UNITED STATES
SECURITIES AND EXCHANGE COMMISSION
Washington, D.C. 20549
FORM N-CSR
CERTIFIED SHAREHOLDER REPORT OF REGISTERED
MANAGEMENT INVESTMENT COMPANIES
Investment Company Act file number 811-3759
Variable Insurance Products Fund IV
(Exact name of registrant as specified in charter)
245 Summer St., Boston, MA 02210
(Address of principal executive offices) (Zip code)
Marc Bryant, Secretary
245 Summer St.
Boston, Massachusetts 02210
(Name and address of agent for service)
Registrant's telephone number, including area code:
617-563-7000
Date of fiscal year end: | December 31 |
Date of reporting period: | June 30, 2018 |
Item 1.
Reports to Stockholders
Fidelity® Variable Insurance Products: Consumer Discretionary Portfolio Semi-Annual Report June 30, 2018 |
 |
Contents
To view a fund's proxy voting guidelines and proxy voting record for the 12-month period ended June 30, visit http://www.fidelity.com/proxyvotingresults or visit the Securities and Exchange Commission's (SEC) web site at http://www.sec.gov.
You may also call 1-877-208-0098 to request a free copy of the proxy voting guidelines.
Fidelity® Variable Insurance Products are separate account options which are purchased through a variable insurance contract.
Standard & Poor's, S&P and S&P 500 are registered service marks of The McGraw-Hill Companies, Inc. and have been licensed for use by Fidelity Distributors Corporation.
Other third-party marks appearing herein are the property of their respective owners.
All other marks appearing herein are registered or unregistered trademarks or service marks of FMR LLC or an affiliated company. © 2018 FMR LLC. All rights reserved.
This report and the financial statements contained herein are submitted for the general information of the shareholders of the Fund. This report is not authorized for distribution to prospective investors in the Fund unless preceded or accompanied by an effective prospectus.
A fund files its complete schedule of portfolio holdings with the SEC for the first and third quarters of each fiscal year on Form N-Q. Forms N-Q are available on the SEC’s web site at http://www.sec.gov. A fund's Forms N-Q may be reviewed and copied at the SEC’s Public Reference Room in Washington, DC. Information regarding the operation of the SEC's Public Reference Room may be obtained by calling 1-800-SEC-0330.
For a complete list of a fund's portfolio holdings, view the most recent holdings listing, semiannual report, or annual report on Fidelity's web site at http://www.fidelity.com, http://www.institutional.fidelity.com, or http://www.401k.com, as applicable.
NOT FDIC INSURED •MAY LOSE VALUE •NO BANK GUARANTEE
Neither the Fund nor Fidelity Distributors Corporation is a bank.
Investment Summary (Unaudited)
Top Ten Stocks as of June 30, 2018
| % of fund's net assets | |
| Amazon.com, Inc. | 19.1 |
| Home Depot, Inc. | 7.2 |
| Netflix, Inc. | 4.5 |
| McDonald's Corp. | 3.6 |
| The Walt Disney Co. | 3.6 |
| Comcast Corp. Class A | 2.9 |
| Lowe's Companies, Inc. | 2.9 |
| The Booking Holdings, Inc. | 2.8 |
| Charter Communications, Inc. Class A | 2.7 |
| NIKE, Inc. Class B | 2.5 |
| 51.8 |
Top Industries (% of fund's net assets)
| As of June 30, 2018 | ||
| Internet & Direct Marketing Retail | 26.9% | |
| Hotels, Restaurants & Leisure | 22.3% | |
| Specialty Retail | 18.2% | |
| Media | 10.3% | |
| Textiles, Apparel & Luxury Goods | 5.7% | |
| All Others* | 16.6% | |

* Includes short-term investments and net other assets (liabilities).
Schedule of Investments June 30, 2018 (Unaudited)
Showing Percentage of Net Assets
| Common Stocks - 99.7% | |||
| Shares | Value | ||
| Air Freight & Logistics - 0.1% | |||
| Air Freight & Logistics - 0.1% | |||
| XPO Logistics, Inc. (a) | 1,800 | $180,324 | |
| Auto Components - 0.2% | |||
| Auto Parts & Equipment - 0.2% | |||
| Aptiv PLC | 3,800 | 348,194 | |
| Lear Corp. | 500 | 92,905 | |
| Tenneco, Inc. | 200 | 8,792 | |
| 449,891 | |||
| Automobiles - 2.4% | |||
| Automobile Manufacturers - 2.4% | |||
| Ferrari NV | 2,500 | 337,525 | |
| General Motors Co. | 25,200 | 992,880 | |
| Tesla, Inc. (a) | 8,100 | 2,777,895 | |
| Thor Industries, Inc. | 6,200 | 603,818 | |
| 4,712,118 | |||
| Beverages - 0.8% | |||
| Distillers & Vintners - 0.6% | |||
| Constellation Brands, Inc. Class A (sub. vtg.) | 5,200 | 1,138,124 | |
| Soft Drinks - 0.2% | |||
| Monster Beverage Corp. (a) | 6,090 | 348,957 | |
| TOTAL BEVERAGES | 1,487,081 | ||
| Building Products - 0.1% | |||
| Building Products - 0.1% | |||
| Masco Corp. | 6,400 | 239,488 | |
| Chemicals - 0.1% | |||
| Specialty Chemicals - 0.1% | |||
| Sherwin-Williams Co. | 400 | 163,028 | |
| Commercial Services & Supplies - 0.2% | |||
| Diversified Support Services - 0.2% | |||
| Copart, Inc. (a) | 6,500 | 367,640 | |
| Distributors - 0.6% | |||
| Distributors - 0.6% | |||
| LKQ Corp. (a) | 27,600 | 880,440 | |
| Pool Corp. | 2,100 | 318,150 | |
| 1,198,590 | |||
| Diversified Consumer Services - 1.1% | |||
| Education Services - 0.6% | |||
| Adtalem Global Education, Inc. (a) | 4,600 | 221,260 | |
| Grand Canyon Education, Inc. (a) | 7,000 | 781,270 | |
| New Oriental Education & Technology Group, Inc. sponsored ADR | 1,900 | 179,854 | |
| 1,182,384 | |||
| Specialized Consumer Services - 0.5% | |||
| Service Corp. International | 2,100 | 75,159 | |
| ServiceMaster Global Holdings, Inc. (a) | 3,700 | 220,039 | |
| Weight Watchers International, Inc. (a) | 7,200 | 727,920 | |
| 1,023,118 | |||
| TOTAL DIVERSIFIED CONSUMER SERVICES | 2,205,502 | ||
| Electronic Equipment & Components - 0.1% | |||
| Electronic Equipment & Instruments - 0.1% | |||
| ADT, Inc. (b) | 15,200 | 131,480 | |
| Food & Staples Retailing - 1.2% | |||
| Food Distributors - 0.7% | |||
| Performance Food Group Co. (a) | 39,200 | 1,438,640 | |
| Hypermarkets & Super Centers - 0.5% | |||
| Bj's Wholesale Club Holdings, Inc. | 14,800 | 350,020 | |
| Costco Wholesale Corp. | 1,000 | 208,980 | |
| Walmart, Inc. | 3,700 | 316,905 | |
| 875,905 | |||
| TOTAL FOOD & STAPLES RETAILING | 2,314,545 | ||
| Health Care Providers & Services - 0.0% | |||
| Health Care Services - 0.0% | |||
| National Vision Holdings, Inc. | 1,800 | 65,826 | |
| Hotels, Restaurants & Leisure - 22.3% | |||
| Casinos & Gaming - 3.5% | |||
| Boyd Gaming Corp. | 8,700 | 301,542 | |
| Caesars Entertainment Corp. (a) | 44,000 | 470,800 | |
| Churchill Downs, Inc. | 800 | 237,200 | |
| Eldorado Resorts, Inc. (a) | 23,924 | 935,428 | |
| Las Vegas Sands Corp. | 36,859 | 2,814,553 | |
| Melco Crown Entertainment Ltd. sponsored ADR | 4,591 | 128,548 | |
| MGM Mirage, Inc. | 42,000 | 1,219,260 | |
| Penn National Gaming, Inc. (a) | 14,845 | 498,644 | |
| PlayAGS, Inc. (a) | 5,700 | 154,299 | |
| Wynn Resorts Ltd. | 565 | 94,547 | |
| 6,854,821 | |||
| Hotels, Resorts & Cruise Lines - 7.9% | |||
| Accor SA | 2,500 | 122,677 | |
| Bluegreen Vacations Corp. | 16,400 | 390,320 | |
| Carnival Corp. | 26,700 | 1,530,177 | |
| Hilton Grand Vacations, Inc. (a) | 23,483 | 814,860 | |
| Hilton Worldwide Holdings, Inc. | 39,800 | 3,150,568 | |
| Hyatt Hotels Corp. Class A | 5,620 | 433,583 | |
| Marriott International, Inc. Class A | 24,900 | 3,152,340 | |
| Marriott Vacations Worldwide Corp. | 8,400 | 948,864 | |
| Royal Caribbean Cruises Ltd. | 30,500 | 3,159,800 | |
| Wyndham Destinations, Inc. | 18,500 | 818,995 | |
| Wyndham Hotels & Resorts, Inc. | 18,500 | 1,088,355 | |
| 15,610,539 | |||
| Leisure Facilities - 1.5% | |||
| Cedar Fair LP (depositary unit) | 3,564 | 224,568 | |
| Drive Shack, Inc. (a) | 37,300 | 287,956 | |
| Planet Fitness, Inc. (a) | 16,800 | 738,192 | |
| Vail Resorts, Inc. | 6,380 | 1,749,332 | |
| 3,000,048 | |||
| Restaurants - 9.4% | |||
| ARAMARK Holdings Corp. | 22,900 | 849,590 | |
| Chipotle Mexican Grill, Inc. (a) | 511 | 220,430 | |
| Compass Group PLC | 5,500 | 117,481 | |
| Darden Restaurants, Inc. | 8,400 | 899,304 | |
| Del Frisco's Restaurant Group, Inc. (a) | 10,300 | 129,780 | |
| Dine Brands Global, Inc. | 2,331 | 174,359 | |
| Domino's Pizza, Inc. | 3,500 | 987,595 | |
| Dunkin' Brands Group, Inc. | 10,716 | 740,154 | |
| Jack in the Box, Inc. | 2,700 | 229,824 | |
| McDonald's Corp. | 45,800 | 7,176,402 | |
| Papa John's International, Inc. | 3,800 | 192,736 | |
| Restaurant Brands International, Inc. | 15,300 | 922,900 | |
| Ruth's Hospitality Group, Inc. | 4,900 | 137,445 | |
| Shake Shack, Inc. Class A (a) | 1,400 | 92,652 | |
| Starbucks Corp. | 69,870 | 3,413,150 | |
| Texas Roadhouse, Inc. Class A | 5,100 | 334,101 | |
| U.S. Foods Holding Corp. (a) | 29,913 | 1,131,310 | |
| Wendy's Co. | 5,700 | 97,926 | |
| Wingstop, Inc. | 3,788 | 197,431 | |
| Yum! Brands, Inc. | 4,600 | 359,812 | |
| 18,404,382 | |||
| TOTAL HOTELS, RESTAURANTS & LEISURE | 43,869,790 | ||
| Household Durables - 2.8% | |||
| Home Furnishings - 0.3% | |||
| Mohawk Industries, Inc. (a) | 2,500 | 535,675 | |
| Homebuilding - 2.4% | |||
| Cavco Industries, Inc. (a) | 1,900 | 394,535 | |
| D.R. Horton, Inc. | 34,800 | 1,426,800 | |
| Lennar Corp.: | |||
| Class A | 22,800 | 1,197,000 | |
| Class B | 228 | 9,733 | |
| LGI Homes, Inc. (a)(b) | 1,600 | 92,368 | |
| New Home Co. LLC (a) | 6,800 | 67,796 | |
| NVR, Inc. (a) | 400 | 1,188,140 | |
| Taylor Morrison Home Corp. (a) | 5,000 | 103,900 | |
| TRI Pointe Homes, Inc. (a) | 21,200 | 346,832 | |
| 4,827,104 | |||
| Household Appliances - 0.1% | |||
| Techtronic Industries Co. Ltd. | 39,908 | 222,542 | |
| TOTAL HOUSEHOLD DURABLES | 5,585,321 | ||
| Internet & Direct Marketing Retail - 26.9% | |||
| Internet & Direct Marketing Retail - 26.9% | |||
| Amazon.com, Inc. (a) | 22,055 | 37,489,087 | |
| Boohoo.Com PLC (a) | 28,100 | 72,130 | |
| Liberty Interactive Corp. QVC Group Series A (a) | 36,650 | 777,713 | |
| Netflix, Inc. (a) | 22,700 | 8,885,461 | |
| Start Today Co. Ltd. | 1,700 | 61,649 | |
| The Booking Holdings, Inc. (a) | 2,700 | 5,473,143 | |
| Wayfair LLC Class A (a) | 800 | 95,008 | |
| Zalando SE (a)(b) | 900 | 50,312 | |
| 52,904,503 | |||
| Internet Software & Services - 0.7% | |||
| Internet Software & Services - 0.7% | |||
| 2U, Inc. (a) | 5,205 | 434,930 | |
| Alphabet, Inc. Class A (a) | 800 | 903,352 | |
| CarGurus, Inc. Class A | 200 | 6,948 | |
| MINDBODY, Inc. (a) | 1,400 | 54,040 | |
| 1,399,270 | |||
| IT Services - 0.4% | |||
| Data Processing & Outsourced Services - 0.4% | |||
| Global Payments, Inc. | 2,200 | 245,278 | |
| PayPal Holdings, Inc. (a) | 5,600 | 466,312 | |
| 711,590 | |||
| Leisure Products - 0.6% | |||
| Leisure Products - 0.6% | |||
| Mattel, Inc. (b) | 69,000 | 1,132,980 | |
| Media - 10.3% | |||
| Advertising - 0.0% | |||
| Interpublic Group of Companies, Inc. | 2,500 | 58,600 | |
| Broadcasting - 0.2% | |||
| CBS Corp. Class B | 7,000 | 393,540 | |
| Cable & Satellite - 5.8% | |||
| Charter Communications, Inc. Class A (a) | 17,977 | 5,271,036 | |
| Comcast Corp. Class A | 175,280 | 5,750,937 | |
| Naspers Ltd. Class N | 1,640 | 416,650 | |
| 11,438,623 | |||
| Movies & Entertainment - 4.3% | |||
| Cinemark Holdings, Inc. | 19,100 | 670,028 | |
| Liberty Media Corp. Liberty Formula One Group Series C (a) | 4,100 | 152,233 | |
| Lions Gate Entertainment Corp. Class B | 600 | 14,076 | |
| Live Nation Entertainment, Inc. (a) | 7,400 | 359,418 | |
| The Walt Disney Co. | 68,267 | 7,155,064 | |
| Twenty-First Century Fox, Inc. Class A | 2,000 | 99,380 | |
| 8,450,199 | |||
| TOTAL MEDIA | 20,340,962 | ||
| Multiline Retail - 4.2% | |||
| Department Stores - 0.5% | |||
| Future Retail Ltd. | 18,244 | 153,166 | |
| Macy's, Inc. | 22,700 | 849,661 | |
| 1,002,827 | |||
| General Merchandise Stores - 3.7% | |||
| B&M European Value Retail S.A. | 36,270 | 193,432 | |
| Dollar General Corp. | 25,300 | 2,494,580 | |
| Dollar Tree, Inc. (a) | 47,600 | 4,046,000 | |
| Ollie's Bargain Outlet Holdings, Inc. (a) | 2,500 | 181,250 | |
| Target Corp. | 5,400 | 411,048 | |
| 7,326,310 | |||
| TOTAL MULTILINE RETAIL | 8,329,137 | ||
| Personal Products - 0.0% | |||
| Personal Products - 0.0% | |||
| Estee Lauder Companies, Inc. Class A | 600 | 85,614 | |
| Real Estate Management & Development - 0.1% | |||
| Real Estate Services - 0.1% | |||
| Redfin Corp. (b) | 6,900 | 159,321 | |
| Software - 0.2% | |||
| Application Software - 0.1% | |||
| Adobe Systems, Inc. (a) | 700 | 170,667 | |
| Home Entertainment Software - 0.1% | |||
| Activision Blizzard, Inc. | 2,500 | 190,800 | |
| TOTAL SOFTWARE | 361,467 | ||
| Specialty Retail - 18.2% | |||
| Apparel Retail - 5.4% | |||
| Burlington Stores, Inc. (a) | 22,200 | 3,341,766 | |
| Inditex SA | 5,172 | 176,128 | |
| Ross Stores, Inc. | 34,982 | 2,964,725 | |
| The Children's Place Retail Stores, Inc. | 3,100 | 374,480 | |
| TJX Companies, Inc. | 39,517 | 3,761,228 | |
| 10,618,327 | |||
| Automotive Retail - 1.9% | |||
| AutoZone, Inc. (a) | 2,200 | 1,476,046 | |
| Monro, Inc. | 4,310 | 250,411 | |
| O'Reilly Automotive, Inc. (a) | 7,673 | 2,099,103 | |
| 3,825,560 | |||
| Computer & Electronics Retail - 0.1% | |||
| Best Buy Co., Inc. | 2,700 | 201,366 | |
| Home Improvement Retail - 10.2% | |||
| Floor & Decor Holdings, Inc. Class A (a) | 3,800 | 187,454 | |
| Home Depot, Inc. | 72,700 | 14,183,770 | |
| Lowe's Companies, Inc. | 58,800 | 5,619,516 | |
| 19,990,740 | |||
| Specialty Stores - 0.6% | |||
| Five Below, Inc. (a) | 200 | 19,542 | |
| Tiffany & Co., Inc. | 1,600 | 210,560 | |
| Ulta Beauty, Inc. (a) | 3,900 | 910,494 | |
| 1,140,596 | |||
| TOTAL SPECIALTY RETAIL | 35,776,589 | ||
| Technology Hardware, Storage & Peripherals - 0.2% | |||
| Technology Hardware, Storage & Peripherals - 0.2% | |||
| Apple, Inc. | 2,500 | 462,775 | |
| Textiles, Apparel & Luxury Goods - 5.7% | |||
| Apparel, Accessories & Luxury Goods - 3.2% | |||
| adidas AG | 1,721 | 375,729 | |
| Canada Goose Holdings, Inc. (a) | 2,800 | 164,680 | |
| Carter's, Inc. | 4,800 | 520,272 | |
| G-III Apparel Group Ltd. (a) | 4,700 | 208,680 | |
| Kering SA | 700 | 395,324 | |
| lululemon athletica, Inc. (a) | 1,800 | 224,730 | |
| LVMH Moet Hennessy - Louis Vuitton SA | 1,654 | 549,159 | |
| Michael Kors Holdings Ltd. (a) | 2,800 | 186,480 | |
| Prada SpA | 33,400 | 154,535 | |
| PVH Corp. | 17,900 | 2,679,988 | |
| Swatch Group AG (Bearer) | 320 | 152,229 | |
| Tapestry, Inc. | 8,000 | 373,680 | |
| VF Corp. | 2,300 | 187,496 | |
| 6,172,982 | |||
| Footwear - 2.5% | |||
| NIKE, Inc. Class B | 62,370 | 4,969,642 | |
| TOTAL TEXTILES, APPAREL & LUXURY GOODS | 11,142,624 | ||
| Tobacco - 0.2% | |||
| Tobacco - 0.2% | |||
| Philip Morris International, Inc. | 3,900 | 314,886 | |
| TOTAL COMMON STOCKS | |||
| (Cost $139,236,281) | 196,092,342 | ||
| Money Market Funds - 0.7% | |||
| Fidelity Cash Central Fund, 1.93% (c) | 248,004 | 248,053 | |
| Fidelity Securities Lending Cash Central Fund 1.92% (c)(d) | 1,198,827 | 1,199,067 | |
| TOTAL MONEY MARKET FUNDS | |||
| (Cost $1,447,000) | 1,447,120 | ||
| TOTAL INVESTMENT IN SECURITIES - 100.4% | |||
| (Cost $140,683,281) | 197,539,462 | ||
| NET OTHER ASSETS (LIABILITIES) - (0.4)% | (738,416) | ||
| NET ASSETS - 100% | $196,801,046 |
Legend
(a) Non-income producing
(b) Security or a portion of the security is on loan at period end.
(c) Affiliated fund that is generally available only to investment companies and other accounts managed by Fidelity Investments. The rate quoted is the annualized seven-day yield of the fund at period end. A complete unaudited listing of the fund's holdings as of its most recent quarter end is available upon request. In addition, each Fidelity Central Fund's financial statements are available on the SEC's website or upon request.
(d) Investment made with cash collateral received from securities on loan.
Affiliated Central Funds
Information regarding fiscal year to date income earned by the Fund from investments in Fidelity Central Funds is as follows:
| Fund | Income earned |
| Fidelity Cash Central Fund | $19,444 |
| Fidelity Securities Lending Cash Central Fund | 12,191 |
| Total | $31,635 |
Amounts in the income column in the above table include any capital gain distributions from underlying funds, which are presented in the corresponding line-item in the Statement of Operations if applicable.
Investment Valuation
The following is a summary of the inputs used, as of June 30, 2018, involving the Fund's assets and liabilities carried at fair value. The inputs or methodology used for valuing securities may not be an indication of the risk associated with investing in those securities. For more information on valuation inputs, and their aggregation into the levels used below, please refer to the Investment Valuation section in the accompanying Notes to Financial Statements.
| Valuation Inputs at Reporting Date: | ||||
| Description | Total | Level 1 | Level 2 | Level 3 |
| Investments in Securities: | ||||
| Common Stocks | $196,092,342 | $195,367,055 | $725,287 | $-- |
| Money Market Funds | 1,447,120 | 1,447,120 | -- | -- |
| Total Investments in Securities: | $197,539,462 | $196,814,175 | $725,287 | $-- |
See accompanying notes which are an integral part of the financial statements.
Financial Statements
Statement of Assets and Liabilities
| June 30, 2018 (Unaudited) | ||
| Assets | ||
| Investment in securities, at value (including securities loaned of $1,175,171) — See accompanying schedule: Unaffiliated issuers (cost $139,236,281) | $196,092,342 | |
| Fidelity Central Funds (cost $1,447,000) | 1,447,120 | |
| Total Investment in Securities (cost $140,683,281) | $197,539,462 | |
| Receivable for investments sold | 1,056,176 | |
| Receivable for fund shares sold | 155,569 | |
| Dividends receivable | 68,166 | |
| Distributions receivable from Fidelity Central Funds | 4,311 | |
| Prepaid expenses | 1,441 | |
| Other receivables | 5,062 | |
| Total assets | 198,830,187 | |
| Liabilities | ||
| Payable for investments purchased | $691,849 | |
| Payable for fund shares redeemed | 58 | |
| Accrued management fee | 87,349 | |
| Other affiliated payables | 27,994 | |
| Other payables and accrued expenses | 23,463 | |
| Collateral on securities loaned | 1,198,428 | |
| Total liabilities | 2,029,141 | |
| Net Assets | $196,801,046 | |
| Net Assets consist of: | ||
| Paid in capital | $138,891,803 | |
| Undistributed net investment income | 217,529 | |
| Accumulated undistributed net realized gain (loss) on investments and foreign currency transactions | 835,607 | |
| Net unrealized appreciation (depreciation) on investments and assets and liabilities in foreign currencies | 56,856,107 | |
| Net Assets | $196,801,046 | |
| Initial Class: | ||
| Net Asset Value, offering price and redemption price per share ($25,522,987 ÷ 1,085,792 shares) | $23.51 | |
| Investor Class: | ||
| Net Asset Value, offering price and redemption price per share ($171,278,059 ÷ 7,309,047 shares) | $23.43 |
See accompanying notes which are an integral part of the financial statements.
Statement of Operations
| Six months ended June 30, 2018 (Unaudited) | ||
| Investment Income | ||
| Dividends | $849,800 | |
| Interest | 11 | |
| Income from Fidelity Central Funds | 31,635 | |
| Total income | 881,446 | |
| Expenses | ||
| Management fee | $472,580 | |
| Transfer agent fees | 115,897 | |
| Accounting and security lending fees | 34,184 | |
| Custodian fees and expenses | 3,555 | |
| Independent trustees' fees and expenses | 760 | |
| Audit | 27,853 | |
| Legal | 699 | |
| Miscellaneous | (517) | |
| Total expenses before reductions | 655,011 | |
| Expense reductions | (1,430) | |
| Total expenses after reductions | 653,581 | |
| Net investment income (loss) | 227,865 | |
| Realized and Unrealized Gain (Loss) | ||
| Net realized gain (loss) on: | ||
| Investment securities: | ||
| Unaffiliated issuers | 1,011,567 | |
| Fidelity Central Funds | (24) | |
| Foreign currency transactions | (220) | |
| Total net realized gain (loss) | 1,011,323 | |
| Change in net unrealized appreciation (depreciation) on: | ||
| Investment securities: | ||
| Unaffiliated issuers | 14,297,610 | |
| Fidelity Central Funds | 15 | |
| Assets and liabilities in foreign currencies | (209) | |
| Total change in net unrealized appreciation (depreciation) | 14,297,416 | |
| Net gain (loss) | 15,308,739 | |
| Net increase (decrease) in net assets resulting from operations | $15,536,604 |
See accompanying notes which are an integral part of the financial statements.
Statement of Changes in Net Assets
| Six months ended June 30, 2018 (Unaudited) | Year ended December 31, 2017 | |
| Increase (Decrease) in Net Assets | ||
| Operations | ||
| Net investment income (loss) | $227,865 | $744,547 |
| Net realized gain (loss) | 1,011,323 | 8,906,754 |
| Change in net unrealized appreciation (depreciation) | 14,297,416 | 18,885,195 |
| Net increase (decrease) in net assets resulting from operations | 15,536,604 | 28,536,496 |
| Distributions to shareholders from net investment income | (166,428) | (694,426) |
| Distributions to shareholders from net realized gain | (6,314,937) | – |
| Total distributions | (6,481,365) | (694,426) |
| Share transactions - net increase (decrease) | 38,037,698 | (26,089,645) |
| Redemption fees | – | 6,759 |
| Total increase (decrease) in net assets | 47,092,937 | 1,759,184 |
| Net Assets | ||
| Beginning of period | 149,708,109 | 147,948,925 |
| End of period | $196,801,046 | $149,708,109 |
| Other Information | ||
| Undistributed net investment income end of period | $217,529 | $156,092 |
See accompanying notes which are an integral part of the financial statements.
Financial Highlights
VIP Consumer Discretionary Portfolio Initial Class
| Six months ended (Unaudited) June 30, | Years endedDecember 31, | |||||
| 2018 | 2017 | 2016 | 2015 | 2014 | 2013 | |
| Selected Per–Share Data | ||||||
| Net asset value, beginning of period | $22.27 | $18.33 | $17.88 | $19.01 | $18.54 | $14.24 |
| Income from Investment Operations | ||||||
| Net investment income (loss)A | .04 | .12 | .15 | .13 | .08 | .03 |
| Net realized and unrealized gain (loss) | 2.12 | 3.93 | .73 | .73 | 1.59 | 5.58 |
| Total from investment operations | 2.16 | 4.05 | .88 | .86 | 1.67 | 5.61 |
| Distributions from net investment income | (.03) | (.11) | (.14) | (.09) | (.10) | (.02) |
| Distributions from net realized gain | (.89) | – | (.30) | (1.91) | (1.11) | (1.30) |
| Total distributions | (.92) | (.11) | (.44) | (2.00) | (1.20)B | (1.32) |
| Redemption fees added to paid in capitalA | – | –C | .01 | .01 | –C | .01 |
| Net asset value, end of period | $23.51 | $22.27 | $18.33 | $17.88 | $19.01 | $18.54 |
| Total ReturnD,E,F | 10.00% | 22.16% | 5.24% | 4.71% | 9.64% | 41.10% |
| Ratios to Average Net AssetsG,H | ||||||
| Expenses before reductions | .68%I | .71% | .70% | .70% | .72% | .76% |
| Expenses net of fee waivers, if any | .68%I | .71% | .70% | .70% | .72% | .75% |
| Expenses net of all reductions | .68%I | .70% | .70% | .69% | .71% | .75% |
| Net investment income (loss) | .33%I | .58% | .86% | .69% | .45% | .16% |
| Supplemental Data | ||||||
| Net assets, end of period (000 omitted) | $25,523 | $22,057 | $23,677 | $42,048 | $21,446 | $32,004 |
| Portfolio turnover rateJ | 18%I | 81% | 43% | 46% | 129% | 122% |
A Calculated based on average shares outstanding during the period.
B Total distributions of $1.20 per share is comprised of distributions from net investment income of $0.097 and distributions from net realized gain of $1.106 per share.
C Amount represents less than $.005 per share.
D Total returns for periods of less than one year are not annualized.
E Total returns do not reflect charges attributable to your insurance company's separate account. Inclusion of these charges would reduce the total returns shown.
F Total returns would have been lower if certain expenses had not been reduced during the applicable periods shown.
G Fees and expenses of any underlying Fidelity Central Funds are not included in the Fund's expense ratio. The Fund indirectly bears its proportionate share of the expenses of any underlying Fidelity Central Funds.
H Expense ratios reflect operating expenses of the class. Expenses before reductions do not reflect amounts reimbursed by the investment adviser or reductions from brokerage service arrangements or reductions from other expense offset arrangements and do not represent the amount paid by the class during periods when reimbursements or reductions occur. Expenses net of fee waivers reflect expenses after reimbursement by the investment adviser but prior to reductions from brokerage service arrangements or other expense offset arrangements. Expenses net of all reductions represent the net expenses paid by the class.
I Annualized
J Amount does not include the portfolio activity of any underlying Fidelity Central Funds.
See accompanying notes which are an integral part of the financial statements.
See accompanying notes which are an integral part of the financial statements.
See accompanying notes which are an integral part of the financial statements.
VIP Consumer Discretionary Portfolio Investor Class
| Six months ended (Unaudited) June 30, | Years endedDecember 31, | |||||
| 2018 | 2017 | 2016 | 2015 | 2014 | 2013 | |
| Selected Per–Share Data | ||||||
| Net asset value, beginning of period | $22.21 | $18.28 | $17.84 | $18.97 | $18.50 | $14.21 |
| Income from Investment Operations | ||||||
| Net investment income (loss)A | .03 | .10 | .14 | .11 | .07 | .01 |
| Net realized and unrealized gain (loss) | 2.10 | 3.93 | .71 | .74 | 1.59 | 5.58 |
| Total from investment operations | 2.13 | 4.03 | .85 | .85 | 1.66 | 5.59 |
| Distributions from net investment income | (.02) | (.10) | (.13) | (.08) | (.08) | (.01) |
| Distributions from net realized gain | (.89) | – | (.30) | (1.91) | (1.11) | (1.30) |
| Total distributions | (.91) | (.10) | (.42)B | (1.99) | (1.19) | (1.31) |
| Redemption fees added to paid in capitalA | – | –C | .01 | .01 | –C | .01 |
| Net asset value, end of period | $23.43 | $22.21 | $18.28 | $17.84 | $18.97 | $18.50 |
| Total ReturnD,E,F | 9.92% | 22.07% | 5.12% | 4.66% | 9.58% | 41.05% |
| Ratios to Average Net AssetsG,H | ||||||
| Expenses before reductions | .76%I | .79% | .78% | .78% | .80% | .83% |
| Expenses net of fee waivers, if any | .76%I | .79% | .78% | .77% | .79% | .83% |
| Expenses net of all reductions | .76%I | .78% | .78% | .77% | .78% | .83% |
| Net investment income (loss) | .25%I | .50% | .78% | .61% | .38% | .08% |
| Supplemental Data | ||||||
| Net assets, end of period (000 omitted) | $171,278 | $127,651 | $124,272 | $165,927 | $86,882 | $109,697 |
| Portfolio turnover rateJ | 18%I | 81% | 43% | 46% | 129% | 122% |
A Calculated based on average shares outstanding during the period.
B Total distributions of $.42 per share is comprised of distributions from net investment income of $.125 and distributions from net realized gain of $.298 per share.
C Amount represents less than $.005 per share.
D Total returns for periods of less than one year are not annualized.
E Total returns do not reflect charges attributable to your insurance company's separate account. Inclusion of these charges would reduce the total returns shown.
F Total returns would have been lower if certain expenses had not been reduced during the applicable periods shown.
G Fees and expenses of any underlying Fidelity Central Funds are not included in the Fund's expense ratio. The Fund indirectly bears its proportionate share of the expenses of any underlying Fidelity Central Funds.
H Expense ratios reflect operating expenses of the class. Expenses before reductions do not reflect amounts reimbursed by the investment adviser or reductions from brokerage service arrangements or reductions from other expense offset arrangements and do not represent the amount paid by the class during periods when reimbursements or reductions occur. Expenses net of fee waivers reflect expenses after reimbursement by the investment adviser but prior to reductions from brokerage service arrangements or other expense offset arrangements. Expenses net of all reductions represent the net expenses paid by the class.
I Annualized
J Amount does not include the portfolio activity of any underlying Fidelity Central Funds.
See accompanying notes which are an integral part of the financial statements.
Notes to Financial Statements (Unaudited)
For the period ended June 30, 2018
1. Organization.
VIP Consumer Discretionary Portfolio (the Fund) is a non-diversified fund of Variable Insurance Products Fund IV (the Trust) and is authorized to issue an unlimited number of shares. The Trust is registered under the Investment Company Act of 1940, as amended (the 1940 Act), as an open-end management investment company organized as a Massachusetts business trust. Shares of the Fund may only be purchased by insurance companies for the purpose of funding variable annuity or variable life insurance contracts. The Fund offers the following classes of shares: Initial Class shares and Investor Class shares. All classes have equal rights and voting privileges, except for matters affecting a single class.
2. Investments in Fidelity Central Funds.
The Fund invests in Fidelity Central Funds, which are open-end investment companies generally available only to other investment companies and accounts managed by the investment adviser and its affiliates. The Fund's Schedule of Investments lists each of the Fidelity Central Funds held as of period end, if any, as an investment of the Fund, but does not include the underlying holdings of each Fidelity Central Fund. As an Investing Fund, the Fund indirectly bears its proportionate share of the expenses of the underlying Fidelity Central Funds.
The Money Market Central Funds seek preservation of capital and current income and are managed by Fidelity Investments Money Management, Inc. (FIMM), an affiliate of the investment adviser. Annualized expenses of the Money Market Central Funds as of their most recent shareholder report date are less than .005%.
A complete unaudited list of holdings for each Fidelity Central Fund is available upon request or at the Securities and Exchange Commission (the SEC) website at www.sec.gov. In addition, the financial statements of the Fidelity Central Funds are available on the SEC website or upon request.
3. Significant Accounting Policies.
The Fund is an investment company and applies the accounting and reporting guidance of the Financial Accounting Standards Board (FASB) Accounting Standards Codification Topic 946 Financial Services – Investments Companies. The financial statements have been prepared in conformity with accounting principles generally accepted in the United States of America (GAAP), which require management to make certain estimates and assumptions at the date of the financial statements. Actual results could differ from those estimates. Subsequent events, if any, through the date that the financial statements were issued have been evaluated in the preparation of the financial statements. The following summarizes the significant accounting policies of the Fund:
Investment Valuation. Investments are valued as of 4:00 p.m. Eastern time on the last calendar day of the period. The Board of Trustees (the Board) has delegated the day to day responsibility for the valuation of the Fund's investments to the Fair Value Committee (the Committee) established by the Fund's investment adviser. In accordance with valuation policies and procedures approved by the Board, the Fund attempts to obtain prices from one or more third party pricing vendors or brokers to value its investments. When current market prices, quotations or currency exchange rates are not readily available or reliable, investments will be fair valued in good faith by the Committee, in accordance with procedures adopted by the Board. Factors used in determining fair value vary by investment type and may include market or investment specific events. The frequency with which these procedures are used cannot be predicted and they may be utilized to a significant extent. The Committee oversees the Fund's valuation policies and procedures and reports to the Board on the Committee's activities and fair value determinations. The Board monitors the appropriateness of the procedures used in valuing the Fund's investments and ratifies the fair value determinations of the Committee.
The Fund categorizes the inputs to valuation techniques used to value its investments into a disclosure hierarchy consisting of three levels as shown below:
- Level 1 – quoted prices in active markets for identical investments
- Level 2 – other significant observable inputs (including quoted prices for similar investments, interest rates, prepayment speeds, etc.)
- Level 3 – unobservable inputs (including the Fund's own assumptions based on the best information available)
Valuation techniques used to value the Fund's investments by major category are as follows:
Equity securities, including restricted securities, for which market quotations are readily available, are valued at the last reported sale price or official closing price as reported by a third party pricing vendor on the primary market or exchange on which they are traded and are categorized as Level 1 in the hierarchy. In the event there were no sales during the day or closing prices are not available, securities are valued at the last quoted bid price or may be valued using the last available price and are generally categorized as Level 2 in the hierarchy. For foreign equity securities, when market or security specific events arise, comparisons to the valuation of American Depositary Receipts (ADRs), futures contracts, Exchange-Traded Funds (ETFs) and certain indexes as well as quoted prices for similar securities may be used and would be categorized as Level 2 in the hierarchy. Utilizing these techniques may result in transfers between Level 1 and Level 2. For equity securities, including restricted securities, where observable inputs are limited, assumptions about market activity and risk are used and these securities may be categorized as Level 3 in the hierarchy.
Investments in open-end mutual funds, including the Fidelity Central Funds, are valued at their closing net asset value (NAV) each business day and are categorized as Level 1 in the hierarchy.
Changes in valuation techniques may result in transfers in or out of an assigned level within the disclosure hierarchy. The aggregate value of investments by input level as of June 30, 2018 is included at the end of the Fund's Schedule of Investments.
Foreign Currency. The Fund may use foreign currency contracts to facilitate transactions in foreign-denominated securities. Gains and losses from these transactions may arise from changes in the value of the foreign currency or if the counterparties do not perform under the contracts' terms.
Foreign-denominated assets, including investment securities, and liabilities are translated into U.S. dollars at the exchange rates at period end. Purchases and sales of investment securities, income and dividends received and expenses denominated in foreign currencies are translated into U.S. dollars at the exchange rate in effect on the transaction date.
The effects of exchange rate fluctuations on investments are included with the net realized and unrealized gain (loss) on investment securities. Other foreign currency transactions resulting in realized and unrealized gain (loss) are disclosed separately.
Investment Transactions and Income. For financial reporting purposes, the Fund's investment holdings and NAV include trades executed through the end of the last business day of the period. The NAV per share for processing shareholder transactions is calculated as of the close of business of the New York Stock Exchange (NYSE), normally 4:00 p.m. Eastern time and includes trades executed through the end of the prior business day. Gains and losses on securities sold are determined on the basis of identified cost and include proceeds received from litigation. Dividend income is recorded on the ex-dividend date, except for certain dividends from foreign securities where the ex-dividend date may have passed, which are recorded as soon as the Fund is informed of the ex-dividend date. Non-cash dividends included in dividend income, if any, are recorded at the fair market value of the securities received. Income and capital gain distributions from Fidelity Central Funds, if any, are recorded on the ex-dividend date. Certain distributions received by the Fund represent a return of capital or capital gain. The Fund determines the components of these distributions subsequent to the ex-dividend date, based upon receipt of tax filings or other correspondence relating to the underlying investment. These distributions are recorded as a reduction of cost of investments and/or as a realized gain. Interest income is accrued as earned and includes coupon interest and amortization of premium and accretion of discount on debt securities as applicable. Investment income is recorded net of foreign taxes withheld where recovery of such taxes is uncertain.
Class Allocations and Expenses. Investment income, realized and unrealized capital gains and losses, common expenses of the Fund, and certain fund-level expense reductions, if any, are allocated daily on a pro-rata basis to each class based on the relative net assets of each class to the total net assets of the Fund. Each class differs with respect to transfer agent fees incurred. Certain expense reductions may also differ by class. For the reporting period, the allocated portion of income and expenses to each class as a percent of its average net assets may vary due to the timing of recording these transactions in relation to fluctuating net assets of the classes. Expenses directly attributable to a fund are charged to that fund. Expenses attributable to more than one fund are allocated among the respective funds on the basis of relative net assets or other appropriate methods. Expense estimates are accrued in the period to which they relate and adjustments are made when actual amounts are known.
Income Tax Information and Distributions to Shareholders. Each year, the Fund intends to qualify as a regulated investment company under Subchapter M of the Internal Revenue Code, including distributing substantially all of its taxable income and realized gains. As a result, no provision for U.S. Federal income taxes is required. The Fund files a U.S. federal tax return, in addition to state and local tax returns as required. The Fund's federal income tax returns are subject to examination by the Internal Revenue Service (IRS) for a period of three fiscal years after they are filed. State and local tax returns may be subject to examination for an additional fiscal year depending on the jurisdiction. Foreign taxes are provided for based on the Fund's understanding of the tax rules and rates that exist in the foreign markets in which it invests.
Distributions are declared and recorded on the ex-dividend date. Income and capital gain distributions are declared separately for each class. Income and capital gain distributions are determined in accordance with income tax regulations, which may differ from GAAP.
Capital accounts within the financial statements are adjusted for permanent book-tax differences. These adjustments have no impact on net assets or the results of operations. Capital accounts are not adjusted for temporary book-tax differences which will reverse in a subsequent period.
Book-tax differences are primarily due to foreign currency transactions, partnerships, capital loss carryforwards, and losses deferred due to wash sales.
As of period end, the cost and unrealized appreciation (depreciation) in securities, and derivatives if applicable, for federal income tax purposes were as follows:
| Gross unrealized appreciation | $60,937,194 |
| Gross unrealized depreciation | (4,392,478) |
| Net unrealized appreciation (depreciation) | $56,544,716 |
| Tax cost | $140,994,746 |
4. Purchases and Sales of Investments.
Purchases and sales of securities, other than short-term securities, aggregated $47,923,086 and $15,196,739, respectively.
5. Fees and Other Transactions with Affiliates.
Management Fee. Fidelity SelectCo, LLC (the investment adviser) and its affiliates provide the Fund with investment management related services for which the Fund pays a monthly management fee. The management fee is the sum of an individual fund fee rate that is based on an annual rate of .30% of the Fund's average net assets and an annualized group fee rate that averaged .24% during the period. The group fee rate is based upon the average net assets of all the mutual funds advised by Fidelity Management & Research Company (FMR) and the investment adviser. The group fee rate decreases as assets under management increase and increases as assets under management decrease. For the reporting period, the total annualized management fee rate was .54% of the Fund's average net assets.
Transfer Agent Fees. Fidelity Investments Institutional Operations Company, Inc. (FIIOC), an affiliate of the investment adviser, is the Fund's transfer, dividend disbursing, and shareholder servicing agent. FIIOC receives an asset-based fee with respect to each class. Each class pays a fee for transfer agent services, typesetting and printing and mailing of shareholder reports, excluding mailing of proxy statements, equal to an annual rate of class-level average net assets. The annual rate for Investor Class is .15% and the annual rate for all other classes is .07%. For the period, transfer agent fees for each class were as follows:
| Initial Class | $7,932 |
| Investor Class | 107,965 |
| $115,897 |
Accounting and Security Lending Fees. Fidelity Service Company, Inc. (FSC), an affiliate of the investment adviser, maintains the Fund's accounting records. The accounting fee is based on the level of average net assets for each month. Under a separate contract, FSC administers the security lending program. The security lending fee is based on the number and duration of lending transactions. For the period, the fees were equivalent to an annualized rate of .04%.
Brokerage Commissions. The Fund placed a portion of its portfolio transactions with brokerage firms which are affiliates of the investment adviser. Brokerage commissions are included in net realized gain (loss) and change in net unrealized appreciation (depreciation) in the Statement of Operations. The commissions paid to these affiliated firms were $379 for the period.
Interfund Trades. The Fund may purchase from or sell securities to other Fidelity Funds under procedures adopted by the Board. The procedures have been designed to ensure these interfund trades are executed in accordance with Rule 17a-7 of the 1940 Act. Interfund trades are included within the respective purchases and sales amounts shown in the Purchases and Sales of Investments note.
6. Committed Line of Credit.
The Fund participates with other funds managed by the investment adviser or an affiliate in a $4.25 billion credit facility (the "line of credit") to be utilized for temporary or emergency purposes to fund shareholder redemptions or for other short-term liquidity purposes. The Fund has agreed to pay commitment fees on its pro-rata portion of the line of credit, which amounted to $216 and is reflected in Miscellaneous expenses on the Statement of Operations. During the period, the Fund did not borrow on this line of credit.
7. Security Lending.
The Fund lends portfolio securities through a lending agent from time to time in order to earn additional income. On the settlement date of the loan, the Fund receives collateral (in the form of U.S. Treasury obligations, letters of credit and/or cash) against the loaned securities and maintains collateral in an amount not less than 100% of the market value of the loaned securities during the period of the loan. The market value of the loaned securities is determined at the close of business of the Fund and any additional required collateral is delivered to the Fund on the next business day. The Fund or borrower may terminate the loan at any time, and if the borrower defaults on its obligation to return the securities loaned because of insolvency or other reasons, the Fund may apply collateral received from the borrower against the obligation. The Fund may experience delays and costs in recovering the securities loaned. Any cash collateral received is invested in the Fidelity Securities Lending Cash Central Fund. The value of loaned securities and cash collateral at period end are disclosed on the Fund's Statement of Assets and Liabilities. Security lending income represents the income earned on investing cash collateral, less rebates paid to borrowers and any lending agent fees associated with the loan, plus any premium payments received for lending certain types of securities. Security lending income is presented in the Statement of Operations as a component of income from Fidelity Central Funds. Total security lending income during the period amounted to $12,191.
8. Expense Reductions.
Commissions paid to certain brokers with whom the investment adviser, or its affiliates, places trades on behalf of the Fund include an amount in addition to trade execution, which may be rebated back to the Fund to offset certain expenses. This amount totaled $751 for the period. In addition, through arrangements with the Fund's custodian, credits realized as a result of certain uninvested cash balances were used to reduce the Fund's expenses. During the period, these credits reduced the Fund's custody expenses by $22.
In addition, during the period the investment adviser reimbursed and/or waived a portion of fund-level operating expenses in the amount of $657.
9. Distributions to Shareholders.
Distributions to shareholders of each class were as follows:
| Six months ended June 30, 2018 | Year ended December 31, 2017 | |
| From net investment income | ||
| Initial Class | $26,433 | $117,886 |
| Investor Class | 139,995 | 576,540 |
| Total | $166,428 | $694,426 |
| From net realized gain | ||
| Initial Class | $903,813 | $– |
| Investor Class | 5,411,124 | – |
| Total | $6,314,937 | $– |
10. Share Transactions.
Transactions for each class of shares were as follows:
| Shares | Shares | Dollars | Dollars | |
| Six months ended June 30, 2018 | Year ended December 31, 2017 | Six months ended June 30, 2018 | Year ended December 31, 2017 | |
| Initial Class | ||||
| Shares sold | 228,648 | 115,416 | $5,261,350 | $2,361,729 |
| Reinvestment of distributions | 42,711 | 5,687 | 930,246 | 117,886 |
| Shares redeemed | (175,932) | (422,794) | (4,045,938) | (8,310,561) |
| Net increase (decrease) | 95,427 | (301,691) | $2,145,658 | $(5,830,946) |
| Investor Class | ||||
| Shares sold | 1,650,033 | 598,518 | $38,106,164 | $12,226,919 |
| Reinvestment of distributions | 255,576 | 27,972 | 5,551,119 | 576,540 |
| Shares redeemed | (343,643) | (1,679,200) | (7,765,243) | (33,062,158) |
| Net increase (decrease) | 1,561,966 | (1,052,710) | $35,892,040 | $(20,258,699) |
11. Other.
The Fund's organizational documents provide former and current trustees and officers with a limited indemnification against liabilities arising in connection with the performance of their duties to the Fund. In the normal course of business, the Fund may also enter into contracts that provide general indemnifications. The Fund's maximum exposure under these arrangements is unknown as this would be dependent on future claims that may be made against the Fund. The risk of material loss from such claims is considered remote.
At the end of the period, the investment adviser or its affiliates were the owners of record of 100% of the total outstanding shares of the Fund.
Shareholder Expense Example
As a shareholder of a Fund, you incur two types of costs: (1) transaction costs and (2) ongoing costs, including management fees and other Fund expenses. This Example is intended to help you understand your ongoing costs (in dollars) of investing in the Funds and to compare these costs with the ongoing costs of investing in other mutual funds.
The Example is based on an investment of $1,000 invested at the beginning of the period and held for the entire period (January 1, 2018 to June 30, 2018).
Actual Expenses
The first line of the accompanying table for each class of the Fund provides information about actual account values and actual expenses. You may use the information in this line, together with the amount you invested, to estimate the expenses that you paid over the period. Simply divide your account value by $1,000.00 (for example, an $8,600 account value divided by $1,000.00 = 8.6), then multiply the result by the number in the first line for a class of the Fund under the heading entitled "Expenses Paid During Period" to estimate the expenses you paid on your account during this period. The estimate of expenses does not include any fees or other expenses of any variable annuity or variable life insurance product. If they were, the estimate of expenses you paid during the period would be higher, and your ending account value would be lower. In addition, the Fund, as a shareholder in the underlying Fidelity Central Funds, will indirectly bear its pro-rata share of the fees and expenses incurred by the underlying Fidelity Central Funds. These fees and expenses are not included in the Fund's annualized expense ratio used to calculate the expense estimate in the table below.
Hypothetical Example for Comparison Purposes
The second line of the accompanying table for each class of the Fund provides information about hypothetical account values and hypothetical expenses based on a Class' actual expense ratio and an assumed rate of return of 5% per year before expenses, which is not the Class' actual return. The hypothetical account values and expenses may not be used to estimate the actual ending account balance or expenses you paid for the period. You may use this information to compare the ongoing costs of investing in the Fund and other funds. To do so, compare this 5% hypothetical example with the 5% hypothetical examples that appear in the shareholder reports of the other funds. The estimate of expenses does not include any fees or other expenses of any variable annuity or variable life insurance product. If they were, the estimate of expenses you paid during the period would be higher, and your ending account value would be lower. In addition, the Fund, as a shareholder in the underlying Fidelity Central Funds, will indirectly bear its pro-rata share of the fees and expenses incurred by the underlying Fidelity Central Funds. These fees and expenses are not included in the Fund's annualized expense ratio used to calculate the expense estimate in the table below.
Please note that the expenses shown in the table are meant to highlight your ongoing costs only and do not reflect any transaction costs. Therefore, the second line of the table is useful in comparing ongoing costs only, and will not help you determine the relative total costs of owning different funds.
| Annualized Expense Ratio-A | Beginning Account Value January 1, 2018 | Ending Account Value June 30, 2018 | Expenses Paid During Period-B January 1, 2018 to June 30, 2018 | |
| Initial Class | .68% | |||
| Actual | $1,000.00 | $1,100.00 | $3.54 | |
| Hypothetical-C | $1,000.00 | $1,021.42 | $3.41 | |
| Investor Class | .76% | |||
| Actual | $1,000.00 | $1,099.20 | $3.96 | |
| Hypothetical-C | $1,000.00 | $1,021.03 | $3.81 |
A Annualized expense ratio reflects expenses net of applicable fee waivers.
B Expenses are equal to each Class' annualized expense ratio, multiplied by the average account value over the period, multiplied by 181/365 (to reflect the one-half year period).
C 5% return per year before expenses
Board Approval of Investment Advisory Contracts and Management Fees
VIP Consumer Discretionary Portfolio
Each year, the Board of Trustees, including the Independent Trustees (together, the Board), votes on the renewal of the management contract with Fidelity SelectCo, LLC (SelectCo), an affiliate of Fidelity Management & Research Company (FMR), and the sub-advisory agreements with affiliates of FMR (together, the Advisory Contracts) for the fund. SelectCo and the sub-advisers are collectively referred to herein as the Investment Advisers. The Board, assisted by the advice of fund counsel and Independent Trustees' counsel, requests and considers a broad range of information relevant to the renewal of the Advisory Contracts throughout the year.
The Board meets regularly and, at each of its meetings, covers an extensive agenda of topics and materials and considers factors that are relevant to its annual consideration of the renewal of the fund's Advisory Contracts, including the services and support provided to the fund and its shareholders. The Board has established four standing committees (Committees) — Operations, Audit, Fair Valuation, and Governance and Nominating — each composed of and chaired by Independent Trustees with varying backgrounds, to which the Board has assigned specific subject matter responsibilities in order to enhance effective decision-making by the Board. The Operations Committee, of which all of the Independent Trustees are members, meets regularly throughout the year and considers, among other matters, information specifically related to the annual consideration of the renewal of the fund's Advisory Contracts. The Board, acting directly and through its Committees, requests and receives information concerning the annual consideration of the renewal of the fund's Advisory Contracts. The Board also meets as needed to review matters specifically related to the Board's annual consideration of the renewal of the Advisory Contracts. Members of the Board may also meet with trustees of other Fidelity funds through ad hoc joint committees to discuss certain matters relevant to all of the Fidelity funds.
At its January 2018 meeting, the Board unanimously determined to renew the fund's Advisory Contracts. In reaching its determination, the Board considered all factors it believed relevant, including (i) the nature, extent, and quality of the services to be provided to the fund and its shareholders (including the investment performance of the fund); (ii) the competitiveness of the fund's management fee and total expense ratio relative to peer funds; (iii) the total costs of the services to be provided by and the profits to be realized by Fidelity from its relationships with the fund; and (iv) the extent to which, if any, economies of scale exist and would be realized as the fund grows, and whether any economies of scale are appropriately shared with fund shareholders.
In considering whether to renew the Advisory Contracts for the fund, the Board reached a determination, with the assistance of fund counsel and Independent Trustees' counsel and through the exercise of its business judgment, that the renewal of the Advisory Contracts was in the best interests of the fund and its shareholders and that the compensation payable under the Advisory Contracts was fair and reasonable. The Board's decision to renew the Advisory Contracts was not based on any single factor, but rather was based on a comprehensive consideration of all the information provided to the Board at its meetings throughout the year. The Board, in reaching its determination to renew the Advisory Contracts, was aware that shareholders of the fund have a broad range of investment choices available to them, including a wide choice among funds offered by Fidelity's competitors, and that the fund's shareholders, who have the opportunity to review and weigh the disclosure provided by the fund in its prospectus and other public disclosures, have chosen to invest in this fund, which is part of the Fidelity family of funds.
Amendment to Group Fee Rate. The Board also ratified an amendment to the management contract for the fund to add an additional breakpoint to the group fee schedule, which was effective October 1, 2017. The Board noted that the additional breakpoint would result in lower management fee rates to the extent that assets under management that are included in group fee calculations increase above the new breakpoint.
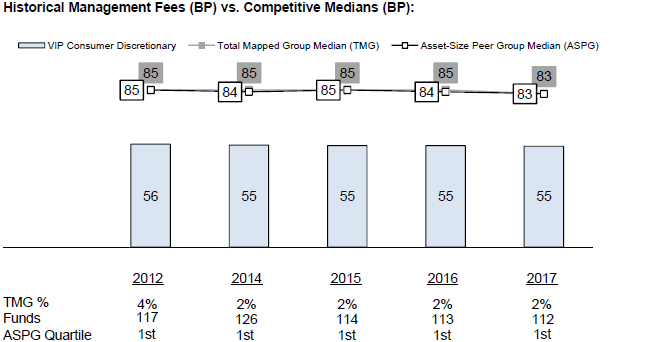
Nature, Extent, and Quality of Services Provided. The Board considered the staffing of the Investment Advisers as it relates to the fund, including the backgrounds of investment personnel of SelectCo, and also considered the fund's investment objective, strategies, and related investment philosophy. The Independent Trustees also had discussions with senior management of Fidelity's investment operations and investment groups. The Board considered the structure of the investment personnel compensation program and whether this structure provides appropriate incentives to act in the best interests of the fund. Additionally, the Board considered the portfolio managers' investments, if any, in the funds that they manage.Resources Dedicated to Investment Management and Support Services. The Board reviewed the general qualifications and capabilities of the Investment Advisers' investment staffs, including their size, education, experience, and resources, as well as Fidelity's approach to recruiting, training, managing, and compensating investment personnel. The Board noted that Fidelity has continued to increase the resources devoted to non-U.S. offices, including expansion of Fidelity's global investment organization. The Board also noted that Fidelity's analysts have extensive resources, tools and capabilities that allow them to conduct sophisticated quantitative and fundamental analysis, as well as credit analysis of issuers, counterparties and guarantors. Further, the Board considered that Fidelity's investment professionals have sufficient access to global information and data so as to provide competitive investment results over time, and that those professionals also have access to sophisticated tools that permit them to assess portfolio construction and risk and performance attribution characteristics continuously, as well as to transmit new information and research conclusions rapidly around the world. Additionally, in its deliberations, the Board considered Fidelity's trading, risk management, compliance, and technology and operations capabilities and resources, which are integral parts of the investment management process.Shareholder and Administrative Services. The Board considered (i) the nature, extent, quality, and cost of advisory, administrative, and shareholder services performed by the Investment Advisers and their affiliates under the Advisory Contracts and under separate agreements covering transfer agency, pricing and bookkeeping, and securities lending services for the fund; (ii) the nature and extent of the supervision of third party service providers, principally custodians, subcustodians, and pricing vendors; and (iii) the resources devoted to, and the record of compliance with, the fund's compliance policies and procedures. The Board also reviewed the allocation of fund brokerage, including allocations to brokers affiliated with the Investment Advisers, the use of brokerage commissions to pay fund expenses, and the use of "soft" commission dollars to pay for research services.The Board noted that the growth of fund assets over time across the complex allows Fidelity to reinvest in the development of services designed to enhance the value or convenience of the Fidelity funds as investment vehicles. These services include 24-hour access to account information and market information through telephone representatives and over the Internet, investor education materials and asset allocation tools, and the expanded availability of Fidelity Investor Centers.The Board noted that it and the boards of certain other Fidelity funds had formed an ad hoc Committee on Transfer Agency Fees to review the variety of transfer agency fee structures throughout the industry and Fidelity's competitive positioning with respect to industry participants.Investment in a Large Fund Family. The Board considered the benefits to shareholders of investing in a Fidelity fund, including the benefits of investing in a fund that is part of a large family of funds offering a variety of investment disciplines and providing a large variety of mutual fund investor services. The Board noted that Fidelity had taken, or had made recommendations that resulted in the Fidelity funds taking, a number of actions over the previous year that benefited particular funds, including: (i) continuing to dedicate additional resources to Fidelity's investment research process, which includes meetings with management of issuers in which the funds invest, and to the support of the senior management team that oversees asset management; (ii) continuing efforts to enhance Fidelity's global research capabilities; (iii) launching new funds and making other enhancements to meet client needs; (iv) launching new share classes of existing funds; (v) eliminating purchase minimums and broadening eligibility requirements for certain lower-priced share classes; (vi) reducing management fees and total expenses for certain growth equity funds and index funds; (vii) lowering expense caps for certain existing funds and classes to reduce expenses borne by shareholders; (viii) eliminating short-term redemption fees for certain funds; (ix) introducing a new pricing structure for certain funds of funds that is expected to reduce overall expenses paid by shareholders; (x) rationalizing product lines and gaining increased efficiencies through proposals for fund mergers and share class consolidations; (xi) continuing to develop, acquire and implement systems and technology to improve services to the funds and shareholders, strengthen information security, and increase efficiency; and (xii) implementing enhancements to further strengthen Fidelity's product line to increase investors' probability of success in achieving their investment goals, including retirement income goals.Investment Performance. The Board considered whether the fund has operated in accordance with its investment objective, as well as its record of compliance with its investment restrictions and its performance history.The Board took into account discussions with representatives of SelectCo about fund investment performance that occur at Board meetings throughout the year. In this regard the Board noted that as part of regularly scheduled fund reviews and other reports to the Board on fund performance, the Board considers annualized return information for the fund for different time periods, measured against a securities market index ("benchmark index"). In its evaluation of fund investment performance at meetings throughout the year, the Board gave particular attention to information indicating underperformance of certain Fidelity funds for specific time periods and discussed with the Investment Advisers the reasons for such underperformance. The fund underperformed its benchmark for the one-, three-, and five-year periods ended June 30, 2017, and as a result, the Board will continue to discuss with SelectCo the steps it is taking to address the fund's performance.In addition to reviewing absolute and relative fund performance, the Independent Trustees periodically consider the appropriateness of fund performance metrics in evaluating the results achieved. In general, the Independent Trustees believe that fund performance should be evaluated based on net performance (after fees and expenses) of both the highest performing and lowest performing fund share classes, where applicable, compared to appropriate benchmark indices, over appropriate time periods that may include full market cycles, taking into account relevant factors, including the following: general market conditions; issuer-specific information; and fund cash flows and other factors. Depending on the circumstances, the Independent Trustees may be satisfied with a fund's performance notwithstanding that it lags its benchmark index for certain periods.The Independent Trustees recognize that shareholders evaluate performance on a net basis over their own holding periods, for which one-, three-, and five-year periods are often used as a proxy. For this reason, the performance information reviewed by the Board also included net cumulative total return information for the fund and an appropriate benchmark index for the most recent one-, three-, and five-year periods ended June 30, 2017.Based on its review, the Board concluded that the nature, extent, and quality of services provided to the fund under the Advisory Contracts should continue to benefit the shareholders of the fund.Competitiveness of Management Fee and Total Expense Ratio. The Board considered the fund's management fee and total expense ratio compared to "mapped groups" of competitive funds and classes created for the purpose of facilitating the Trustees' analysis of the competitiveness of management fees and total expenses. Fidelity creates "mapped groups" by combining similar Lipper investment objective categories that have comparable investment mandates. For this purpose, all sector focused equity variable annuity funds are grouped in the same mapped group. Combining Lipper investment objective categories aids the Board's management fee and total expense ratio comparisons by broadening the competitive group used for comparison.Management Fee. The Board considered two proprietary management fee comparisons for the 12-month periods ended June 30 shown in basis points (BP) in the chart below. The group of Lipper funds used by the Board for management fee comparisons is referred to below as the "Total Mapped Group." The Total Mapped Group comparison focuses on a fund's standing in terms of gross management fees before expense reimbursements or caps relative to the total universe of funds with comparable investment mandates (i.e., sector equities), regardless of whether their management fee structures also are comparable. Funds with comparable management fee structures have similar management fee contractual arrangements (e.g., flat rate charged for advisory services, all-inclusive fee rate, etc.). "TMG %" represents the percentage of funds in the Total Mapped Group that had management fees that were lower than the fund's. For example, a hypothetical TMG % of 20% would mean that 80% of the funds in the Total Mapped Group had higher, and 20% had lower, management fees than the fund. The fund's actual TMG %s and the number of funds in the Total Mapped Group are in the chart below. The "Asset-Size Peer Group" (ASPG) comparison focuses on a fund's standing relative to a subset of non-Fidelity funds within the Total Mapped Group that are similar in size and management fee structure. For example, if a fund is in the first quartile of the ASPG, the fund's management fee ranks in the least expensive or lowest 25% of funds in the ASPG. The ASPG represents at least 15% of the funds in the Total Mapped Group with comparable asset size and management fee structures, subject to a minimum of 50 funds (or all funds in the Total Mapped Group if fewer than 50). Additional information, such as the ASPG quartile in which the fund's management fee rate ranked, is also included in the chart and considered by the Board.VIP Consumer Discretionary Portfolio
![]()
VCONIC-SANN-0818
1.817358.113
Fidelity® Variable Insurance Products: Consumer Staples Portfolio Semi-Annual Report June 30, 2018 |
|
Contents
To view a fund's proxy voting guidelines and proxy voting record for the 12-month period ended June 30, visit http://www.fidelity.com/proxyvotingresults or visit the Securities and Exchange Commission's (SEC) web site at http://www.sec.gov.
You may also call 1-877-208-0098 to request a free copy of the proxy voting guidelines.
Fidelity® Variable Insurance Products are separate account options which are purchased through a variable insurance contract.
Standard & Poor's, S&P and S&P 500 are registered service marks of The McGraw-Hill Companies, Inc. and have been licensed for use by Fidelity Distributors Corporation.
Other third-party marks appearing herein are the property of their respective owners.
All other marks appearing herein are registered or unregistered trademarks or service marks of FMR LLC or an affiliated company. © 2018 FMR LLC. All rights reserved.
This report and the financial statements contained herein are submitted for the general information of the shareholders of the Fund. This report is not authorized for distribution to prospective investors in the Fund unless preceded or accompanied by an effective prospectus.
A fund files its complete schedule of portfolio holdings with the SEC for the first and third quarters of each fiscal year on Form N-Q. Forms N-Q are available on the SEC’s web site at http://www.sec.gov. A fund's Forms N-Q may be reviewed and copied at the SEC’s Public Reference Room in Washington, DC. Information regarding the operation of the SEC's Public Reference Room may be obtained by calling 1-800-SEC-0330.
For a complete list of a fund's portfolio holdings, view the most recent holdings listing, semiannual report, or annual report on Fidelity's web site at http://www.fidelity.com, http://www.institutional.fidelity.com, or http://www.401k.com, as applicable.
NOT FDIC INSURED •MAY LOSE VALUE •NO BANK GUARANTEE
Neither the Fund nor Fidelity Distributors Corporation is a bank.
Investment Summary (Unaudited)
Top Ten Stocks as of June 30, 2018
| % of fund's net assets | |
| The Coca-Cola Co. | 9.8 |
| Philip Morris International, Inc. | 7.8 |
| Procter & Gamble Co. | 7.2 |
| PepsiCo, Inc. | 6.4 |
| Coty, Inc. Class A | 4.4 |
| Spectrum Brands Holdings, Inc. | 4.4 |
| Altria Group, Inc. | 4.1 |
| Monster Beverage Corp. | 4.0 |
| Mondelez International, Inc. | 3.8 |
| Costco Wholesale Corp. | 3.6 |
| 55.5 |
Top Industries (% of fund's net assets)
| As of June 30, 2018 | ||
| Beverages | 28.3% | |
| Food Products | 21.1% | |
| Household Products | 14.1% | |
| Tobacco | 13.9% | |
| Personal Products | 9.5% | |
| All Others* | 13.1% | |

* Includes short-term investments and net other assets (liabilities).
Schedule of Investments June 30, 2018 (Unaudited)
Showing Percentage of Net Assets
| Common Stocks - 99.1% | |||
| Shares | Value | ||
| Beverages - 28.3% | |||
| Brewers - 0.9% | |||
| Beijing Yanjing Brewery Co. Ltd. Class A | 1,419,979 | $1,443,356 | |
| China Resources Beer Holdings Co. Ltd. | 18,666 | 90,646 | |
| Molson Coors Brewing Co. Class B | 7,400 | 503,496 | |
| 2,037,498 | |||
| Distillers & Vintners - 2.5% | |||
| Constellation Brands, Inc. Class A (sub. vtg.) | 18,800 | 4,114,756 | |
| Kweichow Moutai Co. Ltd. (A Shares) | 1,850 | 204,380 | |
| Pernod Ricard SA | 6,600 | 1,078,276 | |
| 5,397,412 | |||
| Soft Drinks - 24.9% | |||
| Coca-Cola Bottling Co. Consolidated | 10,730 | 1,449,945 | |
| Coca-Cola European Partners PLC | 83,700 | 3,401,568 | |
| Coca-Cola FEMSA S.A.B. de CV sponsored ADR | 9,400 | 530,442 | |
| Coca-Cola West Co. Ltd. | 3,050 | 121,901 | |
| Dr. Pepper Snapple Group, Inc. | 37,500 | 4,575,000 | |
| Fever-Tree Drinks PLC | 7,263 | 324,943 | |
| Monster Beverage Corp. (a) | 151,400 | 8,675,220 | |
| PepsiCo, Inc. | 129,106 | 14,055,770 | |
| The Coca-Cola Co. | 489,338 | 21,462,366 | |
| 54,597,155 | |||
| TOTAL BEVERAGES | 62,032,065 | ||
| Chemicals - 0.1% | |||
| Specialty Chemicals - 0.1% | |||
| Frutarom Industries Ltd. | 3,400 | 333,192 | |
| Communications Equipment - 0.1% | |||
| Communications Equipment - 0.1% | |||
| Xiaomi Corp. Class B | 102,000 | 221,016 | |
| Food & Staples Retailing - 9.3% | |||
| Drug Retail - 1.9% | |||
| Rite Aid Corp. (a) | 181,900 | 314,687 | |
| Walgreens Boots Alliance, Inc. | 64,800 | 3,888,972 | |
| 4,203,659 | |||
| Food Distributors - 1.6% | |||
| Sysco Corp. | 48,000 | 3,277,920 | |
| United Natural Foods, Inc. (a) | 2,100 | 89,586 | |
| 3,367,506 | |||
| Food Retail - 0.8% | |||
| Kroger Co. | 30,152 | 857,824 | |
| Sprouts Farmers Market LLC (a) | 41,100 | 907,077 | |
| 1,764,901 | |||
| Hypermarkets & Super Centers - 5.0% | |||
| Bj's Wholesale Club Holdings, Inc. | 2,900 | 68,585 | |
| Costco Wholesale Corp. | 37,900 | 7,920,342 | |
| Walmart, Inc. | 35,504 | 3,040,918 | |
| 11,029,845 | |||
| TOTAL FOOD & STAPLES RETAILING | 20,365,911 | ||
| Food Products - 21.1% | |||
| Agricultural Products - 1.7% | |||
| Bunge Ltd. | 25,500 | 1,777,605 | |
| Darling International, Inc. (a) | 61,900 | 1,230,572 | |
| Ingredion, Inc. | 5,900 | 653,130 | |
| 3,661,307 | |||
| Packaged Foods & Meats - 19.4% | |||
| ConAgra Foods, Inc. | 80,700 | 2,883,411 | |
| Danone SA | 48,356 | 3,530,592 | |
| Hostess Brands, Inc. Class A (a) | 9,400 | 127,840 | |
| JBS SA | 668,500 | 1,604,090 | |
| Kellogg Co. | 46,700 | 3,262,929 | |
| Mondelez International, Inc. | 204,900 | 8,400,900 | |
| Post Holdings, Inc. (a) | 17,000 | 1,462,340 | |
| The Hain Celestial Group, Inc. (a) | 65,180 | 1,942,364 | |
| The Hershey Co. | 17,600 | 1,637,856 | |
| The J.M. Smucker Co. | 34,600 | 3,718,808 | |
| The Kraft Heinz Co. | 105,400 | 6,621,228 | |
| The Simply Good Foods Co. | 233,000 | 3,364,520 | |
| TreeHouse Foods, Inc. (a) | 79,200 | 4,158,792 | |
| 42,715,670 | |||
| TOTAL FOOD PRODUCTS | 46,376,977 | ||
| Health Care Providers & Services - 0.9% | |||
| Health Care Services - 0.9% | |||
| CVS Health Corp. | 30,039 | 1,933,010 | |
| Hotels, Restaurants & Leisure - 1.3% | |||
| Restaurants - 1.3% | |||
| Compass Group PLC | 6,795 | 145,142 | |
| U.S. Foods Holding Corp. (a) | 72,300 | 2,734,386 | |
| 2,879,528 | |||
| Household Durables - 0.1% | |||
| Housewares & Specialties - 0.1% | |||
| Newell Brands, Inc. | 10,572 | 272,652 | |
| Household Products - 14.1% | |||
| Household Products - 14.1% | |||
| Colgate-Palmolive Co. | 53,590 | 3,473,168 | |
| Essity AB Class B | 46,300 | 1,143,446 | |
| Procter & Gamble Co. | 203,807 | 15,909,174 | |
| Reckitt Benckiser Group PLC | 11,076 | 910,058 | |
| Spectrum Brands Holdings, Inc. (b) | 117,100 | 9,557,702 | |
| 30,993,548 | |||
| Multiline Retail - 0.4% | |||
| General Merchandise Stores - 0.4% | |||
| Dollar Tree, Inc. (a) | 9,900 | 841,500 | |
| Personal Products - 9.5% | |||
| Personal Products - 9.5% | |||
| Avon Products, Inc. (a) | 1,184,500 | 1,918,890 | |
| Coty, Inc. Class A | 690,248 | 9,732,497 | |
| Estee Lauder Companies, Inc. Class A | 16,700 | 2,382,923 | |
| Herbalife Nutrition Ltd. (a) | 12,700 | 682,244 | |
| Ontex Group NV | 32,500 | 713,905 | |
| Unilever NV (Certificaten Van Aandelen) (Bearer) | 96,686 | 5,387,052 | |
| 20,817,511 | |||
| Tobacco - 13.9% | |||
| Tobacco - 13.9% | |||
| Altria Group, Inc. | 159,596 | 9,063,457 | |
| British American Tobacco PLC sponsored ADR | 87,296 | 4,404,083 | |
| Philip Morris International, Inc. | 210,434 | 16,990,441 | |
| 30,457,981 | |||
| TOTAL COMMON STOCKS | |||
| (Cost $191,875,340) | 217,524,891 | ||
| Convertible Preferred Stocks - 0.7% | |||
| Internet & Direct Marketing Retail - 0.7% | |||
| Internet & Direct Marketing Retail - 0.7% | |||
| The Honest Co., Inc.: | |||
| Series D (a)(c)(d) | 32,783 | 642,704 | |
| Series E (c)(d) | 51,008 | 1,000,002 | |
| TOTAL CONVERTIBLE PREFERRED STOCKS | |||
| (Cost $2,499,988) | 1,642,706 | ||
| Money Market Funds - 2.9% | |||
| Fidelity Securities Lending Cash Central Fund 1.92% (e)(f) | |||
| (Cost $6,304,470) | 6,303,840 | 6,305,100 | |
| TOTAL INVESTMENT IN SECURITIES - 102.7% | |||
| (Cost $200,679,798) | 225,472,697 | ||
| NET OTHER ASSETS (LIABILITIES) - (2.7)% | (5,926,758) | ||
| NET ASSETS - 100% | $219,545,939 |
Legend
(a) Non-income producing
(b) Security or a portion of the security is on loan at period end.
(c) Restricted securities - Investment in securities not registered under the Securities Act of 1933 (excluding 144A issues). At the end of the period, the value of restricted securities (excluding 144A issues) amounted to $1,642,706 or 0.7% of net assets.
(d) Level 3 security
(e) Affiliated fund that is generally available only to investment companies and other accounts managed by Fidelity Investments. The rate quoted is the annualized seven-day yield of the fund at period end. A complete unaudited listing of the fund's holdings as of its most recent quarter end is available upon request. In addition, each Fidelity Central Fund's financial statements are available on the SEC's website or upon request.
(f) Investment made with cash collateral received from securities on loan.
Additional information on each restricted holding is as follows:
| Security | Acquisition Date | Acquisition Cost |
| The Honest Co., Inc. Series D | 8/3/15 | $1,499,986 |
| The Honest Co., Inc. Series E | 9/28/17 | $1,000,002 |
Affiliated Central Funds
Information regarding fiscal year to date income earned by the Fund from investments in Fidelity Central Funds is as follows:
| Fund | Income earned |
| Fidelity Cash Central Fund | $907 |
| Fidelity Securities Lending Cash Central Fund | 17,719 |
| Total | $18,626 |
Amounts in the income column in the above table include any capital gain distributions from underlying funds, which are presented in the corresponding line-item in the Statement of Operations if applicable.
Investment Valuation
The following is a summary of the inputs used, as of June 30, 2018, involving the Fund's assets and liabilities carried at fair value. The inputs or methodology used for valuing securities may not be an indication of the risk associated with investing in those securities. For more information on valuation inputs, and their aggregation into the levels used below, please refer to the Investment Valuation section in the accompanying Notes to Financial Statements.
| Valuation Inputs at Reporting Date: | ||||
| Description | Total | Level 1 | Level 2 | Level 3 |
| Investments in Securities: | ||||
| Common Stocks | $217,524,891 | $207,476,173 | $10,048,718 | $-- |
| Convertible Preferred Stocks | 1,642,706 | -- | -- | 1,642,706 |
| Money Market Funds | 6,305,100 | 6,305,100 | -- | -- |
| Total Investments in Securities: | $225,472,697 | $213,781,273 | $10,048,718 | $1,642,706 |
Other Information
Distribution of investments by country or territory of incorporation, as a percentage of Total Net Assets, is as follows (Unaudited):
| United States of America | 87.4% |
| United Kingdom | 4.1% |
| Netherlands | 2.5% |
| France | 2.1% |
| Others (Individually Less Than 1%) | 3.9% |
| 100.0% |
See accompanying notes which are an integral part of the financial statements.
Financial Statements
Statement of Assets and Liabilities
| June 30, 2018 (Unaudited) | ||
| Assets | ||
| Investment in securities, at value (including securities loaned of $6,072,528) — See accompanying schedule: Unaffiliated issuers (cost $194,375,328) | $219,167,597 | |
| Fidelity Central Funds (cost $6,304,470) | 6,305,100 | |
| Total Investment in Securities (cost $200,679,798) | $225,472,697 | |
| Foreign currency held at value (cost $2) | 2 | |
| Receivable for investments sold | 1,310,981 | |
| Receivable for fund shares sold | 17,295 | |
| Dividends receivable | 683,612 | |
| Distributions receivable from Fidelity Central Funds | 5,332 | |
| Prepaid expenses | 2,124 | |
| Other receivables | 3,704 | |
| Total assets | 227,495,747 | |
| Liabilities | ||
| Payable to custodian bank | $405,606 | |
| Payable for investments purchased | 832,217 | |
| Payable for fund shares redeemed | 251,458 | |
| Accrued management fee | 98,881 | |
| Other affiliated payables | 32,316 | |
| Other payables and accrued expenses | 25,770 | |
| Collateral on securities loaned | 6,303,560 | |
| Total liabilities | 7,949,808 | |
| Net Assets | $219,545,939 | |
| Net Assets consist of: | ||
| Paid in capital | $188,392,764 | |
| Undistributed net investment income | 2,135,841 | |
| Accumulated undistributed net realized gain (loss) on investments and foreign currency transactions | 4,224,907 | |
| Net unrealized appreciation (depreciation) on investments and assets and liabilities in foreign currencies | 24,792,427 | |
| Net Assets | $219,545,939 | |
| Initial Class: | ||
| Net Asset Value, offering price and redemption price per share ($20,066,659 ÷ 1,198,967 shares) | $16.74 | |
| Investor Class: | ||
| Net Asset Value, offering price and redemption price per share ($199,479,280 ÷ 11,971,599 shares) | $16.66 |
See accompanying notes which are an integral part of the financial statements.
Statement of Operations
| Six months ended June 30, 2018 (Unaudited) | ||
| Investment Income | ||
| Dividends | $3,030,459 | |
| Income from Fidelity Central Funds | 18,626 | |
| Total income | 3,049,085 | |
| Expenses | ||
| Management fee | $668,265 | |
| Transfer agent fees | 167,589 | |
| Accounting and security lending fees | 48,744 | |
| Custodian fees and expenses | 13,284 | |
| Independent trustees' fees and expenses | 1,289 | |
| Audit | 27,853 | |
| Legal | 2,687 | |
| Miscellaneous | (3,524) | |
| Total expenses before reductions | 926,187 | |
| Expense reductions | (9,111) | |
| Total expenses after reductions | 917,076 | |
| Net investment income (loss) | 2,132,009 | |
| Realized and Unrealized Gain (Loss) | ||
| Net realized gain (loss) on: | ||
| Investment securities: | ||
| Unaffiliated issuers | 5,396,233 | |
| Fidelity Central Funds | (18) | |
| Foreign currency transactions | (8,412) | |
| Total net realized gain (loss) | 5,387,803 | |
| Change in net unrealized appreciation (depreciation) on: | ||
| Investment securities: | ||
| Unaffiliated issuers | (32,372,791) | |
| Fidelity Central Funds | 378 | |
| Assets and liabilities in foreign currencies | (354) | |
| Total change in net unrealized appreciation (depreciation) | (32,372,767) | |
| Net gain (loss) | (26,984,964) | |
| Net increase (decrease) in net assets resulting from operations | $(24,852,955) |
See accompanying notes which are an integral part of the financial statements.
Statement of Changes in Net Assets
| Six months ended June 30, 2018 (Unaudited) | Year ended December 31, 2017 | |
| Increase (Decrease) in Net Assets | ||
| Operations | ||
| Net investment income (loss) | $2,132,009 | $5,028,593 |
| Net realized gain (loss) | 5,387,803 | 16,416,777 |
| Change in net unrealized appreciation (depreciation) | (32,372,767) | 19,914,119 |
| Net increase (decrease) in net assets resulting from operations | (24,852,955) | 41,359,489 |
| Distributions to shareholders from net investment income | (949,103) | (4,398,396) |
| Distributions to shareholders from net realized gain | (16,215,630) | – |
| Total distributions | (17,164,733) | (4,398,396) |
| Share transactions - net increase (decrease) | (25,915,559) | (66,674,321) |
| Redemption fees | – | 8,394 |
| Total increase (decrease) in net assets | (67,933,247) | (29,704,834) |
| Net Assets | ||
| Beginning of period | 287,479,186 | 317,184,020 |
| End of period | $219,545,939 | $287,479,186 |
| Other Information | ||
| Undistributed net investment income end of period | $2,135,841 | $952,935 |
See accompanying notes which are an integral part of the financial statements.
Financial Highlights
VIP Consumer Staples Portfolio Initial Class
| Six months ended (Unaudited) June 30, | Years endedDecember 31, | |||||
| 2018 | 2017 | 2016 | 2015 | 2014 | 2013 | |
| Selected Per–Share Data | ||||||
| Net asset value, beginning of period | $19.72 | $17.48 | $18.25 | $18.08 | $16.44 | $14.03 |
| Income from Investment Operations | ||||||
| Net investment income (loss)A | .16 | .32 | .33 | .28 | .28 | .31 |
| Net realized and unrealized gain (loss) | (1.90) | 2.24 | .30 | 1.34 | 2.21 | 2.73 |
| Total from investment operations | (1.74) | 2.56 | .63 | 1.62 | 2.49 | 3.04 |
| Distributions from net investment income | (.07) | (.32) | (.33)B | (.27) | (.24) | (.31) |
| Distributions from net realized gain | (1.17) | – | (1.07)B | (1.18) | (.61) | (.32) |
| Total distributions | (1.24) | (.32) | (1.40) | (1.45) | (.85) | (.63) |
| Redemption fees added to paid in capitalA | – | –C | –C | –C | –C | –C |
| Net asset value, end of period | $16.74 | $19.72 | $17.48 | $18.25 | $18.08 | $16.44 |
| Total ReturnD,E,F | (9.09)% | 14.66% | 3.72% | 9.46% | 15.66% | 21.80% |
| Ratios to Average Net AssetsG,H | ||||||
| Expenses before reductions | .68%I | .68% | .68% | .69% | .71% | .73% |
| Expenses net of fee waivers, if any | .68%I | .68% | .68% | .69% | .70% | .72% |
| Expenses net of all reductions | .67%I | .68% | .67% | .68% | .70% | .72% |
| Net investment income (loss) | 1.80%I | 1.69% | 1.79% | 1.61% | 1.66% | 1.94% |
| Supplemental Data | ||||||
| Net assets, end of period (000 omitted) | $20,067 | $29,388 | $38,192 | $28,077 | $22,943 | $25,736 |
| Portfolio turnover rateJ | 41%I | 41% | 45% | 38% | 78% | 36% |
A Calculated based on average shares outstanding during the period.
B The amounts shown reflect certain reclassifications related to book to tax differences that were made in the year shown.
C Amount represents less than $.005 per share.
D Total returns for periods of less than one year are not annualized.
E Total returns do not reflect charges attributable to your insurance company's separate account. Inclusion of these charges would reduce the total returns shown.
F Total returns would have been lower if certain expenses had not been reduced during the applicable periods shown.
G Fees and expenses of any underlying Fidelity Central Funds are not included in the Fund's expense ratio. The Fund indirectly bears its proportionate share of the expenses of any underlying Fidelity Central Funds.
H Expense ratios reflect operating expenses of the class. Expenses before reductions do not reflect amounts reimbursed by the investment adviser or reductions from brokerage service arrangements or reductions from other expense offset arrangements and do not represent the amount paid by the class during periods when reimbursements or reductions occur. Expenses net of fee waivers reflect expenses after reimbursement by the investment adviser but prior to reductions from brokerage service arrangements or other expense offset arrangements. Expenses net of all reductions represent the net expenses paid by the class.
I Annualized
J Amount does not include the portfolio activity of any underlying Fidelity Central Funds.
See accompanying notes which are an integral part of the financial statements.
VIP Consumer Staples Portfolio Investor Class
| Six months ended (Unaudited) June 30, | Years endedDecember 31, | |||||
| 2018 | 2017 | 2016 | 2015 | 2014 | 2013 | |
| Selected Per–Share Data | ||||||
| Net asset value, beginning of period | $19.64 | $17.42 | $18.19 | $18.02 | $16.40 | $13.99 |
| Income from Investment Operations | ||||||
| Net investment income (loss)A | .15 | .31 | .32 | .27 | .26 | .30 |
| Net realized and unrealized gain (loss) | (1.89) | 2.21 | .30 | 1.34 | 2.20 | 2.73 |
| Total from investment operations | (1.74) | 2.52 | .62 | 1.61 | 2.46 | 3.03 |
| Distributions from net investment income | (.07) | (.30) | (.32)B | (.26) | (.23) | (.30) |
| Distributions from net realized gain | (1.17) | – | (1.07)B | (1.18) | (.61) | (.32) |
| Total distributions | (1.24) | (.30) | (1.39) | (1.44) | (.84) | (.62) |
| Redemption fees added to paid in capitalA | – | –C | –C | –C | –C | –C |
| Net asset value, end of period | $16.66 | $19.64 | $17.42 | $18.19 | $18.02 | $16.40 |
| Total ReturnD,E,F | (9.14)% | 14.52%�� | 3.67% | 9.41% | 15.52% | 21.79% |
| Ratios to Average Net AssetsG,H | ||||||
| Expenses before reductions | .76%I | .76% | .76% | .77% | .78% | .80% |
| Expenses net of fee waivers, if any | .76%I | .76% | .76% | .76% | .78% | .80% |
| Expenses net of all reductions | .75%I | .76% | .75% | .76% | .77% | .80% |
| Net investment income (loss) | 1.72%I | 1.61% | 1.71% | 1.53% | 1.59% | 1.86% |
| Supplemental Data | ||||||
| Net assets, end of period (000 omitted) | $199,479 | $258,092 | $278,992 | $213,575 | $160,591 | $140,485 |
| Portfolio turnover rateJ | 41%I | 41% | 45% | 38% | 78% | 36% |
A Calculated based on average shares outstanding during the period.
B The amounts shown reflect certain reclassifications related to book to tax differences that were made in the year shown.
C Amount represents less than $.005 per share.
D Total returns for periods of less than one year are not annualized.
E Total returns do not reflect charges attributable to your insurance company's separate account. Inclusion of these charges would reduce the total returns shown.
F Total returns would have been lower if certain expenses had not been reduced during the applicable periods shown.
G Fees and expenses of any underlying Fidelity Central Funds are not included in the Fund's expense ratio. The Fund indirectly bears its proportionate share of the expenses of any underlying Fidelity Central Funds.
H Expense ratios reflect operating expenses of the class. Expenses before reductions do not reflect amounts reimbursed by the investment adviser or reductions from brokerage service arrangements or reductions from other expense offset arrangements and do not represent the amount paid by the class during periods when reimbursements or reductions occur. Expenses net of fee waivers reflect expenses after reimbursement by the investment adviser but prior to reductions from brokerage service arrangements or other expense offset arrangements. Expenses net of all reductions represent the net expenses paid by the class.
I Annualized
J Amount does not include the portfolio activity of any underlying Fidelity Central Funds.
See accompanying notes which are an integral part of the financial statements.
Notes to Financial Statements (Unaudited)
For the period ended June 30, 2018
1. Organization.
VIP Consumer Staples Portfolio (the Fund) is a non-diversified fund of Variable Insurance Products Fund IV (the Trust) and is authorized to issue an unlimited number of shares. The Trust is registered under the Investment Company Act of 1940, as amended (the 1940 Act), as an open-end management investment company organized as a Massachusetts business trust. Shares of the Fund may only be purchased by insurance companies for the purpose of funding variable annuity or variable life insurance contracts. The Fund offers the following classes of shares: Initial Class shares and Investor Class shares. All classes have equal rights and voting privileges, except for matters affecting a single class.
2. Investments in Fidelity Central Funds.
The Fund invests in Fidelity Central Funds, which are open-end investment companies generally available only to other investment companies and accounts managed by the investment adviser and its affiliates. The Fund's Schedule of Investments lists each of the Fidelity Central Funds held as of period end, if any, as an investment of the Fund, but does not include the underlying holdings of each Fidelity Central Fund. As an Investing Fund, the Fund indirectly bears its proportionate share of the expenses of the underlying Fidelity Central Funds.
The Money Market Central Funds seek preservation of capital and current income and are managed by Fidelity Investments Money Management, Inc. (FIMM), an affiliate of the investment adviser. Annualized expenses of the Money Market Central Funds as of their most recent shareholder report date are less than .005%.
A complete unaudited list of holdings for each Fidelity Central Fund is available upon request or at the Securities and Exchange Commission (the SEC) website at www.sec.gov. In addition, the financial statements of the Fidelity Central Funds are available on the SEC website or upon request.
3. Significant Accounting Policies.
The Fund is an investment company and applies the accounting and reporting guidance of the Financial Accounting Standards Board (FASB) Accounting Standards Codification Topic 946 Financial Services – Investments Companies. The financial statements have been prepared in conformity with accounting principles generally accepted in the United States of America (GAAP), which require management to make certain estimates and assumptions at the date of the financial statements. Actual results could differ from those estimates. Subsequent events, if any, through the date that the financial statements were issued have been evaluated in the preparation of the financial statements. The following summarizes the significant accounting policies of the Fund:
Investment Valuation. Investments are valued as of 4:00 p.m. Eastern time on the last calendar day of the period. The Board of Trustees (the Board) has delegated the day to day responsibility for the valuation of the Fund's investments to the Fair Value Committee (the Committee) established by the Fund's investment adviser. In accordance with valuation policies and procedures approved by the Board, the Fund attempts to obtain prices from one or more third party pricing vendors or brokers to value its investments. When current market prices, quotations or currency exchange rates are not readily available or reliable, investments will be fair valued in good faith by the Committee, in accordance with procedures adopted by the Board. Factors used in determining fair value vary by investment type and may include market or investment specific events. The frequency with which these procedures are used cannot be predicted and they may be utilized to a significant extent. The Committee oversees the Fund's valuation policies and procedures and reports to the Board on the Committee's activities and fair value determinations. The Board monitors the appropriateness of the procedures used in valuing the Fund's investments and ratifies the fair value determinations of the Committee.
The Fund categorizes the inputs to valuation techniques used to value its investments into a disclosure hierarchy consisting of three levels as shown below:
- Level 1 – quoted prices in active markets for identical investments
- Level 2 – other significant observable inputs (including quoted prices for similar investments, interest rates, prepayment speeds, etc.)
- Level 3 – unobservable inputs (including the Fund's own assumptions based on the best information available)
Valuation techniques used to value the Fund's investments by major category are as follows:
Equity securities, including restricted securities, for which market quotations are readily available, are valued at the last reported sale price or official closing price as reported by a third party pricing vendor on the primary market or exchange on which they are traded and are categorized as Level 1 in the hierarchy. In the event there were no sales during the day or closing prices are not available, securities are valued at the last quoted bid price or may be valued using the last available price and are generally categorized as Level 2 in the hierarchy. For foreign equity securities, when market or security specific events arise, comparisons to the valuation of American Depositary Receipts (ADRs), futures contracts, Exchange-Traded Funds (ETFs) and certain indexes as well as quoted prices for similar securities may be used and would be categorized as Level 2 in the hierarchy. Utilizing these techniques may result in transfers between Level 1 and Level 2. For equity securities, including restricted securities, where observable inputs are limited, assumptions about market activity and risk are used and these securities may be categorized as Level 3 in the hierarchy.
Investments in open-end mutual funds, including the Fidelity Central Funds, are valued at their closing net asset value (NAV) each business day and are categorized as Level 1 in the hierarchy
Changes in valuation techniques may result in transfers in or out of an assigned level within the disclosure hierarchy. The aggregate value of investments by input level as of June 30, 2018 is included at the end of the Fund's Schedule of Investments.
Foreign Currency. The Fund may use foreign currency contracts to facilitate transactions in foreign-denominated securities. Gains and losses from these transactions may arise from changes in the value of the foreign currency or if the counterparties do not perform under the contracts' terms.
Foreign-denominated assets, including investment securities, and liabilities are translated into U.S. dollars at the exchange rates at period end. Purchases and sales of investment securities, income and dividends received and expenses denominated in foreign currencies are translated into U.S. dollars at the exchange rate in effect on the transaction date.
The effects of exchange rate fluctuations on investments are included with the net realized and unrealized gain (loss) on investment securities. Other foreign currency transactions resulting in realized and unrealized gain (loss) are disclosed separately.
Investment Transactions and Income. For financial reporting purposes, the Fund's investment holdings and NAV include trades executed through the end of the last business day of the period. The NAV per share for processing shareholder transactions is calculated as of the close of business of the New York Stock Exchange (NYSE), normally 4:00 p.m. Eastern time and includes trades executed through the end of the prior business day. Gains and losses on securities sold are determined on the basis of identified cost and include proceeds received from litigation. Dividend income is recorded on the ex-dividend date, except for certain dividends from foreign securities where the ex-dividend date may have passed, which are recorded as soon as the Fund is informed of the ex-dividend date. Non-cash dividends included in dividend income, if any, are recorded at the fair market value of the securities received. Income and capital gain distributions from Fidelity Central Funds, if any, are recorded on the ex-dividend date. Certain distributions received by the Fund represent a return of capital or capital gain. The Fund determines the components of these distributions subsequent to the ex-dividend date, based upon receipt of tax filings or other correspondence relating to the underlying investment. These distributions are recorded as a reduction of cost of investments and/or as a realized gain. Investment income is recorded net of foreign taxes withheld where recovery of such taxes is uncertain.
Class Allocations and Expenses. Investment income, realized and unrealized capital gains and losses, common expenses of the Fund, and certain fund-level expense reductions, if any, are allocated daily on a pro-rata basis to each class based on the relative net assets of each class to the total net assets of the Fund. Each class differs with respect to transfer agent fees incurred. Certain expense reductions may also differ by class. For the reporting period, the allocated portion of income and expenses to each class as a percent of its average net assets may vary due to the timing of recording these transactions in relation to fluctuating net assets of the classes. Expenses directly attributable to a fund are charged to that fund. Expenses attributable to more than one fund are allocated among the respective funds on the basis of relative net assets or other appropriate methods. Expense estimates are accrued in the period to which they relate and adjustments are made when actual amounts are known.
Income Tax Information and Distributions to Shareholders. Each year, the Fund intends to qualify as a regulated investment company under Subchapter M of the Internal Revenue Code, including distributing substantially all of its taxable income and realized gains. As a result, no provision for U.S. Federal income taxes is required. The Fund files a U.S. federal tax return, in addition to state and local tax returns as required. The Fund's federal income tax returns are subject to examination by the Internal Revenue Service (IRS) for a period of three fiscal years after they are filed. State and local tax returns may be subject to examination for an additional fiscal year depending on the jurisdiction. Foreign taxes are provided for based on the Fund's understanding of the tax rules and rates that exist in the foreign markets in which it invests.
Distributions are declared and recorded on the ex-dividend date. Income and capital gain distributions are declared separately for each class. Income and capital gain distributions are determined in accordance with income tax regulations, which may differ from GAAP.
Capital accounts within the financial statements are adjusted for permanent book-tax differences. These adjustments have no impact on net assets or the results of operations. Capital accounts are not adjusted for temporary book-tax differences which will reverse in a subsequent period.
Book-tax differences are primarily due to foreign currency transactions, passive foreign investment companies (PFIC), and losses deferred due to wash sales and excise tax regulations.
As of period end, the cost and unrealized appreciation (depreciation) in securities, and derivatives if applicable, for federal income tax purposes were as follows:
| Gross unrealized appreciation | $37,583,046 |
| Gross unrealized depreciation | (13,538,688) |
| Net unrealized appreciation (depreciation) | $24,044,358 |
| Tax cost | $201,428,339 |
Restricted Securities. The Fund may invest in securities that are subject to legal or contractual restrictions on resale. These securities generally may be resold in transactions exempt from registration or to the public if the securities are registered. Disposal of these securities may involve time-consuming negotiations and expense, and prompt sale at an acceptable price may be difficult. Information regarding restricted securities is included at the end of the Fund's Schedule of Investments.
4. Purchases and Sales of Investments.
Purchases and sales of securities, other than short-term securities, aggregated $51,088,032 and $89,119,435, respectively.
5. Fees and Other Transactions with Affiliates.
Management Fee. Fidelity SelectCo, LLC (the investment adviser) and its affiliates provide the Fund with investment management related services for which the Fund pays a monthly management fee. The management fee is the sum of an individual fund fee rate that is based on an annual rate of .30% of the Fund's average net assets and an annualized group fee rate that averaged .24% during the period. The group fee rate is based upon the average net assets of all the mutual funds advised by Fidelity Management & Research Company (FMR) and the investment adviser. The group fee rate decreases as assets under management increase and increases as assets under management decrease. For the reporting period, the total annualized management fee rate was .54% of the Fund's average net assets.
Transfer Agent Fees. Fidelity Investments Institutional Operations Company, Inc. (FIIOC), an affiliate of the investment adviser, is the Fund's transfer, dividend disbursing, and shareholder servicing agent. FIIOC receives an asset-based fee with respect to each class. Each class pays a fee for transfer agent services, typesetting and printing and mailing of shareholder reports, excluding mailing of proxy statements, equal to an annual rate of class-level average net assets. The annual rate for Investor Class is .15% and the annual rate for all other classes is .07%. For the period, transfer agent fees for each class were as follows:
| Initial Class | $7,787 |
| Investor Class | 159,802 |
| $167,589 |
Accounting and Security Lending Fees. Fidelity Service Company, Inc. (FSC), an affiliate of the investment adviser, maintains the Fund's accounting records. The accounting fee is based on the level of average net assets for each month. Under a separate contract, FSC administers the security lending program. The security lending fee is based on the number and duration of lending transactions. For the period, the fees were equivalent to an annualized rate of .04%.
Brokerage Commissions. The Fund placed a portion of its portfolio transactions with brokerage firms which are affiliates of the investment adviser. Brokerage commissions are included in net realized gain (loss) and change in net unrealized appreciation (depreciation) in the Statement of Operations. The commissions paid to these affiliated firms were $1,832 for the period.
Interfund Trades. The Fund may purchase from or sell securities to other Fidelity Funds under procedures adopted by the Board. The procedures have been designed to ensure these interfund trades are executed in accordance with Rule 17a-7 of the 1940 Act. Interfund trades are included within the respective purchases and sales amounts shown in the Purchases and Sales of Investments note.
6. Committed Line of Credit.
The Fund participates with other funds managed by the investment adviser or an affiliate in a $4.25 billion credit facility (the "line of credit") to be utilized for temporary or emergency purposes to fund shareholder redemptions or for other short-term liquidity purposes. The Fund has agreed to pay commitment fees on its pro-rata portion of the line of credit, which amounted to $396 and is reflected in Miscellaneous expenses on the Statement of Operations. During the period, the Fund did not borrow on this line of credit.
7. Security Lending.
The Fund lends portfolio securities through a lending agent from time to time in order to earn additional income. On the settlement date of the loan, the Fund receives collateral (in the form of U.S. Treasury obligations, letters of credit and/or cash) against the loaned securities and maintains collateral in an amount not less than 100% of the market value of the loaned securities during the period of the loan. The market value of the loaned securities is determined at the close of business of the Fund and any additional required collateral is delivered to the Fund on the next business day. The Fund or borrower may terminate the loan at any time, and if the borrower defaults on its obligation to return the securities loaned because of insolvency or other reasons, the Fund may apply collateral received from the borrower against the obligation. The Fund may experience delays and costs in recovering the securities loaned. Any cash collateral received is invested in the Fidelity Securities Lending Cash Central Fund. The value of loaned securities and cash collateral at period end are disclosed on the Fund's Statement of Assets and Liabilities. Security lending income represents the income earned on investing cash collateral, less rebates paid to borrowers and any lending agent fees associated with the loan, plus any premium payments received for lending certain types of securities. Security lending income is presented in the Statement of Operations as a component of income from Fidelity Central Funds. Total security lending income during the period amounted to $17,719.
8. Expense Reductions.
Commissions paid to certain brokers with whom the investment adviser, or its affiliates, places trades on behalf of the Fund include an amount in addition to trade execution, which may be rebated back to the Fund to offset certain expenses. This amount totaled $7,825 for the period.
In addition, during the period the investment adviser reimbursed and/or waived a portion of fund-level operating expenses in the amount of $1,286.
9. Distributions to Shareholders.
Distributions to shareholders of each class were as follows:
| Six months ended June 30, 2018 | Year ended December 31, 2017 | |
| From net investment income | ||
| Initial Class | $100,203 | $462,346 |
| Investor Class | 848,900 | 3,936,050 |
| Total | $949,103 | $4,398,396 |
| From net realized gain | ||
| Initial Class | $1,647,005 | $– |
| Investor Class | 14,568,625 | – |
| Total | $16,215,630 | $– |
10. Share Transactions.
Transactions for each class of shares were as follows:
| Shares | Shares | Dollars | Dollars | |
| Six months ended June 30, 2018 | Year ended December 31, 2017 | Six months ended June 30, 2018 | Year ended December 31, 2017 | |
| Initial Class | ||||
| Shares sold | 11,712 | 107,109 | $215,205 | $2,071,040 |
| Reinvestment of distributions | 100,184 | 23,968 | 1,747,208 | 462,346 |
| Shares redeemed | (403,431) | (825,192) | (7,022,634) | (15,503,391) |
| Net increase (decrease) | (291,535) | (694,115) | $(5,060,221) | $(12,970,005) |
| Investor Class | ||||
| Shares sold | 107,864 | 570,245 | $1,900,282 | $10,950,378 |
| Reinvestment of distributions | 888,106 | 204,789 | 15,417,525 | 3,936,050 |
| Shares redeemed | (2,165,956) | (3,651,453) | (38,173,145) | (68,590,744) |
| Net increase (decrease) | (1,169,986) | (2,876,419) | $(20,855,338) | $(53,704,316) |
11. Other.
The Fund's organizational documents provide former and current trustees and officers with a limited indemnification against liabilities arising in connection with the performance of their duties to the Fund. In the normal course of business, the Fund may also enter into contracts that provide general indemnifications. The Fund's maximum exposure under these arrangements is unknown as this would be dependent on future claims that may be made against the Fund. The risk of material loss from such claims is considered remote.
At the end of the period, the investment adviser or its affiliates were the owners of record of 100% of the total outstanding shares of the Fund.
Shareholder Expense Example
As a shareholder of the Fund, you incur two types of costs: (1) transaction costs and (2) ongoing costs, including management fees and other Fund expenses. This Example is intended to help you understand your ongoing costs (in dollars) of investing in the Fund and to compare these costs with the ongoing costs of investing in other mutual funds.
The Example is based on an investment of $1,000 invested at the beginning of the period and held for the entire period (January 1, 2018 to June 30, 2018).
Actual Expenses
The first line of the accompanying table for each class of the Fund provides information about actual account values and actual expenses. You may use the information in this line, together with the amount you invested, to estimate the expenses that you paid over the period. Simply divide your account value by $1,000.00 (for example, an $8,600 account value divided by $1,000.00 = 8.6), then multiply the result by the number in the first line for a class of the Fund under the heading entitled "Expenses Paid During Period" to estimate the expenses you paid on your account during this period. The estimate of expenses does not include any fees or other expenses of any variable annuity or variable life insurance product. If they were, the estimate of expenses you paid during the period would be higher, and your ending account value would be lower. In addition, the Fund, as a shareholder in the underlying Fidelity Central Funds, will indirectly bear its pro-rata share of the fees and expenses incurred by the underlying Fidelity Central Funds. These fees and expenses are not included in the Fund's annualized expense ratio used to calculate the expense estimate in the table below.
Hypothetical Example for Comparison Purposes
The second line of the accompanying table for each class of the Fund provides information about hypothetical account values and hypothetical expenses based on a Class' actual expense ratio and an assumed rate of return of 5% per year before expenses, which is not the Class' actual return. The hypothetical account values and expenses may not be used to estimate the actual ending account balance or expenses you paid for the period. You may use this information to compare the ongoing costs of investing in the Fund and other funds. To do so, compare this 5% hypothetical example with the 5% hypothetical examples that appear in the shareholder reports of the other funds. The estimate of expenses does not include any fees or other expenses of any variable annuity or variable life insurance product. If they were, the estimate of expenses you paid during the period would be higher, and your ending account value would be lower. In addition, the Fund, as a shareholder in the underlying Fidelity Central Funds, will indirectly bear its pro-rata share of the fees and expenses incurred by the underlying Fidelity Central Funds. These fees and expenses are not included in the Fund's annualized expense ratio used to calculate the expense estimate in the table below.
Please note that the expenses shown in the table are meant to highlight your ongoing costs only and do not reflect any transaction costs. Therefore, the second line of the table is useful in comparing ongoing costs only, and will not help you determine the relative total costs of owning different funds.
| Annualized Expense Ratio-A | Beginning Account Value January 1, 2018 | Ending Account Value June 30, 2018 | Expenses Paid During Period-B January 1, 2018 to June 30, 2018 | |
| Initial Class | .68% | |||
| Actual | $1,000.00 | $909.10 | $3.22 | |
| Hypothetical-C | $1,000.00 | $1,021.42 | $3.41 | |
| Investor Class | .76% | |||
| Actual | $1,000.00 | $908.60 | $3.60 | |
| Hypothetical-C | $1,000.00 | $1,021.03 | $3.81 |
A Annualized expense ratio reflects expenses net of applicable fee waivers.
B Expenses are equal to each Class' annualized expense ratio, multiplied by the average account value over the period, multiplied by 181/365 (to reflect the one-half year period).
C 5% return per year before expenses
Board Approval of Investment Advisory Contracts and Management Fees
VIP Consumer Staples Portfolio
Each year, the Board of Trustees, including the Independent Trustees (together, the Board), votes on the renewal of the management contract with Fidelity SelectCo, LLC (SelectCo), an affiliate of Fidelity Management & Research Company (FMR), and the sub-advisory agreements with affiliates of FMR (together, the Advisory Contracts) for the fund. SelectCo and the sub-advisers are collectively referred to herein as the Investment Advisers. The Board, assisted by the advice of fund counsel and Independent Trustees' counsel, requests and considers a broad range of information relevant to the renewal of the Advisory Contracts throughout the year.
The Board meets regularly and, at each of its meetings, covers an extensive agenda of topics and materials and considers factors that are relevant to its annual consideration of the renewal of the fund's Advisory Contracts, including the services and support provided to the fund and its shareholders. The Board has established four standing committees (Committees) — Operations, Audit, Fair Valuation, and Governance and Nominating — each composed of and chaired by Independent Trustees with varying backgrounds, to which the Board has assigned specific subject matter responsibilities in order to enhance effective decision-making by the Board. The Operations Committee, of which all of the Independent Trustees are members, meets regularly throughout the year and considers, among other matters, information specifically related to the annual consideration of the renewal of the fund's Advisory Contracts. The Board, acting directly and through its Committees, requests and receives information concerning the annual consideration of the renewal of the fund's Advisory Contracts. The Board also meets as needed to review matters specifically related to the Board's annual consideration of the renewal of the Advisory Contracts. Members of the Board may also meet with trustees of other Fidelity funds through ad hoc joint committees to discuss certain matters relevant to all of the Fidelity funds.
At its January 2018 meeting, the Board unanimously determined to renew the fund's Advisory Contracts. In reaching its determination, the Board considered all factors it believed relevant, including (i) the nature, extent, and quality of the services to be provided to the fund and its shareholders (including the investment performance of the fund); (ii) the competitiveness of the fund's management fee and total expense ratio relative to peer funds; (iii) the total costs of the services to be provided by and the profits to be realized by Fidelity from its relationships with the fund; and (iv) the extent to which, if any, economies of scale exist and would be realized as the fund grows, and whether any economies of scale are appropriately shared with fund shareholders.
In considering whether to renew the Advisory Contracts for the fund, the Board reached a determination, with the assistance of fund counsel and Independent Trustees' counsel and through the exercise of its business judgment, that the renewal of the Advisory Contracts was in the best interests of the fund and its shareholders and that the compensation payable under the Advisory Contracts was fair and reasonable. The Board's decision to renew the Advisory Contracts was not based on any single factor, but rather was based on a comprehensive consideration of all the information provided to the Board at its meetings throughout the year. The Board, in reaching its determination to renew the Advisory Contracts, was aware that shareholders of the fund have a broad range of investment choices available to them, including a wide choice among funds offered by Fidelity's competitors, and that the fund's shareholders, who have the opportunity to review and weigh the disclosure provided by the fund in its prospectus and other public disclosures, have chosen to invest in this fund, which is part of the Fidelity family of funds.
Amendment to Group Fee Rate. The Board also ratified an amendment to the management contract for the fund to add an additional breakpoint to the group fee schedule, which was effective October 1, 2017. The Board noted that the additional breakpoint would result in lower management fee rates to the extent that assets under management that are included in group fee calculations increase above the new breakpoint.
Nature, Extent, and Quality of Services Provided. The Board considered the staffing of the Investment Advisers as it relates to the fund, including the backgrounds of investment personnel of SelectCo, and also considered the fund's investment objective, strategies, and related investment philosophy. The Independent Trustees also had discussions with senior management of Fidelity's investment operations and investment groups. The Board considered the structure of the investment personnel compensation program and whether this structure provides appropriate incentives to act in the best interests of the fund. Additionally, the Board considered the portfolio managers' investments, if any, in the funds that they manage.Resources Dedicated to Investment Management and Support Services. The Board reviewed the general qualifications and capabilities of the Investment Advisers' investment staffs, including their size, education, experience, and resources, as well as Fidelity's approach to recruiting, training, managing, and compensating investment personnel. The Board noted that Fidelity has continued to increase the resources devoted to non-U.S. offices, including expansion of Fidelity's global investment organization. The Board also noted that Fidelity's analysts have extensive resources, tools and capabilities that allow them to conduct sophisticated quantitative and fundamental analysis, as well as credit analysis of issuers, counterparties and guarantors. Further, the Board considered that Fidelity's investment professionals have sufficient access to global information and data so as to provide competitive investment results over time, and that those professionals also have access to sophisticated tools that permit them to assess portfolio construction and risk and performance attribution characteristics continuously, as well as to transmit new information and research conclusions rapidly around the world. Additionally, in its deliberations, the Board considered Fidelity's trading, risk management, compliance, and technology and operations capabilities and resources, which are integral parts of the investment management process.Shareholder and Administrative Services. The Board considered (i) the nature, extent, quality, and cost of advisory, administrative, and shareholder services performed by the Investment Advisers and their affiliates under the Advisory Contracts and under separate agreements covering transfer agency, pricing and bookkeeping, and securities lending services for the fund; (ii) the nature and extent of the supervision of third party service providers, principally custodians, subcustodians, and pricing vendors; and (iii) the resources devoted to, and the record of compliance with, the fund's compliance policies and procedures. The Board also reviewed the allocation of fund brokerage, including allocations to brokers affiliated with the Investment Advisers, the use of brokerage commissions to pay fund expenses, and the use of "soft" commission dollars to pay for research services.The Board noted that the growth of fund assets over time across the complex allows Fidelity to reinvest in the development of services designed to enhance the value or convenience of the Fidelity funds as investment vehicles. These services include 24-hour access to account information and market information through telephone representatives and over the Internet, investor education materials and asset allocation tools, and the expanded availability of Fidelity Investor Centers.The Board noted that it and the boards of certain other Fidelity funds had formed an ad hoc Committee on Transfer Agency Fees to review the variety of transfer agency fee structures throughout the industry and Fidelity's competitive positioning with respect to industry participants.Investment in a Large Fund Family. The Board considered the benefits to shareholders of investing in a Fidelity fund, including the benefits of investing in a fund that is part of a large family of funds offering a variety of investment disciplines and providing a large variety of mutual fund investor services. The Board noted that Fidelity had taken, or had made recommendations that resulted in the Fidelity funds taking, a number of actions over the previous year that benefited particular funds, including: (i) continuing to dedicate additional resources to Fidelity's investment research process, which includes meetings with management of issuers in which the funds invest, and to the support of the senior management team that oversees asset management; (ii) continuing efforts to enhance Fidelity's global research capabilities; (iii) launching new funds and making other enhancements to meet client needs; (iv) launching new share classes of existing funds; (v) eliminating purchase minimums and broadening eligibility requirements for certain lower-priced share classes; (vi) reducing management fees and total expenses for certain growth equity funds and index funds; (vii) lowering expense caps for certain existing funds and classes to reduce expenses borne by shareholders; (viii) eliminating short-term redemption fees for certain funds; (ix) introducing a new pricing structure for certain funds of funds that is expected to reduce overall expenses paid by shareholders; (x) rationalizing product lines and gaining increased efficiencies through proposals for fund mergers and share class consolidations; (xi) continuing to develop, acquire and implement systems and technology to improve services to the funds and shareholders, strengthen information security, and increase efficiency; and (xii) implementing enhancements to further strengthen Fidelity's product line to increase investors' probability of success in achieving their investment goals, including retirement income goals.Investment Performance. The Board considered whether the fund has operated in accordance with its investment objective, as well as its record of compliance with its investment restrictions and its performance history.The Board took into account discussions with representatives of SelectCo about fund investment performance that occur at Board meetings throughout the year. In this regard the Board noted that as part of regularly scheduled fund reviews and other reports to the Board on fund performance, the Board considers annualized return information for the fund for different time periods, measured against a securities market index ("benchmark index"). In its evaluation of fund investment performance at meetings throughout the year, the Board gave particular attention to information indicating underperformance of certain Fidelity funds for specific time periods and discussed with the Investment Advisers the reasons for such underperformance.In addition to reviewing absolute and relative fund performance, the Independent Trustees periodically consider the appropriateness of fund performance metrics in evaluating the results achieved. In general, the Independent Trustees believe that fund performance should be evaluated based on net performance (after fees and expenses) of both the highest performing and lowest performing fund share classes, where applicable, compared to appropriate benchmark indices, over appropriate time periods that may include full market cycles, taking into account relevant factors, including the following: general market conditions; issuer-specific information; and fund cash flows and other factors. Depending on the circumstances, the Independent Trustees may be satisfied with a fund's performance notwithstanding that it lags its benchmark index for certain periods.The Independent Trustees recognize that shareholders evaluate performance on a net basis over their own holding periods, for which one-, three-, and five-year periods are often used as a proxy. For this reason, the performance information reviewed by the Board also included net cumulative total return information for the fund and an appropriate benchmark index for the most recent one-, three-, and five-year periods ended June 30, 2017.Based on its review, the Board concluded that the nature, extent, and quality of services provided to the fund under the Advisory Contracts should continue to benefit the shareholders of the fund.Competitiveness of Management Fee and Total Expense Ratio. The Board considered the fund's management fee and total expense ratio compared to "mapped groups" of competitive funds and classes created for the purpose of facilitating the Trustees' analysis of the competitiveness of management fees and total expenses. Fidelity creates "mapped groups" by combining similar Lipper investment objective categories that have comparable investment mandates. For this purpose, all sector focused equity variable annuity funds are grouped in the same mapped group. Combining Lipper investment objective categories aids the Board's management fee and total expense ratio comparisons by broadening the competitive group used for comparison.Management Fee. The Board considered two proprietary management fee comparisons for the 12-month periods ended June 30 shown in basis points (BP) in the chart below. The group of Lipper funds used by the Board for management fee comparisons is referred to below as the "Total Mapped Group." The Total Mapped Group comparison focuses on a fund's standing in terms of gross management fees before expense reimbursements or caps relative to the total universe of funds with comparable investment mandates (i.e., sector equities), regardless of whether their management fee structures also are comparable. Funds with comparable management fee structures have similar management fee contractual arrangements (e.g., flat rate charged for advisory services, all-inclusive fee rate, etc.). "TMG %" represents the percentage of funds in the Total Mapped Group that had management fees that were lower than the fund's. For example, a hypothetical TMG % of 20% would mean that 80% of the funds in the Total Mapped Group had higher, and 20% had lower, management fees than the fund. The fund's actual TMG %s and the number of funds in the Total Mapped Group are in the chart below. The "Asset-Size Peer Group" (ASPG) comparison focuses on a fund's standing relative to a subset of non-Fidelity funds within the Total Mapped Group that are similar in size and management fee structure. For example, if a fund is in the first quartile of the ASPG, the fund's management fee ranks in the least expensive or lowest 25% of funds in the ASPG. The ASPG represents at least 15% of the funds in the Total Mapped Group with comparable asset size and management fee structures, subject to a minimum of 50 funds (or all funds in the Total Mapped Group if fewer than 50). Additional information, such as the ASPG quartile in which the fund's management fee rate ranked, is also included in the chart and considered by the Board.VIP Consumer Staples Portfolio

![]()
VCSP-SANN-0818
1.850997.111
Fidelity® Variable Insurance Products: Energy Portfolio Semi-Annual Report June 30, 2018 |
|
Contents
To view a fund's proxy voting guidelines and proxy voting record for the 12-month period ended June 30, visit http://www.fidelity.com/proxyvotingresults or visit the Securities and Exchange Commission's (SEC) web site at http://www.sec.gov.
You may also call 1-877-208-0098 to request a free copy of the proxy voting guidelines.
Fidelity® Variable Insurance Products are separate account options which are purchased through a variable insurance contract.
Standard & Poor's, S&P and S&P 500 are registered service marks of The McGraw-Hill Companies, Inc. and have been licensed for use by Fidelity Distributors Corporation.
Other third-party marks appearing herein are the property of their respective owners.
All other marks appearing herein are registered or unregistered trademarks or service marks of FMR LLC or an affiliated company. © 2018 FMR LLC. All rights reserved.
This report and the financial statements contained herein are submitted for the general information of the shareholders of the Fund. This report is not authorized for distribution to prospective investors in the Fund unless preceded or accompanied by an effective prospectus.
A fund files its complete schedule of portfolio holdings with the SEC for the first and third quarters of each fiscal year on Form N-Q. Forms N-Q are available on the SEC’s web site at http://www.sec.gov. A fund's Forms N-Q may be reviewed and copied at the SEC’s Public Reference Room in Washington, DC. Information regarding the operation of the SEC's Public Reference Room may be obtained by calling 1-800-SEC-0330.
For a complete list of a fund's portfolio holdings, view the most recent holdings listing, semiannual report, or annual report on Fidelity's web site at http://www.fidelity.com, http://www.institutional.fidelity.com, or http://www.401k.com, as applicable.
NOT FDIC INSURED •MAY LOSE VALUE •NO BANK GUARANTEE
Neither the Fund nor Fidelity Distributors Corporation is a bank.
Investment Summary (Unaudited)
Top Ten Stocks as of June 30, 2018
| % of fund's net assets | |
| Chevron Corp. | 8.4 |
| EOG Resources, Inc. | 7.1 |
| Delek U.S. Holdings, Inc. | 4.6 |
| Valero Energy Corp. | 4.5 |
| Pioneer Natural Resources Co. | 4.4 |
| Anadarko Petroleum Corp. | 4.1 |
| Phillips 66 Co. | 4.0 |
| Exxon Mobil Corp. | 3.5 |
| Diamondback Energy, Inc. | 3.5 |
| Occidental Petroleum Corp. | 3.3 |
| 47.4 |
Top Industries (% of fund's net assets)
| As of June 30, 2018 | ||
| Oil, Gas & Consumable Fuels | 86.1% | |
| Energy Equipment & Services | 10.7% | |
| Chemicals | 1.5% | |
| Machinery | 0.6% | |
| Capital Markets | 0.3% | |
| All Others* | 0.8% | |

* Includes short-term investments and net other assets (liabilities).
Schedule of Investments June 30, 2018 (Unaudited)
Showing Percentage of Net Assets
| Common Stocks - 99.5% | |||
| Shares | Value | ||
| Capital Markets - 0.3% | |||
| Investment Banking & Brokerage - 0.3% | |||
| TPG Pace Energy Holdings Corp. (a) | 77,800 | $845,686 | |
| Chemicals - 1.5% | |||
| Commodity Chemicals - 1.5% | |||
| LG Chemical Ltd. | 1,927 | 576,739 | |
| LyondellBasell Industries NV Class A | 36,700 | 4,031,495 | |
| 4,608,234 | |||
| Energy Equipment & Services - 10.7% | |||
| Oil & Gas Drilling - 1.9% | |||
| Nabors Industries Ltd. | 230,812 | 1,479,505 | |
| Odfjell Drilling Ltd. (a) | 190,750 | 790,464 | |
| Odfjell Drilling Ltd. rights 12/31/99 (a) | 16,079 | 0 | |
| Precision Drilling Corp. (a) | 305,000 | 1,009,204 | |
| Shelf Drilling Ltd. (a)(b) | 224,188 | 1,754,834 | |
| Trinidad Drilling Ltd. (a) | 287,900 | 409,518 | |
| Xtreme Drilling & Coil Services Corp. (a) | 310,000 | 502,263 | |
| 5,945,788 | |||
| Oil & Gas Equipment & Services - 8.8% | |||
| Baker Hughes, a GE Co. Class A | 276,400 | 9,129,492 | |
| C&J Energy Services, Inc. (a) | 15,000 | 354,000 | |
| Dril-Quip, Inc. (a) | 20,344 | 1,045,682 | |
| Halliburton Co. | 190,100 | 8,565,906 | |
| Liberty Oilfield Services, Inc. Class A (a)(c) | 86,500 | 1,619,280 | |
| NCS Multistage Holdings, Inc. (a) | 38,400 | 557,952 | |
| Oceaneering International, Inc. | 36,649 | 933,084 | |
| RigNet, Inc. (a) | 86,200 | 887,860 | |
| Schlumberger Ltd. | 52,109 | 3,492,866 | |
| Smart Sand, Inc. (a)(c) | 35,500 | 188,505 | |
| TechnipFMC PLC | 44,800 | 1,421,952 | |
| 28,196,579 | |||
| TOTAL ENERGY EQUIPMENT & SERVICES | 34,142,367 | ||
| Gas Utilities - 0.3% | |||
| Gas Utilities - 0.3% | |||
| Indraprastha Gas Ltd. | 248,547 | 923,247 | |
| Machinery - 0.6% | |||
| Industrial Machinery - 0.6% | |||
| Cactus, Inc. (a) | 18,600 | 628,494 | |
| Gardner Denver Holdings, Inc. (a) | 24,500 | 720,055 | |
| ProPetro Holding Corp. (a) | 33,500 | 525,280 | |
| 1,873,829 | |||
| Oil, Gas & Consumable Fuels - 86.1% | |||
| Coal & Consumable Fuels - 0.3% | |||
| Peabody Energy Corp. | 19,400 | 882,312 | |
| Integrated Oil & Gas - 17.5% | |||
| Cenovus Energy, Inc. | 600 | 6,230 | |
| Chevron Corp. | 210,231 | 26,579,506 | |
| Exxon Mobil Corp. | 135,848 | 11,238,705 | |
| Occidental Petroleum Corp. | 125,600 | 10,510,208 | |
| Suncor Energy, Inc. | 180,000 | 7,325,144 | |
| 55,659,793 | |||
| Oil & Gas Exploration & Production - 46.9% | |||
| Aker Bp ASA | 8,700 | 321,322 | |
| Anadarko Petroleum Corp. | 177,434 | 12,997,041 | |
| Cabot Oil & Gas Corp. | 278,200 | 6,621,160 | |
| California Resources Corp. (a)(c) | 19,900 | 904,256 | |
| Canadian Natural Resources Ltd. | 9,800 | 353,714 | |
| Centennial Resource Development, Inc.: | |||
| Class A (a) | 14,400 | 260,064 | |
| Class A (a) | 106,100 | 1,916,166 | |
| Cimarex Energy Co. | 28,187 | 2,867,745 | |
| Concho Resources, Inc. (a) | 22,400 | 3,099,040 | |
| ConocoPhillips Co. | 55,000 | 3,829,100 | |
| Continental Resources, Inc. (a) | 141,700 | 9,176,492 | |
| Denbury Resources, Inc. (a) | 78,200 | 376,142 | |
| Devon Energy Corp. | 208,700 | 9,174,452 | |
| Diamondback Energy, Inc. | 83,900 | 11,038,723 | |
| Encana Corp. | 629,500 | 8,221,591 | |
| EOG Resources, Inc. | 182,442 | 22,701,258 | |
| Extraction Oil & Gas, Inc. (a) | 129,601 | 1,903,839 | |
| GeoPark Ltd. (a) | 20,500 | 423,120 | |
| Gran Tierra Energy, Inc. (U.S.) (a)(c) | 299,500 | 1,033,275 | |
| Hess Corp. | 62,100 | 4,153,869 | |
| Noble Energy, Inc. | 128,000 | 4,515,840 | |
| Parex Resources, Inc. (a) | 147,200 | 2,779,070 | |
| Parsley Energy, Inc. Class A (a) | 234,930 | 7,113,680 | |
| PDC Energy, Inc. (a) | 40,334 | 2,438,190 | |
| Pioneer Natural Resources Co. | 73,865 | 13,978,213 | |
| Ring Energy, Inc. (a) | 60,100 | 758,462 | |
| RSP Permian, Inc. (a) | 133,200 | 5,863,464 | |
| Viper Energy Partners LP | 129,200 | 4,122,772 | |
| Whiting Petroleum Corp. (a) | 90,100 | 4,750,072 | |
| WildHorse Resource Development Corp. (a) | 15,100 | 382,936 | |
| WPX Energy, Inc. (a) | 72,900 | 1,314,387 | |
| 149,389,455 | |||
| Oil & Gas Refining & Marketing - 16.7% | |||
| Andeavor | 41,100 | 5,391,498 | |
| Delek U.S. Holdings, Inc. | 289,377 | 14,518,044 | |
| HollyFrontier Corp. | 34,200 | 2,340,306 | |
| Marathon Petroleum Corp. | 43,300 | 3,037,928 | |
| Phillips 66 Co. | 114,162 | 12,821,534 | |
| Reliance Industries Ltd. | 67,358 | 956,796 | |
| Valero Energy Corp. | 129,200 | 14,319,236 | |
| 53,385,342 | |||
| Oil & Gas Storage & Transport - 4.7% | |||
| Cheniere Energy, Inc. (a) | 58,400 | 3,807,096 | |
| Enterprise Products Partners LP | 112,600 | 3,115,642 | |
| Euronav NV (c) | 152,847 | 1,406,192 | |
| GasLog Partners LP | 11,981 | 285,747 | |
| Golar LNG Ltd. (c) | 62,200 | 1,832,412 | |
| Noble Midstream Partners LP | 9,562 | 488,236 | |
| Noble Midstream Partners LP (d) | 14,739 | 752,573 | |
| Plains GP Holdings LP Class A | 57,522 | 1,375,351 | |
| Teekay LNG Partners LP | 13,000 | 219,050 | |
| The Williams Companies, Inc. | 61,600 | 1,669,976 | |
| 14,952,275 | |||
| TOTAL OIL, GAS & CONSUMABLE FUELS | 274,269,177 | ||
| Semiconductors & Semiconductor Equipment - 0.0% | |||
| Semiconductor Equipment - 0.0% | |||
| SolarEdge Technologies, Inc. (a) | 2,800 | 133,980 | |
| TOTAL COMMON STOCKS | |||
| (Cost $245,965,763) | 316,796,520 | ||
| Money Market Funds - 1.3% | |||
| Fidelity Cash Central Fund, 1.93% (e) | 1,468,283 | 1,468,576 | |
| Fidelity Securities Lending Cash Central Fund 1.92% (e)(f) | 2,755,508 | 2,756,059 | |
| TOTAL MONEY MARKET FUNDS | |||
| (Cost $4,224,360) | 4,224,635 | ||
| TOTAL INVESTMENT IN SECURITIES - 100.8% | |||
| (Cost $250,190,123) | 321,021,155 | ||
| NET OTHER ASSETS (LIABILITIES) - (0.8)% | (2,510,707) | ||
| NET ASSETS - 100% | $318,510,448 |
Legend
(a) Non-income producing
(b) Security exempt from registration under Rule 144A of the Securities Act of 1933. These securities may be resold in transactions exempt from registration, normally to qualified institutional buyers. At the end of the period, the value of these securities amounted to $1,754,834 or 0.6% of net assets.
(c) Security or a portion of the security is on loan at period end.
(d) Restricted securities - Investment in securities not registered under the Securities Act of 1933 (excluding 144A issues). At the end of the period, the value of restricted securities (excluding 144A issues) amounted to $752,573 or 0.2% of net assets.
(e) Affiliated fund that is generally available only to investment companies and other accounts managed by Fidelity Investments. The rate quoted is the annualized seven-day yield of the fund at period end. A complete unaudited listing of the fund's holdings as of its most recent quarter end is available upon request. In addition, each Fidelity Central Fund's financial statements are available on the SEC's website or upon request.
(f) Investment made with cash collateral received from securities on loan.
Additional information on each restricted holding is as follows:
| Security | Acquisition Date | Acquisition Cost |
| Noble Midstream Partners LP | 6/21/17 | $596,193 |
Affiliated Central Funds
Information regarding fiscal year to date income earned by the Fund from investments in Fidelity Central Funds is as follows:
| Fund | Income earned |
| Fidelity Cash Central Fund | $22,757 |
| Fidelity Securities Lending Cash Central Fund | 6,268 |
| Total | $29,025 |
Amounts in the income column in the above table include any capital gain distributions from underlying funds, which are presented in the corresponding line-item in the Statement of Operations if applicable.
Investment Valuation
All investments are categorized as Level 1 under the Fair Value Hierarchy. The inputs or methodology used for valuing securities may not be an indication of the risk associated with investing in those securities. For more information on valuation inputs please refer to the Investment Valuation section in the accompanying Notes to Financial Statements.
Other Information
Distribution of investments by country or territory of incorporation, as a percentage of Total Net Assets, is as follows (Unaudited):
| United States of America | 87.2% |
| Canada | 6.5% |
| Bermuda | 1.4% |
| Netherlands | 1.3% |
| Curacao | 1.1% |
| Others (Individually Less Than 1%) | 2.5% |
| 100.0% |
See accompanying notes which are an integral part of the financial statements.
Financial Statements
Statement of Assets and Liabilities
| June 30, 2018 (Unaudited) | ||
| Assets | ||
| Investment in securities, at value (including securities loaned of $2,649,911) — See accompanying schedule: Unaffiliated issuers (cost $245,965,763) | $316,796,520 | |
| Fidelity Central Funds (cost $4,224,360) | 4,224,635 | |
| Total Investment in Securities (cost $250,190,123) | $321,021,155 | |
| Foreign currency held at value (cost $8,138) | 8,138 | |
| Receivable for investments sold | 529,542 | |
| Receivable for fund shares sold | 29,056 | |
| Dividends receivable | 150,999 | |
| Distributions receivable from Fidelity Central Funds | 5,049 | |
| Prepaid expenses | 2,219 | |
| Other receivables | 18,744 | |
| Total assets | 321,764,902 | |
| Liabilities | ||
| Payable for fund shares redeemed | $156,730 | |
| Accrued management fee | 143,621 | |
| Distribution and service plan fees payable | 28,623 | |
| Other affiliated payables | 36,737 | |
| Other payables and accrued expenses | 134,718 | |
| Collateral on securities loaned | 2,754,025 | |
| Total liabilities | 3,254,454 | |
| Net Assets | $318,510,448 | |
| Net Assets consist of: | ||
| Paid in capital | $305,480,786 | |
| Undistributed net investment income | 685,883 | |
| Accumulated undistributed net realized gain (loss) on investments and foreign currency transactions | (58,379,461) | |
| Net unrealized appreciation (depreciation) on investments and assets and liabilities in foreign currencies | 70,723,240 | |
| Net Assets | $318,510,448 | |
| Initial Class: | ||
| Net Asset Value, offering price and redemption price per share ($44,970,707 ÷ 2,116,676 shares) | $21.25 | |
| Service Class 2: | ||
| Net Asset Value, offering price and redemption price per share ($137,768,689 ÷ 6,524,027 shares) | $21.12 | |
| Investor Class: | ||
| Net Asset Value, offering price and redemption price per share ($135,771,052 ÷ 6,405,391 shares) | $21.20 |
See accompanying notes which are an integral part of the financial statements.
Statement of Operations
| Six months ended June 30, 2018 (Unaudited) | ||
| Investment Income | ||
| Dividends | $2,310,938 | |
| Income from Fidelity Central Funds | 29,025 | |
| Total income | 2,339,963 | |
| Expenses | ||
| Management fee | $806,821 | |
| Transfer agent fees | 145,729 | |
| Distribution and service plan fees | 163,564 | |
| Accounting and security lending fees | 58,407 | |
| Custodian fees and expenses | 11,203 | |
| Independent trustees' fees and expenses | 1,383 | |
| Audit | 20,246 | |
| Legal | 1,997 | |
| Miscellaneous | 14,415 | |
| Total expenses before reductions | 1,223,765 | |
| Expense reductions | (17,827) | |
| Total expenses after reductions | 1,205,938 | |
| Net investment income (loss) | 1,134,025 | |
| Realized and Unrealized Gain (Loss) | ||
| Net realized gain (loss) on: | ||
| Investment securities: | ||
| Unaffiliated issuers | 2,537,306 | |
| Fidelity Central Funds | 104 | |
| Foreign currency transactions | (10,646) | |
| Total net realized gain (loss) | 2,526,764 | |
| Change in net unrealized appreciation (depreciation) on: | ||
| Investment securities: | ||
| Unaffiliated issuers (net of increase in deferred foreign taxes of $12,393) | 16,333,929 | |
| Fidelity Central Funds | (163) | |
| Assets and liabilities in foreign currencies | (4,285) | |
| Total change in net unrealized appreciation (depreciation) | 16,329,481 | |
| Net gain (loss) | 18,856,245 | |
| Net increase (decrease) in net assets resulting from operations | $19,990,270 |
See accompanying notes which are an integral part of the financial statements.
Statement of Changes in Net Assets
| Six months ended June 30, 2018 (Unaudited) | Year ended December 31, 2017 | |
| Increase (Decrease) in Net Assets | ||
| Operations | ||
| Net investment income (loss) | $1,134,025 | $4,729,088 |
| Net realized gain (loss) | 2,526,764 | 877,192 |
| Change in net unrealized appreciation (depreciation) | 16,329,481 | (21,648,499) |
| Net increase (decrease) in net assets resulting from operations | 19,990,270 | (16,042,219) |
| Distributions to shareholders from net investment income | (623,382) | (4,314,006) |
| Distributions to shareholders from net realized gain | – | (148,102) |
| Total distributions | (623,382) | (4,462,108) |
| Share transactions - net increase (decrease) | 6,218,052 | (63,570,468) |
| Redemption fees | – | 66,399 |
| Total increase (decrease) in net assets | 25,584,940 | (84,008,396) |
| Net Assets | ||
| Beginning of period | 292,925,508 | 376,933,904 |
| End of period | $318,510,448 | $292,925,508 |
| Other Information | ||
| Undistributed net investment income end of period | $685,883 | $175,240 |
See accompanying notes which are an integral part of the financial statements.
Financial Highlights
VIP Energy Portfolio Initial Class
| Six months ended (Unaudited) June 30, | Years endedDecember 31, | |||||
| 2018 | 2017 | 2016 | 2015 | 2014 | 2013 | |
| Selected Per–Share Data | ||||||
| Net asset value, beginning of period | $19.86 | $20.72 | $15.57 | $20.45 | $23.95 | $19.53 |
| Income from Investment Operations | ||||||
| Net investment income (loss)A | .09 | .32B | .13 | .24 | .22 | .20 |
| Net realized and unrealized gain (loss) | 1.35 | (.85) | 5.14 | (4.30) | (3.23) | 4.58 |
| Total from investment operations | 1.44 | (.53) | 5.27 | (4.06) | (3.01) | 4.78 |
| Distributions from net investment income | (.05) | (.32) | (.12) | (.23) | (.23) | (.22) |
| Distributions from net realized gain | – | (.01) | – | (.60) | (.28) | (.14) |
| Total distributions | (.05) | (.33) | (.12) | (.83) | (.50)C | (.36) |
| Redemption fees added to paid in capitalA | – | –D | –D | .01 | .01 | –D |
| Net asset value, end of period | $21.25 | $19.86 | $20.72 | $15.57 | $20.45 | $23.95 |
| Total ReturnE,F,G | 7.27% | (2.47)% | 33.84% | (20.54)% | (12.59)% | 24.55% |
| Ratios to Average Net AssetsH,I | ||||||
| Expenses before reductions | .68%J | .69% | .68% | .68% | .68% | .70% |
| Expenses net of fee waivers, if any | .67%J | .68% | .68% | .68% | .67% | .69% |
| Expenses net of all reductions | .66%J | .67% | .67% | .67% | .67% | .69% |
| Net investment income (loss) | .90%J | 1.73%B | .71% | 1.25% | .91% | .88% |
| Supplemental Data | ||||||
| Net assets, end of period (000 omitted) | $44,971 | $43,633 | $63,955 | $46,360 | $70,828 | $94,202 |
| Portfolio turnover rateK | 70%J | 66% | 87% | 70% | 99% | 90% |
A Calculated based on average shares outstanding during the period.
B Net investment income per share reflects a large, non-recurring dividend which amounted to $.21 per share. Excluding this non-recurring dividend, the ratio of net investment income (loss) to average net assets would have been .62%.
C Total distributions of $.50 per share is comprised of distributions from net investment income of $.227 and distributions from net realized gain of $.273 per share.
D Amount represents less than $.005 per share.
E Total returns for periods of less than one year are not annualized.
F Total returns do not reflect charges attributable to your insurance company's separate account. Inclusion of these charges would reduce the total returns shown.
G Total returns would have been lower if certain expenses had not been reduced during the applicable periods shown.
H Fees and expenses of any underlying Fidelity Central Funds are not included in the Fund's expense ratio. The Fund indirectly bears its proportionate share of the expenses of any underlying Fidelity Central Funds.
I Expense ratios reflect operating expenses of the class. Expenses before reductions do not reflect amounts reimbursed by the investment adviser or reductions from brokerage service arrangements or reductions from other expense offset arrangements and do not represent the amount paid by the class during periods when reimbursements or reductions occur. Expenses net of fee waivers reflect expenses after reimbursement by the investment adviser but prior to reductions from brokerage service arrangements or other expense offset arrangements. Expenses net of all reductions represent the net expenses paid by the class.
J Annualized
K Amount does not include the portfolio activity of any underlying Fidelity Central Funds.
See accompanying notes which are an integral part of the financial statements.
VIP Energy Portfolio Service Class 2
| Six months ended (Unaudited) June 30, | Years endedDecember 31, | |||||
| 2018 | 2017 | 2016 | 2015 | 2014 | 2013 | |
| Selected Per–Share Data | ||||||
| Net asset value, beginning of period | $19.75 | $20.62 | $15.51 | $20.37 | $23.83 | $19.44 |
| Income from Investment Operations | ||||||
| Net investment income (loss)A | .07 | .27B | .08 | .19 | .16 | .14 |
| Net realized and unrealized gain (loss) | 1.34 | (.86) | 5.12 | (4.28) | (3.19) | 4.55 |
| Total from investment operations | 1.41 | (.59) | 5.20 | (4.09) | (3.03) | 4.69 |
| Distributions from net investment income | (.04) | (.27) | (.09) | (.18) | (.16) | (.16) |
| Distributions from net realized gain | – | (.01) | – | (.60) | (.28) | (.14) |
| Total distributions | (.04) | (.28) | (.09) | (.78) | (.44) | (.30) |
| Redemption fees added to paid in capitalA | – | –C | –C | .01 | .01 | –C |
| Net asset value, end of period | $21.12 | $19.75 | $20.62 | $15.51 | $20.37 | $23.83 |
| Total ReturnD,E,F | 7.17% | (2.78)% | 33.51% | (20.75)% | (12.76)% | 24.21% |
| Ratios to Average Net AssetsG,H | ||||||
| Expenses before reductions | .93%I | .94% | .93% | .93% | .93% | .94% |
| Expenses net of fee waivers, if any | .92%I | .93% | .93% | .93% | .92% | .94% |
| Expenses net of all reductions | .91%I | .93% | .92% | .92% | .92% | .94% |
| Net investment income (loss) | .65%I | 1.48%B | .47% | 1.00% | .66% | .64% |
| Supplemental Data | ||||||
| Net assets, end of period (000 omitted) | $137,769 | $128,346 | $150,744 | $97,286 | $116,228 | $130,100 |
| Portfolio turnover rateJ | 70%I | 66% | 87% | 70% | 99% | 90% |
A Calculated based on average shares outstanding during the period.
B Net investment income per share reflects a large, non-recurring dividend which amounted to $.20 per share. Excluding this non-recurring dividend, the ratio of net investment income (loss) to average net assets would have been .37%.
C Amount represents less than $.005 per share.
D Total returns for periods of less than one year are not annualized.
E Total returns do not reflect charges attributable to your insurance company's separate account. Inclusion of these charges would reduce the total returns shown.
F Total returns would have been lower if certain expenses had not been reduced during the applicable periods shown.
G Fees and expenses of any underlying Fidelity Central Funds are not included in the Fund's expense ratio. The Fund indirectly bears its proportionate share of the expenses of any underlying Fidelity Central Funds.
H Expense ratios reflect operating expenses of the class. Expenses before reductions do not reflect amounts reimbursed by the investment adviser or reductions from brokerage service arrangements or reductions from other expense offset arrangements and do not represent the amount paid by the class during periods when reimbursements or reductions occur. Expenses net of fee waivers reflect expenses after reimbursement by the investment adviser but prior to reductions from brokerage service arrangements or other expense offset arrangements. Expenses net of all reductions represent the net expenses paid by the class.
I Annualized
J Amount does not include the portfolio activity of any underlying Fidelity Central Funds.
See accompanying notes which are an integral part of the financial statements.
VIP Energy Portfolio Investor Class
| Six months ended (Unaudited) June 30, | Years endedDecember 31, | |||||
| 2018 | 2017 | 2016 | 2015 | 2014 | 2013 | |
| Selected Per–Share Data | ||||||
| Net asset value, beginning of period | $19.82 | $20.68 | $15.55 | $20.42 | $23.90 | $19.49 |
| Income from Investment Operations | ||||||
| Net investment income (loss)A | .08 | .30B | .11 | .22 | .20 | .18 |
| Net realized and unrealized gain (loss) | 1.34 | (.85) | 5.13 | (4.29) | (3.21) | 4.57 |
| Total from investment operations | 1.42 | (.55) | 5.24 | (4.07) | (3.01) | 4.75 |
| Distributions from net investment income | (.04) | (.30) | (.11) | (.22) | (.20) | (.20) |
| Distributions from net realized gain | – | (.01) | – | (.60) | (.28) | (.14) |
| Total distributions | (.04) | (.31) | (.11) | (.81)C | (.48) | (.34) |
| Redemption fees added to paid in capitalA | – | –D | –D | .01 | .01 | –D |
| Net asset value, end of period | $21.20 | $19.82 | $20.68 | $15.55 | $20.42 | $23.90 |
| Total ReturnE,F,G | 7.23% | (2.57)% | 33.70% | (20.58)% | (12.65)% | 24.45% |
| Ratios to Average Net AssetsH,I | ||||||
| Expenses before reductions | .75%J | .77% | .76% | .76% | .76% | .78% |
| Expenses net of fee waivers, if any | .75%J | .77% | .76% | .76% | .75% | .77% |
| Expenses net of all reductions | .74%J | .76% | .75% | .75% | .75% | .77% |
| Net investment income (loss) | .82%J | 1.65%B | .63% | 1.17% | .83% | .80% |
| Supplemental Data | ||||||
| Net assets, end of period (000 omitted) | $135,771 | $120,946 | $162,235 | $98,909 | $101,214 | $108,077 |
| Portfolio turnover rateK | 70%J | 66% | 87% | 70% | 99% | 90% |
A Calculated based on average shares outstanding during the period.
B Net investment income per share reflects a large, non-recurring dividend which amounted to $.20 per share. Excluding this non-recurring dividend, the ratio of net investment income (loss) to average net assets would have been .54%.
C Total distributions of $.81 per share is comprised of distributions from net investment income of $.215 and distributions from net realized gain of $.599 per share.
D Amount represents less than $.005 per share.
E Total returns for periods of less than one year are not annualized.
F Total returns do not reflect charges attributable to your insurance company's separate account. Inclusion of these charges would reduce the total returns shown.
G Total returns would have been lower if certain expenses had not been reduced during the applicable periods shown.
H Fees and expenses of any underlying Fidelity Central Funds are not included in the Fund's expense ratio. The Fund indirectly bears its proportionate share of the expenses of any underlying Fidelity Central Funds.
I Expense ratios reflect operating expenses of the class. Expenses before reductions do not reflect amounts reimbursed by the investment adviser or reductions from brokerage service arrangements or reductions from other expense offset arrangements and do not represent the amount paid by the class during periods when reimbursements or reductions occur. Expenses net of fee waivers reflect expenses after reimbursement by the investment adviser but prior to reductions from brokerage service arrangements or other expense offset arrangements. Expenses net of all reductions represent the net expenses paid by the class.
J Annualized
K Amount does not include the portfolio activity of any underlying Fidelity Central Funds.
See accompanying notes which are an integral part of the financial statements.
Notes to Financial Statements (Unaudited)
For the period ended June 30, 2018
1. Organization.
VIP Energy Portfolio (the Fund) is a non-diversified fund of Variable Insurance Products Fund IV (the Trust) and is authorized to issue an unlimited number of shares. The Trust is registered under the Investment Company Act of 1940, as amended (the 1940 Act), as an open-end management investment company organized as a Massachusetts business trust. Shares of the Fund may only be purchased by insurance companies for the purpose of funding variable annuity or variable life insurance contracts. The Fund offers the following classes of shares: Initial Class shares, Service Class 2 shares and Investor Class shares. All classes have equal rights and voting privileges, except for matters affecting a single class.
2. Investments in Fidelity Central Funds.
The Fund invests in Fidelity Central Funds, which are open-end investment companies generally available only to other investment companies and accounts managed by the investment adviser and its affiliates. The Fund's Schedule of Investments lists each of the Fidelity Central Funds held as of period end, if any, as an investment of the Fund, but does not include the underlying holdings of each Fidelity Central Fund. As an Investing Fund, the Fund indirectly bears its proportionate share of the expenses of the underlying Fidelity Central Funds.
The Money Market Central Funds seek preservation of capital and current income and are managed by Fidelity Investments Money Management, Inc. (FIMM), an affiliate of the investment adviser. Annualized expenses of the Money Market Central Funds as of their most recent shareholder report date are less than .005%.
A complete unaudited list of holdings for each Fidelity Central Fund is available upon request or at the Securities and Exchange Commission (the SEC) website at www.sec.gov. In addition, the financial statements of the Fidelity Central Funds are available on the SEC website or upon request.
3. Significant Accounting Policies.
The Fund is an investment company and applies the accounting and reporting guidance of the Financial Accounting Standards Board (FASB) Accounting Standards Codification Topic 946 Financial Services – Investments Companies. The financial statements have been prepared in conformity with accounting principles generally accepted in the United States of America (GAAP), which require management to make certain estimates and assumptions at the date of the financial statements. Actual results could differ from those estimates. Subsequent events, if any, through the date that the financial statements were issued have been evaluated in the preparation of the financial statements. The following summarizes the significant accounting policies of the Fund:
Investment Valuation. Investments are valued as of 4:00 p.m. Eastern time on the last calendar day of the period. The Board of Trustees (the Board) has delegated the day to day responsibility for the valuation of the Fund's investments to the Fair Value Committee (the Committee) established by the Fund's investment adviser. In accordance with valuation policies and procedures approved by the Board, the Fund attempts to obtain prices from one or more third party pricing vendors or brokers to value its investments. When current market prices, quotations or currency exchange rates are not readily available or reliable, investments will be fair valued in good faith by the Committee, in accordance with procedures adopted by the Board. Factors used in determining fair value vary by investment type and may include market or investment specific events. The frequency with which these procedures are used cannot be predicted and they may be utilized to a significant extent. The Committee oversees the Fund's valuation policies and procedures and reports to the Board on the Committee's activities and fair value determinations. The Board monitors the appropriateness of the procedures used in valuing the Fund's investments and ratifies the fair value determinations of the Committee.
The Fund categorizes the inputs to valuation techniques used to value its investments into a disclosure hierarchy consisting of three levels as shown below:
- Level 1 – quoted prices in active markets for identical investments
- Level 2 – other significant observable inputs (including quoted prices for similar investments, interest rates, prepayment speeds, etc.)
- Level 3 – unobservable inputs (including the Fund's own assumptions based on the best information available)
Valuation techniques used to value the Fund's investments by major category are as follows:
Equity securities, including restricted securities, for which market quotations are readily available, are valued at the last reported sale price or official closing price as reported by a third party pricing vendor on the primary market or exchange on which they are traded and are categorized as Level 1 in the hierarchy. In the event there were no sales during the day or closing prices are not available, securities are valued at the last quoted bid price or may be valued using the last available price and are generally categorized as Level 2 in the hierarchy. For foreign equity securities, when market or security specific events arise, comparisons to the valuation of American Depositary Receipts (ADRs), futures contracts, Exchange-Traded Funds (ETFs) and certain indexes as well as quoted prices for similar securities may be used and would be categorized as Level 2 in the hierarchy. Utilizing these techniques may result in transfers between Level 1 and Level 2. For equity securities, including restricted securities, where observable inputs are limited, assumptions about market activity and risk are used and these securities may be categorized as Level 3 in the hierarchy.
Investments in open-end mutual funds, including the Fidelity Central Funds, are valued at their closing net asset value (NAV) each business day and are categorized as Level 1 in the hierarchy.
Changes in valuation techniques may result in transfers in or out of an assigned level within the disclosure hierarchy.
Foreign Currency. The Fund may use foreign currency contracts to facilitate transactions in foreign-denominated securities. Gains and losses from these transactions may arise from changes in the value of the foreign currency or if the counterparties do not perform under the contracts' terms.
Foreign-denominated assets, including investment securities, and liabilities are translated into U.S. dollars at the exchange rates at period end. Purchases and sales of investment securities, income and dividends received and expenses denominated in foreign currencies are translated into U.S. dollars at the exchange rate in effect on the transaction date.
The effects of exchange rate fluctuations on investments are included with the net realized and unrealized gain (loss) on investment securities. Other foreign currency transactions resulting in realized and unrealized gain (loss) are disclosed separately.
Investment Transactions and Income. For financial reporting purposes, the Fund's investment holdings and NAV include trades executed through the end of the last business day of the period. The NAV per share for processing shareholder transactions is calculated as of the close of business of the New York Stock Exchange (NYSE), normally 4:00 p.m. Eastern time and includes trades executed through the end of the prior business day. Gains and losses on securities sold are determined on the basis of identified cost and include proceeds received from litigation. Dividend income is recorded on the ex-dividend date, except for certain dividends from foreign securities where the ex-dividend date may have passed, which are recorded as soon as the Fund is informed of the ex-dividend date. Non-cash dividends included in dividend income, if any, are recorded at the fair market value of the securities received. Income and capital gain distributions from Fidelity Central Funds, if any, are recorded on the ex-dividend date. Certain distributions received by the Fund represent a return of capital or capital gain. The Fund determines the components of these distributions subsequent to the ex-dividend date, based upon receipt of tax filings or other correspondence relating to the underlying investment. These distributions are recorded as a reduction of cost of investments and/or as a realized gain. Investment income is recorded net of foreign taxes withheld where recovery of such taxes is uncertain.
Class Allocations and Expenses. Investment income, realized and unrealized capital gains and losses, common expenses of the Fund, and certain fund-level expense reductions, if any, are allocated daily on a pro-rata basis to each class based on the relative net assets of each class to the total net assets of the Fund. Each class differs with respect to transfer agent and distribution and service plan fees incurred. Certain expense reductions may also differ by class. For the reporting period, the allocated portion of income and expenses to each class as a percent of its average net assets may vary due to the timing of recording these transactions in relation to fluctuating net assets of the classes. Expenses directly attributable to a fund are charged to that fund. Expenses attributable to more than one fund are allocated among the respective funds on the basis of relative net assets or other appropriate methods. Expense estimates are accrued in the period to which they relate and adjustments are made when actual amounts are known.
Income Tax Information and Distributions to Shareholders. Each year, the Fund intends to qualify as a regulated investment company under Subchapter M of the Internal Revenue Code, including distributing substantially all of its taxable income and realized gains. As a result, no provision for U.S. Federal income taxes is required. The Fund files a U.S. federal tax return, in addition to state and local tax returns as required. The Fund's federal income tax returns are subject to examination by the Internal Revenue Service (IRS) for a period of three fiscal years after they are filed. State and local tax returns may be subject to examination for an additional fiscal year depending on the jurisdiction. Foreign taxes are provided for based on the Fund's understanding of the tax rules and rates that exist in the foreign markets in which it invests. The Fund is subject to a tax imposed on capital gains by certain countries in which it invests. An estimated deferred tax liability for net unrealized appreciation on the applicable securities is included in Other payables and accrued expenses on the Statement of Assets & Liabilities.
Distributions are declared and recorded on the ex-dividend date. Income and capital gain distributions are declared separately for each class. Income and capital gain distributions are determined in accordance with income tax regulations, which may differ from GAAP.
Capital accounts within the financial statements are adjusted for permanent book-tax differences. These adjustments have no impact on net assets or the results of operations. Capital accounts are not adjusted for temporary book-tax differences which will reverse in a subsequent period.
Book-tax differences are primarily due to foreign currency transactions, certain foreign taxes, passive foreign investment companies (PFIC), partnerships, capital loss carryforwards and losses deferred due to wash sales.
As of period end, the cost and unrealized appreciation (depreciation) in securities, and derivatives if applicable, for federal income tax purposes were as follows:
| Gross unrealized appreciation | $77,936,470 |
| Gross unrealized depreciation | (7,780,478) |
| Net unrealized appreciation (depreciation) | $70,155,992 |
| Tax cost | $250,865,163 |
Capital loss carryforwards are only available to offset future capital gains of the Fund to the extent provided by regulations and may be limited. Under the Regulated Investment Company Modernization Act of 2010 (the Act), the Fund is permitted to carry forward capital losses incurred in taxable years beginning after December 22, 2010 for an unlimited period and such capital losses are required to be used prior to any losses that expire. The capital loss carryforward information presented below, including any applicable limitation, is estimated as of prior fiscal period end and is subject to adjustment.
| No expiration | |
| Short-term | $(39,230,248) |
| Long-term | (20,478,314) |
| Total capital loss carryforward | $(59,708,562) |
Restricted Securities. The Fund may invest in securities that are subject to legal or contractual restrictions on resale. These securities generally may be resold in transactions exempt from registration or to the public if the securities are registered. Disposal of these securities may involve time-consuming negotiations and expense, and prompt sale at an acceptable price may be difficult. Information regarding restricted securities is included at the end of the Fund's Schedule of Investments.
4. Purchases and Sales of Investments.
Purchases and sales of securities, other than short-term securities, aggregated $112,212,943 and $104,253,554, respectively.
5. Fees and Other Transactions with Affiliates.
Management Fee. Fidelity SelectCo, LLC (the investment adviser) and its affiliates provide the Fund with investment management related services for which the Fund pays a monthly management fee. The management fee is the sum of an individual fund fee rate that is based on an annual rate of .30% of the Fund's average net assets and an annualized group fee rate that averaged .24% during the period. The group fee rate is based upon the average net assets of all the mutual funds advised by Fidelity Management & Research Company (FMR) and the investment adviser. The group fee rate decreases as assets under management increase and increases as assets under management decrease. For the reporting period, the total annualized management fee rate was .54% of the Fund's average net assets.
Distribution and Service Plan Fees. In accordance with Rule 12b-1 of the 1940 Act, the Fund has adopted a separate 12b-1 Plan for Service Class 2 shares. Service Class 2 pays Fidelity Distributors Corporation (FDC), an affiliate of the investment adviser, a service fee. For the period, the service fee is based on an annual rate of .25% of Service Class 2's average net assets.
For the period, total fees for Service Class 2, all of which was re-allowed to insurance companies for the distribution of shares and providing shareholder support services were $163,564.
Transfer Agent Fees. Fidelity Investments Institutional Operations Company, Inc. (FIIOC), an affiliate of the investment adviser, is the Fund's transfer, dividend disbursing, and shareholder servicing agent. FIIOC receives an asset-based fee with respect to each class. Each class pays a fee for transfer agent services, typesetting and printing and mailing of shareholder reports, excluding mailing of proxy statements, equal to an annual rate of class-level average net assets. The annual rate for Investor Class is .15% and the annual rate for all other classes is .07%. For the period, transfer agent fees for each class were as follows:
| Initial Class | $13,696 |
| Service Class 2 | 42,126 |
| Investor Class | 89,907 |
| $145,729 |
Accounting and Security Lending Fees. Fidelity Service Company, Inc. (FSC), an affiliate of the investment adviser, maintains the Fund's accounting records. The accounting fee is based on the level of average net assets for each month. Under a separate contract, FSC administers the security lending program. The security lending fee is based on the number and duration of lending transactions. For the period, the fees were equivalent to an annualized rate of .04%.
Brokerage Commissions. The Fund placed a portion of its portfolio transactions with brokerage firms which are affiliates of the investment adviser. Brokerage commissions are included in net realized gain (loss) and change in net unrealized appreciation (depreciation) in the Statement of Operations. The commissions paid to these affiliated firms were $2,937 for the period.
Interfund Trades. The Fund may purchase from or sell securities to other Fidelity Funds under procedures adopted by the Board. The procedures have been designed to ensure these interfund trades are executed in accordance with Rule 17a-7 of the 1940 Act. Interfund trades are included within the respective purchases and sales amounts shown in the Purchases and Sales of Investments note.
6. Committed Line of Credit.
The Fund participates with other funds managed by the investment adviser or an affiliate in a $4.25 billion credit facility (the "line of credit") to be utilized for temporary or emergency purposes to fund shareholder redemptions or for other short-term liquidity purposes. The Fund has agreed to pay commitment fees on its pro-rata portion of the line of credit, which amounted to $402 and is reflected in Miscellaneous expenses on the Statement of Operations. During the period, the Fund did not borrow on this line of credit.
7. Security Lending.
The Fund lends portfolio securities through a lending agent from time to time in order to earn additional income. On the settlement date of the loan, the Fund receives collateral (in the form of U.S. Treasury obligations, letters of credit and/or cash) against the loaned securities and maintains collateral in an amount not less than 100% of the market value of the loaned securities during the period of the loan. The market value of the loaned securities is determined at the close of business of the Fund and any additional required collateral is delivered to the Fund on the next business day. The Fund or borrower may terminate the loan at any time, and if the borrower defaults on its obligation to return the securities loaned because of insolvency or other reasons, the Fund may apply collateral received from the borrower against the obligation. The Fund may experience delays and costs in recovering the securities loaned. Any cash collateral received is invested in the Fidelity Securities Lending Cash Central Fund. The value of loaned securities and cash collateral at period end are disclosed on the Fund's Statement of Assets and Liabilities. Security lending income represents the income earned on investing cash collateral, less rebates paid to borrowers and any lending agent fees associated with the loan, plus any premium payments received for lending certain types of securities. Security lending income is presented in the Statement of Operations as a component of income from Fidelity Central Funds. Total security lending income during the period amounted to $6,268.
8. Expense Reductions.
Commissions paid to certain brokers with whom the investment adviser, or its affiliates, places trades on behalf of the Fund include an amount in addition to trade execution, which may be rebated back to the Fund to offset certain expenses. This amount totaled $16,568 for the period. In addition, during the period the investment adviser reimbursed and/or waived a portion of fund-level operating expenses in the amount of $1,259.
9. Distributions to Shareholders.
Distributions to shareholders of each class were as follows:
| Six months ended June 30, 2018 | Year ended December 31, 2017 | |
| From net investment income | ||
| Initial Class | $97,771 | $704,300 |
| Service Class 2 | 255,213 | 1,745,376 |
| Investor Class | 270,398 | 1,864,330 |
| Total | $623,382 | $4,314,006 |
| From net realized gain | ||
| Initial Class | $– | $21,984 |
| Service Class 2 | – | 64,405 |
| Investor Class | – | 61,713 |
| Total | $– | $148,102 |
10. Share Transactions.
Transactions for each class of shares were as follows:
| Shares | Shares | Dollars | Dollars | |
| Six months ended June 30, 2018 | Year ended December 31, 2017 | Six months ended June 30, 2018 | Year ended December 31, 2017 | |
| Initial Class | ||||
| Shares sold | 235,008 | 152,915 | $4,982,958 | $2,910,797 |
| Reinvestment of distributions | 5,471 | 38,684 | 97,771 | 726,283 |
| Shares redeemed | (321,247) | (1,080,413) | (6,387,227) | (20,415,649) |
| Net increase (decrease) | (80,768) | (888,814) | $(1,306,498) | $(16,778,569) |
| Service Class 2 | ||||
| Shares sold | 601,447 | 752,096 | $12,052,947 | $14,010,538 |
| Reinvestment of distributions | 14,354 | 97,091 | 255,213 | 1,809,781 |
| Shares redeemed | (589,294) | (1,663,105) | (11,654,428) | (30,744,171) |
| Net increase (decrease) | 26,507 | (813,918) | $653,732 | $(14,923,852) |
| Investor Class | ||||
| Shares sold | 1,094,800 | 912,948 | $22,619,439 | $17,075,657 |
| Reinvestment of distributions | 15,165 | 102,856 | 270,398 | 1,926,043 |
| Shares redeemed | (808,167) | (2,757,527) | (16,019,019) | (50,869,747) |
| Net increase (decrease) | 301,798 | (1,741,723) | $6,870,818 | $(31,868,047) |
11. Other.
The Fund's organizational documents provide former and current trustees and officers with a limited indemnification against liabilities arising in connection with the performance of their duties to the Fund. In the normal course of business, the Fund may also enter into contracts that provide general indemnifications. The Fund's maximum exposure under these arrangements is unknown as this would be dependent on future claims that may be made against the Fund. The risk of material loss from such claims is considered remote.
At the end of the period, the investment adviser or its affiliates were the owners of record of 56% of the total outstanding shares of the Fund and one otherwise unaffiliated shareholder was the owner of record of 38% of the total outstanding shares of the Fund.
Shareholder Expense Example
As a shareholder of the Fund, you incur two types of costs: (1) transaction costs and (2) ongoing costs, including management fees, distribution and/or service (12b-1) fees and other Fund expenses. This Example is intended to help you understand your ongoing costs (in dollars) of investing in the Fund and to compare these costs with the ongoing costs of investing in other mutual funds.
The Example is based on an investment of $1,000 invested at the beginning of the period and held for the entire period (January 1, 2018 to June 30, 2018).
Actual Expenses
The first line of the accompanying table for each class of the Fund provides information about actual account values and actual expenses. You may use the information in this line, together with the amount you invested, to estimate the expenses that you paid over the period. Simply divide your account value by $1,000.00 (for example, an $8,600 account value divided by $1,000.00 = 8.6), then multiply the result by the number in the first line for a class of the Fund under the heading entitled "Expenses Paid During Period" to estimate the expenses you paid on your account during this period. The estimate of expenses does not include any fees or other expenses of any variable annuity or variable life insurance product. If they were, the estimate of expenses you paid during the period would be higher, and your ending account value would be lower. In addition, the Fund, as a shareholder in the underlying Fidelity Central Funds, will indirectly bear its pro-rata share of the fees and expenses incurred by the underlying Fidelity Central Funds. These fees and expenses are not included in the Fund's annualized expense ratio used to calculate the expense estimate in the table below.
Hypothetical Example for Comparison Purposes
The second line of the accompanying table for each class of the Fund provides information about hypothetical account values and hypothetical expenses based on a Class' actual expense ratio and an assumed rate of return of 5% per year before expenses, which is not the Class' actual return. The hypothetical account values and expenses may not be used to estimate the actual ending account balance or expenses you paid for the period. You may use this information to compare the ongoing costs of investing in the Fund and other funds. To do so, compare this 5% hypothetical example with the 5% hypothetical examples that appear in the shareholder reports of the other funds. The estimate of expenses does not include any fees or other expenses of any variable annuity or variable life insurance product. If they were, the estimate of expenses you paid during the period would be higher, and your ending account value would be lower. In addition, the Fund, as a shareholder in the underlying Fidelity Central Funds, will indirectly bear its pro-rata share of the fees and expenses incurred by the underlying Fidelity Central Funds. These fees and expenses are not included in the Fund's annualized expense ratio used to calculate the expense estimate in the table below.
Please note that the expenses shown in the table are meant to highlight your ongoing costs only and do not reflect any transaction costs. Therefore, the second line of the table is useful in comparing ongoing costs only, and will not help you determine the relative total costs of owning different funds.
| Annualized Expense Ratio-A | Beginning Account Value January 1, 2018 | Ending Account Value June 30, 2018 | Expenses Paid During Period-B January 1, 2018 to June 30, 2018 | |
| Initial Class | .67% | |||
| Actual | $1,000.00 | $1,072.70 | $3.44 | |
| Hypothetical-C | $1,000.00 | $1,021.47 | $3.36 | |
| Service Class 2 | .92% | |||
| Actual | $1,000.00 | $1,071.70 | $4.73 | |
| Hypothetical-C | $1,000.00 | $1,020.23 | $4.61 | |
| Investor Class | .75% | |||
| Actual | $1,000.00 | $1,072.30 | $3.85 | |
| Hypothetical-C | $1,000.00 | $1,021.08 | $3.76 |
A Annualized expense ratio reflects expenses net of applicable fee waivers.
B Expenses are equal to each Class' annualized expense ratio, multiplied by the average account value over the period, multiplied by 181/365 (to reflect the one-half year period).
C 5% return per year before expenses
Board Approval of Investment Advisory Contracts and Management Fees
VIP Energy Portfolio
Each year, the Board of Trustees, including the Independent Trustees (together, the Board), votes on the renewal of the management contract with Fidelity SelectCo, LLC (SelectCo), an affiliate of Fidelity Management & Research Company (FMR), and the sub-advisory agreements with affiliates of FMR (together, the Advisory Contracts) for the fund. SelectCo and the sub-advisers are collectively referred to herein as the Investment Advisers. The Board, assisted by the advice of fund counsel and Independent Trustees' counsel, requests and considers a broad range of information relevant to the renewal of the Advisory Contracts throughout the year.
The Board meets regularly and, at each of its meetings, covers an extensive agenda of topics and materials and considers factors that are relevant to its annual consideration of the renewal of the fund's Advisory Contracts, including the services and support provided to the fund and its shareholders. The Board has established four standing committees (Committees) — Operations, Audit, Fair Valuation, and Governance and Nominating — each composed of and chaired by Independent Trustees with varying backgrounds, to which the Board has assigned specific subject matter responsibilities in order to enhance effective decision-making by the Board. The Operations Committee, of which all of the Independent Trustees are members, meets regularly throughout the year and considers, among other matters, information specifically related to the annual consideration of the renewal of the fund's Advisory Contracts. The Board, acting directly and through its Committees, requests and receives information concerning the annual consideration of the renewal of the fund's Advisory Contracts. The Board also meets as needed to review matters specifically related to the Board's annual consideration of the renewal of the Advisory Contracts. Members of the Board may also meet with trustees of other Fidelity funds through ad hoc joint committees to discuss certain matters relevant to all of the Fidelity funds.
At its January 2018 meeting, the Board unanimously determined to renew the fund's Advisory Contracts. In reaching its determination, the Board considered all factors it believed relevant, including (i) the nature, extent, and quality of the services to be provided to the fund and its shareholders (including the investment performance of the fund); (ii) the competitiveness of the fund's management fee and total expense ratio relative to peer funds; (iii) the total costs of the services to be provided by and the profits to be realized by Fidelity from its relationships with the fund; and (iv) the extent to which, if any, economies of scale exist and would be realized as the fund grows, and whether any economies of scale are appropriately shared with fund shareholders.
In considering whether to renew the Advisory Contracts for the fund, the Board reached a determination, with the assistance of fund counsel and Independent Trustees' counsel and through the exercise of its business judgment, that the renewal of the Advisory Contracts was in the best interests of the fund and its shareholders and that the compensation payable under the Advisory Contracts was fair and reasonable. The Board's decision to renew the Advisory Contracts was not based on any single factor, but rather was based on a comprehensive consideration of all the information provided to the Board at its meetings throughout the year. The Board, in reaching its determination to renew the Advisory Contracts, was aware that shareholders of the fund have a broad range of investment choices available to them, including a wide choice among funds offered by Fidelity's competitors, and that the fund's shareholders, who have the opportunity to review and weigh the disclosure provided by the fund in its prospectus and other public disclosures, have chosen to invest in this fund, which is part of the Fidelity family of funds.
Amendment to Group Fee Rate. The Board also ratified an amendment to the management contract for the fund to add an additional breakpoint to the group fee schedule, which was effective October 1, 2017. The Board noted that the additional breakpoint would result in lower management fee rates to the extent that assets under management that are included in group fee calculations increase above the new breakpoint.
Nature, Extent, and Quality of Services Provided. The Board considered the staffing of the Investment Advisers as it relates to the fund, including the backgrounds of investment personnel of SelectCo, and also considered the fund's investment objective, strategies, and related investment philosophy. The Independent Trustees also had discussions with senior management of Fidelity's investment operations and investment groups. The Board considered the structure of the investment personnel compensation program and whether this structure provides appropriate incentives to act in the best interests of the fund. Additionally, the Board considered the portfolio managers' investments, if any, in the funds that they manage.Resources Dedicated to Investment Management and Support Services. The Board reviewed the general qualifications and capabilities of the Investment Advisers' investment staffs, including their size, education, experience, and resources, as well as Fidelity's approach to recruiting, training, managing, and compensating investment personnel. The Board noted that Fidelity has continued to increase the resources devoted to non-U.S. offices, including expansion of Fidelity's global investment organization. The Board also noted that Fidelity's analysts have extensive resources, tools and capabilities that allow them to conduct sophisticated quantitative and fundamental analysis, as well as credit analysis of issuers, counterparties and guarantors. Further, the Board considered that Fidelity's investment professionals have sufficient access to global information and data so as to provide competitive investment results over time, and that those professionals also have access to sophisticated tools that permit them to assess portfolio construction and risk and performance attribution characteristics continuously, as well as to transmit new information and research conclusions rapidly around the world. Additionally, in its deliberations, the Board considered Fidelity's trading, risk management, compliance, and technology and operations capabilities and resources, which are integral parts of the investment management process.Shareholder and Administrative Services. The Board considered (i) the nature, extent, quality, and cost of advisory, administrative, and shareholder services performed by the Investment Advisers and their affiliates under the Advisory Contracts and under separate agreements covering transfer agency, pricing and bookkeeping, and securities lending services for the fund; (ii) the nature and extent of the supervision of third party service providers, principally custodians, subcustodians, and pricing vendors; and (iii) the resources devoted to, and the record of compliance with, the fund's compliance policies and procedures. The Board also reviewed the allocation of fund brokerage, including allocations to brokers affiliated with the Investment Advisers, the use of brokerage commissions to pay fund expenses, and the use of "soft" commission dollars to pay for research services.The Board noted that the growth of fund assets over time across the complex allows Fidelity to reinvest in the development of services designed to enhance the value or convenience of the Fidelity funds as investment vehicles. These services include 24-hour access to account information and market information through telephone representatives and over the Internet, investor education materials and asset allocation tools, and the expanded availability of Fidelity Investor Centers.The Board noted that it and the boards of certain other Fidelity funds had formed an ad hoc Committee on Transfer Agency Fees to review the variety of transfer agency fee structures throughout the industry and Fidelity's competitive positioning with respect to industry participants.Investment in a Large Fund Family. The Board considered the benefits to shareholders of investing in a Fidelity fund, including the benefits of investing in a fund that is part of a large family of funds offering a variety of investment disciplines and providing a large variety of mutual fund investor services. The Board noted that Fidelity had taken, or had made recommendations that resulted in the Fidelity funds taking, a number of actions over the previous year that benefited particular funds, including: (i) continuing to dedicate additional resources to Fidelity's investment research process, which includes meetings with management of issuers in which the funds invest, and to the support of the senior management team that oversees asset management; (ii) continuing efforts to enhance Fidelity's global research capabilities; (iii) launching new funds and making other enhancements to meet client needs; (iv) launching new share classes of existing funds; (v) eliminating purchase minimums and broadening eligibility requirements for certain lower-priced share classes; (vi) reducing management fees and total expenses for certain growth equity funds and index funds; (vii) lowering expense caps for certain existing funds and classes to reduce expenses borne by shareholders; (viii) eliminating short-term redemption fees for certain funds; (ix) introducing a new pricing structure for certain funds of funds that is expected to reduce overall expenses paid by shareholders; (x) rationalizing product lines and gaining increased efficiencies through proposals for fund mergers and share class consolidations; (xi) continuing to develop, acquire and implement systems and technology to improve services to the funds and shareholders, strengthen information security, and increase efficiency; and (xii) implementing enhancements to further strengthen Fidelity's product line to increase investors' probability of success in achieving their investment goals, including retirement income goals.Investment Performance. The Board considered whether the fund has operated in accordance with its investment objective, as well as its record of compliance with its investment restrictions and its performance history.The Board took into account discussions with representatives of SelectCo about fund investment performance that occur at Board meetings throughout the year. In this regard the Board noted that as part of regularly scheduled fund reviews and other reports to the Board on fund performance, the Board considers annualized return information for the fund for different time periods, measured against a securities market index ("benchmark index"). In its evaluation of fund investment performance at meetings throughout the year, the Board gave particular attention to information indicating underperformance of certain Fidelity funds for specific time periods and discussed with the Investment Advisers the reasons for such underperformance.In addition to reviewing absolute and relative fund performance, the Independent Trustees periodically consider the appropriateness of fund performance metrics in evaluating the results achieved. In general, the Independent Trustees believe that fund performance should be evaluated based on net performance (after fees and expenses) of both the highest performing and lowest performing fund share classes, where applicable, compared to appropriate benchmark indices, over appropriate time periods that may include full market cycles, taking into account relevant factors, including the following: general market conditions; issuer-specific information; and fund cash flows and other factors. Depending on the circumstances, the Independent Trustees may be satisfied with a fund's performance notwithstanding that it lags its benchmark index for certain periods.The Independent Trustees recognize that shareholders evaluate performance on a net basis over their own holding periods, for which one-, three-, and five-year periods are often used as a proxy. For this reason, the performance information reviewed by the Board also included net cumulative total return information for the fund and an appropriate benchmark index for the most recent one-, three-, and five-year periods ended June 30, 2017.Based on its review, the Board concluded that the nature, extent, and quality of services provided to the fund under the Advisory Contracts should continue to benefit the shareholders of the fund.Competitiveness of Management Fee and Total Expense Ratio. The Board considered the fund's management fee and total expense ratio compared to "mapped groups" of competitive funds and classes created for the purpose of facilitating the Trustees' analysis of the competitiveness of management fees and total expenses. Fidelity creates "mapped groups" by combining similar Lipper investment objective categories that have comparable investment mandates. For this purpose, all sector focused equity variable annuity funds are grouped in the same mapped group. Combining Lipper investment objective categories aids the Board's management fee and total expense ratio comparisons by broadening the competitive group used for comparison.Management Fee. The Board considered two proprietary management fee comparisons for the 12-month periods ended June 30 shown in basis points (BP) in the chart below. The group of Lipper funds used by the Board for management fee comparisons is referred to below as the "Total Mapped Group." The Total Mapped Group comparison focuses on a fund's standing in terms of gross management fees before expense reimbursements or caps relative to the total universe of funds with comparable investment mandates (i.e., sector equities), regardless of whether their management fee structures also are comparable. Funds with comparable management fee structures have similar management fee contractual arrangements (e.g., flat rate charged for advisory services, all-inclusive fee rate, etc.). "TMG %" represents the percentage of funds in the Total Mapped Group that had management fees that were lower than the fund's. For example, a hypothetical TMG % of 20% would mean that 80% of the funds in the Total Mapped Group had higher, and 20% had lower, management fees than the fund. The fund's actual TMG %s and the number of funds in the Total Mapped Group are in the chart below. The "Asset-Size Peer Group" (ASPG) comparison focuses on a fund's standing relative to a subset of non-Fidelity funds within the Total Mapped Group that are similar in size and management fee structure. For example, if a fund is in the first quartile of the ASPG, the fund's management fee ranks in the least expensive or lowest 25% of funds in the ASPG. The ASPG represents at least 15% of the funds in the Total Mapped Group with comparable asset size and management fee structures, subject to a minimum of 50 funds (or all funds in the Total Mapped Group if fewer than 50). Additional information, such as the ASPG quartile in which the fund's management fee rate ranked, is also included in the chart and considered by the Board.VIP Energy Portfolio
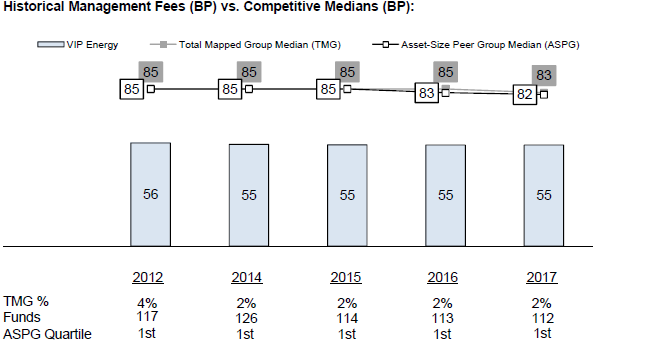
![]()
VNRIC-SANN-0818
1.817382.113
Fidelity® Variable Insurance Products: Financial Services Portfolio Semi-Annual Report June 30, 2018 |
|
Contents
To view a fund's proxy voting guidelines and proxy voting record for the 12-month period ended June 30, visit http://www.fidelity.com/proxyvotingresults or visit the Securities and Exchange Commission's (SEC) web site at http://www.sec.gov.
You may also call 1-877-208-0098 to request a free copy of the proxy voting guidelines.
Fidelity® Variable Insurance Products are separate account options which are purchased through a variable insurance contract.
Standard & Poor's, S&P and S&P 500 are registered service marks of The McGraw-Hill Companies, Inc. and have been licensed for use by Fidelity Distributors Corporation.
Other third-party marks appearing herein are the property of their respective owners.
All other marks appearing herein are registered or unregistered trademarks or service marks of FMR LLC or an affiliated company. © 2018 FMR LLC. All rights reserved.
This report and the financial statements contained herein are submitted for the general information of the shareholders of the Fund. This report is not authorized for distribution to prospective investors in the Fund unless preceded or accompanied by an effective prospectus.
A fund files its complete schedule of portfolio holdings with the SEC for the first and third quarters of each fiscal year on Form N-Q. Forms N-Q are available on the SEC’s web site at http://www.sec.gov. A fund's Forms N-Q may be reviewed and copied at the SEC’s Public Reference Room in Washington, DC. Information regarding the operation of the SEC's Public Reference Room may be obtained by calling 1-800-SEC-0330.
For a complete list of a fund's portfolio holdings, view the most recent holdings listing, semiannual report, or annual report on Fidelity's web site at http://www.fidelity.com, http://www.institutional.fidelity.com, or http://www.401k.com, as applicable.
NOT FDIC INSURED •MAY LOSE VALUE •NO BANK GUARANTEE
Neither the Fund nor Fidelity Distributors Corporation is a bank.
Investment Summary (Unaudited)
Top Ten Stocks as of June 30, 2018
| % of fund's net assets | |
| Capital One Financial Corp. | 5.3 |
| Citigroup, Inc. | 5.2 |
| Bank of America Corp. | 5.2 |
| TD Ameritrade Holding Corp. | 4.7 |
| Huntington Bancshares, Inc. | 4.6 |
| Goldman Sachs Group, Inc. | 3.9 |
| The Travelers Companies, Inc. | 3.5 |
| PNC Financial Services Group, Inc. | 3.5 |
| Hartford Financial Services Group, Inc. | 3.5 |
| JPMorgan Chase & Co. | 3.4 |
| 42.8 |
Top Industries (% of fund's net assets)
| As of June 30, 2018 | ||
| Banks | 36.1% | |
| Capital Markets | 23.3% | |
| Insurance | 20.5% | |
| Consumer Finance | 11.0% | |
| Diversified Financial Services | 3.2% | |
| All Others* | 5.9% | |
* Includes short-term investments and net other assets (liabilities).
Schedule of Investments June 30, 2018 (Unaudited)
Showing Percentage of Net Assets
| Common Stocks - 98.5% | |||
| Shares | Value | ||
| Banks - 36.1% | |||
| Diversified Banks - 16.7% | |||
| Bank of America Corp. | 401,746 | $11,325,220 | |
| Citigroup, Inc. | 170,089 | 11,382,356 | |
| JPMorgan Chase & Co. | 72,254 | 7,528,867 | |
| Wells Fargo & Co. | 116,496 | 6,458,538 | |
| 36,694,981 | |||
| Regional Banks - 19.4% | |||
| Bank of the Ozarks, Inc. | 56,700 | 2,553,768 | |
| CoBiz, Inc. | 62,856 | 1,350,147 | |
| East West Bancorp, Inc. | 42,500 | 2,771,000 | |
| First Citizen Bancshares, Inc. | 1,800 | 725,940 | |
| First Hawaiian, Inc. | 19,200 | 557,184 | |
| First Horizon National Corp. | 120,500 | 2,149,720 | |
| Huntington Bancshares, Inc. | 682,270 | 10,070,305 | |
| M&T Bank Corp. | 21,100 | 3,590,165 | |
| PNC Financial Services Group, Inc. | 57,100 | 7,714,210 | |
| Popular, Inc. | 37,869 | 1,712,057 | |
| Preferred Bank, Los Angeles | 9,300 | 571,578 | |
| Signature Bank (a) | 24,000 | 3,069,120 | |
| SunTrust Banks, Inc. | 78,700 | 5,195,774 | |
| United Community Bank, Inc. | 8,500 | 260,695 | |
| Wintrust Financial Corp. | 6,000 | 522,300 | |
| 42,813,963 | |||
| TOTAL BANKS | 79,508,944 | ||
| Capital Markets - 23.3% | |||
| Asset Management & Custody Banks - 6.0% | |||
| Apollo Global Management LLC Class A | 56,730 | 1,807,985 | |
| BlackRock, Inc. Class A | 9,800 | 4,890,592 | |
| Northern Trust Corp. | 57,850 | 5,952,187 | |
| Oaktree Capital Group LLC Class A | 15,000 | 609,750 | |
| 13,260,514 | |||
| Financial Exchanges & Data - 3.1% | |||
| Cboe Global Markets, Inc. | 34,527 | 3,593,225 | |
| IntercontinentalExchange, Inc. | 42,580 | 3,131,759 | |
| 6,724,984 | |||
| Investment Banking & Brokerage - 14.2% | |||
| E*TRADE Financial Corp. (a) | 120,500 | 7,369,780 | |
| Goldman Sachs Group, Inc. | 39,170 | 8,639,727 | |
| Greenhill & Co., Inc. (b) | 9,500 | 269,800 | |
| Hamilton Lane, Inc. Class A | 27,000 | 1,295,190 | |
| Investment Technology Group, Inc. | 59,846 | 1,251,978 | |
| Lazard Ltd. Class A | 22,600 | 1,105,366 | |
| PJT Partners, Inc. | 19,500 | 1,041,105 | |
| TD Ameritrade Holding Corp. | 189,200 | 10,362,484 | |
| 31,335,430 | |||
| TOTAL CAPITAL MARKETS | 51,320,928 | ||
| Consumer Finance - 11.0% | |||
| Consumer Finance - 11.0% | |||
| Capital One Financial Corp. | 126,235 | 11,600,998 | |
| Discover Financial Services | 1,900 | 133,779 | |
| OneMain Holdings, Inc. (a) | 75,200 | 2,503,408 | |
| SLM Corp. (a) | 315,900 | 3,617,055 | |
| Synchrony Financial | 194,400 | 6,489,072 | |
| 24,344,312 | |||
| Diversified Financial Services - 3.2% | |||
| Multi-Sector Holdings - 3.2% | |||
| Berkshire Hathaway, Inc. Class B (a) | 37,668 | 7,030,732 | |
| Insurance - 20.5% | |||
| Life & Health Insurance - 5.0% | |||
| MetLife, Inc. | 143,800 | 6,269,680 | |
| Torchmark Corp. | 58,590 | 4,769,812 | |
| 11,039,492 | |||
| Multi-Line Insurance - 6.4% | |||
| American International Group, Inc. | 120,100 | 6,367,702 | |
| Hartford Financial Services Group, Inc. | 150,100 | 7,674,613 | |
| 14,042,315 | |||
| Property & Casualty Insurance - 6.8% | |||
| Aspen Insurance Holdings Ltd. | 6,000 | 244,200 | |
| Axis Capital Holdings Ltd. | 9,500 | 528,390 | |
| Beazley PLC | 90,800 | 702,223 | |
| Chubb Ltd. | 7,556 | 959,763 | |
| FNF Group | 88,470 | 3,328,241 | |
| Hiscox Ltd. | 67,700 | 1,362,543 | |
| RSA Insurance Group PLC | 9,300 | 83,387 | |
| The Travelers Companies, Inc. | 63,712 | 7,794,526 | |
| 15,003,273 | |||
| Reinsurance - 2.3% | |||
| Reinsurance Group of America, Inc. | 37,800 | 5,045,544 | |
| TOTAL INSURANCE | 45,130,624 | ||
| IT Services - 2.4% | |||
| Data Processing & Outsourced Services - 2.4% | |||
| Adyen BV (c) | 100 | 55,091 | |
| Visa, Inc. Class A | 22,640 | 2,998,668 | |
| WEX, Inc. (a) | 12,000 | 2,285,760 | |
| 5,339,519 | |||
| Mortgage Real Estate Investment Trusts - 0.1% | |||
| Mortgage REITs - 0.1% | |||
| AGNC Investment Corp. | 15,000 | 278,850 | |
| Software - 0.7% | |||
| Application Software - 0.7% | |||
| Black Knight, Inc. (a) | 28,499 | 1,526,121 | |
| Thrifts & Mortgage Finance - 1.2% | |||
| Thrifts & Mortgage Finance - 1.2% | |||
| MGIC Investment Corp. (a) | 179,500 | 1,924,240 | |
| NMI Holdings, Inc. (a) | 19,000 | 309,700 | |
| Radian Group, Inc. | 30,100 | 488,222 | |
| 2,722,162 | |||
| TOTAL COMMON STOCKS | |||
| (Cost $179,125,441) | 217,202,192 | ||
| Money Market Funds - 0.9% | |||
| Fidelity Cash Central Fund, 1.93% (d) | 1,703,616 | 1,703,956 | |
| Fidelity Securities Lending Cash Central Fund 1.92% (d)(e) | 272,600 | 272,654 | |
| TOTAL MONEY MARKET FUNDS | |||
| (Cost $1,976,583) | 1,976,610 | ||
| TOTAL INVESTMENT IN SECURITIES - 99.4% | |||
| (Cost $181,102,024) | 219,178,802 | ||
| NET OTHER ASSETS (LIABILITIES) - 0.6% | 1,348,775 | ||
| NET ASSETS - 100% | $220,527,577 |
Legend
(a) Non-income producing
(b) Security or a portion of the security is on loan at period end.
(c) Security exempt from registration under Rule 144A of the Securities Act of 1933. These securities may be resold in transactions exempt from registration, normally to qualified institutional buyers. At the end of the period, the value of these securities amounted to $55,091 or 0.0% of net assets.
(d) Affiliated fund that is generally available only to investment companies and other accounts managed by Fidelity Investments. The rate quoted is the annualized seven-day yield of the fund at period end. A complete unaudited listing of the fund's holdings as of its most recent quarter end is available upon request. In addition, each Fidelity Central Fund's financial statements are available on the SEC's website or upon request.
(e) Investment made with cash collateral received from securities on loan.
Affiliated Central Funds
Information regarding fiscal year to date income earned by the Fund from investments in Fidelity Central Funds is as follows:
| Fund | Income earned |
| Fidelity Cash Central Fund | $30,072 |
| Fidelity Securities Lending Cash Central Fund | 512 |
| Total | $30,584 |
Amounts in the income column in the above table include any capital gain distributions from underlying funds, which are presented in the corresponding line-item in the Statement of Operations if applicable.
Investment Valuation
All investments are categorized as Level 1 under the Fair Value Hierarchy. The inputs or methodology used for valuing securities may not be an indication of the risk associated with investing in those securities. For more information on valuation inputs please refer to the Investment Valuation section in the accompanying Notes to Financial Statements.
See accompanying notes which are an integral part of the financial statements.
Financial Statements
Statement of Assets and Liabilities
| June 30, 2018 (Unaudited) | ||
| Assets | ||
| Investment in securities, at value (including securities loaned of $266,960) — See accompanying schedule: Unaffiliated issuers (cost $179,125,441) | $217,202,192 | |
| Fidelity Central Funds (cost $1,976,583) | 1,976,610 | |
| Total Investment in Securities (cost $181,102,024) | $219,178,802 | |
| Receivable for investments sold | 2,750,736 | |
| Receivable for fund shares sold | 187,470 | |
| Dividends receivable | 191,952 | |
| Distributions receivable from Fidelity Central Funds | 6,194 | |
| Prepaid expenses | 2,053 | |
| Other receivables | 4,816 | |
| Total assets | 222,322,023 | |
| Liabilities | ||
| Payable for investments purchased | $1,247,366 | |
| Payable for fund shares redeemed | 113,804 | |
| Accrued management fee | 103,595 | |
| Other affiliated payables | 32,755 | |
| Other payables and accrued expenses | 24,326 | |
| Collateral on securities loaned | 272,600 | |
| Total liabilities | 1,794,446 | |
| Net Assets | $220,527,577 | |
| Net Assets consist of: | ||
| Paid in capital | $176,972,925 | |
| Undistributed net investment income | 1,147,480 | |
| Accumulated undistributed net realized gain (loss) on investments and foreign currency transactions | 4,330,643 | |
| Net unrealized appreciation (depreciation) on investments and assets and liabilities in foreign currencies | 38,076,529 | |
| Net Assets | $220,527,577 | |
| Initial Class: | ||
| Net Asset Value, offering price and redemption price per share ($36,094,781 ÷ 2,792,214 shares) | $12.93 | |
| Investor Class: | ||
| Net Asset Value, offering price and redemption price per share ($184,432,796 ÷ 14,333,511 shares) | $12.87 |
See accompanying notes which are an integral part of the financial statements.
Statement of Operations
| Six months ended June 30, 2018 (Unaudited) | ||
| Investment Income | ||
| Dividends | $1,983,561 | |
| Income from Fidelity Central Funds | 30,584 | |
| Total income | 2,014,145 | |
| Expenses | ||
| Management fee | $648,967 | |
| Transfer agent fees | 156,269 | |
| Accounting and security lending fees | 46,753 | |
| Custodian fees and expenses | 5,797 | |
| Independent trustees' fees and expenses | 1,122 | |
| Audit | 20,434 | |
| Legal | 1,875 | |
| Miscellaneous | (2,099) | |
| Total expenses before reductions | 879,118 | |
| Expense reductions | (11,249) | |
| Total expenses after reductions | 867,869 | |
| Net investment income (loss) | 1,146,276 | |
| Realized and Unrealized Gain (Loss) | ||
| Net realized gain (loss) on: | ||
| Investment securities: | ||
| Unaffiliated issuers | 5,212,614 | |
| Fidelity Central Funds | 23 | |
| Foreign currency transactions | 1,257 | |
| Total net realized gain (loss) | 5,213,894 | |
| Change in net unrealized appreciation (depreciation) on: | ||
| Investment securities: | ||
| Unaffiliated issuers | (14,521,217) | |
| Fidelity Central Funds | 27 | |
| Assets and liabilities in foreign currencies | (126) | |
| Total change in net unrealized appreciation (depreciation) | (14,521,316) | |
| Net gain (loss) | (9,307,422) | |
| Net increase (decrease) in net assets resulting from operations | $(8,161,146) |
See accompanying notes which are an integral part of the financial statements.
Statement of Changes in Net Assets
| Six months ended June 30, 2018 (Unaudited) | Year ended December 31, 2017 | |
| Increase (Decrease) in Net Assets | ||
| Operations | ||
| Net investment income (loss) | $1,146,276 | $1,572,799 |
| Net realized gain (loss) | 5,213,894 | 7,178,761 |
| Change in net unrealized appreciation (depreciation) | (14,521,316) | 26,181,381 |
| Net increase (decrease) in net assets resulting from operations | (8,161,146) | 34,932,941 |
| Distributions to shareholders from net investment income | (489,392) | (1,318,016) |
| Distributions to shareholders from net realized gain | (5,075,784) | (1,932,141) |
| Total distributions | (5,565,176) | (3,250,157) |
| Share transactions - net increase (decrease) | (1,195,075) | 32,415,148 |
| Redemption fees | – | 35,115 |
| Total increase (decrease) in net assets | (14,921,397) | 64,133,047 |
| Net Assets | ||
| Beginning of period | 235,448,974 | 171,315,927 |
| End of period | $220,527,577 | $235,448,974 |
| Other Information | ||
| Undistributed net investment income end of period | $1,147,480 | $490,596 |
See accompanying notes which are an integral part of the financial statements.
Financial Highlights
VIP Financial Services Portfolio Initial Class
| Six months ended (Unaudited) June 30, | Years endedDecember 31, | |||||
| 2018 | 2017 | 2016 | 2015 | 2014 | 2013 | |
| Selected Per–Share Data | ||||||
| Net asset value, beginning of period | $13.72 | $11.50 | $9.74 | $10.23 | $9.33 | $7.05 |
| Income from Investment Operations | ||||||
| Net investment income (loss)A | .07 | .11 | .12 | .10 | .12 | .11 |
| Net realized and unrealized gain (loss) | (.54) | 2.33 | 1.70 | (.48) | .90 | 2.27 |
| Total from investment operations | (.47) | 2.44 | 1.82 | (.38) | 1.02 | 2.38 |
| Distributions from net investment income | (.03) | (.09) | (.06) | (.11) | (.12) | (.10) |
| Distributions from net realized gain | (.29) | (.13) | – | – | – | – |
| Total distributions | (.32) | (.22) | (.06) | (.11) | (.12) | (.10) |
| Redemption fees added to paid in capitalA | – | –B | –B | –B | –B | –B |
| Net asset value, end of period | $12.93 | $13.72 | $11.50 | $9.74 | $10.23 | $9.33 |
| Total ReturnC,D,E | (3.45)% | 21.25% | 18.72% | (3.69)% | 10.88% | 33.86% |
| Ratios to Average Net AssetsF,G | ||||||
| Expenses before reductions | .67%H | .69% | .72% | .71% | .73% | .81% |
| Expenses net of fee waivers, if any | .67%H | .69% | .72% | .71% | .72% | .81% |
| Expenses net of all reductions | .66%H | .69% | .71% | .71% | .72% | .79% |
| Net investment income (loss) | 1.02%H | .91% | 1.18% | 1.02% | 1.21% | 1.29% |
| Supplemental Data | ||||||
| Net assets, end of period (000 omitted) | $36,095 | $44,248 | $41,404 | $20,570 | $23,351 | $27,726 |
| Portfolio turnover rateI | 56%H | 72% | 87% | 59% | 58% | 211% |
A Calculated based on average shares outstanding during the period.
B Amount represents less than $.005 per share.
C Total returns for periods of less than one year are not annualized.
D Total returns do not reflect charges attributable to your insurance company's separate account. Inclusion of these charges would reduce the total returns shown.
E Total returns would have been lower if certain expenses had not been reduced during the applicable periods shown.
F Fees and expenses of any underlying Fidelity Central Funds are not included in the Fund's expense ratio. The Fund indirectly bears its proportionate share of the expenses of any underlying Fidelity Central Funds.
G Expense ratios reflect operating expenses of the class. Expenses before reductions do not reflect amounts reimbursed by the investment adviser or reductions from brokerage service arrangements or reductions from other expense offset arrangements and do not represent the amount paid by the class during periods when reimbursements or reductions occur. Expenses net of fee waivers reflect expenses after reimbursement by the investment adviser but prior to reductions from brokerage service arrangements or other expense offset arrangements. Expenses net of all reductions represent the net expenses paid by the class.
H Annualized
I Amount does not include the portfolio activity of any underlying Fidelity Central Funds.
See accompanying notes which are an integral part of the financial statements.
VIP Financial Services Portfolio Investor Class
| Six months ended (Unaudited) June 30, | Years endedDecember 31, | |||||
| 2018 | 2017 | 2016 | 2015 | 2014 | 2013 | |
| Selected Per–Share Data | ||||||
| Net asset value, beginning of period | $13.66 | $11.45 | $9.71 | $10.19 | $9.30 | $7.03 |
| Income from Investment Operations | ||||||
| Net investment income (loss)A | .06 | .10 | .11 | .09 | .11 | .10 |
| Net realized and unrealized gain (loss) | (.53) | 2.32 | 1.69 | (.47) | .89 | 2.27 |
| Total from investment operations | (.47) | 2.42 | 1.80 | (.38) | 1.00 | 2.37 |
| Distributions from net investment income | (.03) | (.08) | (.06) | (.10) | (.11) | (.10) |
| Distributions from net realized gain | (.29) | (.13) | – | – | – | – |
| Total distributions | (.32) | (.21) | (.06) | (.10) | (.11) | (.10) |
| Redemption fees added to paid in capitalA | – | –B | –B | –B | –B | –B |
| Net asset value, end of period | $12.87 | $13.66 | $11.45 | $9.71 | $10.19 | $9.30 |
| Total ReturnC,D,E | (3.48)% | 21.18% | 18.51% | (3.68)% | 10.75% | 33.74% |
| Ratios to Average Net AssetsF,G | ||||||
| Expenses before reductions | .75%H | .77% | .80% | .79% | .80% | .89% |
| Expenses net of fee waivers, if any | .75%H | .77% | .80% | .79% | .80% | .89% |
| Expenses net of all reductions | .74%H | .77% | .79% | .78% | .79% | .87% |
| Net investment income (loss) | .94%H | .83% | 1.10% | .95% | 1.14% | 1.22% |
| Supplemental Data | ||||||
| Net assets, end of period (000 omitted) | $184,433 | $191,201 | $129,912 | $90,950 | $83,817 | $60,357 |
| Portfolio turnover rateI | 56%H | 72% | 87% | 59% | 58% | 211% |
A Calculated based on average shares outstanding during the period.
B Amount represents less than $.005 per share.
C Total returns for periods of less than one year are not annualized.
D Total returns do not reflect charges attributable to your insurance company's separate account. Inclusion of these charges would reduce the total returns shown.
E Total returns would have been lower if certain expenses had not been reduced during the applicable periods shown.
F Fees and expenses of any underlying Fidelity Central Funds are not included in the Fund's expense ratio. The Fund indirectly bears its proportionate share of the expenses of any underlying Fidelity Central Funds.
G Expense ratios reflect operating expenses of the class. Expenses before reductions do not reflect amounts reimbursed by the investment adviser or reductions from brokerage service arrangements or reductions from other expense offset arrangements and do not represent the amount paid by the class during periods when reimbursements or reductions occur. Expenses net of fee waivers reflect expenses after reimbursement by the investment adviser but prior to reductions from brokerage service arrangements or other expense offset arrangements. Expenses net of all reductions represent the net expenses paid by the class.
H Annualized
I Amount does not include the portfolio activity of any underlying Fidelity Central Funds.
See accompanying notes which are an integral part of the financial statements.
Notes to Financial Statements (Unaudited)
For the period ended June 30, 2018
1. Organization.
VIP Financial Services Portfolio (the Fund) is a non-diversified fund of Variable Insurance Products Fund IV (the Trust) and is authorized to issue an unlimited number of shares. The Trust is registered under the Investment Company Act of 1940, as amended (the 1940 Act), as an open-end management investment company organized as a Massachusetts business trust. Shares of the Fund may only be purchased by insurance companies for the purpose of funding variable annuity or variable life insurance contracts. The Fund offers the following classes of shares: Initial Class shares and Investor Class shares. All classes have equal rights and voting privileges, except for matters affecting a single class.
2. Investments in Fidelity Central Funds.
The Fund invests in Fidelity Central Funds, which are open-end investment companies generally available only to other investment companies and accounts managed by the investment adviser and its affiliates. The Fund's Schedule of Investments lists each of the Fidelity Central Funds held as of period end, if any, as an investment of the Fund, but does not include the underlying holdings of each Fidelity Central Fund. As an Investing Fund, the Fund indirectly bears its proportionate share of the expenses of the underlying Fidelity Central Funds.
The Money Market Central Funds seek preservation of capital and current income and are managed by Fidelity Investments Money Management, Inc. (FIMM), an affiliate of the investment adviser. Annualized expenses of the Money Market Central Funds as of their most recent shareholder report date are less than .005%.
A complete unaudited list of holdings for each Fidelity Central Fund is available upon request or at the Securities and Exchange Commission (the SEC) website at www.sec.gov. In addition, the financial statements of the Fidelity Central Funds are available on the SEC website or upon request.
3. Significant Accounting Policies.
The Fund is an investment company and applies the accounting and reporting guidance of the Financial Accounting Standards Board (FASB) Accounting Standards Codification Topic 946 Financial Services – Investments Companies. The financial statements have been prepared in conformity with accounting principles generally accepted in the United States of America (GAAP), which require management to make certain estimates and assumptions at the date of the financial statements. Actual results could differ from those estimates. Subsequent events, if any, through the date that the financial statements were issued have been evaluated in the preparation of the financial statements. The following summarizes the significant accounting policies of the Fund:
Investment Valuation. Investments are valued as of 4:00 p.m. Eastern time on the last calendar day of the period. The Board of Trustees (the Board) has delegated the day to day responsibility for the valuation of the Fund's investments to the Fair Value Committee (the Committee) established by the Fund's investment adviser. In accordance with valuation policies and procedures approved by the Board, the Fund attempts to obtain prices from one or more third party pricing vendors or brokers to value its investments. When current market prices, quotations or currency exchange rates are not readily available or reliable, investments will be fair valued in good faith by the Committee, in accordance with procedures adopted by the Board. Factors used in determining fair value vary by investment type and may include market or investment specific events. The frequency with which these procedures are used cannot be predicted and they may be utilized to a significant extent. The Committee oversees the Fund's valuation policies and procedures and reports to the Board on the Committee's activities and fair value determinations. The Board monitors the appropriateness of the procedures used in valuing the Fund's investments and ratifies the fair value determinations of the Committee.
The Fund categorizes the inputs to valuation techniques used to value its investments into a disclosure hierarchy consisting of three levels as shown below:
- Level 1 – quoted prices in active markets for identical investments
- Level 2 – other significant observable inputs (including quoted prices for similar investments, interest rates, prepayment speeds, etc.)
- Level 3 – unobservable inputs (including the Fund's own assumptions based on the best information available)
Valuation techniques used to value the Fund's investments by major category are as follows:
Equity securities, including restricted securities, for which market quotations are readily available, are valued at the last reported sale price or official closing price as reported by a third party pricing vendor on the primary market or exchange on which they are traded and are categorized as Level 1 in the hierarchy. In the event there were no sales during the day or closing prices are not available, securities are valued at the last quoted bid price or may be valued using the last available price and are generally categorized as Level 2 in the hierarchy. For foreign equity securities, when market or security specific events arise, comparisons to the valuation of American Depositary Receipts (ADRs), futures contracts, Exchange-Traded Funds (ETFs) and certain indexes as well as quoted prices for similar securities may be used and would be categorized as Level 2 in the hierarchy. Utilizing these techniques may result in transfers between Level 1 and Level 2. For equity securities, including restricted securities, where observable inputs are limited, assumptions about market activity and risk are used and these securities may be categorized as Level 3 in the hierarchy.
Investments in open-end mutual funds, including the Fidelity Central Funds, are valued at their closing net asset value (NAV) each business day and are categorized as Level 1 in the hierarchy.
Changes in valuation techniques may result in transfers in or out of an assigned level within the disclosure hierarchy.
Foreign Currency. The Fund may use foreign currency contracts to facilitate transactions in foreign-denominated securities. Gains and losses from these transactions may arise from changes in the value of the foreign currency or if the counterparties do not perform under the contracts' terms.
Foreign-denominated assets, including investment securities, and liabilities are translated into U.S. dollars at the exchange rates at period end. Purchases and sales of investment securities, income and dividends received and expenses denominated in foreign currencies are translated into U.S. dollars at the exchange rate in effect on the transaction date.
The effects of exchange rate fluctuations on investments are included with the net realized and unrealized gain (loss) on investment securities. Other foreign currency transactions resulting in realized and unrealized gain (loss) are disclosed separately.
Investment Transactions and Income. For financial reporting purposes, the Fund's investment holdings and NAV include trades executed through the end of the last business day of the period. The NAV per share for processing shareholder transactions is calculated as of the close of business of the New York Stock Exchange (NYSE), normally 4:00 p.m. Eastern time and includes trades executed through the end of the prior business day. Gains and losses on securities sold are determined on the basis of identified cost and include proceeds received from litigation. Dividend income is recorded on the ex-dividend date, except for certain dividends from foreign securities where the ex-dividend date may have passed, which are recorded as soon as the Fund is informed of the ex-dividend date. Non-cash dividends included in dividend income, if any, are recorded at the fair market value of the securities received. Income and capital gain distributions from Fidelity Central Funds, if any, are recorded on the ex-dividend date. Certain distributions received by the Fund represent a return of capital or capital gain. The Fund determines the components of these distributions subsequent to the ex-dividend date, based upon receipt of tax filings or other correspondence relating to the underlying investment. These distributions are recorded as a reduction of cost of investments and/or as a realized gain. Investment income is recorded net of foreign taxes withheld where recovery of such taxes is uncertain.
Class Allocations and Expenses. Investment income, realized and unrealized capital gains and losses, common expenses of the Fund, and certain fund-level expense reductions, if any, are allocated daily on a pro-rata basis to each class based on the relative net assets of each class to the total net assets of the Fund. Each class differs with respect to transfer agent fees incurred. Certain expense reductions may also differ by class. For the reporting period, the allocated portion of income and expenses to each class as a percent of its average net assets may vary due to the timing of recording these transactions in relation to fluctuating net assets of the classes. Expenses directly attributable to a fund are charged to that fund. Expenses attributable to more than one fund are allocated among the respective funds on the basis of relative net assets or other appropriate methods. Expense estimates are accrued in the period to which they relate and adjustments are made when actual amounts are known.
Income Tax Information and Distributions to Shareholders. Each year, the Fund intends to qualify as a regulated investment company under Subchapter M of the Internal Revenue Code, including distributing substantially all of its taxable income and realized gains. As a result, no provision for U.S. Federal income taxes is required. The Fund files a U.S. federal tax return, in addition to state and local tax returns as required. The Fund's federal income tax returns are subject to examination by the Internal Revenue Service (IRS) for a period of three fiscal years after they are filed. State and local tax returns may be subject to examination for an additional fiscal year depending on the jurisdiction. Foreign taxes are provided for based on the Fund's understanding of the tax rules and rates that exist in the foreign markets in which it invests.
Distributions are declared and recorded on the ex-dividend date. Income and capital gain distributions are declared separately for each class. Income and capital gain distributions are determined in accordance with income tax regulations, which may differ from GAAP.
Capital accounts within the financial statements are adjusted for permanent book-tax differences. These adjustments have no impact on net assets or the results of operations. Capital accounts are not adjusted for temporary book-tax differences which will reverse in a subsequent period.
Book-tax differences are primarily due to foreign currency transactions, certain deemed distributions and losses deferred due to wash sales.
As of period end, the cost and unrealized appreciation (depreciation) in securities, and derivatives if applicable, for federal income tax purposes were as follows:
| Gross unrealized appreciation | $42,026,583 |
| Gross unrealized depreciation | (4,663,353) |
| Net unrealized appreciation (depreciation) | $37,363,230 |
| Tax cost | $181,815,572 |
Restricted Securities. The Fund may invest in securities that are subject to legal or contractual restrictions on resale. These securities generally may be resold in transactions exempt from registration or to the public if the securities are registered. Disposal of these securities may involve time-consuming negotiations and expense, and prompt sale at an acceptable price may be difficult. Information regarding restricted securities is included at the end of the Fund's Schedule of Investments.
4. Purchases and Sales of Investments.
Purchases and sales of securities, other than short-term securities, aggregated $64,027,797 and $66,725,055, respectively.
5. Fees and Other Transactions with Affiliates.
Management Fee. Fidelity SelectCo, LLC (the investment adviser) and its affiliates provide the Fund with investment management related services for which the Fund pays a monthly management fee. The management fee is the sum of an individual fund fee rate that is based on an annual rate of .30% of the Fund's average net assets and an annualized group fee rate that averaged .24% during the period. The group fee rate is based upon the average net assets of all the mutual funds advised by Fidelity Management & Research Company (FMR) and the investment adviser. The group fee rate decreases as assets under management increase and increases as assets under management decrease. For the reporting period, the total annualized management fee rate was .54% of the Fund's average net assets.
Transfer Agent Fees. Fidelity Investments Institutional Operations Company, Inc. (FIIOC), an affiliate of the investment adviser, is the Fund's transfer, dividend disbursing, and shareholder servicing agent. FIIOC receives an asset-based fee with respect to each class. Each class pays a fee for transfer agent services, typesetting and printing and mailing of shareholder reports, excluding mailing of proxy statements, equal to an annual rate of class-level average net assets. The annual rate for Investor Class is .15% and the annual rate for all other classes is .07%. For the period, transfer agent fees for each class were as follows:
| Initial Class | 13,099 |
| Investor Class | 143,170 |
| $156,269 |
Accounting and Security Lending Fees. Fidelity Service Company, Inc. (FSC), an affiliate of the investment adviser, maintains the Fund's accounting records. The accounting fee is based on the level of average net assets for each month. Under a separate contract, FSC administers the security lending program. The security lending fee is based on the number and duration of lending transactions. For the period, the fees were equivalent to an annualized rate of .04%.
Brokerage Commissions. The Fund placed a portion of its portfolio transactions with brokerage firms which are affiliates of the investment adviser. Brokerage commissions are included in net realized gain (loss) and change in net unrealized appreciation (depreciation) in the Statement of Operations. The commissions paid to these affiliated firms were $1,081 for the period.
Interfund Trades. The Fund may purchase from or sell securities to other Fidelity Funds under procedures adopted by the Board. The procedures have been designed to ensure these interfund trades are executed in accordance with Rule 17a-7 of the 1940 Act. Interfund trades are included within the respective purchases and sales amounts shown in the Purchases and Sales of Investments note.
6. Committed Line of Credit.
The Fund participates with other funds managed by the investment adviser or an affiliate in a $4.25 billion credit facility (the "line of credit") to be utilized for temporary or emergency purposes to fund shareholder redemptions or for other short-term liquidity purposes. The Fund has agreed to pay commitment fees on its pro-rata portion of the line of credit, which amounted to $315 and is reflected in Miscellaneous expenses on the Statement of Operations. During the period, the Fund did not borrow on this line of credit.
7. Security Lending.
The Fund lends portfolio securities through a lending agent from time to time in order to earn additional income. On the settlement date of the loan, the Fund receives collateral (in the form of U.S. Treasury obligations, letters of credit and/or cash) against the loaned securities and maintains collateral in an amount not less than 100% of the market value of the loaned securities during the period of the loan. The market value of the loaned securities is determined at the close of business of the Fund and any additional required collateral is delivered to the Fund on the next business day. The Fund or borrower may terminate the loan at any time, and if the borrower defaults on its obligation to return the securities loaned because of insolvency or other reasons, the Fund may apply collateral received from the borrower against the obligation. The Fund may experience delays and costs in recovering the securities loaned. Any cash collateral received is invested in the Fidelity Securities Lending Cash Central Fund. The value of loaned securities and cash collateral at period end are disclosed on the Fund's Statement of Assets and Liabilities. Security lending income represents the income earned on investing cash collateral, less rebates paid to borrowers and any lending agent fees associated with the loan, plus any premium payments received for lending certain types of securities. Security lending income is presented in the Statement of Operations as a component of income from Fidelity Central Funds. Total security lending income during the period amounted to $512.
8. Expense Reductions.
Commissions paid to certain brokers with whom the investment adviser, or its affiliates, places trades on behalf of the Fund include an amount in addition to trade execution, which may be rebated back to the Fund to offset certain expenses. This amount totaled $10,229 for the period. In addition, through arrangements with the Fund's custodian, credits realized as a result of certain uninvested cash balances were used to reduce the Fund's expenses. During the period, these credits reduced the Fund's custody expenses by $13.
In addition, during the period the investment adviser reimbursed and/or waived a portion of fund-level operating expenses in the amount of $1,007.
9. Distributions to Shareholders.
Distributions to shareholders of each class were as follows:
| Six months ended June 30, 2018 | Year ended December 31, 2017 | |
| From net investment income | ||
| Initial Class | 89,761 | 277,930 |
| Investor Class | 399,631 | 1,040,086 |
| Total | $489,392 | $1,318,016 |
| From net realized gain | ||
| Initial Class | 879,659 | 355,165 |
| Investor Class | 4,196,125 | 1,576,976 |
| Total | $5,075,784 | $1,932,141 |
10. Share Transactions.
Transactions for each class of shares were as follows:
| Shares | Shares | Dollars | Dollars | |
| Six months ended June 30, 2018 | Year ended December 31, 2017 | Six months ended June 30, 2018 | Year ended December 31, 2017 | |
| Initial Class | ||||
| Shares sold | 328,396 | 2,128,839 | $4,509,627 | $26,596,431 |
| Reinvestment of distributions | 73,385 | 47,511 | 969,420 | 633,094 |
| Shares redeemed | (834,628) | (2,552,381) | (11,465,388) | (30,424,794) |
| Net increase (decrease) | (432,847) | (376,031) | $(5,986,341) | $(3,195,269) |
| Investor Class | ||||
| Shares sold | 1,818,635 | 6,400,195 | $24,893,790 | $79,447,825 |
| Reinvestment of distributions | 349,222 | 196,433 | 4,595,756 | 2,617,062 |
| Shares redeemed | (1,829,989) | (3,946,164) | (24,698,280) | (46,454,470) |
| Net increase (decrease) | 337,868 | 2,650,464 | $4,791,266 | $35,610,417 |
11. Other.
The Fund's organizational documents provide former and current trustees and officers with a limited indemnification against liabilities arising in connection with the performance of their duties to the Fund. In the normal course of business, the Fund may also enter into contracts that provide general indemnifications. The Fund's maximum exposure under these arrangements is unknown as this would be dependent on future claims that may be made against the Fund. The risk of material loss from such claims is considered remote.
At the end of the period, the investment adviser or its affiliates were the owners of record of 99% of the total outstanding shares of the Fund.
Shareholder Expense Example
As a shareholder of the Fund, you incur two types of costs: (1) transaction costs and (2) ongoing costs, including management fees and other Fund expenses. This Example is intended to help you understand your ongoing costs (in dollars) of investing in the Fund and to compare these costs with the ongoing costs of investing in other mutual funds.
The Example is based on an investment of $1,000 invested at the beginning of the period and held for the entire period (January 1, 2018 to June 30, 2018).
Actual Expenses
The first line of the accompanying table for each class of the Fund provides information about actual account values and actual expenses. You may use the information in this line, together with the amount you invested, to estimate the expenses that you paid over the period. Simply divide your account value by $1,000.00 (for example, an $8,600 account value divided by $1,000.00 = 8.6), then multiply the result by the number in the first line for a class of the Fund under the heading entitled "Expenses Paid During Period" to estimate the expenses you paid on your account during this period. The estimate of expenses does not include any fees or other expenses of any variable annuity or variable life insurance product. If they were, the estimate of expenses you paid during the period would be higher, and your ending account value would be lower. In addition, the Fund, as a shareholder in the underlying Fidelity Central Funds, will indirectly bear its pro-rata share of the fees and expenses incurred by the underlying Fidelity Central Funds. These fees and expenses are not included in the Fund's annualized expense ratio used to calculate the expense estimate in the table below.
Hypothetical Example for Comparison Purposes
The second line of the accompanying table for each class of the Fund provides information about hypothetical account values and hypothetical expenses based on a Class' actual expense ratio and an assumed rate of return of 5% per year before expenses, which is not the Class' actual return. The hypothetical account values and expenses may not be used to estimate the actual ending account balance or expenses you paid for the period. You may use this information to compare the ongoing costs of investing in the Fund and other funds. To do so, compare this 5% hypothetical example with the 5% hypothetical examples that appear in the shareholder reports of the other funds. The estimate of expenses does not include any fees or other expenses of any variable annuity or variable life insurance product. If they were, the estimate of expenses you paid during the period would be higher, and your ending account value would be lower. In addition, the Fund, as a shareholder in the underlying Fidelity Central Funds, will indirectly bear its pro-rata share of the fees and expenses incurred by the underlying Fidelity Central Funds. These fees and expenses are not included in the Fund's annualized expense ratio used to calculate the expense estimate in the table below.
Please note that the expenses shown in the table are meant to highlight your ongoing costs only and do not reflect any transaction costs. Therefore, the second line of the table is useful in comparing ongoing costs only, and will not help you determine the relative total costs of owning different funds.
| Annualized Expense Ratio-A | Beginning Account Value January 1, 2018 | Ending Account Value June 30, 2018 | Expenses Paid During Period-B January 1, 2018 to June 30, 2018 | |
| Initial Class | .67% | |||
| Actual | $1,000.00 | $965.50 | $3.27 | |
| Hypothetical-C | $1,000.00 | $1,021.47 | $3.36 | |
| Investor Class | .75% | |||
| Actual | $1,000.00 | $965.20 | $3.65 | |
| Hypothetical-C | $1,000.00 | $1,021.08 | $3.76 |
A Annualized expense ratio reflects expenses net of applicable fee waivers.
B Expenses are equal to each Class' annualized expense ratio, multiplied by the average account value over the period, multiplied by 181/365 (to reflect the one-half year period).
C 5% return per year before expenses
Board Approval of Investment Advisory Contracts and Management Fees
VIP Financial Services Portfolio
Each year, the Board of Trustees, including the Independent Trustees (together, the Board), votes on the renewal of the management contract with Fidelity SelectCo, LLC (SelectCo), an affiliate of Fidelity Management & Research Company (FMR), and the sub-advisory agreements with affiliates of FMR (together, the Advisory Contracts) for the fund. SelectCo and the sub-advisers are collectively referred to herein as the Investment Advisers. The Board, assisted by the advice of fund counsel and Independent Trustees' counsel, requests and considers a broad range of information relevant to the renewal of the Advisory Contracts throughout the year.
The Board meets regularly and, at each of its meetings, covers an extensive agenda of topics and materials and considers factors that are relevant to its annual consideration of the renewal of the fund's Advisory Contracts, including the services and support provided to the fund and its shareholders. The Board has established four standing committees (Committees) — Operations, Audit, Fair Valuation, and Governance and Nominating — each composed of and chaired by Independent Trustees with varying backgrounds, to which the Board has assigned specific subject matter responsibilities in order to enhance effective decision-making by the Board. The Operations Committee, of which all of the Independent Trustees are members, meets regularly throughout the year and considers, among other matters, information specifically related to the annual consideration of the renewal of the fund's Advisory Contracts. The Board, acting directly and through its Committees, requests and receives information concerning the annual consideration of the renewal of the fund's Advisory Contracts. The Board also meets as needed to review matters specifically related to the Board's annual consideration of the renewal of the Advisory Contracts. Members of the Board may also meet with trustees of other Fidelity funds through ad hoc joint committees to discuss certain matters relevant to all of the Fidelity funds.
At its January 2018 meeting, the Board unanimously determined to renew the fund's Advisory Contracts. In reaching its determination, the Board considered all factors it believed relevant, including (i) the nature, extent, and quality of the services to be provided to the fund and its shareholders (including the investment performance of the fund); (ii) the competitiveness of the fund's management fee and total expense ratio relative to peer funds; (iii) the total costs of the services to be provided by and the profits to be realized by Fidelity from its relationships with the fund; and (iv) the extent to which, if any, economies of scale exist and would be realized as the fund grows, and whether any economies of scale are appropriately shared with fund shareholders.
In considering whether to renew the Advisory Contracts for the fund, the Board reached a determination, with the assistance of fund counsel and Independent Trustees' counsel and through the exercise of its business judgment, that the renewal of the Advisory Contracts was in the best interests of the fund and its shareholders and that the compensation payable under the Advisory Contracts was fair and reasonable. The Board's decision to renew the Advisory Contracts was not based on any single factor, but rather was based on a comprehensive consideration of all the information provided to the Board at its meetings throughout the year. The Board, in reaching its determination to renew the Advisory Contracts, was aware that shareholders of the fund have a broad range of investment choices available to them, including a wide choice among funds offered by Fidelity's competitors, and that the fund's shareholders, who have the opportunity to review and weigh the disclosure provided by the fund in its prospectus and other public disclosures, have chosen to invest in this fund, which is part of the Fidelity family of funds.
Amendment to Group Fee Rate. The Board also ratified an amendment to the management contract for the fund to add an additional breakpoint to the group fee schedule, which was effective October 1, 2017. The Board noted that the additional breakpoint would result in lower management fee rates to the extent that assets under management that are included in group fee calculations increase above the new breakpoint.
Nature, Extent, and Quality of Services Provided. The Board considered the staffing of the Investment Advisers as it relates to the fund, including the backgrounds of investment personnel of SelectCo, and also considered the fund's investment objective, strategies, and related investment philosophy. The Independent Trustees also had discussions with senior management of Fidelity's investment operations and investment groups. The Board considered the structure of the investment personnel compensation program and whether this structure provides appropriate incentives to act in the best interests of the fund. Additionally, the Board considered the portfolio managers' investments, if any, in the funds that they manage.Resources Dedicated to Investment Management and Support Services. The Board reviewed the general qualifications and capabilities of the Investment Advisers' investment staffs, including their size, education, experience, and resources, as well as Fidelity's approach to recruiting, training, managing, and compensating investment personnel. The Board noted that Fidelity has continued to increase the resources devoted to non-U.S. offices, including expansion of Fidelity's global investment organization. The Board also noted that Fidelity's analysts have extensive resources, tools and capabilities that allow them to conduct sophisticated quantitative and fundamental analysis, as well as credit analysis of issuers, counterparties and guarantors. Further, the Board considered that Fidelity's investment professionals have sufficient access to global information and data so as to provide competitive investment results over time, and that those professionals also have access to sophisticated tools that permit them to assess portfolio construction and risk and performance attribution characteristics continuously, as well as to transmit new information and research conclusions rapidly around the world. Additionally, in its deliberations, the Board considered Fidelity's trading, risk management, compliance, and technology and operations capabilities and resources, which are integral parts of the investment management process.Shareholder and Administrative Services. The Board considered (i) the nature, extent, quality, and cost of advisory, administrative, and shareholder services performed by the Investment Advisers and their affiliates under the Advisory Contracts and under separate agreements covering transfer agency, pricing and bookkeeping, and securities lending services for the fund; (ii) the nature and extent of the supervision of third party service providers, principally custodians, subcustodians, and pricing vendors; and (iii) the resources devoted to, and the record of compliance with, the fund's compliance policies and procedures. The Board also reviewed the allocation of fund brokerage, including allocations to brokers affiliated with the Investment Advisers, the use of brokerage commissions to pay fund expenses, and the use of "soft" commission dollars to pay for research services.The Board noted that the growth of fund assets over time across the complex allows Fidelity to reinvest in the development of services designed to enhance the value or convenience of the Fidelity funds as investment vehicles. These services include 24-hour access to account information and market information through telephone representatives and over the Internet, investor education materials and asset allocation tools, and the expanded availability of Fidelity Investor Centers.The Board noted that it and the boards of certain other Fidelity funds had formed an ad hoc Committee on Transfer Agency Fees to review the variety of transfer agency fee structures throughout the industry and Fidelity's competitive positioning with respect to industry participants.Investment in a Large Fund Family. The Board considered the benefits to shareholders of investing in a Fidelity fund, including the benefits of investing in a fund that is part of a large family of funds offering a variety of investment disciplines and providing a large variety of mutual fund investor services. The Board noted that Fidelity had taken, or had made recommendations that resulted in the Fidelity funds taking, a number of actions over the previous year that benefited particular funds, including: (i) continuing to dedicate additional resources to Fidelity's investment research process, which includes meetings with management of issuers in which the funds invest, and to the support of the senior management team that oversees asset management; (ii) continuing efforts to enhance Fidelity's global research capabilities; (iii) launching new funds and making other enhancements to meet client needs; (iv) launching new share classes of existing funds; (v) eliminating purchase minimums and broadening eligibility requirements for certain lower-priced share classes; (vi) reducing management fees and total expenses for certain growth equity funds and index funds; (vii) lowering expense caps for certain existing funds and classes to reduce expenses borne by shareholders; (viii) eliminating short-term redemption fees for certain funds; (ix) introducing a new pricing structure for certain funds of funds that is expected to reduce overall expenses paid by shareholders; (x) rationalizing product lines and gaining increased efficiencies through proposals for fund mergers and share class consolidations; (xi) continuing to develop, acquire and implement systems and technology to improve services to the funds and shareholders, strengthen information security, and increase efficiency; and (xii) implementing enhancements to further strengthen Fidelity's product line to increase investors' probability of success in achieving their investment goals, including retirement income goals.Investment Performance. The Board considered whether the fund has operated in accordance with its investment objective, as well as its record of compliance with its investment restrictions and its performance history.The Board took into account discussions with representatives of SelectCo about fund investment performance that occur at Board meetings throughout the year. In this regard the Board noted that as part of regularly scheduled fund reviews and other reports to the Board on fund performance, the Board considers annualized return information for the fund for different time periods, measured against a securities market index ("benchmark index"). In its evaluation of fund investment performance at meetings throughout the year, the Board gave particular attention to information indicating underperformance of certain Fidelity funds for specific time periods and discussed with the Investment Advisers the reasons for such underperformance. The fund underperformed its benchmark for the one-, three-, and five-year periods ended June 30, 2017, and as a result, the Board will continue to discuss with SelectCo the steps it is taking to address the fund's performance.In addition to reviewing absolute and relative fund performance, the Independent Trustees periodically consider the appropriateness of fund performance metrics in evaluating the results achieved. In general, the Independent Trustees believe that fund performance should be evaluated based on net performance (after fees and expenses) of both the highest performing and lowest performing fund share classes, where applicable, compared to appropriate benchmark indices, over appropriate time periods that may include full market cycles, taking into account relevant factors, including the following: general market conditions; issuer-specific information; and fund cash flows and other factors. Depending on the circumstances, the Independent Trustees may be satisfied with a fund's performance notwithstanding that it lags its benchmark index for certain periods.The Independent Trustees recognize that shareholders evaluate performance on a net basis over their own holding periods, for which one-, three-, and five-year periods are often used as a proxy. For this reason, the performance information reviewed by the Board also included net cumulative total return information for the fund and an appropriate benchmark index for the most recent one-, three-, and five-year periods ended June 30, 2017.Based on its review, the Board concluded that the nature, extent, and quality of services provided to the fund under the Advisory Contracts should continue to benefit the shareholders of the fund.Competitiveness of Management Fee and Total Expense Ratio. The Board considered the fund's management fee and total expense ratio compared to "mapped groups" of competitive funds and classes created for the purpose of facilitating the Trustees' analysis of the competitiveness of management fees and total expenses. Fidelity creates "mapped groups" by combining similar Lipper investment objective categories that have comparable investment mandates. For this purpose, all sector focused equity variable annuity funds are grouped in the same mapped group. Combining Lipper investment objective categories aids the Board's management fee and total expense ratio comparisons by broadening the competitive group used for comparison.Management Fee. The Board considered two proprietary management fee comparisons for the 12-month periods ended June 30 shown in basis points (BP) in the chart below. The group of Lipper funds used by the Board for management fee comparisons is referred to below as the "Total Mapped Group." The Total Mapped Group comparison focuses on a fund's standing in terms of gross management fees before expense reimbursements or caps relative to the total universe of funds with comparable investment mandates (i.e., sector equities), regardless of whether their management fee structures also are comparable. Funds with comparable management fee structures have similar management fee contractual arrangements (e.g., flat rate charged for advisory services, all-inclusive fee rate, etc.). "TMG %" represents the percentage of funds in the Total Mapped Group that had management fees that were lower than the fund's. For example, a hypothetical TMG % of 20% would mean that 80% of the funds in the Total Mapped Group had higher, and 20% had lower, management fees than the fund. The fund's actual TMG %s and the number of funds in the Total Mapped Group are in the chart below. The "Asset-Size Peer Group" (ASPG) comparison focuses on a fund's standing relative to a subset of non-Fidelity funds within the Total Mapped Group that are similar in size and management fee structure. For example, if a fund is in the first quartile of the ASPG, the fund's management fee ranks in the least expensive or lowest 25% of funds in the ASPG. The ASPG represents at least 15% of the funds in the Total Mapped Group with comparable asset size and management fee structures, subject to a minimum of 50 funds (or all funds in the Total Mapped Group if fewer than 50). Additional information, such as the ASPG quartile in which the fund's management fee rate ranked, is also included in the chart and considered by the Board.VIP Financial Services Portfolio

![]()
VFSIC-SANN-0818
1.817370.113
Fidelity® Variable Insurance Products: Health Care Portfolio Semi-Annual Report June 30, 2018 |
|
Contents
To view a fund's proxy voting guidelines and proxy voting record for the 12-month period ended June 30, visit http://www.fidelity.com/proxyvotingresults or visit the Securities and Exchange Commission's (SEC) web site at http://www.sec.gov.
You may also call 1-877-208-0098 to request a free copy of the proxy voting guidelines.
Fidelity® Variable Insurance Products are separate account options which are purchased through a variable insurance contract.
Standard & Poor's, S&P and S&P 500 are registered service marks of The McGraw-Hill Companies, Inc. and have been licensed for use by Fidelity Distributors Corporation.
Other third-party marks appearing herein are the property of their respective owners.
All other marks appearing herein are registered or unregistered trademarks or service marks of FMR LLC or an affiliated company. © 2018 FMR LLC. All rights reserved.
This report and the financial statements contained herein are submitted for the general information of the shareholders of the Fund. This report is not authorized for distribution to prospective investors in the Fund unless preceded or accompanied by an effective prospectus.
A fund files its complete schedule of portfolio holdings with the SEC for the first and third quarters of each fiscal year on Form N-Q. Forms N-Q are available on the SEC’s web site at http://www.sec.gov. A fund's Forms N-Q may be reviewed and copied at the SEC’s Public Reference Room in Washington, DC. Information regarding the operation of the SEC's Public Reference Room may be obtained by calling 1-800-SEC-0330.
For a complete list of a fund's portfolio holdings, view the most recent holdings listing, semiannual report, or annual report on Fidelity's web site at http://www.fidelity.com, http://www.institutional.fidelity.com, or http://www.401k.com, as applicable.
NOT FDIC INSURED •MAY LOSE VALUE •NO BANK GUARANTEE
Neither the Fund nor Fidelity Distributors Corporation is a bank.
Investment Summary (Unaudited)
Top Ten Stocks as of June 30, 2018
| % of fund's net assets | |
| UnitedHealth Group, Inc. | 9.8 |
| Becton, Dickinson & Co. | 7.6 |
| Boston Scientific Corp. | 6.7 |
| Humana, Inc. | 5.2 |
| AstraZeneca PLC (United Kingdom) | 3.0 |
| Baxter International, Inc. | 3.0 |
| Amgen, Inc. | 2.9 |
| Intuitive Surgical, Inc. | 2.7 |
| Sarepta Therapeutics, Inc. | 2.5 |
| Vertex Pharmaceuticals, Inc. | 2.5 |
| 45.9 |
Top Industries (% of fund's net assets)
| As of June 30, 2018 | ||
| Health Care Equipment & Supplies | 31.4% | |
| Biotechnology | 24.6% | |
| Health Care Providers & Services | 24.2% | |
| Pharmaceuticals | 14.4% | |
| Health Care Technology | 1.4% | |
| All Others* | 4.0% | |
* Includes short-term investments and net other assets (liabilities).
Schedule of Investments June 30, 2018 (Unaudited)
Showing Percentage of Net Assets
| Common Stocks - 97.6% | |||
| Shares | Value | ||
| Biotechnology - 24.4% | |||
| Biotechnology - 24.4% | |||
| Abeona Therapeutics, Inc. (a)(b) | 200,000 | $3,200,000 | |
| AC Immune SA (a)(b) | 116,000 | 1,078,800 | |
| Acceleron Pharma, Inc. (a) | 50,000 | 2,426,000 | |
| Acorda Therapeutics, Inc. (a) | 115,000 | 3,300,500 | |
| Alexion Pharmaceuticals, Inc. (a) | 160,000 | 19,864,000 | |
| Alnylam Pharmaceuticals, Inc. (a) | 65,000 | 6,401,850 | |
| Amgen, Inc. | 130,000 | 23,996,700 | |
| AnaptysBio, Inc. (a) | 50,800 | 3,608,832 | |
| Argenx SE ADR (a) | 64,000 | 5,303,040 | |
| Ascendis Pharma A/S sponsored ADR (a) | 74,000 | 4,922,480 | |
| Atara Biotherapeutics, Inc. (a) | 128,000 | 4,704,000 | |
| Audentes Therapeutics, Inc. (a) | 54,000 | 2,063,340 | |
| BeiGene Ltd. ADR (a) | 53,000 | 8,147,690 | |
| Biogen, Inc. (a) | 24,000 | 6,965,760 | |
| bluebird bio, Inc. (a) | 29,800 | 4,677,110 | |
| Blueprint Medicines Corp. (a) | 94,600 | 6,005,208 | |
| Cellectis SA sponsored ADR (a) | 92,260 | 2,610,035 | |
| CytomX Therapeutics, Inc. (a) | 59,700 | 1,364,742 | |
| FibroGen, Inc. (a) | 38,000 | 2,378,800 | |
| Five Prime Therapeutics, Inc. (a) | 70,000 | 1,106,700 | |
| GlycoMimetics, Inc. (a) | 130,000 | 2,096,900 | |
| Heron Therapeutics, Inc. (a) | 30,000 | 1,165,500 | |
| Insmed, Inc. (a) | 291,013 | 6,882,457 | |
| Intercept Pharmaceuticals, Inc. (a)(b) | 43,892 | 3,682,978 | |
| La Jolla Pharmaceutical Co. (a) | 60,000 | 1,750,200 | |
| Neurocrine Biosciences, Inc. (a) | 140,000 | 13,753,600 | |
| Sage Therapeutics, Inc. (a) | 2,600 | 406,978 | |
| Sarepta Therapeutics, Inc. (a) | 158,000 | 20,884,440 | |
| Spark Therapeutics, Inc. (a)(b) | 34,000 | 2,813,840 | |
| TESARO, Inc. (a)(b) | 80,000 | 3,557,600 | |
| uniQure B.V. (a) | 72,406 | 2,736,947 | |
| Vertex Pharmaceuticals, Inc. (a) | 120,000 | 20,395,200 | |
| Xencor, Inc. (a) | 130,000 | 4,811,300 | |
| Zai Lab Ltd. ADR (b) | 72,000 | 1,674,000 | |
| 200,737,527 | |||
| Diversified Consumer Services - 0.2% | |||
| Specialized Consumer Services - 0.2% | |||
| Carriage Services, Inc. | 80,759 | 1,982,633 | |
| Health Care Equipment & Supplies - 31.4% | |||
| Health Care Equipment - 30.4% | |||
| Atricure, Inc. (a) | 180,000 | 4,869,000 | |
| Baxter International, Inc. | 330,000 | 24,367,200 | |
| Becton, Dickinson & Co. | 260,000 | 62,285,600 | |
| Boston Scientific Corp. (a) | 1,700,000 | 55,590,000 | |
| Danaher Corp. | 50,000 | 4,934,000 | |
| DexCom, Inc. (a) | 69,000 | 6,553,620 | |
| Edwards Lifesciences Corp. (a) | 38,000 | 5,531,660 | |
| Fisher & Paykel Healthcare Corp. | 200,000 | 2,016,999 | |
| Insulet Corp. (a) | 127,100 | 10,892,470 | |
| Integra LifeSciences Holdings Corp. (a) | 186,000 | 11,980,260 | |
| Intuitive Surgical, Inc. (a) | 47,000 | 22,488,560 | |
| Penumbra, Inc. (a) | 62,400 | 8,620,560 | |
| Stryker Corp. | 120,000 | 20,263,200 | |
| Wright Medical Group NV (a) | 400,000 | 10,384,000 | |
| 250,777,129 | |||
| Health Care Supplies - 1.0% | |||
| Align Technology, Inc. (a) | 23,400 | 8,006,076 | |
| TOTAL HEALTH CARE EQUIPMENT & SUPPLIES | 258,783,205 | ||
| Health Care Providers & Services - 24.0% | |||
| Health Care Distributors & Services - 2.2% | |||
| Amplifon SpA | 107,200 | 2,223,342 | |
| EBOS Group Ltd. | 350,000 | 4,255,137 | |
| Henry Schein, Inc. (a) | 156,500 | 11,368,160 | |
| 17,846,639 | |||
| Health Care Facilities - 1.8% | |||
| HCA Holdings, Inc. | 146,000 | 14,979,600 | |
| Health Care Services - 1.6% | |||
| Diplomat Pharmacy, Inc. (a) | 130,000 | 3,322,800 | |
| G1 Therapeutics, Inc. (a) | 84,000 | 3,650,640 | |
| Premier, Inc. (a) | 74,000 | 2,692,120 | |
| United Drug PLC (United Kingdom) | 330,000 | 3,597,375 | |
| 13,262,935 | |||
| Managed Health Care - 18.4% | |||
| Cigna Corp. | 100,000 | 16,995,000 | |
| Humana, Inc. | 144,000 | 42,858,720 | |
| Molina Healthcare, Inc. (a) | 84,000 | 8,226,960 | |
| Notre Dame Intermedica Participacoes SA | 440,000 | 2,452,171 | |
| UnitedHealth Group, Inc. | 330,000 | 80,962,201 | |
| 151,495,052 | |||
| TOTAL HEALTH CARE PROVIDERS & SERVICES | 197,584,226 | ||
| Health Care Technology - 1.4% | |||
| Health Care Technology - 1.4% | |||
| Castlight Health, Inc. (a) | 104,900 | 445,825 | |
| Castlight Health, Inc. Class B (a) | 47,126 | 200,286 | |
| Teladoc, Inc. (a)(b) | 192,000 | 11,145,600 | |
| 11,791,711 | |||
| Internet Software & Services - 0.7% | |||
| Internet Software & Services - 0.7% | |||
| Benefitfocus, Inc. (a)(b) | 180,000 | 6,048,000 | |
| Life Sciences Tools & Services - 1.1% | |||
| Life Sciences Tools & Services - 1.1% | |||
| Hangzhou Tigermed Consulting Co. Ltd. Class A | 130,000 | 1,214,786 | |
| Lonza Group AG | 21,000 | 5,549,176 | |
| Morphosys AG (a) | 18,000 | 2,207,142 | |
| 8,971,104 | |||
| Pharmaceuticals - 14.4% | |||
| Pharmaceuticals - 14.4% | |||
| Allergan PLC | 80,000 | 13,337,600 | |
| Amneal Pharmaceuticals, Inc. (a) | 20,900 | 342,969 | |
| Amneal Pharmaceuticals, Inc. (c) | 178,378 | 2,927,183 | |
| AstraZeneca PLC (United Kingdom) | 360,000 | 24,900,186 | |
| Bristol-Myers Squibb Co. | 60,000 | 3,320,400 | |
| Dechra Pharmaceuticals PLC | 246,000 | 9,031,999 | |
| Indivior PLC (a) | 720,000 | 3,641,243 | |
| Jazz Pharmaceuticals PLC (a) | 24,000 | 4,135,200 | |
| Jiangsu Hengrui Medicine Co. Ltd. (A Shares) | 500,000 | 5,721,190 | |
| Mylan NV (a) | 155,000 | 5,601,700 | |
| MyoKardia, Inc. (a) | 37,000 | 1,837,050 | |
| Nektar Therapeutics (a) | 225,000 | 10,986,750 | |
| Perrigo Co. PLC | 112,000 | 8,165,920 | |
| Roche Holding AG (participation certificate) | 48,000 | 10,649,193 | |
| RPI International Holdings LP (c)(d) | 21,133 | 3,019,377 | |
| The Medicines Company (a) | 124,000 | 4,550,800 | |
| Theravance Biopharma, Inc. (a)(b) | 155,000 | 3,515,400 | |
| Tonghua Dongbao Pharmaceutical Co. Ltd. Class A | 760,000 | 2,751,427 | |
| 118,435,587 | |||
| Textiles, Apparel & Luxury Goods - 0.0% | |||
| Textiles - 0.0% | |||
| Scholar Rock Holding Corp. | 6,500 | 101,400 | |
| TOTAL COMMON STOCKS | |||
| (Cost $571,669,784) | 804,435,393 | ||
| Convertible Preferred Stocks - 0.6% | |||
| Biotechnology - 0.2% | |||
| Biotechnology - 0.2% | |||
| BioNTech AG Series A (c)(d) | 6,948 | 1,481,026 | |
| Health Care Providers & Services - 0.2% | |||
| Health Care Services - 0.2% | |||
| 1Life Healthcare, Inc. Series G (a)(c)(d) | 181,172 | 1,396,836 | |
| Software - 0.1% | |||
| Application Software - 0.1% | |||
| Outset Medical, Inc. Series C (a)(c)(d) | 308,701 | 876,711 | |
| Textiles, Apparel & Luxury Goods - 0.1% | |||
| Textiles - 0.1% | |||
| Generation Bio Series B (c)(d) | 14,000 | 128,040 | |
| Harmony Biosciences II, Inc. Series A (c)(d) | 1,195,827 | 1,195,827 | |
| 1,323,867 | |||
| TOTAL CONVERTIBLE PREFERRED STOCKS | |||
| (Cost $4,838,701) | 5,078,440 | ||
| Money Market Funds - 4.7% | |||
| Fidelity Cash Central Fund, 1.93% (e) | 14,323,401 | 14,326,265 | |
| Fidelity Securities Lending Cash Central Fund 1.92% (e)(f) | 24,187,486 | 24,192,323 | |
| TOTAL MONEY MARKET FUNDS | |||
| (Cost $38,516,170) | 38,518,588 | ||
| TOTAL INVESTMENT IN SECURITIES - 102.9% | |||
| (Cost $615,024,655) | 848,032,421 | ||
| NET OTHER ASSETS (LIABILITIES) - (2.9)% | (24,174,801) | ||
| NET ASSETS - 100% | $823,857,620 |
Legend
(a) Non-income producing
(b) Security or a portion of the security is on loan at period end.
(c) Restricted securities - Investment in securities not registered under the Securities Act of 1933 (excluding 144A issues). At the end of the period, the value of restricted securities (excluding 144A issues) amounted to $11,025,000 or 1.3% of net assets.
(d) Level 3 security
(e) Affiliated fund that is generally available only to investment companies and other accounts managed by Fidelity Investments. The rate quoted is the annualized seven-day yield of the fund at period end. A complete unaudited listing of the fund's holdings as of its most recent quarter end is available upon request. In addition, each Fidelity Central Fund's financial statements are available on the SEC's website or upon request.
(f) Investment made with cash collateral received from securities on loan.
Additional information on each restricted holding is as follows:
| Security | Acquisition Date | Acquisition Cost |
| 1Life Healthcare, Inc. Series G | 4/10/14 | $1,193,163 |
| Amneal Pharmaceuticals, Inc. | 5/4/18 | $3,255,399 |
| BioNTech AG Series A | 12/29/17 | $1,521,672 |
| Generation Bio Series B | 2/21/18 | $128,040 |
| Harmony Biosciences II, Inc. Series A | 9/22/17 | $1,195,827 |
| Outset Medical, Inc. Series C | 4/19/17 | $799,999 |
| RPI International Holdings LP | 5/21/15 - 3/23/16 | $2,801,500 |
Affiliated Central Funds
Information regarding fiscal year to date income earned by the Fund from investments in Fidelity Central Funds is as follows:
| Fund | Income earned |
| Fidelity Cash Central Fund | $89,007 |
| Fidelity Securities Lending Cash Central Fund | 179,932 |
| Total | $268,939 |
Amounts in the income column in the above table include any capital gain distributions from underlying funds, which are presented in the corresponding line-item in the Statement of Operations if applicable.
Investment Valuation
The following is a summary of the inputs used, as of June 30, 2018, involving the Fund's assets and liabilities carried at fair value. The inputs or methodology used for valuing securities may not be an indication of the risk associated with investing in those securities. For more information on valuation inputs, and their aggregation into the levels used below, please refer to the Investment Valuation section in the accompanying Notes to Financial Statements.
| Valuation Inputs at Reporting Date: | ||||
| Description | Total | Level 1 | Level 2 | Level 3 |
| Investments in Securities: | ||||
| Common Stocks | $804,435,393 | $760,317,461 | $41,098,555 | $3,019,377 |
| Convertible Preferred Stocks | 5,078,440 | -- | -- | 5,078,440 |
| Money Market Funds | 38,518,588 | 38,518,588 | -- | -- |
| Total Investments in Securities: | $848,032,421 | $798,836,049 | $41,098,555 | $8,097,817 |
Other Information
Distribution of investments by country or territory of incorporation, as a percentage of Total Net Assets, is as follows (Unaudited):
| United States of America | 81.1% |
| United Kingdom | 4.6% |
| Ireland | 3.5% |
| Netherlands | 2.9% |
| Switzerland | 2.1% |
| Cayman Islands | 2.0% |
| China | 1.1% |
| Others (Individually Less Than 1%) | 2.7% |
| 100.0% |
See accompanying notes which are an integral part of the financial statements.
Financial Statements
Statement of Assets and Liabilities
| June 30, 2018 (Unaudited) | ||
| Assets | ||
| Investment in securities, at value (including securities loaned of $23,829,186) — See accompanying schedule: Unaffiliated issuers (cost $576,508,485) | $809,513,833 | |
| Fidelity Central Funds (cost $38,516,170) | 38,518,588 | |
| Total Investment in Securities (cost $615,024,655) | $848,032,421 | |
| Cash | 50,191 | |
| Receivable for investments sold | 1,454,800 | |
| Receivable for fund shares sold | 852,965 | |
| Dividends receivable | 347,116 | |
| Distributions receivable from Fidelity Central Funds | 36,680 | |
| Prepaid expenses | 6,184 | |
| Other receivables | 26,911 | |
| Total assets | 850,807,268 | |
| Liabilities | ||
| Payable for investments purchased | $2,231,214 | |
| Payable for fund shares redeemed | 8,395 | |
| Accrued management fee | 373,087 | |
| Other affiliated payables | 114,170 | |
| Other payables and accrued expenses | 39,157 | |
| Collateral on securities loaned | 24,183,625 | |
| Total liabilities | 26,949,648 | |
| Net Assets | $823,857,620 | |
| Net Assets consist of: | ||
| Paid in capital | $549,789,703 | |
| Undistributed net investment income | 1,154,542 | |
| Accumulated undistributed net realized gain (loss) on investments and foreign currency transactions | 39,913,850 | |
| Net unrealized appreciation (depreciation) on investments and assets and liabilities in foreign currencies | 232,999,525 | |
| Net Assets | $823,857,620 | |
| Initial Class: | ||
| Net Asset Value, offering price and redemption price per share ($144,396,291 ÷ 4,883,495 shares) | $29.57 | |
| Investor Class: | ||
| Net Asset Value, offering price and redemption price per share ($679,461,329 ÷ 23,177,148 shares) | $29.32 |
See accompanying notes which are an integral part of the financial statements.
Statement of Operations
| Six months ended June 30, 2018 (Unaudited) | ||
| Investment Income | ||
| Dividends | $3,607,757 | |
| Income from Fidelity Central Funds | 268,939 | |
| Total income | 3,876,696 | |
| Expenses | ||
| Management fee | $2,084,532 | |
| Transfer agent fees | 499,289 | |
| Accounting and security lending fees | 139,227 | |
| Custodian fees and expenses | 22,129 | |
| Independent trustees' fees and expenses | 3,535 | |
| Audit | 21,524 | |
| Legal | 6,055 | |
| Miscellaneous | (11,611) | |
| Total expenses before reductions | 2,764,680 | |
| Expense reductions | (52,295) | |
| Total expenses after reductions | 2,712,385 | |
| Net investment income (loss) | 1,164,311 | |
| Realized and Unrealized Gain (Loss) | ||
| Net realized gain (loss) on: | ||
| Investment securities: | ||
| Unaffiliated issuers | 44,597,064 | |
| Fidelity Central Funds | 4,817 | |
| Foreign currency transactions | (17,879) | |
| Total net realized gain (loss) | 44,584,002 | |
| Change in net unrealized appreciation (depreciation) on: | ||
| Investment securities: | ||
| Unaffiliated issuers | 51,474,029 | |
| Fidelity Central Funds | (4,936) | |
| Assets and liabilities in foreign currencies | (7,534) | |
| Total change in net unrealized appreciation (depreciation) | 51,461,559 | |
| Net gain (loss) | 96,045,561 | |
| Net increase (decrease) in net assets resulting from operations | $97,209,872 |
See accompanying notes which are an integral part of the financial statements.
Statement of Changes in Net Assets
| Six months ended June 30, 2018 (Unaudited) | Year ended December 31, 2017 | |
| Increase (Decrease) in Net Assets | ||
| Operations | ||
| Net investment income (loss) | $1,164,311 | $1,680,602 |
| Net realized gain (loss) | 44,584,002 | 45,201,774 |
| Change in net unrealized appreciation (depreciation) | 51,461,559 | 109,355,469 |
| Net increase (decrease) in net assets resulting from operations | 97,209,872 | 156,237,845 |
| Distributions to shareholders from net investment income | (364,714) | (1,512,371) |
| Distributions to shareholders from net realized gain | (11,772,506) | (2,734,725) |
| Total distributions | (12,137,220) | (4,247,096) |
| Share transactions - net increase (decrease) | 24,728,941 | (98,699,996) |
| Redemption fees | – | 49,993 |
| Total increase (decrease) in net assets | 109,801,593 | 53,340,746 |
| Net Assets | ||
| Beginning of period | 714,056,027 | 660,715,281 |
| End of period | $823,857,620 | $714,056,027 |
| Other Information | ||
| Undistributed net investment income end of period | $1,154,542 | $354,945 |
See accompanying notes which are an integral part of the financial statements.
Financial Highlights
VIP Health Care Portfolio Initial Class
| Six months ended (Unaudited) June 30, | Years endedDecember 31, | |||||
| 2018 | 2017 | 2016 | 2015 | 2014 | 2013 | |
| Selected Per–Share Data | ||||||
| Net asset value, beginning of period | $26.44 | $21.28 | $25.92 | $27.70 | $22.56 | $15.51 |
| Income from Investment Operations | ||||||
| Net investment income (loss)A | .05 | .07 | .04 | –B | (.02) | –B |
| Net realized and unrealized gain (loss) | 3.53 | 5.26 | (2.86) | 1.70 | 7.21 | 8.42 |
| Total from investment operations | 3.58 | 5.33 | (2.82) | 1.70 | 7.19 | 8.42 |
| Distributions from net investment income | (.02) | (.07) | (.04) | – | – | – |
| Distributions from net realized gain | (.44) | (.10) | (1.78) | (3.49) | (2.06) | (1.37) |
| Total distributions | (.45)C | (.17) | (1.82) | (3.49) | (2.06) | (1.37) |
| Redemption fees added to paid in capitalA | – | –B | –B | .01 | .01 | –B |
| Net asset value, end of period | $29.57 | $26.44 | $21.28 | $25.92 | $27.70 | $22.56 |
| Total ReturnD,E,F | 13.77% | 25.05% | (10.43)% | 6.37% | 32.83% | 56.12% |
| Ratios to Average Net AssetsG,H | ||||||
| Expenses before reductions | .65%I | .67% | .67% | .66% | .67% | .69% |
| Expenses net of fee waivers, if any | .65%I | .67% | .67% | .66% | .67% | .69% |
| Expenses net of all reductions | .64%I | .66% | .66% | .65% | .66% | .68% |
| Net investment income (loss) | .37%I | .30% | .19% | - %J | (.07)% | (.01)% |
| Supplemental Data | ||||||
| Net assets, end of period (000 omitted) | $144,396 | $131,698 | $130,887 | $226,283 | $236,566 | $167,493 |
| Portfolio turnover rateK | 81%I | 74% | 53% | 77% | 104% | 93% |
A Calculated based on average shares outstanding during the period.
B Amount represents less than $.005 per share.
C Total distributions of $.45 per share is comprised of distributions from net investment income of $.016 and distributions from net realized gain of $.437 per share.
D Total returns for periods of less than one year are not annualized.
E Total returns do not reflect charges attributable to your insurance company's separate account. Inclusion of these charges would reduce the total returns shown.
F Total returns would have been lower if certain expenses had not been reduced during the applicable periods shown.
G Fees and expenses of any underlying Fidelity Central Funds are not included in the Fund's expense ratio. The Fund indirectly bears its proportionate share of the expenses of any underlying Fidelity Central Funds.
H Expense ratios reflect operating expenses of the class. Expenses before reductions do not reflect amounts reimbursed by the investment adviser or reductions from brokerage service arrangements or reductions from other expense offset arrangements and do not represent the amount paid by the class during periods when reimbursements or reductions occur. Expenses net of fee waivers reflect expenses after reimbursement by the investment adviser but prior to reductions from brokerage service arrangements or other expense offset arrangements. Expenses net of all reductions represent the net expenses paid by the class.
I Annualized
J Amount represents less than .005%.
K Amount does not include the portfolio activity of any underlying Fidelity Central Funds.
See accompanying notes which are an integral part of the financial statements.
VIP Health Care Portfolio Investor Class
| Six months ended (Unaudited) June 30, | Years endedDecember 31, | |||||
| 2018 | 2017 | 2016 | 2015 | 2014 | 2013 | |
| Selected Per–Share Data | ||||||
| Net asset value, beginning of period | $26.23 | $21.11 | $25.73 | $27.52 | $22.43 | $15.44 |
| Income from Investment Operations | ||||||
| Net investment income (loss)A | .04 | .05 | .02 | (.02) | (.04) | (.02) |
| Net realized and unrealized gain (loss) | 3.50 | 5.22 | (2.84) | 1.69 | 7.17 | 8.37 |
| Total from investment operations | 3.54 | 5.27 | (2.82) | 1.67 | 7.13 | 8.35 |
| Distributions from net investment income | (.01) | (.05) | (.02) | – | – | – |
| Distributions from net realized gain | (.44) | (.10) | (1.78) | (3.47) | (2.05) | (1.36) |
| Total distributions | (.45) | (.15) | (1.80) | (3.47) | (2.05) | (1.36) |
| Redemption fees added to paid in capitalA | – | –B | –B | .01 | .01 | –B |
| Net asset value, end of period | $29.32 | $26.23 | $21.11 | $25.73 | $27.52 | $22.43 |
| Total ReturnC,D,E | 13.71% | 24.97% | (10.51)% | 6.29% | 32.72% | 55.91% |
| Ratios to Average Net AssetsF,G | ||||||
| Expenses before reductions | .73%H | .75% | .75% | .74% | .75% | .77% |
| Expenses net of fee waivers, if any | .73%H | .75% | .75% | .74% | .75% | .77% |
| Expenses net of all reductions | .72%H | .74% | .75% | .73% | .74% | .76% |
| Net investment income (loss) | .29%H | .22% | .11% | (.08)% | (.15)% | (.10)% |
| Supplemental Data | ||||||
| Net assets, end of period (000 omitted) | $679,461 | $582,358 | $529,828 | $820,079 | $669,762 | $384,285 |
| Portfolio turnover rateI | 81%H | 74% | 53% | 77% | 104% | 93% |
A Calculated based on average shares outstanding during the period.
B Amount represents less than $.005 per share.
C Total returns for periods of less than one year are not annualized.
D Total returns do not reflect charges attributable to your insurance company's separate account. Inclusion of these charges would reduce the total returns shown.
E Total returns would have been lower if certain expenses had not been reduced during the applicable periods shown.
F Fees and expenses of any underlying Fidelity Central Funds are not included in the Fund's expense ratio. The Fund indirectly bears its proportionate share of the expenses of any underlying Fidelity Central Funds.
G Expense ratios reflect operating expenses of the class. Expenses before reductions do not reflect amounts reimbursed by the investment adviser or reductions from brokerage service arrangements or reductions from other expense offset arrangements and do not represent the amount paid by the class during periods when reimbursements or reductions occur. Expenses net of fee waivers reflect expenses after reimbursement by the investment adviser but prior to reductions from brokerage service arrangements or other expense offset arrangements. Expenses net of all reductions represent the net expenses paid by the class.
H Annualized
I Amount does not include the portfolio activity of any underlying Fidelity Central Funds.
See accompanying notes which are an integral part of the financial statements.
Notes to Financial Statements (Unaudited)
For the period ended June 30, 2018
1. Organization.
VIP Health Care Portfolio (the Fund) is a non-diversified fund of Variable Insurance Products Fund IV (the Trust) and is authorized to issue an unlimited number of shares. The Trust is registered under the Investment Company Act of 1940, as amended (the 1940 Act), as an open-end management investment company organized as a Massachusetts business trust. Shares of the Fund may only be purchased by insurance companies for the purpose of funding variable annuity or variable life insurance contracts. The Fund offers the following classes of shares: Initial Class shares and Investor Class shares. All classes have equal rights and voting privileges, except for matters affecting a single class.
2. Investments in Fidelity Central Funds.
The Fund invests in Fidelity Central Funds, which are open-end investment companies generally available only to other investment companies and accounts managed by the investment adviser and its affiliates. The Fund's Schedule of Investments lists each of the Fidelity Central Funds held as of period end, if any, as an investment of the Fund, but does not include the underlying holdings of each Fidelity Central Fund. As an Investing Fund, the Fund indirectly bears its proportionate share of the expenses of the underlying Fidelity Central Funds.
The Money Market Central Funds seek preservation of capital and current income and are managed by Fidelity Investments Money Management, Inc. (FIMM), an affiliate of the investment adviser. Annualized expenses of the Money Market Central Funds as of their most recent shareholder report date are less than .005%.
A complete unaudited list of holdings for each Fidelity Central Fund is available upon request or at the Securities and Exchange Commission (the SEC) website at www.sec.gov. In addition, the financial statements of the Fidelity Central Funds are available on the SEC website or upon request.
3. Significant Accounting Policies.
The Fund is an investment company and applies the accounting and reporting guidance of the Financial Accounting Standards Board (FASB) Accounting Standards Codification Topic 946 Financial Services – Investments Companies. The financial statements have been prepared in conformity with accounting principles generally accepted in the United States of America (GAAP), which require management to make certain estimates and assumptions at the date of the financial statements. Actual results could differ from those estimates. Subsequent events, if any, through the date that the financial statements were issued have been evaluated in the preparation of the financial statements. The following summarizes the significant accounting policies of the Fund:
Investment Valuation. Investments are valued as of 4:00 p.m. Eastern time on the last calendar day of the period. The Board of Trustees (the Board) has delegated the day to day responsibility for the valuation of the Fund's investments to the Fair Value Committee (the Committee) established by the Fund's investment adviser. In accordance with valuation policies and procedures approved by the Board, the Fund attempts to obtain prices from one or more third party pricing vendors or brokers to value its investments. When current market prices, quotations or currency exchange rates are not readily available or reliable, investments will be fair valued in good faith by the Committee, in accordance with procedures adopted by the Board. Factors used in determining fair value vary by investment type and may include market or investment specific events. The frequency with which these procedures are used cannot be predicted and they may be utilized to a significant extent. The Committee oversees the Fund's valuation policies and procedures and reports to the Board on the Committee's activities and fair value determinations. The Board monitors the appropriateness of the procedures used in valuing the Fund's investments and ratifies the fair value determinations of the Committee.
The Fund categorizes the inputs to valuation techniques used to value its investments into a disclosure hierarchy consisting of three levels as shown below:
- Level 1 – quoted prices in active markets for identical investments
- Level 2 – other significant observable inputs (including quoted prices for similar investments, interest rates, prepayment speeds, etc.)
- Level 3 – unobservable inputs (including the Fund's own assumptions based on the best information available)
Valuation techniques used to value the Fund's investments by major category are as follows:
Equity securities, including restricted securities, for which market quotations are readily available, are valued at the last reported sale price or official closing price as reported by a third party pricing vendor on the primary market or exchange on which they are traded and are categorized as Level 1 in the hierarchy. In the event there were no sales during the day or closing prices are not available, securities are valued at the last quoted bid price or may be valued using the last available price and are generally categorized as Level 2 in the hierarchy. For foreign equity securities, when market or security specific events arise, comparisons to the valuation of American Depositary Receipts (ADRs), futures contracts, Exchange-Traded Funds (ETFs) and certain indexes as well as quoted prices for similar securities may be used and would be categorized as Level 2 in the hierarchy. Utilizing these techniques may result in transfers between Level 1 and Level 2. For equity securities, including restricted securities, where observable inputs are limited, assumptions about market activity and risk are used and these securities may be categorized as Level 3 in the hierarchy.
Investments in open-end mutual funds, including the Fidelity Central Funds, are valued at their closing net asset value (NAV) each business day and are categorized as Level 1 in the hierarchy.
Changes in valuation techniques may result in transfers in or out of an assigned level within the disclosure hierarchy. The aggregate value of investments by input level as of June 30, 2018, is included at the end of the Fund's Schedule of Investments.
Foreign Currency. The Fund may use foreign currency contracts to facilitate transactions in foreign-denominated securities. Gains and losses from these transactions may arise from changes in the value of the foreign currency or if the counterparties do not perform under the contracts' terms.
Foreign-denominated assets, including investment securities, and liabilities are translated into U.S. dollars at the exchange rates at period end. Purchases and sales of investment securities, income and dividends received and expenses denominated in foreign currencies are translated into U.S. dollars at the exchange rate in effect on the transaction date.
The effects of exchange rate fluctuations on investments are included with the net realized and unrealized gain (loss) on investment securities. Other foreign currency transactions resulting in realized and unrealized gain (loss) are disclosed separately.
Investment Transactions and Income. For financial reporting purposes, the Fund's investment holdings and NAV include trades executed through the end of the last business day of the period. The NAV per share for processing shareholder transactions is calculated as of the close of business of the New York Stock Exchange (NYSE), normally 4:00 p.m. Eastern time and includes trades executed through the end of the prior business day. Gains and losses on securities sold are determined on the basis of identified cost and include proceeds received from litigation. Dividend income is recorded on the ex-dividend date, except for certain dividends from foreign securities where the ex-dividend date may have passed, which are recorded as soon as the Fund is informed of the ex-dividend date. Non-cash dividends included in dividend income, if any, are recorded at the fair market value of the securities received. Income and capital gain distributions from Fidelity Central Funds, if any, are recorded on the ex-dividend date. Certain distributions received by the Fund represent a return of capital or capital gain. The Fund determines the components of these distributions subsequent to the ex-dividend date, based upon receipt of tax filings or other correspondence relating to the underlying investment. These distributions are recorded as a reduction of cost of investments and/or as a realized gain. Investment income is recorded net of foreign taxes withheld where recovery of such taxes is uncertain.
Class Allocations and Expenses. Investment income, realized and unrealized capital gains and losses, common expenses of the Fund, and certain fund-level expense reductions, if any, are allocated daily on a pro-rata basis to each class based on the relative net assets of each class to the total net assets of the Fund. Each class differs with respect to transfer agent fees incurred. Certain expense reductions may also differ by class. For the reporting period, the allocated portion of income and expenses to each class as a percent of its average net assets may vary due to the timing of recording these transactions in relation to fluctuating net assets of the classes. Expenses directly attributable to a fund are charged to that fund. Expenses attributable to more than one fund are allocated among the respective funds on the basis of relative net assets or other appropriate methods. Expense estimates are accrued in the period to which they relate and adjustments are made when actual amounts are known.
Income Tax Information and Distributions to Shareholders. Each year, the Fund intends to qualify as a regulated investment company under Subchapter M of the Internal Revenue Code, including distributing substantially all of its taxable income and realized gains. As a result, no provision for U.S. Federal income taxes is required. The Fund files a U.S. federal tax return, in addition to state and local tax returns as required. The Fund's federal income tax returns are subject to examination by the Internal Revenue Service (IRS) for a period of three fiscal years after they are filed. State and local tax returns may be subject to examination for an additional fiscal year depending on the jurisdiction. Foreign taxes are provided for based on the Fund's understanding of the tax rules and rates that exist in the foreign markets in which it invests.
Distributions are declared and recorded on the ex-dividend date. Income and capital gain distributions are declared separately for each class. Income and capital gain distributions are determined in accordance with income tax regulations, which may differ from GAAP.
Capital accounts within the financial statements are adjusted for permanent book-tax differences. These adjustments have no impact on net assets or the results of operations. Capital accounts are not adjusted for temporary book-tax differences which will reverse in a subsequent period.
Book-tax differences are primarily due to foreign currency transactions, passive foreign investment companies (PFIC), capital loss carryforwards and losses deferred due to wash sales.
As of period end, the cost and unrealized appreciation (depreciation) in securities, and derivatives if applicable, for federal income tax purposes were as follows:
| Gross unrealized appreciation | $249,998,113 |
| Gross unrealized depreciation | (17,759,132) |
| Net unrealized appreciation (depreciation) | $232,238,981 |
| Tax cost | $615,793,440 |
Restricted Securities. The Fund may invest in securities that are subject to legal or contractual restrictions on resale. These securities generally may be resold in transactions exempt from registration or to the public if the securities are registered. Disposal of these securities may involve time-consuming negotiations and expense, and prompt sale at an acceptable price may be difficult. Information regarding restricted securities is included at the end of the Fund's Schedule of Investments.
4. Purchases and Sales of Investments.
Purchases and sales of securities, other than short-term securities, aggregated $306,458,086 and $305,516,823, respectively.
5. Fees and Other Transactions with Affiliates.
Management Fee. Fidelity SelectCo, LLC (the investment adviser) and its affiliates provide the Fund with investment management related services for which the Fund pays a monthly management fee. The management fee is the sum of an individual fund fee rate that is based on an annual rate of .30% of the Fund's average net assets and an annualized group fee rate that averaged .24% during the period. The group fee rate is based upon the average net assets of all the mutual funds advised by Fidelity Management & Research Company (FMR) and the investment adviser. The group fee rate decreases as assets under management increase and increases as assets under management decrease. For the reporting period, the total annualized management fee rate was .54% of the Fund's average net assets.
Transfer Agent Fees. Fidelity Investments Institutional Operations Company, Inc. (FIIOC), an affiliate of the investment adviser, is the Fund's transfer, dividend disbursing, and shareholder servicing agent. FIIOC receives an asset-based fee with respect to each class. Each class pays a fee for transfer agent services, typesetting and printing and mailing of shareholder reports, excluding mailing of proxy statements, equal to an annual rate of class-level average net assets. The annual rate for Investor Class is .15% and the annual rate for all other classes is .07%. For the period, transfer agent fees for each class were as follows:
| Initial Class | $44,357 |
| Investor Class | 454,932 |
| $499,289 |
Accounting and Security Lending Fees. Fidelity Service Company, Inc. (FSC), an affiliate of the investment adviser, maintains the Fund's accounting records. The accounting fee is based on the level of average net assets for each month. Under a separate contract, FSC administers the security lending program. The security lending fee is based on the number and duration of lending transactions. For the period, the fees were equivalent to an annualized rate of .04%.
Brokerage Commissions. The Fund placed a portion of its portfolio transactions with brokerage firms which are affiliates of the investment adviser. Brokerage commissions are included in net realized gain (loss) and change in net unrealized appreciation (depreciation) in the Statement of Operations. The commissions paid to these affiliated firms were $7,359 for the period.
Interfund Trades. The Fund may purchase from or sell securities to other Fidelity Funds under procedures adopted by the Board. The procedures have been designed to ensure these interfund trades are executed in accordance with Rule 17a-7 of the 1940 Act. Interfund trades are included within the respective purchases and sales amounts shown in the Purchases and Sales of Investments note.
6. Committed Line of Credit.
The Fund participates with other funds managed by the investment adviser or an affiliate in a $4.25 billion credit facility (the "line of credit") to be utilized for temporary or emergency purposes to fund shareholder redemptions or for other short-term liquidity purposes. The Fund has agreed to pay commitment fees on its pro-rata portion of the line of credit, which amounted to $1,065 and is reflected in Miscellaneous expenses on the Statement of Operations. During the period, the Fund did not borrow on this line of credit.
7. Security Lending.
The Fund lends portfolio securities through a lending agent from time to time in order to earn additional income. On the settlement date of the loan, the Fund receives collateral (in the form of U.S. Treasury obligations, letters of credit and/or cash) against the loaned securities and maintains collateral in an amount not less than 100% of the market value of the loaned securities during the period of the loan. The market value of the loaned securities is determined at the close of business of the Fund and any additional required collateral is delivered to the Fund on the next business day. The Fund or borrower may terminate the loan at any time, and if the borrower defaults on its obligation to return the securities loaned because of insolvency or other reasons, the Fund may apply collateral received from the borrower against the obligation. The Fund may experience delays and costs in recovering the securities loaned. Any cash collateral received is invested in Fidelity Securities Lending Cash Central Fund. The value of loaned securities and cash collateral at period end are disclosed on the Fund's Statement of Assets and Liabilities. Security lending income represents the income earned on investing cash collateral, less rebates paid to borrowers and any lending agent fees associated with the loan, plus any premium payments received for lending certain types of securities. Security lending income is presented in the Statement of Operations as a component of income from Fidelity Central Funds. Total security lending income during the period amounted to $179,932.
8. Expense Reductions.
Commissions paid to certain brokers with whom the investment adviser, or its affiliates, places trades on behalf of the Fund include an amount in addition to trade execution, which may be rebated back to the Fund to offset certain expenses. This amount totaled $49,023 for the period. Through arrangements with the Fund's custodian, credits realized as a result of certain uninvested cash balances were used to reduce the Fund's expenses. During the period, these credits reduced the Fund's custody expenses by $41.
In addition, during the period the investment adviser reimbursed and/or waived a portion of fund-level operating expenses in the amount of $3,231.
9. Distributions to Shareholders.
Distributions to shareholders of each class were as follows:
| Six months ended June 30, 2018 | Year ended December 31, 2017 | |
| From net investment income | ||
| Initial Class | $77,344 | $360,506 |
| Investor Class | 287,370 | 1,151,865 |
| Total | $364,714 | $1,512,371 |
| From net realized gain | ||
| Initial Class | $2,112,459 | $505,025 |
| Investor Class | 9,660,047 | 2,229,700 |
| Total | $11,772,506 | $2,734,725 |
10. Share Transactions.
Transactions for each class of shares were as follows:
| Shares | Shares | Dollars | Dollars | |
| Six months ended June 30, 2018 | Year ended December 31, 2017 | Six months ended June 30, 2018 | Year ended December 31, 2017 | |
| Initial Class | ||||
| Shares sold | 233,142 | 312,878 | $6,715,397 | $7,964,347 |
| Reinvestment of distributions | 83,421 | 32,737 | 2,189,803 | 865,531 |
| Shares redeemed | (413,531) | (1,516,987) | (11,515,482) | (37,362,086) |
| Net increase (decrease) | (96,968) | (1,171,372) | $(2,610,282) | $(28,532,208) |
| Investor Class | ||||
| Shares sold | 1,354,928 | 1,445,926 | $38,660,584 | $36,356,330 |
| Reinvestment of distributions | 382,152 | 128,748 | 9,947,417 | 3,381,565 |
| Shares redeemed | (763,157) | (4,474,069) | (21,268,778) | (109,905,683) |
| Net increase (decrease) | 973,923 | (2,899,395) | $27,339,223 | $(70,167,788) |
11. Other.
The Fund's organizational documents provide former and current trustees and officers with a limited indemnification against liabilities arising in connection with the performance of their duties to the Fund. In the normal course of business, the Fund may also enter into contracts that provide general indemnifications. The Fund's maximum exposure under these arrangements is unknown as this would be dependent on future claims that may be made against the Fund. The risk of material loss from such claims is considered remote.
At the end of the period, the investment adviser or its affiliates were the owners of record of 100% of the total outstanding shares of the Fund.
Shareholder Expense Example
As a shareholder of the Fund, you incur two types of costs: (1) transaction costs and (2) ongoing costs, including management fees and other Fund expenses. This Example is intended to help you understand your ongoing costs (in dollars) of investing in the Fund and to compare these costs with the ongoing costs of investing in other mutual funds.
The Example is based on an investment of $1,000 invested at the beginning of the period and held for the entire period (January 1, 2018 to June 30, 2018).
Actual Expenses
The first line of the accompanying table for each class of the Fund provides information about actual account values and actual expenses. You may use the information in this line, together with the amount you invested, to estimate the expenses that you paid over the period. Simply divide your account value by $1,000.00 (for example, an $8,600 account value divided by $1,000.00 = 8.6), then multiply the result by the number in the first line for a class of the Fund under the heading entitled "Expenses Paid During Period" to estimate the expenses you paid on your account during this period. The estimate of expenses does not include any fees or other expenses of any variable annuity or variable life insurance product. If they were, the estimate of expenses you paid during the period would be higher, and your ending account value would be lower. In addition, the Fund, as a shareholder in the underlying Fidelity Central Funds, will indirectly bear its pro-rata share of the fees and expenses incurred by the underlying Fidelity Central Funds. These fees and expenses are not included in the Fund's annualized expense ratio used to calculate the expense estimate in the table below.
Hypothetical Example for Comparison Purposes
The second line of the accompanying table for each class of the Fund provides information about hypothetical account values and hypothetical expenses based on a Class' actual expense ratio and an assumed rate of return of 5% per year before expenses, which is not the Class' actual return. The hypothetical account values and expenses may not be used to estimate the actual ending account balance or expenses you paid for the period. You may use this information to compare the ongoing costs of investing in the Fund and other funds. To do so, compare this 5% hypothetical example with the 5% hypothetical examples that appear in the shareholder reports of the other funds. The estimate of expenses does not include any fees or other expenses of any variable annuity or variable life insurance product. If they were, the estimate of expenses you paid during the period would be higher, and your ending account value would be lower. In addition, the Fund, as a shareholder in the underlying Fidelity Central Funds, will indirectly bear its pro-rata share of the fees and expenses incurred by the underlying Fidelity Central Funds. These fees and expenses are not included in the Fund's annualized expense ratio used to calculate the expense estimate in the table below.
Please note that the expenses shown in the table are meant to highlight your ongoing costs only and do not reflect any transaction costs. Therefore, the second line of the table is useful in comparing ongoing costs only, and will not help you determine the relative total costs of owning different funds.
| Annualized Expense Ratio-A | Beginning Account Value January 1, 2018 | Ending Account Value June 30, 2018 | Expenses Paid During Period-B January 1, 2018 to June 30, 2018 | |
| Initial Class | .65% | |||
| Actual | $1,000.00 | $1,137.70 | $3.45 | |
| Hypothetical-C | $1,000.00 | $1,021.57 | $3.26 | |
| Investor Class | .73% | |||
| Actual | $1,000.00 | $1,137.10 | $3.87 | |
| Hypothetical-C | $1,000.00 | $1,021.17 | $3.66 |
A Annualized expense ratio reflects expenses net of applicable fee waivers.
B Expenses are equal to each Class' annualized expense ratio, multiplied by the average account value over the period, multiplied by 181/365 (to reflect the one-half year period).
C 5% return per year before expenses
Board Approval of Investment Advisory Contracts and Management Fees
VIP Health Care Portfolio
Each year, the Board of Trustees, including the Independent Trustees (together, the Board), votes on the renewal of the management contract with Fidelity SelectCo, LLC (SelectCo), an affiliate of Fidelity Management & Research Company (FMR), and the sub-advisory agreements with affiliates of FMR (together, the Advisory Contracts) for the fund. SelectCo and the sub-advisers are collectively referred to herein as the Investment Advisers. The Board, assisted by the advice of fund counsel and Independent Trustees' counsel, requests and considers a broad range of information relevant to the renewal of the Advisory Contracts throughout the year.
The Board meets regularly and, at each of its meetings, covers an extensive agenda of topics and materials and considers factors that are relevant to its annual consideration of the renewal of the fund's Advisory Contracts, including the services and support provided to the fund and its shareholders. The Board has established four standing committees (Committees) — Operations, Audit, Fair Valuation, and Governance and Nominating — each composed of and chaired by Independent Trustees with varying backgrounds, to which the Board has assigned specific subject matter responsibilities in order to enhance effective decision-making by the Board. The Operations Committee, of which all of the Independent Trustees are members, meets regularly throughout the year and considers, among other matters, information specifically related to the annual consideration of the renewal of the fund's Advisory Contracts. The Board, acting directly and through its Committees, requests and receives information concerning the annual consideration of the renewal of the fund's Advisory Contracts. The Board also meets as needed to review matters specifically related to the Board's annual consideration of the renewal of the Advisory Contracts. Members of the Board may also meet with trustees of other Fidelity funds through ad hoc joint committees to discuss certain matters relevant to all of the Fidelity funds.
At its January 2018 meeting, the Board unanimously determined to renew the fund's Advisory Contracts. In reaching its determination, the Board considered all factors it believed relevant, including (i) the nature, extent, and quality of the services to be provided to the fund and its shareholders (including the investment performance of the fund); (ii) the competitiveness of the fund's management fee and total expense ratio relative to peer funds; (iii) the total costs of the services to be provided by and the profits to be realized by Fidelity from its relationships with the fund; and (iv) the extent to which, if any, economies of scale exist and would be realized as the fund grows, and whether any economies of scale are appropriately shared with fund shareholders.
In considering whether to renew the Advisory Contracts for the fund, the Board reached a determination, with the assistance of fund counsel and Independent Trustees' counsel and through the exercise of its business judgment, that the renewal of the Advisory Contracts was in the best interests of the fund and its shareholders and that the compensation payable under the Advisory Contracts was fair and reasonable. The Board's decision to renew the Advisory Contracts was not based on any single factor, but rather was based on a comprehensive consideration of all the information provided to the Board at its meetings throughout the year. The Board, in reaching its determination to renew the Advisory Contracts, was aware that shareholders of the fund have a broad range of investment choices available to them, including a wide choice among funds offered by Fidelity's competitors, and that the fund's shareholders, who have the opportunity to review and weigh the disclosure provided by the fund in its prospectus and other public disclosures, have chosen to invest in this fund, which is part of the Fidelity family of funds.
Amendment to Group Fee Rate. The Board also ratified an amendment to the management contract for the fund to add an additional breakpoint to the group fee schedule, which was effective October 1, 2017. The Board noted that the additional breakpoint would result in lower management fee rates to the extent that assets under management that are included in group fee calculations increase above the new breakpoint.
Nature, Extent, and Quality of Services Provided. The Board considered the staffing of the Investment Advisers as it relates to the fund, including the backgrounds of investment personnel of SelectCo, and also considered the fund's investment objective, strategies, and related investment philosophy. The Independent Trustees also had discussions with senior management of Fidelity's investment operations and investment groups. The Board considered the structure of the investment personnel compensation program and whether this structure provides appropriate incentives to act in the best interests of the fund. Additionally, the Board considered the portfolio managers' investments, if any, in the funds that they manage.Resources Dedicated to Investment Management and Support Services. The Board reviewed the general qualifications and capabilities of the Investment Advisers' investment staffs, including their size, education, experience, and resources, as well as Fidelity's approach to recruiting, training, managing, and compensating investment personnel. The Board noted that Fidelity has continued to increase the resources devoted to non-U.S. offices, including expansion of Fidelity's global investment organization. The Board also noted that Fidelity's analysts have extensive resources, tools and capabilities that allow them to conduct sophisticated quantitative and fundamental analysis, as well as credit analysis of issuers, counterparties and guarantors. Further, the Board considered that Fidelity's investment professionals have sufficient access to global information and data so as to provide competitive investment results over time, and that those professionals also have access to sophisticated tools that permit them to assess portfolio construction and risk and performance attribution characteristics continuously, as well as to transmit new information and research conclusions rapidly around the world. Additionally, in its deliberations, the Board considered Fidelity's trading, risk management, compliance, and technology and operations capabilities and resources, which are integral parts of the investment management process.Shareholder and Administrative Services. The Board considered (i) the nature, extent, quality, and cost of advisory, administrative, and shareholder services performed by the Investment Advisers and their affiliates under the Advisory Contracts and under separate agreements covering transfer agency, pricing and bookkeeping, and securities lending services for the fund; (ii) the nature and extent of the supervision of third party service providers, principally custodians, subcustodians, and pricing vendors; and (iii) the resources devoted to, and the record of compliance with, the fund's compliance policies and procedures. The Board also reviewed the allocation of fund brokerage, including allocations to brokers affiliated with the Investment Advisers, the use of brokerage commissions to pay fund expenses, and the use of "soft" commission dollars to pay for research services.The Board noted that the growth of fund assets over time across the complex allows Fidelity to reinvest in the development of services designed to enhance the value or convenience of the Fidelity funds as investment vehicles. These services include 24-hour access to account information and market information through telephone representatives and over the Internet, investor education materials and asset allocation tools, and the expanded availability of Fidelity Investor Centers.The Board noted that it and the boards of certain other Fidelity funds had formed an ad hoc Committee on Transfer Agency Fees to review the variety of transfer agency fee structures throughout the industry and Fidelity's competitive positioning with respect to industry participants.Investment in a Large Fund Family. The Board considered the benefits to shareholders of investing in a Fidelity fund, including the benefits of investing in a fund that is part of a large family of funds offering a variety of investment disciplines and providing a large variety of mutual fund investor services. The Board noted that Fidelity had taken, or had made recommendations that resulted in the Fidelity funds taking, a number of actions over the previous year that benefited particular funds, including: (i) continuing to dedicate additional resources to Fidelity's investment research process, which includes meetings with management of issuers in which the funds invest, and to the support of the senior management team that oversees asset management; (ii) continuing efforts to enhance Fidelity's global research capabilities; (iii) launching new funds and making other enhancements to meet client needs; (iv) launching new share classes of existing funds; (v) eliminating purchase minimums and broadening eligibility requirements for certain lower-priced share classes; (vi) reducing management fees and total expenses for certain growth equity funds and index funds; (vii) lowering expense caps for certain existing funds and classes to reduce expenses borne by shareholders; (viii) eliminating short-term redemption fees for certain funds; (ix) introducing a new pricing structure for certain funds of funds that is expected to reduce overall expenses paid by shareholders; (x) rationalizing product lines and gaining increased efficiencies through proposals for fund mergers and share class consolidations; (xi) continuing to develop, acquire and implement systems and technology to improve services to the funds and shareholders, strengthen information security, and increase efficiency; and (xii) implementing enhancements to further strengthen Fidelity's product line to increase investors' probability of success in achieving their investment goals, including retirement income goals.Investment Performance. The Board considered whether the fund has operated in accordance with its investment objective, as well as its record of compliance with its investment restrictions and its performance history.The Board took into account discussions with representatives of SelectCo about fund investment performance that occur at Board meetings throughout the year. In this regard the Board noted that as part of regularly scheduled fund reviews and other reports to the Board on fund performance, the Board considers annualized return information for the fund for different time periods, measured against a securities market index ("benchmark index"). In its evaluation of fund investment performance at meetings throughout the year, the Board gave particular attention to information indicating underperformance of certain Fidelity funds for specific time periods and discussed with the Investment Advisers the reasons for such underperformance.In addition to reviewing absolute and relative fund performance, the Independent Trustees periodically consider the appropriateness of fund performance metrics in evaluating the results achieved. In general, the Independent Trustees believe that fund performance should be evaluated based on net performance (after fees and expenses) of both the highest performing and lowest performing fund share classes, where applicable, compared to appropriate benchmark indices, over appropriate time periods that may include full market cycles, taking into account relevant factors, including the following: general market conditions; issuer-specific information; and fund cash flows and other factors. Depending on the circumstances, the Independent Trustees may be satisfied with a fund's performance notwithstanding that it lags its benchmark index for certain periods.The Independent Trustees recognize that shareholders evaluate performance on a net basis over their own holding periods, for which one-, three-, and five-year periods are often used as a proxy. For this reason, the performance information reviewed by the Board also included net cumulative total return information for the fund and an appropriate benchmark index for the most recent one-, three-, and five-year periods ended June 30, 2017.Based on its review, the Board concluded that the nature, extent, and quality of services provided to the fund under the Advisory Contracts should continue to benefit the shareholders of the fund.Competitiveness of Management Fee and Total Expense Ratio. The Board considered the fund's management fee and total expense ratio compared to "mapped groups" of competitive funds and classes created for the purpose of facilitating the Trustees' analysis of the competitiveness of management fees and total expenses. Fidelity creates "mapped groups" by combining similar Lipper investment objective categories that have comparable investment mandates. For this purpose, all sector focused equity variable annuity funds are grouped in the same mapped group. Combining Lipper investment objective categories aids the Board's management fee and total expense ratio comparisons by broadening the competitive group used for comparison.Management Fee. The Board considered two proprietary management fee comparisons for the 12-month periods ended June 30 shown in basis points (BP) in the chart below. The group of Lipper funds used by the Board for management fee comparisons is referred to below as the "Total Mapped Group." The Total Mapped Group comparison focuses on a fund's standing in terms of gross management fees before expense reimbursements or caps relative to the total universe of funds with comparable investment mandates (i.e., sector equities), regardless of whether their management fee structures also are comparable. Funds with comparable management fee structures have similar management fee contractual arrangements (e.g., flat rate charged for advisory services, all-inclusive fee rate, etc.). "TMG %" represents the percentage of funds in the Total Mapped Group that had management fees that were lower than the fund's. For example, a hypothetical TMG % of 20% would mean that 80% of the funds in the Total Mapped Group had higher, and 20% had lower, management fees than the fund. The fund's actual TMG %s and the number of funds in the Total Mapped Group are in the chart below. The "Asset-Size Peer Group" (ASPG) comparison focuses on a fund's standing relative to a subset of non-Fidelity funds within the Total Mapped Group that are similar in size and management fee structure. For example, if a fund is in the first quartile of the ASPG, the fund's management fee ranks in the least expensive or lowest 25% of funds in the ASPG. The ASPG represents at least 15% of the funds in the Total Mapped Group with comparable asset size and management fee structures, subject to a minimum of 50 funds (or all funds in the Total Mapped Group if fewer than 50). Additional information, such as the ASPG quartile in which the fund's management fee rate ranked, is also included in the chart and considered by the Board.VIP Health Care Portfolio
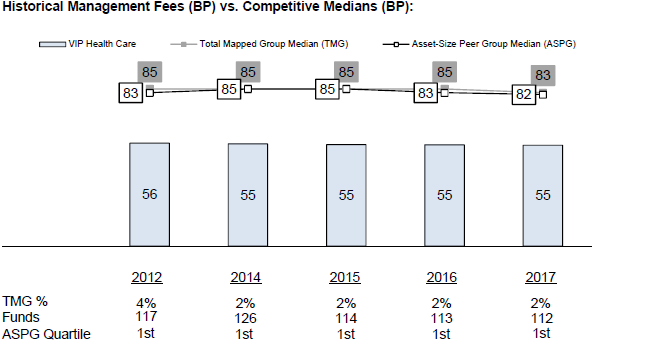
![]()
VHCIC-SANN-0818
1.817376.113
Fidelity® Variable Insurance Products: Industrials Portfolio Semi-Annual Report June 30, 2018 |
|
Contents
To view a fund's proxy voting guidelines and proxy voting record for the 12-month period ended June 30, visit http://www.fidelity.com/proxyvotingresults or visit the Securities and Exchange Commission's (SEC) web site at http://www.sec.gov.
You may also call 1-877-208-0098 to request a free copy of the proxy voting guidelines.
Fidelity® Variable Insurance Products are separate account options which are purchased through a variable insurance contract.
Standard & Poor's, S&P and S&P 500 are registered service marks of The McGraw-Hill Companies, Inc. and have been licensed for use by Fidelity Distributors Corporation.
Other third-party marks appearing herein are the property of their respective owners.
All other marks appearing herein are registered or unregistered trademarks or service marks of FMR LLC or an affiliated company. © 2018 FMR LLC. All rights reserved.
This report and the financial statements contained herein are submitted for the general information of the shareholders of the Fund. This report is not authorized for distribution to prospective investors in the Fund unless preceded or accompanied by an effective prospectus.
A fund files its complete schedule of portfolio holdings with the SEC for the first and third quarters of each fiscal year on Form N-Q. Forms N-Q are available on the SEC’s web site at http://www.sec.gov. A fund's Forms N-Q may be reviewed and copied at the SEC’s Public Reference Room in Washington, DC. Information regarding the operation of the SEC's Public Reference Room may be obtained by calling 1-800-SEC-0330.
For a complete list of a fund's portfolio holdings, view the most recent holdings listing, semiannual report, or annual report on Fidelity's web site at http://www.fidelity.com, http://www.institutional.fidelity.com, or http://www.401k.com, as applicable.
NOT FDIC INSURED •MAY LOSE VALUE •NO BANK GUARANTEE
Neither the Fund nor Fidelity Distributors Corporation is a bank.
Investment Summary (Unaudited)
Top Ten Stocks as of June 30, 2018
| % of fund's net assets | |
| United Technologies Corp. | 6.5 |
| General Electric Co. | 5.1 |
| Honeywell International, Inc. | 5.0 |
| Union Pacific Corp. | 4.4 |
| Northrop Grumman Corp. | 4.3 |
| The Boeing Co. | 3.8 |
| General Dynamics Corp. | 3.8 |
| Ingersoll-Rand PLC | 3.0 |
| FedEx Corp. | 3.0 |
| Fortive Corp. | 2.9 |
| 41.8 |
Top Industries (% of fund's net assets)
| As of June 30, 2018 | ||
| Aerospace & Defense | 28.3% | |
| Machinery | 19.9% | |
| Industrial Conglomerates | 11.4% | |
| Road & Rail | 8.5% | |
| Electrical Equipment | 6.9% | |
| All Others* | 25.0% | |
* Includes short-term investments and net other assets (liabilities).
Schedule of Investments June 30, 2018 (Unaudited)
Showing Percentage of Net Assets
| Common Stocks - 99.6% | |||
| Shares | Value | ||
| Aerospace & Defense - 28.3% | |||
| Aerospace & Defense - 28.3% | |||
| Bombardier, Inc. Class B (sub. vtg.) (a) | 717,200 | $2,836,831 | |
| General Dynamics Corp. | 40,800 | 7,605,528 | |
| Huntington Ingalls Industries, Inc. | 14,800 | 3,208,492 | |
| Moog, Inc. Class A | 14,800 | 1,153,808 | |
| Northrop Grumman Corp. | 27,500 | 8,461,750 | |
| Raytheon Co. | 24,800 | 4,790,864 | |
| Spirit AeroSystems Holdings, Inc. Class A | 26,400 | 2,268,024 | |
| Teledyne Technologies, Inc. (a) | 7,578 | 1,508,477 | |
| Textron, Inc. | 33,100 | 2,181,621 | |
| The Boeing Co. | 22,700 | 7,616,077 | |
| TransDigm Group, Inc. | 4,900 | 1,691,186 | |
| United Technologies Corp. | 102,523 | 12,818,451 | |
| 56,141,109 | |||
| Air Freight & Logistics - 4.3% | |||
| Air Freight & Logistics - 4.3% | |||
| FedEx Corp. | 26,000 | 5,903,560 | |
| XPO Logistics, Inc. (a) | 25,600 | 2,564,608 | |
| 8,468,168 | |||
| Airlines - 4.4% | |||
| Airlines - 4.4% | |||
| Allegiant Travel Co. | 4,600 | 639,170 | |
| Delta Air Lines, Inc. | 66,100 | 3,274,594 | |
| Southwest Airlines Co. | 61,000 | 3,103,680 | |
| Spirit Airlines, Inc. (a) | 49,000 | 1,781,150 | |
| 8,798,594 | |||
| Building Products - 2.2% | |||
| Building Products - 2.2% | |||
| A.O. Smith Corp. | 25,984 | 1,536,954 | |
| Masco Corp. | 76,500 | 2,862,630 | |
| 4,399,584 | |||
| Commercial Services & Supplies - 3.4% | |||
| Diversified Support Services - 1.7% | |||
| Cintas Corp. | 17,800 | 3,294,246 | |
| Environmental & Facility Services - 1.7% | |||
| Waste Connection, Inc. (United States) | 45,700 | 3,440,296 | |
| TOTAL COMMERCIAL SERVICES & SUPPLIES | 6,734,542 | ||
| Construction & Engineering - 3.9% | |||
| Construction & Engineering - 3.9% | |||
| Fluor Corp. | 52,400 | 2,556,072 | |
| Jacobs Engineering Group, Inc. | 53,400 | 3,390,366 | |
| KBR, Inc. | 103,000 | 1,845,760 | |
| 7,792,198 | |||
| Electrical Equipment - 6.9% | |||
| Electrical Components & Equipment - 6.5% | |||
| Acuity Brands, Inc. | 7,600 | 880,612 | |
| AMETEK, Inc. | 29,000 | 2,092,640 | |
| Emerson Electric Co. | 59,100 | 4,086,174 | |
| Fortive Corp. | 75,292 | 5,805,766 | |
| 12,865,192 | |||
| Heavy Electrical Equipment - 0.4% | |||
| Melrose Industries PLC | 308,536 | 866,094 | |
| TOTAL ELECTRICAL EQUIPMENT | 13,731,286 | ||
| Industrial Conglomerates - 11.4% | |||
| Industrial Conglomerates - 11.4% | |||
| 3M Co. | 1,100 | 216,392 | |
| General Electric Co. | 751,446 | 10,227,180 | |
| Honeywell International, Inc. | 68,527 | 9,871,314 | |
| ITT, Inc. | 44,500 | 2,326,015 | |
| 22,640,901 | |||
| Machinery - 19.9% | |||
| Agricultural & Farm Machinery - 2.0% | |||
| Deere & Co. | 27,700 | 3,872,460 | |
| Construction Machinery & Heavy Trucks - 6.5% | |||
| Allison Transmission Holdings, Inc. | 111,200 | 4,502,488 | |
| Caterpillar, Inc. | 38,100 | 5,169,027 | |
| WABCO Holdings, Inc. (a) | 11,700 | 1,369,134 | |
| Wabtec Corp. | 19,700 | 1,942,026 | |
| 12,982,675 | |||
| Industrial Machinery - 11.4% | |||
| Flowserve Corp. | 35,200 | 1,422,080 | |
| Gardner Denver Holdings, Inc. (a) | 117,900 | 3,465,081 | |
| IDEX Corp. | 9,340 | 1,274,723 | |
| Ingersoll-Rand PLC | 66,500 | 5,967,045 | |
| Lincoln Electric Holdings, Inc. | 15,300 | 1,342,728 | |
| Parker Hannifin Corp. | 14,900 | 2,322,165 | |
| Snap-On, Inc. | 28,100 | 4,516,232 | |
| The Weir Group PLC | 36,300 | 958,138 | |
| Xylem, Inc. | 20,400 | 1,374,552 | |
| 22,642,744 | |||
| TOTAL MACHINERY | 39,497,879 | ||
| Professional Services - 3.4% | |||
| Research & Consulting Services - 3.4% | |||
| IHS Markit Ltd. (a) | 79,710 | 4,112,239 | |
| Nielsen Holdings PLC | 83,200 | 2,573,376 | |
| 6,685,615 | |||
| Road & Rail - 8.5% | |||
| Railroads - 7.2% | |||
| Genesee & Wyoming, Inc. Class A (a) | 20,200 | 1,642,664 | |
| Norfolk Southern Corp. | 26,200 | 3,952,794 | |
| Union Pacific Corp. | 61,000 | 8,642,480 | |
| 14,237,938 | |||
| Trucking - 1.3% | |||
| J.B. Hunt Transport Services, Inc. | 11,146 | 1,354,796 | |
| Knight-Swift Transportation Holdings, Inc. Class A | 33,500 | 1,280,035 | |
| 2,634,831 | |||
| TOTAL ROAD & RAIL | 16,872,769 | ||
| Specialty Retail - 1.0% | |||
| Home Improvement Retail - 1.0% | |||
| Lowe's Companies, Inc. | 21,000 | 2,006,970 | |
| Trading Companies & Distributors - 2.0% | |||
| Trading Companies & Distributors - 2.0% | |||
| Bunzl PLC | 54,100 | 1,638,595 | |
| Univar, Inc. (a) | 83,900 | 2,201,536 | |
| 3,840,131 | |||
| TOTAL COMMON STOCKS | |||
| (Cost $157,671,615) | 197,609,746 | ||
| Nonconvertible Preferred Stocks - 0.3% | |||
| Airlines - 0.3% | |||
| Airlines - 0.3% | |||
| Azul SA (a) | |||
| (Cost $768,367) | 86,800 | 477,700 | |
| Money Market Funds - 0.1% | |||
| Fidelity Cash Central Fund, 1.93% (b) | |||
| (Cost $262,435) | 262,382 | 262,435 | |
| TOTAL INVESTMENT IN SECURITIES - 100.0% | |||
| (Cost $158,702,417) | 198,349,881 | ||
| NET OTHER ASSETS (LIABILITIES) - 0.0% | 5,081 | ||
| NET ASSETS - 100% | $198,354,962 |
Legend
(a) Non-income producing
(b) Affiliated fund that is generally available only to investment companies and other accounts managed by Fidelity Investments. The rate quoted is the annualized seven-day yield of the fund at period end. A complete unaudited listing of the fund's holdings as of its most recent quarter end is available upon request. In addition, each Fidelity Central Fund's financial statements are available on the SEC's website or upon request.
Affiliated Central Funds
Information regarding fiscal year to date income earned by the Fund from investments in Fidelity Central Funds is as follows:
| Fund | Income earned |
| Fidelity Cash Central Fund | $13,806 |
| Fidelity Securities Lending Cash Central Fund | 4,357 |
| Total | $18,163 |
Amounts in the income column in the above table include any capital gain distributions from underlying funds, which are presented in the corresponding line-item in the Statement of Operations if applicable.
Investment Valuation
All investments are categorized as Level 1 under the Fair Value Hierarchy. The inputs or methodology used for valuing securities may not be an indication of the risk associated with investing in those securities. For more information on valuation inputs please refer to the Investment Valuation section in the accompanying Notes to Financial Statements.
Other Information
Distribution of investments by country or territory of incorporation, as a percentage of Total Net Assets, is as follows (Unaudited):
| United States of America | 88.4% |
| Canada | 3.1% |
| United Kingdom | 3.1% |
| Ireland | 3.0% |
| Bermuda | 2.1% |
| Others (Individually Less Than 1%) | 0.3% |
| 100.0% |
See accompanying notes which are an integral part of the financial statements.
Financial Statements
Statement of Assets and Liabilities
| June 30, 2018 (Unaudited) | ||
| Assets | ||
| Investment in securities, at value — See accompanying schedule: Unaffiliated issuers (cost $158,439,982) | $198,087,446 | |
| Fidelity Central Funds (cost $262,435) | 262,435 | |
| Total Investment in Securities (cost $158,702,417) | $198,349,881 | |
| Cash | 186 | |
| Receivable for fund shares sold | 6,501 | |
| Dividends receivable | 190,917 | |
| Distributions receivable from Fidelity Central Funds | 1,747 | |
| Prepaid expenses | 1,808 | |
| Other receivables | 3,535 | |
| Total assets | 198,554,575 | |
| Liabilities | ||
| Payable for fund shares redeemed | $52,713 | |
| Accrued management fee | 93,216 | |
| Transfer agent fee payable | 22,311 | |
| Other affiliated payables | 6,713 | |
| Audit fees payable | 20,183 | |
| Other payables and accrued expenses | 4,477 | |
| Total liabilities | 199,613 | |
| Net Assets | $198,354,962 | |
| Net Assets consist of: | ||
| Paid in capital | $147,827,553 | |
| Undistributed net investment income | 760,503 | |
| Accumulated undistributed net realized gain (loss) on investments and foreign currency transactions | 10,119,763 | |
| Net unrealized appreciation (depreciation) on investments and assets and liabilities in foreign currencies | 39,647,143 | |
| Net Assets | $198,354,962 | |
| Initial Class: | ||
| Net Asset Value, offering price and redemption price per share ($39,101,735 ÷ 1,767,606 shares) | $22.12 | |
| Investor Class: | ||
| Net Asset Value, offering price and redemption price per share ($159,253,227 ÷ 7,250,799 shares) | $21.96 |
See accompanying notes which are an integral part of the financial statements.
Statement of Operations
| Six months ended June 30, 2018 (Unaudited) | ||
| Investment Income | ||
| Dividends | $1,521,494 | |
| Income from Fidelity Central Funds | 18,163 | |
| Total income | 1,539,657 | |
| Expenses | ||
| Management fee | $581,835 | |
| Transfer agent fees | 137,601 | |
| Accounting and security lending fees | 42,093 | |
| Custodian fees and expenses | 6,334 | |
| Independent trustees' fees and expenses | 1,034 | |
| Audit | 20,183 | |
| Legal | 2,210 | |
| Miscellaneous | (1,320) | |
| Total expenses before reductions | 789,970 | |
| Expense reductions | (10,549) | |
| Total expenses after reductions | 779,421 | |
| Net investment income (loss) | 760,236 | |
| Realized and Unrealized Gain (Loss) | ||
| Net realized gain (loss) on: | ||
| Investment securities: | ||
| Unaffiliated issuers | 10,237,600 | |
| Fidelity Central Funds | 82 | |
| Foreign currency transactions | (3,558) | |
| Total net realized gain (loss) | 10,234,124 | |
| Change in net unrealized appreciation (depreciation) on: | ||
| Investment securities: | ||
| Unaffiliated issuers | (18,238,733) | |
| Fidelity Central Funds | (88) | |
| Assets and liabilities in foreign currencies | (321) | |
| Total change in net unrealized appreciation (depreciation) | (18,239,142) | |
| Net gain (loss) | (8,005,018) | |
| Net increase (decrease) in net assets resulting from operations | $(7,244,782) |
See accompanying notes which are an integral part of the financial statements.
Statement of Changes in Net Assets
| Six months ended June 30, 2018 (Unaudited) | Year ended December 31, 2017 | |
| Increase (Decrease) in Net Assets | ||
| Operations | ||
| Net investment income (loss) | $760,236 | $1,332,560 |
| Net realized gain (loss) | 10,234,124 | 9,395,506 |
| Change in net unrealized appreciation (depreciation) | (18,239,142) | 25,929,207 |
| Net increase (decrease) in net assets resulting from operations | (7,244,782) | 36,657,273 |
| Distributions to shareholders from net investment income | (216,427) | (1,349,019) |
| Distributions to shareholders from net realized gain | (8,117,247) | (9,072,190) |
| Total distributions | (8,333,674) | (10,421,209) |
| Share transactions - net increase (decrease) | (4,916,819) | (1,684,948) |
| Redemption fees | – | 9,710 |
| Total increase (decrease) in net assets | (20,495,275) | 24,560,826 |
| Net Assets | ||
| Beginning of period | 218,850,237 | 194,289,411 |
| End of period | $198,354,962 | $218,850,237 |
| Other Information | ||
| Undistributed net investment income end of period | $760,503 | $216,694 |
See accompanying notes which are an integral part of the financial statements.
Financial Highlights
VIP Industrials Portfolio Initial Class
| Six months ended (Unaudited) June 30, | Years endedDecember 31, | |||||
| June 30, February 28, | 2018 | 2017 | 2016 | 2015 | 2014 | 2013 |
| Selected Per–Share Data | ||||||
| Net asset value, beginning of period | $23.85 | $20.88 | $20.25 | $22.92 | $22.17 | $16.88 |
| Income from Investment Operations | ||||||
| Net investment income (loss)A | .09 | .16 | .18 | .17 | .18 | .17 |
| Net realized and unrealized gain (loss) | (.91) | 3.91 | 2.50 | (.55) | 1.17 | 6.48 |
| Total from investment operations | (.82) | 4.07 | 2.68 | (.38) | 1.35 | 6.65 |
| Distributions from net investment income | (.03) | (.16) | (.13) | (.18) | (.20) | (.16) |
| Distributions from net realized gain | (.89) | (.94) | (1.92) | (2.11) | (.40) | (1.20) |
| Total distributions | (.91)B | (1.10) | (2.05) | (2.29) | (.60) | (1.36) |
| Redemption fees added to paid in capitalA | – | –C | –C | –C | –C | –C |
| Net asset value, end of period | $22.12 | $23.85 | $20.88 | $20.25 | $22.92 | $22.17 |
| Total ReturnD,E,F | (3.45)% | 20.15% | 15.87% | (1.89)% | 6.21% | 39.80% |
| Ratios to Average Net AssetsG,H | ||||||
| Expenses before reductions | .67%I | .69% | .70% | .69% | .69% | .72% |
| Expenses net of fee waivers, if any | .67%I | .68% | .70% | .69% | .69% | .72% |
| Expenses net of all reductions | .66%I | .68% | .69% | .69% | .69% | .72% |
| Net investment income (loss) | .77%I | .72% | .94% | .83% | .81% | .84% |
| Supplemental Data | ||||||
| Net assets, end of period (000 omitted) | $39,102 | $44,205 | $42,322 | $35,852 | $46,692 | $55,234 |
| Portfolio turnover rateJ | 65%I | 64% | 62% | 69% | 70% | 64% |
A Calculated based on average shares outstanding during the period.
B Total distributions of $0.91 per share is comprised of distributions from net investment income of $.026 and distributions from net realized gain of $.885 per share.
C Amount represents less than $.005 per share.
D Total returns for periods of less than one year are not annualized.
E Total returns do not reflect charges attributable to your insurance company's separate account. Inclusion of these charges would reduce the total returns shown.
F Total returns would have been lower if certain expenses had not been reduced during the applicable periods shown.
G Fees and expenses of any underlying Fidelity Central Funds are not included in the Fund's expense ratio. The Fund indirectly bears its proportionate share of the expenses of any underlying Fidelity Central Funds.
H Expense ratios reflect operating expenses of the class. Expenses before reductions do not reflect amounts reimbursed or waived by the investment adviser or reductions from brokerage service arrangements or reductions from other expense offset arrangements and do not represent the amount paid by the class during periods when reimbursements, waivers or reductions occur. Expenses net of fee waivers reflect expenses after reimbursement and waivers by the investment adviser but prior to reductions from brokerage service arrangements or other expense offset arrangements. Expenses net of all reductions represent the net expenses paid by the class.
I Annualized
J Amount does not include the portfolio activity of any underlying Fidelity Central Funds.
See accompanying notes which are an integral part of the financial statements.
VIP Industrials Portfolio Investor Class
| Six months ended (Unaudited) June 30, | Years endedDecember 31, | |||||
| June 30, February 28, | 2018 | 2017 | 2016 | 2015 | 2014 | 2013 |
| Selected Per–Share Data | ||||||
| Net asset value, beginning of period | $23.69 | $20.75 | $20.15 | $22.82 | $22.07 | $16.81 |
| Income from Investment Operations | ||||||
| Net investment income (loss)A | .08 | .14 | .16 | .16 | .16 | .15 |
| Net realized and unrealized gain (loss) | (.90) | 3.88 | 2.48 | (.56) | 1.17 | 6.46 |
| Total from investment operations | (.82) | 4.02 | 2.64 | (.40) | 1.33 | 6.61 |
| Distributions from net investment income | (.02) | (.15) | (.12) | (.17) | (.18) | (.15) |
| Distributions from net realized gain | (.89) | (.94) | (1.92) | (2.11) | (.40) | (1.20) |
| Total distributions | (.91) | (1.08)B | (2.04) | (2.27)C | (.58) | (1.35) |
| Redemption fees added to paid in capitalA | – | –D | –D | –D | –D | –D |
| Net asset value, end of period | $21.96 | $23.69 | $20.75 | $20.15 | $22.82 | $22.07 |
| Total ReturnE,F,G | (3.49)% | 20.05% | 15.73% | (1.97)% | 6.16% | 39.72% |
| Ratios to Average Net AssetsH,I | ||||||
| Expenses before reductions | .75%J | .77% | .78% | .77% | .77% | .80% |
| Expenses net of fee waivers, if any | .75%J | .77% | .78% | .77% | .77% | .80% |
| Expenses net of all reductions | .74%J | .76% | .77% | .77% | .77% | .79% |
| Net investment income (loss) | .69%J | .64% | .86% | .76% | .73% | .77% |
| Supplemental Data | ||||||
| Net assets, end of period (000 omitted) | $159,253 | $174,645 | $151,967 | $110,411 | $126,131 | $136,117 |
| Portfolio turnover rateK | 65%J | 64% | 62% | 69% | 70% | 64% |
A Calculated based on average shares outstanding during the period.
B Total distributions of $1.08 per share is comprised of distributions from net investment income of $.145 and distributions from net realized gain of $.937 per share.
C Total distributions of $2.27 per share is comprised of distributions from net investment income of $.166 and distributions from net realized gain of $2.105 per share.
D Amount represents less than $.005 per share.
E Total returns for periods of less than one year are not annualized.
F Total returns do not reflect charges attributable to your insurance company's separate account. Inclusion of these charges would reduce the total returns shown.
G Total returns would have been lower if certain expenses had not been reduced during the applicable periods shown.
H Fees and expenses of any underlying Fidelity Central Funds are not included in the Fund's expense ratio. The Fund indirectly bears its proportionate share of the expenses of any underlying Fidelity Central Funds.
I Expense ratios reflect operating expenses of the class. Expenses before reductions do not reflect amounts reimbursed or waived by the investment adviser or reductions from brokerage service arrangements or reductions from other expense offset arrangements and do not represent the amount paid by the class during periods when reimbursements, waivers or reductions occur. Expenses net of fee waivers reflect expenses after reimbursement and waivers by the investment adviser but prior to reductions from brokerage service arrangements or other expense offset arrangements. Expenses net of all reductions represent the net expenses paid by the class.
J Annualized
K Amount does not include the portfolio activity of any underlying Fidelity Central Funds.
See accompanying notes which are an integral part of the financial statements.
Notes to Financial Statements (Unaudited)
For the period ended June 30, 2018
1. Organization.
VIP Industrials Portfolio (the Fund) is a non-diversified fund of Variable Insurance Products Fund IV (the Trust) and is authorized to issue an unlimited number of shares. The Trust is registered under the Investment Company Act of 1940, as amended (the 1940 Act), as an open-end management investment company organized as a Massachusetts business trust. Shares of the Fund may only be purchased by insurance companies for the purpose of funding variable annuity or variable life insurance contracts. The Fund offers the following classes of shares: Initial Class shares and Investor Class shares. All classes have equal rights and voting privileges, except for matters affecting a single class.
2. Investments in Fidelity Central Funds.
The Fund invests in Fidelity Central Funds, which are open-end investment companies generally available only to other investment companies and accounts managed by the investment adviser and its affiliates. The Fund's Schedule of Investments lists each of the Fidelity Central Funds held as of period end, if any, as an investment of the Fund, but does not include the underlying holdings of each Fidelity Central Fund. As an Investing Fund, the Fund indirectly bears its proportionate share of the expenses of the underlying Fidelity Central Funds.
The Money Market Central Funds seek preservation of capital and current income and are managed by Fidelity Investments Money Management, Inc. (FIMM), an affiliate of the investment adviser. Annualized expenses of the Money Market Central Funds as of their most recent shareholder report date are less than .005%.
A complete unaudited list of holdings for each Fidelity Central Fund is available upon request or at the Securities and Exchange Commission (the SEC) website at www.sec.gov. In addition, the financial statements of the Fidelity Central Funds are available on the SEC website or upon request.
3. Significant Accounting Policies.
The Fund is an investment company and applies the accounting and reporting guidance of the Financial Accounting Standards Board (FASB) Accounting Standards Codification Topic 946 Financial Services – Investments Companies. The financial statements have been prepared in conformity with accounting principles generally accepted in the United States of America (GAAP), which require management to make certain estimates and assumptions at the date of the financial statements. Actual results could differ from those estimates. Subsequent events, if any, through the date that the financial statements were issued have been evaluated in the preparation of the financial statements. The following summarizes the significant accounting policies of the Fund:
Investment Valuation. Investments are valued as of 4:00 p.m. Eastern time on the last calendar day of the period. The Board of Trustees (the Board) has delegated the day to day responsibility for the valuation of the Fund's investments to the Fair Value Committee (the Committee) established by the Fund's investment adviser. In accordance with valuation policies and procedures approved by the Board, the Fund attempts to obtain prices from one or more third party pricing vendors or brokers to value its investments. When current market prices, quotations or currency exchange rates are not readily available or reliable, investments will be fair valued in good faith by the Committee, in accordance with procedures adopted by the Board. Factors used in determining fair value vary by investment type and may include market or investment specific events. The frequency with which these procedures are used cannot be predicted and they may be utilized to a significant extent. The Committee oversees the Fund's valuation policies and procedures and reports to the Board on the Committee's activities and fair value determinations. The Board monitors the appropriateness of the procedures used in valuing the Fund's investments and ratifies the fair value determinations of the Committee.
The Fund categorizes the inputs to valuation techniques used to value its investments into a disclosure hierarchy consisting of three levels as shown below:
- Level 1 – quoted prices in active markets for identical investments
- Level 2 – other significant observable inputs (including quoted prices for similar investments, interest rates, prepayment speeds, etc.)
- Level 3 – unobservable inputs (including the Fund's own assumptions based on the best information available)
Valuation techniques used to value the Fund's investments by major category are as follows:
Equity securities, including restricted securities, for which market quotations are readily available, are valued at the last reported sale price or official closing price as reported by a third party pricing vendor on the primary market or exchange on which they are traded and are categorized as Level 1 in the hierarchy. In the event there were no sales during the day or closing prices are not available, securities are valued at the last quoted bid price or may be valued using the last available price and are generally categorized as Level 2 in the hierarchy. For foreign equity securities, when market or security specific events arise, comparisons to the valuation of American Depositary Receipts (ADRs), futures contracts, Exchange-Traded Funds (ETFs) and certain indexes as well as quoted prices for similar securities may be used and would be categorized as Level 2 in the hierarchy. Utilizing these techniques may result in transfers between Level 1 and Level 2. For equity securities, including restricted securities, where observable inputs are limited, assumptions about market activity and risk are used and these securities may be categorized as Level 3 in the hierarchy.
Investments in open-end mutual funds, including the Fidelity Central Funds, are valued at their closing net asset value (NAV) each business day and are categorized as Level 1 in the hierarchy.
Changes in valuation techniques may result in transfers in or out of an assigned level within the disclosure hierarchy.
Foreign Currency. The Fund may use foreign currency contracts to facilitate transactions in foreign-denominated securities. Gains and losses from these transactions may arise from changes in the value of the foreign currency or if the counterparties do not perform under the contracts' terms.
Foreign-denominated assets, including investment securities, and liabilities are translated into U.S. dollars at the exchange rates at period end. Purchases and sales of investment securities, income and dividends received and expenses denominated in foreign currencies are translated into U.S. dollars at the exchange rate in effect on the transaction date.
The effects of exchange rate fluctuations on investments are included with the net realized and unrealized gain (loss) on investment securities. Other foreign currency transactions resulting in realized and unrealized gain (loss) are disclosed separately.
Investment Transactions and Income. For financial reporting purposes, the Fund's investment holdings and NAV include trades executed through the end of the last business day of the period. The NAV per share for processing shareholder transactions is calculated as of the close of business of the New York Stock Exchange (NYSE), normally 4:00 p.m. Eastern time and includes trades executed through the end of the prior business day. Gains and losses on securities sold are determined on the basis of identified cost and include proceeds received from litigation. Dividend income is recorded on the ex-dividend date, except for certain dividends from foreign securities where the ex-dividend date may have passed, which are recorded as soon as the Fund is informed of the ex-dividend date. Non-cash dividends included in dividend income, if any, are recorded at the fair market value of the securities received. Income and capital gain distributions from Fidelity Central Funds, if any, are recorded on the ex-dividend date. Certain distributions received by the Fund represent a return of capital or capital gain. The Fund determines the components of these distributions subsequent to the ex-dividend date, based upon receipt of tax filings or other correspondence relating to the underlying investment. These distributions are recorded as a reduction of cost of investments and/or as a realized gain. Investment income is recorded net of foreign taxes withheld where recovery of such taxes is uncertain.
Class Allocations and Expenses. Investment income, realized and unrealized capital gains and losses, common expenses of the Fund, and certain fund-level expense reductions, if any, are allocated daily on a pro-rata basis to each class based on the relative net assets of each class to the total net assets of the Fund. Each class differs with respect to transfer agent fees incurred. Certain expense reductions may also differ by class. For the reporting period, the allocated portion of income and expenses to each class as a percent of its average net assets may vary due to the timing of recording these transactions in relation to fluctuating net assets of the classes. Expenses directly attributable to a fund are charged to that fund. Expenses attributable to more than one fund are allocated among the respective funds on the basis of relative net assets or other appropriate methods. Expense estimates are accrued in the period to which they relate and adjustments are made when actual amounts are known.
Income Tax Information and Distributions to Shareholders. Each year, the Fund intends to qualify as a regulated investment company under Subchapter M of the Internal Revenue Code, including distributing substantially all of its taxable income and realized gains. As a result, no provision for U.S. Federal income taxes is required. The Fund files a U.S. federal tax return, in addition to state and local tax returns as required. The Fund's federal income tax returns are subject to examination by the Internal Revenue Service (IRS) for a period of three fiscal years after they are filed. State and local tax returns may be subject to examination for an additional fiscal year depending on the jurisdiction. Foreign taxes are provided for based on the Fund's understanding of the tax rules and rates that exist in the foreign markets in which it invests.
Distributions are declared and recorded on the ex-dividend date. Income and capital gain distributions are declared separately for each class. Income and capital gain distributions are determined in accordance with income tax regulations, which may differ from GAAP.
Capital accounts within the financial statements are adjusted for permanent book-tax differences. These adjustments have no impact on net assets or the results of operations. Capital accounts are not adjusted for temporary book-tax differences which will reverse in a subsequent period.
Book-tax differences are primarily due to foreign currency transactions and losses deferred due to wash sales.
As of period end, the cost and unrealized appreciation (depreciation) in securities, and derivatives if applicable, for federal income tax purposes were as follows:
| Gross unrealized appreciation | $44,699,964 |
| Gross unrealized depreciation | (5,473,253) |
| Net unrealized appreciation (depreciation) | $39,226,711 |
| Tax cost | $159,123,170 |
4. Purchases and Sales of Investments.
Purchases and sales of securities, other than short-term securities, aggregated $68,437,685 and $78,962,246, respectively.
5. Fees and Other Transactions with Affiliates.
Management Fee. Fidelity SelectCo, LLC (the investment adviser) and its affiliates provide the Fund with investment management related services for which the Fund pays a monthly management fee. The management fee is the sum of an individual fund fee rate that is based on an annual rate of .30% of the Fund's average net assets and an annualized group fee rate that averaged .24% during the period. The group fee rate is based upon the average net assets of all the mutual funds advised by Fidelity Management & Research Company (FMR) and the investment adviser. The group fee rate decreases as assets under management increase and increases as assets under management decrease. For the reporting period, the total annualized management fee rate was .54% of the Fund's average net assets.
Transfer Agent Fees. Fidelity Investments Institutional Operations Company, Inc. (FIIOC), an affiliate of the investment adviser, is the Fund's transfer, dividend disbursing, and shareholder servicing agent. FIIOC receives an asset-based fee with respect to each class. Each class pays a fee for transfer agent services, typesetting and printing and mailing of shareholder reports, excluding mailing of proxy statements, equal to an annual rate of class-level average net assets. The annual rate for Investor Class is .15% and the annual rate for all other classes is .07%. For the period, transfer agent fees for each class were as follows:
| Initial Class | $13,721 |
| Investor Class | 123,880 |
| $137,601 |
Accounting and Security Lending Fees. Fidelity Service Company, Inc. (FSC), an affiliate of the investment adviser, maintains the Fund's accounting records. The accounting fee is based on the level of average net assets for each month. Under a separate contract, FSC administers the security lending program. The security lending fee is based on the number and duration of lending transactions. For the period, the fees were equivalent to an annualized rate of .04%.
Brokerage Commissions. The Fund placed a portion of its portfolio transactions with brokerage firms which are affiliates of the investment adviser. Brokerage commissions are included in net realized gain (loss) and change in net unrealized appreciation (depreciation) in the Statement of Operations. The commissions paid to these affiliated firms were $1,791 for the period.
Interfund Trades. The Fund may purchase from or sell securities to other Fidelity Funds under procedures adopted by the Board. The procedures have been designed to ensure these interfund trades are executed in accordance with Rule 17a-7 of the 1940 Act. Interfund trades are included within the respective purchases and sales amounts shown in the Purchases and Sales of Investments note.
6. Committed Line of Credit.
The Fund participates with other funds managed by the investment adviser or an affiliate in a $4.25 billion credit facility (the "line of credit") to be utilized for temporary or emergency purposes to fund shareholder redemptions or for other short-term liquidity purposes. The Fund has agreed to pay commitment fees on its pro-rata portion of the line of credit, which amounted to $301 and is reflected in Miscellaneous expenses on the Statement of Operations. During the period, the Fund did not borrow on this line of credit.
7. Security Lending.
The Fund lends portfolio securities through a lending agent from time to time in order to earn additional income. On the settlement date of the loan, the Fund receives collateral (in the form of U.S. Treasury obligations, letters of credit and/or cash) against the loaned securities and maintains collateral in an amount not less than 100% of the market value of the loaned securities during the period of the loan. The market value of the loaned securities is determined at the close of business of the Fund and any additional required collateral is delivered to the Fund on the next business day. The Fund or borrower may terminate the loan at any time, and if the borrower defaults on its obligation to return the securities loaned because of insolvency or other reasons, the Fund may apply collateral received from the borrower against the obligation. The Fund may experience delays and costs in recovering the securities loaned. Any cash collateral received is invested in the Fidelity Securities Lending Cash Central Fund. At period end, there were no security loans outstanding. Security lending income represents the income earned on investing cash collateral, less rebates paid to borrowers and any lending agent fees associated with the loan, plus any premium payments received for lending certain types of securities. Security lending income is presented in the Statement of Operations as a component of income from Fidelity Central Funds. Total security lending income during the period amounted to $4,357.
8. Expense Reductions.
Commissions paid to certain brokers with whom the investment adviser, or its affiliates, places trades on behalf of the Fund include an amount in addition to trade execution, which may be rebated back to the Fund to offset certain expenses. This amount totaled $9,506 for the period. In addition, through arrangements with the Fund's custodian, credits realized as a result of certain uninvested cash balances were used to reduce the Fund's expenses. During the period, these credits reduced the Fund's custody expenses by $85.
In addition, during the period the investment adviser reimbursed and/or waived a portion of fund-level operating expenses in the amount of $958.
9. Distributions to Shareholders.
Distributions to shareholders of each class were as follows:
| Six months ended June 30, 2018 | Year ended December 31, 2017 | |
| From net investment income | ||
| Initial Class | $47,405 | $298,116 |
| Investor Class | 169,022 | 1,050,903 |
| Total | $216,427 | $1,349,019 |
| From net realized gain | ||
| Initial Class | $1,613,579 | $1,894,536 |
| Investor Class | 6,503,668 | 7,177,654 |
| Total | $8,117,247 | $9,072,190 |
10. Share Transactions.
Transactions for each class of shares were as follows:
| Shares | Shares | Dollars | Dollars | |
| Six months ended June 30, 2018 | Year ended December 31, 2017 | Six months ended June 30, 2018 | Year ended December 31, 2017 | |
| Initial Class | ||||
| Shares sold | 39,174 | 205,198 | $924,901 | $4,489,427 |
| Reinvestment of distributions | 74,752 | 102,942 | 1,660,984 | 2,192,652 |
| Shares redeemed | (199,790) | (481,745) | (4,627,361) | (10,255,941) |
| Net increase (decrease) | (85,864) | (173,605) | $(2,041,476) | $(3,573,862) |
| Investor Class | ||||
| Shares sold | 411,421 | 1,534,565 | $9,783,778 | $33,316,997 |
| Reinvestment of distributions | 302,342 | 388,964 | 6,672,690 | 8,228,557 |
| Shares redeemed | (834,291) | (1,876,036) | (19,331,811) | (39,656,640) |
| Net increase (decrease) | (120,528) | 47,493 | $(2,875,343) | $1,888,914 |
11. Other.
The Fund's organizational documents provide former and current trustees and officers with a limited indemnification against liabilities arising in connection with the performance of their duties to the Fund. In the normal course of business, the Fund may also enter into contracts that provide general indemnifications. The Fund's maximum exposure under these arrangements is unknown as this would be dependent on future claims that may be made against the Fund. The risk of material loss from such claims is considered remote.
At the end of the period, the investment adviser or its affiliates were the owners of record of 100% of the total outstanding shares of the Fund.
Shareholder Expense Example
As a shareholder of the Fund, you incur two types of costs: (1) transaction costs and (2) ongoing costs, including management fees and other Fund expenses. This Example is intended to help you understand your ongoing costs (in dollars) of investing in the Fund and to compare these costs with the ongoing costs of investing in other mutual funds.
The Example is based on an investment of $1,000 invested at the beginning of the period and held for the entire period (January 1, 2018 to June 30, 2018).
Actual Expenses
The first line of the accompanying table for each class of the Fund provides information about actual account values and actual expenses. You may use the information in this line, together with the amount you invested, to estimate the expenses that you paid over the period. Simply divide your account value by $1,000.00 (for example, an $8,600 account value divided by $1,000.00 = 8.6), then multiply the result by the number in the first line for a class of the Fund under the heading entitled "Expenses Paid During Period" to estimate the expenses you paid on your account during this period. The estimate of expenses does not include any fees or other expenses of any variable annuity or variable life insurance product. If they were, the estimate of expenses you paid during the period would be higher, and your ending account value would be lower. In addition, the Fund, as a shareholder in the underlying Fidelity Central Funds, will indirectly bear its pro-rata share of the fees and expenses incurred by the underlying Fidelity Central Funds. These fees and expenses are not included in the Fund's annualized expense ratio used to calculate the expense estimate in the table below.
Hypothetical Example for Comparison Purposes
The second line of the accompanying table for each class of the Fund provides information about hypothetical account values and hypothetical expenses based on a Class' actual expense ratio and an assumed rate of return of 5% per year before expenses, which is not the Class' actual return. The hypothetical account values and expenses may not be used to estimate the actual ending account balance or expenses you paid for the period. You may use this information to compare the ongoing costs of investing in the Fund and other funds. To do so, compare this 5% hypothetical example with the 5% hypothetical examples that appear in the shareholder reports of the other funds. The estimate of expenses does not include any fees or other expenses of any variable annuity or variable life insurance product. If they were, the estimate of expenses you paid during the period would be higher, and your ending account value would be lower. In addition, the Fund, as a shareholder in the underlying Fidelity Central Funds, will indirectly bear its pro-rata share of the fees and expenses incurred by the underlying Fidelity Central Funds. These fees and expenses are not included in the Fund's annualized expense ratio used to calculate the expense estimate in the table below.
Please note that the expenses shown in the table are meant to highlight your ongoing costs only and do not reflect any transaction costs. Therefore, the second line of the table is useful in comparing ongoing costs only, and will not help you determine the relative total costs of owning different funds.
| Annualized Expense Ratio-A | Beginning Account Value January 1, 2018 | Ending Account Value June 30, 2018 | Expenses Paid During Period-B January 1, 2018 to June 30, 2018 | |
| Initial Class | .67% | |||
| Actual | $1,000.00 | $965.50 | $3.27 | |
| Hypothetical-C | $1,000.00 | $1,021.47 | $3.36 | |
| Investor Class | .75% | |||
| Actual | $1,000.00 | $965.10 | $3.65 | |
| Hypothetical-C | $1,000.00 | $1,021.08 | $3.76 |
A Annualized expense ratio reflects expenses net of applicable fee waivers.
B Expenses are equal to each Class' annualized expense ratio, multiplied by the average account value over the period, multiplied by 181/365 (to reflect the one-half year period).
C 5% return per year before expenses
Board Approval of Investment Advisory Contracts and Management Fees
VIP Industrials Portfolio
Each year, the Board of Trustees, including the Independent Trustees (together, the Board), votes on the renewal of the management contract with Fidelity SelectCo, LLC (SelectCo), an affiliate of Fidelity Management & Research Company (FMR), and the sub-advisory agreements with affiliates of FMR (together, the Advisory Contracts) for the fund. SelectCo and the sub-advisers are collectively referred to herein as the Investment Advisers. The Board, assisted by the advice of fund counsel and Independent Trustees' counsel, requests and considers a broad range of information relevant to the renewal of the Advisory Contracts throughout the year.
The Board meets regularly and, at each of its meetings, covers an extensive agenda of topics and materials and considers factors that are relevant to its annual consideration of the renewal of the fund's Advisory Contracts, including the services and support provided to the fund and its shareholders. The Board has established four standing committees (Committees) — Operations, Audit, Fair Valuation, and Governance and Nominating — each composed of and chaired by Independent Trustees with varying backgrounds, to which the Board has assigned specific subject matter responsibilities in order to enhance effective decision-making by the Board. The Operations Committee, of which all of the Independent Trustees are members, meets regularly throughout the year and considers, among other matters, information specifically related to the annual consideration of the renewal of the fund's Advisory Contracts. The Board, acting directly and through its Committees, requests and receives information concerning the annual consideration of the renewal of the fund's Advisory Contracts. The Board also meets as needed to review matters specifically related to the Board's annual consideration of the renewal of the Advisory Contracts. Members of the Board may also meet with trustees of other Fidelity funds through ad hoc joint committees to discuss certain matters relevant to all of the Fidelity funds.
At its January 2018 meeting, the Board unanimously determined to renew the fund's Advisory Contracts. In reaching its determination, the Board considered all factors it believed relevant, including (i) the nature, extent, and quality of the services to be provided to the fund and its shareholders (including the investment performance of the fund); (ii) the competitiveness of the fund's management fee and total expense ratio relative to peer funds; (iii) the total costs of the services to be provided by and the profits to be realized by Fidelity from its relationships with the fund; and (iv) the extent to which, if any, economies of scale exist and would be realized as the fund grows, and whether any economies of scale are appropriately shared with fund shareholders.
In considering whether to renew the Advisory Contracts for the fund, the Board reached a determination, with the assistance of fund counsel and Independent Trustees' counsel and through the exercise of its business judgment, that the renewal of the Advisory Contracts was in the best interests of the fund and its shareholders and that the compensation payable under the Advisory Contracts was fair and reasonable. The Board's decision to renew the Advisory Contracts was not based on any single factor, but rather was based on a comprehensive consideration of all the information provided to the Board at its meetings throughout the year. The Board, in reaching its determination to renew the Advisory Contracts, was aware that shareholders of the fund have a broad range of investment choices available to them, including a wide choice among funds offered by Fidelity's competitors, and that the fund's shareholders, who have the opportunity to review and weigh the disclosure provided by the fund in its prospectus and other public disclosures, have chosen to invest in this fund, which is part of the Fidelity family of funds.
Amendment to Group Fee Rate. The Board also ratified an amendment to the management contract for the fund to add an additional breakpoint to the group fee schedule, which was effective October 1, 2017. The Board noted that the additional breakpoint would result in lower management fee rates to the extent that assets under management that are included in group fee calculations increase above the new breakpoint.
Nature, Extent, and Quality of Services Provided. The Board considered the staffing of the Investment Advisers as it relates to the fund, including the backgrounds of investment personnel of SelectCo, and also considered the fund's investment objective, strategies, and related investment philosophy. The Independent Trustees also had discussions with senior management of Fidelity's investment operations and investment groups. The Board considered the structure of the investment personnel compensation program and whether this structure provides appropriate incentives to act in the best interests of the fund. Additionally, the Board considered the portfolio managers' investments, if any, in the funds that they manage.Resources Dedicated to Investment Management and Support Services. The Board reviewed the general qualifications and capabilities of the Investment Advisers' investment staffs, including their size, education, experience, and resources, as well as Fidelity's approach to recruiting, training, managing, and compensating investment personnel. The Board noted that Fidelity has continued to increase the resources devoted to non-U.S. offices, including expansion of Fidelity's global investment organization. The Board also noted that Fidelity's analysts have extensive resources, tools and capabilities that allow them to conduct sophisticated quantitative and fundamental analysis, as well as credit analysis of issuers, counterparties and guarantors. Further, the Board considered that Fidelity's investment professionals have sufficient access to global information and data so as to provide competitive investment results over time, and that those professionals also have access to sophisticated tools that permit them to assess portfolio construction and risk and performance attribution characteristics continuously, as well as to transmit new information and research conclusions rapidly around the world. Additionally, in its deliberations, the Board considered Fidelity's trading, risk management, compliance, and technology and operations capabilities and resources, which are integral parts of the investment management process.Shareholder and Administrative Services. The Board considered (i) the nature, extent, quality, and cost of advisory, administrative, and shareholder services performed by the Investment Advisers and their affiliates under the Advisory Contracts and under separate agreements covering transfer agency, pricing and bookkeeping, and securities lending services for the fund; (ii) the nature and extent of the supervision of third party service providers, principally custodians, subcustodians, and pricing vendors; and (iii) the resources devoted to, and the record of compliance with, the fund's compliance policies and procedures. The Board also reviewed the allocation of fund brokerage, including allocations to brokers affiliated with the Investment Advisers, the use of brokerage commissions to pay fund expenses, and the use of "soft" commission dollars to pay for research services.The Board noted that the growth of fund assets over time across the complex allows Fidelity to reinvest in the development of services designed to enhance the value or convenience of the Fidelity funds as investment vehicles. These services include 24-hour access to account information and market information through telephone representatives and over the Internet, investor education materials and asset allocation tools, and the expanded availability of Fidelity Investor Centers.The Board noted that it and the boards of certain other Fidelity funds had formed an ad hoc Committee on Transfer Agency Fees to review the variety of transfer agency fee structures throughout the industry and Fidelity's competitive positioning with respect to industry participants.Investment in a Large Fund Family. The Board considered the benefits to shareholders of investing in a Fidelity fund, including the benefits of investing in a fund that is part of a large family of funds offering a variety of investment disciplines and providing a large variety of mutual fund investor services. The Board noted that Fidelity had taken, or had made recommendations that resulted in the Fidelity funds taking, a number of actions over the previous year that benefited particular funds, including: (i) continuing to dedicate additional resources to Fidelity's investment research process, which includes meetings with management of issuers in which the funds invest, and to the support of the senior management team that oversees asset management; (ii) continuing efforts to enhance Fidelity's global research capabilities; (iii) launching new funds and making other enhancements to meet client needs; (iv) launching new share classes of existing funds; (v) eliminating purchase minimums and broadening eligibility requirements for certain lower-priced share classes; (vi) reducing management fees and total expenses for certain growth equity funds and index funds; (vii) lowering expense caps for certain existing funds and classes to reduce expenses borne by shareholders; (viii) eliminating short-term redemption fees for certain funds; (ix) introducing a new pricing structure for certain funds of funds that is expected to reduce overall expenses paid by shareholders; (x) rationalizing product lines and gaining increased efficiencies through proposals for fund mergers and share class consolidations; (xi) continuing to develop, acquire and implement systems and technology to improve services to the funds and shareholders, strengthen information security, and increase efficiency; and (xii) implementing enhancements to further strengthen Fidelity's product line to increase investors' probability of success in achieving their investment goals, including retirement income goals.Investment Performance. The Board considered whether the fund has operated in accordance with its investment objective, as well as its record of compliance with its investment restrictions and its performance history.The Board took into account discussions with representatives of SelectCo about fund investment performance that occur at Board meetings throughout the year. In this regard the Board noted that as part of regularly scheduled fund reviews and other reports to the Board on fund performance, the Board considers annualized return information for the fund for different time periods, measured against a securities market index ("benchmark index"). In its evaluation of fund investment performance at meetings throughout the year, the Board gave particular attention to information indicating underperformance of certain Fidelity funds for specific time periods and discussed with the Investment Advisers the reasons for such underperformance. The fund underperformed its benchmark for the one-, three-, and five-year periods ended June 30, 2017, and as a result, the Board will continue to discuss with SelectCo the steps it is taking to address the fund's performance.In addition to reviewing absolute and relative fund performance, the Independent Trustees periodically consider the appropriateness of fund performance metrics in evaluating the results achieved. In general, the Independent Trustees believe that fund performance should be evaluated based on net performance (after fees and expenses) of both the highest performing and lowest performing fund share classes, where applicable, compared to appropriate benchmark indices, over appropriate time periods that may include full market cycles, taking into account relevant factors, including the following: general market conditions; issuer-specific information; and fund cash flows and other factors. Depending on the circumstances, the Independent Trustees may be satisfied with a fund's performance notwithstanding that it lags its benchmark index for certain periods.The Independent Trustees recognize that shareholders evaluate performance on a net basis over their own holding periods, for which one-, three-, and five-year periods are often used as a proxy. For this reason, the performance information reviewed by the Board also included net cumulative total return information for the fund and an appropriate benchmark index for the most recent one-, three-, and five-year periods ended June 30, 2017.Based on its review, the Board concluded that the nature, extent, and quality of services provided to the fund under the Advisory Contracts should continue to benefit the shareholders of the fund.Competitiveness of Management Fee and Total Expense Ratio. The Board considered the fund's management fee and total expense ratio compared to "mapped groups" of competitive funds and classes created for the purpose of facilitating the Trustees' analysis of the competitiveness of management fees and total expenses. Fidelity creates "mapped groups" by combining similar Lipper investment objective categories that have comparable investment mandates. For this purpose, all sector focused equity variable annuity funds are grouped in the same mapped group. Combining Lipper investment objective categories aids the Board's management fee and total expense ratio comparisons by broadening the competitive group used for comparison.Management Fee. The Board considered two proprietary management fee comparisons for the 12-month periods ended June 30 shown in basis points (BP) in the chart below. The group of Lipper funds used by the Board for management fee comparisons is referred to below as the "Total Mapped Group." The Total Mapped Group comparison focuses on a fund's standing in terms of gross management fees before expense reimbursements or caps relative to the total universe of funds with comparable investment mandates (i.e., sector equities), regardless of whether their management fee structures also are comparable. Funds with comparable management fee structures have similar management fee contractual arrangements (e.g., flat rate charged for advisory services, all-inclusive fee rate, etc.). "TMG %" represents the percentage of funds in the Total Mapped Group that had management fees that were lower than the fund's. For example, a hypothetical TMG % of 20% would mean that 80% of the funds in the Total Mapped Group had higher, and 20% had lower, management fees than the fund. The fund's actual TMG %s and the number of funds in the Total Mapped Group are in the chart below. The "Asset-Size Peer Group" (ASPG) comparison focuses on a fund's standing relative to a subset of non-Fidelity funds within the Total Mapped Group that are similar in size and management fee structure. For example, if a fund is in the first quartile of the ASPG, the fund's management fee ranks in the least expensive or lowest 25% of funds in the ASPG. The ASPG represents at least 15% of the funds in the Total Mapped Group with comparable asset size and management fee structures, subject to a minimum of 50 funds (or all funds in the Total Mapped Group if fewer than 50). Additional information, such as the ASPG quartile in which the fund's management fee rate ranked, is also included in the chart and considered by the Board.VIP Industrials Portfolio
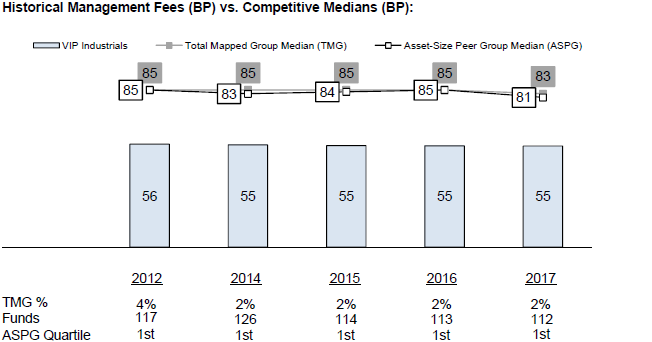
![]()
VCYLIC-SANN-0818
1.817364.113
Fidelity® Variable Insurance Products: Materials Portfolio Semi-Annual Report June 30, 2018 |
|
Contents
To view a fund's proxy voting guidelines and proxy voting record for the 12-month period ended June 30, visit http://www.fidelity.com/proxyvotingresults or visit the Securities and Exchange Commission's (SEC) web site at http://www.sec.gov.
You may also call 1-877-208-0098 to request a free copy of the proxy voting guidelines.
Fidelity® Variable Insurance Products are separate account options which are purchased through a variable insurance contract.
Standard & Poor's, S&P and S&P 500 are registered service marks of The McGraw-Hill Companies, Inc. and have been licensed for use by Fidelity Distributors Corporation.
Other third-party marks appearing herein are the property of their respective owners.
All other marks appearing herein are registered or unregistered trademarks or service marks of FMR LLC or an affiliated company. © 2018 FMR LLC. All rights reserved.
This report and the financial statements contained herein are submitted for the general information of the shareholders of the Fund. This report is not authorized for distribution to prospective investors in the Fund unless preceded or accompanied by an effective prospectus.
A fund files its complete schedule of portfolio holdings with the SEC for the first and third quarters of each fiscal year on Form N-Q. Forms N-Q are available on the SEC’s web site at http://www.sec.gov. A fund's Forms N-Q may be reviewed and copied at the SEC’s Public Reference Room in Washington, DC. Information regarding the operation of the SEC's Public Reference Room may be obtained by calling 1-800-SEC-0330.
For a complete list of a fund's portfolio holdings, view the most recent holdings listing, semiannual report, or annual report on Fidelity's web site at http://www.fidelity.com, http://www.institutional.fidelity.com, or http://www.401k.com, as applicable.
NOT FDIC INSURED •MAY LOSE VALUE •NO BANK GUARANTEE
Neither the Fund nor Fidelity Distributors Corporation is a bank.
Investment Summary (Unaudited)
Top Ten Stocks as of June 30, 2018
| % of fund's net assets | |
| DowDuPont, Inc. | 24.1 |
| LyondellBasell Industries NV Class A | 7.3 |
| The Chemours Co. LLC | 6.7 |
| Olin Corp. | 4.4 |
| Linde AG | 4.3 |
| Air Products & Chemicals, Inc. | 4.0 |
| Martin Marietta Materials, Inc. | 3.2 |
| Westlake Chemical Corp. | 3.0 |
| Freeport-McMoRan, Inc. | 2.8 |
| WestRock Co. | 2.6 |
| 62.4 |
Top Industries (% of fund's net assets)
| As of June 30, 2018 | ||
| Chemicals | 74.0% | |
| Metals & Mining | 11.6% | |
| Containers & Packaging | 8.2% | |
| Construction Materials | 4.0% | |
| Trading Companies & Distributors | 1.4% | |
| All Others* | 0.8% | |

* Includes short-term investments and net other assets (liabilities).
Schedule of Investments June 30, 2018 (Unaudited)
Showing Percentage of Net Assets
| Common Stocks - 98.1% | |||
| Shares | Value | ||
| Building Products - 0.2% | |||
| Building Products - 0.2% | |||
| GCP Applied Technologies, Inc. (a) | 6,900 | $199,755 | |
| Chemicals - 72.2% | |||
| Commodity Chemicals - 18.3% | |||
| Alpek SA de CV | 101,292 | 150,712 | |
| Cabot Corp. | 7,100 | 438,567 | |
| Ciner Resources LP | 7,200 | 189,360 | |
| LG Chemical Ltd. | 702 | 210,104 | |
| LyondellBasell Industries NV Class A | 55,416 | 6,087,448 | |
| Olin Corp. | 129,006 | 3,705,052 | |
| Orion Engineered Carbons SA | 21,000 | 647,850 | |
| Tronox Ltd. Class A | 72,791 | 1,432,527 | |
| Westlake Chemical Corp. | 23,000 | 2,475,490 | |
| 15,337,110 | |||
| Diversified Chemicals - 33.8% | |||
| Ashland Global Holdings, Inc. | 6,500 | 508,170 | |
| DowDuPont, Inc. | 306,797 | 20,224,059 | |
| Eastman Chemical Co. | 14,335 | 1,432,927 | |
| Huntsman Corp. | 8,400 | 245,280 | |
| Ingevity Corp. (a) | 4,500 | 363,870 | |
| The Chemours Co. LLC | 126,293 | 5,602,357 | |
| 28,376,663 | |||
| Fertilizers & Agricultural Chemicals - 3.3% | |||
| FMC Corp. | 18,700 | 1,668,227 | |
| The Mosaic Co. | 37,326 | 1,046,994 | |
| 2,715,221 | |||
| Industrial Gases - 8.3% | |||
| Air Products & Chemicals, Inc. | 21,500 | 3,348,195 | |
| Linde AG | 15,100 | 3,604,345 | |
| 6,952,540 | |||
| Specialty Chemicals - 8.5% | |||
| Axalta Coating Systems Ltd. (a) | 22,300 | 675,913 | |
| Celanese Corp. Class A | 13,500 | 1,499,310 | |
| Covestro AG (b) | 3,400 | 303,427 | |
| KMG Chemicals, Inc. | 1,400 | 103,292 | |
| Platform Specialty Products Corp. (a) | 179,000 | 2,076,400 | |
| Sherwin-Williams Co. | 5,100 | 2,078,607 | |
| Venator Materials PLC | 24,700 | 404,092 | |
| 7,141,041 | |||
| TOTAL CHEMICALS�� | 60,522,575 | ||
| Construction Materials - 4.0% | |||
| Construction Materials - 4.0% | |||
| CRH PLC sponsored ADR | 11,200 | 395,920 | |
| Martin Marietta Materials, Inc. | 11,900 | 2,657,627 | |
| Summit Materials, Inc. | 11,073 | 290,666 | |
| 3,344,213 | |||
| Containers & Packaging - 8.2% | |||
| Metal & Glass Containers - 1.7% | |||
| Aptargroup, Inc. | 6,500 | 606,970 | |
| Berry Global Group, Inc. (a) | 12,100 | 555,874 | |
| Silgan Holdings, Inc. | 8,000 | 214,640 | |
| 1,377,484 | |||
| Paper Packaging - 6.5% | |||
| Avery Dennison Corp. | 4,700 | 479,870 | |
| Graphic Packaging Holding Co. | 65,400 | 948,954 | |
| Packaging Corp. of America | 16,700 | 1,866,893 | |
| WestRock Co. | 37,972 | 2,165,163 | |
| 5,460,880 | |||
| TOTAL CONTAINERS & PACKAGING | 6,838,364 | ||
| Energy Equipment & Services - 0.5% | |||
| Oil & Gas Equipment & Services - 0.5% | |||
| Tenaris SA sponsored ADR | 11,600 | 422,124 | |
| Metals & Mining - 11.6% | |||
| Copper - 2.8% | |||
| Freeport-McMoRan, Inc. | 136,700 | 2,359,442 | |
| Diversified Metals & Mining - 1.6% | |||
| Alcoa Corp. (a) | 18,900 | 886,032 | |
| Elkem ASA (a) | 73,300 | 342,004 | |
| Ivanhoe Mines Ltd. (a) | 62,800 | 128,977 | |
| 1,357,013 | |||
| Gold - 3.1% | |||
| Newmont Mining Corp. | 53,000 | 1,998,630 | |
| Royal Gold, Inc. | 6,500 | 603,460 | |
| 2,602,090 | |||
| Steel - 4.1% | |||
| Commercial Metals Co. | 39,300 | 829,623 | |
| Nucor Corp. | 10,800 | 675,000 | |
| Ryerson Holding Corp. (a) | 37,900 | 422,585 | |
| Steel Dynamics, Inc. | 32,800 | 1,507,160 | |
| 3,434,368 | |||
| TOTAL METALS & MINING | 9,752,913 | ||
| Trading Companies & Distributors - 1.4% | |||
| Trading Companies & Distributors - 1.4% | |||
| Univar, Inc. (a) | 44,600 | 1,170,304 | |
| TOTAL COMMON STOCKS | |||
| (Cost $69,471,485) | 82,250,248 | ||
| Nonconvertible Preferred Stocks - 1.8% | |||
| Chemicals - 1.8% | |||
| Commodity Chemicals - 1.8% | |||
| Braskem SA (PN-A) | |||
| (Cost $1,765,459) | 114,900 | 1,504,825 | |
| TOTAL INVESTMENT IN SECURITIES - 99.9% | |||
| (Cost $71,236,944) | 83,755,073 | ||
| NET OTHER ASSETS (LIABILITIES) - 0.1% | 110,753 | ||
| NET ASSETS - 100% | $83,865,826 |
Legend
(a) Non-income producing
(b) Security exempt from registration under Rule 144A of the Securities Act of 1933. These securities may be resold in transactions exempt from registration, normally to qualified institutional buyers. At the end of the period, the value of these securities amounted to $303,427 or 0.4% of net assets.
Affiliated Central Funds
Information regarding fiscal year to date income earned by the Fund from investments in Fidelity Central Funds is as follows:
| Fund | Income earned |
| Fidelity Cash Central Fund | $7,165 |
| Fidelity Securities Lending Cash Central Fund | 91 |
| Total | $7,256 |
Amounts in the income column in the above table include any capital gain distributions from underlying funds, which are presented in the corresponding line-item in the Statement of Operations if applicable.
Investment Valuation
All investments are categorized as Level 1 under the Fair Value Hierarchy. The inputs or methodology used for valuing securities may not be an indication of the risk associated with investing in those securities. For more information on valuation inputs please refer to the Investment Valuation section in the accompanying Notes to Financial Statements.
Other Information
Distribution of investments by country or territory of incorporation, as a percentage of Total Net Assets, is as follows (Unaudited):
| United States of America | 80.6% |
| Netherlands | 7.3% |
| Germany | 4.6% |
| Brazil | 1.8% |
| Australia | 1.7% |
| Luxembourg | 1.3% |
| Others (Individually Less Than 1%) | 2.7% |
| 100.0% |
See accompanying notes which are an integral part of the financial statements.
Financial Statements
Statement of Assets and Liabilities
| June 30, 2018 (Unaudited) | ||
| Assets | ||
| Investment in securities, at value — See accompanying schedule: Unaffiliated issuers (cost $71,236,944) | $83,755,073 | |
| Receivable for investments sold | 490,133 | |
| Dividends receivable | 82,502 | |
| Distributions receivable from Fidelity Central Funds | 755 | |
| Prepaid expenses | 792 | |
| Other receivables | 2,556 | |
| Total assets | 84,331,811 | |
| Liabilities | ||
| Payable to custodian bank | $105,833 | |
| Payable for fund shares redeemed | 283,413 | |
| Accrued management fee | 39,593 | |
| Other affiliated payables | 12,377 | |
| Other payables and accrued expenses | 24,769 | |
| Total liabilities | 465,985 | |
| Net Assets | $83,865,826 | |
| Net Assets consist of: | ||
| Paid in capital | $66,729,664 | |
| Undistributed net investment income | 618,082 | |
| Accumulated undistributed net realized gain (loss) on investments and foreign currency transactions | 4,000,002 | |
| Net unrealized appreciation (depreciation) on investments and assets and liabilities in foreign currencies | 12,518,078 | |
| Net Assets | $83,865,826 | |
| Initial Class: | ||
| Net Asset Value, offering price and redemption price per share ($15,905,411 ÷ 1,093,406 shares) | $14.55 | |
| Investor Class: | ||
| Net Asset Value, offering price and redemption price per share ($67,960,415 ÷ 4,676,938 shares) | $14.53 |
See accompanying notes which are an integral part of the financial statements.
Statement of Operations
| Six months ended June 30, 2018 (Unaudited) | ||
| Investment Income | ||
| Dividends | $962,232 | |
| Income from Fidelity Central Funds | 7,256 | |
| Total income | 969,488 | |
| Expenses | ||
| Management fee | $253,440 | |
| Transfer agent fees | 60,208 | |
| Accounting and security lending fees | 18,262 | |
| Custodian fees and expenses | 7,419 | |
| Independent trustees' fees and expenses | 458 | |
| Audit | 20,181 | |
| Legal | 409 | |
| Miscellaneous | 61 | |
| Total expenses before reductions | 360,438 | |
| Expense reductions | (7,586) | |
| Total expenses after reductions | 352,852 | |
| Net investment income (loss) | 616,636 | |
| Realized and Unrealized Gain (Loss) | ||
| Net realized gain (loss) on: | ||
| Investment securities: | ||
| Unaffiliated issuers | 4,132,716 | |
| Fidelity Central Funds | (10) | |
| Foreign currency transactions | (4,476) | |
| Total net realized gain (loss) | 4,128,230 | |
| Change in net unrealized appreciation (depreciation) on: | ||
| Investment securities: | ||
| Unaffiliated issuers | (9,291,815) | |
| Fidelity Central Funds | (16) | |
| Assets and liabilities in foreign currencies | (103) | |
| Total change in net unrealized appreciation (depreciation) | (9,291,934) | |
| Net gain (loss) | (5,163,704) | |
| Net increase (decrease) in net assets resulting from operations | $(4,547,068) |
See accompanying notes which are an integral part of the financial statements.
Statement of Changes in Net Assets
| Six months ended June 30, 2018 (Unaudited) | Year ended December 31, 2017 | |
| Increase (Decrease) in Net Assets | ||
| Operations | ||
| Net investment income (loss) | $616,636 | $789,190 |
| Net realized gain (loss) | 4,128,230 | 6,232,428 |
| Change in net unrealized appreciation (depreciation) | (9,291,934) | 10,999,076 |
| Net increase (decrease) in net assets resulting from operations | (4,547,068) | 18,020,694 |
| Distributions to shareholders from net investment income | (236,426) | (708,148) |
| Distributions to shareholders from net realized gain | (5,298,246) | (1,380,860) |
| Total distributions | (5,534,672) | (2,089,008) |
| Share transactions - net increase (decrease) | (3,390,401) | 15,883,386 |
| Redemption fees | – | 11,397 |
| Total increase (decrease) in net assets | (13,472,141) | 31,826,469 |
| Net Assets | ||
| Beginning of period | 97,337,967 | 65,511,498 |
| End of period | $83,865,826 | $97,337,967 |
| Other Information | ||
| Undistributed net investment income end of period | $618,082 | $237,872 |
See accompanying notes which are an integral part of the financial statements.
Financial Highlights
VIP Materials Portfolio Initial Class
| Six months ended (Unaudited) June 30, | Years endedDecember 31, | |||||
| 2018 | 2017 | 2016 | 2015 | 2014 | 2013 | |
| Selected Per–Share Data | ||||||
| Net asset value, beginning of period | $16.18 | $13.16 | $12.18 | $14.84 | $15.53 | $13.27 |
| Income from Investment Operations | ||||||
| Net investment income (loss)A | .11 | .15 | .17 | .17 | .15 | .11 |
| Net realized and unrealized gain (loss) | (.84) | 3.25 | 1.23 | (1.33) | (.09) | 2.77 |
| Total from investment operations | (.73) | 3.40 | 1.40 | (1.16) | .06 | 2.88 |
| Distributions from net investment income | (.04) | (.13) | (.11) | (.19) | (.15) | (.17) |
| Distributions from net realized gain | (.86) | (.25) | (.31) | (1.32) | (.60) | (.45) |
| Total distributions | (.90) | (.38) | (.42) | (1.50)B | (.75) | (.62) |
| Redemption fees added to paid in capitalA | – | –C | –C | –C | –C | –C |
| Net asset value, end of period | $14.55 | $16.18 | $13.16 | $12.18 | $14.84 | $15.53 |
| Total ReturnD,E,F | (4.49)% | 26.08% | 12.20% | (9.01)% | .37% | 22.15% |
| Ratios to Average Net AssetsG,H | ||||||
| Expenses before reductions | .71%I | .73% | .77% | .75% | .75% | .76% |
| Expenses net of fee waivers, if any | .70%I | .73% | .77% | .75% | .74% | .76% |
| Expenses net of all reductions | .69%I | .72% | .76% | .75% | .73% | .75% |
| Net investment income (loss) | 1.38%I | 1.05% | 1.37% | 1.23% | 1.00% | .77% |
| Supplemental Data | ||||||
| Net assets, end of period (000 omitted) | $15,905 | $19,126 | $12,726 | $11,432 | $17,469 | $21,067 |
| Portfolio turnover rateJ | 100%I | 64% | 56% | 68% | 78% | 68% |
A Calculated based on average shares outstanding during the period.
B Total distributions of $1.50 per share is comprised of distributions from net investment income of $.185 and distributions from net realized gain of $1.319 per share.
C Amount represents less than $.005 per share.
D Total returns for periods of less than one year are not annualized.
E Total returns do not reflect charges attributable to your insurance company's separate account. Inclusion of these charges would reduce the total returns shown.
F Total returns would have been lower if certain expenses had not been reduced during the applicable periods shown.
G Fees and expenses of any underlying Fidelity Central Funds are not included in the Fund's expense ratio. The Fund indirectly bears its proportionate share of the expenses of any underlying Fidelity Central Funds.
H Expense ratios reflect operating expenses of the class. Expenses before reductions do not reflect amounts reimbursed by the investment adviser or reductions from brokerage service arrangements or reductions from other expense offset arrangements and do not represent the amount paid by the class during periods when reimbursements or reductions occur. Expenses net of fee waivers reflect expenses after reimbursement by the investment adviser but prior to reductions from brokerage service arrangements or other expense offset arrangements. Expenses net of all reductions represent the net expenses paid by the class.
I Annualized
J Amount does not include the portfolio activity of any underlying Fidelity Central Funds.
See accompanying notes which are an integral part of the financial statements.
VIP Materials Portfolio Investor Class
| Six months ended (Unaudited) June 30, | Years endedDecember 31, | |||||
| 2018 | 2017 | 2016 | 2015 | 2014 | 2013 | |
| Selected Per–Share Data | ||||||
| Net asset value, beginning of period | $16.17 | $13.15 | $12.18 | $14.84 | $15.53 | $13.27 |
| Income from Investment Operations | ||||||
| Net investment income (loss)A | .10 | .14 | .16 | .16 | .14 | .10 |
| Net realized and unrealized gain (loss) | (.84) | 3.25 | 1.23 | (1.33) | (.09) | 2.77 |
| Total from investment operations | (.74) | 3.39 | 1.39 | (1.17) | .05 | 2.87 |
| Distributions from net investment income | (.04) | (.12) | (.11) | (.17) | (.14) | (.16) |
| Distributions from net realized gain | (.86) | (.25) | (.31) | (1.32) | (.60) | (.45) |
| Total distributions | (.90) | (.37) | (.42) | (1.49) | (.74) | (.61) |
| Redemption fees added to paid in capitalA | – | –B | –B | –B | –B | –B |
| Net asset value, end of period | $14.53 | $16.17 | $13.15 | $12.18 | $14.84 | $15.53 |
| Total ReturnC,D,E | (4.57)% | 26.02% | 12.06% | (9.09)% | .32% | 22.07% |
| Ratios to Average Net AssetsF,G | ||||||
| Expenses before reductions | .78%H | .81% | .85% | .83% | .82% | .83% |
| Expenses net of fee waivers, if any | .78%H | .81% | .85% | .83% | .81% | .83% |
| Expenses net of all reductions | .77%H | .80% | .85% | .82% | .81% | .83% |
| Net investment income (loss) | 1.30%H | .97% | 1.29% | 1.16% | .93% | .69% |
| Supplemental Data | ||||||
| Net assets, end of period (000 omitted) | $67,960 | $78,212 | $52,786 | $39,807 | $54,837 | $54,561 |
| Portfolio turnover rateI | 100%H | 64% | 56% | 68% | 78% | 68% |
A Calculated based on average shares outstanding during the period.
B Amount represents less than $.005 per share.
C Total returns for periods of less than one year are not annualized.
D Total returns do not reflect charges attributable to your insurance company's separate account. Inclusion of these charges would reduce the total returns shown.
E Total returns would have been lower if certain expenses had not been reduced during the applicable periods shown.
F Fees and expenses of any underlying Fidelity Central Funds are not included in the Fund's expense ratio. The Fund indirectly bears its proportionate share of the expenses of any underlying Fidelity Central Funds.
G Expense ratios reflect operating expenses of the class. Expenses before reductions do not reflect amounts reimbursed by the investment adviser or reductions from brokerage service arrangements or reductions from other expense offset arrangements and do not represent the amount paid by the class during periods when reimbursements or reductions occur. Expenses net of fee waivers reflect expenses after reimbursement by the investment adviser but prior to reductions from brokerage service arrangements or other expense offset arrangements. Expenses net of all reductions represent the net expenses paid by the class.
H Annualized
I Amount does not include the portfolio activity of any underlying Fidelity Central Funds.
See accompanying notes which are an integral part of the financial statements.
Notes to Financial Statements (Unaudited)
For the period ended June 30, 2018
1. Organization.
VIP Materials Portfolio (the Fund) is a non-diversified fund of Variable Insurance Products Fund IV (the Trust) and is authorized to issue an unlimited number of shares. The Trust is registered under the Investment Company Act of 1940, as amended (the 1940 Act), as an open-end management investment company organized as a Massachusetts business trust. Shares of the Fund may only be purchased by insurance companies for the purpose of funding variable annuity or variable life insurance contracts. The Fund offers the following classes of shares: Initial Class shares and Investor Class shares. All classes have equal rights and voting privileges, except for matters affecting a single class.
2. Investments in Fidelity Central Funds.
The Fund invests in Fidelity Central Funds, which are open-end investment companies generally available only to other investment companies and accounts managed by the investment adviser and its affiliates. The Fund's Schedule of Investments lists each of the Fidelity Central Funds held as of period end, if any, as an investment of the Fund, but does not include the underlying holdings of each Fidelity Central Fund. As an Investing Fund, the Fund indirectly bears its proportionate share of the expenses of the underlying Fidelity Central Funds.
The Money Market Central Funds seek preservation of capital and current income and are managed by Fidelity Investments Money Management, Inc. (FIMM), an affiliate of the investment adviser. Annualized expenses of the Money Market Central Funds as of their most recent shareholder report date are less than .005%.
A complete unaudited list of holdings for each Fidelity Central Fund is available upon request or at the Securities and Exchange Commission (the SEC) website at www.sec.gov. In addition, the financial statements of the Fidelity Central Funds are available on the SEC website or upon request.
3. Significant Accounting Policies.
The Fund is an investment company and applies the accounting and reporting guidance of the Financial Accounting Standards Board (FASB) Accounting Standards Codification Topic 946 Financial Services – Investments Companies. The financial statements have been prepared in conformity with accounting principles generally accepted in the United States of America (GAAP), which require management to make certain estimates and assumptions at the date of the financial statements. Actual results could differ from those estimates. Subsequent events, if any, through the date that the financial statements were issued have been evaluated in the preparation of the financial statements. The following summarizes the significant accounting policies of the Fund:
Investment Valuation. Investments are valued as of 4:00 p.m. Eastern time on the last calendar day of the period. The Board of Trustees (the Board) has delegated the day to day responsibility for the valuation of the Fund's investments to the Fair Value Committee (the Committee) established by the Fund's investment adviser. In accordance with valuation policies and procedures approved by the Board, the Fund attempts to obtain prices from one or more third party pricing vendors or brokers to value its investments. When current market prices, quotations or currency exchange rates are not readily available or reliable, investments will be fair valued in good faith by the Committee, in accordance with procedures adopted by the Board. Factors used in determining fair value vary by investment type and may include market or investment specific events. The frequency with which these procedures are used cannot be predicted and they may be utilized to a significant extent. The Committee oversees the Fund's valuation policies and procedures and reports to the Board on the Committee's activities and fair value determinations. The Board monitors the appropriateness of the procedures used in valuing the Fund's investments and ratifies the fair value determinations of the Committee.
The Fund categorizes the inputs to valuation techniques used to value its investments into a disclosure hierarchy consisting of three levels as shown below:
- Level 1 – quoted prices in active markets for identical investments
- Level 2 – other significant observable inputs (including quoted prices for similar investments, interest rates, prepayment speeds, etc.)
- Level 3 – unobservable inputs (including the Fund's own assumptions based on the best information available)
Valuation techniques used to value the Fund's investments by major category are as follows:
Equity securities, including restricted securities, for which market quotations are readily available, are valued at the last reported sale price or official closing price as reported by a third party pricing vendor on the primary market or exchange on which they are traded and are categorized as Level 1 in the hierarchy. In the event there were no sales during the day or closing prices are not available, securities are valued at the last quoted bid price or may be valued using the last available price and are generally categorized as Level 2 in the hierarchy. For foreign equity securities, when market or security specific events arise, comparisons to the valuation of American Depositary Receipts (ADRs), futures contracts, Exchange-Traded Funds (ETFs) and certain indexes as well as quoted prices for similar securities may be used and would be categorized as Level 2 in the hierarchy. Utilizing these techniques may result in transfers between Level 1 and Level 2. For equity securities, including restricted securities, where observable inputs are limited, assumptions about market activity and risk are used and these securities may be categorized as Level 3 in the hierarchy.
Investments in open-end mutual funds, including the Fidelity Central Funds, are valued at their closing net asset value (NAV) each business day and are categorized as Level 1 in the hierarchy.
Changes in valuation techniques may result in transfers in or out of an assigned level within the disclosure hierarchy.
Foreign Currency. The Fund may use foreign currency contracts to facilitate transactions in foreign-denominated securities. Gains and losses from these transactions may arise from changes in the value of the foreign currency or if the counterparties do not perform under the contracts' terms.
Foreign-denominated assets, including investment securities, and liabilities are translated into U.S. dollars at the exchange rates at period end. Purchases and sales of investment securities, income and dividends received and expenses denominated in foreign currencies are translated into U.S. dollars at the exchange rate in effect on the transaction date.
The effects of exchange rate fluctuations on investments are included with the net realized and unrealized gain (loss) on investment securities. Other foreign currency transactions resulting in realized and unrealized gain (loss) are disclosed separately.
Investment Transactions and Income. For financial reporting purposes, the Fund's investment holdings and NAV include trades executed through the end of the last business day of the period. The NAV per share for processing shareholder transactions is calculated as of the close of business of the New York Stock Exchange (NYSE), normally 4:00 p.m. Eastern time and includes trades executed through the end of the prior business day. Gains and losses on securities sold are determined on the basis of identified cost and include proceeds received from litigation. Dividend income is recorded on the ex-dividend date, except for certain dividends from foreign securities where the ex-dividend date may have passed, which are recorded as soon as the Fund is informed of the ex-dividend date. Non-cash dividends included in dividend income, if any, are recorded at the fair market value of the securities received. Income and capital gain distributions from Fidelity Central Funds, if any, are recorded on the ex-dividend date. Certain distributions received by the Fund represent a return of capital or capital gain. The Fund determines the components of these distributions subsequent to the ex-dividend date, based upon receipt of tax filings or other correspondence relating to the underlying investment. These distributions are recorded as a reduction of cost of investments and/or as a realized gain. Investment income is recorded net of foreign taxes withheld where recovery of such taxes is uncertain.
Class Allocations and Expenses. Investment income, realized and unrealized capital gains and losses, common expenses of the Fund, and certain fund-level expense reductions, if any, are allocated daily on a pro-rata basis to each class based on the relative net assets of each class to the total net assets of the Fund. Each class differs with respect to transfer agent fees incurred. Certain expense reductions may also differ by class. For the reporting period, the allocated portion of income and expenses to each class as a percent of its average net assets may vary due to the timing of recording these transactions in relation to fluctuating net assets of the classes. Expenses directly attributable to a fund are charged to that fund. Expenses attributable to more than one fund are allocated among the respective funds on the basis of relative net assets or other appropriate methods. Expense estimates are accrued in the period to which they relate and adjustments are made when actual amounts are known.
Income Tax Information and Distributions to Shareholders. Each year, the Fund intends to qualify as a regulated investment company under Subchapter M of the Internal Revenue Code, including distributing substantially all of its taxable income and realized gains. As a result, no provision for U.S. Federal income taxes is required. The Fund files a U.S. federal tax return, in addition to state and local tax returns as required. The Fund's federal income tax returns are subject to examination by the Internal Revenue Service (IRS) for a period of three fiscal years after they are filed. State and local tax returns may be subject to examination for an additional fiscal year depending on the jurisdiction. Foreign taxes are provided for based on the Fund's understanding of the tax rules and rates that exist in the foreign markets in which it invests.
Distributions are declared and recorded on the ex-dividend date. Income and capital gain distributions are declared separately for each class. Income and capital gain distributions are determined in accordance with income tax regulations, which may differ from GAAP.
Capital accounts within the financial statements are adjusted for permanent book-tax differences. These adjustments have no impact on net assets or the results of operations. Capital accounts are not adjusted for temporary book-tax differences which will reverse in a subsequent period.
Book-tax differences are primarily due to foreign currency transactions, passive foreign investment companies (PFIC) and losses deferred due to wash sales.
As of period end, the cost and unrealized appreciation (depreciation) in securities, and derivatives if applicable, for federal income tax purposes were as follows:
| Gross unrealized appreciation | $14,590,470 |
| Gross unrealized depreciation | (2,484,447) |
| Net unrealized appreciation (depreciation) | $12,106,023 |
| Tax cost | $71,649,050 |
Restricted Securities. The Fund may invest in securities that are subject to legal or contractual restrictions on resale. These securities generally may be resold in transactions exempt from registration or to the public if the securities are registered. Disposal of these securities may involve time-consuming negotiations and expense, and prompt sale at an acceptable price may be difficult. Information regarding restricted securities is included at the end of the Fund's Schedule of Investments.
4. Purchases and Sales of Investments.
Purchases and sales of securities, other than short-term securities, aggregated $45,556,786 and $51,589,374, respectively.
5. Fees and Other Transactions with Affiliates.
Management Fee. Fidelity SelectCo, LLC (the investment adviser) and its affiliates provide the Fund with investment management related services for which the Fund pays a monthly management fee. The management fee is the sum of an individual fund fee rate that is based on an annual rate of .30% of the Fund's average net assets and an annualized group fee rate that averaged .24% during the period. The group fee rate is based upon the average net assets of all the mutual funds advised by Fidelity Management & Research Company (FMR) and the investment adviser. The group fee rate decreases as assets under management increase and increases as assets under management decrease. For the reporting period, the total annualized management fee rate was .54% of the Fund's average net assets.
Transfer Agent Fees. Fidelity Investments Institutional Operations Company, Inc. (FIIOC), an affiliate of the investment adviser, is the Fund's transfer, dividend disbursing, and shareholder servicing agent. FIIOC receives an asset-based fee with respect to each class. Each class pays a fee for transfer agent services, typesetting and printing and mailing of shareholder reports, excluding mailing of proxy statements, equal to an annual rate of class-level average net assets. The annual rate for Investor Class is .15% and the annual rate for all other classes is .07%. For the period, transfer agent fees for each class were as follows:
| Initial Class | $5,737 |
| Investor Class | 54,471 |
| $60,208 |
Accounting and Security Lending Fees. Fidelity Service Company, Inc. (FSC), an affiliate of the investment adviser, maintains the Fund's accounting records. The accounting fee is based on the level of average net assets for each month. Under a separate contract, FSC administers the security lending program. The security lending fee is based on the number and duration of lending transactions. For the period, the fees were equivalent to an annualized rate of .04%.
Brokerage Commissions. The Fund placed a portion of its portfolio transactions with brokerage firms which are affiliates of the investment adviser. Brokerage commissions are included in net realized gain (loss) and change in net unrealized appreciation (depreciation) in the Statement of Operations. The commissions paid to these affiliated firms were $1,684 for the period.
Interfund Trades. The Fund may purchase from or sell securities to other Fidelity Funds under procedures adopted by the Board. The procedures have been designed to ensure these interfund trades are executed in accordance with Rule 17a-7 of the 1940 Act. Interfund trades are included within the respective purchases and sales amounts shown in the Purchases and Sales of Investments note.
6. Committed Line of Credit.
The Fund participates with other funds managed by the investment adviser or an affiliate in a $4.25 billion credit facility (the "line of credit") to be utilized for temporary or emergency purposes to fund shareholder redemptions or for other short-term liquidity purposes. The Fund has agreed to pay commitment fees on its pro-rata portion of the line of credit, which amounted to $135 and is reflected in Miscellaneous expenses on the Statement of Operations. During the period, the Fund did not borrow on this line of credit.
7. Security Lending.
The Fund lends portfolio securities through a lending agent from time to time in order to earn additional income. On the settlement date of the loan, the Fund receives collateral (in the form of U.S. Treasury obligations, letters of credit and/or cash) against the loaned securities and maintains collateral in an amount not less than 100% of the market value of the loaned securities during the period of the loan. The market value of the loaned securities is determined at the close of business of the Fund and any additional required collateral is delivered to the Fund on the next business day. The Fund or borrower may terminate the loan at any time, and if the borrower defaults on its obligation to return the securities loaned because of insolvency or other reasons, the Fund may apply collateral received from the borrower against the obligation. The Fund may experience delays and costs in recovering the securities loaned. Any cash collateral received is invested in the Fidelity Securities Lending Cash Central Fund. At period end, there were no security loans outstanding. Security lending income represents the income earned on investing cash collateral, less rebates paid to borrowers and any lending agent fees associated with the loan, plus any premium payments received for lending certain types of securities. Security lending income is presented in the Statement of Operations as a component of income from Fidelity Central Funds. Total security lending income during the period amounted to $91.
8. Expense Reductions.
Commissions paid to certain brokers with whom the investment adviser, or its affiliates, places trades on behalf of the Fund include an amount in addition to trade execution, which may be rebated back to the Fund to offset certain expenses. This amount totaled $7,163 for the period.
In addition, during the period the investment adviser reimbursed and/or waived a portion of fund-level operating expenses in the amount of $423.
9. Distributions to Shareholders.
Distributions to shareholders of each class were as follows:
| Six months ended June 30, 2018 | Year ended December 31, 2017 | |
| From net investment income | ||
| Initial Class | $46,354 | $150,503 |
| Investor Class | 190,072 | 557,645 |
| Total | $236,426 | $708,148 |
| From net realized gain | ||
| Initial Class | $996,606 | $276,391 |
| Investor Class | 4,301,640 | 1,104,469 |
| Total | $5,298,246 | $1,380,860 |
10. Share Transactions.
Transactions for each class of shares were as follows:
| Shares | Shares | Dollars | Dollars | |
| Six months ended June 30, 2018 | Year ended December 31, 2017 | Six months ended June 30, 2018 | Year ended December 31, 2017 | |
| Initial Class | ||||
| Shares sold | 112,422 | 501,204 | $1,783,934 | $7,305,805 |
| Reinvestment of distributions | 71,978 | 28,510 | 1,042,960 | 426,894 |
| Shares redeemed | (273,129) | (314,876) | (4,124,854) | (4,507,729) |
| Net increase (decrease) | (88,729) | 214,838 | $(1,297,960) | $3,224,970 |
| Investor Class | ||||
| Shares sold | 505,303 | 1,981,885 | $8,009,382 | $29,318,309 |
| Reinvestment of distributions | 310,201 | 111,128 | 4,491,712 | 1,662,114 |
| Shares redeemed | (976,298) | (1,269,883) | (14,593,535) | (18,322,007) |
| Net increase (decrease) | (160,794) | 823,130 | $(2,092,441) | $12,658,416 |
11. Other.
The Fund's organizational documents provide former and current trustees and officers with a limited indemnification against liabilities arising in connection with the performance of their duties to the Fund. In the normal course of business, the Fund may also enter into contracts that provide general indemnifications. The Fund's maximum exposure under these arrangements is unknown as this would be dependent on future claims that may be made against the Fund. The risk of material loss from such claims is considered remote.
At the end of the period, the investment adviser or its affiliates were the owners of record of 100% of the total outstanding shares of the Fund.
Shareholder Expense Example
As a shareholder of the Fund, you incur two types of costs: (1) transaction costs and (2) ongoing costs, including management fees and other Fund expenses. This Example is intended to help you understand your ongoing costs (in dollars) of investing in the Fund and to compare these costs with the ongoing costs of investing in other mutual funds.
The Example is based on an investment of $1,000 invested at the beginning of the period and held for the entire period (January 1, 2018 to June 30, 2018).
Actual Expenses
The first line of the accompanying table for each class of the Fund provides information about actual account values and actual expenses. You may use the information in this line, together with the amount you invested, to estimate the expenses that you paid over the period. Simply divide your account value by $1,000.00 (for example, an $8,600 account value divided by $1,000.00 = 8.6), then multiply the result by the number in the first line for a class of the Fund under the heading entitled "Expenses Paid During Period" to estimate the expenses you paid on your account during this period. The estimate of expenses does not include any fees or other expenses of any variable annuity or variable life insurance product. If they were, the estimate of expenses you paid during the period would be higher, and your ending account value would be lower. In addition, the Fund, as a shareholder in the underlying Fidelity Central Funds, will indirectly bear its pro-rata share of the fees and expenses incurred by the underlying Fidelity Central Funds. These fees and expenses are not included in the Fund's annualized expense ratio used to calculate the expense estimate in the table below.
Hypothetical Example for Comparison Purposes
The second line of the accompanying table for each class of the Fund provides information about hypothetical account values and hypothetical expenses based on a Class' actual expense ratio and an assumed rate of return of 5% per year before expenses, which is not the Class' actual return. The hypothetical account values and expenses may not be used to estimate the actual ending account balance or expenses you paid for the period. You may use this information to compare the ongoing costs of investing in the Fund and other funds. To do so, compare this 5% hypothetical example with the 5% hypothetical examples that appear in the shareholder reports of the other funds. The estimate of expenses does not include any fees or other expenses of any variable annuity or variable life insurance product. If they were, the estimate of expenses you paid during the period would be higher, and your ending account value would be lower. In addition, the Fund, as a shareholder in the underlying Fidelity Central Funds, will indirectly bear its pro-rata share of the fees and expenses incurred by the underlying Fidelity Central Funds. These fees and expenses are not included in the Fund's annualized expense ratio used to calculate the expense estimate in the table below.
Please note that the expenses shown in the table are meant to highlight your ongoing costs only and do not reflect any transaction costs. Therefore, the second line of the table is useful in comparing ongoing costs only, and will not help you determine the relative total costs of owning different funds.
| Annualized Expense Ratio-A | Beginning Account Value January 1, 2018 | Ending Account Value June 30, 2018 | Expenses Paid During Period-B January 1, 2018 to June 30, 2018 | |
| Initial Class | .70% | |||
| Actual | $1,000.00 | $955.10 | $3.39 | |
| Hypothetical-C | $1,000.00 | $1,021.32 | $3.51 | |
| Investor Class | .78% | |||
| Actual | $1,000.00 | $954.30 | $3.78 | |
| Hypothetical-C | $1,000.00 | $1,020.93 | $3.91 |
A Annualized expense ratio reflects expenses net of applicable fee waivers.
B Expenses are equal to each Class' annualized expense ratio, multiplied by the average account value over the period, multiplied by 181/365 (to reflect the one-half year period).
C 5% return per year before expenses
Board Approval of Investment Advisory Contracts and Management Fees
VIP Materials Portfolio
Each year, the Board of Trustees, including the Independent Trustees (together, the Board), votes on the renewal of the management contract with Fidelity SelectCo, LLC (SelectCo), an affiliate of Fidelity Management & Research Company (FMR), and the sub-advisory agreements with affiliates of FMR (together, the Advisory Contracts) for the fund. SelectCo and the sub-advisers are collectively referred to herein as the Investment Advisers. The Board, assisted by the advice of fund counsel and Independent Trustees' counsel, requests and considers a broad range of information relevant to the renewal of the Advisory Contracts throughout the year.
The Board meets regularly and, at each of its meetings, covers an extensive agenda of topics and materials and considers factors that are relevant to its annual consideration of the renewal of the fund's Advisory Contracts, including the services and support provided to the fund and its shareholders. The Board has established four standing committees (Committees) — Operations, Audit, Fair Valuation, and Governance and Nominating — each composed of and chaired by Independent Trustees with varying backgrounds, to which the Board has assigned specific subject matter responsibilities in order to enhance effective decision-making by the Board. The Operations Committee, of which all of the Independent Trustees are members, meets regularly throughout the year and considers, among other matters, information specifically related to the annual consideration of the renewal of the fund's Advisory Contracts. The Board, acting directly and through its Committees, requests and receives information concerning the annual consideration of the renewal of the fund's Advisory Contracts. The Board also meets as needed to review matters specifically related to the Board's annual consideration of the renewal of the Advisory Contracts. Members of the Board may also meet with trustees of other Fidelity funds through ad hoc joint committees to discuss certain matters relevant to all of the Fidelity funds.
At its January 2018 meeting, the Board unanimously determined to renew the fund's Advisory Contracts. In reaching its determination, the Board considered all factors it believed relevant, including (i) the nature, extent, and quality of the services to be provided to the fund and its shareholders (including the investment performance of the fund); (ii) the competitiveness of the fund's management fee and total expense ratio relative to peer funds; (iii) the total costs of the services to be provided by and the profits to be realized by Fidelity from its relationships with the fund; and (iv) the extent to which, if any, economies of scale exist and would be realized as the fund grows, and whether any economies of scale are appropriately shared with fund shareholders.
In considering whether to renew the Advisory Contracts for the fund, the Board reached a determination, with the assistance of fund counsel and Independent Trustees' counsel and through the exercise of its business judgment, that the renewal of the Advisory Contracts was in the best interests of the fund and its shareholders and that the compensation payable under the Advisory Contracts was fair and reasonable. The Board's decision to renew the Advisory Contracts was not based on any single factor, but rather was based on a comprehensive consideration of all the information provided to the Board at its meetings throughout the year. The Board, in reaching its determination to renew the Advisory Contracts, was aware that shareholders of the fund have a broad range of investment choices available to them, including a wide choice among funds offered by Fidelity's competitors, and that the fund's shareholders, who have the opportunity to review and weigh the disclosure provided by the fund in its prospectus and other public disclosures, have chosen to invest in this fund, which is part of the Fidelity family of funds.
Amendment to Group Fee Rate. The Board also ratified an amendment to the management contract for the fund to add an additional breakpoint to the group fee schedule, which was effective October 1, 2017. The Board noted that the additional breakpoint would result in lower management fee rates to the extent that assets under management that are included in group fee calculations increase above the new breakpoint.
Nature, Extent, and Quality of Services Provided. The Board considered the staffing of the Investment Advisers as it relates to the fund, including the backgrounds of investment personnel of SelectCo, and also considered the fund's investment objective, strategies, and related investment philosophy. The Independent Trustees also had discussions with senior management of Fidelity's investment operations and investment groups. The Board considered the structure of the investment personnel compensation program and whether this structure provides appropriate incentives to act in the best interests of the fund. Additionally, the Board considered the portfolio managers' investments, if any, in the funds that they manage.Resources Dedicated to Investment Management and Support Services. The Board reviewed the general qualifications and capabilities of the Investment Advisers' investment staffs, including their size, education, experience, and resources, as well as Fidelity's approach to recruiting, training, managing, and compensating investment personnel. The Board noted that Fidelity has continued to increase the resources devoted to non-U.S. offices, including expansion of Fidelity's global investment organization. The Board also noted that Fidelity's analysts have extensive resources, tools and capabilities that allow them to conduct sophisticated quantitative and fundamental analysis, as well as credit analysis of issuers, counterparties and guarantors. Further, the Board considered that Fidelity's investment professionals have sufficient access to global information and data so as to provide competitive investment results over time, and that those professionals also have access to sophisticated tools that permit them to assess portfolio construction and risk and performance attribution characteristics continuously, as well as to transmit new information and research conclusions rapidly around the world. Additionally, in its deliberations, the Board considered Fidelity's trading, risk management, compliance, and technology and operations capabilities and resources, which are integral parts of the investment management process.Shareholder and Administrative Services. The Board considered (i) the nature, extent, quality, and cost of advisory, administrative, and shareholder services performed by the Investment Advisers and their affiliates under the Advisory Contracts and under separate agreements covering transfer agency, pricing and bookkeeping, and securities lending services for the fund; (ii) the nature and extent of the supervision of third party service providers, principally custodians, subcustodians, and pricing vendors; and (iii) the resources devoted to, and the record of compliance with, the fund's compliance policies and procedures. The Board also reviewed the allocation of fund brokerage, including allocations to brokers affiliated with the Investment Advisers, the use of brokerage commissions to pay fund expenses, and the use of "soft" commission dollars to pay for research services.The Board noted that the growth of fund assets over time across the complex allows Fidelity to reinvest in the development of services designed to enhance the value or convenience of the Fidelity funds as investment vehicles. These services include 24-hour access to account information and market information through telephone representatives and over the Internet, investor education materials and asset allocation tools, and the expanded availability of Fidelity Investor Centers.The Board noted that it and the boards of certain other Fidelity funds had formed an ad hoc Committee on Transfer Agency Fees to review the variety of transfer agency fee structures throughout the industry and Fidelity's competitive positioning with respect to industry participants.Investment in a Large Fund Family. The Board considered the benefits to shareholders of investing in a Fidelity fund, including the benefits of investing in a fund that is part of a large family of funds offering a variety of investment disciplines and providing a large variety of mutual fund investor services. The Board noted that Fidelity had taken, or had made recommendations that resulted in the Fidelity funds taking, a number of actions over the previous year that benefited particular funds, including: (i) continuing to dedicate additional resources to Fidelity's investment research process, which includes meetings with management of issuers in which the funds invest, and to the support of the senior management team that oversees asset management; (ii) continuing efforts to enhance Fidelity's global research capabilities; (iii) launching new funds and making other enhancements to meet client needs; (iv) launching new share classes of existing funds; (v) eliminating purchase minimums and broadening eligibility requirements for certain lower-priced share classes; (vi) reducing management fees and total expenses for certain growth equity funds and index funds; (vii) lowering expense caps for certain existing funds and classes to reduce expenses borne by shareholders; (viii) eliminating short-term redemption fees for certain funds; (ix) introducing a new pricing structure for certain funds of funds that is expected to reduce overall expenses paid by shareholders; (x) rationalizing product lines and gaining increased efficiencies through proposals for fund mergers and share class consolidations; (xi) continuing to develop, acquire and implement systems and technology to improve services to the funds and shareholders, strengthen information security, and increase efficiency; and (xii) implementing enhancements to further strengthen Fidelity's product line to increase investors' probability of success in achieving their investment goals, including retirement income goals.Investment Performance. The Board considered whether the fund has operated in accordance with its investment objective, as well as its record of compliance with its investment restrictions and its performance history.The Board took into account discussions with representatives of SelectCo about fund investment performance that occur at Board meetings throughout the year. In this regard the Board noted that as part of regularly scheduled fund reviews and other reports to the Board on fund performance, the Board considers annualized return information for the fund for different time periods, measured against a securities market index ("benchmark index"). In its evaluation of fund investment performance at meetings throughout the year, the Board gave particular attention to information indicating underperformance of certain Fidelity funds for specific time periods and discussed with the Investment Advisers the reasons for such underperformance. The fund underperformed its benchmark for the one-, three-, and five-year periods ended June 30, 2017, and as a result, the Board will continue to discuss with SelectCo the steps it is taking to address the fund's performance.In addition to reviewing absolute and relative fund performance, the Independent Trustees periodically consider the appropriateness of fund performance metrics in evaluating the results achieved. In general, the Independent Trustees believe that fund performance should be evaluated based on net performance (after fees and expenses) of both the highest performing and lowest performing fund share classes, where applicable, compared to appropriate benchmark indices, over appropriate time periods that may include full market cycles, taking into account relevant factors, including the following: general market conditions; issuer-specific information; and fund cash flows and other factors. Depending on the circumstances, the Independent Trustees may be satisfied with a fund's performance notwithstanding that it lags its benchmark index for certain periods.The Independent Trustees recognize that shareholders evaluate performance on a net basis over their own holding periods, for which one-, three-, and five-year periods are often used as a proxy. For this reason, the performance information reviewed by the Board also included net cumulative total return information for the fund and an appropriate benchmark index for the most recent one-, three-, and five-year periods ended June 30, 2017.Based on its review, the Board concluded that the nature, extent, and quality of services provided to the fund under the Advisory Contracts should continue to benefit the shareholders of the fund.Competitiveness of Management Fee and Total Expense Ratio. The Board considered the fund's management fee and total expense ratio compared to "mapped groups" of competitive funds and classes created for the purpose of facilitating the Trustees' analysis of the competitiveness of management fees and total expenses. Fidelity creates "mapped groups" by combining similar Lipper investment objective categories that have comparable investment mandates. For this purpose, all sector focused equity variable annuity funds are grouped in the same mapped group. Combining Lipper investment objective categories aids the Board's management fee and total expense ratio comparisons by broadening the competitive group used for comparison.Management Fee. The Board considered two proprietary management fee comparisons for the 12-month periods ended June 30 shown in basis points (BP) in the chart below. The group of Lipper funds used by the Board for management fee comparisons is referred to below as the "Total Mapped Group." The Total Mapped Group comparison focuses on a fund's standing in terms of gross management fees before expense reimbursements or caps relative to the total universe of funds with comparable investment mandates (i.e., sector equities), regardless of whether their management fee structures also are comparable. Funds with comparable management fee structures have similar management fee contractual arrangements (e.g., flat rate charged for advisory services, all-inclusive fee rate, etc.). "TMG %" represents the percentage of funds in the Total Mapped Group that had management fees that were lower than the fund's. For example, a hypothetical TMG % of 20% would mean that 80% of the funds in the Total Mapped Group had higher, and 20% had lower, management fees than the fund. The fund's actual TMG %s and the number of funds in the Total Mapped Group are in the chart below. The "Asset-Size Peer Group" (ASPG) comparison focuses on a fund's standing relative to a subset of non-Fidelity funds within the Total Mapped Group that are similar in size and management fee structure. For example, if a fund is in the first quartile of the ASPG, the fund's management fee ranks in the least expensive or lowest 25% of funds in the ASPG. The ASPG represents at least 15% of the funds in the Total Mapped Group with comparable asset size and management fee structures, subject to a minimum of 50 funds (or all funds in the Total Mapped Group if fewer than 50). Additional information, such as the ASPG quartile in which the fund's management fee rate ranked, is also included in the chart and considered by the Board.VIP Materials Portfolio

![]()
VMATP-SANN-0818
1.851002.111
Fidelity® Variable Insurance Products: Real Estate Portfolio Semi-Annual Report June 30, 2018 |
|
Contents
To view a fund's proxy voting guidelines and proxy voting record for the 12-month period ended June 30, visit http://www.fidelity.com/proxyvotingresults or visit the Securities and Exchange Commission's (SEC) web site at http://www.sec.gov.
You may also call 1-877-208-0098 to request a free copy of the proxy voting guidelines.
Fidelity® Variable Insurance Products are separate account options which are purchased through a variable insurance contract.
Standard & Poor's, S&P and S&P 500 are registered service marks of The McGraw-Hill Companies, Inc. and have been licensed for use by Fidelity Distributors Corporation.
Other third-party marks appearing herein are the property of their respective owners.
All other marks appearing herein are registered or unregistered trademarks or service marks of FMR LLC or an affiliated company. © 2018 FMR LLC. All rights reserved.
This report and the financial statements contained herein are submitted for the general information of the shareholders of the Fund. This report is not authorized for distribution to prospective investors in the Fund unless preceded or accompanied by an effective prospectus.
A fund files its complete schedule of portfolio holdings with the SEC for the first and third quarters of each fiscal year on Form N-Q. Forms N-Q are available on the SEC’s web site at http://www.sec.gov. A fund's Forms N-Q may be reviewed and copied at the SEC’s Public Reference Room in Washington, DC. Information regarding the operation of the SEC's Public Reference Room may be obtained by calling 1-800-SEC-0330.
For a complete list of a fund's portfolio holdings, view the most recent holdings listing, semiannual report, or annual report on Fidelity's web site at http://www.fidelity.com, http://www.institutional.fidelity.com, or http://www.401k.com, as applicable.
NOT FDIC INSURED •MAY LOSE VALUE •NO BANK GUARANTEE
Neither the Fund nor Fidelity Distributors Corporation is a bank.
Investment Summary (Unaudited)
Top Ten Stocks as of June 30, 2018
| % of fund's net assets | |
| Simon Property Group, Inc. | 7.7 |
| Public Storage | 7.3 |
| AvalonBay Communities, Inc. | 6.0 |
| Boston Properties, Inc. | 5.8 |
| Equity Residential (SBI) | 4.7 |
| Ventas, Inc. | 4.5 |
| Essex Property Trust, Inc. | 4.0 |
| Prologis, Inc. | 3.6 |
| SL Green Realty Corp. | 3.3 |
| Duke Realty Corp. | 3.1 |
| 50.0 |
Top Five REIT Sectors as of June 30, 2018
| % of fund's net assets | |
| REITs - Apartments | 17.2 |
| REITs - Office Property | 16.8 |
| REITs - Regional Malls | 10.4 |
| REITs - Health Care | 9.3 |
| REITs - Diversified | 8.7 |
Asset Allocation (% of fund's net assets)
| As of June 30, 2018 | ||
| Stocks | 98.1% | |
| Short-Term Investments and Net Other Assets (Liabilities) | 1.9% | |

Schedule of Investments June 30, 2018 (Unaudited)
Showing Percentage of Net Assets
| Common Stocks - 98.1% | |||
| Shares | Value | ||
| Equity Real Estate Investment Trusts (REITs) - 96.9% | |||
| REITs - Apartments - 17.2% | |||
| American Homes 4 Rent Class A | 250,800 | $5,562,744 | |
| AvalonBay Communities, Inc. | 140,542 | 24,157,764 | |
| Equity Residential (SBI) | 301,470 | 19,200,624 | |
| Essex Property Trust, Inc. | 66,948 | 16,005,258 | |
| UDR, Inc. | 116,400 | 4,369,656 | |
| 69,296,046 | |||
| REITs - Diversified - 8.7% | |||
| Digital Realty Trust, Inc. | 24,800 | 2,767,184 | |
| Duke Realty Corp. | 433,500 | 12,584,505 | |
| Equinix, Inc. | 26,200 | 11,263,118 | |
| Washington REIT (SBI) | 282,100 | 8,556,093 | |
| 35,170,900 | |||
| REITs - Health Care - 9.3% | |||
| Healthcare Realty Trust, Inc. | 267,800 | 7,787,624 | |
| Ventas, Inc. | 313,810 | 17,871,480 | |
| Welltower, Inc. | 187,728 | 11,768,668 | |
| 37,427,772 | |||
| REITs - Hotels - 7.5% | |||
| Braemar Hotels & Resorts, Inc. | 31,187 | 356,156 | |
| DiamondRock Hospitality Co. | 610,600 | 7,498,168 | |
| Host Hotels & Resorts, Inc. | 578,578 | 12,190,638 | |
| Sunstone Hotel Investors, Inc. | 596,500 | 9,913,830 | |
| 29,958,792 | |||
| REITs - Management/Investment - 1.1% | |||
| American Tower Corp. | 13,400 | 1,931,878 | |
| Retail Properties America, Inc. | 199,900 | 2,554,722 | |
| 4,486,600 | |||
| REITs - Manufactured Homes - 2.8% | |||
| Equity Lifestyle Properties, Inc. | 121,310 | 11,148,389 | |
| REITs - Office Property - 16.8% | |||
| Boston Properties, Inc. | 187,277 | 23,488,281 | |
| Corporate Office Properties Trust (SBI) | 253,900 | 7,360,561 | |
| Douglas Emmett, Inc. | 288,300 | 11,583,894 | |
| Highwoods Properties, Inc. (SBI) | 195,300 | 9,907,569 | |
| Hudson Pacific Properties, Inc. | 57,075 | 2,022,167 | |
| SL Green Realty Corp. | 131,600 | 13,229,748 | |
| 67,592,220 | |||
| REITs - Regional Malls - 10.4% | |||
| Simon Property Group, Inc. | 183,499 | 31,229,696 | |
| Taubman Centers, Inc. | 93,800 | 5,511,688 | |
| The Macerich Co. | 91,500 | 5,199,945 | |
| 41,941,329 | |||
| REITs - Shopping Centers - 6.6% | |||
| Acadia Realty Trust (SBI) | 255,700 | 6,998,509 | |
| Cedar Realty Trust, Inc. | 507,091 | 2,393,470 | |
| DDR Corp. | 239,000 | 4,278,100 | |
| Urban Edge Properties | 447,205 | 10,227,578 | |
| Weingarten Realty Investors (SBI) | 85,500 | 2,634,255 | |
| 26,531,912 | |||
| REITs - Storage - 8.6% | |||
| Extra Space Storage, Inc. | 50,100 | 5,000,481 | |
| Public Storage | 129,855 | 29,458,905 | |
| 34,459,386 | |||
| REITs - Warehouse/Industrial - 7.9% | |||
| Americold Realty Trust | 102,000 | 2,246,040 | |
| DCT Industrial Trust, Inc. | 173,350 | 11,567,646 | |
| Prologis, Inc. | 219,837 | 14,441,093 | |
| Rexford Industrial Realty, Inc. | 117,600 | 3,691,464 | |
| 31,946,243 | |||
| TOTAL EQUITY REAL ESTATE INVESTMENT TRUSTS (REITS) | 389,959,589 | ||
| Hotels, Restaurants & Leisure - 0.6% | |||
| Hotels, Resorts & Cruise Lines - 0.6% | |||
| Hilton Grand Vacations, Inc. (a) | 69,800 | 2,422,060 | |
| Real Estate Management & Development - 0.6% | |||
| Real Estate Development - 0.6% | |||
| Howard Hughes Corp. (a) | 16,700 | 2,212,750 | |
| TOTAL COMMON STOCKS | |||
| (Cost $307,146,794) | 394,594,399 | ||
| Money Market Funds - 2.4% | |||
| Fidelity Cash Central Fund, 1.93% (b) | |||
| (Cost $9,563,648) | 9,561,736 | 9,563,648 | |
| TOTAL INVESTMENT IN SECURITIES - 100.5% | |||
| (Cost $316,710,442) | 404,158,047 | ||
| NET OTHER ASSETS (LIABILITIES) - (0.5)% | (1,848,012) | ||
| NET ASSETS - 100% | $402,310,035 |
Legend
(a) Non-income producing
(b) Affiliated fund that is generally available only to investment companies and other accounts managed by Fidelity Investments. The rate quoted is the annualized seven-day yield of the fund at period end. A complete unaudited listing of the fund's holdings as of its most recent quarter end is available upon request. In addition, each Fidelity Central Fund's financial statements are available on the SEC's website or upon request.
Affiliated Central Funds
Information regarding fiscal year to date income earned by the Fund from investments in Fidelity Central Funds is as follows:
| Fund | Income earned |
| Fidelity Cash Central Fund | $22,591 |
| Fidelity Securities Lending Cash Central Fund | 159 |
| Total | $22,750 |
Amounts in the income column in the above table include any capital gain distributions from underlying funds, which are presented in the corresponding line-item in the Statement of Operations if applicable.
Investment Valuation
All investments are categorized as Level 1 under the Fair Value Hierarchy. The inputs or methodology used for valuing securities may not be an indication of the risk associated with investing in those securities. For more information on valuation inputs please refer to the Investment Valuation section in the accompanying Notes to Financial Statements.
See accompanying notes which are an integral part of the financial statements.
Financial Statements
Statement of Assets and Liabilities
| June 30, 2018 (Unaudited) | ||
| Assets | ||
| Investment in securities, at value — See accompanying schedule: Unaffiliated issuers (cost $307,146,794) | $394,594,399 | |
| Fidelity Central Funds (cost $9,563,648) | 9,563,648 | |
| Total Investment in Securities (cost $316,710,442) | $404,158,047 | |
| Cash | 40,636 | |
| Receivable for investments sold | 1,719,580 | |
| Receivable for fund shares sold | 179,684 | |
| Dividends receivable | 1,767,110 | |
| Distributions receivable from Fidelity Central Funds | 5,344 | |
| Prepaid expenses | 3,020 | |
| Other receivables | 6,350 | |
| Total assets | 407,879,771 | |
| Liabilities | ||
| Payable for investments purchased | $4,867,904 | |
| Payable for fund shares redeemed | 421,292 | |
| Accrued management fee | 177,659 | |
| Distribution and service plan fees payable | 24,873 | |
| Other affiliated payables | 45,414 | |
| Other payables and accrued expenses | 32,594 | |
| Total liabilities | 5,569,736 | |
| Net Assets | $402,310,035 | |
| Net Assets consist of: | ||
| Paid in capital | $307,727,339 | |
| Undistributed net investment income | 3,668,916 | |
| Accumulated undistributed net realized gain (loss) on investments and foreign currency transactions | 3,466,175 | |
| Net unrealized appreciation (depreciation) on investments | 87,447,605 | |
| Net Assets | $402,310,035 | |
| Initial Class: | ||
| Net Asset Value, offering price and redemption price per share ($103,440,960 ÷ 5,586,475 shares) | $18.52 | |
| Service Class: | ||
| Net Asset Value, offering price and redemption price per share ($8,315,885 ÷ 450,926 shares) | $18.44 | |
| Service Class 2: | ||
| Net Asset Value, offering price and redemption price per share ($118,868,063 ÷ 6,530,176 shares) | $18.20 | |
| Investor Class: | ||
| Net Asset Value, offering price and redemption price per share ($171,685,127 ÷ 9,326,290 shares) | $18.41 |
See accompanying notes which are an integral part of the financial statements.
Statement of Operations
| Six months ended June 30, 2018 (Unaudited) | ||
| Investment Income | ||
| Dividends | $5,180,728 | |
| Income from Fidelity Central Funds | 22,750 | |
| Total income | 5,203,478 | |
| Expenses | ||
| Management fee | $1,032,608 | |
| Transfer agent fees | 187,969 | |
| Distribution and service plan fees | 143,725 | |
| Accounting and security lending fees | 74,423 | |
| Custodian fees and expenses | 12,821 | |
| Independent trustees' fees and expenses | 1,894 | |
| Audit | 24,412 | |
| Legal | 2,568 | |
| Miscellaneous | 37,483 | |
| Total expenses before reductions | 1,517,903 | |
| Expense reductions | (15,031) | |
| Total expenses after reductions | 1,502,872 | |
| Net investment income (loss) | 3,700,606 | |
| Realized and Unrealized Gain (Loss) | ||
| Net realized gain (loss) on: | ||
| Investment securities: | ||
| Unaffiliated issuers | 4,564,562 | |
| Fidelity Central Funds | 13 | |
| Foreign currency transactions | 711 | |
| Total net realized gain (loss) | 4,565,286 | |
| Change in net unrealized appreciation (depreciation) on: | ||
| Investment securities: | ||
| Unaffiliated issuers | (3,166,459) | |
| Fidelity Central Funds | (17) | |
| Total change in net unrealized appreciation (depreciation) | (3,166,476) | |
| Net gain (loss) | 1,398,810 | |
| Net increase (decrease) in net assets resulting from operations | $5,099,416 |
See accompanying notes which are an integral part of the financial statements.
Statement of Changes in Net Assets
| Six months ended June 30, 2018 (Unaudited) | Year ended December 31, 2017 | |
| Increase (Decrease) in Net Assets | ||
| Operations | ||
| Net investment income (loss) | $3,700,606 | $7,894,374 |
| Net realized gain (loss) | 4,565,286 | 25,451,686 |
| Change in net unrealized appreciation (depreciation) | (3,166,476) | (17,612,221) |
| Net increase (decrease) in net assets resulting from operations | 5,099,416 | 15,733,839 |
| Distributions to shareholders from net investment income | (1,978,964) | (7,708,495) |
| Distributions to shareholders from net realized gain | (21,299,220) | (32,575,424) |
| Total distributions | (23,278,184) | (40,283,919) |
| Share transactions - net increase (decrease) | (1,594,498) | (109,317,815) |
| Total increase (decrease) in net assets | (19,773,266) | (133,867,895) |
| Net Assets | ||
| Beginning of period | 422,083,301 | 555,951,196 |
| End of period | $402,310,035 | $422,083,301 |
| Other Information | ||
| Undistributed net investment income end of period | $3,668,916 | $1,947,274 |
See accompanying notes which are an integral part of the financial statements.
Financial Highlights
VIP Real Estate Portfolio Initial Class
| Six months ended (Unaudited) June 30, | Years endedDecember 31, | |||||
| 2018 | 2017 | 2016 | 2015 | 2014 | 2013 | |
| Selected Per–Share Data | ||||||
| Net asset value, beginning of period | $19.44 | $20.21 | $19.61 | $19.73 | $16.35 | $17.22 |
| Income from Investment Operations | ||||||
| Net investment income (loss)A | .18 | .36 | .36B | .38 | .35 | .29 |
| Net realized and unrealized gain (loss) | –C | .42 | .74 | .33 | 4.53 | –C |
| Total from investment operations | .18 | .78 | 1.10 | .71 | 4.88 | .29 |
| Distributions from net investment income | (.10) | (.36) | (.30) | (.39) | (.31)D | (.33) |
| Distributions from net realized gain | (1.00) | (1.19) | (.20) | (.44) | (1.19)D | (.83) |
| Total distributions | (1.10) | (1.55) | (.50) | (.83) | (1.50) | (1.16) |
| Net asset value, end of period | $18.52 | $19.44 | $20.21 | $19.61 | $19.73 | $16.35 |
| Total ReturnE,F,G | 1.66% | 4.07% | 5.75% | 3.71% | 30.18% | 1.82% |
| Ratios to Average Net AssetsH,I | ||||||
| Expenses before reductions | .68%J | .68% | .67% | .67% | .68% | .69% |
| Expenses net of fee waivers, if any | .68%J | .68% | .67% | .67% | .68% | .68% |
| Expenses net of all reductions | .68%J | .67% | .66% | .67% | .67% | .68% |
| Net investment income (loss) | 2.04%J | 1.84% | 1.79%B | 1.92% | 1.84% | 1.61% |
| Supplemental Data | ||||||
| Net assets, end of period (000 omitted) | $103,441 | $107,038 | $102,666 | $99,804 | $91,749 | $57,396 |
| Portfolio turnover rateK | 46%J | 52% | 65% | 72% | 65% | 59% |
A Calculated based on average shares outstanding during the period.
B Net investment income per share reflects a large, non-recurring dividend which amounted to $.06 per share. Excluding this non-recurring dividend, the ratio of net investment income (loss) to average net assets would have been 1.47%.
C Amount represents less than $.005 per share.
D The amounts shown reflect certain reclassifications related to book to tax differences that were made in the year shown.
E Total returns for periods of less than one year are not annualized.
F Total returns do not reflect charges attributable to your insurance company's separate account. Inclusion of these charges would reduce the total returns shown.
G Total returns would have been lower if certain expenses had not been reduced during the applicable periods shown.
H Fees and expenses of any underlying Fidelity Central Funds are not included in the Fund's expense ratio. The Fund indirectly bears its proportionate share of the expenses of any underlying Fidelity Central Funds.
I Expense ratios reflect operating expenses of the class. Expenses before reductions do not reflect amounts reimbursed by the investment adviser or reductions from brokerage service arrangements or reductions from other expense offset arrangements and do not represent the amount paid by the class during periods when reimbursements or reductions occur. Expenses net of fee waivers reflect expenses after reimbursement by the investment adviser but prior to reductions from brokerage service arrangements or other expense offset arrangements. Expenses net of all reductions represent the net expenses paid by the class.
J Annualized
K Amount does not include the portfolio activity of any underlying Fidelity Central Funds.
See accompanying notes which are an integral part of the financial statements.
VIP Real Estate Portfolio Service Class
| Six months ended (Unaudited) June 30, | Years endedDecember 31, | |||||
| June 30, February 28, | 2018 | 2017 | 2016 | 2015 | 2014 | 2013 |
| Selected Per–Share Data | ||||||
| Net asset value, beginning of period | $19.37 | $20.14 | $19.56 | $19.68 | $16.32 | $17.20 |
| Income from Investment Operations | ||||||
| Net investment income (loss)A | .17 | .34 | .34B | .36 | .33 | .27 |
| Net realized and unrealized gain (loss) | –C | .42 | .74 | .33 | 4.51 | .01D |
| Total from investment operations | .17 | .76 | 1.08 | .69 | 4.84 | .28 |
| Distributions from net investment income | (.09) | (.34) | (.29) | (.37) | (.29)E | (.32) |
| Distributions from net realized gain | (1.00) | (1.19) | (.20) | (.44) | (1.19)E | (.83) |
| Total distributions | (1.10)F | (1.53) | (.50)G | (.81) | (1.48) | (1.16)H |
| Net asset value, end of period | $18.44 | $19.37 | $20.14 | $19.56 | $19.68 | $16.32 |
| Total ReturnI,J,K | 1.59% | 3.98% | 5.63% | 3.61% | 29.98% | 1.73% |
| Ratios to Average Net AssetsL,M | ||||||
| Expenses before reductions | .78%N | .78% | .77% | .77% | .78% | .78% |
| Expenses net of fee waivers, if any | .78%N | .78% | .77% | .77% | .78% | .78% |
| Expenses net of all reductions | .78%N | .77% | .76% | .76% | .77% | .78% |
| Net investment income (loss) | 1.94%N | 1.74% | 1.69%B | 1.82% | 1.75% | 1.52% |
| Supplemental Data | ||||||
| Net assets, end of period (000 omitted) | $8,316 | $7,877 | $8,781 | $4,060 | $4,056 | $3,255 |
| Portfolio turnover rateO | 46%N | 52% | 65% | 72% | 65% | 59% |
A Calculated based on average shares outstanding during the period.
B Net investment income per share reflects a large, non-recurring dividend which amounted to $.06 per share. Excluding this non-recurring dividend, the ratio of net investment income (loss) to average net assets would have been 1.38%.
C Amount represents less than $.005 per share.
D The amount shown for a share outstanding does not correspond with the aggregate net gain (loss) on investments for the period due to the timing of sales and repurchases of shares in relation to fluctuating market values of the investments of the Fund.
E The amounts shown reflect certain reclassifications related to book to tax differences that were made in the year shown.
F Total distributions of $1.10 per share is comprised of distributions from net investment income of $.094 and distributions from net realized gain of $1.004 per share.
G Total distributions of $.50 per share is comprised of distributions from net investment income of $.292 and distributions from net realized gain of $.204 per share.
H Total distributions of $1.16 per share is comprised of distributions from net investment income of $.324 and distributions from net realized gain of $.833 per share.
I Total returns for periods of less than one year are not annualized.
J Total returns do not reflect charges attributable to your insurance company's separate account. Inclusion of these charges would reduce the total returns shown.
K Total returns would have been lower if certain expenses had not been reduced during the applicable periods shown.
L Fees and expenses of any underlying Fidelity Central Funds are not included in the Fund's expense ratio. The Fund indirectly bears its proportionate share of the expenses of any underlying Fidelity Central Funds.
M Expense ratios reflect operating expenses of the class. Expenses before reductions do not reflect amounts reimbursed or waived by the investment adviser or reductions from brokerage service arrangements or reductions from other expense offset arrangements and do not represent the amount paid by the class during periods when reimbursements, waivers or reductions occur. Expenses net of fee waivers reflect expenses after reimbursement and waivers by the investment adviser but prior to reductions from brokerage service arrangements or other expense offset arrangements. Expenses net of all reductions represent the net expenses paid by the class.
N Annualized
O Amount does not include the portfolio activity of any underlying Fidelity Central Funds.
See accompanying notes which are an integral part of the financial statements.
VIP Real Estate Portfolio Service Class 2
| Six months ended (Unaudited) June 30, | Years endedDecember 31, | |||||
| 2018 | 2017 | 2016 | 2015 | 2014 | 2013 | |
| Selected Per–Share Data | ||||||
| Net asset value, beginning of period | $19.14 | $19.92 | $19.35 | $19.47 | $16.16 | $17.03 |
| Income from Investment Operations | ||||||
| Net investment income (loss)A | .15 | .31 | .31B | .33 | .30 | .24 |
| Net realized and unrealized gain (loss) | –C | .41 | .72 | .33 | 4.46 | .01D |
| Total from investment operations | .15 | .72 | 1.03 | .66 | 4.76 | .25 |
| Distributions from net investment income | (.09) | (.31) | (.26) | (.34) | (.26)E | (.29) |
| Distributions from net realized gain | (1.00) | (1.19) | (.20) | (.44) | (1.19)E | (.83) |
| Total distributions | (1.09) | (1.50) | (.46) | (.78) | (1.45) | (1.12) |
| Net asset value, end of period | $18.20 | $19.14 | $19.92 | $19.35 | $19.47 | $16.16 |
| Total ReturnF,G,H | 1.52% | 3.77% | 5.46% | 3.49% | 29.80% | 1.61% |
| Ratios to Average Net AssetsI,J | ||||||
| Expenses before reductions | .93%K | .93% | .92% | .92% | .93% | .94% |
| Expenses net of fee waivers, if any | .93%K | .93% | .92% | .92% | .93% | .93% |
| Expenses net of all reductions | .93%K | .92% | .91% | .91% | .92% | .93% |
| Net investment income (loss) | 1.79%K | 1.59% | 1.54%B | 1.67% | 1.60% | 1.37% |
| Supplemental Data | ||||||
| Net assets, end of period (000 omitted) | $118,868 | $119,798 | $213,984 | $194,640 | $200,481 | $165,134 |
| Portfolio turnover rateL | 46%K | 52% | 65% | 72% | 65% | 59% |
A Calculated based on average shares outstanding during the period.
B Net investment income per share reflects a large, non-recurring dividend which amounted to $.06 per share. Excluding this non-recurring dividend, the ratio of net investment income (loss) to average net assets would have been 1.23%.
C Amount represents less than $.005 per share.
D The amount shown for a share outstanding does not correspond with the aggregate net gain (loss) on investments for the period due to the timing of sales and repurchases of shares in relation to fluctuating market values of the investments of the Fund.
E The amounts shown reflect certain reclassifications related to book to tax differences that were made in the year shown.
F Total returns for periods of less than one year are not annualized.
G Total returns do not reflect charges attributable to your insurance company's separate account. Inclusion of these charges would reduce the total returns shown.
H Total returns would have been lower if certain expenses had not been reduced during the applicable periods shown.
I Fees and expenses of any underlying Fidelity Central Funds are not included in the Fund's expense ratio. The Fund indirectly bears its proportionate share of the expenses of any underlying Fidelity Central Funds.
J Expense ratios reflect operating expenses of the class. Expenses before reductions do not reflect amounts reimbursed by the investment adviser or reductions from brokerage service arrangements or reductions from other expense offset arrangements and do not represent the amount paid by the class during periods when reimbursements or reductions occur. Expenses net of fee waivers reflect expenses after reimbursement by the investment adviser but prior to reductions from brokerage service arrangements or other expense offset arrangements. Expenses net of all reductions represent the net expenses paid by the class.
K Annualized
L Amount does not include the portfolio activity of any underlying Fidelity Central Funds.
See accompanying notes which are an integral part of the financial statements.
VIP Real Estate Portfolio Investor Class
| Six months ended (Unaudited) June 30, | Years endedDecember 31, | |||||
| 2018 | 2017 | 2016 | 2015 | 2014 | 2013 | |
| Selected Per–Share Data | ||||||
| Net asset value, beginning of period | $19.34 | $20.11 | $19.52 | $19.64 | $16.29 | $17.15 |
| Income from Investment Operations | ||||||
| Net investment income (loss)A | .17 | .34 | .35B | .36 | .33 | .28 |
| Net realized and unrealized gain (loss) | –C | .42 | .73 | .33 | 4.50 | .01D |
| Total from investment operations | .17 | .76 | 1.08 | .69 | 4.83 | .29 |
| Distributions from net investment income | (.09) | (.35) | (.28) | (.37) | (.30)E | (.32) |
| Distributions from net realized gain | (1.00) | (1.19) | (.20) | (.44) | (1.19)E | (.83) |
| Total distributions | (1.10)F | (1.53)G | (.49)H | (.81) | (1.48)I | (1.15) |
| Net asset value, end of period | $18.41 | $19.34 | $20.11 | $19.52 | $19.64 | $16.29 |
| Total ReturnJ,K,L | 1.59% | 3.99% | 5.65% | 3.64% | 30.02% | 1.81% |
| Ratios to Average Net AssetsM,N | ||||||
| Expenses before reductions | .76%O | .76% | .75% | .75% | .76% | .77% |
| Expenses net of fee waivers, if any | .76%O | .76% | .75% | .75% | .76% | .76% |
| Expenses net of all reductions | .76%O | .75% | .74% | .74% | .75% | .76% |
| Net investment income (loss) | 1.96%O | 1.76% | 1.71%B | 1.84% | 1.76% | 1.53% |
| Supplemental Data | ||||||
| Net assets, end of period (000 omitted) | $171,685 | $187,371 | $230,521 | $222,596 | $219,550 | $138,855 |
| Portfolio turnover rateP | 46%O | 52% | 65% | 72% | 65% | 59% |
A Calculated based on average shares outstanding during the period.
B Net investment income per share reflects a large, non-recurring dividend which amounted to $.06 per share. Excluding this non-recurring dividend, the ratio of net investment income (loss) to average net assets would have been 1.39%.
C Amount represents less than $.005 per share.
D The amount shown for a share outstanding does not correspond with the aggregate net gain (loss) on investments for the period due to the timing of sales and repurchases of shares in relation to fluctuating market values of the investments of the Fund.
E The amounts shown reflect certain reclassifications related to book to tax differences that were made in the year shown.
F Total distributions of $1.10 per share is comprised of distributions from net investment income of $.094 and distributions from net realized gain of $1.004 per share.
G Total distributions of $1.53 per share is comprised of distributions from net investment income of $.345 and distributions from net realized gain of $1.189 per share.
H Total distributions of $.49 per share is comprised of distributions from net investment income of $.282 and distributions from net realized gain of $.204 per share.
I Total distributions of $1.48 per share is comprised of distributions from net investment income of $.296 and distributions from net realized gain of $1.188 per share.
J Total returns for periods of less than one year are not annualized.
K Total returns do not reflect charges attributable to your insurance company's separate account. Inclusion of these charges would reduce the total returns shown.
L Total returns would have been lower if certain expenses had not been reduced during the applicable periods shown.
M Fees and expenses of any underlying Fidelity Central Funds are not included in the Fund's expense ratio. The Fund indirectly bears its proportionate share of the expenses of any underlying Fidelity Central Funds.
N Expense ratios reflect operating expenses of the class. Expenses before reductions do not reflect amounts reimbursed by the investment adviser or reductions from brokerage service arrangements or reductions from other expense offset arrangements and do not represent the amount paid by the class during periods when reimbursements or reductions occur. Expenses net of fee waivers reflect expenses after reimbursement by the investment adviser but prior to reductions from brokerage service arrangements or other expense offset arrangements. Expenses net of all reductions represent the net expenses paid by the class.
O Annualized
P Amount does not include the portfolio activity of any underlying Fidelity Central Funds.
See accompanying notes which are an integral part of the financial statements.
Notes to Financial Statements (Unaudited)
For the period ended June 30, 2018
1. Organization.
VIP Real Estate Portfolio (the Fund) is a non-diversified fund of Variable Insurance Products Fund IV (the Trust) and is authorized to issue an unlimited number of shares. The Trust is registered under the Investment Company Act of 1940, as amended (the 1940 Act), as an open-end management investment company organized as a Massachusetts business trust. Shares of the Fund may only be purchased by insurance companies for the purpose of funding variable annuity or variable life insurance contracts. The Fund offers the following classes of shares: Initial Class shares, Service Class shares, Service Class 2 shares and Investor Class shares. All classes have equal rights and voting privileges, except for matters affecting a single class.
2. Investments in Fidelity Central Funds.
The Fund invests in Fidelity Central Funds, which are open-end investment companies generally available only to other investment companies and accounts managed by the investment adviser and its affiliates. The Fund's Schedule of Investments lists each of the Fidelity Central Funds held as of period end, if any, as an investment of the Fund, but does not include the underlying holdings of each Fidelity Central Fund. As an Investing Fund, the Fund indirectly bears its proportionate share of the expenses of the underlying Fidelity Central Funds.
The Money Market Central Funds seek preservation of capital and current income and are managed by Fidelity Investments Money Management, Inc. (FIMM), an affiliate of the investment adviser. Annualized expenses of the Money Market Central Funds as of their most recent shareholder report date are less than .005%.
A complete unaudited list of holdings for each Fidelity Central Fund is available upon request or at the Securities and Exchange Commission (the SEC) website at www.sec.gov. In addition, the financial statements of the Fidelity Central Funds are available on the SEC website or upon request.
3. Significant Accounting Policies.
The Fund is an investment company and applies the accounting and reporting guidance of the Financial Accounting Standards Board (FASB) Accounting Standards Codification Topic 946 Financial Services – Investments Companies. The financial statements have been prepared in conformity with accounting principles generally accepted in the United States of America (GAAP), which require management to make certain estimates and assumptions at the date of the financial statements. Actual results could differ from those estimates. Subsequent events, if any, through the date that the financial statements were issued have been evaluated in the preparation of the financial statements. The following summarizes the significant accounting policies of the Fund:
Investment Valuation. Investments are valued as of 4:00 p.m. Eastern time on the last calendar day of the period. The Board of Trustees (the Board) has delegated the day to day responsibility for the valuation of the Fund's investments to the Fair Value Committee (the Committee) established by the Fund's investment adviser. In accordance with valuation policies and procedures approved by the Board, the Fund attempts to obtain prices from one or more third party pricing vendors or brokers to value its investments. When current market prices, quotations or currency exchange rates are not readily available or reliable, investments will be fair valued in good faith by the Committee, in accordance with procedures adopted by the Board. Factors used in determining fair value vary by investment type and may include market or investment specific events. The frequency with which these procedures are used cannot be predicted and they may be utilized to a significant extent. The Committee oversees the Fund's valuation policies and procedures and reports to the Board on the Committee's activities and fair value determinations. The Board monitors the appropriateness of the procedures used in valuing the Fund's investments and ratifies the fair value determinations of the Committee.
The Fund categorizes the inputs to valuation techniques used to value its investments into a disclosure hierarchy consisting of three levels as shown below:
- Level 1 – quoted prices in active markets for identical investments
- Level 2 – other significant observable inputs (including quoted prices for similar investments, interest rates, prepayment speeds, etc.)
- Level 3 – unobservable inputs (including the Fund's own assumptions based on the best information available)
Valuation techniques used to value the Fund's investments by major category are as follows:
Equity securities, including restricted securities, for which market quotations are readily available, are valued at the last reported sale price or official closing price as reported by a third party pricing vendor on the primary market or exchange on which they are traded and are categorized as Level 1 in the hierarchy. In the event there were no sales during the day or closing prices are not available, securities are valued at the last quoted bid price or may be valued using the last available price and are generally categorized as Level 2 in the hierarchy. For foreign equity securities, when market or security specific events arise, comparisons to the valuation of American Depositary Receipts (ADRs), futures contracts, Exchange-Traded Funds (ETFs) and certain indexes as well as quoted prices for similar securities may be used and would be categorized as Level 2 in the hierarchy. Utilizing these techniques may result in transfers between Level 1 and Level 2. For equity securities, including restricted securities, where observable inputs are limited, assumptions about market activity and risk are used and these securities may be categorized as Level 3 in the hierarchy.
Investments in open-end mutual funds, including the Fidelity Central Funds, are valued at their closing net asset value (NAV) each business day and are categorized as Level 1 in the hierarchy.
Changes in valuation techniques may result in transfers in or out of an assigned level within the disclosure hierarchy.
Foreign Currency. The Fund may use foreign currency contracts to facilitate transactions in foreign-denominated securities. Gains and losses from these transactions may arise from changes in the value of the foreign currency or if the counterparties do not perform under the contracts' terms.
Foreign-denominated assets, including investment securities, and liabilities are translated into U.S. dollars at the exchange rates at period end. Purchases and sales of investment securities, income and dividends received and expenses denominated in foreign currencies are translated into U.S. dollars at the exchange rate in effect on the transaction date.
The effects of exchange rate fluctuations on investments are included with the net realized and unrealized gain (loss) on investment securities. Other foreign currency transactions resulting in realized and unrealized gain (loss) are disclosed separately.
Investment Transactions and Income. For financial reporting purposes, the Fund's investment holdings and NAV include trades executed through the end of the last business day of the period. The NAV per share for processing shareholder transactions is calculated as of the close of business of the New York Stock Exchange (NYSE), normally 4:00 p.m. Eastern time and includes trades executed through the end of the prior business day. Gains and losses on securities sold are determined on the basis of identified cost. Dividend income is recorded on the ex-dividend date, except for certain dividends from foreign securities where the ex-dividend date may have passed, which are recorded as soon as the Fund is informed of the ex-dividend date. Non-cash dividends included in dividend income, if any, are recorded at the fair market value of the securities received. Income and capital gain distributions from Fidelity Central Funds, if any, are recorded on the ex-dividend date. Certain distributions received by the Fund represent a return of capital or capital gain. The Fund determines the components of these distributions subsequent to the ex-dividend date, based upon receipt of tax filings or other correspondence relating to the underlying investment. These distributions are recorded as a reduction of cost of investments and/or as a realized gain. Investment income is recorded net of foreign taxes withheld where recovery of such taxes is uncertain.
Class Allocations and Expenses. Investment income, realized and unrealized capital gains and losses, common expenses of the Fund, and certain fund-level expense reductions, if any, are allocated daily on a pro-rata basis to each class based on the relative net assets of each class to the total net assets of the Fund. Each class differs with respect to transfer agent and distribution and service plan fees incurred. Certain expense reductions may also differ by class. For the reporting period, the allocated portion of income and expenses to each class as a percent of its average net assets may vary due to the timing of recording these transactions in relation to fluctuating net assets of the classes. Expenses directly attributable to a fund are charged to that fund. Expenses attributable to more than one fund are allocated among the respective funds on the basis of relative net assets or other appropriate methods. Expense estimates are accrued in the period to which they relate and adjustments are made when actual amounts are known.
Income Tax Information and Distributions to Shareholders. Each year, the Fund intends to qualify as a regulated investment company under Subchapter M of the Internal Revenue Code, including distributing substantially all of its taxable income and realized gains. As a result, no provision for U.S. Federal income taxes is required. The Fund files a U.S. federal tax return, in addition to state and local tax returns as required. The Fund's federal income tax returns are subject to examination by the Internal Revenue Service (IRS) for a period of three fiscal years after they are filed. State and local tax returns may be subject to examination for an additional fiscal year depending on the jurisdiction. Foreign taxes are provided for based on the Fund's understanding of the tax rules and rates that exist in the foreign markets in which it invests.
Distributions are declared and recorded on the ex-dividend date. Income and capital gain distributions are declared separately for each class. Income and capital gain distributions are determined in accordance with income tax regulations, which may differ from GAAP.
Capital accounts within the financial statements are adjusted for permanent book-tax differences. These adjustments have no impact on net assets or the results of operations. Capital accounts are not adjusted for temporary book-tax differences which will reverse in a subsequent period.
Book-tax differences are primarily due to short-term capital gains, foreign currency transactions, and losses deferred due to wash sales and excise tax regulations.
As of period end, the cost and unrealized appreciation (depreciation) in securities, and derivatives if applicable, for federal income tax purposes were as follows:
| Gross unrealized appreciation | $92,221,756 |
| Gross unrealized depreciation | (6,068,761) |
| Net unrealized appreciation (depreciation) | $86,152,995 |
| Tax cost | $318,005,052 |
4. Purchases and Sales of Investments.
Purchases and sales of securities, other than short-term securities, aggregated $88,642,843 and $109,746,327, respectively.
5. Fees and Other Transactions with Affiliates.
Management Fee. Fidelity SelectCo, LLC (the investment adviser)and its affiliates provide the Fund with investment management related services for which the Fund pays a monthly management fee. The management fee is the sum of an individual fund fee rate that is based on an annual rate of .30% of the Fund's average net assets and an annualized group fee rate that averaged .24% during the period. The group fee rate is based upon the average net assets of all the mutual funds advised by Fidelity Management & Research Company (FMR) and the investment adviser. The group fee rate decreases as assets under management increase and increases as assets under management decrease. For the reporting period, the total annualized management fee rate was .54% of the Fund's average net assets.
Distribution and Service Plan Fees. In accordance with Rule 12b-1 of the 1940 Act, the Fund has adopted separate 12b-1 Plans for each Service Class of shares. Each Service Class pays Fidelity Distributors Corporation (FDC), an affiliate of the investment adviser, a service fee. For the period, the service fee is based on an annual rate of .10% of Service Class' average net assets and .25% of Service Class 2's average net assets.
For the period, total fees, all of which were re-allowed to insurance companies for the distribution of shares and providing shareholder support services, were as follows:
| Service Class | $3,914 |
| Service Class 2 | 139,811 |
| $143,725 |
Transfer Agent Fees. Fidelity Investments Institutional Operations Company, Inc. (FIIOC), an affiliate of the investment adviser, is the Fund's transfer, dividend disbursing, and shareholder servicing agent. FIIOC receives an asset-based fee with respect to each class. Each class pays a fee for transfer agent services, typesetting and printing and mailing of shareholder reports, excluding mailing of proxy statements, equal to an annual rate of class-level average net assets. The annual rate for Investor Class is .15% and the annual rate for all other classes is .07%. For the period, transfer agent fees for each class were as follows:
| Initial Class | $31,549 |
| Service Class | 2,520 |
| Service Class 2 | 35,987 |
| Investor Class | 117,913 |
| $187,969 |
Accounting and Security Lending Fees. Fidelity Service Company, Inc. (FSC), an affiliate of the investment adviser, maintains the Fund's accounting records. The accounting fee is based on the level of average net assets for each month. Under a separate contract, FSC administers the security lending program. The security lending fee is based on the number and duration of lending transactions. For the period, the fees were equivalent to an annualized rate of .04%.
Brokerage Commissions. The Fund placed a portion of its portfolio transactions with brokerage firms which are affiliates of the investment adviser. Brokerage commissions are included in net realized gain (loss) and change in net unrealized appreciation (depreciation) in the Statement of Operations. The commissions paid to these affiliated firms were $1,407 for the period.
Interfund Trades. The Fund may purchase from or sell securities to other Fidelity Funds under procedures adopted by the Board. The procedures have been designed to ensure these interfund trades are executed in accordance with Rule 17a-7 of the 1940 Act. Interfund trades are included within the respective purchases and sales amounts shown in the Purchases and Sales of Investments note.
Other. During the period, the investment adviser reimbursed the Fund for certain losses in the amount of $1,849.
6. Committed Line of Credit.
The Fund participates with other funds managed by the investment adviser or an affiliate in a $4.25 billion credit facility (the "line of credit") to be utilized for temporary or emergency purposes to fund shareholder redemptions or for other short-term liquidity purposes. The Fund has agreed to pay commitment fees on its pro-rata portion of the line of credit, which amounted to $579 and is reflected in Miscellaneous expenses on the Statement of Operations. During the period, the Fund did not borrow on this line of credit.
7. Security Lending.
The Fund lends portfolio securities through a lending agent from time to time in order to earn additional income. On the settlement date of the loan, the Fund receives collateral (in the form of U.S. Treasury obligations, letters of credit and/or cash) against the loaned securities and maintains collateral in an amount not less than 100% of the market value of the loaned securities during the period of the loan. The market value of the loaned securities is determined at the close of business of the Fund and any additional required collateral is delivered to the Fund on the next business day. The Fund or borrower may terminate the loan at any time, and if the borrower defaults on its obligation to return the securities loaned because of insolvency or other reasons, the Fund may apply collateral received from the borrower against the obligation. The Fund may experience delays and costs in recovering the securities loaned. Any cash collateral received is invested in the Fidelity Securities Lending Cash Central Fund. At period end, there were no security loans outstanding. Security lending income represents the income earned on investing cash collateral, less rebates paid to borrowers and any lending agent fees associated with the loan, plus any premium payments received for lending certain types of securities. Security lending income is presented in the Statement of Operations as a component of income from Fidelity Central Funds. Total security lending income during the period amounted to $159.
8. Expense Reductions.
Commissions paid to certain brokers with whom the investment adviser, or its affiliates, places trades on behalf of the Fund include an amount in addition to trade execution, which may be rebated back to the Fund to offset certain expenses. This amount totaled $12,642 for the period. In addition, through arrangements with the Fund's custodian, credits realized as a result of certain uninvested cash balances were used to reduce the Fund's expenses. During the period, these credits reduced the Fund's custody expenses by $488.
In addition, during the period the investment adviser reimbursed and/or waived a portion of fund-level operating expenses in the amount of $1,901.
9. Distributions to Shareholders.
Distributions to shareholders of each class were as follows:
| Six months ended June 30, 2018 | Year ended December 31, 2017 | |
| From net investment income | ||
| Initial Class | $515,292 | $1,944,865 |
| Service Class | 41,694 | 137,817 |
| Service Class 2 | 553,993 | 2,176,827 |
| Investor Class | 867,985 | 3,448,986 |
| Total | $1,978,964 | $7,708,495 |
| From net realized gain | ||
| Initial Class | $5,333,541 | $5,887,635 |
| Service Class | 445,325 | 517,241 |
| Service Class 2 | 6,249,537 | 12,818,755 |
| Investor Class | 9,270,817 | 13,351,793 |
| Total | $21,299,220 | $32,575,424 |
10. Share Transactions.
Transactions for each class of shares were as follows:
| Shares | Shares | Dollars | Dollars | |
| Six months ended June 30, 2018 | Year ended December 31, 2017 | Six months ended June 30, 2018 | Year ended December 31, 2017 | |
| Initial Class | ||||
| Shares sold | 333,876 | 1,328,932 | $5,652,313 | $25,892,801 |
| Reinvestment of distributions | 356,202 | 408,095 | 5,848,833 | 7,832,500 |
| Shares redeemed | (610,441) | (1,310,835) | (10,846,720) | (25,436,492) |
| Net increase (decrease) | 79,637 | 426,192 | $654,426 | $8,288,809 |
| Service Class | ||||
| Shares sold | 82,925 | 106,242 | $1,465,081 | $2,065,928 |
| Reinvestment of distributions | 29,769 | 34,280 | 487,019 | 655,058 |
| Shares redeemed | (68,442) | (169,763) | (1,169,437) | (3,268,034) |
| Net increase (decrease) | 44,252 | (29,241) | $782,663 | $(547,048) |
| Service Class 2 | ||||
| Shares sold | 763,303 | 1,470,560 | $13,143,139 | $28,220,688 |
| Reinvestment of distributions | 421,271 | 794,853 | 6,803,530 | 14,995,582 |
| Shares redeemed | (912,516) | (6,751,913) | (15,739,206) | (126,077,833) |
| Net increase (decrease) | 272,058 | (4,486,500) | $4,207,463 | $(82,861,563) |
| Investor Class | ||||
| Shares sold | 116,445 | 171,163 | $2,008,034 | $3,348,089 |
| Reinvestment of distributions | 620,870 | 880,677 | 10,138,802 | 16,800,778 |
| Shares redeemed | (1,101,601) | (2,825,724) | (19,385,886) | (54,346,880) |
| Net increase (decrease) | (364,286) | (1,773,884) | $(7,239,050) | $(34,198,013) |
11. Other.
The Fund's organizational documents provide former and current trustees and officers with a limited indemnification against liabilities arising in connection with the performance of their duties to the Fund. In the normal course of business, the Fund may also enter into contracts that provide general indemnifications. The Fund's maximum exposure under these arrangements is unknown as this would be dependent on future claims that may be made against the Fund. The risk of material loss from such claims is considered remote.
At the end of the period, the investment adviser or its affiliates were the owners of record of 52% of the total outstanding shares of the Fund and one otherwise unaffiliated shareholder was the owner of record of 13% of the total outstanding shares of the Fund.
Shareholder Expense Example
As a shareholder of the Fund, you incur two types of costs: (1) transaction costs and (2) ongoing costs, including management fees, distribution and/or service (12b-1) fees and other Fund expenses. This Example is intended to help you understand your ongoing costs (in dollars) of investing in the Fund and to compare these costs with the ongoing costs of investing in other mutual funds.
The Example is based on an investment of $1,000 invested at the beginning of the period and held for the entire period (January 1, 2018 to June 30, 2018).
Actual Expenses
The first line of the accompanying table for each class of the Fund provides information about actual account values and actual expenses. You may use the information in this line, together with the amount you invested, to estimate the expenses that you paid over the period. Simply divide your account value by $1,000.00 (for example, an $8,600 account value divided by $1,000.00 = 8.6), then multiply the result by the number in the first line for a class of the Fund under the heading entitled "Expenses Paid During Period" to estimate the expenses you paid on your account during this period. The estimate of expenses does not include any fees or other expenses of any variable annuity or variable life insurance product. If they were, the estimate of expenses you paid during the period would be higher, and your ending account value would be lower. In addition, the Fund, as a shareholder in the underlying Fidelity Central Funds, will indirectly bear its pro-rata share of the fees and expenses incurred by the underlying Fidelity Central Funds. These fees and expenses are not included in the Fund's annualized expense ratio used to calculate the expense estimate in the table below.
Hypothetical Example for Comparison Purposes
The second line of the accompanying table for each class of the Fund provides information about hypothetical account values and hypothetical expenses based on a Class' actual expense ratio and an assumed rate of return of 5% per year before expenses, which is not the Class' actual return. The hypothetical account values and expenses may not be used to estimate the actual ending account balance or expenses you paid for the period. You may use this information to compare the ongoing costs of investing in the Fund and other funds. To do so, compare this 5% hypothetical example with the 5% hypothetical examples that appear in the shareholder reports of the other funds. The estimate of expenses does not include any fees or other expenses of any variable annuity or variable life insurance product. If they were, the estimate of expenses you paid during the period would be higher, and your ending account value would be lower. In addition, the Fund, as a shareholder in the underlying Fidelity Central Funds, will indirectly bear its pro-rata share of the fees and expenses incurred by the underlying Fidelity Central Funds. These fees and expenses are not included in the Fund's annualized expense ratio used to calculate the expense estimate in the table below.
Please note that the expenses shown in the table are meant to highlight your ongoing costs only and do not reflect any transaction costs. Therefore, the second line of the table is useful in comparing ongoing costs only, and will not help you determine the relative total costs of owning different funds.
| Annualized Expense Ratio-A | Beginning Account Value January 1, 2018 | Ending Account Value June 30, 2018 | Expenses Paid During Period-B January 1, 2018 to June 30, 2018 | |
| Initial Class | .68% | |||
| Actual | $1,000.00 | $1,016.60 | $3.40 | |
| Hypothetical-C | $1,000.00 | $1,021.42 | $3.41 | |
| Service Class | .78% | |||
| Actual | $1,000.00 | $1,015.90 | $3.90 | |
| Hypothetical-C | $1,000.00 | $1,020.93 | $3.91 | |
| Service Class 2 | .93% | |||
| Actual | $1,000.00 | $1,015.20 | $4.65 | |
| Hypothetical-C | $1,000.00 | $1,020.18 | $4.66 | |
| Investor Class | .76% | |||
| Actual | $1,000.00 | $1,015.90 | $3.80 | |
| Hypothetical-C | $1,000.00 | $1,021.03 | $3.81 |
A Annualized expense ratio reflects expenses net of applicable fee waivers.
B Expenses are equal to each Class' annualized expense ratio, multiplied by the average account value over the period, multiplied by 181/365 (to reflect the one-half year period).
C 5% return per year before expenses
Board Approval of Investment Advisory Contracts and Management Fees
VIP Real Estate Portfolio
Each year, the Board of Trustees, including the Independent Trustees (together, the Board), votes on the renewal of the management contract with Fidelity SelectCo, LLC (SelectCo), an affiliate of Fidelity Management & Research Company (FMR), and the sub-advisory agreements with affiliates of FMR (together, the Advisory Contracts) for the fund. SelectCo and the sub-advisers are collectively referred to herein as the Investment Advisers. The Board, assisted by the advice of fund counsel and Independent Trustees' counsel, requests and considers a broad range of information relevant to the renewal of the Advisory Contracts throughout the year.
The Board meets regularly and, at each of its meetings, covers an extensive agenda of topics and materials and considers factors that are relevant to its annual consideration of the renewal of the fund's Advisory Contracts, including the services and support provided to the fund and its shareholders. The Board has established four standing committees (Committees) — Operations, Audit, Fair Valuation, and Governance and Nominating — each composed of and chaired by Independent Trustees with varying backgrounds, to which the Board has assigned specific subject matter responsibilities in order to enhance effective decision-making by the Board. The Operations Committee, of which all of the Independent Trustees are members, meets regularly throughout the year and considers, among other matters, information specifically related to the annual consideration of the renewal of the fund's Advisory Contracts. The Board, acting directly and through its Committees, requests and receives information concerning the annual consideration of the renewal of the fund's Advisory Contracts. The Board also meets as needed to review matters specifically related to the Board's annual consideration of the renewal of the Advisory Contracts. Members of the Board may also meet with trustees of other Fidelity funds through ad hoc joint committees to discuss certain matters relevant to all of the Fidelity funds.
At its January 2018 meeting, the Board unanimously determined to renew the fund's Advisory Contracts. In reaching its determination, the Board considered all factors it believed relevant, including (i) the nature, extent, and quality of the services to be provided to the fund and its shareholders (including the investment performance of the fund); (ii) the competitiveness of the fund's management fee and total expense ratio relative to peer funds; (iii) the total costs of the services to be provided by and the profits to be realized by Fidelity from its relationships with the fund; and (iv) the extent to which, if any, economies of scale exist and would be realized as the fund grows, and whether any economies of scale are appropriately shared with fund shareholders.
In considering whether to renew the Advisory Contracts for the fund, the Board reached a determination, with the assistance of fund counsel and Independent Trustees' counsel and through the exercise of its business judgment, that the renewal of the Advisory Contracts was in the best interests of the fund and its shareholders and that the compensation payable under the Advisory Contracts was fair and reasonable. The Board's decision to renew the Advisory Contracts was not based on any single factor, but rather was based on a comprehensive consideration of all the information provided to the Board at its meetings throughout the year. The Board, in reaching its determination to renew the Advisory Contracts, was aware that shareholders of the fund have a broad range of investment choices available to them, including a wide choice among funds offered by Fidelity's competitors, and that the fund's shareholders, who have the opportunity to review and weigh the disclosure provided by the fund in its prospectus and other public disclosures, have chosen to invest in this fund, which is part of the Fidelity family of funds.
Amendment to Group Fee Rate. The Board also ratified an amendment to the management contract for the fund to add an additional breakpoint to the group fee schedule, which was effective October 1, 2017. The Board noted that the additional breakpoint would result in lower management fee rates to the extent that assets under management that are included in group fee calculations increase above the new breakpoint.
Nature, Extent, and Quality of Services Provided. The Board considered the staffing of the Investment Advisers as it relates to the fund, including the backgrounds of investment personnel of SelectCo, and also considered the fund's investment objective, strategies, and related investment philosophy. The Independent Trustees also had discussions with senior management of Fidelity's investment operations and investment groups. The Board considered the structure of the investment personnel compensation program and whether this structure provides appropriate incentives to act in the best interests of the fund. Additionally, the Board considered the portfolio managers' investments, if any, in the funds that they manage.Resources Dedicated to Investment Management and Support Services. The Board reviewed the general qualifications and capabilities of the Investment Advisers' investment staffs, including their size, education, experience, and resources, as well as Fidelity's approach to recruiting, training, managing, and compensating investment personnel. The Board noted that Fidelity has continued to increase the resources devoted to non-U.S. offices, including expansion of Fidelity's global investment organization. The Board also noted that Fidelity's analysts have extensive resources, tools and capabilities that allow them to conduct sophisticated quantitative and fundamental analysis, as well as credit analysis of issuers, counterparties and guarantors. Further, the Board considered that Fidelity's investment professionals have sufficient access to global information and data so as to provide competitive investment results over time, and that those professionals also have access to sophisticated tools that permit them to assess portfolio construction and risk and performance attribution characteristics continuously, as well as to transmit new information and research conclusions rapidly around the world. Additionally, in its deliberations, the Board considered Fidelity's trading, risk management, compliance, and technology and operations capabilities and resources, which are integral parts of the investment management process.Shareholder and Administrative Services. The Board considered (i) the nature, extent, quality, and cost of advisory, administrative, and shareholder services performed by the Investment Advisers and their affiliates under the Advisory Contracts and under separate agreements covering transfer agency, pricing and bookkeeping, and securities lending services for the fund; (ii) the nature and extent of the supervision of third party service providers, principally custodians, subcustodians, and pricing vendors; and (iii) the resources devoted to, and the record of compliance with, the fund's compliance policies and procedures. The Board also reviewed the allocation of fund brokerage, including allocations to brokers affiliated with the Investment Advisers, the use of brokerage commissions to pay fund expenses, and the use of "soft" commission dollars to pay for research services.The Board noted that the growth of fund assets over time across the complex allows Fidelity to reinvest in the development of services designed to enhance the value or convenience of the Fidelity funds as investment vehicles. These services include 24-hour access to account information and market information through telephone representatives and over the Internet, investor education materials and asset allocation tools, and the expanded availability of Fidelity Investor Centers.The Board noted that it and the boards of certain other Fidelity funds had formed an ad hoc Committee on Transfer Agency Fees to review the variety of transfer agency fee structures throughout the industry and Fidelity's competitive positioning with respect to industry participants.Investment in a Large Fund Family. The Board considered the benefits to shareholders of investing in a Fidelity fund, including the benefits of investing in a fund that is part of a large family of funds offering a variety of investment disciplines and providing a large variety of mutual fund investor services. The Board noted that Fidelity had taken, or had made recommendations that resulted in the Fidelity funds taking, a number of actions over the previous year that benefited particular funds, including: (i) continuing to dedicate additional resources to Fidelity's investment research process, which includes meetings with management of issuers in which the funds invest, and to the support of the senior management team that oversees asset management; (ii) continuing efforts to enhance Fidelity's global research capabilities; (iii) launching new funds and making other enhancements to meet client needs; (iv) launching new share classes of existing funds; (v) eliminating purchase minimums and broadening eligibility requirements for certain lower-priced share classes; (vi) reducing management fees and total expenses for certain growth equity funds and index funds; (vii) lowering expense caps for certain existing funds and classes to reduce expenses borne by shareholders; (viii) eliminating short-term redemption fees for certain funds; (ix) introducing a new pricing structure for certain funds of funds that is expected to reduce overall expenses paid by shareholders; (x) rationalizing product lines and gaining increased efficiencies through proposals for fund mergers and share class consolidations; (xi) continuing to develop, acquire and implement systems and technology to improve services to the funds and shareholders, strengthen information security, and increase efficiency; and (xii) implementing enhancements to further strengthen Fidelity's product line to increase investors' probability of success in achieving their investment goals, including retirement income goals.Investment Performance. The Board considered whether the fund has operated in accordance with its investment objective, as well as its record of compliance with its investment restrictions and its performance history.The Board took into account discussions with representatives of SelectCo about fund investment performance that occur at Board meetings throughout the year. In this regard the Board noted that as part of regularly scheduled fund reviews and other reports to the Board on fund performance, the Board considers annualized return information for the fund for different time periods, measured against a securities market index ("benchmark index"). In its evaluation of fund investment performance at meetings throughout the year, the Board gave particular attention to information indicating underperformance of certain Fidelity funds for specific time periods and discussed with the Investment Advisers the reasons for such underperformance.In addition to reviewing absolute and relative fund performance, the Independent Trustees periodically consider the appropriateness of fund performance metrics in evaluating the results achieved. In general, the Independent Trustees believe that fund performance should be evaluated based on net performance (after fees and expenses) of both the highest performing and lowest performing fund share classes, where applicable, compared to appropriate benchmark indices, over appropriate time periods that may include full market cycles, taking into account relevant factors, including the following: general market conditions; issuer-specific information; and fund cash flows and other factors. Depending on the circumstances, the Independent Trustees may be satisfied with a fund's performance notwithstanding that it lags its benchmark index for certain periods.The Independent Trustees recognize that shareholders evaluate performance on a net basis over their own holding periods, for which one-, three-, and five-year periods are often used as a proxy. For this reason, the performance information reviewed by the Board also included net cumulative total return information for the fund and an appropriate benchmark index for the most recent one-, three-, and five-year periods ended June 30, 2017.Based on its review, the Board concluded that the nature, extent, and quality of services provided to the fund under the Advisory Contracts should continue to benefit the shareholders of the fund.Competitiveness of Management Fee and Total Expense Ratio. The Board considered the fund's management fee and total expense ratio compared to "mapped groups" of competitive funds and classes created for the purpose of facilitating the Trustees' analysis of the competitiveness of management fees and total expenses. Fidelity creates "mapped groups" by combining similar Lipper investment objective categories that have comparable investment mandates. For this purpose, all sector focused equity variable annuity funds are grouped in the same mapped group. Combining Lipper investment objective categories aids the Board's management fee and total expense ratio comparisons by broadening the competitive group used for comparison.Management Fee. The Board considered two proprietary management fee comparisons for the 12-month periods ended June 30 shown in basis points (BP) in the chart below. The group of Lipper funds used by the Board for management fee comparisons is referred to below as the "Total Mapped Group." The Total Mapped Group comparison focuses on a fund's standing in terms of gross management fees before expense reimbursements or caps relative to the total universe of funds with comparable investment mandates (i.e., sector equities), regardless of whether their management fee structures also are comparable. Funds with comparable management fee structures have similar management fee contractual arrangements (e.g., flat rate charged for advisory services, all-inclusive fee rate, etc.). "TMG %" represents the percentage of funds in the Total Mapped Group that had management fees that were lower than the fund's. For example, a hypothetical TMG % of 20% would mean that 80% of the funds in the Total Mapped Group had higher, and 20% had lower, management fees than the fund. The fund's actual TMG %s and the number of funds in the Total Mapped Group are in the chart below. The "Asset-Size Peer Group" (ASPG) comparison focuses on a fund's standing relative to a subset of non-Fidelity funds within the Total Mapped Group that are similar in size and management fee structure. For example, if a fund is in the first quartile of the ASPG, the fund's management fee ranks in the least expensive or lowest 25% of funds in the ASPG. The ASPG represents at least 15% of the funds in the Total Mapped Group with comparable asset size and management fee structures, subject to a minimum of 50 funds (or all funds in the Total Mapped Group if fewer than 50). Additional information, such as the ASPG quartile in which the fund's management fee rate ranked, is also included in the chart and considered by the Board.VIP Real Estate Portfolio

![]()
VIPRE-SANN-0818
1.787989.115
Fidelity® Variable Insurance Products: Technology Portfolio Semi-Annual Report June 30, 2018 |
|
Contents
To view a fund's proxy voting guidelines and proxy voting record for the 12-month period ended June 30, visit http://www.fidelity.com/proxyvotingresults or visit the Securities and Exchange Commission's (SEC) web site at http://www.sec.gov.
You may also call 1-877-208-0098 to request a free copy of the proxy voting guidelines.
Fidelity® Variable Insurance Products are separate account options which are purchased through a variable insurance contract.
Standard & Poor's, S&P and S&P 500 are registered service marks of The McGraw-Hill Companies, Inc. and have been licensed for use by Fidelity Distributors Corporation.
Other third-party marks appearing herein are the property of their respective owners.
All other marks appearing herein are registered or unregistered trademarks or service marks of FMR LLC or an affiliated company. © 2018 FMR LLC. All rights reserved.
This report and the financial statements contained herein are submitted for the general information of the shareholders of the Fund. This report is not authorized for distribution to prospective investors in the Fund unless preceded or accompanied by an effective prospectus.
A fund files its complete schedule of portfolio holdings with the SEC for the first and third quarters of each fiscal year on Form N-Q. Forms N-Q are available on the SEC’s web site at http://www.sec.gov. A fund's Forms N-Q may be reviewed and copied at the SEC’s Public Reference Room in Washington, DC. Information regarding the operation of the SEC's Public Reference Room may be obtained by calling 1-800-SEC-0330.
For a complete list of a fund's portfolio holdings, view the most recent holdings listing, semiannual report, or annual report on Fidelity's web site at http://www.fidelity.com, http://www.institutional.fidelity.com, or http://www.401k.com, as applicable.
NOT FDIC INSURED •MAY LOSE VALUE •NO BANK GUARANTEE
Neither the Fund nor Fidelity Distributors Corporation is a bank.
Investment Summary (Unaudited)
Top Ten Stocks as of June 30, 2018
| % of fund's net assets | |
| Microsoft Corp. | 12.1 |
| NVIDIA Corp. | 5.4 |
| Salesforce.com, Inc. | 3.5 |
| Adobe Systems, Inc. | 3.2 |
| Parametric Technology Corp. | 3.0 |
| Alibaba Group Holding Ltd. sponsored ADR | 3.0 |
| Electronic Arts, Inc. | 2.6 |
| Activision Blizzard, Inc. | 2.6 |
| Apple, Inc. | 2.5 |
| Qualcomm, Inc. | 2.4 |
| 40.3 |
Top Industries (% of fund's net assets)
| As of June 30, 2018 | ||
| Software | 41.6% | |
| Semiconductors & Semiconductor Equipment | 22.1% | |
| Internet Software & Services | 13.6% | |
| IT Services | 5.5% | |
| Electronic Equipment & Components | 4.3% | |
| All Others* | 12.9% | |
* Includes short-term investments and net other assets (liabilities).
Schedule of Investments June 30, 2018 (Unaudited)
Showing Percentage of Net Assets
| Common Stocks - 97.7% | |||
| Shares | Value | ||
| Air Freight & Logistics - 0.2% | |||
| Air Freight & Logistics - 0.2% | |||
| Best, Inc. ADR | 118,800 | $1,451,736 | |
| Automobiles - 2.2% | |||
| Automobile Manufacturers - 2.2% | |||
| Tesla, Inc. (a)(b) | 54,700 | 18,759,365 | |
| Biotechnology - 0.0% | |||
| Biotechnology - 0.0% | |||
| BeiGene Ltd. ADR (a) | 500 | 76,865 | |
| Communications Equipment - 1.4% | |||
| Communications Equipment - 1.4% | |||
| Applied Optoelectronics, Inc. (a) | 14,700 | 660,030 | |
| Cisco Systems, Inc. | 70,400 | 3,029,312 | |
| CommScope Holding Co., Inc. (a) | 71,100 | 2,076,476 | |
| Hytera Communications Corp. Ltd. Class A | 1,329,197 | 1,676,302 | |
| Lumentum Holdings, Inc. (a) | 14,100 | 816,390 | |
| Telefonaktiebolaget LM Ericsson (B Shares) sponsored ADR | 152,000 | 1,165,840 | |
| Xiaomi Corp. Class B | 959,600 | 2,079,280 | |
| 11,503,630 | |||
| Diversified Consumer Services - 1.4% | |||
| Education Services - 1.4% | |||
| TAL Education Group ADR (a) | 331,438 | 12,196,918 | |
| Diversified Financial Services - 0.2% | |||
| Other Diversified Financial Services - 0.2% | |||
| Jianpu Technology, Inc. ADR (a)(b) | 218,100 | 1,441,641 | |
| Electrical Equipment - 0.0% | |||
| Electrical Components & Equipment - 0.0% | |||
| BizLink Holding, Inc. | 56,141 | 395,463 | |
| Electronic Equipment & Components - 4.3% | |||
| Electronic Components - 1.5% | |||
| E Ink Holdings, Inc. | 1,816,000 | 2,021,687 | |
| LG Innotek Co. Ltd. | 51,515 | 6,680,413 | |
| Samsung Electro-Mechanics Co. Ltd. | 32,159 | 4,285,789 | |
| 12,987,889 | |||
| Electronic Equipment & Instruments - 2.0% | |||
| Chroma ATE, Inc. | 1,084,415 | 5,840,336 | |
| Hitachi High-Technologies Corp. | 60,700 | 2,478,110 | |
| Trimble, Inc. (a) | 253,770 | 8,333,807 | |
| 16,652,253 | |||
| Technology Distributors - 0.8% | |||
| Dell Technologies, Inc. (a) | 77,800 | 6,580,324 | |
| TOTAL ELECTRONIC EQUIPMENT & COMPONENTS | 36,220,466 | ||
| Equity Real Estate Investment Trusts (REITs) - 0.4% | |||
| Diversified REITs - 0.4% | |||
| Ant International Co. Ltd. (c)(d) | 567,730 | 3,184,965 | |
| Health Care Equipment & Supplies - 0.0% | |||
| Health Care Equipment - 0.0% | |||
| China Medical Technologies, Inc. sponsored ADR (a)(d) | 300 | 0 | |
| Internet & Direct Marketing Retail - 1.8% | |||
| Internet & Direct Marketing Retail - 1.8% | |||
| Amazon.com, Inc. (a) | 4,100 | 6,969,180 | |
| China Internet Plus Holdings Ltd. Class B (a)(c)(d) | 141,569 | 705,014 | |
| Netflix, Inc. (a) | 19,600 | 7,672,028 | |
| 15,346,222 | |||
| Internet Software & Services - 13.2% | |||
| Internet Software & Services - 13.2% | |||
| Alibaba Group Holding Ltd. sponsored ADR (a) | 136,300 | 25,287,739 | |
| Alphabet, Inc.: | |||
| Class A (a) | 9,900 | 11,178,981 | |
| Class C (a) | 10,561 | 11,782,380 | |
| Apptio, Inc. Class A (a) | 500 | 18,100 | |
| eBay, Inc. (a) | 47,000 | 1,704,220 | |
| Facebook, Inc. Class A (a) | 39,189 | 7,615,206 | |
| GoDaddy, Inc. (a) | 95,700 | 6,756,420 | |
| LogMeIn, Inc. | 56,817 | 5,866,355 | |
| MercadoLibre, Inc. | 14,700 | 4,394,271 | |
| Mercari, Inc. (a) | 1,800 | 73,730 | |
| MongoDB, Inc. Class A | 1,900 | 94,297 | |
| NetEase, Inc. ADR | 38,000 | 9,601,460 | |
| New Relic, Inc. (a) | 42,400 | 4,265,016 | |
| Nutanix, Inc.: | |||
| Class A (a) | 94,600 | 4,878,522 | |
| Class B (a)(e) | 6,397 | 329,893 | |
| Okta, Inc. (a) | 20,100 | 1,012,437 | |
| SMS Co., Ltd. | 196,800 | 3,595,957 | |
| Tencent Holdings Ltd. | 79,900 | 4,012,211 | |
| Xunlei Ltd. sponsored ADR (a)(b) | 295,207 | 3,158,715 | |
| Yandex NV Series A (a) | 150,800 | 5,413,720 | |
| 111,039,630 | |||
| IT Services - 5.5% | |||
| Data Processing & Outsourced Services - 4.0% | |||
| Adyen BV (e) | 400 | 220,364 | |
| FleetCor Technologies, Inc. (a) | 40,700 | 8,573,455 | |
| Global Payments, Inc. | 21,000 | 2,341,290 | |
| PayPal Holdings, Inc. (a) | 203,900 | 16,978,753 | |
| Square, Inc. (a) | 86,000 | 5,301,040 | |
| 33,414,902 | |||
| IT Consulting & Other Services - 1.5% | |||
| China Information Technology, Inc. (a) | 42 | 55 | |
| Cognizant Technology Solutions Corp. Class A | 108,400 | 8,562,516 | |
| DXC Technology Co. | 50,100 | 4,038,561 | |
| Perspecta, Inc. | 25,050 | 514,778 | |
| 13,115,910 | |||
| TOTAL IT SERVICES | 46,530,812 | ||
| Life Sciences Tools & Services - 0.0% | |||
| Life Sciences Tools & Services - 0.0% | |||
| JHL Biotech, Inc. (a)(d) | 94,814 | 191,490 | |
| Machinery - 0.7% | |||
| Industrial Machinery - 0.7% | |||
| Minebea Mitsumi, Inc. | 346,948 | 5,872,561 | |
| Media - 0.1% | |||
| Advertising - 0.0% | |||
| iCar Asia Ltd. (a) | 94,449 | 16,426 | |
| Publishing - 0.1% | |||
| China Literature Ltd. (a)(e) | 108,072 | 1,015,207 | |
| TOTAL MEDIA | 1,031,633 | ||
| Semiconductors & Semiconductor Equipment - 22.1% | |||
| Semiconductor Equipment - 3.5% | |||
| ASM Pacific Technology Ltd. | 460,922 | 5,827,911 | |
| ASML Holding NV | 9,900 | 1,959,903 | |
| ASML Holding NV (Netherlands) | 11,400 | 2,255,887 | |
| Entegris, Inc. | 55,800 | 1,891,620 | |
| Ferrotec Holdings Corp. | 97,700 | 1,510,747 | |
| Lam Research Corp. | 32,200 | 5,565,770 | |
| Screen Holdings Co. Ltd. | 30,500 | 2,148,760 | |
| Sino-American Silicon Products, Inc. | 1,981,000 | 8,001,806 | |
| STR Holdings, Inc. (a) | 433 | 117 | |
| Veeco Instruments, Inc. (a) | 7,115 | 101,389 | |
| 29,263,910 | |||
| Semiconductors - 18.6% | |||
| Advanced Micro Devices, Inc. (a) | 633,900 | 9,502,161 | |
| ams AG | 115,060 | 8,572,278 | |
| Broadcom, Inc. | 56,200 | 13,636,368 | |
| ChipMOS TECHNOLOGIES, Inc. sponsored ADR | 26,964 | 407,965 | |
| Cree, Inc. (a) | 67,500 | 2,805,975 | |
| Global Unichip Corp. | 97,000 | 871,219 | |
| Himax Technologies, Inc. sponsored ADR (b) | 756,400 | 5,642,744 | |
| Inphi Corp. (a)(b) | 70,000 | 2,282,700 | |
| Intel Corp. | 76,500 | 3,802,815 | |
| International Quantum Epitaxy PLC (a)(b) | 1,796,300 | 2,420,451 | |
| MACOM Technology Solutions Holdings, Inc. (a)(b) | 171,800 | 3,958,272 | |
| Marvell Technology Group Ltd. | 444,600 | 9,532,224 | |
| Micron Technology, Inc. (a) | 80,700 | 4,231,908 | |
| Monolithic Power Systems, Inc. | 16,000 | 2,138,720 | |
| Nanya Technology Corp. | 3,988,000 | 10,896,246 | |
| NVIDIA Corp. | 192,000 | 45,484,800 | |
| NXP Semiconductors NV (a) | 35,600 | 3,890,012 | |
| Qorvo, Inc. (a) | 28,765 | 2,306,090 | |
| Qualcomm, Inc. | 363,150 | 20,379,978 | |
| Renesas Electronics Corp. (a) | 56,900 | 558,130 | |
| Silicon Laboratories, Inc. (a) | 19,100 | 1,902,360 | |
| Silicon Motion Technology Corp. sponsored ADR | 15,900 | 840,951 | |
| Skyworks Solutions, Inc. | 6,900 | 666,885 | |
| Win Semiconductors Corp. | 107,000 | 771,288 | |
| 157,502,540 | |||
| TOTAL SEMICONDUCTORS & SEMICONDUCTOR EQUIPMENT | 186,766,450 | ||
| Software - 41.6% | |||
| Application Software - 18.9% | |||
| Adobe Systems, Inc. (a) | 110,600 | 26,965,386 | |
| Atlassian Corp. PLC (a) | 13,504 | 844,270 | |
| Autodesk, Inc. (a) | 137,900 | 18,077,311 | |
| Avalara, Inc. | 1,154 | 61,589 | |
| Ceridian HCM Holding, Inc. (b) | 2,600 | 86,294 | |
| Citrix Systems, Inc. (a) | 131,300 | 13,765,492 | |
| Ellie Mae, Inc. (a)(b) | 38,400 | 3,987,456 | |
| HubSpot, Inc. (a) | 2,700 | 338,580 | |
| Intuit, Inc. | 41,800 | 8,539,949 | |
| Parametric Technology Corp. (a) | 270,014 | 25,330,013 | |
| Pivotal Software, Inc. | 14,600 | 354,342 | |
| Salesforce.com, Inc. (a) | 215,500 | 29,394,200 | |
| SAP SE | 36,313 | 4,191,166 | |
| Snap, Inc. Class A (a)(b) | 145,600 | 1,905,904 | |
| Splunk, Inc. (a) | 34,600 | 3,429,206 | |
| Ultimate Software Group, Inc. (a) | 56,880 | 14,635,793 | |
| Workday, Inc. Class A (a) | 27,500 | 3,330,800 | |
| Zendesk, Inc. (a) | 83,400 | 4,544,466 | |
| 159,782,217 | |||
| Home Entertainment Software - 7.0% | |||
| Activision Blizzard, Inc. | 282,600 | 21,568,032 | |
| Electronic Arts, Inc. (a) | 155,400 | 21,914,508 | |
| Nintendo Co. Ltd. | 21,400 | 6,985,584 | |
| Nintendo Co. Ltd. ADR | 72,600 | 2,961,354 | |
| Take-Two Interactive Software, Inc. (a) | 44,700 | 5,290,692 | |
| 58,720,170 | |||
| Systems Software - 15.7% | |||
| Microsoft Corp. | 1,035,500 | 102,110,656 | |
| Oracle Corp. | 389,817 | 17,175,337 | |
| Red Hat, Inc. (a) | 58,700 | 7,887,519 | |
| ServiceNow, Inc. (a) | 16,300 | 2,811,261 | |
| Tableau Software, Inc. (a) | 23,300 | 2,277,575 | |
| Zscaler, Inc. (a) | 1,600 | 57,200 | |
| 132,319,548 | |||
| TOTAL SOFTWARE | 350,821,935 | ||
| Technology Hardware, Storage & Peripherals - 2.6% | |||
| Technology Hardware, Storage & Peripherals - 2.6% | |||
| Apple, Inc. | 114,915 | 21,271,916 | |
| Samsung Electronics Co. Ltd. | 12,610 | 527,920 | |
| 21,799,836 | |||
| TOTAL COMMON STOCKS | |||
| (Cost $646,176,389) | 824,631,618 | ||
| Convertible Preferred Stocks - 1.0% | |||
| Food & Staples Retailing - 0.2% | |||
| Food Retail - 0.2% | |||
| Roofoods Ltd. Series F (c)(d) | 4,211 | 1,644,522 | |
| Internet & Direct Marketing Retail - 0.4% | |||
| Internet & Direct Marketing Retail - 0.4% | |||
| China Internet Plus Holdings Ltd.: | |||
| Series A-11 (a)(c)(d) | 259,152 | 1,290,577 | |
| Series B (a)(c)(d) | 401,913 | 2,001,527 | |
| 3,292,104 | |||
| Internet Software & Services - 0.4% | |||
| Internet Software & Services - 0.4% | |||
| Lyft, Inc. Series I (c)(d) | 45,297 | 2,144,990 | |
| Uber Technologies, Inc. Series D, 8.00% (a)(c)(d) | 45,124 | 1,804,960 | |
| 3,949,950 | |||
| TOTAL CONVERTIBLE PREFERRED STOCKS | |||
| (Cost $6,704,694) | 8,886,576 | ||
| Money Market Funds - 5.9% | |||
| Fidelity Cash Central Fund, 1.93% (f) | 7,050,883 | 7,052,293 | |
| Fidelity Securities Lending Cash Central Fund 1.92% (f)(g) | 42,715,615 | 42,724,158 | |
| TOTAL MONEY MARKET FUNDS | |||
| (Cost $49,773,975) | 49,776,451 | ||
| TOTAL INVESTMENT IN SECURITIES - 104.6% | |||
| (Cost $702,655,058) | 883,294,645 | ||
| NET OTHER ASSETS (LIABILITIES) - (4.6)% | (39,119,132) | ||
| NET ASSETS - 100% | $844,175,513 |
Legend
(a) Non-income producing
(b) Security or a portion of the security is on loan at period end.
(c) Restricted securities - Investment in securities not registered under the Securities Act of 1933 (excluding 144A issues). At the end of the period, the value of restricted securities (excluding 144A issues) amounted to $12,776,555 or 1.5% of net assets.
(d) Level 3 security
(e) Security exempt from registration under Rule 144A of the Securities Act of 1933. These securities may be resold in transactions exempt from registration, normally to qualified institutional buyers. At the end of the period, the value of these securities amounted to $1,565,464 or 0.2% of net assets.
(f) Affiliated fund that is generally available only to investment companies and other accounts managed by Fidelity Investments. The rate quoted is the annualized seven-day yield of the fund at period end. A complete unaudited listing of the fund's holdings as of its most recent quarter end is available upon request. In addition, each Fidelity Central Fund's financial statements are available on the SEC's website or upon request.
(g) Investment made with cash collateral received from securities on loan.
Additional information on each restricted holding is as follows:
| Security | Acquisition Date | Acquisition Cost |
| Ant International Co. Ltd. | 5/16/18 | $3,184,965 |
| China Internet Plus Holdings Ltd. Class B | 11/16/16 | $398,984 |
| China Internet Plus Holdings Ltd. Series A-11 | 1/26/15 | $819,141 |
| China Internet Plus Holdings Ltd. Series B | 12/11/15 | $1,551,666 |
| Lyft, Inc. Series I | 6/27/18 | $2,144,990 |
| Roofoods Ltd. Series F | 9/12/17 | $1,488,886 |
| Uber Technologies, Inc. Series D, 8.00% | 6/6/14 | $700,011 |
Affiliated Central Funds
Information regarding fiscal year to date income earned by the Fund from investments in Fidelity Central Funds is as follows:
| Fund | Income earned |
| Fidelity Cash Central Fund | $119,307 |
| Fidelity Securities Lending Cash Central Fund | 773,026 |
| Total | $892,333 |
Amounts in the income column in the above table include any capital gain distributions from underlying funds, which are presented in the corresponding line-item in the Statement of Operations if applicable.
Investment Valuation
The following is a summary of the inputs used, as of June 30, 2018, involving the Fund's assets and liabilities carried at fair value. The inputs or methodology used for valuing securities may not be an indication of the risk associated with investing in those securities. For more information on valuation inputs, and their aggregation into the levels used below, please refer to the Investment Valuation section in the accompanying Notes to Financial Statements.
| Valuation Inputs at Reporting Date: | ||||
| Description | Total | Level 1 | Level 2 | Level 3 |
| Investments in Securities: | ||||
| Common Stocks | $824,631,618 | $801,026,021 | $19,524,128 | $4,081,469 |
| Convertible Preferred Stocks | 8,886,576 | -- | -- | 8,886,576 |
| Money Market Funds | 49,776,451 | 49,776,451 | -- | -- |
| Total Investments in Securities: | $883,294,645 | $850,802,472 | $19,524,128 | $12,968,045 |
The following is a reconciliation of Investments in Securities and Derivative Instruments for which Level 3 inputs were used in determining value:
| Investments in Securities: | |
| Convertible Preferred Stocks | |
| Beginning Balance | $6,759,348 |
| Total Realized Gain (Loss) | -- |
| Total Unrealized Gain (Loss) | (17,762) |
| Cost of Purchases | 2,144,990 |
| Proceeds of Sales | -- |
| Amortization/Accretion | -- |
| Transfers in to Level 3 | -- |
| Transfers out of Level 3 | -- |
| Ending Balance | $8,886,576 |
| The change in unrealized gain (loss) for the period attributable to Level 3 securities held at June 30, 2018 | $(17,762) |
| Other Investments in Securities | |
| Beginning Balance | $791,238 |
| Total Realized Gain (Loss) | -- |
| Total Unrealized Gain (Loss) | (89,686) |
| Cost of Purchases | 3,184,965 |
| Proceeds of Sales | -- |
| Amortization/Accretion | -- |
| Transfers in to Level 3 | 194,952 |
| Transfers out of Level 3 | -- |
| Ending Balance | $4,081,469 |
| The change in unrealized gain (loss) for the period attributable to Level 3 securities held at June 30, 2018 | $(89,686) |
The information used in the above reconciliations represents fiscal year to date activity for any Investments in Securities identified as using Level 3 inputs at either the beginning or the end of the current fiscal period. Transfers in or out of Level 3 represent the beginning value of any Security or Instrument where a change in the pricing level occurred from the beginning to the end of the period. The cost of purchases and the proceeds of sales may include securities received or delivered through corporate actions or exchanges. Realized and unrealized gains (losses) disclosed in the reconciliations are included in Net Gain (Loss) on the Fund's Statement of Operations.
Other Information
Distribution of investments by country or territory of incorporation, as a percentage of Total Net Assets, is as follows (Unaudited):
| United States of America | 77.3% |
| Cayman Islands | 9.4% |
| Taiwan | 3.3% |
| Japan | 3.2% |
| Netherlands | 1.7% |
| Korea (South) | 1.4% |
| Bermuda | 1.1% |
| Austria | 1.0% |
| Others (Individually Less Than 1%) | 1.6% |
| 100.0% |
See accompanying notes which are an integral part of the financial statements.
Financial Statements
Statement of Assets and Liabilities
| June 30, 2018 (Unaudited) | ||
| Assets | ||
| Investment in securities, at value (including securities loaned of $41,136,167) — See accompanying schedule: Unaffiliated issuers (cost $652,881,083) | $833,518,194 | |
| Fidelity Central Funds (cost $49,773,975) | 49,776,451 | |
| Total Investment in Securities (cost $702,655,058) | $883,294,645 | |
| Receivable for investments sold | 4,931,831 | |
| Receivable for fund shares sold | 561,661 | |
| Dividends receivable | 550,721 | |
| Distributions receivable from Fidelity Central Funds | 168,191 | |
| Prepaid expenses | 6,428 | |
| Other receivables | 30,733 | |
| Total assets | 889,544,210 | |
| Liabilities | ||
| Payable for investments purchased | $2,100,233 | |
| Payable for fund shares redeemed | 287 | |
| Accrued management fee | 387,636 | |
| Other affiliated payables | 116,007 | |
| Other payables and accrued expenses | 49,901 | |
| Collateral on securities loaned | 42,714,633 | |
| Total liabilities | 45,368,697 | |
| Net Assets | $844,175,513 | |
| Net Assets consist of: | ||
| Paid in capital | $574,291,385 | |
| Undistributed net investment income | 947,145 | |
| Accumulated undistributed net realized gain (loss) on investments and foreign currency transactions | 88,296,108 | |
| Net unrealized appreciation (depreciation) on investments and assets and liabilities in foreign currencies | 180,640,875 | |
| Net Assets | $844,175,513 | |
| Initial Class: | ||
| Net Asset Value, offering price and redemption price per share ($183,211,659 ÷ 9,580,240 shares) | $19.12 | |
| Investor Class: | ||
| Net Asset Value, offering price and redemption price per share ($660,963,854 ÷ 34,984,736 shares) | $18.89 |
See accompanying notes which are an integral part of the financial statements.
Statement of Operations
| Six months ended June 30, 2018 (Unaudited) | ||
| Investment Income | ||
| Dividends | $2,821,093 | |
| Income from Fidelity Central Funds (including $773,026 from security lending) | 892,333 | |
| Total income | 3,713,426 | |
| Expenses | ||
| Management fee | $2,130,235 | |
| Transfer agent fees | 497,311 | |
| Accounting and security lending fees | 143,376 | |
| Custodian fees and expenses | 33,429 | |
| Independent trustees' fees and expenses | 3,514 | |
| Audit | 34,174 | |
| Legal | 4,097 | |
| Interest | 1,674 | |
| Miscellaneous | (13,327) | |
| Total expenses before reductions | 2,834,483 | |
| Expense reductions | (68,202) | |
| Total expenses after reductions | 2,766,281 | |
| Net investment income (loss) | 947,145 | |
| Realized and Unrealized Gain (Loss) | ||
| Net realized gain (loss) on: | ||
| Investment securities: | ||
| Unaffiliated issuers | 89,828,538 | |
| Fidelity Central Funds | 4,175 | |
| Foreign currency transactions | 5,813 | |
| Total net realized gain (loss) | 89,838,526 | |
| Change in net unrealized appreciation (depreciation) on: | ||
| Investment securities: | ||
| Unaffiliated issuers | (12,591,184) | |
| Fidelity Central Funds | (3,323) | |
| Assets and liabilities in foreign currencies | 1,096 | |
| Total change in net unrealized appreciation (depreciation) | (12,593,411) | |
| Net gain (loss) | 77,245,115 | |
| Net increase (decrease) in net assets resulting from operations | $78,192,260 |
See accompanying notes which are an integral part of the financial statements.
Statement of Changes in Net Assets
| Six months ended June 30, 2018 (Unaudited) | Year ended December 31, 2017 | |
| Increase (Decrease) in Net Assets | ||
| Operations | ||
| Net investment income (loss) | $947,145 | $(159,298) |
| Net realized gain (loss) | 89,838,526 | 70,931,859 |
| Change in net unrealized appreciation (depreciation) | (12,593,411) | 130,028,322 |
| Net increase (decrease) in net assets resulting from operations | 78,192,260 | 200,800,883 |
| Distributions to shareholders from net investment income | – | (61,212) |
| Distributions to shareholders from net realized gain | (49,737,538) | (26,317,179) |
| Total distributions | (49,737,538) | (26,378,391) |
| Share transactions - net increase (decrease) | 123,509,525 | 187,963,500 |
| Redemption fees | – | 58,624 |
| Total increase (decrease) in net assets | 151,964,247 | 362,444,616 |
| Net Assets | ||
| Beginning of period | 692,211,266 | 329,766,650 |
| End of period | $844,175,513 | $692,211,266 |
| Other Information | ||
| Undistributed net investment income end of period | $947,145 | $– |
See accompanying notes which are an integral part of the financial statements.
Financial Highlights
VIP Technology Portfolio Initial Class
| Six months ended (Unaudited) June 30, | Years endedDecember 31, | |||||
| 2018 | 2017 | 2016 | 2015 | 2014 | 2013 | |
| Selected Per–Share Data | ||||||
| Net asset value, beginning of period | $18.43 | $12.76 | $11.91 | $11.83 | $12.43 | $10.33 |
| Income from Investment Operations | ||||||
| Net investment income (loss)A | .03 | .01 | .02 | .02 | .01 | .01 |
| Net realized and unrealized gain (loss) | 1.96 | 6.41 | 1.22 | .71 | 1.38 | 2.78 |
| Total from investment operations | 1.99 | 6.42 | 1.24 | .73 | 1.39 | 2.79 |
| Distributions from net investment income | – | –B | (.02) | (.02) | (.01) | (.02) |
| Distributions from net realized gain | (1.30) | (.75) | (.37) | (.63) | (1.98) | (.67) |
| Total distributions | (1.30) | (.75) | (.39) | (.65) | (1.99) | (.69) |
| Redemption fees added to paid in capitalA | – | –B | –B | –B | –B | –B |
| Net asset value, end of period | $19.12 | $18.43 | $12.76 | $11.91 | $11.83 | $12.43 |
| Total ReturnC,D,E | 11.56% | 50.78% | 11.37% | 6.27% | 11.91% | 27.81% |
| Ratios to Average Net AssetsF,G | ||||||
| Expenses before reductions | .66%H | .68% | .70% | .69% | .70% | .73% |
| Expenses net of fee waivers, if any | .66%H | .68% | .70% | .69% | .69% | .72% |
| Expenses net of all reductions | .64%H | .67% | .69% | .68% | .69% | .72% |
| Net investment income (loss) | .30%H | .03% | .17% | .16% | .13% | .10% |
| Supplemental Data | ||||||
| Net assets, end of period (000 omitted) | $183,212 | $154,984 | $75,480 | $70,596 | $69,964 | $61,534 |
| Portfolio turnover rateI | 88%H | 68% | 67% | 68% | 67% | 113% |
A Calculated based on average shares outstanding during the period.
B Amount represents less than $.005 per share.
C Total returns for periods of less than one year are not annualized.
D Total returns do not reflect charges attributable to your insurance company's separate account. Inclusion of these charges would reduce the total returns shown.
E Total returns would have been lower if certain expenses had not been reduced during the applicable periods shown.
F Fees and expenses of any underlying Fidelity Central Funds are not included in the Fund's expense ratio. The Fund indirectly bears its proportionate share of the expenses of any underlying Fidelity Central Funds.
G Expense ratios reflect operating expenses of the class. Expenses before reductions do not reflect amounts reimbursed by the investment adviser or reductions from brokerage service arrangements or reductions from other expense offset arrangements and do not represent the amount paid by the class during periods when reimbursements or reductions occur. Expenses net of fee waivers reflect expenses after reimbursement by the investment adviser but prior to reductions from brokerage service arrangements or other expense offset arrangements. Expenses net of all reductions represent the net expenses paid by the class.
H Annualized
I Amount does not include the portfolio activity of any underlying Fidelity Central Funds.
See accompanying notes which are an integral part of the financial statements.
VIP Technology Portfolio Investor Class
| Six months ended (Unaudited) June 30, | Years endedDecember 31, | |||||
| 2018 | 2017 | 2016 | 2015 | 2014 | 2013 | |
| Selected Per–Share Data | ||||||
| Net asset value, beginning of period | $18.23 | $12.63 | $11.79 | $11.73 | $12.34 | $10.26 |
| Income from Investment Operations | ||||||
| Net investment income (loss)A | .02 | (.01) | .01 | .01 | .01 | –B |
| Net realized and unrealized gain (loss) | 1.94 | 6.35 | 1.21 | .69 | 1.36 | 2.76 |
| Total from investment operations | 1.96 | 6.34 | 1.22 | .70 | 1.37 | 2.76 |
| Distributions from net investment income | – | –B | (.01) | (.01) | (.01) | (.01) |
| Distributions from net realized gain | (1.30) | (.74) | (.37) | (.63) | (1.98) | (.67) |
| Total distributions | (1.30) | (.74) | (.38) | (.64) | (1.98)C | (.68) |
| Redemption fees added to paid in capitalA | – | –B | –B | –B | –B | –B |
| Net asset value, end of period | $18.89 | $18.23 | $12.63 | $11.79 | $11.73 | $12.34 |
| Total ReturnD,E,F | 11.51% | 50.67% | 11.34% | 6.08% | 11.86% | 27.73% |
| Ratios to Average Net AssetsG,H | ||||||
| Expenses before reductions | .74%I | .76% | .78% | .77% | .78% | .81% |
| Expenses net of fee waivers, if any | .73%I | .76% | .78% | .77% | .77% | .80% |
| Expenses net of all reductions | .72%I | .75% | .77% | .76% | .77% | .80% |
| Net investment income (loss) | .22%I | (.05)% | .09% | .08% | .05% | .02% |
| Supplemental Data | ||||||
| Net assets, end of period (000 omitted) | $660,964 | $537,227 | $254,287 | $241,491 | $180,147 | $120,666 |
| Portfolio turnover rateJ | 88%I | 68% | 67% | 68% | 67% | 113% |
A Calculated based on average shares outstanding during the period.
B Amount represents less than $.005 per share.
C Total distributions of $1.98 per share is comprised of distributions from net investment income of $.005 and distributions from net realized gain of $1.977 per share.
D Total returns for periods of less than one year are not annualized.
E Total returns do not reflect charges attributable to your insurance company's separate account. Inclusion of these charges would reduce the total returns shown.
F Total returns would have been lower if certain expenses had not been reduced during the applicable periods shown.
G Fees and expenses of any underlying Fidelity Central Funds are not included in the Fund's expense ratio. The Fund indirectly bears its proportionate share of the expenses of any underlying Fidelity Central Funds.
H Expense ratios reflect operating expenses of the class. Expenses before reductions do not reflect amounts reimbursed by the investment adviser or reductions from brokerage service arrangements or reductions from other expense offset arrangements and do not represent the amount paid by the class during periods when reimbursements or reductions occur. Expenses net of fee waivers reflect expenses after reimbursement by the investment adviser but prior to reductions from brokerage service arrangements or other expense offset arrangements. Expenses net of all reductions represent the net expenses paid by the class.
I Annualized
J Amount does not include the portfolio activity of any underlying Fidelity Central Funds.
See accompanying notes which are an integral part of the financial statements.
Notes to Financial Statements (Unaudited)
For the period ended June 30, 2018
1. Organization.
VIP Technology Portfolio (the Fund) is a non-diversified fund of Variable Insurance Products Fund IV (the Trust) and is authorized to issue an unlimited number of shares. The Trust is registered under the Investment Company Act of 1940, as amended (the 1940 Act), as an open-end management investment company organized as a Massachusetts business trust. Shares of the Fund may only be purchased by insurance companies for the purpose of funding variable annuity or variable life insurance contracts. The Fund offers the following classes of shares: Initial Class shares and Investor Class shares. All classes have equal rights and voting privileges, except for matters affecting a single class.
2. Investments in Fidelity Central Funds.
The Fund invests in Fidelity Central Funds, which are open-end investment companies generally available only to other investment companies and accounts managed by the investment adviser and its affiliates. The Fund's Schedule of Investments lists each of the Fidelity Central Funds held as of period end, if any, as an investment of the Fund, but does not include the underlying holdings of each Fidelity Central Fund. As an Investing Fund, the Fund indirectly bears its proportionate share of the expenses of the underlying Fidelity Central Funds.
The Money Market Central Funds seek preservation of capital and current income and are managed by Fidelity Investments Money Management, Inc. (FIMM), an affiliate of the investment adviser. Annualized expenses of the Money Market Central Funds as of their most recent shareholder report date are less than .005%.
A complete unaudited list of holdings for each Fidelity Central Fund is available upon request or at the Securities and Exchange Commission (the SEC) website at www.sec.gov. In addition, the financial statements of the Fidelity Central Funds are available on the SEC website or upon request.
3. Significant Accounting Policies.
The Fund is an investment company and applies the accounting and reporting guidance of the Financial Accounting Standards Board (FASB) Accounting Standards Codification Topic 946 Financial Services – Investments Companies. The financial statements have been prepared in conformity with accounting principles generally accepted in the United States of America (GAAP), which require management to make certain estimates and assumptions at the date of the financial statements. Actual results could differ from those estimates. Subsequent events, if any, through the date that the financial statements were issued have been evaluated in the preparation of the financial statements. The following summarizes the significant accounting policies of the Fund:
Investment Valuation. Investments are valued as of 4:00 p.m. Eastern time on the last calendar day of the period. The Board of Trustees (the Board) has delegated the day to day responsibility for the valuation of the Fund's investments to the Fair Value Committee (the Committee) established by the Fund's investment adviser. In accordance with valuation policies and procedures approved by the Board, the Fund attempts to obtain prices from one or more third party pricing vendors or brokers to value its investments. When current market prices, quotations or currency exchange rates are not readily available or reliable, investments will be fair valued in good faith by the Committee, in accordance with procedures adopted by the Board. Factors used in determining fair value vary by investment type and may include market or investment specific events. The frequency with which these procedures are used cannot be predicted and they may be utilized to a significant extent. The Committee oversees the Fund's valuation policies and procedures and reports to the Board on the Committee's activities and fair value determinations. The Board monitors the appropriateness of the procedures used in valuing the Fund's investments and ratifies the fair value determinations of the Committee.
The Fund categorizes the inputs to valuation techniques used to value its investments into a disclosure hierarchy consisting of three levels as shown below:
- Level 1 – quoted prices in active markets for identical investments
- Level 2 – other significant observable inputs (including quoted prices for similar investments, interest rates, prepayment speeds, etc.)
- Level 3 – unobservable inputs (including the Fund's own assumptions based on the best information available)
Valuation techniques used to value the Fund's investments by major category are as follows:
Equity securities, including restricted securities, for which market quotations are readily available, are valued at the last reported sale price or official closing price as reported by a third party pricing vendor on the primary market or exchange on which they are traded and are categorized as Level 1 in the hierarchy. In the event there were no sales during the day or closing prices are not available, securities are valued at the last quoted bid price or may be valued using the last available price and are generally categorized as Level 2 in the hierarchy. For foreign equity securities, when market or security specific events arise, comparisons to the valuation of American Depositary Receipts (ADRs), futures contracts, Exchange-Traded Funds (ETFs) and certain indexes as well as quoted prices for similar securities may be used and would be categorized as Level 2 in the hierarchy. Utilizing these techniques may result in transfers between Level 1 and Level 2. For equity securities, including restricted securities, where observable inputs are limited, assumptions about market activity and risk are used and these securities may be categorized as Level 3 in the hierarchy. Equity securities, including restricted securities, for which observable inputs are not available are valued using alternate valuation approaches, including the market approach and the income approach and are categorized as Level 3 in the hierarchy. The market approach generally consists of using comparable market transactions while the income approach generally consists of using the net present value of estimated future cash flows, adjusted as appropriate for liquidity, credit, market and/or other risk factors.
Investments in open-end mutual funds, including the Fidelity Central Funds, are valued at their closing net asset value (NAV) each business day and are categorized as Level 1 in the hierarchy.
The following provides information on Level 3 securities held by the Fund that were valued at period end based on unobservable inputs. These amounts exclude valuations provided by a broker.
| Asset Type | Fair Value | Valuation Technique(s) | Unobservable Input | Amount or Range/Weighted Average | Impact to Valuation from an Increase in Input(a) |
| Equities | $ 12,776,554 | Market comparable | Enterprise value/Sales multiple (EV/S) | 2.0 | Increase |
| Enterprise value/Gross profit multiple (EV/GP) | 4.3 | Increase | |||
| Discount rate | 57.0% - 73.0% / 61.7% | Decrease | |||
| Discount for lack of marketability | 15.0% | Decrease | |||
| Market approach | Transaction price | $5.61 - $47.35 / $26.86 | Increase | ||
| Recovery value | Recovery value | 0.0% | Increase |
(a) Represents the expected directional change in the fair value of the Level 3 investments that would result from an increase in the corresponding input. A decrease to the unobservable input would have the opposite effect. Significant changes in these inputs could result in significantly higher or lower fair value measurements.
Changes in valuation techniques may result in transfers in or out of an assigned level within the disclosure hierarchy. The aggregate value of investments by input level as of June 30, 2018, as well as a roll forward of Level 3 investments, is included at the end of the Fund's Schedule of Investments.
Foreign Currency. The Fund may use foreign currency contracts to facilitate transactions in foreign-denominated securities. Gains and losses from these transactions may arise from changes in the value of the foreign currency or if the counterparties do not perform under the contracts' terms.
Foreign-denominated assets, including investment securities, and liabilities are translated into U.S. dollars at the exchange rates at period end. Purchases and sales of investment securities, income and dividends received and expenses denominated in foreign currencies are translated into U.S. dollars at the exchange rate in effect on the transaction date.
The effects of exchange rate fluctuations on investments are included with the net realized and unrealized gain (loss) on investment securities. Other foreign currency transactions resulting in realized and unrealized gain (loss) are disclosed separately.
Investment Transactions and Income. For financial reporting purposes, the Fund's investment holdings and NAV include trades executed through the end of the last business day of the period. The NAV per share for processing shareholder transactions is calculated as of the close of business of the New York Stock Exchange (NYSE), normally 4:00 p.m. Eastern time and includes trades executed through the end of the prior business day. Gains and losses on securities sold are determined on the basis of identified cost and include proceeds received from litigation. Dividend income is recorded on the ex-dividend date, except for certain dividends from foreign securities where the ex-dividend date may have passed, which are recorded as soon as the Fund is informed of the ex-dividend date. Non-cash dividends included in dividend income, if any, are recorded at the fair market value of the securities received. Income and capital gain distributions from Fidelity Central Funds, if any, are recorded on the ex-dividend date. Certain distributions received by the Fund represent a return of capital or capital gain. The Fund determines the components of these distributions subsequent to the ex-dividend date, based upon receipt of tax filings or other correspondence relating to the underlying investment. These distributions are recorded as a reduction of cost of investments and/or as a realized gain. Investment income is recorded net of foreign taxes withheld where recovery of such taxes is uncertain.
Class Allocations and Expenses. Investment income, realized and unrealized capital gains and losses, common expenses of the Fund, and certain fund-level expense reductions, if any, are allocated daily on a pro-rata basis to each class based on the relative net assets of each class to the total net assets of the Fund. Each class differs with respect to transfer agent fees incurred. Certain expense reductions may also differ by class. For the reporting period, the allocated portion of income and expenses to each class as a percent of its average net assets may vary due to the timing of recording these transactions in relation to fluctuating net assets of the classes. Expenses directly attributable to a fund are charged to that fund. Expenses attributable to more than one fund are allocated among the respective funds on the basis of relative net assets or other appropriate methods. Expense estimates are accrued in the period to which they relate and adjustments are made when actual amounts are known.
Income Tax Information and Distributions to Shareholders. Each year, the Fund intends to qualify as a regulated investment company under Subchapter M of the Internal Revenue Code, including distributing substantially all of its taxable income and realized gains. As a result, no provision for U.S. Federal income taxes is required. The Fund files a U.S. federal tax return, in addition to state and local tax returns as required. The Fund's federal income tax returns are subject to examination by the Internal Revenue Service (IRS) for a period of three fiscal years after they are filed. State and local tax returns may be subject to examination for an additional fiscal year depending on the jurisdiction. Foreign taxes are provided for based on the Fund's understanding of the tax rules and rates that exist in the foreign markets in which it invests.
Distributions are declared and recorded on the ex-dividend date. Income and capital gain distributions are declared separately for each class. Income and capital gain distributions are determined in accordance with income tax regulations, which may differ from GAAP.
Capital accounts within the financial statements are adjusted for permanent book-tax differences. These adjustments have no impact on net assets or the results of operations. Capital accounts are not adjusted for temporary book-tax differences which will reverse in a subsequent period.
Book-tax differences are primarily due to foreign currency transactions, passive foreign investment companies (PFIC) and losses deferred due to wash sales.
As of period end, the cost and unrealized appreciation (depreciation) in securities, and derivatives if applicable, for federal income tax purposes were as follows:
| Gross unrealized appreciation | $204,373,608 |
| Gross unrealized depreciation | (24,113,787) |
| Net unrealized appreciation (depreciation) | $180,259,821 |
| Tax cost | $703,034,824 |
Restricted Securities. The Fund may invest in securities that are subject to legal or contractual restrictions on resale. These securities generally may be resold in transactions exempt from registration or to the public if the securities are registered. Disposal of these securities may involve time-consuming negotiations and expense, and prompt sale at an acceptable price may be difficult. Information regarding restricted securities is included at the end of the Fund's Schedule of Investments.
4. Purchases and Sales of Investments.
Purchases and sales of securities, other than short-term securities, aggregated $414,468,349 and $338,403,352, respectively.
5. Fees and Other Transactions with Affiliates.
Management Fee. Fidelity Management & Research Company (the investment adviser) and its affiliates provide the Fund with investment management related services for which the Fund pays a monthly management fee. The management fee is the sum of an individual fund fee rate that is based on an annual rate of .30% of the Fund's average net assets and an annualized group fee rate that averaged .24% during the period. The group fee rate is based upon the average net assets of all the mutual funds advised by Fidelity Management & Research Company (FMR) and the investment adviser. The group fee rate decreases as assets under management increase and increases as assets under management decrease. For the reporting period, the total annualized management fee rate was .54% of the Fund's average net assets.
Transfer Agent Fees. Fidelity Investments Institutional Operations Company, Inc. (FIIOC), an affiliate of the investment adviser, is the Fund's transfer, dividend disbursing, and shareholder servicing agent. FIIOC receives an asset-based fee with respect to each class. Each class pays a fee for transfer agent services, typesetting and printing and mailing of shareholder reports, excluding mailing of proxy statements, equal to an annual rate of class-level average net assets. The annual rate for Investor Class is .15% and the annual rate for all other classes is .07%. For the period, transfer agent fees for each class were as follows:
| Initial Class | $56,044 |
| Investor Class | 441,267 |
| $497,311 |
Accounting and Security Lending Fees. Fidelity Service Company, Inc. (FSC), an affiliate of the investment adviser, maintains the Fund's accounting records. The accounting fee is based on the level of average net assets for each month. Under a separate contract, FSC administers the security lending program. The security lending fee is based on the number and duration of lending transactions. For the period, the fees were equivalent to an annualized rate of .04%.
Brokerage Commissions. The Fund placed a portion of its portfolio transactions with brokerage firms which are affiliates of the investment adviser. Brokerage commissions are included in net realized gain (loss) and change in net unrealized appreciation (depreciation) in the Statement of Operations. The commissions paid to these affiliated firms were $8,611 for the period.
Interfund Lending Program. Pursuant to an Exemptive Order issued by the SEC, the Fund, along with other registered investment companies having management contracts with Fidelity Management & Research Company (FMR) or other affiliated entities of FMR, may participate in an interfund lending program. This program provides an alternative credit facility allowing the funds to borrow from, or lend money to, other participating affiliated funds. At period end, there were no interfund loans outstanding. The Fund's activity in this program during the period for which loans were outstanding was as follows:
| Borrower or Lender | Average Loan Balance | Weighted Average Interest Rate | Interest Expense |
| Borrower | $6,767,200 | 1.78% | $1,674 |
Interfund Trades. The Fund may purchase from or sell securities to other Fidelity Funds under procedures adopted by the Board. The procedures have been designed to ensure these interfund trades are executed in accordance with Rule 17a-7 of the 1940 Act. Interfund trades are included within the respective purchases and sales amounts shown in the Purchases and Sales of Investments note.
6. Committed Line of Credit.
The Fund participates with other funds managed by the investment adviser or an affiliate in a $4.25 billion credit facility (the "line of credit") to be utilized for temporary or emergency purposes to fund shareholder redemptions or for other short-term liquidity purposes. The Fund has agreed to pay commitment fees on its pro-rata portion of the line of credit, which amounted to $1,025 and is reflected in Miscellaneous expenses on the Statement of Operations. During the period, the Fund did not borrow on this line of credit.
7. Security Lending.
The Fund lends portfolio securities through a lending agent from time to time in order to earn additional income. On the settlement date of the loan, the Fund receives collateral (in the form of U.S. Treasury obligations, letters of credit and/or cash) against the loaned securities and maintains collateral in an amount not less than 100% of the market value of the loaned securities during the period of the loan. The market value of the loaned securities is determined at the close of business of the Fund and any additional required collateral is delivered to the Fund on the next business day. The Fund or borrower may terminate the loan at any time, and if the borrower defaults on its obligation to return the securities loaned because of insolvency or other reasons, the Fund may apply collateral received from the borrower against the obligation. The Fund may experience delays and costs in recovering the securities loaned. Any cash collateral received is invested in the Fidelity Securities Lending Cash Central Fund. The value of loaned securities and cash collateral at period end are disclosed on the Fund's Statement of Assets and Liabilities. Security lending income represents the income earned on investing cash collateral, less rebates paid to borrowers and any lending agent fees associated with the loan, plus any premium payments received for lending certain types of securities. Security lending income is presented in the Statement of Operations as a component of income from Fidelity Central Funds.
8. Expense Reductions.
Commissions paid to certain brokers with whom the investment adviser, or its affiliates, places trades on behalf of the Fund include an amount in addition to trade execution, which may be rebated back to the Fund to offset certain expenses. This amount totaled $64,898 for the period. Through arrangements with the Fund's custodian, credits realized as a result of certain uninvested cash balances were used to reduce the Fund's expenses. During the period, these credits reduced the Fund's custody expenses by $169.
In addition, during the period the investment adviser reimbursed and/or waived a portion of fund-level operating expenses in the amount of $3,135.
9. Distributions to Shareholders.
Distributions to shareholders of each class were as follows:
| Six months ended June 30, 2018 | Year ended December 31, 2017 | |
| From net investment income | ||
| Initial Class | $– | $18,359 |
| Investor Class | – | 42,853 |
| Total | $– | $61,212 |
| From net realized gain | ||
| Initial Class | $10,963,398 | $5,924,655 |
| Investor Class | 38,774,140 | 20,392,524 |
| Total | $49,737,538 | $26,317,179 |
10. Share Transactions.
Transactions for each class of shares were as follows:
| Shares | Shares | Dollars | Dollars | |
| Six months ended June 30, 2018 | Year ended December 31, 2017 | Six months ended June 30, 2018 | Year ended December 31, 2017 | |
| Initial Class | ||||
| Shares sold | 1,333,401 | 3,603,124 | $25,629,616 | $57,019,389 |
| Reinvestment of distributions | 633,356 | 338,642 | 10,963,398 | 5,943,014 |
| Shares redeemed | (797,132) | (1,447,039) | (14,877,722) | (24,749,490) |
| Net increase (decrease) | 1,169,625 | 2,494,727 | $21,715,292 | $38,212,913 |
| Investor Class | ||||
| Shares sold | 5,599,752 | 11,306,903 | $106,006,100 | $182,711,660 |
| Reinvestment of distributions | 2,267,494 | 1,177,657 | 38,774,140 | 20,435,377 |
| Shares redeemed | (2,359,950) | (3,143,809) | (42,986,007) | (53,396,450) |
| Net increase (decrease) | 5,507,296 | 9,340,751 | $101,794,233 | $149,750,587 |
11. Other.
The Fund's organizational documents provide former and current trustees and officers with a limited indemnification against liabilities arising in connection with the performance of their duties to the Fund. In the normal course of business, the Fund may also enter into contracts that provide general indemnifications. The Fund's maximum exposure under these arrangements is unknown as this would be dependent on future claims that may be made against the Fund. The risk of material loss from such claims is considered remote.
At the end of the period, the investment adviser or its affiliates were the owners of record of 100% of the total outstanding shares of the Fund.
Shareholder Expense Example
As a shareholder of the Fund, you incur two types of costs: (1) transaction costs and (2) ongoing costs, including management fees and other Fund expenses. This Example is intended to help you understand your ongoing costs (in dollars) of investing in the Fund and to compare these costs with the ongoing costs of investing in other mutual funds.
The Example is based on an investment of $1,000 invested at the beginning of the period and held for the entire period (January 1, 2018 to June 30, 2018).
Actual Expenses
The first line of the accompanying table for each class of the Fund provides information about actual account values and actual expenses. You may use the information in this line, together with the amount you invested, to estimate the expenses that you paid over the period. Simply divide your account value by $1,000.00 (for example, an $8,600 account value divided by $1,000.00 = 8.6), then multiply the result by the number in the first line for a class of the Fund under the heading entitled "Expenses Paid During Period" to estimate the expenses you paid on your account during this period. The estimate of expenses does not include any fees or other expenses of any variable annuity or variable life insurance product. If they were, the estimate of expenses you paid during the period would be higher, and your ending account value would be lower. In addition, the Fund, as a shareholder in the underlying Fidelity Central Funds, will indirectly bear its pro-rata share of the fees and expenses incurred by the underlying Fidelity Central Funds. These fees and expenses are not included in the Fund's annualized expense ratio used to calculate the expense estimate in the table below.
Hypothetical Example for Comparison Purposes
The second line of the accompanying table for each class of the Fund provides information about hypothetical account values and hypothetical expenses based on a Class' actual expense ratio and an assumed rate of return of 5% per year before expenses, which is not the Class' actual return. The hypothetical account values and expenses may not be used to estimate the actual ending account balance or expenses you paid for the period. You may use this information to compare the ongoing costs of investing in the Fund and other funds. To do so, compare this 5% hypothetical example with the 5% hypothetical examples that appear in the shareholder reports of the other funds. The estimate of expenses does not include any fees or other expenses of any variable annuity or variable life insurance product. If they were, the estimate of expenses you paid during the period would be higher, and your ending account value would be lower. In addition, the Fund, as a shareholder in the underlying Fidelity Central Funds, will indirectly bear its pro-rata share of the fees and expenses incurred by the underlying Fidelity Central Funds. These fees and expenses are not included in the Fund's annualized expense ratio used to calculate the expense estimate in the table below.
Please note that the expenses shown in the table are meant to highlight your ongoing costs only and do not reflect any transaction costs. Therefore, the second line of the table is useful in comparing ongoing costs only, and will not help you determine the relative total costs of owning different funds.
| Annualized Expense Ratio-A | Beginning Account Value January 1, 2018 | Ending Account Value June 30, 2018 | Expenses Paid During Period-B January 1, 2018 to June 30, 2018 | |
| Initial Class | .66% | |||
| Actual | $1,000.00 | $1,115.60 | $3.46 | |
| Hypothetical-C | $1,000.00 | $1,021.52 | $3.31 | |
| Investor Class | .73% | |||
| Actual | $1,000.00 | $1,115.10 | $3.83 | |
| Hypothetical-C | $1,000.00 | $1,021.17 | $3.66 |
A Annualized expense ratio reflects expenses net of applicable fee waivers.
B Expenses are equal to each Class' annualized expense ratio, multiplied by the average account value over the period, multiplied by 181/365 (to reflect the one-half year period).
C 5% return per year before expenses
Board Approval of Investment Advisory Contracts and Management Fees
VIP Technology Portfolio
Each year, the Board of Trustees, including the Independent Trustees (together, the Board), votes on the renewal of the management contract with Fidelity SelectCo, LLC (SelectCo), an affiliate of Fidelity Management & Research Company (FMR), and the sub-advisory agreements with affiliates of FMR (together, the Advisory Contracts) for the fund. SelectCo and the sub-advisers are collectively referred to herein as the Investment Advisers. The Board, assisted by the advice of fund counsel and Independent Trustees' counsel, requests and considers a broad range of information relevant to the renewal of the Advisory Contracts throughout the year.
The Board meets regularly and, at each of its meetings, covers an extensive agenda of topics and materials and considers factors that are relevant to its annual consideration of the renewal of the fund's Advisory Contracts, including the services and support provided to the fund and its shareholders. The Board has established four standing committees (Committees) — Operations, Audit, Fair Valuation, and Governance and Nominating — each composed of and chaired by Independent Trustees with varying backgrounds, to which the Board has assigned specific subject matter responsibilities in order to enhance effective decision-making by the Board. The Operations Committee, of which all of the Independent Trustees are members, meets regularly throughout the year and considers, among other matters, information specifically related to the annual consideration of the renewal of the fund's Advisory Contracts. The Board, acting directly and through its Committees, requests and receives information concerning the annual consideration of the renewal of the fund's Advisory Contracts. The Board also meets as needed to review matters specifically related to the Board's annual consideration of the renewal of the Advisory Contracts. Members of the Board may also meet with trustees of other Fidelity funds through ad hoc joint committees to discuss certain matters relevant to all of the Fidelity funds.
At its January 2018 meeting, the Board unanimously determined to renew the fund's Advisory Contracts. In reaching its determination, the Board considered all factors it believed relevant, including (i) the nature, extent, and quality of the services to be provided to the fund and its shareholders (including the investment performance of the fund); (ii) the competitiveness of the fund's management fee and total expense ratio relative to peer funds; (iii) the total costs of the services to be provided by and the profits to be realized by Fidelity from its relationships with the fund; and (iv) the extent to which, if any, economies of scale exist and would be realized as the fund grows, and whether any economies of scale are appropriately shared with fund shareholders.
In considering whether to renew the Advisory Contracts for the fund, the Board reached a determination, with the assistance of fund counsel and Independent Trustees' counsel and through the exercise of its business judgment, that the renewal of the Advisory Contracts was in the best interests of the fund and its shareholders and that the compensation payable under the Advisory Contracts was fair and reasonable. The Board's decision to renew the Advisory Contracts was not based on any single factor, but rather was based on a comprehensive consideration of all the information provided to the Board at its meetings throughout the year. The Board, in reaching its determination to renew the Advisory Contracts, was aware that shareholders of the fund have a broad range of investment choices available to them, including a wide choice among funds offered by Fidelity's competitors, and that the fund's shareholders, who have the opportunity to review and weigh the disclosure provided by the fund in its prospectus and other public disclosures, have chosen to invest in this fund, which is part of the Fidelity family of funds.
Amendment to Group Fee Rate. The Board also ratified an amendment to the management contract for the fund to add an additional breakpoint to the group fee schedule, which was effective October 1, 2017. The Board noted that the additional breakpoint would result in lower management fee rates to the extent that assets under management that are included in group fee calculations increase above the new breakpoint.
Nature, Extent, and Quality of Services Provided. The Board considered the staffing of the Investment Advisers as it relates to the fund, including the backgrounds of investment personnel of SelectCo, and also considered the fund's investment objective, strategies, and related investment philosophy. The Independent Trustees also had discussions with senior management of Fidelity's investment operations and investment groups. The Board considered the structure of the investment personnel compensation program and whether this structure provides appropriate incentives to act in the best interests of the fund. Additionally, the Board considered the portfolio managers' investments, if any, in the funds that they manage.Resources Dedicated to Investment Management and Support Services. The Board reviewed the general qualifications and capabilities of the Investment Advisers' investment staffs, including their size, education, experience, and resources, as well as Fidelity's approach to recruiting, training, managing, and compensating investment personnel. The Board noted that Fidelity has continued to increase the resources devoted to non-U.S. offices, including expansion of Fidelity's global investment organization. The Board also noted that Fidelity's analysts have extensive resources, tools and capabilities that allow them to conduct sophisticated quantitative and fundamental analysis, as well as credit analysis of issuers, counterparties and guarantors. Further, the Board considered that Fidelity's investment professionals have sufficient access to global information and data so as to provide competitive investment results over time, and that those professionals also have access to sophisticated tools that permit them to assess portfolio construction and risk and performance attribution characteristics continuously, as well as to transmit new information and research conclusions rapidly around the world. Additionally, in its deliberations, the Board considered Fidelity's trading, risk management, compliance, and technology and operations capabilities and resources, which are integral parts of the investment management process.Shareholder and Administrative Services. The Board considered (i) the nature, extent, quality, and cost of advisory, administrative, and shareholder services performed by the Investment Advisers and their affiliates under the Advisory Contracts and under separate agreements covering transfer agency, pricing and bookkeeping, and securities lending services for the fund; (ii) the nature and extent of the supervision of third party service providers, principally custodians, subcustodians, and pricing vendors; and (iii) the resources devoted to, and the record of compliance with, the fund's compliance policies and procedures. The Board also reviewed the allocation of fund brokerage, including allocations to brokers affiliated with the Investment Advisers, the use of brokerage commissions to pay fund expenses, and the use of "soft" commission dollars to pay for research services.The Board noted that the growth of fund assets over time across the complex allows Fidelity to reinvest in the development of services designed to enhance the value or convenience of the Fidelity funds as investment vehicles. These services include 24-hour access to account information and market information through telephone representatives and over the Internet, investor education materials and asset allocation tools, and the expanded availability of Fidelity Investor Centers.The Board noted that it and the boards of certain other Fidelity funds had formed an ad hoc Committee on Transfer Agency Fees to review the variety of transfer agency fee structures throughout the industry and Fidelity's competitive positioning with respect to industry participants.Investment in a Large Fund Family. The Board considered the benefits to shareholders of investing in a Fidelity fund, including the benefits of investing in a fund that is part of a large family of funds offering a variety of investment disciplines and providing a large variety of mutual fund investor services. The Board noted that Fidelity had taken, or had made recommendations that resulted in the Fidelity funds taking, a number of actions over the previous year that benefited particular funds, including: (i) continuing to dedicate additional resources to Fidelity's investment research process, which includes meetings with management of issuers in which the funds invest, and to the support of the senior management team that oversees asset management; (ii) continuing efforts to enhance Fidelity's global research capabilities; (iii) launching new funds and making other enhancements to meet client needs; (iv) launching new share classes of existing funds; (v) eliminating purchase minimums and broadening eligibility requirements for certain lower-priced share classes; (vi) reducing management fees and total expenses for certain growth equity funds and index funds; (vii) lowering expense caps for certain existing funds and classes to reduce expenses borne by shareholders; (viii) eliminating short-term redemption fees for certain funds; (ix) introducing a new pricing structure for certain funds of funds that is expected to reduce overall expenses paid by shareholders; (x) rationalizing product lines and gaining increased efficiencies through proposals for fund mergers and share class consolidations; (xi) continuing to develop, acquire and implement systems and technology to improve services to the funds and shareholders, strengthen information security, and increase efficiency; and (xii) implementing enhancements to further strengthen Fidelity's product line to increase investors' probability of success in achieving their investment goals, including retirement income goals.Investment Performance. The Board considered whether the fund has operated in accordance with its investment objective, as well as its record of compliance with its investment restrictions and its performance history.The Board took into account discussions with representatives of SelectCo about fund investment performance that occur at Board meetings throughout the year. In this regard the Board noted that as part of regularly scheduled fund reviews and other reports to the Board on fund performance, the Board considers annualized return information for the fund for different time periods, measured against a securities market index ("benchmark index"). In its evaluation of fund investment performance at meetings throughout the year, the Board gave particular attention to information indicating underperformance of certain Fidelity funds for specific time periods and discussed with the Investment Advisers the reasons for such underperformance.In addition to reviewing absolute and relative fund performance, the Independent Trustees periodically consider the appropriateness of fund performance metrics in evaluating the results achieved. In general, the Independent Trustees believe that fund performance should be evaluated based on net performance (after fees and expenses) of both the highest performing and lowest performing fund share classes, where applicable, compared to appropriate benchmark indices, over appropriate time periods that may include full market cycles, taking into account relevant factors, including the following: general market conditions; issuer-specific information; and fund cash flows and other factors. Depending on the circumstances, the Independent Trustees may be satisfied with a fund's performance notwithstanding that it lags its benchmark index for certain periods.The Independent Trustees recognize that shareholders evaluate performance on a net basis over their own holding periods, for which one-, three-, and five-year periods are often used as a proxy. For this reason, the performance information reviewed by the Board also included net cumulative total return information for the fund and an appropriate benchmark index for the most recent one-, three-, and five-year periods ended June 30, 2017.Based on its review, the Board concluded that the nature, extent, and quality of services provided to the fund under the Advisory Contracts should continue to benefit the shareholders of the fund.Competitiveness of Management Fee and Total Expense Ratio. The Board considered the fund's management fee and total expense ratio compared to "mapped groups" of competitive funds and classes created for the purpose of facilitating the Trustees' analysis of the competitiveness of management fees and total expenses. Fidelity creates "mapped groups" by combining similar Lipper investment objective categories that have comparable investment mandates. For this purpose, all sector focused equity variable annuity funds are grouped in the same mapped group. Combining Lipper investment objective categories aids the Board's management fee and total expense ratio comparisons by broadening the competitive group used for comparison.Management Fee. The Board considered two proprietary management fee comparisons for the 12-month periods ended June 30 shown in basis points (BP) in the chart below. The group of Lipper funds used by the Board for management fee comparisons is referred to below as the "Total Mapped Group." The Total Mapped Group comparison focuses on a fund's standing in terms of gross management fees before expense reimbursements or caps relative to the total universe of funds with comparable investment mandates (i.e., sector equities), regardless of whether their management fee structures also are comparable. Funds with comparable management fee structures have similar management fee contractual arrangements (e.g., flat rate charged for advisory services, all-inclusive fee rate, etc.). "TMG %" represents the percentage of funds in the Total Mapped Group that had management fees that were lower than the fund's. For example, a hypothetical TMG % of 20% would mean that 80% of the funds in the Total Mapped Group had higher, and 20% had lower, management fees than the fund. The fund's actual TMG %s and the number of funds in the Total Mapped Group are in the chart below. The "Asset-Size Peer Group" (ASPG) comparison focuses on a fund's standing relative to a subset of non-Fidelity funds within the Total Mapped Group that are similar in size and management fee structure. For example, if a fund is in the first quartile of the ASPG, the fund's management fee ranks in the least expensive or lowest 25% of funds in the ASPG. The ASPG represents at least 15% of the funds in the Total Mapped Group with comparable asset size and management fee structures, subject to a minimum of 50 funds (or all funds in the Total Mapped Group if fewer than 50). Additional information, such as the ASPG quartile in which the fund's management fee rate ranked, is also included in the chart and considered by the Board.VIP Technology Portfolio

![]()
VTECIC-SANN-0818
1.817388.113
Fidelity® Variable Insurance Products: Telecommunications Portfolio Semi-Annual Report June 30, 2018 |
|
Contents
To view a fund's proxy voting guidelines and proxy voting record for the 12-month period ended June 30, visit http://www.fidelity.com/proxyvotingresults or visit the Securities and Exchange Commission's (SEC) web site at http://www.sec.gov.
You may also call 1-877-208-0098 to request a free copy of the proxy voting guidelines.
Fidelity® Variable Insurance Products are separate account options which are purchased through a variable insurance contract.
Standard & Poor's, S&P and S&P 500 are registered service marks of The McGraw-Hill Companies, Inc. and have been licensed for use by Fidelity Distributors Corporation.
Other third-party marks appearing herein are the property of their respective owners.
All other marks appearing herein are registered or unregistered trademarks or service marks of FMR LLC or an affiliated company. © 2018 FMR LLC. All rights reserved.
This report and the financial statements contained herein are submitted for the general information of the shareholders of the Fund. This report is not authorized for distribution to prospective investors in the Fund unless preceded or accompanied by an effective prospectus.
A fund files its complete schedule of portfolio holdings with the SEC for the first and third quarters of each fiscal year on Form N-Q. Forms N-Q are available on the SEC’s web site at http://www.sec.gov. A fund's Forms N-Q may be reviewed and copied at the SEC’s Public Reference Room in Washington, DC. Information regarding the operation of the SEC's Public Reference Room may be obtained by calling 1-800-SEC-0330.
For a complete list of a fund's portfolio holdings, view the most recent holdings listing, semiannual report, or annual report on Fidelity's web site at http://www.fidelity.com, http://www.institutional.fidelity.com, or http://www.401k.com, as applicable.
NOT FDIC INSURED •MAY LOSE VALUE •NO BANK GUARANTEE
Neither the Fund nor Fidelity Distributors Corporation is a bank.
Investment Summary (Unaudited)
Top Ten Stocks as of June 30, 2018
| % of fund's net assets | |
| Verizon Communications, Inc. | 24.7 |
| AT&T, Inc. | 15.9 |
| T-Mobile U.S., Inc. | 7.6 |
| Vonage Holdings Corp. | 4.0 |
| Cogent Communications Group, Inc. | 3.8 |
| Comcast Corp. Class A | 3.3 |
| Liberty Global PLC Class C | 3.2 |
| Telephone & Data Systems, Inc. | 2.9 |
| Liberty Broadband Corp. Class A | 2.9 |
| Iridium Communications, Inc. | 2.7 |
| 71.0 |
Top Industries (% of fund's net assets)
| As of June 30, 2018 | ||
| Diversified Telecommunication Services | 62.5% | |
| Wireless Telecommunication Services | 17.2% | |
| Media | 13.1% | |
| Equity Real Estate Investment Trusts (Reits) | 3.1% | |
| Software | 2.1% | |
| All Others* | 2.0% | |

* Includes short-term investments and net other assets (liabilities).
Schedule of Investments June 30, 2018 (Unaudited)
Showing Percentage of Net Assets
| Common Stocks - 99.5% | |||
| Shares | Value | ||
| Communications Equipment - 1.0% | |||
| Communications Equipment - 1.0% | |||
| Quantenna Communications, Inc. (a) | 22,200 | $344,988 | |
| Diversified Telecommunication Services - 62.5% | |||
| Alternative Carriers - 15.6% | |||
| Cogent Communications Group, Inc. | 25,463 | 1,359,724 | |
| Globalstar, Inc. (a)(b) | 320,600 | 157,062 | |
| Iliad SA | 2,968 | 469,127 | |
| Iridium Communications, Inc. (a) | 59,963 | 965,404 | |
| ORBCOMM, Inc. (a) | 23,731 | 239,683 | |
| Vonage Holdings Corp. (a) | 109,400 | 1,410,166 | |
| Zayo Group Holdings, Inc. (a) | 26,300 | 959,424 | |
| 5,560,590 | |||
| Integrated Telecommunication Services - 46.9% | |||
| AT&T, Inc. | 176,118 | 5,655,149 | |
| Atlantic Tele-Network, Inc. | 9,800 | 517,146 | |
| Bandwidth, Inc. (a) | 2,500 | 94,950 | |
| Cincinnati Bell, Inc. (a) | 41,207 | 646,950 | |
| Consolidated Communications Holdings, Inc. (b) | 48,547 | 600,041 | |
| Frontier Communications Corp. (b) | 43,453 | 232,908 | |
| Verizon Communications, Inc. | 174,471 | 8,777,636 | |
| Windstream Holdings, Inc. | 22,216 | 117,078 | |
| 16,641,858 | |||
| TOTAL DIVERSIFIED TELECOMMUNICATION SERVICES | 22,202,448 | ||
| Equity Real Estate Investment Trusts (REITs) - 3.1% | |||
| Specialized REITs - 3.1% | |||
| American Tower Corp. | 3,882 | 559,668 | |
| Equinix, Inc. | 1,300 | 558,857 | |
| 1,118,525 | |||
| Internet Software & Services - 0.5% | |||
| Internet Software & Services - 0.5% | |||
| Gogo, Inc. (a)(b) | 37,600 | 182,736 | |
| Media - 13.1% | |||
| Cable & Satellite - 13.1% | |||
| Altice Europe NV Class A | 30,375 | 123,797 | |
| Altice U.S.A., Inc. Class A | 12,645 | 215,724 | |
| Comcast Corp. Class A | 35,300 | 1,158,193 | |
| DISH Network Corp. Class A (a) | 11,000 | 369,710 | |
| GCI Liberty, Inc. (a) | 7,082 | 319,257 | |
| Liberty Broadband Corp. Class A (a) | 13,600 | 1,028,704 | |
| Liberty Global PLC Class C (a) | 42,300 | 1,125,603 | |
| Liberty Latin America Ltd. (a) | 8,736 | 169,304 | |
| Megacable Holdings S.A.B. de CV unit | 35,100 | 144,622 | |
| 4,654,914 | |||
| Software - 2.1% | |||
| Home Entertainment Software - 2.1% | |||
| Activision Blizzard, Inc. | 9,600 | 732,672 | |
| Wireless Telecommunication Services - 17.2% | |||
| Wireless Telecommunication Services - 17.2% | |||
| Millicom International Cellular SA | 2,400 | 141,000 | |
| Shenandoah Telecommunications Co. | 22,474 | 734,900 | |
| Sprint Corp. (a) | 155,016 | 843,287 | |
| T-Mobile U.S., Inc. (a) | 45,128 | 2,696,398 | |
| Telephone & Data Systems, Inc. | 37,825 | 1,037,162 | |
| U.S. Cellular Corp. (a) | 17,400 | 644,496 | |
| 6,097,243 | |||
| TOTAL COMMON STOCKS | |||
| (Cost $32,813,197) | 35,333,526 | ||
| Money Market Funds - 2.6% | |||
| Fidelity Securities Lending Cash Central Fund 1.92% (c)(d) | |||
| (Cost $930,824) | 930,791 | 930,977 | |
| TOTAL INVESTMENT IN SECURITIES - 102.1% | |||
| (Cost $33,744,021) | 36,264,503 | ||
| NET OTHER ASSETS (LIABILITIES) - (2.1)% | (756,030) | ||
| NET ASSETS - 100% | $35,508,473 |
Legend
(a) Non-income producing
(b) Security or a portion of the security is on loan at period end.
(c) Affiliated fund that is generally available only to investment companies and other accounts managed by Fidelity Investments. The rate quoted is the annualized seven-day yield of the fund at period end. A complete unaudited listing of the fund's holdings as of its most recent quarter end is available upon request. In addition, each Fidelity Central Fund's financial statements are available on the SEC's website or upon request.
(d) Investment made with cash collateral received from securities on loan.
Affiliated Central Funds
Information regarding fiscal year to date income earned by the Fund from investments in Fidelity Central Funds is as follows:
| Fund | Income earned |
| Fidelity Cash Central Fund | $1,062 |
| Fidelity Securities Lending Cash Central Fund | 30,491 |
| Total | $31,553 |
Amounts in the income column in the above table include any capital gain distributions from underlying funds, which are presented in the corresponding line-item in the Statement of Operations if applicable.
Investment Valuation
All investments are categorized as Level 1 under the Fair Value Hierarchy. The inputs or methodology used for valuing securities may not be an indication of the risk associated with investing in those securities. For more information on valuation inputs please refer to the Investment Valuation section in the accompanying Notes to Financial Statements.
See accompanying notes which are an integral part of the financial statements.
Financial Statements
Statement of Assets and Liabilities
| June 30, 2018 (Unaudited) | ||
| Assets | ||
| Investment in securities, at value (including securities loaned of $766,766) — See accompanying schedule: Unaffiliated issuers (cost $32,813,197) | $35,333,526 | |
| Fidelity Central Funds (cost $930,824) | 930,977 | |
| Total Investment in Securities (cost $33,744,021) | $36,264,503 | |
| Receivable for investments sold | 298,999 | |
| Receivable for fund shares sold | 9,116 | |
| Dividends receivable | 4,655 | |
| Distributions receivable from Fidelity Central Funds | 3,587 | |
| Prepaid expenses | 310 | |
| Other receivables | 1,931 | |
| Total assets | 36,583,101 | |
| Liabilities | ||
| Payable to custodian bank | $101,557 | |
| Payable for fund shares redeemed | 118 | |
| Accrued management fee | 16,061 | |
| Other affiliated payables | 5,168 | |
| Other payables and accrued expenses | 21,869 | |
| Collateral on securities loaned | 929,855 | |
| Total liabilities | 1,074,628 | |
| Net Assets | $35,508,473 | |
| Net Assets consist of: | ||
| Paid in capital | $31,660,953 | |
| Undistributed net investment income | 455,293 | |
| Accumulated undistributed net realized gain (loss) on investments and foreign currency transactions | 872,218 | |
| Net unrealized appreciation (depreciation) on investments and assets and liabilities in foreign currencies | 2,520,009 | |
| Net Assets | $35,508,473 | |
| Initial Class: | ||
| Net Asset Value, offering price and redemption price per share ($4,528,749 ÷ 416,830 shares) | $10.86 | |
| Investor Class: | ||
| Net Asset Value, offering price and redemption price per share ($30,979,724 ÷ 2,873,162 shares) | $10.78 |
See accompanying notes which are an integral part of the financial statements.
Statement of Operations
| Six months ended June 30, 2018 (Unaudited) | ||
| Investment Income | ||
| Dividends | $415,285 | |
| Non-Cash dividends | 171,461 | |
| Income from Fidelity Central Funds | 31,553 | |
| Total income | 618,299 | |
| Expenses | ||
| Management fee | $101,898 | |
| Transfer agent fees | 25,044 | |
| Accounting and security lending fees | 7,614 | |
| Custodian fees and expenses | 4,485 | |
| Independent trustees' fees and expenses | 192 | |
| Audit | 20,181 | |
| Legal | 272 | |
| Miscellaneous | 254 | |
| Total expenses before reductions | 159,940 | |
| Expense reductions | (2,797) | |
| Total expenses after reductions | 157,143 | |
| Net investment income (loss) | 461,156 | |
| Realized and Unrealized Gain (Loss) | ||
| Net realized gain (loss) on: | ||
| Investment securities: | ||
| Unaffiliated issuers | 1,411,300 | |
| Fidelity Central Funds | 146 | |
| Foreign currency transactions | 412 | |
| Total net realized gain (loss) | 1,411,858 | |
| Change in net unrealized appreciation (depreciation) on: | ||
| Investment securities: | ||
| Unaffiliated issuers | (3,628,292) | |
| Fidelity Central Funds | (291) | |
| Assets and liabilities in foreign currencies | (47) | |
| Total change in net unrealized appreciation (depreciation) | (3,628,630) | |
| Net gain (loss) | (2,216,772) | |
| Net increase (decrease) in net assets resulting from operations | $(1,755,616) |
See accompanying notes which are an integral part of the financial statements.
Statement of Changes in Net Assets
| Six months ended June 30, 2018 (Unaudited) | Year ended December 31, 2017 | |
| Increase (Decrease) in Net Assets | ||
| Operations | ||
| Net investment income (loss) | $461,156 | $1,296,003 |
| Net realized gain (loss) | 1,411,858 | 5,308,518 |
| Change in net unrealized appreciation (depreciation) | (3,628,630) | (6,313,980) |
| Net increase (decrease) in net assets resulting from operations | (1,755,616) | 290,541 |
| Distributions to shareholders from net investment income | (80,586) | (1,221,677) |
| Distributions to shareholders from net realized gain | (4,123,174) | (1,074,140) |
| Total distributions | (4,203,760) | (2,295,817) |
| Share transactions - net increase (decrease) | (1,343,511) | (45,062,427) |
| Redemption fees | – | 23,031 |
| Total increase (decrease) in net assets | (7,302,887) | (47,044,672) |
| Net Assets | ||
| Beginning of period | 42,811,360 | 89,856,032 |
| End of period | $35,508,473 | $42,811,360 |
| Other Information | ||
| Undistributed net investment income end of period | $455,293 | $74,723 |
See accompanying notes which are an integral part of the financial statements.
Financial Highlights
VIP Telecommunications Portfolio Initial Class
| Six months ended (Unaudited) June 30, | Years endedDecember 31, | |||||
| 2018 | 2017 | 2016 | 2015 | 2014 | 2013 | |
| Selected Per–Share Data | ||||||
| Net asset value, beginning of period | $12.74 | $13.10 | $10.85 | $10.74 | $10.77 | $9.27 |
| Income from Investment Operations | ||||||
| Net investment income (loss)A | .14B | .26 | .19 | .15 | .36C | .17 |
| Net realized and unrealized gain (loss) | (.71) | –D | 2.28 | .10 | .03 | 1.77 |
| Total from investment operations | (.57) | .26 | 2.47 | .25 | .39 | 1.94 |
| Distributions from net investment income | (.03) | (.39) | (.15) | (.13)E | (.40) | (.15) |
| Distributions from net realized gain | (1.29) | (.23) | (.08) | (.01)E | (.02) | (.30) |
| Total distributions | (1.31)F | (.62) | (.22)G | (.14) | (.42) | (.45) |
| Redemption fees added to paid in capitalA | – | –D | –D | –D | –D | .01 |
| Net asset value, end of period | $10.86 | $12.74 | $13.10 | $10.85 | $10.74 | $10.77 |
| Total ReturnH,I,J | (4.31)% | 2.05% | 22.81% | 2.34% | 3.59% | 21.28% |
| Ratios to Average Net AssetsK,L | ||||||
| Expenses before reductions | .78%M | .76% | .78% | .88% | .96% | 1.02% |
| Expenses net of fee waivers, if any | .78%M | .76% | .78% | .88% | .95% | 1.00% |
| Expenses net of all reductions | .77%M | .74% | .77% | .87% | .93% | .99% |
| Net investment income (loss) | 2.06%B,M | 2.02% | 1.52% | 1.36% | 3.31%C | 1.64% |
| Supplemental Data | ||||||
| Net assets, end of period (000 omitted) | $4,529 | $6,067 | $15,797 | $4,839 | $3,723 | $4,535 |
| Portfolio turnover rateN | 73%M | 74% | 100% | 64% | 99% | 136% |
A Calculated based on average shares outstanding during the period.
B Net investment income per share reflects a large, non-recurring dividend which amounted to $.05 per share. This dividend is not annualized in the ratio of net investment income (loss) to average net assets. Excluding this dividend the ratio would have been 1.61%.
C Net investment income per share reflects a large, non-recurring dividend which amounted to $.21 per share. Excluding this non-recurring dividend, the ratio of net investment income (loss) to average net assets would have been 1.41%.
D Amount represents less than $.005 per share.
E The amounts shown reflect certain reclassifications related to book to tax differences that were made in the year shown.
F Total distributions of $1.31 per share is comprised of distributions from net investment income of $.026 and distributions from net realized gain of $1.286 per share.
G Total distributions of $.22 per share is comprised of distributions from net investment income of $.147 and distributions from net realized gain of $.077 per share.
H Total returns for periods of less than one year are not annualized.
I Total returns do not reflect charges attributable to your insurance company's separate account. Inclusion of these charges would reduce the total returns shown.
J Total returns would have been lower if certain expenses had not been reduced during the applicable periods shown.
K Fees and expenses of any underlying Fidelity Central Funds are not included in the Fund's expense ratio. The Fund indirectly bears its proportionate share of the expenses of any underlying Fidelity Central Funds.
L Expense ratios reflect operating expenses of the class. Expenses before reductions do not reflect amounts reimbursed by the investment adviser or reductions from brokerage service arrangements or reductions from other expense offset arrangements and do not represent the amount paid by the class during periods when reimbursements or reductions occur. Expenses net of fee waivers reflect expenses after reimbursement by the investment adviser but prior to reductions from brokerage service arrangements or other expense offset arrangements. Expenses net of all reductions represent the net expenses paid by the class.
M Annualized
N Amount does not include the portfolio activity of any underlying Fidelity Central Funds.
See accompanying notes which are an integral part of the financial statements.
VIP Telecommunications Portfolio Investor Class
| Six months ended (Unaudited) June 30, | Years endedDecember 31, | |||||
| 2018 | 2017 | 2016 | 2015 | 2014 | 2013 | |
| Selected Per–Share Data | ||||||
| Net asset value, beginning of period | $12.65 | $13.02 | $10.79 | $10.67 | $10.71 | $9.22 |
| Income from Investment Operations | ||||||
| Net investment income (loss)A | .14B | .25 | .18 | .14 | .35C | .16 |
| Net realized and unrealized gain (loss) | (.70) | (.01) | 2.27 | .11 | .03 | 1.77 |
| Total from investment operations | (.56) | .24 | 2.45 | .25 | .38 | 1.93 |
| Distributions from net investment income | (.03) | (.37) | (.14) | (.12)D | (.40) | (.15) |
| Distributions from net realized gain | (1.29) | (.23) | (.08) | (.01)D | (.02) | (.30) |
| Total distributions | (1.31)E | (.61)F | (.22) | (.13) | (.42) | (.45) |
| Redemption fees added to paid in capitalA | – | –G | –G | –G | –G | .01 |
| Net asset value, end of period | $10.78 | $12.65 | $13.02 | $10.79 | $10.67 | $10.71 |
| Total ReturnH,I,J | (4.28)% | 1.89% | 22.69% | 2.38% | 3.48% | 21.27% |
| Ratios to Average Net AssetsK,L | ||||||
| Expenses before reductions | .86%M | .84% | .86% | .95% | 1.01% | 1.07% |
| Expenses net of fee waivers, if any | .86%M | .84% | .86% | .95% | .99% | 1.07% |
| Expenses net of all reductions | .84%M | .83% | .85% | .94% | .97% | 1.06% |
| Net investment income (loss) | 1.98%B,M | 1.94% | 1.44% | 1.29% | 3.27%C | 1.57% |
| Supplemental Data | ||||||
| Net assets, end of period (000 omitted) | $30,980 | $36,744 | $74,059 | $23,080 | $16,159 | $17,112 |
| Portfolio turnover rateN | 73%M | 74% | 100% | 64% | 99% | 136% |
A Calculated based on average shares outstanding during the period.
B Net investment income per share reflects a large, non-recurring dividend which amounted to $.05 per share. This dividend is not annualized in the ratio of net investment income (loss) to average net assets. Excluding this dividend the ratio would have been 1.53%.
C Net investment income per share reflects a large, non-recurring dividend which amounted to $.21 per share. Excluding this non-recurring dividend, the ratio of net investment income (loss) to average net assets would have been 1.37%.
D The amounts shown reflect certain reclassifications related to book to tax differences that were made in the year shown.
E Total distributions of $1.31 per share is comprised of distributions from net investment income of $.025 and distributions from net realized gain of $1.286 per share.
F Total distributions of $.61 per share is comprised of distributions from net investment income of $.373 and distributions from net realized gain of $.232 per share.
G Amount represents less than $.005 per share.
H Total returns for periods of less than one year are not annualized.
I Total returns do not reflect charges attributable to your insurance company's separate account. Inclusion of these charges would reduce the total returns shown.
J Total returns would have been lower if certain expenses had not been reduced during the applicable periods shown.
K Fees and expenses of any underlying Fidelity Central Funds are not included in the Fund's expense ratio. The Fund indirectly bears its proportionate share of the expenses of any underlying Fidelity Central Funds.
L Expense ratios reflect operating expenses of the class. Expenses before reductions do not reflect amounts reimbursed by the investment adviser or reductions from brokerage service arrangements or reductions from other expense offset arrangements and do not represent the amount paid by the class during periods when reimbursements or reductions occur. Expenses net of fee waivers reflect expenses after reimbursement by the investment adviser but prior to reductions from brokerage service arrangements or other expense offset arrangements. Expenses net of all reductions represent the net expenses paid by the class.
M Annualized
N Amount does not include the portfolio activity of any underlying Fidelity Central Funds.
See accompanying notes which are an integral part of the financial statements.
Notes to Financial Statements (Unaudited)
For the period ended June 30, 2018
1. Organization.
VIP Telecommunications Portfolio (the Fund) is a non-diversified fund of Variable Insurance Products Fund IV (the Trust) and is authorized to issue an unlimited number of shares. The Trust is registered under the Investment Company Act of 1940, as amended (the 1940 Act), as an open-end management investment company organized as a Massachusetts business trust. Shares of the Fund may only be purchased by insurance companies for the purpose of funding variable annuity or variable life insurance contracts. The Fund offers the following classes of shares: Initial Class shares and Investor Class shares. All classes have equal rights and voting privileges, except for matters affecting a single class.
2. Investments in Fidelity Central Funds.
The Fund invests in Fidelity Central Funds, which are open-end investment companies generally available only to other investment companies and accounts managed by the investment adviser and its affiliates. The Fund's Schedule of Investments lists each of the Fidelity Central Funds held as of period end, if any, as an investment of the Fund, but does not include the underlying holdings of each Fidelity Central Fund. As an Investing Fund, the Fund indirectly bears its proportionate share of the expenses of the underlying Fidelity Central Funds.
The Money Market Central Funds seek preservation of capital and current income and are managed by Fidelity Investments Money Management, Inc. (FIMM), an affiliate of the investment adviser. Annualized expenses of the Money Market Central Funds as of their most recent shareholder report date are less than .005%.
A complete unaudited list of holdings for each Fidelity Central Fund is available upon request or at the Securities and Exchange Commission (the SEC) website at www.sec.gov. In addition, the financial statements of the Fidelity Central Funds are available on the SEC website or upon request.
3. Significant Accounting Policies.
The Fund is an investment company and applies the accounting and reporting guidance of the Financial Accounting Standards Board (FASB) Accounting Standards Codification Topic 946 Financial Services – Investments Companies. The financial statements have been prepared in conformity with accounting principles generally accepted in the United States of America (GAAP), which require management to make certain estimates and assumptions at the date of the financial statements. Actual results could differ from those estimates. Subsequent events, if any, through the date that the financial statements were issued have been evaluated in the preparation of the financial statements. The following summarizes the significant accounting policies of the Fund:
Investment Valuation. Investments are valued as of 4:00 p.m. Eastern time on the last calendar day of the period. The Board of Trustees (the Board) has delegated the day to day responsibility for the valuation of the Fund's investments to the Fair Value Committee (the Committee) established by the Fund's investment adviser. In accordance with valuation policies and procedures approved by the Board, the Fund attempts to obtain prices from one or more third party pricing vendors or brokers to value its investments. When current market prices, quotations or currency exchange rates are not readily available or reliable, investments will be fair valued in good faith by the Committee, in accordance with procedures adopted by the Board. Factors used in determining fair value vary by investment type and may include market or investment specific events. The frequency with which these procedures are used cannot be predicted and they may be utilized to a significant extent. The Committee oversees the Fund's valuation policies and procedures and reports to the Board on the Committee's activities and fair value determinations. The Board monitors the appropriateness of the procedures used in valuing the Fund's investments and ratifies the fair value determinations of the Committee.
The Fund categorizes the inputs to valuation techniques used to value its investments into a disclosure hierarchy consisting of three levels as shown below:
- Level 1 – quoted prices in active markets for identical investments
- Level 2 – other significant observable inputs (including quoted prices for similar investments, interest rates, prepayment speeds, etc.)
- Level 3 – unobservable inputs (including the Fund's own assumptions based on the best information available)
Valuation techniques used to value the Fund's investments by major category are as follows:
Equity securities, including restricted securities, for which market quotations are readily available, are valued at the last reported sale price or official closing price as reported by a third party pricing vendor on the primary market or exchange on which they are traded and are categorized as Level 1 in the hierarchy. In the event there were no sales during the day or closing prices are not available, securities are valued at the last quoted bid price or may be valued using the last available price and are generally categorized as Level 2 in the hierarchy. For foreign equity securities, when market or security specific events arise, comparisons to the valuation of American Depositary Receipts (ADRs), futures contracts, Exchange-Traded Funds (ETFs) and certain indexes as well as quoted prices for similar securities may be used and would be categorized as Level 2 in the hierarchy. Utilizing these techniques may result in transfers between Level 1 and Level 2. For equity securities, including restricted securities, where observable inputs are limited, assumptions about market activity and risk are used and these securities may be categorized as Level 3 in the hierarchy.
Investments in open-end mutual funds, including the Fidelity Central Funds, are valued at their closing net asset value (NAV) each business day and are categorized as Level 1 in the hierarchy.
Changes in valuation techniques may result in transfers in or out of an assigned level within the disclosure hierarchy.
Foreign Currency. The Fund may use foreign currency contracts to facilitate transactions in foreign-denominated securities. Gains and losses from these transactions may arise from changes in the value of the foreign currency or if the counterparties do not perform under the contracts' terms.
Foreign-denominated assets, including investment securities, and liabilities are translated into U.S. dollars at the exchange rates at period end. Purchases and sales of investment securities, income and dividends received and expenses denominated in foreign currencies are translated into U.S. dollars at the exchange rate in effect on the transaction date.
The effects of exchange rate fluctuations on investments are included with the net realized and unrealized gain (loss) on investment securities. Other foreign currency transactions resulting in realized and unrealized gain (loss) are disclosed separately.
Investment Transactions and Income. For financial reporting purposes, the Fund's investment holdings and NAV include trades executed through the end of the last business day of the period. The NAV per share for processing shareholder transactions is calculated as of the close of business of the New York Stock Exchange (NYSE), normally 4:00 p.m. Eastern time and includes trades executed through the end of the prior business day. Gains and losses on securities sold are determined on the basis of identified cost and include proceeds received from litigation. Dividend income is recorded on the ex-dividend date, except for certain dividends from foreign securities where the ex-dividend date may have passed, which are recorded as soon as the Fund is informed of the ex-dividend date. Non-cash dividends included in dividend income, if any, are recorded at the fair market value of the securities received. Income and capital gain distributions from Fidelity Central Funds, if any, are recorded on the ex-dividend date. Certain distributions received by the Fund represent a return of capital or capital gain. The Fund determines the components of these distributions subsequent to the ex-dividend date, based upon receipt of tax filings or other correspondence relating to the underlying investment. These distributions are recorded as a reduction of cost of investments and/or as a realized gain. Large, non-recurring dividends recognized by the Fund are presented separately on the Statement of Operations as "Non-cash dividends" and the impact of these dividends is presented in the Financial Highlights. Investment income is recorded net of foreign taxes withheld where recovery of such taxes is uncertain.
Class Allocations and Expenses. Investment income, realized and unrealized capital gains and losses, common expenses of the Fund, and certain fund-level expense reductions, if any, are allocated daily on a pro-rata basis to each class based on the relative net assets of each class to the total net assets of the Fund. Each class differs with respect to transfer agent fees incurred. Certain expense reductions may also differ by class. For the reporting period, the allocated portion of income and expenses to each class as a percent of its average net assets may vary due to the timing of recording these transactions in relation to fluctuating net assets of the classes. Expenses directly attributable to a fund are charged to that fund. Expenses attributable to more than one fund are allocated among the respective funds on the basis of relative net assets or other appropriate methods. Expense estimates are accrued in the period to which they relate and adjustments are made when actual amounts are known.
Income Tax Information and Distributions to Shareholders. Each year, the Fund intends to qualify as a regulated investment company under Subchapter M of the Internal Revenue Code, including distributing substantially all of its taxable income and realized gains. As a result, no provision for U.S. Federal income taxes is required. The Fund files a U.S. federal tax return, in addition to state and local tax returns as required. The Fund's federal income tax returns are subject to examination by the Internal Revenue Service (IRS) for a period of three fiscal years after they are filed. State and local tax returns may be subject to examination for an additional fiscal year depending on the jurisdiction. Foreign taxes are provided for based on the Fund's understanding of the tax rules and rates that exist in the foreign markets in which it invests.
Distributions are declared and recorded on the ex-dividend date. Income and capital gain distributions are declared separately for each class. Income and capital gain distributions are determined in accordance with income tax regulations, which may differ from GAAP.
Capital accounts within the financial statements are adjusted for permanent book-tax differences. These adjustments have no impact on net assets or the results of operations. Capital accounts are not adjusted for temporary book-tax differences which will reverse in a subsequent period.
Book-tax differences are primarily due to foreign currency transactions, certain deemed distributions and losses deferred due to wash sales.
As of period end, the cost and unrealized appreciation (depreciation) in securities, and derivatives if applicable, for federal income tax purposes were as follows:
| Gross unrealized appreciation | $6,347,878 |
| Gross unrealized depreciation | (4,354,816) |
| Net unrealized appreciation (depreciation) | $1,993,062 |
| Tax cost | $34,271,441 |
4. Purchases and Sales of Investments.
Purchases and sales of securities, other than short-term securities, aggregated $13,800,916 and $18,636,411, respectively.
5. Fees and Other Transactions with Affiliates.
Management Fee. Fidelity SelectCo, LLC (the investment adviser) and its affiliates provide the Fund with investment management related services for which the Fund pays a monthly management fee. The management fee is the sum of an individual fund fee rate that is based on an annual rate of .30% of the Fund's average net assets and an annualized group fee rate that averaged .24% during the period. The group fee rate is based upon the average net assets of all the mutual funds advised by Fidelity Management & Research Company (FMR) and the investment adviser. The group fee rate decreases as assets under management increase and increases as assets under management decrease. For the reporting period, the total annualized management fee rate was .54% of the Fund's average net assets.
Transfer Agent Fees. Fidelity Investments Institutional Operations Company, Inc. (FIIOC), an affiliate of the investment adviser, is the Fund's transfer, dividend disbursing, and shareholder servicing agent. FIIOC receives an asset-based fee with respect to each class. Each class pays a fee for transfer agent services, typesetting and printing and mailing of shareholder reports, excluding mailing of proxy statements, equal to an annual rate of class-level average net assets. The annual rate for Investor Class is .15% and the annual rate for all other classes is .07%. For the period, transfer agent fees for each class were as follows:
| Initial Class | $1,611 |
| Investor Class | 23,433 |
| $25,044 |
Accounting and Security Lending Fees. Fidelity Service Company, Inc. (FSC), an affiliate of the investment adviser, maintains the Fund's accounting records. The accounting fee is based on the level of average net assets for each month. Under a separate contract, FSC administers the security lending program. The security lending fee is based on the number and duration of lending transactions. For the period, the fees were equivalent to an annualized rate of .04%.
Brokerage Commissions. The Fund placed a portion of its portfolio transactions with brokerage firms which are affiliates of the investment adviser. Brokerage commissions are included in net realized gain (loss) and change in net unrealized appreciation (depreciation) in the Statement of Operations. The commissions paid to these affiliated firms were $714 for the period.
Interfund Trades. The Fund may purchase from or sell securities to other Fidelity Funds under procedures adopted by the Board. The procedures have been designed to ensure these interfund trades are executed in accordance with Rule 17a-7 of the 1940 Act. Interfund trades are included within the respective purchases and sales amounts shown in the Purchases and Sales of Investments note.
6. Committed Line of Credit.
The Fund participates with other funds managed by the investment adviser or an affiliate in a $4.25 billion credit facility (the "line of credit") to be utilized for temporary or emergency purposes to fund shareholder redemptions or for other short-term liquidity purposes. The Fund has agreed to pay commitment fees on its pro-rata portion of the line of credit, which amounted to $61 and is reflected in Miscellaneous expenses on the Statement of Operations. During the period, the Fund did not borrow on this line of credit.
7. Security Lending.
The Fund lends portfolio securities through a lending agent from time to time in order to earn additional income. On the settlement date of the loan, the Fund receives collateral (in the form of U.S. Treasury obligations, letters of credit and/or cash) against the loaned securities and maintains collateral in an amount not less than 100% of the market value of the loaned securities during the period of the loan. The market value of the loaned securities is determined at the close of business of the Fund and any additional required collateral is delivered to the Fund on the next business day. The Fund or borrower may terminate the loan at any time, and if the borrower defaults on its obligation to return the securities loaned because of insolvency or other reasons, the Fund may apply collateral received from the borrower against the obligation. The Fund may experience delays and costs in recovering the securities loaned. Any cash collateral received is invested in the Fidelity Securities Lending Cash Central Fund. The value of loaned securities and cash collateral at period end are disclosed on the Fund's Statement of Assets and Liabilities. Security lending income represents the income earned on investing cash collateral, less rebates paid to borrowers and any lending agent fees associated with the loan, plus any premium payments received for lending certain types of securities. Security lending income is presented in the Statement of Operations as a component of income from Fidelity Central Funds. Total security lending income during the period amounted to $30,491.
8. Expense Reductions.
Commissions paid to certain brokers with whom the investment adviser, or its affiliates, places trades on behalf of the Fund include an amount in addition to trade execution, which may be rebated back to the Fund to offset certain expenses. This amount totaled $2,607 for the period.
In addition, during the period the investment adviser reimbursed and/or waived a portion of fund-level operating expenses in the amount of $190.
9. Distributions to Shareholders.
Distributions to shareholders of each class were as follows:
| Six months ended June 30, 2018 | Year ended December 31, 2017 | |
| From net investment income | ||
| Initial Class | $11,188 | $186,059 |
| Investor Class | 69,398 | 1,035,618 |
| Total | $80,586 | $1,221,677 |
| From net realized gain | ||
| Initial Class | $553,354 | $188,175 |
| Investor Class | 3,569,820 | 885,965 |
| Total | $4,123,174 | $1,074,140 |
10. Share Transactions.
Transactions for each class of shares were as follows:
| Shares | Shares | Dollars | Dollars | |
| Six months ended June 30, 2018 | Year ended December 31, 2017 | Six months ended June 30, 2018 | Year ended December 31, 2017 | |
| Initial Class | ||||
| Shares sold | 7,496 | 316,832 | $82,971 | $4,207,080 |
| Reinvestment of distributions | 52,712 | 29,505 | 564,542 | 374,234 |
| Shares redeemed | (119,743) | (1,075,454) | (1,384,501) | (13,955,988) |
| Net increase (decrease) | (59,535) | (729,117) | $(736,988) | $(9,374,674) |
| Investor Class | ||||
| Shares sold | 149,939 | 632,227 | $1,665,647 | $8,267,802 |
| Reinvestment of distributions | 342,032 | 152,997 | 3,639,218 | 1,921,583 |
| Shares redeemed | (522,798) | (3,568,494) | (5,911,388) | (45,877,138) |
| Net increase (decrease) | (30,827) | (2,783,270) | $(606,523) | $(35,687,753) |
11. Other.
The Fund's organizational documents provide former and current trustees and officers with a limited indemnification against liabilities arising in connection with the performance of their duties to the Fund. In the normal course of business, the Fund may also enter into contracts that provide general indemnifications. The Fund's maximum exposure under these arrangements is unknown as this would be dependent on future claims that may be made against the Fund. The risk of material loss from such claims is considered remote.
At the end of the period, the investment adviser or its affiliates were the owners of record of 100% of the total outstanding shares of the Fund.
Shareholder Expense Example
As a shareholder of the Fund, you incur two types of costs: (1) transaction costs and (2) ongoing costs, including management fees and other Fund expenses. This Example is intended to help you understand your ongoing costs (in dollars) of investing in the Fund and to compare these costs with the ongoing costs of investing in other mutual funds.
The Example is based on an investment of $1,000 invested at the beginning of the period and held for the entire period (January 1, 2018 to June 30, 2018).
Actual Expenses
The first line of the accompanying table for each class of the Fund provides information about actual account values and actual expenses. You may use the information in this line, together with the amount you invested, to estimate the expenses that you paid over the period. Simply divide your account value by $1,000.00 (for example, an $8,600 account value divided by $1,000.00 = 8.6), then multiply the result by the number in the first line for a class of the Fund under the heading entitled "Expenses Paid During Period" to estimate the expenses you paid on your account during this period. The estimate of expenses does not include any fees or other expenses of any variable annuity or variable life insurance product. If they were, the estimate of expenses you paid during the period would be higher, and your ending account value would be lower. In addition, the Fund, as a shareholder in the underlying Fidelity Central Funds, will indirectly bear its pro-rata share of the fees and expenses incurred by the underlying Fidelity Central Funds. These fees and expenses are not included in the Fund's annualized expense ratio used to calculate the expense estimate in the table below.
Hypothetical Example for Comparison Purposes
The second line of the accompanying table for each class of the Fund provides information about hypothetical account values and hypothetical expenses based on a Class' actual expense ratio and an assumed rate of return of 5% per year before expenses, which is not the Class' actual return. The hypothetical account values and expenses may not be used to estimate the actual ending account balance or expenses you paid for the period. You may use this information to compare the ongoing costs of investing in the Fund and other funds. To do so, compare this 5% hypothetical example with the 5% hypothetical examples that appear in the shareholder reports of the other funds. The estimate of expenses does not include any fees or other expenses of any variable annuity or variable life insurance product. If they were, the estimate of expenses you paid during the period would be higher, and your ending account value would be lower. In addition, the Fund, as a shareholder in the underlying Fidelity Central Funds, will indirectly bear its pro-rata share of the fees and expenses incurred by the underlying Fidelity Central Funds. These fees and expenses are not included in the Fund's annualized expense ratio used to calculate the expense estimate in the table below.
Please note that the expenses shown in the table are meant to highlight your ongoing costs only and do not reflect any transaction costs. Therefore, the second line of the table is useful in comparing ongoing costs only, and will not help you determine the relative total costs of owning different funds.
| Annualized Expense Ratio-A | Beginning Account Value January 1, 2018 | Ending Account Value June 30, 2018 | Expenses Paid During Period-B January 1, 2018 to June 30, 2018 | |
| Initial Class | .78% | |||
| Actual | $1,000.00 | $956.90 | $3.78 | |
| Hypothetical-C | $1,000.00 | $1,020.93 | $3.91 | |
| Investor Class | .86% | |||
| Actual | $1,000.00 | $957.20 | $4.17 | |
| Hypothetical-C | $1,000.00 | $1,020.53 | $4.31 |
A Annualized expense ratio reflects expenses net of applicable fee waivers.
B Expenses are equal to each Class' annualized expense ratio, multiplied by the average account value over the period, multiplied by 181/365 (to reflect the one-half year period).
C 5% return per year before expenses
Board Approval of Investment Advisory Contracts and Management Fees
VIP Telecommunications Portfolio
Each year, the Board of Trustees, including the Independent Trustees (together, the Board), votes on the renewal of the management contract with Fidelity SelectCo, LLC (SelectCo), an affiliate of Fidelity Management & Research Company (FMR), and the sub-advisory agreements with affiliates of FMR (together, the Advisory Contracts) for the fund. SelectCo and the sub-advisers are collectively referred to herein as the Investment Advisers. The Board, assisted by the advice of fund counsel and Independent Trustees' counsel, requests and considers a broad range of information relevant to the renewal of the Advisory Contracts throughout the year.
The Board meets regularly and, at each of its meetings, covers an extensive agenda of topics and materials and considers factors that are relevant to its annual consideration of the renewal of the fund's Advisory Contracts, including the services and support provided to the fund and its shareholders. The Board has established four standing committees (Committees) — Operations, Audit, Fair Valuation, and Governance and Nominating — each composed of and chaired by Independent Trustees with varying backgrounds, to which the Board has assigned specific subject matter responsibilities in order to enhance effective decision-making by the Board. The Operations Committee, of which all of the Independent Trustees are members, meets regularly throughout the year and considers, among other matters, information specifically related to the annual consideration of the renewal of the fund's Advisory Contracts. The Board, acting directly and through its Committees, requests and receives information concerning the annual consideration of the renewal of the fund's Advisory Contracts. The Board also meets as needed to review matters specifically related to the Board's annual consideration of the renewal of the Advisory Contracts. Members of the Board may also meet with trustees of other Fidelity funds through ad hoc joint committees to discuss certain matters relevant to all of the Fidelity funds.
At its January 2018 meeting, the Board unanimously determined to renew the fund's Advisory Contracts. In reaching its determination, the Board considered all factors it believed relevant, including (i) the nature, extent, and quality of the services to be provided to the fund and its shareholders (including the investment performance of the fund); (ii) the competitiveness of the fund's management fee and total expense ratio relative to peer funds; (iii) the total costs of the services to be provided by and the profits to be realized by Fidelity from its relationships with the fund; and (iv) the extent to which, if any, economies of scale exist and would be realized as the fund grows, and whether any economies of scale are appropriately shared with fund shareholders.
In considering whether to renew the Advisory Contracts for the fund, the Board reached a determination, with the assistance of fund counsel and Independent Trustees' counsel and through the exercise of its business judgment, that the renewal of the Advisory Contracts was in the best interests of the fund and its shareholders and that the compensation payable under the Advisory Contracts was fair and reasonable. The Board's decision to renew the Advisory Contracts was not based on any single factor, but rather was based on a comprehensive consideration of all the information provided to the Board at its meetings throughout the year. The Board, in reaching its determination to renew the Advisory Contracts, was aware that shareholders of the fund have a broad range of investment choices available to them, including a wide choice among funds offered by Fidelity's competitors, and that the fund's shareholders, who have the opportunity to review and weigh the disclosure provided by the fund in its prospectus and other public disclosures, have chosen to invest in this fund, which is part of the Fidelity family of funds.
Amendment to Group Fee Rate. The Board also ratified an amendment to the management contract for the fund to add an additional breakpoint to the group fee schedule, which was effective October 1, 2017. The Board noted that the additional breakpoint would result in lower management fee rates to the extent that assets under management that are included in group fee calculations increase above the new breakpoint.
Nature, Extent, and Quality of Services Provided. The Board considered the staffing of the Investment Advisers as it relates to the fund, including the backgrounds of investment personnel of SelectCo, and also considered the fund's investment objective, strategies, and related investment philosophy. The Independent Trustees also had discussions with senior management of Fidelity's investment operations and investment groups. The Board considered the structure of the investment personnel compensation program and whether this structure provides appropriate incentives to act in the best interests of the fund. Additionally, the Board considered the portfolio managers' investments, if any, in the funds that they manage.Resources Dedicated to Investment Management and Support Services. The Board reviewed the general qualifications and capabilities of the Investment Advisers' investment staffs, including their size, education, experience, and resources, as well as Fidelity's approach to recruiting, training, managing, and compensating investment personnel. The Board noted that Fidelity has continued to increase the resources devoted to non-U.S. offices, including expansion of Fidelity's global investment organization. The Board also noted that Fidelity's analysts have extensive resources, tools and capabilities that allow them to conduct sophisticated quantitative and fundamental analysis, as well as credit analysis of issuers, counterparties and guarantors. Further, the Board considered that Fidelity's investment professionals have sufficient access to global information and data so as to provide competitive investment results over time, and that those professionals also have access to sophisticated tools that permit them to assess portfolio construction and risk and performance attribution characteristics continuously, as well as to transmit new information and research conclusions rapidly around the world. Additionally, in its deliberations, the Board considered Fidelity's trading, risk management, compliance, and technology and operations capabilities and resources, which are integral parts of the investment management process.Shareholder and Administrative Services. The Board considered (i) the nature, extent, quality, and cost of advisory, administrative, and shareholder services performed by the Investment Advisers and their affiliates under the Advisory Contracts and under separate agreements covering transfer agency, pricing and bookkeeping, and securities lending services for the fund; (ii) the nature and extent of the supervision of third party service providers, principally custodians, subcustodians, and pricing vendors; and (iii) the resources devoted to, and the record of compliance with, the fund's compliance policies and procedures. The Board also reviewed the allocation of fund brokerage, including allocations to brokers affiliated with the Investment Advisers, the use of brokerage commissions to pay fund expenses, and the use of "soft" commission dollars to pay for research services.The Board noted that the growth of fund assets over time across the complex allows Fidelity to reinvest in the development of services designed to enhance the value or convenience of the Fidelity funds as investment vehicles. These services include 24-hour access to account information and market information through telephone representatives and over the Internet, investor education materials and asset allocation tools, and the expanded availability of Fidelity Investor Centers.The Board noted that it and the boards of certain other Fidelity funds had formed an ad hoc Committee on Transfer Agency Fees to review the variety of transfer agency fee structures throughout the industry and Fidelity's competitive positioning with respect to industry participants.Investment in a Large Fund Family. The Board considered the benefits to shareholders of investing in a Fidelity fund, including the benefits of investing in a fund that is part of a large family of funds offering a variety of investment disciplines and providing a large variety of mutual fund investor services. The Board noted that Fidelity had taken, or had made recommendations that resulted in the Fidelity funds taking, a number of actions over the previous year that benefited particular funds, including: (i) continuing to dedicate additional resources to Fidelity's investment research process, which includes meetings with management of issuers in which the funds invest, and to the support of the senior management team that oversees asset management; (ii) continuing efforts to enhance Fidelity's global research capabilities; (iii) launching new funds and making other enhancements to meet client needs; (iv) launching new share classes of existing funds; (v) eliminating purchase minimums and broadening eligibility requirements for certain lower-priced share classes; (vi) reducing management fees and total expenses for certain growth equity funds and index funds; (vii) lowering expense caps for certain existing funds and classes to reduce expenses borne by shareholders; (viii) eliminating short-term redemption fees for certain funds; (ix) introducing a new pricing structure for certain funds of funds that is expected to reduce overall expenses paid by shareholders; (x) rationalizing product lines and gaining increased efficiencies through proposals for fund mergers and share class consolidations; (xi) continuing to develop, acquire and implement systems and technology to improve services to the funds and shareholders, strengthen information security, and increase efficiency; and (xii) implementing enhancements to further strengthen Fidelity's product line to increase investors' probability of success in achieving their investment goals, including retirement income goals.Investment Performance. The Board considered whether the fund has operated in accordance with its investment objective, as well as its record of compliance with its investment restrictions and its performance history.The Board took into account discussions with representatives of SelectCo about fund investment performance that occur at Board meetings throughout the year. In this regard the Board noted that as part of regularly scheduled fund reviews and other reports to the Board on fund performance, the Board considers annualized return information for the fund for different time periods, measured against a securities market index ("benchmark index"). In its evaluation of fund investment performance at meetings throughout the year, the Board gave particular attention to information indicating underperformance of certain Fidelity funds for specific time periods and discussed with the Investment Advisers the reasons for such underperformance.In addition to reviewing absolute and relative fund performance, the Independent Trustees periodically consider the appropriateness of fund performance metrics in evaluating the results achieved. In general, the Independent Trustees believe that fund performance should be evaluated based on net performance (after fees and expenses) of both the highest performing and lowest performing fund share classes, where applicable, compared to appropriate benchmark indices, over appropriate time periods that may include full market cycles, taking into account relevant factors, including the following: general market conditions; issuer-specific information; and fund cash flows and other factors. Depending on the circumstances, the Independent Trustees may be satisfied with a fund's performance notwithstanding that it lags its benchmark index for certain periods.The Independent Trustees recognize that shareholders evaluate performance on a net basis over their own holding periods, for which one-, three-, and five-year periods are often used as a proxy. For this reason, the performance information reviewed by the Board also included net cumulative total return information for the fund and an appropriate benchmark index for the most recent one-, three-, and five-year periods ended June 30, 2017.Based on its review, the Board concluded that the nature, extent, and quality of services provided to the fund under the Advisory Contracts should continue to benefit the shareholders of the fund.Competitiveness of Management Fee and Total Expense Ratio. The Board considered the fund's management fee and total expense ratio compared to "mapped groups" of competitive funds and classes created for the purpose of facilitating the Trustees' analysis of the competitiveness of management fees and total expenses. Fidelity creates "mapped groups" by combining similar Lipper investment objective categories that have comparable investment mandates. For this purpose, all sector focused equity variable annuity funds are grouped in the same mapped group. Combining Lipper investment objective categories aids the Board's management fee and total expense ratio comparisons by broadening the competitive group used for comparison.Management Fee. The Board considered two proprietary management fee comparisons for the 12-month periods ended June 30 shown in basis points (BP) in the chart below. The group of Lipper funds used by the Board for management fee comparisons is referred to below as the "Total Mapped Group." The Total Mapped Group comparison focuses on a fund's standing in terms of gross management fees before expense reimbursements or caps relative to the total universe of funds with comparable investment mandates (i.e., sector equities), regardless of whether their management fee structures also are comparable. Funds with comparable management fee structures have similar management fee contractual arrangements (e.g., flat rate charged for advisory services, all-inclusive fee rate, etc.). "TMG %" represents the percentage of funds in the Total Mapped Group that had management fees that were lower than the fund's. For example, a hypothetical TMG % of 20% would mean that 80% of the funds in the Total Mapped Group had higher, and 20% had lower, management fees than the fund. The fund's actual TMG %s and the number of funds in the Total Mapped Group are in the chart below. The "Asset-Size Peer Group" (ASPG) comparison focuses on a fund's standing relative to a subset of non-Fidelity funds within the Total Mapped Group that are similar in size and management fee structure. For example, if a fund is in the first quartile of the ASPG, the fund's management fee ranks in the least expensive or lowest 25% of funds in the ASPG. The ASPG represents at least 15% of the funds in the Total Mapped Group with comparable asset size and management fee structures, subject to a minimum of 50 funds (or all funds in the Total Mapped Group if fewer than 50). Additional information, such as the ASPG quartile in which the fund's management fee rate ranked, is also included in the chart and considered by the Board.VIP Telecommunications Portfolio

![]()
VTELP-SANN-0818
1.851007.111
Fidelity® Variable Insurance Products: Utilities Portfolio Semi-Annual Report June 30, 2018 |
|
Contents
To view a fund's proxy voting guidelines and proxy voting record for the 12-month period ended June 30, visit http://www.fidelity.com/proxyvotingresults or visit the Securities and Exchange Commission's (SEC) web site at http://www.sec.gov.
You may also call 1-877-208-0098 to request a free copy of the proxy voting guidelines.
Fidelity® Variable Insurance Products are separate account options which are purchased through a variable insurance contract.
Standard & Poor's, S&P and S&P 500 are registered service marks of The McGraw-Hill Companies, Inc. and have been licensed for use by Fidelity Distributors Corporation.
Other third-party marks appearing herein are the property of their respective owners.
All other marks appearing herein are registered or unregistered trademarks or service marks of FMR LLC or an affiliated company. © 2018 FMR LLC. All rights reserved.
This report and the financial statements contained herein are submitted for the general information of the shareholders of the Fund. This report is not authorized for distribution to prospective investors in the Fund unless preceded or accompanied by an effective prospectus.
A fund files its complete schedule of portfolio holdings with the SEC for the first and third quarters of each fiscal year on Form N-Q. Forms N-Q are available on the SEC’s web site at http://www.sec.gov. A fund's Forms N-Q may be reviewed and copied at the SEC’s Public Reference Room in Washington, DC. Information regarding the operation of the SEC's Public Reference Room may be obtained by calling 1-800-SEC-0330.
For a complete list of a fund's portfolio holdings, view the most recent holdings listing, semiannual report, or annual report on Fidelity's web site at http://www.fidelity.com, http://www.institutional.fidelity.com, or http://www.401k.com, as applicable.
NOT FDIC INSURED •MAY LOSE VALUE •NO BANK GUARANTEE
Neither the Fund nor Fidelity Distributors Corporation is a bank.
Investment Summary (Unaudited)
Top Ten Stocks as of June 30, 2018
| % of fund's net assets | |
| NextEra Energy, Inc. | 8.4 |
| Evergy, Inc. | 6.9 |
| Exelon Corp. | 6.8 |
| FirstEnergy Corp. | 6.1 |
| Public Service Enterprise Group, Inc. | 5.9 |
| Dominion Resources, Inc. | 5.9 |
| American Electric Power Co., Inc. | 5.4 |
| Entergy Corp. | 4.7 |
| Sempra Energy | 4.2 |
| Eversource Energy | 3.3 |
| 57.6 |
Top Industries (% of fund's net assets)
| As of June 30, 2018 | ||
| Electric Utilities | 54.9% | |
| Multi-Utilities | 19.9% | |
| Independent Power and Renewable Electricity Producers | 7.2% | |
| Oil, Gas & Consumable Fuels | 5.3% | |
| Media | 3.4% | |
| All Others* | 9.3% | |

* Includes short-term investments and net other assets (liabilities).
Schedule of Investments June 30, 2018 (Unaudited)
Showing Percentage of Net Assets
| Common Stocks - 98.6% | |||
| Shares | Value | ||
| Diversified Telecommunication Services - 3.3% | |||
| Integrated Telecommunication Services - 3.3% | |||
| AT&T, Inc. | 138,671 | $4,452,726 | |
| Electric Utilities - 54.9% | |||
| Electric Utilities - 54.9% | |||
| American Electric Power Co., Inc. | 105,200 | 7,285,100 | |
| Duke Energy Corp. | 44,013 | 3,480,548 | |
| Edison International | 37,700 | 2,385,279 | |
| El Paso Electric Co. | 25,411 | 1,501,790 | |
| Entergy Corp. | 78,800 | 6,366,252 | |
| Evergy, Inc. | 167,261 | 9,391,705 | |
| Eversource Energy | 76,600 | 4,489,526 | |
| Exelon Corp. | 215,271 | 9,170,545 | |
| FirstEnergy Corp. | 231,032 | 8,296,359 | |
| NextEra Energy, Inc. | 67,831 | 11,329,812 | |
| PG&E Corp. | 53,747 | 2,287,472 | |
| PPL Corp. | 151,522 | 4,325,953 | |
| Vistra Energy Corp. (a) | 169,255 | 4,004,573 | |
| 74,314,914 | |||
| Electrical Equipment - 0.1% | |||
| Heavy Electrical Equipment - 0.1% | |||
| Siemens Gamesa Renewable Energy SA | 8,300 | 111,515 | |
| Equity Real Estate Investment Trusts (REITs) - 2.1% | |||
| Specialized REITs - 2.1% | |||
| InfraReit, Inc. | 126,854 | 2,812,353 | |
| Gas Utilities - 2.4% | |||
| Gas Utilities - 2.4% | |||
| South Jersey Industries, Inc. | 98,100 | 3,283,407 | |
| Independent Power and Renewable Electricity Producers - 7.2% | |||
| Independent Power Producers & Energy Traders - 5.0% | |||
| NRG Energy, Inc. | 51,599 | 1,584,089 | |
| NRG Yield, Inc. Class C | 57,303 | 985,612 | |
| The AES Corp. | 310,795 | 4,167,761 | |
| 6,737,462 | |||
| Renewable Electricity - 2.2% | |||
| NextEra Energy Partners LP | 64,896 | 3,028,696 | |
| TOTAL INDEPENDENT POWER AND RENEWABLE ELECTRICITY PRODUCERS | 9,766,158 | ||
| Media - 3.4% | |||
| Cable & Satellite - 2.4% | |||
| Comcast Corp. Class A | 98,000 | 3,215,380 | |
| Movies & Entertainment - 1.0% | |||
| Twenty-First Century Fox, Inc. Class A | 27,200 | 1,351,568 | |
| TOTAL MEDIA | 4,566,948 | ||
| Multi-Utilities - 19.9% | |||
| Multi-Utilities - 19.9% | |||
| Ameren Corp. | 6,798 | 413,658 | |
| Avangrid, Inc. | 45,203 | 2,392,595 | |
| Dominion Resources, Inc. | 117,300 | 7,997,514 | |
| Public Service Enterprise Group, Inc. | 148,700 | 8,050,618 | |
| SCANA Corp. | 61,600 | 2,372,832 | |
| Sempra Energy | 48,841 | 5,670,929 | |
| 26,898,146 | |||
| Oil, Gas & Consumable Fuels - 5.3% | |||
| Oil & Gas Storage & Transport - 5.3% | |||
| AltaGas Ltd. | 13,600 | 280,866 | |
| Boardwalk Pipeline Partners, LP | 314,461 | 3,654,037 | |
| Cheniere Energy Partners LP Holdings LLC | 59,924 | 1,884,610 | |
| Cheniere Energy, Inc. (a) | 22,100 | 1,440,699 | |
| 7,260,212 | |||
| TOTAL COMMON STOCKS | |||
| (Cost $110,843,417) | 133,466,379 | ||
| Money Market Funds - 2.4% | |||
| Fidelity Cash Central Fund, 1.93% (b) | |||
| (Cost $3,240,486) | 3,239,838 | 3,240,486 | |
| TOTAL INVESTMENT IN SECURITIES - 101.0% | |||
| (Cost $114,083,903) | 136,706,865 | ||
| NET OTHER ASSETS (LIABILITIES) - (1.0)% | (1,399,059) | ||
| NET ASSETS - 100% | $135,307,806 |
Legend
(a) Non-income producing
(b) Affiliated fund that is generally available only to investment companies and other accounts managed by Fidelity Investments. The rate quoted is the annualized seven-day yield of the fund at period end. A complete unaudited listing of the fund's holdings as of its most recent quarter end is available upon request. In addition, each Fidelity Central Fund's financial statements are available on the SEC's website or upon request.
Affiliated Central Funds
Information regarding fiscal year to date income earned by the Fund from investments in Fidelity Central Funds is as follows:
| Fund | Income earned |
| Fidelity Cash Central Fund | $13,225 |
| Fidelity Securities Lending Cash Central Fund | 2,114 |
| Total | $15,339 |
Amounts in the income column in the above table include any capital gain distributions from underlying funds, which are presented in the corresponding line-item in the Statement of Operations if applicable.
Investment Valuation
All investments are categorized as Level 1 under the Fair Value Hierarchy. The inputs or methodology used for valuing securities may not be an indication of the risk associated with investing in those securities. For more information on valuation inputs please refer to the Investment Valuation section in the accompanying Notes to Financial Statements.
See accompanying notes which are an integral part of the financial statements.
Financial Statements
Statement of Assets and Liabilities
| June 30, 2018 (Unaudited) | ||
| Assets | ||
| Investment in securities, at value — See accompanying schedule: Unaffiliated issuers (cost $110,843,417) | $133,466,379 | |
| Fidelity Central Funds (cost $3,240,486) | 3,240,486 | |
| Total Investment in Securities (cost $114,083,903) | $136,706,865 | |
| Cash | 450,389 | |
| Receivable for investments sold | 496,367 | |
| Receivable for fund shares sold | 189,111 | |
| Dividends receivable | 196,721 | |
| Distributions receivable from Fidelity Central Funds | 3,503 | |
| Prepaid expenses | 980 | |
| Other receivables | 6,715 | |
| Total assets | 138,050,651 | |
| Liabilities | ||
| Payable for investments purchased | $2,574,305 | |
| Payable for fund shares redeemed | 70,578 | |
| Accrued management fee | 58,263 | |
| Other affiliated payables | 18,152 | |
| Other payables and accrued expenses | 21,547 | |
| Total liabilities | 2,742,845 | |
| Net Assets | $135,307,806 | |
| Net Assets consist of: | ||
| Paid in capital | $100,029,562 | |
| Undistributed net investment income | 1,322,349 | |
| Accumulated undistributed net realized gain (loss) on investments and foreign currency transactions | 11,332,864 | |
| Net unrealized appreciation (depreciation) on investments and assets and liabilities in foreign currencies | 22,623,031 | |
| Net Assets | $135,307,806 | |
| Initial Class: | ||
| Net Asset Value, offering price and redemption price per share ($25,885,611 ÷ 1,504,924 shares) | $17.20 | |
| Investor Class: | ||
| Net Asset Value, offering price and redemption price per share ($109,422,195 ÷ 6,401,466 shares) | $17.09 |
See accompanying notes which are an integral part of the financial statements.
Statement of Operations
| Six months ended June 30, 2018 (Unaudited) | ||
| Investment Income | ||
| Dividends | $1,771,314 | |
| Income from Fidelity Central Funds | 15,339 | |
| Total income | 1,786,653 | |
| Expenses | ||
| Management fee | $338,057 | |
| Transfer agent fees | 79,902 | |
| Accounting and security lending fees | 24,632 | |
| Custodian fees and expenses | 2,802 | |
| Independent trustees' fees and expenses | 613 | |
| Audit | 19,631 | |
| Legal | 1,129 | |
| Miscellaneous | (258) | |
| Total expenses before reductions | 466,508 | |
| Expense reductions | (17,539) | |
| Total expenses after reductions | 448,969 | |
| Net investment income (loss) | 1,337,684 | |
| Realized and Unrealized Gain (Loss) | ||
| Net realized gain (loss) on: | ||
| Investment securities: | ||
| Unaffiliated issuers | 11,502,262 | |
| Fidelity Central Funds | 483 | |
| Foreign currency transactions | 785 | |
| Total net realized gain (loss) | 11,503,530 | |
| Change in net unrealized appreciation (depreciation) on: | ||
| Investment securities: | ||
| Unaffiliated issuers | (2,989,712) | |
| Fidelity Central Funds | (695) | |
| Assets and liabilities in foreign currencies | (42) | |
| Total change in net unrealized appreciation (depreciation) | (2,990,449) | |
| Net gain (loss) | 8,513,081 | |
| Net increase (decrease) in net assets resulting from operations | $9,850,765 |
See accompanying notes which are an integral part of the financial statements.
Statement of Changes in Net Assets
| Six months ended June 30, 2018 (Unaudited) | Year ended December 31, 2017 | |
| Increase (Decrease) in Net Assets | ||
| Operations | ||
| Net investment income (loss) | $1,337,684 | $2,653,029 |
| Net realized gain (loss) | 11,503,530 | 7,404,749 |
| Change in net unrealized appreciation (depreciation) | (2,990,449) | 11,098,155 |
| Net increase (decrease) in net assets resulting from operations | 9,850,765 | 21,155,933 |
| Distributions to shareholders from net investment income | (597,351) | (2,747,634) |
| Distributions to shareholders from net realized gain | (5,357,024) | – |
| Total distributions | (5,954,375) | (2,747,634) |
| Share transactions - net increase (decrease) | (1,004,956) | (10,559,513) |
| Redemption fees | – | 13,440 |
| Total increase (decrease) in net assets | 2,891,434 | 7,862,226 |
| Net Assets | ||
| Beginning of period | 132,416,372 | 124,554,146 |
| End of period | $135,307,806 | $132,416,372 |
| Other Information | ||
| Undistributed net investment income end of period | $1,322,349 | $582,016 |
See accompanying notes which are an integral part of the financial statements.
Financial Highlights
VIP Utilities Portfolio Initial Class
| Six months ended (Unaudited) June 30, | Years endedDecember 31, | |||||
| 2018 | 2017 | 2016 | 2015 | 2014 | 2013 | |
| Selected Per–Share Data | ||||||
| Net asset value, beginning of period | $16.73 | $14.49 | $13.17 | $15.62 | $13.45 | $11.41 |
| Income from Investment Operations | ||||||
| Net investment income (loss)A | .18 | .33 | .34 | .31 | .31 | .32 |
| Net realized and unrealized gain (loss) | 1.08 | 2.26 | 1.49 | (1.98) | 2.63 | 2.06 |
| Total from investment operations | 1.26 | 2.59 | 1.83 | (1.67) | 2.94 | 2.38 |
| Distributions from net investment income | (.08) | (.35) | (.26) | (.33)B | (.27) | (.35) |
| Distributions from net realized gain | (.71) | – | (.25) | (.45)B | (.51) | – |
| Total distributions | (.79) | (.35) | (.52)C | (.78) | (.77)D | (.35) |
| Redemption fees added to paid in capitalA | – | –E | .01 | –E | –E | .01 |
| Net asset value, end of period | $17.20 | $16.73 | $14.49 | $13.17 | $15.62 | $13.45 |
| Total ReturnF,G,H | 8.24% | 17.88% | 14.17% | (10.78)% | 21.77% | 21.02% |
| Ratios to Average Net AssetsI,J | ||||||
| Expenses before reductions | .68%K | .69% | .70% | .71% | .70% | .74% |
| Expenses net of fee waivers, if any | .68%K | .69% | .70% | .71% | .70% | .73% |
| Expenses net of all reductions | .65%K | .68% | .69% | .70% | .69% | .71% |
| Net investment income (loss) | 2.20%K | 2.06% | 2.30% | 2.17% | 2.01% | 2.44% |
| Supplemental Data | ||||||
| Net assets, end of period (000 omitted) | $25,886 | $26,377 | $26,194 | $21,960 | $36,599 | $25,824 |
| Portfolio turnover rateL | 147%K | 52% | 83% | 88% | 113% | 156% |
A Calculated based on average shares outstanding during the period.
B The amounts shown reflect certain reclassifications related to book to tax differences that were made in the year shown.
C Total distributions of $.52 per share is comprised of distributions from net investment income of $.263 and distributions from net realized gain of $.253 per share.
D Total distributions of $.77 per share is comprised of distributions from net investment income of $.267 and distributions from net realized gain of $.506 per share.
E Amount represents less than $.005 per share.
F Total returns for periods of less than one year are not annualized.
G Total returns do not reflect charges attributable to your insurance company's separate account. Inclusion of these charges would reduce the total returns shown.
H Total returns would have been lower if certain expenses had not been reduced during the applicable periods shown.
I Fees and expenses of any underlying Fidelity Central Funds are not included in the Fund's expense ratio. The Fund indirectly bears its proportionate share of the expenses of any underlying Fidelity Central Funds.
J Expense ratios reflect operating expenses of the class. Expenses before reductions do not reflect amounts reimbursed by the investment adviser or reductions from brokerage service arrangements or reductions from other expense offset arrangements and do not represent the amount paid by the class during periods when reimbursements or reductions occur. Expenses net of fee waivers reflect expenses after reimbursement by the investment adviser but prior to reductions from brokerage service arrangements or other expense offset arrangements. Expenses net of all reductions represent the net expenses paid by the class.
K Annualized
L Amount does not include the portfolio activity of any underlying Fidelity Central Funds.
See accompanying notes which are an integral part of the financial statements.
VIP Utilities Portfolio Investor Class
| Six months ended (Unaudited) June 30, | Years endedDecember 31, | |||||
| 2018 | 2017 | 2016 | 2015 | 2014 | 2013 | |
| Selected Per–Share Data | ||||||
| Net asset value, beginning of period | $16.64 | $14.41 | $13.11 | $15.54 | $13.39 | $11.36 |
| Income from Investment Operations | ||||||
| Net investment income (loss)A | .17 | .32 | .32 | .30 | .29 | .30 |
| Net realized and unrealized gain (loss) | 1.07 | 2.25 | 1.48 | (1.96) | 2.62 | 2.06 |
| Total from investment operations | 1.24 | 2.57 | 1.80 | (1.66) | 2.91 | 2.36 |
| Distributions from net investment income | (.08) | (.34) | (.26) | (.31)B | (.26) | (.34) |
| Distributions from net realized gain | (.71) | – | (.25) | (.45)B | (.51) | – |
| Total distributions | (.79) | (.34) | (.51) | (.77)C | (.76)D | (.34) |
| Redemption fees added to paid in capitalA | – | –E | .01 | –E | –E | .01 |
| Net asset value, end of period | $17.09 | $16.64 | $14.41 | $13.11 | $15.54 | $13.39 |
| Total ReturnF,G,H | 8.15% | 17.83% | 14.03% | (10.80)% | 21.64% | 20.92% |
| Ratios to Average Net AssetsI,J | ||||||
| Expenses before reductions | .76%K | .77% | .78% | .79% | .78% | .82% |
| Expenses net of fee waivers, if any | .76%K | .77% | .78% | .79% | .78% | .81% |
| Expenses net of all reductions | .73%K | .76% | .77% | .78% | .77% | .79% |
| Net investment income (loss) | 2.12%K | 1.98% | 2.22% | 2.09% | 1.93% | 2.36% |
| Supplemental Data | ||||||
| Net assets, end of period (000 omitted) | $109,422 | $106,040 | $98,360 | $57,645 | $96,217 | $51,308 |
| Portfolio turnover rateL | 147%K | 52% | 83% | 88% | 113% | 156% |
A Calculated based on average shares outstanding during the period.
B The amounts shown reflect certain reclassifications related to book to tax differences that were made in the year shown.
C Total distributions of $.77 per share is comprised of distributions from net investment income of $.314 and distributions from net realized gain of $.454 per share.
D Total distributions of $.76 per share is comprised of distributions from net investment income of $.257 and distributions from net realized gain of $.506 per share.
E Amount represents less than $.005 per share.
F Total returns for periods of less than one year are not annualized.
G Total returns do not reflect charges attributable to your insurance company's separate account. Inclusion of these charges would reduce the total returns shown.
H Total returns would have been lower if certain expenses had not been reduced during the applicable periods shown.
I Fees and expenses of any underlying Fidelity Central Funds are not included in the Fund's expense ratio. The Fund indirectly bears its proportionate share of the expenses of any underlying Fidelity Central Funds.
J Expense ratios reflect operating expenses of the class. Expenses before reductions do not reflect amounts reimbursed by the investment adviser or reductions from brokerage service arrangements or reductions from other expense offset arrangements and do not represent the amount paid by the class during periods when reimbursements or reductions occur. Expenses net of fee waivers reflect expenses after reimbursement by the investment adviser but prior to reductions from brokerage service arrangements or other expense offset arrangements. Expenses net of all reductions represent the net expenses paid by the class.
K Annualized
L Amount does not include the portfolio activity of any underlying Fidelity Central Funds.
See accompanying notes which are an integral part of the financial statements.
Notes to Financial Statements (Unaudited)
For the period ended June 30, 2018
1. Organization.
VIP Utilities Portfolio (the Fund) is a non-diversified fund of Variable Insurance Products Fund IV (the Trust) and is authorized to issue an unlimited number of shares. The Trust is registered under the Investment Company Act of 1940, as amended (the 1940 Act), as an open-end management investment company organized as a Massachusetts business trust. Shares of the Fund may only be purchased by insurance companies for the purpose of funding variable annuity or variable life insurance contracts. The Fund offers the following classes of shares: Initial Class shares and Investor Class shares. All classes have equal rights and voting privileges, except for matters affecting a single class.
2. Investments in Fidelity Central Funds.
The Fund invests in Fidelity Central Funds, which are open-end investment companies generally available only to other investment companies and accounts managed by the investment adviser and its affiliates. The Fund's Schedule of Investments lists each of the Fidelity Central Funds held as of period end, if any, as an investment of the Fund, but does not include the underlying holdings of each Fidelity Central Fund. As an Investing Fund, the Fund indirectly bears its proportionate share of the expenses of the underlying Fidelity Central Funds.
The Money Market Central Funds seek preservation of capital and current income and are managed by Fidelity Investments Money Management, Inc. (FIMM), an affiliate of the investment adviser. Annualized expenses of the Money Market Central Funds as of their most recent shareholder report date are less than .005%.
A complete unaudited list of holdings for each Fidelity Central Fund is available upon request or at the Securities and Exchange Commission (the SEC) website at www.sec.gov. In addition, the financial statements of the Fidelity Central Funds are available on the SEC website or upon request.
3. Significant Accounting Policies.
The Fund is an investment company and applies the accounting and reporting guidance of the Financial Accounting Standards Board (FASB) Accounting Standards Codification Topic 946 Financial Services – Investments Companies. The financial statements have been prepared in conformity with accounting principles generally accepted in the United States of America (GAAP), which require management to make certain estimates and assumptions at the date of the financial statements. Actual results could differ from those estimates. Subsequent events, if any, through the date that the financial statements were issued have been evaluated in the preparation of the financial statements. The following summarizes the significant accounting policies of the Fund:
Investment Valuation. Investments are valued as of 4:00 p.m. Eastern time on the last calendar day of the period. The Board of Trustees (the Board) has delegated the day to day responsibility for the valuation of the Fund's investments to the Fair Value Committee (the Committee) established by the Fund's investment adviser. In accordance with valuation policies and procedures approved by the Board, the Fund attempts to obtain prices from one or more third party pricing vendors or brokers to value its investments. When current market prices, quotations or currency exchange rates are not readily available or reliable, investments will be fair valued in good faith by the Committee, in accordance with procedures adopted by the Board. Factors used in determining fair value vary by investment type and may include market or investment specific events. The frequency with which these procedures are used cannot be predicted and they may be utilized to a significant extent. The Committee oversees the Fund's valuation policies and procedures and reports to the Board on the Committee's activities and fair value determinations. The Board monitors the appropriateness of the procedures used in valuing the Fund's investments and ratifies the fair value determinations of the Committee.
The Fund categorizes the inputs to valuation techniques used to value its investments into a disclosure hierarchy consisting of three levels as shown below:
- Level 1 – quoted prices in active markets for identical investments
- Level 2 – other significant observable inputs (including quoted prices for similar investments, interest rates, prepayment speeds, etc.)
- Level 3 – unobservable inputs (including the Fund's own assumptions based on the best information available)
Valuation techniques used to value the Fund's investments by major category are as follows:
Equity securities, including restricted securities, for which market quotations are readily available, are valued at the last reported sale price or official closing price as reported by a third party pricing vendor on the primary market or exchange on which they are traded and are categorized as Level 1 in the hierarchy. In the event there were no sales during the day or closing prices are not available, securities are valued at the last quoted bid price or may be valued using the last available price and are generally categorized as Level 2 in the hierarchy. For foreign equity securities, when market or security specific events arise, comparisons to the valuation of American Depositary Receipts (ADRs), futures contracts, Exchange-Traded Funds (ETFs) and certain indexes as well as quoted prices for similar securities may be used and would be categorized as Level 2 in the hierarchy. Utilizing these techniques may result in transfers between Level 1 and Level 2. For equity securities, including restricted securities, where observable inputs are limited, assumptions about market activity and risk are used and these securities may be categorized as Level 3 in the hierarchy.
Investments in open-end mutual funds, including the Fidelity Central Funds, are valued at their closing net asset value (NAV) each business day and are categorized as Level 1 in the hierarchy.
Changes in valuation techniques may result in transfers in or out of an assigned level within the disclosure hierarchy.
Foreign Currency. The Fund may use foreign currency contracts to facilitate transactions in foreign-denominated securities. Gains and losses from these transactions may arise from changes in the value of the foreign currency or if the counterparties do not perform under the contracts' terms.
Foreign-denominated assets, including investment securities, and liabilities are translated into U.S. dollars at the exchange rates at period end. Purchases and sales of investment securities, income and dividends received and expenses denominated in foreign currencies are translated into U.S. dollars at the exchange rate in effect on the transaction date.
The effects of exchange rate fluctuations on investments are included with the net realized and unrealized gain (loss) on investment securities. Other foreign currency transactions resulting in realized and unrealized gain (loss) are disclosed separately.
Investment Transactions and Income. For financial reporting purposes, the Fund's investment holdings and NAV include trades executed through the end of the last business day of the period. The NAV per share for processing shareholder transactions is calculated as of the close of business of the New York Stock Exchange (NYSE), normally 4:00 p.m. Eastern time and includes trades executed through the end of the prior business day. Gains and losses on securities sold are determined on the basis of identified cost. Dividend income is recorded on the ex-dividend date, except for certain dividends from foreign securities where the ex-dividend date may have passed, which are recorded as soon as the Fund is informed of the ex-dividend date. Non-cash dividends included in dividend income, if any, are recorded at the fair market value of the securities received. Income and capital gain distributions from Fidelity Central Funds, if any, are recorded on the ex-dividend date. Certain distributions received by the Fund represent a return of capital or capital gain. The Fund determines the components of these distributions subsequent to the ex-dividend date, based upon receipt of tax filings or other correspondence relating to the underlying investment. These distributions are recorded as a reduction of cost of investments and/or as a realized gain. Investment income is recorded net of foreign taxes withheld where recovery of such taxes is uncertain.
Class Allocations and Expenses. Investment income, realized and unrealized capital gains and losses, common expenses of the Fund, and certain fund-level expense reductions, if any, are allocated daily on a pro-rata basis to each class based on the relative net assets of each class to the total net assets of the Fund. Each class differs with respect to transfer agent fees incurred. Certain expense reductions may also differ by class. For the reporting period, the allocated portion of income and expenses to each class as a percent of its average net assets may vary due to the timing of recording these transactions in relation to fluctuating net assets of the classes. Expenses directly attributable to a fund are charged to that fund. Expenses attributable to more than one fund are allocated among the respective funds on the basis of relative net assets or other appropriate methods. Expense estimates are accrued in the period to which they relate and adjustments are made when actual amounts are known.
Income Tax Information and Distributions to Shareholders. Each year, the Fund intends to qualify as a regulated investment company under Subchapter M of the Internal Revenue Code, including distributing substantially all of its taxable income and realized gains. As a result, no provision for U.S. Federal income taxes is required. The Fund files a U.S. federal tax return, in addition to state and local tax returns as required. The Fund's federal income tax returns are subject to examination by the Internal Revenue Service (IRS) for a period of three fiscal years after they are filed. State and local tax returns may be subject to examination for an additional fiscal year depending on the jurisdiction. Foreign taxes are provided for based on the Fund's understanding of the tax rules and rates that exist in the foreign markets in which it invests.
Distributions are declared and recorded on the ex-dividend date. Income and capital gain distributions are declared separately for each class. Income and capital gain distributions are determined in accordance with income tax regulations, which may differ from GAAP.
Capital accounts within the financial statements are adjusted for permanent book-tax differences. These adjustments have no impact on net assets or the results of operations. Capital accounts are not adjusted for temporary book-tax differences which will reverse in a subsequent period.
Book-tax differences are primarily due to foreign currency transactions, capital loss carryforwards and losses deferred due to wash sales.
As of period end, the cost and unrealized appreciation (depreciation) in securities, and derivatives if applicable, for federal income tax purposes were as follows:
| Gross unrealized appreciation | $22,897,528 |
| Gross unrealized depreciation | (1,375,622) |
| Net unrealized appreciation (depreciation) | $21,521,906 |
| Tax cost | $115,184,959 |
4. Purchases and Sales of Investments.
Purchases and sales of securities, other than short-term securities, aggregated $92,402,204 and $99,154,152, respectively.
5. Fees and Other Transactions with Affiliates.
Management Fee. Fidelity SelectCo, LLC (the investment adviser) and its affiliates provide the Fund with investment management related services for which the Fund pays a monthly management fee. The management fee is the sum of an individual fund fee rate that is based on an annual rate of .30% of the Fund's average net assets and an annualized group fee rate that averaged .24% during the period. The group fee rate is based upon the average net assets of all the mutual funds advised by Fidelity Management & Research Company (FMR) and the investment adviser. The group fee rate decreases as assets under management increase and increases as assets under management decrease. For the reporting period, the total annualized management fee rate was .54% of the Fund's average net assets.
Transfer Agent Fees. Fidelity Investments Institutional Operations Company, Inc. (FIIOC), an affiliate of the investment adviser, is the Fund's transfer, dividend disbursing, and shareholder servicing agent. FIIOC receives an asset-based fee with respect to each class. Each class pays a fee for transfer agent services, typesetting and printing and mailing of shareholder reports, excluding mailing of proxy statements, equal to an annual rate of class-level average net assets. The annual rate for Investor Class is .15% and the annual rate for all other classes is .07%. For the period, transfer agent fees for each class were as follows:
| Initial Class | $7,991 |
| Investor Class | 71,911 |
| $79,902 |
Accounting and Security Lending Fees. Fidelity Service Company, Inc. (FSC), an affiliate of the investment adviser, maintains the Fund's accounting records. The accounting fee is based on the level of average net assets for each month. Under a separate contract, FSC administers the security lending program. The security lending fee is based on the number and duration of lending transactions. For the period, the fees were equivalent to an annualized rate of .04%.
Brokerage Commissions. The Fund placed a portion of its portfolio transactions with brokerage firms which are affiliates of the investment adviser. Brokerage commissions are included in net realized gain (loss) and change in net unrealized appreciation (depreciation) in the Statement of Operations. The commissions paid to these affiliated firms were $2,381 for the period.
Interfund Trades. The Fund may purchase from or sell securities to other Fidelity Funds under procedures adopted by the Board. The procedures have been designed to ensure these interfund trades are executed in accordance with Rule 17a-7 of the 1940 Act. Interfund trades are included within the respective purchases and sales amounts shown in the Purchases and Sales of Investments note.
6. Committed Line of Credit.
The Fund participates with other funds managed by the investment adviser or an affiliate in a $4.25 billion credit facility (the "line of credit") to be utilized for temporary or emergency purposes to fund shareholder redemptions or for other short-term liquidity purposes. The Fund has agreed to pay commitment fees on its pro-rata portion of the line of credit, which amounted to $187 and is reflected in Miscellaneous expenses on the Statement of Operations. During the period, the Fund did not borrow on this line of credit.
7. Security Lending.
The Fund lends portfolio securities through a lending agent from time to time in order to earn additional income. On the settlement date of the loan, the Fund receives collateral (in the form of U.S. Treasury obligations, letters of credit and/or cash) against the loaned securities and maintains collateral in an amount not less than 100% of the market value of the loaned securities during the period of the loan. The market value of the loaned securities is determined at the close of business of the Fund and any additional required collateral is delivered to the Fund on the next business day. The Fund or borrower may terminate the loan at any time, and if the borrower defaults on its obligation to return the securities loaned because of insolvency or other reasons, the Fund may apply collateral received from the borrower against the obligation. The Fund may experience delays and costs in recovering the securities loaned. Any cash collateral received is invested in the Fidelity Securities Lending Cash Central Fund. At period end, there were no security loans outstanding. Security lending income represents the income earned on investing cash collateral, less rebates paid to borrowers and any lending agent fees associated with the loan, plus any premium payments received for lending certain types of securities. Security lending income is presented in the Statement of Operations as a component of income from Fidelity Central Funds. Total security lending income during the period amounted to $2,114.
8. Expense Reductions.
Commissions paid to certain brokers with whom the investment adviser, or its affiliates, places trades on behalf of the Fund include an amount in addition to trade execution, which may be rebated back to the Fund to offset certain expenses. This amount totaled $16,926 for the period.
In addition, during the period the investment adviser reimbursed and/or waived a portion of fund-level operating expenses in the amount of $613.
9. Distributions to Shareholders.
Distributions to shareholders of each class were as follows:
| Six months ended June 30, 2018 | Year ended December 31, 2017 | |
| From net investment income | ||
| Initial Class | $119,936 | $563,202 |
| Investor Class | 477,415 | 2,184,432 |
| Total | $597,351 | $2,747,634 |
| From net realized gain | ||
| Initial Class | 1,054,248 | – |
| Investor Class | 4,302,776 | – |
| Total | $5,357,024 | $– |
10. Share Transactions.
Transactions for each class of shares were as follows:
| Shares | Shares | Dollars | Dollars | |
| Six months ended June 30, 2018 | Year ended December 31, 2017 | Six months ended June 30, 2018 | Year ended December 31, 2017 | |
| Initial Class | ||||
| Shares sold | 92,503 | 112,872 | $1,500,963 | $1,838,537 |
| Reinvestment of distributions | 78,227 | 33,747 | 1,174,183 | 563,202 |
| Shares redeemed | (242,376) | (377,929) | (3,942,829) | (6,004,954) |
| Net increase (decrease) | (71,646) | (231,310) | $(1,267,683) | $(3,603,215) |
| Investor Class | ||||
| Shares sold | 461,473 | 860,996 | $7,539,337 | $13,865,966 |
| Reinvestment of distributions | 320,388 | 131,493 | 4,780,191 | 2,184,432 |
| Shares redeemed | (754,763) | (1,444,025) | (12,056,801) | (23,006,696) |
| Net increase (decrease) | 27,098 | (451,536) | $262,727 | $(6,956,298) |
11. Other.
The Fund's organizational documents provide former and current trustees and officers with a limited indemnification against liabilities arising in connection with the performance of their duties to the Fund. In the normal course of business, the Fund may also enter into contracts that provide general indemnifications. The Fund's maximum exposure under these arrangements is unknown as this would be dependent on future claims that may be made against the Fund. The risk of material loss from such claims is considered remote.
At the end of the period, the investment adviser or its affiliates were the owners of record of 100% of the total outstanding shares of the Fund.
Shareholder Expense Example
As a shareholder of the Fund, you incur two types of costs: (1) transaction costs, and (2) ongoing costs, including management fees and other Fund expenses. This Example is intended to help you understand your ongoing costs (in dollars) of investing in the Fund and to compare these costs with the ongoing costs of investing in other mutual funds.
The Example is based on an investment of $1,000 invested at the beginning of the period and held for the entire period (January 1, 2018 to June 30, 2018).
Actual Expenses
The first line of the accompanying table for each class of the Fund provides information about actual account values and actual expenses. You may use the information in this line, together with the amount you invested, to estimate the expenses that you paid over the period. Simply divide your account value by $1,000.00 (for example, an $8,600 account value divided by $1,000.00 = 8.6), then multiply the result by the number in the first line for a class of the Fund under the heading entitled "Expenses Paid During Period" to estimate the expenses you paid on your account during this period. The estimate of expenses does not include any fees or other expenses of any variable annuity or variable life insurance product. If they were, the estimate of expenses you paid during the period would be higher, and your ending account value would be lower. In addition, the Fund, as a shareholder in the underlying Fidelity Central Funds, will indirectly bear its pro-rata share of the fees and expenses incurred by the underlying Fidelity Central Funds. These fees and expenses are not included in the Fund's annualized expense ratio used to calculate the expense estimate in the table below.
Hypothetical Example for Comparison Purposes
The second line of the accompanying table for each class of the Fund provides information about hypothetical account values and hypothetical expenses based on a Class' actual expense ratio and an assumed rate of return of 5% per year before expenses, which is not the Class' actual return. The hypothetical account values and expenses may not be used to estimate the actual ending account balance or expenses you paid for the period. You may use this information to compare the ongoing costs of investing in the Fund and other funds. To do so, compare this 5% hypothetical example with the 5% hypothetical examples that appear in the shareholder reports of the other funds. The estimate of expenses does not include any fees or other expenses of any variable annuity or variable life insurance product. If they were, the estimate of expenses you paid during the period would be higher, and your ending account value would be lower. In addition, the Fund, as a shareholder in the underlying Fidelity Central Funds, will indirectly bear its pro-rata share of the fees and expenses incurred by the underlying Fidelity Central Funds. These fees and expenses are not included in the Fund's annualized expense ratio used to calculate the expense estimate in the table below.
Please note that the expenses shown in the table are meant to highlight your ongoing costs only and do not reflect any transaction costs. Therefore, the second line of the table is useful in comparing ongoing costs only, and will not help you determine the relative total costs of owning different funds.
| Annualized Expense Ratio-A | Beginning Account Value January 1, 2018 | Ending Account Value June 30, 2018 | Expenses Paid During Period-B January 1, 2018 to June 30, 2018 | |
| Initial Class | .68% | |||
| Actual | $1,000.00 | $1,082.40 | $3.51 | |
| Hypothetical-C | $1,000.00 | $1,021.42 | $3.41 | |
| Investor Class | .76% | |||
| Actual | $1,000.00 | $1,081.50 | $3.92 | |
| Hypothetical-C | $1,000.00 | $1,021.03 | $3.81 |
A Annualized expense ratio reflects expenses net of applicable fee waivers.
B Expenses are equal to each Class' annualized expense ratio, multiplied by the average account value over the period, multiplied by 181/365 (to reflect the one-half year period).
C 5% return per year before expenses
Board Approval of Investment Advisory Contracts and Management Fees
VIP Utilities Portfolio
Each year, the Board of Trustees, including the Independent Trustees (together, the Board), votes on the renewal of the management contract with Fidelity SelectCo, LLC (SelectCo), an affiliate of Fidelity Management & Research Company (FMR), and the sub-advisory agreements with affiliates of FMR (together, the Advisory Contracts) for the fund. SelectCo and the sub-advisers are collectively referred to herein as the Investment Advisers. The Board, assisted by the advice of fund counsel and Independent Trustees' counsel, requests and considers a broad range of information relevant to the renewal of the Advisory Contracts throughout the year.
The Board meets regularly and, at each of its meetings, covers an extensive agenda of topics and materials and considers factors that are relevant to its annual consideration of the renewal of the fund's Advisory Contracts, including the services and support provided to the fund and its shareholders. The Board has established four standing committees (Committees) — Operations, Audit, Fair Valuation, and Governance and Nominating — each composed of and chaired by Independent Trustees with varying backgrounds, to which the Board has assigned specific subject matter responsibilities in order to enhance effective decision-making by the Board. The Operations Committee, of which all of the Independent Trustees are members, meets regularly throughout the year and considers, among other matters, information specifically related to the annual consideration of the renewal of the fund's Advisory Contracts. The Board, acting directly and through its Committees, requests and receives information concerning the annual consideration of the renewal of the fund's Advisory Contracts. The Board also meets as needed to review matters specifically related to the Board's annual consideration of the renewal of the Advisory Contracts. Members of the Board may also meet with trustees of other Fidelity funds through ad hoc joint committees to discuss certain matters relevant to all of the Fidelity funds.
At its January 2018 meeting, the Board unanimously determined to renew the fund's Advisory Contracts. In reaching its determination, the Board considered all factors it believed relevant, including (i) the nature, extent, and quality of the services to be provided to the fund and its shareholders (including the investment performance of the fund); (ii) the competitiveness of the fund's management fee and total expense ratio relative to peer funds; (iii) the total costs of the services to be provided by and the profits to be realized by Fidelity from its relationships with the fund; and (iv) the extent to which, if any, economies of scale exist and would be realized as the fund grows, and whether any economies of scale are appropriately shared with fund shareholders.
In considering whether to renew the Advisory Contracts for the fund, the Board reached a determination, with the assistance of fund counsel and Independent Trustees' counsel and through the exercise of its business judgment, that the renewal of the Advisory Contracts was in the best interests of the fund and its shareholders and that the compensation payable under the Advisory Contracts was fair and reasonable. The Board's decision to renew the Advisory Contracts was not based on any single factor, but rather was based on a comprehensive consideration of all the information provided to the Board at its meetings throughout the year. The Board, in reaching its determination to renew the Advisory Contracts, was aware that shareholders of the fund have a broad range of investment choices available to them, including a wide choice among funds offered by Fidelity's competitors, and that the fund's shareholders, who have the opportunity to review and weigh the disclosure provided by the fund in its prospectus and other public disclosures, have chosen to invest in this fund, which is part of the Fidelity family of funds.
Amendment to Group Fee Rate. The Board also ratified an amendment to the management contract for the fund to add an additional breakpoint to the group fee schedule, which was effective October 1, 2017. The Board noted that the additional breakpoint would result in lower management fee rates to the extent that assets under management that are included in group fee calculations increase above the new breakpoint.
Nature, Extent, and Quality of Services Provided. The Board considered the staffing of the Investment Advisers as it relates to the fund, including the backgrounds of investment personnel of SelectCo, and also considered the fund's investment objective, strategies, and related investment philosophy. The Independent Trustees also had discussions with senior management of Fidelity's investment operations and investment groups. The Board considered the structure of the investment personnel compensation program and whether this structure provides appropriate incentives to act in the best interests of the fund. Additionally, the Board considered the portfolio managers' investments, if any, in the funds that they manage.Resources Dedicated to Investment Management and Support Services. The Board reviewed the general qualifications and capabilities of the Investment Advisers' investment staffs, including their size, education, experience, and resources, as well as Fidelity's approach to recruiting, training, managing, and compensating investment personnel. The Board noted that Fidelity has continued to increase the resources devoted to non-U.S. offices, including expansion of Fidelity's global investment organization. The Board also noted that Fidelity's analysts have extensive resources, tools and capabilities that allow them to conduct sophisticated quantitative and fundamental analysis, as well as credit analysis of issuers, counterparties and guarantors. Further, the Board considered that Fidelity's investment professionals have sufficient access to global information and data so as to provide competitive investment results over time, and that those professionals also have access to sophisticated tools that permit them to assess portfolio construction and risk and performance attribution characteristics continuously, as well as to transmit new information and research conclusions rapidly around the world. Additionally, in its deliberations, the Board considered Fidelity's trading, risk management, compliance, and technology and operations capabilities and resources, which are integral parts of the investment management process.Shareholder and Administrative Services. The Board considered (i) the nature, extent, quality, and cost of advisory, administrative, and shareholder services performed by the Investment Advisers and their affiliates under the Advisory Contracts and under separate agreements covering transfer agency, pricing and bookkeeping, and securities lending services for the fund; (ii) the nature and extent of the supervision of third party service providers, principally custodians, subcustodians, and pricing vendors; and (iii) the resources devoted to, and the record of compliance with, the fund's compliance policies and procedures. The Board also reviewed the allocation of fund brokerage, including allocations to brokers affiliated with the Investment Advisers, the use of brokerage commissions to pay fund expenses, and the use of "soft" commission dollars to pay for research services.The Board noted that the growth of fund assets over time across the complex allows Fidelity to reinvest in the development of services designed to enhance the value or convenience of the Fidelity funds as investment vehicles. These services include 24-hour access to account information and market information through telephone representatives and over the Internet, investor education materials and asset allocation tools, and the expanded availability of Fidelity Investor Centers.The Board noted that it and the boards of certain other Fidelity funds had formed an ad hoc Committee on Transfer Agency Fees to review the variety of transfer agency fee structures throughout the industry and Fidelity's competitive positioning with respect to industry participants.Investment in a Large Fund Family. The Board considered the benefits to shareholders of investing in a Fidelity fund, including the benefits of investing in a fund that is part of a large family of funds offering a variety of investment disciplines and providing a large variety of mutual fund investor services. The Board noted that Fidelity had taken, or had made recommendations that resulted in the Fidelity funds taking, a number of actions over the previous year that benefited particular funds, including: (i) continuing to dedicate additional resources to Fidelity's investment research process, which includes meetings with management of issuers in which the funds invest, and to the support of the senior management team that oversees asset management; (ii) continuing efforts to enhance Fidelity's global research capabilities; (iii) launching new funds and making other enhancements to meet client needs; (iv) launching new share classes of existing funds; (v) eliminating purchase minimums and broadening eligibility requirements for certain lower-priced share classes; (vi) reducing management fees and total expenses for certain growth equity funds and index funds; (vii) lowering expense caps for certain existing funds and classes to reduce expenses borne by shareholders; (viii) eliminating short-term redemption fees for certain funds; (ix) introducing a new pricing structure for certain funds of funds that is expected to reduce overall expenses paid by shareholders; (x) rationalizing product lines and gaining increased efficiencies through proposals for fund mergers and share class consolidations; (xi) continuing to develop, acquire and implement systems and technology to improve services to the funds and shareholders, strengthen information security, and increase efficiency; and (xii) implementing enhancements to further strengthen Fidelity's product line to increase investors' probability of success in achieving their investment goals, including retirement income goals.Investment Performance. The Board considered whether the fund has operated in accordance with its investment objective, as well as its record of compliance with its investment restrictions and its performance history.The Board took into account discussions with representatives of SelectCo about fund investment performance that occur at Board meetings throughout the year. In this regard the Board noted that as part of regularly scheduled fund reviews and other reports to the Board on fund performance, the Board considers annualized return information for the fund for different time periods, measured against a securities market index ("benchmark index"). In its evaluation of fund investment performance at meetings throughout the year, the Board gave particular attention to information indicating underperformance of certain Fidelity funds for specific time periods and discussed with the Investment Advisers the reasons for such underperformance.In addition to reviewing absolute and relative fund performance, the Independent Trustees periodically consider the appropriateness of fund performance metrics in evaluating the results achieved. In general, the Independent Trustees believe that fund performance should be evaluated based on net performance (after fees and expenses) of both the highest performing and lowest performing fund share classes, where applicable, compared to appropriate benchmark indices, over appropriate time periods that may include full market cycles, taking into account relevant factors, including the following: general market conditions; issuer-specific information; and fund cash flows and other factors. Depending on the circumstances, the Independent Trustees may be satisfied with a fund's performance notwithstanding that it lags its benchmark index for certain periods.The Independent Trustees recognize that shareholders evaluate performance on a net basis over their own holding periods, for which one-, three-, and five-year periods are often used as a proxy. For this reason, the performance information reviewed by the Board also included net cumulative total return information for the fund and an appropriate benchmark index for the most recent one-, three-, and five-year periods ended June 30, 2017.Based on its review, the Board concluded that the nature, extent, and quality of services provided to the fund under the Advisory Contracts should continue to benefit the shareholders of the fund.Competitiveness of Management Fee and Total Expense Ratio. The Board considered the fund's management fee and total expense ratio compared to "mapped groups" of competitive funds and classes created for the purpose of facilitating the Trustees' analysis of the competitiveness of management fees and total expenses. Fidelity creates "mapped groups" by combining similar Lipper investment objective categories that have comparable investment mandates. For this purpose, all sector focused equity variable annuity funds are grouped in the same mapped group. Combining Lipper investment objective categories aids the Board's management fee and total expense ratio comparisons by broadening the competitive group used for comparison.Management Fee. The Board considered two proprietary management fee comparisons for the 12-month periods ended June 30 shown in basis points (BP) in the chart below. The group of Lipper funds used by the Board for management fee comparisons is referred to below as the "Total Mapped Group." The Total Mapped Group comparison focuses on a fund's standing in terms of gross management fees before expense reimbursements or caps relative to the total universe of funds with comparable investment mandates (i.e., sector equities), regardless of whether their management fee structures also are comparable. Funds with comparable management fee structures have similar management fee contractual arrangements (e.g., flat rate charged for advisory services, all-inclusive fee rate, etc.). "TMG %" represents the percentage of funds in the Total Mapped Group that had management fees that were lower than the fund's. For example, a hypothetical TMG % of 20% would mean that 80% of the funds in the Total Mapped Group had higher, and 20% had lower, management fees than the fund. The fund's actual TMG %s and the number of funds in the Total Mapped Group are in the chart below. The "Asset-Size Peer Group" (ASPG) comparison focuses on a fund's standing relative to a subset of non-Fidelity funds within the Total Mapped Group that are similar in size and management fee structure. For example, if a fund is in the first quartile of the ASPG, the fund's management fee ranks in the least expensive or lowest 25% of funds in the ASPG. The ASPG represents at least 15% of the funds in the Total Mapped Group with comparable asset size and management fee structures, subject to a minimum of 50 funds (or all funds in the Total Mapped Group if fewer than 50). Additional information, such as the ASPG quartile in which the fund's management fee rate ranked, is also included in the chart and considered by the Board.VIP Utilities Portfolio
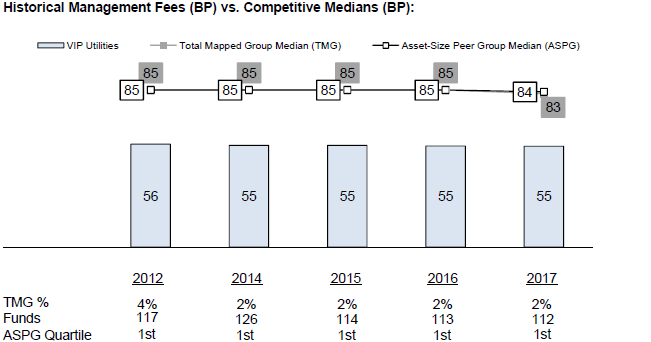
![]()
VTELIC-SANN-0818
1.817394.113
Item 2.
Code of Ethics
Not applicable.
Item 3.
Audit Committee Financial Expert
Not applicable.
Item 4.
Principal Accountant Fees and Services
Not applicable.
Item 5.
Audit Committee of Listed Registrants
Not applicable.
Item 6.
Investments
(a)
Not applicable.
(b)
Not applicable
Item 7.
Disclosure of Proxy Voting Policies and Procedures for Closed-End Management Investment Companies
Not applicable.
Item 8.
Portfolio Managers of Closed-End Management Investment Companies
Not applicable.
Item 9.
Purchase of Equity Securities by Closed-End Management Investment Company and Affiliated Purchasers
Not applicable.
Item 10.
Submission of Matters to a Vote of Security Holders
There were no material changes to the procedures by which shareholders may recommend nominees to the Variable Insurance Products Fund IV’s Board of Trustees.
Item 11.
Controls and Procedures
(a)(i) The President and Treasurer and the Chief Financial Officer have concluded that the Variable Insurance Products Fund IV’s (the “Trust”) disclosure controls and procedures (as defined in Rule 30a-3(c) under the Investment Company Act) provide
reasonable assurances that material information relating to the Trust is made known to them by the appropriate persons, based on their evaluation of these controls and procedures as of a date within 90 days of the filing date of this report.
(a)(ii) There was no change in the Trust’s internal control over financial reporting (as defined in Rule 30a-3(d) under the Investment Company Act) that occurred during the period covered by this report that has materially affected, or is reasonably likely to materially affect, the Trust’s internal control over financial reporting.
Item 12.
Disclosure of Securities Lending Activities for Closed-End Management
Investment Companies
Not applicable.
Item 13.
Exhibits
(a) | (1) | Not applicable. |
(a) | (2) | Certification pursuant to Rule 30a-2(a) under the Investment Company Act of 1940 (17 CFR 270.30a-2(a)) is filed and attached hereto as Exhibit 99.CERT. |
(a) | (3) | Not applicable. |
(b) | Certification pursuant to Rule 30a-2(b) under the Investment Company Act of 1940 (17 CFR 270.30a-2(b)) is furnished and attached hereto as Exhibit 99.906CERT. |
SIGNATURES
Pursuant to the requirements of the Securities Exchange Act of 1934 and the Investment Company Act of 1940, the registrant has duly caused this report to be signed on its behalf by the undersigned, thereunto duly authorized.
Variable Insurance Products Fund IV
By: | /s/Stacie M. Smith |
Stacie M. Smith | |
President and Treasurer | |
Date: | August 23, 2018 |
Pursuant to the requirements of the Securities Exchange Act of 1934 and the Investment Company Act of 1940, this report has been signed below by the following persons on behalf of the registrant and in the capacities and on the dates indicated.
By: | /s/Stacie M. Smith |
Stacie M. Smith | |
President and Treasurer | |
Date: | August 23, 2018 |
By: | /s/John J. Burke III |
John J. Burke III | |
Chief Financial Officer | |
Date: | August 23, 2018 |