UNITED STATES
SECURITIES AND EXCHANGE COMMISSION
Washington, D.C. 20549
FORM N-CSR
CERTIFIED SHAREHOLDER REPORT OF REGISTERED
MANAGEMENT INVESTMENT COMPANIES
Investment Company Act file number 811-03759
Variable Insurance Products Fund IV
(Exact name of registrant as specified in charter)
245 Summer St., Boston, MA 02210
(Address of principal executive offices) (Zip code)
William C. Coffey, Secretary
245 Summer St.
Boston, Massachusetts 02210
(Name and address of agent for service)
Registrant's telephone number, including area code:
617-563-7000
| |
Date of fiscal year end: | December 31 |
|
|
Date of reporting period: | June 30, 2019 |
Item 1.
Reports to Stockholders
Fidelity® Variable Insurance Products: Technology Portfolio
Semi-Annual Report June 30, 2019 |
 |
Beginning on January 1, 2021, as permitted by regulations adopted by the Securities and Exchange Commission, and if your insurance carrier elects to participate, you may not be receiving paper copies of the Fund’s shareholder reports from the insurance company that offers your variable insurance product unless you specifically request paper copies from your financial professional or the administrator of your variable insurance product. Instead, the reports will be made available on a website, and you will be notified by mail each time a report is posted and provided with a website link to access the report.
If you already elected to receive shareholder reports electronically, you will not be affected by this change and you need not take any action. You may elect to receive shareholder reports and other communications from the Fund electronically, by contacting your financial professional or the administrator of your variable insurance product. If you own a Fidelity-administered variable insurance product, please visit fidelity.com/mailpreferences to make your election or call 1-800-343-3548.
You may elect to receive all future reports in paper free of charge. If you wish to continue receiving paper copies of your shareholder reports, you may contact your financial professional or the administrator of your variable insurance product. If you own a Fidelity-administered variable insurance product, please visit fidelity.com/mailpreferences to make your election or call 1-800-343-3548. Your election to receive reports in paper will apply to all funds available under your variable insurance product.
Contents
To view a fund's proxy voting guidelines and proxy voting record for the 12-month period ended June 30, visit http://www.fidelity.com/proxyvotingresults or visit the Securities and Exchange Commission's (SEC) web site at http://www.sec.gov.
You may also call 1-877-208-0098 to request a free copy of the proxy voting guidelines.
Fidelity® Variable Insurance Products are separate account options which are purchased through a variable insurance contract.
Standard & Poor's, S&P and S&P 500 are registered service marks of The McGraw-Hill Companies, Inc. and have been licensed for use by Fidelity Distributors Corporation.
Other third-party marks appearing herein are the property of their respective owners.
All other marks appearing herein are registered or unregistered trademarks or service marks of FMR LLC or an affiliated company. © 2019 FMR LLC. All rights reserved.
This report and the financial statements contained herein are submitted for the general information of the shareholders of the Fund. This report is not authorized for distribution to prospective investors in the Fund unless preceded or accompanied by an effective prospectus.
A fund files its complete schedule of portfolio holdings with the SEC for the first and third quarters of each fiscal year on Form N-PORT. Forms N-PORT are available on the SEC’s web site at http://www.sec.gov. A fund's Forms N-PORT may be reviewed and copied at the SEC’s Public Reference Room in Washington, DC. Information regarding the operation of the SEC's Public Reference Room may be obtained by calling 1-800-SEC-0330.
For a complete list of a fund's portfolio holdings, view the most recent holdings listing, semiannual report, or annual report on Fidelity's web site at http://www.fidelity.com, http://www.institutional.fidelity.com, or http://www.401k.com, as applicable.
NOT FDIC INSURED •MAY LOSE VALUE •NO BANK GUARANTEE
Neither the Fund nor Fidelity Distributors Corporation is a bank.
Investment Summary (Unaudited)
Top Ten Stocks as of June 30, 2019
| | % of fund's net assets |
| Microsoft Corp. | 17.4 |
| Apple, Inc. | 16.4 |
| Visa, Inc. Class A | 5.9 |
| MasterCard, Inc. Class A | 3.8 |
| Adobe, Inc. | 3.3 |
| Netflix, Inc. | 2.8 |
| Salesforce.com, Inc. | 2.4 |
| PayPal Holdings, Inc. | 2.0 |
| Broadcom, Inc. | 1.9 |
| Accenture PLC Class A | 1.9 |
| | 57.8 |
Top Industries (% of fund's net assets)
| As of June 30, 2019 |
| | Software | 31.4% |
| | IT Services | 22.3% |
| | Technology Hardware, Storage & Peripherals | 17.1% |
| | Semiconductors & Semiconductor Equipment | 15.2% |
| | Entertainment | 2.8% |
| | All Others* | 11.2% |

* Includes short-term investments and net other assets (liabilities).
Schedule of Investments June 30, 2019 (Unaudited)
Showing Percentage of Net Assets
| Common Stocks - 98.9% | | | |
| | | Shares | Value |
| Communications Equipment - 2.2% | | | |
| Communications Equipment - 2.2% | | | |
| Arista Networks, Inc. (a) | | 6,600 | $1,713,492 |
| Cisco Systems, Inc. | | 212,083 | 11,607,303 |
| Motorola Solutions, Inc. | | 20,800 | 3,467,984 |
| | | | 16,788,779 |
| Electronic Equipment & Components - 2.2% | | | |
| Electronic Components - 0.9% | | | |
| Amphenol Corp. Class A | | 35,669 | 3,422,084 |
| Corning, Inc. | | 99,656 | 3,311,569 |
| | | | 6,733,653 |
| Electronic Equipment & Instruments - 0.5% | | | |
| Keysight Technologies, Inc. (a) | | 22,489 | 2,019,737 |
| Zebra Technologies Corp. Class A (a) | | 6,600 | 1,382,634 |
| | | | 3,402,371 |
| Electronic Manufacturing Services - 0.5% | | | |
| TE Connectivity Ltd. | | 42,800 | 4,099,384 |
| Technology Distributors - 0.3% | | | |
| CDW Corp. | | 18,400 | 2,042,400 |
|
| TOTAL ELECTRONIC EQUIPMENT & COMPONENTS | | | 16,277,808 |
|
| Entertainment - 2.8% | | | |
| Movies & Entertainment - 2.8% | | | |
| Netflix, Inc. (a) | | 58,132 | 21,353,046 |
| Equity Real Estate Investment Trusts (REITs) - 0.6% | | | |
| Diversified REITs - 0.6% | | | |
| Ant International Co. Ltd. Class C (a)(b)(c) | | 567,730 | 4,275,007 |
| Food & Staples Retailing - 0.0% | | | |
| Food Retail - 0.0% | | | |
| Grocery Outlet Holding Corp. | | 1,900 | 62,472 |
| Health Care Equipment & Supplies - 0.0% | | | |
| Health Care Equipment - 0.0% | | | |
| China Medical Technologies, Inc. sponsored ADR (a)(c) | | 300 | 0 |
| Interactive Media & Services - 1.7% | | | |
| Interactive Media & Services - 1.7% | | | |
| Alphabet, Inc. Class C (a) | | 12,161 | 13,144,947 |
| Internet & Direct Marketing Retail - 2.7% | | | |
| Internet & Direct Marketing Retail - 2.7% | | | |
| Amazon.com, Inc. (a) | | 4,000 | 7,574,520 |
| eBay, Inc. | | 149,400 | 5,901,300 |
| Meituan Dianping Class B | | 802,634 | 7,038,216 |
| | | | 20,514,036 |
| IT Services - 22.3% | | | |
| Data Processing & Outsourced Services - 17.6% | | | |
| Alliance Data Systems Corp. | | 5,800 | 812,754 |
| Automatic Data Processing, Inc. | | 53,101 | 8,779,188 |
| Broadridge Financial Solutions, Inc. | | 13,940 | 1,779,859 |
| Fidelity National Information Services, Inc. | | 39,604 | 4,858,619 |
| First Data Corp. Class A (a) | | 60,189 | 1,629,316 |
| Fiserv, Inc. (a) | | 50,000 | 4,558,000 |
| FleetCor Technologies, Inc. (a) | | 11,400 | 3,201,690 |
| Global Payments, Inc. | | 19,900 | 3,186,587 |
| Jack Henry & Associates, Inc. | | 9,233 | 1,236,483 |
| MasterCard, Inc. Class A | | 109,100 | 28,860,223 |
| Paychex, Inc. | | 39,555 | 3,254,981 |
| PayPal Holdings, Inc. (a) | | 133,300 | 15,257,518 |
| Square, Inc. (a) | | 38,000 | 2,756,140 |
| The Western Union Co. | | 52,690 | 1,048,004 |
| Total System Services, Inc. | | 20,800 | 2,668,016 |
| Visa, Inc. Class A | | 256,500 | 44,515,575 |
| Worldpay, Inc. (a) | | 38,600 | 4,730,430 |
| | | | 133,133,383 |
| Internet Services & Infrastructure - 2.2% | | | |
| Akamai Technologies, Inc. (a) | | 20,200 | 1,618,828 |
| GoDaddy, Inc. (a) | | 21,100 | 1,480,165 |
| MongoDB, Inc. Class A (a)(d) | | 43,000 | 6,539,870 |
| Okta, Inc. (a) | | 33,100 | 4,088,181 |
| VeriSign, Inc. (a) | | 13,370 | 2,796,469 |
| | | | 16,523,513 |
| IT Consulting & Other Services - 2.5% | | | |
| Accenture PLC Class A | | 76,010 | 14,044,368 |
| DXC Technology Co. | | 35,200 | 1,941,280 |
| Gartner, Inc. (a) | | 10,803 | 1,738,635 |
| Leidos Holdings, Inc. | | 15,185 | 1,212,522 |
| | | | 18,936,805 |
|
| TOTAL IT SERVICES | | | 168,593,701 |
|
| Life Sciences Tools & Services - 0.0% | | | |
| Life Sciences Tools & Services - 0.0% | | | |
| JHL Biotech, Inc. (a)(c) | | 94,814 | 94,113 |
| Road & Rail - 0.7% | | | |
| Trucking - 0.7% | | | |
| Lyft, Inc. | | 4,200 | 275,982 |
| Lyft, Inc. | | 45,297 | 2,827,643 |
| Uber Technologies, Inc. | | 45,124 | 1,883,566 |
| | | | 4,987,191 |
| Semiconductors & Semiconductor Equipment - 15.2% | | | |
| Semiconductor Equipment - 3.5% | | | |
| Applied Materials, Inc. | | 311,000 | 13,967,010 |
| ASML Holding NV (Netherlands) | | 13,000 | 2,705,169 |
| KLA-Tencor Corp. | | 20,100 | 2,375,820 |
| Lam Research Corp. | | 38,500 | 7,231,840 |
| | | | 26,279,839 |
| Semiconductors - 11.7% | | | |
| Advanced Micro Devices, Inc. (a) | | 115,500 | 3,507,735 |
| Analog Devices, Inc. | | 44,700 | 5,045,289 |
| Broadcom, Inc. | | 50,803 | 14,624,152 |
| Intel Corp. | | 213,608 | 10,225,415 |
| Marvell Technology Group Ltd. | | 222,700 | 5,315,849 |
| Microchip Technology, Inc. (d) | | 28,600 | 2,479,620 |
| Micron Technology, Inc. (a) | | 142,100 | 5,483,639 |
| NVIDIA Corp. | | 69,300 | 11,381,139 |
| NXP Semiconductors NV | | 37,300 | 3,640,853 |
| ON Semiconductor Corp. (a) | | 52,185 | 1,054,659 |
| Qorvo, Inc. (a) | | 16,500 | 1,099,065 |
| Qualcomm, Inc. | | 169,550 | 12,897,669 |
| Skyworks Solutions, Inc. | | 23,100 | 1,784,937 |
| Texas Instruments, Inc. | | 83,048 | 9,530,588 |
| | | | 88,070,609 |
|
| TOTAL SEMICONDUCTORS & SEMICONDUCTOR EQUIPMENT | | | 114,350,448 |
|
| Software - 31.4% | | | |
| Application Software - 11.8% | | | |
| Adobe, Inc. (a) | | 84,900 | 25,015,785 |
| ANSYS, Inc. (a) | | 9,322 | 1,909,332 |
| Atlassian Corp. PLC (a) | | 25,704 | 3,363,111 |
| Autodesk, Inc. (a) | | 27,800 | 4,528,620 |
| Cadence Design Systems, Inc. (a) | | 33,970 | 2,405,416 |
| Citrix Systems, Inc. | | 16,400 | 1,609,496 |
| Intuit, Inc. | | 45,300 | 11,838,249 |
| Nutanix, Inc. Class B (a)(e) | | 6,397 | 165,938 |
| Parametric Technology Corp. (a) | | 88,642 | 7,956,506 |
| Salesforce.com, Inc. (a) | | 121,700 | 18,465,541 |
| Splunk, Inc. (a) | | 16,400 | 2,062,300 |
| SS&C Technologies Holdings, Inc. | | 66,000 | 3,802,260 |
| Synopsys, Inc. (a) | | 16,468 | 2,119,267 |
| Workday, Inc. Class A (a) | | 18,000 | 3,700,440 |
| | | | 88,942,261 |
| Systems Software - 19.6% | | | |
| Crowdstrike Holdings, Inc. | | 1,200 | 81,948 |
| Fortinet, Inc. (a) | | 17,108 | 1,314,408 |
| Microsoft Corp. | | 980,500 | 131,347,778 |
| Palo Alto Networks, Inc. (a) | | 11,300 | 2,302,488 |
| Red Hat, Inc. (a) | | 21,400 | 4,018,064 |
| ServiceNow, Inc. (a) | | 21,300 | 5,848,341 |
| Symantec Corp. | | 75,000 | 1,632,000 |
| Tableau Software, Inc. (a) | | 8,400 | 1,394,568 |
| | | | 147,939,595 |
|
| TOTAL SOFTWARE | | | 236,881,856 |
|
| Technology Hardware, Storage & Peripherals - 17.1% | | | |
| Technology Hardware, Storage & Peripherals - 17.1% | | | |
| Apple, Inc. | | 627,515 | 124,197,769 |
| NetApp, Inc. | | 31,500 | 1,943,550 |
| Seagate Technology LLC | | 32,600 | 1,536,112 |
| Western Digital Corp. | | 34,900 | 1,659,495 |
| | | | 129,336,926 |
| TOTAL COMMON STOCKS | | | |
| (Cost $555,395,963) | | | 746,660,330 |
|
| Convertible Preferred Stocks - 0.4% | | | |
| Food & Staples Retailing - 0.3% | | | |
| Food Retail - 0.3% | | | |
| Roofoods Ltd. Series F (a)(b)(c) | | 4,211 | 1,759,777 |
| Internet & Direct Marketing Retail - 0.1% | | | |
| Internet & Direct Marketing Retail - 0.1% | | | |
| Reddit, Inc. Series D (b)(c) | | 33,900 | 735,166 |
| Software - 0.0% | | | |
| Application Software - 0.0% | | | |
| UiPath, Inc.: | | | |
| Series A1 (b)(c) | | 3,467 | 136,432 |
| Series B1 (b)(c) | | 173 | 6,808 |
| Series B2 (b)(c) | | 860 | 33,842 |
| | | | 177,082 |
| TOTAL CONVERTIBLE PREFERRED STOCKS | | | |
| (Cost $2,401,134) | | | 2,672,025 |
|
| Money Market Funds - 1.9% | | | |
| Fidelity Cash Central Fund 2.42% (f) | | 6,052,581 | 6,053,792 |
| Fidelity Securities Lending Cash Central Fund 2.42% (f)(g) | | 8,585,250 | 8,586,108 |
| TOTAL MONEY MARKET FUNDS | | | |
| (Cost $14,639,900) | | | 14,639,900 |
| TOTAL INVESTMENT IN SECURITIES - 101.2% | | | |
| (Cost $572,436,997) | | | 763,972,255 |
| NET OTHER ASSETS (LIABILITIES) - (1.2)% | | | (8,727,970) |
| NET ASSETS - 100% | | | $755,244,285 |
Legend
(a) Non-income producing
(b) Restricted securities - Investment in securities not registered under the Securities Act of 1933 (excluding 144A issues). At the end of the period, the value of restricted securities (excluding 144A issues) amounted to $6,947,032 or 0.9% of net assets.
(c) Level 3 security
(d) Security or a portion of the security is on loan at period end.
(e) Security exempt from registration under Rule 144A of the Securities Act of 1933. These securities may be resold in transactions exempt from registration, normally to qualified institutional buyers. At the end of the period, the value of these securities amounted to $165,938 or 0.0% of net assets.
(f) Affiliated fund that is generally available only to investment companies and other accounts managed by Fidelity Investments. The rate quoted is the annualized seven-day yield of the fund at period end. A complete unaudited listing of the fund's holdings as of its most recent quarter end is available upon request. In addition, each Fidelity Central Fund's financial statements are available on the SEC's website or upon request.
(g) Investment made with cash collateral received from securities on loan.
Additional information on each restricted holding is as follows:
| Security | Acquisition Date | Acquisition Cost |
| Ant International Co. Ltd. Class C | 5/16/18 | $3,184,965 |
| Reddit, Inc. Series D | 2/4/19 | $735,166 |
| Roofoods Ltd. Series F | 9/12/17 | $1,488,886 |
| UiPath, Inc. Series A1 | 6/14/19 | $136,432 |
| UiPath, Inc. Series B1 | 6/14/19 | $6,808 |
| UiPath, Inc. Series B2 | 6/14/19 | $33,842 |
Affiliated Central Funds
Information regarding fiscal year to date income earned by the Fund from investments in Fidelity Central Funds is as follows:
| Fund | Income earned |
| Fidelity Cash Central Fund | $58,964 |
| Fidelity Securities Lending Cash Central Fund | 522,078 |
| Total | $581,042 |
Amounts in the income column in the above table include any capital gain distributions from underlying funds, which are presented in the corresponding line-item in the Statement of Operations, if applicable. Amount for Fidelity Securities Lending Cash Central Fund represents securities lending income earned from the reinvestment of cash collateral from loaned securities, net of payments to and from borrowers of securities.
Investment Valuation
The following is a summary of the inputs used, as of June 30, 2019, involving the Fund's assets and liabilities carried at fair value. The inputs or methodology used for valuing securities may not be an indication of the risk associated with investing in those securities. For more information on valuation inputs, and their aggregation into the levels used below, please refer to the Investment Valuation section in the accompanying Notes to Financial Statements.
| | Valuation Inputs at Reporting Date: |
| Description | Total | Level 1 | Level 2 | Level 3 |
| Investments in Securities: | | | | |
| Common Stocks | $746,660,330 | $734,874,832 | $7,416,378 | $4,369,120 |
| Convertible Preferred Stocks | 2,672,025 | -- | -- | 2,672,025 |
| Money Market Funds | 14,639,900 | 14,639,900 | -- | -- |
| Total Investments in Securities: | $763,972,255 | $749,514,732 | $7,416,378 | $7,041,145 |
The following is a reconciliation of Investments in Securities for which Level 3 inputs were used in determining value:
| Investments in Securities: | |
| Beginning Balance | $8,684,070 |
| Total Realized Gain (Loss) | -- |
| Total Unrealized Gain (Loss) | 289,827 |
| Cost of Purchases | 912,248 |
| Proceeds of Sales | (2,845,000) |
| Amortization/Accretion | -- |
| Transfers in to Level 3 | -- |
| Transfers out of Level 3 | -- |
| Ending Balance | $7,041,145 |
| The change in unrealized gain (loss) for the period attributable to Level 3 securities held at June 30, 2019 | $1,790,514 |
The information used in the above reconciliations represents fiscal year to date activity for any Investments in Securities identified as using Level 3 inputs at either the beginning or the end of the current fiscal period. Transfers in or out of Level 3 represent the beginning value of any Security or Instrument where a change in the pricing level occurred from the beginning to the end of the period. The cost of purchases and the proceeds of sales may include securities received or delivered through corporate actions or exchanges. Realized and unrealized gains (losses) disclosed in the reconciliations are included in Net Gain (Loss) on the Fund's Statement of Operations.
See accompanying notes which are an integral part of the financial statements.
Financial Statements
Statement of Assets and Liabilities
| | | June 30, 2019 (Unaudited) |
| Assets | | |
Investment in securities, at value (including securities loaned of $8,417,669) — See accompanying schedule:
Unaffiliated issuers (cost $557,797,097) | $749,332,355 | |
| Fidelity Central Funds (cost $14,639,900) | 14,639,900 | |
| Total Investment in Securities (cost $572,436,997) | | $763,972,255 |
| Receivable for fund shares sold | | 263,152 |
| Dividends receivable | | 304,112 |
| Distributions receivable from Fidelity Central Funds | | 9,419 |
| Prepaid expenses | | 5,464 |
| Other receivables | | 1,926 |
| Total assets | | 764,556,328 |
| Liabilities | | |
| Payable for fund shares redeemed | $250,513 | |
| Accrued management fee | 330,213 | |
| Other affiliated payables | 100,935 | |
| Other payables and accrued expenses | 50,977 | |
| Collateral on securities loaned | 8,579,405 | |
| Total liabilities | | 9,312,043 |
| Net Assets | | $755,244,285 |
| Net Assets consist of: | | |
| Paid in capital | | $590,098,025 |
| Total distributable earnings (loss) | | 165,146,260 |
| Net Assets | | $755,244,285 |
| Net Asset Value and Maximum Offering Price | | |
| Initial Class: | | |
| Net Asset Value, offering price and redemption price per share ($150,946,564 ÷ 9,315,536 shares) | | $16.20 |
| Investor Class: | | |
| Net Asset Value, offering price and redemption price per share ($604,297,721 ÷ 37,858,936 shares) | | $15.96 |
See accompanying notes which are an integral part of the financial statements.
Statement of Operations
| | | Six months ended June 30, 2019 (Unaudited) |
| Investment Income | | |
| Dividends | | $4,143,367 |
| Income from Fidelity Central Funds (including $522,078 from security lending) | | 581,042 |
| Total income | | 4,724,409 |
| Expenses | | |
| Management fee | $1,908,777 | |
| Transfer agent fees | 457,635 | |
| Accounting and security lending fees | 126,539 | |
| Custodian fees and expenses | 32,639 | |
| Independent trustees' fees and expenses | 1,667 | |
| Audit | 33,623 | |
| Legal | 1,267 | |
| Miscellaneous | 4,591 | |
| Total expenses before reductions | 2,566,738 | |
| Expense reductions | (19,666) | |
| Total expenses after reductions | | 2,547,072 |
| Net investment income (loss) | | 2,177,337 |
| Realized and Unrealized Gain (Loss) | | |
| Net realized gain (loss) on: | | |
| Investment securities: | | |
| Unaffiliated issuers | 4,187,344 | |
| Fidelity Central Funds | 702 | |
| Foreign currency transactions | (2,048) | |
| Total net realized gain (loss) | | 4,185,998 |
| Change in net unrealized appreciation (depreciation) on: | | |
| Investment securities: | | |
| Unaffiliated issuers | 161,705,311 | |
| Fidelity Central Funds | (58) | |
| Assets and liabilities in foreign currencies | (786) | |
| Total change in net unrealized appreciation (depreciation) | | 161,704,467 |
| Net gain (loss) | | 165,890,465 |
| Net increase (decrease) in net assets resulting from operations | | $168,067,802 |
See accompanying notes which are an integral part of the financial statements.
Statement of Changes in Net Assets
| | Six months ended June 30, 2019 (Unaudited) | Year ended December 31, 2018 |
| Increase (Decrease) in Net Assets | | |
| Operations | | |
| Net investment income (loss) | $2,177,337 | $1,676,472 |
| Net realized gain (loss) | 4,185,998 | 102,912,665 |
| Change in net unrealized appreciation (depreciation) | 161,704,467 | (163,403,448) |
| Net increase (decrease) in net assets resulting from operations | 168,067,802 | (58,814,311) |
| Distributions to shareholders | (133,266,077) | (52,270,559) |
| Share transactions - net increase (decrease) | 108,340,391 | 30,975,773 |
| Total increase (decrease) in net assets | 143,142,116 | (80,109,097) |
| Net Assets | | |
| Beginning of period | 612,102,169 | 692,211,266 |
| End of period | $755,244,285 | $612,102,169 |
See accompanying notes which are an integral part of the financial statements.
Financial Highlights
VIP Technology Portfolio Initial Class
| | Six months ended (Unaudited) June 30, | Years endedDecember 31, | | | | |
| | 2019 | 2018 | 2017 | 2016 | 2015 | 2014 |
| Selected Per–Share Data | | | | | | |
| Net asset value, beginning of period | $15.76 | $18.43 | $12.76 | $11.91 | $11.83 | $12.43 |
| Income from Investment Operations | | | | | | |
| Net investment income (loss)A | .05 | .05 | .01 | .02 | .02 | .01 |
| Net realized and unrealized gain (loss) | 3.81 | (1.34) | 6.41 | 1.22 | .71 | 1.38 |
| Total from investment operations | 3.86 | (1.29) | 6.42 | 1.24 | .73 | 1.39 |
| Distributions from net investment income | (.01) | – | –B | (.02) | (.02) | (.01) |
| Distributions from net realized gain | (3.40) | (1.38) | (.75) | (.37) | (.63) | (1.98) |
| Total distributions | (3.42)C | (1.38) | (.75) | (.39) | (.65) | (1.99) |
| Redemption fees added to paid in capitalA | – | – | –B | –B | –B | –B |
| Net asset value, end of period | $16.20 | $15.76 | $18.43 | $12.76 | $11.91 | $11.83 |
| Total ReturnD,E,F | 27.96% | (7.62)% | 50.78% | 11.37% | 6.27% | 11.91% |
| Ratios to Average Net AssetsG,H | | | | | | |
| Expenses before reductions | .66%I | .66% | .68% | .70% | .69% | .70% |
| Expenses net of fee waivers, if any | .66%I | .66% | .68% | .70% | .69% | .69% |
| Expenses net of all reductions | .65%I | .64% | .67% | .69% | .68% | .69% |
| Net investment income (loss) | .68%I | .27% | .03% | .17% | .16% | .13% |
| Supplemental Data | | | | | | |
| Net assets, end of period (000 omitted) | $150,947 | $123,867 | $154,984 | $75,480 | $70,596 | $69,964 |
| Portfolio turnover rateJ | 12%I | 139% | 68% | 67% | 68% | 67% |
A Calculated based on average shares outstanding during the period.
B Amount represents less than $.005 per share.
C Total distributions of $3.42 per share is comprised of distributions from net investment income of $.012 and distributions from net realized gain of $3.404 per share.
D Total returns for periods of less than one year are not annualized.
E Total returns do not reflect charges attributable to your insurance company's separate account. Inclusion of these charges would reduce the total returns shown.
F Total returns would have been lower if certain expenses had not been reduced during the applicable periods shown.
G Fees and expenses of any underlying Fidelity Central Funds are not included in the Fund's expense ratio. The Fund indirectly bears its proportionate share of the expenses of any underlying Fidelity Central Funds.
H Expense ratios reflect operating expenses of the class. Expenses before reductions do not reflect amounts reimbursed by the investment adviser or reductions from brokerage service arrangements or reductions from other expense offset arrangements and do not represent the amount paid by the class during periods when reimbursements or reductions occur. Expenses net of fee waivers reflect expenses after reimbursement by the investment adviser but prior to reductions from brokerage service arrangements or other expense offset arrangements. Expenses net of all reductions represent the net expenses paid by the class.
I Annualized
J Amount does not include the portfolio activity of any underlying Fidelity Central Funds.
See accompanying notes which are an integral part of the financial statements.
VIP Technology Portfolio Investor Class
| | Six months ended (Unaudited) June 30, | Years endedDecember 31, | | | | |
| | 2019 | 2018 | 2017 | 2016 | 2015 | 2014 |
| Selected Per–Share Data | | | | | | |
| Net asset value, beginning of period | $15.57 | $18.23 | $12.63 | $11.79 | $11.73 | $12.34 |
| Income from Investment Operations | | | | | | |
| Net investment income (loss)A | .05 | .04 | (.01) | .01 | .01 | .01 |
| Net realized and unrealized gain (loss) | 3.75 | (1.34) | 6.35 | 1.21 | .69 | 1.36 |
| Total from investment operations | 3.80 | (1.30) | 6.34 | 1.22 | .70 | 1.37 |
| Distributions from net investment income | (.01) | – | –B | (.01) | (.01) | (.01) |
| Distributions from net realized gain | (3.40) | (1.36) | (.74) | (.37) | (.63) | (1.98) |
| Total distributions | (3.41) | (1.36) | (.74) | (.38) | (.64) | (1.98)C |
| Redemption fees added to paid in capitalA | – | – | –B | –B | –B | –B |
| Net asset value, end of period | $15.96 | $15.57 | $18.23 | $12.63 | $11.79 | $11.73 |
| Total ReturnD,E,F | 27.96% | (7.73)% | 50.67% | 11.34% | 6.08% | 11.86% |
| Ratios to Average Net AssetsG,H | | | | | | |
| Expenses before reductions | .74%I | .74% | .76% | .78% | .77% | .78% |
| Expenses net of fee waivers, if any | .74%I | .73% | .76% | .78% | .77% | .77% |
| Expenses net of all reductions | .73%I | .72% | .75% | .77% | .76% | .77% |
| Net investment income (loss) | .60%I | .20% | (.05)% | .09% | .08% | .05% |
| Supplemental Data | | | | | | |
| Net assets, end of period (000 omitted) | $604,298 | $488,235 | $537,227 | $254,287 | $241,491 | $180,147 |
| Portfolio turnover rateJ | 12%I | 139% | 68% | 67% | 68% | 67% |
A Calculated based on average shares outstanding during the period.
B Amount represents less than $.005 per share.
C Total distributions of $1.98 per share is comprised of distributions from net investment income of $.005 and distributions from net realized gain of $1.977 per share.
D Total returns for periods of less than one year are not annualized.
E Total returns do not reflect charges attributable to your insurance company's separate account. Inclusion of these charges would reduce the total returns shown.
F Total returns would have been lower if certain expenses had not been reduced during the applicable periods shown.
G Fees and expenses of any underlying Fidelity Central Funds are not included in the Fund's expense ratio. The Fund indirectly bears its proportionate share of the expenses of any underlying Fidelity Central Funds.
H Expense ratios reflect operating expenses of the class. Expenses before reductions do not reflect amounts reimbursed by the investment adviser or reductions from brokerage service arrangements or reductions from other expense offset arrangements and do not represent the amount paid by the class during periods when reimbursements or reductions occur. Expenses net of fee waivers reflect expenses after reimbursement by the investment adviser but prior to reductions from brokerage service arrangements or other expense offset arrangements. Expenses net of all reductions represent the net expenses paid by the class.
I Annualized
J Amount does not include the portfolio activity of any underlying Fidelity Central Funds.
See accompanying notes which are an integral part of the financial statements.
Notes to Financial Statements (Unaudited)
For the period ended June 30, 2019
1. Organization.
VIP Technology Portfolio (the Fund) is a non-diversified fund of Variable Insurance Products Fund IV (the Trust) and is authorized to issue an unlimited number of shares. The Trust is registered under the Investment Company Act of 1940, as amended (the 1940 Act), as an open-end management investment company organized as a Massachusetts business trust. Shares of the Fund may only be purchased by insurance companies for the purpose of funding variable annuity or variable life insurance contracts. The Fund offers the following classes of shares: Initial Class shares and Investor Class shares. All classes have equal rights and voting privileges, except for matters affecting a single class.
2. Investments in Fidelity Central Funds.
The Fund invests in Fidelity Central Funds, which are open-end investment companies generally available only to other investment companies and accounts managed by the investment adviser and its affiliates. The Fund's Schedule of Investments lists each of the Fidelity Central Funds held as of period end, if any, as an investment of the Fund, but does not include the underlying holdings of each Fidelity Central Fund. As an Investing Fund, the Fund indirectly bears its proportionate share of the expenses of the underlying Fidelity Central Funds.
The Money Market Central Funds seek preservation of capital and current income and are managed by Fidelity Investments Money Management, Inc. (FIMM), an affiliate of the investment adviser. Annualized expenses of the Money Market Central Funds as of their most recent shareholder report date ranged from less than .005% to .01%.
A complete unaudited list of holdings for each Fidelity Central Fund is available upon request or at the Securities and Exchange Commission (the SEC) website at www.sec.gov. In addition, the financial statements of the Fidelity Central Funds are available on the SEC website or upon request.
3. Significant Accounting Policies.
The Fund is an investment company and applies the accounting and reporting guidance of the Financial Accounting Standards Board (FASB) Accounting Standards Codification Topic 946 Financial Services – Investments Companies. The financial statements have been prepared in conformity with accounting principles generally accepted in the United States of America (GAAP), which require management to make certain estimates and assumptions at the date of the financial statements. Actual results could differ from those estimates. Subsequent events, if any, through the date that the financial statements were issued have been evaluated in the preparation of the financial statements. The following summarizes the significant accounting policies of the Fund:
Investment Valuation. Investments are valued as of 4:00 p.m. Eastern time on the last calendar day of the period. The Board of Trustees (the Board) has delegated the day to day responsibility for the valuation of the Fund's investments to the Fair Value Committee (the Committee) established by the Fund's investment adviser. In accordance with valuation policies and procedures approved by the Board, the Fund attempts to obtain prices from one or more third party pricing vendors or brokers to value its investments. When current market prices, quotations or currency exchange rates are not readily available or reliable, investments will be fair valued in good faith by the Committee, in accordance with procedures adopted by the Board. Factors used in determining fair value vary by investment type and may include market or investment specific events. The frequency with which these procedures are used cannot be predicted and they may be utilized to a significant extent. The Committee oversees the Fund's valuation policies and procedures and reports to the Board on the Committee's activities and fair value determinations. The Board monitors the appropriateness of the procedures used in valuing the Fund's investments and ratifies the fair value determinations of the Committee.
The Fund categorizes the inputs to valuation techniques used to value its investments into a disclosure hierarchy consisting of three levels as shown below:
- Level 1 – quoted prices in active markets for identical investments
- Level 2 – other significant observable inputs (including quoted prices for similar investments, interest rates, prepayment speeds, etc.)
- Level 3 – unobservable inputs (including the Fund's own assumptions based on the best information available)
Valuation techniques used to value the Fund's investments by major category are as follows:
Equity securities, including restricted securities, for which market quotations are readily available, are valued at the last reported sale price or official closing price as reported by a third party pricing vendor on the primary market or exchange on which they are traded and are categorized as Level 1 in the hierarchy. In the event there were no sales during the day or closing prices are not available, securities are valued at the last quoted bid price or may be valued using the last available price and are generally categorized as Level 2 in the hierarchy. For foreign equity securities, when market or security specific events arise, comparisons to the valuation of American Depositary Receipts (ADRs), futures contracts, Exchange-Traded Funds (ETFs) and certain indexes as well as quoted prices for similar securities may be used and would be categorized as Level 2 in the hierarchy. For equity securities, including restricted securities, where observable inputs are limited, assumptions about market activity and risk are used and these securities may be categorized as Level 3 in the hierarchy.
Investments in open-end mutual funds, including the Fidelity Central Funds, are valued at their closing net asset value (NAV) each business day and are categorized as Level 1 in the hierarchy.
Changes in valuation techniques may result in transfers in or out of an assigned level within the disclosure hierarchy. The aggregate value of investments by input level as of June 30, 2019, as well as a roll forward of Level 3 investments, is included at the end of the Fund's Schedule of Investments.
Foreign Currency. The Fund may use foreign currency contracts to facilitate transactions in foreign-denominated securities. Gains and losses from these transactions may arise from changes in the value of the foreign currency or if the counterparties do not perform under the contracts' terms.
Foreign-denominated assets, including investment securities, and liabilities are translated into U.S. dollars at the exchange rates at period end. Purchases and sales of investment securities, income and dividends received and expenses denominated in foreign currencies are translated into U.S. dollars at the exchange rate in effect on the transaction date.
The effects of exchange rate fluctuations on investments are included with the net realized and unrealized gain (loss) on investment securities. Other foreign currency transactions resulting in realized and unrealized gain (loss) are disclosed separately.
Investment Transactions and Income. For financial reporting purposes, the Fund's investment holdings and NAV include trades executed through the end of the last business day of the period. The NAV per share for processing shareholder transactions is calculated as of the close of business of the New York Stock Exchange (NYSE), normally 4:00 p.m. Eastern time and includes trades executed through the end of the prior business day. Gains and losses on securities sold are determined on the basis of identified cost and include proceeds received from litigation. Dividend income is recorded on the ex-dividend date, except for certain dividends from foreign securities where the ex-dividend date may have passed, which are recorded as soon as the Fund is informed of the ex-dividend date. Non-cash dividends included in dividend income, if any, are recorded at the fair market value of the securities received. Income and capital gain distributions from Fidelity Central Funds, if any, are recorded on the ex-dividend date. Certain distributions received by the Fund represent a return of capital or capital gain. The Fund determines the components of these distributions subsequent to the ex-dividend date, based upon receipt of tax filings or other correspondence relating to the underlying investment. These distributions are recorded as a reduction of cost of investments and/or as a realized gain. Investment income is recorded net of foreign taxes withheld where recovery of such taxes is uncertain.
Class Allocations and Expenses. Investment income, realized and unrealized capital gains and losses, common expenses of the Fund, and certain fund-level expense reductions, if any, are allocated daily on a pro-rata basis to each class based on the relative net assets of each class to the total net assets of the Fund. Each class differs with respect to transfer agent fees incurred. Certain expense reductions may also differ by class. For the reporting period, the allocated portion of income and expenses to each class as a percent of its average net assets may vary due to the timing of recording these transactions in relation to fluctuating net assets of the classes. Expenses directly attributable to a fund are charged to that fund. Expenses attributable to more than one fund are allocated among the respective funds on the basis of relative net assets or other appropriate methods. Expense estimates are accrued in the period to which they relate and adjustments are made when actual amounts are known.
Income Tax Information and Distributions to Shareholders. Each year, the Fund intends to qualify as a regulated investment company under Subchapter M of the Internal Revenue Code, including distributing substantially all of its taxable income and realized gains. As a result, no provision for U.S. Federal income taxes is required. The Fund files a U.S. federal tax return, in addition to state and local tax returns as required. The Fund's federal income tax returns are subject to examination by the Internal Revenue Service (IRS) for a period of three fiscal years after they are filed. State and local tax returns may be subject to examination for an additional fiscal year depending on the jurisdiction. Foreign taxes are provided for based on the Fund's understanding of the tax rules and rates that exist in the foreign markets in which it invests.
Distributions are declared and recorded on the ex-dividend date. Income and capital gain distributions are declared separately for each class. Income and capital gain distributions are determined in accordance with income tax regulations, which may differ from GAAP.
Capital accounts within the financial statements are adjusted for permanent book-tax differences. These adjustments have no impact on net assets or the results of operations. Capital accounts are not adjusted for temporary book-tax differences which will reverse in a subsequent period.
Book-tax differences are primarily due to foreign currency transactions, passive foreign investment companies (PFIC) and losses deferred due to wash sales and excise tax regulations.
As of period end, the cost and unrealized appreciation (depreciation) in securities, and derivatives if applicable, for federal income tax purposes were as follows:
| Gross unrealized appreciation | $197,311,302 |
| Gross unrealized depreciation | (8,374,953) |
| Net unrealized appreciation (depreciation) | $188,936,349 |
| Tax cost | $575,035,906 |
The Fund elected to defer to its next fiscal year approximately $26,383,527 of capital losses recognized during the period November 1, 2018 to December 31, 2018.
Restricted Securities. The Fund may invest in securities that are subject to legal or contractual restrictions on resale. These securities generally may be resold in transactions exempt from registration or to the public if the securities are registered. Disposal of these securities may involve time-consuming negotiations and expense, and prompt sale at an acceptable price may be difficult. Information regarding restricted securities is included at the end of the Fund's Schedule of Investments.
4. Purchases and Sales of Investments.
Purchases and sales of securities, other than short-term securities, aggregated $42,932,161 and $69,928,909, respectively.
5. Fees and Other Transactions with Affiliates.
Management Fee. Fidelity SelectCo, LLC (the investment adviser) and its affiliates provide the Fund with investment management related services for which the Fund pays a monthly management fee. The management fee is the sum of an individual fund fee rate that is based on an annual rate of .30% of the Fund's average net assets and an annualized group fee rate that averaged .24% during the period. The group fee rate is based upon the average net assets of all the mutual funds advised by Fidelity Management & Research Company (FMR) and the investment adviser. The group fee rate decreases as assets under management increase and increases as assets under management decrease. For the reporting period, the total annualized management fee rate was .54% of the Fund's average net assets.
Transfer Agent Fees. Fidelity Investments Institutional Operations Company, Inc. (FIIOC), an affiliate of the investment adviser, is the Fund's transfer, dividend disbursing, and shareholder servicing agent. FIIOC receives an asset-based fee with respect to each class. Each class pays a fee for transfer agent services, typesetting and printing and mailing of shareholder reports, excluding mailing of proxy statements, equal to an annual rate of class-level average net assets. The annual rate for Investor Class is .15% and the annual rate for all other classes is .07%. For the period, transfer agent fees for each class were as follows:
| Initial Class | $46,149 |
| Investor Class | 411,486 |
| | $457,635 |
Accounting and Security Lending Fees. Fidelity Service Company, Inc. (FSC), an affiliate of the investment adviser, maintains the Fund's accounting records. The accounting fee is based on the level of average net assets for each month. Prior to April 1, 2019, FSC had a separate agreement with the Fund for administration of the security lending program, based on the number and duration of lending transactions. For the period, the total fees paid for accounting and administration of securities lending were equivalent to an annualized rate of .04%.
Brokerage Commissions. The Fund placed a portion of its portfolio transactions with brokerage firms which are affiliates of the investment adviser. Brokerage commissions are included in net realized gain (loss) and change in net unrealized appreciation (depreciation) in the Statement of Operations. The commissions paid to these affiliated firms were $1,655 for the period.
Interfund Trades. The Fund may purchase from or sell securities to other Fidelity Funds under procedures adopted by the Board. The procedures have been designed to ensure these interfund trades are executed in accordance with Rule 17a-7 of the 1940 Act. Interfund trades are included within the respective purchases and sales amounts shown in the Purchases and Sales of Investments note.
6. Committed Line of Credit.
The Fund participates with other funds managed by the investment adviser or an affiliate in a $4.25 billion credit facility (the "line of credit") to be utilized for temporary or emergency purposes to fund shareholder redemptions or for other short-term liquidity purposes. The Fund has agreed to pay commitment fees on its pro-rata portion of the line of credit, which amounted to $992 and is reflected in Miscellaneous expenses on the Statement of Operations. During the period, the Fund did not borrow on this line of credit.
7. Security Lending.
The Fund lends portfolio securities from time to time in order to earn additional income. For equity securities, lending agents are used, including National Financial Services (NFS), an affiliate of the Fund. Pursuant to a securities lending agreement, NFS will receive a fee, which is capped at 9.9% of daily lending revenue, for its services as lending agent. The Fund may lend securities to certain qualified borrowers. On the settlement date of the loan, the Fund receives collateral (in the form of U.S. Treasury obligations, letters of credit and/or cash) against the loaned securities and maintains collateral in an amount not less than 100% of the market value of the loaned securities during the period of the loan. The market value of the loaned securities is determined at the close of business of the Fund and any additional required collateral is delivered to the Fund on the next business day. The Fund or borrower may terminate the loan at any time, and if the borrower defaults on its obligation to return the securities loaned because of insolvency or other reasons, the Fund may apply collateral received from the borrower against the obligation. The Fund may experience delays and costs in recovering the securities loaned. Any cash collateral received is invested in the Fidelity Securities Lending Cash Central Fund. The value of loaned securities and cash collateral at period end are disclosed on the Fund's Statement of Assets and Liabilities. Security lending income represents the income earned on investing cash collateral, less rebates paid to borrowers and any lending agent fees associated with the loan, plus any premium payments received for lending certain types of securities. Security lending income is presented in the Statement of Operations as a component of income from Fidelity Central Funds.
8. Expense Reductions.
Commissions paid to certain brokers with whom the investment adviser, or its affiliates, places trades on behalf of the Fund include an amount in addition to trade execution, which may be rebated back to the Fund to offset certain expenses. This amount totaled $17,093 for the period. Through arrangements with the Fund's custodian, credits realized as a result of certain uninvested cash balances were used to reduce the Fund's expenses. During the period, these credits reduced the Fund's custody expenses by $10.
In addition, during the period the investment adviser reimbursed and/or waived a portion of fund-level operating expenses in the amount of $2,563.
9. Distributions to Shareholders.
Distributions to shareholders of each class were as follows:
| | Six months ended
June 30, 2019 | Year ended
December 31, 2018 |
| Distributions to shareholders | | |
| Initial Class | $26,569,001 | $11,544,861 |
| Investor Class | 106,697,076 | 40,725,698 |
| Total | $133,266,077 | $52,270,559 |
10. Share Transactions.
Transactions for each class of shares were as follows:
| | Shares | Shares | Dollars | Dollars |
| | Six months ended June 30, 2019 | Year ended December 31, 2018 | Six months ended June 30, 2019 | Year ended December 31, 2018 |
| Initial Class | | | | |
| Shares sold | 601,369 | 1,652,009 | $9,505,041 | $31,765,341 |
| Reinvestment of distributions | 1,904,588 | 670,181 | 26,569,001 | 11,544,861 |
| Shares redeemed | (1,049,901) | (2,873,325) | (16,083,336) | (53,337,180) |
| Net increase (decrease) | 1,456,056 | (551,135) | $19,990,706 | $(10,026,978) |
| Investor Class | | | | |
| Shares sold | 1,971,388 | 7,335,943 | $30,349,201 | $138,857,274 |
| Reinvestment of distributions | 7,759,787 | 2,392,513 | 106,697,076 | 40,725,698 |
| Shares redeemed | (3,220,223) | (7,857,912) | (48,696,592) | (138,580,221) |
| Net increase (decrease) | 6,510,952 | 1,870,544 | $88,349,685 | $41,002,751 |
11. Other.
The Fund's organizational documents provide former and current trustees and officers with a limited indemnification against liabilities arising in connection with the performance of their duties to the Fund. In the normal course of business, the Fund may also enter into contracts that provide general indemnifications. The Fund's maximum exposure under these arrangements is unknown as this would be dependent on future claims that may be made against the Fund. The risk of material loss from such claims is considered remote.
At the end of the period, the investment adviser or its affiliates were the owners of record of 100% of the total outstanding shares of the Fund.
Shareholder Expense Example
As a shareholder of the Fund, you incur two types of costs: (1) transaction costs, and (2) ongoing costs, including management fees and other Fund expenses. This Example is intended to help you understand your ongoing costs (in dollars) of investing in the Fund and to compare these costs with the ongoing costs of investing in other mutual funds.
The Example is based on an investment of $1,000 invested at the beginning of the period and held for the entire period (January 1, 2019 to June 30, 2019).
Actual Expenses
The first line of the accompanying table for each class of the Fund provides information about actual account values and actual expenses. You may use the information in this line, together with the amount you invested, to estimate the expenses that you paid over the period. Simply divide your account value by $1,000.00 (for example, an $8,600 account value divided by $1,000.00 = 8.6), then multiply the result by the number in the first line for a class of the Fund under the heading entitled "Expenses Paid During Period" to estimate the expenses you paid on your account during this period. The estimate of expenses does not include any fees or other expenses of any variable annuity or variable life insurance product. If they were, the estimate of expenses you paid during the period would be higher, and your ending account value would be lower. In addition, the Fund, as a shareholder in the underlying Fidelity Central Funds, will indirectly bear its pro-rata share of the fees and expenses incurred by the underlying Fidelity Central Funds. These fees and expenses are not included in the Fund's annualized expense ratio used to calculate the expense estimate in the table below.
Hypothetical Example for Comparison Purposes
The second line of the accompanying table for each class of the Fund provides information about hypothetical account values and hypothetical expenses based on a Class' actual expense ratio and an assumed rate of return of 5% per year before expenses, which is not the Class' actual return. The hypothetical account values and expenses may not be used to estimate the actual ending account balance or expenses you paid for the period. You may use this information to compare the ongoing costs of investing in the Fund and other funds. To do so, compare this 5% hypothetical example with the 5% hypothetical examples that appear in the shareholder reports of the other funds. The estimate of expenses does not include any fees or other expenses of any variable annuity or variable life insurance product. If they were, the estimate of expenses you paid during the period would be higher, and your ending account value would be lower. In addition, the Fund, as a shareholder in the underlying Fidelity Central Funds, will indirectly bear its pro-rata share of the fees and expenses incurred by the underlying Fidelity Central Funds. These fees and expenses are not included in the Fund's annualized expense ratio used to calculate the expense estimate in the table below.
Please note that the expenses shown in the table are meant to highlight your ongoing costs only and do not reflect any transaction costs. Therefore, the second line of the table is useful in comparing ongoing costs only, and will not help you determine the relative total costs of owning different funds.
| | Annualized Expense Ratio-A | Beginning
Account Value
January 1, 2019 | Ending
Account Value
June 30, 2019 | Expenses Paid
During Period-B
January 1, 2019
to June 30, 2019 |
| Initial Class | .66% | | | |
| Actual | | $1,000.00 | $1,279.60 | $3.73 |
| Hypothetical-C | | $1,000.00 | $1,021.52 | $3.31 |
| Investor Class | .74% | | | |
| Actual | | $1,000.00 | $1,279.60 | $4.18 |
| Hypothetical-C | | $1,000.00 | $1,021.12 | $3.71 |
A Annualized expense ratio reflects expenses net of applicable fee waivers.
B Expenses are equal to each Class' annualized expense ratio, multiplied by the average account value over the period, multiplied by 181/365 (to reflect the one-half year period).
C 5% return per year before expenses
Board Approval of Investment Advisory Contracts and Management Fees
VIP Technology Portfolio
Each year, the Board of Trustees, including the Independent Trustees (together, the Board), votes on the renewal of the management contract with Fidelity SelectCo, LLC (SelectCo), an affiliate of Fidelity Management & Research Company (FMR), and the sub-advisory agreements with affiliates of FMR (together, the Advisory Contracts) for the fund. SelectCo and the sub-advisers are referred to herein as the Investment Advisers. The Board, assisted by the advice of fund counsel and Independent Trustees' counsel, requests and considers a broad range of information relevant to the renewal of the Advisory Contracts throughout the year.
The Board meets regularly and, at each of its meetings, covers an extensive agenda of topics and materials and considers factors that are relevant to its annual consideration of the renewal of the fund's Advisory Contracts, including the services and support provided to the fund and its shareholders. The Board has established various standing committees (Committees), each composed of and chaired by Independent Trustees with varying backgrounds, to which the Board has assigned specific subject matter responsibilities in order to enhance effective decision-making by the Board. The Board, acting directly and through its Committees, requests and receives information concerning the annual consideration of the renewal of the fund's Advisory Contracts. The Board also meets as needed to review matters specifically related to the Board's annual consideration of the renewal of the Advisory Contracts. Members of the Board may also meet with trustees of other Fidelity funds through joint ad hoc committees to discuss certain matters relevant to all of the Fidelity funds.
At its January 2019 meeting, the Board unanimously determined to renew the fund's Advisory Contracts. In reaching its determination, the Board considered all factors it believed relevant, including (i) the nature, extent, and quality of the services to be provided to the fund and its shareholders (including the investment performance of the fund); (ii) the competitiveness of the fund's management fee and total expense ratio relative to peer funds; (iii) the total costs of the services to be provided by and the profits to be realized by Fidelity from its relationships with the fund; and (iv) the extent to which, if any, economies of scale exist and would be realized as the fund grows, and whether any economies of scale are appropriately shared with fund shareholders.
In considering whether to renew the Advisory Contracts for the fund, the Board reached a determination, with the assistance of fund counsel and Independent Trustees' counsel and through the exercise of its business judgment, that the renewal of the Advisory Contracts was in the best interests of the fund and its shareholders and that the compensation payable under the Advisory Contracts was fair and reasonable. The Board's decision to renew the Advisory Contracts was not based on any single factor, but rather was based on a comprehensive consideration of all the information provided to the Board at its meetings throughout the year. The Board, in reaching its determination to renew the Advisory Contracts, was aware that shareholders of the fund have a broad range of investment choices available to them, including a wide choice among funds offered by Fidelity's competitors, and that the fund's shareholders, who have the opportunity to review and weigh the disclosure provided by the fund in its prospectus and other public disclosures, have chosen to invest in this fund, which is part of the Fidelity family of funds.
Nature, Extent, and Quality of Services Provided. The Board considered Fidelity's staffing as it relates to the fund, including the backgrounds of investment personnel of Fidelity, and also considered the fund's investment objective, strategies, and related investment philosophy. The Independent Trustees also had discussions with senior management of Fidelity's investment operations and investment groups. The Board considered the structure of the investment personnel compensation program and whether this structure provides appropriate incentives to act in the best interests of the fund. Additionally, the Board considered the portfolio managers' investments, if any, in the funds that they manage.
Resources Dedicated to Investment Management and Support Services. The Board and the Fund Oversight and Research Committees reviewed the general qualifications and capabilities of Fidelity's investment staff, including its size, education, experience, and resources, as well as Fidelity's approach to recruiting, training, managing, and compensating investment personnel. The Board noted that Fidelity has continued to increase the resources devoted to non-U.S. offices, including expansion of Fidelity's global investment organization. The Board also noted that Fidelity's analysts have extensive resources, tools and capabilities that allow them to conduct sophisticated quantitative and fundamental analysis, as well as credit analysis of issuers, counterparties and guarantors. Further, the Board considered that Fidelity's investment professionals have sufficient access to global information and data so as to provide competitive investment results over time, and that those professionals also have access to sophisticated tools that permit them to assess portfolio construction and risk and performance attribution characteristics continuously, as well as to transmit new information and research conclusions rapidly around the world. Additionally, in its deliberations, the Board considered Fidelity's trading, risk management, compliance, and technology and operations capabilities and resources, which are integral parts of the investment management process.
Shareholder and Administrative Services. The Board considered (i) the nature, extent, quality, and cost of advisory, administrative, and shareholder services performed by the Investment Advisers and their affiliates under the Advisory Contracts and under separate agreements covering transfer agency, pricing and bookkeeping, and securities lending services for the fund; (ii) the nature and extent of the supervision of third party service providers, principally custodians, subcustodians, and pricing vendors; and (iii) the resources devoted to, and the record of compliance with, the fund's compliance policies and procedures. The Board also reviewed the allocation of fund brokerage, including allocations to brokers affiliated with the Investment Advisers, the use of brokerage commissions to pay fund expenses, and the use of "soft" commission dollars to pay for research services.
The Board noted that the growth of fund assets over time across the complex allows Fidelity to reinvest in the development of services designed to enhance the value and convenience of the Fidelity funds as investment vehicles. These services include 24-hour access to account information and market information through telephone representatives and over the Internet, investor education materials and asset allocation tools, and the expanded availability of Fidelity Investor Centers.
The Board noted that it and the boards of certain other Fidelity funds had formed an ad hoc Committee on Transfer Agency Fees to review the variety of transfer agency fee structures throughout the industry and Fidelity's competitive positioning with respect to industry participants.
Investment in a Large Fund Family. The Board considered the benefits to shareholders of investing in a Fidelity fund, including the benefits of investing in a fund that is part of a large family of funds offering a variety of investment disciplines and providing a large variety of mutual fund investor services. The Board noted that Fidelity had taken, or had made recommendations that resulted in the Fidelity funds taking, a number of actions over the previous year that benefited particular funds, including: (i) continuing to dedicate additional resources to Fidelity's investment research process, which includes meetings with management of issuers of securities in which the funds invest, and to the support of the senior management team that oversees asset management; (ii) continuing efforts to enhance Fidelity's global research capabilities; (iii) launching new funds and making other enhancements to meet client needs; (iv) launching new share classes of existing funds; (v) eliminating purchase minimums and broadening eligibility requirements for certain funds and share classes; (vi) reducing management fees and total expenses for certain growth equity funds and index funds; (vii) lowering expense caps for certain existing funds and classes, and converting certain voluntary expense caps to contractual caps, to reduce expenses borne by shareholders; (viii) eliminating short-term redemption fees for funds that had such fees; (ix) rationalizing product lines and gaining increased efficiencies from fund mergers and share class consolidations; (x) continuing to develop, acquire and implement systems and technology to improve services to the funds and shareholders, strengthen information security, and increase efficiency; and (xi) continuing to implement enhancements to further strengthen Fidelity's product line to increase investors' probability of success in achieving their investment goals, including retirement income goals.
Investment Performance. The Board considered whether the fund has operated in accordance with its investment objective, as well as its record of compliance with its investment restrictions and its performance history. The fund had a portfolio manager change in July 2018. The Board will continue to monitor closely the fund's performance, taking into account the portfolio manager change.
The Board took into account discussions that occur at Board meetings throughout the year with representatives of the Investment Advisers about fund investment performance. In this regard the Board noted that as part of regularly scheduled fund reviews and other reports to the Board on fund performance, the Board considers annualized return information for the fund for different time periods, measured against an appropriate securities market index ("benchmark index"). In its evaluation of fund investment performance, the Board gave particular attention to information indicating changes in performance of certain Fidelity funds for specific time periods and discussed with the Investment Advisers the reasons for any overperformance or underperformance.
In addition to reviewing absolute and relative fund performance, the Independent Trustees periodically consider the appropriateness of fund performance metrics in evaluating the results achieved. In general, the Independent Trustees believe that fund performance should be evaluated based on net performance (after fees and expenses) of both the highest performing and lowest performing fund share classes, where applicable, compared to appropriate benchmark indices, over appropriate time periods that may include full market cycles, taking into account relevant factors including the following: general market conditions; issuer-specific information; and fund cash flows and other factors.
The Independent Trustees recognize that shareholders evaluate performance on a net basis over their own holding periods, for which one-, three-, and five-year periods are often used as a proxy. For this reason, the performance information reviewed by the Board also included net cumulative total return information for the fund and an appropriate benchmark index for the most recent one-, three-, and five-year periods ended June 30, 2018, as shown below.
VIP Technology Portfolio

Based on its review, the Board concluded that the nature, extent, and quality of services provided to the fund under the Advisory Contracts should continue to benefit the shareholders of the fund.
Competitiveness of Management Fee and Total Expense Ratio. The Board considered the fund's management fee and total expense ratio compared to "mapped groups" of competitive funds and classes created for the purpose of facilitating the Trustees' competitive analysis of management fees and total expenses. Fidelity creates "mapped groups" by combining similar Lipper investment objective categories that have comparable investment mandates. For this purpose, all sector focused equity variable annuity funds are grouped in the same mapped group. Combining Lipper investment objective categories aids the Board's management fee and total expense ratio comparisons by broadening the competitive group used for comparison.
Management Fee. The Board considered two proprietary management fee comparisons for the 12-month periods ended June 30 shown in basis points (BP) in the chart below. The group of Lipper funds used by the Board for management fee comparisons is referred to below as the "Total Mapped Group." The Total Mapped Group comparison focuses on a fund's standing in terms of gross management fees before expense reimbursements or caps relative to the total universe of funds with comparable investment mandates (i.e., sector equities), regardless of whether their management fee structures also are comparable. Funds with comparable management fee structures have similar management fee contractual arrangements (
e.g., flat rate charged for advisory services, all-inclusive fee rate,
etc.). "TMG %" represents the percentage of funds in the Total Mapped Group that had management fees that were lower than the fund's. For example, a hypothetical TMG % of 20% would mean that 80% of the funds in the Total Mapped Group had higher, and 20% had lower, management fees than the fund. The fund's actual TMG %s and the number of funds in the Total Mapped Group are in the chart below. The "Asset-Size Peer Group" (ASPG) comparison focuses on a fund's standing relative to a subset of non-Fidelity funds within the Total Mapped Group that are similar in size and management fee structure. For example, if a fund is in the first quartile of the ASPG, the fund's management fee ranks in the least expensive or lowest 25% of funds in the ASPG. The ASPG represents at least 15% of the funds in the Total Mapped Group with comparable asset size and management fee structures, subject to a minimum of 50 funds (or all funds in the Total Mapped Group if fewer than 50). Additional information, such as the ASPG quartile in which the fund's management fee rate ranked, is also included in the chart and was considered by the Board.
VIP Technology Portfolio

The Board noted that the fund's management fee rate ranked below the median of its Total Mapped Group and below the median of its ASPG for the 12-month period ended June 30, 2018.
The Board noted that it and the boards of other Fidelity funds formed an ad hoc Committee on Group Fee, which meets periodically, to conduct an in-depth review of the "group fee" component of the management fee of funds with such management fee structures. The Committee's focus included the mechanics of the group fee, the competitive landscape of group fee structures, Fidelity funds with no group fee component and investment products not included in group fee assets. The Board also considered that, for funds subject to the group fee, FMR agreed to voluntarily waive fees over a specified period of time in amounts designed to account for assets converted from certain funds to certain collective investment trusts.
Based on its review, the Board concluded that the fund's management fee is fair and reasonable in light of the services that the fund receives and the other factors considered.
Total Expense Ratio. In its review of each class's total expense ratio, the Board considered the fund's management fee rate as well as other fund or class expenses, as applicable, such as transfer agent fees, pricing and bookkeeping fees, and custodial, legal, and audit fees. The Board also noted that Fidelity may agree to waive fees and expenses from time to time, and the extent to which, if any, it has done so for the fund. As part of its review, the Board also considered the current and historical total expense ratios of each class of the fund compared to competitive fund median expenses. Each class of the fund is compared to those funds and classes in the Total Mapped Group (used by the Board for management fee comparisons) that have a similar sales load structure.
The Board noted that the total expense ratio of each class ranked below the competitive median for the 12-month period ended June 30, 2018.
Fees Charged to Other Fidelity Clients. The Board also considered Fidelity fee structures and other information with respect to clients of Fidelity, such as other funds advised or subadvised by Fidelity, pension plan clients, and other institutional clients with similar mandates. The Board noted that a joint ad hoc committee created by it and the boards of other Fidelity funds periodically reviews and compares Fidelity's institutional investment advisory business with its business of providing services to the Fidelity funds, and also noted the most recent findings of the committee. The Board noted that the committee's review included a consideration of the differences in services provided, fees charged, and costs incurred, as well as competition in the markets serving the different categories of clients.
Based on its review of total expense ratios and fees charged to other Fidelity clients, the Board concluded that the total expense ratio of each class of the fund was reasonable in light of the services that the fund and its shareholders receive and the other factors considered.
Costs of the Services and Profitability. The Board considered the revenues earned and the expenses incurred by Fidelity in conducting the business of developing, marketing, distributing, managing, administering and servicing the fund and servicing the fund's shareholders. The Board also considered the level of Fidelity's profits in respect of all the Fidelity funds.
On an annual basis, Fidelity presents to the Board information about the profitability of its relationships with the fund. Fidelity calculates profitability information for each fund, as well as aggregate profitability information for groups of Fidelity funds and all Fidelity funds, using a series of detailed revenue and cost allocation methodologies which originate with the books and records of Fidelity on which Fidelity's audited financial statements are based. The Audit Committee of the Board reviews any significant changes from the prior year's methodologies.
PricewaterhouseCoopers LLP (PwC), auditor to Fidelity and certain Fidelity funds, has been engaged annually by the Board as part of the Board's assessment of Fidelity's profitability analysis. PwC's engagement includes the review and assessment of the methodologies used by Fidelity in determining the revenues and expenses attributable to Fidelity's mutual fund business, and completion of agreed-upon procedures in respect of the mathematical accuracy of the fund profitability information and its conformity to established allocation methodologies. After considering PwC's reports issued under the engagement and information provided by Fidelity, the Board concluded that while other allocation methods may also be reasonable, Fidelity's profitability methodologies are reasonable in all material respects.
The Board also reviewed Fidelity's non-fund businesses and potential indirect benefits such businesses may have received as a result of their association with Fidelity's mutual fund business (i.e., fall-out benefits) as well as cases where Fidelity's affiliates may benefit from the fund's business. The Board noted that changes to fall-out benefits year-over-year reflect business developments at Fidelity's various businesses.
The Board considered the costs of the services provided by and the profits realized by Fidelity in connection with the operation of the fund and was satisfied that the profitability was not excessive.
Economies of Scale. The Board considered whether there have been economies of scale in respect of the management of the Fidelity funds, whether the Fidelity funds (including the fund) have appropriately benefited from any such economies of scale, and whether there is potential for realization of any further economies of scale. The Board considered the extent to which the fund will benefit from economies of scale as assets grow through increased services to the fund, through waivers or reimbursements, or through fee or expense ratio reductions. The Board also noted that a committee (the Economies of Scale Committee) created by it and the boards of other Fidelity funds periodically analyzes whether Fidelity attains economies of scale in respect of the management and servicing of the Fidelity funds, whether the Fidelity funds have appropriately benefited from such economies of scale, and whether there is potential for realization of any further economies of scale.
The Board recognized that the fund's management contract incorporates a "group fee" structure, which provides for lower group fee rates as total group assets increase, and for higher group fee rates as total group assets decrease (with "group assets" defined to include fund assets under SelectCo's management plus assets under FMR's management). SelectCo calculates the group fee rates based on a tiered asset "breakpoint" schedule that varies based on asset class. The Board considered that the group fee is designed to deliver the benefits of economies of scale to fund shareholders when total group assets increase, even if assets of any particular fund are unchanged or have declined, because some portion of Fidelity's costs are attributable to services provided to all Fidelity funds, and all funds benefit if those costs can be allocated among more assets. The Board concluded that, given the group fee structure, fund shareholders will benefit from lower management fees as group assets increase at the fund complex level, regardless of whether Fidelity achieves any such economies of scale.
The Board concluded, taking into account the analysis of the Economies of Scale Committee, that economies of scale, if any, are being appropriately shared between fund shareholders and Fidelity.
Additional Information Requested by the Board. In order to develop fully the factual basis for consideration of the Fidelity funds' advisory contracts, the Board requested and received additional information on certain topics, including: (i) fund performance trends, in particular the underperformance of certain funds, and Fidelity's long-term strategies for certain funds; (ii) Fidelity's fund profitability methodology, profitability trends for certain funds, and the impact of certain factors on fund profitability results; (iii) metrics for evaluating index fund and ETF performance and information about ETF trading characteristics; (iv) the methodology with respect to the evaluation of competitive fund data and peer group classifications and fee comparisons; (v) the expense structures for different funds and classes; (vi) information regarding other accounts managed by Fidelity, including collective investment trusts; and (vii) Fidelity's philosophies and strategies for evaluating funds and classes with lower or declining asset levels.
Based on its evaluation of all of the conclusions noted above, and after considering all factors it believed relevant, the Board concluded that the advisory fee arrangements are fair and reasonable, and that the fund's Advisory Contracts should be renewed.

VTECIC-SANN-0819
1.817388.114
Fidelity® Variable Insurance Products: Energy Portfolio
Semi-Annual Report June 30, 2019 |
|
Beginning on January 1, 2021, as permitted by regulations adopted by the Securities and Exchange Commission, and if your insurance carrier elects to participate, you may not be receiving paper copies of the Fund’s shareholder reports from the insurance company that offers your variable insurance product unless you specifically request paper copies from your financial professional or the administrator of your variable insurance product. Instead, the reports will be made available on a website, and you will be notified by mail each time a report is posted and provided with a website link to access the report.
If you already elected to receive shareholder reports electronically, you will not be affected by this change and you need not take any action. You may elect to receive shareholder reports and other communications from the Fund electronically, by contacting your financial professional or the administrator of your variable insurance product. If you own a Fidelity-administered variable insurance product, please visit fidelity.com/mailpreferences to make your election or call 1-800-343-3548.
You may elect to receive all future reports in paper free of charge. If you wish to continue receiving paper copies of your shareholder reports, you may contact your financial professional or the administrator of your variable insurance product. If you own a Fidelity-administered variable insurance product, please visit fidelity.com/mailpreferences to make your election or call 1-800-343-3548. Your election to receive reports in paper will apply to all funds available under your variable insurance product.
Contents
To view a fund's proxy voting guidelines and proxy voting record for the 12-month period ended June 30, visit http://www.fidelity.com/proxyvotingresults or visit the Securities and Exchange Commission's (SEC) web site at http://www.sec.gov.
You may also call 1-877-208-0098 to request a free copy of the proxy voting guidelines.
Fidelity® Variable Insurance Products are separate account options which are purchased through a variable insurance contract.
Standard & Poor's, S&P and S&P 500 are registered service marks of The McGraw-Hill Companies, Inc. and have been licensed for use by Fidelity Distributors Corporation.
Other third-party marks appearing herein are the property of their respective owners.
All other marks appearing herein are registered or unregistered trademarks or service marks of FMR LLC or an affiliated company. © 2019 FMR LLC. All rights reserved.
This report and the financial statements contained herein are submitted for the general information of the shareholders of the Fund. This report is not authorized for distribution to prospective investors in the Fund unless preceded or accompanied by an effective prospectus.
A fund files its complete schedule of portfolio holdings with the SEC for the first and third quarters of each fiscal year on Form N-PORT. Forms N-PORT are available on the SEC’s web site at http://www.sec.gov. A fund's Forms N-PORT may be reviewed and copied at the SEC’s Public Reference Room in Washington, DC. Information regarding the operation of the SEC's Public Reference Room may be obtained by calling 1-800-SEC-0330.
For a complete list of a fund's portfolio holdings, view the most recent holdings listing, semiannual report, or annual report on Fidelity's web site at http://www.fidelity.com, http://www.institutional.fidelity.com, or http://www.401k.com, as applicable.
NOT FDIC INSURED •MAY LOSE VALUE •NO BANK GUARANTEE
Neither the Fund nor Fidelity Distributors Corporation is a bank.
Investment Summary (Unaudited)
Top Ten Stocks as of June 30, 2019
| | % of fund's net assets |
| Chevron Corp. | 17.5 |
| EOG Resources, Inc. | 7.7 |
| Valero Energy Corp. | 6.7 |
| Exxon Mobil Corp. | 4.8 |
| Diamondback Energy, Inc. | 4.6 |
| Pioneer Natural Resources Co. | 4.5 |
| ConocoPhillips Co. | 4.1 |
| Phillips 66 Co. | 3.9 |
| Marathon Petroleum Corp. | 3.2 |
| Hess Corp. | 2.5 |
| | 59.5 |
Top Industries (% of fund's net assets)
| As of June 30, 2019 |
| | Oil, Gas & Consumable Fuels | 91.5% |
| | Energy Equipment & Services | 6.6% |
| | Machinery | 0.7% |
| | Electric Utilities | 0.2% |
| | Chemicals | 0.1% |
| | All Others* | 0.9% |

* Includes short-term investments and net other assets (liabilities).
Schedule of Investments June 30, 2019 (Unaudited)
Showing Percentage of Net Assets
| Common Stocks - 99.2% | | | |
| | | Shares | Value |
| Chemicals - 0.1% | | | |
| Commodity Chemicals - 0.1% | | | |
| LG Chemical Ltd. | | 857 | $262,529 |
| Electric Utilities - 0.2% | | | |
| Electric Utilities - 0.2% | | | |
| DONG Energy A/S (a) | | 4,900 | 423,701 |
| Energy Equipment & Services - 6.6% | | | |
| Oil & Gas Drilling - 0.8% | | | |
| AKITA Drilling Ltd. Class A (non-vtg.) | | 44,185 | 84,351 |
| Odfjell Drilling Ltd. (b) | | 140,050 | 426,859 |
| Patterson-UTI Energy, Inc. | | 37,900 | 436,229 |
| Shelf Drilling Ltd. (a)(b) | | 216,333 | 748,123 |
| | | | 1,695,562 |
| Oil & Gas Equipment & Services - 5.8% | | | |
| Baker Hughes, a GE Co. Class A | | 115,900 | 2,854,617 |
| Dmc Global, Inc. | | 5,400 | 342,090 |
| Forum Energy Technologies, Inc. (b) | | 138,600 | 474,012 |
| Halliburton Co. | | 46,600 | 1,059,684 |
| Hunting PLC | | 44,900 | 291,091 |
| Liberty Oilfield Services, Inc. Class A | | 37,000 | 598,660 |
| RigNet, Inc. (b) | | 93,800 | 945,504 |
| Schlumberger Ltd. | | 115,209 | 4,578,406 |
| Solaris Oilfield Infrastructure, Inc. Class A (c) | | 102,500 | 1,535,450 |
| Tenaris SA sponsored ADR | | 8,300 | 218,373 |
| | | | 12,897,887 |
|
| TOTAL ENERGY EQUIPMENT & SERVICES | | | 14,593,449 |
|
| Independent Power and Renewable Electricity Producers - 0.1% | | | |
| Renewable Electricity - 0.1% | | | |
| NextEra Energy Partners LP | | 2,839 | 136,982 |
| Machinery - 0.7% | | | |
| Industrial Machinery - 0.7% | | | |
| Cactus, Inc. (b) | | 9,200 | 304,704 |
| ProPetro Holding Corp. (b) | | 58,200 | 1,204,740 |
| | | | 1,509,444 |
| Oil, Gas & Consumable Fuels - 91.5% | | | |
| Integrated Oil & Gas - 26.9% | | | |
| Chevron Corp. | | 311,031 | 38,704,698 |
| Equinor ASA | | 47,700 | 941,927 |
| Exxon Mobil Corp. | | 138,848 | 10,639,922 |
| Occidental Petroleum Corp. | | 99,600 | 5,007,888 |
| Suncor Energy, Inc. | | 131,800 | 4,111,359 |
| | | | 59,405,794 |
| Oil & Gas Exploration & Production - 43.7% | | | |
| Berry Petroleum Corp. | | 116,800 | 1,238,080 |
| Black Stone Minerals LP | | 16,700 | 258,850 |
| Brigham Minerals, Inc. Class A | | 25,200 | 540,792 |
| Cabot Oil & Gas Corp. | | 173,700 | 3,988,152 |
| Concho Resources, Inc. | | 24,124 | 2,489,114 |
| ConocoPhillips Co. | | 148,200 | 9,040,200 |
| Continental Resources, Inc. (b) | | 86,079 | 3,623,065 |
| Devon Energy Corp. | | 190,200 | 5,424,504 |
| Diamondback Energy, Inc. | | 92,799 | 10,112,307 |
| Encana Corp. (Toronto) | | 786,800 | 4,037,491 |
| EOG Resources, Inc. | | 183,542 | 17,098,773 |
| EQT Corp. | | 11,900 | 188,139 |
| Hess Corp. | | 85,400 | 5,428,878 |
| Kosmos Energy Ltd. | | 300,700 | 1,885,389 |
| Lundin Petroleum AB | | 50,000 | 1,550,158 |
| Magnolia Oil & Gas Corp. Class A (b)(c) | | 225,600 | 2,612,448 |
| National Energy Services Reunited Corp. (b) | | 2,800 | 24,360 |
| Noble Energy, Inc. | | 216,100 | 4,840,640 |
| Northern Oil & Gas, Inc. (b)(c) | | 631,200 | 1,218,216 |
| Parex Resources, Inc. (b) | | 197,300 | 3,165,418 |
| Parsley Energy, Inc. Class A (b) | | 120,530 | 2,291,275 |
| PDC Energy, Inc. (b) | | 25,034 | 902,726 |
| Pioneer Natural Resources Co. | | 65,265 | 10,041,673 |
| Talos Energy, Inc. (b) | | 13,800 | 331,890 |
| Texas Pacific Land Trust | | 200 | 157,398 |
| Viper Energy Partners LP | | 136,000 | 4,191,520 |
| | | | 96,681,456 |
| Oil & Gas Refining & Marketing - 16.1% | | | |
| Delek U.S. Holdings, Inc. | | 70,877 | 2,871,936 |
| Marathon Petroleum Corp. | | 126,036 | 7,042,892 |
| Par Pacific Holdings, Inc. (b) | | 57,100 | 1,171,692 |
| Phillips 66 Co. | | 93,762 | 8,770,497 |
| Reliance Industries Ltd. | | 58,358 | 1,060,601 |
| Valero Energy Corp. | | 172,500 | 14,767,725 |
| | | | 35,685,343 |
| Oil & Gas Storage & Transport - 4.8% | | | |
| Cheniere Energy, Inc. (b) | | 70,900 | 4,853,105 |
| Dorian Lpg Ltd. (b) | | 23,800 | 214,676 |
| Enterprise Products Partners LP | | 74,900 | 2,162,363 |
| Golar LNG Ltd. | | 38,900 | 718,872 |
| Keyera Corp. | | 21,200 | 545,561 |
| Noble Midstream Partners LP (b)(d) | | 14,739 | 490,219 |
| Teekay LNG Partners LP | | 13,000 | 183,300 |
| The Williams Companies, Inc. | | 55,100 | 1,545,004 |
| | | | 10,713,100 |
|
| TOTAL OIL, GAS & CONSUMABLE FUELS | | | 202,485,693 |
|
| TOTAL COMMON STOCKS | | | |
| (Cost $201,259,282) | | | 219,411,798 |
|
| Money Market Funds - 1.7% | | | |
| Fidelity Cash Central Fund 2.42% (e) | | 544,535 | 544,644 |
| Fidelity Securities Lending Cash Central Fund 2.42% (e)(f) | | 3,359,247 | 3,359,583 |
| TOTAL MONEY MARKET FUNDS | | | |
| (Cost $3,904,227) | | | 3,904,227 |
| TOTAL INVESTMENT IN SECURITIES - 100.9% | | | |
| (Cost $205,163,509) | | | 223,316,025 |
| NET OTHER ASSETS (LIABILITIES) - (0.9)% | | | (2,059,865) |
| NET ASSETS - 100% | | | $221,256,160 |
Legend
(a) Security exempt from registration under Rule 144A of the Securities Act of 1933. These securities may be resold in transactions exempt from registration, normally to qualified institutional buyers. At the end of the period, the value of these securities amounted to $1,171,824 or 0.5% of net assets.
(b) Non-income producing
(c) Security or a portion of the security is on loan at period end.
(d) Restricted securities - Investment in securities not registered under the Securities Act of 1933 (excluding 144A issues). At the end of the period, the value of restricted securities (excluding 144A issues) amounted to $490,219 or 0.2% of net assets.
(e) Affiliated fund that is generally available only to investment companies and other accounts managed by Fidelity Investments. The rate quoted is the annualized seven-day yield of the fund at period end. A complete unaudited listing of the fund's holdings as of its most recent quarter end is available upon request. In addition, each Fidelity Central Fund's financial statements are available on the SEC's website or upon request.
(f) Investment made with cash collateral received from securities on loan.
Additional information on each restricted holding is as follows:
| Security | Acquisition Date | Acquisition Cost |
| Noble Midstream Partners LP | 6/21/17 | $596,193 |
Affiliated Central Funds
Information regarding fiscal year to date income earned by the Fund from investments in Fidelity Central Funds is as follows:
| Fund | Income earned |
| Fidelity Cash Central Fund | $19,757 |
| Fidelity Securities Lending Cash Central Fund | 5,654 |
| Total | $25,411 |
Amounts in the income column in the above table include any capital gain distributions from underlying funds, which are presented in the corresponding line-item in the Statement of Operations, if applicable. Amount for Fidelity Securities Lending Cash Central Fund represents securities lending income earned from the reinvestment of cash collateral from loaned securities, net of payments to and from borrowers of securities.
Investment Valuation
All investments are categorized as Level 1 under the Fair Value Hierarchy. The inputs or methodology used for valuing securities may not be an indication of the risk associated with investing in those securities. For more information on valuation inputs please refer to the Investment Valuation section in the accompanying Notes to Financial Statements.
Other Information
Distribution of investments by country or territory of incorporation, as a percentage of Total Net Assets, is as follows (Unaudited):
| United States of America | 89.4% |
| Canada | 5.3% |
| Curacao | 2.1% |
| Others (Individually Less Than 1%) | 3.2% |
| | 100.0% |
See accompanying notes which are an integral part of the financial statements.
Financial Statements
Statement of Assets and Liabilities
| | | June 30, 2019 (Unaudited) |
| Assets | | |
Investment in securities, at value (including securities loaned of $3,235,123) — See accompanying schedule:
Unaffiliated issuers (cost $201,259,282) | $219,411,798 | |
| Fidelity Central Funds (cost $3,904,227) | 3,904,227 | |
| Total Investment in Securities (cost $205,163,509) | | $223,316,025 |
| Receivable for investments sold | | 3,006,660 |
| Receivable for fund shares sold | | 16,973 |
| Dividends receivable | | 136,180 |
| Distributions receivable from Fidelity Central Funds | | 2,863 |
| Prepaid expenses | | 1,887 |
| Other receivables | | 11,999 |
| Total assets | | 226,492,587 |
| Liabilities | | |
| Payable to custodian bank | $343,499 | |
| Payable for investments purchased | 978,320 | |
| Payable for fund shares redeemed | 368,576 | |
| Accrued management fee | 95,294 | |
| Distribution and service plan fees payable | 19,634 | |
| Other affiliated payables | 24,398 | |
| Other payables and accrued expenses | 48,956 | |
| Collateral on securities loaned | 3,357,750 | |
| Total liabilities | | 5,236,427 |
| Net Assets | | $221,256,160 |
| Net Assets consist of: | | |
| Paid in capital | | $275,161,875 |
| Total distributable earnings (loss) | | (53,905,715) |
| Net Assets | | $221,256,160 |
| Net Asset Value and Maximum Offering Price | | |
| Initial Class: | | |
| Net Asset Value, offering price and redemption price per share ($30,196,374 ÷ 1,825,014 shares) | | $16.55 |
| Service Class 2: | | |
| Net Asset Value, offering price and redemption price per share ($97,766,903 ÷ 5,939,815 shares) | | $16.46 |
| Investor Class: | | |
| Net Asset Value, offering price and redemption price per share ($93,292,883 ÷ 5,650,361 shares) | | $16.51 |
See accompanying notes which are an integral part of the financial statements.
Statement of Operations
| | | Six months ended June 30, 2019 (Unaudited) |
| Investment Income | | |
| Dividends | | $2,769,881 |
| Income from Fidelity Central Funds (including $5,654 from security lending) | | 25,411 |
| Total income | | 2,795,292 |
| Expenses | | |
| Management fee | $624,470 | |
| Transfer agent fees | 115,151 | |
| Distribution and service plan fees | 125,812 | |
| Accounting and security lending fees | 45,302 | |
| Custodian fees and expenses | 7,305 | |
| Independent trustees' fees and expenses | 565 | |
| Audit | 24,099 | |
| Legal | 547 | |
| Miscellaneous | 1,034 | |
| Total expenses before reductions | 944,285 | |
| Expense reductions | (7,228) | |
| Total expenses after reductions | | 937,057 |
| Net investment income (loss) | | 1,858,235 |
| Realized and Unrealized Gain (Loss) | | |
| Net realized gain (loss) on: | | |
| Investment securities: | | |
| Unaffiliated issuers (net of foreign taxes of $4,262) | (12,034,766) | |
| Fidelity Central Funds | 49 | |
| Foreign currency transactions | (2,633) | |
| Total net realized gain (loss) | | (12,037,350) |
| Change in net unrealized appreciation (depreciation) on: | | |
| Investment securities: | | |
| Unaffiliated issuers (net of increase in deferred foreign taxes of $21,049) | 36,521,808 | |
| Fidelity Central Funds | (24) | |
| Assets and liabilities in foreign currencies | 236 | |
| Total change in net unrealized appreciation (depreciation) | | 36,522,020 |
| Net gain (loss) | | 24,484,670 |
| Net increase (decrease) in net assets resulting from operations | | $26,342,905 |
See accompanying notes which are an integral part of the financial statements.
Statement of Changes in Net Assets
| | Six months ended June 30, 2019 (Unaudited) | Year ended December 31, 2018 |
| Increase (Decrease) in Net Assets | | |
| Operations | | |
| Net investment income (loss) | $1,858,235 | $2,862,088 |
| Net realized gain (loss) | (12,037,350) | (629,792) |
| Change in net unrealized appreciation (depreciation) | 36,522,020 | (72,786,556) |
| Net increase (decrease) in net assets resulting from operations | 26,342,905 | (70,554,260) |
| Distributions to shareholders | (1,063,402) | (2,587,589) |
| Share transactions - net increase (decrease) | (15,051,838) | (8,755,164) |
| Total increase (decrease) in net assets | 10,227,665 | (81,897,013) |
| Net Assets | | |
| Beginning of period | 211,028,495 | 292,925,508 |
| End of period | $221,256,160 | $211,028,495 |
See accompanying notes which are an integral part of the financial statements.
Financial Highlights
VIP Energy Portfolio Initial Class
| | Six months ended (Unaudited) June 30, | Years endedDecember 31, | | | | |
| | 2019 | 2018 | 2017 | 2016 | 2015 | 2014 |
| Selected Per–Share Data | | | | | | |
| Net asset value, beginning of period | $14.78 | $19.86 | $20.72 | $15.57 | $20.45 | $23.95 |
| Income from Investment Operations | | | | | | |
| Net investment income (loss)A | .14 | .22 | .32B | .13 | .24 | .22 |
| Net realized and unrealized gain (loss) | 1.71 | (5.09) | (.85) | 5.14 | (4.30) | (3.23) |
| Total from investment operations | 1.85 | (4.87) | (.53) | 5.27 | (4.06) | (3.01) |
| Distributions from net investment income | (.08) | (.19) | (.32) | (.12) | (.23) | (.23) |
| Distributions from net realized gain | – | (.02) | (.01) | – | (.60) | (.28) |
| Total distributions | (.08) | (.21) | (.33) | (.12) | (.83) | (.50)C |
| Redemption fees added to paid in capitalA | – | – | –D | –D | .01 | .01 |
| Net asset value, end of period | $16.55 | $14.78 | $19.86 | $20.72 | $15.57 | $20.45 |
| Total ReturnE,F,G | 12.52% | (24.58)% | (2.47)% | 33.84% | (20.54)% | (12.59)% |
| Ratios to Average Net AssetsH,I | | | | | | |
| Expenses before reductions | .67%J | .67% | .69% | .68% | .68% | .68% |
| Expenses net of fee waivers, if any | .67%J | .67% | .68% | .68% | .68% | .67% |
| Expenses net of all reductions | .66%J | .66% | .67% | .67% | .67% | .67% |
| Net investment income (loss) | 1.74%J | 1.12% | 1.73%B | .71% | 1.25% | .91% |
| Supplemental Data | | | | | | |
| Net assets, end of period (000 omitted) | $30,196 | $28,999 | $43,633 | $63,955 | $46,360 | $70,828 |
| Portfolio turnover rateK | 65%J | 58% | 66% | 87% | 70% | 99% |
A Calculated based on average shares outstanding during the period.
B Net investment income per share reflects a large, non-recurring dividend which amounted to $.21 per share. Excluding this non-recurring dividend, the ratio of net investment income (loss) to average net assets would have been .62%.
C Total distributions of $.50 per share is comprised of distributions from net investment income of $.227 and distributions from net realized gain of $.273 per share.
D Amount represents less than $.005 per share.
E Total returns for periods of less than one year are not annualized.
F Total returns do not reflect charges attributable to your insurance company's separate account. Inclusion of these charges would reduce the total returns shown.
G Total returns would have been lower if certain expenses had not been reduced during the applicable periods shown.
H Fees and expenses of any underlying Fidelity Central Funds are not included in the Fund's expense ratio. The Fund indirectly bears its proportionate share of the expenses of any underlying Fidelity Central Funds.
I Expense ratios reflect operating expenses of the class. Expenses before reductions do not reflect amounts reimbursed by the investment adviser or reductions from brokerage service arrangements or reductions from other expense offset arrangements and do not represent the amount paid by the class during periods when reimbursements or reductions occur. Expenses net of fee waivers reflect expenses after reimbursement by the investment adviser but prior to reductions from brokerage service arrangements or other expense offset arrangements. Expenses net of all reductions represent the net expenses paid by the class.
J Annualized
K Amount does not include the portfolio activity of any underlying Fidelity Central Funds.
See accompanying notes which are an integral part of the financial statements.
VIP Energy Portfolio Service Class 2
| | Six months ended (Unaudited) June 30, | Years endedDecember 31, | | | | |
| | 2019 | 2018 | 2017 | 2016 | 2015 | 2014 |
| Selected Per–Share Data | | | | | | |
| Net asset value, beginning of period | $14.71 | $19.75 | $20.62 | $15.51 | $20.37 | $23.83 |
| Income from Investment Operations | | | | | | |
| Net investment income (loss)A | .12 | .17 | .27B | .08 | .19 | .16 |
| Net realized and unrealized gain (loss) | 1.70 | (5.05) | (.86) | 5.12 | (4.28) | (3.19) |
| Total from investment operations | 1.82 | (4.88) | (.59) | 5.20 | (4.09) | (3.03) |
| Distributions from net investment income | (.07) | (.14) | (.27) | (.09) | (.18) | (.16) |
| Distributions from net realized gain | – | (.02) | (.01) | – | (.60) | (.28) |
| Total distributions | (.07) | (.16) | (.28) | (.09) | (.78) | (.44) |
| Redemption fees added to paid in capitalA | – | – | –C | –C | .01 | .01 |
| Net asset value, end of period | $16.46 | $14.71 | $19.75 | $20.62 | $15.51 | $20.37 |
| Total ReturnD,E,F | 12.40% | (24.77)% | (2.78)% | 33.51% | (20.75)% | (12.76)% |
| Ratios to Average Net AssetsG,H | | | | | | |
| Expenses before reductions | .92%I | .92% | .94% | .93% | .93% | .93% |
| Expenses net of fee waivers, if any | .92%I | .92% | .93% | .93% | .93% | .92% |
| Expenses net of all reductions | .91%I | .91% | .93% | .92% | .92% | .92% |
| Net investment income (loss) | 1.49%I | .88% | 1.48%B | .47% | 1.00% | .66% |
| Supplemental Data | | | | | | |
| Net assets, end of period (000 omitted) | $97,767 | $90,093 | $128,346 | $150,744 | $97,286 | $116,228 |
| Portfolio turnover rateJ | 65%I | 58% | 66% | 87% | 70% | 99% |
A Calculated based on average shares outstanding during the period.
B Net investment income per share reflects a large, non-recurring dividend which amounted to $.20 per share. Excluding this non-recurring dividend, the ratio of net investment income (loss) to average net assets would have been .37%.
C Amount represents less than $.005 per share.
D Total returns for periods of less than one year are not annualized.
E Total returns do not reflect charges attributable to your insurance company's separate account. Inclusion of these charges would reduce the total returns shown.
F Total returns would have been lower if certain expenses had not been reduced during the applicable periods shown.
G Fees and expenses of any underlying Fidelity Central Funds are not included in the Fund's expense ratio. The Fund indirectly bears its proportionate share of the expenses of any underlying Fidelity Central Funds.
H Expense ratios reflect operating expenses of the class. Expenses before reductions do not reflect amounts reimbursed by the investment adviser or reductions from brokerage service arrangements or reductions from other expense offset arrangements and do not represent the amount paid by the class during periods when reimbursements or reductions occur. Expenses net of fee waivers reflect expenses after reimbursement by the investment adviser but prior to reductions from brokerage service arrangements or other expense offset arrangements. Expenses net of all reductions represent the net expenses paid by the class.
I Annualized
J Amount does not include the portfolio activity of any underlying Fidelity Central Funds.
See accompanying notes which are an integral part of the financial statements.
VIP Energy Portfolio Investor Class
| | Six months ended (Unaudited) June 30, | Years endedDecember 31, | | | | |
| | 2019 | 2018 | 2017 | 2016 | 2015 | 2014 |
| Selected Per–Share Data | | | | | | |
| Net asset value, beginning of period | $14.75 | $19.82 | $20.68 | $15.55 | $20.42 | $23.90 |
| Income from Investment Operations | | | | | | |
| Net investment income (loss)A | .14 | .21 | .30B | .11 | .22 | .20 |
| Net realized and unrealized gain (loss) | 1.70 | (5.09) | (.85) | 5.13 | (4.29) | (3.21) |
| Total from investment operations | 1.84 | (4.88) | (.55) | 5.24 | (4.07) | (3.01) |
| Distributions from net investment income | (.08) | (.17) | (.30) | (.11) | (.22) | (.20) |
| Distributions from net realized gain | – | (.02) | (.01) | – | (.60) | (.28) |
| Total distributions | (.08) | (.19) | (.31) | (.11) | (.81)C | (.48) |
| Redemption fees added to paid in capitalA | – | – | –D | –D | .01 | .01 |
| Net asset value, end of period | $16.51 | $14.75 | $19.82 | $20.68 | $15.55 | $20.42 |
| Total ReturnE,F,G | 12.46% | (24.65)% | (2.57)% | 33.70% | (20.58)% | (12.65)% |
| Ratios to Average Net AssetsH,I | | | | | | |
| Expenses before reductions | .75%J | .75% | .77% | .76% | .76% | .76% |
| Expenses net of fee waivers, if any | .75%J | .75% | .77% | .76% | .76% | .75% |
| Expenses net of all reductions | .74%J | .74% | .76% | .75% | .75% | .75% |
| Net investment income (loss) | 1.66%J | 1.05% | 1.65%B | .63% | 1.17% | .83% |
| Supplemental Data | | | | | | |
| Net assets, end of period (000 omitted) | $93,293 | $91,936 | $120,946 | $162,235 | $98,909 | $101,214 |
| Portfolio turnover rateK | 65%J | 58% | 66% | 87% | 70% | 99% |
A Calculated based on average shares outstanding during the period.
B Net investment income per share reflects a large, non-recurring dividend which amounted to $.20 per share. Excluding this non-recurring dividend, the ratio of net investment income (loss) to average net assets would have been .54%.
C Total distributions of $.81 per share is comprised of distributions from net investment income of $.215 and distributions from net realized gain of $.599 per share.
D Amount represents less than $.005 per share.
E Total returns for periods of less than one year are not annualized.
F Total returns do not reflect charges attributable to your insurance company's separate account. Inclusion of these charges would reduce the total returns shown.
G Total returns would have been lower if certain expenses had not been reduced during the applicable periods shown.
H Fees and expenses of any underlying Fidelity Central Funds are not included in the Fund's expense ratio. The Fund indirectly bears its proportionate share of the expenses of any underlying Fidelity Central Funds.
I Expense ratios reflect operating expenses of the class. Expenses before reductions do not reflect amounts reimbursed by the investment adviser or reductions from brokerage service arrangements or reductions from other expense offset arrangements and do not represent the amount paid by the class during periods when reimbursements or reductions occur. Expenses net of fee waivers reflect expenses after reimbursement by the investment adviser but prior to reductions from brokerage service arrangements or other expense offset arrangements. Expenses net of all reductions represent the net expenses paid by the class.
J Annualized
K Amount does not include the portfolio activity of any underlying Fidelity Central Funds.
See accompanying notes which are an integral part of the financial statements.
Notes to Financial Statements (Unaudited)
For the period ended June 30, 2019
1. Organization.
VIP Energy Portfolio (the Fund) is a non-diversified fund of Variable Insurance Products Fund IV (the Trust) and is authorized to issue an unlimited number of shares. The Trust is registered under the Investment Company Act of 1940, as amended (the 1940 Act), as an open-end management investment company organized as a Massachusetts business trust. Shares of the Fund may only be purchased by insurance companies for the purpose of funding variable annuity or variable life insurance contracts. The Fund offers the following classes of shares: Initial Class shares, Service Class 2 shares and Investor Class shares. All classes have equal rights and voting privileges, except for matters affecting a single class.
2. Investments in Fidelity Central Funds.
The Fund invests in Fidelity Central Funds, which are open-end investment companies generally available only to other investment companies and accounts managed by the investment adviser and its affiliates. The Fund's Schedule of Investments lists each of the Fidelity Central Funds held as of period end, if any, as an investment of the Fund, but does not include the underlying holdings of each Fidelity Central Fund. As an Investing Fund, the Fund indirectly bears its proportionate share of the expenses of the underlying Fidelity Central Funds.
The Money Market Central Funds seek preservation of capital and current income and are managed by Fidelity Investments Money Management, Inc. (FIMM), an affiliate of the investment adviser. Annualized expenses of the Money Market Central Funds as of their most recent shareholder report date ranged from less than .005% to .01%.
A complete unaudited list of holdings for each Fidelity Central Fund is available upon request or at the Securities and Exchange Commission (the SEC) website at www.sec.gov. In addition, the financial statements of the Fidelity Central Funds are available on the SEC website or upon request.
3. Significant Accounting Policies.
The Fund is an investment company and applies the accounting and reporting guidance of the Financial Accounting Standards Board (FASB) Accounting Standards Codification Topic 946 Financial Services – Investments Companies. The financial statements have been prepared in conformity with accounting principles generally accepted in the United States of America (GAAP), which require management to make certain estimates and assumptions at the date of the financial statements. Actual results could differ from those estimates. Subsequent events, if any, through the date that the financial statements were issued have been evaluated in the preparation of the financial statements. The following summarizes the significant accounting policies of the Fund:
Investment Valuation. Investments are valued as of 4:00 p.m. Eastern time on the last calendar day of the period. The Board of Trustees (the Board) has delegated the day to day responsibility for the valuation of the Fund's investments to the Fair Value Committee (the Committee) established by the Fund's investment adviser. In accordance with valuation policies and procedures approved by the Board, the Fund attempts to obtain prices from one or more third party pricing vendors or brokers to value its investments. When current market prices, quotations or currency exchange rates are not readily available or reliable, investments will be fair valued in good faith by the Committee, in accordance with procedures adopted by the Board. Factors used in determining fair value vary by investment type and may include market or investment specific events. The frequency with which these procedures are used cannot be predicted and they may be utilized to a significant extent. The Committee oversees the Fund's valuation policies and procedures and reports to the Board on the Committee's activities and fair value determinations. The Board monitors the appropriateness of the procedures used in valuing the Fund's investments and ratifies the fair value determinations of the Committee.
The Fund categorizes the inputs to valuation techniques used to value its investments into a disclosure hierarchy consisting of three levels as shown below:
- Level 1 – quoted prices in active markets for identical investments
- Level 2 – other significant observable inputs (including quoted prices for similar investments, interest rates, prepayment speeds, etc.)
- Level 3 – unobservable inputs (including the Fund's own assumptions based on the best information available)
Valuation techniques used to value the Fund's investments by major category are as follows:
Equity securities, including restricted securities, for which market quotations are readily available, are valued at the last reported sale price or official closing price as reported by a third party pricing vendor on the primary market or exchange on which they are traded and are categorized as Level 1 in the hierarchy. In the event there were no sales during the day or closing prices are not available, securities are valued at the last quoted bid price or may be valued using the last available price and are generally categorized as Level 2 in the hierarchy. For foreign equity securities, when market or security specific events arise, comparisons to the valuation of American Depositary Receipts (ADRs), futures contracts, Exchange-Traded Funds (ETFs) and certain indexes as well as quoted prices for similar securities may be used and would be categorized as Level 2 in the hierarchy. For equity securities, including restricted securities, where observable inputs are limited, assumptions about market activity and risk are used and these securities may be categorized as Level 3 in the hierarchy.
Investments in open-end mutual funds, including the Fidelity Central Funds, are valued at their closing net asset value (NAV) each business day and are categorized as Level 1 in the hierarchy.
Changes in valuation techniques may result in transfers in or out of an assigned level within the disclosure hierarchy.
Foreign Currency. The Fund may use foreign currency contracts to facilitate transactions in foreign-denominated securities. Gains and losses from these transactions may arise from changes in the value of the foreign currency or if the counterparties do not perform under the contracts' terms.
Foreign-denominated assets, including investment securities, and liabilities are translated into U.S. dollars at the exchange rates at period end. Purchases and sales of investment securities, income and dividends received and expenses denominated in foreign currencies are translated into U.S. dollars at the exchange rate in effect on the transaction date.
The effects of exchange rate fluctuations on investments are included with the net realized and unrealized gain (loss) on investment securities. Other foreign currency transactions resulting in realized and unrealized gain (loss) are disclosed separately.
Investment Transactions and Income. For financial reporting purposes, the Fund's investment holdings and NAV include trades executed through the end of the last business day of the period. The NAV per share for processing shareholder transactions is calculated as of the close of business of the New York Stock Exchange (NYSE), normally 4:00 p.m. Eastern time and includes trades executed through the end of the prior business day. Gains and losses on securities sold are determined on the basis of identified cost and include proceeds received from litigation. Dividend income is recorded on the ex-dividend date, except for certain dividends from foreign securities where the ex-dividend date may have passed, which are recorded as soon as the Fund is informed of the ex-dividend date. Non-cash dividends included in dividend income, if any, are recorded at the fair market value of the securities received. Income and capital gain distributions from Fidelity Central Funds, if any, are recorded on the ex-dividend date. Certain distributions received by the Fund represent a return of capital or capital gain. The Fund determines the components of these distributions subsequent to the ex-dividend date, based upon receipt of tax filings or other correspondence relating to the underlying investment. These distributions are recorded as a reduction of cost of investments and/or as a realized gain. Investment income is recorded net of foreign taxes withheld where recovery of such taxes is uncertain.
Class Allocations and Expenses. Investment income, realized and unrealized capital gains and losses, common expenses of the Fund, and certain fund-level expense reductions, if any, are allocated daily on a pro-rata basis to each class based on the relative net assets of each class to the total net assets of the Fund. Each class differs with respect to transfer agent and distribution and service plan fees incurred. Certain expense reductions may also differ by class. For the reporting period, the allocated portion of income and expenses to each class as a percent of its average net assets may vary due to the timing of recording these transactions in relation to fluctuating net assets of the classes. Expenses directly attributable to a fund are charged to that fund. Expenses attributable to more than one fund are allocated among the respective funds on the basis of relative net assets or other appropriate methods. Expense estimates are accrued in the period to which they relate and adjustments are made when actual amounts are known.
Income Tax Information and Distributions to Shareholders. Each year, the Fund intends to qualify as a regulated investment company under Subchapter M of the Internal Revenue Code, including distributing substantially all of its taxable income and realized gains. As a result, no provision for U.S. Federal income taxes is required. The Fund files a U.S. federal tax return, in addition to state and local tax returns as required. The Fund's federal income tax returns are subject to examination by the Internal Revenue Service (IRS) for a period of three fiscal years after they are filed. State and local tax returns may be subject to examination for an additional fiscal year depending on the jurisdiction. Foreign taxes are provided for based on the Fund's understanding of the tax rules and rates that exist in the foreign markets in which it invests. The Fund is subject to a tax imposed on capital gains by certain countries in which it invests. An estimated deferred tax liability for net unrealized appreciation on the applicable securities is included in Other payables and accrued expenses on the Statement of Assets & Liabilities.
Distributions are declared and recorded on the ex-dividend date. Income and capital gain distributions are declared separately for each class. Income and capital gain distributions are determined in accordance with income tax regulations, which may differ from GAAP.
Capital accounts within the financial statements are adjusted for permanent book-tax differences. These adjustments have no impact on net assets or the results of operations. Capital accounts are not adjusted for temporary book-tax differences which will reverse in a subsequent period.
Book-tax differences are primarily due to foreign currency transactions, certain foreign taxes, passive foreign investment companies (PFIC), partnerships, capital loss carryforwards and losses deferred due to wash sales.
As of period end, the cost and unrealized appreciation (depreciation) in securities, and derivatives if applicable, for federal income tax purposes were as follows:
| Gross unrealized appreciation | $32,496,008 |
| Gross unrealized depreciation | (16,083,489) |
| Net unrealized appreciation (depreciation) | $16,412,519 |
| Tax cost | $206,903,506 |
Capital loss carryforwards are only available to offset future capital gains of the Fund to the extent provided by regulations and may be limited. Under the Regulated Investment Company Modernization Act of 2010 (the Act), the Fund is permitted to carry forward capital losses incurred in taxable years beginning after December 22, 2010 for an unlimited period and such capital losses are required to be used prior to any losses that expire. The capital loss carryforward information presented below, including any applicable limitation, is estimated as of prior fiscal period end and is subject to adjustment.
| No expiration | |
| Short-term | $(39,619,565) |
| Long-term | (20,022,037) |
| Total capital loss carryforward | $(59,641,602) |
Restricted Securities. The Fund may invest in securities that are subject to legal or contractual restrictions on resale. These securities generally may be resold in transactions exempt from registration or to the public if the securities are registered. Disposal of these securities may involve time-consuming negotiations and expense, and prompt sale at an acceptable price may be difficult. Information regarding restricted securities is included at the end of the Fund's Schedule of Investments.
4. Purchases and Sales of Investments.
Purchases and sales of securities, other than short-term securities, aggregated $72,969,034 and $86,857,593, respectively.
5. Fees and Other Transactions with Affiliates.
Management Fee. Fidelity SelectCo, LLC (the investment adviser) and its affiliates provide the Fund with investment management related services for which the Fund pays a monthly management fee. The management fee is the sum of an individual fund fee rate that is based on an annual rate of .30% of the Fund's average net assets and an annualized group fee rate that averaged .24% during the period. The group fee rate is based upon the average net assets of all the mutual funds advised by Fidelity Management & Research Company (FMR) and the investment adviser. The group fee rate decreases as assets under management increase and increases as assets under management decrease. For the reporting period, the total annualized management fee rate was .54% of the Fund's average net assets.
Distribution and Service Plan Fees. In accordance with Rule 12b-1 of the 1940 Act, the Fund has adopted a separate 12b-1 Plan for Service Class 2 shares. Service Class 2 pays Fidelity Distributors Corporation (FDC), an affiliate of the investment adviser, a service fee. For the period, the service fee is based on an annual rate of .25% of Service Class 2's average net assets.
For the period, total fees for Service Class 2, all of which was re-allowed to insurance companies for the distribution of shares and providing shareholder support services were $125,812.
Transfer Agent Fees. Fidelity Investments Institutional Operations Company, Inc. (FIIOC), an affiliate of the investment adviser, is the Fund's transfer, dividend disbursing, and shareholder servicing agent. FIIOC receives an asset-based fee with respect to each class. Each class pays a fee for transfer agent services, typesetting and printing and mailing of shareholder reports, excluding mailing of proxy statements, equal to an annual rate of class-level average net assets. The annual rate for Investor Class is .15% and the annual rate for all other classes is .07%. For the period, transfer agent fees for each class were as follows:
| Initial Class | $10,451 |
| Service Class 2 | 32,711 |
| Investor Class | 71,989 |
| | $115,151 |
Accounting and Security Lending Fees. Fidelity Service Company, Inc. (FSC), an affiliate of the investment adviser, maintains the Fund's accounting records. The accounting fee is based on the level of average net assets for each month. Prior to April 1, 2019, FSC had a separate agreement with the Fund for administration of the security lending program, based on the number and duration of lending transactions. For the period, the total fees paid for accounting and administration of securities lending were equivalent to an annualized rate of .04%.
Brokerage Commissions. The Fund placed a portion of its portfolio transactions with brokerage firms which are affiliates of the investment adviser. Brokerage commissions are included in net realized gain (loss) and change in net unrealized appreciation (depreciation) in the Statement of Operations. The commissions paid to these affiliated firms were $2,561 for the period.
Interfund Trades. The Fund may purchase from or sell securities to other Fidelity Funds under procedures adopted by the Board. The procedures have been designed to ensure these interfund trades are executed in accordance with Rule 17a-7 of the 1940 Act. Interfund trades are included within the respective purchases and sales amounts shown in the Purchases and Sales of Investments note.
6. Committed Line of Credit.
The Fund participates with other funds managed by the investment adviser or an affiliate in a $4.25 billion credit facility (the "line of credit") to be utilized for temporary or emergency purposes to fund shareholder redemptions or for other short-term liquidity purposes. The Fund has agreed to pay commitment fees on its pro-rata portion of the line of credit, which amounted to $353 and is reflected in Miscellaneous expenses on the Statement of Operations. During the period, the Fund did not borrow on this line of credit.
7. Security Lending.
The Fund lends portfolio securities from time to time in order to earn additional income. For equity securities, lending agents are used, including National Financial Services (NFS), an affiliate of the Fund. Pursuant to a securities lending agreement, NFS will receive a fee, which is capped at 9.9% of daily lending revenue, for its services as lending agent. The Fund may lend securities to certain qualified borrowers. On the settlement date of the loan, the Fund receives collateral (in the form of U.S. Treasury obligations, letters of credit and/or cash) against the loaned securities and maintains collateral in an amount not less than 100% of the market value of the loaned securities during the period of the loan. The market value of the loaned securities is determined at the close of business of the Fund and any additional required collateral is delivered to the Fund on the next business day. The Fund or borrower may terminate the loan at any time, and if the borrower defaults on its obligation to return the securities loaned because of insolvency or other reasons, the Fund may apply collateral received from the borrower against the obligation. The Fund may experience delays and costs in recovering the securities loaned. Any cash collateral received is invested in the Fidelity Securities Lending Cash Central Fund. The value of loaned securities and cash collateral at period end are disclosed on the Fund's Statement of Assets and Liabilities. Security lending income represents the income earned on investing cash collateral, less rebates paid to borrowers and any lending agent fees associated with the loan, plus any premium payments received for lending certain types of securities. Security lending income is presented in the Statement of Operations as a component of income from Fidelity Central Funds.
8. Expense Reductions.
Commissions paid to certain brokers with whom the investment adviser, or its affiliates, places trades on behalf of the Fund include an amount in addition to trade execution, which may be rebated back to the Fund to offset certain expenses. This amount totaled $6,336 for the period.
In addition, during the period the investment adviser reimbursed and/or waived a portion of fund-level operating expenses in the amount of $892.
9. Distributions to Shareholders.
Distributions to shareholders of each class were as follows:
| | Six months ended
June 30, 2019 | Year ended
December 31, 2018 |
| Distributions to shareholders | | |
| Initial Class | $156,896 | $415,166 |
| Service Class 2 | 437,170 | 975,446 |
| Investor Class | 469,336 | 1,196,977 |
| Total | $1,063,402 | $2,587,589 |
10. Share Transactions.
Transactions for each class of shares were as follows:
| | Shares | Shares | Dollars | Dollars |
| | Six months ended June 30, 2019 | Year ended December 31, 2018 | Six months ended June 30, 2019 | Year ended December 31, 2018 |
| Initial Class | | | | |
| Shares sold | 107,974 | 324,800 | $1,801,498 | $6,787,219 |
| Reinvestment of distributions | 9,855 | 26,589 | 156,896 | 415,166 |
| Shares redeemed | (255,162) | (586,486) | (4,241,048) | (11,645,264) |
| Net increase (decrease) | (137,333) | (235,097) | $(2,282,654) | $(4,442,879) |
| Service Class 2 | | | | |
| Shares sold | 274,689 | 786,615 | $4,532,167 | $15,562,471 |
| Reinvestment of distributions | 27,582 | 62,498 | 437,170 | 975,446 |
| Shares redeemed | (485,851) | (1,223,238) | (8,040,891) | (24,180,037) |
| Net increase (decrease) | (183,580) | (374,125) | $(3,071,554) | $(7,642,120) |
| Investor Class | | | | |
| Shares sold | 376,247 | 1,754,150 | $6,174,906 | $35,327,039 |
| Reinvestment of distributions | 29,537 | 76,937 | 469,336 | 1,196,977 |
| Shares redeemed | (988,483) | (1,701,620) | (16,341,872) | (33,194,181) |
| Net increase (decrease) | (582,699) | 129,467 | $(9,697,630) | $3,329,835 |
11. Other.
The Fund's organizational documents provide former and current trustees and officers with a limited indemnification against liabilities arising in connection with the performance of their duties to the Fund. In the normal course of business, the Fund may also enter into contracts that provide general indemnifications. The Fund's maximum exposure under these arrangements is unknown as this would be dependent on future claims that may be made against the Fund. The risk of material loss from such claims is considered remote.
At the end of the period, the investment adviser or its affiliates were the owners of record of 56% of the total outstanding shares of the Fund and one otherwise unaffiliated shareholder was the owner of record of 38% of the total outstanding shares of the Fund.
Shareholder Expense Example
As a shareholder of the Fund, you incur two types of costs: (1) transaction costs, and (2) ongoing costs, including management fees, distribution and/or service (12b-1) fees and other Fund expenses. This Example is intended to help you understand your ongoing costs (in dollars) of investing in the Fund and to compare these costs with the ongoing costs of investing in other mutual funds.
The Example is based on an investment of $1,000 invested at the beginning of the period and held for the entire period (January 1, 2019 to June 30, 2019).
Actual Expenses
The first line of the accompanying table for each class of the Fund provides information about actual account values and actual expenses. You may use the information in this line, together with the amount you invested, to estimate the expenses that you paid over the period. Simply divide your account value by $1,000.00 (for example, an $8,600 account value divided by $1,000.00 = 8.6), then multiply the result by the number in the first line for a class of the Fund under the heading entitled "Expenses Paid During Period" to estimate the expenses you paid on your account during this period. The estimate of expenses does not include any fees or other expenses of any variable annuity or variable life insurance product. If they were, the estimate of expenses you paid during the period would be higher, and your ending account value would be lower. In addition, the Fund, as a shareholder in the underlying Fidelity Central Funds, will indirectly bear its pro-rata share of the fees and expenses incurred by the underlying Fidelity Central Funds. These fees and expenses are not included in the Fund's annualized expense ratio used to calculate the expense estimate in the table below.
Hypothetical Example for Comparison Purposes
The second line of the accompanying table for each class of the Fund provides information about hypothetical account values and hypothetical expenses based on a Class' actual expense ratio and an assumed rate of return of 5% per year before expenses, which is not the Class' actual return. The hypothetical account values and expenses may not be used to estimate the actual ending account balance or expenses you paid for the period. You may use this information to compare the ongoing costs of investing in the Fund and other funds. To do so, compare this 5% hypothetical example with the 5% hypothetical examples that appear in the shareholder reports of the other funds. The estimate of expenses does not include any fees or other expenses of any variable annuity or variable life insurance product. If they were, the estimate of expenses you paid during the period would be higher, and your ending account value would be lower. In addition, the Fund, as a shareholder in the underlying Fidelity Central Funds, will indirectly bear its pro-rata share of the fees and expenses incurred by the underlying Fidelity Central Funds. These fees and expenses are not included in the Fund's annualized expense ratio used to calculate the expense estimate in the table below.
Please note that the expenses shown in the table are meant to highlight your ongoing costs only and do not reflect any transaction costs. Therefore, the second line of the table is useful in comparing ongoing costs only, and will not help you determine the relative total costs of owning different funds.
| | Annualized Expense Ratio-A | Beginning
Account Value
January 1, 2019 | Ending
Account Value
June 30, 2019 | Expenses Paid
During Period-B
January 1, 2019
to June 30, 2019 |
| Initial Class | .67% | | | |
| Actual | | $1,000.00 | $1,125.20 | $3.53 |
| Hypothetical-C | | $1,000.00 | $1,021.47 | $3.36 |
| Service Class 2 | .92% | | | |
| Actual | | $1,000.00 | $1,124.00 | $4.85 |
| Hypothetical-C | | $1,000.00 | $1,020.23 | $4.61 |
| Investor Class | .75% | | | |
| Actual | | $1,000.00 | $1,124.60 | $3.95 |
| Hypothetical-C | | $1,000.00 | $1,021.08 | $3.76 |
A Annualized expense ratio reflects expenses net of applicable fee waivers.
B Expenses are equal to each Class' annualized expense ratio, multiplied by the average account value over the period, multiplied by 181/365 (to reflect the one-half year period).
C 5% return per year before expenses
Board Approval of Investment Advisory Contracts and Management Fees
VIP Energy Portfolio
Each year, the Board of Trustees, including the Independent Trustees (together, the Board), votes on the renewal of the management contract with Fidelity SelectCo, LLC (SelectCo), an affiliate of Fidelity Management & Research Company (FMR), and the sub-advisory agreements with affiliates of FMR (together, the Advisory Contracts) for the fund. SelectCo and the sub-advisers are referred to herein as the Investment Advisers. The Board, assisted by the advice of fund counsel and Independent Trustees' counsel, requests and considers a broad range of information relevant to the renewal of the Advisory Contracts throughout the year.
The Board meets regularly and, at each of its meetings, covers an extensive agenda of topics and materials and considers factors that are relevant to its annual consideration of the renewal of the fund's Advisory Contracts, including the services and support provided to the fund and its shareholders. The Board has established various standing committees (Committees), each composed of and chaired by Independent Trustees with varying backgrounds, to which the Board has assigned specific subject matter responsibilities in order to enhance effective decision-making by the Board. The Board, acting directly and through its Committees, requests and receives information concerning the annual consideration of the renewal of the fund's Advisory Contracts. The Board also meets as needed to review matters specifically related to the Board's annual consideration of the renewal of the Advisory Contracts. Members of the Board may also meet with trustees of other Fidelity funds through joint ad hoc committees to discuss certain matters relevant to all of the Fidelity funds.
At its January 2019 meeting, the Board unanimously determined to renew the fund's Advisory Contracts. In reaching its determination, the Board considered all factors it believed relevant, including (i) the nature, extent, and quality of the services to be provided to the fund and its shareholders (including the investment performance of the fund); (ii) the competitiveness of the fund's management fee and total expense ratio relative to peer funds; (iii) the total costs of the services to be provided by and the profits to be realized by Fidelity from its relationships with the fund; and (iv) the extent to which, if any, economies of scale exist and would be realized as the fund grows, and whether any economies of scale are appropriately shared with fund shareholders.
In considering whether to renew the Advisory Contracts for the fund, the Board reached a determination, with the assistance of fund counsel and Independent Trustees' counsel and through the exercise of its business judgment, that the renewal of the Advisory Contracts was in the best interests of the fund and its shareholders and that the compensation payable under the Advisory Contracts was fair and reasonable. The Board's decision to renew the Advisory Contracts was not based on any single factor, but rather was based on a comprehensive consideration of all the information provided to the Board at its meetings throughout the year. The Board, in reaching its determination to renew the Advisory Contracts, was aware that shareholders of the fund have a broad range of investment choices available to them, including a wide choice among funds offered by Fidelity's competitors, and that the fund's shareholders, who have the opportunity to review and weigh the disclosure provided by the fund in its prospectus and other public disclosures, have chosen to invest in this fund, which is part of the Fidelity family of funds.
Nature, Extent, and Quality of Services Provided. The Board considered Fidelity's staffing as it relates to the fund, including the backgrounds of investment personnel of Fidelity, and also considered the fund's investment objective, strategies, and related investment philosophy. The Independent Trustees also had discussions with senior management of Fidelity's investment operations and investment groups. The Board considered the structure of the investment personnel compensation program and whether this structure provides appropriate incentives to act in the best interests of the fund. Additionally, the Board considered the portfolio managers' investments, if any, in the funds that they manage.
Resources Dedicated to Investment Management and Support Services. The Board and the Fund Oversight and Research Committees reviewed the general qualifications and capabilities of Fidelity's investment staff, including its size, education, experience, and resources, as well as Fidelity's approach to recruiting, training, managing, and compensating investment personnel. The Board noted that Fidelity has continued to increase the resources devoted to non-U.S. offices, including expansion of Fidelity's global investment organization. The Board also noted that Fidelity's analysts have extensive resources, tools and capabilities that allow them to conduct sophisticated quantitative and fundamental analysis, as well as credit analysis of issuers, counterparties and guarantors. Further, the Board considered that Fidelity's investment professionals have sufficient access to global information and data so as to provide competitive investment results over time, and that those professionals also have access to sophisticated tools that permit them to assess portfolio construction and risk and performance attribution characteristics continuously, as well as to transmit new information and research conclusions rapidly around the world. Additionally, in its deliberations, the Board considered Fidelity's trading, risk management, compliance, and technology and operations capabilities and resources, which are integral parts of the investment management process.
Shareholder and Administrative Services. The Board considered (i) the nature, extent, quality, and cost of advisory, administrative, and shareholder services performed by the Investment Advisers and their affiliates under the Advisory Contracts and under separate agreements covering transfer agency, pricing and bookkeeping, and securities lending services for the fund; (ii) the nature and extent of the supervision of third party service providers, principally custodians, subcustodians, and pricing vendors; and (iii) the resources devoted to, and the record of compliance with, the fund's compliance policies and procedures. The Board also reviewed the allocation of fund brokerage, including allocations to brokers affiliated with the Investment Advisers, the use of brokerage commissions to pay fund expenses, and the use of "soft" commission dollars to pay for research services.
The Board noted that the growth of fund assets over time across the complex allows Fidelity to reinvest in the development of services designed to enhance the value and convenience of the Fidelity funds as investment vehicles. These services include 24-hour access to account information and market information through telephone representatives and over the Internet, investor education materials and asset allocation tools, and the expanded availability of Fidelity Investor Centers.
The Board noted that it and the boards of certain other Fidelity funds had formed an ad hoc Committee on Transfer Agency Fees to review the variety of transfer agency fee structures throughout the industry and Fidelity's competitive positioning with respect to industry participants.
Investment in a Large Fund Family. The Board considered the benefits to shareholders of investing in a Fidelity fund, including the benefits of investing in a fund that is part of a large family of funds offering a variety of investment disciplines and providing a large variety of mutual fund investor services. The Board noted that Fidelity had taken, or had made recommendations that resulted in the Fidelity funds taking, a number of actions over the previous year that benefited particular funds, including: (i) continuing to dedicate additional resources to Fidelity's investment research process, which includes meetings with management of issuers of securities in which the funds invest, and to the support of the senior management team that oversees asset management; (ii) continuing efforts to enhance Fidelity's global research capabilities; (iii) launching new funds and making other enhancements to meet client needs; (iv) launching new share classes of existing funds; (v) eliminating purchase minimums and broadening eligibility requirements for certain funds and share classes; (vi) reducing management fees and total expenses for certain growth equity funds and index funds; (vii) lowering expense caps for certain existing funds and classes, and converting certain voluntary expense caps to contractual caps, to reduce expenses borne by shareholders; (viii) eliminating short-term redemption fees for funds that had such fees; (ix) rationalizing product lines and gaining increased efficiencies from fund mergers and share class consolidations; (x) continuing to develop, acquire and implement systems and technology to improve services to the funds and shareholders, strengthen information security, and increase efficiency; and (xi) continuing to implement enhancements to further strengthen Fidelity's product line to increase investors' probability of success in achieving their investment goals, including retirement income goals.
Investment Performance. The Board considered whether the fund has operated in accordance with its investment objective, as well as its record of compliance with its investment restrictions and its performance history.
The Board took into account discussions that occur at Board meetings throughout the year with representatives of the Investment Advisers about fund investment performance. In this regard the Board noted that as part of regularly scheduled fund reviews and other reports to the Board on fund performance, the Board considers annualized return information for the fund for different time periods, measured against an appropriate securities market index ("benchmark index"). In its evaluation of fund investment performance, the Board gave particular attention to information indicating changes in performance of certain Fidelity funds for specific time periods and discussed with the Investment Advisers the reasons for any overperformance or underperformance.
In addition to reviewing absolute and relative fund performance, the Independent Trustees periodically consider the appropriateness of fund performance metrics in evaluating the results achieved. In general, the Independent Trustees believe that fund performance should be evaluated based on net performance (after fees and expenses) of both the highest performing and lowest performing fund share classes, where applicable, compared to appropriate benchmark indices, over appropriate time periods that may include full market cycles, taking into account relevant factors including the following: general market conditions; issuer-specific information; and fund cash flows and other factors.
The Independent Trustees recognize that shareholders evaluate performance on a net basis over their own holding periods, for which one-, three-, and five-year periods are often used as a proxy. For this reason, the performance information reviewed by the Board also included net cumulative total return information for the fund and an appropriate benchmark index for the most recent one-, three-, and five-year periods ended June 30, 2018, as shown below.
VIP Energy Portfolio
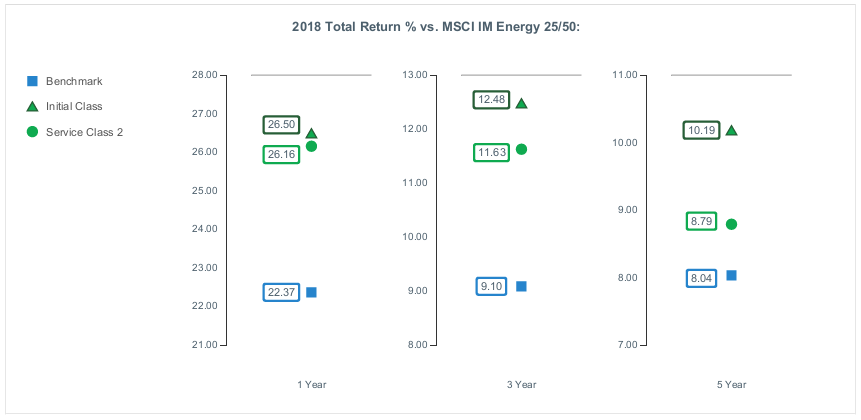
Based on its review, the Board concluded that the nature, extent, and quality of services provided to the fund under the Advisory Contracts should continue to benefit the shareholders of the fund.
Competitiveness of Management Fee and Total Expense Ratio. The Board considered the fund's management fee and total expense ratio compared to "mapped groups" of competitive funds and classes created for the purpose of facilitating the Trustees' competitive analysis of management fees and total expenses. Fidelity creates "mapped groups" by combining similar Lipper investment objective categories that have comparable investment mandates. For this purpose, all sector focused equity variable annuity funds are grouped in the same mapped group. Combining Lipper investment objective categories aids the Board's management fee and total expense ratio comparisons by broadening the competitive group used for comparison.
Management Fee. The Board considered two proprietary management fee comparisons for the 12-month periods ended June 30 shown in basis points (BP) in the chart below. The group of Lipper funds used by the Board for management fee comparisons is referred to below as the "Total Mapped Group." The Total Mapped Group comparison focuses on a fund's standing in terms of gross management fees before expense reimbursements or caps relative to the total universe of funds with comparable investment mandates (i.e., sector equities), regardless of whether their management fee structures also are comparable. Funds with comparable management fee structures have similar management fee contractual arrangements (
e.g., flat rate charged for advisory services, all-inclusive fee rate,
etc.). "TMG %" represents the percentage of funds in the Total Mapped Group that had management fees that were lower than the fund's. For example, a hypothetical TMG % of 20% would mean that 80% of the funds in the Total Mapped Group had higher, and 20% had lower, management fees than the fund. The fund's actual TMG %s and the number of funds in the Total Mapped Group are in the chart below. The "Asset-Size Peer Group" (ASPG) comparison focuses on a fund's standing relative to a subset of non-Fidelity funds within the Total Mapped Group that are similar in size and management fee structure. For example, if a fund is in the first quartile of the ASPG, the fund's management fee ranks in the least expensive or lowest 25% of funds in the ASPG. The ASPG represents at least 15% of the funds in the Total Mapped Group with comparable asset size and management fee structures, subject to a minimum of 50 funds (or all funds in the Total Mapped Group if fewer than 50). Additional information, such as the ASPG quartile in which the fund's management fee rate ranked, is also included in the chart and was considered by the Board.
VIP Energy Portfolio

The Board noted that the fund's management fee rate ranked below the median of its Total Mapped Group and below the median of its ASPG for the 12-month period ended June 30, 2018.
The Board noted that it and the boards of other Fidelity funds formed an ad hoc Committee on Group Fee, which meets periodically, to conduct an in-depth review of the "group fee" component of the management fee of funds with such management fee structures. The Committee's focus included the mechanics of the group fee, the competitive landscape of group fee structures, Fidelity funds with no group fee component and investment products not included in group fee assets. The Board also considered that, for funds subject to the group fee, FMR agreed to voluntarily waive fees over a specified period of time in amounts designed to account for assets converted from certain funds to certain collective investment trusts.
Based on its review, the Board concluded that the fund's management fee is fair and reasonable in light of the services that the fund receives and the other factors considered.
Total Expense Ratio. In its review of each class's total expense ratio, the Board considered the fund's management fee rate as well as other fund or class expenses, as applicable, such as transfer agent fees, pricing and bookkeeping fees, fund-paid 12b-1 fees, and custodial, legal, and audit fees. The Board also noted that Fidelity may agree to waive fees and expenses from time to time, and the extent to which, if any, it has done so for the fund. As part of its review, the Board also considered the current and historical total expense ratios of each class of the fund compared to competitive fund median expenses. Each class of the fund is compared to those funds and classes in the Total Mapped Group (used by the Board for management fee comparisons) that have a similar sales load structure.
The Board noted that the total expense ratio of each class ranked below the competitive median for the 12-month period ended June 30, 2018.
Fees Charged to Other Fidelity Clients. The Board also considered Fidelity fee structures and other information with respect to clients of Fidelity, such as other funds advised or subadvised by Fidelity, pension plan clients, and other institutional clients with similar mandates. The Board noted that a joint ad hoc committee created by it and the boards of other Fidelity funds periodically reviews and compares Fidelity's institutional investment advisory business with its business of providing services to the Fidelity funds, and also noted the most recent findings of the committee. The Board noted that the committee's review included a consideration of the differences in services provided, fees charged, and costs incurred, as well as competition in the markets serving the different categories of clients.
Based on its review of total expense ratios and fees charged to other Fidelity clients, the Board concluded that the total expense ratio of each class of the fund was reasonable in light of the services that the fund and its shareholders receive and the other factors considered.
Costs of the Services and Profitability. The Board considered the revenues earned and the expenses incurred by Fidelity in conducting the business of developing, marketing, distributing, managing, administering and servicing the fund and servicing the fund's shareholders. The Board also considered the level of Fidelity's profits in respect of all the Fidelity funds.
On an annual basis, Fidelity presents to the Board information about the profitability of its relationships with the fund. Fidelity calculates profitability information for each fund, as well as aggregate profitability information for groups of Fidelity funds and all Fidelity funds, using a series of detailed revenue and cost allocation methodologies which originate with the books and records of Fidelity on which Fidelity's audited financial statements are based. The Audit Committee of the Board reviews any significant changes from the prior year's methodologies.
PricewaterhouseCoopers LLP (PwC), auditor to Fidelity and certain Fidelity funds, has been engaged annually by the Board as part of the Board's assessment of Fidelity's profitability analysis. PwC's engagement includes the review and assessment of the methodologies used by Fidelity in determining the revenues and expenses attributable to Fidelity's mutual fund business, and completion of agreed-upon procedures in respect of the mathematical accuracy of the fund profitability information and its conformity to established allocation methodologies. After considering PwC's reports issued under the engagement and information provided by Fidelity, the Board concluded that while other allocation methods may also be reasonable, Fidelity's profitability methodologies are reasonable in all material respects.
The Board also reviewed Fidelity's non-fund businesses and potential indirect benefits such businesses may have received as a result of their association with Fidelity's mutual fund business (i.e., fall-out benefits) as well as cases where Fidelity's affiliates may benefit from the fund's business. The Board noted that changes to fall-out benefits year-over-year reflect business developments at Fidelity's various businesses.
The Board considered the costs of the services provided by and the profits realized by Fidelity in connection with the operation of the fund and was satisfied that the profitability was not excessive.
Economies of Scale. The Board considered whether there have been economies of scale in respect of the management of the Fidelity funds, whether the Fidelity funds (including the fund) have appropriately benefited from any such economies of scale, and whether there is potential for realization of any further economies of scale. The Board considered the extent to which the fund will benefit from economies of scale as assets grow through increased services to the fund, through waivers or reimbursements, or through fee or expense ratio reductions. The Board also noted that a committee (the Economies of Scale Committee) created by it and the boards of other Fidelity funds periodically analyzes whether Fidelity attains economies of scale in respect of the management and servicing of the Fidelity funds, whether the Fidelity funds have appropriately benefited from such economies of scale, and whether there is potential for realization of any further economies of scale.
The Board recognized that the fund's management contract incorporates a "group fee" structure, which provides for lower group fee rates as total group assets increase, and for higher group fee rates as total group assets decrease (with "group assets" defined to include fund assets under SelectCo's management plus assets under FMR's management). SelectCo calculates the group fee rates based on a tiered asset "breakpoint" schedule that varies based on asset class. The Board considered that the group fee is designed to deliver the benefits of economies of scale to fund shareholders when total group assets increase, even if assets of any particular fund are unchanged or have declined, because some portion of Fidelity's costs are attributable to services provided to all Fidelity funds, and all funds benefit if those costs can be allocated among more assets. The Board concluded that, given the group fee structure, fund shareholders will benefit from lower management fees as group assets increase at the fund complex level, regardless of whether Fidelity achieves any such economies of scale.
The Board concluded, taking into account the analysis of the Economies of Scale Committee, that economies of scale, if any, are being appropriately shared between fund shareholders and Fidelity.
Additional Information Requested by the Board. In order to develop fully the factual basis for consideration of the Fidelity funds' advisory contracts, the Board requested and received additional information on certain topics, including: (i) fund performance trends, in particular the underperformance of certain funds, and Fidelity's long-term strategies for certain funds; (ii) Fidelity's fund profitability methodology, profitability trends for certain funds, and the impact of certain factors on fund profitability results; (iii) metrics for evaluating index fund and ETF performance and information about ETF trading characteristics; (iv) the methodology with respect to the evaluation of competitive fund data and peer group classifications and fee comparisons; (v) the expense structures for different funds and classes; (vi) information regarding other accounts managed by Fidelity, including collective investment trusts; and (vii) Fidelity's philosophies and strategies for evaluating funds and classes with lower or declining asset levels.
Based on its evaluation of all of the conclusions noted above, and after considering all factors it believed relevant, the Board concluded that the advisory fee arrangements are fair and reasonable, and that the fund's Advisory Contracts should be renewed.
VNRIC-SANN-0819
1.817382.114
Fidelity® Variable Insurance Products: Health Care Portfolio
Semi-Annual Report June 30, 2019 |
|
Beginning on January 1, 2021, as permitted by regulations adopted by the Securities and Exchange Commission, and if your insurance carrier elects to participate, you may not be receiving paper copies of the Fund’s shareholder reports from the insurance company that offers your variable insurance product unless you specifically request paper copies from your financial professional or the administrator of your variable insurance product. Instead, the reports will be made available on a website, and you will be notified by mail each time a report is posted and provided with a website link to access the report.
If you already elected to receive shareholder reports electronically, you will not be affected by this change and you need not take any action. You may elect to receive shareholder reports and other communications from the Fund electronically, by contacting your financial professional or the administrator of your variable insurance product. If you own a Fidelity-administered variable insurance product, please visit fidelity.com/mailpreferences to make your election or call 1-800-343-3548.
You may elect to receive all future reports in paper free of charge. If you wish to continue receiving paper copies of your shareholder reports, you may contact your financial professional or the administrator of your variable insurance product. If you own a Fidelity-administered variable insurance product, please visit fidelity.com/mailpreferences to make your election or call 1-800-343-3548. Your election to receive reports in paper will apply to all funds available under your variable insurance product.
Contents
To view a fund's proxy voting guidelines and proxy voting record for the 12-month period ended June 30, visit http://www.fidelity.com/proxyvotingresults or visit the Securities and Exchange Commission's (SEC) web site at http://www.sec.gov.
You may also call 1-877-208-0098 to request a free copy of the proxy voting guidelines.
Fidelity® Variable Insurance Products are separate account options which are purchased through a variable insurance contract.
Standard & Poor's, S&P and S&P 500 are registered service marks of The McGraw-Hill Companies, Inc. and have been licensed for use by Fidelity Distributors Corporation.
Other third-party marks appearing herein are the property of their respective owners.
All other marks appearing herein are registered or unregistered trademarks or service marks of FMR LLC or an affiliated company. © 2019 FMR LLC. All rights reserved.
This report and the financial statements contained herein are submitted for the general information of the shareholders of the Fund. This report is not authorized for distribution to prospective investors in the Fund unless preceded or accompanied by an effective prospectus.
A fund files its complete schedule of portfolio holdings with the SEC for the first and third quarters of each fiscal year on Form N-PORT. Forms N-PORT are available on the SEC’s web site at http://www.sec.gov. A fund's Forms N-PORT may be reviewed and copied at the SEC’s Public Reference Room in Washington, DC. Information regarding the operation of the SEC's Public Reference Room may be obtained by calling 1-800-SEC-0330.
For a complete list of a fund's portfolio holdings, view the most recent holdings listing, semiannual report, or annual report on Fidelity's web site at http://www.fidelity.com, http://www.institutional.fidelity.com, or http://www.401k.com, as applicable.
NOT FDIC INSURED •MAY LOSE VALUE •NO BANK GUARANTEE
Neither the Fund nor Fidelity Distributors Corporation is a bank.
Investment Summary (Unaudited)
Top Ten Stocks as of June 30, 2019
| | % of fund's net assets |
| UnitedHealth Group, Inc. | 8.1 |
| Boston Scientific Corp. | 6.9 |
| Becton, Dickinson & Co. | 6.2 |
| Roche Holding AG (participation certificate) | 5.1 |
| AstraZeneca PLC (United Kingdom) | 4.7 |
| Vertex Pharmaceuticals, Inc. | 4.1 |
| Stryker Corp. | 3.4 |
| Cigna Corp. | 3.4 |
| Humana, Inc. | 3.3 |
| Alexion Pharmaceuticals, Inc. | 3.1 |
| | 48.3 |
Top Industries (% of fund's net assets)
| As of June 30, 2019 |
| | Health Care Equipment & Supplies | 28.0% |
| | Biotechnology | 26.1% |
| | Health Care Providers & Services | 24.2% |
| | Pharmaceuticals | 18.1% |
| | Life Sciences Tools & Services | 1.5% |
| | All Others* | 2.1% |

* Includes short-term investments and net other assets (liabilities).
Schedule of Investments June 30, 2019 (Unaudited)
Showing Percentage of Net Assets
| Common Stocks - 97.9% | | | |
| | | Shares | Value |
| Biotechnology - 25.7% | | | |
| Biotechnology - 25.7% | | | |
| AbbVie, Inc. | | 47,668 | $3,466,417 |
| Abeona Therapeutics, Inc. (a) | | 160,000 | 764,800 |
| Acceleron Pharma, Inc. (a) | | 90,000 | 3,697,200 |
| Acorda Therapeutics, Inc. (a) | | 130,000 | 997,100 |
| Alexion Pharmaceuticals, Inc. (a) | | 196,000 | 25,672,080 |
| Allakos, Inc. (a)(b) | | 86,000 | 3,726,380 |
| Allogene Therapeutics, Inc. (b) | | 40,000 | 1,074,000 |
| Alnylam Pharmaceuticals, Inc. (a) | | 64,000 | 4,643,840 |
| Amgen, Inc. | | 34,000 | 6,265,520 |
| Amicus Therapeutics, Inc. (a) | | 230,000 | 2,870,400 |
| AnaptysBio, Inc. (a) | | 66,013 | 3,724,453 |
| Argenx SE ADR (a) | | 74,000 | 10,476,920 |
| Array BioPharma, Inc. (a) | | 220,000 | 10,192,600 |
| Ascendis Pharma A/S sponsored ADR (a) | | 88,000 | 10,133,200 |
| Atara Biotherapeutics, Inc. (a) | | 80,000 | 1,608,800 |
| BeiGene Ltd. ADR (a) | | 50,000 | 6,197,500 |
| bluebird bio, Inc. (a) | | 35,763 | 4,549,054 |
| Blueprint Medicines Corp. (a) | | 100,000 | 9,433,000 |
| Cellectis SA sponsored ADR (a) | | 96,000 | 1,497,600 |
| FibroGen, Inc. (a) | | 142,000 | 6,415,560 |
| GlycoMimetics, Inc. (a) | | 130,000 | 1,549,600 |
| Gritstone Oncology, Inc. | | 60,000 | 668,400 |
| Immunomedics, Inc. (a)(b) | | 180,000 | 2,496,600 |
| Insmed, Inc. (a) | | 200,000 | 5,120,000 |
| Intercept Pharmaceuticals, Inc. (a) | | 44,000 | 3,501,080 |
| Kura Oncology, Inc. (a) | | 97,340 | 1,916,625 |
| Morphosys AG (a) | | 24,000 | 2,304,674 |
| Neurocrine Biosciences, Inc. (a) | | 100,000 | 8,443,000 |
| Principia Biopharma, Inc. | | 74,900 | 2,485,931 |
| Sage Therapeutics, Inc. (a) | | 11,400 | 2,087,226 |
| Sarepta Therapeutics, Inc. (a) | | 140,000 | 21,273,000 |
| Scholar Rock Holding Corp. (a) | | 10,200 | 161,772 |
| uniQure B.V. (a) | | 46,000 | 3,594,900 |
| Vertex Pharmaceuticals, Inc. (a) | | 188,000 | 34,475,440 |
| Viking Therapeutics, Inc. (a)(b) | | 140,000 | 1,162,000 |
| Xencor, Inc. (a) | | 139,100 | 5,693,363 |
| Zymeworks, Inc. (a) | | 95,707 | 2,105,554 |
| | | | 216,445,589 |
| Diversified Consumer Services - 0.2% | | | |
| Specialized Consumer Services - 0.2% | | | |
| Carriage Services, Inc. | | 80,759 | 1,535,229 |
| Health Care Equipment & Supplies - 28.0% | | | |
| Health Care Equipment - 28.0% | | | |
| Atricure, Inc. (a) | | 179,900 | 5,368,216 |
| Becton, Dickinson & Co. | | 208,000 | 52,418,080 |
| Boston Scientific Corp. (a) | | 1,340,000 | 57,593,200 |
| Danaher Corp. | | 97,000 | 13,863,240 |
| Hologic, Inc. (a) | | 210,000 | 10,084,200 |
| Insulet Corp. (a) | | 120,000 | 14,325,600 |
| Intuitive Surgical, Inc. (a) | | 40,000 | 20,982,000 |
| Masimo Corp. (a) | | 72,000 | 10,715,040 |
| Penumbra, Inc. (a) | | 80,000 | 12,800,000 |
| Stryker Corp. | | 140,000 | 28,781,200 |
| Wright Medical Group NV (a) | | 300,000 | 8,946,000 |
| | | | 235,876,776 |
| Health Care Providers & Services - 23.9% | | | |
| Health Care Distributors & Services - 0.9% | | | |
| Covetrus, Inc. (a) | | 120,000 | 2,935,200 |
| EBOS Group Ltd. | | 280,000 | 4,354,608 |
| | | | 7,289,808 |
| Health Care Facilities - 2.4% | | | |
| HCA Holdings, Inc. | | 150,000 | 20,275,500 |
| Health Care Services - 4.1% | | | |
| Cigna Corp. | | 180,000 | 28,359,000 |
| G1 Therapeutics, Inc. (a) | | 112,000 | 3,433,920 |
| Premier, Inc. (a) | | 75,000 | 2,933,250 |
| | | | 34,726,170 |
| Managed Health Care - 16.5% | | | |
| Centene Corp. (a) | | 280,000 | 14,683,200 |
| Humana, Inc. | | 104,000 | 27,591,200 |
| Molina Healthcare, Inc. (a) | | 66,000 | 9,447,240 |
| Notre Dame Intermedica Participacoes SA | | 550,000 | 5,775,075 |
| UnitedHealth Group, Inc. | | 280,000 | 68,322,800 |
| Wellcare Health Plans, Inc. (a) | | 44,000 | 12,543,080 |
| | | | 138,362,595 |
|
| TOTAL HEALTH CARE PROVIDERS & SERVICES | | | 200,654,073 |
|
| Health Care Technology - 0.1% | | | |
| Health Care Technology - 0.1% | | | |
| Castlight Health, Inc. (a) | | 103,400 | 333,982 |
| Castlight Health, Inc. Class B (a) | | 200,000 | 646,000 |
| | | | 979,982 |
| Life Sciences Tools & Services - 1.5% | | | |
| Life Sciences Tools & Services - 1.5% | | | |
| Adaptive Biotechnologies Corp. | | 3,200 | 154,560 |
| Avantor, Inc. | | 304,000 | 5,803,360 |
| Lonza Group AG | | 19,000 | 6,414,264 |
| | | | 12,372,184 |
| Pharmaceuticals - 17.9% | | | |
| Pharmaceuticals - 17.9% | | | |
| Allergan PLC | | 105,000 | 17,580,150 |
| Amneal Pharmaceuticals, Inc. (a) | | 40,000 | 286,800 |
| Amneal Pharmaceuticals, Inc. (a)(c) | | 178,378 | 1,278,970 |
| AstraZeneca PLC (United Kingdom) | | 480,000 | 39,240,814 |
| Bristol-Myers Squibb Co. | | 160,000 | 7,256,000 |
| Dechra Pharmaceuticals PLC | | 180,000 | 6,277,109 |
| Eli Lilly & Co. | | 80,000 | 8,863,200 |
| MyoKardia, Inc. (a) | | 66,116 | 3,315,056 |
| Nektar Therapeutics (a) | | 140,000 | 4,981,200 |
| Recordati SpA | | 70,000 | 2,918,026 |
| Roche Holding AG (participation certificate) | | 152,000 | 42,740,555 |
| RPI International Holdings LP (a)(c)(d) | | 21,133 | 3,233,349 |
| The Medicines Company (a)(b) | | 130,000 | 4,741,100 |
| Theravance Biopharma, Inc. (a)(b) | | 155,000 | 2,531,150 |
| Turning Point Therapeutics, Inc. | | 5,600 | 227,920 |
| Zogenix, Inc. (a) | | 105,000 | 5,016,900 |
| | | | 150,488,299 |
| Software - 0.6% | | | |
| Application Software - 0.6% | | | |
| Benefitfocus, Inc. (a)(b) | | 180,000 | 4,887,000 |
| TOTAL COMMON STOCKS | | | |
| (Cost $576,658,542) | | | 823,239,132 |
|
| Convertible Preferred Stocks - 1.1% | | | |
| Biotechnology - 0.4% | | | |
| Biotechnology - 0.4% | | | |
| BioNTech AG: | | | |
| Series A (a)(c)(d) | | 6,948 | 2,263,977 |
| Series A (d) | | 3,393 | 1,105,595 |
| Generation Bio Series B (a)(c)(d) | | 14,000 | 127,260 |
| | | | 3,496,832 |
| Health Care Providers & Services - 0.3% | | | |
| Health Care Services - 0.3% | | | |
| 1Life Healthcare, Inc. Series G (a)(c)(d) | | 181,172 | 2,304,508 |
| Pharmaceuticals - 0.2% | | | |
| Pharmaceuticals - 0.2% | | | |
| Harmony Biosciences II, Inc. Series A (a)(c)(d) | | 1,195,827 | 1,195,827 |
| Software - 0.2% | | | |
| Application Software - 0.2% | | | |
| Outset Medical, Inc.: | | | |
| Series C (a)(c)(d) | | 308,701 | 960,060 |
| Series D (c)(d) | | 321,544 | 1,000,002 |
| | | | 1,960,062 |
| TOTAL CONVERTIBLE PREFERRED STOCKS | | | |
| (Cost $6,814,308) | | | 8,957,229 |
|
| Money Market Funds - 3.0% | | | |
| Fidelity Cash Central Fund 2.42% (e) | | 12,214,641 | 12,217,084 |
| Fidelity Securities Lending Cash Central Fund 2.42% (e)(f) | | 12,983,169 | 12,984,467 |
| TOTAL MONEY MARKET FUNDS | | | |
| (Cost $25,201,551) | | | 25,201,551 |
| TOTAL INVESTMENT IN SECURITIES - 102.0% | | | |
| (Cost $608,674,401) | | | 857,397,912 |
| NET OTHER ASSETS (LIABILITIES) - (2.0)% | | | (16,829,801) |
| NET ASSETS - 100% | | | $840,568,111 |
Legend
(a) Non-income producing
(b) Security or a portion of the security is on loan at period end.
(c) Restricted securities - Investment in securities not registered under the Securities Act of 1933 (excluding 144A issues). At the end of the period, the value of restricted securities (excluding 144A issues) amounted to $12,363,953 or 1.5% of net assets.
(d) Level 3 security
(e) Affiliated fund that is generally available only to investment companies and other accounts managed by Fidelity Investments. The rate quoted is the annualized seven-day yield of the fund at period end. A complete unaudited listing of the fund's holdings as of its most recent quarter end is available upon request. In addition, each Fidelity Central Fund's financial statements are available on the SEC's website or upon request.
(f) Investment made with cash collateral received from securities on loan.
Additional information on each restricted holding is as follows:
| Security | Acquisition Date | Acquisition Cost |
| 1Life Healthcare, Inc. Series G | 4/10/14 | $1,193,163 |
| Amneal Pharmaceuticals, Inc. | 5/4/18 | $3,255,399 |
| BioNTech AG Series A | 12/29/17 | $1,521,672 |
| Generation Bio Series B | 2/21/18 | $128,040 |
| Harmony Biosciences II, Inc. Series A | 9/22/17 | $1,195,827 |
| Outset Medical, Inc. Series C | 4/19/17 | $799,999 |
| Outset Medical, Inc. Series D | 8/20/18 | $1,000,002 |
| RPI International Holdings LP | 5/21/15 - 3/23/16 | $2,801,500 |
Affiliated Central Funds
Information regarding fiscal year to date income earned by the Fund from investments in Fidelity Central Funds is as follows:
| Fund | Income earned |
| Fidelity Cash Central Fund | $69,750 |
| Fidelity Securities Lending Cash Central Fund | 66,793 |
| Total | $136,543 |
Amounts in the income column in the above table include any capital gain distributions from underlying funds, which are presented in the corresponding line-item in the Statement of Operations, if applicable. Amount for Fidelity Securities Lending Cash Central Fund represents securities lending income earned from the reinvestment of cash collateral from loaned securities, net of payments to and from borrowers of securities.
Investment Valuation
The following is a summary of the inputs used, as of June 30, 2019, involving the Fund's assets and liabilities carried at fair value. The inputs or methodology used for valuing securities may not be an indication of the risk associated with investing in those securities. For more information on valuation inputs, and their aggregation into the levels used below, please refer to the Investment Valuation section in the accompanying Notes to Financial Statements.
| | Valuation Inputs at Reporting Date: |
| Description | Total | Level 1 | Level 2 | Level 3 |
| Investments in Securities: | | | | |
| Common Stocks | $823,239,132 | $731,610,150 | $88,395,633 | $3,233,349 |
| Convertible Preferred Stocks | 8,957,229 | -- | -- | 8,957,229 |
| Money Market Funds | 25,201,551 | 25,201,551 | -- | -- |
| Total Investments in Securities: | $857,397,912 | $756,811,701 | $88,395,633 | $12,190,578 |
The following is a reconciliation of Investments in Securities for which Level 3 inputs were used in determining value:
| Investments in Securities: | |
| Convertible Preferred Stocks | |
| Beginning Balance | $ 8,513,641 |
| Total Realized Gain (Loss) | -- |
| Total Unrealized Gain (Loss) | 443,588 |
| Cost of Purchases | -- |
| Proceeds of Sales | -- |
| Amortization/Accretion | -- |
| Transfers in to Level 3 | -- |
| Transfers out of Level 3 | -- |
| Ending Balance | $ 8,957,229 |
| The change in unrealized gain (loss) for the period attributable to Level 3 securities held at June 30, 2019 | $ 443,588 |
| Other Investments in Securities | |
| Beginning Balance | $ 3,190,238 |
| Total Realized Gain (Loss) | -- |
| Total Unrealized Gain (Loss) | 43,111 |
| Cost of Purchases | -- |
| Proceeds of Sales | -- |
| Amortization/Accretion | -- |
| Transfers in to Level 3 | -- |
| Transfers out of Level 3 | -- |
| Ending Balance | $ 3,233,349 |
| The change in unrealized gain (loss) for the period attributable to Level 3 securities held at June 30, 2019 | $ 43,111 |
The information used in the above reconciliations represents fiscal year to date activity for any Investments in Securities identified as using Level 3 inputs at either the beginning or the end of the current fiscal period. Transfers in or out of Level 3 represent the beginning value of any Security or Instrument where a change in the pricing level occurred from the beginning to the end of the period. The cost of purchases and the proceeds of sales may include securities received or delivered through corporate actions or exchanges. Realized and unrealized gains (losses) disclosed in the reconciliations are included in Net Gain (Loss) on the Fund's Statement of Operations.
Other Information
Distribution of investments by country or territory of incorporation, as a percentage of Total Net Assets, is as follows (Unaudited):
| United States of America | 78.5% |
| Switzerland | 5.9% |
| United Kingdom | 5.4% |
| Netherlands | 2.8% |
| Ireland | 2.1% |
| Cayman Islands | 1.4% |
| Denmark | 1.2% |
| Others (Individually Less Than 1%) | 2.7% |
| | 100.0% |
See accompanying notes which are an integral part of the financial statements.
Financial Statements
Statement of Assets and Liabilities
| | | June 30, 2019 (Unaudited) |
| Assets | | |
Investment in securities, at value (including securities loaned of $12,857,197) — See accompanying schedule:
Unaffiliated issuers (cost $583,472,850) | $832,196,361 | |
| Fidelity Central Funds (cost $25,201,551) | 25,201,551 | |
| Total Investment in Securities (cost $608,674,401) | | $857,397,912 |
| Cash | | 52,834 |
| Receivable for investments sold | | 1,081,725 |
| Receivable for fund shares sold | | 55,735 |
| Dividends receivable | | 530,381 |
| Distributions receivable from Fidelity Central Funds | | 22,023 |
| Prepaid expenses | | 5,257 |
| Other receivables | | 6,637 |
| Total assets | | 859,152,504 |
| Liabilities | | |
| Payable for investments purchased | $4,567,664 | |
| Payable for fund shares redeemed | 519,780 | |
| Accrued management fee | 364,659 | |
| Distribution and service plan fees payable | 493 | |
| Other affiliated payables | 112,632 | |
| Other payables and accrued expenses | 40,978 | |
| Collateral on securities loaned | 12,978,187 | |
| Total liabilities | | 18,584,393 |
| Net Assets | | $840,568,111 |
| Net Assets consist of: | | |
| Paid in capital | | $581,973,697 |
| Total distributable earnings (loss) | | 258,594,414 |
| Net Assets | | $840,568,111 |
| Net Asset Value and Maximum Offering Price | | |
| Initial Class: | | |
| Net Asset Value, offering price and redemption price per share ($140,226,247 ÷ 4,780,140 shares) | | $29.34 |
| Service Class 2: | | |
| Net Asset Value, offering price and redemption price per share ($4,074,243 ÷ 138,950 shares) | | $29.32 |
| Investor Class: | | |
| Net Asset Value, offering price and redemption price per share ($696,267,621 ÷ 23,955,023 shares) | | $29.07 |
See accompanying notes which are an integral part of the financial statements.
Statement of Operations
| | | Six months ended June 30, 2019 (Unaudited) |
| Investment Income | | |
| Dividends | | $4,291,324 |
| Income from Fidelity Central Funds (including $66,793 from security lending) | | 136,543 |
| Total income | | 4,427,867 |
| Expenses | | |
| Management fee | $2,301,559 | |
| Transfer agent fees | 562,870 | |
| Distribution and service plan fees | 635 | |
| Accounting and security lending fees | 147,861 | |
| Custodian fees and expenses | 18,793 | |
| Independent trustees' fees and expenses | 2,080 | |
| Audit | 22,094 | |
| Legal | 1,825 | |
| Interest | 5,815 | |
| Miscellaneous | 3,683 | |
| Total expenses before reductions | 3,067,215 | |
| Expense reductions | (13,003) | |
| Total expenses after reductions | | 3,054,212 |
| Net investment income (loss) | | 1,373,655 |
| Realized and Unrealized Gain (Loss) | | |
| Net realized gain (loss) on: | | |
| Investment securities: | | |
| Unaffiliated issuers | 16,602,818 | |
| Fidelity Central Funds | 870 | |
| Foreign currency transactions | 3,491 | |
| Total net realized gain (loss) | | 16,607,179 |
| Change in net unrealized appreciation (depreciation) on: | | |
| Investment securities: | | |
| Unaffiliated issuers | 82,272,510 | |
| Assets and liabilities in foreign currencies | 9,246 | |
| Total change in net unrealized appreciation (depreciation) | | 82,281,756 |
| Net gain (loss) | | 98,888,935 |
| Net increase (decrease) in net assets resulting from operations | | $100,262,590 |
See accompanying notes which are an integral part of the financial statements.
Statement of Changes in Net Assets
| | Six months ended June 30, 2019 (Unaudited) | Year ended December 31, 2018 |
| Increase (Decrease) in Net Assets | | |
| Operations | | |
| Net investment income (loss) | $1,373,655 | $1,007,765 |
| Net realized gain (loss) | 16,607,179 | 60,295,929 |
| Change in net unrealized appreciation (depreciation) | 82,281,756 | (15,093,665) |
| Net increase (decrease) in net assets resulting from operations | 100,262,590 | 46,210,029 |
| Distributions to shareholders | (60,081,140) | (16,792,330) |
| Share transactions - net increase (decrease) | (12,750,346) | 69,663,281 |
| Total increase (decrease) in net assets | 27,431,104 | 99,080,980 |
| Net Assets | | |
| Beginning of period | 813,137,007 | 714,056,027 |
| End of period | $840,568,111 | $813,137,007 |
See accompanying notes which are an integral part of the financial statements.
Financial Highlights
VIP Health Care Portfolio Initial Class
| | Six months ended (Unaudited) June 30, | Years endedDecember 31, | | | | |
| | 2019 | 2018 | 2017 | 2016 | 2015 | 2014 |
| Selected Per–Share Data | | | | | | |
| Net asset value, beginning of period | $27.86 | $26.44 | $21.28 | $25.92 | $27.70 | $22.56 |
| Income from Investment Operations | | | | | | |
| Net investment income (loss)A | .06 | .06 | .07 | .04 | –B | (.02) |
| Net realized and unrealized gain (loss) | 3.43 | 1.99 | 5.26 | (2.86) | 1.70 | 7.21 |
| Total from investment operations | 3.49 | 2.05 | 5.33 | (2.82) | 1.70 | 7.19 |
| Distributions from net investment income | (.01) | (.06) | (.07) | (.04) | – | – |
| Distributions from net realized gain | (2.00) | (.57) | (.10) | (1.78) | (3.49) | (2.06) |
| Total distributions | (2.01) | (.63) | (.17) | (1.82) | (3.49) | (2.06) |
| Redemption fees added to paid in capitalA | – | – | –B | –B | .01 | .01 |
| Net asset value, end of period | $29.34 | $27.86 | $26.44 | $21.28 | $25.92 | $27.70 |
| Total ReturnC,D,E | 12.81% | 7.86% | 25.05% | (10.43)% | 6.37% | 32.83% |
| Ratios to Average Net AssetsF,G | | | | | | |
| Expenses before reductions | .65%H | .65% | .67% | .67% | .66% | .67% |
| Expenses net of fee waivers, if any | .65%H | .65% | .67% | .67% | .66% | .67% |
| Expenses net of all reductions | .65%H | .64% | .66% | .66% | .65% | .66% |
| Net investment income (loss) | .39%H | .19% | .30% | .19% | - %I | (.07)% |
| Supplemental Data | | | | | | |
| Net assets, end of period (000 omitted) | $140,226 | $139,026 | $131,698 | $130,887 | $226,283 | $236,566 |
| Portfolio turnover rateJ | 39%H | 65% | 74% | 53% | 77% | 104% |
A Calculated based on average shares outstanding during the period.
B Amount represents less than $.005 per share.
C Total returns for periods of less than one year are not annualized.
D Total returns do not reflect charges attributable to your insurance company's separate account. Inclusion of these charges would reduce the total returns shown.
E Total returns would have been lower if certain expenses had not been reduced during the applicable periods shown.
F Fees and expenses of any underlying Fidelity Central Funds are not included in the Fund's expense ratio. The Fund indirectly bears its proportionate share of the expenses of any underlying Fidelity Central Funds.
G Expense ratios reflect operating expenses of the class. Expenses before reductions do not reflect amounts reimbursed by the investment adviser or reductions from brokerage service arrangements or reductions from other expense offset arrangements and do not represent the amount paid by the class during periods when reimbursements or reductions occur. Expenses net of fee waivers reflect expenses after reimbursement by the investment adviser but prior to reductions from brokerage service arrangements or other expense offset arrangements. Expenses net of all reductions represent the net expenses paid by the class.
H Annualized
I Amount represents less than .005%.
J Amount does not include the portfolio activity of any underlying Fidelity Central Funds.
See accompanying notes which are an integral part of the financial statements.
VIP Health Care Portfolio Service Class 2
| | Six months ended (Unaudited) June 30, |
| | 2019 A |
| Selected Per–Share Data | |
| Net asset value, beginning of period | $28.52 |
| Income from Investment Operations | |
| Net investment income (loss)B | –C |
| Net realized and unrealized gain (loss) | .80 |
| Total from investment operations | .80 |
| Distributions from net investment income | – |
| Distributions from net realized gain | – |
| Total distributions | – |
| Net asset value, end of period | $29.32 |
| Total ReturnD,E,F | 2.81% |
| Ratios to Average Net AssetsG,H | |
| Expenses before reductions | .91%I |
| Expenses net of fee waivers, if any | .91%I |
| Expenses net of all reductions | .91%I |
| Net investment income (loss) | .02%I |
| Supplemental Data | |
| Net assets, end of period (000 omitted) | $4,074 |
| Portfolio turnover rateJ | 39%I |
A For the period April 11, 2019 (commencement of sale of shares) to June 30, 2019.
B Calculated based on average shares outstanding during the period.
C Amount represents less than $.005 per share.
D Total returns for periods of less than one year are not annualized.
E Total returns do not reflect charges attributable to your insurance company's separate account. Inclusion of these charges would reduce the total returns shown.
F Total returns would have been lower if certain expenses had not been reduced during the applicable periods shown.
G Fees and expenses of any underlying Fidelity Central Funds are not included in the Fund's expense ratio. The Fund indirectly bears its proportionate share of the expenses of any underlying Fidelity Central Funds.
H Expense ratios reflect operating expenses of the class. Expenses before reductions do not reflect amounts reimbursed by the investment adviser or reductions from brokerage service arrangements or reductions from other expense offset arrangements and do not represent the amount paid by the class during periods when reimbursements or reductions occur. Expense ratios before reductions for start-up periods may not be representative of longer-term operating periods. Expenses net of fee waivers reflect expenses after reimbursement by the investment adviser but prior to reductions from brokerage service arrangements or other expense offset arrangements. Expenses net of all reductions represent the net expenses paid by the class.
I Annualized
J Amount does not include the portfolio activity of any underlying Fidelity Central Funds.
See accompanying notes which are an integral part of the financial statements.
VIP Health Care Portfolio Investor Class
| | Six months ended (Unaudited) June 30, | Years endedDecember 31, | | | | |
| | 2019 | 2018 | 2017 | 2016 | 2015 | 2014 |
| Selected Per–Share Data | | | | | | |
| Net asset value, beginning of period | $27.62 | $26.23 | $21.11 | $25.73 | $27.52 | $22.43 |
| Income from Investment Operations | | | | | | |
| Net investment income (loss)A | .04 | .03 | .05 | .02 | (.02) | (.04) |
| Net realized and unrealized gain (loss) | 3.42 | 1.96 | 5.22 | (2.84) | 1.69 | 7.17 |
| Total from investment operations | 3.46 | 1.99 | 5.27 | (2.82) | 1.67 | 7.13 |
| Distributions from net investment income | (.01) | (.04) | (.05) | (.02) | – | – |
| Distributions from net realized gain | (2.00) | (.57) | (.10) | (1.78) | (3.47) | (2.05) |
| Total distributions | (2.01) | (.60)B | (.15) | (1.80) | (3.47) | (2.05) |
| Redemption fees added to paid in capitalA | – | – | –C | –C | .01 | .01 |
| Net asset value, end of period | $29.07 | $27.62 | $26.23 | $21.11 | $25.73 | $27.52 |
| Total ReturnD,E,F | 12.79% | 7.72% | 24.97% | (10.51)% | 6.29% | 32.72% |
| Ratios to Average Net AssetsG,H | | | | | | |
| Expenses before reductions | .73%I | .73% | .75% | .75% | .74% | .75% |
| Expenses net of fee waivers, if any | .73%I | .73% | .75% | .75% | .74% | .75% |
| Expenses net of all reductions | .73%I | .72% | .74% | .75% | .73% | .74% |
| Net investment income (loss) | .31%I | .11% | .22% | .11% | (.08)% | (.15)% |
| Supplemental Data | | | | | | |
| Net assets, end of period (000 omitted) | $696,268 | $674,111 | $582,358 | $529,828 | $820,079 | $669,762 |
| Portfolio turnover rateJ | 39%I | 65% | 74% | 53% | 77% | 104% |
A Calculated based on average shares outstanding during the period.
B Total distributions of $.60 per share is comprised of distributions from net investment income of $.039 and distributions from net realized gain of $.565 per share.
C Amount represents less than $.005 per share.
D Total returns for periods of less than one year are not annualized.
E Total returns do not reflect charges attributable to your insurance company's separate account. Inclusion of these charges would reduce the total returns shown.
F Total returns would have been lower if certain expenses had not been reduced during the applicable periods shown.
G Fees and expenses of any underlying Fidelity Central Funds are not included in the Fund's expense ratio. The Fund indirectly bears its proportionate share of the expenses of any underlying Fidelity Central Funds.
H Expense ratios reflect operating expenses of the class. Expenses before reductions do not reflect amounts reimbursed by the investment adviser or reductions from brokerage service arrangements or reductions from other expense offset arrangements and do not represent the amount paid by the class during periods when reimbursements or reductions occur. Expenses net of fee waivers reflect expenses after reimbursement by the investment adviser but prior to reductions from brokerage service arrangements or other expense offset arrangements. Expenses net of all reductions represent the net expenses paid by the class.
I Annualized
J Amount does not include the portfolio activity of any underlying Fidelity Central Funds.
See accompanying notes which are an integral part of the financial statements.
Notes to Financial Statements (Unaudited)
For the period ended June 30, 2019
1. Organization.
VIP Health Care Portfolio (the Fund) is a non-diversified fund of Variable Insurance Products Fund IV (the Trust) and is authorized to issue an unlimited number of shares. The Trust is registered under the Investment Company Act of 1940, as amended (the 1940 Act), as an open-end management investment company organized as a Massachusetts business trust. Shares of the Fund may only be purchased by insurance companies for the purpose of funding variable annuity or variable life insurance contracts. The Fund commenced sale of Service Class 2 shares on April 11, 2019. The Fund offers the following classes of shares: Initial Class shares, Service Class 2 shares, and Investor Class shares. All classes have equal rights and voting privileges, except for matters affecting a single class.
2. Investments in Fidelity Central Funds.
The Fund invests in Fidelity Central Funds, which are open-end investment companies generally available only to other investment companies and accounts managed by the investment adviser and its affiliates. The Fund's Schedule of Investments lists each of the Fidelity Central Funds held as of period end, if any, as an investment of the Fund, but does not include the underlying holdings of each Fidelity Central Fund. As an Investing Fund, the Fund indirectly bears its proportionate share of the expenses of the underlying Fidelity Central Funds.
The Money Market Central Funds seek preservation of capital and current income and are managed by Fidelity Investments Money Management, Inc. (FIMM), an affiliate of the investment adviser. Annualized expenses of the Money Market Central Funds as of their most recent shareholder report date ranged from less than .005% to .01%.
A complete unaudited list of holdings for each Fidelity Central Fund is available upon request or at the Securities and Exchange Commission (the SEC) website at www.sec.gov. In addition, the financial statements of the Fidelity Central Funds are available on the SEC website or upon request.
3. Significant Accounting Policies.
The Fund is an investment company and applies the accounting and reporting guidance of the Financial Accounting Standards Board (FASB) Accounting Standards Codification Topic 946 Financial Services – Investments Companies. The financial statements have been prepared in conformity with accounting principles generally accepted in the United States of America (GAAP), which require management to make certain estimates and assumptions at the date of the financial statements. Actual results could differ from those estimates. Subsequent events, if any, through the date that the financial statements were issued have been evaluated in the preparation of the financial statements. The following summarizes the significant accounting policies of the Fund:
Investment Valuation. Investments are valued as of 4:00 p.m. Eastern time on the last calendar day of the period. The Board of Trustees (the Board) has delegated the day to day responsibility for the valuation of the Fund's investments to the Fair Value Committee (the Committee) established by the Fund's investment adviser. In accordance with valuation policies and procedures approved by the Board, the Fund attempts to obtain prices from one or more third party pricing vendors or brokers to value its investments. When current market prices, quotations or currency exchange rates are not readily available or reliable, investments will be fair valued in good faith by the Committee, in accordance with procedures adopted by the Board. Factors used in determining fair value vary by investment type and may include market or investment specific events. The frequency with which these procedures are used cannot be predicted and they may be utilized to a significant extent. The Committee oversees the Fund's valuation policies and procedures and reports to the Board on the Committee's activities and fair value determinations. The Board monitors the appropriateness of the procedures used in valuing the Fund's investments and ratifies the fair value determinations of the Committee.
The Fund categorizes the inputs to valuation techniques used to value its investments into a disclosure hierarchy consisting of three levels as shown below:
- Level 1 – quoted prices in active markets for identical investments
- Level 2 – other significant observable inputs (including quoted prices for similar investments, interest rates, prepayment speeds, etc.)
- Level 3 – unobservable inputs (including the Fund's own assumptions based on the best information available)
Valuation techniques used to value the Fund's investments by major category are as follows:
Equity securities, including restricted securities, for which market quotations are readily available, are valued at the last reported sale price or official closing price as reported by a third party pricing vendor on the primary market or exchange on which they are traded and are categorized as Level 1 in the hierarchy. In the event there were no sales during the day or closing prices are not available, securities are valued at the last quoted bid price or may be valued using the last available price and are generally categorized as Level 2 in the hierarchy. For foreign equity securities, when market or security specific events arise, comparisons to the valuation of American Depositary Receipts (ADRs), futures contracts, Exchange-Traded Funds (ETFs) and certain indexes as well as quoted prices for similar securities may be used and would be categorized as Level 2 in the hierarchy. For equity securities, including restricted securities, where observable inputs are limited, assumptions about market activity and risk are used and these securities may be categorized as Level 3 in the hierarchy. Equity securities, including restricted securities, for which observable inputs are not available are valued using alternate valuation approaches, including the market approach and the income approach and are categorized as Level 3 in the hierarchy. The market approach generally consists of using comparable market transactions while the income approach generally consists of using the net present value of estimated future cash flows, adjusted as appropriate for liquidity, credit, market and/or other risk factors.
Investments in open-end mutual funds, including the Fidelity Central Funds, are valued at their closing net asset value (NAV) each business day and are categorized as Level 1 in the hierarchy.
The following provides information on Level 3 securities held by the Fund that were valued at period end based on unobservable inputs. These amounts exclude valuations provided by a broker.
| Asset Type | Fair Value | Valuation Technique(s) | Unobservable Input | Amount or Range/Weighted Average | Impact to Valuation from an Increase in Input(a) |
| Equities | $ 12,190,578 | Market comparable | Enterprise value/Sales multiple (EV/S) | 5.0 | Increase |
| | | | Transaction price
| $1.00-$325.82/ $234.46 | Increase |
| | | | Premium rate
Proxy discount
| 98.5%
0.6%
| Increase
Decrease
|
| | | Market approach | Transaction price | $3.11-$153.00/$96.43 | Increase |
(a) Represents the directional change in the fair value of the Level 3 investments that could have resulted from an increase in the corresponding input as of period end. A decrease to the unobservable input would have had the opposite effect. Significant changes in these inputs may have resulted in a significantly higher or lower fair value measurement at period end.
Changes in valuation techniques may result in transfers in or out of an assigned level within the disclosure hierarchy. The aggregate value of investments by input level as of June 30, 2019, as well as a roll forward of Level 3 investments, is included at the end of the Fund's Schedule of Investments.
Foreign Currency. The Fund may use foreign currency contracts to facilitate transactions in foreign-denominated securities. Gains and losses from these transactions may arise from changes in the value of the foreign currency or if the counterparties do not perform under the contracts' terms.
Foreign-denominated assets, including investment securities, and liabilities are translated into U.S. dollars at the exchange rates at period end. Purchases and sales of investment securities, income and dividends received and expenses denominated in foreign currencies are translated into U.S. dollars at the exchange rate in effect on the transaction date.
The effects of exchange rate fluctuations on investments are included with the net realized and unrealized gain (loss) on investment securities. Other foreign currency transactions resulting in realized and unrealized gain (loss) are disclosed separately.
Investment Transactions and Income. For financial reporting purposes, the Fund's investment holdings and NAV include trades executed through the end of the last business day of the period. The NAV per share for processing shareholder transactions is calculated as of the close of business of the New York Stock Exchange (NYSE), normally 4:00 p.m. Eastern time and includes trades executed through the end of the prior business day. Gains and losses on securities sold are determined on the basis of identified cost and include proceeds received from litigation. Dividend income is recorded on the ex-dividend date, except for certain dividends from foreign securities where the ex-dividend date may have passed, which are recorded as soon as the Fund is informed of the ex-dividend date. Non-cash dividends included in dividend income, if any, are recorded at the fair market value of the securities received. Income and capital gain distributions from Fidelity Central Funds, if any, are recorded on the ex-dividend date. Certain distributions received by the Fund represent a return of capital or capital gain. The Fund determines the components of these distributions subsequent to the ex-dividend date, based upon receipt of tax filings or other correspondence relating to the underlying investment. These distributions are recorded as a reduction of cost of investments and/or as a realized gain. Investment income is recorded net of foreign taxes withheld where recovery of such taxes is uncertain.
Class Allocations and Expenses. Investment income, realized and unrealized capital gains and losses, common expenses of the Fund, and certain fund-level expense reductions, if any, are allocated daily on a pro-rata basis to each class based on the relative net assets of each class to the total net assets of the Fund. Each class differs with respect to transfer agent and distribution and service plan fees incurred. Certain expense reductions may also differ by class. For the reporting period, the allocated portion of income and expenses to each class as a percent of its average net assets may vary due to the timing of recording these transactions in relation to fluctuating net assets of the classes. Expenses directly attributable to a fund are charged to that fund. Expenses attributable to more than one fund are allocated among the respective funds on the basis of relative net assets or other appropriate methods. Expense estimates are accrued in the period to which they relate and adjustments are made when actual amounts are known.
Income Tax Information and Distributions to Shareholders. Each year, the Fund intends to qualify as a regulated investment company under Subchapter M of the Internal Revenue Code, including distributing substantially all of its taxable income and realized gains. As a result, no provision for U.S. Federal income taxes is required. The Fund files a U.S. federal tax return, in addition to state and local tax returns as required. The Fund's federal income tax returns are subject to examination by the Internal Revenue Service (IRS) for a period of three fiscal years after they are filed. State and local tax returns may be subject to examination for an additional fiscal year depending on the jurisdiction. Foreign taxes are provided for based on the Fund's understanding of the tax rules and rates that exist in the foreign markets in which it invests.
Distributions are declared and recorded on the ex-dividend date. Income and capital gain distributions are declared separately for each class. Income and capital gain distributions are determined in accordance with income tax regulations, which may differ from GAAP.
Capital accounts within the financial statements are adjusted for permanent book-tax differences. These adjustments have no impact on net assets or the results of operations. Capital accounts are not adjusted for temporary book-tax differences which will reverse in a subsequent period.
Book-tax differences are primarily due to foreign currency transactions, passive foreign investment companies (PFIC) and losses deferred due to wash sales and excise tax regulations.
As of period end, the cost and unrealized appreciation (depreciation) in securities, and derivatives if applicable, for federal income tax purposes were as follows:
| Gross unrealized appreciation | $271,775,942 |
| Gross unrealized depreciation | (27,747,142) |
| Net unrealized appreciation (depreciation) | $244,028,800 |
| Tax cost | $613,369,112 |
The Fund elected to defer to its next fiscal year approximately $4,067,423 of capital losses recognized during the period November 1, 2018 to December 31, 2018.
Restricted Securities. The Fund may invest in securities that are subject to legal or contractual restrictions on resale. These securities generally may be resold in transactions exempt from registration or to the public if the securities are registered. Disposal of these securities may involve time-consuming negotiations and expense, and prompt sale at an acceptable price may be difficult. Information regarding restricted securities is included at the end of the Fund's Schedule of Investments.
4. Purchases and Sales of Investments.
Purchases and sales of securities, other than short-term securities, aggregated $163,606,258 and $237,433,121, respectively.
5. Fees and Other Transactions with Affiliates.
Management Fee. Fidelity SelectCo, LLC (the investment adviser) and its affiliates provide the Fund with investment management related services for which the Fund pays a monthly management fee. The management fee is the sum of an individual fund fee rate that is based on an annual rate of .30% of the Fund's average net assets and an annualized group fee rate that averaged .24% during the period. The group fee rate is based upon the average net assets of all the mutual funds advised by Fidelity Management & Research Company (FMR) and the investment adviser. The group fee rate decreases as assets under management increase and increases as assets under management decrease. For the reporting period, the total annualized management fee rate was .54% of the Fund's average net assets.
Distribution and Service Plan Fees. In accordance with Rule 12b-1 of the 1940 Act, the Fund has adopted a separate 12b-1 Plan for Service Class 2 shares. Service Class 2 pays Fidelity Distributors Corporation (FDC), an affiliate of the investment adviser, a service fee. For the period, the service fee is based on an annual rate of .25% of Service Class 2's average net assets.
For the period, total fees for Service Class 2, all of which was re-allowed to insurance companies for the distribution of shares and providing shareholder support services were $635.
Transfer Agent Fees. Fidelity Investments Institutional Operations Company, Inc. (FIIOC), an affiliate of the investment adviser, is the Fund's transfer, dividend disbursing, and shareholder servicing agent. FIIOC receives an asset-based fee with respect to each class. Each class pays a fee for transfer agent services, typesetting and printing and mailing of shareholder reports, excluding mailing of proxy statements, equal to an annual rate of class-level average net assets. The annual rate for Investor Class is .15% and the annual rate for all other classes is .07%. For the period, transfer agent fees for each class were as follows:
| Initial Class | $46,389 |
| Service Class 2 | 165 |
| Investor Class | 516,316 |
| | $562,870 |
Accounting and Security Lending Fees. Fidelity Service Company, Inc. (FSC), an affiliate of the investment adviser, maintains the Fund's accounting records. The accounting fee is based on the level of average net assets for each month. Prior to April 1, 2019, FSC had a separate agreement with the Fund for administration of the security lending program, based on the number and duration of lending transactions. For the period, the total fees paid for accounting and administration of securities lending were equivalent to an annualized rate of .03%.
Brokerage Commissions. The Fund placed a portion of its portfolio transactions with brokerage firms which are affiliates of the investment adviser. Brokerage commissions are included in net realized gain (loss) and change in net unrealized appreciation (depreciation) in the Statement of Operations. The commissions paid to these affiliated firms were $4,296 for the period.
Interfund Lending Program. Pursuant to an Exemptive Order issued by the SEC, the Fund, along with other registered investment companies having management contracts with Fidelity Management & Research Company (FMR) or other affiliated entities of FMR, may participate in an interfund lending program. This program provides an alternative credit facility allowing the funds to borrow from, or lend money to, other participating affiliated funds. At period end, there were no interfund loans outstanding. The Fund's activity in this program during the period for which loans were outstanding was as follows:
| Borrower or Lender | Average Loan Balance | Weighted Average Interest Rate | Interest Expense |
| Borrower | $8,171,556 | 2.69% | $5,490 |
Interfund Trades. The Fund may purchase from or sell securities to other Fidelity Funds under procedures adopted by the Board. The procedures have been designed to ensure these interfund trades are executed in accordance with Rule 17a-7 of the 1940 Act. Interfund trades are included within the respective purchases and sales amounts shown in the Purchases and Sales of Investments note.
Other. During the period, the investment adviser reimbursed the Fund for certain losses in the amount of $1,000.
6. Committed Line of Credit.
The Fund participates with other funds managed by the investment adviser or an affiliate in a $4.25 billion credit facility (the "line of credit") to be utilized for temporary or emergency purposes to fund shareholder redemptions or for other short-term liquidity purposes. The Fund has agreed to pay commitment fees on its pro-rata portion of the line of credit, which amounted to $1,274 and is reflected in Miscellaneous expenses on the Statement of Operations. During the period, the Fund did not borrow on this line of credit.
7. Security Lending.
The Fund lends portfolio securities from time to time in order to earn additional income. For equity securities, lending agents are used, including National Financial Services (NFS), an affiliate of the Fund. Pursuant to a securities lending agreement, NFS will receive a fee, which is capped at 9.9% of daily lending revenue, for its services as lending agent. The Fund may lend securities to certain qualified borrowers. On the settlement date of the loan, the Fund receives collateral (in the form of U.S. Treasury obligations, letters of credit and/or cash) against the loaned securities and maintains collateral in an amount not less than 100% of the market value of the loaned securities during the period of the loan. The market value of the loaned securities is determined at the close of business of the Fund and any additional required collateral is delivered to the Fund on the next business day. The Fund or borrower may terminate the loan at any time, and if the borrower defaults on its obligation to return the securities loaned because of insolvency or other reasons, the Fund may apply collateral received from the borrower against the obligation. The Fund may experience delays and costs in recovering the securities loaned. Any cash collateral received is invested in the Fidelity Securities Lending Cash Central Fund. The value of loaned securities and cash collateral at period end are disclosed on the Fund's Statement of Assets and Liabilities. Security lending income represents the income earned on investing cash collateral, less rebates paid to borrowers and any lending agent fees associated with the loan, plus any premium payments received for lending certain types of securities. Security lending income is presented in the Statement of Operations as a component of income from Fidelity Central Funds.
8. Bank Borrowings.
The Fund is permitted to have bank borrowings for temporary or emergency purposes to fund shareholder redemptions or for other short-term liquidity requirements. The Fund has established borrowing arrangements with certain banks. The interest rate on the borrowings is the bank's base rate, as revised from time to time. The average loan balance during the period for which loans were outstanding amounted to $3,979,000. The weighted average interest rate was 2.94%. The interest expense amounted to $325 under the bank borrowing program. At period end, there were no bank borrowings outstanding.
9. Expense Reductions.
Commissions paid to certain brokers with whom the investment adviser, or its affiliates, places trades on behalf of the Fund include an amount in addition to trade execution, which may be rebated back to the Fund to offset certain expenses. This amount totaled $9,621 for the period.
In addition, during the period the investment adviser reimbursed and/or waived a portion of fund-level operating expenses in the amount of $3,382.
10. Distributions to Shareholders.
Distributions to shareholders of each class were as follows:
| | Six months ended
June 30, 2019(a) | Year ended
December 31, 2018 |
| Distributions to shareholders | | |
| Initial Class | $9,927,847 | $3,055,353 |
| Investor Class | 50,153,293 | 13,736,977 |
| Total | $60,081,140 | $16,792,330 |
(a) Distributions for Service Class 2 are for the period April 11,2019 (commencement of sale of shares) to June 30, 2019.
Share Transactions.
Transactions for each class of shares were as follows:
| | Shares | Shares | Dollars | Dollars |
| | Six months ended June 30, 2019 (a) | Year ended December 31, 2018 | Six months ended June 30, 2019(a) | Year ended December 31, 2018 |
| Initial Class | | | | |
| Shares sold | 85,650 | 881,073 | $2,458,460 | $27,036,190 |
| Reinvestment of distributions | 350,931 | 114,782 | 9,927,847 | 3,055,353 |
| Shares redeemed | (647,253) | (985,506) | (18,327,834) | (28,636,641) |
| Net increase (decrease) | (210,672) | 10,349 | $(5,941,527) | $1,454,902 |
| Service Class 2 | | | | |
| Shares sold | 140,401 | – | $3,958,793 | $– |
| Shares redeemed | (1,451) | – | (41,789) | – |
| Net increase (decrease) | 138,950 | – | $3,917,004 | $– |
| Investor Class | | | | |
| Shares sold | 994,551 | 3,955,718 | $28,736,239 | $119,018,545 |
| Reinvestment of distributions | 1,788,634 | 520,609 | 50,153,293 | 13,736,977 |
| Shares redeemed | (3,231,022) | (2,276,692) | (89,615,355) | (64,547,143) |
| Net increase (decrease) | (447,837) | 2,199,635 | $(10,725,823) | $68,208,379 |
(a) Share transactions for Service Class 2 are for the period April 11, 2019 (commencement of sale of shares) to June 30, 2019.
11. Other.
The Fund's organizational documents provide former and current trustees and officers with a limited indemnification against liabilities arising in connection with the performance of their duties to the Fund. In the normal course of business, the Fund may also enter into contracts that provide general indemnifications. The Fund's maximum exposure under these arrangements is unknown as this would be dependent on future claims that may be made against the Fund. The risk of material loss from such claims is considered remote.
At the end of the period, the investment adviser or its affiliates were the owners of record of 100% of the total outstanding shares of the Fund.
Shareholder Expense Example
As a shareholder of the Fund, you incur two types of costs: (1) transaction costs, and (2) ongoing costs, including management fees, distribution and/or service (12b-1) fees and other Fund expenses. This Example is intended to help you understand your ongoing costs (in dollars) of investing in the Fund and to compare these costs with the ongoing costs of investing in other mutual funds.
The actual expense Example is based on an investment of $1,000 invested at the beginning of the period and held for the entire period (January 1, 2019 to June 30, 2019) for Initial Class and Investor Class and for the period (April 11, 2019 to June 30, 2019) for Service Class 2. The hypothetical expense Example is based on an investment of $1,000 invested for the one-half year period (January 1, 2019 to June 30, 2019).
Actual Expenses
The first line of the accompanying table for each class of the Fund provides information about actual account values and actual expenses. You may use the information in this line, together with the amount you invested, to estimate the expenses that you paid over the period. Simply divide your account value by $1,000.00 (for example, an $8,600 account value divided by $1,000.00 = 8.6), then multiply the result by the number in the first line for a class of the Fund under the heading entitled "Expenses Paid During Period" to estimate the expenses you paid on your account during this period. The estimate of expenses does not include any fees or other expenses of any variable annuity or variable life insurance product. If they were, the estimate of expenses you paid during the period would be higher, and your ending account value would be lower. In addition, the Fund, as a shareholder in the underlying Fidelity Central Funds, will indirectly bear its pro-rata share of the fees and expenses incurred by the underlying Fidelity Central Funds. These fees and expenses are not included in the Fund's annualized expense ratio used to calculate the expense estimate in the table below.
Hypothetical Example for Comparison Purposes
The second line of the accompanying table for each class of the Fund provides information about hypothetical account values and hypothetical expenses based on a Class' actual expense ratio and an assumed rate of return of 5% per year before expenses, which is not the Class' actual return. The hypothetical account values and expenses may not be used to estimate the actual ending account balance or expenses you paid for the period. You may use this information to compare the ongoing costs of investing in the Fund and other funds. To do so, compare this 5% hypothetical example with the 5% hypothetical examples that appear in the shareholder reports of the other funds. The estimate of expenses does not include any fees or other expenses of any variable annuity or variable life insurance product. If they were, the estimate of expenses you paid during the period would be higher, and your ending account value would be lower. In addition, the Fund, as a shareholder in the underlying Fidelity Central Funds, will indirectly bear its pro-rata share of the fees and expenses incurred by the underlying Fidelity Central Funds. These fees and expenses are not included in the Fund's annualized expense ratio used to calculate the expense estimate in the table below.
Please note that the expenses shown in the table are meant to highlight your ongoing costs only and do not reflect any transaction costs. Therefore, the second line of the table is useful in comparing ongoing costs only, and will not help you determine the relative total costs of owning different funds.
| | Annualized Expense Ratio-A | Beginning
Account Value
| Ending
Account Value
June 30, 2019 | Expenses Paid
During Period
|
| Initial Class | .65% | | | |
| Actual | | $1,000.00 | $1,128.10 | $3.43-B |
| Hypothetical-C | | $1,000.00 | $1,021.57 | $3.26-D |
| Service Class 2 | .91% | | | |
| Actual | | $1,000.00 | $1,028.10 | $2.05-B |
| Hypothetical-C | | $1,000.00 | $1,020.28 | $4.56-D |
| Investor Class | .73% | | | |
| Actual | | $1,000.00 | $1,127.90 | $3.85-B |
| Hypothetical-C | | $1,000.00 | $1,021.17 | $3.66-D |
A Annualized expense ratio reflects expenses net of applicable fee waivers.
B Actual expenses are equal to each Class' annualized expense ratio, multiplied by the average account value over the period, multiplied by 181/365 (to reflect the one-half year period) for Initial Class and Investor Class and multiplied by 81/365 (to reflect the period April 11, 2019 to June 30, 2019) for Service Class 2.
C 5% return per year before expenses
D Hypothetical expenses are equal to each Class' annualized expense ratio, multiplied by the average account value over the period, multiplied by 181/365 (to reflect the one-half year period).
Board Approval of Investment Advisory Contracts and Management Fees
VIP Health Care Portfolio
Each year, the Board of Trustees, including the Independent Trustees (together, the Board), votes on the renewal of the management contract with Fidelity SelectCo, LLC (SelectCo), an affiliate of Fidelity Management & Research Company (FMR), and the sub-advisory agreements with affiliates of FMR (together, the Advisory Contracts) for the fund. SelectCo and the sub-advisers are referred to herein as the Investment Advisers. The Board, assisted by the advice of fund counsel and Independent Trustees' counsel, requests and considers a broad range of information relevant to the renewal of the Advisory Contracts throughout the year.
The Board meets regularly and, at each of its meetings, covers an extensive agenda of topics and materials and considers factors that are relevant to its annual consideration of the renewal of the fund's Advisory Contracts, including the services and support provided to the fund and its shareholders. The Board has established various standing committees (Committees), each composed of and chaired by Independent Trustees with varying backgrounds, to which the Board has assigned specific subject matter responsibilities in order to enhance effective decision-making by the Board. The Board, acting directly and through its Committees, requests and receives information concerning the annual consideration of the renewal of the fund's Advisory Contracts. The Board also meets as needed to review matters specifically related to the Board's annual consideration of the renewal of the Advisory Contracts. Members of the Board may also meet with trustees of other Fidelity funds through joint ad hoc committees to discuss certain matters relevant to all of the Fidelity funds.
At its January 2019 meeting, the Board unanimously determined to renew the fund's Advisory Contracts. In reaching its determination, the Board considered all factors it believed relevant, including (i) the nature, extent, and quality of the services to be provided to the fund and its shareholders (including the investment performance of the fund); (ii) the competitiveness of the fund's management fee and total expense ratio relative to peer funds; (iii) the total costs of the services to be provided by and the profits to be realized by Fidelity from its relationships with the fund; and (iv) the extent to which, if any, economies of scale exist and would be realized as the fund grows, and whether any economies of scale are appropriately shared with fund shareholders.
In considering whether to renew the Advisory Contracts for the fund, the Board reached a determination, with the assistance of fund counsel and Independent Trustees' counsel and through the exercise of its business judgment, that the renewal of the Advisory Contracts was in the best interests of the fund and its shareholders and that the compensation payable under the Advisory Contracts was fair and reasonable. The Board's decision to renew the Advisory Contracts was not based on any single factor, but rather was based on a comprehensive consideration of all the information provided to the Board at its meetings throughout the year. The Board, in reaching its determination to renew the Advisory Contracts, was aware that shareholders of the fund have a broad range of investment choices available to them, including a wide choice among funds offered by Fidelity's competitors, and that the fund's shareholders, who have the opportunity to review and weigh the disclosure provided by the fund in its prospectus and other public disclosures, have chosen to invest in this fund, which is part of the Fidelity family of funds.
Nature, Extent, and Quality of Services Provided. The Board considered Fidelity's staffing as it relates to the fund, including the backgrounds of investment personnel of Fidelity, and also considered the fund's investment objective, strategies, and related investment philosophy. The Independent Trustees also had discussions with senior management of Fidelity's investment operations and investment groups. The Board considered the structure of the investment personnel compensation program and whether this structure provides appropriate incentives to act in the best interests of the fund. Additionally, the Board considered the portfolio managers' investments, if any, in the funds that they manage.
Resources Dedicated to Investment Management and Support Services. The Board and the Fund Oversight and Research Committees reviewed the general qualifications and capabilities of Fidelity's investment staff, including its size, education, experience, and resources, as well as Fidelity's approach to recruiting, training, managing, and compensating investment personnel. The Board noted that Fidelity has continued to increase the resources devoted to non-U.S. offices, including expansion of Fidelity's global investment organization. The Board also noted that Fidelity's analysts have extensive resources, tools and capabilities that allow them to conduct sophisticated quantitative and fundamental analysis, as well as credit analysis of issuers, counterparties and guarantors. Further, the Board considered that Fidelity's investment professionals have sufficient access to global information and data so as to provide competitive investment results over time, and that those professionals also have access to sophisticated tools that permit them to assess portfolio construction and risk and performance attribution characteristics continuously, as well as to transmit new information and research conclusions rapidly around the world. Additionally, in its deliberations, the Board considered Fidelity's trading, risk management, compliance, and technology and operations capabilities and resources, which are integral parts of the investment management process.
Shareholder and Administrative Services. The Board considered (i) the nature, extent, quality, and cost of advisory, administrative, and shareholder services performed by the Investment Advisers and their affiliates under the Advisory Contracts and under separate agreements covering transfer agency, pricing and bookkeeping, and securities lending services for the fund; (ii) the nature and extent of the supervision of third party service providers, principally custodians, subcustodians, and pricing vendors; and (iii) the resources devoted to, and the record of compliance with, the fund's compliance policies and procedures. The Board also reviewed the allocation of fund brokerage, including allocations to brokers affiliated with the Investment Advisers, the use of brokerage commissions to pay fund expenses, and the use of "soft" commission dollars to pay for research services.
The Board noted that the growth of fund assets over time across the complex allows Fidelity to reinvest in the development of services designed to enhance the value and convenience of the Fidelity funds as investment vehicles. These services include 24-hour access to account information and market information through telephone representatives and over the Internet, investor education materials and asset allocation tools, and the expanded availability of Fidelity Investor Centers.
The Board noted that it and the boards of certain other Fidelity funds had formed an ad hoc Committee on Transfer Agency Fees to review the variety of transfer agency fee structures throughout the industry and Fidelity's competitive positioning with respect to industry participants.
Investment in a Large Fund Family. The Board considered the benefits to shareholders of investing in a Fidelity fund, including the benefits of investing in a fund that is part of a large family of funds offering a variety of investment disciplines and providing a large variety of mutual fund investor services. The Board noted that Fidelity had taken, or had made recommendations that resulted in the Fidelity funds taking, a number of actions over the previous year that benefited particular funds, including: (i) continuing to dedicate additional resources to Fidelity's investment research process, which includes meetings with management of issuers of securities in which the funds invest, and to the support of the senior management team that oversees asset management; (ii) continuing efforts to enhance Fidelity's global research capabilities; (iii) launching new funds and making other enhancements to meet client needs; (iv) launching new share classes of existing funds; (v) eliminating purchase minimums and broadening eligibility requirements for certain funds and share classes; (vi) reducing management fees and total expenses for certain growth equity funds and index funds; (vii) lowering expense caps for certain existing funds and classes, and converting certain voluntary expense caps to contractual caps, to reduce expenses borne by shareholders; (viii) eliminating short-term redemption fees for funds that had such fees; (ix) rationalizing product lines and gaining increased efficiencies from fund mergers and share class consolidations; (x) continuing to develop, acquire and implement systems and technology to improve services to the funds and shareholders, strengthen information security, and increase efficiency; and (xi) continuing to implement enhancements to further strengthen Fidelity's product line to increase investors' probability of success in achieving their investment goals, including retirement income goals.
Investment Performance. The Board considered whether the fund has operated in accordance with its investment objective, as well as its record of compliance with its investment restrictions and its performance history.
The Board took into account discussions that occur at Board meetings throughout the year with representatives of the Investment Advisers about fund investment performance. In this regard the Board noted that as part of regularly scheduled fund reviews and other reports to the Board on fund performance, the Board considers annualized return information for the fund for different time periods, measured against an appropriate securities market index ("benchmark index"). In its evaluation of fund investment performance, the Board gave particular attention to information indicating changes in performance of certain Fidelity funds for specific time periods and discussed with the Investment Advisers the reasons for any overperformance or underperformance.
In addition to reviewing absolute and relative fund performance, the Independent Trustees periodically consider the appropriateness of fund performance metrics in evaluating the results achieved. In general, the Independent Trustees believe that fund performance should be evaluated based on net performance (after fees and expenses) of both the highest performing and lowest performing fund share classes, where applicable, compared to appropriate benchmark indices, over appropriate time periods that may include full market cycles, taking into account relevant factors including the following: general market conditions; issuer-specific information; and fund cash flows and other factors.
The Independent Trustees recognize that shareholders evaluate performance on a net basis over their own holding periods, for which one-, three-, and five-year periods are often used as a proxy. For this reason, the performance information reviewed by the Board also included net cumulative total return information for the fund and an appropriate benchmark index for the most recent one-, three-, and five-year periods ended June 30, 2018, as shown below.
VIP Health Care Portfolio
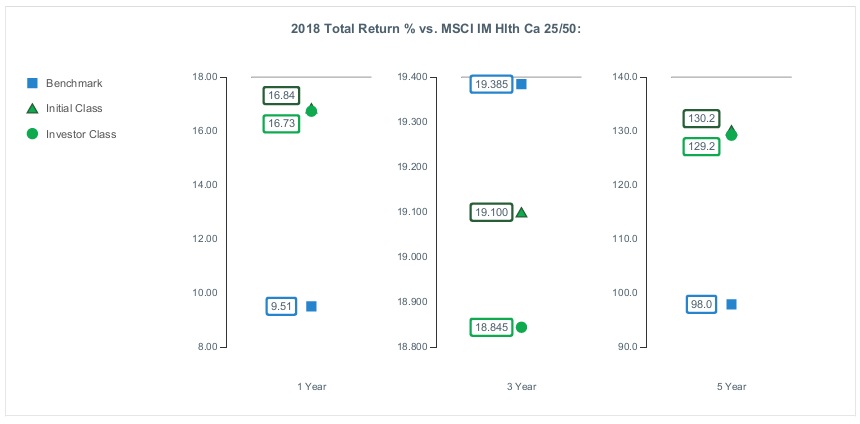
Based on its review, the Board concluded that the nature, extent, and quality of services provided to the fund under the Advisory Contracts should continue to benefit the shareholders of the fund.
Competitiveness of Management Fee and Total Expense Ratio. The Board considered the fund's management fee and total expense ratio compared to "mapped groups" of competitive funds and classes created for the purpose of facilitating the Trustees' competitive analysis of management fees and total expenses. Fidelity creates "mapped groups" by combining similar Lipper investment objective categories that have comparable investment mandates. For this purpose, all sector focused equity variable annuity funds are grouped in the same mapped group. Combining Lipper investment objective categories aids the Board's management fee and total expense ratio comparisons by broadening the competitive group used for comparison.
Management Fee. The Board considered two proprietary management fee comparisons for the 12-month periods ended June 30 shown in basis points (BP) in the chart below. The group of Lipper funds used by the Board for management fee comparisons is referred to below as the "Total Mapped Group." The Total Mapped Group comparison focuses on a fund's standing in terms of gross management fees before expense reimbursements or caps relative to the total universe of funds with comparable investment mandates (i.e., sector equities), regardless of whether their management fee structures also are comparable. Funds with comparable management fee structures have similar management fee contractual arrangements (
e.g., flat rate charged for advisory services, all-inclusive fee rate,
etc.). "TMG %" represents the percentage of funds in the Total Mapped Group that had management fees that were lower than the fund's. For example, a hypothetical TMG % of 20% would mean that 80% of the funds in the Total Mapped Group had higher, and 20% had lower, management fees than the fund. The fund's actual TMG %s and the number of funds in the Total Mapped Group are in the chart below. The "Asset-Size Peer Group" (ASPG) comparison focuses on a fund's standing relative to a subset of non-Fidelity funds within the Total Mapped Group that are similar in size and management fee structure. For example, if a fund is in the first quartile of the ASPG, the fund's management fee ranks in the least expensive or lowest 25% of funds in the ASPG. The ASPG represents at least 15% of the funds in the Total Mapped Group with comparable asset size and management fee structures, subject to a minimum of 50 funds (or all funds in the Total Mapped Group if fewer than 50). Additional information, such as the ASPG quartile in which the fund's management fee rate ranked, is also included in the chart and was considered by the Board.
VIP Health Care Portfolio
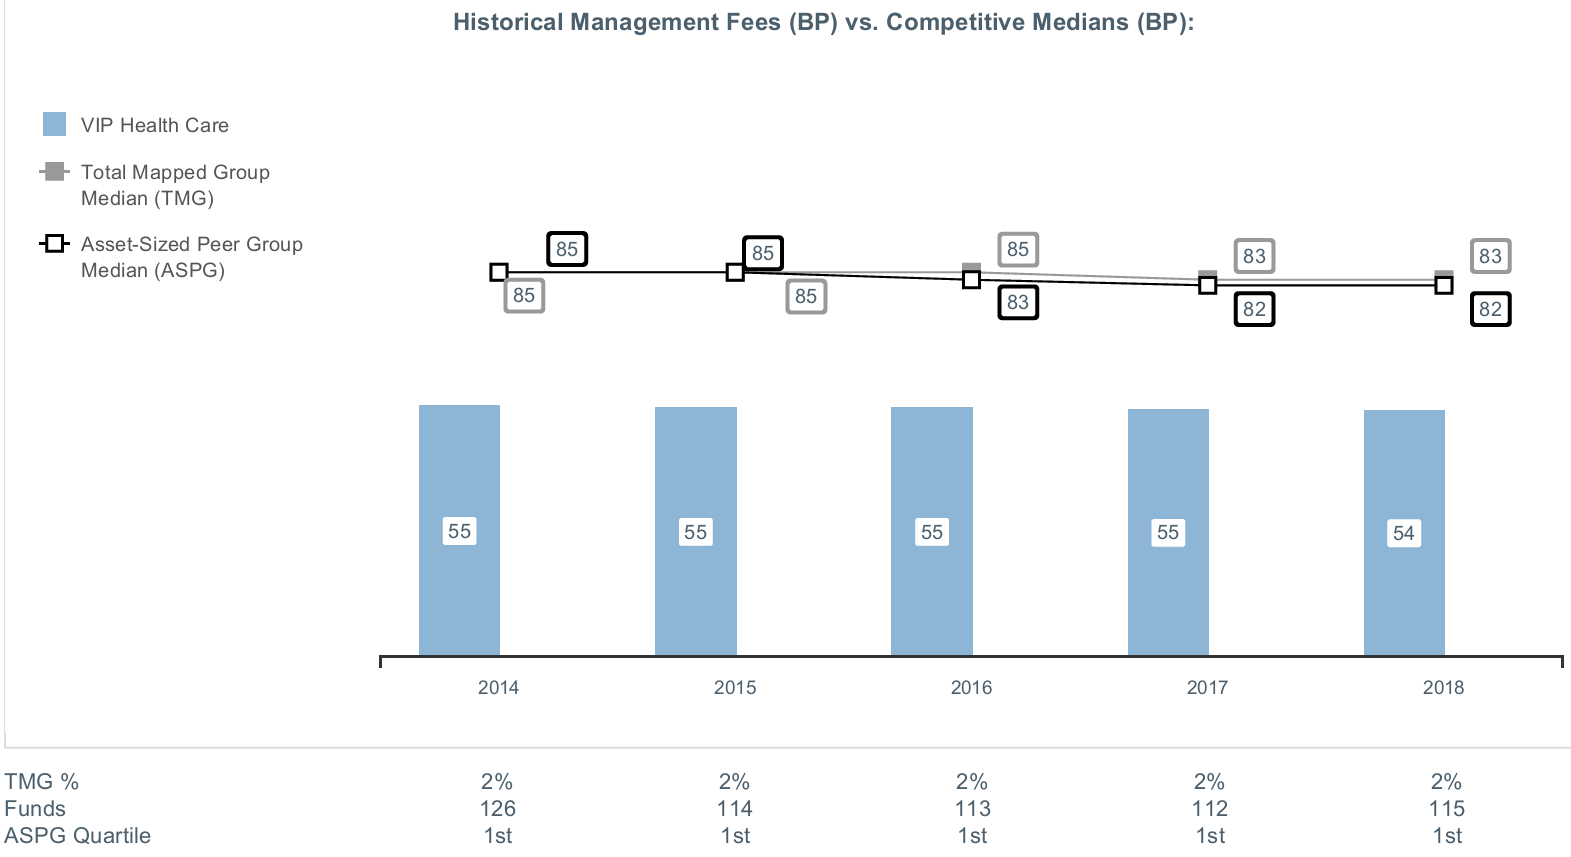
The Board noted that the fund's management fee rate ranked below the median of its Total Mapped Group and below the median of its ASPG for the 12-month period ended June 30, 2018.
The Board noted that it and the boards of other Fidelity funds formed an ad hoc Committee on Group Fee, which meets periodically, to conduct an in-depth review of the "group fee" component of the management fee of funds with such management fee structures. The Committee's focus included the mechanics of the group fee, the competitive landscape of group fee structures, Fidelity funds with no group fee component and investment products not included in group fee assets. The Board also considered that, for funds subject to the group fee, FMR agreed to voluntarily waive fees over a specified period of time in amounts designed to account for assets converted from certain funds to certain collective investment trusts.
Based on its review, the Board concluded that the fund's management fee is fair and reasonable in light of the services that the fund receives and the other factors considered.
Total Expense Ratio. In its review of each class's total expense ratio, the Board considered the fund's management fee rate as well as other fund or class expenses, as applicable, such as transfer agent fees, pricing and bookkeeping fees, and custodial, legal, and audit fees. The Board also noted that Fidelity may agree to waive fees and expenses from time to time, and the extent to which, if any, it has done so for the fund. As part of its review, the Board also considered the current and historical total expense ratios of each class of the fund compared to competitive fund median expenses. Each class of the fund is compared to those funds and classes in the Total Mapped Group (used by the Board for management fee comparisons) that have a similar sales load structure.
The Board noted that the total expense ratio of each class ranked below the competitive median for the 12-month period ended June 30, 2018.
Fees Charged to Other Fidelity Clients. The Board also considered Fidelity fee structures and other information with respect to clients of Fidelity, such as other funds advised or subadvised by Fidelity, pension plan clients, and other institutional clients with similar mandates. The Board noted that a joint ad hoc committee created by it and the boards of other Fidelity funds periodically reviews and compares Fidelity's institutional investment advisory business with its business of providing services to the Fidelity funds, and also noted the most recent findings of the committee. The Board noted that the committee's review included a consideration of the differences in services provided, fees charged, and costs incurred, as well as competition in the markets serving the different categories of clients.
Based on its review of total expense ratios and fees charged to other Fidelity clients, the Board concluded that the total expense ratio of each class of the fund was reasonable in light of the services that the fund and its shareholders receive and the other factors considered.
Costs of the Services and Profitability. The Board considered the revenues earned and the expenses incurred by Fidelity in conducting the business of developing, marketing, distributing, managing, administering and servicing the fund and servicing the fund's shareholders. The Board also considered the level of Fidelity's profits in respect of all the Fidelity funds.
On an annual basis, Fidelity presents to the Board information about the profitability of its relationships with the fund. Fidelity calculates profitability information for each fund, as well as aggregate profitability information for groups of Fidelity funds and all Fidelity funds, using a series of detailed revenue and cost allocation methodologies which originate with the books and records of Fidelity on which Fidelity's audited financial statements are based. The Audit Committee of the Board reviews any significant changes from the prior year's methodologies.
PricewaterhouseCoopers LLP (PwC), auditor to Fidelity and certain Fidelity funds, has been engaged annually by the Board as part of the Board's assessment of Fidelity's profitability analysis. PwC's engagement includes the review and assessment of the methodologies used by Fidelity in determining the revenues and expenses attributable to Fidelity's mutual fund business, and completion of agreed-upon procedures in respect of the mathematical accuracy of the fund profitability information and its conformity to established allocation methodologies. After considering PwC's reports issued under the engagement and information provided by Fidelity, the Board concluded that while other allocation methods may also be reasonable, Fidelity's profitability methodologies are reasonable in all material respects.
The Board also reviewed Fidelity's non-fund businesses and potential indirect benefits such businesses may have received as a result of their association with Fidelity's mutual fund business (i.e., fall-out benefits) as well as cases where Fidelity's affiliates may benefit from the fund's business. The Board noted that changes to fall-out benefits year-over-year reflect business developments at Fidelity's various businesses.
The Board considered the costs of the services provided by and the profits realized by Fidelity in connection with the operation of the fund and was satisfied that the profitability was not excessive.
Economies of Scale. The Board considered whether there have been economies of scale in respect of the management of the Fidelity funds, whether the Fidelity funds (including the fund) have appropriately benefited from any such economies of scale, and whether there is potential for realization of any further economies of scale. The Board considered the extent to which the fund will benefit from economies of scale as assets grow through increased services to the fund, through waivers or reimbursements, or through fee or expense ratio reductions. The Board also noted that a committee (the Economies of Scale Committee) created by it and the boards of other Fidelity funds periodically analyzes whether Fidelity attains economies of scale in respect of the management and servicing of the Fidelity funds, whether the Fidelity funds have appropriately benefited from such economies of scale, and whether there is potential for realization of any further economies of scale.
The Board recognized that the fund's management contract incorporates a "group fee" structure, which provides for lower group fee rates as total group assets increase, and for higher group fee rates as total group assets decrease (with "group assets" defined to include fund assets under SelectCo's management plus assets under FMR's management). SelectCo calculates the group fee rates based on a tiered asset "breakpoint" schedule that varies based on asset class. The Board considered that the group fee is designed to deliver the benefits of economies of scale to fund shareholders when total group assets increase, even if assets of any particular fund are unchanged or have declined, because some portion of Fidelity's costs are attributable to services provided to all Fidelity funds, and all funds benefit if those costs can be allocated among more assets. The Board concluded that, given the group fee structure, fund shareholders will benefit from lower management fees as group assets increase at the fund complex level, regardless of whether Fidelity achieves any such economies of scale.
The Board concluded, taking into account the analysis of the Economies of Scale Committee, that economies of scale, if any, are being appropriately shared between fund shareholders and Fidelity.
Additional Information Requested by the Board. In order to develop fully the factual basis for consideration of the Fidelity funds' advisory contracts, the Board requested and received additional information on certain topics, including: (i) fund performance trends, in particular the underperformance of certain funds, and Fidelity's long-term strategies for certain funds; (ii) Fidelity's fund profitability methodology, profitability trends for certain funds, and the impact of certain factors on fund profitability results; (iii) metrics for evaluating index fund and ETF performance and information about ETF trading characteristics; (iv) the methodology with respect to the evaluation of competitive fund data and peer group classifications and fee comparisons; (v) the expense structures for different funds and classes; (vi) information regarding other accounts managed by Fidelity, including collective investment trusts; and (vii) Fidelity's philosophies and strategies for evaluating funds and classes with lower or declining asset levels.
Based on its evaluation of all of the conclusions noted above, and after considering all factors it believed relevant, the Board concluded that the advisory fee arrangements are fair and reasonable, and that the fund's Advisory Contracts should be renewed.
VHCIC-SANN-0819
1.817376.114
Fidelity® Variable Insurance Products: Utilities Portfolio
Semi-Annual Report June 30, 2019 |
|
Beginning on January 1, 2021, as permitted by regulations adopted by the Securities and Exchange Commission, and if your insurance carrier elects to participate, you may not be receiving paper copies of the Fund’s shareholder reports from the insurance company that offers your variable insurance product unless you specifically request paper copies from your financial professional or the administrator of your variable insurance product. Instead, the reports will be made available on a website, and you will be notified by mail each time a report is posted and provided with a website link to access the report.
If you already elected to receive shareholder reports electronically, you will not be affected by this change and you need not take any action. You may elect to receive shareholder reports and other communications from the Fund electronically, by contacting your financial professional or the administrator of your variable insurance product. If you own a Fidelity-administered variable insurance product, please visit fidelity.com/mailpreferences to make your election or call 1-800-343-3548.
You may elect to receive all future reports in paper free of charge. If you wish to continue receiving paper copies of your shareholder reports, you may contact your financial professional or the administrator of your variable insurance product. If you own a Fidelity-administered variable insurance product, please visit fidelity.com/mailpreferences to make your election or call 1-800-343-3548. Your election to receive reports in paper will apply to all funds available under your variable insurance product.
Contents
To view a fund's proxy voting guidelines and proxy voting record for the 12-month period ended June 30, visit http://www.fidelity.com/proxyvotingresults or visit the Securities and Exchange Commission's (SEC) web site at http://www.sec.gov.
You may also call 1-877-208-0098 to request a free copy of the proxy voting guidelines.
Fidelity® Variable Insurance Products are separate account options which are purchased through a variable insurance contract.
Standard & Poor's, S&P and S&P 500 are registered service marks of The McGraw-Hill Companies, Inc. and have been licensed for use by Fidelity Distributors Corporation.
Other third-party marks appearing herein are the property of their respective owners.
All other marks appearing herein are registered or unregistered trademarks or service marks of FMR LLC or an affiliated company. © 2019 FMR LLC. All rights reserved.
This report and the financial statements contained herein are submitted for the general information of the shareholders of the Fund. This report is not authorized for distribution to prospective investors in the Fund unless preceded or accompanied by an effective prospectus.
A fund files its complete schedule of portfolio holdings with the SEC for the first and third quarters of each fiscal year on Form N-PORT. Forms N-PORT are available on the SEC’s web site at http://www.sec.gov. A fund's Forms N-PORT may be reviewed and copied at the SEC’s Public Reference Room in Washington, DC. Information regarding the operation of the SEC's Public Reference Room may be obtained by calling 1-800-SEC-0330.
For a complete list of a fund's portfolio holdings, view the most recent holdings listing, semiannual report, or annual report on Fidelity's web site at http://www.fidelity.com, http://www.institutional.fidelity.com, or http://www.401k.com, as applicable.
NOT FDIC INSURED •MAY LOSE VALUE •NO BANK GUARANTEE
Neither the Fund nor Fidelity Distributors Corporation is a bank.
Investment Summary (Unaudited)
Top Ten Stocks as of June 30, 2019
| | % of fund's net assets |
| Dominion Resources, Inc. | 10.2 |
| Exelon Corp. | 10.0 |
| Sempra Energy | 8.1 |
| Southern Co. | 8.0 |
| Edison International | 7.0 |
| Entergy Corp. | 4.9 |
| FirstEnergy Corp. | 4.9 |
| Public Service Enterprise Group, Inc. | 4.8 |
| NextEra Energy, Inc. | 4.2 |
| CenterPoint Energy, Inc. | 3.8 |
| | 65.9 |
Top Industries (% of fund's net assets)
| As of June 30, 2019 |
| | Electric Utilities | 55.2% |
| | Multi-Utilities | 30.2% |
| | Independent Power and Renewable Electricity Producers | 5.3% |
| | Gas Utilities | 3.2% |
| | Oil, Gas & Consumable Fuels | 2.8% |
| | All Others* | 3.3% |

* Includes short-term investments and net other assets (liabilities).
Schedule of Investments June 30, 2019 (Unaudited)
Showing Percentage of Net Assets
| Common Stocks - 99.5% | | | |
| | | Shares | Value |
| Electric Utilities - 55.0% | | | |
| Electric Utilities - 55.0% | | | |
| Duke Energy Corp. | | 68,800 | $6,070,912 |
| Edison International | | 223,529 | 15,068,090 |
| Entergy Corp. | | 103,901 | 10,694,530 |
| Evergy, Inc. | | 109,361 | 6,578,064 |
| Eversource Energy | | 62,700 | 4,750,152 |
| Exelon Corp. | | 452,271 | 21,681,872 |
| FirstEnergy Corp. | | 245,889 | 10,526,508 |
| NextEra Energy, Inc. | | 44,217 | 9,058,295 |
| PG&E Corp. (a) | | 108,400 | 2,484,528 |
| PPL Corp. | | 227,122 | 7,043,053 |
| Southern Co. | | 313,300 | 17,319,224 |
| Vistra Energy Corp. | | 354,455 | 8,024,861 |
| | | | 119,300,089 |
| Gas Utilities - 3.2% | | | |
| Gas Utilities - 3.2% | | | |
| Atmos Energy Corp. | | 50,000 | 5,278,000 |
| Southwest Gas Holdings, Inc. | | 19,400 | 1,738,628 |
| | | | 7,016,628 |
| Independent Power and Renewable Electricity Producers - 5.3% | | | |
| Independent Power Producers & Energy Traders - 2.4% | | | |
| NRG Energy, Inc. | | 96,209 | 3,378,860 |
| NRG Yield, Inc. Class C | | 63,423 | 1,069,312 |
| The AES Corp. | | 41,522 | 695,909 |
| | | | 5,144,081 |
| Renewable Electricity - 2.9% | | | |
| Atlantica Yield PLC | | 133,333 | 3,022,659 |
| NextEra Energy Partners LP | | 69,999 | 3,377,452 |
| | | | 6,400,111 |
|
| TOTAL INDEPENDENT POWER AND RENEWABLE ELECTRICITY PRODUCERS | | | 11,544,192 |
|
| Media - 1.0% | | | |
| Cable & Satellite - 1.0% | | | |
| Altice U.S.A., Inc. Class A | | 85,360 | 2,078,516 |
| Multi-Utilities - 30.2% | | | |
| Multi-Utilities - 30.2% | | | |
| Avangrid, Inc. | | 83,618 | 4,222,709 |
| CenterPoint Energy, Inc. | | 287,867 | 8,241,632 |
| Dominion Resources, Inc. | | 284,657 | 22,009,679 |
| National Grid PLC sponsored ADR | | 24,500 | 1,302,910 |
| Public Service Enterprise Group, Inc. | | 176,735 | 10,395,553 |
| RWE AG | | 68,500 | 1,687,906 |
| Sempra Energy | | 128,451 | 17,654,305 |
| | | | 65,514,694 |
| Oil, Gas & Consumable Fuels - 2.8% | | | |
| Oil & Gas Storage & Transport - 2.8% | | | |
| Cheniere Energy, Inc. (a) | | 88,561 | 6,062,000 |
| Water Utilities - 2.0% | | | |
| Water Utilities - 2.0% | | | |
| SJW Corp. | | 69,900 | 4,247,823 |
| TOTAL COMMON STOCKS | | | |
| (Cost $177,375,653) | | | 215,763,942 |
|
| Nonconvertible Preferred Stocks - 0.2% | | | |
| Electric Utilities - 0.2% | | | |
| Electric Utilities - 0.2% | | | |
| Companhia Energetica de Minas Gerais (CEMIG) (PN) sponsored ADR (non-vtg.) (b) | | | |
| (Cost $426,064) | | 125,500 | 478,155 |
|
| Money Market Funds - 0.6% | | | |
| Fidelity Cash Central Fund 2.42% (c) | | 695,533 | 695,672 |
| Fidelity Securities Lending Cash Central Fund 2.42% (c)(d) | | 501,550 | 501,600 |
| TOTAL MONEY MARKET FUNDS | | | |
| (Cost $1,197,272) | | | 1,197,272 |
| TOTAL INVESTMENT IN SECURITIES - 100.3% | | | |
| (Cost $178,998,989) | | | 217,439,369 |
| NET OTHER ASSETS (LIABILITIES) - (0.3)% | | | (581,714) |
| NET ASSETS - 100% | | | $216,857,655 |
Legend
(a) Non-income producing
(b) Security or a portion of the security is on loan at period end.
(c) Affiliated fund that is generally available only to investment companies and other accounts managed by Fidelity Investments. The rate quoted is the annualized seven-day yield of the fund at period end. A complete unaudited listing of the fund's holdings as of its most recent quarter end is available upon request. In addition, each Fidelity Central Fund's financial statements are available on the SEC's website or upon request.
(d) Investment made with cash collateral received from securities on loan.
Affiliated Central Funds
Information regarding fiscal year to date income earned by the Fund from investments in Fidelity Central Funds is as follows:
| Fund | Income earned |
| Fidelity Cash Central Fund | $40,123 |
| Fidelity Securities Lending Cash Central Fund | 276 |
| Total | $40,399 |
Amounts in the income column in the above table include any capital gain distributions from underlying funds, which are presented in the corresponding line-item in the Statement of Operations, if applicable. Amount for Fidelity Securities Lending Cash Central Fund represents securities lending income earned from the reinvestment of cash collateral from loaned securities, net of payments to and from borrowers of securities.
Investment Valuation
All investments are categorized as Level 1 under the Fair Value Hierarchy. The inputs or methodology used for valuing securities may not be an indication of the risk associated with investing in those securities. For more information on valuation inputs please refer to the Investment Valuation section in the accompanying Notes to Financial Statements.
See accompanying notes which are an integral part of the financial statements.
Financial Statements
Statement of Assets and Liabilities
| | | June 30, 2019 (Unaudited) |
| Assets | | |
Investment in securities, at value (including securities loaned of $477,774) — See accompanying schedule:
Unaffiliated issuers (cost $177,801,717) | $216,242,097 | |
| Fidelity Central Funds (cost $1,197,272) | 1,197,272 | |
| Total Investment in Securities (cost $178,998,989) | | $217,439,369 |
| Receivable for investments sold | | 1,866,154 |
| Receivable for fund shares sold | | 182,201 |
| Dividends receivable | | 185,822 |
| Distributions receivable from Fidelity Central Funds | | 6,831 |
| Prepaid expenses | | 833 |
| Other receivables | | 4,328 |
| Total assets | | 219,685,538 |
| Liabilities | | |
| Payable for investments purchased | $2,176,235 | |
| Payable for fund shares redeemed | 74 | |
| Accrued management fee | 96,328 | |
| Other affiliated payables | 30,478 | |
| Other payables and accrued expenses | 23,168 | |
| Collateral on securities loaned | 501,600 | |
| Total liabilities | | 2,827,883 |
| Net Assets | | $216,857,655 |
| Net Assets consist of: | | |
| Paid in capital | | $177,617,349 |
| Total distributable earnings (loss) | | 39,240,306 |
| Net Assets | | $216,857,655 |
| Net Asset Value and Maximum Offering Price | | |
| Initial Class: | | |
| Net Asset Value, offering price and redemption price per share ($37,725,835 ÷ 2,148,999 shares) | | $17.56 |
| Investor Class: | | |
| Net Asset Value, offering price and redemption price per share ($179,131,820 ÷ 10,276,475 shares) | | $17.43 |
See accompanying notes which are an integral part of the financial statements.
Statement of Operations
| | | Six months ended June 30, 2019 (Unaudited) |
| Investment Income | | |
| Dividends | | $3,143,048 |
| Income from Fidelity Central Funds (including $276 from security lending) | | 40,399 |
| Total income | | 3,183,447 |
| Expenses | | |
| Management fee | $527,816 | |
| Transfer agent fees | 127,959 | |
| Accounting and security lending fees | 38,284 | |
| Custodian fees and expenses | 4,236 | |
| Independent trustees' fees and expenses | 453 | |
| Audit | 19,935 | |
| Legal | 129 | |
| Miscellaneous | 534 | |
| Total expenses before reductions | 719,346 | |
| Expense reductions | (7,106) | |
| Total expenses after reductions | | 712,240 |
| Net investment income (loss) | | 2,471,207 |
| Realized and Unrealized Gain (Loss) | | |
| Net realized gain (loss) on: | | |
| Investment securities: | | |
| Unaffiliated issuers | (743,299) | |
| Foreign currency transactions | 264 | |
| Total net realized gain (loss) | | (743,035) |
| Change in net unrealized appreciation (depreciation) on: | | |
| Investment securities: | | |
| Unaffiliated issuers | 21,437,417 | |
| Assets and liabilities in foreign currencies | 34 | |
| Total change in net unrealized appreciation (depreciation) | | 21,437,451 |
| Net gain (loss) | | 20,694,416 |
| Net increase (decrease) in net assets resulting from operations | | $23,165,623 |
See accompanying notes which are an integral part of the financial statements.
Statement of Changes in Net Assets
| | Six months ended June 30, 2019 (Unaudited) | Year ended December 31, 2018 |
| Increase (Decrease) in Net Assets | | |
| Operations | | |
| Net investment income (loss) | $2,471,207 | $3,174,542 |
| Net realized gain (loss) | (743,035) | 14,634,111 |
| Change in net unrealized appreciation (depreciation) | 21,437,451 | (8,610,508) |
| Net increase (decrease) in net assets resulting from operations | 23,165,623 | 9,198,145 |
| Distributions to shareholders | (13,639,086) | (10,866,229) |
| Share transactions - net increase (decrease) | 31,426,444 | 45,156,386 |
| Total increase (decrease) in net assets | 40,952,981 | 43,488,302 |
| Net Assets | | |
| Beginning of period | 175,904,674 | 132,416,372 |
| End of period | $216,857,655 | $175,904,674 |
See accompanying notes which are an integral part of the financial statements.
Financial Highlights
VIP Utilities Portfolio Initial Class
| | Six months ended (Unaudited) June 30, | Years endedDecember 31, | | | | |
| | 2019 | 2018 | 2017 | 2016 | 2015 | 2014 |
| Selected Per–Share Data | | | | | | |
| Net asset value, beginning of period | $16.81 | $16.73 | $14.49 | $13.17 | $15.62 | $13.45 |
| Income from Investment Operations | | | | | | |
| Net investment income (loss)A | .22 | .40 | .33 | .34 | .31 | .31 |
| Net realized and unrealized gain (loss) | 1.88 | .96 | 2.26 | 1.49 | (1.98) | 2.63 |
| Total from investment operations | 2.10 | 1.36 | 2.59 | 1.83 | (1.67) | 2.94 |
| Distributions from net investment income | (.08) | (.32) | (.35) | (.26) | (.33)B | (.27) |
| Distributions from net realized gain | (1.27) | (.97) | – | (.25) | (.45)B | (.51) |
| Total distributions | (1.35) | (1.28)C | (.35) | (.52)D | (.78) | (.77)E |
| Redemption fees added to paid in capitalA | – | – | –F | .01 | –F | –F |
| Net asset value, end of period | $17.56 | $16.81 | $16.73 | $14.49 | $13.17 | $15.62 |
| Total ReturnG,H,I | 13.17% | 8.82% | 17.88% | 14.17% | (10.78)% | 21.77% |
| Ratios to Average Net AssetsJ,K | | | | | | |
| Expenses before reductions | .67%L | .68% | .69% | .70% | .71% | .70% |
| Expenses net of fee waivers, if any | .67%L | .68% | .69% | .70% | .71% | .70% |
| Expenses net of all reductions | .66%L | .65% | .68% | .69% | .70% | .69% |
| Net investment income (loss) | 2.58%L | 2.36% | 2.06% | 2.30% | 2.17% | 2.01% |
| Supplemental Data | | | | | | |
| Net assets, end of period (000 omitted) | $37,726 | $38,270 | $26,377 | $26,194 | $21,960 | $36,599 |
| Portfolio turnover rateM | 65%L | 113% | 52% | 83% | 88% | 113% |
A Calculated based on average shares outstanding during the period.
B The amounts shown reflect certain reclassifications related to book to tax differences that were made in the year shown.
C Total distributions of $1.28 per share is comprised of distributions from net investment income of $.317 and distributions from net realized gain of $.966 per share.
D Total distributions of $.52 per share is comprised of distributions from net investment income of $.263 and distributions from net realized gain of $.253 per share.
E Total distributions of $.77 per share is comprised of distributions from net investment income of $.267 and distributions from net realized gain of $.506 per share.
F Amount represents less than $.005 per share.
G Total returns for periods of less than one year are not annualized.
H Total returns do not reflect charges attributable to your insurance company's separate account. Inclusion of these charges would reduce the total returns shown.
I Total returns would have been lower if certain expenses had not been reduced during the applicable periods shown.
J Fees and expenses of any underlying Fidelity Central Funds are not included in the Fund's expense ratio. The Fund indirectly bears its proportionate share of the expenses of any underlying Fidelity Central Funds.
K Expense ratios reflect operating expenses of the class. Expenses before reductions do not reflect amounts reimbursed by the investment adviser or reductions from brokerage service arrangements or reductions from other expense offset arrangements and do not represent the amount paid by the class during periods when reimbursements or reductions occur. Expenses net of fee waivers reflect expenses after reimbursement by the investment adviser but prior to reductions from brokerage service arrangements or other expense offset arrangements. Expenses net of all reductions represent the net expenses paid by the class.
L Annualized
M Amount does not include the portfolio activity of any underlying Fidelity Central Funds.
See accompanying notes which are an integral part of the financial statements.
VIP Utilities Portfolio Investor Class
| | Six months ended (Unaudited) June 30, | Years endedDecember 31, | | | | |
| | 2019 | 2018 | 2017 | 2016 | 2015 | 2014 |
| Selected Per–Share Data | | | | | | |
| Net asset value, beginning of period | $16.70 | $16.64 | $14.41 | $13.11 | $15.54 | $13.39 |
| Income from Investment Operations | | | | | | |
| Net investment income (loss)A | .21 | .38 | .32 | .32 | .30 | .29 |
| Net realized and unrealized gain (loss) | 1.87 | .95 | 2.25 | 1.48 | (1.96) | 2.62 |
| Total from investment operations | 2.08 | 1.33 | 2.57 | 1.80 | (1.66) | 2.91 |
| Distributions from net investment income | (.08) | (.31) | (.34) | (.26) | (.31)B | (.26) |
| Distributions from net realized gain | (1.27) | (.97) | – | (.25) | (.45)B | (.51) |
| Total distributions | (1.35) | (1.27)C | (.34) | (.51) | (.77)D | (.76)E |
| Redemption fees added to paid in capitalA | – | – | –F | .01 | –F | –F |
| Net asset value, end of period | $17.43 | $16.70 | $16.64 | $14.41 | $13.11 | $15.54 |
| Total ReturnG,H,I | 13.12% | 8.66% | 17.83% | 14.03% | (10.80)% | 21.64% |
| Ratios to Average Net AssetsJ,K | | | | | | |
| Expenses before reductions | .75%L | .76% | .77% | .78% | .79% | .78% |
| Expenses net of fee waivers, if any | .75%L | .76% | .77% | .78% | .79% | .78% |
| Expenses net of all reductions | .74%L | .73% | .76% | .77% | .78% | .77% |
| Net investment income (loss) | 2.50%L | 2.28% | 1.98% | 2.22% | 2.09% | 1.93% |
| Supplemental Data | | | | | | |
| Net assets, end of period (000 omitted) | $179,132 | $137,635 | $106,040 | $98,360 | $57,645 | $96,217 |
| Portfolio turnover rateM | 65%L | 113% | 52% | 83% | 88% | 113% |
A Calculated based on average shares outstanding during the period.
B The amounts shown reflect certain reclassifications related to book to tax differences that were made in the year shown.
C Total distributions of $1.27 per share is comprised of distributions from net investment income of $.305 and distributions from net realized gain of $.966 per share.
D Total distributions of $.77 per share is comprised of distributions from net investment income of $.314 and distributions from net realized gain of $.454 per share.
E Total distributions of $.76 per share is comprised of distributions from net investment income of $.257 and distributions from net realized gain of $.506 per share.
F Amount represents less than $.005 per share.
G Total returns for periods of less than one year are not annualized.
H Total returns do not reflect charges attributable to your insurance company's separate account. Inclusion of these charges would reduce the total returns shown.
I Total returns would have been lower if certain expenses had not been reduced during the applicable periods shown.
J Fees and expenses of any underlying Fidelity Central Funds are not included in the Fund's expense ratio. The Fund indirectly bears its proportionate share of the expenses of any underlying Fidelity Central Funds.
K Expense ratios reflect operating expenses of the class. Expenses before reductions do not reflect amounts reimbursed by the investment adviser or reductions from brokerage service arrangements or reductions from other expense offset arrangements and do not represent the amount paid by the class during periods when reimbursements or reductions occur. Expenses net of fee waivers reflect expenses after reimbursement by the investment adviser but prior to reductions from brokerage service arrangements or other expense offset arrangements. Expenses net of all reductions represent the net expenses paid by the class.
L Annualized
M Amount does not include the portfolio activity of any underlying Fidelity Central Funds.
See accompanying notes which are an integral part of the financial statements.
Notes to Financial Statements (Unaudited)
For the period ended June 30, 2019
1. Organization.
VIP Utilities Portfolio (the Fund) is a non-diversified fund of Variable Insurance Products Fund IV (the Trust) and is authorized to issue an unlimited number of shares. The Trust is registered under the Investment Company Act of 1940, as amended (the 1940 Act), as an open-end management investment company organized as a Massachusetts business trust. Shares of the Fund may only be purchased by insurance companies for the purpose of funding variable annuity or variable life insurance contracts. The Fund offers the following classes of shares: Initial Class shares and Investor Class shares. All classes have equal rights and voting privileges, except for matters affecting a single class.
2. Investments in Fidelity Central Funds.
The Fund invests in Fidelity Central Funds, which are open-end investment companies generally available only to other investment companies and accounts managed by the investment adviser and its affiliates. The Fund's Schedule of Investments lists each of the Fidelity Central Funds held as of period end, if any, as an investment of the Fund, but does not include the underlying holdings of each Fidelity Central Fund. As an Investing Fund, the Fund indirectly bears its proportionate share of the expenses of the underlying Fidelity Central Funds.
The Money Market Central Funds seek preservation of capital and current income and are managed by Fidelity Investments Money Management, Inc. (FIMM), an affiliate of the investment adviser. Annualized expenses of the Money Market Central Funds as of their most recent shareholder report date ranged from less than .005% to .01%.
A complete unaudited list of holdings for each Fidelity Central Fund is available upon request or at the Securities and Exchange Commission (the SEC) website at www.sec.gov. In addition, the financial statements of the Fidelity Central Funds are available on the SEC website or upon request.
3. Significant Accounting Policies.
The Fund is an investment company and applies the accounting and reporting guidance of the Financial Accounting Standards Board (FASB) Accounting Standards Codification Topic 946 Financial Services – Investments Companies. The financial statements have been prepared in conformity with accounting principles generally accepted in the United States of America (GAAP), which require management to make certain estimates and assumptions at the date of the financial statements. Actual results could differ from those estimates. Subsequent events, if any, through the date that the financial statements were issued have been evaluated in the preparation of the financial statements. The following summarizes the significant accounting policies of the Fund:
Investment Valuation. Investments are valued as of 4:00 p.m. Eastern time on the last calendar day of the period. The Board of Trustees (the Board) has delegated the day to day responsibility for the valuation of the Fund's investments to the Fair Value Committee (the Committee) established by the Fund's investment adviser. In accordance with valuation policies and procedures approved by the Board, the Fund attempts to obtain prices from one or more third party pricing vendors or brokers to value its investments. When current market prices, quotations or currency exchange rates are not readily available or reliable, investments will be fair valued in good faith by the Committee, in accordance with procedures adopted by the Board. Factors used in determining fair value vary by investment type and may include market or investment specific events. The frequency with which these procedures are used cannot be predicted and they may be utilized to a significant extent. The Committee oversees the Fund's valuation policies and procedures and reports to the Board on the Committee's activities and fair value determinations. The Board monitors the appropriateness of the procedures used in valuing the Fund's investments and ratifies the fair value determinations of the Committee.
The Fund categorizes the inputs to valuation techniques used to value its investments into a disclosure hierarchy consisting of three levels as shown below:
- Level 1 – quoted prices in active markets for identical investments
- Level 2 – other significant observable inputs (including quoted prices for similar investments, interest rates, prepayment speeds, etc.)
- Level 3 – unobservable inputs (including the Fund's own assumptions based on the best information available)
Valuation techniques used to value the Fund's investments by major category are as follows:
Equity securities, including restricted securities, for which market quotations are readily available, are valued at the last reported sale price or official closing price as reported by a third party pricing vendor on the primary market or exchange on which they are traded and are categorized as Level 1 in the hierarchy. In the event there were no sales during the day or closing prices are not available, securities are valued at the last quoted bid price or may be valued using the last available price and are generally categorized as Level 2 in the hierarchy. For foreign equity securities, when market or security specific events arise, comparisons to the valuation of American Depositary Receipts (ADRs), futures contracts, Exchange-Traded Funds (ETFs) and certain indexes as well as quoted prices for similar securities may be used and would be categorized as Level 2 in the hierarchy. For equity securities, including restricted securities, where observable inputs are limited, assumptions about market activity and risk are used and these securities may be categorized as Level 3 in the hierarchy.
Investments in open-end mutual funds, including the Fidelity Central Funds, are valued at their closing net asset value (NAV) each business day and are categorized as Level 1 in the hierarchy.
Changes in valuation techniques may result in transfers in or out of an assigned level within the disclosure hierarchy.
Foreign Currency. The Fund may use foreign currency contracts to facilitate transactions in foreign-denominated securities. Gains and losses from these transactions may arise from changes in the value of the foreign currency or if the counterparties do not perform under the contracts' terms.
Foreign-denominated assets, including investment securities, and liabilities are translated into U.S. dollars at the exchange rates at period end. Purchases and sales of investment securities, income and dividends received and expenses denominated in foreign currencies are translated into U.S. dollars at the exchange rate in effect on the transaction date.
The effects of exchange rate fluctuations on investments are included with the net realized and unrealized gain (loss) on investment securities. Other foreign currency transactions resulting in realized and unrealized gain (loss) are disclosed separately.
Investment Transactions and Income. For financial reporting purposes, the Fund's investment holdings and NAV include trades executed through the end of the last business day of the period. The NAV per share for processing shareholder transactions is calculated as of the close of business of the New York Stock Exchange (NYSE), normally 4:00 p.m. Eastern time and includes trades executed through the end of the prior business day. Gains and losses on securities sold are determined on the basis of identified cost and include proceeds received from litigation. Dividend income is recorded on the ex-dividend date, except for certain dividends from foreign securities where the ex-dividend date may have passed, which are recorded as soon as the Fund is informed of the ex-dividend date. Non-cash dividends included in dividend income, if any, are recorded at the fair market value of the securities received. Income and capital gain distributions from Fidelity Central Funds, if any, are recorded on the ex-dividend date. Certain distributions received by the Fund represent a return of capital or capital gain. The Fund determines the components of these distributions subsequent to the ex-dividend date, based upon receipt of tax filings or other correspondence relating to the underlying investment. These distributions are recorded as a reduction of cost of investments and/or as a realized gain. Investment income is recorded net of foreign taxes withheld where recovery of such taxes is uncertain.
Class Allocations and Expenses. Investment income, realized and unrealized capital gains and losses, common expenses of the Fund, and certain fund-level expense reductions, if any, are allocated daily on a pro-rata basis to each class based on the relative net assets of each class to the total net assets of the Fund. Each class differs with respect to transfer agent fees incurred. Certain expense reductions may also differ by class. For the reporting period, the allocated portion of income and expenses to each class as a percent of its average net assets may vary due to the timing of recording these transactions in relation to fluctuating net assets of the classes. Expenses directly attributable to a fund are charged to that fund. Expenses attributable to more than one fund are allocated among the respective funds on the basis of relative net assets or other appropriate methods. Expense estimates are accrued in the period to which they relate and adjustments are made when actual amounts are known.
Income Tax Information and Distributions to Shareholders. Each year, the Fund intends to qualify as a regulated investment company under Subchapter M of the Internal Revenue Code, including distributing substantially all of its taxable income and realized gains. As a result, no provision for U.S. Federal income taxes is required. The Fund files a U.S. federal tax return, in addition to state and local tax returns as required. The Fund's federal income tax returns are subject to examination by the Internal Revenue Service (IRS) for a period of three fiscal years after they are filed. State and local tax returns may be subject to examination for an additional fiscal year depending on the jurisdiction. Foreign taxes are provided for based on the Fund's understanding of the tax rules and rates that exist in the foreign markets in which it invests.
Distributions are declared and recorded on the ex-dividend date. Income and capital gain distributions are declared separately for each class. Income and capital gain distributions are determined in accordance with income tax regulations, which may differ from GAAP.
Capital accounts within the financial statements are adjusted for permanent book-tax differences. These adjustments have no impact on net assets or the results of operations. Capital accounts are not adjusted for temporary book-tax differences which will reverse in a subsequent period.
Book-tax differences are primarily due to foreign currency transactions, partnerships and losses deferred due to wash sales and excise tax regulations.
As of period end, the cost and unrealized appreciation (depreciation) in securities, and derivatives if applicable, for federal income tax purposes were as follows:
| Gross unrealized appreciation | $38,751,081 |
| Gross unrealized depreciation | (2,106,716) |
| Net unrealized appreciation (depreciation) | $36,644,365 |
| Tax cost | $180,795,004 |
The Fund elected to defer to its next fiscal year approximately $649,742 of capital losses recognized during the period November 1, 2018 to December 31, 2018.
4. Purchases and Sales of Investments.
Purchases and sales of securities, other than short-term securities, aggregated $84,994,864 and $63,208,823, respectively.
5. Fees and Other Transactions with Affiliates.
Management Fee. Fidelity SelectCo, LLC (the investment adviser) and its affiliates provide the Fund with investment management related services for which the Fund pays a monthly management fee. The management fee is the sum of an individual fund fee rate that is based on an annual rate of .30% of the Fund's average net assets and an annualized group fee rate that averaged .24% during the period. The group fee rate is based upon the average net assets of all the mutual funds advised by Fidelity Management & Research Company (FMR) and the investment adviser. The group fee rate decreases as assets under management increase and increases as assets under management decrease. For the reporting period, the total annualized management fee rate was .54% of the Fund's average net assets.
Transfer Agent Fees. Fidelity Investments Institutional Operations Company, Inc. (FIIOC), an affiliate of the investment adviser, is the Fund's transfer, dividend disbursing, and shareholder servicing agent. FIIOC receives an asset-based fee with respect to each class. Each class pays a fee for transfer agent services, typesetting and printing and mailing of shareholder reports, excluding mailing of proxy statements, equal to an annual rate of class-level average net assets. The annual rate for Investor Class is .15% and the annual rate for all other classes is .07%. For the period, transfer agent fees for each class were as follows:
| Initial Class | $11,615 |
| Investor Class | 116,344 |
| | $127,959 |
Accounting and Security Lending Fees. Fidelity Service Company, Inc. (FSC), an affiliate of the investment adviser, maintains the Fund's accounting records. The accounting fee is based on the level of average net assets for each month. Prior to April 1, 2019, FSC had a separate agreement with the Fund for administration of the security lending program, based on the number and duration of lending transactions. For the period, the total fees paid for accounting and administration of securities lending were equivalent to an annualized rate of .04%.
Brokerage Commissions. The Fund placed a portion of its portfolio transactions with brokerage firms which are affiliates of the investment adviser. Brokerage commissions are included in net realized gain (loss) and change in net unrealized appreciation (depreciation) in the Statement of Operations. The commissions paid to these affiliated firms were $2,563 for the period.
Interfund Trades. The Fund may purchase from or sell securities to other Fidelity Funds under procedures adopted by the Board. The procedures have been designed to ensure these interfund trades are executed in accordance with Rule 17a-7 of the 1940 Act. Interfund trades are included within the respective purchases and sales amounts shown in the Purchases and Sales of Investments note.
6. Committed Line of Credit.
The Fund participates with other funds managed by the investment adviser or an affiliate in a $4.25 billion credit facility (the "line of credit") to be utilized for temporary or emergency purposes to fund shareholder redemptions or for other short-term liquidity purposes. The Fund has agreed to pay commitment fees on its pro-rata portion of the line of credit, which amounted to $246 and is reflected in Miscellaneous expenses on the Statement of Operations. During the period, the Fund did not borrow on this line of credit.
7. Security Lending.
The Fund lends portfolio securities from time to time in order to earn additional income. For equity securities, lending agents are used, including National Financial Services (NFS), an affiliate of the Fund. Pursuant to a securities lending agreement, NFS will receive a fee, which is capped at 9.9% of daily lending revenue, for its services as lending agent. The Fund may lend securities to certain qualified borrowers. On the settlement date of the loan, the Fund receives collateral (in the form of U.S. Treasury obligations, letters of credit and/or cash) against the loaned securities and maintains collateral in an amount not less than 100% of the market value of the loaned securities during the period of the loan. The market value of the loaned securities is determined at the close of business of the Fund and any additional required collateral is delivered to the Fund on the next business day. The Fund or borrower may terminate the loan at any time, and if the borrower defaults on its obligation to return the securities loaned because of insolvency or other reasons, the Fund may apply collateral received from the borrower against the obligation. The Fund may experience delays and costs in recovering the securities loaned. Any cash collateral received is invested in the Fidelity Securities Lending Cash Central Fund. The value of loaned securities and cash collateral at period end are disclosed on the Fund's Statement of Assets and Liabilities. Security lending income represents the income earned on investing cash collateral, less rebates paid to borrowers and any lending agent fees associated with the loan, plus any premium payments received for lending certain types of securities. Security lending income is presented in the Statement of Operations as a component of income from Fidelity Central Funds.
8. Expense Reductions.
Commissions paid to certain brokers with whom the investment adviser, or its affiliates, places trades on behalf of the Fund include an amount in addition to trade execution, which may be rebated back to the Fund to offset certain expenses. This amount totaled $6,339 for the period. In addition, through arrangements with the Fund's custodian, credits realized as a result of certain uninvested cash balances were used to reduce the Fund's expenses. During the period, these credits reduced the Fund's custody expenses by $67.
In addition, during the period the investment adviser reimbursed and/or waived a portion of fund-level operating expenses in the amount of $700.
9. Distributions to Shareholders.
Distributions to shareholders of each class were as follows:
| | Six months ended
June 30, 2019 | Year ended
December 31, 2018 |
| Distributions to shareholders | | |
| Initial Class | $2,553,431 | $2,229,433 |
| Investor Class | 11,085,655 | 8,636,796 |
| Total | $13,639,086 | $10,866,229 |
10. Share Transactions.
Transactions for each class of shares were as follows:
| | Shares | Shares | Dollars | Dollars |
| | Six months ended June 30, 2019 | Year ended December 31, 2018 | Six months ended June 30, 2019 | Year ended December 31, 2018 |
| Initial Class | | | | |
| Shares sold | 375,208 | 912,835 | $6,366,311 | $16,146,381 |
| Reinvestment of distributions | 157,522 | 139,901 | 2,553,431 | 2,229,433 |
| Shares redeemed | (660,410) | (352,627) | (11,108,095) | (5,850,455) |
| Net increase (decrease) | (127,680) | 700,109 | $(2,188,353) | $12,525,359 |
| Investor Class | | | | |
| Shares sold | 2,047,296 | 2,551,740 | $34,377,754 | $44,264,874 |
| Reinvestment of distributions | 688,550 | 547,114 | 11,085,655 | 8,636,796 |
| Shares redeemed | (698,712) | (1,233,881) | (11,848,612) | (20,270,643) |
| Net increase (decrease) | 2,037,134 | 1,864,973 | $33,614,797 | $32,631,027 |
11. Other.
The Fund's organizational documents provide former and current trustees and officers with a limited indemnification against liabilities arising in connection with the performance of their duties to the Fund. In the normal course of business, the Fund may also enter into contracts that provide general indemnifications. The Fund's maximum exposure under these arrangements is unknown as this would be dependent on future claims that may be made against the Fund. The risk of material loss from such claims is considered remote.
At the end of the period, the investment adviser or its affiliates were the owners of record of 100% of the total outstanding shares of the Fund.
Shareholder Expense Example
As a shareholder of the Fund, you incur two types of costs: (1) transaction costs and (2) ongoing costs, including management fees and other Fund expenses. This Example is intended to help you understand your ongoing costs (in dollars) of investing in the Fund and to compare these costs with the ongoing costs of investing in other mutual funds.
The Example is based on an investment of $1,000 invested at the beginning of the period and held for the entire period (January 1, 2019 to June 30, 2019).
Actual Expenses
The first line of the accompanying table for each class of the Fund provides information about actual account values and actual expenses. You may use the information in this line, together with the amount you invested, to estimate the expenses that you paid over the period. Simply divide your account value by $1,000.00 (for example, an $8,600 account value divided by $1,000.00 = 8.6), then multiply the result by the number in the first line for a class of the Fund under the heading entitled "Expenses Paid During Period" to estimate the expenses you paid on your account during this period. The estimate of expenses does not include any fees or other expenses of any variable annuity or variable life insurance product. If they were, the estimate of expenses you paid during the period would be higher, and your ending account value would be lower. In addition, the Fund, as a shareholder in the underlying Fidelity Central Funds, will indirectly bear its pro-rata share of the fees and expenses incurred by the underlying Fidelity Central Funds. These fees and expenses are not included in the Fund's annualized expense ratio used to calculate the expense estimate in the table below.
Hypothetical Example for Comparison Purposes
The second line of the accompanying table for each class of the Fund provides information about hypothetical account values and hypothetical expenses based on a Class' actual expense ratio and an assumed rate of return of 5% per year before expenses, which is not the Class' actual return. The hypothetical account values and expenses may not be used to estimate the actual ending account balance or expenses you paid for the period. You may use this information to compare the ongoing costs of investing in the Fund and other funds. To do so, compare this 5% hypothetical example with the 5% hypothetical examples that appear in the shareholder reports of the other funds. The estimate of expenses does not include any fees or other expenses of any variable annuity or variable life insurance product. If they were, the estimate of expenses you paid during the period would be higher, and your ending account value would be lower. In addition, the Fund, as a shareholder in the underlying Fidelity Central Funds, will indirectly bear its pro-rata share of the fees and expenses incurred by the underlying Fidelity Central Funds. These fees and expenses are not included in the Fund's annualized expense ratio used to calculate the expense estimate in the table below.
Please note that the expenses shown in the table are meant to highlight your ongoing costs only and do not reflect any transaction costs. Therefore, the second line of the table is useful in comparing ongoing costs only, and will not help you determine the relative total costs of owning different funds.
| | Annualized Expense Ratio-A | Beginning
Account Value
January 1, 2019 | Ending
Account Value
June 30, 2019 | Expenses Paid
During Period-B
January 1, 2019
to June 30, 2019 |
| Initial Class | .67% | | | |
| Actual | | $1,000.00 | $1,131.70 | $3.54 |
| Hypothetical-C | | $1,000.00 | $1,021.47 | $3.36 |
| Investor Class | .75% | | | |
| Actual | | $1,000.00 | $1,131.20 | $3.96 |
| Hypothetical-C | | $1,000.00 | $1,021.08 | $3.76 |
A Annualized expense ratio reflects expenses net of applicable fee waivers.
B Expenses are equal to each Class' annualized expense ratio, multiplied by the average account value over the period, multiplied by 181/365 (to reflect the one-half year period).
C 5% return per year before expenses
Board Approval of Investment Advisory Contracts and Management Fees
VIP Utilities Portfolio
Each year, the Board of Trustees, including the Independent Trustees (together, the Board), votes on the renewal of the management contract with Fidelity SelectCo, LLC (SelectCo), an affiliate of Fidelity Management & Research Company (FMR), and the sub-advisory agreements with affiliates of FMR (together, the Advisory Contracts) for the fund. SelectCo and the sub-advisers are referred to herein as the Investment Advisers. The Board, assisted by the advice of fund counsel and Independent Trustees' counsel, requests and considers a broad range of information relevant to the renewal of the Advisory Contracts throughout the year.
The Board meets regularly and, at each of its meetings, covers an extensive agenda of topics and materials and considers factors that are relevant to its annual consideration of the renewal of the fund's Advisory Contracts, including the services and support provided to the fund and its shareholders. The Board has established various standing committees (Committees), each composed of and chaired by Independent Trustees with varying backgrounds, to which the Board has assigned specific subject matter responsibilities in order to enhance effective decision-making by the Board. The Board, acting directly and through its Committees, requests and receives information concerning the annual consideration of the renewal of the fund's Advisory Contracts. The Board also meets as needed to review matters specifically related to the Board's annual consideration of the renewal of the Advisory Contracts. Members of the Board may also meet with trustees of other Fidelity funds through joint ad hoc committees to discuss certain matters relevant to all of the Fidelity funds.
At its January 2019 meeting, the Board unanimously determined to renew the fund's Advisory Contracts. In reaching its determination, the Board considered all factors it believed relevant, including (i) the nature, extent, and quality of the services to be provided to the fund and its shareholders (including the investment performance of the fund); (ii) the competitiveness of the fund's management fee and total expense ratio relative to peer funds; (iii) the total costs of the services to be provided by and the profits to be realized by Fidelity from its relationships with the fund; and (iv) the extent to which, if any, economies of scale exist and would be realized as the fund grows, and whether any economies of scale are appropriately shared with fund shareholders.
In considering whether to renew the Advisory Contracts for the fund, the Board reached a determination, with the assistance of fund counsel and Independent Trustees' counsel and through the exercise of its business judgment, that the renewal of the Advisory Contracts was in the best interests of the fund and its shareholders and that the compensation payable under the Advisory Contracts was fair and reasonable. The Board's decision to renew the Advisory Contracts was not based on any single factor, but rather was based on a comprehensive consideration of all the information provided to the Board at its meetings throughout the year. The Board, in reaching its determination to renew the Advisory Contracts, was aware that shareholders of the fund have a broad range of investment choices available to them, including a wide choice among funds offered by Fidelity's competitors, and that the fund's shareholders, who have the opportunity to review and weigh the disclosure provided by the fund in its prospectus and other public disclosures, have chosen to invest in this fund, which is part of the Fidelity family of funds.
Nature, Extent, and Quality of Services Provided. The Board considered Fidelity's staffing as it relates to the fund, including the backgrounds of investment personnel of Fidelity, and also considered the fund's investment objective, strategies, and related investment philosophy. The Independent Trustees also had discussions with senior management of Fidelity's investment operations and investment groups. The Board considered the structure of the investment personnel compensation program and whether this structure provides appropriate incentives to act in the best interests of the fund. Additionally, the Board considered the portfolio managers' investments, if any, in the funds that they manage.
Resources Dedicated to Investment Management and Support Services. The Board and the Fund Oversight and Research Committees reviewed the general qualifications and capabilities of Fidelity's investment staff, including its size, education, experience, and resources, as well as Fidelity's approach to recruiting, training, managing, and compensating investment personnel. The Board noted that Fidelity has continued to increase the resources devoted to non-U.S. offices, including expansion of Fidelity's global investment organization. The Board also noted that Fidelity's analysts have extensive resources, tools and capabilities that allow them to conduct sophisticated quantitative and fundamental analysis, as well as credit analysis of issuers, counterparties and guarantors. Further, the Board considered that Fidelity's investment professionals have sufficient access to global information and data so as to provide competitive investment results over time, and that those professionals also have access to sophisticated tools that permit them to assess portfolio construction and risk and performance attribution characteristics continuously, as well as to transmit new information and research conclusions rapidly around the world. Additionally, in its deliberations, the Board considered Fidelity's trading, risk management, compliance, and technology and operations capabilities and resources, which are integral parts of the investment management process.
Shareholder and Administrative Services. The Board considered (i) the nature, extent, quality, and cost of advisory, administrative, and shareholder services performed by the Investment Advisers and their affiliates under the Advisory Contracts and under separate agreements covering transfer agency, pricing and bookkeeping, and securities lending services for the fund; (ii) the nature and extent of the supervision of third party service providers, principally custodians, subcustodians, and pricing vendors; and (iii) the resources devoted to, and the record of compliance with, the fund's compliance policies and procedures. The Board also reviewed the allocation of fund brokerage, including allocations to brokers affiliated with the Investment Advisers, the use of brokerage commissions to pay fund expenses, and the use of "soft" commission dollars to pay for research services.
The Board noted that the growth of fund assets over time across the complex allows Fidelity to reinvest in the development of services designed to enhance the value and convenience of the Fidelity funds as investment vehicles. These services include 24-hour access to account information and market information through telephone representatives and over the Internet, investor education materials and asset allocation tools, and the expanded availability of Fidelity Investor Centers.
The Board noted that it and the boards of certain other Fidelity funds had formed an ad hoc Committee on Transfer Agency Fees to review the variety of transfer agency fee structures throughout the industry and Fidelity's competitive positioning with respect to industry participants.
Investment in a Large Fund Family. The Board considered the benefits to shareholders of investing in a Fidelity fund, including the benefits of investing in a fund that is part of a large family of funds offering a variety of investment disciplines and providing a large variety of mutual fund investor services. The Board noted that Fidelity had taken, or had made recommendations that resulted in the Fidelity funds taking, a number of actions over the previous year that benefited particular funds, including: (i) continuing to dedicate additional resources to Fidelity's investment research process, which includes meetings with management of issuers of securities in which the funds invest, and to the support of the senior management team that oversees asset management; (ii) continuing efforts to enhance Fidelity's global research capabilities; (iii) launching new funds and making other enhancements to meet client needs; (iv) launching new share classes of existing funds; (v) eliminating purchase minimums and broadening eligibility requirements for certain funds and share classes; (vi) reducing management fees and total expenses for certain growth equity funds and index funds; (vii) lowering expense caps for certain existing funds and classes, and converting certain voluntary expense caps to contractual caps, to reduce expenses borne by shareholders; (viii) eliminating short-term redemption fees for funds that had such fees; (ix) rationalizing product lines and gaining increased efficiencies from fund mergers and share class consolidations; (x) continuing to develop, acquire and implement systems and technology to improve services to the funds and shareholders, strengthen information security, and increase efficiency; and (xi) continuing to implement enhancements to further strengthen Fidelity's product line to increase investors' probability of success in achieving their investment goals, including retirement income goals.
Investment Performance. The Board considered whether the fund has operated in accordance with its investment objective, as well as its record of compliance with its investment restrictions and its performance history.
The Board took into account discussions that occur at Board meetings throughout the year with representatives of the Investment Advisers about fund investment performance. In this regard the Board noted that as part of regularly scheduled fund reviews and other reports to the Board on fund performance, the Board considers annualized return information for the fund for different time periods, measured against an appropriate securities market index ("benchmark index"). In its evaluation of fund investment performance, the Board gave particular attention to information indicating changes in performance of certain Fidelity funds for specific time periods and discussed with the Investment Advisers the reasons for any overperformance or underperformance.
In addition to reviewing absolute and relative fund performance, the Independent Trustees periodically consider the appropriateness of fund performance metrics in evaluating the results achieved. In general, the Independent Trustees believe that fund performance should be evaluated based on net performance (after fees and expenses) of both the highest performing and lowest performing fund share classes, where applicable, compared to appropriate benchmark indices, over appropriate time periods that may include full market cycles, taking into account relevant factors including the following: general market conditions; issuer-specific information; and fund cash flows and other factors.
The Independent Trustees recognize that shareholders evaluate performance on a net basis over their own holding periods, for which one-, three-, and five-year periods are often used as a proxy. For this reason, the performance information reviewed by the Board also included net cumulative total return information for the fund and an appropriate benchmark index for the most recent one-, three-, and five-year periods ended June 30, 2018, as shown below.
VIP Utilities Portfolio
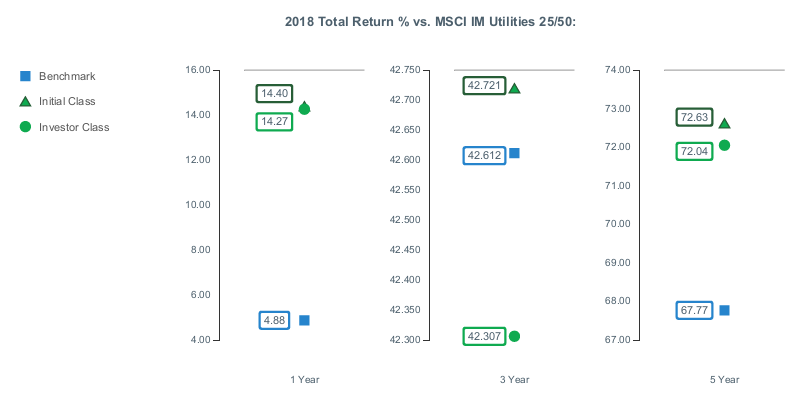
Based on its review, the Board concluded that the nature, extent, and quality of services provided to the fund under the Advisory Contracts should continue to benefit the shareholders of the fund.
Competitiveness of Management Fee and Total Expense Ratio. The Board considered the fund's management fee and total expense ratio compared to "mapped groups" of competitive funds and classes created for the purpose of facilitating the Trustees' competitive analysis of management fees and total expenses. Fidelity creates "mapped groups" by combining similar Lipper investment objective categories that have comparable investment mandates. For this purpose, all sector focused equity variable annuity funds are grouped in the same mapped group. Combining Lipper investment objective categories aids the Board's management fee and total expense ratio comparisons by broadening the competitive group used for comparison.
Management Fee. The Board considered two proprietary management fee comparisons for the 12-month periods ended June 30 shown in basis points (BP) in the chart below. The group of Lipper funds used by the Board for management fee comparisons is referred to below as the "Total Mapped Group." The Total Mapped Group comparison focuses on a fund's standing in terms of gross management fees before expense reimbursements or caps relative to the total universe of funds with comparable investment mandates (i.e., sector equities), regardless of whether their management fee structures also are comparable. Funds with comparable management fee structures have similar management fee contractual arrangements (
e.g., flat rate charged for advisory services, all-inclusive fee rate,
etc.). "TMG %" represents the percentage of funds in the Total Mapped Group that had management fees that were lower than the fund's. For example, a hypothetical TMG % of 20% would mean that 80% of the funds in the Total Mapped Group had higher, and 20% had lower, management fees than the fund. The fund's actual TMG %s and the number of funds in the Total Mapped Group are in the chart below. The "Asset-Size Peer Group" (ASPG) comparison focuses on a fund's standing relative to a subset of non-Fidelity funds within the Total Mapped Group that are similar in size and management fee structure. For example, if a fund is in the first quartile of the ASPG, the fund's management fee ranks in the least expensive or lowest 25% of funds in the ASPG. The ASPG represents at least 15% of the funds in the Total Mapped Group with comparable asset size and management fee structures, subject to a minimum of 50 funds (or all funds in the Total Mapped Group if fewer than 50). Additional information, such as the ASPG quartile in which the fund's management fee rate ranked, is also included in the chart and was considered by the Board.
VIP Utilities Portfolio

The Board noted that the fund's management fee rate ranked below the median of its Total Mapped Group and below the median of its ASPG for the 12-month period ended June 30, 2018.
The Board noted that it and the boards of other Fidelity funds formed an ad hoc Committee on Group Fee, which meets periodically, to conduct an in-depth review of the "group fee" component of the management fee of funds with such management fee structures. The Committee's focus included the mechanics of the group fee, the competitive landscape of group fee structures, Fidelity funds with no group fee component and investment products not included in group fee assets. The Board also considered that, for funds subject to the group fee, FMR agreed to voluntarily waive fees over a specified period of time in amounts designed to account for assets converted from certain funds to certain collective investment trusts.
Based on its review, the Board concluded that the fund's management fee is fair and reasonable in light of the services that the fund receives and the other factors considered.
Total Expense Ratio. In its review of each class's total expense ratio, the Board considered the fund's management fee rate as well as other fund or class expenses, as applicable, such as transfer agent fees, pricing and bookkeeping fees, and custodial, legal, and audit fees. The Board also noted that Fidelity may agree to waive fees and expenses from time to time, and the extent to which, if any, it has done so for the fund. As part of its review, the Board also considered the current and historical total expense ratios of each class of the fund compared to competitive fund median expenses. Each class of the fund is compared to those funds and classes in the Total Mapped Group (used by the Board for management fee comparisons) that have a similar sales load structure.
The Board noted that the total expense ratio of each class ranked below the competitive median for the 12-month period ended June 30, 2018.
Fees Charged to Other Fidelity Clients. The Board also considered Fidelity fee structures and other information with respect to clients of Fidelity, such as other funds advised or subadvised by Fidelity, pension plan clients, and other institutional clients with similar mandates. The Board noted that a joint ad hoc committee created by it and the boards of other Fidelity funds periodically reviews and compares Fidelity's institutional investment advisory business with its business of providing services to the Fidelity funds, and also noted the most recent findings of the committee. The Board noted that the committee's review included a consideration of the differences in services provided, fees charged, and costs incurred, as well as competition in the markets serving the different categories of clients.
Based on its review of total expense ratios and fees charged to other Fidelity clients, the Board concluded that the total expense ratio of each class of the fund was reasonable in light of the services that the fund and its shareholders receive and the other factors considered.
Costs of the Services and Profitability. The Board considered the revenues earned and the expenses incurred by Fidelity in conducting the business of developing, marketing, distributing, managing, administering and servicing the fund and servicing the fund's shareholders. The Board also considered the level of Fidelity's profits in respect of all the Fidelity funds.
On an annual basis, Fidelity presents to the Board information about the profitability of its relationships with the fund. Fidelity calculates profitability information for each fund, as well as aggregate profitability information for groups of Fidelity funds and all Fidelity funds, using a series of detailed revenue and cost allocation methodologies which originate with the books and records of Fidelity on which Fidelity's audited financial statements are based. The Audit Committee of the Board reviews any significant changes from the prior year's methodologies.
PricewaterhouseCoopers LLP (PwC), auditor to Fidelity and certain Fidelity funds, has been engaged annually by the Board as part of the Board's assessment of Fidelity's profitability analysis. PwC's engagement includes the review and assessment of the methodologies used by Fidelity in determining the revenues and expenses attributable to Fidelity's mutual fund business, and completion of agreed-upon procedures in respect of the mathematical accuracy of the fund profitability information and its conformity to established allocation methodologies. After considering PwC's reports issued under the engagement and information provided by Fidelity, the Board concluded that while other allocation methods may also be reasonable, Fidelity's profitability methodologies are reasonable in all material respects.
The Board also reviewed Fidelity's non-fund businesses and potential indirect benefits such businesses may have received as a result of their association with Fidelity's mutual fund business (i.e., fall-out benefits) as well as cases where Fidelity's affiliates may benefit from the fund's business. The Board noted that changes to fall-out benefits year-over-year reflect business developments at Fidelity's various businesses.
The Board considered the costs of the services provided by and the profits realized by Fidelity in connection with the operation of the fund and was satisfied that the profitability was not excessive.
Economies of Scale. The Board considered whether there have been economies of scale in respect of the management of the Fidelity funds, whether the Fidelity funds (including the fund) have appropriately benefited from any such economies of scale, and whether there is potential for realization of any further economies of scale. The Board considered the extent to which the fund will benefit from economies of scale as assets grow through increased services to the fund, through waivers or reimbursements, or through fee or expense ratio reductions. The Board also noted that a committee (the Economies of Scale Committee) created by it and the boards of other Fidelity funds periodically analyzes whether Fidelity attains economies of scale in respect of the management and servicing of the Fidelity funds, whether the Fidelity funds have appropriately benefited from such economies of scale, and whether there is potential for realization of any further economies of scale.
The Board recognized that the fund's management contract incorporates a "group fee" structure, which provides for lower group fee rates as total group assets increase, and for higher group fee rates as total group assets decrease (with "group assets" defined to include fund assets under SelectCo's management plus assets under FMR's management). SelectCo calculates the group fee rates based on a tiered asset "breakpoint" schedule that varies based on asset class. The Board considered that the group fee is designed to deliver the benefits of economies of scale to fund shareholders when total group assets increase, even if assets of any particular fund are unchanged or have declined, because some portion of Fidelity's costs are attributable to services provided to all Fidelity funds, and all funds benefit if those costs can be allocated among more assets. The Board concluded that, given the group fee structure, fund shareholders will benefit from lower management fees as group assets increase at the fund complex level, regardless of whether Fidelity achieves any such economies of scale.
The Board concluded, taking into account the analysis of the Economies of Scale Committee, that economies of scale, if any, are being appropriately shared between fund shareholders and Fidelity.
Additional Information Requested by the Board. In order to develop fully the factual basis for consideration of the Fidelity funds' advisory contracts, the Board requested and received additional information on certain topics, including: (i) fund performance trends, in particular the underperformance of certain funds, and Fidelity's long-term strategies for certain funds; (ii) Fidelity's fund profitability methodology, profitability trends for certain funds, and the impact of certain factors on fund profitability results; (iii) metrics for evaluating index fund and ETF performance and information about ETF trading characteristics; (iv) the methodology with respect to the evaluation of competitive fund data and peer group classifications and fee comparisons; (v) the expense structures for different funds and classes; (vi) information regarding other accounts managed by Fidelity, including collective investment trusts; and (vii) Fidelity's philosophies and strategies for evaluating funds and classes with lower or declining asset levels.
Based on its evaluation of all of the conclusions noted above, and after considering all factors it believed relevant, the Board concluded that the advisory fee arrangements are fair and reasonable, and that the fund's Advisory Contracts should be renewed.
VTELIC-SANN-0819
1.817394.114
Fidelity® Variable Insurance Products: Financial Services Portfolio
Semi-Annual Report June 30, 2019 |
|
Beginning on January 1, 2021, as permitted by regulations adopted by the Securities and Exchange Commission, and if your insurance carrier elects to participate, you may not be receiving paper copies of the Fund’s shareholder reports from the insurance company that offers your variable insurance product unless you specifically request paper copies from your financial professional or the administrator of your variable insurance product. Instead, the reports will be made available on a website, and you will be notified by mail each time a report is posted and provided with a website link to access the report.
If you already elected to receive shareholder reports electronically, you will not be affected by this change and you need not take any action. You may elect to receive shareholder reports and other communications from the Fund electronically, by contacting your financial professional or the administrator of your variable insurance product. If you own a Fidelity-administered variable insurance product, please visit fidelity.com/mailpreferences to make your election or call 1-800-343-3548.
You may elect to receive all future reports in paper free of charge. If you wish to continue receiving paper copies of your shareholder reports, you may contact your financial professional or the administrator of your variable insurance product. If you own a Fidelity-administered variable insurance product, please visit fidelity.com/mailpreferences to make your election or call 1-800-343-3548. Your election to receive reports in paper will apply to all funds available under your variable insurance product.
Contents
To view a fund's proxy voting guidelines and proxy voting record for the 12-month period ended June 30, visit http://www.fidelity.com/proxyvotingresults or visit the Securities and Exchange Commission's (SEC) web site at http://www.sec.gov.
You may also call 1-877-208-0098 to request a free copy of the proxy voting guidelines.
Fidelity® Variable Insurance Products are separate account options which are purchased through a variable insurance contract.
Standard & Poor's, S&P and S&P 500 are registered service marks of The McGraw-Hill Companies, Inc. and have been licensed for use by Fidelity Distributors Corporation.
Other third-party marks appearing herein are the property of their respective owners.
All other marks appearing herein are registered or unregistered trademarks or service marks of FMR LLC or an affiliated company. © 2019 FMR LLC. All rights reserved.
This report and the financial statements contained herein are submitted for the general information of the shareholders of the Fund. This report is not authorized for distribution to prospective investors in the Fund unless preceded or accompanied by an effective prospectus.
A fund files its complete schedule of portfolio holdings with the SEC for the first and third quarters of each fiscal year on Form N-PORT. Forms N-PORT are available on the SEC’s web site at http://www.sec.gov. A fund's Forms N-PORT may be reviewed and copied at the SEC’s Public Reference Room in Washington, DC. Information regarding the operation of the SEC's Public Reference Room may be obtained by calling 1-800-SEC-0330.
For a complete list of a fund's portfolio holdings, view the most recent holdings listing, semiannual report, or annual report on Fidelity's web site at http://www.fidelity.com, http://www.institutional.fidelity.com, or http://www.401k.com, as applicable.
NOT FDIC INSURED •MAY LOSE VALUE •NO BANK GUARANTEE
Neither the Fund nor Fidelity Distributors Corporation is a bank.
Investment Summary (Unaudited)
Top Ten Stocks as of June 30, 2019
| | % of fund's net assets |
| Citigroup, Inc. | 7.3 |
| Bank of America Corp. | 6.0 |
| Berkshire Hathaway, Inc. Class B | 5.5 |
| Wells Fargo & Co. | 4.9 |
| Capital One Financial Corp. | 4.1 |
| The Travelers Companies, Inc. | 4.1 |
| Hartford Financial Services Group, Inc. | 3.9 |
| JPMorgan Chase & Co. | 3.7 |
| PNC Financial Services Group, Inc. | 3.5 |
| Cboe Global Markets, Inc. | 3.4 |
| | 46.4 |
Top Industries (% of fund's net assets)
| As of June 30, 2019 |
| | Banks | 35.7% |
| | Insurance | 25.7% |
| | Capital Markets | 13.3% |
| | Consumer Finance | 10.7% |
| | Diversified Financial Services | 5.5% |
| | All Others* | 9.1% |

* Includes short-term investments and net other assets (liabilities).
Schedule of Investments June 30, 2019 (Unaudited)
Showing Percentage of Net Assets
| Common Stocks - 98.9% | | | |
| | | Shares | Value |
| Banks - 35.7% | | | |
| Diversified Banks - 21.9% | | | |
| Bank of America Corp. | | 330,500 | $9,584,500 |
| Citigroup, Inc. | | 165,300 | 11,575,959 |
| JPMorgan Chase & Co. | | 52,154 | 5,830,817 |
| Wells Fargo & Co. | | 163,796 | 7,750,827 |
| | | | 34,742,103 |
| Regional Banks - 13.8% | | | |
| BOK Financial Corp. | | 8,942 | 674,942 |
| First Citizens Bancshares, Inc. | | 2,700 | 1,215,729 |
| First Hawaiian, Inc. | | 43,800 | 1,133,106 |
| First Horizon National Corp. | | 71,862 | 1,072,900 |
| Huntington Bancshares, Inc. | | 287,370 | 3,971,453 |
| KeyCorp | | 100,600 | 1,785,650 |
| M&T Bank Corp. | | 10,100 | 1,717,707 |
| PNC Financial Services Group, Inc. | | 40,200 | 5,518,656 |
| Signature Bank | | 17,200 | 2,078,448 |
| SunTrust Banks, Inc. | | 43,100 | 2,708,835 |
| | | | 21,877,426 |
|
| TOTAL BANKS | | | 56,619,529 |
|
| Capital Markets - 13.3% | | | |
| Asset Management & Custody Banks - 2.7% | | | |
| Bank of New York Mellon Corp. | | 57,500 | 2,538,625 |
| Oaktree Capital Group LLC Class A | | 34,516 | 1,709,923 |
| | | | 4,248,548 |
| Financial Exchanges & Data - 3.4% | | | |
| Cboe Global Markets, Inc. | | 51,727 | 5,360,469 |
| Investment Banking & Brokerage - 7.2% | | | |
| E*TRADE Financial Corp. | | 57,500 | 2,564,500 |
| Goldman Sachs Group, Inc. | | 2,870 | 587,202 |
| Hamilton Lane, Inc. Class A | | 31,600 | 1,803,096 |
| Morgan Stanley | | 65,200 | 2,856,412 |
| PJT Partners, Inc. | | 18,700 | 757,724 |
| TD Ameritrade Holding Corp. | | 31,900 | 1,592,448 |
| Tradeweb Markets, Inc. Class A | | 7,200 | 315,432 |
| Virtu Financial, Inc. Class A (a) | | 47,400 | 1,032,372 |
| | | | 11,509,186 |
|
| TOTAL CAPITAL MARKETS | | | 21,118,203 |
|
| Consumer Finance - 10.7% | | | |
| Consumer Finance - 10.7% | | | |
| American Express Co. | | 34,500 | 4,258,680 |
| Capital One Financial Corp. | | 71,800 | 6,515,132 |
| OneMain Holdings, Inc. | | 85,800 | 2,900,898 |
| SLM Corp. | | 330,500 | 3,212,460 |
| | | | 16,887,170 |
| Diversified Financial Services - 5.5% | | | |
| Multi-Sector Holdings - 5.5% | | | |
| Berkshire Hathaway, Inc. Class B (b) | | 40,568 | 8,647,881 |
| Household Durables - 0.4% | | | |
| Homebuilding - 0.4% | | | |
| D.R. Horton, Inc. | | 14,800 | 638,324 |
| Insurance - 25.7% | | | |
| Insurance Brokers - 2.8% | | | |
| Willis Group Holdings PLC | | 23,000 | 4,405,420 |
| Life & Health Insurance - 1.9% | | | |
| Torchmark Corp. | | 33,090 | 2,960,231 |
| Multi-Line Insurance - 7.6% | | | |
| American International Group, Inc. | | 83,300 | 4,438,224 |
| Assurant, Inc. | | 13,100 | 1,393,578 |
| Hartford Financial Services Group, Inc. | | 112,100 | 6,246,212 |
| | | | 12,078,014 |
| Property & Casualty Insurance - 10.4% | | | |
| Axis Capital Holdings Ltd. | | 35,900 | 2,141,435 |
| Beazley PLC | | 175,800 | 1,231,264 |
| FNF Group | | 114,970 | 4,633,291 |
| Hiscox Ltd. | | 62,900 | 1,351,567 |
| RSA Insurance Group PLC | | 90,100 | 659,989 |
| The Travelers Companies, Inc. | | 43,512 | 6,505,914 |
| | | | 16,523,460 |
| Reinsurance - 3.0% | | | |
| Reinsurance Group of America, Inc. | | 30,300 | 4,727,709 |
|
| TOTAL INSURANCE | | | 40,694,834 |
|
| IT Services - 1.4% | | | |
| Data Processing & Outsourced Services - 1.4% | | | |
| Visa, Inc. Class A | | 12,900 | 2,238,795 |
| Mortgage Real Estate Investment Trusts - 2.9% | | | |
| Mortgage REITs - 2.9% | | | |
| AGNC Investment Corp. | | 145,000 | 2,438,900 |
| MFA Financial, Inc. | | 289,900 | 2,081,482 |
| | | | 4,520,382 |
| Software - 1.0% | | | |
| Application Software - 1.0% | | | |
| Black Knight, Inc. (b) | | 26,099 | 1,569,855 |
| Thrifts & Mortgage Finance - 2.3% | | | |
| Thrifts & Mortgage Finance - 2.3% | | | |
| Essent Group Ltd. (b) | | 38,800 | 1,823,212 |
| MGIC Investment Corp. (b) | | 143,700 | 1,888,218 |
| | | | 3,711,430 |
| TOTAL COMMON STOCKS | | | |
| (Cost $125,985,918) | | | 156,646,403 |
|
| Money Market Funds - 1.5% | | | |
| Fidelity Cash Central Fund 2.42% (c) | | 1,390,131 | 1,390,409 |
| Fidelity Securities Lending Cash Central Fund 2.42% (c)(d) | | 1,023,943 | 1,024,045 |
| TOTAL MONEY MARKET FUNDS | | | |
| (Cost $2,414,454) | | | 2,414,454 |
| TOTAL INVESTMENT IN SECURITIES - 100.4% | | | |
| (Cost $128,400,372) | | | 159,060,857 |
| NET OTHER ASSETS (LIABILITIES) - (0.4)% | | | (663,105) |
| NET ASSETS - 100% | | | $158,397,752 |
Legend
(a) Security or a portion of the security is on loan at period end.
(b) Non-income producing
(c) Affiliated fund that is generally available only to investment companies and other accounts managed by Fidelity Investments. The rate quoted is the annualized seven-day yield of the fund at period end. A complete unaudited listing of the fund's holdings as of its most recent quarter end is available upon request. In addition, each Fidelity Central Fund's financial statements are available on the SEC's website or upon request.
(d) Investment made with cash collateral received from securities on loan.
Affiliated Central Funds
Information regarding fiscal year to date income earned by the Fund from investments in Fidelity Central Funds is as follows:
| Fund | Income earned |
| Fidelity Cash Central Fund | $28,420 |
| Fidelity Securities Lending Cash Central Fund | 121 |
| Total | $28,541 |
Amounts in the income column in the above table include any capital gain distributions from underlying funds, which are presented in the corresponding line-item in the Statement of Operations, if applicable. Amount for Fidelity Securities Lending Cash Central Fund represents securities lending income earned from the reinvestment of cash collateral from loaned securities, net of payments to and from borrowers of securities.
Investment Valuation
All investments are categorized as Level 1 under the Fair Value Hierarchy. The inputs or methodology used for valuing securities may not be an indication of the risk associated with investing in those securities. For more information on valuation inputs please refer to the Investment Valuation section in the accompanying Notes to Financial Statements.
See accompanying notes which are an integral part of the financial statements.
Financial Statements
Statement of Assets and Liabilities
| | | June 30, 2019 (Unaudited) |
| Assets | | |
Investment in securities, at value (including securities loaned of $1,030,194) — See accompanying schedule:
Unaffiliated issuers (cost $125,985,918) | $156,646,403 | |
| Fidelity Central Funds (cost $2,414,454) | 2,414,454 | |
| Total Investment in Securities (cost $128,400,372) | | $159,060,857 |
| Receivable for investments sold | | 3,347,106 |
| Receivable for fund shares sold | | 47,936 |
| Dividends receivable | | 202,491 |
| Distributions receivable from Fidelity Central Funds | | 2,598 |
| Prepaid expenses | | 1,745 |
| Other receivables | | 3,146 |
| Total assets | | 162,665,879 |
| Liabilities | | |
| Payable for investments purchased | $3,054,825 | |
| Payable for fund shares redeemed | 69,521 | |
| Accrued management fee | 71,445 | |
| Other affiliated payables | 22,823 | |
| Other payables and accrued expenses | 25,468 | |
| Collateral on securities loaned | 1,024,045 | |
| Total liabilities | | 4,268,127 |
| Net Assets | | $158,397,752 |
| Net Assets consist of: | | |
| Paid in capital | | $125,924,455 |
| Total distributable earnings (loss) | | 32,473,297 |
| Net Assets | | $158,397,752 |
| Net Asset Value and Maximum Offering Price | | |
| Initial Class: | | |
| Net Asset Value, offering price and redemption price per share ($24,630,318 ÷ 2,018,633 shares) | | $12.20 |
| Investor Class: | | |
| Net Asset Value, offering price and redemption price per share ($133,767,434 ÷ 11,015,270 shares) | | $12.14 |
See accompanying notes which are an integral part of the financial statements.
Statement of Operations
| | | Six months ended June 30, 2019 (Unaudited) |
| Investment Income | | |
| Dividends | | $2,004,099 |
| Income from Fidelity Central Funds (including $121 from security lending) | | 28,541 |
| Total income | | 2,032,640 |
| Expenses | | |
| Management fee | $443,379 | |
| Transfer agent fees | 109,489 | |
| Accounting and security lending fees | 32,062 | |
| Custodian fees and expenses | 5,416 | |
| Independent trustees' fees and expenses | 402 | |
| Audit | 20,735 | |
| Legal | 3,281 | |
| Miscellaneous | 778 | |
| Total expenses before reductions | 615,542 | |
| Expense reductions | (6,124) | |
| Total expenses after reductions | | 609,418 |
| Net investment income (loss) | | 1,423,222 |
| Realized and Unrealized Gain (Loss) | | |
| Net realized gain (loss) on: | | |
| Investment securities: | | |
| Unaffiliated issuers | 1,175,840 | |
| Fidelity Central Funds | 3 | |
| Foreign currency transactions | (1,110) | |
| Total net realized gain (loss) | | 1,174,733 |
| Change in net unrealized appreciation (depreciation) on: | | |
| Investment securities: | | |
| Unaffiliated issuers | 25,090,615 | |
| Assets and liabilities in foreign currencies | 2 | |
| Total change in net unrealized appreciation (depreciation) | | 25,090,617 |
| Net gain (loss) | | 26,265,350 |
| Net increase (decrease) in net assets resulting from operations | | $27,688,572 |
See accompanying notes which are an integral part of the financial statements.
Statement of Changes in Net Assets
| | Six months ended June 30, 2019 (Unaudited) | Year ended December 31, 2018 |
| Increase (Decrease) in Net Assets | | |
| Operations | | |
| Net investment income (loss) | $1,423,222 | $2,608,525 |
| Net realized gain (loss) | 1,174,733 | 12,057,883 |
| Change in net unrealized appreciation (depreciation) | 25,090,617 | (47,028,121) |
| Net increase (decrease) in net assets resulting from operations | 27,688,572 | (32,361,713) |
| Distributions to shareholders | (12,777,541) | (7,356,991) |
| Share transactions - net increase (decrease) | (14,645,864) | (37,604,333) |
| Redemption fees | – | 6,648 |
| Total increase (decrease) in net assets | 265,167 | (77,316,389) |
| Net Assets | | |
| Beginning of period | 158,132,585 | 235,448,974 |
| End of period | $158,397,752 | $158,132,585 |
See accompanying notes which are an integral part of the financial statements.
Financial Highlights
VIP Financial Services Portfolio Initial Class
| | Six months ended (Unaudited) June 30, | Years endedDecember 31, | | | | |
| | 2019 | 2018 | 2017 | 2016 | 2015 | 2014 |
| Selected Per–Share Data | | | | | | |
| Net asset value, beginning of period | $11.15 | $13.72 | $11.50 | $9.74 | $10.23 | $9.33 |
| Income from Investment Operations | | | | | | |
| Net investment income (loss)A | .11 | .17 | .11 | .12 | .10 | .12 |
| Net realized and unrealized gain (loss) | 1.87 | (2.28) | 2.33 | 1.70 | (.48) | .90 |
| Total from investment operations | 1.98 | (2.11) | 2.44 | 1.82 | (.38) | 1.02 |
| Distributions from net investment income | (.06) | (.16) | (.09) | (.06) | (.11) | (.12) |
| Distributions from net realized gain | (.87) | (.29) | (.13) | – | – | – |
| Total distributions | (.93) | (.46)B | (.22) | (.06) | (.11) | (.12) |
| Redemption fees added to paid in capitalA | – | –C | –C | –C | –C | –C |
| Net asset value, end of period | $12.20 | $11.15 | $13.72 | $11.50 | $9.74 | $10.23 |
| Total ReturnD,E,F | 18.44% | (15.73)% | 21.25% | 18.72% | (3.69)% | 10.88% |
| Ratios to Average Net AssetsG,H | | | | | | |
| Expenses before reductions | .68%I | .67% | .69% | .72% | .71% | .73% |
| Expenses net of fee waivers, if any | .68%I | .67% | .69% | .72% | .71% | .72% |
| Expenses net of all reductions | .67%I | .66% | .69% | .71% | .71% | .72% |
| Net investment income (loss) | 1.80%I | 1.25% | .91% | 1.18% | 1.02% | 1.21% |
| Supplemental Data | | | | | | |
| Net assets, end of period (000 omitted) | $24,630 | $24,142 | $44,248 | $41,404 | $20,570 | $23,351 |
| Portfolio turnover rateJ | 37%I | 59% | 72% | 87% | 59% | 58% |
A Calculated based on average shares outstanding during the period.
B Total distributions of $.46 per share is comprised of distributions from net investment income of $.163 and distributions from net realized gain of $.294 per share.
C Amount represents less than $.005 per share.
D Total returns for periods of less than one year are not annualized.
E Total returns do not reflect charges attributable to your insurance company's separate account. Inclusion of these charges would reduce the total returns shown.
F Total returns would have been lower if certain expenses had not been reduced during the applicable periods shown.
G Fees and expenses of any underlying Fidelity Central Funds are not included in the Fund's expense ratio. The Fund indirectly bears its proportionate share of the expenses of any underlying Fidelity Central Funds.
H Expense ratios reflect operating expenses of the class. Expenses before reductions do not reflect amounts reimbursed by the investment adviser or reductions from brokerage service arrangements or reductions from other expense offset arrangements and do not represent the amount paid by the class during periods when reimbursements or reductions occur. Expenses net of fee waivers reflect expenses after reimbursement by the investment adviser but prior to reductions from brokerage service arrangements or other expense offset arrangements. Expenses net of all reductions represent the net expenses paid by the class.
I Annualized
J Amount does not include the portfolio activity of any underlying Fidelity Central Funds.
See accompanying notes which are an integral part of the financial statements.
VIP Financial Services Portfolio Investor Class
| | Six months ended (Unaudited) June 30, | Years endedDecember 31, | | | | |
| | 2019 | 2018 | 2017 | 2016 | 2015 | 2014 |
| Selected Per–Share Data | | | | | | |
| Net asset value, beginning of period | $11.10 | $13.66 | $11.45 | $9.71 | $10.19 | $9.30 |
| Income from Investment Operations | | | | | | |
| Net investment income (loss)A | .10 | .15 | .10 | .11 | .09 | .11 |
| Net realized and unrealized gain (loss) | 1.87 | (2.26) | 2.32 | 1.69 | (.47) | .89 |
| Total from investment operations | 1.97 | (2.11) | 2.42 | 1.80 | (.38) | 1.00 |
| Distributions from net investment income | (.05) | (.15) | (.08) | (.06) | (.10) | (.11) |
| Distributions from net realized gain | (.87) | (.29) | (.13) | – | – | – |
| Total distributions | (.93)B | (.45)C | (.21) | (.06) | (.10) | (.11) |
| Redemption fees added to paid in capitalA | – | –D | –D | –D | –D | –D |
| Net asset value, end of period | $12.14 | $11.10 | $13.66 | $11.45 | $9.71 | $10.19 |
| Total ReturnE,F,G | 18.41% | (15.82)% | 21.18% | 18.51% | (3.68)% | 10.75% |
| Ratios to Average Net AssetsH,I | | | | | | |
| Expenses before reductions | .76%J | .75% | .77% | .80% | .79% | .80% |
| Expenses net of fee waivers, if any | .76%J | .75% | .77% | .80% | .79% | .80% |
| Expenses net of all reductions | .75%J | .74% | .77% | .79% | .78% | .79% |
| Net investment income (loss) | 1.72%J | 1.17% | .83% | 1.10% | .95% | 1.14% |
| Supplemental Data | | | | | | |
| Net assets, end of period (000 omitted) | $133,767 | $133,990 | $191,201 | $129,912 | $90,950 | $83,817 |
| Portfolio turnover rateK | 37%J | 59% | 72% | 87% | 59% | 58% |
A Calculated based on average shares outstanding during the period.
B Total distributions of $.93 per share is comprised of distributions from net investment income of $.053 and distributions from net realized gain of $.874 per share.
C Total distributions of $.45 per share is comprised of distributions from net investment income of $.151 and distributions from net realized gain of $.294 per share.
D Amount represents less than $.005 per share.
E Total returns for periods of less than one year are not annualized.
F Total returns do not reflect charges attributable to your insurance company's separate account. Inclusion of these charges would reduce the total returns shown.
G Total returns would have been lower if certain expenses had not been reduced during the applicable periods shown.
H Fees and expenses of any underlying Fidelity Central Funds are not included in the Fund's expense ratio. The Fund indirectly bears its proportionate share of the expenses of any underlying Fidelity Central Funds.
I Expense ratios reflect operating expenses of the class. Expenses before reductions do not reflect amounts reimbursed by the investment adviser or reductions from brokerage service arrangements or reductions from other expense offset arrangements and do not represent the amount paid by the class during periods when reimbursements or reductions occur. Expenses net of fee waivers reflect expenses after reimbursement by the investment adviser but prior to reductions from brokerage service arrangements or other expense offset arrangements. Expenses net of all reductions represent the net expenses paid by the class.
J Annualized
K Amount does not include the portfolio activity of any underlying Fidelity Central Funds.
See accompanying notes which are an integral part of the financial statements.
Notes to Financial Statements (Unaudited)
For the period ended June 30, 2019
1. Organization.
VIP Financial Services Portfolio (the Fund) is a non-diversified fund of Variable Insurance Products Fund IV (the Trust) and is authorized to issue an unlimited number of shares. The Trust is registered under the Investment Company Act of 1940, as amended (the 1940 Act), as an open-end management investment company organized as a Massachusetts business trust. Shares of the Fund may only be purchased by insurance companies for the purpose of funding variable annuity or variable life insurance contracts. The Fund offers the following classes of shares: Initial Class shares and Investor Class shares. All classes have equal rights and voting privileges, except for matters affecting a single class.
2. Investments in Fidelity Central Funds.
The Fund invests in Fidelity Central Funds, which are open-end investment companies generally available only to other investment companies and accounts managed by the investment adviser and its affiliates. The Fund's Schedule of Investments lists each of the Fidelity Central Funds held as of period end, if any, as an investment of the Fund, but does not include the underlying holdings of each Fidelity Central Fund. As an Investing Fund, the Fund indirectly bears its proportionate share of the expenses of the underlying Fidelity Central Funds.
The Money Market Central Funds seek preservation of capital and current income and are managed by Fidelity Investments Money Management, Inc. (FIMM), an affiliate of the investment adviser. Annualized expenses of the Money Market Central Funds as of their most recent shareholder report date ranged from less than .005% to .01%.
A complete unaudited list of holdings for each Fidelity Central Fund is available upon request or at the Securities and Exchange Commission (the SEC) website at www.sec.gov. In addition, the financial statements of the Fidelity Central Funds are available on the SEC website or upon request.
3. Significant Accounting Policies.
The Fund is an investment company and applies the accounting and reporting guidance of the Financial Accounting Standards Board (FASB) Accounting Standards Codification Topic 946 Financial Services – Investments Companies. The financial statements have been prepared in conformity with accounting principles generally accepted in the United States of America (GAAP), which require management to make certain estimates and assumptions at the date of the financial statements. Actual results could differ from those estimates. Subsequent events, if any, through the date that the financial statements were issued have been evaluated in the preparation of the financial statements. The following summarizes the significant accounting policies of the Fund:
Investment Valuation. Investments are valued as of 4:00 p.m. Eastern time on the last calendar day of the period. The Board of Trustees (the Board) has delegated the day to day responsibility for the valuation of the Fund's investments to the Fair Value Committee (the Committee) established by the Fund's investment adviser. In accordance with valuation policies and procedures approved by the Board, the Fund attempts to obtain prices from one or more third party pricing vendors or brokers to value its investments. When current market prices, quotations or currency exchange rates are not readily available or reliable, investments will be fair valued in good faith by the Committee, in accordance with procedures adopted by the Board. Factors used in determining fair value vary by investment type and may include market or investment specific events. The frequency with which these procedures are used cannot be predicted and they may be utilized to a significant extent. The Committee oversees the Fund's valuation policies and procedures and reports to the Board on the Committee's activities and fair value determinations. The Board monitors the appropriateness of the procedures used in valuing the Fund's investments and ratifies the fair value determinations of the Committee.
The Fund categorizes the inputs to valuation techniques used to value its investments into a disclosure hierarchy consisting of three levels as shown below:
- Level 1 – quoted prices in active markets for identical investments
- Level 2 – other significant observable inputs (including quoted prices for similar investments, interest rates, prepayment speeds, etc.)
- Level 3 – unobservable inputs (including the Fund's own assumptions based on the best information available)
Valuation techniques used to value the Fund's investments by major category are as follows:
Equity securities, including restricted securities, for which market quotations are readily available, are valued at the last reported sale price or official closing price as reported by a third party pricing vendor on the primary market or exchange on which they are traded and are categorized as Level 1 in the hierarchy. In the event there were no sales during the day or closing prices are not available, securities are valued at the last quoted bid price or may be valued using the last available price and are generally categorized as Level 2 in the hierarchy. For foreign equity securities, when market or security specific events arise, comparisons to the valuation of American Depositary Receipts (ADRs), futures contracts, Exchange-Traded Funds (ETFs) and certain indexes as well as quoted prices for similar securities may be used and would be categorized as Level 2 in the hierarchy. For equity securities, including restricted securities, where observable inputs are limited, assumptions about market activity and risk are used and these securities may be categorized as Level 3 in the hierarchy.
Investments in open-end mutual funds, including the Fidelity Central Funds, are valued at their closing net asset value (NAV) each business day and are categorized as Level 1 in the hierarchy.
Changes in valuation techniques may result in transfers in or out of an assigned level within the disclosure hierarchy.
Foreign Currency. The Fund may use foreign currency contracts to facilitate transactions in foreign-denominated securities. Gains and losses from these transactions may arise from changes in the value of the foreign currency or if the counterparties do not perform under the contracts' terms.
Foreign-denominated assets, including investment securities, and liabilities are translated into U.S. dollars at the exchange rates at period end. Purchases and sales of investment securities, income and dividends received and expenses denominated in foreign currencies are translated into U.S. dollars at the exchange rate in effect on the transaction date.
The effects of exchange rate fluctuations on investments are included with the net realized and unrealized gain (loss) on investment securities. Other foreign currency transactions resulting in realized and unrealized gain (loss) are disclosed separately.
Investment Transactions and Income. For financial reporting purposes, the Fund's investment holdings and NAV include trades executed through the end of the last business day of the period. The NAV per share for processing shareholder transactions is calculated as of the close of business of the New York Stock Exchange (NYSE), normally 4:00 p.m. Eastern time and includes trades executed through the end of the prior business day. Gains and losses on securities sold are determined on the basis of identified cost and include proceeds received from litigation. Dividend income is recorded on the ex-dividend date, except for certain dividends from foreign securities where the ex-dividend date may have passed, which are recorded as soon as the Fund is informed of the ex-dividend date. Non-cash dividends included in dividend income, if any, are recorded at the fair market value of the securities received. Income and capital gain distributions from Fidelity Central Funds, if any, are recorded on the ex-dividend date. Certain distributions received by the Fund represent a return of capital or capital gain. The Fund determines the components of these distributions subsequent to the ex-dividend date, based upon receipt of tax filings or other correspondence relating to the underlying investment. These distributions are recorded as a reduction of cost of investments and/or as a realized gain. Investment income is recorded net of foreign taxes withheld where recovery of such taxes is uncertain.
Class Allocations and Expenses. Investment income, realized and unrealized capital gains and losses, common expenses of the Fund, and certain fund-level expense reductions, if any, are allocated daily on a pro-rata basis to each class based on the relative net assets of each class to the total net assets of the Fund. Each class differs with respect to transfer agent fees incurred. Certain expense reductions may also differ by class. For the reporting period, the allocated portion of income and expenses to each class as a percent of its average net assets may vary due to the timing of recording these transactions in relation to fluctuating net assets of the classes. Expenses directly attributable to a fund are charged to that fund. Expenses attributable to more than one fund are allocated among the respective funds on the basis of relative net assets or other appropriate methods. Expense estimates are accrued in the period to which they relate and adjustments are made when actual amounts are known.
Income Tax Information and Distributions to Shareholders. Each year, the Fund intends to qualify as a regulated investment company under Subchapter M of the Internal Revenue Code, including distributing substantially all of its taxable income and realized gains. As a result, no provision for U.S. Federal income taxes is required. The Fund files a U.S. federal tax return, in addition to state and local tax returns as required. The Fund's federal income tax returns are subject to examination by the Internal Revenue Service (IRS) for a period of three fiscal years after they are filed. State and local tax returns may be subject to examination for an additional fiscal year depending on the jurisdiction. Foreign taxes are provided for based on the Fund's understanding of the tax rules and rates that exist in the foreign markets in which it invests.
Distributions are declared and recorded on the ex-dividend date. Income and capital gain distributions are declared separately for each class. Income and capital gain distributions are determined in accordance with income tax regulations, which may differ from GAAP.
Capital accounts within the financial statements are adjusted for permanent book-tax differences. These adjustments have no impact on net assets or the results of operations. Capital accounts are not adjusted for temporary book-tax differences which will reverse in a subsequent period.
Book-tax differences are primarily due to foreign currency transactions, partnerships and certain losses related to wash sales.
As of period end, the cost and unrealized appreciation (depreciation) in securities, and derivatives if applicable, for federal income tax purposes were as follows:
| Gross unrealized appreciation | $32,831,891 |
| Gross unrealized depreciation | (2,588,569) |
| Net unrealized appreciation (depreciation) | $30,243,322 |
| Tax cost | $128,817,535 |
4. Purchases and Sales of Investments.
Purchases and sales of securities, other than short-term securities, aggregated $29,749,552 and $53,320,457, respectively.
5. Fees and Other Transactions with Affiliates.
Management Fee. Fidelity SelectCo, LLC (the investment adviser) and its affiliates provide the Fund with investment management related services for which the Fund pays a monthly management fee. The management fee is the sum of an individual fund fee rate that is based on an annual rate of .30% of the Fund's average net assets and an annualized group fee rate that averaged .24% during the period. The group fee rate is based upon the average net assets of all the mutual funds advised by Fidelity Management & Research Company (FMR) and the investment adviser. The group fee rate decreases as assets under management increase and increases as assets under management decrease. For the reporting period, the total annualized management fee rate was .54% of the Fund's average net assets.
Transfer Agent Fees. Fidelity Investments Institutional Operations Company, Inc. (FIIOC), an affiliate of the investment adviser, is the Fund's transfer, dividend disbursing, and shareholder servicing agent. FIIOC receives an asset-based fee with respect to each class. Each class pays a fee for transfer agent services, typesetting and printing and mailing of shareholder reports, excluding mailing of proxy statements, equal to an annual rate of class-level average net assets. The annual rate for Investor Class is .15% and the annual rate for all other classes is .07%. For the period, transfer agent fees for each class were as follows:
| Initial Class | $8,112 |
| Investor Class | 101,377 |
| | $109,489 |
Accounting and Security Lending Fees. Fidelity Service Company, Inc. (FSC), an affiliate of the investment adviser, maintains the Fund's accounting records. The accounting fee is based on the level of average net assets for each month. Prior to April 1, 2019, FSC had a separate agreement with the Fund for administration of the security lending program, based on the number and duration of lending transactions. For the period, the total fees paid for accounting and administration of securities lending were equivalent to an annualized rate of .04%.
Brokerage Commissions. The Fund placed a portion of its portfolio transactions with brokerage firms which are affiliates of the investment adviser. Brokerage commissions are included in net realized gain (loss) and change in net unrealized appreciation (depreciation) in the Statement of Operations. The commissions paid to these affiliated firms were $920 for the period.
Interfund Trades. The Fund may purchase from or sell securities to other Fidelity Funds under procedures adopted by the Board. The procedures have been designed to ensure these interfund trades are executed in accordance with Rule 17a-7 of the 1940 Act. Interfund trades are included within the respective purchases and sales amounts shown in the Purchases and Sales of Investments note.
6. Committed Line of Credit.
The Fund participates with other funds managed by the investment adviser or an affiliate in a $4.25 billion credit facility (the "line of credit") to be utilized for temporary or emergency purposes to fund shareholder redemptions or for other short-term liquidity purposes. The Fund has agreed to pay commitment fees on its pro-rata portion of the line of credit, which amounted to $251 and is reflected in Miscellaneous expenses on the Statement of Operations. During the period, the Fund did not borrow on this line of credit.
7. Security Lending.
The Fund lends portfolio securities from time to time in order to earn additional income. For equity securities, lending agents are used, including National Financial Services (NFS), an affiliate of the Fund. Pursuant to a securities lending agreement, NFS will receive a fee, which is capped at 9.9% of daily lending revenue, for its services as lending agent. The Fund may lend securities to certain qualified borrowers. On the settlement date of the loan, the Fund receives collateral (in the form of U.S. Treasury obligations, letters of credit and/or cash) against the loaned securities and maintains collateral in an amount not less than 100% of the market value of the loaned securities during the period of the loan. The market value of the loaned securities is determined at the close of business of the Fund and any additional required collateral is delivered to the Fund on the next business day. The Fund or borrower may terminate the loan at any time, and if the borrower defaults on its obligation to return the securities loaned because of insolvency or other reasons, the Fund may apply collateral received from the borrower against the obligation. The Fund may experience delays and costs in recovering the securities loaned. Any cash collateral received is invested in the Fidelity Securities Lending Cash Central Fund. The value of loaned securities and cash collateral at period end are disclosed on the Fund's Statement of Assets and Liabilities. Security lending income represents the income earned on investing cash collateral, less rebates paid to borrowers and any lending agent fees associated with the loan, plus any premium payments received for lending certain types of securities. Security lending income is presented in the Statement of Operations as a component of income from Fidelity Central Funds.
8. Expense Reductions.
Commissions paid to certain brokers with whom the investment adviser, or its affiliates, places trades on behalf of the Fund include an amount in addition to trade execution, which may be rebated back to the Fund to offset certain expenses. This amount totaled $5,430 for the period. In addition, through arrangements with the Fund's custodian, credits realized as a result of certain uninvested cash balances were used to reduce the Fund's expenses. During the period, these credits reduced the Fund's custody expenses by $28.
In addition, during the period the investment adviser reimbursed and/or waived a portion of fund-level operating expenses in the amount of $666.
9. Distributions to Shareholders.
Distributions to shareholders of each class were as follows:
| | Six months ended
June 30, 2019 | Year ended
December 31, 2018 |
| Distributions to shareholders | | |
| Initial Class | $1,921,950 | $1,262,668 |
| Investor Class | 10,855,591 | 6,094,323 |
| Total | $12,777,541 | $7,356,991 |
10. Share Transactions.
Transactions for each class of shares were as follows:
| | Shares | Shares | Dollars | Dollars |
| | Six months ended June 30, 2019 | Year ended December 31, 2018 | Six months ended June 30, 2019 | Year ended December 31, 2018 |
| Initial Class | | | | |
| Shares sold | 115,575 | 514,137 | $1,372,801 | $6,923,550 |
| Reinvestment of distributions | 170,688 | 100,069 | 1,921,950 | 1,262,668 |
| Shares redeemed | (433,502) | (1,673,395) | (5,079,796) | (22,265,392) |
| Net increase (decrease) | (147,239) | (1,059,189) | $(1,785,045) | $(14,079,174) |
| Investor Class | | | | |
| Shares sold | 279,048 | 2,212,552 | $3,317,829 | $30,015,916 |
| Reinvestment of distributions | 968,385 | 486,202 | 10,855,591 | 6,094,323 |
| Shares redeemed | (2,302,870) | (4,623,690) | (27,034,239) | (59,635,398) |
| Net increase (decrease) | (1,055,437) | (1,924,936) | $(12,860,819) | $(23,525,159) |
11. Other.
The Fund's organizational documents provide former and current trustees and officers with a limited indemnification against liabilities arising in connection with the performance of their duties to the Fund. In the normal course of business, the Fund may also enter into contracts that provide general indemnifications. The Fund's maximum exposure under these arrangements is unknown as this would be dependent on future claims that may be made against the Fund. The risk of material loss from such claims is considered remote.
At the end of the period, the investment adviser or its affiliates were the owners of record of 100% of the total outstanding shares of the Fund.
Shareholder Expense Example
As a shareholder of the Fund, you incur two types of costs: (1) transaction costs, and (2) ongoing costs, including management fees and other Fund expenses. This Example is intended to help you understand your ongoing costs (in dollars) of investing in the Fund and to compare these costs with the ongoing costs of investing in other mutual funds.
The Example is based on an investment of $1,000 invested at the beginning of the period and held for the entire period (January 1, 2019 to June 30, 2019).
Actual Expenses
The first line of the accompanying table for each class of the Fund provides information about actual account values and actual expenses. You may use the information in this line, together with the amount you invested, to estimate the expenses that you paid over the period. Simply divide your account value by $1,000.00 (for example, an $8,600 account value divided by $1,000.00 = 8.6), then multiply the result by the number in the first line for a class of the Fund under the heading entitled "Expenses Paid During Period" to estimate the expenses you paid on your account during this period. The estimate of expenses does not include any fees or other expenses of any variable annuity or variable life insurance product. If they were, the estimate of expenses you paid during the period would be higher, and your ending account value would be lower. In addition, the Fund, as a shareholder in the underlying Fidelity Central Funds, will indirectly bear its pro-rata share of the fees and expenses incurred by the underlying Fidelity Central Funds. These fees and expenses are not included in the Fund's annualized expense ratio used to calculate the expense estimate in the table below.
Hypothetical Example for Comparison Purposes
The second line of the accompanying table for each class of the Fund provides information about hypothetical account values and hypothetical expenses based on a Class' actual expense ratio and an assumed rate of return of 5% per year before expenses, which is not the Class' actual return. The hypothetical account values and expenses may not be used to estimate the actual ending account balance or expenses you paid for the period. You may use this information to compare the ongoing costs of investing in the Fund and other funds. To do so, compare this 5% hypothetical example with the 5% hypothetical examples that appear in the shareholder reports of the other funds. The estimate of expenses does not include any fees or other expenses of any variable annuity or variable life insurance product. If they were, the estimate of expenses you paid during the period would be higher, and your ending account value would be lower. In addition, the Fund, as a shareholder in the underlying Fidelity Central Funds, will indirectly bear its pro-rata share of the fees and expenses incurred by the underlying Fidelity Central Funds. These fees and expenses are not included in the Fund's annualized expense ratio used to calculate the expense estimate in the table below.
Please note that the expenses shown in the table are meant to highlight your ongoing costs only and do not reflect any transaction costs. Therefore, the second line of the table is useful in comparing ongoing costs only, and will not help you determine the relative total costs of owning different funds.
| | Annualized Expense Ratio-A | Beginning
Account Value
January 1, 2019 | Ending
Account Value
June 30, 2019 | Expenses Paid
During Period-B
January 1, 2019
to June 30, 2019 |
| Initial Class | .68% | | | |
| Actual | | $1,000.00 | $1,184.40 | $3.68 |
| Hypothetical-C | | $1,000.00 | $1,021.42 | $3.41 |
| Investor Class | .76% | | | |
| Actual | | $1,000.00 | $1,184.10 | $4.12 |
| Hypothetical-C | | $1,000.00 | $1,021.03 | $3.81 |
A Annualized expense ratio reflects expenses net of applicable fee waivers.
B Expenses are equal to each Class' annualized expense ratio, multiplied by the average account value over the period, multiplied by 181/365 (to reflect the one-half year period).
C 5% return per year before expenses
Board Approval of Investment Advisory Contracts and Management Fees
VIP Financial Services Portfolio
Each year, the Board of Trustees, including the Independent Trustees (together, the Board), votes on the renewal of the management contract with Fidelity SelectCo, LLC (SelectCo), an affiliate of Fidelity Management & Research Company (FMR), and the sub-advisory agreements with affiliates of FMR (together, the Advisory Contracts) for the fund. SelectCo and the sub-advisers are referred to herein as the Investment Advisers. The Board, assisted by the advice of fund counsel and Independent Trustees' counsel, requests and considers a broad range of information relevant to the renewal of the Advisory Contracts throughout the year.
The Board meets regularly and, at each of its meetings, covers an extensive agenda of topics and materials and considers factors that are relevant to its annual consideration of the renewal of the fund's Advisory Contracts, including the services and support provided to the fund and its shareholders. The Board has established various standing committees (Committees), each composed of and chaired by Independent Trustees with varying backgrounds, to which the Board has assigned specific subject matter responsibilities in order to enhance effective decision-making by the Board. The Board, acting directly and through its Committees, requests and receives information concerning the annual consideration of the renewal of the fund's Advisory Contracts. The Board also meets as needed to review matters specifically related to the Board's annual consideration of the renewal of the Advisory Contracts. Members of the Board may also meet with trustees of other Fidelity funds through joint ad hoc committees to discuss certain matters relevant to all of the Fidelity funds.
At its January 2019 meeting, the Board unanimously determined to renew the fund's Advisory Contracts. In reaching its determination, the Board considered all factors it believed relevant, including (i) the nature, extent, and quality of the services to be provided to the fund and its shareholders (including the investment performance of the fund); (ii) the competitiveness of the fund's management fee and total expense ratio relative to peer funds; (iii) the total costs of the services to be provided by and the profits to be realized by Fidelity from its relationships with the fund; and (iv) the extent to which, if any, economies of scale exist and would be realized as the fund grows, and whether any economies of scale are appropriately shared with fund shareholders.
In considering whether to renew the Advisory Contracts for the fund, the Board reached a determination, with the assistance of fund counsel and Independent Trustees' counsel and through the exercise of its business judgment, that the renewal of the Advisory Contracts was in the best interests of the fund and its shareholders and that the compensation payable under the Advisory Contracts was fair and reasonable. The Board's decision to renew the Advisory Contracts was not based on any single factor, but rather was based on a comprehensive consideration of all the information provided to the Board at its meetings throughout the year. The Board, in reaching its determination to renew the Advisory Contracts, was aware that shareholders of the fund have a broad range of investment choices available to them, including a wide choice among funds offered by Fidelity's competitors, and that the fund's shareholders, who have the opportunity to review and weigh the disclosure provided by the fund in its prospectus and other public disclosures, have chosen to invest in this fund, which is part of the Fidelity family of funds.
Nature, Extent, and Quality of Services Provided. The Board considered Fidelity's staffing as it relates to the fund, including the backgrounds of investment personnel of Fidelity, and also considered the fund's investment objective, strategies, and related investment philosophy. The Independent Trustees also had discussions with senior management of Fidelity's investment operations and investment groups. The Board considered the structure of the investment personnel compensation program and whether this structure provides appropriate incentives to act in the best interests of the fund. Additionally, the Board considered the portfolio managers' investments, if any, in the funds that they manage.
Resources Dedicated to Investment Management and Support Services. The Board and the Fund Oversight and Research Committees reviewed the general qualifications and capabilities of Fidelity's investment staff, including its size, education, experience, and resources, as well as Fidelity's approach to recruiting, training, managing, and compensating investment personnel. The Board noted that Fidelity has continued to increase the resources devoted to non-U.S. offices, including expansion of Fidelity's global investment organization. The Board also noted that Fidelity's analysts have extensive resources, tools and capabilities that allow them to conduct sophisticated quantitative and fundamental analysis, as well as credit analysis of issuers, counterparties and guarantors. Further, the Board considered that Fidelity's investment professionals have sufficient access to global information and data so as to provide competitive investment results over time, and that those professionals also have access to sophisticated tools that permit them to assess portfolio construction and risk and performance attribution characteristics continuously, as well as to transmit new information and research conclusions rapidly around the world. Additionally, in its deliberations, the Board considered Fidelity's trading, risk management, compliance, and technology and operations capabilities and resources, which are integral parts of the investment management process.
Shareholder and Administrative Services. The Board considered (i) the nature, extent, quality, and cost of advisory, administrative, and shareholder services performed by the Investment Advisers and their affiliates under the Advisory Contracts and under separate agreements covering transfer agency, pricing and bookkeeping, and securities lending services for the fund; (ii) the nature and extent of the supervision of third party service providers, principally custodians, subcustodians, and pricing vendors; and (iii) the resources devoted to, and the record of compliance with, the fund's compliance policies and procedures. The Board also reviewed the allocation of fund brokerage, including allocations to brokers affiliated with the Investment Advisers, the use of brokerage commissions to pay fund expenses, and the use of "soft" commission dollars to pay for research services.
The Board noted that the growth of fund assets over time across the complex allows Fidelity to reinvest in the development of services designed to enhance the value and convenience of the Fidelity funds as investment vehicles. These services include 24-hour access to account information and market information through telephone representatives and over the Internet, investor education materials and asset allocation tools, and the expanded availability of Fidelity Investor Centers.
The Board noted that it and the boards of certain other Fidelity funds had formed an ad hoc Committee on Transfer Agency Fees to review the variety of transfer agency fee structures throughout the industry and Fidelity's competitive positioning with respect to industry participants.
Investment in a Large Fund Family. The Board considered the benefits to shareholders of investing in a Fidelity fund, including the benefits of investing in a fund that is part of a large family of funds offering a variety of investment disciplines and providing a large variety of mutual fund investor services. The Board noted that Fidelity had taken, or had made recommendations that resulted in the Fidelity funds taking, a number of actions over the previous year that benefited particular funds, including: (i) continuing to dedicate additional resources to Fidelity's investment research process, which includes meetings with management of issuers of securities in which the funds invest, and to the support of the senior management team that oversees asset management; (ii) continuing efforts to enhance Fidelity's global research capabilities; (iii) launching new funds and making other enhancements to meet client needs; (iv) launching new share classes of existing funds; (v) eliminating purchase minimums and broadening eligibility requirements for certain funds and share classes; (vi) reducing management fees and total expenses for certain growth equity funds and index funds; (vii) lowering expense caps for certain existing funds and classes, and converting certain voluntary expense caps to contractual caps, to reduce expenses borne by shareholders; (viii) eliminating short-term redemption fees for funds that had such fees; (ix) rationalizing product lines and gaining increased efficiencies from fund mergers and share class consolidations; (x) continuing to develop, acquire and implement systems and technology to improve services to the funds and shareholders, strengthen information security, and increase efficiency; and (xi) continuing to implement enhancements to further strengthen Fidelity's product line to increase investors' probability of success in achieving their investment goals, including retirement income goals.
Investment Performance. The Board considered whether the fund has operated in accordance with its investment objective, as well as its record of compliance with its investment restrictions and its performance history.
The Board took into account discussions that occur at Board meetings throughout the year with representatives of the Investment Advisers about fund investment performance. In this regard the Board noted that as part of regularly scheduled fund reviews and other reports to the Board on fund performance, the Board considers annualized return information for the fund for different time periods, measured against an appropriate securities market index ("benchmark index"). In its evaluation of fund investment performance, the Board gave particular attention to information indicating changes in performance of certain Fidelity funds for specific time periods and discussed with the Investment Advisers the reasons for any overperformance or underperformance.
In addition to reviewing absolute and relative fund performance, the Independent Trustees periodically consider the appropriateness of fund performance metrics in evaluating the results achieved. In general, the Independent Trustees believe that fund performance should be evaluated based on net performance (after fees and expenses) of both the highest performing and lowest performing fund share classes, where applicable, compared to appropriate benchmark indices, over appropriate time periods that may include full market cycles, taking into account relevant factors including the following: general market conditions; issuer-specific information; and fund cash flows and other factors.
The Independent Trustees recognize that shareholders evaluate performance on a net basis over their own holding periods, for which one-, three-, and five-year periods are often used as a proxy. For this reason, the performance information reviewed by the Board also included net cumulative total return information for the fund and an appropriate benchmark index for the most recent one-, three-, and five-year periods ended June 30, 2018, as shown below.
VIP Financial Services Portfolio

Based on its review, the Board concluded that the nature, extent, and quality of services provided to the fund under the Advisory Contracts should continue to benefit the shareholders of the fund.
Competitiveness of Management Fee and Total Expense Ratio. The Board considered the fund's management fee and total expense ratio compared to "mapped groups" of competitive funds and classes created for the purpose of facilitating the Trustees' competitive analysis of management fees and total expenses. Fidelity creates "mapped groups" by combining similar Lipper investment objective categories that have comparable investment mandates. For this purpose, all sector focused equity variable annuity funds are grouped in the same mapped group. Combining Lipper investment objective categories aids the Board's management fee and total expense ratio comparisons by broadening the competitive group used for comparison.
Management Fee. The Board considered two proprietary management fee comparisons for the 12-month periods ended June 30 shown in basis points (BP) in the chart below. The group of Lipper funds used by the Board for management fee comparisons is referred to below as the "Total Mapped Group." The Total Mapped Group comparison focuses on a fund's standing in terms of gross management fees before expense reimbursements or caps relative to the total universe of funds with comparable investment mandates (i.e., sector equities), regardless of whether their management fee structures also are comparable. Funds with comparable management fee structures have similar management fee contractual arrangements (
e.g., flat rate charged for advisory services, all-inclusive fee rate,
etc.). "TMG %" represents the percentage of funds in the Total Mapped Group that had management fees that were lower than the fund's. For example, a hypothetical TMG % of 20% would mean that 80% of the funds in the Total Mapped Group had higher, and 20% had lower, management fees than the fund. The fund's actual TMG %s and the number of funds in the Total Mapped Group are in the chart below. The "Asset-Size Peer Group" (ASPG) comparison focuses on a fund's standing relative to a subset of non-Fidelity funds within the Total Mapped Group that are similar in size and management fee structure. For example, if a fund is in the first quartile of the ASPG, the fund's management fee ranks in the least expensive or lowest 25% of funds in the ASPG. The ASPG represents at least 15% of the funds in the Total Mapped Group with comparable asset size and management fee structures, subject to a minimum of 50 funds (or all funds in the Total Mapped Group if fewer than 50). Additional information, such as the ASPG quartile in which the fund's management fee rate ranked, is also included in the chart and was considered by the Board.
VIP Financial Services Portfolio
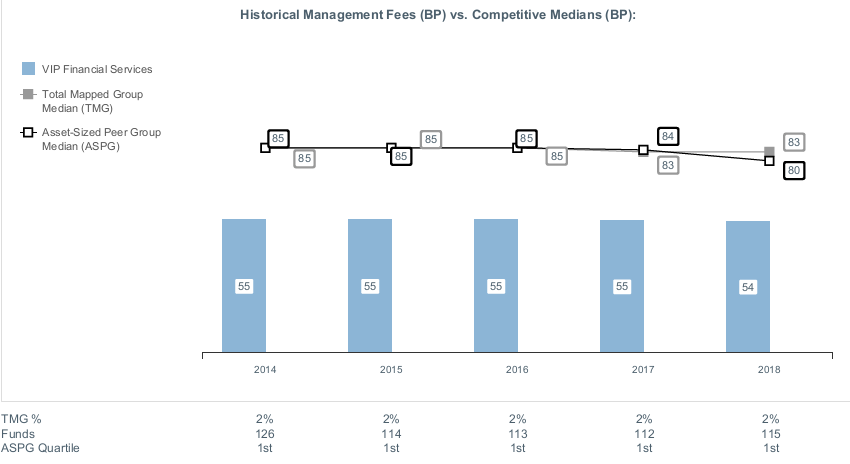
The Board noted that the fund's management fee rate ranked below the median of its Total Mapped Group and below the median of its ASPG for the 12-month period ended June 30, 2018.
The Board noted that it and the boards of other Fidelity funds formed an ad hoc Committee on Group Fee, which meets periodically, to conduct an in-depth review of the "group fee" component of the management fee of funds with such management fee structures. The Committee's focus included the mechanics of the group fee, the competitive landscape of group fee structures, Fidelity funds with no group fee component and investment products not included in group fee assets. The Board also considered that, for funds subject to the group fee, FMR agreed to voluntarily waive fees over a specified period of time in amounts designed to account for assets converted from certain funds to certain collective investment trusts.
Based on its review, the Board concluded that the fund's management fee is fair and reasonable in light of the services that the fund receives and the other factors considered.
Total Expense Ratio. In its review of each class's total expense ratio, the Board considered the fund's management fee rate as well as other fund or class expenses, as applicable, such as transfer agent fees, pricing and bookkeeping fees, and custodial, legal, and audit fees. The Board also noted that Fidelity may agree to waive fees and expenses from time to time, and the extent to which, if any, it has done so for the fund. As part of its review, the Board also considered the current and historical total expense ratios of each class of the fund compared to competitive fund median expenses. Each class of the fund is compared to those funds and classes in the Total Mapped Group (used by the Board for management fee comparisons) that have a similar sales load structure.
The Board noted that the total expense ratio of each class ranked below the competitive median for the 12-month period ended June 30, 2018.
Fees Charged to Other Fidelity Clients. The Board also considered Fidelity fee structures and other information with respect to clients of Fidelity, such as other funds advised or subadvised by Fidelity, pension plan clients, and other institutional clients with similar mandates. The Board noted that a joint ad hoc committee created by it and the boards of other Fidelity funds periodically reviews and compares Fidelity's institutional investment advisory business with its business of providing services to the Fidelity funds, and also noted the most recent findings of the committee. The Board noted that the committee's review included a consideration of the differences in services provided, fees charged, and costs incurred, as well as competition in the markets serving the different categories of clients.
Based on its review of total expense ratios and fees charged to other Fidelity clients, the Board concluded that the total expense ratio of each class of the fund was reasonable in light of the services that the fund and its shareholders receive and the other factors considered.
Costs of the Services and Profitability. The Board considered the revenues earned and the expenses incurred by Fidelity in conducting the business of developing, marketing, distributing, managing, administering and servicing the fund and servicing the fund's shareholders. The Board also considered the level of Fidelity's profits in respect of all the Fidelity funds.
On an annual basis, Fidelity presents to the Board information about the profitability of its relationships with the fund. Fidelity calculates profitability information for each fund, as well as aggregate profitability information for groups of Fidelity funds and all Fidelity funds, using a series of detailed revenue and cost allocation methodologies which originate with the books and records of Fidelity on which Fidelity's audited financial statements are based. The Audit Committee of the Board reviews any significant changes from the prior year's methodologies.
PricewaterhouseCoopers LLP (PwC), auditor to Fidelity and certain Fidelity funds, has been engaged annually by the Board as part of the Board's assessment of Fidelity's profitability analysis. PwC's engagement includes the review and assessment of the methodologies used by Fidelity in determining the revenues and expenses attributable to Fidelity's mutual fund business, and completion of agreed-upon procedures in respect of the mathematical accuracy of the fund profitability information and its conformity to established allocation methodologies. After considering PwC's reports issued under the engagement and information provided by Fidelity, the Board concluded that while other allocation methods may also be reasonable, Fidelity's profitability methodologies are reasonable in all material respects.
The Board also reviewed Fidelity's non-fund businesses and potential indirect benefits such businesses may have received as a result of their association with Fidelity's mutual fund business (i.e., fall-out benefits) as well as cases where Fidelity's affiliates may benefit from the fund's business. The Board noted that changes to fall-out benefits year-over-year reflect business developments at Fidelity's various businesses.
The Board considered the costs of the services provided by and the profits realized by Fidelity in connection with the operation of the fund and was satisfied that the profitability was not excessive.
Economies of Scale. The Board considered whether there have been economies of scale in respect of the management of the Fidelity funds, whether the Fidelity funds (including the fund) have appropriately benefited from any such economies of scale, and whether there is potential for realization of any further economies of scale. The Board considered the extent to which the fund will benefit from economies of scale as assets grow through increased services to the fund, through waivers or reimbursements, or through fee or expense ratio reductions. The Board also noted that a committee (the Economies of Scale Committee) created by it and the boards of other Fidelity funds periodically analyzes whether Fidelity attains economies of scale in respect of the management and servicing of the Fidelity funds, whether the Fidelity funds have appropriately benefited from such economies of scale, and whether there is potential for realization of any further economies of scale.
The Board recognized that the fund's management contract incorporates a "group fee" structure, which provides for lower group fee rates as total group assets increase, and for higher group fee rates as total group assets decrease (with "group assets" defined to include fund assets under SelectCo's management plus assets under FMR's management). SelectCo calculates the group fee rates based on a tiered asset "breakpoint" schedule that varies based on asset class. The Board considered that the group fee is designed to deliver the benefits of economies of scale to fund shareholders when total group assets increase, even if assets of any particular fund are unchanged or have declined, because some portion of Fidelity's costs are attributable to services provided to all Fidelity funds, and all funds benefit if those costs can be allocated among more assets. The Board concluded that, given the group fee structure, fund shareholders will benefit from lower management fees as group assets increase at the fund complex level, regardless of whether Fidelity achieves any such economies of scale.
The Board concluded, taking into account the analysis of the Economies of Scale Committee, that economies of scale, if any, are being appropriately shared between fund shareholders and Fidelity.
Additional Information Requested by the Board. In order to develop fully the factual basis for consideration of the Fidelity funds' advisory contracts, the Board requested and received additional information on certain topics, including: (i) fund performance trends, in particular the underperformance of certain funds, and Fidelity's long-term strategies for certain funds; (ii) Fidelity's fund profitability methodology, profitability trends for certain funds, and the impact of certain factors on fund profitability results; (iii) metrics for evaluating index fund and ETF performance and information about ETF trading characteristics; (iv) the methodology with respect to the evaluation of competitive fund data and peer group classifications and fee comparisons; (v) the expense structures for different funds and classes; (vi) information regarding other accounts managed by Fidelity, including collective investment trusts; and (vii) Fidelity's philosophies and strategies for evaluating funds and classes with lower or declining asset levels.
Based on its evaluation of all of the conclusions noted above, and after considering all factors it believed relevant, the Board concluded that the advisory fee arrangements are fair and reasonable, and that the fund's Advisory Contracts should be renewed.
VFSIC-SANN-0819
1.817370.114
Fidelity® Variable Insurance Products: Industrials Portfolio
Semi-Annual Report June 30, 2019 |
|
Beginning on January 1, 2021, as permitted by regulations adopted by the Securities and Exchange Commission, and if your insurance carrier elects to participate, you may not be receiving paper copies of the Fund’s shareholder reports from the insurance company that offers your variable insurance product unless you specifically request paper copies from your financial professional or the administrator of your variable insurance product. Instead, the reports will be made available on a website, and you will be notified by mail each time a report is posted and provided with a website link to access the report.
If you already elected to receive shareholder reports electronically, you will not be affected by this change and you need not take any action. You may elect to receive shareholder reports and other communications from the Fund electronically, by contacting your financial professional or the administrator of your variable insurance product. If you own a Fidelity-administered variable insurance product, please visit fidelity.com/mailpreferences to make your election or call 1-800-343-3548.
You may elect to receive all future reports in paper free of charge. If you wish to continue receiving paper copies of your shareholder reports, you may contact your financial professional or the administrator of your variable insurance product. If you own a Fidelity-administered variable insurance product, please visit fidelity.com/mailpreferences to make your election or call 1-800-343-3548. Your election to receive reports in paper will apply to all funds available under your variable insurance product.
Contents
To view a fund's proxy voting guidelines and proxy voting record for the 12-month period ended June 30, visit http://www.fidelity.com/proxyvotingresults or visit the Securities and Exchange Commission's (SEC) web site at http://www.sec.gov.
You may also call 1-877-208-0098 to request a free copy of the proxy voting guidelines.
Fidelity® Variable Insurance Products are separate account options which are purchased through a variable insurance contract.
Standard & Poor's, S&P and S&P 500 are registered service marks of The McGraw-Hill Companies, Inc. and have been licensed for use by Fidelity Distributors Corporation.
Other third-party marks appearing herein are the property of their respective owners.
All other marks appearing herein are registered or unregistered trademarks or service marks of FMR LLC or an affiliated company. © 2019 FMR LLC. All rights reserved.
This report and the financial statements contained herein are submitted for the general information of the shareholders of the Fund. This report is not authorized for distribution to prospective investors in the Fund unless preceded or accompanied by an effective prospectus.
A fund files its complete schedule of portfolio holdings with the SEC for the first and third quarters of each fiscal year on Form N-PORT. Forms N-PORT are available on the SEC’s web site at http://www.sec.gov. A fund's Forms N-PORT may be reviewed and copied at the SEC’s Public Reference Room in Washington, DC. Information regarding the operation of the SEC's Public Reference Room may be obtained by calling 1-800-SEC-0330.
For a complete list of a fund's portfolio holdings, view the most recent holdings listing, semiannual report, or annual report on Fidelity's web site at http://www.fidelity.com, http://www.institutional.fidelity.com, or http://www.401k.com, as applicable.
NOT FDIC INSURED •MAY LOSE VALUE •NO BANK GUARANTEE
Neither the Fund nor Fidelity Distributors Corporation is a bank.
Investment Summary (Unaudited)
Top Ten Stocks as of June 30, 2019
| | % of fund's net assets |
| The Boeing Co. | 6.9 |
| AMETEK, Inc. | 6.6 |
| Union Pacific Corp. | 5.6 |
| Ingersoll-Rand PLC | 5.0 |
| Lockheed Martin Corp. | 4.9 |
| Roper Technologies, Inc. | 4.8 |
| Fortive Corp. | 4.3 |
| ITT, Inc. | 4.0 |
| IDEX Corp. | 3.9 |
| General Electric Co. | 3.8 |
| | 49.8 |
Top Industries (% of fund's net assets)
| As of June 30, 2019 |
| | Aerospace & Defense | 27.1% |
| | Industrial Conglomerates | 16.1% |
| | Machinery | 16.1% |
| | Road & Rail | 13.5% |
| | Electrical Equipment | 13.4% |
| | All Others* | 13.8% |

* Includes short-term investments and net other assets (liabilities).
Schedule of Investments June 30, 2019 (Unaudited)
Showing Percentage of Net Assets
| Common Stocks - 99.2% | | | |
| | | Shares | Value |
| Aerospace & Defense - 27.1% | | | |
| Aerospace & Defense - 27.1% | | | |
| General Dynamics Corp. | | 23,400 | $4,254,588 |
| Harris Corp. | | 18,900 | 3,574,557 |
| HEICO Corp. Class A | | 39,600 | 4,093,452 |
| Huntington Ingalls Industries, Inc. | | 8,150 | 1,831,631 |
| Lockheed Martin Corp. | | 25,000 | 9,088,500 |
| Northrop Grumman Corp. | | 10,800 | 3,489,588 |
| Raytheon Co. | | 9,300 | 1,617,084 |
| Teledyne Technologies, Inc. (a) | | 3,978 | 1,089,455 |
| The Boeing Co. | | 34,700 | 12,631,146 |
| TransDigm Group, Inc. (a) | | 10,000 | 4,838,000 |
| United Technologies Corp. | | 27,129 | 3,532,196 |
| | | | 50,040,197 |
| Air Freight & Logistics - 0.5% | | | |
| Air Freight & Logistics - 0.5% | | | |
| United Parcel Service, Inc. Class B | | 9,400 | 970,738 |
| Airlines - 1.3% | | | |
| Airlines - 1.3% | | | |
| Delta Air Lines, Inc. | | 5,800 | 329,150 |
| Southwest Airlines Co. | | 18,700 | 949,586 |
| Spirit Airlines, Inc. (a) | | 22,500 | 1,073,925 |
| | | | 2,352,661 |
| Commercial Services & Supplies - 4.0% | | | |
| Diversified Support Services - 0.5% | | | |
| Cintas Corp. | | 4,002 | 949,635 |
| Environmental & Facility Services - 3.5% | | | |
| Stericycle, Inc. (a) | | 16,400 | 783,100 |
| Waste Connection, Inc. (United States) | | 58,200 | 5,562,756 |
| | | | 6,345,856 |
|
| TOTAL COMMERCIAL SERVICES & SUPPLIES | | | 7,295,491 |
|
| Electrical Equipment - 13.4% | | | |
| Electrical Components & Equipment - 13.4% | | | |
| AMETEK, Inc. | | 133,000 | 12,081,720 |
| Emerson Electric Co. | | 67,900 | 4,530,288 |
| Fortive Corp. | | 98,392 | 8,020,916 |
| | | | 24,632,924 |
| Industrial Conglomerates - 16.1% | | | |
| Industrial Conglomerates - 16.1% | | | |
| General Electric Co. | | 666,746 | 7,000,833 |
| Honeywell International, Inc. | | 37,127 | 6,482,003 |
| ITT, Inc. | | 113,656 | 7,442,195 |
| Roper Technologies, Inc. | | 24,000 | 8,790,240 |
| | | | 29,715,271 |
| Machinery - 16.1% | | | |
| Agricultural & Farm Machinery - 2.0% | | | |
| Deere & Co. | | 21,900 | 3,629,049 |
| Construction Machinery & Heavy Trucks - 2.0% | | | |
| Caterpillar, Inc. | | 27,100 | 3,693,459 |
| Industrial Machinery - 12.1% | | | |
| Flowserve Corp. | | 20,400 | 1,074,876 |
| Gardner Denver Holdings, Inc. (a) | | 136,300 | 4,715,980 |
| IDEX Corp. | | 41,340 | 7,116,268 |
| Ingersoll-Rand PLC | | 73,500 | 9,310,245 |
| Xylem, Inc. | | 1,400 | 117,096 |
| | | | 22,334,465 |
|
| TOTAL MACHINERY | | | 29,656,973 |
|
| Professional Services - 4.4% | | | |
| Human Resource & Employment Services - 1.2% | | | |
| TriNet Group, Inc. (a) | | 33,200 | 2,250,960 |
| Research & Consulting Services - 3.2% | | | |
| Equifax, Inc. | | 38,100 | 5,152,644 |
| IHS Markit Ltd. (a) | | 11,910 | 758,905 |
| | | | 5,911,549 |
|
| TOTAL PROFESSIONAL SERVICES | | | 8,162,509 |
|
| Road & Rail - 13.5% | | | |
| Railroads - 12.4% | | | |
| CSX Corp. | | 69,800 | 5,400,426 |
| Genesee & Wyoming, Inc. Class A (a) | | 11,100 | 1,110,000 |
| Norfolk Southern Corp. | | 30,800 | 6,139,364 |
| Union Pacific Corp. | | 60,800 | 10,281,888 |
| | | | 22,931,678 |
| Trucking - 1.1% | | | |
| Knight-Swift Transportation Holdings, Inc. Class A | | 61,400 | 2,016,376 |
|
| TOTAL ROAD & RAIL | | | 24,948,054 |
|
| Trading Companies & Distributors - 2.8% | | | |
| Trading Companies & Distributors - 2.8% | | | |
| HD Supply Holdings, Inc. (a) | | 130,100 | 5,240,428 |
| TOTAL COMMON STOCKS | | | |
| (Cost $139,087,623) | | | 183,015,246 |
|
| Money Market Funds - 0.4% | | | |
| Fidelity Cash Central Fund 2.42% (b) | | | |
| (Cost $794,423) | | 794,265 | 794,423 |
| TOTAL INVESTMENT IN SECURITIES - 99.6% | | | |
| (Cost $139,882,046) | | | 183,809,669 |
| NET OTHER ASSETS (LIABILITIES) - 0.4% | | | 651,605 |
| NET ASSETS - 100% | | | $184,461,274 |
Legend
(a) Non-income producing
(b) Affiliated fund that is generally available only to investment companies and other accounts managed by Fidelity Investments. The rate quoted is the annualized seven-day yield of the fund at period end. A complete unaudited listing of the fund's holdings as of its most recent quarter end is available upon request. In addition, each Fidelity Central Fund's financial statements are available on the SEC's website or upon request.
Affiliated Central Funds
Information regarding fiscal year to date income earned by the Fund from investments in Fidelity Central Funds is as follows:
| Fund | Income earned |
| Fidelity Cash Central Fund | $27,230 |
| Fidelity Securities Lending Cash Central Fund | 40 |
| Total | $27,270 |
Amounts in the income column in the above table include any capital gain distributions from underlying funds, which are presented in the corresponding line-item in the Statement of Operations, if applicable. Amount for Fidelity Securities Lending Cash Central Fund represents securities lending income earned from the reinvestment of cash collateral from loaned securities, net of payments to and from borrowers of securities.
Investment Valuation
All investments are categorized as Level 1 under the Fair Value Hierarchy. The inputs or methodology used for valuing securities may not be an indication of the risk associated with investing in those securities. For more information on valuation inputs please refer to the Investment Valuation section in the accompanying Notes to Financial Statements.
See accompanying notes which are an integral part of the financial statements.
Financial Statements
Statement of Assets and Liabilities
| | | June 30, 2019 (Unaudited) |
| Assets | | |
Investment in securities, at value — See accompanying schedule:
Unaffiliated issuers (cost $139,087,623) | $183,015,246 | |
| Fidelity Central Funds (cost $794,423) | 794,423 | |
| Total Investment in Securities (cost $139,882,046) | | $183,809,669 |
| Receivable for investments sold | | 1,807,086 |
| Receivable for fund shares sold | | 919 |
| Dividends receivable | | 46,284 |
| Distributions receivable from Fidelity Central Funds | | 949 |
| Prepaid expenses | | 1,537 |
| Other receivables | | 1,725 |
| Total assets | | 185,668,169 |
| Liabilities | | |
| Payable for investments purchased | $1,063,530 | |
| Payable for fund shares redeemed | 6,262 | |
| Accrued management fee | 81,502 | |
| Other affiliated payables | 25,508 | |
| Other payables and accrued expenses | 30,093 | |
| Total liabilities | | 1,206,895 |
| Net Assets | | $184,461,274 |
| Net Assets consist of: | | |
| Paid in capital | | $136,426,310 |
| Total distributable earnings (loss) | | 48,034,964 |
| Net Assets | | $184,461,274 |
| Net Asset Value and Maximum Offering Price | | |
| Initial Class: | | |
| Net Asset Value, offering price and redemption price per share ($36,582,318 ÷ 1,684,890 shares) | | $21.71 |
| Investor Class: | | |
| Net Asset Value, offering price and redemption price per share ($147,878,956 ÷ 6,863,452 shares) | | $21.55 |
See accompanying notes which are an integral part of the financial statements.
Statement of Operations
| | | Six months ended June 30, 2019 (Unaudited) |
| Investment Income | | |
| Dividends | | $1,349,670 |
| Non-Cash dividends | | 262,629 |
| Income from Fidelity Central Funds (including $40 from security lending) | | 27,270 |
| Total income | | 1,639,569 |
| Expenses | | |
| Management fee | $484,490 | |
| Transfer agent fees | 116,393 | |
| Accounting and security lending fees | 35,041 | |
| Custodian fees and expenses | 12,621 | |
| Independent trustees' fees and expenses | 425 | |
| Audit | 20,463 | |
| Legal | 494 | |
| Miscellaneous | 727 | |
| Total expenses before reductions | 670,654 | |
| Expense reductions | (8,487) | |
| Total expenses after reductions | | 662,167 |
| Net investment income (loss) | | 977,402 |
| Realized and Unrealized Gain (Loss) | | |
| Net realized gain (loss) on: | | |
| Investment securities: | | |
| Unaffiliated issuers | 4,000,088 | |
| Foreign currency transactions | (47) | |
| Total net realized gain (loss) | | 4,000,041 |
| Change in net unrealized appreciation (depreciation) on: | | |
| Investment securities: | | |
| Unaffiliated issuers | 32,104,632 | |
| Assets and liabilities in foreign currencies | 9 | |
| Total change in net unrealized appreciation (depreciation) | | 32,104,641 |
| Net gain (loss) | | 36,104,682 |
| Net increase (decrease) in net assets resulting from operations | | $37,082,084 |
See accompanying notes which are an integral part of the financial statements.
Statement of Changes in Net Assets
| | Six months ended June 30, 2019 (Unaudited) | Year ended December 31, 2018 |
| Increase (Decrease) in Net Assets | | |
| Operations | | |
| Net investment income (loss) | $977,402 | $1,594,387 |
| Net realized gain (loss) | 4,000,041 | 15,323,336 |
| Change in net unrealized appreciation (depreciation) | 32,104,641 | (46,063,303) |
| Net increase (decrease) in net assets resulting from operations | 37,082,084 | (29,145,580) |
| Distributions to shareholders | (16,511,558) | (9,495,847) |
| Share transactions - net increase (decrease) | 8,635,392 | (24,953,454) |
| Total increase (decrease) in net assets | 29,205,918 | (63,594,881) |
| Net Assets | | |
| Beginning of period | 155,255,356 | 218,850,237 |
| End of period | $184,461,274 | $155,255,356 |
See accompanying notes which are an integral part of the financial statements.
Financial Highlights
VIP Industrials Portfolio Initial Class
| | Six months ended (Unaudited) June 30, | Years endedDecember 31, | | | | |
| | 2019 | 2018 | 2017 | 2016 | 2015 | 2014 |
| Selected Per–Share Data | | | | | | |
| Net asset value, beginning of period | $19.29 | $23.85 | $20.88 | $20.25 | $22.92 | $22.17 |
| Income from Investment Operations | | | | | | |
| Net investment income (loss)A | .12B | .19 | .16 | .18 | .17 | .18 |
| Net realized and unrealized gain (loss) | 4.35 | (3.68) | 3.91 | 2.50 | (.55) | 1.17 |
| Total from investment operations | 4.47 | (3.49) | 4.07 | 2.68 | (.38) | 1.35 |
| Distributions from net investment income | (.06) | (.18) | (.16) | (.13) | (.18) | (.20) |
| Distributions from net realized gain | (2.00) | (.89) | (.94) | (1.92) | (2.11) | (.40) |
| Total distributions | (2.05)C | (1.07) | (1.10) | (2.05) | (2.29) | (.60) |
| Redemption fees added to paid in capitalA | – | – | –D | –D | –D | –D |
| Net asset value, end of period | $21.71 | $19.29 | $23.85 | $20.88 | $20.25 | $22.92 |
| Total ReturnE,F,G | 24.21% | (15.12)% | 20.15% | 15.87% | (1.89)% | 6.21% |
| Ratios to Average Net AssetsH,I | | | | | | |
| Expenses before reductions | .68%J | .67% | .69% | .70% | .69% | .69% |
| Expenses net of fee waivers, if any | .68%J | .67% | .68% | .70% | .69% | .69% |
| Expenses net of all reductions | .67%J | .66% | .68% | .69% | .69% | .69% |
| Net investment income (loss) | 1.15%B,J | .85% | .72% | .94% | .83% | .81% |
| Supplemental Data | | | | | | |
| Net assets, end of period (000 omitted) | $36,582 | $30,987 | $44,205 | $42,322 | $35,852 | $46,692 |
| Portfolio turnover rateK | 88%J | 94% | 64% | 62% | 69% | 70% |
A Calculated based on average shares outstanding during the period.
B Net investment income per share reflects a large, non-recurring dividend which amounted to $.03 per share. This dividend is not annualized in the ratio of net investment income (loss) to average net assets. Excluding this dividend the ratio would have been .86%.
C Total distributions of $2.05 per share is comprised of distributions from net investment income of $.055 and distributions from net realized gain of $1.997 per share.
D Amount represents less than $.005 per share.
E Total returns for periods of less than one year are not annualized.
F Total returns do not reflect charges attributable to your insurance company's separate account. Inclusion of these charges would reduce the total returns shown.
G Total returns would have been lower if certain expenses had not been reduced during the applicable periods shown.
H Fees and expenses of any underlying Fidelity Central Funds are not included in the Fund's expense ratio. The Fund indirectly bears its proportionate share of the expenses of any underlying Fidelity Central Funds.
I Expense ratios reflect operating expenses of the class. Expenses before reductions do not reflect amounts reimbursed by the investment adviser or reductions from brokerage service arrangements or reductions from other expense offset arrangements and do not represent the amount paid by the class during periods when reimbursements or reductions occur. Expenses net of fee waivers reflect expenses after reimbursement by the investment adviser but prior to reductions from brokerage service arrangements or other expense offset arrangements. Expenses net of all reductions represent the net expenses paid by the class.
J Annualized
K Amount does not include the portfolio activity of any underlying Fidelity Central Funds.
See accompanying notes which are an integral part of the financial statements.
VIP Industrials Portfolio Investor Class
| | Six months ended (Unaudited) June 30, | Years endedDecember 31, | | | | |
| | 2019 | 2018 | 2017 | 2016 | 2015 | 2014 |
| Selected Per–Share Data | | | | | | |
| Net asset value, beginning of period | $19.17 | $23.69 | $20.75 | $20.15 | $22.82 | $22.07 |
| Income from Investment Operations | | | | | | |
| Net investment income (loss)A | .11B | .17 | .14 | .16 | .16 | .16 |
| Net realized and unrealized gain (loss) | 4.32 | (3.64) | 3.88 | 2.48 | (.56) | 1.17 |
| Total from investment operations | 4.43 | (3.47) | 4.02 | 2.64 | (.40) | 1.33 |
| Distributions from net investment income | (.05) | (.16) | (.15) | (.12) | (.17) | (.18) |
| Distributions from net realized gain | (2.00) | (.89) | (.94) | (1.92) | (2.11) | (.40) |
| Total distributions | (2.05) | (1.05) | (1.08)C | (2.04) | (2.27)D | (.58) |
| Redemption fees added to paid in capitalA | – | – | –E | –E | –E | –E |
| Net asset value, end of period | $21.55 | $19.17 | $23.69 | $20.75 | $20.15 | $22.82 |
| Total ReturnF,G,H | 24.14% | (15.14)% | 20.05% | 15.73% | (1.97)% | 6.16% |
| Ratios to Average Net AssetsI,J | | | | | | |
| Expenses before reductions | .76%K | .75% | .77% | .78% | .77% | .77% |
| Expenses net of fee waivers, if any | .76%K | .75% | .77% | .78% | .77% | .77% |
| Expenses net of all reductions | .75%K | .74% | .76% | .77% | .77% | .77% |
| Net investment income (loss) | 1.07%B,K | .77% | .64% | .86% | .76% | .73% |
| Supplemental Data | | | | | | |
| Net assets, end of period (000 omitted) | $147,879 | $124,268 | $174,645 | $151,967 | $110,411 | $126,131 |
| Portfolio turnover rateL | 88%K | 94% | 64% | 62% | 69% | 70% |
A Calculated based on average shares outstanding during the period.
B Net investment income per share reflects a large, non-recurring dividend which amounted to $.03 per share. This dividend is not annualized in the ratio of net investment income (loss) to average net assets. Excluding this dividend the ratio would have been .78%.
C Total distributions of $1.08 per share is comprised of distributions from net investment income of $.145 and distributions from net realized gain of $.937 per share.
D Total distributions of $2.27 per share is comprised of distributions from net investment income of $.166 and distributions from net realized gain of $2.105 per share.
E Amount represents less than $.005 per share.
F Total returns for periods of less than one year are not annualized.
G Total returns do not reflect charges attributable to your insurance company's separate account. Inclusion of these charges would reduce the total returns shown.
H Total returns would have been lower if certain expenses had not been reduced during the applicable periods shown.
I Fees and expenses of any underlying Fidelity Central Funds are not included in the Fund's expense ratio. The Fund indirectly bears its proportionate share of the expenses of any underlying Fidelity Central Funds.
J Expense ratios reflect operating expenses of the class. Expenses before reductions do not reflect amounts reimbursed by the investment adviser or reductions from brokerage service arrangements or reductions from other expense offset arrangements and do not represent the amount paid by the class during periods when reimbursements or reductions occur. Expenses net of fee waivers reflect expenses after reimbursement by the investment adviser but prior to reductions from brokerage service arrangements or other expense offset arrangements. Expenses net of all reductions represent the net expenses paid by the class.
K Annualized
L Amount does not include the portfolio activity of any underlying Fidelity Central Funds.
See accompanying notes which are an integral part of the financial statements.
Notes to Financial Statements (Unaudited)
For the period ended June 30, 2019
1. Organization.
VIP Industrials Portfolio (the Fund) is a non-diversified fund of Variable Insurance Products Fund IV (the Trust) and is authorized to issue an unlimited number of shares. The Trust is registered under the Investment Company Act of 1940, as amended (the 1940 Act), as an open-end management investment company organized as a Massachusetts business trust. Shares of the Fund may only be purchased by insurance companies for the purpose of funding variable annuity or variable life insurance contracts. The Fund offers the following classes of shares: Initial Class shares and Investor Class shares. All classes have equal rights and voting privileges, except for matters affecting a single class.
2. Investments in Fidelity Central Funds.
The Fund invests in Fidelity Central Funds, which are open-end investment companies generally available only to other investment companies and accounts managed by the investment adviser and its affiliates. The Fund's Schedule of Investments lists each of the Fidelity Central Funds held as of period end, if any, as an investment of the Fund, but does not include the underlying holdings of each Fidelity Central Fund. As an Investing Fund, the Fund indirectly bears its proportionate share of the expenses of the underlying Fidelity Central Funds.
The Money Market Central Funds seek preservation of capital and current income and are managed by Fidelity Investments Money Management, Inc. (FIMM), an affiliate of the investment adviser. Annualized expenses of the Money Market Central Funds as of their most recent shareholder report date ranged from less than .005% to .01%.
A complete unaudited list of holdings for each Fidelity Central Fund is available upon request or at the Securities and Exchange Commission (the SEC) website at www.sec.gov. In addition, the financial statements of the Fidelity Central Funds are available on the SEC website or upon request.
3. Significant Accounting Policies.
The Fund is an investment company and applies the accounting and reporting guidance of the Financial Accounting Standards Board (FASB) Accounting Standards Codification Topic 946 Financial Services – Investments Companies. The financial statements have been prepared in conformity with accounting principles generally accepted in the United States of America (GAAP), which require management to make certain estimates and assumptions at the date of the financial statements. Actual results could differ from those estimates. Subsequent events, if any, through the date that the financial statements were issued have been evaluated in the preparation of the financial statements. The following summarizes the significant accounting policies of the Fund:
Investment Valuation. Investments are valued as of 4:00 p.m. Eastern time on the last calendar day of the period. The Board of Trustees (the Board) has delegated the day to day responsibility for the valuation of the Fund's investments to the Fair Value Committee (the Committee) established by the Fund's investment adviser. In accordance with valuation policies and procedures approved by the Board, the Fund attempts to obtain prices from one or more third party pricing vendors or brokers to value its investments. When current market prices, quotations or currency exchange rates are not readily available or reliable, investments will be fair valued in good faith by the Committee, in accordance with procedures adopted by the Board. Factors used in determining fair value vary by investment type and may include market or investment specific events. The frequency with which these procedures are used cannot be predicted and they may be utilized to a significant extent. The Committee oversees the Fund's valuation policies and procedures and reports to the Board on the Committee's activities and fair value determinations. The Board monitors the appropriateness of the procedures used in valuing the Fund's investments and ratifies the fair value determinations of the Committee.
The Fund categorizes the inputs to valuation techniques used to value its investments into a disclosure hierarchy consisting of three levels as shown below:
- Level 1 – quoted prices in active markets for identical investments
- Level 2 – other significant observable inputs (including quoted prices for similar investments, interest rates, prepayment speeds, etc.)
- Level 3 – unobservable inputs (including the Fund's own assumptions based on the best information available)
Valuation techniques used to value the Fund's investments by major category are as follows:
Equity securities, including restricted securities, for which market quotations are readily available, are valued at the last reported sale price or official closing price as reported by a third party pricing vendor on the primary market or exchange on which they are traded and are categorized as Level 1 in the hierarchy. In the event there were no sales during the day or closing prices are not available, securities are valued at the last quoted bid price or may be valued using the last available price and are generally categorized as Level 2 in the hierarchy. For foreign equity securities, when market or security specific events arise, comparisons to the valuation of American Depositary Receipts (ADRs), futures contracts, Exchange-Traded Funds (ETFs) and certain indexes as well as quoted prices for similar securities may be used and would be categorized as Level 2 in the hierarchy. For equity securities, including restricted securities, where observable inputs are limited, assumptions about market activity and risk are used and these securities may be categorized as Level 3 in the hierarchy.
Investments in open-end mutual funds, including the Fidelity Central Funds, are valued at their closing net asset value (NAV) each business day and are categorized as Level 1 in the hierarchy.
Changes in valuation techniques may result in transfers in or out of an assigned level within the disclosure hierarchy.
Foreign Currency. The Fund may use foreign currency contracts to facilitate transactions in foreign-denominated securities. Gains and losses from these transactions may arise from changes in the value of the foreign currency or if the counterparties do not perform under the contracts' terms.
Foreign-denominated assets, including investment securities, and liabilities are translated into U.S. dollars at the exchange rates at period end. Purchases and sales of investment securities, income and dividends received and expenses denominated in foreign currencies are translated into U.S. dollars at the exchange rate in effect on the transaction date.
The effects of exchange rate fluctuations on investments are included with the net realized and unrealized gain (loss) on investment securities. Other foreign currency transactions resulting in realized and unrealized gain (loss) are disclosed separately.
Investment Transactions and Income. For financial reporting purposes, the Fund's investment holdings and NAV include trades executed through the end of the last business day of the period. The NAV per share for processing shareholder transactions is calculated as of the close of business of the New York Stock Exchange (NYSE), normally 4:00 p.m. Eastern time and includes trades executed through the end of the prior business day. Gains and losses on securities sold are determined on the basis of identified cost. Dividend income is recorded on the ex-dividend date, except for certain dividends from foreign securities where the ex-dividend date may have passed, which are recorded as soon as the Fund is informed of the ex-dividend date. Non-cash dividends included in dividend income, if any, are recorded at the fair market value of the securities received. Income and capital gain distributions from Fidelity Central Funds, if any, are recorded on the ex-dividend date. Certain distributions received by the Fund represent a return of capital or capital gain. The Fund determines the components of these distributions subsequent to the ex-dividend date, based upon receipt of tax filings or other correspondence relating to the underlying investment. These distributions are recorded as a reduction of cost of investments and/or as a realized gain. Large, non-recurring dividends recognized by the Fund are presented separately on the Statement of Operations as "Non-cash Dividends" and the impact of these dividends is presented in the Financial Highlights. Investment income is recorded net of foreign taxes withheld where recovery of such taxes is uncertain.
Class Allocations and Expenses. Investment income, realized and unrealized capital gains and losses, common expenses of the Fund, and certain fund-level expense reductions, if any, are allocated daily on a pro-rata basis to each class based on the relative net assets of each class to the total net assets of the Fund. Each class differs with respect to transfer agent fees incurred. Certain expense reductions may also differ by class. For the reporting period, the allocated portion of income and expenses to each class as a percent of its average net assets may vary due to the timing of recording these transactions in relation to fluctuating net assets of the classes. Expenses directly attributable to a fund are charged to that fund. Expenses attributable to more than one fund are allocated among the respective funds on the basis of relative net assets or other appropriate methods. Expense estimates are accrued in the period to which they relate and adjustments are made when actual amounts are known.
Income Tax Information and Distributions to Shareholders. Each year, the Fund intends to qualify as a regulated investment company under Subchapter M of the Internal Revenue Code, including distributing substantially all of its taxable income and realized gains. As a result, no provision for U.S. Federal income taxes is required. The Fund files a U.S. federal tax return, in addition to state and local tax returns as required. The Fund's federal income tax returns are subject to examination by the Internal Revenue Service (IRS) for a period of three fiscal years after they are filed. State and local tax returns may be subject to examination for an additional fiscal year depending on the jurisdiction. Foreign taxes are provided for based on the Fund's understanding of the tax rules and rates that exist in the foreign markets in which it invests.
Distributions are declared and recorded on the ex-dividend date. Income and capital gain distributions are declared separately for each class. Income and capital gain distributions are determined in accordance with income tax regulations, which may differ from GAAP.
Capital accounts within the financial statements are adjusted for permanent book-tax differences. These adjustments have no impact on net assets or the results of operations. Capital accounts are not adjusted for temporary book-tax differences which will reverse in a subsequent period.
Book-tax differences are primarily due to foreign currency transactions and losses deferred due to wash sales.
As of period end, the cost and unrealized appreciation (depreciation) in securities, and derivatives if applicable, for federal income tax purposes were as follows:
| Gross unrealized appreciation | $46,119,789 |
| Gross unrealized depreciation | (2,356,819) |
| Net unrealized appreciation (depreciation) | $43,762,970 |
| Tax cost | $140,046,699 |
4. Purchases and Sales of Investments.
Purchases and sales of securities, other than short-term securities, aggregated $77,756,044 and $86,374,008, respectively.
5. Fees and Other Transactions with Affiliates.
Management Fee. Fidelity SelectCo, LLC (the investment adviser) and its affiliates provide the Fund with investment management related services for which the Fund pays a monthly management fee. The management fee is the sum of an individual fund fee rate that is based on an annual rate of .30% of the Fund's average net assets and an annualized group fee rate that averaged .24% during the period. The group fee rate is based upon the average net assets of all the mutual funds advised by Fidelity Management & Research Company (FMR) and the investment adviser. The group fee rate decreases as assets under management increase and increases as assets under management decrease. For the reporting period, the total annualized management fee rate was .54% of the Fund's average net assets.
Transfer Agent Fees. Fidelity Investments Institutional Operations Company, Inc. (FIIOC), an affiliate of the investment adviser, is the Fund's transfer, dividend disbursing, and shareholder servicing agent. FIIOC receives an asset-based fee with respect to each class. Each class pays a fee for transfer agent services, typesetting and printing and mailing of shareholder reports, excluding mailing of proxy statements, equal to an annual rate of class-level average net assets. The annual rate for Investor Class is .15% and the annual rate for all other classes is .07%. For the period, transfer agent fees for each class were as follows:
| Initial Class | $11,518 |
| Investor Class | 104,875 |
| | $116,393 |
Accounting and Security Lending Fees. Fidelity Service Company, Inc. (FSC), an affiliate of the investment adviser, maintains the Fund's accounting records. The accounting fee is based on the level of average net assets for each month. Prior to April 1, 2019, FSC had a separate agreement with the Fund for administration of the security lending program, based on the number and duration of lending transactions. For the period, the total fees paid for accounting and administration of securities lending were equivalent to an annualized rate of .04%.
Brokerage Commissions. The Fund placed a portion of its portfolio transactions with brokerage firms which are affiliates of the investment adviser. Brokerage commissions are included in net realized gain (loss) and change in net unrealized appreciation (depreciation) in the Statement of Operations. The commissions paid to these affiliated firms were $1,612 for the period.
Interfund Trades. The Fund may purchase from or sell securities to other Fidelity Funds under procedures adopted by the Board. The procedures have been designed to ensure these interfund trades are executed in accordance with Rule 17a-7 of the 1940 Act. Interfund trades are included within the respective purchases and sales amounts shown in the Purchases and Sales of Investments note.
6. Committed Line of Credit.
The Fund participates with other funds managed by the investment adviser or an affiliate in a $4.25 billion credit facility (the "line of credit") to be utilized for temporary or emergency purposes to fund shareholder redemptions or for other short-term liquidity purposes. The Fund has agreed to pay commitment fees on its pro-rata portion of the line of credit, which amounted to $254 and is reflected in Miscellaneous expenses on the Statement of Operations. During the period, the Fund did not borrow on this line of credit.
7. Security Lending.
The Fund lends portfolio securities from time to time in order to earn additional income. For equity securities, lending agents are used, including National Financial Services (NFS), an affiliate of the Fund. Pursuant to a securities lending agreement, NFS will receive a fee, which is capped at 9.9% of daily lending revenue, for its services as lending agent. The Fund may lend securities to certain qualified borrowers. On the settlement date of the loan, the Fund receives collateral (in the form of U.S. Treasury obligations, letters of credit and/or cash) against the loaned securities and maintains collateral in an amount not less than 100% of the market value of the loaned securities during the period of the loan. The market value of the loaned securities is determined at the close of business of the Fund and any additional required collateral is delivered to the Fund on the next business day. The Fund or borrower may terminate the loan at any time, and if the borrower defaults on its obligation to return the securities loaned because of insolvency or other reasons, the Fund may apply collateral received from the borrower against the obligation. The Fund may experience delays and costs in recovering the securities loaned. Any cash collateral received is invested in the Fidelity Securities Lending Cash Central Fund. At period end, there were no security loans outstanding. Security lending income represents the income earned on investing cash collateral, less rebates paid to borrowers and any lending agent fees associated with the loan, plus any premium payments received for lending certain types of securities. Security lending income is presented in the Statement of Operations as a component of income from Fidelity Central Funds.
8. Expense Reductions.
Commissions paid to certain brokers with whom the investment adviser, or its affiliates, places trades on behalf of the Fund include an amount in addition to trade execution, which may be rebated back to the Fund to offset certain expenses. This amount totaled $7,839 for the period.
In addition, during the period the investment adviser reimbursed and/or waived a portion of fund-level operating expenses in the amount of $648.
9. Distributions to Shareholders.
Distributions to shareholders of each class were as follows:
| | Six months ended
June 30, 2019 | Year ended
December 31, 2018 |
| Distributions to shareholders | | |
| Initial Class | $3,270,659 | $1,914,706 |
| Investor Class | 13,240,899 | 7,581,141 |
| Total | $16,511,558 | $9,495,847 |
10. Share Transactions.
Transactions for each class of shares were as follows:
| | Shares | Shares | Dollars | Dollars |
| | Six months ended June 30, 2019 | Year ended December 31, 2018 | Six months ended June 30, 2019 | Year ended December 31, 2018 |
| Initial Class | | | | |
| Shares sold | 85,249 | 64,045 | $1,778,953 | $1,518,621 |
| Reinvestment of distributions | 165,185 | 87,878 | 3,270,659 | 1,914,706 |
| Shares redeemed | (171,621) | (399,316) | (3,541,135) | (9,006,877) |
| Net increase (decrease) | 78,813 | (247,393) | $1,508,477 | $(5,573,550) |
| Investor Class | | | | |
| Shares sold | 504,110 | 548,185 | $10,377,964 | $12,933,255 |
| Reinvestment of distributions | 673,837 | 349,657 | 13,240,899 | 7,581,141 |
| Shares redeemed | (798,499) | (1,785,165) | (16,491,948) | (39,894,300) |
| Net increase (decrease) | 379,448 | (887,323) | $7,126,915 | $(19,379,904) |
11. Other.
The Fund's organizational documents provide former and current trustees and officers with a limited indemnification against liabilities arising in connection with the performance of their duties to the Fund. In the normal course of business, the Fund may also enter into contracts that provide general indemnifications. The Fund's maximum exposure under these arrangements is unknown as this would be dependent on future claims that may be made against the Fund. The risk of material loss from such claims is considered remote.
At the end of the period, the investment adviser or its affiliates were the owners of record of 100% of the total outstanding shares of the Fund.
Shareholder Expense Example
As a shareholder of the Fund, you incur two types of costs: (1) transaction costs and (2) ongoing costs, including management fees and other Fund expenses. This Example is intended to help you understand your ongoing costs (in dollars) of investing in the Fund and to compare these costs with the ongoing costs of investing in other mutual funds.
The Example is based on an investment of $1,000 invested at the beginning of the period and held for the entire period (January 1, 2019 to June 30, 2019).
Actual Expenses
The first line of the accompanying table for each class of the Fund provides information about actual account values and actual expenses. You may use the information in this line, together with the amount you invested, to estimate the expenses that you paid over the period. Simply divide your account value by $1,000.00 (for example, an $8,600 account value divided by $1,000.00 = 8.6), then multiply the result by the number in the first line for a class of the Fund under the heading entitled "Expenses Paid During Period" to estimate the expenses you paid on your account during this period. The estimate of expenses does not include any fees or other expenses of any variable annuity or variable life insurance product. If they were, the estimate of expenses you paid during the period would be higher, and your ending account value would be lower. In addition, the Fund, as a shareholder in the underlying Fidelity Central Funds, will indirectly bear its pro-rata share of the fees and expenses incurred by the underlying Fidelity Central Funds. These fees and expenses are not included in the Fund's annualized expense ratio used to calculate the expense estimate in the table below.
Hypothetical Example for Comparison Purposes
The second line of the accompanying table for each class of the Fund provides information about hypothetical account values and hypothetical expenses based on a Class' actual expense ratio and an assumed rate of return of 5% per year before expenses, which is not the Class' actual return. The hypothetical account values and expenses may not be used to estimate the actual ending account balance or expenses you paid for the period. You may use this information to compare the ongoing costs of investing in the Fund and other funds. To do so, compare this 5% hypothetical example with the 5% hypothetical examples that appear in the shareholder reports of the other funds. The estimate of expenses does not include any fees or other expenses of any variable annuity or variable life insurance product. If they were, the estimate of expenses you paid during the period would be higher, and your ending account value would be lower. In addition, the Fund, as a shareholder in the underlying Fidelity Central Funds, will indirectly bear its pro-rata share of the fees and expenses incurred by the underlying Fidelity Central Funds. These fees and expenses are not included in the Fund's annualized expense ratio used to calculate the expense estimate in the table below.
Please note that the expenses shown in the table are meant to highlight your ongoing costs only and do not reflect any transaction costs. Therefore, the second line of the table is useful in comparing ongoing costs only, and will not help you determine the relative total costs of owning different funds.
| | Annualized Expense Ratio-A | Beginning
Account Value
January 1, 2019 | Ending
Account Value
June 30, 2019 | Expenses Paid
During Period-B
January 1, 2019
to June 30, 2019 |
| Initial Class | .68% | | | |
| Actual | | $1,000.00 | $1,242.10 | $3.78 |
| Hypothetical-C | | $1,000.00 | $1,021.42 | $3.41 |
| Investor Class | .76% | | | |
| Actual | | $1,000.00 | $1,241.40 | $4.22 |
| Hypothetical-C | | $1,000.00 | $1,021.03 | $3.81 |
A Annualized expense ratio reflects expenses net of applicable fee waivers.
B Expenses are equal to each Class' annualized expense ratio, multiplied by the average account value over the period, multiplied by 181/365 (to reflect the one-half year period).
C 5% return per year before expenses
Board Approval of Investment Advisory Contracts and Management Fees
VIP Industrials Portfolio
Each year, the Board of Trustees, including the Independent Trustees (together, the Board), votes on the renewal of the management contract with Fidelity SelectCo, LLC (SelectCo), an affiliate of Fidelity Management & Research Company (FMR), and the sub-advisory agreements with affiliates of FMR (together, the Advisory Contracts) for the fund. SelectCo and the sub-advisers are referred to herein as the Investment Advisers. The Board, assisted by the advice of fund counsel and Independent Trustees' counsel, requests and considers a broad range of information relevant to the renewal of the Advisory Contracts throughout the year.
The Board meets regularly and, at each of its meetings, covers an extensive agenda of topics and materials and considers factors that are relevant to its annual consideration of the renewal of the fund's Advisory Contracts, including the services and support provided to the fund and its shareholders. The Board has established various standing committees (Committees), each composed of and chaired by Independent Trustees with varying backgrounds, to which the Board has assigned specific subject matter responsibilities in order to enhance effective decision-making by the Board. The Board, acting directly and through its Committees, requests and receives information concerning the annual consideration of the renewal of the fund's Advisory Contracts. The Board also meets as needed to review matters specifically related to the Board's annual consideration of the renewal of the Advisory Contracts. Members of the Board may also meet with trustees of other Fidelity funds through joint ad hoc committees to discuss certain matters relevant to all of the Fidelity funds.
At its January 2019 meeting, the Board unanimously determined to renew the fund's Advisory Contracts. In reaching its determination, the Board considered all factors it believed relevant, including (i) the nature, extent, and quality of the services to be provided to the fund and its shareholders (including the investment performance of the fund); (ii) the competitiveness of the fund's management fee and total expense ratio relative to peer funds; (iii) the total costs of the services to be provided by and the profits to be realized by Fidelity from its relationships with the fund; and (iv) the extent to which, if any, economies of scale exist and would be realized as the fund grows, and whether any economies of scale are appropriately shared with fund shareholders.
In considering whether to renew the Advisory Contracts for the fund, the Board reached a determination, with the assistance of fund counsel and Independent Trustees' counsel and through the exercise of its business judgment, that the renewal of the Advisory Contracts was in the best interests of the fund and its shareholders and that the compensation payable under the Advisory Contracts was fair and reasonable. The Board's decision to renew the Advisory Contracts was not based on any single factor, but rather was based on a comprehensive consideration of all the information provided to the Board at its meetings throughout the year. The Board, in reaching its determination to renew the Advisory Contracts, was aware that shareholders of the fund have a broad range of investment choices available to them, including a wide choice among funds offered by Fidelity's competitors, and that the fund's shareholders, who have the opportunity to review and weigh the disclosure provided by the fund in its prospectus and other public disclosures, have chosen to invest in this fund, which is part of the Fidelity family of funds.
Nature, Extent, and Quality of Services Provided. The Board considered Fidelity's staffing as it relates to the fund, including the backgrounds of investment personnel of Fidelity, and also considered the fund's investment objective, strategies, and related investment philosophy. The Independent Trustees also had discussions with senior management of Fidelity's investment operations and investment groups. The Board considered the structure of the investment personnel compensation program and whether this structure provides appropriate incentives to act in the best interests of the fund. Additionally, the Board considered the portfolio managers' investments, if any, in the funds that they manage.
Resources Dedicated to Investment Management and Support Services. The Board and the Fund Oversight and Research Committees reviewed the general qualifications and capabilities of Fidelity's investment staff, including its size, education, experience, and resources, as well as Fidelity's approach to recruiting, training, managing, and compensating investment personnel. The Board noted that Fidelity has continued to increase the resources devoted to non-U.S. offices, including expansion of Fidelity's global investment organization. The Board also noted that Fidelity's analysts have extensive resources, tools and capabilities that allow them to conduct sophisticated quantitative and fundamental analysis, as well as credit analysis of issuers, counterparties and guarantors. Further, the Board considered that Fidelity's investment professionals have sufficient access to global information and data so as to provide competitive investment results over time, and that those professionals also have access to sophisticated tools that permit them to assess portfolio construction and risk and performance attribution characteristics continuously, as well as to transmit new information and research conclusions rapidly around the world. Additionally, in its deliberations, the Board considered Fidelity's trading, risk management, compliance, and technology and operations capabilities and resources, which are integral parts of the investment management process.
Shareholder and Administrative Services. The Board considered (i) the nature, extent, quality, and cost of advisory, administrative, and shareholder services performed by the Investment Advisers and their affiliates under the Advisory Contracts and under separate agreements covering transfer agency, pricing and bookkeeping, and securities lending services for the fund; (ii) the nature and extent of the supervision of third party service providers, principally custodians, subcustodians, and pricing vendors; and (iii) the resources devoted to, and the record of compliance with, the fund's compliance policies and procedures. The Board also reviewed the allocation of fund brokerage, including allocations to brokers affiliated with the Investment Advisers, the use of brokerage commissions to pay fund expenses, and the use of "soft" commission dollars to pay for research services.
The Board noted that the growth of fund assets over time across the complex allows Fidelity to reinvest in the development of services designed to enhance the value and convenience of the Fidelity funds as investment vehicles. These services include 24-hour access to account information and market information through telephone representatives and over the Internet, investor education materials and asset allocation tools, and the expanded availability of Fidelity Investor Centers.
The Board noted that it and the boards of certain other Fidelity funds had formed an ad hoc Committee on Transfer Agency Fees to review the variety of transfer agency fee structures throughout the industry and Fidelity's competitive positioning with respect to industry participants.
Investment in a Large Fund Family. The Board considered the benefits to shareholders of investing in a Fidelity fund, including the benefits of investing in a fund that is part of a large family of funds offering a variety of investment disciplines and providing a large variety of mutual fund investor services. The Board noted that Fidelity had taken, or had made recommendations that resulted in the Fidelity funds taking, a number of actions over the previous year that benefited particular funds, including: (i) continuing to dedicate additional resources to Fidelity's investment research process, which includes meetings with management of issuers of securities in which the funds invest, and to the support of the senior management team that oversees asset management; (ii) continuing efforts to enhance Fidelity's global research capabilities; (iii) launching new funds and making other enhancements to meet client needs; (iv) launching new share classes of existing funds; (v) eliminating purchase minimums and broadening eligibility requirements for certain funds and share classes; (vi) reducing management fees and total expenses for certain growth equity funds and index funds; (vii) lowering expense caps for certain existing funds and classes, and converting certain voluntary expense caps to contractual caps, to reduce expenses borne by shareholders; (viii) eliminating short-term redemption fees for funds that had such fees; (ix) rationalizing product lines and gaining increased efficiencies from fund mergers and share class consolidations; (x) continuing to develop, acquire and implement systems and technology to improve services to the funds and shareholders, strengthen information security, and increase efficiency; and (xi) continuing to implement enhancements to further strengthen Fidelity's product line to increase investors' probability of success in achieving their investment goals, including retirement income goals.
Investment Performance. The Board considered whether the fund has operated in accordance with its investment objective, as well as its record of compliance with its investment restrictions and its performance history. The fund had a portfolio manager change in November 2018. The Board will continue to monitor closely the fund's performance, taking into account the portfolio manager change.
The Board took into account discussions that occur at Board meetings throughout the year with representatives of the Investment Advisers about fund investment performance. In this regard the Board noted that as part of regularly scheduled fund reviews and other reports to the Board on fund performance, the Board considers annualized return information for the fund for different time periods, measured against an appropriate securities market index ("benchmark index"). In its evaluation of fund investment performance, the Board gave particular attention to information indicating changes in performance of certain Fidelity funds for specific time periods and discussed with the Investment Advisers the reasons for any overperformance or underperformance.
In addition to reviewing absolute and relative fund performance, the Independent Trustees periodically consider the appropriateness of fund performance metrics in evaluating the results achieved. In general, the Independent Trustees believe that fund performance should be evaluated based on net performance (after fees and expenses) of both the highest performing and lowest performing fund share classes, where applicable, compared to appropriate benchmark indices, over appropriate time periods that may include full market cycles, taking into account relevant factors including the following: general market conditions; issuer-specific information; and fund cash flows and other factors.
The Independent Trustees recognize that shareholders evaluate performance on a net basis over their own holding periods, for which one-, three-, and five-year periods are often used as a proxy. For this reason, the performance information reviewed by the Board also included net cumulative total return information for the fund and an appropriate benchmark index for the most recent one-, three-, and five-year periods ended June 30, 2018, as shown below.
VIP Industrials Portfolio

The Board considered the fund's underperformance for different time based on time periods ended prior to June 30, 2018 (which periods are not shown in the chart above). The Board noted that the fund's underperformance has continued since the Board approved the management contract in 2017 and 2018. The Board's discussions with SelectCo regarding underperformance cover topics including, but not limited to: the longer-term track record of a fund's portfolio manager(s); broader trends in the market that may adversely impact a fund's performance; attribution reports on contributors to the fund's underperformance; and the applicable portfolio manager's explanation of his or her underperformance. The Board engages with SelectCo on steps that might be taken to address a fund's underperformance. The Board noted that the fund's more recent performance had improved.
Based on its review, the Board concluded that the nature, extent, and quality of services provided to the fund under the Advisory Contracts should continue to benefit the shareholders of the fund.
Competitiveness of Management Fee and Total Expense Ratio. The Board considered the fund's management fee and total expense ratio compared to "mapped groups" of competitive funds and classes created for the purpose of facilitating the Trustees' competitive analysis of management fees and total expenses. Fidelity creates "mapped groups" by combining similar Lipper investment objective categories that have comparable investment mandates. For this purpose, all sector focused equity variable annuity funds are grouped in the same mapped group. Combining Lipper investment objective categories aids the Board's management fee and total expense ratio comparisons by broadening the competitive group used for comparison.
Management Fee. The Board considered two proprietary management fee comparisons for the 12-month periods ended June 30 shown in basis points (BP) in the chart below. The group of Lipper funds used by the Board for management fee comparisons is referred to below as the "Total Mapped Group." The Total Mapped Group comparison focuses on a fund's standing in terms of gross management fees before expense reimbursements or caps relative to the total universe of funds with comparable investment mandates (i.e., sector equities), regardless of whether their management fee structures also are comparable. Funds with comparable management fee structures have similar management fee contractual arrangements (
e.g., flat rate charged for advisory services, all-inclusive fee rate,
etc.). "TMG %" represents the percentage of funds in the Total Mapped Group that had management fees that were lower than the fund's. For example, a hypothetical TMG % of 20% would mean that 80% of the funds in the Total Mapped Group had higher, and 20% had lower, management fees than the fund. The fund's actual TMG %s and the number of funds in the Total Mapped Group are in the chart below. The "Asset-Size Peer Group" (ASPG) comparison focuses on a fund's standing relative to a subset of non-Fidelity funds within the Total Mapped Group that are similar in size and management fee structure. For example, if a fund is in the first quartile of the ASPG, the fund's management fee ranks in the least expensive or lowest 25% of funds in the ASPG. The ASPG represents at least 15% of the funds in the Total Mapped Group with comparable asset size and management fee structures, subject to a minimum of 50 funds (or all funds in the Total Mapped Group if fewer than 50). Additional information, such as the ASPG quartile in which the fund's management fee rate ranked, is also included in the chart and was considered by the Board.
VIP Industrials Portfolio

The Board noted that the fund's management fee rate ranked below the median of its Total Mapped Group and below the median of its ASPG for the 12-month period ended June 30, 2018.
The Board noted that it and the boards of other Fidelity funds formed an ad hoc Committee on Group Fee, which meets periodically, to conduct an in-depth review of the "group fee" component of the management fee of funds with such management fee structures. The Committee's focus included the mechanics of the group fee, the competitive landscape of group fee structures, Fidelity funds with no group fee component and investment products not included in group fee assets. The Board also considered that, for funds subject to the group fee, FMR agreed to voluntarily waive fees over a specified period of time in amounts designed to account for assets converted from certain funds to certain collective investment trusts.
Based on its review, the Board concluded that the fund's management fee is fair and reasonable in light of the services that the fund receives and the other factors considered.
Total Expense Ratio. In its review of each class's total expense ratio, the Board considered the fund's management fee rate as well as other fund or class expenses, as applicable, such as transfer agent fees, pricing and bookkeeping fees, and custodial, legal, and audit fees. The Board also noted that Fidelity may agree to waive fees and expenses from time to time, and the extent to which, if any, it has done so for the fund. As part of its review, the Board also considered the current and historical total expense ratios of each class of the fund compared to competitive fund median expenses. Each class of the fund is compared to those funds and classes in the Total Mapped Group (used by the Board for management fee comparisons) that have a similar sales load structure.
The Board noted that the total expense ratio of each class ranked below the competitive median for the 12-month period ended June 30, 2018.
Fees Charged to Other Fidelity Clients. The Board also considered Fidelity fee structures and other information with respect to clients of Fidelity, such as other funds advised or subadvised by Fidelity, pension plan clients, and other institutional clients with similar mandates. The Board noted that a joint ad hoc committee created by it and the boards of other Fidelity funds periodically reviews and compares Fidelity's institutional investment advisory business with its business of providing services to the Fidelity funds, and also noted the most recent findings of the committee. The Board noted that the committee's review included a consideration of the differences in services provided, fees charged, and costs incurred, as well as competition in the markets serving the different categories of clients.
Based on its review of total expense ratios and fees charged to other Fidelity clients, the Board concluded that the total expense ratio of each class of the fund was reasonable in light of the services that the fund and its shareholders receive and the other factors considered.
Costs of the Services and Profitability. The Board considered the revenues earned and the expenses incurred by Fidelity in conducting the business of developing, marketing, distributing, managing, administering and servicing the fund and servicing the fund's shareholders. The Board also considered the level of Fidelity's profits in respect of all the Fidelity funds.
On an annual basis, Fidelity presents to the Board information about the profitability of its relationships with the fund. Fidelity calculates profitability information for each fund, as well as aggregate profitability information for groups of Fidelity funds and all Fidelity funds, using a series of detailed revenue and cost allocation methodologies which originate with the books and records of Fidelity on which Fidelity's audited financial statements are based. The Audit Committee of the Board reviews any significant changes from the prior year's methodologies.
PricewaterhouseCoopers LLP (PwC), auditor to Fidelity and certain Fidelity funds, has been engaged annually by the Board as part of the Board's assessment of Fidelity's profitability analysis. PwC's engagement includes the review and assessment of the methodologies used by Fidelity in determining the revenues and expenses attributable to Fidelity's mutual fund business, and completion of agreed-upon procedures in respect of the mathematical accuracy of the fund profitability information and its conformity to established allocation methodologies. After considering PwC's reports issued under the engagement and information provided by Fidelity, the Board concluded that while other allocation methods may also be reasonable, Fidelity's profitability methodologies are reasonable in all material respects.
The Board also reviewed Fidelity's non-fund businesses and potential indirect benefits such businesses may have received as a result of their association with Fidelity's mutual fund business (i.e., fall-out benefits) as well as cases where Fidelity's affiliates may benefit from the fund's business. The Board noted that changes to fall-out benefits year-over-year reflect business developments at Fidelity's various businesses.
The Board considered the costs of the services provided by and the profits realized by Fidelity in connection with the operation of the fund and was satisfied that the profitability was not excessive.
Economies of Scale. The Board considered whether there have been economies of scale in respect of the management of the Fidelity funds, whether the Fidelity funds (including the fund) have appropriately benefited from any such economies of scale, and whether there is potential for realization of any further economies of scale. The Board considered the extent to which the fund will benefit from economies of scale as assets grow through increased services to the fund, through waivers or reimbursements, or through fee or expense ratio reductions. The Board also noted that a committee (the Economies of Scale Committee) created by it and the boards of other Fidelity funds periodically analyzes whether Fidelity attains economies of scale in respect of the management and servicing of the Fidelity funds, whether the Fidelity funds have appropriately benefited from such economies of scale, and whether there is potential for realization of any further economies of scale.
The Board recognized that the fund's management contract incorporates a "group fee" structure, which provides for lower group fee rates as total group assets increase, and for higher group fee rates as total group assets decrease (with "group assets" defined to include fund assets under SelectCo's management plus assets under FMR's management). SelectCo calculates the group fee rates based on a tiered asset "breakpoint" schedule that varies based on asset class. The Board considered that the group fee is designed to deliver the benefits of economies of scale to fund shareholders when total group assets increase, even if assets of any particular fund are unchanged or have declined, because some portion of Fidelity's costs are attributable to services provided to all Fidelity funds, and all funds benefit if those costs can be allocated among more assets. The Board concluded that, given the group fee structure, fund shareholders will benefit from lower management fees as group assets increase at the fund complex level, regardless of whether Fidelity achieves any such economies of scale.
The Board concluded, taking into account the analysis of the Economies of Scale Committee, that economies of scale, if any, are being appropriately shared between fund shareholders and Fidelity.
Additional Information Requested by the Board. In order to develop fully the factual basis for consideration of the Fidelity funds' advisory contracts, the Board requested and received additional information on certain topics, including: (i) fund performance trends, in particular the underperformance of certain funds, and Fidelity's long-term strategies for certain funds; (ii) Fidelity's fund profitability methodology, profitability trends for certain funds, and the impact of certain factors on fund profitability results; (iii) metrics for evaluating index fund and ETF performance and information about ETF trading characteristics; (iv) the methodology with respect to the evaluation of competitive fund data and peer group classifications and fee comparisons; (v) the expense structures for different funds and classes; (vi) information regarding other accounts managed by Fidelity, including collective investment trusts; and (vii) Fidelity's philosophies and strategies for evaluating funds and classes with lower or declining asset levels.
Based on its evaluation of all of the conclusions noted above, and after considering all factors it believed relevant, the Board concluded that the advisory fee arrangements are fair and reasonable, and that the fund's Advisory Contracts should be renewed.
VCYLIC-SANN-0819
1.817364.114
Fidelity® Variable Insurance Products: Consumer Discretionary Portfolio
Semi-Annual Report June 30, 2019 |
|
Beginning on January 1, 2021, as permitted by regulations adopted by the Securities and Exchange Commission, and if your insurance carrier elects to participate, you may not be receiving paper copies of the Fund’s shareholder reports from the insurance company that offers your variable insurance product unless you specifically request paper copies from your financial professional or the administrator of your variable insurance product. Instead, the reports will be made available on a website, and you will be notified by mail each time a report is posted and provided with a website link to access the report.
If you already elected to receive shareholder reports electronically, you will not be affected by this change and you need not take any action. You may elect to receive shareholder reports and other communications from the Fund electronically, by contacting your financial professional or the administrator of your variable insurance product. If you own a Fidelity-administered variable insurance product, please visit fidelity.com/mailpreferences to make your election or call 1-800-343-3548.
You may elect to receive all future reports in paper free of charge. If you wish to continue receiving paper copies of your shareholder reports, you may contact your financial professional or the administrator of your variable insurance product. If you own a Fidelity-administered variable insurance product, please visit fidelity.com/mailpreferences to make your election or call 1-800-343-3548. Your election to receive reports in paper will apply to all funds available under your variable insurance product.
Contents
To view a fund's proxy voting guidelines and proxy voting record for the 12-month period ended June 30, visit http://www.fidelity.com/proxyvotingresults or visit the Securities and Exchange Commission's (SEC) web site at http://www.sec.gov.
You may also call 1-877-208-0098 to request a free copy of the proxy voting guidelines.
Fidelity® Variable Insurance Products are separate account options which are purchased through a variable insurance contract.
Standard & Poor's, S&P and S&P 500 are registered service marks of The McGraw-Hill Companies, Inc. and have been licensed for use by Fidelity Distributors Corporation.
Other third-party marks appearing herein are the property of their respective owners.
All other marks appearing herein are registered or unregistered trademarks or service marks of FMR LLC or an affiliated company. © 2019 FMR LLC. All rights reserved.
This report and the financial statements contained herein are submitted for the general information of the shareholders of the Fund. This report is not authorized for distribution to prospective investors in the Fund unless preceded or accompanied by an effective prospectus.
A fund files its complete schedule of portfolio holdings with the SEC for the first and third quarters of each fiscal year on Form N-PORT. Forms N-PORT are available on the SEC’s web site at http://www.sec.gov. A fund's Forms N-PORT may be reviewed and copied at the SEC’s Public Reference Room in Washington, DC. Information regarding the operation of the SEC's Public Reference Room may be obtained by calling 1-800-SEC-0330.
For a complete list of a fund's portfolio holdings, view the most recent holdings listing, semiannual report, or annual report on Fidelity's web site at http://www.fidelity.com, http://www.institutional.fidelity.com, or http://www.401k.com, as applicable.
NOT FDIC INSURED •MAY LOSE VALUE •NO BANK GUARANTEE
Neither the Fund nor Fidelity Distributors Corporation is a bank.
Investment Summary (Unaudited)
Top Ten Stocks as of June 30, 2019
| | % of fund's net assets |
| Amazon.com, Inc. | 23.1 |
| The Home Depot, Inc. | 8.1 |
| McDonald's Corp. | 5.0 |
| Lowe's Companies, Inc. | 3.9 |
| The Booking Holdings, Inc. | 3.6 |
| Royal Caribbean Cruises Ltd. | 3.2 |
| NIKE, Inc. Class B | 3.1 |
| TJX Companies, Inc. | 2.9 |
| Burlington Stores, Inc. | 2.9 |
| Dollar Tree, Inc. | 2.4 |
| | 58.2 |
Top Industries (% of fund's net assets)
| As of June 30, 2019 |
| | Internet & Direct Marketing Retail | 27.4% |
| | Specialty Retail | 26.6% |
| | Hotels, Restaurants & Leisure | 22.2% |
| | Textiles, Apparel & Luxury Goods | 9.3% |
| | Multiline Retail | 5.1% |
| | All Others* | 9.4% |

* Includes short-term investments and net other assets (liabilities).
Schedule of Investments June 30, 2019 (Unaudited)
Showing Percentage of Net Assets
| Common Stocks - 100.0% | | | |
| | | Shares | Value |
| Automobiles - 0.3% | | | |
| Automobile Manufacturers - 0.3% | | | |
| Ferrari NV | | 4,200 | $677,964 |
| Beverages - 0.3% | | | |
| Distillers & Vintners - 0.2% | | | |
| Constellation Brands, Inc. Class A (sub. vtg.) | | 2,700 | 531,738 |
| Soft Drinks - 0.1% | | | |
| Luckin Coffee, Inc. ADR | | 2,100 | 40,929 |
| Monster Beverage Corp. (a) | | 1,800 | 114,894 |
| | | | 155,823 |
|
| TOTAL BEVERAGES | | | 687,561 |
|
| Commercial Services & Supplies - 0.2% | | | |
| Diversified Support Services - 0.2% | | | |
| Copart, Inc. (a) | | 5,600 | 418,544 |
| Distributors - 0.6% | | | |
| Distributors - 0.6% | | | |
| LKQ Corp. (a) | | 30,000 | 798,300 |
| Pool Corp. | | 2,447 | 467,377 |
| | | | 1,265,677 |
| Diversified Consumer Services - 1.3% | | | |
| Education Services - 1.3% | | | |
| Grand Canyon Education, Inc. (a) | | 19,700 | 2,305,294 |
| New Oriental Education & Technology Group, Inc. sponsored ADR (a) | | 4,100 | 395,978 |
| | | | 2,701,272 |
| Entertainment - 0.6% | | | |
| Interactive Home Entertainment - 0.1% | | | |
| Electronic Arts, Inc. (a) | | 2,000 | 202,520 |
| Movies & Entertainment - 0.5% | | | |
| Live Nation Entertainment, Inc. (a) | | 3,800 | 251,750 |
| Netflix, Inc. (a) | | 1,000 | 367,320 |
| World Wrestling Entertainment, Inc. Class A | | 5,700 | 411,597 |
| | | | 1,030,667 |
|
| TOTAL ENTERTAINMENT | | | 1,233,187 |
|
| Food & Staples Retailing - 1.3% | | | |
| Food Distributors - 0.5% | | | |
| Performance Food Group Co. (a) | | 27,900 | 1,116,837 |
| Hypermarkets & Super Centers - 0.8% | | | |
| BJ's Wholesale Club Holdings, Inc. | | 40,100 | 1,058,640 |
| Walmart, Inc. | | 4,700 | 519,303 |
| | | | 1,577,943 |
|
| TOTAL FOOD & STAPLES RETAILING | | | 2,694,780 |
|
| Health Care Providers & Services - 0.1% | | | |
| Health Care Services - 0.1% | | | |
| National Vision Holdings, Inc. (a) | | 3,500 | 107,555 |
| Hotels, Restaurants & Leisure - 22.2% | | | |
| Casinos & Gaming - 1.8% | | | |
| Boyd Gaming Corp. | | 22,600 | 608,844 |
| Churchill Downs, Inc. | | 6,500 | 747,955 |
| Eldorado Resorts, Inc. (a) | | 32,862 | 1,513,952 |
| Wynn Resorts Ltd. | | 7,598 | 942,076 |
| | | | 3,812,827 |
| Hotels, Resorts & Cruise Lines - 7.9% | | | |
| Hilton Grand Vacations, Inc. (a) | | 27,383 | 871,327 |
| Hilton Worldwide Holdings, Inc. | | 13,600 | 1,329,264 |
| Marriott International, Inc. Class A | | 31,000 | 4,348,990 |
| Marriott Vacations Worldwide Corp. | | 16,400 | 1,580,960 |
| Royal Caribbean Cruises Ltd. | | 54,800 | 6,642,308 |
| Wyndham Destinations, Inc. | | 16,600 | 728,740 |
| Wyndham Hotels & Resorts, Inc. | | 16,000 | 891,840 |
| | | | 16,393,429 |
| Leisure Facilities - 1.7% | | | |
| Drive Shack, Inc. (a) | | 62,200 | 291,718 |
| Planet Fitness, Inc. (a) | | 28,000 | 2,028,320 |
| Vail Resorts, Inc. | | 5,280 | 1,178,390 |
| | | | 3,498,428 |
| Restaurants - 10.8% | | | |
| ARAMARK Holdings Corp. | | 42,021 | 1,515,277 |
| Chipotle Mexican Grill, Inc. (a) | | 2,511 | 1,840,262 |
| Domino's Pizza, Inc. | | 7,205 | 2,005,007 |
| McDonald's Corp. | | 50,500 | 10,486,830 |
| Restaurant Brands International, Inc. | | 14,300 | 994,465 |
| Starbucks Corp. | | 21,670 | 1,816,596 |
| U.S. Foods Holding Corp. (a) | | 32,613 | 1,166,241 |
| Yum! Brands, Inc. | | 24,500 | 2,711,415 |
| | | | 22,536,093 |
|
| TOTAL HOTELS, RESTAURANTS & LEISURE | | | 46,240,777 |
|
| Household Durables - 3.3% | | | |
| Home Furnishings - 0.5% | | | |
| Mohawk Industries, Inc. (a) | | 7,000 | 1,032,290 |
| Homebuilding - 2.8% | | | |
| Cavco Industries, Inc. (a) | | 2,600 | 409,604 |
| D.R. Horton, Inc. | | 52,700 | 2,272,951 |
| Lennar Corp. Class A | | 33,100 | 1,604,026 |
| NVR, Inc. (a) | | 470 | 1,584,018 |
| | | | 5,870,599 |
|
| TOTAL HOUSEHOLD DURABLES | | | 6,902,889 |
|
| Interactive Media & Services - 0.5% | | | |
| Interactive Media & Services - 0.5% | | | |
| Alphabet, Inc. Class A (a) | | 1,000 | 1,082,800 |
| Internet & Direct Marketing Retail - 27.4% | | | |
| Internet & Direct Marketing Retail - 27.4% | | | |
| Amazon.com, Inc. (a) | | 25,399 | 48,096,309 |
| eBay, Inc. | | 16,900 | 667,550 |
| Liberty Interactive Corp. QVC Group Series A (a) | | 47,750 | 591,623 |
| The Booking Holdings, Inc. (a) | | 4,000 | 7,498,840 |
| The RealReal, Inc. | | 400 | 11,560 |
| Wayfair LLC Class A (a) | | 1,737 | 253,602 |
| | | | 57,119,484 |
| IT Services - 0.3% | | | |
| Data Processing & Outsourced Services - 0.3% | | | |
| PayPal Holdings, Inc. (a) | | 5,100 | 583,746 |
| Leisure Products - 0.5% | | | |
| Leisure Products - 0.5% | | | |
| Mattel, Inc. (a)(b) | | 73,996 | 829,495 |
| OneSpaWorld Holdings Ltd. (a) | | 18,400 | 285,200 |
| | | | 1,114,695 |
| Multiline Retail - 5.1% | | | |
| General Merchandise Stores - 5.1% | | | |
| B&M European Value Retail SA | | 56,770 | 240,293 |
| Dollar General Corp. | | 33,900 | 4,581,924 |
| Dollar Tree, Inc. (a) | | 46,200 | 4,961,418 |
| Ollie's Bargain Outlet Holdings, Inc. (a) | | 9,900 | 862,389 |
| | | | 10,646,024 |
| Software - 0.1% | | | |
| Application Software - 0.1% | | | |
| 2U, Inc. (a) | | 7,105 | 267,432 |
| Specialty Retail - 26.6% | | | |
| Apparel Retail - 8.7% | | | |
| Burlington Stores, Inc. (a) | | 35,083 | 5,969,372 |
| Ross Stores, Inc. | | 43,582 | 4,319,848 |
| The Children's Place Retail Stores, Inc. | | 17,600 | 1,678,688 |
| TJX Companies, Inc. | | 115,534 | 6,109,438 |
| | | | 18,077,346 |
| Automotive Retail - 2.8% | | | |
| AutoZone, Inc. (a) | | 2,000 | 2,198,940 |
| Monro, Inc. | | 9,010 | 768,553 |
| O'Reilly Automotive, Inc. (a) | | 7,973 | 2,944,588 |
| | | | 5,912,081 |
| Computer & Electronics Retail - 0.9% | | | |
| Best Buy Co., Inc. | | 26,777 | 1,867,160 |
| Home Improvement Retail - 12.4% | | | |
| Floor & Decor Holdings, Inc. Class A (a) | | 21,400 | 896,660 |
| Lowe's Companies, Inc. | | 80,700 | 8,143,437 |
| The Home Depot, Inc. | | 81,300 | 16,907,961 |
| | | | 25,948,058 |
| Specialty Stores - 1.8% | | | |
| Five Below, Inc. (a) | | 6,800 | 816,136 |
| Tiffany & Co., Inc. | | 6,000 | 561,840 |
| Ulta Beauty, Inc. (a) | | 6,600 | 2,289,474 |
| | | | 3,667,450 |
|
| TOTAL SPECIALTY RETAIL | | | 55,472,095 |
|
| Textiles, Apparel & Luxury Goods - 9.3% | | | |
| Apparel, Accessories & Luxury Goods - 6.1% | | | |
| adidas AG | | 1,221 | 376,950 |
| Canada Goose Holdings, Inc. (a) | | 8,900 | 344,501 |
| Capri Holdings Ltd. (a) | | 39,200 | 1,359,456 |
| Carter's, Inc. | | 5,900 | 575,486 |
| G-III Apparel Group Ltd. (a) | | 12,500 | 367,750 |
| Kering SA | | 885 | 523,394 |
| lululemon athletica, Inc. (a) | | 2,368 | 426,737 |
| LVMH Moet Hennessy Louis Vuitton SE | | 1,854 | 788,183 |
| PVH Corp. | | 36,100 | 3,416,504 |
| Tapestry, Inc. | | 92,600 | 2,938,198 |
| VF Corp. | | 17,700 | 1,546,095 |
| | | | 12,663,254 |
| Footwear - 3.2% | | | |
| NIKE, Inc. Class B | | 76,770 | 6,444,842 |
| Puma AG | | 3,430 | 228,750 |
| | | | 6,673,592 |
|
| TOTAL TEXTILES, APPAREL & LUXURY GOODS | | | 19,336,846 |
|
| TOTAL COMMON STOCKS | | | |
| (Cost $147,011,019) | | | 208,553,328 |
|
| Money Market Funds - 0.5% | | | |
| Fidelity Cash Central Fund 2.42% (c) | | 327,398 | 327,463 |
| Fidelity Securities Lending Cash Central Fund 2.42% (c)(d) | | 650,710 | 650,775 |
| TOTAL MONEY MARKET FUNDS | | | |
| (Cost $978,238) | | | 978,238 |
| TOTAL INVESTMENT IN SECURITIES - 100.5% | | | |
| (Cost $147,989,257) | | | 209,531,566 |
| NET OTHER ASSETS (LIABILITIES) - (0.5)% | | | (1,110,857) |
| NET ASSETS - 100% | | | $208,420,709 |
Legend
(a) Non-income producing
(b) Security or a portion of the security is on loan at period end.
(c) Affiliated fund that is generally available only to investment companies and other accounts managed by Fidelity Investments. The rate quoted is the annualized seven-day yield of the fund at period end. A complete unaudited listing of the fund's holdings as of its most recent quarter end is available upon request. In addition, each Fidelity Central Fund's financial statements are available on the SEC's website or upon request.
(d) Investment made with cash collateral received from securities on loan.
Affiliated Central Funds
Information regarding fiscal year to date income earned by the Fund from investments in Fidelity Central Funds is as follows:
| Fund | Income earned |
| Fidelity Cash Central Fund | $6,976 |
| Fidelity Securities Lending Cash Central Fund | 1,952 |
| Total | $8,928 |
Amounts in the income column in the above table include any capital gain distributions from underlying funds, which are presented in the corresponding line-item in the Statement of Operations, if applicable. Amount for Fidelity Securities Lending Cash Central Fund represents securities lending income earned from the reinvestment of cash collateral from loaned securities, net of payments to and from borrowers of securities.
Investment Valuation
The following is a summary of the inputs used, as of June 30, 2019, involving the Fund's assets and liabilities carried at fair value. The inputs or methodology used for valuing securities may not be an indication of the risk associated with investing in those securities. For more information on valuation inputs, and their aggregation into the levels used below, please refer to the Investment Valuation section in the accompanying Notes to Financial Statements.
| | Valuation Inputs at Reporting Date: |
| Description | Total | Level 1 | Level 2 | Level 3 |
| Investments in Securities: | | | | |
| Common Stocks | $208,553,328 | $207,765,145 | $788,183 | $-- |
| Money Market Funds | 978,238 | 978,238 | -- | -- |
| Total Investments in Securities: | $209,531,566 | $208,743,383 | $788,183 | $-- |
See accompanying notes which are an integral part of the financial statements.
Financial Statements
Statement of Assets and Liabilities
| | | June 30, 2019 (Unaudited) |
| Assets | | |
Investment in securities, at value (including securities loaned of $651,256) — See accompanying schedule:
Unaffiliated issuers (cost $147,011,019) | $208,553,328 | |
| Fidelity Central Funds (cost $978,238) | 978,238 | |
| Total Investment in Securities (cost $147,989,257) | | $209,531,566 |
| Receivable for investments sold | | 518,151 |
| Receivable for fund shares sold | | 15 |
| Dividends receivable | | 124,034 |
| Distributions receivable from Fidelity Central Funds | | 1,126 |
| Prepaid expenses | | 1,225 |
| Other receivables | | 4,144 |
| Total assets | | 210,180,261 |
| Liabilities | | |
| Payable for investments purchased | $755,348 | |
| Payable for fund shares redeemed | 202,185 | |
| Accrued management fee | 92,422 | |
| Other affiliated payables | 29,788 | |
| Other payables and accrued expenses | 29,569 | |
| Collateral on securities loaned | 650,240 | |
| Total liabilities | | 1,759,552 |
| Net Assets | | $208,420,709 |
| Net Assets consist of: | | |
| Paid in capital | | $148,876,717 |
| Total distributable earnings (loss) | | 59,543,992 |
| Net Assets | | $208,420,709 |
| Net Asset Value and Maximum Offering Price | | |
| Initial Class: | | |
| Net Asset Value, offering price and redemption price per share ($28,162,214 ÷ 1,175,509 shares) | | $23.96 |
| Investor Class: | | |
| Net Asset Value, offering price and redemption price per share ($180,258,495 ÷ 7,549,120 shares) | | $23.88 |
See accompanying notes which are an integral part of the financial statements.
Statement of Operations
| | | Six months ended June 30, 2019 (Unaudited) |
| Investment Income | | |
| Dividends | | $1,031,824 |
| Income from Fidelity Central Funds (including $1,952 from security lending) | | 8,928 |
| Total income | | 1,040,752 |
| Expenses | | |
| Management fee | $545,645 | |
| Transfer agent fees | 136,154 | |
| Accounting and security lending fees | 39,555 | |
| Custodian fees and expenses | 13,192 | |
| Independent trustees' fees and expenses | 485 | |
| Audit | 28,426 | |
| Legal | 157 | |
| Miscellaneous | 712 | |
| Total expenses before reductions | 764,326 | |
| Expense reductions | (6,060) | |
| Total expenses after reductions | | 758,266 |
| Net investment income (loss) | | 282,486 |
| Realized and Unrealized Gain (Loss) | | |
| Net realized gain (loss) on: | | |
| Investment securities: | | |
| Unaffiliated issuers | 887,299 | |
| Fidelity Central Funds | (2) | |
| Foreign currency transactions | 1,804 | |
| Total net realized gain (loss) | | 889,101 |
| Change in net unrealized appreciation (depreciation) on: | | |
| Investment securities: | | |
| Unaffiliated issuers | 35,118,423 | |
| Assets and liabilities in foreign currencies | 41 | |
| Total change in net unrealized appreciation (depreciation) | | 35,118,464 |
| Net gain (loss) | | 36,007,565 |
| Net increase (decrease) in net assets resulting from operations | | $36,290,051 |
See accompanying notes which are an integral part of the financial statements.
Statement of Changes in Net Assets
| | Six months ended June 30, 2019 (Unaudited) | Year ended December 31, 2018 |
| Increase (Decrease) in Net Assets | | |
| Operations | | |
| Net investment income (loss) | $282,486 | $539,950 |
| Net realized gain (loss) | 889,101 | 7,936,610 |
| Change in net unrealized appreciation (depreciation) | 35,118,464 | (16,134,939) |
| Net increase (decrease) in net assets resulting from operations | 36,290,051 | (7,658,379) |
| Distributions to shareholders | (10,037,051) | (7,904,633) |
| Share transactions - net increase (decrease) | (4,423,270) | 52,445,882 |
| Total increase (decrease) in net assets | 21,829,730 | 36,882,870 |
| Net Assets | | |
| Beginning of period | 186,590,979 | 149,708,109 |
| End of period | $208,420,709 | $186,590,979 |
See accompanying notes which are an integral part of the financial statements.
Financial Highlights
VIP Consumer Discretionary Portfolio Initial Class
| | Six months ended (Unaudited) June 30, | Years endedDecember 31, | | | | |
| | 2019 | 2018 | 2017 | 2016 | 2015 | 2014 |
| Selected Per–Share Data | | | | | | |
| Net asset value, beginning of period | $20.97 | $22.27 | $18.33 | $17.88 | $19.01 | $18.54 |
| Income from Investment Operations | | | | | | |
| Net investment income (loss)A | .04 | .08 | .12 | .15 | .13 | .08 |
| Net realized and unrealized gain (loss) | 4.10 | (.30) | 3.93 | .73 | .73 | 1.59 |
| Total from investment operations | 4.14 | (.22) | 4.05 | .88 | .86 | 1.67 |
| Distributions from net investment income | (.03) | (.07) | (.11) | (.14) | (.09) | (.10) |
| Distributions from net realized gain | (1.12) | (1.01) | – | (.30) | (1.91) | (1.11) |
| Total distributions | (1.15) | (1.08) | (.11) | (.44) | (2.00) | (1.20)B |
| Redemption fees added to paid in capitalA | – | – | –C | .01 | .01 | –C |
| Net asset value, end of period | $23.96 | $20.97 | $22.27 | $18.33 | $17.88 | $19.01 |
| Total ReturnD,E,F | 20.34% | (1.09)% | 22.16% | 5.24% | 4.71% | 9.64% |
| Ratios to Average Net AssetsG,H | | | | | | |
| Expenses before reductions | .68%I | .68% | .71% | .70% | .70% | .72% |
| Expenses net of fee waivers, if any | .68%I | .68% | .71% | .70% | .70% | .72% |
| Expenses net of all reductions | .68%I | .67% | .70% | .70% | .69% | .71% |
| Net investment income (loss) | .35%I | .35% | .58% | .86% | .69% | .45% |
| Supplemental Data | | | | | | |
| Net assets, end of period (000 omitted) | $28,162 | $25,079 | $22,057 | $23,677 | $42,048 | $21,446 |
| Portfolio turnover rateJ | 51%I | 38% | 81% | 43% | 46% | 129% |
A Calculated based on average shares outstanding during the period.
B Total distributions of $1.20 per share is comprised of distributions from net investment income of $.097 and distributions from net realized gain of $1.106 per share.
C Amount represents less than $.005 per share.
D Total returns for periods of less than one year are not annualized.
E Total returns do not reflect charges attributable to your insurance company's separate account. Inclusion of these charges would reduce the total returns shown.
F Total returns would have been lower if certain expenses had not been reduced during the applicable periods shown.
G Fees and expenses of any underlying Fidelity Central Funds are not included in the Fund's expense ratio. The Fund indirectly bears its proportionate share of the expenses of any underlying Fidelity Central Funds.
H Expense ratios reflect operating expenses of the class. Expenses before reductions do not reflect amounts reimbursed by the investment adviser or reductions from brokerage service arrangements or reductions from other expense offset arrangements and do not represent the amount paid by the class during periods when reimbursements or reductions occur. Expenses net of fee waivers reflect expenses after reimbursement by the investment adviser but prior to reductions from brokerage service arrangements or other expense offset arrangements. Expenses net of all reductions represent the net expenses paid by the class.
I Annualized
J Amount does not include the portfolio activity of any underlying Fidelity Central Funds.
See accompanying notes which are an integral part of the financial statements.
VIP Consumer Discretionary Portfolio Investor Class
| | Six months ended (Unaudited) June 30, | Years endedDecember 31, | | | | |
| | 2019 | 2018 | 2017 | 2016 | 2015 | 2014 |
| Selected Per–Share Data | | | | | | |
| Net asset value, beginning of period | $20.91 | $22.21 | $18.28 | $17.84 | $18.97 | $18.50 |
| Income from Investment Operations | | | | | | |
| Net investment income (loss)A | .03 | .06 | .10 | .14 | .11 | .07 |
| Net realized and unrealized gain (loss) | 4.09 | (.29) | 3.93 | .71 | .74 | 1.59 |
| Total from investment operations | 4.12 | (.23) | 4.03 | .85 | .85 | 1.66 |
| Distributions from net investment income | (.02) | (.06) | (.10) | (.13) | (.08) | (.08) |
| Distributions from net realized gain | (1.12) | (1.01) | – | (.30) | (1.91) | (1.11) |
| Total distributions | (1.15)B | (1.07) | (.10) | (.42)C | (1.99) | (1.19) |
| Redemption fees added to paid in capitalA | – | – | –D | .01 | .01 | –D |
| Net asset value, end of period | $23.88 | $20.91 | $22.21 | $18.28 | $17.84 | $18.97 |
| Total ReturnE,F,G | 20.28% | (1.16)% | 22.07% | 5.12% | 4.66% | 9.58% |
| Ratios to Average Net AssetsH,I | | | | | | |
| Expenses before reductions | .76%J | .76% | .79% | .78% | .78% | .80% |
| Expenses net of fee waivers, if any | .76%J | .76% | .79% | .78% | .77% | .79% |
| Expenses net of all reductions | .76%J | .75% | .78% | .78% | .77% | .78% |
| Net investment income (loss) | .27%J | .27% | .50% | .78% | .61% | .38% |
| Supplemental Data | | | | | | |
| Net assets, end of period (000 omitted) | $180,259 | $161,512 | $127,651 | $124,272 | $165,927 | $86,882 |
| Portfolio turnover rateK | 51%J | 38% | 81% | 43% | 46% | 129% |
A Calculated based on average shares outstanding during the period.
B Total distributions of $1.15 per share is comprised of distributions from net investment income of $.022 and distributions from net realized gain of $1.123 per share.
C Total distributions of $.42 per share is comprised of distributions from net investment income of $.125 and distributions from net realized gain of $.298 per share.
D Amount represents less than $.005 per share.
E Total returns for periods of less than one year are not annualized.
F Total returns do not reflect charges attributable to your insurance company's separate account. Inclusion of these charges would reduce the total returns shown.
G Total returns would have been lower if certain expenses had not been reduced during the applicable periods shown.
H Fees and expenses of any underlying Fidelity Central Funds are not included in the Fund's expense ratio. The Fund indirectly bears its proportionate share of the expenses of any underlying Fidelity Central Funds.
I Expense ratios reflect operating expenses of the class. Expenses before reductions do not reflect amounts reimbursed by the investment adviser or reductions from brokerage service arrangements or reductions from other expense offset arrangements and do not represent the amount paid by the class during periods when reimbursements or reductions occur. Expenses net of fee waivers reflect expenses after reimbursement by the investment adviser but prior to reductions from brokerage service arrangements or other expense offset arrangements. Expenses net of all reductions represent the net expenses paid by the class.
J Annualized
K Amount does not include the portfolio activity of any underlying Fidelity Central Funds.
See accompanying notes which are an integral part of the financial statements.
Notes to Financial Statements (Unaudited)
For the period ended June 30, 2019
1. Organization.
VIP Consumer Discretionary Portfolio (the Fund) is a non-diversified fund of Variable Insurance Products Fund IV (the Trust) and is authorized to issue an unlimited number of shares. The Trust is registered under the Investment Company Act of 1940, as amended (the 1940 Act), as an open-end management investment company organized as a Massachusetts business trust. Shares of the Fund may only be purchased by insurance companies for the purpose of funding variable annuity or variable life insurance contracts. The Fund offers the following classes of shares: Initial Class shares and Investor Class shares. All classes have equal rights and voting privileges, except for matters affecting a single class.
2. Investments in Fidelity Central Funds.
The Fund invests in Fidelity Central Funds, which are open-end investment companies generally available only to other investment companies and accounts managed by the investment adviser and its affiliates. The Fund's Schedule of Investments lists each of the Fidelity Central Funds held as of period end, if any, as an investment of the Fund, but does not include the underlying holdings of each Fidelity Central Fund. As an Investing Fund, the Fund indirectly bears its proportionate share of the expenses of the underlying Fidelity Central Funds.
The Money Market Central Funds seek preservation of capital and current income and are managed by Fidelity Investments Money Management, Inc. (FIMM), an affiliate of the investment adviser. Annualized expenses of the Money Market Central Funds as of their most recent shareholder report date ranged from less than .005% to .01%.
A complete unaudited list of holdings for each Fidelity Central Fund is available upon request or at the Securities and Exchange Commission (the SEC) website at www.sec.gov. In addition, the financial statements of the Fidelity Central Funds are available on the SEC website or upon request.
3. Significant Accounting Policies.
The Fund is an investment company and applies the accounting and reporting guidance of the Financial Accounting Standards Board (FASB) Accounting Standards Codification Topic 946 Financial Services – Investments Companies. The financial statements have been prepared in conformity with accounting principles generally accepted in the United States of America (GAAP), which require management to make certain estimates and assumptions at the date of the financial statements. Actual results could differ from those estimates. Subsequent events, if any, through the date that the financial statements were issued have been evaluated in the preparation of the financial statements. The following summarizes the significant accounting policies of the Fund:
Investment Valuation. Investments are valued as of 4:00 p.m. Eastern time on the last calendar day of the period. The Board of Trustees (the Board) has delegated the day to day responsibility for the valuation of the Fund's investments to the Fair Value Committee (the Committee) established by the Fund's investment adviser. In accordance with valuation policies and procedures approved by the Board, the Fund attempts to obtain prices from one or more third party pricing vendors or brokers to value its investments. When current market prices, quotations or currency exchange rates are not readily available or reliable, investments will be fair valued in good faith by the Committee, in accordance with procedures adopted by the Board. Factors used in determining fair value vary by investment type and may include market or investment specific events. The frequency with which these procedures are used cannot be predicted and they may be utilized to a significant extent. The Committee oversees the Fund's valuation policies and procedures and reports to the Board on the Committee's activities and fair value determinations. The Board monitors the appropriateness of the procedures used in valuing the Fund's investments and ratifies the fair value determinations of the Committee.
The Fund categorizes the inputs to valuation techniques used to value its investments into a disclosure hierarchy consisting of three levels as shown below:
- Level 1 – quoted prices in active markets for identical investments
- Level 2 – other significant observable inputs (including quoted prices for similar investments, interest rates, prepayment speeds, etc.)
- Level 3 – unobservable inputs (including the Fund's own assumptions based on the best information available)
Valuation techniques used to value the Fund's investments by major category are as follows:
Equity securities, including restricted securities, for which market quotations are readily available, are valued at the last reported sale price or official closing price as reported by a third party pricing vendor on the primary market or exchange on which they are traded and are categorized as Level 1 in the hierarchy. In the event there were no sales during the day or closing prices are not available, securities are valued at the last quoted bid price or may be valued using the last available price and are generally categorized as Level 2 in the hierarchy. For foreign equity securities, when market or security specific events arise, comparisons to the valuation of American Depositary Receipts (ADRs), futures contracts, Exchange-Traded Funds (ETFs) and certain indexes as well as quoted prices for similar securities may be used and would be categorized as Level 2 in the hierarchy. For equity securities, including restricted securities, where observable inputs are limited, assumptions about market activity and risk are used and these securities may be categorized as Level 3 in the hierarchy.
Investments in open-end mutual funds, including the Fidelity Central Funds, are valued at their closing net asset value (NAV) each business day and are categorized as Level 1 in the hierarchy.
Changes in valuation techniques may result in transfers in or out of an assigned level within the disclosure hierarchy. The aggregate value of investments by input level as of June 30, 2019 is included at the end of the Fund's Schedule of Investments.
Foreign Currency. The Fund may use foreign currency contracts to facilitate transactions in foreign-denominated securities. Gains and losses from these transactions may arise from changes in the value of the foreign currency or if the counterparties do not perform under the contracts' terms.
Foreign-denominated assets, including investment securities, and liabilities are translated into U.S. dollars at the exchange rates at period end. Purchases and sales of investment securities, income and dividends received and expenses denominated in foreign currencies are translated into U.S. dollars at the exchange rate in effect on the transaction date.
The effects of exchange rate fluctuations on investments are included with the net realized and unrealized gain (loss) on investment securities. Other foreign currency transactions resulting in realized and unrealized gain (loss) are disclosed separately.
Investment Transactions and Income. For financial reporting purposes, the Fund's investment holdings and NAV include trades executed through the end of the last business day of the period. The NAV per share for processing shareholder transactions is calculated as of the close of business of the New York Stock Exchange (NYSE), normally 4:00 p.m. Eastern time and includes trades executed through the end of the prior business day. Gains and losses on securities sold are determined on the basis of identified cost. Dividend income is recorded on the ex-dividend date, except for certain dividends from foreign securities where the ex-dividend date may have passed, which are recorded as soon as the Fund is informed of the ex-dividend date. Non-cash dividends included in dividend income, if any, are recorded at the fair market value of the securities received. Income and capital gain distributions from Fidelity Central Funds, if any, are recorded on the ex-dividend date. Certain distributions received by the Fund represent a return of capital or capital gain. The Fund determines the components of these distributions subsequent to the ex-dividend date, based upon receipt of tax filings or other correspondence relating to the underlying investment. These distributions are recorded as a reduction of cost of investments and/or as a realized gain. Investment income is recorded net of foreign taxes withheld where recovery of such taxes is uncertain.
Class Allocations and Expenses. Investment income, realized and unrealized capital gains and losses, common expenses of the Fund, and certain fund-level expense reductions, if any, are allocated daily on a pro-rata basis to each class based on the relative net assets of each class to the total net assets of the Fund. Each class differs with respect to transfer agent fees incurred. Certain expense reductions may also differ by class. For the reporting period, the allocated portion of income and expenses to each class as a percent of its average net assets may vary due to the timing of recording these transactions in relation to fluctuating net assets of the classes. Expenses directly attributable to a fund are charged to that fund. Expenses attributable to more than one fund are allocated among the respective funds on the basis of relative net assets or other appropriate methods. Expense estimates are accrued in the period to which they relate and adjustments are made when actual amounts are known.
Income Tax Information and Distributions to Shareholders. Each year, the Fund intends to qualify as a regulated investment company under Subchapter M of the Internal Revenue Code, including distributing substantially all of its taxable income and realized gains. As a result, no provision for U.S. Federal income taxes is required. The Fund files a U.S. federal tax return, in addition to state and local tax returns as required. The Fund's federal income tax returns are subject to examination by the Internal Revenue Service (IRS) for a period of three fiscal years after they are filed. State and local tax returns may be subject to examination for an additional fiscal year depending on the jurisdiction. Foreign taxes are provided for based on the Fund's understanding of the tax rules and rates that exist in the foreign markets in which it invests.
Distributions are declared and recorded on the ex-dividend date. Income and capital gain distributions are declared separately for each class. Income and capital gain distributions are determined in accordance with income tax regulations, which may differ from GAAP.
Capital accounts within the financial statements are adjusted for permanent book-tax differences. These adjustments have no impact on net assets or the results of operations. Capital accounts are not adjusted for temporary book-tax differences which will reverse in a subsequent period.
Book-tax differences are primarily due to foreign currency transactions, partnerships and losses deferred due to wash sales and excise tax regulations.
As of period end, the cost and unrealized appreciation (depreciation) in securities, and derivatives if applicable, for federal income tax purposes were as follows:
| Gross unrealized appreciation | $66,028,001 |
| Gross unrealized depreciation | (5,394,498) |
| Net unrealized appreciation (depreciation) | $60,633,503 |
| Tax cost | $148,898,063 |
The Fund elected to defer to its next fiscal year approximately $919,061 of capital losses recognized during the period November 1, 2018 to December 31, 2018.
4. Purchases and Sales of Investments.
Purchases and sales of securities, other than short-term securities, aggregated $50,970,385 and $64,408,639, respectively.
5. Fees and Other Transactions with Affiliates.
Management Fee. Fidelity SelectCo, LLC (the investment adviser) and its affiliates provide the Fund with investment management related services for which the Fund pays a monthly management fee. The management fee is the sum of an individual fund fee rate that is based on an annual rate of .30% of the Fund's average net assets and an annualized group fee rate that averaged .24% during the period. The group fee rate is based upon the average net assets of all the mutual funds advised by Fidelity Management & Research Company (FMR) and the investment adviser. The group fee rate decreases as assets under management increase and increases as assets under management decrease. For the reporting period, the total annualized management fee rate was .54% of the Fund's average net assets.
Transfer Agent Fees. Fidelity Investments Institutional Operations Company, Inc. (FIIOC), an affiliate of the investment adviser, is the Fund's transfer, dividend disbursing, and shareholder servicing agent. FIIOC receives an asset-based fee with respect to each class. Each class pays a fee for transfer agent services, typesetting and printing and mailing of shareholder reports, excluding mailing of proxy statements, equal to an annual rate of class-level average net assets. The annual rate for Investor Class is .15% and the annual rate for all other classes is .07%. For the period, transfer agent fees for each class were as follows:
| Initial Class | $8,846 |
| Investor Class | 127,308 |
| | $136,154 |
Accounting and Security Lending Fees. Fidelity Service Company, Inc. (FSC), an affiliate of the investment adviser, maintains the Fund's accounting records. The accounting fee is based on the level of average net assets for each month. Prior to April 1, 2019, FSC had a separate agreement with the Fund for administration of the security lending program, based on the number and duration of lending transactions. For the period, the total fees paid for accounting and administration of securities lending were equivalent to an annualized rate of .04%.
Brokerage Commissions. The Fund placed a portion of its portfolio transactions with brokerage firms which are affiliates of the investment adviser. Brokerage commissions are included in net realized gain (loss) and change in net unrealized appreciation (depreciation) in the Statement of Operations. The commissions paid to these affiliated firms were $748 for the period.
Interfund Trades. The Fund may purchase from or sell securities to other Fidelity Funds under procedures adopted by the Board. The procedures have been designed to ensure these interfund trades are executed in accordance with Rule 17a-7 of the 1940 Act. Interfund trades are included within the respective purchases and sales amounts shown in the Purchases and Sales of Investments note.
6. Committed Line of Credit.
The Fund participates with other funds managed by the investment adviser or an affiliate in a $4.25 billion credit facility (the "line of credit") to be utilized for temporary or emergency purposes to fund shareholder redemptions or for other short-term liquidity purposes. The Fund has agreed to pay commitment fees on its pro-rata portion of the line of credit, which amounted to $292 and is reflected in Miscellaneous expenses on the Statement of Operations. During the period, the Fund did not borrow on this line of credit.
7. Security Lending.
The Fund lends portfolio securities from time to time in order to earn additional income. For equity securities, lending agents are used, including National Financial Services (NFS), an affiliate of the Fund. Pursuant to a securities lending agreement, NFS will receive a fee, which is capped at 9.9% of daily lending revenue, for its services as lending agent. The Fund may lend securities to certain qualified borrowers. On the settlement date of the loan, the Fund receives collateral (in the form of U.S. Treasury obligations, letters of credit and/or cash) against the loaned securities and maintains collateral in an amount not less than 100% of the market value of the loaned securities during the period of the loan. The market value of the loaned securities is determined at the close of business of the Fund and any additional required collateral is delivered to the Fund on the next business day. The Fund or borrower may terminate the loan at any time, and if the borrower defaults on its obligation to return the securities loaned because of insolvency or other reasons, the Fund may apply collateral received from the borrower against the obligation. The Fund may experience delays and costs in recovering the securities loaned. Any cash collateral received is invested in the Fidelity Securities Lending Cash Central Fund. The value of loaned securities and cash collateral at period end are disclosed on the Fund's Statement of Assets and Liabilities. Security lending income represents the income earned on investing cash collateral, less rebates paid to borrowers and any lending agent fees associated with the loan, plus any premium payments received for lending certain types of securities. Security lending income is presented in the Statement of Operations as a component of income from Fidelity Central Funds.
8. Expense Reductions.
Commissions paid to certain brokers with whom the investment adviser, or its affiliates, places trades on behalf of the Fund include an amount in addition to trade execution, which may be rebated back to the Fund to offset certain expenses. This amount totaled $5,280 for the period.
In addition, during the period the investment adviser reimbursed and/or waived a portion of fund-level operating expenses in the amount of $780.
9. Distributions to Shareholders.
Distributions to shareholders of each class were as follows:
| | Six months ended
June 30, 2019 | Year ended
December 31, 2018 |
| Distributions to shareholders | | |
| Initial Class | $1,341,870 | $1,134,568 |
| Investor Class | 8,695,181 | 6,770,065 |
| Total | $10,037,051 | $7,904,633 |
10. Share Transactions.
Transactions for each class of shares were as follows:
| | Shares | Shares | Dollars | Dollars |
| | Six months ended June 30, 2019 | Year ended December 31, 2018 | Six months ended June 30, 2019 | Year ended December 31, 2018 |
| Initial Class | | | | |
| Shares sold | 68,943 | 431,880 | $1,618,961 | $10,153,361 |
| Reinvestment of distributions | 62,210 | 52,520 | 1,341,870 | 1,134,568 |
| Shares redeemed | (151,386) | (279,023) | (3,419,447) | (6,318,800) |
| Net increase (decrease) | (20,233) | 205,377 | $(458,616) | $4,969,129 |
| Investor Class | | | | |
| Shares sold | 480,986 | 3,052,639 | $11,255,555 | $71,763,597 |
| Reinvestment of distributions | 404,239 | 314,264 | 8,695,181 | 6,770,065 |
| Shares redeemed | (1,059,069) | (1,391,020) | (23,915,390) | (31,056,909) |
| Net increase (decrease) | (173,844) | 1,975,883 | $(3,964,654) | $47,476,753 |
11. Other.
The Fund's organizational documents provide former and current trustees and officers with a limited indemnification against liabilities arising in connection with the performance of their duties to the Fund. In the normal course of business, the Fund may also enter into contracts that provide general indemnifications. The Fund's maximum exposure under these arrangements is unknown as this would be dependent on future claims that may be made against the Fund. The risk of material loss from such claims is considered remote.
At the end of the period, the investment adviser or its affiliates were the owners of record of 100% of the total outstanding shares of the Fund.
Shareholder Expense Example
As a shareholder of the Fund, you incur two types of costs: (1) transaction costs and (2) ongoing costs, including management fees and other Fund expenses. This Example is intended to help you understand your ongoing costs (in dollars) of investing in the Fund and to compare these costs with the ongoing costs of investing in other mutual funds.
The Example is based on an investment of $1,000 invested at the beginning of the period and held for the entire period (January 1, 2019 to June 30, 2019).
Actual Expenses
The first line of the accompanying table for each class of the Fund provides information about actual account values and actual expenses. You may use the information in this line, together with the amount you invested, to estimate the expenses that you paid over the period. Simply divide your account value by $1,000.00 (for example, an $8,600 account value divided by $1,000.00 = 8.6), then multiply the result by the number in the first line for a class of the Fund under the heading entitled "Expenses Paid During Period" to estimate the expenses you paid on your account during this period. The estimate of expenses does not include any fees or other expenses of any variable annuity or variable life insurance product. If they were, the estimate of expenses you paid during the period would be higher, and your ending account value would be lower. In addition, the Fund, as a shareholder in the underlying Fidelity Central Funds, will indirectly bear its pro-rata share of the fees and expenses incurred by the underlying Fidelity Central Funds. These fees and expenses are not included in the Fund's annualized expense ratio used to calculate the expense estimate in the table below.
Hypothetical Example for Comparison Purposes
The second line of the accompanying table for each class of the Fund provides information about hypothetical account values and hypothetical expenses based on a Class' actual expense ratio and an assumed rate of return of 5% per year before expenses, which is not the Class' actual return. The hypothetical account values and expenses may not be used to estimate the actual ending account balance or expenses you paid for the period. You may use this information to compare the ongoing costs of investing in the Fund and other funds. To do so, compare this 5% hypothetical example with the 5% hypothetical examples that appear in the shareholder reports of the other funds. The estimate of expenses does not include any fees or other expenses of any variable annuity or variable life insurance product. If they were, the estimate of expenses you paid during the period would be higher, and your ending account value would be lower. In addition, the Fund, as a shareholder in the underlying Fidelity Central Funds, will indirectly bear its pro-rata share of the fees and expenses incurred by the underlying Fidelity Central Funds. These fees and expenses are not included in the Fund's annualized expense ratio used to calculate the expense estimate in the table below.
Please note that the expenses shown in the table are meant to highlight your ongoing costs only and do not reflect any transaction costs. Therefore, the second line of the table is useful in comparing ongoing costs only, and will not help you determine the relative total costs of owning different funds.
| | Annualized Expense Ratio-A | Beginning
Account Value
January 1, 2019 | Ending
Account Value
June 30, 2019 | Expenses Paid
During Period-B
January 1, 2019
to June 30, 2019 |
| Initial Class | .68% | | | |
| Actual | | $1,000.00 | $1,203.40 | $3.71 |
| Hypothetical-C | | $1,000.00 | $1,021.42 | $3.41 |
| Investor Class | .76% | | | |
| Actual | | $1,000.00 | $1,202.80 | $4.15 |
| Hypothetical-C | | $1,000.00 | $1,021.03 | $3.81 |
A Annualized expense ratio reflects expenses net of applicable fee waivers.
B Expenses are equal to each Class' annualized expense ratio, multiplied by the average account value over the period, multiplied by 181/365 (to reflect the one-half year period).
C 5% return per year before expenses
Board Approval of Investment Advisory Contracts and Management Fees
VIP Consumer Discretionary Portfolio
Each year, the Board of Trustees, including the Independent Trustees (together, the Board), votes on the renewal of the management contract with Fidelity SelectCo, LLC (SelectCo), an affiliate of Fidelity Management & Research Company (FMR), and the sub-advisory agreements with affiliates of FMR (together, the Advisory Contracts) for the fund. SelectCo and the sub-advisers are referred to herein as the Investment Advisers. The Board, assisted by the advice of fund counsel and Independent Trustees' counsel, requests and considers a broad range of information relevant to the renewal of the Advisory Contracts throughout the year.
The Board meets regularly and, at each of its meetings, covers an extensive agenda of topics and materials and considers factors that are relevant to its annual consideration of the renewal of the fund's Advisory Contracts, including the services and support provided to the fund and its shareholders. The Board has established various standing committees (Committees), each composed of and chaired by Independent Trustees with varying backgrounds, to which the Board has assigned specific subject matter responsibilities in order to enhance effective decision-making by the Board. The Board, acting directly and through its Committees, requests and receives information concerning the annual consideration of the renewal of the fund's Advisory Contracts. The Board also meets as needed to review matters specifically related to the Board's annual consideration of the renewal of the Advisory Contracts. Members of the Board may also meet with trustees of other Fidelity funds through joint ad hoc committees to discuss certain matters relevant to all of the Fidelity funds.
At its January 2019 meeting, the Board unanimously determined to renew the fund's Advisory Contracts. In reaching its determination, the Board considered all factors it believed relevant, including (i) the nature, extent, and quality of the services to be provided to the fund and its shareholders (including the investment performance of the fund); (ii) the competitiveness of the fund's management fee and total expense ratio relative to peer funds; (iii) the total costs of the services to be provided by and the profits to be realized by Fidelity from its relationships with the fund; and (iv) the extent to which, if any, economies of scale exist and would be realized as the fund grows, and whether any economies of scale are appropriately shared with fund shareholders.
In considering whether to renew the Advisory Contracts for the fund, the Board reached a determination, with the assistance of fund counsel and Independent Trustees' counsel and through the exercise of its business judgment, that the renewal of the Advisory Contracts was in the best interests of the fund and its shareholders and that the compensation payable under the Advisory Contracts was fair and reasonable. The Board's decision to renew the Advisory Contracts was not based on any single factor, but rather was based on a comprehensive consideration of all the information provided to the Board at its meetings throughout the year. The Board, in reaching its determination to renew the Advisory Contracts, was aware that shareholders of the fund have a broad range of investment choices available to them, including a wide choice among funds offered by Fidelity's competitors, and that the fund's shareholders, who have the opportunity to review and weigh the disclosure provided by the fund in its prospectus and other public disclosures, have chosen to invest in this fund, which is part of the Fidelity family of funds.
Nature, Extent, and Quality of Services Provided. The Board considered Fidelity's staffing as it relates to the fund, including the backgrounds of investment personnel of Fidelity, and also considered the fund's investment objective, strategies, and related investment philosophy. The Independent Trustees also had discussions with senior management of Fidelity's investment operations and investment groups. The Board considered the structure of the investment personnel compensation program and whether this structure provides appropriate incentives to act in the best interests of the fund. Additionally, the Board considered the portfolio managers' investments, if any, in the funds that they manage.
Resources Dedicated to Investment Management and Support Services. The Board and the Fund Oversight and Research Committees reviewed the general qualifications and capabilities of Fidelity's investment staff, including its size, education, experience, and resources, as well as Fidelity's approach to recruiting, training, managing, and compensating investment personnel. The Board noted that Fidelity has continued to increase the resources devoted to non-U.S. offices, including expansion of Fidelity's global investment organization. The Board also noted that Fidelity's analysts have extensive resources, tools and capabilities that allow them to conduct sophisticated quantitative and fundamental analysis, as well as credit analysis of issuers, counterparties and guarantors. Further, the Board considered that Fidelity's investment professionals have sufficient access to global information and data so as to provide competitive investment results over time, and that those professionals also have access to sophisticated tools that permit them to assess portfolio construction and risk and performance attribution characteristics continuously, as well as to transmit new information and research conclusions rapidly around the world. Additionally, in its deliberations, the Board considered Fidelity's trading, risk management, compliance, and technology and operations capabilities and resources, which are integral parts of the investment management process.
Shareholder and Administrative Services. The Board considered (i) the nature, extent, quality, and cost of advisory, administrative, and shareholder services performed by the Investment Advisers and their affiliates under the Advisory Contracts and under separate agreements covering transfer agency, pricing and bookkeeping, and securities lending services for the fund; (ii) the nature and extent of the supervision of third party service providers, principally custodians, subcustodians, and pricing vendors; and (iii) the resources devoted to, and the record of compliance with, the fund's compliance policies and procedures. The Board also reviewed the allocation of fund brokerage, including allocations to brokers affiliated with the Investment Advisers, the use of brokerage commissions to pay fund expenses, and the use of "soft" commission dollars to pay for research services.
The Board noted that the growth of fund assets over time across the complex allows Fidelity to reinvest in the development of services designed to enhance the value and convenience of the Fidelity funds as investment vehicles. These services include 24-hour access to account information and market information through telephone representatives and over the Internet, investor education materials and asset allocation tools, and the expanded availability of Fidelity Investor Centers.
The Board noted that it and the boards of certain other Fidelity funds had formed an ad hoc Committee on Transfer Agency Fees to review the variety of transfer agency fee structures throughout the industry and Fidelity's competitive positioning with respect to industry participants.
Investment in a Large Fund Family. The Board considered the benefits to shareholders of investing in a Fidelity fund, including the benefits of investing in a fund that is part of a large family of funds offering a variety of investment disciplines and providing a large variety of mutual fund investor services. The Board noted that Fidelity had taken, or had made recommendations that resulted in the Fidelity funds taking, a number of actions over the previous year that benefited particular funds, including: (i) continuing to dedicate additional resources to Fidelity's investment research process, which includes meetings with management of issuers of securities in which the funds invest, and to the support of the senior management team that oversees asset management; (ii) continuing efforts to enhance Fidelity's global research capabilities; (iii) launching new funds and making other enhancements to meet client needs; (iv) launching new share classes of existing funds; (v) eliminating purchase minimums and broadening eligibility requirements for certain funds and share classes; (vi) reducing management fees and total expenses for certain growth equity funds and index funds; (vii) lowering expense caps for certain existing funds and classes, and converting certain voluntary expense caps to contractual caps, to reduce expenses borne by shareholders; (viii) eliminating short-term redemption fees for funds that had such fees; (ix) rationalizing product lines and gaining increased efficiencies from fund mergers and share class consolidations; (x) continuing to develop, acquire and implement systems and technology to improve services to the funds and shareholders, strengthen information security, and increase efficiency; and (xi) continuing to implement enhancements to further strengthen Fidelity's product line to increase investors' probability of success in achieving their investment goals, including retirement income goals.
Investment Performance. The Board considered whether the fund has operated in accordance with its investment objective, as well as its record of compliance with its investment restrictions and its performance history.
The Board took into account discussions that occur at Board meetings throughout the year with representatives of the Investment Advisers about fund investment performance. In this regard the Board noted that as part of regularly scheduled fund reviews and other reports to the Board on fund performance, the Board considers annualized return information for the fund for different time periods, measured against an appropriate securities market index ("benchmark index"). In its evaluation of fund investment performance, the Board gave particular attention to information indicating changes in performance of certain Fidelity funds for specific time periods and discussed with the Investment Advisers the reasons for any overperformance or underperformance.
In addition to reviewing absolute and relative fund performance, the Independent Trustees periodically consider the appropriateness of fund performance metrics in evaluating the results achieved. In general, the Independent Trustees believe that fund performance should be evaluated based on net performance (after fees and expenses) of both the highest performing and lowest performing fund share classes, where applicable, compared to appropriate benchmark indices, over appropriate time periods that may include full market cycles, taking into account relevant factors including the following: general market conditions; issuer-specific information; and fund cash flows and other factors.
The Independent Trustees recognize that shareholders evaluate performance on a net basis over their own holding periods, for which one-, three-, and five-year periods are often used as a proxy. For this reason, the performance information reviewed by the Board also included net cumulative total return information for the fund and an appropriate benchmark index for the most recent one-, three-, and five-year periods ended June 30, 2018, as shown below.
VIP Consumer Discretionary Portfolio

Based on its review, the Board concluded that the nature, extent, and quality of services provided to the fund under the Advisory Contracts should continue to benefit the shareholders of the fund.
Competitiveness of Management Fee and Total Expense Ratio. The Board considered the fund's management fee and total expense ratio compared to "mapped groups" of competitive funds and classes created for the purpose of facilitating the Trustees' competitive analysis of management fees and total expenses. Fidelity creates "mapped groups" by combining similar Lipper investment objective categories that have comparable investment mandates. For this purpose, all sector focused equity variable annuity funds are grouped in the same mapped group. Combining Lipper investment objective categories aids the Board's management fee and total expense ratio comparisons by broadening the competitive group used for comparison.
Management Fee. The Board considered two proprietary management fee comparisons for the 12-month periods ended June 30 shown in basis points (BP) in the chart below. The group of Lipper funds used by the Board for management fee comparisons is referred to below as the "Total Mapped Group." The Total Mapped Group comparison focuses on a fund's standing in terms of gross management fees before expense reimbursements or caps relative to the total universe of funds with comparable investment mandates (i.e., sector equities), regardless of whether their management fee structures also are comparable. Funds with comparable management fee structures have similar management fee contractual arrangements (
e.g., flat rate charged for advisory services, all-inclusive fee rate,
etc.). "TMG %" represents the percentage of funds in the Total Mapped Group that had management fees that were lower than the fund's. For example, a hypothetical TMG % of 20% would mean that 80% of the funds in the Total Mapped Group had higher, and 20% had lower, management fees than the fund. The fund's actual TMG %s and the number of funds in the Total Mapped Group are in the chart below. The "Asset-Size Peer Group" (ASPG) comparison focuses on a fund's standing relative to a subset of non-Fidelity funds within the Total Mapped Group that are similar in size and management fee structure. For example, if a fund is in the first quartile of the ASPG, the fund's management fee ranks in the least expensive or lowest 25% of funds in the ASPG. The ASPG represents at least 15% of the funds in the Total Mapped Group with comparable asset size and management fee structures, subject to a minimum of 50 funds (or all funds in the Total Mapped Group if fewer than 50). Additional information, such as the ASPG quartile in which the fund's management fee rate ranked, is also included in the chart and was considered by the Board.
VIP Consumer Discretionary Portfolio

The Board noted that the fund's management fee rate ranked below the median of its Total Mapped Group and below the median of its ASPG for the 12-month period ended June 30, 2018.
The Board noted that it and the boards of other Fidelity funds formed an ad hoc Committee on Group Fee, which meets periodically, to conduct an in-depth review of the "group fee" component of the management fee of funds with such management fee structures. The Committee's focus included the mechanics of the group fee, the competitive landscape of group fee structures, Fidelity funds with no group fee component and investment products not included in group fee assets. The Board also considered that, for funds subject to the group fee, FMR agreed to voluntarily waive fees over a specified period of time in amounts designed to account for assets converted from certain funds to certain collective investment trusts.
Based on its review, the Board concluded that the fund's management fee is fair and reasonable in light of the services that the fund receives and the other factors considered.
Total Expense Ratio. In its review of each class's total expense ratio, the Board considered the fund's management fee rate as well as other fund or class expenses, as applicable, such as transfer agent fees, pricing and bookkeeping fees, and custodial, legal, and audit fees. The Board also noted that Fidelity may agree to waive fees and expenses from time to time, and the extent to which, if any, it has done so for the fund. As part of its review, the Board also considered the current and historical total expense ratios of each class of the fund compared to competitive fund median expenses. Each class of the fund is compared to those funds and classes in the Total Mapped Group (used by the Board for management fee comparisons) that have a similar sales load structure.
The Board noted that the total expense ratio of each class ranked below the competitive median for the 12-month period ended June 30, 2018.
Fees Charged to Other Fidelity Clients. The Board also considered Fidelity fee structures and other information with respect to clients of Fidelity, such as other funds advised or subadvised by Fidelity, pension plan clients, and other institutional clients with similar mandates. The Board noted that a joint ad hoc committee created by it and the boards of other Fidelity funds periodically reviews and compares Fidelity's institutional investment advisory business with its business of providing services to the Fidelity funds, and also noted the most recent findings of the committee. The Board noted that the committee's review included a consideration of the differences in services provided, fees charged, and costs incurred, as well as competition in the markets serving the different categories of clients.
Based on its review of total expense ratios and fees charged to other Fidelity clients, the Board concluded that the total expense ratio of each class of the fund was reasonable in light of the services that the fund and its shareholders receive and the other factors considered.
Costs of the Services and Profitability. The Board considered the revenues earned and the expenses incurred by Fidelity in conducting the business of developing, marketing, distributing, managing, administering and servicing the fund and servicing the fund's shareholders. The Board also considered the level of Fidelity's profits in respect of all the Fidelity funds.
On an annual basis, Fidelity presents to the Board information about the profitability of its relationships with the fund. Fidelity calculates profitability information for each fund, as well as aggregate profitability information for groups of Fidelity funds and all Fidelity funds, using a series of detailed revenue and cost allocation methodologies which originate with the books and records of Fidelity on which Fidelity's audited financial statements are based. The Audit Committee of the Board reviews any significant changes from the prior year's methodologies.
PricewaterhouseCoopers LLP (PwC), auditor to Fidelity and certain Fidelity funds, has been engaged annually by the Board as part of the Board's assessment of Fidelity's profitability analysis. PwC's engagement includes the review and assessment of the methodologies used by Fidelity in determining the revenues and expenses attributable to Fidelity's mutual fund business, and completion of agreed-upon procedures in respect of the mathematical accuracy of the fund profitability information and its conformity to established allocation methodologies. After considering PwC's reports issued under the engagement and information provided by Fidelity, the Board concluded that while other allocation methods may also be reasonable, Fidelity's profitability methodologies are reasonable in all material respects.
The Board also reviewed Fidelity's non-fund businesses and potential indirect benefits such businesses may have received as a result of their association with Fidelity's mutual fund business (i.e., fall-out benefits) as well as cases where Fidelity's affiliates may benefit from the fund's business. The Board noted that changes to fall-out benefits year-over-year reflect business developments at Fidelity's various businesses.
The Board considered the costs of the services provided by and the profits realized by Fidelity in connection with the operation of the fund and was satisfied that the profitability was not excessive.
Economies of Scale. The Board considered whether there have been economies of scale in respect of the management of the Fidelity funds, whether the Fidelity funds (including the fund) have appropriately benefited from any such economies of scale, and whether there is potential for realization of any further economies of scale. The Board considered the extent to which the fund will benefit from economies of scale as assets grow through increased services to the fund, through waivers or reimbursements, or through fee or expense ratio reductions. The Board also noted that a committee (the Economies of Scale Committee) created by it and the boards of other Fidelity funds periodically analyzes whether Fidelity attains economies of scale in respect of the management and servicing of the Fidelity funds, whether the Fidelity funds have appropriately benefited from such economies of scale, and whether there is potential for realization of any further economies of scale.
The Board recognized that the fund's management contract incorporates a "group fee" structure, which provides for lower group fee rates as total group assets increase, and for higher group fee rates as total group assets decrease (with "group assets" defined to include fund assets under SelectCo's management plus assets under FMR's management). SelectCo calculates the group fee rates based on a tiered asset "breakpoint" schedule that varies based on asset class. The Board considered that the group fee is designed to deliver the benefits of economies of scale to fund shareholders when total group assets increase, even if assets of any particular fund are unchanged or have declined, because some portion of Fidelity's costs are attributable to services provided to all Fidelity funds, and all funds benefit if those costs can be allocated among more assets. The Board concluded that, given the group fee structure, fund shareholders will benefit from lower management fees as group assets increase at the fund complex level, regardless of whether Fidelity achieves any such economies of scale.
The Board concluded, taking into account the analysis of the Economies of Scale Committee, that economies of scale, if any, are being appropriately shared between fund shareholders and Fidelity.
Additional Information Requested by the Board. In order to develop fully the factual basis for consideration of the Fidelity funds' advisory contracts, the Board requested and received additional information on certain topics, including: (i) fund performance trends, in particular the underperformance of certain funds, and Fidelity's long-term strategies for certain funds; (ii) Fidelity's fund profitability methodology, profitability trends for certain funds, and the impact of certain factors on fund profitability results; (iii) metrics for evaluating index fund and ETF performance and information about ETF trading characteristics; (iv) the methodology with respect to the evaluation of competitive fund data and peer group classifications and fee comparisons; (v) the expense structures for different funds and classes; (vi) information regarding other accounts managed by Fidelity, including collective investment trusts; and (vii) Fidelity's philosophies and strategies for evaluating funds and classes with lower or declining asset levels.
Based on its evaluation of all of the conclusions noted above, and after considering all factors it believed relevant, the Board concluded that the advisory fee arrangements are fair and reasonable, and that the fund's Advisory Contracts should be renewed.
VCONIC-SANN-0819
1.817358.114
Fidelity® Variable Insurance Products: Real Estate Portfolio
Semi-Annual Report June 30, 2019 |
|
Beginning on January 1, 2021, as permitted by regulations adopted by the Securities and Exchange Commission, and if your insurance carrier elects to participate, you may not be receiving paper copies of the Fund’s shareholder reports from the insurance company that offers your variable insurance product unless you specifically request paper copies from your financial professional or the administrator of your variable insurance product. Instead, the reports will be made available on a website, and you will be notified by mail each time a report is posted and provided with a website link to access the report.
If you already elected to receive shareholder reports electronically, you will not be affected by this change and you need not take any action. You may elect to receive shareholder reports and other communications from the Fund electronically, by contacting your financial professional or the administrator of your variable insurance product. If you own a Fidelity-administered variable insurance product, please visit fidelity.com/mailpreferences to make your election or call 1-800-343-3548.
You may elect to receive all future reports in paper free of charge. If you wish to continue receiving paper copies of your shareholder reports, you may contact your financial professional or the administrator of your variable insurance product. If you own a Fidelity-administered variable insurance product, please visit fidelity.com/mailpreferences to make your election or call 1-800-343-3548. Your election to receive reports in paper will apply to all funds available under your variable insurance product.
Contents
To view a fund's proxy voting guidelines and proxy voting record for the 12-month period ended June 30, visit http://www.fidelity.com/proxyvotingresults or visit the Securities and Exchange Commission's (SEC) web site at http://www.sec.gov.
You may also call 1-877-208-0098 to request a free copy of the proxy voting guidelines.
Fidelity® Variable Insurance Products are separate account options which are purchased through a variable insurance contract.
Standard & Poor's, S&P and S&P 500 are registered service marks of The McGraw-Hill Companies, Inc. and have been licensed for use by Fidelity Distributors Corporation.
Other third-party marks appearing herein are the property of their respective owners.
All other marks appearing herein are registered or unregistered trademarks or service marks of FMR LLC or an affiliated company. © 2019 FMR LLC. All rights reserved.
This report and the financial statements contained herein are submitted for the general information of the shareholders of the Fund. This report is not authorized for distribution to prospective investors in the Fund unless preceded or accompanied by an effective prospectus.
A fund files its complete schedule of portfolio holdings with the SEC for the first and third quarters of each fiscal year on Form N-PORT. Forms N-PORT are available on the SEC’s web site at http://www.sec.gov. A fund's Forms N-PORT may be reviewed and copied at the SEC’s Public Reference Room in Washington, DC. Information regarding the operation of the SEC's Public Reference Room may be obtained by calling 1-800-SEC-0330.
For a complete list of a fund's portfolio holdings, view the most recent holdings listing, semiannual report, or annual report on Fidelity's web site at http://www.fidelity.com, http://www.institutional.fidelity.com, or http://www.401k.com, as applicable.
NOT FDIC INSURED •MAY LOSE VALUE •NO BANK GUARANTEE
Neither the Fund nor Fidelity Distributors Corporation is a bank.
Investment Summary (Unaudited)
Top Ten Stocks as of June 30, 2019
| | % of fund's net assets |
| Prologis, Inc. | 9.4 |
| AvalonBay Communities, Inc. | 6.2 |
| Boston Properties, Inc. | 5.0 |
| Ventas, Inc. | 5.0 |
| Simon Property Group, Inc. | 4.9 |
| Essex Property Trust, Inc. | 4.4 |
| Equity Residential (SBI) | 4.3 |
| UDR, Inc. | 4.1 |
| Welltower, Inc. | 3.7 |
| CubeSmart | 3.7 |
| | 50.7 |
Top Five REIT Sectors as of June 30, 2019
| | % of fund's net assets |
| REITs - Apartments | 21.1 |
| REITs - Office Property | 12.9 |
| REITs - Warehouse/Industrial | 11.3 |
| REITs - Health Care | 11.1 |
| REITs - Storage | 8.6 |
Asset Allocation (% of fund's net assets)
| As of June 30, 2019 |
| | Stocks | 97.5% |
| | Short-Term Investments and Net Other Assets (Liabilities) | 2.5% |

Schedule of Investments June 30, 2019 (Unaudited)
Showing Percentage of Net Assets
| Common Stocks - 97.5% | | | |
| | | Shares | Value |
| Equity Real Estate Investment Trusts (REITs) - 95.6% | | | |
| REITs - Apartments - 21.1% | | | |
| AvalonBay Communities, Inc. | | 124,142 | $25,223,172 |
| Equity Residential (SBI) | | 228,970 | 17,383,402 |
| Essex Property Trust, Inc. | | 60,648 | 17,704,971 |
| Invitation Homes, Inc. | | 324,700 | 8,679,231 |
| UDR, Inc. | | 375,800 | 16,869,662 |
| | | | 85,860,438 |
| REITs - Diversified - 8.4% | | | |
| Clipper Realty, Inc. | | 186,100 | 2,080,598 |
| Crown Castle International Corp. | | 31,200 | 4,066,920 |
| Digital Realty Trust, Inc. | | 70,300 | 8,280,637 |
| Duke Realty Corp. | | 325,800 | 10,298,538 |
| Equinix, Inc. | | 19,200 | 9,682,368 |
| | | | 34,409,061 |
| REITs - Health Care - 11.1% | | | |
| Healthcare Realty Trust, Inc. | | 309,100 | 9,681,012 |
| Ventas, Inc. | | 296,210 | 20,245,954 |
| Welltower, Inc. | | 186,228 | 15,183,169 |
| | | | 45,110,135 |
| REITs - Hotels - 4.6% | | | |
| Braemar Hotels & Resorts, Inc. | | 178,900 | 1,771,110 |
| Host Hotels & Resorts, Inc. | | 149,178 | 2,718,023 |
| RLJ Lodging Trust | | 468,700 | 8,314,738 |
| Sunstone Hotel Investors, Inc. | | 437,100 | 5,992,641 |
| | | | 18,796,512 |
| REITs - Management/Investment - 1.4% | | | |
| Weyerhaeuser Co. | | 223,600 | 5,889,624 |
| REITs - Manufactured Homes - 3.6% | | | |
| Equity Lifestyle Properties, Inc. | | 119,910 | 14,549,879 |
| REITs - Office Property - 12.9% | | | |
| Alexandria Real Estate Equities, Inc. | | 78,500 | 11,075,565 |
| Boston Properties, Inc. | | 157,477 | 20,314,533 |
| Douglas Emmett, Inc. | | 236,900 | 9,438,096 |
| Highwoods Properties, Inc. (SBI) | | 243,200 | 10,044,160 |
| Mack-Cali Realty Corp. | | 79,366 | 1,848,434 |
| | | | 52,720,788 |
| REITs - Regional Malls - 6.8% | | | |
| Simon Property Group, Inc. | | 124,799 | 19,937,888 |
| Taubman Centers, Inc. | | 189,200 | 7,725,036 |
| | | | 27,662,924 |
| REITs - Shopping Centers - 5.8% | | | |
| Acadia Realty Trust (SBI) | | 254,000 | 6,951,980 |
| Cedar Realty Trust, Inc. | | 810,991 | 2,149,126 |
| DDR Corp. | | 587,500 | 7,778,500 |
| Urban Edge Properties | | 387,505 | 6,715,462 |
| | | | 23,595,068 |
| REITs - Storage - 8.6% | | | |
| CubeSmart | | 447,500 | 14,964,400 |
| Extra Space Storage, Inc. | | 100,300 | 10,641,830 |
| Public Storage | | 40,155 | 9,563,716 |
| | | | 35,169,946 |
| REITs - Warehouse/Industrial - 11.3% | | | |
| Americold Realty Trust | | 116,500 | 3,776,930 |
| Prologis, Inc. | | 476,554 | 38,171,976 |
| Terreno Realty Corp. | | 83,700 | 4,104,648 |
| | | | 46,053,554 |
|
| TOTAL EQUITY REAL ESTATE INVESTMENT TRUSTS (REITS) | | | 389,817,929 |
|
| Hotels, Restaurants & Leisure - 1.9% | | | |
| Hotels, Resorts & Cruise Lines - 1.9% | | | |
| Hilton Grand Vacations, Inc. (a) | | 63,700 | 2,026,934 |
| Marriott International, Inc. Class A | | 40,400 | 5,667,716 |
| | | | 7,694,650 |
| TOTAL COMMON STOCKS | | | |
| (Cost $300,506,268) | | | 397,512,579 |
|
| Money Market Funds - 2.2% | | | |
| Fidelity Cash Central Fund 2.42% (b) | | | |
| (Cost $8,972,760) | | 8,971,293 | 8,973,087 |
| TOTAL INVESTMENT IN SECURITIES - 99.7% | | | |
| (Cost $309,479,028) | | | 406,485,666 |
| NET OTHER ASSETS (LIABILITIES) - 0.3% | | | 1,266,479 |
| NET ASSETS - 100% | | | $407,752,145 |
Legend
(a) Non-income producing
(b) Affiliated fund that is generally available only to investment companies and other accounts managed by Fidelity Investments. The rate quoted is the annualized seven-day yield of the fund at period end. A complete unaudited listing of the fund's holdings as of its most recent quarter end is available upon request. In addition, each Fidelity Central Fund's financial statements are available on the SEC's website or upon request.
Affiliated Central Funds
Information regarding fiscal year to date income earned by the Fund from investments in Fidelity Central Funds is as follows:
| Fund | Income earned |
| Fidelity Cash Central Fund | $62,732 |
| Fidelity Securities Lending Cash Central Fund | 147 |
| Total | $62,879 |
Amounts in the income column in the above table include any capital gain distributions from underlying funds, which are presented in the corresponding line-item in the Statement of Operations, if applicable. Amount for Fidelity Securities Lending Cash Central Fund represents securities lending income earned from the reinvestment of cash collateral from loaned securities, net of payments to and from borrowers of securities.
Investment Valuation
All investments are categorized as Level 1 under the Fair Value Hierarchy. The inputs or methodology used for valuing securities may not be an indication of the risk associated with investing in those securities. For more information on valuation inputs please refer to the Investment Valuation section in the accompanying Notes to Financial Statements.
See accompanying notes which are an integral part of the financial statements.
Financial Statements
Statement of Assets and Liabilities
| | | June 30, 2019 (Unaudited) |
| Assets | | |
Investment in securities, at value — See accompanying schedule:
Unaffiliated issuers (cost $300,506,268) | $397,512,579 | |
| Fidelity Central Funds (cost $8,972,760) | 8,973,087 | |
| Total Investment in Securities (cost $309,479,028) | | $406,485,666 |
| Receivable for investments sold | | 839,059 |
| Receivable for fund shares sold | | 2,765,691 |
| Dividends receivable | | 1,609,704 |
| Distributions receivable from Fidelity Central Funds | | 14,084 |
| Prepaid expenses | | 2,567 |
| Other receivables | | 1,265 |
| Total assets | | 411,718,036 |
| Liabilities | | |
| Payable for investments purchased | $3,603,750 | |
| Payable for fund shares redeemed | 80,831 | |
| Accrued management fee | 180,641 | |
| Distribution and service plan fees payable | 25,877 | |
| Other affiliated payables | 47,212 | |
| Other payables and accrued expenses | 27,580 | |
| Total liabilities | | 3,965,891 |
| Net Assets | | $407,752,145 |
| Net Assets consist of: | | |
| Paid in capital | | $299,292,208 |
| Total distributable earnings (loss) | | 108,459,937 |
| Net Assets | | $407,752,145 |
| Net Asset Value and Maximum Offering Price | | |
| Initial Class: | | |
| Net Asset Value, offering price and redemption price per share ($87,366,151 ÷ 4,548,826 shares) | | $19.21 |
| Service Class: | | |
| Net Asset Value, offering price and redemption price per share ($11,957,414 ÷ 625,449 shares) | | $19.12 |
| Service Class 2: | | |
| Net Asset Value, offering price and redemption price per share ($124,091,617 ÷ 6,577,157 shares) | | $18.87 |
| Investor Class: | | |
| Net Asset Value, offering price and redemption price per share ($184,336,963 ÷ 9,656,218 shares) | | $19.09 |
See accompanying notes which are an integral part of the financial statements.
Statement of Operations
| | | Six months ended June 30, 2019 (Unaudited) |
| Investment Income | | |
| Dividends | | $6,069,261 |
| Income from Fidelity Central Funds (including $147 from security lending) | | 62,879 |
| Total income | | 6,132,140 |
| Expenses | | |
| Management fee | $1,036,098 | |
| Transfer agent fees | 194,713 | |
| Distribution and service plan fees | 150,508 | |
| Accounting and security lending fees | 74,978 | |
| Custodian fees and expenses | 5,594 | |
| Independent trustees' fees and expenses | 909 | |
| Audit | 24,906 | |
| Legal | 283 | |
| Miscellaneous | 1,408 | |
| Total expenses before reductions | 1,489,397 | |
| Expense reductions | (10,869) | |
| Total expenses after reductions | | 1,478,528 |
| Net investment income (loss) | | 4,653,612 |
| Realized and Unrealized Gain (Loss) | | |
| Net realized gain (loss) on: | | |
| Investment securities: | | |
| Unaffiliated issuers | 8,417,121 | |
| Total net realized gain (loss) | | 8,417,121 |
| Change in net unrealized appreciation (depreciation) on: | | |
| Investment securities: | | |
| Unaffiliated issuers | 45,188,911 | |
| Fidelity Central Funds | (1) | |
| Total change in net unrealized appreciation (depreciation) | | 45,188,910 |
| Net gain (loss) | | 53,606,031 |
| Net increase (decrease) in net assets resulting from operations | | $58,259,643 |
See accompanying notes which are an integral part of the financial statements.
Statement of Changes in Net Assets
| | Six months ended June 30, 2019 (Unaudited) | Year ended December 31, 2018 |
| Increase (Decrease) in Net Assets | | |
| Operations | | |
| Net investment income (loss) | $4,653,612 | $8,162,318 |
| Net realized gain (loss) | 8,417,121 | 6,629,182 |
| Change in net unrealized appreciation (depreciation) | 45,188,910 | (38,796,353) |
| Net increase (decrease) in net assets resulting from operations | 58,259,643 | (24,004,853) |
| Distributions to shareholders | (7,170,411) | (31,385,907) |
| Share transactions - net increase (decrease) | 17,102,494 | (27,132,122) |
| Total increase (decrease) in net assets | 68,191,726 | (82,522,882) |
| Net Assets | | |
| Beginning of period | 339,560,419 | 422,083,301 |
| End of period | $407,752,145 | $339,560,419 |
See accompanying notes which are an integral part of the financial statements.
Financial Highlights
VIP Real Estate Portfolio Initial Class
| | Six months ended (Unaudited) June 30, | Years endedDecember 31, | | | | |
| | 2019 | 2018 | 2017 | 2016 | 2015 | 2014 |
| Selected Per–Share Data | | | | | | |
| Net asset value, beginning of period | $16.68 | $19.44 | $20.21 | $19.61 | $19.73 | $16.35 |
| Income from Investment Operations | | | | | | |
| Net investment income (loss)A | .24 | .40 | .36 | .36B | .38 | .35 |
| Net realized and unrealized gain (loss) | 2.65 | (1.64) | .42 | .74 | .33 | 4.53 |
| Total from investment operations | 2.89 | (1.24) | .78 | 1.10 | .71 | 4.88 |
| Distributions from net investment income | (.01) | (.51) | (.36) | (.30) | (.39) | (.31)C |
| Distributions from net realized gain | (.35) | (1.00) | (1.19) | (.20) | (.44) | (1.19)C |
| Total distributions | (.36) | (1.52)D | (1.55) | (.50) | (.83) | (1.50) |
| Net asset value, end of period | $19.21 | $16.68 | $19.44 | $20.21 | $19.61 | $19.73 |
| Total ReturnE,F,G | 17.39% | (6.22)% | 4.07% | 5.75% | 3.71% | 30.18% |
| Ratios to Average Net AssetsH,I | | | | | | |
| Expenses before reductions | .66%J | .67% | .68% | .67% | .67% | .68% |
| Expenses net of fee waivers, if any | .66%J | .67% | .68% | .67% | .67% | .68% |
| Expenses net of all reductions | .65%J | .67% | .67% | .66% | .67% | .67% |
| Net investment income (loss) | 2.53%J | 2.23% | 1.84% | 1.79%B | 1.92% | 1.84% |
| Supplemental Data | | | | | | |
| Net assets, end of period (000 omitted) | $87,366 | $74,259 | $107,038 | $102,666 | $99,804 | $91,749 |
| Portfolio turnover rateK | 50%J | 50% | 52% | 65% | 72% | 65% |
A Calculated based on average shares outstanding during the period.
B Net investment income per share reflects a large, non-recurring dividend which amounted to $.06 per share. Excluding this non-recurring dividend, the ratio of net investment income (loss) to average net assets would have been 1.47%.
C The amounts shown reflect certain reclassifications related to book to tax differences that were made in the year shown.
D Total distributions of $1.52 per share is comprised of distributions from net investment income of $.514 and distributions from net realized gain of $1.004 per share.
E Total returns for periods of less than one year are not annualized.
F Total returns do not reflect charges attributable to your insurance company's separate account. Inclusion of these charges would reduce the total returns shown.
G Total returns would have been lower if certain expenses had not been reduced during the applicable periods shown.
H Fees and expenses of any underlying Fidelity Central Funds are not included in the Fund's expense ratio. The Fund indirectly bears its proportionate share of the expenses of any underlying Fidelity Central Funds.
I Expense ratios reflect operating expenses of the class. Expenses before reductions do not reflect amounts reimbursed by the investment adviser or reductions from brokerage service arrangements or reductions from other expense offset arrangements and do not represent the amount paid by the class during periods when reimbursements or reductions occur. Expenses net of fee waivers reflect expenses after reimbursement by the investment adviser but prior to reductions from brokerage service arrangements or other expense offset arrangements. Expenses net of all reductions represent the net expenses paid by the class.
J Annualized
K Amount does not include the portfolio activity of any underlying Fidelity Central Funds.
See accompanying notes which are an integral part of the financial statements.
VIP Real Estate Portfolio Service Class
| | Six months ended (Unaudited) June 30, | Years endedDecember 31, | | | | |
| | 2019 | 2018 | 2017 | 2016 | 2015 | 2014 |
| Selected Per–Share Data | | | | | | |
| Net asset value, beginning of period | $16.61 | $19.37 | $20.14 | $19.56 | $19.68 | $16.32 |
| Income from Investment Operations | | | | | | |
| Net investment income (loss)A | .23 | .38 | .34 | .34B | .36 | .33 |
| Net realized and unrealized gain (loss) | 2.63 | (1.63) | .42 | .74 | .33 | 4.51 |
| Total from investment operations | 2.86 | (1.25) | .76 | 1.08 | .69 | 4.84 |
| Distributions from net investment income | (.01) | (.50) | (.34) | (.29) | (.37) | (.29)C |
| Distributions from net realized gain | (.35) | (1.00) | (1.19) | (.20) | (.44) | (1.19)C |
| Total distributions | (.35)D | (1.51)E | (1.53) | (.50)F | (.81) | (1.48) |
| Net asset value, end of period | $19.12 | $16.61 | $19.37 | $20.14 | $19.56 | $19.68 |
| Total ReturnG,H,I | 17.33% | (6.31)% | 3.98% | 5.63% | 3.61% | 29.98% |
| Ratios to Average Net AssetsJ,K | | | | | | |
| Expenses before reductions | .76%L | .77% | .78% | .77% | .77% | .78% |
| Expenses net of fee waivers, if any | .76%L | .77% | .78% | .77% | .77% | .78% |
| Expenses net of all reductions | .75%L | .77% | .77% | .76% | .76% | .77% |
| Net investment income (loss) | 2.43%L | 2.13% | 1.74% | 1.69%B | 1.82% | 1.75% |
| Supplemental Data | | | | | | |
| Net assets, end of period (000 omitted) | $11,957 | $9,737 | $7,877 | $8,781 | $4,060 | $4,056 |
| Portfolio turnover rateM | 50%L | 50% | 52% | 65% | 72% | 65% |
A Calculated based on average shares outstanding during the period.
B Net investment income per share reflects a large, non-recurring dividend which amounted to $.06 per share. Excluding this non-recurring dividend, the ratio of net investment income (loss) to average net assets would have been 1.38%.
C The amounts shown reflect certain reclassifications related to book to tax differences that were made in the year shown.
D Total distributions of $.35 per share is comprised of distributions from net investment income of $.009 and distributions from net realized gain of $.345 per share.
E Total distributions of $1.51 per share is comprised of distributions from net investment income of $.503 and distributions from net realized gain of $1.004 per share.
F Total distributions of $.50 per share is comprised of distributions from net investment income of $.292 and distributions from net realized gain of $.204 per share.
G Total returns for periods of less than one year are not annualized.
H Total returns do not reflect charges attributable to your insurance company's separate account. Inclusion of these charges would reduce the total returns shown.
I Total returns would have been lower if certain expenses had not been reduced during the applicable periods shown.
J Fees and expenses of any underlying Fidelity Central Funds are not included in the Fund's expense ratio. The Fund indirectly bears its proportionate share of the expenses of any underlying Fidelity Central Funds.
K Expense ratios reflect operating expenses of the class. Expenses before reductions do not reflect amounts reimbursed by the investment adviser or reductions from brokerage service arrangements or reductions from other expense offset arrangements and do not represent the amount paid by the class during periods when reimbursements or reductions occur. Expenses net of fee waivers reflect expenses after reimbursement by the investment adviser but prior to reductions from brokerage service arrangements or other expense offset arrangements. Expenses net of all reductions represent the net expenses paid by the class.
L Annualized
M Amount does not include the portfolio activity of any underlying Fidelity Central Funds.
See accompanying notes which are an integral part of the financial statements.
VIP Real Estate Portfolio Service Class 2
| | Six months ended (Unaudited) June 30, | Years endedDecember 31, | | | | |
| | 2019 | 2018 | 2017 | 2016 | 2015 | 2014 |
| Selected Per–Share Data | | | | | | |
| Net asset value, beginning of period | $16.40 | $19.14 | $19.92 | $19.35 | $19.47 | $16.16 |
| Income from Investment Operations | | | | | | |
| Net investment income (loss)A | .21 | .35 | .31 | .31B | .33 | .30 |
| Net realized and unrealized gain (loss) | 2.61 | (1.62) | .41 | .72 | .33 | 4.46 |
| Total from investment operations | 2.82 | (1.27) | .72 | 1.03 | .66 | 4.76 |
| Distributions from net investment income | –C | (.47) | (.31) | (.26) | (.34) | (.26)D |
| Distributions from net realized gain | (.35) | (1.00) | (1.19) | (.20) | (.44) | (1.19)D |
| Total distributions | (.35) | (1.47) | (1.50) | (.46) | (.78) | (1.45) |
| Net asset value, end of period | $18.87 | $16.40 | $19.14 | $19.92 | $19.35 | $19.47 |
| Total ReturnE,F,G | 17.27% | (6.45)% | 3.77% | 5.46% | 3.49% | 29.80% |
| Ratios to Average Net AssetsH,I | | | | | | |
| Expenses before reductions | .91%J | .92% | .93% | .92% | .92% | .93% |
| Expenses net of fee waivers, if any | .91%J | .92% | .93% | .92% | .92% | .93% |
| Expenses net of all reductions | .90%J | .92% | .92% | .91% | .91% | .92% |
| Net investment income (loss) | 2.28%J | 1.98% | 1.59% | 1.54%B | 1.67% | 1.60% |
| Supplemental Data | | | | | | |
| Net assets, end of period (000 omitted) | $124,092 | $104,238 | $119,798 | $213,984 | $194,640 | $200,481 |
| Portfolio turnover rateK | 50%J | 50% | 52% | 65% | 72% | 65% |
A Calculated based on average shares outstanding during the period.
B Net investment income per share reflects a large, non-recurring dividend which amounted to $.06 per share. Excluding this non-recurring dividend, the ratio of net investment income (loss) to average net assets would have been 1.23%.
C Amount represents less than $.005 per share.
D The amounts shown reflect certain reclassifications related to book to tax differences that were made in the year shown.
E Total returns for periods of less than one year are not annualized.
F Total returns do not reflect charges attributable to your insurance company's separate account. Inclusion of these charges would reduce the total returns shown.
G Total returns would have been lower if certain expenses had not been reduced during the applicable periods shown.
H Fees and expenses of any underlying Fidelity Central Funds are not included in the Fund's expense ratio. The Fund indirectly bears its proportionate share of the expenses of any underlying Fidelity Central Funds.
I Expense ratios reflect operating expenses of the class. Expenses before reductions do not reflect amounts reimbursed by the investment adviser or reductions from brokerage service arrangements or reductions from other expense offset arrangements and do not represent the amount paid by the class during periods when reimbursements or reductions occur. Expenses net of fee waivers reflect expenses after reimbursement by the investment adviser but prior to reductions from brokerage service arrangements or other expense offset arrangements. Expenses net of all reductions represent the net expenses paid by the class.
J Annualized
K Amount does not include the portfolio activity of any underlying Fidelity Central Funds.
See accompanying notes which are an integral part of the financial statements.
VIP Real Estate Portfolio Investor Class
| | Six months ended (Unaudited) June 30, | Years endedDecember 31, | | | | |
| | 2019 | 2018 | 2017 | 2016 | 2015 | 2014 |
| Selected Per–Share Data | | | | | | |
| Net asset value, beginning of period | $16.58 | $19.34 | $20.11 | $19.52 | $19.64 | $16.29 |
| Income from Investment Operations | | | | | | |
| Net investment income (loss)A | .23 | .38 | .34 | .35B | .36 | .33 |
| Net realized and unrealized gain (loss) | 2.63 | (1.64) | .42 | .73 | .33 | 4.50 |
| Total from investment operations | 2.86 | (1.26) | .76 | 1.08 | .69 | 4.83 |
| Distributions from net investment income | (.01) | (.50) | (.35) | (.28) | (.37) | (.30)C |
| Distributions from net realized gain | (.35) | (1.00) | (1.19) | (.20) | (.44) | (1.19)C |
| Total distributions | (.35)D | (1.50) | (1.53)E | (.49)F | (.81) | (1.48)G |
| Net asset value, end of period | $19.09 | $16.58 | $19.34 | $20.11 | $19.52 | $19.64 |
| Total ReturnH,I,J | 17.36% | (6.33)% | 3.99% | 5.65% | 3.64% | 30.02% |
| Ratios to Average Net AssetsK,L | | | | | | |
| Expenses before reductions | .74%M | .75% | .76% | .75% | .75% | .76% |
| Expenses net of fee waivers, if any | .74%M | .75% | .76% | .75% | .75% | .76% |
| Expenses net of all reductions | .73%M | .75% | .75% | .74% | .74% | .75% |
| Net investment income (loss) | 2.45%M | 2.15% | 1.76% | 1.71%B | 1.84% | 1.76% |
| Supplemental Data | | | | | | |
| Net assets, end of period (000 omitted) | $184,337 | $151,327 | $187,371 | $230,521 | $222,596 | $219,550 |
| Portfolio turnover rateN | 50%M | 50% | 52% | 65% | 72% | 65% |
A Calculated based on average shares outstanding during the period.
B Net investment income per share reflects a large, non-recurring dividend which amounted to $.06 per share. Excluding this non-recurring dividend, the ratio of net investment income (loss) to average net assets would have been 1.39%.
C The amounts shown reflect certain reclassifications related to book to tax differences that were made in the year shown.
D Total distributions of $.35 per share is comprised of distributions from net investment income of $.009 and distributions from net realized gain of $.345 per share.
E Total distributions of $1.53 per share is comprised of distributions from net investment income of $.345 and distributions from net realized gain of $1.189 per share.
F Total distributions of $.49 per share is comprised of distributions from net investment income of $.282 and distributions from net realized gain of $.204 per share.
G Total distributions of $1.48 per share is comprised of distributions from net investment income of $.296 and distributions from net realized gain of $1.188 per share.
H Total returns for periods of less than one year are not annualized.
I Total returns do not reflect charges attributable to your insurance company's separate account. Inclusion of these charges would reduce the total returns shown.
J Total returns would have been lower if certain expenses had not been reduced during the applicable periods shown.
K Fees and expenses of any underlying Fidelity Central Funds are not included in the Fund's expense ratio. The Fund indirectly bears its proportionate share of the expenses of any underlying Fidelity Central Funds.
L Expense ratios reflect operating expenses of the class. Expenses before reductions do not reflect amounts reimbursed by the investment adviser or reductions from brokerage service arrangements or reductions from other expense offset arrangements and do not represent the amount paid by the class during periods when reimbursements or reductions occur. Expenses net of fee waivers reflect expenses after reimbursement by the investment adviser but prior to reductions from brokerage service arrangements or other expense offset arrangements. Expenses net of all reductions represent the net expenses paid by the class.
M Annualized
N Amount does not include the portfolio activity of any underlying Fidelity Central Funds.
See accompanying notes which are an integral part of the financial statements.
Notes to Financial Statements (Unaudited)
For the period ended June 30, 2019
1. Organization.
VIP Real Estate Portfolio (the Fund) is a non-diversified fund of Variable Insurance Products Fund IV (the Trust) and is authorized to issue an unlimited number of shares. The Trust is registered under the Investment Company Act of 1940, as amended (the 1940 Act), as an open-end management investment company organized as a Massachusetts business trust. Shares of the Fund may only be purchased by insurance companies for the purpose of funding variable annuity or variable life insurance contracts. The Fund offers the following classes of shares: Initial Class shares, Service Class shares, Service Class 2 shares and Investor Class shares. All classes have equal rights and voting privileges, except for matters affecting a single class.
2. Investments in Fidelity Central Funds.
The Fund invests in Fidelity Central Funds, which are open-end investment companies generally available only to other investment companies and accounts managed by the investment adviser and its affiliates. The Fund's Schedule of Investments lists each of the Fidelity Central Funds held as of period end, if any, as an investment of the Fund, but does not include the underlying holdings of each Fidelity Central Fund. As an Investing Fund, the Fund indirectly bears its proportionate share of the expenses of the underlying Fidelity Central Funds.
The Money Market Central Funds seek preservation of capital and current income and are managed by Fidelity Investments Money Management, Inc. (FIMM), an affiliate of the investment adviser. Annualized expenses of the Money Market Central Funds as of their most recent shareholder report date ranged from less than .005% to .01%.
A complete unaudited list of holdings for each Fidelity Central Fund is available upon request or at the Securities and Exchange Commission (the SEC) website at www.sec.gov. In addition, the financial statements of the Fidelity Central Funds are available on the SEC website or upon request.
3. Significant Accounting Policies.
The Fund is an investment company and applies the accounting and reporting guidance of the Financial Accounting Standards Board (FASB) Accounting Standards Codification Topic 946 Financial Services – Investments Companies. The financial statements have been prepared in conformity with accounting principles generally accepted in the United States of America (GAAP), which require management to make certain estimates and assumptions at the date of the financial statements. Actual results could differ from those estimates. Subsequent events, if any, through the date that the financial statements were issued have been evaluated in the preparation of the financial statements. The following summarizes the significant accounting policies of the Fund:
Investment Valuation. Investments are valued as of 4:00 p.m. Eastern time on the last calendar day of the period. The Board of Trustees (the Board) has delegated the day to day responsibility for the valuation of the Fund's investments to the Fair Value Committee (the Committee) established by the Fund's investment adviser. In accordance with valuation policies and procedures approved by the Board, the Fund attempts to obtain prices from one or more third party pricing vendors or brokers to value its investments. When current market prices, quotations or currency exchange rates are not readily available or reliable, investments will be fair valued in good faith by the Committee, in accordance with procedures adopted by the Board. Factors used in determining fair value vary by investment type and may include market or investment specific events. The frequency with which these procedures are used cannot be predicted and they may be utilized to a significant extent. The Committee oversees the Fund's valuation policies and procedures and reports to the Board on the Committee's activities and fair value determinations. The Board monitors the appropriateness of the procedures used in valuing the Fund's investments and ratifies the fair value determinations of the Committee.
The Fund categorizes the inputs to valuation techniques used to value its investments into a disclosure hierarchy consisting of three levels as shown below:
- Level 1 – quoted prices in active markets for identical investments
- Level 2 – other significant observable inputs (including quoted prices for similar investments, interest rates, prepayment speeds, etc.)
- Level 3 – unobservable inputs (including the Fund's own assumptions based on the best information available)
Valuation techniques used to value the Fund's investments by major category are as follows:
Equity securities, including restricted securities, for which market quotations are readily available, are valued at the last reported sale price or official closing price as reported by a third party pricing vendor on the primary market or exchange on which they are traded and are categorized as Level 1 in the hierarchy. In the event there were no sales during the day or closing prices are not available, securities are valued at the last quoted bid price or may be valued using the last available price and are generally categorized as Level 2 in the hierarchy. For foreign equity securities, when market or security specific events arise, comparisons to the valuation of American Depositary Receipts (ADRs), futures contracts, Exchange-Traded Funds (ETFs) and certain indexes as well as quoted prices for similar securities may be used and would be categorized as Level 2 in the hierarchy. For equity securities, including restricted securities, where observable inputs are limited, assumptions about market activity and risk are used and these securities may be categorized as Level 3 in the hierarchy.
Investments in open-end mutual funds, including the Fidelity Central Funds, are valued at their closing net asset value (NAV) each business day and are categorized as Level 1 in the hierarchy.
Changes in valuation techniques may result in transfers in or out of an assigned level within the disclosure hierarchy.
Investment Transactions and Income. For financial reporting purposes, the Fund's investment holdings and NAV include trades executed through the end of the last business day of the period. The NAV per share for processing shareholder transactions is calculated as of the close of business of the New York Stock Exchange (NYSE), normally 4:00 p.m. Eastern time and includes trades executed through the end of the prior business day. Gains and losses on securities sold are determined on the basis of identified cost and include proceeds received from litigation. Dividend income is recorded on the ex-dividend date, except for certain dividends from foreign securities where the ex-dividend date may have passed, which are recorded as soon as the Fund is informed of the ex-dividend date. Non-cash dividends included in dividend income, if any, are recorded at the fair market value of the securities received. Income and capital gain distributions from Fidelity Central Funds, if any, are recorded on the ex-dividend date. Certain distributions received by the Fund represent a return of capital or capital gain. The Fund determines the components of these distributions subsequent to the ex-dividend date, based upon receipt of tax filings or other correspondence relating to the underlying investment. These distributions are recorded as a reduction of cost of investments and/or as a realized gain.
Class Allocations and Expenses. Investment income, realized and unrealized capital gains and losses, common expenses of the Fund, and certain fund-level expense reductions, if any, are allocated daily on a pro-rata basis to each class based on the relative net assets of each class to the total net assets of the Fund. Each class differs with respect to transfer agent and distribution and service plan fees incurred. Certain expense reductions may also differ by class. For the reporting period, the allocated portion of income and expenses to each class as a percent of its average net assets may vary due to the timing of recording these transactions in relation to fluctuating net assets of the classes. Expenses directly attributable to a fund are charged to that fund. Expenses attributable to more than one fund are allocated among the respective funds on the basis of relative net assets or other appropriate methods. Expense estimates are accrued in the period to which they relate and adjustments are made when actual amounts are known.
Income Tax Information and Distributions to Shareholders. Each year, the Fund intends to qualify as a regulated investment company under Subchapter M of the Internal Revenue Code, including distributing substantially all of its taxable income and realized gains. As a result, no provision for U.S. Federal income taxes is required. The Fund files a U.S. federal tax return, in addition to state and local tax returns as required. The Fund's federal income tax returns are subject to examination by the Internal Revenue Service (IRS) for a period of three fiscal years after they are filed. State and local tax returns may be subject to examination for an additional fiscal year depending on the jurisdiction.
Distributions are declared and recorded on the ex-dividend date. Income and capital gain distributions are declared separately for each class. Income and capital gain distributions are determined in accordance with income tax regulations, which may differ from GAAP.
Capital accounts within the financial statements are adjusted for permanent book-tax differences. These adjustments have no impact on net assets or the results of operations. Capital accounts are not adjusted for temporary book-tax differences which will reverse in a subsequent period.
Book-tax differences are primarily due to short-term capital gains, foreign currency transactions, and losses deferred due to wash sales.
As of period end, the cost and unrealized appreciation (depreciation) in securities, and derivatives if applicable, for federal income tax purposes were as follows:
| Gross unrealized appreciation | $108,663,476 |
| Gross unrealized depreciation | (13,249,243) |
| Net unrealized appreciation (depreciation) | $95,414,233 |
| Tax cost | $311,071,433 |
4. Purchases and Sales of Investments.
Purchases and sales of securities, other than short-term securities, aggregated $101,914,297 and $93,618,436, respectively.
5. Fees and Other Transactions with Affiliates.
Management Fee. Fidelity SelectCo, LLC (the investment adviser) and its affiliates provide the Fund with investment management related services for which the Fund pays a monthly management fee. The management fee is the sum of an individual fund fee rate that is based on an annual rate of .30% of the Fund's average net assets and an annualized group fee rate that averaged .24% during the period. The group fee rate is based upon the average net assets of all the mutual funds advised by Fidelity Management & Research Company (FMR) and the investment adviser. The group fee rate decreases as assets under management increase and increases as assets under management decrease. For the reporting period, the total annualized management fee rate was .54% of the Fund's average net assets.
Distribution and Service Plan Fees. In accordance with Rule 12b-1 of the 1940 Act, the Fund has adopted separate 12b-1 Plans for each Service Class of shares. Each Service Class pays Fidelity Distributors Corporation (FDC), an affiliate of the investment adviser, a service fee. For the period, the service fee is based on an annual rate of .10% of Service Class' average net assets and .25% of Service Class 2's average net assets.
For the period, total fees, all of which were re-allowed to insurance companies for the distribution of shares and providing shareholder support services, were as follows:
| Service Class | $5,615 |
| Service Class 2 | 144,893 |
| | $150,508 |
Transfer Agent Fees. Fidelity Investments Institutional Operations Company, Inc. (FIIOC), an affiliate of the investment adviser, is the Fund's transfer, dividend disbursing, and shareholder servicing agent. FIIOC receives an asset-based fee with respect to each class. Each class pays a fee for transfer agent services, typesetting and printing and mailing of shareholder reports, excluding mailing of proxy statements, equal to an annual rate of class-level average net assets. The annual rate for Investor Class is .15% and the annual rate for all other classes is .07%. For the period, transfer agent fees for each class were as follows:
| Initial Class | $27,342 |
| Service Class | 3,650 |
| Service Class 2 | 37,672 |
| Investor Class | 126,049 |
| | $194,713 |
Accounting and Security Lending Fees. Fidelity Service Company, Inc. (FSC), an affiliate of the investment adviser, maintains the Fund's accounting records. The accounting fee is based on the level of average net assets for each month. Prior to April 1, 2019, FSC had a separate agreement with the Fund for administration of the security lending program, based on the number and duration of lending transactions. For the period, the total fees paid for accounting and administration of securities lending were equivalent to an annualized rate of .04%.
Brokerage Commissions. The Fund placed a portion of its portfolio transactions with brokerage firms which are affiliates of the investment adviser. Brokerage commissions are included in net realized gain (loss) and change in net unrealized appreciation (depreciation) in the Statement of Operations. The commissions paid to these affiliated firms were $752 for the period.
Interfund Trades. The Fund may purchase from or sell securities to other Fidelity Funds under procedures adopted by the Board. The procedures have been designed to ensure these interfund trades are executed in accordance with Rule 17a-7 of the 1940 Act. Interfund trades are included within the respective purchases and sales amounts shown in the Purchases and Sales of Investments note.
6. Committed Line of Credit.
The Fund participates with other funds managed by the investment adviser or an affiliate in a $4.25 billion credit facility (the "line of credit") to be utilized for temporary or emergency purposes to fund shareholder redemptions or for other short-term liquidity purposes. The Fund has agreed to pay commitment fees on its pro-rata portion of the line of credit, which amounted to $533 and is reflected in Miscellaneous expenses on the Statement of Operations. During the period, the Fund did not borrow on this line of credit.
7. Security Lending.
The Fund lends portfolio securities from time to time in order to earn additional income. For equity securities, lending agents are used, including National Financial Services (NFS), an affiliate of the Fund. Pursuant to a securities lending agreement, NFS will receive a fee, which is capped at 9.9% of daily lending revenue, for its services as lending agent. The Fund may lend securities to certain qualified borrowers. On the settlement date of the loan, the Fund receives collateral (in the form of U.S. Treasury obligations, letters of credit and/or cash) against the loaned securities and maintains collateral in an amount not less than 100% of the market value of the loaned securities during the period of the loan. The market value of the loaned securities is determined at the close of business of the Fund and any additional required collateral is delivered to the Fund on the next business day. The Fund or borrower may terminate the loan at any time, and if the borrower defaults on its obligation to return the securities loaned because of insolvency or other reasons, the Fund may apply collateral received from the borrower against the obligation. The Fund may experience delays and costs in recovering the securities loaned. Any cash collateral received is invested in the Fidelity Securities Lending Cash Central Fund. At period end, there were no security loans outstanding. Security lending income represents the income earned on investing cash collateral, less rebates paid to borrowers and any lending agent fees associated with the loan, plus any premium payments received for lending certain types of securities. Security lending income is presented in the Statement of Operations as a component of income from Fidelity Central Funds.
8. Expense Reductions.
Commissions paid to certain brokers with whom the investment adviser, or its affiliates, places trades on behalf of the Fund include an amount in addition to trade execution, which may be rebated back to the Fund to offset certain expenses. This amount totaled $9,118 for the period. In addition, through arrangements with the Fund's custodian, credits realized as a result of certain uninvested cash balances were used to reduce the Fund's expenses. During the period, these credits reduced the Fund's custody expenses by $315.
In addition, during the period the investment adviser reimbursed and/or waived a portion of fund-level operating expenses in the amount of $1,436.
9. Distributions to Shareholders.
Distributions to shareholders of each class were as follows:
| | Six months ended
June 30, 2019 | Year ended
December 31, 2018 |
| Distributions to shareholders | | |
| Initial Class | $1,584,749 | $7,673,740 |
| Service Class | 203,316 | 713,768 |
| Service Class 2 | 2,176,928 | 9,221,236 |
| Investor Class | 3,205,418 | 13,777,163 |
| Total | $7,170,411 | $31,385,907 |
10. Share Transactions.
Transactions for each class of shares were as follows:
| | Shares | Shares | Dollars | Dollars |
| | Six months ended June 30, 2019 | Year ended December 31, 2018 | Six months ended June 30, 2019 | Year ended December 31, 2018 |
| Initial Class | | | | |
| Shares sold | 293,619 | 495,417 | $5,498,442 | $8,594,131 |
| Reinvestment of distributions | 85,755 | 462,425 | 1,584,749 | 7,673,740 |
| Shares redeemed | (282,635) | (2,012,593) | (5,259,853) | (36,655,697) |
| Net increase (decrease) | 96,739 | (1,054,751) | $1,823,338 | $(20,387,826) |
| Service Class | | | | |
| Shares sold | 93,233 | 266,146 | $1,749,000 | $4,748,357 |
| Reinvestment of distributions | 11,050 | 43,021 | 203,316 | 713,768 |
| Shares redeemed | (65,012) | (129,663) | (1,211,112) | (2,304,588) |
| Net increase (decrease) | 39,271 | 179,504 | $741,204 | $3,157,537 |
| Service Class 2 | | | | |
| Shares sold | 997,208 | 1,624,109 | $18,498,547 | $28,739,955 |
| Reinvestment of distributions | 119,809 | 564,331 | 2,176,928 | 9,221,236 |
| Shares redeemed | (894,054) | (2,092,364) | (16,267,440) | (36,826,165) |
| Net increase (decrease) | 222,963 | 96,076 | $4,408,035 | $1,135,026 |
| Investor Class | | | | |
| Shares sold | 883,822 | 286,688 | $16,620,428 | $5,147,252 |
| Reinvestment of distributions | 174,492 | 833,888 | 3,205,418 | 13,777,163 |
| Shares redeemed | (526,840) | (1,686,408) | (9,695,929) | (29,961,274) |
| Net increase (decrease) | 531,474 | (565,832) | $10,129,917 | $(11,036,859) |
11. Other.
The Fund's organizational documents provide former and current trustees and officers with a limited indemnification against liabilities arising in connection with the performance of their duties to the Fund. In the normal course of business, the Fund may also enter into contracts that provide general indemnifications. The Fund's maximum exposure under these arrangements is unknown as this would be dependent on future claims that may be made against the Fund. The risk of material loss from such claims is considered remote.
At the end of the period, the investment adviser or its affiliates were the owners of record of 55% of the total outstanding shares of the Fund and one otherwise unaffiliated shareholder was the owner of record of 11% of the total outstanding shares of the Fund.
Shareholder Expense Example
As a shareholder of the Fund, you incur two types of costs: (1) transaction costs and (2) ongoing costs, including management fees, distribution and/or service (12b-1) fees and other Fund expenses. This Example is intended to help you understand your ongoing costs (in dollars) of investing in the Fund and to compare these costs with the ongoing costs of investing in other mutual funds.
The Example is based on an investment of $1,000 invested at the beginning of the period and held for the entire period (January 1, 2019 to June 30, 2019).
Actual Expenses
The first line of the accompanying table for each class of the Fund provides information about actual account values and actual expenses. You may use the information in this line, together with the amount you invested, to estimate the expenses that you paid over the period. Simply divide your account value by $1,000.00 (for example, an $8,600 account value divided by $1,000.00 = 8.6), then multiply the result by the number in the first line for a class of the Fund under the heading entitled "Expenses Paid During Period" to estimate the expenses you paid on your account during this period. The estimate of expenses does not include any fees or other expenses of any variable annuity or variable life insurance product. If they were, the estimate of expenses you paid during the period would be higher, and your ending account value would be lower. In addition, the Fund, as a shareholder in the underlying Fidelity Central Funds, will indirectly bear its pro-rata share of the fees and expenses incurred by the underlying Fidelity Central Funds. These fees and expenses are not included in the Fund's annualized expense ratio used to calculate the expense estimate in the table below.
Hypothetical Example for Comparison Purposes
The second line of the accompanying table for each class of the Fund provides information about hypothetical account values and hypothetical expenses based on a Class' actual expense ratio and an assumed rate of return of 5% per year before expenses, which is not the Class' actual return. The hypothetical account values and expenses may not be used to estimate the actual ending account balance or expenses you paid for the period. You may use this information to compare the ongoing costs of investing in the Fund and other funds. To do so, compare this 5% hypothetical example with the 5% hypothetical examples that appear in the shareholder reports of the other funds. The estimate of expenses does not include any fees or other expenses of any variable annuity or variable life insurance product. If they were, the estimate of expenses you paid during the period would be higher, and your ending account value would be lower. In addition, the Fund, as a shareholder in the underlying Fidelity Central Funds, will indirectly bear its pro-rata share of the fees and expenses incurred by the underlying Fidelity Central Funds. These fees and expenses are not included in the Fund's annualized expense ratio used to calculate the expense estimate in the table below.
Please note that the expenses shown in the table are meant to highlight your ongoing costs only and do not reflect any transaction costs. Therefore, the second line of the table is useful in comparing ongoing costs only, and will not help you determine the relative total costs of owning different funds.
| | Annualized Expense Ratio-A | Beginning
Account Value
January 1, 2019 | Ending
Account Value
June 30, 2019 | Expenses Paid
During Period-B
January 1, 2019
to June 30, 2019 |
| Initial Class | .66% | | | |
| Actual | | $1,000.00 | $1,173.90 | $3.56 |
| Hypothetical-C | | $1,000.00 | $1,021.52 | $3.31 |
| Service Class | .76% | | | |
| Actual | | $1,000.00 | $1,173.30 | $4.10 |
| Hypothetical-C | | $1,000.00 | $1,021.03 | $3.81 |
| Service Class 2 | .91% | | | |
| Actual | | $1,000.00 | $1,172.70 | $4.90 |
| Hypothetical-C | | $1,000.00 | $1,020.28 | $4.56 |
| Investor Class | .74% | | | |
| Actual | | $1,000.00 | $1,173.60 | $3.99 |
| Hypothetical-C | | $1,000.00 | $1,021.12 | $3.71 |
A Annualized expense ratio reflects expenses net of applicable fee waivers.
B Expenses are equal to each Class' annualized expense ratio, multiplied by the average account value over the period, multiplied by 181/365 (to reflect the one-half year period).
C 5% return per year before expenses
Board Approval of Investment Advisory Contracts and Management Fees
VIP Real Estate Portfolio
Each year, the Board of Trustees, including the Independent Trustees (together, the Board), votes on the renewal of the management contract with Fidelity SelectCo, LLC (SelectCo), an affiliate of Fidelity Management & Research Company (FMR), and the sub-advisory agreements with affiliates of FMR (together, the Advisory Contracts) for the fund. SelectCo and the sub-advisers are referred to herein as the Investment Advisers. The Board, assisted by the advice of fund counsel and Independent Trustees' counsel, requests and considers a broad range of information relevant to the renewal of the Advisory Contracts throughout the year.
The Board meets regularly and, at each of its meetings, covers an extensive agenda of topics and materials and considers factors that are relevant to its annual consideration of the renewal of the fund's Advisory Contracts, including the services and support provided to the fund and its shareholders. The Board has established various standing committees (Committees), each composed of and chaired by Independent Trustees with varying backgrounds, to which the Board has assigned specific subject matter responsibilities in order to enhance effective decision-making by the Board. The Board, acting directly and through its Committees, requests and receives information concerning the annual consideration of the renewal of the fund's Advisory Contracts. The Board also meets as needed to review matters specifically related to the Board's annual consideration of the renewal of the Advisory Contracts. Members of the Board may also meet with trustees of other Fidelity funds through joint ad hoc committees to discuss certain matters relevant to all of the Fidelity funds.
At its January 2019 meeting, the Board unanimously determined to renew the fund's Advisory Contracts. In reaching its determination, the Board considered all factors it believed relevant, including (i) the nature, extent, and quality of the services to be provided to the fund and its shareholders (including the investment performance of the fund); (ii) the competitiveness of the fund's management fee and total expense ratio relative to peer funds; (iii) the total costs of the services to be provided by and the profits to be realized by Fidelity from its relationships with the fund; and (iv) the extent to which, if any, economies of scale exist and would be realized as the fund grows, and whether any economies of scale are appropriately shared with fund shareholders.
In considering whether to renew the Advisory Contracts for the fund, the Board reached a determination, with the assistance of fund counsel and Independent Trustees' counsel and through the exercise of its business judgment, that the renewal of the Advisory Contracts was in the best interests of the fund and its shareholders and that the compensation payable under the Advisory Contracts was fair and reasonable. The Board's decision to renew the Advisory Contracts was not based on any single factor, but rather was based on a comprehensive consideration of all the information provided to the Board at its meetings throughout the year. The Board, in reaching its determination to renew the Advisory Contracts, was aware that shareholders of the fund have a broad range of investment choices available to them, including a wide choice among funds offered by Fidelity's competitors, and that the fund's shareholders, who have the opportunity to review and weigh the disclosure provided by the fund in its prospectus and other public disclosures, have chosen to invest in this fund, which is part of the Fidelity family of funds.
Nature, Extent, and Quality of Services Provided. The Board considered Fidelity's staffing as it relates to the fund, including the backgrounds of investment personnel of Fidelity, and also considered the fund's investment objective, strategies, and related investment philosophy. The Independent Trustees also had discussions with senior management of Fidelity's investment operations and investment groups. The Board considered the structure of the investment personnel compensation program and whether this structure provides appropriate incentives to act in the best interests of the fund. Additionally, the Board considered the portfolio managers' investments, if any, in the funds that they manage.
Resources Dedicated to Investment Management and Support Services. The Board and the Fund Oversight and Research Committees reviewed the general qualifications and capabilities of Fidelity's investment staff, including its size, education, experience, and resources, as well as Fidelity's approach to recruiting, training, managing, and compensating investment personnel. The Board noted that Fidelity has continued to increase the resources devoted to non-U.S. offices, including expansion of Fidelity's global investment organization. The Board also noted that Fidelity's analysts have extensive resources, tools and capabilities that allow them to conduct sophisticated quantitative and fundamental analysis, as well as credit analysis of issuers, counterparties and guarantors. Further, the Board considered that Fidelity's investment professionals have sufficient access to global information and data so as to provide competitive investment results over time, and that those professionals also have access to sophisticated tools that permit them to assess portfolio construction and risk and performance attribution characteristics continuously, as well as to transmit new information and research conclusions rapidly around the world. Additionally, in its deliberations, the Board considered Fidelity's trading, risk management, compliance, and technology and operations capabilities and resources, which are integral parts of the investment management process.
Shareholder and Administrative Services. The Board considered (i) the nature, extent, quality, and cost of advisory, administrative, and shareholder services performed by the Investment Advisers and their affiliates under the Advisory Contracts and under separate agreements covering transfer agency, pricing and bookkeeping, and securities lending services for the fund; (ii) the nature and extent of the supervision of third party service providers, principally custodians, subcustodians, and pricing vendors; and (iii) the resources devoted to, and the record of compliance with, the fund's compliance policies and procedures. The Board also reviewed the allocation of fund brokerage, including allocations to brokers affiliated with the Investment Advisers, the use of brokerage commissions to pay fund expenses, and the use of "soft" commission dollars to pay for research services.
The Board noted that the growth of fund assets over time across the complex allows Fidelity to reinvest in the development of services designed to enhance the value and convenience of the Fidelity funds as investment vehicles. These services include 24-hour access to account information and market information through telephone representatives and over the Internet, investor education materials and asset allocation tools, and the expanded availability of Fidelity Investor Centers.
The Board noted that it and the boards of certain other Fidelity funds had formed an ad hoc Committee on Transfer Agency Fees to review the variety of transfer agency fee structures throughout the industry and Fidelity's competitive positioning with respect to industry participants.
Investment in a Large Fund Family. The Board considered the benefits to shareholders of investing in a Fidelity fund, including the benefits of investing in a fund that is part of a large family of funds offering a variety of investment disciplines and providing a large variety of mutual fund investor services. The Board noted that Fidelity had taken, or had made recommendations that resulted in the Fidelity funds taking, a number of actions over the previous year that benefited particular funds, including: (i) continuing to dedicate additional resources to Fidelity's investment research process, which includes meetings with management of issuers of securities in which the funds invest, and to the support of the senior management team that oversees asset management; (ii) continuing efforts to enhance Fidelity's global research capabilities; (iii) launching new funds and making other enhancements to meet client needs; (iv) launching new share classes of existing funds; (v) eliminating purchase minimums and broadening eligibility requirements for certain funds and share classes; (vi) reducing management fees and total expenses for certain growth equity funds and index funds; (vii) lowering expense caps for certain existing funds and classes, and converting certain voluntary expense caps to contractual caps, to reduce expenses borne by shareholders; (viii) eliminating short-term redemption fees for funds that had such fees; (ix) rationalizing product lines and gaining increased efficiencies from fund mergers and share class consolidations; (x) continuing to develop, acquire and implement systems and technology to improve services to the funds and shareholders, strengthen information security, and increase efficiency; and (xi) continuing to implement enhancements to further strengthen Fidelity's product line to increase investors' probability of success in achieving their investment goals, including retirement income goals.
Investment Performance. The Board considered whether the fund has operated in accordance with its investment objective, as well as its record of compliance with its investment restrictions and its performance history.
The Board took into account discussions that occur at Board meetings throughout the year with representatives of the Investment Advisers about fund investment performance. In this regard the Board noted that as part of regularly scheduled fund reviews and other reports to the Board on fund performance, the Board considers annualized return information for the fund for different time periods, measured against an appropriate securities market index ("benchmark index"). In its evaluation of fund investment performance, the Board gave particular attention to information indicating changes in performance of certain Fidelity funds for specific time periods and discussed with the Investment Advisers the reasons for any overperformance or underperformance.
In addition to reviewing absolute and relative fund performance, the Independent Trustees periodically consider the appropriateness of fund performance metrics in evaluating the results achieved. In general, the Independent Trustees believe that fund performance should be evaluated based on net performance (after fees and expenses) of both the highest performing and lowest performing fund share classes, where applicable, compared to appropriate benchmark indices, over appropriate time periods that may include full market cycles, taking into account relevant factors including the following: general market conditions; issuer-specific information; and fund cash flows and other factors.
The Independent Trustees recognize that shareholders evaluate performance on a net basis over their own holding periods, for which one-, three-, and five-year periods are often used as a proxy. For this reason, the performance information reviewed by the Board also included net cumulative total return information for the fund and an appropriate benchmark index for the most recent one-, three-, and five-year periods ended June 30, 2018, as shown below.
VIP Real Estate Portfolio
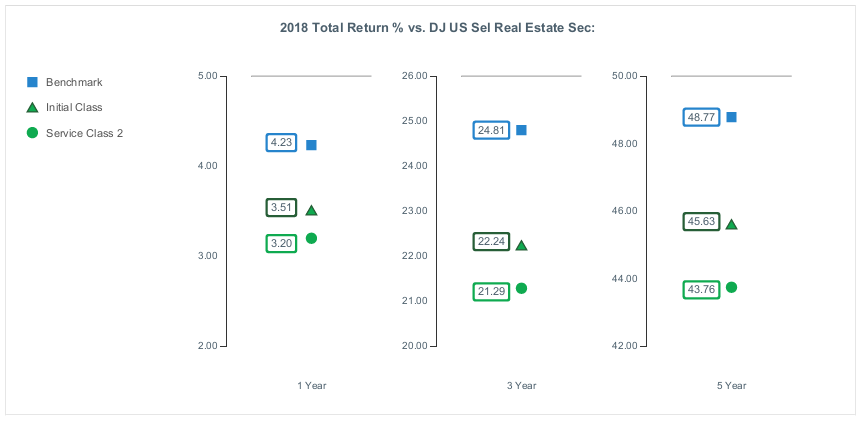
The Board considered the fund's underperformance for different time periods based on the June 30, 2018 data presented above and based on earlier periods ended prior to June 30, 2018. The Board noted that the fund's underperformance has continued since the Board approved the management contract in 2017 and 2018. The Board's discussions with SelectCo regarding underperformance cover topics including, but not limited to: the longer-term track record of a fund's portfolio manager(s); broader trends in the market that may adversely impact a fund's performance; attribution reports on contributors to the fund's underperformance; and the applicable portfolio manager's explanation of his or her underperformance. The Board engages with SelectCo on steps that might be taken to address a fund's underperformance. For a fund with underperformance over longer periods of time, the Board typically monitors the effect of any remedial actions and other relevant factors.
Based on its review, the Board concluded that the nature, extent, and quality of services provided to the fund under the Advisory Contracts should continue to benefit the shareholders of the fund.
Competitiveness of Management Fee and Total Expense Ratio. The Board considered the fund's management fee and total expense ratio compared to "mapped groups" of competitive funds and classes created for the purpose of facilitating the Trustees' competitive analysis of management fees and total expenses. Fidelity creates "mapped groups" by combining similar Lipper investment objective categories that have comparable investment mandates. For this purpose, all sector focused equity variable annuity funds are grouped in the same mapped group. Combining Lipper investment objective categories aids the Board's management fee and total expense ratio comparisons by broadening the competitive group used for comparison.
Management Fee. The Board considered two proprietary management fee comparisons for the 12-month periods ended June 30 shown in basis points (BP) in the chart below. The group of Lipper funds used by the Board for management fee comparisons is referred to below as the "Total Mapped Group." The Total Mapped Group comparison focuses on a fund's standing in terms of gross management fees before expense reimbursements or caps relative to the total universe of funds with comparable investment mandates (i.e., sector equities), regardless of whether their management fee structures also are comparable. Funds with comparable management fee structures have similar management fee contractual arrangements (
e.g., flat rate charged for advisory services, all-inclusive fee rate,
etc.). "TMG %" represents the percentage of funds in the Total Mapped Group that had management fees that were lower than the fund's. For example, a hypothetical TMG % of 20% would mean that 80% of the funds in the Total Mapped Group had higher, and 20% had lower, management fees than the fund. The fund's actual TMG %s and the number of funds in the Total Mapped Group are in the chart below. The "Asset-Size Peer Group" (ASPG) comparison focuses on a fund's standing relative to a subset of non-Fidelity funds within the Total Mapped Group that are similar in size and management fee structure. For example, if a fund is in the first quartile of the ASPG, the fund's management fee ranks in the least expensive or lowest 25% of funds in the ASPG. The ASPG represents at least 15% of the funds in the Total Mapped Group with comparable asset size and management fee structures, subject to a minimum of 50 funds (or all funds in the Total Mapped Group if fewer than 50). Additional information, such as the ASPG quartile in which the fund's management fee rate ranked, is also included in the chart and was considered by the Board.
VIP Real Estate Portfolio

The Board noted that the fund's management fee rate ranked below the median of its Total Mapped Group and below the median of its ASPG for the 12-month period ended June 30, 2018.
The Board noted that it and the boards of other Fidelity funds formed an ad hoc Committee on Group Fee, which meets periodically, to conduct an in-depth review of the "group fee" component of the management fee of funds with such management fee structures. The Committee's focus included the mechanics of the group fee, the competitive landscape of group fee structures, Fidelity funds with no group fee component and investment products not included in group fee assets. The Board also considered that, for funds subject to the group fee, FMR agreed to voluntarily waive fees over a specified period of time in amounts designed to account for assets converted from certain funds to certain collective investment trusts.
Based on its review, the Board concluded that the fund's management fee is fair and reasonable in light of the services that the fund receives and the other factors considered.
Total Expense Ratio. In its review of each class's total expense ratio, the Board considered the fund's management fee rate as well as other fund or class expenses, as applicable, such as transfer agent fees, pricing and bookkeeping fees, fund-paid 12b-1 fees, and custodial, legal, and audit fees. The Board also noted that Fidelity may agree to waive fees and expenses from time to time, and the extent to which, if any, it has done so for the fund. As part of its review, the Board also considered the current and historical total expense ratios of each class of the fund compared to competitive fund median expenses. Each class of the fund is compared to those funds and classes in the Total Mapped Group (used by the Board for management fee comparisons) that have a similar sales load structure.
The Board noted that the total expense ratio of each class ranked below the competitive median for the 12-month period ended June 30, 2018.
Fees Charged to Other Fidelity Clients. The Board also considered Fidelity fee structures and other information with respect to clients of Fidelity, such as other funds advised or subadvised by Fidelity, pension plan clients, and other institutional clients with similar mandates. The Board noted that a joint ad hoc committee created by it and the boards of other Fidelity funds periodically reviews and compares Fidelity's institutional investment advisory business with its business of providing services to the Fidelity funds, and also noted the most recent findings of the committee. The Board noted that the committee's review included a consideration of the differences in services provided, fees charged, and costs incurred, as well as competition in the markets serving the different categories of clients.
Based on its review of total expense ratios and fees charged to other Fidelity clients, the Board concluded that the total expense ratio of each class of the fund was reasonable in light of the services that the fund and its shareholders receive and the other factors considered.
Costs of the Services and Profitability. The Board considered the revenues earned and the expenses incurred by Fidelity in conducting the business of developing, marketing, distributing, managing, administering and servicing the fund and servicing the fund's shareholders. The Board also considered the level of Fidelity's profits in respect of all the Fidelity funds.
On an annual basis, Fidelity presents to the Board information about the profitability of its relationships with the fund. Fidelity calculates profitability information for each fund, as well as aggregate profitability information for groups of Fidelity funds and all Fidelity funds, using a series of detailed revenue and cost allocation methodologies which originate with the books and records of Fidelity on which Fidelity's audited financial statements are based. The Audit Committee of the Board reviews any significant changes from the prior year's methodologies.
PricewaterhouseCoopers LLP (PwC), auditor to Fidelity and certain Fidelity funds, has been engaged annually by the Board as part of the Board's assessment of Fidelity's profitability analysis. PwC's engagement includes the review and assessment of the methodologies used by Fidelity in determining the revenues and expenses attributable to Fidelity's mutual fund business, and completion of agreed-upon procedures in respect of the mathematical accuracy of the fund profitability information and its conformity to established allocation methodologies. After considering PwC's reports issued under the engagement and information provided by Fidelity, the Board concluded that while other allocation methods may also be reasonable, Fidelity's profitability methodologies are reasonable in all material respects.
The Board also reviewed Fidelity's non-fund businesses and potential indirect benefits such businesses may have received as a result of their association with Fidelity's mutual fund business (i.e., fall-out benefits) as well as cases where Fidelity's affiliates may benefit from the fund's business. The Board noted that changes to fall-out benefits year-over-year reflect business developments at Fidelity's various businesses.
The Board considered the costs of the services provided by and the profits realized by Fidelity in connection with the operation of the fund and was satisfied that the profitability was not excessive.
Economies of Scale. The Board considered whether there have been economies of scale in respect of the management of the Fidelity funds, whether the Fidelity funds (including the fund) have appropriately benefited from any such economies of scale, and whether there is potential for realization of any further economies of scale. The Board considered the extent to which the fund will benefit from economies of scale as assets grow through increased services to the fund, through waivers or reimbursements, or through fee or expense ratio reductions. The Board also noted that a committee (the Economies of Scale Committee) created by it and the boards of other Fidelity funds periodically analyzes whether Fidelity attains economies of scale in respect of the management and servicing of the Fidelity funds, whether the Fidelity funds have appropriately benefited from such economies of scale, and whether there is potential for realization of any further economies of scale.
The Board recognized that the fund's management contract incorporates a "group fee" structure, which provides for lower group fee rates as total group assets increase, and for higher group fee rates as total group assets decrease (with "group assets" defined to include fund assets under SelectCo's management plus assets under FMR's management). SelectCo calculates the group fee rates based on a tiered asset "breakpoint" schedule that varies based on asset class. The Board considered that the group fee is designed to deliver the benefits of economies of scale to fund shareholders when total group assets increase, even if assets of any particular fund are unchanged or have declined, because some portion of Fidelity's costs are attributable to services provided to all Fidelity funds, and all funds benefit if those costs can be allocated among more assets. The Board concluded that, given the group fee structure, fund shareholders will benefit from lower management fees as group assets increase at the fund complex level, regardless of whether Fidelity achieves any such economies of scale.
The Board concluded, taking into account the analysis of the Economies of Scale Committee, that economies of scale, if any, are being appropriately shared between fund shareholders and Fidelity.
Additional Information Requested by the Board. In order to develop fully the factual basis for consideration of the Fidelity funds' advisory contracts, the Board requested and received additional information on certain topics, including: (i) fund performance trends, in particular the underperformance of certain funds, and Fidelity's long-term strategies for certain funds; (ii) Fidelity's fund profitability methodology, profitability trends for certain funds, and the impact of certain factors on fund profitability results; (iii) metrics for evaluating index fund and ETF performance and information about ETF trading characteristics; (iv) the methodology with respect to the evaluation of competitive fund data and peer group classifications and fee comparisons; (v) the expense structures for different funds and classes; (vi) information regarding other accounts managed by Fidelity, including collective investment trusts; and (vii) Fidelity's philosophies and strategies for evaluating funds and classes with lower or declining asset levels.
Based on its evaluation of all of the conclusions noted above, and after considering all factors it believed relevant, the Board concluded that the advisory fee arrangements are fair and reasonable, and that the fund's Advisory Contracts should be renewed.
VIPRE-SANN-0819
1.787989.116
Fidelity® Variable Insurance Products: Consumer Staples Portfolio
Semi-Annual Report June 30, 2019 |
|
Beginning on January 1, 2021, as permitted by regulations adopted by the Securities and Exchange Commission, and if your insurance carrier elects to participate, you may not be receiving paper copies of the Fund’s shareholder reports from the insurance company that offers your variable insurance product unless you specifically request paper copies from your financial professional or the administrator of your variable insurance product. Instead, the reports will be made available on a website, and you will be notified by mail each time a report is posted and provided with a website link to access the report.
If you already elected to receive shareholder reports electronically, you will not be affected by this change and you need not take any action. You may elect to receive shareholder reports and other communications from the Fund electronically, by contacting your financial professional or the administrator of your variable insurance product. If you own a Fidelity-administered variable insurance product, please visit fidelity.com/mailpreferences to make your election or call 1-800-343-3548.
You may elect to receive all future reports in paper free of charge. If you wish to continue receiving paper copies of your shareholder reports, you may contact your financial professional or the administrator of your variable insurance product. If you own a Fidelity-administered variable insurance product, please visit fidelity.com/mailpreferences to make your election or call 1-800-343-3548. Your election to receive reports in paper will apply to all funds available under your variable insurance product.
Contents
To view a fund's proxy voting guidelines and proxy voting record for the 12-month period ended June 30, visit http://www.fidelity.com/proxyvotingresults or visit the Securities and Exchange Commission's (SEC) web site at http://www.sec.gov.
You may also call 1-877-208-0098 to request a free copy of the proxy voting guidelines.
Fidelity® Variable Insurance Products are separate account options which are purchased through a variable insurance contract.
Standard & Poor's, S&P and S&P 500 are registered service marks of The McGraw-Hill Companies, Inc. and have been licensed for use by Fidelity Distributors Corporation.
Other third-party marks appearing herein are the property of their respective owners.
All other marks appearing herein are registered or unregistered trademarks or service marks of FMR LLC or an affiliated company. © 2019 FMR LLC. All rights reserved.
This report and the financial statements contained herein are submitted for the general information of the shareholders of the Fund. This report is not authorized for distribution to prospective investors in the Fund unless preceded or accompanied by an effective prospectus.
A fund files its complete schedule of portfolio holdings with the SEC for the first and third quarters of each fiscal year on Form N-PORT. Forms N-PORT are available on the SEC’s web site at http://www.sec.gov. A fund's Forms N-PORT may be reviewed and copied at the SEC’s Public Reference Room in Washington, DC. Information regarding the operation of the SEC's Public Reference Room may be obtained by calling 1-800-SEC-0330.
For a complete list of a fund's portfolio holdings, view the most recent holdings listing, semiannual report, or annual report on Fidelity's web site at http://www.fidelity.com, http://www.institutional.fidelity.com, or http://www.401k.com, as applicable.
NOT FDIC INSURED •MAY LOSE VALUE •NO BANK GUARANTEE
Neither the Fund nor Fidelity Distributors Corporation is a bank.
Investment Summary (Unaudited)
Top Ten Stocks as of June 30, 2019
| | % of fund's net assets |
| The Coca-Cola Co. | 10.3 |
| Procter & Gamble Co. | 9.8 |
| Philip Morris International, Inc. | 6.2 |
| Altria Group, Inc. | 5.7 |
| PepsiCo, Inc. | 4.9 |
| Monster Beverage Corp. | 4.9 |
| Spectrum Brands Holdings, Inc. | 3.8 |
| Mondelez International, Inc. | 3.4 |
| Coty, Inc. Class A | 3.2 |
| Costco Wholesale Corp. | 3.0 |
| | 55.2 |
Top Industries (% of fund's net assets)
| As of June 30, 2019 |
| | Beverages | 26.0% |
| | Household Products | 19.4% |
| | Food Products | 18.9% |
| | Tobacco | 12.6% |
| | Personal Products | 9.6% |
| | All Others* | 13.5% |

* Includes Short-Term investments and Net Other Assets (Liabilities).
Schedule of Investments June 30, 2019 (Unaudited)
Showing Percentage of Net Assets
| Common Stocks - 98.2% | | | |
| | | Shares | Value |
| Beverages - 26.0% | | | |
| Brewers - 1.3% | | | |
| Anheuser-Busch InBev SA NV | | 20,700 | $1,831,751 |
| Beijing Yanjing Brewery Co. Ltd. (A Shares) | | 882,479 | 853,332 |
| China Resources Beer Holdings Co. Ltd. | | 18,666 | 88,650 |
| | | | 2,773,733 |
| Distillers & Vintners - 2.3% | | | |
| Constellation Brands, Inc. Class A (sub. vtg.) | | 24,000 | 4,726,560 |
| Kweichow Moutai Co. Ltd. (A Shares) | | 1,850 | 265,102 |
| | | | 4,991,662 |
| Soft Drinks - 22.4% | | | |
| Coca-Cola European Partners PLC | | 27,400 | 1,548,100 |
| Coca-Cola FEMSA S.A.B. de CV sponsored ADR | | 10,200 | 633,828 |
| Coca-Cola West Co. Ltd. | | 6,250 | 158,199 |
| Fever-Tree Drinks PLC | | 263 | 7,742 |
| Keurig Dr. Pepper, Inc. (a) | | 97,200 | 2,809,080 |
| Monster Beverage Corp. (b) | | 168,400 | 10,748,972 |
| PepsiCo, Inc. | | 82,006 | 10,753,447 |
| The Coca-Cola Co. | | 448,438 | 22,834,461 |
| | | | 49,493,829 |
|
| TOTAL BEVERAGES | | | 57,259,224 |
|
| Food & Staples Retailing - 9.5% | | | |
| Drug Retail - 1.3% | | | |
| Walgreens Boots Alliance, Inc. | | 54,600 | 2,984,982 |
| Food Distributors - 1.8% | | | |
| Performance Food Group Co. (b) | | 8,200 | 328,246 |
| Sysco Corp. | | 50,500 | 3,571,360 |
| | | | 3,899,606 |
| Food Retail - 1.9% | | | |
| Kroger Co. | | 168,652 | 3,661,435 |
| Sprouts Farmers Market LLC (b) | | 27,000 | 510,030 |
| | | | 4,171,465 |
| Hypermarkets & Super Centers - 4.5% | | | |
| BJ's Wholesale Club Holdings, Inc. | | 2,900 | 76,560 |
| Costco Wholesale Corp. | | 25,000 | 6,606,500 |
| Walmart, Inc. | | 28,904 | 3,193,603 |
| | | | 9,876,663 |
|
| TOTAL FOOD & STAPLES RETAILING | | | 20,932,716 |
|
| Food Products - 18.9% | | | |
| Agricultural Products - 1.0% | | | |
| Bunge Ltd. | | 11,200 | 623,952 |
| Darling International, Inc. (b) | | 56,300 | 1,119,807 |
| Ingredion, Inc. | | 4,200 | 346,458 |
| | | | 2,090,217 |
| Packaged Foods & Meats - 17.9% | | | |
| Conagra Brands, Inc. | | 92,900 | 2,463,708 |
| Danone SA | | 44,056 | 3,730,319 |
| Freshpet, Inc. (b) | | 51,100 | 2,325,561 |
| General Mills, Inc. | | 58,400 | 3,067,168 |
| JBS SA | | 353,800 | 1,955,139 |
| Kellogg Co. | | 19,500 | 1,044,615 |
| Mondelez International, Inc. | | 138,500 | 7,465,150 |
| Muyuan Foodstuff Co. Ltd. (A Shares) | | 49,800 | 426,362 |
| Nomad Foods Ltd. (b) | | 10,600 | 226,416 |
| Post Holdings, Inc. (b) | | 8,700 | 904,539 |
| SunOpta, Inc. (b) | | 28,900 | 95,081 |
| The Hain Celestial Group, Inc. (b) | | 19,180 | 420,042 |
| The J.M. Smucker Co. | | 30,400 | 3,501,776 |
| The Kraft Heinz Co. | | 149,600 | 4,643,584 |
| The Simply Good Foods Co. (b) | | 44,800 | 1,078,784 |
| TreeHouse Foods, Inc. (b) | | 46,400 | 2,510,240 |
| Tyson Foods, Inc. Class A | | 39,600 | 3,197,304 |
| Wens Foodstuffs Group Co. Ltd. (A Shares) | | 83,314 | 435,085 |
| | | | 39,490,873 |
|
| TOTAL FOOD PRODUCTS | | | 41,581,090 |
|
| Hotels, Restaurants & Leisure - 0.9% | | | |
| Restaurants - 0.9% | | | |
| U.S. Foods Holding Corp. (b) | | 52,600 | 1,880,976 |
| Household Products - 19.4% | | | |
| Household Products - 19.4% | | | |
| C&S Paper Co. Ltd. (A Shares) | | 594,361 | 1,062,905 |
| Colgate-Palmolive Co. | | 87,490 | 6,270,408 |
| Energizer Holdings, Inc. | | 21,000 | 811,440 |
| Essity AB Class B | | 140,000 | 4,302,752 |
| Procter & Gamble Co. | | 196,407 | 21,536,028 |
| Reckitt Benckiser Group PLC | | 5,164 | 407,722 |
| Spectrum Brands Holdings, Inc. | | 157,400 | 8,463,398 |
| | | | 42,854,653 |
| Internet & Direct Marketing Retail - 0.3% | | | |
| Internet & Direct Marketing Retail - 0.3% | | | |
| Ocado Group PLC (b) | | 50,500 | 748,426 |
| Multiline Retail - 1.0% | | | |
| General Merchandise Stores - 1.0% | | | |
| Dollar General Corp. | | 4,900 | 662,284 |
| Dollar Tree, Inc. (b) | | 13,800 | 1,481,982 |
| | | | 2,144,266 |
| Personal Products - 9.6% | | | |
| Personal Products - 9.6% | | | |
| Avon Products, Inc. (b) | | 579,815 | 2,249,682 |
| Coty, Inc. Class A | | 518,902 | 6,953,287 |
| Edgewell Personal Care Co. (b) | | 122,800 | 3,309,460 |
| Estee Lauder Companies, Inc. Class A | | 6,300 | 1,153,593 |
| Ontex Group NV | | 113,300 | 1,826,858 |
| Unilever NV (Certificaten Van Aandelen) (Bearer) | | 93,086 | 5,655,736 |
| | | | 21,148,616 |
| Tobacco - 12.6% | | | |
| Tobacco - 12.6% | | | |
| Altria Group, Inc. | | 264,196 | 12,509,681 |
| British American Tobacco PLC sponsored ADR | | 42,796 | 1,492,297 |
| Philip Morris International, Inc. | | 175,734 | 13,800,391 |
| | | | 27,802,369 |
| TOTAL COMMON STOCKS | | | |
| (Cost $176,363,690) | | | 216,352,336 |
|
| Convertible Preferred Stocks - 1.1% | | | |
| Internet & Direct Marketing Retail - 1.1% | | | |
| Internet & Direct Marketing Retail - 1.1% | | | |
| The Honest Co., Inc.: | | | |
| Series D (b)(c)(d) | | 32,783 | 1,500,150 |
| Series E (b)(c)(d) | | 51,008 | 999,757 |
| | | | |
| TOTAL CONVERTIBLE PREFERRED STOCKS | | | |
| (Cost $2,499,988) | | | 2,499,907 |
|
| Money Market Funds - 1.3% | | | |
| Fidelity Cash Central Fund 2.42% (e) | | 1,512,052 | 1,512,355 |
| Fidelity Securities Lending Cash Central Fund 2.42% (e)(f) | | 1,392,261 | 1,392,400 |
| TOTAL MONEY MARKET FUNDS | | | |
| (Cost $2,904,755) | | | 2,904,755 |
| TOTAL INVESTMENT IN SECURITIES - 100.6% | | | |
| (Cost $181,768,433) | | | 221,756,998 |
| NET OTHER ASSETS (LIABILITIES) - (0.6)% | | | (1,321,291) |
| NET ASSETS - 100% | | | $220,435,707 |
Legend
(a) Security or a portion of the security is on loan at period end.
(b) Non-income producing
(c) Restricted securities - Investment in securities not registered under the Securities Act of 1933 (excluding 144A issues). At the end of the period, the value of restricted securities (excluding 144A issues) amounted to $2,499,907 or 1.1% of net assets.
(d) Level 3 security
(e) Affiliated fund that is generally available only to investment companies and other accounts managed by Fidelity Investments. The rate quoted is the annualized seven-day yield of the fund at period end. A complete unaudited listing of the fund's holdings as of its most recent quarter end is available upon request. In addition, each Fidelity Central Fund's financial statements are available on the SEC's website or upon request.
(f) Investment made with cash collateral received from securities on loan.
Additional information on each restricted holding is as follows:
| Security | Acquisition Date | Acquisition Cost |
| The Honest Co., Inc. Series D | 8/3/15 | $1,499,986 |
| The Honest Co., Inc. Series E | 9/28/17 | $1,000,002 |
Affiliated Central Funds
Information regarding fiscal year to date income earned by the Fund from investments in Fidelity Central Funds is as follows:
| Fund | Income earned |
| Fidelity Cash Central Fund | $10,661 |
| Fidelity Securities Lending Cash Central Fund | 3,183 |
| Total | $13,844 |
Amounts in the income column in the above table include any capital gain distributions from underlying funds, which are presented in the corresponding line-item in the Statement of Operations, if applicable. Amount for Fidelity Securities Lending Cash Central Fund represents securities lending income earned from the reinvestment of cash collateral from loaned securities, net of payments to and from borrowers of securities.
Investment Valuation
The following is a summary of the inputs used, as of June 30, 2019, involving the Fund's assets and liabilities carried at fair value. The inputs or methodology used for valuing securities may not be an indication of the risk associated with investing in those securities. For more information on valuation inputs, and their aggregation into the levels used below, please refer to the Investment Valuation section in the accompanying Notes to Financial Statements.
| | Valuation Inputs at Reporting Date: |
| Description | Total | Level 1 | Level 2 | Level 3 |
| Investments in Securities: | | | | |
| Common Stocks | $216,352,336 | $204,726,808 | $11,625,528 | $-- |
| Convertible Preferred Stocks | 2,499,907 | -- | -- | 2,499,907 |
| Money Market Funds | 2,904,755 | 2,904,755 | -- | -- |
| Total Investments in Securities: | $221,756,998 | $207,631,563 | $11,625,528 | $2,499,907 |
The following is a reconciliation of Investments in Securities for which Level 3 inputs were used in determining value:
| Investments in Securities: | |
| Convertible Preferred Stocks | |
| Beginning Balance | $2,350,006 |
| Total Realized Gain (Loss) | -- |
| Total Unrealized Gain (Loss) | 149,901 |
| Cost of Purchases | -- |
| Proceeds of Sales | -- |
| Amortization/Accretion | -- |
| Transfers in to Level 3 | -- |
| Transfers out of Level 3 | -- |
| Ending Balance | $2,499,907 |
| The change in unrealized gain (loss) for the period attributable to Level 3 securities held at June 30, 2019 | $149,901 |
The information used in the above reconciliation represents fiscal year to date activity for any Investments in Securities identified as using Level 3 inputs at either the beginning or the end of the current fiscal period. Transfers in or out of Level 3 represent the beginning value of any Security or Instrument where a change in the pricing level occurred from the beginning to the end of the period. The cost of purchases and the proceeds of sales may include securities received or delivered through corporate actions or exchanges. Realized and unrealized gains (losses) disclosed in the reconciliation are included in Net Gain (Loss) on the Fund's Statement of Operations.
Other Information
Distribution of investments by country or territory of incorporation, as a percentage of Total Net Assets, is as follows (Unaudited):
| United States of America | 87.2% |
| Netherlands | 2.6% |
| Sweden | 1.9% |
| United Kingdom | 1.9% |
| France | 1.7% |
| Belgium | 1.6% |
| China | 1.4% |
| Others (Individually Less Than 1%) | 1.7% |
| | 100.0% |
See accompanying notes which are an integral part of the financial statements.
Financial Statements
Statement of Assets and Liabilities
| | | June 30, 2019 (Unaudited) |
| Assets | | |
Investment in securities, at value (including securities loaned of $1,364,080) — See accompanying schedule:
Unaffiliated issuers (cost $178,863,678) | $218,852,243 | |
| Fidelity Central Funds (cost $2,904,755) | 2,904,755 | |
| Total Investment in Securities (cost $181,768,433) | | $221,756,998 |
| Cash | | 32,399 |
| Foreign currency held at value (cost $3,575) | | 3,576 |
| Receivable for investments sold | | 757,343 |
| Dividends receivable | | 683,857 |
| Distributions receivable from Fidelity Central Funds | | 3,118 |
| Prepaid expenses | | 1,805 |
| Other receivables | | 1,994 |
| Total assets | | 223,241,090 |
| Liabilities | | |
| Payable for investments purchased | $1,076,354 | |
| Payable for fund shares redeemed | 179,093 | |
| Accrued management fee | 98,723 | |
| Other affiliated payables | 32,534 | |
| Other payables and accrued expenses | 26,279 | |
| Collateral on securities loaned | 1,392,400 | |
| Total liabilities | | 2,805,383 |
| Net Assets | | $220,435,707 |
| Net Assets consist of: | | |
| Paid in capital | | $179,222,918 |
| Total distributable earnings (loss) | | 41,212,789 |
| Net Assets | | $220,435,707 |
| Net Asset Value and Maximum Offering Price | | |
| Initial Class: | | |
| Net Asset Value, offering price and redemption price per share ($18,918,533 ÷ 1,080,864 shares) | | $17.50 |
| Investor Class: | | |
| Net Asset Value, offering price and redemption price per share ($201,517,174 ÷ 11,566,707 shares) | | $17.42 |
See accompanying notes which are an integral part of the financial statements.
Statement of Operations
| | | Six months ended June 30, 2019 (Unaudited) |
| Investment Income | | |
| Dividends | | $3,375,738 |
| Income from Fidelity Central Funds (including $3,183 from security lending) | | 13,844 |
| Total income | | 3,389,582 |
| Expenses | | |
| Management fee | $565,493 | |
| Transfer agent fees | 145,173 | |
| Accounting and security lending fees | 41,071 | |
| Custodian fees and expenses | 8,612 | |
| Independent trustees' fees and expenses | 498 | |
| Audit | 27,817 | |
| Legal | 522 | |
| Miscellaneous | 822 | |
| Total expenses before reductions | 790,008 | |
| Expense reductions | (3,010) | |
| Total expenses after reductions | | 786,998 |
| Net investment income (loss) | | 2,602,584 |
| Realized and Unrealized Gain (Loss) | | |
| Net realized gain (loss) on: | | |
| Investment securities: | | |
| Unaffiliated issuers | 628,841 | |
| Fidelity Central Funds | 130 | |
| Foreign currency transactions | 792 | |
| Total net realized gain (loss) | | 629,763 |
| Change in net unrealized appreciation (depreciation) on: | | |
| Investment securities: | | |
| Unaffiliated issuers | 34,767,191 | |
| Assets and liabilities in foreign currencies | 138 | |
| Total change in net unrealized appreciation (depreciation) | | 34,767,329 |
| Net gain (loss) | | 35,397,092 |
| Net increase (decrease) in net assets resulting from operations | | $37,999,676 |
See accompanying notes which are an integral part of the financial statements.
Statement of Changes in Net Assets
| | Six months ended June 30, 2019 (Unaudited) | Year ended December 31, 2018 |
| Increase (Decrease) in Net Assets | | |
| Operations | | |
| Net investment income (loss) | $2,602,584 | $5,671,592 |
| Net realized gain (loss) | 629,763 | 7,016,820 |
| Change in net unrealized appreciation (depreciation) | 34,767,329 | (51,944,128) |
| Net increase (decrease) in net assets resulting from operations | 37,999,676 | (39,255,716) |
| Distributions to shareholders | (8,025,916) | (22,676,118) |
| Share transactions - net increase (decrease) | 2,080,933 | (37,166,338) |
| Total increase (decrease) in net assets | 32,054,693 | (99,098,172) |
| Net Assets | | |
| Beginning of period | 188,381,014 | 287,479,186 |
| End of period | $220,435,707 | $188,381,014 |
See accompanying notes which are an integral part of the financial statements.
Financial Highlights
VIP Consumer Staples Portfolio Initial Class
| | Six months ended (Unaudited) June 30, | Years endedDecember 31, | | | | |
| | 2019 | 2018 | 2017 | 2016 | 2015 | 2014 |
| Selected Per–Share Data | | | | | | |
| Net asset value, beginning of period | $15.10 | $19.72 | $17.48 | $18.25 | $18.08 | $16.44 |
| Income from Investment Operations | | | | | | |
| Net investment income (loss)A | .21 | .44B | .32 | .33 | .28 | .28 |
| Net realized and unrealized gain (loss) | 2.84 | (3.36) | 2.24 | .30 | 1.34 | 2.21 |
| Total from investment operations | 3.05 | (2.92) | 2.56 | .63 | 1.62 | 2.49 |
| Distributions from net investment income | (.04) | (.50) | (.32) | (.33)C | (.27) | (.24) |
| Distributions from net realized gain | (.61) | (1.19) | – | (1.07)C | (1.18) | (.61) |
| Total distributions | (.65) | (1.70)D | (.32) | (1.40) | (1.45) | (.85) |
| Redemption fees added to paid in capitalA | – | – | –E | –E | –E | –E |
| Net asset value, end of period | $17.50 | $15.10 | $19.72 | $17.48 | $18.25 | $18.08 |
| Total ReturnF,G,H | 20.62% | (15.55)% | 14.66% | 3.72% | 9.46% | 15.66% |
| Ratios to Average Net AssetsI,J | | | | | | |
| Expenses before reductions | .68%K | .68% | .68% | .68% | .69% | .71% |
| Expenses net of fee waivers, if any | .68%K | .68% | .68% | .68% | .69% | .70% |
| Expenses net of all reductions | .68%K | .67% | .68% | .67% | .68% | .70% |
| Net investment income (loss) | 2.55%K | 2.53%B | 1.69% | 1.79% | 1.61% | 1.66% |
| Supplemental Data | | | | | | |
| Net assets, end of period (000 omitted) | $18,919 | $16,285 | $29,388 | $38,192 | $28,077 | $22,943 |
| Portfolio turnover rateL | 51%K | 38% | 41% | 45% | 38% | 78% |
A Calculated based on average shares outstanding during the period.
B Net investment income per share reflects a large, non-recurring dividend which amounted to $.14 per share. Excluding this non-recurring dividend, the ratio of net investment income (loss) to average net assets would have been 1.71%.
C The amounts shown reflect certain reclassifications related to book to tax differences that were made in the year shown.
D Total distributions of $1.70 per share is comprised of distributions from net investment income of $.501 and distributions from net realized gain of $1.194 per share.
E Amount represents less than $.005 per share.
F Total returns for periods of less than one year are not annualized.
G Total returns do not reflect charges attributable to your insurance company's separate account. Inclusion of these charges would reduce the total returns shown.
H Total returns would have been lower if certain expenses had not been reduced during the applicable periods shown.
I Fees and expenses of any underlying Fidelity Central Funds are not included in the Fund's expense ratio. The Fund indirectly bears its proportionate share of the expenses of any underlying Fidelity Central Funds.
J Expense ratios reflect operating expenses of the class. Expenses before reductions do not reflect amounts reimbursed by the investment adviser or reductions from brokerage service arrangements or reductions from other expense offset arrangements and do not represent the amount paid by the class during periods when reimbursements or reductions occur. Expenses net of fee waivers reflect expenses after reimbursement by the investment adviser but prior to reductions from brokerage service arrangements or other expense offset arrangements. Expenses net of all reductions represent the net expenses paid by the class.
K Annualized
L Amount does not include the portfolio activity of any underlying Fidelity Central Funds.
See accompanying notes which are an integral part of the financial statements.
VIP Consumer Staples Portfolio Investor Class
| | Six months ended (Unaudited) June 30, | Years endedDecember 31, | | | | |
| | 2019 | 2018 | 2017 | 2016 | 2015 | 2014 |
| Selected Per–Share Data | | | | | | |
| Net asset value, beginning of period | $15.04 | $19.64 | $17.42 | $18.19 | $18.02 | $16.40 |
| Income from Investment Operations | | | | | | |
| Net investment income (loss)A | .21 | .42B | .31 | .32 | .27 | .26 |
| Net realized and unrealized gain (loss) | 2.82 | (3.34) | 2.21 | .30 | 1.34 | 2.20 |
| Total from investment operations | 3.03 | (2.92) | 2.52 | .62 | 1.61 | 2.46 |
| Distributions from net investment income | (.04) | (.49) | (.30) | (.32)C | (.26) | (.23) |
| Distributions from net realized gain | (.61) | (1.19) | – | (1.07)C | (1.18) | (.61) |
| Total distributions | (.65) | (1.68) | (.30) | (1.39) | (1.44) | (.84) |
| Redemption fees added to paid in capitalA | – | – | –D | –D | –D | –D |
| Net asset value, end of period | $17.42 | $15.04 | $19.64 | $17.42 | $18.19 | $18.02 |
| Total ReturnE,F,G | 20.55% | (15.58)% | 14.52% | 3.67% | 9.41% | 15.52% |
| Ratios to Average Net AssetsH,I | | | | | | |
| Expenses before reductions | .76%J | .76% | .76% | .76% | .77% | .78% |
| Expenses net of fee waivers, if any | .76%J | .76% | .76% | .76% | .76% | .78% |
| Expenses net of all reductions | .76%J | .75% | .76% | .75% | .76% | .77% |
| Net investment income (loss) | 2.47%J | 2.45%B | 1.61% | 1.71% | 1.53% | 1.59% |
| Supplemental Data | | | | | | |
| Net assets, end of period (000 omitted) | $201,517 | $172,096 | $258,092 | $278,992 | $213,575 | $160,591 |
| Portfolio turnover rateK | 51%J | 38% | 41% | 45% | 38% | 78% |
A Calculated based on average shares outstanding during the period.
B Net investment income per share reflects a large, non-recurring dividend which amounted to $.14 per share. Excluding this non-recurring dividend, the ratio of net investment income (loss) to average net assets would have been 1.63%.
C The amounts shown reflect certain reclassifications related to book to tax differences that were made in the year shown.
D Amount represents less than $.005 per share.
E Total returns for periods of less than one year are not annualized.
F Total returns do not reflect charges attributable to your insurance company's separate account. Inclusion of these charges would reduce the total returns shown.
G Total returns would have been lower if certain expenses had not been reduced during the applicable periods shown.
H Fees and expenses of any underlying Fidelity Central Funds are not included in the Fund's expense ratio. The Fund indirectly bears its proportionate share of the expenses of any underlying Fidelity Central Funds.
I Expense ratios reflect operating expenses of the class. Expenses before reductions do not reflect amounts reimbursed by the investment adviser or reductions from brokerage service arrangements or reductions from other expense offset arrangements and do not represent the amount paid by the class during periods when reimbursements or reductions occur. Expenses net of fee waivers reflect expenses after reimbursement by the investment adviser but prior to reductions from brokerage service arrangements or other expense offset arrangements. Expenses net of all reductions represent the net expenses paid by the class.
J Annualized
K Amount does not include the portfolio activity of any underlying Fidelity Central Funds.
See accompanying notes which are an integral part of the financial statements.
Notes to Financial Statements (Unaudited)
For the period ended June 30, 2019
1. Organization.
VIP Consumer Staples Portfolio (the Fund) is a non-diversified fund of Variable Insurance Products Fund IV (the Trust) and is authorized to issue an unlimited number of shares. The Trust is registered under the Investment Company Act of 1940, as amended (the 1940 Act), as an open-end management investment company organized as a Massachusetts business trust. Shares of the Fund may only be purchased by insurance companies for the purpose of funding variable annuity or variable life insurance contracts. The Fund offers the following classes of shares: Initial Class shares and Investor Class shares. All classes have equal rights and voting privileges, except for matters affecting a single class.
2. Investments in Fidelity Central Funds.
The Fund invests in Fidelity Central Funds, which are open-end investment companies generally available only to other investment companies and accounts managed by the investment adviser and its affiliates. The Fund's Schedule of Investments lists each of the Fidelity Central Funds held as of period end, if any, as an investment of the Fund, but does not include the underlying holdings of each Fidelity Central Fund. As an Investing Fund, the Fund indirectly bears its proportionate share of the expenses of the underlying Fidelity Central Funds.
The Money Market Central Funds seek preservation of capital and current income and are managed by Fidelity Investments Money Management, Inc. (FIMM), an affiliate of the investment adviser. Annualized expenses of the Money Market Central Funds as of their most recent shareholder report date ranged from less than .005% to .01%.
A complete unaudited list of holdings for each Fidelity Central Fund is available upon request or at the Securities and Exchange Commission (the SEC) website at www.sec.gov. In addition, the financial statements of the Fidelity Central Funds are available on the SEC website or upon request.
3. Significant Accounting Policies.
The Fund is an investment company and applies the accounting and reporting guidance of the Financial Accounting Standards Board (FASB) Accounting Standards Codification Topic 946 Financial Services – Investments Companies. The financial statements have been prepared in conformity with accounting principles generally accepted in the United States of America (GAAP), which require management to make certain estimates and assumptions at the date of the financial statements. Actual results could differ from those estimates. Subsequent events, if any, through the date that the financial statements were issued have been evaluated in the preparation of the financial statements. The following summarizes the significant accounting policies of the Fund:
Investment Valuation. Investments are valued as of 4:00 p.m. Eastern time on the last calendar day of the period. The Board of Trustees (the Board) has delegated the day to day responsibility for the valuation of the Fund's investments to the Fair Value Committee (the Committee) established by the Fund's investment adviser. In accordance with valuation policies and procedures approved by the Board, the Fund attempts to obtain prices from one or more third party pricing vendors or brokers to value its investments. When current market prices, quotations or currency exchange rates are not readily available or reliable, investments will be fair valued in good faith by the Committee, in accordance with procedures adopted by the Board. Factors used in determining fair value vary by investment type and may include market or investment specific events. The frequency with which these procedures are used cannot be predicted and they may be utilized to a significant extent. The Committee oversees the Fund's valuation policies and procedures and reports to the Board on the Committee's activities and fair value determinations. The Board monitors the appropriateness of the procedures used in valuing the Fund's investments and ratifies the fair value determinations of the Committee.
The Fund categorizes the inputs to valuation techniques used to value its investments into a disclosure hierarchy consisting of three levels as shown below:
- Level 1 – quoted prices in active markets for identical investments
- Level 2 – other significant observable inputs (including quoted prices for similar investments, interest rates, prepayment speeds, etc.)
- Level 3 – unobservable inputs (including the Fund's own assumptions based on the best information available)
Valuation techniques used to value the Fund's investments by major category are as follows:
Equity securities, including restricted securities, for which market quotations are readily available, are valued at the last reported sale price or official closing price as reported by a third party pricing vendor on the primary market or exchange on which they are traded and are categorized as Level 1 in the hierarchy. In the event there were no sales during the day or closing prices are not available, securities are valued at the last quoted bid price or may be valued using the last available price and are generally categorized as Level 2 in the hierarchy. For foreign equity securities, when market or security specific events arise, comparisons to the valuation of American Depositary Receipts (ADRs), futures contracts, Exchange-Traded Funds (ETFs) and certain indexes as well as quoted prices for similar securities may be used and would be categorized as Level 2 in the hierarchy. For equity securities, including restricted securities, where observable inputs are limited, assumptions about market activity and risk are used and these securities may be categorized as Level 3 in the hierarchy. Equity securities, including restricted securities, for which observable inputs are not available are valued using alternate valuation approaches, including the market approach and the income approach and are categorized as Level 3 in the hierarchy. The market approach generally consists of using comparable market transactions while the income approach generally consists of using the net present value of estimated future cash flows, adjusted as appropriate for liquidity, credit, market and/or other risk factors.
Investments in open-end mutual funds, including the Fidelity Central Funds, are valued at their closing net asset value (NAV) each business day and are categorized as Level 1 in the hierarchy.
The following provides information on Level 3 securities held by the Fund that were valued at period end based on unobservable inputs. These amounts exclude valuations provided by a broker.
| Asset Type | Fair Value | Valuation Technique(s) | Unobservable Input | Amount or Range/Weighted Average | Impact to Valuation from an Increase in Input(a) |
| Equities | $2,499,907 | Market comparable | Enterprise value/Sales multiple (EV/S) | 3.1 | Increase |
| | | | Discount for lack of marketability | 10.0% | Decrease |
| | | | Liquidity preference | $19.60 - $45.76/$35.30 | Increase |
(a) Represents the directional change in the fair value of the Level 3 investments that could have resulted from an increase in the corresponding input as of period end. A decrease to the unobservable input would have had the opposite effect. Significant changes in these inputs may have resulted in a significantly higher or lower fair value measurement at period end.
Changes in valuation techniques may result in transfers in or out of an assigned level within the disclosure hierarchy. The aggregate value of investments by input level as of June 30, 2019, as well as a roll forward of Level 3 investments, is included at the end of the Fund's Schedule of Investments.
Foreign Currency. The Fund may use foreign currency contracts to facilitate transactions in foreign-denominated securities. Gains and losses from these transactions may arise from changes in the value of the foreign currency or if the counterparties do not perform under the contracts' terms.
Foreign-denominated assets, including investment securities, and liabilities are translated into U.S. dollars at the exchange rates at period end. Purchases and sales of investment securities, income and dividends received and expenses denominated in foreign currencies are translated into U.S. dollars at the exchange rate in effect on the transaction date.
The effects of exchange rate fluctuations on investments are included with the net realized and unrealized gain (loss) on investment securities. Other foreign currency transactions resulting in realized and unrealized gain (loss) are disclosed separately.
Investment Transactions and Income. For financial reporting purposes, the Fund's investment holdings and NAV include trades executed through the end of the last business day of the period. The NAV per share for processing shareholder transactions is calculated as of the close of business of the New York Stock Exchange (NYSE), normally 4:00 p.m. Eastern time and includes trades executed through the end of the prior business day. Gains and losses on securities sold are determined on the basis of identified cost and include proceeds received from litigation. Dividend income is recorded on the ex-dividend date, except for certain dividends from foreign securities where the ex-dividend date may have passed, which are recorded as soon as the Fund is informed of the ex-dividend date. Non-cash dividends included in dividend income, if any, are recorded at the fair market value of the securities received. Income and capital gain distributions from Fidelity Central Funds, if any, are recorded on the ex-dividend date. Certain distributions received by the Fund represent a return of capital or capital gain. The Fund determines the components of these distributions subsequent to the ex-dividend date, based upon receipt of tax filings or other correspondence relating to the underlying investment. These distributions are recorded as a reduction of cost of investments and/or as a realized gain. Investment income is recorded net of foreign taxes withheld where recovery of such taxes is uncertain.
Class Allocations and Expenses. Investment income, realized and unrealized capital gains and losses, common expenses of the Fund, and certain fund-level expense reductions, if any, are allocated daily on a pro-rata basis to each class based on the relative net assets of each class to the total net assets of the Fund. Each class differs with respect to transfer agent fees incurred. Certain expense reductions may also differ by class. For the reporting period, the allocated portion of income and expenses to each class as a percent of its average net assets may vary due to the timing of recording these transactions in relation to fluctuating net assets of the classes. Expenses directly attributable to a fund are charged to that fund. Expenses attributable to more than one fund are allocated among the respective funds on the basis of relative net assets or other appropriate methods. Expense estimates are accrued in the period to which they relate and adjustments are made when actual amounts are known.
Income Tax Information and Distributions to Shareholders. Each year, the Fund intends to qualify as a regulated investment company under Subchapter M of the Internal Revenue Code, including distributing substantially all of its taxable income and realized gains. As a result, no provision for U.S. Federal income taxes is required. The Fund files a U.S. federal tax return, in addition to state and local tax returns as required. The Fund's federal income tax returns are subject to examination by the Internal Revenue Service (IRS) for a period of three fiscal years after they are filed. State and local tax returns may be subject to examination for an additional fiscal year depending on the jurisdiction. Foreign taxes are provided for based on the Fund's understanding of the tax rules and rates that exist in the foreign markets in which it invests.
Distributions are declared and recorded on the ex-dividend date. Income and capital gain distributions are declared separately for each class. Income and capital gain distributions are determined in accordance with income tax regulations, which may differ from GAAP.
Capital accounts within the financial statements are adjusted for permanent book-tax differences. These adjustments have no impact on net assets or the results of operations. Capital accounts are not adjusted for temporary book-tax differences which will reverse in a subsequent period.
Book-tax differences are primarily due to foreign currency transactions, certain foreign taxes and losses deferred due to wash sales and excise tax regulations.
As of period end, the cost and unrealized appreciation (depreciation) in securities, and derivatives if applicable, for federal income tax purposes were as follows:
| Gross unrealized appreciation | $55,667,721 |
| Gross unrealized depreciation | (17,269,118) |
| Net unrealized appreciation (depreciation) | $38,398,603 |
| Tax cost | $183,358,395 |
The Fund elected to defer to its next fiscal year approximately $20,642 of capital losses recognized during the period November 1, 2018 to December 31, 2018.
Restricted Securities. The Fund may invest in securities that are subject to legal or contractual restrictions on resale. These securities generally may be resold in transactions exempt from registration or to the public if the securities are registered. Disposal of these securities may involve time-consuming negotiations and expense, and prompt sale at an acceptable price may be difficult. Information regarding restricted securities is included at the end of the Fund's Schedule of Investments.
4. Purchases and Sales of Investments.
Purchases and sales of securities, other than short-term securities, aggregated $52,509,859 and $56,712,924, respectively.
5. Fees and Other Transactions with Affiliates.
Management Fee. Fidelity SelectCo, LLC (the investment adviser) and its affiliates provide the Fund with investment management related services for which the Fund pays a monthly management fee. The management fee is the sum of an individual fund fee rate that is based on an annual rate of .30% of the Fund's average net assets and an annualized group fee rate that averaged .24% during the period. The group fee rate is based upon the average net assets of all the mutual funds advised by Fidelity Management & Research Company (FMR) and the investment adviser. The group fee rate decreases as assets under management increase and increases as assets under management decrease. For the reporting period, the total annualized management fee rate was .54% of the Fund's average net assets.
Transfer Agent Fees. Fidelity Investments Institutional Operations Company, Inc. (FIIOC), an affiliate of the investment adviser, is the Fund's transfer, dividend disbursing, and shareholder servicing agent. FIIOC receives an asset-based fee with respect to each class. Each class pays a fee for transfer agent services, typesetting and printing and mailing of shareholder reports, excluding mailing of proxy statements, equal to an annual rate of class-level average net assets. The annual rate for Investor Class is .15% and the annual rate for all other classes is .07%. For the period, transfer agent fees for each class were as follows:
| Initial Class | $5,870 |
| Investor Class | 139,303 |
| | $145,173 |
Accounting and Security Lending Fees. Fidelity Service Company, Inc. (FSC), an affiliate of the investment adviser, maintains the Fund's accounting records. The accounting fee is based on the level of average net assets for each month. Prior to April 1, 2019, FSC had a separate agreement with the Fund for administration of the security lending program, based on the number and duration of lending transactions. For the period, the total fees paid for accounting and administration of securities lending were equivalent to an annualized rate of .04%.
Brokerage Commissions. The Fund placed a portion of its portfolio transactions with brokerage firms which are affiliates of the investment adviser. Brokerage commissions are included in net realized gain (loss) and change in net unrealized appreciation (depreciation) in the Statement of Operations. The commissions paid to these affiliated firms were $2,153 for the period.
Interfund Trades. The Fund may purchase from or sell securities to other Fidelity Funds under procedures adopted by the Board. The procedures have been designed to ensure these interfund trades are executed in accordance with Rule 17a-7 of the 1940 Act. Interfund trades are included within the respective purchases and sales amounts shown in the Purchases and Sales of Investments note.
6. Committed Line of Credit.
The Fund participates with other funds managed by the investment adviser or an affiliate in a $4.25 billion credit facility (the "line of credit") to be utilized for temporary or emergency purposes to fund shareholder redemptions or for other short-term liquidity purposes. The Fund has agreed to pay commitment fees on its pro-rata portion of the line of credit, which amounted to $294 and is reflected in Miscellaneous expenses on the Statement of Operations. During the period, the Fund did not borrow on this line of credit.
7. Security Lending.
The Fund lends portfolio securities from time to time in order to earn additional income. For equity securities, lending agents are used, including National Financial Services (NFS), an affiliate of the Fund. Pursuant to a securities lending agreement, NFS will receive a fee, which is capped at 9.9% of daily lending revenue, for its services as lending agent. The Fund may lend securities to certain qualified borrowers. On the settlement date of the loan, the Fund receives collateral (in the form of U.S. Treasury obligations, letters of credit and/or cash) against the loaned securities and maintains collateral in an amount not less than 100% of the market value of the loaned securities during the period of the loan. The market value of the loaned securities is determined at the close of business of the Fund and any additional required collateral is delivered to the Fund on the next business day. The Fund or borrower may terminate the loan at any time, and if the borrower defaults on its obligation to return the securities loaned because of insolvency or other reasons, the Fund may apply collateral received from the borrower against the obligation. The Fund may experience delays and costs in recovering the securities loaned. Any cash collateral received is invested in the Fidelity Securities Lending Cash Central Fund. The value of loaned securities and cash collateral at period end are disclosed on the Fund's Statement of Assets and Liabilities. Security lending income represents the income earned on investing cash collateral, less rebates paid to borrowers and any lending agent fees associated with the loan, plus any premium payments received for lending certain types of securities. Security lending income is presented in the Statement of Operations as a component of income from Fidelity Central Funds.
8. Expense Reductions.
Commissions paid to certain brokers with whom the investment adviser, or its affiliates, places trades on behalf of the Fund include an amount in addition to trade execution, which may be rebated back to the Fund to offset certain expenses. This amount totaled $2,219 for the period.
In addition, during the period the investment adviser reimbursed and/or waived a portion of fund-level operating expenses in the amount of $791.
9. Distributions to Shareholders.
Distributions to shareholders of each class were as follows:
| | Six months ended
June 30, 2019 | Year ended
December 31, 2018 |
| Distributions to shareholders | | |
| Initial Class | $683,528 | $2,244,849 |
| Investor Class | 7,342,388 | 20,431,269 |
| Total | $8,025,916 | $22,676,118 |
10. Share Transactions.
Transactions for each class of shares were as follows:
| | Shares | Shares | Dollars | Dollars |
| | Six months ended June 30, 2019 | Year ended December 31, 2018 | Six months ended June 30, 2019 | Year ended December 31, 2018 |
| Initial Class | | | | |
| Shares sold | 65,681 | 72,349 | $1,119,489 | $1,253,500 |
| Reinvestment of distributions | 42,908 | 132,625 | 683,528 | 2,244,849 |
| Shares redeemed | (105,925) | (617,276) | (1,758,790) | (10,591,791) |
| Net increase (decrease) | 2,664 | (412,302) | $44,227 | $(7,093,442) |
| Investor Class | | | | |
| Shares sold | 599,102 | 494,836 | $10,141,468 | $8,484,254 |
| Reinvestment of distributions | 462,950 | 1,216,231 | 7,342,388 | 20,431,269 |
| Shares redeemed | (937,674) | (3,410,323) | (15,447,150) | (58,988,419) |
| Net increase (decrease) | 124,378 | (1,699,256) | $2,036,706 | $(30,072,896) |
11. Other.
The Fund's organizational documents provide former and current trustees and officers with a limited indemnification against liabilities arising in connection with the performance of their duties to the Fund. In the normal course of business, the Fund may also enter into contracts that provide general indemnifications. The Fund's maximum exposure under these arrangements is unknown as this would be dependent on future claims that may be made against the Fund. The risk of material loss from such claims is considered remote.
At the end of the period, the investment adviser or its affiliates were the owners of record of 100% of the total outstanding shares of the Fund.
Shareholder Expense Example
As a shareholder of the Fund, you incur two types of costs: (1) transaction costs and (2) ongoing costs, including management fees and other Fund expenses. This Example is intended to help you understand your ongoing costs (in dollars) of investing in the Fund and to compare these costs with the ongoing costs of investing in other mutual funds.
The Example is based on an investment of $1,000 invested at the beginning of the period and held for the entire period (January 1, 2019 to June 30, 2019).
Actual Expenses
The first line of the accompanying table for each class of the Fund provides information about actual account values and actual expenses. You may use the information in this line, together with the amount you invested, to estimate the expenses that you paid over the period. Simply divide your account value by $1,000.00 (for example, an $8,600 account value divided by $1,000.00 = 8.6), then multiply the result by the number in the first line for a class of the Fund under the heading entitled "Expenses Paid During Period" to estimate the expenses you paid on your account during this period. The estimate of expenses does not include any fees or other expenses of any variable annuity or variable life insurance product. If they were, the estimate of expenses you paid during the period would be higher, and your ending account value would be lower. In addition, the Fund, as a shareholder in the underlying Fidelity Central Funds, will indirectly bear its pro-rata share of the fees and expenses incurred by the underlying Fidelity Central Funds. These fees and expenses are not included in the Fund's annualized expense ratio used to calculate the expense estimate in the table below.
Hypothetical Example for Comparison Purposes
The second line of the accompanying table for each class of the Fund provides information about hypothetical account values and hypothetical expenses based on a Class' actual expense ratio and an assumed rate of return of 5% per year before expenses, which is not the Class' actual return. The hypothetical account values and expenses may not be used to estimate the actual ending account balance or expenses you paid for the period. You may use this information to compare the ongoing costs of investing in the Fund and other funds. To do so, compare this 5% hypothetical example with the 5% hypothetical examples that appear in the shareholder reports of the other funds. The estimate of expenses does not include any fees or other expenses of any variable annuity or variable life insurance product. If they were, the estimate of expenses you paid during the period would be higher, and your ending account value would be lower. In addition, the Fund, as a shareholder in the underlying Fidelity Central Funds, will indirectly bear its pro-rata share of the fees and expenses incurred by the underlying Fidelity Central Funds. These fees and expenses are not included in the Fund's annualized expense ratio used to calculate the expense estimate in the table below.
Please note that the expenses shown in the table are meant to highlight your ongoing costs only and do not reflect any transaction costs. Therefore, the second line of the table is useful in comparing ongoing costs only, and will not help you determine the relative total costs of owning different funds.
| | Annualized Expense Ratio-A | Beginning
Account Value
January 1, 2019 | Ending
Account Value
June 30, 2019 | Expenses Paid
During Period-B
January 1, 2019
to June 30, 2019 |
| Initial Class | .68% | | | |
| Actual | | $1,000.00 | $1,206.20 | $3.72 |
| Hypothetical-C | | $1,000.00 | $1,021.42 | $3.41 |
| Investor Class | .76% | | | |
| Actual | | $1,000.00 | $1,205.50 | $4.16 |
| Hypothetical-C | | $1,000.00 | $1,021.03 | $3.81 |
A Annualized expense ratio reflects expenses net of applicable fee waivers.
B Expenses are equal to each Class' annualized expense ratio, multiplied by the average account value over the period, multiplied by 181/365 (to reflect the one-half year period).
C 5% return per year before expenses
Board Approval of Investment Advisory Contracts and Management Fees
VIP Consumer Staples Portfolio
Each year, the Board of Trustees, including the Independent Trustees (together, the Board), votes on the renewal of the management contract with Fidelity SelectCo, LLC (SelectCo), an affiliate of Fidelity Management & Research Company (FMR), and the sub-advisory agreements with affiliates of FMR (together, the Advisory Contracts) for the fund. SelectCo and the sub-advisers are referred to herein as the Investment Advisers. The Board, assisted by the advice of fund counsel and Independent Trustees' counsel, requests and considers a broad range of information relevant to the renewal of the Advisory Contracts throughout the year.
The Board meets regularly and, at each of its meetings, covers an extensive agenda of topics and materials and considers factors that are relevant to its annual consideration of the renewal of the fund's Advisory Contracts, including the services and support provided to the fund and its shareholders. The Board has established various standing committees (Committees), each composed of and chaired by Independent Trustees with varying backgrounds, to which the Board has assigned specific subject matter responsibilities in order to enhance effective decision-making by the Board. The Board, acting directly and through its Committees, requests and receives information concerning the annual consideration of the renewal of the fund's Advisory Contracts. The Board also meets as needed to review matters specifically related to the Board's annual consideration of the renewal of the Advisory Contracts. Members of the Board may also meet with trustees of other Fidelity funds through joint ad hoc committees to discuss certain matters relevant to all of the Fidelity funds.
At its January 2019 meeting, the Board unanimously determined to renew the fund's Advisory Contracts. In reaching its determination, the Board considered all factors it believed relevant, including (i) the nature, extent, and quality of the services to be provided to the fund and its shareholders (including the investment performance of the fund); (ii) the competitiveness of the fund's management fee and total expense ratio relative to peer funds; (iii) the total costs of the services to be provided by and the profits to be realized by Fidelity from its relationships with the fund; and (iv) the extent to which, if any, economies of scale exist and would be realized as the fund grows, and whether any economies of scale are appropriately shared with fund shareholders.
In considering whether to renew the Advisory Contracts for the fund, the Board reached a determination, with the assistance of fund counsel and Independent Trustees' counsel and through the exercise of its business judgment, that the renewal of the Advisory Contracts was in the best interests of the fund and its shareholders and that the compensation payable under the Advisory Contracts was fair and reasonable. The Board's decision to renew the Advisory Contracts was not based on any single factor, but rather was based on a comprehensive consideration of all the information provided to the Board at its meetings throughout the year. The Board, in reaching its determination to renew the Advisory Contracts, was aware that shareholders of the fund have a broad range of investment choices available to them, including a wide choice among funds offered by Fidelity's competitors, and that the fund's shareholders, who have the opportunity to review and weigh the disclosure provided by the fund in its prospectus and other public disclosures, have chosen to invest in this fund, which is part of the Fidelity family of funds.
Nature, Extent, and Quality of Services Provided. The Board considered Fidelity's staffing as it relates to the fund, including the backgrounds of investment personnel of Fidelity, and also considered the fund's investment objective, strategies, and related investment philosophy. The Independent Trustees also had discussions with senior management of Fidelity's investment operations and investment groups. The Board considered the structure of the investment personnel compensation program and whether this structure provides appropriate incentives to act in the best interests of the fund. Additionally, the Board considered the portfolio managers' investments, if any, in the funds that they manage.
Resources Dedicated to Investment Management and Support Services. The Board and the Fund Oversight and Research Committees reviewed the general qualifications and capabilities of Fidelity's investment staff, including its size, education, experience, and resources, as well as Fidelity's approach to recruiting, training, managing, and compensating investment personnel. The Board noted that Fidelity has continued to increase the resources devoted to non-U.S. offices, including expansion of Fidelity's global investment organization. The Board also noted that Fidelity's analysts have extensive resources, tools and capabilities that allow them to conduct sophisticated quantitative and fundamental analysis, as well as credit analysis of issuers, counterparties and guarantors. Further, the Board considered that Fidelity's investment professionals have sufficient access to global information and data so as to provide competitive investment results over time, and that those professionals also have access to sophisticated tools that permit them to assess portfolio construction and risk and performance attribution characteristics continuously, as well as to transmit new information and research conclusions rapidly around the world. Additionally, in its deliberations, the Board considered Fidelity's trading, risk management, compliance, and technology and operations capabilities and resources, which are integral parts of the investment management process.
Shareholder and Administrative Services. The Board considered (i) the nature, extent, quality, and cost of advisory, administrative, and shareholder services performed by the Investment Advisers and their affiliates under the Advisory Contracts and under separate agreements covering transfer agency, pricing and bookkeeping, and securities lending services for the fund; (ii) the nature and extent of the supervision of third party service providers, principally custodians, subcustodians, and pricing vendors; and (iii) the resources devoted to, and the record of compliance with, the fund's compliance policies and procedures. The Board also reviewed the allocation of fund brokerage, including allocations to brokers affiliated with the Investment Advisers, the use of brokerage commissions to pay fund expenses, and the use of "soft" commission dollars to pay for research services.
The Board noted that the growth of fund assets over time across the complex allows Fidelity to reinvest in the development of services designed to enhance the value and convenience of the Fidelity funds as investment vehicles. These services include 24-hour access to account information and market information through telephone representatives and over the Internet, investor education materials and asset allocation tools, and the expanded availability of Fidelity Investor Centers.
The Board noted that it and the boards of certain other Fidelity funds had formed an ad hoc Committee on Transfer Agency Fees to review the variety of transfer agency fee structures throughout the industry and Fidelity's competitive positioning with respect to industry participants.
Investment in a Large Fund Family. The Board considered the benefits to shareholders of investing in a Fidelity fund, including the benefits of investing in a fund that is part of a large family of funds offering a variety of investment disciplines and providing a large variety of mutual fund investor services. The Board noted that Fidelity had taken, or had made recommendations that resulted in the Fidelity funds taking, a number of actions over the previous year that benefited particular funds, including: (i) continuing to dedicate additional resources to Fidelity's investment research process, which includes meetings with management of issuers of securities in which the funds invest, and to the support of the senior management team that oversees asset management; (ii) continuing efforts to enhance Fidelity's global research capabilities; (iii) launching new funds and making other enhancements to meet client needs; (iv) launching new share classes of existing funds; (v) eliminating purchase minimums and broadening eligibility requirements for certain funds and share classes; (vi) reducing management fees and total expenses for certain growth equity funds and index funds; (vii) lowering expense caps for certain existing funds and classes, and converting certain voluntary expense caps to contractual caps, to reduce expenses borne by shareholders; (viii) eliminating short-term redemption fees for funds that had such fees; (ix) rationalizing product lines and gaining increased efficiencies from fund mergers and share class consolidations; (x) continuing to develop, acquire and implement systems and technology to improve services to the funds and shareholders, strengthen information security, and increase efficiency; and (xi) continuing to implement enhancements to further strengthen Fidelity's product line to increase investors' probability of success in achieving their investment goals, including retirement income goals.
Investment Performance. The Board considered whether the fund has operated in accordance with its investment objective, as well as its record of compliance with its investment restrictions and its performance history.
The Board took into account discussions that occur at Board meetings throughout the year with representatives of the Investment Advisers about fund investment performance. In this regard the Board noted that as part of regularly scheduled fund reviews and other reports to the Board on fund performance, the Board considers annualized return information for the fund for different time periods, measured against an appropriate securities market index ("benchmark index"). In its evaluation of fund investment performance, the Board gave particular attention to information indicating changes in performance of certain Fidelity funds for specific time periods and discussed with the Investment Advisers the reasons for any overperformance or underperformance.
In addition to reviewing absolute and relative fund performance, the Independent Trustees periodically consider the appropriateness of fund performance metrics in evaluating the results achieved. In general, the Independent Trustees believe that fund performance should be evaluated based on net performance (after fees and expenses) of both the highest performing and lowest performing fund share classes, where applicable, compared to appropriate benchmark indices, over appropriate time periods that may include full market cycles, taking into account relevant factors including the following: general market conditions; issuer-specific information; and fund cash flows and other factors.
The Independent Trustees recognize that shareholders evaluate performance on a net basis over their own holding periods, for which one-, three-, and five-year periods are often used as a proxy. For this reason, the performance information reviewed by the Board also included net cumulative total return information for the fund and an appropriate benchmark index for the most recent one-, three-, and five-year periods ended June 30, 2018, as shown below.
VIP Consumer Staples Portfolio

The Board considered the fund's underperformance for different time periods based on the June 30, 2018 data presented above. The Board's discussions with SelectCo regarding underperformance cover topics including, but not limited to: the longer-term track record of a fund's portfolio manager(s); broader trends in the market that may adversely impact a fund's performance; attribution reports on contributors to the fund's underperformance; and the applicable portfolio manager's explanation of his or her underperformance. The Board engages with SelectCo on steps that might be taken to address a fund's underperformance.
Based on its review, the Board concluded that the nature, extent, and quality of services provided to the fund under the Advisory Contracts should continue to benefit the shareholders of the fund.
Competitiveness of Management Fee and Total Expense Ratio. The Board considered the fund's management fee and total expense ratio compared to "mapped groups" of competitive funds and classes created for the purpose of facilitating the Trustees' competitive analysis of management fees and total expenses. Fidelity creates "mapped groups" by combining similar Lipper investment objective categories that have comparable investment mandates. For this purpose, all sector focused equity variable annuity funds are grouped in the same mapped group. Combining Lipper investment objective categories aids the Board's management fee and total expense ratio comparisons by broadening the competitive group used for comparison.
Management Fee. The Board considered two proprietary management fee comparisons for the 12-month periods ended June 30 shown in basis points (BP) in the chart below. The group of Lipper funds used by the Board for management fee comparisons is referred to below as the "Total Mapped Group." The Total Mapped Group comparison focuses on a fund's standing in terms of gross management fees before expense reimbursements or caps relative to the total universe of funds with comparable investment mandates (i.e., sector equities), regardless of whether their management fee structures also are comparable. Funds with comparable management fee structures have similar management fee contractual arrangements (
e.g., flat rate charged for advisory services, all-inclusive fee rate,
etc.). "TMG %" represents the percentage of funds in the Total Mapped Group that had management fees that were lower than the fund's. For example, a hypothetical TMG % of 20% would mean that 80% of the funds in the Total Mapped Group had higher, and 20% had lower, management fees than the fund. The fund's actual TMG %s and the number of funds in the Total Mapped Group are in the chart below. The "Asset-Size Peer Group" (ASPG) comparison focuses on a fund's standing relative to a subset of non-Fidelity funds within the Total Mapped Group that are similar in size and management fee structure. For example, if a fund is in the first quartile of the ASPG, the fund's management fee ranks in the least expensive or lowest 25% of funds in the ASPG. The ASPG represents at least 15% of the funds in the Total Mapped Group with comparable asset size and management fee structures, subject to a minimum of 50 funds (or all funds in the Total Mapped Group if fewer than 50). Additional information, such as the ASPG quartile in which the fund's management fee rate ranked, is also included in the chart and was considered by the Board.
VIP Consumer Staples Portfolio
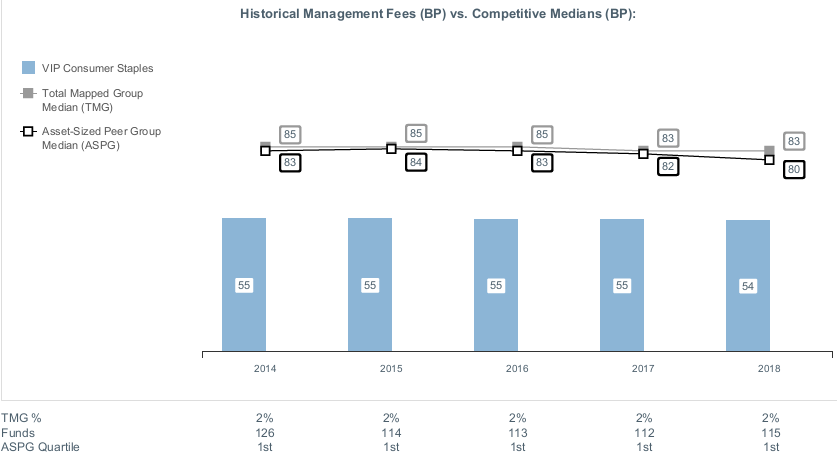
The Board noted that the fund's management fee rate ranked below the median of its Total Mapped Group and below the median of its ASPG for the 12-month period ended June 30, 2018.
The Board noted that it and the boards of other Fidelity funds formed an ad hoc Committee on Group Fee, which meets periodically, to conduct an in-depth review of the "group fee" component of the management fee of funds with such management fee structures. The Committee's focus included the mechanics of the group fee, the competitive landscape of group fee structures, Fidelity funds with no group fee component and investment products not included in group fee assets. The Board also considered that, for funds subject to the group fee, FMR agreed to voluntarily waive fees over a specified period of time in amounts designed to account for assets converted from certain funds to certain collective investment trusts.
Based on its review, the Board concluded that the fund's management fee is fair and reasonable in light of the services that the fund receives and the other factors considered.
Total Expense Ratio. In its review of each class's total expense ratio, the Board considered the fund's management fee rate as well as other fund or class expenses, as applicable, such as transfer agent fees, pricing and bookkeeping fees, and custodial, legal, and audit fees. The Board also noted that Fidelity may agree to waive fees and expenses from time to time, and the extent to which, if any, it has done so for the fund. As part of its review, the Board also considered the current and historical total expense ratios of each class of the fund compared to competitive fund median expenses. Each class of the fund is compared to those funds and classes in the Total Mapped Group (used by the Board for management fee comparisons) that have a similar sales load structure.
The Board noted that the total expense ratio of each class ranked below the competitive median for the 12-month period ended June 30, 2018.
Fees Charged to Other Fidelity Clients. The Board also considered Fidelity fee structures and other information with respect to clients of Fidelity, such as other funds advised or subadvised by Fidelity, pension plan clients, and other institutional clients with similar mandates. The Board noted that a joint ad hoc committee created by it and the boards of other Fidelity funds periodically reviews and compares Fidelity's institutional investment advisory business with its business of providing services to the Fidelity funds, and also noted the most recent findings of the committee. The Board noted that the committee's review included a consideration of the differences in services provided, fees charged, and costs incurred, as well as competition in the markets serving the different categories of clients.
Based on its review of total expense ratios and fees charged to other Fidelity clients, the Board concluded that the total expense ratio of each class of the fund was reasonable in light of the services that the fund and its shareholders receive and the other factors considered.
Costs of the Services and Profitability. The Board considered the revenues earned and the expenses incurred by Fidelity in conducting the business of developing, marketing, distributing, managing, administering and servicing the fund and servicing the fund's shareholders. The Board also considered the level of Fidelity's profits in respect of all the Fidelity funds.
On an annual basis, Fidelity presents to the Board information about the profitability of its relationships with the fund. Fidelity calculates profitability information for each fund, as well as aggregate profitability information for groups of Fidelity funds and all Fidelity funds, using a series of detailed revenue and cost allocation methodologies which originate with the books and records of Fidelity on which Fidelity's audited financial statements are based. The Audit Committee of the Board reviews any significant changes from the prior year's methodologies.
PricewaterhouseCoopers LLP (PwC), auditor to Fidelity and certain Fidelity funds, has been engaged annually by the Board as part of the Board's assessment of Fidelity's profitability analysis. PwC's engagement includes the review and assessment of the methodologies used by Fidelity in determining the revenues and expenses attributable to Fidelity's mutual fund business, and completion of agreed-upon procedures in respect of the mathematical accuracy of the fund profitability information and its conformity to established allocation methodologies. After considering PwC's reports issued under the engagement and information provided by Fidelity, the Board concluded that while other allocation methods may also be reasonable, Fidelity's profitability methodologies are reasonable in all material respects.
The Board also reviewed Fidelity's non-fund businesses and potential indirect benefits such businesses may have received as a result of their association with Fidelity's mutual fund business (i.e., fall-out benefits) as well as cases where Fidelity's affiliates may benefit from the fund's business. The Board noted that changes to fall-out benefits year-over-year reflect business developments at Fidelity's various businesses.
The Board considered the costs of the services provided by and the profits realized by Fidelity in connection with the operation of the fund and was satisfied that the profitability was not excessive.
Economies of Scale. The Board considered whether there have been economies of scale in respect of the management of the Fidelity funds, whether the Fidelity funds (including the fund) have appropriately benefited from any such economies of scale, and whether there is potential for realization of any further economies of scale. The Board considered the extent to which the fund will benefit from economies of scale as assets grow through increased services to the fund, through waivers or reimbursements, or through fee or expense ratio reductions. The Board also noted that a committee (the Economies of Scale Committee) created by it and the boards of other Fidelity funds periodically analyzes whether Fidelity attains economies of scale in respect of the management and servicing of the Fidelity funds, whether the Fidelity funds have appropriately benefited from such economies of scale, and whether there is potential for realization of any further economies of scale.
The Board recognized that the fund's management contract incorporates a "group fee" structure, which provides for lower group fee rates as total group assets increase, and for higher group fee rates as total group assets decrease (with "group assets" defined to include fund assets under SelectCo's management plus assets under FMR's management). SelectCo calculates the group fee rates based on a tiered asset "breakpoint" schedule that varies based on asset class. The Board considered that the group fee is designed to deliver the benefits of economies of scale to fund shareholders when total group assets increase, even if assets of any particular fund are unchanged or have declined, because some portion of Fidelity's costs are attributable to services provided to all Fidelity funds, and all funds benefit if those costs can be allocated among more assets. The Board concluded that, given the group fee structure, fund shareholders will benefit from lower management fees as group assets increase at the fund complex level, regardless of whether Fidelity achieves any such economies of scale.
The Board concluded, taking into account the analysis of the Economies of Scale Committee, that economies of scale, if any, are being appropriately shared between fund shareholders and Fidelity.
Additional Information Requested by the Board. In order to develop fully the factual basis for consideration of the Fidelity funds' advisory contracts, the Board requested and received additional information on certain topics, including: (i) fund performance trends, in particular the underperformance of certain funds, and Fidelity's long-term strategies for certain funds; (ii) Fidelity's fund profitability methodology, profitability trends for certain funds, and the impact of certain factors on fund profitability results; (iii) metrics for evaluating index fund and ETF performance and information about ETF trading characteristics; (iv) the methodology with respect to the evaluation of competitive fund data and peer group classifications and fee comparisons; (v) the expense structures for different funds and classes; (vi) information regarding other accounts managed by Fidelity, including collective investment trusts; and (vii) Fidelity's philosophies and strategies for evaluating funds and classes with lower or declining asset levels.
Based on its evaluation of all of the conclusions noted above, and after considering all factors it believed relevant, the Board concluded that the advisory fee arrangements are fair and reasonable, and that the fund's Advisory Contracts should be renewed.
VCSP-SANN-0819
1.850997.112
Fidelity® Variable Insurance Products: Materials Portfolio
Semi-Annual Report June 30, 2019 |
|
Beginning on January 1, 2021, as permitted by regulations adopted by the Securities and Exchange Commission, and if your insurance carrier elects to participate, you may not be receiving paper copies of the Fund’s shareholder reports from the insurance company that offers your variable insurance product unless you specifically request paper copies from your financial professional or the administrator of your variable insurance product. Instead, the reports will be made available on a website, and you will be notified by mail each time a report is posted and provided with a website link to access the report.
If you already elected to receive shareholder reports electronically, you will not be affected by this change and you need not take any action. You may elect to receive shareholder reports and other communications from the Fund electronically, by contacting your financial professional or the administrator of your variable insurance product. If you own a Fidelity-administered variable insurance product, please visit fidelity.com/mailpreferences to make your election or call 1-800-343-3548.
You may elect to receive all future reports in paper free of charge. If you wish to continue receiving paper copies of your shareholder reports, you may contact your financial professional or the administrator of your variable insurance product. If you own a Fidelity-administered variable insurance product, please visit fidelity.com/mailpreferences to make your election or call 1-800-343-3548. Your election to receive reports in paper will apply to all funds available under your variable insurance product.
Contents
To view a fund's proxy voting guidelines and proxy voting record for the 12-month period ended June 30, visit http://www.fidelity.com/proxyvotingresults or visit the Securities and Exchange Commission's (SEC) web site at http://www.sec.gov.
You may also call 1-877-208-0098 to request a free copy of the proxy voting guidelines.
Fidelity® Variable Insurance Products are separate account options which are purchased through a variable insurance contract.
Standard & Poor's, S&P and S&P 500 are registered service marks of The McGraw-Hill Companies, Inc. and have been licensed for use by Fidelity Distributors Corporation.
Other third-party marks appearing herein are the property of their respective owners.
All other marks appearing herein are registered or unregistered trademarks or service marks of FMR LLC or an affiliated company. © 2019 FMR LLC. All rights reserved.
This report and the financial statements contained herein are submitted for the general information of the shareholders of the Fund. This report is not authorized for distribution to prospective investors in the Fund unless preceded or accompanied by an effective prospectus.
A fund files its complete schedule of portfolio holdings with the SEC for the first and third quarters of each fiscal year on Form N-PORT. Forms N-PORT are available on the SEC’s web site at http://www.sec.gov. A fund's Forms N-PORT may be reviewed and copied at the SEC’s Public Reference Room in Washington, DC. Information regarding the operation of the SEC's Public Reference Room may be obtained by calling 1-800-SEC-0330.
For a complete list of a fund's portfolio holdings, view the most recent holdings listing, semiannual report, or annual report on Fidelity's web site at http://www.fidelity.com, http://www.institutional.fidelity.com, or http://www.401k.com, as applicable.
NOT FDIC INSURED •MAY LOSE VALUE •NO BANK GUARANTEE
Neither the Fund nor Fidelity Distributors Corporation is a bank.
Investment Summary (Unaudited)
Top Ten Stocks as of June 30, 2019
| | % of fund's net assets |
| Linde PLC | 13.4 |
| DowDuPont, Inc. | 10.5 |
| Air Products & Chemicals, Inc. | 6.6 |
| Olin Corp. | 6.2 |
| The Chemours Co. LLC | 5.1 |
| Corteva, Inc. | 4.7 |
| Sherwin-Williams Co. | 4.5 |
| Ecolab, Inc. | 3.8 |
| International Flavors & Fragrances, Inc. | 3.6 |
| Vulcan Materials Co. | 3.6 |
| | 62.0 |
Top Industries (% of fund's net assets)
| As of June 30, 2019 |
| | Chemicals | 69.3% |
| | Containers & Packaging | 11.3% |
| | Construction Materials | 7.0% |
| | Pharmaceuticals | 4.7% |
| | Metals & Mining | 4.3% |
| | All Others* | 3.4% |

* Includes short-term investments and net other assets (liabilities).
Schedule of Investments June 30, 2019 (Unaudited)
Showing Percentage of Net Assets
| Common Stocks - 98.9% | | | |
| | | Shares | Value |
| Chemicals - 68.2% | | | |
| Commodity Chemicals - 9.9% | | | |
| Cabot Corp. | | 9,000 | $429,390 |
| LyondellBasell Industries NV Class A | | 5,516 | 475,093 |
| Olin Corp. | | 145,546 | 3,188,913 |
| Orion Engineered Carbons SA | | 19,800 | 423,918 |
| Westlake Chemical Corp. | | 8,157 | 566,585 |
| | | | 5,083,899 |
| Diversified Chemicals - 19.1% | | | |
| Dow, Inc. (a) | | 21,814 | 1,075,648 |
| DowDuPont, Inc. | | 71,499 | 5,367,430 |
| Hexion U.S. Finance Corp. (b)(c) | | 4,853 | 69,962 |
| Ingevity Corp. (a) | | 6,500 | 683,605 |
| The Chemours Co. LLC | | 107,490 | 2,579,760 |
| | | | 9,776,405 |
| Fertilizers & Agricultural Chemicals - 1.2% | | | |
| CF Industries Holdings, Inc. | | 13,100 | 611,901 |
| Industrial Gases - 20.0% | | | |
| Air Products & Chemicals, Inc. | | 14,900 | 3,372,913 |
| Linde PLC | | 34,030 | 6,833,225 |
| | | | 10,206,138 |
| Specialty Chemicals - 18.0% | | | |
| Ecolab, Inc. | | 9,900 | 1,954,656 |
| Element Solutions, Inc. (a) | | 37,600 | 388,784 |
| International Flavors & Fragrances, Inc. (d) | | 12,600 | 1,828,134 |
| PolyOne Corp. | | 4,700 | 147,533 |
| Sherwin-Williams Co. | | 5,000 | 2,291,450 |
| Tronox Holdings PLC | | 141,780 | 1,811,948 |
| W.R. Grace & Co. | | 10,400 | 791,544 |
| | | | 9,214,049 |
|
| TOTAL CHEMICALS | | | 34,892,392 |
|
| Commercial Services & Supplies - 1.0% | | | |
| Environmental & Facility Services - 1.0% | | | |
| Waste Connection, Inc. (United States) | | 5,300 | 506,574 |
| Construction Materials - 7.0% | | | |
| Construction Materials - 7.0% | | | |
| Martin Marietta Materials, Inc. | | 7,000 | 1,610,770 |
| Summit Materials, Inc. (a) | | 6,600 | 127,050 |
| Vulcan Materials Co. | | 13,300 | 1,826,223 |
| | | | 3,564,043 |
| Containers & Packaging - 11.3% | | | |
| Metal & Glass Containers - 8.6% | | | |
| Aptargroup, Inc. | | 10,000 | 1,243,400 |
| Ball Corp. | | 20,000 | 1,399,800 |
| Crown Holdings, Inc. (a) | | 28,739 | 1,755,953 |
| | | | 4,399,153 |
| Paper Packaging - 2.7% | | | |
| Avery Dennison Corp. | | 11,800 | 1,365,024 |
|
| TOTAL CONTAINERS & PACKAGING | | | 5,764,177 |
|
| Metals & Mining - 4.3% | | | |
| Gold - 4.3% | | | |
| Newmont Goldcorp Corp. | | 47,300 | 1,819,631 |
| Royal Gold, Inc. | | 3,800 | 389,462 |
| | | | 2,209,093 |
| Pharmaceuticals - 4.7% | | | |
| Pharmaceuticals - 4.7% | | | |
| Corteva, Inc. | | 82,299 | 2,433,581 |
| Trading Companies & Distributors - 2.4% | | | |
| Trading Companies & Distributors - 2.4% | | | |
| Univar, Inc. (a) | | 57,000 | 1,256,280 |
| TOTAL COMMON STOCKS | | | |
| (Cost $46,183,103) | | | 50,626,140 |
| | | Principal Amount | Value |
|
| Nonconvertible Bonds - 1.1% | | | |
| Chemicals - 1.1% | | | |
| Diversified Chemicals - 1.1% | | | |
| Hexion U.S. Finance Corp. 6.625% 4/15/20(e) | | | |
| (Cost $560,475) | | 705,000 | 546,375 |
| | | Shares | Value |
|
| Money Market Funds - 1.7% | | | |
| Fidelity Securities Lending Cash Central Fund 2.42% (f)(g) | | | |
| (Cost $900,634) | | 900,544 | 900,634 |
| TOTAL INVESTMENT IN SECURITIES - 101.7% | | | |
| (Cost $47,644,212) | | | 52,073,149 |
| NET OTHER ASSETS (LIABILITIES) - (1.7)% | | | (887,902) |
| NET ASSETS - 100% | | | $51,185,247 |
Legend
(a) Non-income producing
(b) Security or a portion of the security purchased on a delayed delivery or when-issued basis.
(c) Level 3 security
(d) Security or a portion of the security is on loan at period end.
(e) Non-income producing - Security is in default.
(f) Affiliated fund that is generally available only to investment companies and other accounts managed by Fidelity Investments. The rate quoted is the annualized seven-day yield of the fund at period end. A complete unaudited listing of the fund's holdings as of its most recent quarter end is available upon request. In addition, each Fidelity Central Fund's financial statements are available on the SEC's website or upon request.
(g) Investment made with cash collateral received from securities on loan.
Affiliated Central Funds
Information regarding fiscal year to date income earned by the Fund from investments in Fidelity Central Funds is as follows:
| Fund | Income earned |
| Fidelity Cash Central Fund | $1,108 |
| Fidelity Securities Lending Cash Central Fund | 1,925 |
| Total | $3,033 |
Amounts in the income column in the above table include any capital gain distributions from underlying funds, which are presented in the corresponding line-item in the Statement of Operations, if applicable. Amount for Fidelity Securities Lending Cash Central Fund represents securities lending income earned from the reinvestment of cash collateral from loaned securities, net of payments to and from borrowers of securities.
Investment Valuation
The following is a summary of the inputs used, as of June 30, 2019, involving the Fund's assets and liabilities carried at fair value. The inputs or methodology used for valuing securities may not be an indication of the risk associated with investing in those securities. For more information on valuation inputs, and their aggregation into the levels used below, please refer to the Investment Valuation section in the accompanying Notes to Financial Statements.
| | Valuation Inputs at Reporting Date: |
| Description | Total | Level 1 | Level 2 | Level 3 |
| Investments in Securities: | | | | |
| Common Stocks | $50,626,140 | $50,556,178 | $-- | $69,962 |
| Nonconvertible Bonds | 546,375 | -- | 546,375 | -- |
| Money Market Funds | 900,634 | 900,634 | -- | -- |
| Total Investments in Securities: | $52,073,149 | $51,456,812 | $546,375 | $69,962 |
Other Information
Distribution of investments by country or territory of incorporation, as a percentage of Total Net Assets, is as follows (Unaudited):
| United States of America | 80.4% |
| Ireland | 13.4% |
| United Kingdom | 3.5% |
| Canada | 1.0% |
| Others (Individually Less Than 1%) | 1.7% |
| | 100.0% |
See accompanying notes which are an integral part of the financial statements.
Financial Statements
Statement of Assets and Liabilities
| | | June 30, 2019 (Unaudited) |
| Assets | | |
Investment in securities, at value (including securities loaned of $892,013) — See accompanying schedule:
Unaffiliated issuers (cost $46,743,578) | $51,172,515 | |
| Fidelity Central Funds (cost $900,634) | 900,634 | |
| Total Investment in Securities (cost $47,644,212) | | $52,073,149 |
| Receivable for investments sold | | 1,334,737 |
| Receivable for fund shares sold | | 3,023 |
| Dividends receivable | | 47,031 |
| Distributions receivable from Fidelity Central Funds | | 175 |
| Prepaid expenses | | 673 |
| Other receivables | | 543 |
| Total assets | | 53,459,331 |
| Liabilities | | |
| Payable to custodian bank | $121,563 | |
| Payable for investments purchased | | |
| Regular delivery | 1,125,217 | |
| Delayed delivery | 63,089 | |
| Payable for fund shares redeemed | 10,441 | |
| Accrued management fee | 22,517 | |
| Other affiliated payables | 7,067 | |
| Other payables and accrued expenses | 23,508 | |
| Collateral on securities loaned | 900,682 | |
| Total liabilities | | 2,274,084 |
| Net Assets | | $51,185,247 |
| Net Assets consist of: | | |
| Paid in capital | | $46,815,371 |
| Total distributable earnings (loss) | | 4,369,876 |
| Net Assets | | $51,185,247 |
| Net Asset Value and Maximum Offering Price | | |
| Initial Class: | | |
| Net Asset Value, offering price and redemption price per share ($9,828,466 ÷ 834,213 shares) | | $11.78 |
| Investor Class: | | |
| Net Asset Value, offering price and redemption price per share ($41,356,781 ÷ 3,512,760 shares) | | $11.77 |
See accompanying notes which are an integral part of the financial statements.
Statement of Operations
| | | Six months ended June 30, 2019 (Unaudited) |
| Investment Income | | |
| Dividends | | $610,754 |
| Income from Fidelity Central Funds (including $1,925 from security lending) | | 3,033 |
| Total income | | 613,787 |
| Expenses | | |
| Management fee | $144,719 | |
| Transfer agent fees | 34,978 | |
| Accounting and security lending fees | 10,488 | |
| Custodian fees and expenses | 4,028 | |
| Independent trustees' fees and expenses | 131 | |
| Audit | 20,754 | |
| Legal | 42 | |
| Miscellaneous | 284 | |
| Total expenses before reductions | 215,424 | |
| Expense reductions | (2,278) | |
| Total expenses after reductions | | 213,146 |
| Net investment income (loss) | | 400,641 |
| Realized and Unrealized Gain (Loss) | | |
| Net realized gain (loss) on: | | |
| Investment securities: | | |
| Unaffiliated issuers | (174,961) | |
| Fidelity Central Funds | (48) | |
| Foreign currency transactions | 2,303 | |
| Total net realized gain (loss) | | (172,706) |
| Change in net unrealized appreciation (depreciation) on: | | |
| Investment securities: | | |
| Unaffiliated issuers | 6,005,783 | |
| Assets and liabilities in foreign currencies | (113) | |
| Total change in net unrealized appreciation (depreciation) | | 6,005,670 |
| Net gain (loss) | | 5,832,964 |
| Net increase (decrease) in net assets resulting from operations | | $6,233,605 |
See accompanying notes which are an integral part of the financial statements.
Statement of Changes in Net Assets
| | Six months ended June 30, 2019 (Unaudited) | Year ended December 31, 2018 |
| Increase (Decrease) in Net Assets | | |
| Operations | | |
| Net investment income (loss) | $400,641 | $960,216 |
| Net realized gain (loss) | (172,706) | 4,273,157 |
| Change in net unrealized appreciation (depreciation) | 6,005,670 | (23,387,385) |
| Net increase (decrease) in net assets resulting from operations | 6,233,605 | (18,154,012) |
| Distributions to shareholders | (4,654,214) | (6,273,404) |
| Share transactions - net increase (decrease) | (2,569,281) | (20,735,414) |
| Total increase (decrease) in net assets | (989,890) | (45,162,830) |
| Net Assets | | |
| Beginning of period | 52,175,137 | 97,337,967 |
| End of period | $51,185,247 | $52,175,137 |
See accompanying notes which are an integral part of the financial statements.
Financial Highlights
VIP Materials Portfolio Initial Class
| | Six months ended (Unaudited) June 30, | Years endedDecember 31, | | | | |
| | 2019 | 2018 | 2017 | 2016 | 2015 | 2014 |
| Selected Per–Share Data | | | | | | |
| Net asset value, beginning of period | $11.46 | $16.18 | $13.16 | $12.18 | $14.84 | $15.53 |
| Income from Investment Operations | | | | | | |
| Net investment income (loss)A | .09 | .18 | .15 | .17 | .17 | .15 |
| Net realized and unrealized gain (loss) | 1.28 | (3.83) | 3.25 | 1.23 | (1.33) | (.09) |
| Total from investment operations | 1.37 | (3.65) | 3.40 | 1.40 | (1.16) | .06 |
| Distributions from net investment income | (.05) | (.21) | (.13) | (.11) | (.19) | (.15) |
| Distributions from net realized gain | (1.00) | (.86) | (.25) | (.31) | (1.32) | (.60) |
| Total distributions | (1.05) | (1.07) | (.38) | (.42) | (1.50)B | (.75) |
| Redemption fees added to paid in capitalA | – | – | –C | –C | –C | –C |
| Net asset value, end of period | $11.78 | $11.46 | $16.18 | $13.16 | $12.18 | $14.84 |
| Total ReturnD,E,F | 12.41% | (23.60)% | 26.08% | 12.20% | (9.01)% | .37% |
| Ratios to Average Net AssetsG,H | | | | | | |
| Expenses before reductions | .74%I | .72% | .73% | .77% | .75% | .75% |
| Expenses net of fee waivers, if any | .74%I | .72% | .73% | .77% | .75% | .74% |
| Expenses net of all reductions | .73%I | .71% | .72% | .76% | .75% | .73% |
| Net investment income (loss) | 1.56%I | 1.26% | 1.05% | 1.37% | 1.23% | 1.00% |
| Supplemental Data | | | | | | |
| Net assets, end of period (000 omitted) | $9,828 | $9,728 | $19,126 | $12,726 | $11,432 | $17,469 |
| Portfolio turnover rateJ | 71%I | 87% | 64% | 56% | 68% | 78% |
A Calculated based on average shares outstanding during the period.
B Total distributions of $1.50 per share is comprised of distributions from net investment income of $.185 and distributions from net realized gain of $1.319 per share.
C Amount represents less than $.005 per share.
D Total returns for periods of less than one year are not annualized.
E Total returns do not reflect charges attributable to your insurance company's separate account. Inclusion of these charges would reduce the total returns shown.
F Total returns would have been lower if certain expenses had not been reduced during the applicable periods shown.
G Fees and expenses of any underlying Fidelity Central Funds are not included in the Fund's expense ratio. The Fund indirectly bears its proportionate share of the expenses of any underlying Fidelity Central Funds.
H Expense ratios reflect operating expenses of the class. Expenses before reductions do not reflect amounts reimbursed by the investment adviser or reductions from brokerage service arrangements or reductions from other expense offset arrangements and do not represent the amount paid by the class during periods when reimbursements or reductions occur. Expenses net of fee waivers reflect expenses after reimbursement by the investment adviser but prior to reductions from brokerage service arrangements or other expense offset arrangements. Expenses net of all reductions represent the net expenses paid by the class.
I Annualized
J Amount does not include the portfolio activity of any underlying Fidelity Central Funds.
See accompanying notes which are an integral part of the financial statements.
VIP Materials Portfolio Investor Class
| | Six months ended (Unaudited) June 30, | Years endedDecember 31, | | | | |
| | 2019 | 2018 | 2017 | 2016 | 2015 | 2014 |
| Selected Per–Share Data | | | | | | |
| Net asset value, beginning of period | $11.46 | $16.17 | $13.15 | $12.18 | $14.84 | $15.53 |
| Income from Investment Operations | | | | | | |
| Net investment income (loss)A | .09 | .17 | .14 | .16 | .16 | .14 |
| Net realized and unrealized gain (loss) | 1.27 | (3.82) | 3.25 | 1.23 | (1.33) | (.09) |
| Total from investment operations | 1.36 | (3.65) | 3.39 | 1.39 | (1.17) | .05 |
| Distributions from net investment income | (.05) | (.20) | (.12) | (.11) | (.17) | (.14) |
| Distributions from net realized gain | (1.00) | (.86) | (.25) | (.31) | (1.32) | (.60) |
| Total distributions | (1.05) | (1.06) | (.37) | (.42) | (1.49) | (.74) |
| Redemption fees added to paid in capitalA | – | – | –B | –B | –B | –B |
| Net asset value, end of period | $11.77 | $11.46 | $16.17 | $13.15 | $12.18 | $14.84 |
| Total ReturnC,D,E | 12.32% | (23.65)% | 26.02% | 12.06% | (9.09)% | .32% |
| Ratios to Average Net AssetsF,G | | | | | | |
| Expenses before reductions | .82%H | .80% | .81% | .85% | .83% | .82% |
| Expenses net of fee waivers, if any | .82%H | .80% | .81% | .85% | .83% | .81% |
| Expenses net of all reductions | .81%H | .79% | .80% | .85% | .82% | .81% |
| Net investment income (loss) | 1.48%H | 1.18% | .97% | 1.29% | 1.16% | .93% |
| Supplemental Data | | | | | | |
| Net assets, end of period (000 omitted) | $41,357 | $42,448 | $78,212 | $52,786 | $39,807 | $54,837 |
| Portfolio turnover rateI | 71%H | 87% | 64%�� | 56% | 68% | 78% |
A Calculated based on average shares outstanding during the period.
B Amount represents less than $.005 per share.
C Total returns for periods of less than one year are not annualized.
D Total returns do not reflect charges attributable to your insurance company's separate account. Inclusion of these charges would reduce the total returns shown.
E Total returns would have been lower if certain expenses had not been reduced during the applicable periods shown.
F Fees and expenses of any underlying Fidelity Central Funds are not included in the Fund's expense ratio. The Fund indirectly bears its proportionate share of the expenses of any underlying Fidelity Central Funds.
G Expense ratios reflect operating expenses of the class. Expenses before reductions do not reflect amounts reimbursed by the investment adviser or reductions from brokerage service arrangements or reductions from other expense offset arrangements and do not represent the amount paid by the class during periods when reimbursements or reductions occur. Expenses net of fee waivers reflect expenses after reimbursement by the investment adviser but prior to reductions from brokerage service arrangements or other expense offset arrangements. Expenses net of all reductions represent the net expenses paid by the class.
H Annualized
I Amount does not include the portfolio activity of any underlying Fidelity Central Funds.
See accompanying notes which are an integral part of the financial statements.
Notes to Financial Statements (Unaudited)
For the period ended June 30, 2019
1. Organization.
VIP Materials Portfolio (the Fund) is a non-diversified fund of Variable Insurance Products Fund IV (the Trust) and is authorized to issue an unlimited number of shares. The Trust is registered under the Investment Company Act of 1940, as amended (the 1940 Act), as an open-end management investment company organized as a Massachusetts business trust. Shares of the Fund may only be purchased by insurance companies for the purpose of funding variable annuity or variable life insurance contracts. The Fund offers the following classes of shares: Initial Class shares, and Investor Class shares. All classes have equal rights and voting privileges, except for matters affecting a single class.
2. Investments in Fidelity Central Funds.
The Fund invests in Fidelity Central Funds, which are open-end investment companies generally available only to other investment companies and accounts managed by the investment adviser and its affiliates. The Fund's Schedule of Investments lists each of the Fidelity Central Funds held as of period end, if any, as an investment of the Fund, but does not include the underlying holdings of each Fidelity Central Fund. As an Investing Fund, the Fund indirectly bears its proportionate share of the expenses of the underlying Fidelity Central Funds.
The Money Market Central Funds seek preservation of capital and current income and are managed by Fidelity Investments Money Management, Inc. (FIMM), an affiliate of the investment adviser. Annualized expenses of the Money Market Central Funds as of their most recent shareholder report date ranged from less than .005% to .01%.
A complete unaudited list of holdings for each Fidelity Central Fund is available upon request or at the Securities and Exchange Commission (the SEC) website at www.sec.gov. In addition, the financial statements of the Fidelity Central Funds are available on the SEC website or upon request.
3. Significant Accounting Policies.
The Fund is an investment company and applies the accounting and reporting guidance of the Financial Accounting Standards Board (FASB) Accounting Standards Codification Topic 946 Financial Services – Investments Companies. The financial statements have been prepared in conformity with accounting principles generally accepted in the United States of America (GAAP), which require management to make certain estimates and assumptions at the date of the financial statements. Actual results could differ from those estimates. Subsequent events, if any, through the date that the financial statements were issued have been evaluated in the preparation of the financial statements. The following summarizes the significant accounting policies of the Fund:
Investment Valuation. Investments are valued as of 4:00 p.m. Eastern time on the last calendar day of the period. The Board of Trustees (the Board) has delegated the day to day responsibility for the valuation of the Fund's investments to the Fair Value Committee (the Committee) established by the Fund's investment adviser. In accordance with valuation policies and procedures approved by the Board, the Fund attempts to obtain prices from one or more third party pricing vendors or brokers to value its investments. When current market prices, quotations or currency exchange rates are not readily available or reliable, investments will be fair valued in good faith by the Committee, in accordance with procedures adopted by the Board. Factors used in determining fair value vary by investment type and may include market or investment specific events, changes in interest rates and credit quality. The frequency with which these procedures are used cannot be predicted and they may be utilized to a significant extent. The Committee oversees the Fund's valuation policies and procedures and reports to the Board on the Committee's activities and fair value determinations. The Board monitors the appropriateness of the procedures used in valuing the Fund's investments and ratifies the fair value determinations of the Committee.
The Fund categorizes the inputs to valuation techniques used to value its investments into a disclosure hierarchy consisting of three levels as shown below:
- Level 1 – quoted prices in active markets for identical investments
- Level 2 – other significant observable inputs (including quoted prices for similar investments, interest rates, prepayment speeds, etc.)
- Level 3 – unobservable inputs (including the Fund's own assumptions based on the best information available)
Valuation techniques used to value the Fund's investments by major category are as follows:
Equity securities, including restricted securities, for which market quotations are readily available, are valued at the last reported sale price or official closing price as reported by a third party pricing vendor on the primary market or exchange on which they are traded and are categorized as Level 1 in the hierarchy. In the event there were no sales during the day or closing prices are not available, securities are valued at the last quoted bid price or may be valued using the last available price and are generally categorized as Level 2 in the hierarchy. For foreign equity securities, when market or security specific events arise, comparisons to the valuation of American Depositary Receipts (ADRs), futures contracts, Exchange-Traded Funds (ETFs) and certain indexes as well as quoted prices for similar securities may be used and would be categorized as Level 2 in the hierarchy. For equity securities, including restricted securities, where observable inputs are limited, assumptions about market activity and risk are used and these securities may be categorized as Level 3 in the hierarchy.
Debt securities, including restricted securities, are valued based on evaluated prices received from third party pricing vendors or from brokers who make markets in such securities. Corporate bonds are valued by pricing vendors who utilize matrix pricing which considers yield or price of bonds of comparable quality, coupon, maturity and type or by broker-supplied prices. When independent prices are unavailable or unreliable, debt securities may be valued utilizing pricing methodologies which consider similar factors that would be used by third party pricing vendors. Debt securities are generally categorized as Level 2 in the hierarchy but may be Level 3 depending on the circumstances.
Investments in open-end mutual funds, including the Fidelity Central Funds, are valued at their closing net asset value (NAV) each business day and are categorized as Level 1 in the hierarchy.
Changes in valuation techniques may result in transfers in or out of an assigned level within the disclosure hierarchy.
Foreign Currency. The Fund may use foreign currency contracts to facilitate transactions in foreign-denominated securities. Gains and losses from these transactions may arise from changes in the value of the foreign currency or if the counterparties do not perform under the contracts' terms.
Foreign-denominated assets, including investment securities, and liabilities are translated into U.S. dollars at the exchange rates at period end. Purchases and sales of investment securities, income and dividends received and expenses denominated in foreign currencies are translated into U.S. dollars at the exchange rate in effect on the transaction date.
The effects of exchange rate fluctuations on investments are included with the net realized and unrealized gain (loss) on investment securities. Other foreign currency transactions resulting in realized and unrealized gain (loss) are disclosed separately.
Investment Transactions and Income. For financial reporting purposes, the Fund's investment holdings and NAV include trades executed through the end of the last business day of the period. The NAV per share for processing shareholder transactions is calculated as of the close of business of the New York Stock Exchange (NYSE), normally 4:00 p.m. Eastern time and includes trades executed through the end of the prior business day. Gains and losses on securities sold are determined on the basis of identified cost. Dividend income is recorded on the ex-dividend date, except for certain dividends from foreign securities where the ex-dividend date may have passed, which are recorded as soon as the Fund is informed of the ex-dividend date. Non-cash dividends included in dividend income, if any, are recorded at the fair market value of the securities received. Income and capital gain distributions from Fidelity Central Funds, if any, are recorded on the ex-dividend date. Certain distributions received by the Fund represent a return of capital or capital gain. The Fund determines the components of these distributions subsequent to the ex-dividend date, based upon receipt of tax filings or other correspondence relating to the underlying investment. These distributions are recorded as a reduction of cost of investments and/or as a realized gain. Investment income is recorded net of foreign taxes withheld where recovery of such taxes is uncertain. Debt obligations may be placed on non-accrual status and related interest income may be reduced by ceasing current accruals and writing off interest receivables when the collection of all or a portion of interest has become doubtful based on consistently applied procedures. A debt obligation is removed from non-accrual status when the issuer resumes interest payments or when collectability of interest is reasonably assured.
Class Allocations and Expenses. Investment income, realized and unrealized capital gains and losses, common expenses of the Fund, and certain fund-level expense reductions, if any, are allocated daily on a pro-rata basis to each class based on the relative net assets of each class to the total net assets of the Fund. Each class differs with respect to transfer agent fees incurred. Certain expense reductions may also differ by class. For the reporting period, the allocated portion of income and expenses to each class as a percent of its average net assets may vary due to the timing of recording these transactions in relation to fluctuating net assets of the classes. Expenses directly attributable to a fund are charged to that fund. Expenses attributable to more than one fund are allocated among the respective funds on the basis of relative net assets or other appropriate methods. Expense estimates are accrued in the period to which they relate and adjustments are made when actual amounts are known.
Income Tax Information and Distributions to Shareholders. Each year, the Fund intends to qualify as a regulated investment company under Subchapter M of the Internal Revenue Code, including distributing substantially all of its taxable income and realized gains. As a result, no provision for U.S. Federal income taxes is required. The Fund files a U.S. federal tax return, in addition to state and local tax returns as required. The Fund's federal income tax returns are subject to examination by the Internal Revenue Service (IRS) for a period of three fiscal years after they are filed. State and local tax returns may be subject to examination for an additional fiscal year depending on the jurisdiction. Foreign taxes are provided for based on the Fund's understanding of the tax rules and rates that exist in the foreign markets in which it invests.
Distributions are declared and recorded on the ex-dividend date. Income and capital gain distributions are declared separately for each class. Income and capital gain distributions are determined in accordance with income tax regulations, which may differ from GAAP.
Capital accounts within the financial statements are adjusted for permanent book-tax differences. These adjustments have no impact on net assets or the results of operations. Capital accounts are not adjusted for temporary book-tax differences which will reverse in a subsequent period.
Book-tax differences are primarily due to foreign currency transactions, passive foreign investment companies (PFIC), partnerships and losses deferred due to wash sales.
As of period end, the cost and unrealized appreciation (depreciation) in securities, and derivatives if applicable, for federal income tax purposes were as follows:
| Gross unrealized appreciation | $6,959,215 |
| Gross unrealized depreciation | (2,853,047) |
| Net unrealized appreciation (depreciation) | $4,106,168 |
| Tax cost | $47,966,981 |
Delayed Delivery Transactions and When-Issued Securities. During the period, the Fund transacted in securities on a delayed delivery or when-issued basis. Payment and delivery may take place after the customary settlement period for that security. The price of the underlying securities and the date when the securities will be delivered and paid for are fixed at the time the transaction is negotiated. The securities purchased on a delayed delivery or when-issued basis are identified as such in the Fund's Schedule of Investments. Losses may arise due to changes in the value of the underlying securities or if the counterparty does not perform under the contract's terms, or if the issuer does not issue the securities due to political, economic, or other factors.
4. Purchases and Sales of Investments.
Purchases and sales of securities, other than short-term securities, aggregated $18,733,023 and $25,508,652, respectively.
5. Fees and Other Transactions with Affiliates.
Management Fee. Fidelity SelectCo, LLC (the investment adviser) and its affiliates provide the Fund with investment management related services for which the Fund pays a monthly management fee. The management fee is the sum of an individual fund fee rate that is based on an annual rate of .30% of the Fund's average net assets and an annualized group fee rate that averaged .24% during the period. The group fee rate is based upon the average net assets of all the mutual funds advised by Fidelity Management & Research Company (FMR) and the investment adviser. The group fee rate decreases as assets under management increase and increases as assets under management decrease. For the reporting period, the total annualized management fee rate was .54% of the Fund's average net assets.
Transfer Agent Fees. Fidelity Investments Institutional Operations Company, Inc. (FIIOC), an affiliate of the investment adviser, is the Fund's transfer, dividend disbursing, and shareholder servicing agent. FIIOC receives an asset-based fee with respect to each class. Each class pays a fee for transfer agent services, typesetting and printing and mailing of shareholder reports, excluding mailing of proxy statements, equal to an annual rate of class-level average net assets. The annual rate for Investor Class is .15% and the annual rate for all other classes is .07%. For the period, transfer agent fees for each class were as follows:
| Initial Class | $ 3,265 |
| Investor Class | 31,713 |
| | $34,978 |
Accounting and Security Lending Fees. Fidelity Service Company, Inc. (FSC), an affiliate of the investment adviser, maintains the Fund's accounting records. The accounting fee is based on the level of average net assets for each month. Prior to April 1, 2019, FSC had a separate agreement with the Fund for administration of the security lending program, based on the number and duration of lending transactions. For the period, the total fees paid for accounting and administration of securities lending were equivalent to an annualized rate of .04%.
Brokerage Commissions. The Fund placed a portion of its portfolio transactions with brokerage firms which are affiliates of the investment adviser. Brokerage commissions are included in net realized gain (loss) and change in net unrealized appreciation (depreciation) in the Statement of Operations. The commissions paid to these affiliated firms were $759 for the period.
Interfund Trades. The Fund may purchase from or sell securities to other Fidelity Funds under procedures adopted by the Board. The procedures have been designed to ensure these interfund trades are executed in accordance with Rule 17a-7 of the 1940 Act. Interfund trades are included within the respective purchases and sales amounts shown in the Purchases and Sales of Investments note.
6. Committed Line of Credit.
The Fund participates with other funds managed by the investment adviser or an affiliate in a $4.25 billion credit facility (the "line of credit") to be utilized for temporary or emergency purposes to fund shareholder redemptions or for other short-term liquidity purposes. The Fund has agreed to pay commitment fees on its pro-rata portion of the line of credit, which amounted to $81 and is reflected in Miscellaneous expenses on the Statement of Operations. During the period, the Fund did not borrow on this line of credit.
7. Security Lending.
The Fund lends portfolio securities from time to time in order to earn additional income. For equity securities, lending agents are used, including National Financial Services (NFS), an affiliate of the Fund. Pursuant to a securities lending agreement, NFS will receive a fee, which is capped at 9.9% of daily lending revenue, for its services as lending agent. The Fund may lend securities to certain qualified borrowers. On the settlement date of the loan, the Fund receives collateral (in the form of U.S. Treasury obligations, letters of credit and/or cash) against the loaned securities and maintains collateral in an amount not less than 100% of the market value of the loaned securities during the period of the loan. The market value of the loaned securities is determined at the close of business of the Fund and any additional required collateral is delivered to the Fund on the next business day. The Fund or borrower may terminate the loan at any time, and if the borrower defaults on its obligation to return the securities loaned because of insolvency or other reasons, the Fund may apply collateral received from the borrower against the obligation. The Fund may experience delays and costs in recovering the securities loaned. Any cash collateral received is invested in the Fidelity Securities Lending Cash Central Fund. The value of loaned securities and cash collateral at period end are disclosed on the Fund's Statement of Assets and Liabilities. Security lending income represents the income earned on investing cash collateral, less rebates paid to borrowers and any lending agent fees associated with the loan, plus any premium payments received for lending certain types of securities. Security lending income is presented in the Statement of Operations as a component of income from Fidelity Central Funds.
8. Expense Reductions.
Commissions paid to certain brokers with whom the investment adviser, or its affiliates, places trades on behalf of the Fund include an amount in addition to trade execution, which may be rebated back to the Fund to offset certain expenses. This amount totaled $2,067 for the period.
In addition, during the period the investment adviser reimbursed and/or waived a portion of fund-level operating expenses in the amount of $211.
9. Distributions to Shareholders.
Distributions to shareholders of each class were as follows:
| | Six months ended
June 30, 2019 | Year ended
December 31, 2018 |
| Distributions to shareholders | | |
| Initial Class | $ 857,115 | $ 1,189,699 |
| Investor Class | 3,797,099 | 5,083,705 |
| Total | $4,654,214 | $6,273,404 |
10. Share Transactions.
Transactions for each class of shares were as follows:
| | Shares | Shares | Dollars | Dollars |
| | Six months ended June 30, 2019 | Year ended December 31, 2018 | Six months ended June 30, 2019 | Year ended December 31, 2018 |
| Initial Class | | | | |
| Shares sold | 25,300 | 134,745 | $298,239 | $2,077,924 |
| Reinvestment of distributions | 76,392 | 85,091 | 857,115 | 1,189,699 |
| Shares redeemed | (115,941) | (553,509) | (1,360,610) | (8,043,417) |
| Net increase (decrease) | (14,249) | (333,673) | $(205,256) | $(4,775,794) |
| Investor Class | | | | |
| Shares sold | 125,739 | 631,940 | $1,508,737 | $9,646,433 |
| Reinvestment of distributions | 338,724 | 363,152 | 3,797,099 | 5,083,705 |
| Shares redeemed | (655,196) | (2,129,331) | (7,669,861) | (30,689,758) |
| Net increase (decrease) | (190,733) | (1,134,239) | $(2,364,025) | $(15,959,620) |
11. Other.
The Fund's organizational documents provide former and current trustees and officers with a limited indemnification against liabilities arising in connection with the performance of their duties to the Fund. In the normal course of business, the Fund may also enter into contracts that provide general indemnifications. The Fund's maximum exposure under these arrangements is unknown as this would be dependent on future claims that may be made against the Fund. The risk of material loss from such claims is considered remote.
At the end of the period, the investment adviser or its affiliates were the owners of record of 100% of the total outstanding shares of the Fund.
Shareholder Expense Example
As a shareholder of the Fund, you incur two types of costs: (1) transaction costs, and (2) ongoing costs, including management fees and other Fund expenses. This Example is intended to help you understand your ongoing costs (in dollars) of investing in the Fund and to compare these costs with the ongoing costs of investing in other mutual funds.
The Example is based on an investment of $1,000 invested at the beginning of the period and held for the entire period (January 1, 2019 to June 30, 2019).
Actual Expenses
The first line of the accompanying table for each class of the Fund provides information about actual account values and actual expenses. You may use the information in this line, together with the amount you invested, to estimate the expenses that you paid over the period. Simply divide your account value by $1,000.00 (for example, an $8,600 account value divided by $1,000.00 = 8.6), then multiply the result by the number in the first line for a class of the Fund under the heading entitled "Expenses Paid During Period" to estimate the expenses you paid on your account during this period. The estimate of expenses does not include any fees or other expenses of any variable annuity or variable life insurance product. If they were, the estimate of expenses you paid during the period would be higher, and your ending account value would be lower. In addition, the Fund, as a shareholder in the underlying Fidelity Central Funds, will indirectly bear its pro-rata share of the fees and expenses incurred by the underlying Fidelity Central Funds. These fees and expenses are not included in the Fund's annualized expense ratio used to calculate the expense estimate in the table below.
Hypothetical Example for Comparison Purposes
The second line of the accompanying table for each class of the Fund provides information about hypothetical account values and hypothetical expenses based on a Class' actual expense ratio and an assumed rate of return of 5% per year before expenses, which is not the Class' actual return. The hypothetical account values and expenses may not be used to estimate the actual ending account balance or expenses you paid for the period. You may use this information to compare the ongoing costs of investing in the Fund and other funds. To do so, compare this 5% hypothetical example with the 5% hypothetical examples that appear in the shareholder reports of the other funds. The estimate of expenses does not include any fees or other expenses of any variable annuity or variable life insurance product. If they were, the estimate of expenses you paid during the period would be higher, and your ending account value would be lower. In addition, the Fund, as a shareholder in the underlying Fidelity Central Funds, will indirectly bear its pro-rata share of the fees and expenses incurred by the underlying Fidelity Central Funds. These fees and expenses are not included in the Fund's annualized expense ratio used to calculate the expense estimate in the table below.
Please note that the expenses shown in the table are meant to highlight your ongoing costs only and do not reflect any transaction costs. Therefore, the second line of the table is useful in comparing ongoing costs only, and will not help you determine the relative total costs of owning different funds.
| | Annualized Expense Ratio-A | Beginning
Account Value
January 1, 2019 | Ending
Account Value
June 30, 2019 | Expenses Paid
During Period-B
January 1, 2019
to June 30, 2019 |
| Initial Class | .74% | | | |
| Actual | | $1,000.00 | $1,124.10 | $3.90 |
| Hypothetical-C | | $1,000.00 | $1,021.12 | $3.71 |
| Investor Class | .82% | | | |
| Actual | | $1,000.00 | $1,123.20 | $4.32 |
| Hypothetical-C | | $1,000.00 | $1,020.73 | $4.11 |
A Annualized expense ratio reflects expenses net of applicable fee waivers.
B Expenses are equal to each Class' annualized expense ratio, multiplied by the average account value over the period, multiplied by 181/365 (to reflect the one-half year period).
C 5% return per year before expenses
Board Approval of Investment Advisory Contracts and Management Fees
VIP Materials Portfolio
Each year, the Board of Trustees, including the Independent Trustees (together, the Board), votes on the renewal of the management contract with Fidelity SelectCo, LLC (SelectCo), an affiliate of Fidelity Management & Research Company (FMR), and the sub-advisory agreements with affiliates of FMR (together, the Advisory Contracts) for the fund. SelectCo and the sub-advisers are referred to herein as the Investment Advisers. The Board, assisted by the advice of fund counsel and Independent Trustees' counsel, requests and considers a broad range of information relevant to the renewal of the Advisory Contracts throughout the year.
The Board meets regularly and, at each of its meetings, covers an extensive agenda of topics and materials and considers factors that are relevant to its annual consideration of the renewal of the fund's Advisory Contracts, including the services and support provided to the fund and its shareholders. The Board has established various standing committees (Committees), each composed of and chaired by Independent Trustees with varying backgrounds, to which the Board has assigned specific subject matter responsibilities in order to enhance effective decision-making by the Board. The Board, acting directly and through its Committees, requests and receives information concerning the annual consideration of the renewal of the fund's Advisory Contracts. The Board also meets as needed to review matters specifically related to the Board's annual consideration of the renewal of the Advisory Contracts. Members of the Board may also meet with trustees of other Fidelity funds through joint ad hoc committees to discuss certain matters relevant to all of the Fidelity funds.
At its January 2019 meeting, the Board unanimously determined to renew the fund's Advisory Contracts. In reaching its determination, the Board considered all factors it believed relevant, including (i) the nature, extent, and quality of the services to be provided to the fund and its shareholders (including the investment performance of the fund); (ii) the competitiveness of the fund's management fee and total expense ratio relative to peer funds; (iii) the total costs of the services to be provided by and the profits to be realized by Fidelity from its relationships with the fund; and (iv) the extent to which, if any, economies of scale exist and would be realized as the fund grows, and whether any economies of scale are appropriately shared with fund shareholders.
In considering whether to renew the Advisory Contracts for the fund, the Board reached a determination, with the assistance of fund counsel and Independent Trustees' counsel and through the exercise of its business judgment, that the renewal of the Advisory Contracts was in the best interests of the fund and its shareholders and that the compensation payable under the Advisory Contracts was fair and reasonable. The Board's decision to renew the Advisory Contracts was not based on any single factor, but rather was based on a comprehensive consideration of all the information provided to the Board at its meetings throughout the year. The Board, in reaching its determination to renew the Advisory Contracts, was aware that shareholders of the fund have a broad range of investment choices available to them, including a wide choice among funds offered by Fidelity's competitors, and that the fund's shareholders, who have the opportunity to review and weigh the disclosure provided by the fund in its prospectus and other public disclosures, have chosen to invest in this fund, which is part of the Fidelity family of funds.
Nature, Extent, and Quality of Services Provided. The Board considered Fidelity's staffing as it relates to the fund, including the backgrounds of investment personnel of Fidelity, and also considered the fund's investment objective, strategies, and related investment philosophy. The Independent Trustees also had discussions with senior management of Fidelity's investment operations and investment groups. The Board considered the structure of the investment personnel compensation program and whether this structure provides appropriate incentives to act in the best interests of the fund. Additionally, the Board considered the portfolio managers' investments, if any, in the funds that they manage.
Resources Dedicated to Investment Management and Support Services. The Board and the Fund Oversight and Research Committees reviewed the general qualifications and capabilities of Fidelity's investment staff, including its size, education, experience, and resources, as well as Fidelity's approach to recruiting, training, managing, and compensating investment personnel. The Board noted that Fidelity has continued to increase the resources devoted to non-U.S. offices, including expansion of Fidelity's global investment organization. The Board also noted that Fidelity's analysts have extensive resources, tools and capabilities that allow them to conduct sophisticated quantitative and fundamental analysis, as well as credit analysis of issuers, counterparties and guarantors. Further, the Board considered that Fidelity's investment professionals have sufficient access to global information and data so as to provide competitive investment results over time, and that those professionals also have access to sophisticated tools that permit them to assess portfolio construction and risk and performance attribution characteristics continuously, as well as to transmit new information and research conclusions rapidly around the world. Additionally, in its deliberations, the Board considered Fidelity's trading, risk management, compliance, and technology and operations capabilities and resources, which are integral parts of the investment management process.
Shareholder and Administrative Services. The Board considered (i) the nature, extent, quality, and cost of advisory, administrative, and shareholder services performed by the Investment Advisers and their affiliates under the Advisory Contracts and under separate agreements covering transfer agency, pricing and bookkeeping, and securities lending services for the fund; (ii) the nature and extent of the supervision of third party service providers, principally custodians, subcustodians, and pricing vendors; and (iii) the resources devoted to, and the record of compliance with, the fund's compliance policies and procedures. The Board also reviewed the allocation of fund brokerage, including allocations to brokers affiliated with the Investment Advisers, the use of brokerage commissions to pay fund expenses, and the use of "soft" commission dollars to pay for research services.
The Board noted that the growth of fund assets over time across the complex allows Fidelity to reinvest in the development of services designed to enhance the value and convenience of the Fidelity funds as investment vehicles. These services include 24-hour access to account information and market information through telephone representatives and over the Internet, investor education materials and asset allocation tools, and the expanded availability of Fidelity Investor Centers.
The Board noted that it and the boards of certain other Fidelity funds had formed an ad hoc Committee on Transfer Agency Fees to review the variety of transfer agency fee structures throughout the industry and Fidelity's competitive positioning with respect to industry participants.
Investment in a Large Fund Family. The Board considered the benefits to shareholders of investing in a Fidelity fund, including the benefits of investing in a fund that is part of a large family of funds offering a variety of investment disciplines and providing a large variety of mutual fund investor services. The Board noted that Fidelity had taken, or had made recommendations that resulted in the Fidelity funds taking, a number of actions over the previous year that benefited particular funds, including: (i) continuing to dedicate additional resources to Fidelity's investment research process, which includes meetings with management of issuers of securities in which the funds invest, and to the support of the senior management team that oversees asset management; (ii) continuing efforts to enhance Fidelity's global research capabilities; (iii) launching new funds and making other enhancements to meet client needs; (iv) launching new share classes of existing funds; (v) eliminating purchase minimums and broadening eligibility requirements for certain funds and share classes; (vi) reducing management fees and total expenses for certain growth equity funds and index funds; (vii) lowering expense caps for certain existing funds and classes, and converting certain voluntary expense caps to contractual caps, to reduce expenses borne by shareholders; (viii) eliminating short-term redemption fees for funds that had such fees; (ix) rationalizing product lines and gaining increased efficiencies from fund mergers and share class consolidations; (x) continuing to develop, acquire and implement systems and technology to improve services to the funds and shareholders, strengthen information security, and increase efficiency; and (xi) continuing to implement enhancements to further strengthen Fidelity's product line to increase investors' probability of success in achieving their investment goals, including retirement income goals.
Investment Performance. The Board considered whether the fund has operated in accordance with its investment objective, as well as its record of compliance with its investment restrictions and its performance history. The fund had a portfolio manager change in November 2017. The Board will continue to monitor closely the fund's performance, taking into account the portfolio manager change.
The Board took into account discussions that occur at Board meetings throughout the year with representatives of the Investment Advisers about fund investment performance. In this regard the Board noted that as part of regularly scheduled fund reviews and other reports to the Board on fund performance, the Board considers annualized return information for the fund for different time periods, measured against an appropriate securities market index ("benchmark index"). In its evaluation of fund investment performance, the Board gave particular attention to information indicating changes in performance of certain Fidelity funds for specific time periods and discussed with the Investment Advisers the reasons for any overperformance or underperformance.
In addition to reviewing absolute and relative fund performance, the Independent Trustees periodically consider the appropriateness of fund performance metrics in evaluating the results achieved. In general, the Independent Trustees believe that fund performance should be evaluated based on net performance (after fees and expenses) of both the highest performing and lowest performing fund share classes, where applicable, compared to appropriate benchmark indices, over appropriate time periods that may include full market cycles, taking into account relevant factors including the following: general market conditions; issuer-specific information; and fund cash flows and other factors.
The Independent Trustees recognize that shareholders evaluate performance on a net basis over their own holding periods, for which one-, three-, and five-year periods are often used as a proxy. For this reason, the performance information reviewed by the Board also included net cumulative total return information for the fund and an appropriate benchmark index for the most recent one-, three-, and five-year periods ended June 30, 2018, as shown below.
VIP Materials Portfolio
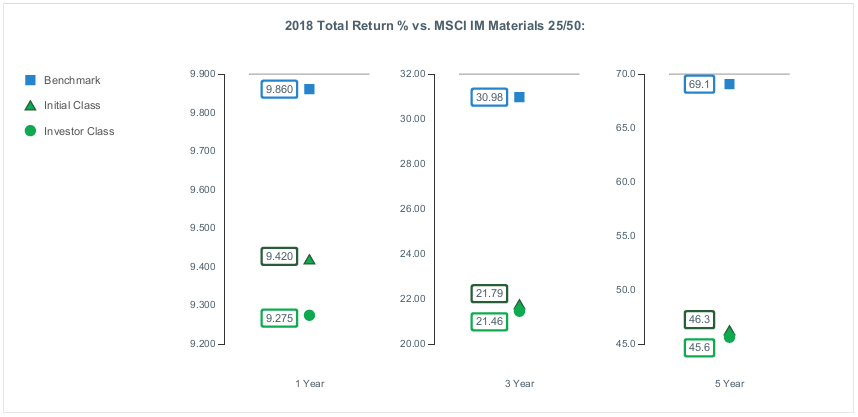
The Board considered the fund's underperformance for different time periods based on the June 30, 2018 data presented above and based on earlier periods ended prior to June 30, 2018. The Board's discussions with SelectCo regarding underperformance cover topics including, but not limited to: the longer-term track record of a fund's portfolio manager(s); broader trends in the market that may adversely impact a fund's performance; attribution reports on contributors to the fund's underperformance; and the applicable portfolio manager's explanation of his or her underperformance. The Board engages with SelectCo on steps that might be taken to address a fund's underperformance.
Based on its review, the Board concluded that the nature, extent, and quality of services provided to the fund under the Advisory Contracts should continue to benefit the shareholders of the fund.
Competitiveness of Management Fee and Total Expense Ratio. The Board considered the fund's management fee and total expense ratio compared to "mapped groups" of competitive funds and classes created for the purpose of facilitating the Trustees' competitive analysis of management fees and total expenses. Fidelity creates "mapped groups" by combining similar Lipper investment objective categories that have comparable investment mandates. For this purpose, all sector focused equity variable annuity funds are grouped in the same mapped group. Combining Lipper investment objective categories aids the Board's management fee and total expense ratio comparisons by broadening the competitive group used for comparison.
Management Fee. The Board considered two proprietary management fee comparisons for the 12-month periods ended June 30 shown in basis points (BP) in the chart below. The group of Lipper funds used by the Board for management fee comparisons is referred to below as the "Total Mapped Group." The Total Mapped Group comparison focuses on a fund's standing in terms of gross management fees before expense reimbursements or caps relative to the total universe of funds with comparable investment mandates (i.e., sector equities), regardless of whether their management fee structures also are comparable. Funds with comparable management fee structures have similar management fee contractual arrangements (
e.g., flat rate charged for advisory services, all-inclusive fee rate,
etc.). "TMG %" represents the percentage of funds in the Total Mapped Group that had management fees that were lower than the fund's. For example, a hypothetical TMG % of 20% would mean that 80% of the funds in the Total Mapped Group had higher, and 20% had lower, management fees than the fund. The fund's actual TMG %s and the number of funds in the Total Mapped Group are in the chart below. The "Asset-Size Peer Group" (ASPG) comparison focuses on a fund's standing relative to a subset of non-Fidelity funds within the Total Mapped Group that are similar in size and management fee structure. For example, if a fund is in the first quartile of the ASPG, the fund's management fee ranks in the least expensive or lowest 25% of funds in the ASPG. The ASPG represents at least 15% of the funds in the Total Mapped Group with comparable asset size and management fee structures, subject to a minimum of 50 funds (or all funds in the Total Mapped Group if fewer than 50). Additional information, such as the ASPG quartile in which the fund's management fee rate ranked, is also included in the chart and was considered by the Board.
VIP Materials Portfolio
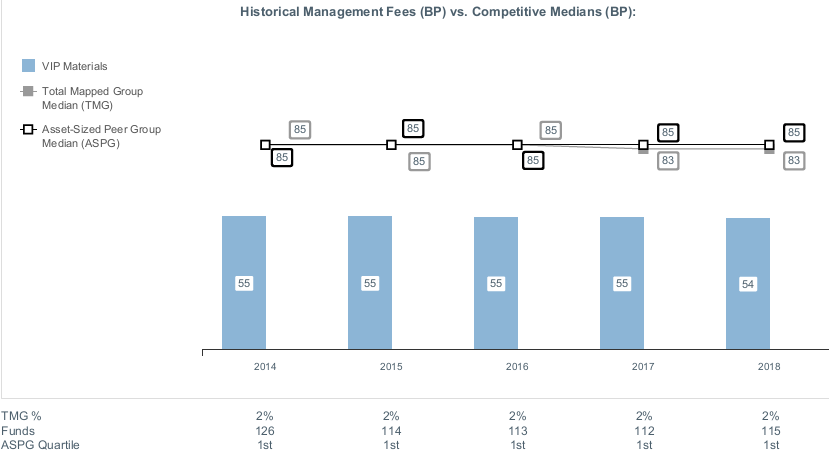
The Board noted that the fund's management fee rate ranked below the median of its Total Mapped Group and below the median of its ASPG for the 12-month period ended June 30, 2018.
The Board noted that it and the boards of other Fidelity funds formed an ad hoc Committee on Group Fee, which meets periodically, to conduct an in-depth review of the "group fee" component of the management fee of funds with such management fee structures. The Committee's focus included the mechanics of the group fee, the competitive landscape of group fee structures, Fidelity funds with no group fee component and investment products not included in group fee assets. The Board also considered that, for funds subject to the group fee, FMR agreed to voluntarily waive fees over a specified period of time in amounts designed to account for assets converted from certain funds to certain collective investment trusts.
Based on its review, the Board concluded that the fund's management fee is fair and reasonable in light of the services that the fund receives and the other factors considered.
Total Expense Ratio. In its review of each class's total expense ratio, the Board considered the fund's management fee rate as well as other fund or class expenses, as applicable, such as transfer agent fees, pricing and bookkeeping fees, and custodial, legal, and audit fees. The Board also noted that Fidelity may agree to waive fees and expenses from time to time, and the extent to which, if any, it has done so for the fund. As part of its review, the Board also considered the current and historical total expense ratios of each class of the fund compared to competitive fund median expenses. Each class of the fund is compared to those funds and classes in the Total Mapped Group (used by the Board for management fee comparisons) that have a similar sales load structure.
The Board noted that the total expense ratio of each class ranked below the competitive median for the 12-month period ended June 30, 2018.
Fees Charged to Other Fidelity Clients. The Board also considered Fidelity fee structures and other information with respect to clients of Fidelity, such as other funds advised or subadvised by Fidelity, pension plan clients, and other institutional clients with similar mandates. The Board noted that a joint ad hoc committee created by it and the boards of other Fidelity funds periodically reviews and compares Fidelity's institutional investment advisory business with its business of providing services to the Fidelity funds, and also noted the most recent findings of the committee. The Board noted that the committee's review included a consideration of the differences in services provided, fees charged, and costs incurred, as well as competition in the markets serving the different categories of clients.
Based on its review of total expense ratios and fees charged to other Fidelity clients, the Board concluded that the total expense ratio of each class of the fund was reasonable in light of the services that the fund and its shareholders receive and the other factors considered.
Costs of the Services and Profitability. The Board considered the revenues earned and the expenses incurred by Fidelity in conducting the business of developing, marketing, distributing, managing, administering and servicing the fund and servicing the fund's shareholders. The Board also considered the level of Fidelity's profits in respect of all the Fidelity funds.
On an annual basis, Fidelity presents to the Board information about the profitability of its relationships with the fund. Fidelity calculates profitability information for each fund, as well as aggregate profitability information for groups of Fidelity funds and all Fidelity funds, using a series of detailed revenue and cost allocation methodologies which originate with the books and records of Fidelity on which Fidelity's audited financial statements are based. The Audit Committee of the Board reviews any significant changes from the prior year's methodologies.
PricewaterhouseCoopers LLP (PwC), auditor to Fidelity and certain Fidelity funds, has been engaged annually by the Board as part of the Board's assessment of Fidelity's profitability analysis. PwC's engagement includes the review and assessment of the methodologies used by Fidelity in determining the revenues and expenses attributable to Fidelity's mutual fund business, and completion of agreed-upon procedures in respect of the mathematical accuracy of the fund profitability information and its conformity to established allocation methodologies. After considering PwC's reports issued under the engagement and information provided by Fidelity, the Board concluded that while other allocation methods may also be reasonable, Fidelity's profitability methodologies are reasonable in all material respects.
The Board also reviewed Fidelity's non-fund businesses and potential indirect benefits such businesses may have received as a result of their association with Fidelity's mutual fund business (i.e., fall-out benefits) as well as cases where Fidelity's affiliates may benefit from the fund's business. The Board noted that changes to fall-out benefits year-over-year reflect business developments at Fidelity's various businesses.
The Board considered the costs of the services provided by and the profits realized by Fidelity in connection with the operation of the fund and was satisfied that the profitability was not excessive.
Economies of Scale. The Board considered whether there have been economies of scale in respect of the management of the Fidelity funds, whether the Fidelity funds (including the fund) have appropriately benefited from any such economies of scale, and whether there is potential for realization of any further economies of scale. The Board considered the extent to which the fund will benefit from economies of scale as assets grow through increased services to the fund, through waivers or reimbursements, or through fee or expense ratio reductions. The Board also noted that a committee (the Economies of Scale Committee) created by it and the boards of other Fidelity funds periodically analyzes whether Fidelity attains economies of scale in respect of the management and servicing of the Fidelity funds, whether the Fidelity funds have appropriately benefited from such economies of scale, and whether there is potential for realization of any further economies of scale.
The Board recognized that the fund's management contract incorporates a "group fee" structure, which provides for lower group fee rates as total group assets increase, and for higher group fee rates as total group assets decrease (with "group assets" defined to include fund assets under SelectCo's management plus assets under FMR's management). SelectCo calculates the group fee rates based on a tiered asset "breakpoint" schedule that varies based on asset class. The Board considered that the group fee is designed to deliver the benefits of economies of scale to fund shareholders when total group assets increase, even if assets of any particular fund are unchanged or have declined, because some portion of Fidelity's costs are attributable to services provided to all Fidelity funds, and all funds benefit if those costs can be allocated among more assets. The Board concluded that, given the group fee structure, fund shareholders will benefit from lower management fees as group assets increase at the fund complex level, regardless of whether Fidelity achieves any such economies of scale.
The Board concluded, taking into account the analysis of the Economies of Scale Committee, that economies of scale, if any, are being appropriately shared between fund shareholders and Fidelity.
Additional Information Requested by the Board. In order to develop fully the factual basis for consideration of the Fidelity funds' advisory contracts, the Board requested and received additional information on certain topics, including: (i) fund performance trends, in particular the underperformance of certain funds, and Fidelity's long-term strategies for certain funds; (ii) Fidelity's fund profitability methodology, profitability trends for certain funds, and the impact of certain factors on fund profitability results; (iii) metrics for evaluating index fund and ETF performance and information about ETF trading characteristics; (iv) the methodology with respect to the evaluation of competitive fund data and peer group classifications and fee comparisons; (v) the expense structures for different funds and classes; (vi) information regarding other accounts managed by Fidelity, including collective investment trusts; and (vii) Fidelity's philosophies and strategies for evaluating funds and classes with lower or declining asset levels.
Based on its evaluation of all of the conclusions noted above, and after considering all factors it believed relevant, the Board concluded that the advisory fee arrangements are fair and reasonable, and that the fund's Advisory Contracts should be renewed.
VMATP-SANN-0819
1.851002.112
Fidelity® Variable Insurance Products: Communication Services Portfolio
Semi-Annual Report June 30, 2019 |
|
Beginning on January 1, 2021, as permitted by regulations adopted by the Securities and Exchange Commission, and if your insurance carrier elects to participate, you may not be receiving paper copies of the Fund’s shareholder reports from the insurance company that offers your variable insurance product unless you specifically request paper copies from your financial professional or the administrator of your variable insurance product. Instead, the reports will be made available on a website, and you will be notified by mail each time a report is posted and provided with a website link to access the report.
If you already elected to receive shareholder reports electronically, you will not be affected by this change and you need not take any action. You may elect to receive shareholder reports and other communications from the Fund electronically, by contacting your financial professional or the administrator of your variable insurance product. If you own a Fidelity-administered variable insurance product, please visit fidelity.com/mailpreferences to make your election or call 1-800-343-3548.
You may elect to receive all future reports in paper free of charge. If you wish to continue receiving paper copies of your shareholder reports, you may contact your financial professional or the administrator of your variable insurance product. If you own a Fidelity-administered variable insurance product, please visit fidelity.com/mailpreferences to make your election or call 1-800-343-3548. Your election to receive reports in paper will apply to all funds available under your variable insurance product.
Contents
To view a fund's proxy voting guidelines and proxy voting record for the 12-month period ended June 30, visit http://www.fidelity.com/proxyvotingresults or visit the Securities and Exchange Commission's (SEC) web site at http://www.sec.gov.
You may also call 1-877-208-0098 to request a free copy of the proxy voting guidelines.
Fidelity® Variable Insurance Products are separate account options which are purchased through a variable insurance contract.
Standard & Poor's, S&P and S&P 500 are registered service marks of The McGraw-Hill Companies, Inc. and have been licensed for use by Fidelity Distributors Corporation.
Other third-party marks appearing herein are the property of their respective owners.
All other marks appearing herein are registered or unregistered trademarks or service marks of FMR LLC or an affiliated company. © 2019 FMR LLC. All rights reserved.
This report and the financial statements contained herein are submitted for the general information of the shareholders of the Fund. This report is not authorized for distribution to prospective investors in the Fund unless preceded or accompanied by an effective prospectus.
A fund files its complete schedule of portfolio holdings with the SEC for the first and third quarters of each fiscal year on Form N-PORT. Forms N-PORT are available on the SEC’s web site at http://www.sec.gov. A fund's Forms N-PORT may be reviewed and copied at the SEC’s Public Reference Room in Washington, DC. Information regarding the operation of the SEC's Public Reference Room may be obtained by calling 1-800-SEC-0330.
For a complete list of a fund's portfolio holdings, view the most recent holdings listing, semiannual report, or annual report on Fidelity's web site at http://www.fidelity.com, http://www.institutional.fidelity.com, or http://www.401k.com, as applicable.
NOT FDIC INSURED •MAY LOSE VALUE •NO BANK GUARANTEE
Neither the Fund nor Fidelity Distributors Corporation is a bank.
Investment Summary (Unaudited)
Top Ten Stocks as of June 30, 2019
| | % of fund's net assets |
| Alphabet, Inc. Class A | 20.8 |
| Facebook, Inc. Class A | 18.3 |
| The Walt Disney Co. | 7.9 |
| Comcast Corp. Class A | 4.6 |
| Activision Blizzard, Inc. | 4.3 |
| Electronic Arts, Inc. | 3.3 |
| T-Mobile U.S., Inc. | 3.0 |
| Meituan Dianping Class B | 2.8 |
| Netflix, Inc. | 2.5 |
| Verizon Communications, Inc. | 2.3 |
| | 69.8 |
Top Industries (% of fund's net assets)
| As of June 30, 2019 |
| | Interactive Media & Services | 43.5% |
| | Entertainment | 22.4% |
| | Media | 16.8% |
| | Diversified Telecommunication Services | 8.9% |
| | Internet & Direct Marketing Retail | 3.8% |
| | All Others* | 4.6% |

* Includes short-term investments and net other assets (liabilities).
Schedule of Investments June 30, 2019 (Unaudited)
Showing Percentage of Net Assets
| Common Stocks - 99.9% | | | |
| | | Shares | Value |
| Diversified Telecommunication Services - 8.9% | | | |
| Alternative Carriers - 3.5% | | | |
| CenturyLink, Inc. | | 19,100 | $224,616 |
| Cogent Communications Group, Inc. | | 6,663 | 395,516 |
| Iliad SA | | 2,168 | 243,466 |
| Iridium Communications, Inc. (a) | | 29,863 | 694,613 |
| ORBCOMM, Inc. (a) | | 21,431 | 155,375 |
| Vonage Holdings Corp. (a) | | 32,300 | 365,959 |
| Zayo Group Holdings, Inc. (a) | | 10,000 | 329,100 |
| | | | 2,408,645 |
| Integrated Telecommunication Services - 5.4% | | | |
| AT&T, Inc. | | 42,618 | 1,428,129 |
| Atn International, Inc. | | 2,700 | 155,871 |
| Cincinnati Bell, Inc. (a) | | 16,407 | 81,215 |
| Masmovil Ibercom SA (a) | | 21,600 | 481,403 |
| Verizon Communications, Inc. | | 27,500 | 1,571,075 |
| | | | 3,717,693 |
|
| TOTAL DIVERSIFIED TELECOMMUNICATION SERVICES | | | 6,126,338 |
|
| Entertainment - 22.4% | | | |
| Interactive Home Entertainment - 10.1% | | | |
| Activision Blizzard, Inc. | | 62,600 | 2,954,720 |
| Electronic Arts, Inc. (a) | | 22,800 | 2,308,728 |
| Take-Two Interactive Software, Inc. (a) | | 12,700 | 1,441,831 |
| Zynga, Inc. (a) | | 48,600 | 297,918 |
| | | | 7,003,197 |
| Movies & Entertainment - 12.3% | | | |
| Lions Gate Entertainment Corp. Class B | | 28,300 | 328,563 |
| Live Nation Entertainment, Inc. (a) | | 3,000 | 198,750 |
| Netflix, Inc. (a) | | 4,810 | 1,766,809 |
| The Walt Disney Co. | | 39,123 | 5,463,136 |
| World Wrestling Entertainment, Inc. Class A | | 10,200 | 736,542 |
| | | | 8,493,800 |
|
| TOTAL ENTERTAINMENT | | | 15,496,997 |
|
| Hotels, Restaurants & Leisure - 0.9% | | | |
| Casinos & Gaming - 0.9% | | | |
| The Stars Group, Inc. (a) | | 36,300 | 619,641 |
| Interactive Media & Services - 43.5% | | | |
| Interactive Media & Services - 43.5% | | | |
| Alphabet, Inc. Class A (a) | | 13,290 | 14,390,411 |
| Facebook, Inc. Class A (a) | | 65,700 | 12,680,100 |
| Match Group, Inc. (b) | | 4,700 | 316,169 |
| Momo, Inc. ADR | | 29,000 | 1,038,200 |
| TripAdvisor, Inc. (a) | | 5,200 | 240,708 |
| Twitter, Inc. (a) | | 32,700 | 1,141,230 |
| Zillow Group, Inc. Class A (a) | | 6,100 | 279,136 |
| | | | 30,085,954 |
| Internet & Direct Marketing Retail - 3.8% | | | |
| Internet & Direct Marketing Retail - 3.8% | | | |
| Alibaba Group Holding Ltd. sponsored ADR (a) | | 4,100 | 694,745 |
| Meituan Dianping Class B | | 224,200 | 1,965,987 |
| | | | 2,660,732 |
| Media - 16.8% | | | |
| Broadcasting - 4.4% | | | |
| Discovery Communications, Inc. Class C (non-vtg.) (a) | | 26,000 | 739,700 |
| Fox Corp. Class B | | 7,733 | 282,486 |
| Liberty Media Corp.: | | | |
| Liberty Media Class A (a) | | 27,500 | 986,150 |
| Liberty SiriusXM Series A (a) | | 12,700 | 480,187 |
| Sinclair Broadcast Group, Inc. Class A | | 10,700 | 573,841 |
| | | | 3,062,364 |
| Cable & Satellite - 11.8% | | | |
| Charter Communications, Inc. Class A (a) | | 1,900 | 750,842 |
| Comcast Corp. Class A | | 75,800 | 3,204,824 |
| DISH Network Corp. Class A (a) | | 10,700 | 410,987 |
| GCI Liberty, Inc. (a) | | 15,582 | 957,670 |
| Liberty Broadband Corp. Class A (a) | | 14,200 | 1,460,328 |
| Liberty Global PLC Class C (a) | | 39,800 | 1,055,894 |
| Liberty Latin America Ltd. Class C (a) | | 14,036 | 241,279 |
| Sirius XM Holdings, Inc. | | 9,360 | 52,229 |
| | | | 8,134,053 |
| Publishing - 0.6% | | | |
| The New York Times Co. Class A | | 12,200 | 397,964 |
|
| TOTAL MEDIA | | | 11,594,381 |
|
| Software - 0.3% | | | |
| Application Software - 0.3% | | | |
| Sciplay Corp. (A Shares) | | 14,800 | 202,908 |
| Wireless Telecommunication Services - 3.3% | | | |
| Wireless Telecommunication Services - 3.3% | | | |
| Boingo Wireless, Inc. (a) | | 11,000 | 197,670 |
| T-Mobile U.S., Inc. (a) | | 28,128 | 2,085,410 |
| | | | 2,283,080 |
| TOTAL COMMON STOCKS | | | |
| (Cost $60,632,608) | | | 69,070,031 |
|
| Money Market Funds - 0.8% | | | |
| Fidelity Cash Central Fund 2.42% (c) | | 254,612 | 254,663 |
| Fidelity Securities Lending Cash Central Fund 2.42% (c)(d) | | 292,977 | 293,007 |
| TOTAL MONEY MARKET FUNDS | | | |
| (Cost $547,670) | | | 547,670 |
| TOTAL INVESTMENT IN SECURITIES - 100.7% | | | |
| (Cost $61,180,278) | | | 69,617,701 |
| NET OTHER ASSETS (LIABILITIES) - (0.7)% | | | (461,992) |
| NET ASSETS - 100% | | | $69,155,709 |
Legend
(a) Non-income producing
(b) Security or a portion of the security is on loan at period end.
(c) Affiliated fund that is generally available only to investment companies and other accounts managed by Fidelity Investments. The rate quoted is the annualized seven-day yield of the fund at period end. A complete unaudited listing of the fund's holdings as of its most recent quarter end is available upon request. In addition, each Fidelity Central Fund's financial statements are available on the SEC's website or upon request.
(d) Investment made with cash collateral received from securities on loan.
Affiliated Central Funds
Information regarding fiscal year to date income earned by the Fund from investments in Fidelity Central Funds is as follows:
| Fund | Income earned |
| Fidelity Cash Central Fund | $9,166 |
| Fidelity Securities Lending Cash Central Fund | 397 |
| Total | $9,563 |
Amounts in the income column in the above table include any capital gain distributions from underlying funds, which are presented in the corresponding line-item in the Statement of Operations, if applicable. Amount for Fidelity Securities Lending Cash Central Fund represents securities lending income earned from the reinvestment of cash collateral from loaned securities, net of payments to and from borrowers of securities.
Investment Valuation
All investments are categorized as Level 1 under the Fair Value Hierarchy. The inputs or methodology used for valuing securities may not be an indication of the risk associated with investing in those securities. For more information on valuation inputs please refer to the Investment Valuation section in the accompanying Notes to Financial Statements.
See accompanying notes which are an integral part of the financial statements.
Financial Statements
Statement of Assets and Liabilities
| | | June 30, 2019 (Unaudited) |
| Assets | | |
Investment in securities, at value (including securities loaned of $282,534) — See accompanying schedule:
Unaffiliated issuers (cost $60,632,608) | $69,070,031 | |
| Fidelity Central Funds (cost $547,670) | 547,670 | |
| Total Investment in Securities (cost $61,180,278) | | $69,617,701 |
| Foreign currency held at value (cost $40) | | 40 |
| Receivable for fund shares sold | | 83,397 |
| Dividends receivable | | 459 |
| Distributions receivable from Fidelity Central Funds | | 785 |
| Prepaid expenses | | 264 |
| Other receivables | | 937 |
| Total assets | | 69,703,583 |
| Liabilities | | |
| Payable for investments purchased | $187,683 | |
| Payable for fund shares redeemed | 75 | |
| Accrued management fee | 30,336 | |
| Other affiliated payables | 9,792 | |
| Other payables and accrued expenses | 27,038 | |
| Collateral on securities loaned | 292,950 | |
| Total liabilities | | 547,874 |
| Net Assets | | $69,155,709 |
| Net Assets consist of: | | |
| Paid in capital | | $60,706,951 |
| Total distributable earnings (loss) | | 8,448,758 |
| Net Assets | | $69,155,709 |
| Net Asset Value and Maximum Offering Price | | |
| Initial Class: | | |
| Net Asset Value, offering price and redemption price per share ($9,188,206 ÷ 761,833 shares) | | $12.06 |
| Investor Class: | | |
| Net Asset Value, offering price and redemption price per share ($59,967,503 ÷ 5,013,462 shares) | | $11.96 |
See accompanying notes which are an integral part of the financial statements.
Statement of Operations
| | | Six months ended June 30, 2019 (Unaudited) |
| Investment Income | | |
| Dividends | | $159,913 |
| Income from Fidelity Central Funds (including $397 from security lending) | | 9,563 |
| Total income | | 169,476 |
| Expenses | | |
| Management fee | $161,473 | |
| Transfer agent fees | 40,503 | |
| Accounting and security lending fees | 11,689 | |
| Custodian fees and expenses | 8,156 | |
| Independent trustees' fees and expenses | 134 | |
| Audit | 20,754 | |
| Legal | 37 | |
| Miscellaneous | 154 | |
| Total expenses before reductions | 242,900 | |
| Expense reductions | (2,836) | |
| Total expenses after reductions | | 240,064 |
| Net investment income (loss) | | (70,588) |
| Realized and Unrealized Gain (Loss) | | |
| Net realized gain (loss) on: | | |
| Investment securities: | | |
| Unaffiliated issuers | 366,315 | |
| Fidelity Central Funds | 57 | |
| Foreign currency transactions | 213 | |
| Total net realized gain (loss) | | 366,585 |
| Change in net unrealized appreciation (depreciation) on: | | |
| Investment securities: | | |
| Unaffiliated issuers | 9,314,038 | |
| Assets and liabilities in foreign currencies | 6 | |
| Total change in net unrealized appreciation (depreciation) | | 9,314,044 |
| Net gain (loss) | | 9,680,629 |
| Net increase (decrease) in net assets resulting from operations | | $9,610,041 |
See accompanying notes which are an integral part of the financial statements.
Statement of Changes in Net Assets
| | Six months ended June 30, 2019 (Unaudited) | Year ended December 31, 2018 |
| Increase (Decrease) in Net Assets | | |
| Operations | | |
| Net investment income (loss) | $(70,588) | $735,952 |
| Net realized gain (loss) | 366,585 | 3,433,489 |
| Change in net unrealized appreciation (depreciation) | 9,314,044 | (7,025,738) |
| Net increase (decrease) in net assets resulting from operations | 9,610,041 | (2,856,297) |
| Distributions to shareholders | (3,149,321) | (4,870,900) |
| Share transactions - net increase (decrease) | 18,367,244 | 9,243,582 |
| Total increase (decrease) in net assets | 24,827,964 | 1,516,385 |
| Net Assets | | |
| Beginning of period | 44,327,745 | 42,811,360 |
| End of period | $69,155,709 | $44,327,745 |
See accompanying notes which are an integral part of the financial statements.
Financial Highlights
VIP Communication Services Portfolio Initial Class
| | Six months ended (Unaudited) June 30, | Years endedDecember 31, | | | | |
| | 2019 | 2018 | 2017 | 2016 | 2015 | 2014 |
| Selected Per–Share Data | | | | | | |
| Net asset value, beginning of period | $10.58 | $12.74 | $13.10 | $10.85 | $10.74 | $10.77 |
| Income from Investment Operations | | | | | | |
| Net investment income (loss)A | (.01) | .21B | .26 | .19 | .15 | .36C |
| Net realized and unrealized gain (loss) | 2.19 | (.89) | –D | 2.28 | .10 | .03 |
| Total from investment operations | 2.18 | (.68) | .26 | 2.47 | .25 | .39 |
| Distributions from net investment income | (.01) | (.19) | (.39) | (.15) | (.13)E | (.40) |
| Distributions from net realized gain | (.69) | (1.29) | (.23) | (.08) | (.01)E | (.02) |
| Total distributions | (.70) | (1.48) | (.62) | (.22)F | (.14) | (.42) |
| Redemption fees added to paid in capitalA | – | – | –D | –D | –D | –D |
| Net asset value, end of period | $12.06 | $10.58 | $12.74 | $13.10 | $10.85 | $10.74 |
| Total ReturnG,H,I | 21.23% | (5.36)% | 2.05% | 22.81% | 2.34% | 3.59% |
| Ratios to Average Net AssetsJ,K | | | | | | |
| Expenses before reductions | .74%L | .81% | .76% | .78% | .88% | .96% |
| Expenses net of fee waivers, if any | .74%L | .81% | .76% | .78% | .88% | .95% |
| Expenses net of all reductions | .73%L | .79% | .74% | .77% | .87% | .93% |
| Net investment income (loss) | (.16)%L | 1.87%B | 2.02% | 1.52% | 1.36% | 3.31%C |
| Supplemental Data | | | | | | |
| Net assets, end of period (000 omitted) | $9,188 | $5,702 | $6,067 | $15,797 | $4,839 | $3,723 |
| Portfolio turnover rateM | 57%L | 162% | 74% | 100% | 64% | 99% |
A Calculated based on average shares outstanding during the period.
B Net investment income per share reflects a large, non-recurring dividend which amounted to $.05 per share. Excluding this non-recurring dividend, the ratio of net investment income (loss) to average net assets would have been 1.45%.
C Net investment income per share reflects a large, non-recurring dividend which amounted to $.21 per share. Excluding this non-recurring dividend, the ratio of net investment income (loss) to average net assets would have been 1.41%.
D Amount represents less than $.005 per share.
E The amounts shown reflect certain reclassifications related to book to tax differences that were made in the year shown.
F Total distributions of $.22 per share is comprised of distributions from net investment income of $.147 and distributions from net realized gain of $.077 per share.
G Total returns for periods of less than one year are not annualized.
H Total returns do not reflect charges attributable to your insurance company's separate account. Inclusion of these charges would reduce the total returns shown.
I Total returns would have been lower if certain expenses had not been reduced during the applicable periods shown.
J Fees and expenses of any underlying Fidelity Central Funds are not included in the Fund's expense ratio. The Fund indirectly bears its proportionate share of the expenses of any underlying Fidelity Central Funds.
K Expense ratios reflect operating expenses of the class. Expenses before reductions do not reflect amounts reimbursed by the investment adviser or reductions from brokerage service arrangements or reductions from other expense offset arrangements and do not represent the amount paid by the class during periods when reimbursements or reductions occur. Expenses net of fee waivers reflect expenses after reimbursement by the investment adviser but prior to reductions from brokerage service arrangements or other expense offset arrangements. Expenses net of all reductions represent the net expenses paid by the class.
L Annualized
M Amount does not include the portfolio activity of any underlying Fidelity Central Funds.
See accompanying notes which are an integral part of the financial statements.
VIP Communication Services Portfolio Investor Class
| | Six months ended (Unaudited) June 30, | Years endedDecember 31, | | | | |
| | 2019 | 2018 | 2017 | 2016 | 2015 | 2014 |
| Selected Per–Share Data | | | | | | |
| Net asset value, beginning of period | $10.50 | $12.65 | $13.02 | $10.79 | $10.67 | $10.71 |
| Income from Investment Operations | | | | | | |
| Net investment income (loss)A | (.01) | .20B | .25 | .18 | .14 | .35C |
| Net realized and unrealized gain (loss) | 2.17 | (.88) | (.01) | 2.27 | .11 | .03 |
| Total from investment operations | 2.16 | (.68) | .24 | 2.45 | .25 | .38 |
| Distributions from net investment income | (.01) | (.18) | (.37) | (.14) | (.12)D | (.40) |
| Distributions from net realized gain | (.69) | (1.29) | (.23) | (.08) | (.01)D | (.02) |
| Total distributions | (.70) | (1.47) | (.61)E | (.22) | (.13) | (.42) |
| Redemption fees added to paid in capitalA | – | – | –F | –F | –F | –F |
| Net asset value, end of period | $11.96 | $10.50 | $12.65 | $13.02 | $10.79 | $10.67 |
| Total ReturnG,H,I | 21.17% | (5.39)% | 1.89% | 22.69% | 2.38% | 3.48% |
| Ratios to Average Net AssetsJ,K | | | | | | |
| Expenses before reductions | .82%L | .89% | .84% | .86% | .95% | 1.01% |
| Expenses net of fee waivers, if any | .82%L | .89% | .84% | .86% | .95% | .99% |
| Expenses net of all reductions | .81%L | .87% | .83% | .85% | .94% | .97% |
| Net investment income (loss) | (.24)%L | 1.79%B | 1.94% | 1.44% | 1.29% | 3.27%C |
| Supplemental Data | | | | | | |
| Net assets, end of period (000 omitted) | $59,968 | $38,626 | $36,744 | $74,059 | $23,080 | $16,159 |
| Portfolio turnover rateM | 57%L | 162% | 74% | 100% | 64% | 99% |
A Calculated based on average shares outstanding during the period.
B Net investment income per share reflects a large, non-recurring dividend which amounted to $.05 per share. Excluding this non-recurring dividend, the ratio of net investment income (loss) to average net assets would have been 1.37%.
C Net investment income per share reflects a large, non-recurring dividend which amounted to $.21 per share. Excluding this non-recurring dividend, the ratio of net investment income (loss) to average net assets would have been 1.37%.
D The amounts shown reflect certain reclassifications related to book to tax differences that were made in the year shown.
E Total distributions of $.61 per share is comprised of distributions from net investment income of $.373 and distributions from net realized gain of $.232 per share.
F Amount represents less than $.005 per share.
G Total returns for periods of less than one year are not annualized.
H Total returns do not reflect charges attributable to your insurance company's separate account. Inclusion of these charges would reduce the total returns shown.
I Total returns would have been lower if certain expenses had not been reduced during the applicable periods shown.
J Fees and expenses of any underlying Fidelity Central Funds are not included in the Fund's expense ratio. The Fund indirectly bears its proportionate share of the expenses of any underlying Fidelity Central Funds.
K Expense ratios reflect operating expenses of the class. Expenses before reductions do not reflect amounts reimbursed by the investment adviser or reductions from brokerage service arrangements or reductions from other expense offset arrangements and do not represent the amount paid by the class during periods when reimbursements or reductions occur. Expenses net of fee waivers reflect expenses after reimbursement by the investment adviser but prior to reductions from brokerage service arrangements or other expense offset arrangements. Expenses net of all reductions represent the net expenses paid by the class.
L Annualized
M Amount does not include the portfolio activity of any underlying Fidelity Central Funds.
See accompanying notes which are an integral part of the financial statements.
Notes to Financial Statements (Unaudited)
For the period ended June 30, 2019
1. Organization.
VIP Communication Services Portfolio (the Fund) is a non-diversified fund of Variable Insurance Products Fund IV (the Trust) and is authorized to issue an unlimited number of shares. The Trust is registered under the Investment Company Act of 1940, as amended (the 1940 Act), as an open-end management investment company organized as a Massachusetts business trust. Shares of the Fund may only be purchased by insurance companies for the purpose of funding variable annuity or variable life insurance contracts. The Fund offers the following classes of shares: Initial Class shares and Investor Class shares. All classes have equal rights and voting privileges, except for matters affecting a single class.
2. Investments in Fidelity Central Funds.
The Fund invests in Fidelity Central Funds, which are open-end investment companies generally available only to other investment companies and accounts managed by the investment adviser and its affiliates. The Fund's Schedule of Investments lists each of the Fidelity Central Funds held as of period end, if any, as an investment of the Fund, but does not include the underlying holdings of each Fidelity Central Fund. As an Investing Fund, the Fund indirectly bears its proportionate share of the expenses of the underlying Fidelity Central Funds.
The Money Market Central Funds seek preservation of capital and current income and are managed by Fidelity Investments Money Management, Inc. (FIMM), an affiliate of the investment adviser. Annualized expenses of the Money Market Central Funds as of their most recent shareholder report date ranged from less than .005% to .01%.
A complete unaudited list of holdings for each Fidelity Central Fund is available upon request or at the Securities and Exchange Commission (the SEC) website at www.sec.gov. In addition, the financial statements of the Fidelity Central Funds are available on the SEC website or upon request.
3. Significant Accounting Policies.
The Fund is an investment company and applies the accounting and reporting guidance of the Financial Accounting Standards Board (FASB) Accounting Standards Codification Topic 946 Financial Services – Investments Companies. The financial statements have been prepared in conformity with accounting principles generally accepted in the United States of America (GAAP), which require management to make certain estimates and assumptions at the date of the financial statements. Actual results could differ from those estimates. Subsequent events, if any, through the date that the financial statements were issued have been evaluated in the preparation of the financial statements. The following summarizes the significant accounting policies of the Fund:
Investment Valuation. Investments are valued as of 4:00 p.m. Eastern time on the last calendar day of the period. The Board of Trustees (the Board) has delegated the day to day responsibility for the valuation of the Fund's investments to the Fair Value Committee (the Committee) established by the Fund's investment adviser. In accordance with valuation policies and procedures approved by the Board, the Fund attempts to obtain prices from one or more third party pricing vendors or brokers to value its investments. When current market prices, quotations or currency exchange rates are not readily available or reliable, investments will be fair valued in good faith by the Committee, in accordance with procedures adopted by the Board. Factors used in determining fair value vary by investment type and may include market or investment specific events. The frequency with which these procedures are used cannot be predicted and they may be utilized to a significant extent. The Committee oversees the Fund's valuation policies and procedures and reports to the Board on the Committee's activities and fair value determinations. The Board monitors the appropriateness of the procedures used in valuing the Fund's investments and ratifies the fair value determinations of the Committee.
The Fund categorizes the inputs to valuation techniques used to value its investments into a disclosure hierarchy consisting of three levels as shown below:
- Level 1 – quoted prices in active markets for identical investments
- Level 2 – other significant observable inputs (including quoted prices for similar investments, interest rates, prepayment speeds, etc.)
- Level 3 – unobservable inputs (including the Fund's own assumptions based on the best information available)
Valuation techniques used to value the Fund's investments by major category are as follows:
Equity securities, including restricted securities, for which market quotations are readily available, are valued at the last reported sale price or official closing price as reported by a third party pricing vendor on the primary market or exchange on which they are traded and are categorized as Level 1 in the hierarchy. In the event there were no sales during the day or closing prices are not available, securities are valued at the last quoted bid price or may be valued using the last available price and are generally categorized as Level 2 in the hierarchy. For foreign equity securities, when market or security specific events arise, comparisons to the valuation of American Depositary Receipts (ADRs), futures contracts, Exchange-Traded Funds (ETFs) and certain indexes as well as quoted prices for similar securities may be used and would be categorized as Level 2 in the hierarchy. For equity securities, including restricted securities, where observable inputs are limited, assumptions about market activity and risk are used and these securities may be categorized as Level 3 in the hierarchy.
Investments in open-end mutual funds, including the Fidelity Central Funds, are valued at their closing net asset value (NAV) each business day and are categorized as Level 1 in the hierarchy.
Changes in valuation techniques may result in transfers in or out of an assigned level within the disclosure hierarchy.
Foreign Currency. The Fund may use foreign currency contracts to facilitate transactions in foreign-denominated securities. Gains and losses from these transactions may arise from changes in the value of the foreign currency or if the counterparties do not perform under the contracts' terms.
Foreign-denominated assets, including investment securities, and liabilities are translated into U.S. dollars at the exchange rates at period end. Purchases and sales of investment securities, income and dividends received and expenses denominated in foreign currencies are translated into U.S. dollars at the exchange rate in effect on the transaction date.
The effects of exchange rate fluctuations on investments are included with the net realized and unrealized gain (loss) on investment securities. Other foreign currency transactions resulting in realized and unrealized gain (loss) are disclosed separately.
Investment Transactions and Income. For financial reporting purposes, the Fund's investment holdings and NAV include trades executed through the end of the last business day of the period. The NAV per share for processing shareholder transactions is calculated as of the close of business of the New York Stock Exchange (NYSE), normally 4:00 p.m. Eastern time and includes trades executed through the end of the prior business day. Gains and losses on securities sold are determined on the basis of identified cost and include proceeds received from litigation. Dividend income is recorded on the ex-dividend date, except for certain dividends from foreign securities where the ex-dividend date may have passed, which are recorded as soon as the Fund is informed of the ex-dividend date. Non-cash dividends included in dividend income, if any, are recorded at the fair market value of the securities received. Income and capital gain distributions from Fidelity Central Funds, if any, are recorded on the ex-dividend date. Certain distributions received by the Fund represent a return of capital or capital gain. The Fund determines the components of these distributions subsequent to the ex-dividend date, based upon receipt of tax filings or other correspondence relating to the underlying investment. These distributions are recorded as a reduction of cost of investments and/or as a realized gain. Investment income is recorded net of foreign taxes withheld where recovery of such taxes is uncertain.
Class Allocations and Expenses. Investment income, realized and unrealized capital gains and losses, common expenses of the Fund, and certain fund-level expense reductions, if any, are allocated daily on a pro-rata basis to each class based on the relative net assets of each class to the total net assets of the Fund. Each class differs with respect to transfer agent fees incurred. Certain expense reductions may also differ by class. For the reporting period, the allocated portion of income and expenses to each class as a percent of its average net assets may vary due to the timing of recording these transactions in relation to fluctuating net assets of the classes. Expenses directly attributable to a fund are charged to that fund. Expenses attributable to more than one fund are allocated among the respective funds on the basis of relative net assets or other appropriate methods. Expense estimates are accrued in the period to which they relate and adjustments are made when actual amounts are known.
Income Tax Information and Distributions to Shareholders. Each year, the Fund intends to qualify as a regulated investment company under Subchapter M of the Internal Revenue Code, including distributing substantially all of its taxable income and realized gains. As a result, no provision for U.S. Federal income taxes is required. The Fund files a U.S. federal tax return, in addition to state and local tax returns as required. The Fund's federal income tax returns are subject to examination by the Internal Revenue Service (IRS) for a period of three fiscal years after they are filed. State and local tax returns may be subject to examination for an additional fiscal year depending on the jurisdiction. Foreign taxes are provided for based on the Fund's understanding of the tax rules and rates that exist in the foreign markets in which it invests.
Distributions are declared and recorded on the ex-dividend date. Income and capital gain distributions are declared separately for each class. Income and capital gain distributions are determined in accordance with income tax regulations, which may differ from GAAP.
Capital accounts within the financial statements are adjusted for permanent book-tax differences. These adjustments have no impact on net assets or the results of operations. Capital accounts are not adjusted for temporary book-tax differences which will reverse in a subsequent period.
Book-tax differences are primarily due to foreign currency transactions and losses deferred due to wash sales.
As of period end, the cost and unrealized appreciation (depreciation) in securities, and derivatives if applicable, for federal income tax purposes were as follows:
| Gross unrealized appreciation | $9,605,564 |
| Gross unrealized depreciation | (1,819,506) |
| Net unrealized appreciation (depreciation) | $7,786,058 |
| Tax cost | $61,831,643 |
4. Purchases and Sales of Investments.
Purchases and sales of securities, other than short-term securities, aggregated $32,552,824 and $16,881,821, respectively.
5. Fees and Other Transactions with Affiliates.
Management Fee. Fidelity SelectCo, LLC (the investment adviser) and its affiliates provide the Fund with investment management related services for which the Fund pays a monthly management fee. The management fee is the sum of an individual fund fee rate that is based on an annual rate of .30% of the Fund's average net assets and an annualized group fee rate that averaged .24% during the period. The group fee rate is based upon the average net assets of all the mutual funds advised by Fidelity Management & Research Company (FMR) and the investment adviser. The group fee rate decreases as assets under management increase and increases as assets under management decrease. For the reporting period, the total annualized management fee rate was .54% of the Fund's average net assets.
Transfer Agent Fees. Fidelity Investments Institutional Operations Company, Inc. (FIIOC), an affiliate of the investment adviser, is the Fund's transfer, dividend disbursing, and shareholder servicing agent. FIIOC receives an asset-based fee with respect to each class. Each class pays a fee for transfer agent services, typesetting and printing and mailing of shareholder reports, excluding mailing of proxy statements, equal to an annual rate of class-level average net assets. The annual rate for Investor Class is .15% and the annual rate for all other classes is .07%. For the period, transfer agent fees for each class were as follows:
| Initial Class | $2,455 |
| Investor Class | 38,048 |
| | $40,503 |
Accounting and Security Lending Fees. Fidelity Service Company, Inc. (FSC), an affiliate of the investment adviser, maintains the Fund's accounting records. The accounting fee is based on the level of average net assets for each month. Prior to April 1, 2019, FSC had a separate agreement with the Fund for administration of the security lending program, based on the number and duration of lending transactions. For the period, the total fees paid for accounting and administration of securities lending were equivalent to an annualized rate of .04%.
Brokerage Commissions. The Fund placed a portion of its portfolio transactions with brokerage firms which are affiliates of the investment adviser. Brokerage commissions are included in net realized gain (loss) and change in net unrealized appreciation (depreciation) in the Statement of Operations. The commissions paid to these affiliated firms were $674 for the period.
Interfund Trades. The Fund may purchase from or sell securities to other Fidelity Funds under procedures adopted by the Board. The procedures have been designed to ensure these interfund trades are executed in accordance with Rule 17a-7 of the 1940 Act. Interfund trades are included within the respective purchases and sales amounts shown in the Purchases and Sales of Investments note.
6. Committed Line of Credit.
The Fund participates with other funds managed by the investment adviser or an affiliate in a $4.25 billion credit facility (the "line of credit") to be utilized for temporary or emergency purposes to fund shareholder redemptions or for other short-term liquidity purposes. The Fund has agreed to pay commitment fees on its pro-rata portion of the line of credit, which amounted to $71 and is reflected in Miscellaneous expenses on the Statement of Operations. During the period, the Fund did not borrow on this line of credit.
7. Security Lending.
The Fund lends portfolio securities from time to time in order to earn additional income. For equity securities, lending agents are used, including National Financial Services (NFS), an affiliate of the Fund. Pursuant to a securities lending agreement, NFS will receive a fee, which is capped at 9.9% of daily lending revenue, for its services as lending agent. The Fund may lend securities to certain qualified borrowers. On the settlement date of the loan, the Fund receives collateral (in the form of U.S. Treasury obligations, letters of credit and/or cash) against the loaned securities and maintains collateral in an amount not less than 100% of the market value of the loaned securities during the period of the loan. The market value of the loaned securities is determined at the close of business of the Fund and any additional required collateral is delivered to the Fund on the next business day. The Fund or borrower may terminate the loan at any time, and if the borrower defaults on its obligation to return the securities loaned because of insolvency or other reasons, the Fund may apply collateral received from the borrower against the obligation. The Fund may experience delays and costs in recovering the securities loaned. Any cash collateral received is invested in the Fidelity Securities Lending Cash Central Fund. The value of loaned securities and cash collateral at period end are disclosed on the Fund's Statement of Assets and Liabilities. Security lending income represents the income earned on investing cash collateral, less rebates paid to borrowers and any lending agent fees associated with the loan, plus any premium payments received for lending certain types of securities. Security lending income is presented in the Statement of Operations as a component of income from Fidelity Central Funds.
8. Expense Reductions.
Commissions paid to certain brokers with whom the investment adviser, or its affiliates, places trades on behalf of the Fund include an amount in addition to trade execution, which may be rebated back to the Fund to offset certain expenses. This amount totaled $2,651 for the period.
In addition, during the period the investment adviser reimbursed and/or waived a portion of fund-level operating expenses in the amount of $185.
9. Distributions to Shareholders.
Distributions to shareholders of each class were as follows:
| | Six months ended
June 30, 2019 | Year ended
December 31, 2018 |
| Distributions to shareholders | | |
| Initial Class | 411,415 | $652,471 |
| Investor Class | 2,737,906 | 4,218,429 |
| Total | $3,149,321 | $4,870,900 |
10. Share Transactions.
Transactions for each class of shares were as follows:
| | Shares | Shares | Dollars | Dollars |
| | Six months ended June 30, 2019 | Year ended December 31, 2018 | Six months ended June 30, 2019 | Year ended December 31, 2018 |
| Initial Class | | | | |
| Shares sold | 349,418 | 196,801 | $4,170,233 | $2,250,219 |
| Reinvestment of distributions | 37,266 | 60,945 | 411,415 | 652,471 |
| Shares redeemed | (163,625) | (195,337) | (1,884,604) | (2,224,399) |
| Net increase (decrease) | 223,059 | 62,409 | $2,697,044 | $678,291 |
| Investor Class | | | | |
| Shares sold | 1,727,903 | 1,290,839 | $20,228,883 | $14,552,923 |
| Reinvestment of distributions | 249,809 | 396,674 | 2,737,906 | 4,218,429 |
| Shares redeemed | (641,668) | (914,084) | (7,296,589) | (10,206,061) |
| Net increase (decrease) | 1,336,044 | 773,429 | $15,670,200 | $8,565,291 |
11. Other.
The Fund's organizational documents provide former and current trustees and officers with a limited indemnification against liabilities arising in connection with the performance of their duties to the Fund. In the normal course of business, the Fund may also enter into contracts that provide general indemnifications. The Fund's maximum exposure under these arrangements is unknown as this would be dependent on future claims that may be made against the Fund. The risk of material loss from such claims is considered remote.
At the end of the period, the investment adviser or its affiliates were the owners of record of 100% of the total outstanding shares of the Fund.
Shareholder Expense Example
As a shareholder of the Fund, you incur two types of costs: (1) transaction costs and (2) ongoing costs, including management fees and other Fund expenses. This Example is intended to help you understand your ongoing costs (in dollars) of investing in the Fund and to compare these costs with the ongoing costs of investing in other mutual funds.
The Example is based on an investment of $1,000 invested at the beginning of the period and held for the entire period (January 1, 2019 to June 30, 2019).
Actual Expenses
The first line of the accompanying table for each class of the Fund provides information about actual account values and actual expenses. You may use the information in this line, together with the amount you invested, to estimate the expenses that you paid over the period. Simply divide your account value by $1,000.00 (for example, an $8,600 account value divided by $1,000.00 = 8.6), then multiply the result by the number in the first line for a class of the Fund under the heading entitled "Expenses Paid During Period" to estimate the expenses you paid on your account during this period. The estimate of expenses does not include any fees or other expenses of any variable annuity or variable life insurance product. If they were, the estimate of expenses you paid during the period would be higher, and your ending account value would be lower. In addition, the Fund, as a shareholder in the underlying Fidelity Central Funds, will indirectly bear its pro-rata share of the fees and expenses incurred by the underlying Fidelity Central Funds. These fees and expenses are not included in the Fund's annualized expense ratio used to calculate the expense estimate in the table below.
Hypothetical Example for Comparison Purposes
The second line of the accompanying table for each class of the Fund provides information about hypothetical account values and hypothetical expenses based on a Class' actual expense ratio and an assumed rate of return of 5% per year before expenses, which is not the Class' actual return. The hypothetical account values and expenses may not be used to estimate the actual ending account balance or expenses you paid for the period. You may use this information to compare the ongoing costs of investing in the Fund and other funds. To do so, compare this 5% hypothetical example with the 5% hypothetical examples that appear in the shareholder reports of the other funds. The estimate of expenses does not include any fees or other expenses of any variable annuity or variable life insurance product. If they were, the estimate of expenses you paid during the period would be higher, and your ending account value would be lower. In addition, the Fund, as a shareholder in the underlying Fidelity Central Funds, will indirectly bear its pro-rata share of the fees and expenses incurred by the underlying Fidelity Central Funds. These fees and expenses are not included in the Fund's annualized expense ratio used to calculate the expense estimate in the table below.
Please note that the expenses shown in the table are meant to highlight your ongoing costs only and do not reflect any transaction costs. Therefore, the second line of the table is useful in comparing ongoing costs only, and will not help you determine the relative total costs of owning different funds.
| | Annualized Expense Ratio-A | Beginning
Account Value
January 1, 2019 | Ending
Account Value
June 30, 2019 | Expenses Paid
During Period-B
January 1, 2019
to June 30, 2019 |
| Initial Class | .74% | | | |
| Actual | | $1,000.00 | $1,212.30 | $4.06 |
| Hypothetical-C | | $1,000.00 | $1,021.12 | $3.71 |
| Investor Class | .82% | | | |
| Actual | | $1,000.00 | $1,211.70 | $4.50 |
| Hypothetical-C | | $1,000.00 | $1,020.73 | $4.11 |
A Annualized expense ratio reflects expenses net of applicable fee waivers.
B Expenses are equal to each Class' annualized expense ratio, multiplied by the average account value over the period, multiplied by 181/365 (to reflect the one-half year period).
C 5% return per year before expenses
Board Approval of Investment Advisory Contracts and Management Fees
VIP Communication Services Portfolio (formerly known as VIP Telecommunications Portfolio)
Each year, the Board of Trustees, including the Independent Trustees (together, the Board), votes on the renewal of the management contract with Fidelity SelectCo, LLC (SelectCo), an affiliate of Fidelity Management & Research Company (FMR), and the sub-advisory agreements with affiliates of FMR (together, the Advisory Contracts) for the fund. SelectCo and the sub-advisers are referred to herein as the Investment Advisers. The Board, assisted by the advice of fund counsel and Independent Trustees' counsel, requests and considers a broad range of information relevant to the renewal of the Advisory Contracts throughout the year.
The Board meets regularly and, at each of its meetings, covers an extensive agenda of topics and materials and considers factors that are relevant to its annual consideration of the renewal of the fund's Advisory Contracts, including the services and support provided to the fund and its shareholders. The Board has established various standing committees (Committees), each composed of and chaired by Independent Trustees with varying backgrounds, to which the Board has assigned specific subject matter responsibilities in order to enhance effective decision-making by the Board. The Board, acting directly and through its Committees, requests and receives information concerning the annual consideration of the renewal of the fund's Advisory Contracts. The Board also meets as needed to review matters specifically related to the Board's annual consideration of the renewal of the Advisory Contracts. Members of the Board may also meet with trustees of other Fidelity funds through joint ad hoc committees to discuss certain matters relevant to all of the Fidelity funds.
At its January 2019 meeting, the Board unanimously determined to renew the fund's Advisory Contracts. In reaching its determination, the Board considered all factors it believed relevant, including (i) the nature, extent, and quality of the services to be provided to the fund and its shareholders (including the investment performance of the fund); (ii) the competitiveness of the fund's management fee and total expense ratio relative to peer funds; (iii) the total costs of the services to be provided by and the profits to be realized by Fidelity from its relationships with the fund; and (iv) the extent to which, if any, economies of scale exist and would be realized as the fund grows, and whether any economies of scale are appropriately shared with fund shareholders.
In considering whether to renew the Advisory Contracts for the fund, the Board reached a determination, with the assistance of fund counsel and Independent Trustees' counsel and through the exercise of its business judgment, that the renewal of the Advisory Contracts was in the best interests of the fund and its shareholders and that the compensation payable under the Advisory Contracts was fair and reasonable. The Board's decision to renew the Advisory Contracts was not based on any single factor, but rather was based on a comprehensive consideration of all the information provided to the Board at its meetings throughout the year. The Board, in reaching its determination to renew the Advisory Contracts, was aware that shareholders of the fund have a broad range of investment choices available to them, including a wide choice among funds offered by Fidelity's competitors, and that the fund's shareholders, who have the opportunity to review and weigh the disclosure provided by the fund in its prospectus and other public disclosures, have chosen to invest in this fund, which is part of the Fidelity family of funds.
Nature, Extent, and Quality of Services Provided. The Board considered Fidelity's staffing as it relates to the fund, including the backgrounds of investment personnel of Fidelity, and also considered the fund's investment objective, strategies, and related investment philosophy. The Independent Trustees also had discussions with senior management of Fidelity's investment operations and investment groups. The Board considered the structure of the investment personnel compensation program and whether this structure provides appropriate incentives to act in the best interests of the fund. Additionally, the Board considered the portfolio managers' investments, if any, in the funds that they manage.
Resources Dedicated to Investment Management and Support Services. The Board and the Fund Oversight and Research Committees reviewed the general qualifications and capabilities of Fidelity's investment staff, including its size, education, experience, and resources, as well as Fidelity's approach to recruiting, training, managing, and compensating investment personnel. The Board noted that Fidelity has continued to increase the resources devoted to non-U.S. offices, including expansion of Fidelity's global investment organization. The Board also noted that Fidelity's analysts have extensive resources, tools and capabilities that allow them to conduct sophisticated quantitative and fundamental analysis, as well as credit analysis of issuers, counterparties and guarantors. Further, the Board considered that Fidelity's investment professionals have sufficient access to global information and data so as to provide competitive investment results over time, and that those professionals also have access to sophisticated tools that permit them to assess portfolio construction and risk and performance attribution characteristics continuously, as well as to transmit new information and research conclusions rapidly around the world. Additionally, in its deliberations, the Board considered Fidelity's trading, risk management, compliance, and technology and operations capabilities and resources, which are integral parts of the investment management process.
Shareholder and Administrative Services. The Board considered (i) the nature, extent, quality, and cost of advisory, administrative, and shareholder services performed by the Investment Advisers and their affiliates under the Advisory Contracts and under separate agreements covering transfer agency, pricing and bookkeeping, and securities lending services for the fund; (ii) the nature and extent of the supervision of third party service providers, principally custodians, subcustodians, and pricing vendors; and (iii) the resources devoted to, and the record of compliance with, the fund's compliance policies and procedures. The Board also reviewed the allocation of fund brokerage, including allocations to brokers affiliated with the Investment Advisers, the use of brokerage commissions to pay fund expenses, and the use of "soft" commission dollars to pay for research services.
The Board noted that the growth of fund assets over time across the complex allows Fidelity to reinvest in the development of services designed to enhance the value and convenience of the Fidelity funds as investment vehicles. These services include 24-hour access to account information and market information through telephone representatives and over the Internet, investor education materials and asset allocation tools, and the expanded availability of Fidelity Investor Centers.
The Board noted that it and the boards of certain other Fidelity funds had formed an ad hoc Committee on Transfer Agency Fees to review the variety of transfer agency fee structures throughout the industry and Fidelity's competitive positioning with respect to industry participants.
Investment in a Large Fund Family. The Board considered the benefits to shareholders of investing in a Fidelity fund, including the benefits of investing in a fund that is part of a large family of funds offering a variety of investment disciplines and providing a large variety of mutual fund investor services. The Board noted that Fidelity had taken, or had made recommendations that resulted in the Fidelity funds taking, a number of actions over the previous year that benefited particular funds, including: (i) continuing to dedicate additional resources to Fidelity's investment research process, which includes meetings with management of issuers of securities in which the funds invest, and to the support of the senior management team that oversees asset management; (ii) continuing efforts to enhance Fidelity's global research capabilities; (iii) launching new funds and making other enhancements to meet client needs; (iv) launching new share classes of existing funds; (v) eliminating purchase minimums and broadening eligibility requirements for certain funds and share classes; (vi) reducing management fees and total expenses for certain growth equity funds and index funds; (vii) lowering expense caps for certain existing funds and classes, and converting certain voluntary expense caps to contractual caps, to reduce expenses borne by shareholders; (viii) eliminating short-term redemption fees for funds that had such fees; (ix) rationalizing product lines and gaining increased efficiencies from fund mergers and share class consolidations; (x) continuing to develop, acquire and implement systems and technology to improve services to the funds and shareholders, strengthen information security, and increase efficiency; and (xi) continuing to implement enhancements to further strengthen Fidelity's product line to increase investors' probability of success in achieving their investment goals, including retirement income goals.
Investment Performance. The Board considered whether the fund has operated in accordance with its investment objective, as well as its record of compliance with its investment restrictions and its performance history.
The Board took into account discussions that occur at Board meetings throughout the year with representatives of the Investment Advisers about fund investment performance. In this regard the Board noted that as part of regularly scheduled fund reviews and other reports to the Board on fund performance, the Board considers annualized return information for the fund for different time periods, measured against an appropriate securities market index ("benchmark index"). In its evaluation of fund investment performance, the Board gave particular attention to information indicating changes in performance of certain Fidelity funds for specific time periods and discussed with the Investment Advisers the reasons for any overperformance or underperformance.
In addition to reviewing absolute and relative fund performance, the Independent Trustees periodically consider the appropriateness of fund performance metrics in evaluating the results achieved. In general, the Independent Trustees believe that fund performance should be evaluated based on net performance (after fees and expenses) of both the highest performing and lowest performing fund share classes, where applicable, compared to appropriate benchmark indices, over appropriate time periods that may include full market cycles, taking into account relevant factors including the following: general market conditions; issuer-specific information; and fund cash flows and other factors.
The Independent Trustees recognize that shareholders evaluate performance on a net basis over their own holding periods, for which one-, three-, and five-year periods are often used as a proxy. For this reason, the performance information reviewed by the Board also included net cumulative total return information for the fund and an appropriate benchmark index for the most recent one-, three-, and five-year periods ended June 30, 2018, as shown below.
VIP Communication Services Portfolio
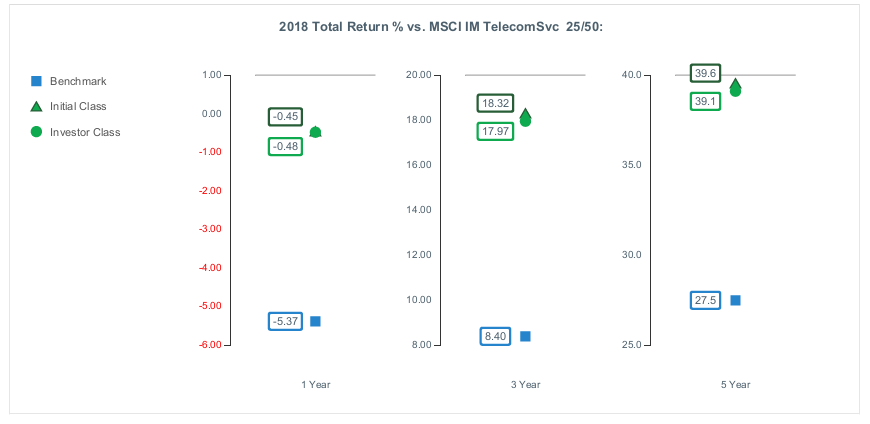
Based on its review, the Board concluded that the nature, extent, and quality of services provided to the fund under the Advisory Contracts should continue to benefit the shareholders of the fund.
Competitiveness of Management Fee and Total Expense Ratio. The Board considered the fund's management fee and total expense ratio compared to "mapped groups" of competitive funds and classes created for the purpose of facilitating the Trustees' competitive analysis of management fees and total expenses. Fidelity creates "mapped groups" by combining similar Lipper investment objective categories that have comparable investment mandates. For this purpose, all sector focused equity variable annuity funds are grouped in the same mapped group. Combining Lipper investment objective categories aids the Board's management fee and total expense ratio comparisons by broadening the competitive group used for comparison.
Management Fee. The Board considered two proprietary management fee comparisons for the 12-month periods ended June 30 shown in basis points (BP) in the chart below. The group of Lipper funds used by the Board for management fee comparisons is referred to below as the "Total Mapped Group." The Total Mapped Group comparison focuses on a fund's standing in terms of gross management fees before expense reimbursements or caps relative to the total universe of funds with comparable investment mandates (i.e., sector equities), regardless of whether their management fee structures also are comparable. Funds with comparable management fee structures have similar management fee contractual arrangements (
e.g., flat rate charged for advisory services, all-inclusive fee rate,
etc.). "TMG %" represents the percentage of funds in the Total Mapped Group that had management fees that were lower than the fund's. For example, a hypothetical TMG % of 20% would mean that 80% of the funds in the Total Mapped Group had higher, and 20% had lower, management fees than the fund. The fund's actual TMG %s and the number of funds in the Total Mapped Group are in the chart below. The "Asset-Size Peer Group" (ASPG) comparison focuses on a fund's standing relative to a subset of non-Fidelity funds within the Total Mapped Group that are similar in size and management fee structure. For example, if a fund is in the first quartile of the ASPG, the fund's management fee ranks in the least expensive or lowest 25% of funds in the ASPG. The ASPG represents at least 15% of the funds in the Total Mapped Group with comparable asset size and management fee structures, subject to a minimum of 50 funds (or all funds in the Total Mapped Group if fewer than 50). Additional information, such as the ASPG quartile in which the fund's management fee rate ranked, is also included in the chart and was considered by the Board.
VIP Communication Services Portfolio

The Board noted that the fund's management fee rate ranked below the median of its Total Mapped Group and below the median of its ASPG for the 12-month period ended June 30, 2018.
The Board noted that it and the boards of other Fidelity funds formed an ad hoc Committee on Group Fee, which meets periodically, to conduct an in-depth review of the "group fee" component of the management fee of funds with such management fee structures. The Committee's focus included the mechanics of the group fee, the competitive landscape of group fee structures, Fidelity funds with no group fee component and investment products not included in group fee assets. The Board also considered that, for funds subject to the group fee, FMR agreed to voluntarily waive fees over a specified period of time in amounts designed to account for assets converted from certain funds to certain collective investment trusts.
Based on its review, the Board concluded that the fund's management fee is fair and reasonable in light of the services that the fund receives and the other factors considered.
Total Expense Ratio. In its review of each class's total expense ratio, the Board considered the fund's management fee rate as well as other fund or class expenses, as applicable, such as transfer agent fees, pricing and bookkeeping fees, and custodial, legal, and audit fees. The Board also noted that Fidelity may agree to waive fees and expenses from time to time, and the extent to which, if any, it has done so for the fund. As part of its review, the Board also considered the current and historical total expense ratios of each class of the fund compared to competitive fund median expenses. Each class of the fund is compared to those funds and classes in the Total Mapped Group (used by the Board for management fee comparisons) that have a similar sales load structure.
The Board noted that the total expense ratio of each class ranked below the competitive median for the 12-month period ended June 30, 2018.
Fees Charged to Other Fidelity Clients. The Board also considered Fidelity fee structures and other information with respect to clients of Fidelity, such as other funds advised or subadvised by Fidelity, pension plan clients, and other institutional clients with similar mandates. The Board noted that a joint ad hoc committee created by it and the boards of other Fidelity funds periodically reviews and compares Fidelity's institutional investment advisory business with its business of providing services to the Fidelity funds, and also noted the most recent findings of the committee. The Board noted that the committee's review included a consideration of the differences in services provided, fees charged, and costs incurred, as well as competition in the markets serving the different categories of clients.
Based on its review of total expense ratios and fees charged to other Fidelity clients, the Board concluded that the total expense ratio of each class of the fund was reasonable in light of the services that the fund and its shareholders receive and the other factors considered.
Costs of the Services and Profitability. The Board considered the revenues earned and the expenses incurred by Fidelity in conducting the business of developing, marketing, distributing, managing, administering and servicing the fund and servicing the fund's shareholders. The Board also considered the level of Fidelity's profits in respect of all the Fidelity funds.
On an annual basis, Fidelity presents to the Board information about the profitability of its relationships with the fund. Fidelity calculates profitability information for each fund, as well as aggregate profitability information for groups of Fidelity funds and all Fidelity funds, using a series of detailed revenue and cost allocation methodologies which originate with the books and records of Fidelity on which Fidelity's audited financial statements are based. The Audit Committee of the Board reviews any significant changes from the prior year's methodologies.
PricewaterhouseCoopers LLP (PwC), auditor to Fidelity and certain Fidelity funds, has been engaged annually by the Board as part of the Board's assessment of Fidelity's profitability analysis. PwC's engagement includes the review and assessment of the methodologies used by Fidelity in determining the revenues and expenses attributable to Fidelity's mutual fund business, and completion of agreed-upon procedures in respect of the mathematical accuracy of the fund profitability information and its conformity to established allocation methodologies. After considering PwC's reports issued under the engagement and information provided by Fidelity, the Board concluded that while other allocation methods may also be reasonable, Fidelity's profitability methodologies are reasonable in all material respects.
The Board also reviewed Fidelity's non-fund businesses and potential indirect benefits such businesses may have received as a result of their association with Fidelity's mutual fund business (i.e., fall-out benefits) as well as cases where Fidelity's affiliates may benefit from the fund's business. The Board noted that changes to fall-out benefits year-over-year reflect business developments at Fidelity's various businesses.
The Board considered the costs of the services provided by and the profits realized by Fidelity in connection with the operation of the fund and was satisfied that the profitability was not excessive.
Economies of Scale. The Board considered whether there have been economies of scale in respect of the management of the Fidelity funds, whether the Fidelity funds (including the fund) have appropriately benefited from any such economies of scale, and whether there is potential for realization of any further economies of scale. The Board considered the extent to which the fund will benefit from economies of scale as assets grow through increased services to the fund, through waivers or reimbursements, or through fee or expense ratio reductions. The Board also noted that a committee (the Economies of Scale Committee) created by it and the boards of other Fidelity funds periodically analyzes whether Fidelity attains economies of scale in respect of the management and servicing of the Fidelity funds, whether the Fidelity funds have appropriately benefited from such economies of scale, and whether there is potential for realization of any further economies of scale.
The Board recognized that the fund's management contract incorporates a "group fee" structure, which provides for lower group fee rates as total group assets increase, and for higher group fee rates as total group assets decrease (with "group assets" defined to include fund assets under SelectCo's management plus assets under FMR's management). SelectCo calculates the group fee rates based on a tiered asset "breakpoint" schedule that varies based on asset class. The Board considered that the group fee is designed to deliver the benefits of economies of scale to fund shareholders when total group assets increase, even if assets of any particular fund are unchanged or have declined, because some portion of Fidelity's costs are attributable to services provided to all Fidelity funds, and all funds benefit if those costs can be allocated among more assets. The Board concluded that, given the group fee structure, fund shareholders will benefit from lower management fees as group assets increase at the fund complex level, regardless of whether Fidelity achieves any such economies of scale.
The Board concluded, taking into account the analysis of the Economies of Scale Committee, that economies of scale, if any, are being appropriately shared between fund shareholders and Fidelity.
Additional Information Requested by the Board. In order to develop fully the factual basis for consideration of the Fidelity funds' advisory contracts, the Board requested and received additional information on certain topics, including: (i) fund performance trends, in particular the underperformance of certain funds, and Fidelity's long-term strategies for certain funds; (ii) Fidelity's fund profitability methodology, profitability trends for certain funds, and the impact of certain factors on fund profitability results; (iii) metrics for evaluating index fund and ETF performance and information about ETF trading characteristics; (iv) the methodology with respect to the evaluation of competitive fund data and peer group classifications and fee comparisons; (v) the expense structures for different funds and classes; (vi) information regarding other accounts managed by Fidelity, including collective investment trusts; and (vii) Fidelity's philosophies and strategies for evaluating funds and classes with lower or declining asset levels.
Based on its evaluation of all of the conclusions noted above, and after considering all factors it believed relevant, the Board concluded that the advisory fee arrangements are fair and reasonable, and that the fund's Advisory Contracts should be renewed.
VTELP-SANN-0819
1.851007.112
Item 2.
Code of Ethics
Not applicable.
Item 3.
Audit Committee Financial Expert
Not applicable.
Item 4.
Principal Accountant Fees and Services
Not applicable.
Item 5.
Audit Committee of Listed Registrants
Not applicable.
Item 6.
Investments
(a)
Not applicable.
(b)
Not applicable
Item 7.
Disclosure of Proxy Voting Policies and Procedures for Closed-End Management Investment Companies
Not applicable.
Item 8.
Portfolio Managers of Closed-End Management Investment Companies
Not applicable.
Item 9.
Purchase of Equity Securities by Closed-End Management Investment Company and Affiliated Purchasers
Not applicable.
Item 10.
Submission of Matters to a Vote of Security Holders
There were no material changes to the procedures by which shareholders may recommend nominees to the Variable Insurance Products Fund IV’s Board of Trustees.
Item 11.
Controls and Procedures
(a)(i) The President and Treasurer and the Chief Financial Officer have concluded that the Variable Insurance Products Fund IV’s (the “Trust”) disclosure controls and procedures (as defined in Rule 30a-3(c) under the Investment Company Act) provide reasonable assurances that material information relating to the Trust is made known to them by the appropriate persons, based on their evaluation of these controls and procedures as of a date within 90 days of the filing date of this report.
(a)(ii) There was no change in the Trust’s internal control over financial reporting (as defined in Rule 30a-3(d) under the Investment Company Act) that occurred during the period covered by this report that has materially affected, or is reasonably likely to materially affect, the Trust’s internal control over financial reporting.
Item 12.
Disclosure of Securities Lending Activities for Closed-End Management
Investment Companies
Not applicable.
Item 13.
Exhibits
| | |
(a) | (1) | Not applicable. |
(a) | (2) | Certification pursuant to Rule 30a-2(a) under the Investment Company Act of 1940 (17 CFR 270.30a-2(a)) is filed and attached hereto as Exhibit 99.CERT. |
(a) | (3) | Not applicable. |
(b) |
| Certification pursuant to Rule 30a-2(b) under the Investment Company Act of 1940 (17 CFR 270.30a-2(b)) is furnished and attached hereto as Exhibit 99.906CERT. |
SIGNATURES
Pursuant to the requirements of the Securities Exchange Act of 1934 and the Investment Company Act of 1940, the registrant has duly caused this report to be signed on its behalf by the undersigned, thereunto duly authorized.
Variable Insurance Products Fund IV
| |
By: | /s/Stacie M. Smith |
| Stacie M. Smith |
| President and Treasurer |
|
|
Date: | August 26, 2019 |
Pursuant to the requirements of the Securities Exchange Act of 1934 and the Investment Company Act of 1940, this report has been signed below by the following persons on behalf of the registrant and in the capacities and on the dates indicated.
| |
By: | /s/Stacie M. Smith |
| Stacie M. Smith |
| President and Treasurer |
|
|
Date: | August 26, 2019 |
| |
By: | /s/John J. Burke III |
| John J. Burke III |
| Chief Financial Officer |
|
|
Date: | August 26, 2019 |