UNITED STATES
SECURITIES AND EXCHANGE COMMISSION
Washington, D.C. 20549
FORM N-CSR
CERTIFIED SHAREHOLDER REPORT OF REGISTERED
MANAGEMENT INVESTMENT COMPANIES
Investment Company Act file number 811-03785
Fidelity Advisor Series I
(Exact name of registrant as specified in charter)
245 Summer St., Boston, MA 02210
(Address of principal executive offices) (Zip code)
Margaret Carey, Secretary
245 Summer St.
Boston, Massachusetts 02210
(Name and address of agent for service)
Registrant's telephone number, including area code:
617-563-7000
Date of fiscal year end: | October 31 |
Date of reporting period: | April 30, 2024 |
Item 1.
Reports to Stockholders


Contents
| Top Bond Issuers (% of Fund's net assets) | ||
(with maturities greater than one year) | ||
| TransDigm, Inc. | 2.6 | |
| Energy Transfer LP | 2.5 | |
| Fidelity Private Credit Co. LLC | 2.2 | |
| JPMorgan Chase & Co. | 1.9 | |
| Citigroup, Inc. | 1.5 | |
| Tenet Healthcare Corp. | 1.5 | |
| Bank of America Corp. | 1.3 | |
| Carnival Corp. | 1.3 | |
| LBM Acquisition LLC | 1.1 | |
| Clydesdale Acquisition Holdings, Inc. | 1.1 | |
| 17.0 | ||
| Market Sectors (% of Fund's net assets) | ||
| Technology | 16.1 | |
| Energy | 10.9 | |
| Banks & Thrifts | 9.4 | |
| Services | 5.1 | |
| Healthcare | 4.4 | |
Quality Diversification (% of Fund's net assets) |
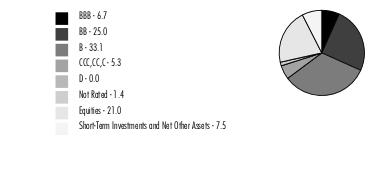 |
Percentages shown as 0.0% may reflect amounts less than 0.05%. |
| We have used ratings from Moody's Investors Service, Inc. Where Moody's® ratings are not available, we have used S&P® ratings. All ratings are as of the date indicated and do not reflect subsequent changes. |
Asset Allocation (% of Fund's net assets) |
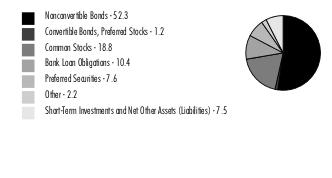 |
| Corporate Bonds - 53.5% | |||
Principal Amount (a) (000s) | Value ($) (000s) | ||
| Convertible Bonds - 1.2% | |||
| Broadcasting - 0.4% | |||
| DISH Network Corp.: | |||
| 0% 12/15/25 | 6,054 | 4,404 | |
| 3.375% 8/15/26 | 8,600 | 5,246 | |
| 9,650 | |||
| Diversified Financial Services - 0.3% | |||
| Coinbase Global, Inc. 0.25% 4/1/30 (b) | 1,440 | 1,301 | |
| New Cotai LLC 5% 2/24/27 (c) | 1,835 | 4,088 | |
| 5,389 | |||
| Technology - 0.5% | |||
| Wolfspeed, Inc. 1.875% 12/1/29 | 17,768 | 10,208 | |
TOTAL CONVERTIBLE BONDS | 25,247 | ||
| Nonconvertible Bonds - 52.3% | |||
| Aerospace - 3.3% | |||
| ATI, Inc.: | |||
| 4.875% 10/1/29 | 845 | 787 | |
| 5.125% 10/1/31 | 750 | 683 | |
| Bombardier, Inc.: | |||
| 6% 2/15/28 (b) | 830 | 809 | |
| 7.125% 6/15/26 (b) | 1,261 | 1,274 | |
| 7.25% 7/1/31 (b) | 1,030 | 1,033 | |
| 7.875% 4/15/27 (b) | 2,854 | 2,836 | |
| 8.75% 11/15/30 (b) | 1,475 | 1,569 | |
| Kaiser Aluminum Corp. 4.625% 3/1/28 (b) | 1,575 | 1,466 | |
| Moog, Inc. 4.25% 12/15/27 (b) | 480 | 448 | |
| Rolls-Royce PLC 5.75% 10/15/27 (b) | 1,440 | 1,424 | |
| TransDigm, Inc.: | |||
| 4.625% 1/15/29 | 4,860 | 4,452 | |
| 4.875% 5/1/29 | 15,000 | 13,797 | |
| 5.5% 11/15/27 | 14,675 | 14,253 | |
| 6.375% 3/1/29 (b) | 4,505 | 4,471 | |
| 6.625% 3/1/32 (b) | 1,005 | 1,003 | |
| 6.75% 8/15/28 (b) | 8,160 | 8,211 | |
| 6.875% 12/15/30 (b) | 7,770 | 7,823 | |
| 7.125% 12/1/31 (b) | 1,950 | 1,987 | |
| Triumph Group, Inc. 9% 3/15/28 (b) | 1,291 | 1,337 | |
| VistaJet Malta Finance PLC / XO Management Holding, Inc. 9.5% 6/1/28 (b) | 1,440 | 1,289 | |
| 70,952 | |||
| Air Transportation - 1.2% | |||
| Air Canada 3.875% 8/15/26 (b) | 1,240 | 1,176 | |
| Allegiant Travel Co. 7.25% 8/15/27 (b) | 1,320 | 1,276 | |
| American Airlines, Inc.: | |||
| 7.25% 2/15/28 (b) | 3,155 | 3,173 | |
| 8.5% 5/15/29 (b) | 3,235 | 3,370 | |
| American Airlines, Inc. / AAdvantage Loyalty IP Ltd. 5.75% 4/20/29 (b) | 4,820 | 4,655 | |
| Hawaiian Brand Intellectual Property Ltd. / HawaiianMiles Loyalty Ltd. 5.75% 1/20/26 (b) | 3,145 | 2,950 | |
| Rand Parent LLC 8.5% 2/15/30 (b) | 2,390 | 2,364 | |
| Spirit Loyalty Cayman Ltd. / Spirit IP Cayman Ltd.: | |||
| 8% 9/20/25 (b) | 1,044 | 816 | |
| 8% 9/20/25 (b) | 470 | 367 | |
| United Airlines, Inc.: | |||
| 4.375% 4/15/26 (b) | 3,965 | 3,814 | |
| 4.625% 4/15/29 (b) | 3,180 | 2,931 | |
| 26,892 | |||
| Automotive & Auto Parts - 1.1% | |||
| Adient Global Holdings Ltd. 7% 4/15/28 (b) | 960 | 970 | |
| Allison Transmission, Inc. 5.875% 6/1/29 (b) | 1,265 | 1,233 | |
| Arko Corp. 5.125% 11/15/29 (b) | 1,290 | 1,040 | |
| Aston Martin Capital Holdings Ltd. 10% 3/31/29 (b) | 1,535 | 1,495 | |
| Clarios Global LP / Clarios U.S. Finance Co. 6.75% 5/15/28 (b) | 1,920 | 1,924 | |
| Dana, Inc.: | |||
| 4.25% 9/1/30 | 1,185 | 1,027 | |
| 4.5% 2/15/32 | 1,305 | 1,107 | |
| LCM Investments Holdings 8.25% 8/1/31 (b) | 1,160 | 1,205 | |
| Macquarie AirFinance Holdings: | |||
| 6.4% 3/26/29 (b) | 710 | 708 | |
| 6.5% 3/26/31 (b) | 1,085 | 1,086 | |
| 8.125% 3/30/29 (b) | 1,475 | 1,542 | |
| McLaren Finance PLC 7.5% 8/1/26 (b) | 1,130 | 981 | |
| Nesco Holdings II, Inc. 5.5% 4/15/29 (b) | 1,850 | 1,722 | |
| Rivian Holdco & Rivian LLC & Rivian Automotive LLC CME Term SOFR 6 Month Index + 6.020% 11.3101% 10/15/26 (b)(d)(e) | 2,250 | 2,216 | |
| Tenneco, Inc. 8% 11/17/28 (b) | 2,915 | 2,724 | |
| Wand NewCo 3, Inc. 7.625% 1/30/32 (b) | 1,995 | 2,028 | |
| 23,008 | |||
| Banks & Thrifts - 1.0% | |||
| Ally Financial, Inc.: | |||
| 8% 11/1/31 | 3,105 | 3,346 | |
| 8% 11/1/31 | 16,223 | 17,564 | |
| Jane Street Group LLC/JSG Finance, Inc. 4.5% 11/15/29 (b) | 1,240 | 1,128 | |
| 22,038 | |||
| Broadcasting - 0.9% | |||
| DISH Network Corp. 11.75% 11/15/27 (b) | 6,645 | 6,698 | |
| Scripps Escrow II, Inc. 3.875% 1/15/29 (b) | 360 | 266 | |
| Sirius XM Radio, Inc.: | |||
| 3.875% 9/1/31 (b) | 1,655 | 1,331 | |
| 4% 7/15/28 (b) | 1,695 | 1,511 | |
| 5% 8/1/27 (b) | 1,575 | 1,487 | |
| Univision Communications, Inc.: | |||
| 4.5% 5/1/29 (b) | 1,610 | 1,401 | |
| 7.375% 6/30/30 (b) | 6,430 | 6,157 | |
| 18,851 | |||
| Building Materials - 0.6% | |||
| Advanced Drain Systems, Inc.: | |||
| 5% 9/30/27 (b) | 355 | 344 | |
| 6.375% 6/15/30 (b) | 890 | 885 | |
| Brundage-Bone Concrete Pumping Holdings, Inc. 6% 2/1/26 (b) | 835 | 822 | |
| MITER Brands Acquisition Holdco, Inc. / MIWD Borrower LLC 6.75% 4/1/32 (b) | 1,540 | 1,529 | |
| MIWD Holdco II LLC / MIWD Finance Corp. 5.5% 2/1/30 (b) | 590 | 534 | |
| Smyrna Ready Mix Concrete LLC 8.875% 11/15/31 (b) | 3,925 | 4,134 | |
| SRS Distribution, Inc.: | |||
| 4.625% 7/1/28 (b) | 1,540 | 1,534 | |
| 6.125% 7/1/29 (b) | 650 | 660 | |
| Summit Materials LLC/Summit Materials Finance Corp.: | |||
| 5.25% 1/15/29 (b) | 1,445 | 1,388 | |
| 7.25% 1/15/31 (b) | 1,480 | 1,517 | |
| 13,347 | |||
| Cable/Satellite TV - 0.4% | |||
| DISH DBS Corp. 5.75% 12/1/28 (b) | 2,170 | 1,465 | |
| VZ Secured Financing BV 5% 1/15/32 (b) | 3,855 | 3,247 | |
| Ziggo BV 4.875% 1/15/30 (b) | 3,795 | 3,321 | |
| 8,033 | |||
| Capital Goods - 0.2% | |||
| ATS Corp. 4.125% 12/15/28 (b) | 1,015 | 912 | |
| Chart Industries, Inc. 7.5% 1/1/30 (b) | 2,500 | 2,557 | |
| 3,469 | |||
| Chemicals - 1.4% | |||
| Compass Minerals International, Inc. 6.75% 12/1/27 (b) | 3,850 | 3,611 | |
| Consolidated Energy Finance SA 12% 2/15/31 (b) | 1,610 | 1,666 | |
| Ingevity Corp. 3.875% 11/1/28 (b) | 1,515 | 1,348 | |
| LSB Industries, Inc. 6.25% 10/15/28 (b) | 3,360 | 3,185 | |
| NOVA Chemicals Corp. 8.5% 11/15/28 (b) | 1,325 | 1,393 | |
| Olin Corp. 5% 2/1/30 | 1,555 | 1,451 | |
| Olympus Water U.S. Holding Corp.: | |||
| 4.25% 10/1/28 (b) | 3,370 | 3,037 | |
| 7.125% 10/1/27 (b) | 1,070 | 1,084 | |
| 9.75% 11/15/28 (b) | 4,875 | 5,173 | |
| SCIH Salt Holdings, Inc. 4.875% 5/1/28 (b) | 1,035 | 962 | |
| SCIL IV LLC / SCIL U.S.A. Holdings LLC 5.375% 11/1/26 (b) | 1,985 | 1,905 | |
| Tronox, Inc. 4.625% 3/15/29 (b) | 1,705 | 1,521 | |
| W.R. Grace Holding LLC: | |||
| 5.625% 8/15/29 (b) | 4,675 | 4,186 | |
| 7.375% 3/1/31 (b) | 950 | 963 | |
| 31,485 | |||
| Consumer Products - 1.0% | |||
| Angi Group LLC 3.875% 8/15/28 (b) | 750 | 633 | |
| Foundation Building Materials, Inc. 6% 3/1/29 (b) | 735 | 648 | |
| Gannett Holdings LLC 6% 11/1/26 (b) | 1,230 | 1,137 | |
| HFC Prestige Products, Inc./HFC Prestige International U.S. LLC 4.75% 1/15/29 (b) | 1,240 | 1,156 | |
| PetSmart, Inc. / PetSmart Finance Corp.: | |||
| 4.75% 2/15/28 (b) | 2,260 | 2,086 | |
| 7.75% 2/15/29 (b) | 2,540 | 2,414 | |
| Spectrum Brands Holdings, Inc. 3.875% 3/15/31 (b) | 1,080 | 1,011 | |
| Tempur Sealy International, Inc.: | |||
| 3.875% 10/15/31 (b) | 2,230 | 1,836 | |
| 4% 4/15/29 (b) | 2,545 | 2,263 | |
| The Scotts Miracle-Gro Co. 4% 4/1/31 | 1,530 | 1,289 | |
| TKC Holdings, Inc. 6.875% 5/15/28 (b) | 5,855 | 5,527 | |
| Windsor Holdings III, LLC 8.5% 6/15/30 (b) | 955 | 995 | |
| 20,995 | |||
| Containers - 0.5% | |||
| Crown Americas LLC/Crown Americas Capital Corp. IV 4.75% 2/1/26 | 4,780 | 4,677 | |
| Crown Americas LLC/Crown Americas Capital Corp. V 4.25% 9/30/26 | 1,210 | 1,159 | |
| Graham Packaging Co., Inc. 7.125% 8/15/28 (b) | 825 | 745 | |
| Graphic Packaging International, Inc. 3.75% 2/1/30 (b) | 1,125 | 979 | |
| Intelligent Packaging Ltd. Finco, Inc. 6% 9/15/28 (b) | 570 | 543 | |
| Mauser Packaging Solutions Holding Co. 7.875% 4/15/27 (b) | 1,895 | 1,931 | |
| Sealed Air Corp./Sealed Air Corp. U.S. 6.125% 2/1/28 (b) | 950 | 938 | |
| Trident TPI Holdings, Inc. 12.75% 12/31/28 (b) | 950 | 1,028 | |
| 12,000 | |||
| Diversified Financial Services - 2.1% | |||
| Broadstreet Partners, Inc. 5.875% 4/15/29 (b) | 2,115 | 1,927 | |
| Coinbase Global, Inc.: | |||
| 3.375% 10/1/28 (b) | 4,600 | 3,856 | |
| 3.625% 10/1/31 (b) | 2,715 | 2,117 | |
| Compass Group Diversified Holdings LLC: | |||
| 5% 1/15/32 (b) | 870 | 767 | |
| 5.25% 4/15/29 (b) | 2,270 | 2,122 | |
| Fortress Transportation & Infrastructure Investors LLC 7.875% 12/1/30 (b) | 1,465 | 1,522 | |
| Hightower Holding LLC 6.75% 4/15/29 (b) | 785 | 737 | |
| Icahn Enterprises LP/Icahn Enterprises Finance Corp.: | |||
| 4.375% 2/1/29 | 3,415 | 2,875 | |
| 5.25% 5/15/27 | 5,030 | 4,596 | |
| 6.25% 5/15/26 | 5,825 | 5,665 | |
| MSCI, Inc.: | |||
| 3.25% 8/15/33 (b) | 1,245 | 997 | |
| 4% 11/15/29 (b) | 900 | 813 | |
| OneMain Finance Corp.: | |||
| 4% 9/15/30 | 720 | 606 | |
| 5.375% 11/15/29 | 9,325 | 8,623 | |
| 6.625% 1/15/28 | 1,185 | 1,181 | |
| 6.875% 3/15/25 | 775 | 780 | |
| 7.125% 3/15/26 | 4,710 | 4,753 | |
| 7.875% 3/15/30 | 985 | 1,005 | |
| Williams Scotsman, Inc. 7.375% 10/1/31 (b) | 985 | 1,006 | |
| 45,948 | |||
| Energy - 7.8% | |||
| Altus Midstream LP 5.875% 6/15/30 (b) | 1,335 | 1,291 | |
| Antero Midstream Partners LP/Antero Midstream Finance Corp.: | |||
| 5.375% 6/15/29 (b) | 1,205 | 1,147 | |
| 5.75% 3/1/27 (b) | 2,655 | 2,607 | |
| 5.75% 1/15/28 (b) | 1,705 | 1,669 | |
| Atlantica Sustainable Infrastructure PLC 4.125% 6/15/28 (b) | 1,045 | 946 | |
| Borr IHC Ltd. / Borr Finance Ltd.: | |||
| 10% 11/15/28 (b) | 1,475 | 1,527 | |
| 10.375% 11/15/30 (b) | 490 | 507 | |
| CGG SA 8.75% 4/1/27 (b) | 1,530 | 1,432 | |
| Chesapeake Energy Corp.: | |||
| 4.875% (c)(f) | 2,950 | 0 | |
| 5.75% (c)(f) | 1,890 | 0 | |
| 5.875% 2/1/29 (b) | 2,735 | 2,682 | |
| 6.75% 4/15/29 (b) | 1,150 | 1,149 | |
| 7% (c)(f) | 840 | 0 | |
| 8% (c)(f) | 300 | 0 | |
| 8% (c)(f) | 480 | 0 | |
| Citgo Petroleum Corp.: | |||
| 6.375% 6/15/26 (b) | 1,105 | 1,103 | |
| 7% 6/15/25 (b) | 3,035 | 3,032 | |
| 8.375% 1/15/29 (b) | 4,325 | 4,476 | |
| Civitas Resources, Inc. 8.625% 11/1/30 (b) | 1,985 | 2,112 | |
| CNX Midstream Partners LP 4.75% 4/15/30 (b) | 900 | 797 | |
| CNX Resources Corp.: | |||
| 6% 1/15/29 (b) | 690 | 669 | |
| 7.375% 1/15/31 (b) | 890 | 901 | |
| Comstock Resources, Inc.: | |||
| 5.875% 1/15/30 (b) | 4,426 | 4,031 | |
| 6.75% 3/1/29 (b) | 7,095 | 6,755 | |
| CQP Holdco LP / BIP-V Chinook Holdco LLC: | |||
| 5.5% 6/15/31 (b) | 4,245 | 3,901 | |
| 7.5% 12/15/33 (b) | 2,610 | 2,626 | |
| CrownRock LP/CrownRock Finance, Inc. 5% 5/1/29 (b) | 665 | 655 | |
| CVR Energy, Inc.: | |||
| 5.75% 2/15/28 (b) | 3,170 | 2,946 | |
| 8.5% 1/15/29 (b) | 6,890 | 6,907 | |
| DCP Midstream Operating LP 8.125% 8/16/30 | 130 | 145 | |
| Delek Logistics Partners LP/Delek Logistics Finance Corp. 7.125% 6/1/28 (b) | 2,645 | 2,583 | |
| Diamond Foreign Asset Co. / Diamond Finance, LLC 8.5% 10/1/30 (b) | 985 | 1,030 | |
| DT Midstream, Inc.: | |||
| 4.125% 6/15/29 (b) | 1,215 | 1,101 | |
| 4.375% 6/15/31 (b) | 1,215 | 1,079 | |
| Endeavor Energy Resources LP/EER Finance, Inc. 5.75% 1/30/28 (b) | 1,365 | 1,383 | |
| Energy Transfer LP: | |||
| 5.625% 5/1/27 (b) | 12,200 | 12,080 | |
| 6% 2/1/29 (b) | 8,530 | 8,518 | |
| EnLink Midstream LLC: | |||
| 5.375% 6/1/29 | 650 | 627 | |
| 6.5% 9/1/30 (b) | 2,725 | 2,759 | |
| Global Partners LP/GLP Finance Corp. 8.25% 1/15/32 (b) | 1,235 | 1,265 | |
| Gran Tierra Energy, Inc. 9.5% 10/15/29 (b) | 1,250 | 1,173 | |
| Hess Midstream Operations LP: | |||
| 4.25% 2/15/30 (b) | 1,345 | 1,214 | |
| 5.125% 6/15/28 (b) | 1,570 | 1,503 | |
| 5.5% 10/15/30 (b) | 890 | 851 | |
| 5.625% 2/15/26 (b) | 2,690 | 2,660 | |
| HF Sinclair Corp.: | |||
| 5% 2/1/28 (b) | 1,060 | 1,017 | |
| 6.375% 4/15/27 (b) | 890 | 890 | |
| Hilcorp Energy I LP/Hilcorp Finance Co. 6.25% 11/1/28 (b) | 310 | 305 | |
| Howard Midstream Energy Partners LLC 8.875% 7/15/28 (b) | 2,400 | 2,514 | |
| Jonah Energy Parent LLC 12% 11/5/25 (c)(g) | 1,621 | 1,731 | |
| KLX Energy Services Holdings, Inc. 11.5% 11/1/25 (b) | 2,300 | 2,315 | |
| Magnolia Oil & Gas Operating LLC/Magnolia Oil & Gas Finance Corp. 6% 8/1/26 (b) | 2,055 | 2,028 | |
| MEG Energy Corp. 7.125% 2/1/27 (b) | 938 | 945 | |
| Mesquite Energy, Inc. 7.25% (b)(c)(f) | 6,264 | 0 | |
| Nabors Industries Ltd. 7.5% 1/15/28 (b) | 1,360 | 1,289 | |
| Nabors Industries, Inc. 9.125% 1/31/30 (b) | 1,950 | 2,011 | |
| New Fortress Energy, Inc. 6.75% 9/15/25 (b) | 1,276 | 1,260 | |
| Noble Finance II LLC 8% 4/15/30 (b) | 960 | 989 | |
| Northern Oil & Gas, Inc.: | |||
| 8.125% 3/1/28 (b) | 990 | 1,002 | |
| 8.75% 6/15/31 (b) | 1,950 | 2,051 | |
| Occidental Petroleum Corp. 7.2% 3/15/29 | 545 | 566 | |
| PBF Holding Co. LLC/PBF Finance Corp.: | |||
| 6% 2/15/28 | 3,845 | 3,750 | |
| 7.875% 9/15/30 (b) | 2,930 | 3,013 | |
| Permian Resources Operating LLC 5.875% 7/1/29 (b) | 1,165 | 1,133 | |
| Seadrill Finance Ltd. 8.375% 8/1/30 (b) | 1,925 | 2,005 | |
| Sitio Royalties OP / Sitio Finance Corp. 7.875% 11/1/28 (b) | 2,460 | 2,530 | |
| SM Energy Co.: | |||
| 5.625% 6/1/25 | 2,480 | 2,462 | |
| 6.625% 1/15/27 | 850 | 846 | |
| 6.75% 9/15/26 | 845 | 845 | |
| Southwestern Energy Co. 5.375% 3/15/30 | 1,665 | 1,581 | |
| Suburban Propane Partners LP/Suburban Energy Finance Corp. 5% 6/1/31 (b) | 1,610 | 1,430 | |
| Sunnova Energy Corp.: | |||
| 5.875% 9/1/26 (b) | 485 | 302 | |
| 11.75% 10/1/28 (b) | 2,950 | 1,761 | |
| Sunoco LP/Sunoco Finance Corp.: | |||
| 4.5% 5/15/29 | 1,320 | 1,205 | |
| 4.5% 4/30/30 | 1,710 | 1,539 | |
| 6% 4/15/27 | 4,740 | 4,683 | |
| 7% 9/15/28 (b) | 985 | 999 | |
| Tallgrass Energy Partners LP / Tallgrass Energy Finance Corp.: | |||
| 5.5% 1/15/28 (b) | 95 | 90 | |
| 6% 3/1/27 (b) | 950 | 925 | |
| 6% 9/1/31 (b) | 1,620 | 1,504 | |
| Talos Production, Inc.: | |||
| 9% 2/1/29 (b) | 880 | 928 | |
| 9.375% 2/1/31 (b) | 1,000 | 1,066 | |
| Targa Resources Partners LP/Targa Resources Partners Finance Corp. 4.875% 2/1/31 | 1,405 | 1,315 | |
| Teine Energy Ltd. 6.875% 4/15/29 (b) | 1,145 | 1,112 | |
| Transocean Titan Finance Ltd. 8.375% 2/1/28 (b) | 1,977 | 2,029 | |
| Transocean, Inc.: | |||
| 8% 2/1/27 (b) | 1,228 | 1,231 | |
| 8.25% 5/15/29 (b) | 775 | 772 | |
| 8.5% 5/15/31 (b) | 775 | 771 | |
| 8.75% 2/15/30 (b) | 4,239 | 4,420 | |
| Valaris Ltd. 8.375% 4/30/30 (b) | 975 | 1,003 | |
| Venture Global Calcasieu Pass LLC: | |||
| 3.875% 8/15/29 (b) | 1,035 | 914 | |
| 4.125% 8/15/31 (b) | 1,035 | 903 | |
| 6.25% 1/15/30 (b) | 3,835 | 3,792 | |
| 169,611 | |||
| Environmental - 0.8% | |||
| Clean Harbors, Inc. 6.375% 2/1/31 (b) | 790 | 783 | |
| Covanta Holding Corp.: | |||
| 4.875% 12/1/29 (b) | 4,810 | 4,216 | |
| 5% 9/1/30 | 1,940 | 1,674 | |
| Darling Ingredients, Inc.: | |||
| 5.25% 4/15/27 (b) | 2,655 | 2,572 | |
| 6% 6/15/30 (b) | 2,040 | 1,982 | |
| GFL Environmental, Inc.: | |||
| 4% 8/1/28 (b) | 1,275 | 1,156 | |
| 4.75% 6/15/29 (b) | 1,625 | 1,499 | |
| 6.75% 1/15/31 (b) | 1,450 | 1,462 | |
| Madison IAQ LLC: | |||
| 4.125% 6/30/28 (b) | 1,535 | 1,424 | |
| 5.875% 6/30/29 (b) | 1,225 | 1,137 | |
| 17,905 | |||
| Food & Drug Retail - 0.8% | |||
| Albertsons Companies LLC/Safeway, Inc./New Albertson's, Inc./Albertson's LLC: | |||
| 3.5% 3/15/29 (b) | 4,630 | 4,085 | |
| 4.625% 1/15/27 (b) | 4,225 | 4,037 | |
| 4.875% 2/15/30 (b) | 6,100 | 5,690 | |
| Murphy Oil U.S.A., Inc. 3.75% 2/15/31 (b) | 675 | 579 | |
| Parkland Corp.: | |||
| 4.5% 10/1/29 (b) | 1,145 | 1,038 | |
| 4.625% 5/1/30 (b) | 1,735 | 1,568 | |
| 16,997 | |||
| Food/Beverage/Tobacco - 1.4% | |||
| BellRing Brands, Inc. 7% 3/15/30 (b) | 2,425 | 2,454 | |
| C&S Group Enterprises LLC 5% 12/15/28 (b) | 1,110 | 851 | |
| Chobani LLC/Finance Corp., Inc. 4.625% 11/15/28 (b) | 855 | 791 | |
| Fiesta Purchaser, Inc. 7.875% 3/1/31 (b) | 1,895 | 1,931 | |
| KeHE Distributor / Nextwave 9% 2/15/29 (b) | 3,610 | 3,645 | |
| Lamb Weston Holdings, Inc.: | |||
| 4.125% 1/31/30 (b) | 1,720 | 1,533 | |
| 4.375% 1/31/32 (b) | 860 | 745 | |
| Performance Food Group, Inc.: | |||
| 4.25% 8/1/29 (b) | 1,160 | 1,040 | |
| 5.5% 10/15/27 (b) | 1,353 | 1,310 | |
| Post Holdings, Inc.: | |||
| 4.5% 9/15/31 (b) | 6,170 | 5,425 | |
| 4.625% 4/15/30 (b) | 2,050 | 1,851 | |
| 5.5% 12/15/29 (b) | 865 | 820 | |
| 5.625% 1/15/28 (b) | 3,640 | 3,532 | |
| Simmons Foods, Inc. 4.625% 3/1/29 (b) | 1,070 | 923 | |
| Triton Water Holdings, Inc. 6.25% 4/1/29 (b) | 810 | 726 | |
| U.S. Foods, Inc.: | |||
| 4.625% 6/1/30 (b) | 1,070 | 973 | |
| 7.25% 1/15/32 (b) | 985 | 1,006 | |
| United Natural Foods, Inc. 6.75% 10/15/28 (b) | 1,055 | 810 | |
| 30,366 | |||
| Gaming - 1.6% | |||
| Affinity Interactive 6.875% 12/15/27 (b) | 168 | 150 | |
| Boyd Gaming Corp. 4.75% 6/15/31 (b) | 4,225 | 3,741 | |
| Caesars Entertainment, Inc. 7% 2/15/30 (b) | 2,845 | 2,865 | |
| Churchill Downs, Inc.: | |||
| 5.75% 4/1/30 (b) | 2,330 | 2,217 | |
| 6.75% 5/1/31 (b) | 1,925 | 1,911 | |
| Fertitta Entertainment LLC / Fertitta Entertainment Finance Co., Inc.: | |||
| 4.625% 1/15/29 (b) | 4,710 | 4,261 | |
| 6.75% 1/15/30 (b) | 4,950 | 4,307 | |
| Jacobs Entertainment, Inc. 6.75% 2/15/29 (b) | 1,250 | 1,186 | |
| Light & Wonder International, Inc. 7.5% 9/1/31 (b) | 970 | 989 | |
| Melco Resorts Finance Ltd. 5.75% 7/21/28 (b) | 335 | 310 | |
| MGM Resorts International 4.75% 10/15/28 | 1,470 | 1,371 | |
| Ontario Gaming Gta LP/Otg Co.-I 8% 8/1/30 (b) | 2,005 | 2,036 | |
| Premier Entertainment Sub LLC: | |||
| 5.625% 9/1/29 (b) | 2,410 | 1,797 | |
| 5.875% 9/1/31 (b) | 370 | 266 | |
| Station Casinos LLC 4.625% 12/1/31 (b) | 1,300 | 1,139 | |
| Studio City Finance Ltd. 5% 1/15/29 (b) | 725 | 622 | |
| VICI Properties LP / VICI Note Co.: | |||
| 3.875% 2/15/29 (b) | 1,445 | 1,311 | |
| 4.25% 12/1/26 (b) | 3,015 | 2,877 | |
| 4.625% 12/1/29 (b) | 1,720 | 1,596 | |
| 34,952 | |||
| Healthcare - 3.8% | |||
| 180 Medical, Inc. 3.875% 10/15/29 (b) | 910 | 806 | |
| Avantor Funding, Inc. 3.875% 11/1/29 (b) | 860 | 761 | |
| Bausch + Lomb Corp. 8.375% 10/1/28 (b) | 1,970 | 2,035 | |
| Bausch Health Companies, Inc.: | |||
| 4.875% 6/1/28 (b) | 2,920 | 1,886 | |
| 5.75% 8/15/27 (b) | 2,955 | 2,039 | |
| 6.125% 2/1/27 (b) | 5,185 | 3,798 | |
| 11% 9/30/28 (b) | 845 | 660 | |
| Cano Health, Inc. 6.25% (b)(f) | 565 | 1 | |
| Charles River Laboratories International, Inc.: | |||
| 3.75% 3/15/29 (b) | 1,365 | 1,226 | |
| 4% 3/15/31 (b) | 1,545 | 1,348 | |
| 4.25% 5/1/28 (b) | 485 | 451 | |
| Community Health Systems, Inc.: | |||
| 4.75% 2/15/31 (b) | 2,860 | 2,232 | |
| 5.25% 5/15/30 (b) | 2,625 | 2,146 | |
| 6% 1/15/29 (b) | 1,085 | 947 | |
| 6.125% 4/1/30 (b) | 2,910 | 2,057 | |
| 8% 3/15/26 (b) | 3,773 | 3,755 | |
| 10.875% 1/15/32 (b) | 3,150 | 3,225 | |
| DaVita, Inc.: | |||
| 3.75% 2/15/31 (b) | 535 | 440 | |
| 4.625% 6/1/30 (b) | 4,545 | 3,982 | |
| Encompass Health Corp. 5.75% 9/15/25 | 400 | 397 | |
| Grifols SA 4.75% 10/15/28 (b) | 850 | 686 | |
| HealthEquity, Inc. 4.5% 10/1/29 (b) | 895 | 815 | |
| Hologic, Inc. 4.625% 2/1/28 (b) | 645 | 613 | |
| IQVIA, Inc. 5% 10/15/26 (b) | 1,125 | 1,100 | |
| Jazz Securities DAC 4.375% 1/15/29 (b) | 1,635 | 1,488 | |
| ModivCare Escrow Issuer, Inc. 5% 10/1/29 (b) | 955 | 663 | |
| Modivcare, Inc. 5.875% 11/15/25 (b) | 1,105 | 1,078 | |
| Molina Healthcare, Inc.: | |||
| 3.875% 11/15/30 (b) | 1,360 | 1,180 | |
| 3.875% 5/15/32 (b) | 1,730 | 1,448 | |
| Organon & Co. / Organon Foreign Debt Co-Issuer BV: | |||
| 4.125% 4/30/28 (b) | 3,525 | 3,210 | |
| 5.125% 4/30/31 (b) | 2,410 | 2,084 | |
| Owens & Minor, Inc. 4.5% 3/31/29 (b) | 1,065 | 955 | |
| Radiology Partners, Inc. 8.5% 1/31/29 pay-in-kind (b)(d) | 1,201 | 1,108 | |
| Tenet Healthcare Corp.: | |||
| 4.25% 6/1/29 | 8,360 | 7,658 | |
| 4.375% 1/15/30 | 6,245 | 5,671 | |
| 6.125% 6/15/30 | 4,600 | 4,504 | |
| 6.25% 2/1/27 | 9,945 | 9,905 | |
| 6.75% 5/15/31 (b) | 990 | 992 | |
| Teva Pharmaceutical Finance Netherlands III BV: | |||
| 4.75% 5/9/27 | 865 | 829 | |
| 5.125% 5/9/29 | 865 | 819 | |
| 7.875% 9/15/29 | 960 | 1,011 | |
| 82,009 | |||
| Homebuilders/Real Estate - 1.6% | |||
| Arcosa, Inc. 4.375% 4/15/29 (b) | 1,075 | 979 | |
| Ashton Woods U.S.A. LLC/Ashton Woods Finance Co. 4.625% 4/1/30 (b) | 1,240 | 1,108 | |
| Brookfield Residential Properties, Inc./Brookfield Residential U.S. Corp. 4.875% 2/15/30 (b) | 1,080 | 935 | |
| Century Communities, Inc. 3.875% 8/15/29 (b) | 1,245 | 1,087 | |
| Greystar Real Estate Partners 7.75% 9/1/30 (b) | 860 | 886 | |
| LGI Homes, Inc. 8.75% 12/15/28 (b) | 975 | 1,014 | |
| MPT Operating Partnership LP/MPT Finance Corp.: | |||
| 3.5% 3/15/31 | 1,445 | 969 | |
| 5% 10/15/27 | 9,710 | 7,942 | |
| Panther Escrow Issuer LLC 7.125% 6/1/31 (b) | 3,590 | 3,609 | |
| Shea Homes Ltd. Partnership/Corp. 4.75% 4/1/29 | 1,070 | 982 | |
| Taylor Morrison Communities, Inc./Monarch Communities, Inc.: | |||
| 5.125% 8/1/30 (b) | 1,416 | 1,319 | |
| 5.75% 1/15/28 (b) | 2,100 | 2,042 | |
| 5.875% 6/15/27 (b) | 1,490 | 1,467 | |
| TopBuild Corp. 3.625% 3/15/29 (b) | 755 | 678 | |
| TRI Pointe Homes, Inc. 5.7% 6/15/28 | 1,965 | 1,902 | |
| Uniti Group LP/Uniti Group Finance, Inc./CSL Capital LLC: | |||
| 4.75% 4/15/28 (b) | 4,258 | 3,734 | |
| 6.5% 2/15/29 (b) | 2,070 | 1,664 | |
| 10.5% 2/15/28 (b) | 1,265 | 1,312 | |
| Weekley Homes LLC/Weekley Finance Corp. 4.875% 9/15/28 (b) | 675 | 617 | |
| 34,246 | |||
| Hotels - 0.4% | |||
| Carnival Holdings (Bermuda) Ltd. 10.375% 5/1/28 (b) | 2,825 | 3,063 | |
| Hilton Domestic Operating Co., Inc.: | |||
| 3.75% 5/1/29 (b) | 725 | 650 | |
| 4% 5/1/31 (b) | 1,085 | 951 | |
| 4.875% 1/15/30 | 1,180 | 1,109 | |
| 5.875% 4/1/29 (b) | 1,445 | 1,426 | |
| 6.125% 4/1/32 (b) | 2,020 | 1,991 | |
| 9,190 | |||
| Insurance - 2.0% | |||
| Acrisure LLC / Acrisure Finance, Inc.: | |||
| 6% 8/1/29 (b) | 1,240 | 1,122 | |
| 8.25% 2/1/29 (b) | 4,685 | 4,647 | |
| 10.125% 8/1/26 (b) | 295 | 305 | |
| Alliant Holdings Intermediate LLC/Alliant Holdings Co.-Issuer: | |||
| 4.25% 10/15/27 (b) | 1,470 | 1,371 | |
| 5.875% 11/1/29 (b) | 1,290 | 1,185 | |
| 6.75% 10/15/27 (b) | 7,995 | 7,840 | |
| 6.75% 4/15/28 (b) | 5,690 | 5,684 | |
| 7% 1/15/31 (b) | 1,680 | 1,685 | |
| AmWINS Group, Inc. 4.875% 6/30/29 (b) | 1,205 | 1,095 | |
| AssuredPartners, Inc.: | |||
| 5.625% 1/15/29 (b) | 1,140 | 1,040 | |
| 7.5% 2/15/32 (b) | 1,005 | 976 | |
| GTCR AP Finance, Inc. 8% 5/15/27 (b) | 985 | 985 | |
| HUB International Ltd.: | |||
| 5.625% 12/1/29 (b) | 5,635 | 5,186 | |
| 7.25% 6/15/30 (b) | 6,265 | 6,357 | |
| 7.375% 1/31/32 (b) | 2,495 | 2,472 | |
| MGIC Investment Corp. 5.25% 8/15/28 | 1,040 | 998 | |
| USI, Inc. 7.5% 1/15/32 (b) | 1,300 | 1,293 | |
| 44,241 | |||
| Leisure - 1.8% | |||
| Boyne U.S.A., Inc. 4.75% 5/15/29 (b) | 840 | 764 | |
| Carnival Corp.: | |||
| 4% 8/1/28 (b) | 9,210 | 8,421 | |
| 7% 8/15/29 (b) | 990 | 1,016 | |
| 7.625% 3/1/26 (b) | 2,775 | 2,792 | |
| NCL Corp. Ltd. 5.875% 2/15/27 (b) | 1,770 | 1,729 | |
| Royal Caribbean Cruises Ltd.: | |||
| 5.375% 7/15/27 (b) | 1,295 | 1,260 | |
| 6.25% 3/15/32 (b) | 2,030 | 2,001 | |
| 7.25% 1/15/30 (b) | 950 | 977 | |
| 8.25% 1/15/29 (b) | 6,455 | 6,811 | |
| 9.25% 1/15/29 (b) | 5,340 | 5,703 | |
| SeaWorld Parks & Entertainment, Inc. 5.25% 8/15/29 (b) | 1,665 | 1,535 | |
| Vail Resorts, Inc. 6.25% 5/15/25 (b) | 850 | 850 | |
| Viking Ocean Cruises Ship VII Ltd. 5.625% 2/15/29 (b) | 625 | 598 | |
| Voc Escrow Ltd. 5% 2/15/28 (b) | 5,510 | 5,255 | |
| 39,712 | |||
| Metals/Mining - 1.4% | |||
| Alcoa Nederland Holding BV: | |||
| 4.125% 3/31/29 (b) | 1,980 | 1,810 | |
| 7.125% 3/15/31 (b) | 835 | 845 | |
| Alpha Natural Resources, Inc. 9.75% (c)(f) | 1,770 | 0 | |
| Arsenal AIC Parent LLC 8% 10/1/30 (b) | 1,145 | 1,192 | |
| Cleveland-Cliffs, Inc.: | |||
| 4.625% 3/1/29 (b) | 3,200 | 2,961 | |
| 4.875% 3/1/31 (b) | 1,480 | 1,297 | |
| 6.75% 4/15/30 (b) | 2,000 | 1,953 | |
| Eldorado Gold Corp. 6.25% 9/1/29 (b) | 1,895 | 1,788 | |
| ERO Copper Corp. 6.5% 2/15/30 (b) | 1,320 | 1,242 | |
| First Quantum Minerals Ltd.: | |||
| 8.625% 6/1/31 (b) | 5,740 | 5,582 | |
| 9.375% 3/1/29 (b) | 2,390 | 2,469 | |
| FMG Resources Pty Ltd. 4.375% 4/1/31 (b) | 1,145 | 1,008 | |
| HudBay Minerals, Inc. 4.5% 4/1/26 (b) | 905 | 875 | |
| Mineral Resources Ltd.: | |||
| 8% 11/1/27 (b) | 3,895 | 3,939 | |
| 8.5% 5/1/30 (b) | 660 | 676 | |
| 9.25% 10/1/28 (b) | 1,745 | 1,829 | |
| 29,466 | |||
| Paper - 0.6% | |||
| Ardagh Metal Packaging Finance U.S.A. LLC/Ardagh Metal Packaging Finance PLC: | |||
| 3.25% 9/1/28 (b) | 760 | 658 | |
| 4% 9/1/29 (b) | 1,515 | 1,249 | |
| 6% 6/15/27 (b) | 890 | 863 | |
| Cascades, Inc.: | |||
| 5.125% 1/15/26 (b) | 790 | 765 | |
| 5.375% 1/15/28 (b) | 790 | 741 | |
| Clydesdale Acquisition Holdings, Inc.: | |||
| 6.625% 4/15/29 (b) | 1,060 | 1,057 | |
| 8.75% 4/15/30 (b) | 7,325 | 7,079 | |
| Mercer International, Inc. 5.125% 2/1/29 | 1,920 | 1,677 | |
| 14,089 | |||
| Restaurants - 0.7% | |||
| 1011778 BC Unlimited Liability Co./New Red Finance, Inc.: | |||
| 3.875% 1/15/28 (b) | 1,630 | 1,504 | |
| 4% 10/15/30 (b) | 5,185 | 4,471 | |
| 4.375% 1/15/28 (b) | 5,490 | 5,105 | |
| Bloomin Brands, Inc. / OSI Restaurant Partners LLC 5.125% 4/15/29 (b) | 715 | 658 | |
| Garden SpinCo Corp. 8.625% 7/20/30 (b) | 775 | 817 | |
| Papa John's International, Inc. 3.875% 9/15/29 (b) | 765 | 666 | |
| Yum! Brands, Inc. 4.625% 1/31/32 | 1,530 | 1,377 | |
| 14,598 | |||
| Services - 3.4% | |||
| Adtalem Global Education, Inc. 5.5% 3/1/28 (b) | 1,335 | 1,265 | |
| Artera Services LLC 8.5% 2/15/31 (b) | 4,195 | 4,293 | |
| ASGN, Inc. 4.625% 5/15/28 (b) | 1,350 | 1,260 | |
| Atlas Luxco 4 SARL / Allied Universal Holdco LLC / Allied Universal Finance Corp.: | |||
| 4.625% 6/1/28 (b) | 1,549 | 1,391 | |
| 4.625% 6/1/28 (b) | 846 | 759 | |
| Brand Industrial Services, Inc. 10.375% 8/1/30 (b) | 7,245 | 7,775 | |
| Camelot Finance SA 4.5% 11/1/26 (b) | 1,515 | 1,443 | |
| CoreCivic, Inc. 8.25% 4/15/29 | 5,765 | 5,957 | |
| Fair Isaac Corp. 4% 6/15/28 (b) | 1,530 | 1,409 | |
| GEMS MENASA Cayman Ltd./GEMS Education Delaware LLC 7.125% 7/31/26 (b) | 1,360 | 1,352 | |
| H&E Equipment Services, Inc. 3.875% 12/15/28 (b) | 2,415 | 2,137 | |
| Hertz Corp.: | |||
| 4.625% 12/1/26 (b) | 740 | 573 | |
| 5% 12/1/29 (b) | 1,435 | 985 | |
| 5.5% (b)(c)(f) | 1,505 | 49 | |
| 6% (b)(c)(f) | 1,385 | 125 | |
| 6.25% (c)(f) | 1,605 | 52 | |
| 7.125% (b)(c)(f) | 1,430 | 129 | |
| Iron Mountain, Inc.: | |||
| 4.5% 2/15/31 (b) | 2,975 | 2,624 | |
| 4.875% 9/15/29 (b) | 3,800 | 3,507 | |
| Neptune BidCo U.S., Inc. 9.29% 4/15/29 (b) | 7,590 | 7,154 | |
| Service Corp. International 4% 5/15/31 | 1,610 | 1,387 | |
| Sotheby's 7.375% 10/15/27 (b) | 640 | 596 | |
| Sotheby's/Bidfair Holdings, Inc. 5.875% 6/1/29 (b) | 2,410 | 2,005 | |
| The GEO Group, Inc.: | |||
| 8.625% 4/15/29 (b) | 3,605 | 3,650 | |
| 10.25% 4/15/31 (b) | 2,575 | 2,655 | |
| TriNet Group, Inc. 3.5% 3/1/29 (b) | 1,135 | 994 | |
| Uber Technologies, Inc.: | |||
| 4.5% 8/15/29 (b) | 3,730 | 3,475 | |
| 6.25% 1/15/28 (b) | 1,225 | 1,224 | |
| 7.5% 9/15/27 (b) | 4,885 | 4,974 | |
| 8% 11/1/26 (b) | 7,110 | 7,181 | |
| WASH Multifamily Acquisition, Inc. 5.75% 4/15/26 (b) | 1,285 | 1,246 | |
| 73,626 | |||
| Steel - 0.2% | |||
| ATI, Inc. 7.25% 8/15/30 | 975 | 997 | |
| Commercial Metals Co. 3.875% 2/15/31 | 780 | 679 | |
| Roller Bearing Co. of America, Inc. 4.375% 10/15/29 (b) | 610 | 551 | |
| Vallourec SA 7.5% 4/15/32 (b) | 2,115 | 2,141 | |
| 4,368 | |||
| Super Retail - 1.5% | |||
| Asbury Automotive Group, Inc.: | |||
| 4.5% 3/1/28 | 492 | 462 | |
| 4.625% 11/15/29 (b) | 6,520 | 5,895 | |
| 4.75% 3/1/30 | 489 | 443 | |
| 5% 2/15/32 (b) | 1,535 | 1,365 | |
| Bath & Body Works, Inc.: | |||
| 6.625% 10/1/30 (b) | 4,585 | 4,582 | |
| 6.75% 7/1/36 | 1,340 | 1,308 | |
| 7.5% 6/15/29 | 1,135 | 1,162 | |
| Carvana Co.: | |||
| 12% 12/1/28 pay-in-kind (b)(d) | 540 | 529 | |
| 13% 6/1/30 pay-in-kind (b)(d) | 815 | 808 | |
| 14% 6/1/31 pay-in-kind (b)(d) | 968 | 970 | |
| EG Global Finance PLC 12% 11/30/28 (b) | 12,260 | 12,656 | |
| LBM Acquisition LLC 6.25% 1/15/29 (b) | 2,880 | 2,644 | |
| 32,824 | |||
| Technology - 3.9% | |||
| Acuris Finance U.S. 5% 5/1/28 (b) | 6,410 | 5,815 | |
| Block, Inc. 3.5% 6/1/31 | 1,615 | 1,364 | |
| CA Magnum Holdings 5.375% 10/31/26 (b) | 690 | 653 | |
| Clarivate Science Holdings Corp.: | |||
| 3.875% 7/1/28 (b) | 1,440 | 1,311 | |
| 4.875% 7/1/29 (b) | 1,360 | 1,239 | |
| Cloud Software Group, Inc. 6.5% 3/31/29 (b) | 16,555 | 15,702 | |
| Coherent Corp. 5% 12/15/29 (b) | 1,350 | 1,245 | |
| Crowdstrike Holdings, Inc. 3% 2/15/29 | 1,130 | 993 | |
| Elastic NV 4.125% 7/15/29 (b) | 3,785 | 3,371 | |
| Go Daddy Operating Co. LLC / GD Finance Co., Inc.: | |||
| 3.5% 3/1/29 (b) | 6,860 | 6,083 | |
| 5.25% 12/1/27 (b) | 1,495 | 1,443 | |
| ION Trading Technologies Ltd. 5.75% 5/15/28 (b) | 1,605 | 1,466 | |
| Iron Mountain Information Management Services, Inc. 5% 7/15/32 (b) | 1,295 | 1,148 | |
| MicroStrategy, Inc. 6.125% 6/15/28 (b) | 4,490 | 4,161 | |
| NCR Atleos Corp. 9.5% 4/1/29 (b) | 1,480 | 1,573 | |
| NCR Voyix Corp.: | |||
| 5% 10/1/28 (b) | 750 | 691 | |
| 5.125% 4/15/29 (b) | 3,710 | 3,409 | |
| 5.25% 10/1/30 (b) | 750 | 668 | |
| ON Semiconductor Corp. 3.875% 9/1/28 (b) | 5,500 | 4,991 | |
| Open Text Corp. 6.9% 12/1/27 (b) | 1,685 | 1,721 | |
| Open Text Holdings, Inc.: | |||
| 4.125% 2/15/30 (b) | 790 | 694 | |
| 4.125% 12/1/31 (b) | 780 | 669 | |
| PTC, Inc.: | |||
| 3.625% 2/15/25 (b) | 925 | 906 | |
| 4% 2/15/28 (b) | 915 | 848 | |
| Roblox Corp. 3.875% 5/1/30 (b) | 3,295 | 2,850 | |
| Seagate HDD Cayman: | |||
| 8.25% 12/15/29 (b) | 3,160 | 3,359 | |
| 8.5% 7/15/31 (b) | 2,045 | 2,183 | |
| Sensata Technologies BV 4% 4/15/29 (b) | 1,530 | 1,370 | |
| Synaptics, Inc. 4% 6/15/29 (b) | 900 | 790 | |
| TTM Technologies, Inc. 4% 3/1/29 (b) | 1,135 | 1,015 | |
| Twilio, Inc.: | |||
| 3.625% 3/15/29 | 6,425 | 5,703 | |
| 3.875% 3/15/31 | 1,340 | 1,160 | |
| UKG, Inc. 6.875% 2/1/31 (b) | 1,505 | 1,508 | |
| Unisys Corp. 6.875% 11/1/27 (b) | 830 | 716 | |
| Veritas U.S., Inc./Veritas Bermuda Ltd. 7.5% 9/1/25 (b) | 3,170 | 2,884 | |
| 85,702 | |||
| Telecommunications - 2.5% | |||
| Altice Financing SA: | |||
| 5% 1/15/28 (b) | 1,580 | 1,247 | |
| 5.75% 8/15/29 (b) | 4,975 | 3,695 | |
| Altice France SA: | |||
| 5.125% 7/15/29 (b) | 7,670 | 4,996 | |
| 5.5% 1/15/28 (b) | 2,465 | 1,665 | |
| 5.5% 10/15/29 (b) | 14,870 | 9,729 | |
| C&W Senior Finance Ltd. 6.875% 9/15/27 (b) | 6,170 | 5,842 | |
| Frontier Communications Holdings LLC: | |||
| 5% 5/1/28 (b) | 2,830 | 2,604 | |
| 5.875% 10/15/27 (b) | 1,375 | 1,319 | |
| Intelsat Jackson Holdings SA 6.5% 3/15/30 (b) | 3,610 | 3,455 | |
| LCPR Senior Secured Financing DAC: | |||
| 5.125% 7/15/29 (b) | 1,895 | 1,580 | |
| 6.75% 10/15/27 (b) | 1,453 | 1,344 | |
| Millicom International Cellular SA 4.5% 4/27/31 (b) | 235 | 196 | |
| Sable International Finance Ltd. 5.75% 9/7/27 (b) | 5,800 | 5,512 | |
| SBA Communications Corp.: | |||
| 3.125% 2/1/29 | 1,695 | 1,476 | |
| 3.875% 2/15/27 | 6,375 | 5,991 | |
| Uniti Group LP/Uniti Fiber Holdings, Inc./CSL Capital LLC 6% 1/15/30 (b) | 1,120 | 871 | |
| VMED O2 UK Financing I PLC 4.75% 7/15/31 (b) | 2,875 | 2,399 | |
| 53,921 | |||
| Textiles/Apparel - 0.1% | |||
| Crocs, Inc.: | |||
| 4.125% 8/15/31 (b) | 825 | 692 | |
| 4.25% 3/15/29 (b) | 1,110 | 995 | |
| Kontoor Brands, Inc. 4.125% 11/15/29 (b) | 760 | 675 | |
| 2,362 | |||
| Transportation Ex Air/Rail - 0.2% | |||
| Seaspan Corp. 5.5% 8/1/29 (b) | 1,240 | 1,066 | |
| XPO, Inc.: | |||
| 6.25% 6/1/28 (b) | 960 | 956 | |
| 7.125% 2/1/32 (b) | 1,470 | 1,479 | |
| 3,501 | |||
| Utilities - 2.1% | |||
| Clearway Energy Operating LLC: | |||
| 3.75% 2/15/31 (b) | 1,705 | 1,441 | |
| 3.75% 1/15/32 (b) | 850 | 704 | |
| 4.75% 3/15/28 (b) | 970 | 914 | |
| NextEra Energy Partners LP 7.25% 1/15/29 (b) | 980 | 993 | |
| NRG Energy, Inc.: | |||
| 3.375% 2/15/29 (b) | 665 | 583 | |
| 3.625% 2/15/31 (b) | 1,320 | 1,117 | |
| 3.875% 2/15/32 (b) | 171 | 144 | |
| 5.75% 1/15/28 | 2,765 | 2,721 | |
| Pacific Gas & Electric Co.: | |||
| 3.45% 7/1/25 | 400 | 389 | |
| 3.75% 7/1/28 | 400 | 369 | |
| 3.95% 12/1/47 | 885 | 621 | |
| 4% 12/1/46 | 2,184 | 1,545 | |
| PG&E Corp.: | |||
| 5% 7/1/28 | 10,140 | 9,662 | |
| 5.25% 7/1/30 | 1,150 | 1,077 | |
| Pike Corp.: | |||
| 5.5% 9/1/28 (b) | 5,980 | 5,667 | |
| 8.625% 1/31/31 (b) | 2,445 | 2,561 | |
| Vistra Operations Co. LLC: | |||
| 4.375% 5/1/29 (b) | 3,105 | 2,827 | |
| 5% 7/31/27 (b) | 3,565 | 3,393 | |
| 5.5% 9/1/26 (b) | 1,822 | 1,778 | |
| 5.625% 2/15/27 (b) | 4,435 | 4,315 | |
| 7.75% 10/15/31 (b) | 1,965 | 2,015 | |
| 44,836 | |||
TOTAL NONCONVERTIBLE BONDS | 1,135,540 | ||
| TOTAL CORPORATE BONDS (Cost $1,216,406) | 1,160,787 | ||
| Common Stocks - 18.8% | |||
| Shares | Value ($) (000s) | ||
| Aerospace - 0.1% | |||
| TransDigm Group, Inc. | 2,100 | 2,621 | |
| Air Transportation - 0.1% | |||
| Air Canada (h) | 3,800 | 56 | |
| Delta Air Lines, Inc. | 23,450 | 1,174 | |
TOTAL AIR TRANSPORTATION | 1,230 | ||
| Automotive & Auto Parts - 0.2% | |||
| BYD Co. Ltd. (H Shares) | 195,000 | 5,345 | |
| UC Holdings, Inc. (c)(h) | 29,835 | 30 | |
TOTAL AUTOMOTIVE & AUTO PARTS | 5,375 | ||
| Banks & Thrifts - 0.0% | |||
| Mr. Cooper Group, Inc. (h) | 1,504 | 116 | |
| Broadcasting - 0.1% | |||
| Nexstar Media Group, Inc. Class A | 8,363 | 1,339 | |
| Building Materials - 1.1% | |||
| Builders FirstSource, Inc. (h) | 14,100 | 2,578 | |
| Carlisle Companies, Inc. | 16,200 | 6,290 | |
| Eagle Materials, Inc. | 23,600 | 5,917 | |
| EMCOR Group, Inc. | 9,500 | 3,393 | |
| Fortune Brands Innovations, Inc. | 52,700 | 3,852 | |
| Simpson Manufacturing Co. Ltd. | 10,600 | 1,843 | |
TOTAL BUILDING MATERIALS | 23,873 | ||
| Capital Goods - 0.5% | |||
| Deere & Co. | 2,400 | 939 | |
| Parker Hannifin Corp. | 10,300 | 5,613 | |
| Trane Technologies PLC | 12,300 | 3,903 | |
TOTAL CAPITAL GOODS | 10,455 | ||
| Chemicals - 0.4% | |||
| Olin Corp. | 55,900 | 2,922 | |
| The Chemours Co. LLC | 138,100 | 3,694 | |
| Westlake Corp. | 8,200 | 1,208 | |
TOTAL CHEMICALS | 7,824 | ||
| Consumer Products - 0.1% | |||
| Tapestry, Inc. | 47,300 | 1,888 | |
| Containers - 0.2% | |||
| Graphic Packaging Holding Co. | 159,900 | 4,133 | |
| Diversified Financial Services - 1.3% | |||
| Apollo Global Management, Inc. | 88,100 | 9,548 | |
| Carnelian Point Holdings LP warrants (c)(h) | 118 | 0 | |
| Coinbase Global, Inc. (h) | 15,900 | 3,242 | |
| MasterCard, Inc. Class A | 16,000 | 7,219 | |
| Moody's Corp. | 5,600 | 2,074 | |
| OneMain Holdings, Inc. | 126,400 | 6,587 | |
TOTAL DIVERSIFIED FINANCIAL SERVICES | 28,670 | ||
| Energy - 1.3% | |||
| Antero Resources Corp. (h) | 47,902 | 1,629 | |
| California Resources Corp. warrants 10/27/24 (h) | 8,300 | 143 | |
| Cheniere Energy, Inc. | 36,000 | 5,682 | |
| EP Energy Corp. (c)(h) | 147,125 | 262 | |
| Forbes Energy Services Ltd. (c)(h) | 65,062 | 0 | |
| Mesquite Energy, Inc. (c)(h) | 90,382 | 7,399 | |
| Noble Corp. PLC | 1,410 | 63 | |
| Permian Resource Corp. Class A | 629,900 | 10,551 | |
| PureWest Energy (c) | 3,289 | 1 | |
| PureWest Energy rights (c)(h) | 1,983 | 0 | |
| Superior Energy Services, Inc. Class A (c) | 17,671 | 1,140 | |
| Tidewater, Inc. warrants 11/14/42 (h) | 12,651 | 1,278 | |
TOTAL ENERGY | 28,148 | ||
| Entertainment/Film - 0.1% | |||
| New Cotai LLC/New Cotai Capital Corp. (c)(g)(h) | 1,458,195 | 1,123 | |
| Food & Drug Retail - 0.1% | |||
| Northeast Grocery, Inc. (c)(g)(h) | 339,746 | 1,909 | |
| Southeastern Grocers, Inc. rights (c)(h) | 250,623 | 276 | |
TOTAL FOOD & DRUG RETAIL | 2,185 | ||
| Food/Beverage/Tobacco - 0.4% | |||
| Celsius Holdings, Inc. (h) | 39,200 | 2,794 | |
| U.S. Foods Holding Corp. (h) | 109,000 | 5,477 | |
TOTAL FOOD/BEVERAGE/TOBACCO | 8,271 | ||
| Gaming - 0.2% | |||
| Boyd Gaming Corp. | 74,300 | 3,976 | |
| Studio City International Holdings Ltd.: | |||
| ADR (b)(h) | 32,338 | 241 | |
| (NYSE) ADR (h) | 35,600 | 265 | |
TOTAL GAMING | 4,482 | ||
| Healthcare - 0.1% | |||
| Tenet Healthcare Corp. (h) | 15,300 | 1,718 | |
| Homebuilders/Real Estate - 1.2% | |||
| Arthur J. Gallagher & Co. | 34,500 | 8,097 | |
| Comfort Systems U.S.A., Inc. | 18,000 | 5,569 | |
| TopBuild Corp. (h) | 21,700 | 8,781 | |
| Willscot Mobile Mini Holdings (h) | 97,300 | 3,596 | |
TOTAL HOMEBUILDERS/REAL ESTATE | 26,043 | ||
| Metals/Mining - 0.0% | |||
| Warrior Metropolitan Coal, Inc. | 692 | 47 | |
| Restaurants - 0.1% | |||
| Domino's Pizza, Inc. | 4,900 | 2,593 | |
| Services - 0.6% | |||
| Airbnb, Inc. Class A (h) | 35,700 | 5,661 | |
| Visa, Inc. Class A | 30,800 | 8,273 | |
TOTAL SERVICES | 13,934 | ||
| Super Retail - 0.9% | |||
| Amazon.com, Inc. (h) | 43,500 | 7,613 | |
| Arena Brands Holding Corp. Class B (c)(g)(h) | 42,253 | 584 | |
| Booking Holdings, Inc. | 800 | 2,762 | |
| Dick's Sporting Goods, Inc. | 21,300 | 4,280 | |
| Lowe's Companies, Inc. | 8,600 | 1,961 | |
| Williams-Sonoma, Inc. | 11,300 | 3,241 | |
TOTAL SUPER RETAIL | 20,441 | ||
| Technology - 8.0% | |||
| Accenture PLC Class A | 6,100 | 1,836 | |
| Adobe, Inc. (h) | 13,400 | 6,202 | |
| Alphabet, Inc. Class A | 39,600 | 6,446 | |
| Arista Networks, Inc. (h) | 15,600 | 4,002 | |
| ASML Holding NV (depository receipt) | 3,400 | 2,966 | |
| Autodesk, Inc. (h) | 12,700 | 2,703 | |
| Block, Inc. Class A (h) | 48,300 | 3,526 | |
| CDW Corp. | 8,800 | 2,128 | |
| Dell Technologies, Inc. | 16,500 | 2,057 | |
| DoubleVerify Holdings, Inc. (h) | 99,600 | 2,918 | |
| Dynatrace, Inc. (h) | 115,400 | 5,229 | |
| Eaton Corp. PLC | 27,200 | 8,657 | |
| Fiserv, Inc. (h) | 56,800 | 8,672 | |
| Gen Digital, Inc. | 98,300 | 1,980 | |
| Intuit, Inc. | 5,100 | 3,191 | |
| KLA Corp. | 7,600 | 5,239 | |
| Lam Research Corp. | 9,800 | 8,765 | |
| Marvell Technology, Inc. | 45,200 | 2,979 | |
| Meta Platforms, Inc. Class A | 41,700 | 17,938 | |
| Microsoft Corp. | 31,000 | 12,069 | |
| Monday.com Ltd. (h) | 14,400 | 2,726 | |
| Nextracker, Inc. Class A (h) | 149,800 | 6,410 | |
| nVent Electric PLC | 51,800 | 3,733 | |
| NVIDIA Corp. | 23,000 | 19,872 | |
| NXP Semiconductors NV | 7,900 | 2,024 | |
| ON Semiconductor Corp. (h) | 113,260 | 7,946 | |
| Oracle Corp. | 33,200 | 3,777 | |
| Salesforce, Inc. | 18,200 | 4,895 | |
| Synopsys, Inc. (h) | 5,100 | 2,706 | |
| UiPath, Inc. Class A (h)(i) | 233,500 | 4,429 | |
| Vertiv Holdings Co. | 67,400 | 6,268 | |
TOTAL TECHNOLOGY | 174,289 | ||
| Telecommunications - 0.2% | |||
| EchoStar Corp. Class A (h)(i) | 126,700 | 2,026 | |
| GTT Communications, Inc. (c)(h) | 11,856 | 442 | |
| Palo Alto Networks, Inc. (h) | 8,800 | 2,560 | |
TOTAL TELECOMMUNICATIONS | 5,028 | ||
| Textiles/Apparel - 0.3% | |||
| Crocs, Inc. (h) | 40,900 | 5,087 | |
| LVMH Moet Hennessy Louis Vuitton SE | 1,900 | 1,561 | |
TOTAL TEXTILES/APPAREL | 6,648 | ||
| Utilities - 1.2% | |||
| Constellation Energy Corp. | 43,600 | 8,107 | |
| Core & Main, Inc. (h) | 59,500 | 3,360 | |
| PG&E Corp. | 341,179 | 5,838 | |
| Vistra Corp. | 110,700 | 8,395 | |
TOTAL UTILITIES | 25,700 | ||
| TOTAL COMMON STOCKS (Cost $327,247) | 408,174 | ||
| Bank Loan Obligations - 10.4% | |||
Principal Amount (a) (000s) | Value ($) (000s) | ||
| Air Transportation - 0.0% | |||
| SkyMiles IP Ltd. Tranche B 1LN, term loan CME Term SOFR 3 Month Index + 3.750% 9.0746% 10/20/27 (d)(e)(j) | 200 | 206 | |
| United Airlines, Inc. Tranche 1LN, term loan CME Term SOFR 1 Month Index + 2.750% 8.0757% 2/24/31 (d)(e)(j) | 455 | 456 | |
TOTAL AIR TRANSPORTATION | 662 | ||
| Automotive & Auto Parts - 0.0% | |||
| Clarios Global LP Tranche B 1LN, term loan CME Term SOFR 1 Month Index + 3.250% 8.3157% 5/6/30 (d)(e)(j) | 429 | 430 | |
| Wand NewCo 3, Inc. Tranche B 1LN, term loan CME Term SOFR 1 Month Index + 3.750% 9.0657% 1/20/31 (d)(e)(j) | 370 | 372 | |
TOTAL AUTOMOTIVE & AUTO PARTS | 802 | ||
| Banks & Thrifts - 0.1% | |||
| Citadel Securities LP Tranche B 1LN, term loan CME Term SOFR 1 Month Index + 2.250% 7.5657% 7/29/30 (d)(e)(j) | 1,203 | 1,205 | |
| Broadcasting - 0.1% | |||
| Diamond Sports Group LLC 1LN, term loan CME Term SOFR 1 Month Index + 8.000% 15.4287% 8/24/26 (d)(e)(j) | 397 | 379 | |
| Univision Communications, Inc.: | |||
| 1LN, term loan CME Term SOFR 3 Month Index + 4.250% 9.5594% 6/24/29 (d)(e)(j) | 113 | 113 | |
| Tranche B 1LN, term loan CME Term SOFR 1 Month Index + 3.250% 8.6802% 1/31/29 (d)(e)(j) | 985 | 982 | |
TOTAL BROADCASTING | 1,474 | ||
| Building Materials - 0.2% | |||
| Hunter Douglas, Inc. Tranche B 1LN, term loan CME Term SOFR 3 Month Index + 3.500% 8.8238% 2/25/29 (d)(e)(j) | 3,286 | 3,259 | |
| Miwd Holdco Ii LLC Tranche B2, term loan CME Term SOFR 1 Month Index + 3.500% 3/20/31 (e)(j)(k) | 130 | 131 | |
| SRS Distribution, Inc. Tranche B 1LN, term loan CME Term SOFR 1 Month Index + 3.500% 8.9302% 6/4/28 (d)(e)(j) | 841 | 847 | |
TOTAL BUILDING MATERIALS | 4,237 | ||
| Capital Goods - 0.0% | |||
| Chart Industries, Inc. Tranche B 1LN, term loan CME Term SOFR 1 Month Index + 3.250% 8.6734% 3/17/30 (d)(e)(j) | 251 | 251 | |
| Chemicals - 0.5% | |||
| Consolidated Energy Finance SA Tranche B 1LN, term loan CME Term SOFR 1 Month Index + 4.500% 9.8157% 11/15/30 (d)(e)(j) | 2,010 | 1,942 | |
| Discovery Purchaser Corp. 1LN, term loan CME Term SOFR 3 Month Index + 4.370% 9.6813% 10/4/29 (d)(e)(j) | 6,123 | 6,111 | |
| Olympus Water U.S. Holding Corp. Tranche B 1LN, term loan CME Term SOFR 3 Month Index + 3.750% 9.321% 11/9/28 (d)(e)(j) | 508 | 509 | |
| W.R. Grace Holding LLC Tranche B 1LN, term loan CME Term SOFR 3 Month Index + 3.750% 9.321% 9/22/28 (d)(e)(j) | 2,346 | 2,346 | |
TOTAL CHEMICALS | 10,908 | ||
| Consumer Products - 0.2% | |||
| Kronos Acquisition Holdings, Inc. Tranche B 1LN, term loan CME Term SOFR 3 Month Index + 3.750% 9.3135% 12/22/26 (d)(e)(j) | 2,489 | 2,491 | |
| TKC Holdings, Inc. 1LN, term loan CME Term SOFR 1 Month Index + 5.500% 10.9302% 5/14/28 (d)(e)(j) | 1,370 | 1,357 | |
TOTAL CONSUMER PRODUCTS | 3,848 | ||
| Containers - 0.0% | |||
| Kloeckner Pentaplast of America, Inc. Tranche B 1LN, term loan CME Term SOFR 6 Month Index + 4.750% 10.2675% 2/9/26 (d)(e)(j) | 184 | 165 | |
| Energy - 0.3% | |||
| EG America LLC Tranche BC 1LN, term loan CME Term SOFR 1 Month Index + 5.500% 11.2383% 2/7/28 (d)(e)(j) | 5,835 | 5,737 | |
| Forbes Energy Services LLC Tranche B, term loan 0% (c)(d)(f)(j) | 610 | 0 | |
| Mesquite Energy, Inc.: | |||
| 1LN, term loan 3 month U.S. LIBOR + 8.000% 0% (c)(e)(f)(j) | 1,671 | 0 | |
| term loan 0% (c)(d)(f)(j) | 721 | 0 | |
| Natgasoline LLC Tranche B, term loan CME Term SOFR 1 Month Index + 3.500% 8.9302% 11/14/25 (d)(e)(j) | 318 | 316 | |
TOTAL ENERGY | 6,053 | ||
| Environmental - 0.0% | |||
| Covanta Holding Corp.: | |||
| Tranche B 1LN, term loan CME Term SOFR 1 Month Index + 2.500% 7.8157% 11/30/28 (d)(e)(j) | 310 | 310 | |
| Tranche C 1LN, term loan CME Term SOFR 1 Month Index + 2.500% 7.8273% 11/30/28 (d)(e)(j) | 24 | 24 | |
| Madison IAQ LLC Tranche B 1LN, term loan CME Term SOFR 1 Month Index + 3.250% 8.6799% 6/21/28 (d)(e)(j) | 399 | 399 | |
TOTAL ENVIRONMENTAL | 733 | ||
| Food/Beverage/Tobacco - 0.0% | |||
| Fiesta Purchaser, Inc. Tranche B 1LN, term loan CME Term SOFR 1 Month Index + 4.000% 9.3169% 2/12/31 (d)(e)(j) | 355 | 356 | |
| Naked Juice LLC 1LN, term loan CME Term SOFR 3 Month Index + 3.250% 8.6594% 1/24/29 (d)(e)(j) | 324 | 313 | |
TOTAL FOOD/BEVERAGE/TOBACCO | 669 | ||
| Gaming - 0.5% | |||
| Caesars Entertainment, Inc. Tranche B1 1LN, term loan CME Term SOFR 1 Month Index + 2.750% 8.0657% 2/6/31 (d)(e)(j) | 1,980 | 1,981 | |
| Fertitta Entertainment LLC NV Tranche B 1LN, term loan CME Term SOFR 1 Month Index + 4.000% 9.069% 1/27/29 (d)(e)(j) | 7,335 | 7,348 | |
| Light & Wonder International, Inc. Tranche B 1LN, term loan CME Term SOFR 1 Month Index + 2.750% 8.071% 4/16/29 (d)(e)(j) | 345 | 345 | |
| Ontario Gaming GTA LP Tranche B 1LN, term loan CME Term SOFR 1 Month Index + 4.250% 9.5594% 8/1/30 (d)(e)(j) | 988 | 992 | |
TOTAL GAMING | 10,666 | ||
| Healthcare - 0.5% | |||
| Gainwell Acquisition Corp. Tranche B 1LN, term loan CME Term SOFR 3 Month Index + 4.000% 9.4094% 10/1/27 (d)(e)(j) | 2,253 | 2,145 | |
| Jazz Financing Lux SARL Tranche B 1LN, term loan CME Term SOFR 1 Month Index + 3.000% 8.4302% 5/5/28 (d)(e)(j) | 814 | 819 | |
| Medline Borrower LP Tranche B 1LN, term loan CME Term SOFR 1 Month Index + 2.750% 8.0683% 10/23/28 (d)(e)(j) | 5,619 | 5,631 | |
| Organon & Co. Tranche B 1LN, term loan CME Term SOFR 3 Month Index + 3.000% 8.4334% 6/2/28 (d)(e)(j) | 1,962 | 1,970 | |
| Phoenix Newco, Inc. Tranche B 1LN, term loan CME Term SOFR 1 Month Index + 3.250% 8.6918% 11/15/28 (d)(e)(j) | 965 | 968 | |
TOTAL HEALTHCARE | 11,533 | ||
| Insurance - 0.8% | |||
| Acrisure LLC: | |||
| Tranche B 1LN, term loan: | |||
CME Term SOFR 1 Month Index + 3.500% 8.9302% 2/15/27 (d)(e)(j) | 2,932 | 2,926 | |
CME Term SOFR 1 Month Index + 4.250% 9.6802% 2/15/27 (d)(e)(j) | 200 | 201 | |
| Tranche B5 1LN, term loan CME Term SOFR 1 Month Index + 4.500% 9.8157% 11/6/30 (d)(e)(j) | 509 | 510 | |
| Alliant Holdings Intermediate LLC Tranche B6 1LN, term loan CME Term SOFR 1 Month Index + 3.500% 8.8189% 11/6/30 (d)(e)(j) | 2,252 | 2,260 | |
| HUB International Ltd. Tranche B 1LN, term loan CME Term SOFR 1 Month Index + 3.250% 8.5745% 6/20/30 (d)(e)(j) | 5,550 | 5,577 | |
| Truist Insurance Holdings LLC: | |||
| 2L, term loan CME Term SOFR 1 Month Index + 4.750% 3/8/32 (e)(j)(k) | 4,320 | 4,355 | |
| Tranche B 1LN, term loan CME Term SOFR 1 Month Index + 3.250% 3/22/31 (e)(j)(k) | 830 | 832 | |
TOTAL INSURANCE | 16,661 | ||
| Leisure - 0.6% | |||
| Carnival Corp. Tranche B 1LN, term loan: | |||
| CME Term SOFR 1 Month Index + 2.750% 8.0669% 8/9/27 (d)(e)(j) | 2,944 | 2,958 | |
| CME Term SOFR 1 Month Index + 2.750% 8.0669% 10/18/28 (d)(e)(j) | 9,065 | 9,093 | |
TOTAL LEISURE | 12,051 | ||
| Metals/Mining - 0.0% | |||
| Arsenal AIC Parent LLC Tranche B 1LN, term loan CME Term SOFR 1 Month Index + 3.750% 9.0657% 8/19/30 (d)(e)(j) | 264 | 265 | |
| Paper - 0.7% | |||
| Clydesdale Acquisition Holdings, Inc. 1LN, term loan CME Term SOFR 1 Month Index + 3.670% 9.0907% 4/13/29 (d)(e)(j) | 14,940 | 14,996 | |
| Services - 1.1% | |||
| ABG Intermediate Holdings 2 LLC Tranche B1 LN, term loan CME Term SOFR 1 Month Index + 3.500% 8.9183% 12/21/28 (d)(e)(j) | 2,757 | 2,769 | |
| Artera Services LLC Tranche B 1LN, term loan CME Term SOFR 1 Month Index + 4.500% 9.8094% 2/10/31 (d)(e)(j) | 1,050 | 1,058 | |
| Ascend Learning LLC: | |||
| 2LN, term loan CME Term SOFR 1 Month Index + 5.750% 11.1657% 12/10/29 (d)(e)(j) | 2,170 | 2,125 | |
| Tranche B 1LN, term loan CME Term SOFR 1 Month Index + 3.500% 8.9157% 12/10/28 (d)(e)(j) | 2,880 | 2,868 | |
| Bifm California Buyer, Inc. Tranche 1LN, term loan CME Term SOFR 1 Month Index + 4.250% 9.5657% 5/31/28 (d)(e)(j) | 240 | 241 | |
| Brand Industrial Services, Inc. Tranche B 1LN, term loan CME Term SOFR 1 Month Index + 4.500% 9.819% 8/1/30 (d)(e)(j) | 5,127 | 5,141 | |
| Galaxy U.S. Opco, Inc. 1LN, term loan CME Term SOFR 1 Month Index + 4.750% 10.0795% 4/29/29 (d)(e)(j) | 4,050 | 3,625 | |
| Neptune BidCo U.S., Inc. Tranche B 1LN, term loan CME Term SOFR 1 Month Index + 5.000% 10.4059% 4/11/29 (d)(e)(j) | 2,465 | 2,312 | |
| Sabert Corp. Tranche B 1LN, term loan CME Term SOFR 1 Month Index + 3.750% 9.1834% 12/16/26 (d)(e)(j) | 700 | 702 | |
| Spin Holdco, Inc. Tranche B 1LN, term loan CME Term SOFR 3 Month Index + 4.000% 9.5854% 3/4/28 (d)(e)(j) | 2,631 | 2,314 | |
| STS Operating, Inc. 1LN, term loan CME Term SOFR 1 Month Index + 4.000% 9.42% 3/25/31 (d)(e)(j) | 1,035 | 1,044 | |
| The GEO Group, Inc. Tranche B 1LN, term loan CME Term SOFR 1 Month Index + 5.250% 10.5689% 4/4/29 (d)(e)(j) | 800 | 809 | |
TOTAL SERVICES | 25,008 | ||
| Super Retail - 1.0% | |||
| Great Outdoors Group LLC Tranche B 1LN, term loan CME Term SOFR 1 Month Index + 3.750% 9.1802% 3/5/28 (d)(e)(j) | 504 | 503 | |
| LBM Acquisition LLC Tranche B 1LN, term loan CME Term SOFR 1 Month Index + 3.750% 9.1773% 12/18/27 (d)(e)(j) | 21,718 | 21,727 | |
TOTAL SUPER RETAIL | 22,230 | ||
| Technology - 3.7% | |||
| Acuris Finance U.S., Inc. 1LN, term loan CME Term SOFR 3 Month Index + 4.000% 9.4519% 2/16/28 (d)(e)(j) | 142 | 142 | |
| Applied Systems, Inc.: | |||
| Tranche 2LN, term loan CME Term SOFR 1 Month Index + 5.250% 10.5594% 2/23/32 (d)(e)(j) | 35 | 36 | |
| Tranche B 1LN, term loan CME Term SOFR 1 Month Index + 3.500% 8.8094% 2/24/31 (d)(e)(j) | 1,965 | 1,978 | |
| Athenahealth Group, Inc. Tranche B 1LN, term loan CME Term SOFR 1 Month Index + 3.500% 8.5657% 2/15/29 (d)(e)(j) | 4,262 | 4,251 | |
| ConnectWise LLC Tranche B 1LN, term loan CME Term SOFR 1 Month Index + 3.500% 9.0635% 9/30/28 (d)(e)(j) | 2,932 | 2,933 | |
| Cotiviti, Inc. Tranche B 1LN, term loan CME Term SOFR 1 Month Index + 3.250% 2/21/31 (e)(j)(k) | 6,935 | 6,941 | |
| DG Investment Intermediate Holdings, Inc. Tranche B 1LN, term loan CME Term SOFR 1 Month Index + 3.750% 9.1802% 3/31/28 (d)(e)(j) | 253 | 252 | |
| First Advantage Holdings LLC Tranche B 1LN, term loan CME Term SOFR 1 Month Index + 2.750% 8.1918% 1/31/27 (d)(e)(j) | 390 | 390 | |
| McAfee Corp. Tranche B 1LN, term loan CME Term SOFR 1 Month Index + 3.750% 9.1773% 3/1/29 (d)(e)(j) | 10,059 | 10,060 | |
| MH Sub I LLC Tranche B 1LN, term loan CME Term SOFR 1 Month Index + 4.250% 9.5657% 5/3/28 (d)(e)(j) | 2,863 | 2,852 | |
| Modena Buyer LLC 1LN, term loan CME Term SOFR 1 Month Index + 4.500% 4/21/31 (e)(j)(k) | 5,020 | 4,910 | |
| Polaris Newco LLC Tranche B 1LN, term loan CME Term SOFR 1 Month Index + 4.000% 9.5911% 6/2/28 (d)(e)(j) | 887 | 881 | |
| Project Alpha Intermediate Holding, Inc. Tranche B 1LN, term loan CME Term SOFR 1 Month Index + 4.750% 10.0627% 10/26/30 (d)(e)(j) | 1,975 | 1,981 | |
| Proofpoint, Inc. Tranche B 1LN, term loan CME Term SOFR 1 Month Index + 3.250% 8.6946% 8/31/28 (d)(e)(j) | 16,764 | 16,832 | |
| RealPage, Inc. Tranche B 1LN, term loan CME Term SOFR 1 Month Index + 3.000% 8.4302% 4/22/28 (d)(e)(j) | 756 | 728 | |
| UKG, Inc. Tranche B 1LN, term loan CME Term SOFR 1 Month Index + 3.500% 8.8143% 2/10/31 (d)(e)(j) | 15,250 | 15,316 | |
| Veritas U.S., Inc. Tranche B 1LN, term loan CME Term SOFR 1 Month Index + 5.000% 10.4302% 9/1/25 (d)(e)(j) | 1,617 | 1,484 | |
| VS Buyer LLC Tranche B 1LN, term loan CME Term SOFR 1 Month Index + 3.250% 8.569% 4/4/31 (d)(e)(j) | 7,724 | 7,738 | |
TOTAL TECHNOLOGY | 79,705 | ||
| Telecommunications - 0.1% | |||
| Aventiv Technologies LLC 1LN, term loan: | |||
| CME Term SOFR 3 Month Index + 5.090% 10.661% 7/31/25 (d)(e)(j) | 939 | 693 | |
| 13.071% 7/31/25 (d)(e)(j) | 25 | 25 | |
| GTT Communications, Inc. 1LN, term loan CME Term SOFR 3 Month Index + 9.000% 14.4094% 6/30/28 (d)(e)(j) | 536 | 377 | |
| Gtt Remainco LLC 1LN, term loan CME Term SOFR 1 Month Index + 7.000% 12.4183% 12/30/27 (d)(e)(j) | 647 | 589 | |
TOTAL TELECOMMUNICATIONS | 1,684 | ||
| Utilities - 0.0% | |||
| Talen Energy Supply LLC 1LN, term loan: | |||
| CME Term SOFR 1 Month Index + 4.500% 9.8257% 5/17/30 (d)(e)(j) | 97 | 97 | |
| CME Term SOFR 1 Month Index + 4.500% 9.8257% 5/17/30 (d)(e)(j) | 63 | 64 | |
TOTAL UTILITIES | 161 | ||
| TOTAL BANK LOAN OBLIGATIONS (Cost $226,647) | 225,967 | ||
| Preferred Securities - 7.6% | |||
Principal Amount (a) (000s) | Value ($) (000s) | ||
| Banks & Thrifts - 6.1% | |||
| Ally Financial, Inc. 4.7% (d)(l) | 945 | 741 | |
| Bank of America Corp.: | |||
| 5.125% (d)(l) | 12,000 | 12,198 | |
| 5.875% (d)(l) | 14,280 | 13,803 | |
| 6.1% (d)(l) | 2,590 | 2,604 | |
| Citigroup, Inc.: | |||
| 5% (d)(l) | 13,000 | 12,965 | |
| 6.3% (d)(l) | 4,585 | 4,716 | |
| 9.0346% (d)(e)(l) | 12,655 | 12,893 | |
| Citigroup, Inc. 4.7% (d)(l) | 2,135 | 2,100 | |
| Goldman Sachs Group, Inc. 5.3% (d)(l) | 15,000 | 15,096 | |
| JPMorgan Chase & Co.: | |||
| 4% (d)(l) | 3,555 | 3,474 | |
| 4.6% (d)(l) | 4,465 | 4,443 | |
| 5% (d)(l) | 24,800 | 24,983 | |
| 9.348% (d)(e)(l) | 8,000 | 8,187 | |
| Wells Fargo & Co.: | |||
| 5.875% (d)(l) | 7,645 | 7,762 | |
| 7.625% (d)(l) | 5,740 | 6,058 | |
TOTAL BANKS & THRIFTS | 132,023 | ||
| Energy - 1.5% | |||
| Energy Transfer LP: | |||
| 3 month U.S. LIBOR + 4.020% 9.5966% (d)(e)(l) | 15,460 | 15,775 | |
| 6.625% (d)(l) | 456 | 425 | |
| 7.125% (d)(l) | 17,150 | 17,030 | |
TOTAL ENERGY | 33,230 | ||
| TOTAL PREFERRED SECURITIES (Cost $167,016) | 165,253 | ||
| Other - 2.2% | |||
| Shares | Value ($) (000s) | ||
| Other - 2.2% | |||
Fidelity Private Credit Co. LLC (g)(m) (Cost $47,821) | 4,805,377 | 48,871 | |
| Money Market Funds - 7.5% | |||
| Shares | Value ($) (000s) | ||
| Fidelity Cash Central Fund 5.39% (n) | 160,128,869 | 160,161 | |
| Fidelity Securities Lending Cash Central Fund 5.39% (n)(o) | 2,006,274 | 2,006 | |
| TOTAL MONEY MARKET FUNDS (Cost $162,167) | 162,167 | ||
| TOTAL INVESTMENT IN SECURITIES - 100.0% (Cost $2,147,304) | 2,171,219 |
NET OTHER ASSETS (LIABILITIES) - 0.0% | 220 |
| NET ASSETS - 100.0% | 2,171,439 |
| (a) | Amount is stated in United States dollars unless otherwise noted. |
| (b) | Security exempt from registration under Rule 144A of the Securities Act of 1933. These securities may be resold in transactions exempt from registration, normally to qualified institutional buyers. At the end of the period, the value of these securities amounted to $923,798,000 or 42.5% of net assets. |
| (c) | Level 3 security |
| (d) | Coupon rates for floating and adjustable rate securities reflect the rates in effect at period end. |
| (e) | Coupon is indexed to a floating interest rate which may be multiplied by a specified factor and/or subject to caps or floors. |
| (f) | Non-income producing - Security is in default. |
| (g) | Restricted securities (including private placements) - Investment in securities not registered under the Securities Act of 1933 (excluding 144A issues). At the end of the period, the value of restricted securities (excluding 144A issues) amounted to $54,218,000 or 2.5% of net assets. |
| (h) | Non-income producing |
| (i) | Security or a portion of the security is on loan at period end. |
| (j) | Remaining maturities of bank loan obligations may be less than the stated maturities shown as a result of contractual or optional prepayments by the borrower. Such prepayments cannot be predicted with certainty. |
| (k) | The coupon rate will be determined upon settlement of the loan after period end. |
| (l) | Security is perpetual in nature with no stated maturity date. |
| (m) | Affiliated Fund |
| (n) | Affiliated fund that is generally available only to investment companies and other accounts managed by Fidelity Investments. The rate quoted is the annualized seven-day yield of the fund at period end. A complete unaudited listing of the fund's holdings as of its most recent quarter end is available upon request. In addition, each Fidelity Central Fund's financial statements are available on the SEC's website or upon request. |
| (o) | Investment made with cash collateral received from securities on loan. |
| Additional information on each restricted holding is as follows: | ||
| Security | Acquisition Date | Acquisition Cost ($) (000s) |
| Arena Brands Holding Corp. Class B | 6/18/97 - 7/13/98 | 1,538 |
| Fidelity Private Credit Co. LLC | 4/28/22 - 1/02/24 | 47,817 |
| Jonah Energy Parent LLC 12% 11/5/25 | 5/05/23 | 1,589 |
| New Cotai LLC/New Cotai Capital Corp. | 9/11/20 | 7,224 |
| Northeast Grocery, Inc. | 11/08/21 | 135 |
| Affiliate (Amounts in thousands) | Value, beginning of period ($) | Purchases ($) | Sales Proceeds ($) | Dividend Income ($) | Realized Gain (loss) ($) | Change in Unrealized appreciation (depreciation) ($) | Value, end of period ($) | % ownership, end of period |
| Fidelity Cash Central Fund 5.39% | 152,805 | 244,246 | 236,890 | 3,707 | - | - | 160,161 | 0.3% |
| Fidelity Securities Lending Cash Central Fund 5.39% | 3,360 | 26,315 | 27,669 | 1 | - | - | 2,006 | 0.0% |
| Total | 156,165 | 270,561 | 264,559 | 3,708 | - | - | 162,167 | |
| Affiliate (Amounts in thousands) | Value, beginning of period ($) | Purchases ($) | Sales Proceeds ($) | Dividend Income ($) | Realized Gain (loss) ($) | Change in Unrealized appreciation (depreciation) ($) | Value, end of period ($) |
| Fidelity Private Credit Co. LLC | 48,171 | 555 | - | 3,270 | - | 145 | 48,871 |
| 48,171 | 555 | - | 3,270 | - | 145 | 48,871 |
| Valuation Inputs at Reporting Date: | ||||
Description (Amounts in thousands) | Total ($) | Level 1 ($) | Level 2 ($) | Level 3 ($) |
Investments in Securities: | ||||
| Equities: | ||||
Communication Services | 27,749 | 27,749 | - | - |
Consumer Discretionary | 56,992 | 48,349 | 6,906 | 1,737 |
Consumer Staples | 10,456 | 8,271 | - | 2,185 |
Energy | 28,147 | 18,068 | 1,278 | 8,801 |
Financials | 57,354 | 57,354 | - | - |
Health Care | 1,718 | 1,718 | - | - |
Industrials | 69,855 | 69,855 | - | - |
Information Technology | 115,641 | 115,199 | - | 442 |
Materials | 17,921 | 17,921 | - | - |
Utilities | 22,341 | 22,340 | - | 1 |
| Corporate Bonds | 1,160,787 | - | 1,154,613 | 6,174 |
| Bank Loan Obligations | 225,967 | - | 225,967 | - |
| Preferred Securities | 165,253 | - | 165,253 | - |
| Other | 48,871 | - | 48,871 | - |
| Money Market Funds | 162,167 | 162,167 | - | - |
| Total Investments in Securities: | 2,171,219 | 548,991 | 1,602,888 | 19,340 |
| (Amounts in thousands) | |||
| Investments in Securities: | |||
| Beginning Balance | $ | 28,484 | |
| Net Realized Gain (Loss) on Investment Securities | 4,851 | ||
| Net Unrealized Gain (Loss) on Investment Securities | (2,754) | ||
| Cost of Purchases | 414 | ||
| Proceeds of Sales | (11,676) | ||
| Amortization/Accretion | 21 | ||
| Transfers into Level 3 | - | ||
| Transfers out of Level 3 | - | ||
| Ending Balance | $ | 19,340 | |
| The change in unrealized gain (loss) for the period attributable to Level 3 securities held at April 30, 2024 | $ | 2,181 | |
| The information used in the above reconciliation represents fiscal year to date activity for any Investments in Securities identified as using Level 3 inputs at either the beginning or the end of the current fiscal period. Cost of purchases and proceeds of sales may include securities received and/or delivered through in-kind transactions, corporate actions or exchanges. Transfers into Level 3 were attributable to a lack of observable market data resulting from decreases in market activity, decreases in liquidity, security restructurings or corporate actions. Transfers out of Level 3 were attributable to observable market data becoming available for those securities. Transfers in or out of Level 3 represent the beginning value of any Security or Instrument where a change in the pricing level occurred from the beginning to the end of the period. Realized and unrealized gains (losses) disclosed in the reconciliation are included in Net Gain (Loss) on the Fund's Statement of Operations. | |||
| Statement of Assets and Liabilities | ||||
| Amounts in thousands (except per-share amounts) | April 30, 2024 (Unaudited) | |||
| Assets | ||||
| Investment in securities, at value (including securities loaned of $1,938) - See accompanying schedule: | ||||
Unaffiliated issuers (cost $1,937,316) | $ | 1,960,181 | ||
Fidelity Central Funds (cost $162,167) | 162,167 | |||
Other affiliated issuers (cost $47,821) | 48,871 | |||
| Total Investment in Securities (cost $2,147,304) | $ | 2,171,219 | ||
| Cash | 280 | |||
| Foreign currency held at value (cost $56) | 56 | |||
| Receivable for investments sold | 6,274 | |||
| Receivable for fund shares sold | 2,056 | |||
| Dividends receivable | 131 | |||
| Interest receivable | 20,944 | |||
| Distributions receivable from Fidelity Central Funds | 573 | |||
| Prepaid expenses | 1 | |||
| Other receivables | 9 | |||
Total assets | 2,201,543 | |||
| Liabilities | ||||
| Payable for investments purchased | $ | 22,971 | ||
| Payable for fund shares redeemed | 2,787 | |||
| Distributions payable | 853 | |||
| Accrued management fee | 1,213 | |||
| Distribution and service plan fees payable | 208 | |||
| Other payables and accrued expenses | 66 | |||
| Collateral on securities loaned | 2,006 | |||
| Total liabilities | 30,104 | |||
| Commitments and contingent liabilities (see Commitments note) | ||||
| Net Assets | $ | 2,171,439 | ||
| Net Assets consist of: | ||||
| Paid in capital | $ | 2,161,391 | ||
| Total accumulated earnings (loss) | 10,048 | |||
| Net Assets | $ | 2,171,439 | ||
| Net Asset Value and Maximum Offering Price | ||||
| Class A : | ||||
Net Asset Value and redemption price per share ($519,191 ÷ 45,610 shares)(a) | $ | 11.38 | ||
| Maximum offering price per share (100/96.00 of $11.38) | $ | 11.85 | ||
| Class M : | ||||
Net Asset Value and redemption price per share ($239,486 ÷ 20,912 shares)(a) | $ | 11.45 | ||
| Maximum offering price per share (100/96.00 of $11.45) | $ | 11.93 | ||
| Class C : | ||||
Net Asset Value and offering price per share ($59,628 ÷ 5,248 shares)(a) | $ | 11.36 | ||
| Class I : | ||||
Net Asset Value, offering price and redemption price per share ($900,802 ÷ 84,893 shares)(b) | $ | 10.61 | ||
| Class Z : | ||||
Net Asset Value, offering price and redemption price per share ($452,332 ÷ 42,623 shares) | $ | 10.61 | ||
(a)Redemption price per share is equal to net asset value less any applicable contingent deferred sales charge. | ||||
(b)Corresponding Net Asset Value does not calculate due to rounding of fractional net assets and/or shares. | ||||
| Statement of Operations | ||||
| Amounts in thousands | Six months ended April 30, 2024 (Unaudited) | |||
| Investment Income | ||||
| Dividends: | ||||
| Unaffiliated issuers | $ | 6,902 | ||
| Affiliated issuers | 3,222 | |||
| Interest | 50,021 | |||
| Income from Fidelity Central Funds (including $1 from security lending) | 3,708 | |||
| Total income | 63,853 | |||
| Expenses | ||||
| Management fee | $ | 6,125 | ||
| Transfer agent fees | 852 | |||
| Distribution and service plan fees | 1,223 | |||
| Accounting fees | 221 | |||
| Custodian fees and expenses | 14 | |||
| Independent trustees' fees and expenses | 5 | |||
| Registration fees | 65 | |||
| Audit | 41 | |||
| Legal | 18 | |||
| Miscellaneous | 5 | |||
| Total expenses before reductions | 8,569 | |||
| Expense reductions | (200) | |||
| Total expenses after reductions | 8,369 | |||
| Net Investment income (loss) | 55,484 | |||
| Realized and Unrealized Gain (Loss) | ||||
| Net realized gain (loss) on: | ||||
| Investment Securities: | ||||
| Unaffiliated issuers | 12,942 | |||
| Foreign currency transactions | (2) | |||
| Capital gain distributions from underlying funds: | ||||
| Affiliated issuers | 48 | |||
| Total net realized gain (loss) | 12,988 | |||
| Change in net unrealized appreciation (depreciation) on: | ||||
| Investment Securities: | ||||
| Unaffiliated issuers | 136,873 | |||
| Affiliated issuers | 145 | |||
| Assets and liabilities in foreign currencies | 1 | |||
| Total change in net unrealized appreciation (depreciation) | 137,019 | |||
| Net gain (loss) | 150,007 | |||
| Net increase (decrease) in net assets resulting from operations | $ | 205,491 | ||
| Statement of Changes in Net Assets | ||||
| Amount in thousands | Six months ended April 30, 2024 (Unaudited) | Year ended October 31, 2023 | ||
| Increase (Decrease) in Net Assets | ||||
| Operations | ||||
| Net investment income (loss) | $ | 55,484 | $ | 96,897 |
| Net realized gain (loss) | 12,988 | (37,304) | ||
| Change in net unrealized appreciation (depreciation) | 137,019 | 31,817 | ||
| Net increase (decrease) in net assets resulting from operations | 205,491 | 91,410 | ||
| Distributions to shareholders | (55,829) | (157,937) | ||
| Share transactions - net increase (decrease) | 170,692 | 127,889 | ||
| Total increase (decrease) in net assets | 320,354 | 61,362 | ||
| Net Assets | ||||
| Beginning of period | 1,851,085 | 1,789,723 | ||
| End of period | $ | 2,171,439 | $ | 1,851,085 |
Fidelity Advisor® High Income Advantage Fund Class A |
Six months ended (Unaudited) April 30, 2024 | Years ended October 31, 2023 | 2022 | 2021 | 2020 | 2019 | |||||||
Selected Per-Share Data | ||||||||||||
| Net asset value, beginning of period | $ | 10.54 | $ | 10.90 | $ | 12.94 | $ | 10.95 | $ | 11.12 | $ | 10.93 |
| Income from Investment Operations | ||||||||||||
Net investment income (loss) A,B | .295 | .551 | .455 | .382 | .422 | .517 | ||||||
| Net realized and unrealized gain (loss) | .841 | - C | (1.803) | 1.989 | (.169) | .260 | ||||||
| Total from investment operations | 1.136 | .551 | (1.348) | 2.371 | .253 | .777 | ||||||
| Distributions from net investment income | (.296) | (.544) | (.433) | (.381) | (.417) | (.587) | ||||||
| Distributions from net realized gain | - | (.367) | (.259) | - | (.006) | - | ||||||
| Total distributions | (.296) | (.911) | (.692) | (.381) | (.423) | (.587) | ||||||
| Net asset value, end of period | $ | 11.38 | $ | 10.54 | $ | 10.90 | $ | 12.94 | $ | 10.95 | $ | 11.12 |
Total Return D,E,F | 10.83 % | 5.16% | (10.75)% | 21.85% | 2.41% | 7.41% | ||||||
Ratios to Average Net Assets B,G,H | ||||||||||||
| Expenses before reductions | .99% I | .98% | 1.01% | .99% | 1.00% | 1.01% | ||||||
| Expenses net of fee waivers, if any | .97 % I | .98% | 1.01% | .99% | 1.00% | 1.00% | ||||||
| Expenses net of all reductions | .97% I | .98% | 1.01% | .99% | 1.00% | 1.00% | ||||||
| Net investment income (loss) | 5.27% I | 5.11% | 3.88% | 3.07% | 3.91% | 4.70% | ||||||
| Supplemental Data | ||||||||||||
| Net assets, end of period (in millions) | $ | 519 | $ | 467 | $ | 463 | $ | 566 | $ | 462 | $ | 515 |
Portfolio turnover rate J | 33 % I | 29% | 29% | 27% | 48% | 53% |
Fidelity Advisor® High Income Advantage Fund Class M |
Six months ended (Unaudited) April 30, 2024 | Years ended October 31, 2023 | 2022 | 2021 | 2020 | 2019 | |||||||
Selected Per-Share Data | ||||||||||||
| Net asset value, beginning of period | $ | 10.60 | $ | 10.96 | $ | 13.01 | $ | 11.01 | $ | 11.18 | $ | 10.99 |
| Income from Investment Operations | ||||||||||||
Net investment income (loss) A,B | .297 | .556 | .458 | .385 | .425 | .521 | ||||||
| Net realized and unrealized gain (loss) | .852 | (.001) | (1.813) | 1.998 | (.169) | .259 | ||||||
| Total from investment operations | 1.149 | .555 | (1.355) | 2.383 | .256 | .780 | ||||||
| Distributions from net investment income | (.299) | (.548) | (.436) | (.383) | (.420) | (.590) | ||||||
| Distributions from net realized gain | - | (.367) | (.259) | - | (.006) | - | ||||||
| Total distributions | (.299) | (.915) | (.695) | (.383) | (.426) | (.590) | ||||||
| Net asset value, end of period | $ | 11.45 | $ | 10.60 | $ | 10.96 | $ | 13.01 | $ | 11.01 | $ | 11.18 |
Total Return C,D,E | 10.89 % | 5.17% | (10.75)% | 21.84% | 2.43% | 7.39% | ||||||
Ratios to Average Net Assets B,F,G | ||||||||||||
| Expenses before reductions | .98% H | .98% | 1.01% | .99% | 1.00% | 1.00% | ||||||
| Expenses net of fee waivers, if any | .97 % H | .97% | 1.01% | .99% | 1.00% | 1.00% | ||||||
| Expenses net of all reductions | .97% H | .97% | 1.01% | .99% | 1.00% | 1.00% | ||||||
| Net investment income (loss) | 5.27% H | 5.11% | 3.89% | 3.08% | 3.91% | 4.71% | ||||||
| Supplemental Data | ||||||||||||
| Net assets, end of period (in millions) | $ | 239 | $ | 224 | $ | 238 | $ | 300 | $ | 266 | $ | 329 |
Portfolio turnover rate I | 33 % H | 29% | 29% | 27% | 48% | 53% |
Fidelity Advisor® High Income Advantage Fund Class C |
Six months ended (Unaudited) April 30, 2024 | Years ended October 31, 2023 | 2022 | 2021 | 2020 | 2019 | |||||||
Selected Per-Share Data | ||||||||||||
| Net asset value, beginning of period | $ | 10.51 | $ | 10.88 | $ | 12.92 | $ | 10.93 | $ | 11.10 | $ | 10.91 |
| Income from Investment Operations | ||||||||||||
Net investment income (loss) A,B | .252 | .469 | .366 | .286 | .339 | .434 | ||||||
| Net realized and unrealized gain (loss) | .851 | (.010) | (1.804) | 1.988 | (.169) | .258 | ||||||
| Total from investment operations | 1.103 | .459 | (1.438) | 2.274 | .170 | .692 | ||||||
| Distributions from net investment income | (.253) | (.462) | (.343) | (.284) | (.334) | (.502) | ||||||
| Distributions from net realized gain | - | (.367) | (.259) | - | (.006) | - | ||||||
| Total distributions | (.253) | (.829) | (.602) | (.284) | (.340) | (.502) | ||||||
| Net asset value, end of period | $ | 11.36 | $ | 10.51 | $ | 10.88 | $ | 12.92 | $ | 10.93 | $ | 11.10 |
Total Return C,D,E | 10.54 % | 4.27% | (11.45)% | 20.95% | 1.63% | 6.60% | ||||||
Ratios to Average Net Assets B,F,G | ||||||||||||
| Expenses before reductions | 1.76% H | 1.76% | 1.78% | 1.76% | 1.77% | 1.77% | ||||||
| Expenses net of fee waivers, if any | 1.73 % H | 1.73% | 1.77% | 1.76% | 1.77% | 1.77% | ||||||
| Expenses net of all reductions | 1.73% H | 1.73% | 1.77% | 1.76% | 1.77% | 1.76% | ||||||
| Net investment income (loss) | 4.51% H | 4.35% | 3.12% | 2.30% | 3.14% | 3.94% | ||||||
| Supplemental Data | ||||||||||||
| Net assets, end of period (in millions) | $ | 60 | $ | 54 | $ | 56 | $ | 71 | $ | 68 | $ | 89 |
Portfolio turnover rate I | 33 % H | 29% | 29% | 27% | 48% | 53% |
Fidelity Advisor® High Income Advantage Fund Class I |
Six months ended (Unaudited) April 30, 2024 | Years ended October 31, 2023 | 2022 | 2021 | 2020 | 2019 | |||||||
Selected Per-Share Data | ||||||||||||
| Net asset value, beginning of period | $ | 9.82 | $ | 10.19 | $ | 12.12 | $ | 10.26 | $ | 10.42 | $ | 10.25 |
| Income from Investment Operations | ||||||||||||
Net investment income (loss) A,B | .288 | .539 | .454 | .388 | .422 | .512 | ||||||
| Net realized and unrealized gain (loss) | .794 | (.007) | (1.691) | 1.860 | (.157) | .241 | ||||||
| Total from investment operations | 1.082 | .532 | (1.237) | 2.248 | .265 | .753 | ||||||
| Distributions from net investment income | (.292) | (.535) | (.434) | (.388) | (.419) | (.583) | ||||||
| Distributions from net realized gain | - | (.367) | (.259) | - | (.006) | - | ||||||
| Total distributions | (.292) | (.902) | (.693) | (.388) | (.425) | (.583) | ||||||
| Net asset value, end of period | $ | 10.61 | $ | 9.82 | $ | 10.19 | $ | 12.12 | $ | 10.26 | $ | 10.42 |
Total Return C,D | 11.07 % | 5.35% | (10.56)% | 22.13% | 2.69% | 7.67% | ||||||
Ratios to Average Net Assets B,E,F | ||||||||||||
| Expenses before reductions | .74% G | .73% | .76% | .74% | .75% | .76% | ||||||
| Expenses net of fee waivers, if any | .72 % G | .72% | .76% | .74% | .75% | .76% | ||||||
| Expenses net of all reductions | .72% G | .72% | .76% | .74% | .74% | .76% | ||||||
| Net investment income (loss) | 5.52% G | 5.36% | 4.13% | 3.32% | 4.17% | 4.95% | ||||||
| Supplemental Data | ||||||||||||
| Net assets, end of period (in millions) | $ | 901 | $ | 745 | $ | 696 | $ | 903 | $ | 510 | $ | 612 |
Portfolio turnover rate H | 33 % G | 29% | 29% | 27% | 48% | 53% |
Fidelity Advisor® High Income Advantage Fund Class Z |
Six months ended (Unaudited) April 30, 2024 | Years ended October 31, 2023 | 2022 | 2021 | 2020 | 2019 | |||||||
Selected Per-Share Data | ||||||||||||
| Net asset value, beginning of period | $ | 9.82 | $ | 10.19 | $ | 12.12 | $ | 10.26 | $ | 10.42 | $ | 10.25 |
| Income from Investment Operations | ||||||||||||
Net investment income (loss) A,B | .293 | .549 | .463 | .399 | .430 | .516 | ||||||
| Net realized and unrealized gain (loss) | .794 | (.007) | (1.690) | 1.860 | (.156) | .248 | ||||||
| Total from investment operations | 1.087 | .542 | (1.227) | 2.259 | .274 | .764 | ||||||
| Distributions from net investment income | (.297) | (.545) | (.444) | (.399) | (.428) | (.594) | ||||||
| Distributions from net realized gain | - | (.367) | (.259) | - | (.006) | - | ||||||
| Total distributions | (.297) | (.912) | (.703) | (.399) | (.434) | (.594) | ||||||
| Net asset value, end of period | $ | 10.61 | $ | 9.82 | $ | 10.19 | $ | 12.12 | $ | 10.26 | $ | 10.42 |
Total Return C,D | 11.12 % | 5.45% | (10.47)% | 22.25% | 2.79% | 7.79% | ||||||
Ratios to Average Net Assets B,E,F | ||||||||||||
| Expenses before reductions | .64% G | .64% | .66% | .64% | .65% | .65% | ||||||
| Expenses net of fee waivers, if any | .62 % G | .63% | .66% | .64% | .65% | .65% | ||||||
| Expenses net of all reductions | .62% G | .63% | .66% | .64% | .65% | .65% | ||||||
| Net investment income (loss) | 5.62% G | 5.46% | 4.23% | 3.42% | 4.26% | 5.06% | ||||||
| Supplemental Data | ||||||||||||
| Net assets, end of period (in millions) | $ | 452 | $ | 361 | $ | 337 | $ | 363 | $ | 159 | $ | 137 |
Portfolio turnover rate H | 33 % G | 29% | 29% | 27% | 48% | 53% |
| Fidelity Central Fund | Investment Manager | Investment Objective | Investment Practices | Expense RatioA |
| Fidelity Money Market Central Funds | Fidelity Management & Research Company LLC (FMR) | Each fund seeks to obtain a high level of current income consistent with the preservation of capital and liquidity. | Short-term Investments | Less than .005% |
| Fidelity Advisor High Income Advantage Fund | $9 |
| Gross unrealized appreciation | $130,530 |
| Gross unrealized depreciation | (101,893) |
| Net unrealized appreciation (depreciation) | $28,637 |
| Tax cost | $2,142,582 |
Short-term | $(2,202) |
Long-term | (35,131) |
| Total capital loss carryforward | $(37,333) |
| Investment to be Acquired | Commitment Amount ($) | |
| Fidelity Advisor High Income Advantage Fund | Fidelity Private Credit Company LLC | 9,632 |
| Purchases ($) | Sales ($) | |
| Fidelity Advisor High Income Advantage Fund | 469,660 | 309,204 |
| Maximum Management Fee Rate % | |
| Class A | .71 |
| Class M | .70 |
| Class C | .73 |
| Class I | .71 |
| Class Z | .61 |
| Total Management Fee Rate % | |
| Class A | .71 |
| Class M | .70 |
| Class C | .73 |
| Class I | .71 |
| Class Z | .61 |
| Distribution Fee | Service Fee | Total Fees ($) | Retained by FDC ($) | |
| Class A | - % | .25% | 630 | 29 |
| Class M | - % | .25% | 299 | 2 |
| Class C | .75% | .25% | 294 | 58 |
| 1,223 | 89 |
| Retained by FDC ($) | |
| Class A | 28 |
| Class M | 4 |
Class CA | _-B |
32 |
| % of Class-Level Average Net Assets | |
| Class A | .1485% |
| Class M | .1430% |
| Class C | .1686% |
| Class I | .1477% |
| Amount ($) | % of Class-Level Average Net AssetsA | |
| Class A | 245 | .15 |
| Class M | 113 | .14 |
| Class C | 32 | .17 |
| Class I | 394 | .15 |
| Class Z | 68 | .05 |
852 |
| % of Average Net Assets | |
| Fidelity Advisor High Income Advantage Fund | .0331 |
| % of Average Net Assets | |
| Fidelity Advisor High Income Advantage Fund | .03 |
| Amount ($) | |
| Fidelity Advisor High Income Advantage Fund | 1 |
| Purchases ($) | Sales ($) | Realized Gain (Loss)($) | |
| Fidelity Advisor High Income Advantage Fund | 11,731 | 1,813 | 22 |
| Amount ($) | |
| Fidelity Advisor High Income Advantage Fund | 2 |
| Total Security Lending Fees Paid to NFS ($) | Security Lending Income From Securities Loaned to NFS ($) | Value of Securities Loaned to NFS at Period End ($) | |
| Fidelity Advisor High Income Advantage Fund | -A | - | - |
| Expense Limitations | Reimbursement ($) | |
| Class C | 1.75% | 2 |
Six months ended April 30, 2024 | Year ended October 31, 2023 | |
| Fidelity Advisor High Income Advantage Fund | ||
| Distributions to shareholders | ||
| Class A | $13,262 | $39,255 |
| Class M | 6,304 | 19,798 |
| Class C | 1,325 | 4,315 |
| Class I | 22,987 | 63,485 |
| Class Z | 11,951 | 31,084 |
Total | $55,829 | $157,937 |
| Shares | Shares | Dollars | Dollars | |
Six months ended April 30, 2024 | Year ended October 31, 2023 | Six months ended April 30, 2024 | Year ended October 31, 2023 | |
| Fidelity Advisor High Income Advantage Fund | ||||
| Class A | ||||
| Shares sold | 5,076 | 8,033 | $57,262 | $86,668 |
| Reinvestment of distributions | 1,082 | 3,371 | 12,231 | 36,314 |
| Shares redeemed | (4,864) | (9,551) | (54,753) | (103,071) |
| Net increase (decrease) | 1,294 | 1,853 | $14,740 | $19,911 |
| Class M | ||||
| Shares sold | 1,386 | 1,730 | $15,655 | $18,846 |
| Reinvestment of distributions | 517 | 1,723 | 5,875 | 18,671 |
| Shares redeemed | (2,109) | (4,083) | (23,967) | (44,308) |
| Net increase (decrease) | (206) | (630) | $(2,437) | $(6,791) |
| Class C | ||||
| Shares sold | 791 | 1,180 | $8,923 | $12,722 |
| Reinvestment of distributions | 113 | 383 | 1,270 | 4,121 |
| Shares redeemed | (797) | (1,573) | (8,987) | (16,924) |
| Net increase (decrease) | 107 | (10) | $1,206 | $(81) |
| Class I | ||||
| Shares sold | 20,330 | 32,016 | $213,678 | $322,869 |
| Reinvestment of distributions | 1,938 | 5,641 | 20,431 | 56,655 |
| Shares redeemed | (13,242) | (30,068) | (138,153) | (302,382) |
| Net increase (decrease) | 9,026 | 7,589 | $95,956 | $77,142 |
| Class Z | ||||
| Shares sold | 11,252 | 11,358 | $117,692 | $114,612 |
| Reinvestment of distributions | 951 | 2,620 | 10,029 | 26,318 |
| Shares redeemed | (6,337) | (10,255) | (66,494) | (103,222) |
| Net increase (decrease) | 5,866 | 3,723 | $61,227 | $37,708 |
| The Example is based on an investment of $1,000 invested at the beginning of the period and held for the entire period (November 1, 2023 to April 30, 2024). |
Annualized Expense Ratio- A | Beginning Account Value November 1, 2023 | Ending Account Value April 30, 2024 | Expenses Paid During Period- C November 1, 2023 to April 30, 2024 | |||||||
| Fidelity Advisor® High Income Advantage Fund | ||||||||||
| Class A | .97% | |||||||||
| Actual | $ 1,000 | $ 1,108.30 | $ 5.08 | |||||||
Hypothetical-B | $ 1,000 | $ 1,020.04 | $ 4.87 | |||||||
| Class M | .97% | |||||||||
| Actual | $ 1,000 | $ 1,108.90 | $ 5.09 | |||||||
Hypothetical-B | $ 1,000 | $ 1,020.04 | $ 4.87 | |||||||
| Class C | 1.73% | |||||||||
| Actual | $ 1,000 | $ 1,105.40 | $ 9.06 | |||||||
Hypothetical-B | $ 1,000 | $ 1,016.26 | $ 8.67 | |||||||
| Class I | .72% | |||||||||
| Actual | $ 1,000 | $ 1,110.70 | $ 3.78 | |||||||
Hypothetical-B | $ 1,000 | $ 1,021.28 | $ 3.62 | |||||||
| Class Z | .62% | |||||||||
| Actual | $ 1,000 | $ 1,111.20 | $ 3.25 | |||||||
Hypothetical-B | $ 1,000 | $ 1,021.78 | $ 3.12 | |||||||
- Highly liquid investments - cash or convertible to cash within three business days or less
- Moderately liquid investments - convertible to cash in three to seven calendar days
- Less liquid investments - can be sold or disposed of, but not settled, within seven calendar days
- Illiquid investments - cannot be sold or disposed of within seven calendar days
 |


Contents
Top Holdings (% of Fund's net assets) | ||
| Constellation Energy Corp. | 1.6 | |
| Antero Resources Corp. | 1.1 | |
| PG&E Corp. | 1.1 | |
| Global Payments, Inc. | 1.0 | |
| Flex Ltd. | 1.0 | |
| Constellium NV | 1.0 | |
| The AES Corp. | 0.9 | |
| WestRock Co. | 0.9 | |
| Expro Group Holdings NV | 0.9 | |
| Cenovus Energy, Inc. (Canada) | 0.9 | |
| 10.4 | ||
| Market Sectors (% of Fund's net assets) | ||
| Financials | 19.0 | |
| Industrials | 18.7 | |
| Consumer Discretionary | 11.9 | |
| Materials | 11.5 | |
| Energy | 10.7 | |
| Utilities | 8.5 | |
| Health Care | 6.6 | |
| Real Estate | 4.6 | |
| Communication Services | 3.3 | |
| Consumer Staples | 3.2 | |
| Information Technology | 3.1 | |
Asset Allocation (% of Fund's net assets) |
 |
Short-Term Investments and Net Other Assets (Liabilities) - (1.1)% |
Geographic Diversification (% of Fund's net assets) |
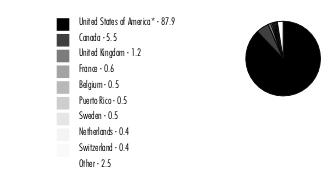 |
* Includes Short-Term investments and Net Other Assets (Liabilities). Percentages are adjusted for the effect of derivatives, if applicable. |
| Common Stocks - 101.1% | |||
| Shares | Value ($) | ||
| COMMUNICATION SERVICES - 3.3% | |||
| Diversified Telecommunication Services - 0.3% | |||
| Cellnex Telecom SA (a) | 33,840 | 1,118,571 | |
| Entertainment - 0.2% | |||
| Ubisoft Entertainment SA (b) | 31,870 | 754,039 | |
| Interactive Media & Services - 0.4% | |||
| Zoominfo Technologies, Inc. (b) | 97,130 | 1,540,482 | |
| Media - 2.4% | |||
| Grupo Televisa SA de CV (CPO) sponsored ADR | 427,330 | 1,247,804 | |
| Interpublic Group of Companies, Inc. | 75,370 | 2,294,263 | |
| Nexstar Media Group, Inc. Class A | 9,463 | 1,514,648 | |
| Thryv Holdings, Inc. (b) | 85,941 | 1,977,502 | |
| WPP PLC | 145,170 | 1,455,063 | |
| 8,489,280 | |||
TOTAL COMMUNICATION SERVICES | 11,902,372 | ||
| CONSUMER DISCRETIONARY - 11.9% | |||
| Automobile Components - 1.2% | |||
| Aptiv PLC (b) | 35,920 | 2,550,320 | |
| Autoliv, Inc. | 14,831 | 1,776,605 | |
| Cie Automotive SA | 2,227 | 59,179 | |
| 4,386,104 | |||
| Automobiles - 0.6% | |||
| Harley-Davidson, Inc. | 62,552 | 2,151,163 | |
| Broadline Retail - 0.4% | |||
| Kohl's Corp. | 54,167 | 1,296,758 | |
| Distributors - 0.3% | |||
| LKQ Corp. | 24,650 | 1,063,155 | |
| Diversified Consumer Services - 0.2% | |||
| H&R Block, Inc. | 18,347 | 866,529 | |
| Hotels, Restaurants & Leisure - 1.6% | |||
| Brinker International, Inc. (b) | 40,718 | 2,182,485 | |
| Everi Holdings, Inc. (b) | 77,170 | 630,479 | |
| Hilton Grand Vacations, Inc. (b) | 33,521 | 1,395,814 | |
| Marriott Vacations Worldwide Corp. | 9,520 | 914,967 | |
| Red Rock Resorts, Inc. | 9,433 | 501,081 | |
| 5,624,826 | |||
| Household Durables - 1.3% | |||
| Mohawk Industries, Inc. (b) | 13,117 | 1,512,652 | |
| Newell Brands, Inc. | 129,740 | 1,030,136 | |
| Tempur Sealy International, Inc. | 40,818 | 2,043,349 | |
| 4,586,137 | |||
| Leisure Products - 1.3% | |||
| BRP, Inc. | 27,078 | 1,821,788 | |
| Brunswick Corp. | 14,130 | 1,139,443 | |
| Topgolf Callaway Brands Corp. (b) | 110,491 | 1,770,066 | |
| 4,731,297 | |||
| Specialty Retail - 2.9% | |||
| Academy Sports & Outdoors, Inc. | 17,489 | 1,019,609 | |
| Camping World Holdings, Inc. (c) | 62,037 | 1,257,490 | |
| Gap, Inc. | 14,790 | 303,491 | |
| Lithia Motors, Inc. Class A (sub. vtg.) | 8,148 | 2,072,688 | |
| Sally Beauty Holdings, Inc. (b) | 102,805 | 1,115,434 | |
| Signet Jewelers Ltd. (c) | 19,813 | 1,942,268 | |
| Upbound Group, Inc. | 60,031 | 1,861,561 | |
| Victoria's Secret & Co. (b) | 61,897 | 1,090,625 | |
| 10,663,166 | |||
| Textiles, Apparel & Luxury Goods - 2.1% | |||
| Dr. Martens Ltd. (c) | 575,480 | 546,509 | |
| Gildan Activewear, Inc. | 55,282 | 1,916,287 | |
| PVH Corp. | 19,750 | 2,148,800 | |
| Samsonite International SA (a) | 519,460 | 1,826,250 | |
| Tapestry, Inc. | 26,700 | 1,065,864 | |
| 7,503,710 | |||
TOTAL CONSUMER DISCRETIONARY | 42,872,845 | ||
| CONSUMER STAPLES - 3.2% | |||
| Beverages - 0.3% | |||
| Keurig Dr. Pepper, Inc. | 31,240 | 1,052,788 | |
| Consumer Staples Distribution & Retail - 0.6% | |||
| U.S. Foods Holding Corp. (b) | 42,183 | 2,119,696 | |
| Food Products - 1.6% | |||
| Archer Daniels Midland Co. | 25,390 | 1,489,377 | |
| Bunge Global SA | 21,966 | 2,235,260 | |
| Darling Ingredients, Inc. (b) | 45,124 | 1,911,904 | |
| Lamb Weston Holdings, Inc. | 1,230 | 102,508 | |
| 5,739,049 | |||
| Personal Care Products - 0.4% | |||
| Kenvue, Inc. | 81,890 | 1,541,170 | |
| Tobacco - 0.3% | |||
| Philip Morris International, Inc. | 13,050 | 1,238,967 | |
TOTAL CONSUMER STAPLES | 11,691,670 | ||
| ENERGY - 10.7% | |||
| Energy Equipment & Services - 3.9% | |||
| Baker Hughes Co. Class A | 66,690 | 2,175,428 | |
| Expro Group Holdings NV (b) | 170,952 | 3,207,060 | |
| John Wood Group PLC (b) | 142,281 | 263,836 | |
| Liberty Oilfield Services, Inc. Class A | 26,164 | 575,608 | |
| Secure Energy Services, Inc. | 124,640 | 1,055,680 | |
| Tenaris SA | 68,470 | 1,145,391 | |
| Tidewater, Inc. (b) | 19,870 | 1,825,060 | |
| Valaris Ltd. (b) | 33,496 | 2,179,250 | |
| Vallourec SA (b) | 92,258 | 1,601,415 | |
| 14,028,728 | |||
| Oil, Gas & Consumable Fuels - 6.8% | |||
| Antero Resources Corp. (b) | 114,008 | 3,877,412 | |
| Canadian Natural Resources Ltd. | 23,878 | 1,809,431 | |
| Cenovus Energy, Inc. (Canada) | 153,560 | 3,154,525 | |
| Delek U.S. Holdings, Inc. | 37,219 | 1,017,195 | |
| Diamondback Energy, Inc. | 6,971 | 1,402,077 | |
| Energy Transfer LP | 93,808 | 1,475,600 | |
| Imperial Oil Ltd. | 27,548 | 1,894,031 | |
| Imperial Oil Ltd. (U.S.) | 5,500 | 379,225 | |
| Kosmos Energy Ltd. (b) | 158,030 | 896,030 | |
| MEG Energy Corp. (b) | 34,500 | 784,655 | |
| Phillips 66 Co. | 17,260 | 2,471,805 | |
| Range Resources Corp. | 24,200 | 869,022 | |
| Targa Resources Corp. | 23,489 | 2,679,155 | |
| Tourmaline Oil Corp. | 34,947 | 1,707,939 | |
| 24,418,102 | |||
TOTAL ENERGY | 38,446,830 | ||
| FINANCIALS - 19.0% | |||
| Banks - 3.6% | |||
| Axos Financial, Inc. (b) | 15,451 | 781,975 | |
| Barclays PLC | 164,120 | 413,795 | |
| East West Bancorp, Inc. | 24,799 | 1,847,278 | |
| First Citizens Bancshares, Inc. | 1,400 | 2,361,464 | |
| First Citizens Bancshares, Inc. Class B | 210 | 318,150 | |
| KeyCorp | 137,180 | 1,987,738 | |
| M&T Bank Corp. | 2,820 | 407,180 | |
| Popular, Inc. | 21,540 | 1,830,685 | |
| U.S. Bancorp | 46,070 | 1,871,824 | |
| Webster Financial Corp. | 28,150 | 1,233,815 | |
| 13,053,904 | |||
| Capital Markets - 3.5% | |||
| Ameriprise Financial, Inc. | 4,331 | 1,783,462 | |
| BGC Group, Inc. Class A | 218,480 | 1,710,698 | |
| Carlyle Group LP | 43,762 | 1,960,538 | |
| LPL Financial | 7,695 | 2,070,955 | |
| Onex Corp. (sub. vtg.) | 10,240 | 726,503 | |
| Petershill Partners PLC (a) | 316,294 | 824,044 | |
| Raymond James Financial, Inc. | 16,094 | 1,963,468 | |
| UBS Group AG | 59,510 | 1,571,181 | |
| 12,610,849 | |||
| Consumer Finance - 2.3% | |||
| Ally Financial, Inc. | 51,580 | 1,978,093 | |
| Navient Corp. | 53,270 | 800,115 | |
| OneMain Holdings, Inc. | 41,337 | 2,154,071 | |
| PROG Holdings, Inc. | 46,340 | 1,540,342 | |
| SLM Corp. | 88,821 | 1,882,117 | |
| 8,354,738 | |||
| Financial Services - 4.5% | |||
| Apollo Global Management, Inc. | 28,597 | 3,099,343 | |
| Corebridge Financial, Inc. (c) | 53,059 | 1,409,247 | |
| ECN Capital Corp. | 355,072 | 453,947 | |
| Essent Group Ltd. | 38,033 | 2,014,608 | |
| Global Payments, Inc. | 29,613 | 3,635,588 | |
| NCR Atleos Corp. | 86,484 | 1,723,626 | |
| Voya Financial, Inc. | 25,780 | 1,757,165 | |
| WEX, Inc. (b) | 8,890 | 1,878,101 | |
| 15,971,625 | |||
| Insurance - 5.1% | |||
| AMBAC Financial Group, Inc. (b) | 76,401 | 1,103,994 | |
| American Financial Group, Inc. | 18,613 | 2,377,811 | |
| Assurant, Inc. | 8,600 | 1,499,840 | |
| First American Financial Corp. | 37,149 | 1,990,072 | |
| Globe Life, Inc. | 16,674 | 1,270,059 | |
| Hartford Financial Services Group, Inc. | 26,270 | 2,545,300 | |
| Primerica, Inc. | 5,020 | 1,063,537 | |
| Prudential PLC | 72,810 | 633,254 | |
| Reinsurance Group of America, Inc. | 11,606 | 2,170,206 | |
| Stewart Information Services Corp. | 14,162 | 878,186 | |
| The Travelers Companies, Inc. | 10,335 | 2,192,674 | |
| Unum Group | 11,880 | 602,316 | |
| 18,327,249 | |||
TOTAL FINANCIALS | 68,318,365 | ||
| HEALTH CARE - 6.6% | |||
| Biotechnology - 0.5% | |||
| Alnylam Pharmaceuticals, Inc. (b) | 504 | 72,551 | |
| Biogen, Inc. (b) | 2,266 | 486,782 | |
| BioMarin Pharmaceutical, Inc. (b) | 2,109 | 170,323 | |
| Exact Sciences Corp. (b) | 2,383 | 141,431 | |
| Galapagos NV (b) | 27,518 | 778,337 | |
| United Therapeutics Corp. (b) | 612 | 143,410 | |
| 1,792,834 | |||
| Health Care Equipment & Supplies - 0.9% | |||
| Baxter International, Inc. | 20,377 | 822,619 | |
| Dentsply Sirona, Inc. | 3,283 | 98,523 | |
| Globus Medical, Inc. (b) | 1,547 | 77,025 | |
| Hologic, Inc. (b) | 4,369 | 331,039 | |
| QuidelOrtho Corp. (b) | 19,459 | 789,062 | |
| STERIS PLC | 1,193 | 244,040 | |
| Teleflex, Inc. | 676 | 141,115 | |
| The Cooper Companies, Inc. | 4,320 | 384,739 | |
| Zimmer Biomet Holdings, Inc. | 3,294 | 396,202 | |
| 3,284,364 | |||
| Health Care Providers & Services - 3.2% | |||
| Acadia Healthcare Co., Inc. (b) | 2,913 | 215,387 | |
| AdaptHealth Corp. (b) | 104,862 | 1,032,891 | |
| BrightSpring Health Services, Inc. | 66,370 | 709,495 | |
| Cencora, Inc. | 2,362 | 564,636 | |
| Centene Corp. (b) | 27,561 | 2,013,607 | |
| Chemed Corp. | 295 | 167,560 | |
| Cigna Group | 5,889 | 2,102,609 | |
| CVS Health Corp. | 24,085 | 1,630,795 | |
| Encompass Health Corp. | 2,572 | 214,453 | |
| Henry Schein, Inc. (b) | 2,105 | 145,834 | |
| Humana, Inc. | 3,640 | 1,099,608 | |
| Molina Healthcare, Inc. (b) | 1,176 | 402,310 | |
| PACS Group, Inc. | 31,200 | 779,064 | |
| Quest Diagnostics, Inc. | 3,181 | 439,551 | |
| R1 RCM, Inc. (b) | 2,058 | 25,293 | |
| Tenet Healthcare Corp. (b) | 1,381 | 155,072 | |
| 11,698,165 | |||
| Health Care Technology - 0.0% | |||
| Doximity, Inc. (b) | 876 | 21,278 | |
| Life Sciences Tools & Services - 0.8% | |||
| Agilent Technologies, Inc. | 2,455 | 336,433 | |
| Avantor, Inc. (b) | 9,607 | 232,778 | |
| Bio-Rad Laboratories, Inc. Class A (b) | 486 | 131,099 | |
| Charles River Laboratories International, Inc. (b) | 1,233 | 282,357 | |
| Fortrea Holdings, Inc. | 33,233 | 1,215,995 | |
| ICON PLC (b) | 1,666 | 496,268 | |
| Illumina, Inc. (b) | 1,267 | 155,904 | |
| Revvity, Inc. | 877 | 89,866 | |
| West Pharmaceutical Services, Inc. | 209 | 74,713 | |
| 3,015,413 | |||
| Pharmaceuticals - 1.2% | |||
| Bausch Health Cos., Inc. (United States) (b) | 3,413 | 29,898 | |
| Catalent, Inc. (b) | 1,946 | 108,684 | |
| Elanco Animal Health, Inc. (b) | 6,792 | 89,383 | |
| Jazz Pharmaceuticals PLC (b) | 10,935 | 1,211,051 | |
| Organon & Co. | 2,283 | 42,487 | |
| Perrigo Co. PLC | 2,674 | 87,333 | |
| Royalty Pharma PLC | 12,510 | 346,527 | |
| Teva Pharmaceutical Industries Ltd. sponsored ADR (b) | 99,340 | 1,395,727 | |
| Viatris, Inc. | 71,161 | 823,333 | |
| 4,134,423 | |||
TOTAL HEALTH CARE | 23,946,477 | ||
| INDUSTRIALS - 18.7% | |||
| Air Freight & Logistics - 0.6% | |||
| DHL Group | 10,880 | 455,545 | |
| FedEx Corp. | 7,082 | 1,853,926 | |
| 2,309,471 | |||
| Building Products - 2.4% | |||
| AZZ, Inc. | 15,440 | 1,105,967 | |
| Builders FirstSource, Inc. (b) | 10,858 | 1,985,060 | |
| Johnson Controls International PLC | 31,340 | 2,039,294 | |
| Tecnoglass, Inc. | 34,880 | 1,937,584 | |
| UFP Industries, Inc. | 13,442 | 1,514,913 | |
| 8,582,818 | |||
| Commercial Services & Supplies - 2.0% | |||
| Driven Brands Holdings, Inc. (b) | 101,200 | 1,450,196 | |
| HNI Corp. | 15,258 | 640,073 | |
| The Brink's Co. | 22,738 | 1,988,665 | |
| The GEO Group, Inc. (b) | 78,120 | 1,160,863 | |
| Vestis Corp. | 108,500 | 1,998,570 | |
| 7,238,367 | |||
| Construction & Engineering - 1.6% | |||
| Fluor Corp. (b) | 40,870 | 1,648,287 | |
| Granite Construction, Inc. | 10,942 | 607,281 | |
| MDU Resources Group, Inc. | 78,028 | 1,927,292 | |
| Willscot Mobile Mini Holdings (b) | 47,971 | 1,773,008 | |
| 5,955,868 | |||
| Electrical Equipment - 1.4% | |||
| Acuity Brands, Inc. | 6,735 | 1,672,301 | |
| GrafTech International Ltd. | 178,065 | 306,272 | |
| Regal Rexnord Corp. | 13,629 | 2,199,312 | |
| Siemens Energy AG (b) | 36,880 | 759,616 | |
| 4,937,501 | |||
| Ground Transportation - 2.3% | |||
| ArcBest Corp. | 11,720 | 1,299,865 | |
| Ryder System, Inc. | 14,563 | 1,774,502 | |
| TFI International, Inc. (Canada) | 10,929 | 1,423,275 | |
| U-Haul Holding Co. (non-vtg.) | 29,829 | 1,829,114 | |
| XPO, Inc. (b) | 17,404 | 1,870,234 | |
| 8,196,990 | |||
| Machinery - 4.3% | |||
| Allison Transmission Holdings, Inc. | 28,616 | 2,104,707 | |
| Atmus Filtration Technologies, Inc. | 59,210 | 1,793,471 | |
| Barnes Group, Inc. | 47,550 | 1,650,936 | |
| Chart Industries, Inc. (b)(c) | 10,700 | 1,541,442 | |
| CNH Industrial NV | 128,040 | 1,459,656 | |
| Gates Industrial Corp. PLC (b) | 104,770 | 1,846,047 | |
| Oshkosh Corp. | 13,770 | 1,545,958 | |
| Terex Corp. | 19,558 | 1,096,226 | |
| Timken Co. | 26,541 | 2,367,988 | |
| 15,406,431 | |||
| Professional Services - 2.0% | |||
| Clarivate PLC (b)(c) | 188,650 | 1,275,274 | |
| Concentrix Corp. | 26,056 | 1,424,482 | |
| First Advantage Corp. (c) | 55,390 | 902,857 | |
| Genpact Ltd. | 27,700 | 851,498 | |
| ManpowerGroup, Inc. | 17,059 | 1,287,102 | |
| WNS Holdings Ltd. | 32,060 | 1,343,635 | |
| 7,084,848 | |||
| Trading Companies & Distributors - 2.1% | |||
| Beacon Roofing Supply, Inc. (b) | 10,084 | 993,577 | |
| GMS, Inc. (b) | 18,510 | 1,712,545 | |
| Herc Holdings, Inc. | 13,388 | 1,914,886 | |
| Rush Enterprises, Inc. Class A | 8,570 | 376,394 | |
| WESCO International, Inc. | 16,881 | 2,578,573 | |
| 7,575,975 | |||
TOTAL INDUSTRIALS | 67,288,269 | ||
| INFORMATION TECHNOLOGY - 3.1% | |||
| Communications Equipment - 0.8% | |||
| Ciena Corp. (b) | 24,310 | 1,123,851 | |
| Lumentum Holdings, Inc. (b) | 44,104 | 1,929,991 | |
| 3,053,842 | |||
| Electronic Equipment, Instruments & Components - 1.0% | |||
| Flex Ltd. (b) | 121,018 | 3,467,166 | |
| IT Services - 0.3% | |||
| GoDaddy, Inc. (b) | 7,770 | 950,893 | |
| Semiconductors & Semiconductor Equipment - 0.6% | |||
| First Solar, Inc. (b) | 7,950 | 1,401,585 | |
| ON Semiconductor Corp. (b) | 9,650 | 677,044 | |
| 2,078,629 | |||
| Software - 0.4% | |||
| NCR Voyix Corp. (b) | 127,779 | 1,565,293 | |
TOTAL INFORMATION TECHNOLOGY | 11,115,823 | ||
| MATERIALS - 11.5% | |||
| Chemicals - 5.3% | |||
| Axalta Coating Systems Ltd. (b) | 33,889 | 1,065,470 | |
| Cabot Corp. | 17,662 | 1,611,304 | |
| Celanese Corp. Class A | 6,323 | 971,276 | |
| Corteva, Inc. | 30,858 | 1,670,344 | |
| Methanex Corp. | 40,887 | 1,958,896 | |
| OCI NV | 58,250 | 1,572,759 | |
| Olin Corp. | 35,036 | 1,831,682 | |
| Syensqo SA | 12,850 | 1,195,682 | |
| The Chemours Co. LLC | 94,409 | 2,525,441 | |
| Tronox Holdings PLC | 100,307 | 1,704,216 | |
| Westlake Corp. | 19,991 | 2,945,874 | |
| 19,052,944 | |||
| Construction Materials - 1.1% | |||
| Eagle Materials, Inc. | 5,589 | 1,401,218 | |
| GCC S.A.B. de CV | 122,108 | 1,389,818 | |
| Martin Marietta Materials, Inc. | 2,043 | 1,199,384 | |
| 3,990,420 | |||
| Containers & Packaging - 1.9% | |||
| Berry Global Group, Inc. | 9,410 | 532,982 | |
| Graphic Packaging Holding Co. | 56,340 | 1,456,389 | |
| International Paper Co. | 14,700 | 513,618 | |
| O-I Glass, Inc. (b) | 69,888 | 1,045,524 | |
| WestRock Co. | 69,990 | 3,356,720 | |
| 6,905,233 | |||
| Metals & Mining - 2.1% | |||
| ATI, Inc. (b) | 23,690 | 1,414,293 | |
| Compass Minerals International, Inc. | 40,050 | 498,623 | |
| Constellium NV (b) | 173,483 | 3,415,880 | |
| First Quantum Minerals Ltd. | 59,642 | 757,304 | |
| Perseus Mining Ltd. (Australia) | 67,760 | 99,114 | |
| Radius Recycling, Inc. Class A | 26,134 | 455,254 | |
| Steel Dynamics, Inc. | 8,423 | 1,096,001 | |
| 7,736,469 | |||
| Paper & Forest Products - 1.1% | |||
| Interfor Corp. (b) | 131,530 | 1,669,145 | |
| Louisiana-Pacific Corp. | 30,293 | 2,217,145 | |
| 3,886,290 | |||
TOTAL MATERIALS | 41,571,356 | ||
| REAL ESTATE - 4.6% | |||
| Equity Real Estate Investment Trusts (REITs) - 4.0% | |||
| Camden Property Trust (SBI) | 20,940 | 2,087,299 | |
| Extra Space Storage, Inc. | 10,950 | 1,470,366 | |
| Lamar Advertising Co. Class A | 10,254 | 1,187,926 | |
| Outfront Media, Inc. | 114,800 | 1,820,728 | |
| Prologis, Inc. | 16,488 | 1,682,600 | |
| Sun Communities, Inc. | 7,510 | 836,013 | |
| Ventas, Inc. | 62,377 | 2,762,054 | |
| Welltower, Inc. | 28,691 | 2,733,678 | |
| 14,580,664 | |||
| Real Estate Management & Development - 0.6% | |||
| Compass, Inc. (b) | 440,500 | 1,387,575 | |
| Newmark Group, Inc. | 69,940 | 669,326 | |
| 2,056,901 | |||
TOTAL REAL ESTATE | 16,637,565 | ||
| UTILITIES - 8.5% | |||
| Electric Utilities - 5.5% | |||
| Constellation Energy Corp. | 30,942 | 5,753,352 | |
| Edison International | 35,071 | 2,492,145 | |
| Entergy Corp. | 17,390 | 1,854,991 | |
| FirstEnergy Corp. | 69,420 | 2,661,563 | |
| NextEra Energy, Inc. | 24,950 | 1,670,902 | |
| NRG Energy, Inc. | 8,350 | 606,795 | |
| PG&E Corp. | 221,555 | 3,790,806 | |
| SSE PLC | 41,580 | 864,298 | |
| 19,694,852 | |||
| Gas Utilities - 0.8% | |||
| Southwest Gas Holdings, Inc. | 16,760 | 1,250,631 | |
| UGI Corp. | 63,530 | 1,623,827 | |
| 2,874,458 | |||
| Independent Power and Renewable Electricity Producers - 1.4% | |||
| The AES Corp. | 188,155 | 3,367,975 | |
| Vistra Corp. | 22,940 | 1,739,770 | |
| 5,107,745 | |||
| Multi-Utilities - 0.8% | |||
| Algonquin Power & Utilities Corp. | 203,590 | 1,243,738 | |
| Sempra | 25,182 | 1,803,787 | |
| 3,047,525 | |||
TOTAL UTILITIES | 30,724,580 | ||
| TOTAL COMMON STOCKS (Cost $297,177,516) | 364,516,152 | ||
| U.S. Treasury Obligations - 0.0% | |||
Principal Amount (d) | Value ($) | ||
U.S. Treasury Bills, yield at date of purchase 5.3% to 5.32% 6/20/24 to 7/18/24 (e) (Cost $49,555) | 50,000 | 49,553 | |
| Money Market Funds - 2.2% | |||
| Shares | Value ($) | ||
| Fidelity Cash Central Fund 5.39% (f) | 496,767 | 496,866 | |
| Fidelity Securities Lending Cash Central Fund 5.39% (f)(g) | 7,360,481 | 7,361,217 | |
| TOTAL MONEY MARKET FUNDS (Cost $7,858,069) | 7,858,083 | ||
| TOTAL INVESTMENT IN SECURITIES - 103.3% (Cost $305,085,140) | 372,423,788 |
NET OTHER ASSETS (LIABILITIES) - (3.3)% | (11,917,679) |
| NET ASSETS - 100.0% | 360,506,109 |
| (a) | Security exempt from registration under Rule 144A of the Securities Act of 1933. These securities may be resold in transactions exempt from registration, normally to qualified institutional buyers. At the end of the period, the value of these securities amounted to $3,768,865 or 1.0% of net assets. |
| (b) | Non-income producing |
| (c) | Security or a portion of the security is on loan at period end. |
| (d) | Amount is stated in United States dollars unless otherwise noted. |
| (e) | Security or a portion of the security was pledged to cover margin requirements for futures contracts. At period end, the value of securities pledged amounted to $49,553. |
| (f) | Affiliated fund that is generally available only to investment companies and other accounts managed by Fidelity Investments. The rate quoted is the annualized seven-day yield of the fund at period end. A complete unaudited listing of the fund's holdings as of its most recent quarter end is available upon request. In addition, each Fidelity Central Fund's financial statements are available on the SEC's website or upon request. |
| (g) | Investment made with cash collateral received from securities on loan. |
| Affiliate | Value, beginning of period ($) | Purchases ($) | Sales Proceeds ($) | Dividend Income ($) | Realized Gain (loss) ($) | Change in Unrealized appreciation (depreciation) ($) | Value, end of period ($) | % ownership, end of period |
| Fidelity Cash Central Fund 5.39% | 3,866,479 | 68,118,038 | 71,487,705 | 96,329 | 54 | - | 496,866 | 0.0% |
| Fidelity Securities Lending Cash Central Fund 5.39% | 7,140,186 | 50,853,719 | 50,632,688 | 77,742 | - | - | 7,361,217 | 0.0% |
| Total | 11,006,665 | 118,971,757 | 122,120,393 | 174,071 | 54 | - | 7,858,083 | |
| Valuation Inputs at Reporting Date: | ||||
| Description | Total ($) | Level 1 ($) | Level 2 ($) | Level 3 ($) |
Investments in Securities: | ||||
| Equities: | ||||
Communication Services | 11,902,372 | 9,328,738 | 2,573,634 | - |
Consumer Discretionary | 42,872,845 | 41,046,595 | 1,826,250 | - |
Consumer Staples | 11,691,670 | 11,691,670 | - | - |
Energy | 38,446,830 | 38,446,830 | - | - |
Financials | 68,318,365 | 67,271,316 | 1,047,049 | - |
Health Care | 23,946,477 | 23,168,140 | 778,337 | - |
Industrials | 67,288,269 | 66,832,724 | 455,545 | - |
Information Technology | 11,115,823 | 11,115,823 | - | - |
Materials | 41,571,356 | 41,472,242 | 99,114 | - |
Real Estate | 16,637,565 | 16,637,565 | - | - |
Utilities | 30,724,580 | 29,860,282 | 864,298 | - |
| U.S. Government and Government Agency Obligations | 49,553 | - | 49,553 | - |
| Money Market Funds | 7,858,083 | 7,858,083 | - | - |
| Total Investments in Securities: | 372,423,788 | 364,730,008 | 7,693,780 | - |
| Statement of Assets and Liabilities | ||||
April 30, 2024 (Unaudited) | ||||
| Assets | ||||
| Investment in securities, at value (including securities loaned of $6,944,023) - See accompanying schedule: | ||||
Unaffiliated issuers (cost $297,227,071) | $ | 364,565,705 | ||
Fidelity Central Funds (cost $7,858,069) | 7,858,083 | |||
| Total Investment in Securities (cost $305,085,140) | $ | 372,423,788 | ||
| Foreign currency held at value (cost $634) | 634 | |||
| Receivable for investments sold | 2,974,383 | |||
| Receivable for fund shares sold | 262,226 | |||
| Dividends receivable | 362,637 | |||
| Distributions receivable from Fidelity Central Funds | 10,573 | |||
| Prepaid expenses | 117 | |||
| Receivable from investment adviser for expense reductions | 7,985 | |||
Total assets | 376,042,343 | |||
| Liabilities | ||||
| Payable to custodian bank | $ | 154,262 | ||
| Payable for investments purchased | 3,262,107 | |||
| Payable for fund shares redeemed | 4,398,892 | |||
| Accrued management fee | 267,989 | |||
| Distribution and service plan fees payable | 43,814 | |||
| Payable for daily variation margin on futures contracts | 1,412 | |||
| Other payables and accrued expenses | 46,887 | |||
| Collateral on securities loaned | 7,360,871 | |||
| Total liabilities | 15,536,234 | |||
| Net Assets | $ | 360,506,109 | ||
| Net Assets consist of: | ||||
| Paid in capital | $ | 282,211,019 | ||
| Total accumulated earnings (loss) | 78,295,090 | |||
| Net Assets | $ | 360,506,109 | ||
| Net Asset Value and Maximum Offering Price | ||||
| Class A : | ||||
Net Asset Value and redemption price per share ($100,955,097 ÷ 2,776,858 shares)(a) | $ | 36.36 | ||
| Maximum offering price per share (100/94.25 of $36.36) | $ | 38.58 | ||
| Class M : | ||||
Net Asset Value and redemption price per share ($25,696,478 ÷ 714,910 shares)(a) | $ | 35.94 | ||
| Maximum offering price per share (100/96.50 of $35.94) | $ | 37.24 | ||
| Class C : | ||||
Net Asset Value and offering price per share ($13,126,131 ÷ 386,762 shares)(a) | $ | 33.94 | ||
| Class I : | ||||
Net Asset Value, offering price and redemption price per share ($154,688,586 ÷ 4,206,316 shares) | $ | 36.78 | ||
| Class Z : | ||||
Net Asset Value, offering price and redemption price per share ($66,039,817 ÷ 1,795,674 shares) | $ | 36.78 | ||
(a)Redemption price per share is equal to net asset value less any applicable contingent deferred sales charge. | ||||
| Statement of Operations | ||||
Six months ended April 30, 2024 (Unaudited) | ||||
| Investment Income | ||||
| Dividends | $ | 3,274,548 | ||
| Interest | 7,351 | |||
| Income from Fidelity Central Funds (including $77,742 from security lending) | 174,071 | |||
| Total income | 3,455,970 | |||
| Expenses | ||||
| Management fee | ||||
| Basic fee | $ | 1,029,361 | ||
| Performance adjustment | 332,269 | |||
| Transfer agent fees | 176,454 | |||
| Distribution and service plan fees | 251,567 | |||
| Accounting fees | 41,256 | |||
| Custodian fees and expenses | 32,419 | |||
| Independent trustees' fees and expenses | 873 | |||
| Registration fees | 61,143 | |||
| Audit | 27,980 | |||
| Legal | 2,429 | |||
| Miscellaneous | 674 | |||
| Total expenses before reductions | 1,956,425 | |||
| Expense reductions | (151,983) | |||
| Total expenses after reductions | 1,804,442 | |||
| Net Investment income (loss) | 1,651,528 | |||
| Realized and Unrealized Gain (Loss) | ||||
| Net realized gain (loss) on: | ||||
| Investment Securities: | ||||
| Unaffiliated issuers | 22,099,823 | |||
| Fidelity Central Funds | 54 | |||
| Foreign currency transactions | 887 | |||
| Futures contracts | 515,054 | |||
| Total net realized gain (loss) | 22,615,818 | |||
| Change in net unrealized appreciation (depreciation) on: | ||||
| Investment Securities: | ||||
| Unaffiliated issuers | 46,638,974 | |||
| Assets and liabilities in foreign currencies | 190 | |||
| Futures contracts | 105,715 | |||
| Total change in net unrealized appreciation (depreciation) | 46,744,879 | |||
| Net gain (loss) | 69,360,697 | |||
| Net increase (decrease) in net assets resulting from operations | $ | 71,012,225 | ||
| Statement of Changes in Net Assets | ||||
Six months ended April 30, 2024 (Unaudited) | Year ended October 31, 2023 | |||
| Increase (Decrease) in Net Assets | ||||
| Operations | ||||
| Net investment income (loss) | $ | 1,651,528 | $ | 3,248,138 |
| Net realized gain (loss) | 22,615,818 | (7,449,973) | ||
| Change in net unrealized appreciation (depreciation) | 46,744,879 | 8,643,122 | ||
| Net increase (decrease) in net assets resulting from operations | 71,012,225 | 4,441,287 | ||
| Distributions to shareholders | (3,454,881) | (2,171,133) | ||
| Share transactions - net increase (decrease) | (12,143,015) | (94,886,937) | ||
| Total increase (decrease) in net assets | 55,414,329 | (92,616,783) | ||
| Net Assets | ||||
| Beginning of period | 305,091,780 | 397,708,563 | ||
| End of period | $ | 360,506,109 | $ | 305,091,780 |
Fidelity Advisor® Value Fund Class A |
Six months ended (Unaudited) April 30, 2024 | Years ended October 31, 2023 | 2022 | 2021 | 2020 | 2019 | |||||||
Selected Per-Share Data | ||||||||||||
| Net asset value, beginning of period | $ | 29.81 | $ | 29.71 | $ | 33.55 | $ | 20.40 | $ | 22.44 | $ | 23.40 |
| Income from Investment Operations | ||||||||||||
Net investment income (loss) A,B | .14 | .23 | .24 | .11 | .14 | .19 | ||||||
| Net realized and unrealized gain (loss) | 6.70 | (.01) C | (2.61) | 13.15 | (1.46) | 1.57 | ||||||
| Total from investment operations | 6.84 | .22 | (2.37) | 13.26 | (1.32) | 1.76 | ||||||
| Distributions from net investment income | (.29) | (.12) | (.24) | (.11) | (.17) D | (.10) D | ||||||
| Distributions from net realized gain | - | - | (1.24) | - | (.55) D | (2.62) D | ||||||
| Total distributions | (.29) | (.12) | (1.47) E | (.11) | (.72) | (2.72) | ||||||
| Net asset value, end of period | $ | 36.36 | $ | 29.81 | $ | 29.71 | $ | 33.55 | $ | 20.40 | $ | 22.44 |
Total Return F,G,H | 23.03 % | .73% | (7.25)% | 65.21% | (6.24)% | 9.00% | ||||||
Ratios to Average Net Assets B,I,J | ||||||||||||
| Expenses before reductions | 1.24% K | 1.22% | 1.15% | 1.21% | 1.17% | 1.10% | ||||||
| Expenses net of fee waivers, if any | 1.14 % K | 1.15% | 1.15% | 1.20% | 1.16% | 1.10% | ||||||
| Expenses net of all reductions | 1.14% K | 1.15% | 1.15% | 1.20% | 1.14% | 1.10% | ||||||
| Net investment income (loss) | .78% K | .74% | .76% | .35% | .71% | .87% | ||||||
| Supplemental Data | ||||||||||||
| Net assets, end of period (000 omitted) | $ | 100,955 | $ | 86,044 | $ | 108,439 | $ | 100,604 | $ | 36,269 | $ | 47,465 |
Portfolio turnover rate L | 78 % K | 75% | 67% | 64% | 91% | 77% |
Fidelity Advisor® Value Fund Class M |
Six months ended (Unaudited) April 30, 2024 | Years ended October 31, 2023 | 2022 | 2021 | 2020 | 2019 | |||||||
Selected Per-Share Data | ||||||||||||
| Net asset value, beginning of period | $ | 29.45 | $ | 29.34 | $ | 33.13 | $ | 20.15 | $ | 22.19 | $ | 23.15 |
| Income from Investment Operations | ||||||||||||
Net investment income (loss) A,B | .09 | .15 | .16 | .03 | .09 | .12 | ||||||
| Net realized and unrealized gain (loss) | 6.62 | - C | (2.57) | 13.01 | (1.47) | 1.57 | ||||||
| Total from investment operations | 6.71 | .15 | (2.41) | 13.04 | (1.38) | 1.69 | ||||||
| Distributions from net investment income | (.22) | (.04) | (.15) | (.06) | (.11) D | (.03) D | ||||||
| Distributions from net realized gain | - | - | (1.24) | - | (.55) D | (2.62) D | ||||||
| Total distributions | (.22) | (.04) | (1.38) E | (.06) | (.66) | (2.65) | ||||||
| Net asset value, end of period | $ | 35.94 | $ | 29.45 | $ | 29.34 | $ | 33.13 | $ | 20.15 | $ | 22.19 |
Total Return F,G,H | 22.84 % | .49% | (7.46)% | 64.81% | (6.55)% | 8.74% | ||||||
Ratios to Average Net Assets B,I,J | ||||||||||||
| Expenses before reductions | 1.48% K | 1.46% | 1.40% | 1.47% | 1.45% | 1.39% | ||||||
| Expenses net of fee waivers, if any | 1.39 % K | 1.40% | 1.40% | 1.45% | 1.43% | 1.38% | ||||||
| Expenses net of all reductions | 1.39% K | 1.39% | 1.40% | 1.45% | 1.42% | 1.38% | ||||||
| Net investment income (loss) | .53% K | .49% | .51% | .10% | .43% | .58% | ||||||
| Supplemental Data | ||||||||||||
| Net assets, end of period (000 omitted) | $ | 25,696 | $ | 21,708 | $ | 22,540 | $ | 23,323 | $ | 12,736 | $ | 15,006 |
Portfolio turnover rate L | 78 % K | 75% | 67% | 64% | 91% | 77% |
Fidelity Advisor® Value Fund Class C |
Six months ended (Unaudited) April 30, 2024 | Years ended October 31, 2023 | 2022 | 2021 | 2020 | 2019 | |||||||
Selected Per-Share Data | ||||||||||||
| Net asset value, beginning of period | $ | 27.73 | $ | 27.73 | $ | 31.45 | $ | 19.18 | $ | 21.15 | $ | 22.16 |
| Income from Investment Operations | ||||||||||||
Net investment income (loss) A,B | .01 | - C | - C | (.12) | (.02) | .01 | ||||||
| Net realized and unrealized gain (loss) | 6.24 | - C | (2.43) | 12.39 | (1.40) | 1.49 | ||||||
| Total from investment operations | 6.25 | - C | (2.43) | 12.27 | (1.42) | 1.50 | ||||||
| Distributions from net investment income | (.04) | - | (.08) | - | - | - | ||||||
| Distributions from net realized gain | - | - | (1.21) | - | (.55) | (2.51) | ||||||
| Total distributions | (.04) | - | (1.29) | - | (.55) | (2.51) | ||||||
| Net asset value, end of period | $ | 33.94 | $ | 27.73 | $ | 27.73 | $ | 31.45 | $ | 19.18 | $ | 21.15 |
Total Return D,E,F | 22.55 % | -% | (7.94)% | 63.97% | (7.02)% | 8.13% | ||||||
Ratios to Average Net Assets B,G,H | ||||||||||||
| Expenses before reductions | 2.00% I | 2.00% | 1.93% | 2.01% | 1.98% | 1.92% | ||||||
| Expenses net of fee waivers, if any | 1.89 % I | 1.90% | 1.90% | 1.96% | 1.97% | 1.92% | ||||||
| Expenses net of all reductions | 1.89% I | 1.90% | 1.90% | 1.96% | 1.95% | 1.91% | ||||||
| Net investment income (loss) | .03% I | (.01)% | -% J | (.41)% | (.11)% | .05% | ||||||
| Supplemental Data | ||||||||||||
| Net assets, end of period (000 omitted) | $ | 13,126 | $ | 11,802 | $ | 14,661 | $ | 15,726 | $ | 6,331 | $ | 8,777 |
Portfolio turnover rate K | 78 % I | 75% | 67% | 64% | 91% | 77% |
Fidelity Advisor® Value Fund Class I |
Six months ended (Unaudited) April 30, 2024 | Years ended October 31, 2023 | 2022 | 2021 | 2020 | 2019 | |||||||
Selected Per-Share Data | ||||||||||||
| Net asset value, beginning of period | $ | 30.19 | $ | 30.09 | $ | 33.96 | $ | 20.64 | $ | 22.70 | $ | 23.66 |
| Income from Investment Operations | ||||||||||||
Net investment income (loss) A,B | .18 | .31 | .32 | .20 | .21 | .26 | ||||||
| Net realized and unrealized gain (loss) | 6.79 | (.02) C | (2.63) | 13.30 | (1.48) | 1.59 | ||||||
| Total from investment operations | 6.97 | .29 | (2.31) | 13.50 | (1.27) | 1.85 | ||||||
| Distributions from net investment income | (.38) | (.19) | (.33) | (.18) | (.25) D | (.19) D | ||||||
| Distributions from net realized gain | - | - | (1.24) | - | (.55) D | (2.62) D | ||||||
| Total distributions | (.38) | (.19) | (1.56) E | (.18) | (.79) E | (2.81) | ||||||
| Net asset value, end of period | $ | 36.78 | $ | 30.19 | $ | 30.09 | $ | 33.96 | $ | 20.64 | $ | 22.70 |
Total Return F,G | 23.20 % | .97% | (6.99)% | 65.68% | (5.95)% | 9.34% | ||||||
Ratios to Average Net Assets B,H,I | ||||||||||||
| Expenses before reductions | .96% J | .94% | .88% | .92% | .87% | .79% | ||||||
| Expenses net of fee waivers, if any | .89 % J | .90% | .88% | .92% | .85% | .79% | ||||||
| Expenses net of all reductions | .89% J | .90% | .88% | .92% | .84% | .79% | ||||||
| Net investment income (loss) | 1.03% J | .99% | 1.02% | .63% | 1.01% | 1.18% | ||||||
| Supplemental Data | ||||||||||||
| Net assets, end of period (000 omitted) | $ | 154,689 | $ | 134,095 | $ | 170,764 | $ | 104,393 | $ | 8,861 | $ | 11,097 |
Portfolio turnover rate K | 78 % J | 75% | 67% | 64% | 91% | 77% |
Fidelity Advisor® Value Fund Class Z |
Six months ended (Unaudited) April 30, 2024 | Years ended October 31, 2023 | 2022 | 2021 | 2020 | 2019 | |||||||
Selected Per-Share Data | ||||||||||||
| Net asset value, beginning of period | $ | 30.21 | $ | 30.10 | $ | 33.96 | $ | 20.63 | $ | 22.69 | $ | 23.67 |
| Income from Investment Operations | ||||||||||||
Net investment income (loss) A,B | .21 | .36 | .36 | .25 | .23 | .28 | ||||||
| Net realized and unrealized gain (loss) | 6.78 | (.01) C | (2.62) | 13.28 | (1.47) | 1.58 | ||||||
| Total from investment operations | 6.99 | .35 | (2.26) | 13.53 | (1.24) | 1.86 | ||||||
| Distributions from net investment income | (.42) | (.24) | (.36) | (.20) | (.27) D | (.22) D | ||||||
| Distributions from net realized gain | - | - | (1.24) | - | (.55) D | (2.62) D | ||||||
| Total distributions | (.42) | (.24) | (1.60) | (.20) | (.82) | (2.84) | ||||||
| Net asset value, end of period | $ | 36.78 | $ | 30.21 | $ | 30.10 | $ | 33.96 | $ | 20.63 | $ | 22.69 |
Total Return E,F | 23.27 % | 1.14% | (6.86)% | 65.88% | (5.84)% | 9.45% | ||||||
Ratios to Average Net Assets B,G,H | ||||||||||||
| Expenses before reductions | .84% I | .82% | .76% | .77% | .75% | .69% | ||||||
| Expenses net of fee waivers, if any | .74 % I | .75% | .75% | .77% | .74% | .68% | ||||||
| Expenses net of all reductions | .74% I | .75% | .75% | .77% | .72% | .68% | ||||||
| Net investment income (loss) | 1.18% I | 1.14% | 1.16% | .78% | 1.13% | 1.28% | ||||||
| Supplemental Data | ||||||||||||
| Net assets, end of period (000 omitted) | $ | 66,040 | $ | 51,443 | $ | 81,306 | $ | 45,835 | $ | 1,712 | $ | 2,772 |
Portfolio turnover rate J | 78 % I | 75% | 67% | 64% | 91% | 77% |
| Fidelity Central Fund | Investment Manager | Investment Objective | Investment Practices | Expense RatioA |
| Fidelity Money Market Central Funds | Fidelity Management & Research Company LLC (FMR) | Each fund seeks to obtain a high level of current income consistent with the preservation of capital and liquidity. | Short-term Investments | Less than .005% |
| Gross unrealized appreciation | $81,727,019 |
| Gross unrealized depreciation | (16,194,518) |
| Net unrealized appreciation (depreciation) | $65,532,501 |
| Tax cost | $306,891,287 |
| Short-term | $(10,226,721) |
| Total capital loss carryforward | $(10,226,721) |
| Equity Risk | Equity risk relates to the fluctuations in the value of financial instruments as a result of changes in market prices (other than those arising from interest rate risk or foreign exchange risk), whether caused by factors specific to an individual investment, its issuer, or all factors affecting all instruments traded in a market or market segment. |
| Purchases ($) | Sales ($) | |
| Fidelity Advisor Value Fund | 136,562,021 | 142,284,979 |
| Maximum Management Fee Rate % | |
| Class A | .71 |
| Class M | .70 |
| Class C | .72 |
| Class I | .68 |
| Class Z | .56 |
| Total Management Fee Rate % | |
| Class A | .71 |
| Class M | .70 |
| Class C | .72 |
| Class I | .68 |
| Class Z | .56 |
| Performance Adjustment Index | |
| Fidelity Advisor Value Fund | Russell Midcap Value Index |
| Distribution Fee | Service Fee | Total Fees ($) | Retained by FDC ($) | |
| Class A | - % | .25% | 123,332 | 2,706 |
| Class M | .25% | .25% | 62,244 | 281 |
| Class C | .75% | .25% | 65,991 | 9,874 |
| 251,567 | 12,861 |
| Retained by FDC ($) | |
| Class A | 15,760 |
| Class M | 935 |
Class CA | 117 |
16,812 |
| % of Class-Level Average Net Assets | |
| Class A | .1895 |
| Class M | .1801 |
| Class C | .2000 |
| Class I | .1646 |
| Amount ($) | % of Class-Level Average Net Assets | |
| Class A | 60,284 | .19 |
| Class M | 14,438 | .18 |
| Class C | 8,805 | .20 |
| Class I | 84,527 | .16 |
| Class Z | 8,400 | .04 |
176,454 |
| % of Average Net Assets | |
| Fidelity Advisor Value Fund | .0354 |
| % of Average Net Assets | |
| Fidelity Advisor Value Fund | .04 |
| Amount ($) | |
| Fidelity Advisor Value Fund | 3,862 |
| Purchases ($) | Sales ($) | Realized Gain (Loss)($) | |
| Fidelity Advisor Value Fund | 5,026,254 | 10,910,894 | 852,904 |
| Amount ($) | |
| Fidelity Advisor Value Fund | 322 |
| Total Security Lending Fees Paid to NFS ($) | Security Lending Income From Securities Loaned to NFS ($) | Value of Securities Loaned to NFS at Period End ($) | |
| Fidelity Advisor Value Fund | 8,416 | - | - |
| Expense Limitations | Reimbursement ($) | |
| Class A | 1.15% | 43,267 |
| Class M | 1.40% | 9,743 |
| Class C | 1.90% | 6,730 |
| Class I | .90% | 48,397 |
| Class Z | .75% | 27,816 |
135,953 |
| Expense reduction ($) | |
| Class M | 25 |
Six months ended April 30, 2024 | Year ended October 31, 2023 | |
| Fidelity Advisor Value Fund | ||
| Distributions to shareholders | ||
| Class A | $808,936 | $432,389 |
| Class M | 153,984 | 26,680 |
| Class C | 16,469 | - |
| Class I | 1,762,612 | 1,087,478 |
| Class Z | 712,880 | 624,586 |
Total | $3,454,881 | $2,171,133 |
| Shares | Shares | Dollars | Dollars | |
Six months ended April 30, 2024 | Year ended October 31, 2023 | Six months ended April 30, 2024 | Year ended October 31, 2023 | |
| Fidelity Advisor Value Fund | ||||
| Class A | ||||
| Shares sold | 175,148 | 645,294 | $6,173,614 | $20,203,230 |
| Reinvestment of distributions | 24,101 | 14,231 | 794,616 | 427,939 |
| Shares redeemed | (308,687) | (1,423,001) | (10,737,273) | (43,844,893) |
| Net increase (decrease) | (109,438) | (763,476) | $(3,769,043) | $(23,213,724) |
| Class M | ||||
| Shares sold | 31,385 | 72,556 | $1,087,213 | $2,224,101 |
| Reinvestment of distributions | 4,679 | 888 | 152,627 | 26,425 |
| Shares redeemed | (58,307) | (104,459) | (1,979,099) | (3,211,772) |
| Net increase (decrease) | (22,243) | (31,015) | $(739,259) | $(961,246) |
| Class C | ||||
| Shares sold | 31,194 | 156,850 | $1,014,196 | $4,543,881 |
| Reinvestment of distributions | 532 | - | 16,405 | - |
| Shares redeemed | (70,581) | (259,838) | (2,274,960) | (7,440,188) |
| Net increase (decrease) | (38,855) | (102,988) | $(1,244,359) | $(2,896,307) |
| Class I | ||||
| Shares sold | 1,063,685 | 2,295,758 | $36,658,287 | $72,434,977 |
| Reinvestment of distributions | 52,545 | 35,458 | 1,750,267 | 1,077,559 |
| Shares redeemed | (1,351,089) | (3,565,521) | (48,028,023) | (111,308,941) |
| Net increase (decrease) | (234,859) | (1,234,305) | $(9,619,469) | $(37,796,405) |
| Class Z | ||||
| Shares sold | 311,592 | 823,282 | $11,050,459 | $26,158,948 |
| Reinvestment of distributions | 19,285 | 17,943 | 641,991 | 544,763 |
| Shares redeemed | (238,096) | (1,839,568) | (8,463,335) | (56,722,966) |
| Net increase (decrease) | 92,781 | (998,343) | $3,229,115 | $(30,019,255) |
| The Example is based on an investment of $1,000 invested at the beginning of the period and held for the entire period (November 1, 2023 to April 30, 2024). |
Annualized Expense Ratio- A | Beginning Account Value November 1, 2023 | Ending Account Value April 30, 2024 | Expenses Paid During Period- C November 1, 2023 to April 30, 2024 | |||||||
| Fidelity Advisor® Value Fund | ||||||||||
| Class A | 1.14% | |||||||||
| Actual | $ 1,000 | $ 1,230.30 | $ 6.32 | |||||||
Hypothetical-B | $ 1,000 | $ 1,019.19 | $ 5.72 | |||||||
| Class M | 1.39% | |||||||||
| Actual | $ 1,000 | $ 1,228.40 | $ 7.70 | |||||||
Hypothetical-B | $ 1,000 | $ 1,017.95 | $ 6.97 | |||||||
| Class C | 1.89% | |||||||||
| Actual | $ 1,000 | $ 1,225.50 | $ 10.46 | |||||||
Hypothetical-B | $ 1,000 | $ 1,015.47 | $ 9.47 | |||||||
| Class I | .89% | |||||||||
| Actual | $ 1,000 | $ 1,232.00 | $ 4.94 | |||||||
Hypothetical-B | $ 1,000 | $ 1,020.44 | $ 4.47 | |||||||
| Class Z | .74% | |||||||||
| Actual | $ 1,000 | $ 1,232.70 | $ 4.11 | |||||||
Hypothetical-B | $ 1,000 | $ 1,021.18 | $ 3.72 | |||||||
- Highly liquid investments - cash or convertible to cash within three business days or less
- Moderately liquid investments - convertible to cash in three to seven calendar days
- Less liquid investments - can be sold or disposed of, but not settled, within seven calendar days
- Illiquid investments - cannot be sold or disposed of within seven calendar days
 |


Contents
| Top Bond Issuers (% of Fund's net assets) | ||
(with maturities greater than one year) | ||
| Great Outdoors Group LLC | 2.2 | |
| Asurion LLC | 2.0 | |
| Caesars Entertainment, Inc. | 1.3 | |
| Acrisure LLC | 1.2 | |
| Fertitta Entertainment LLC NV | 1.1 | |
| Polaris Newco LLC | 1.0 | |
| UKG, Inc. | 0.9 | |
| MH Sub I LLC | 0.9 | |
| TransDigm, Inc. | 0.8 | |
| Clydesdale Acquisition Holdings, Inc. | 0.8 | |
| 12.2 | ||
| Market Sectors (% of Fund's net assets) | ||
| Technology | 15.2 | |
| Services | 11.1 | |
| Insurance | 6.0 | |
| Healthcare | 6.0 | |
| Gaming | 4.9 | |
Quality Diversification (% of Fund's net assets) |
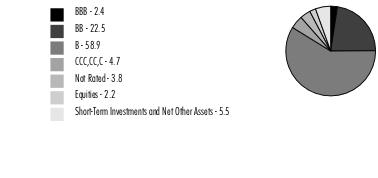 |
| We have used ratings from Moody's Investors Service, Inc. Where Moody's® ratings are not available, we have used S&P® ratings. All ratings are as of the date indicated and do not reflect subsequent changes. |
Asset Allocation (% of Fund's net assets) |
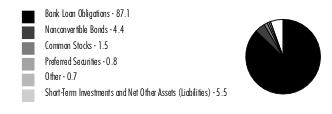 |
| Bank Loan Obligations - 87.1% | |||
Principal Amount (a) (000s) | Value ($) (000s) | ||
| Aerospace - 0.9% | |||
| ADS Tactical, Inc. Tranche B 1LN, term loan CME Term SOFR 1 Month Index + 5.750% 11.1802% 3/19/26 (b)(c)(d) | 16,090 | 16,131 | |
| Gemini HDPE LLC Tranche B 1LN, term loan CME Term SOFR 3 Month Index + 3.000% 8.5743% 12/31/27 (b)(c)(d) | 3,916 | 3,913 | |
| KBR, Inc. Tranche B 1LN, term loan CME Term SOFR 1 Month Index + 2.250% 7.5657% 1/21/31 (b)(c)(d) | 6,525 | 6,540 | |
| Ovation Parent, Inc. Tranche B 1LN, term loan CME Term SOFR 1 Month Index + 3.500% 8.8266% 3/26/31 (b)(c)(d) | 13,390 | 13,432 | |
| TransDigm, Inc.: | |||
| Tranche I 1LN, term loan CME Term SOFR 1 Month Index + 2.750% 8.0594% 8/24/28 (b)(c)(d) | 38,727 | 38,914 | |
| Tranche J 1LN, term loan CME Term SOFR 3 Month Index + 3.250% 8.5594% 2/28/31 (b)(c)(d) | 16,164 | 16,252 | |
| Tranche K 1LN, term loan CME Term SOFR 1 Month Index + 2.750% 8.0594% 3/22/30 (b)(c)(d) | 36,525 | 36,673 | |
TOTAL AEROSPACE | 131,855 | ||
| Air Transportation - 1.2% | |||
| AAdvantage Loyalty IP Ltd. Tranche B 1LN, term loan CME Term SOFR 3 Month Index + 4.750% 10.3362% 4/20/28 (b)(c)(d) | 23,462 | 24,378 | |
| Air Canada Tranche B 1LN, term loan CME Term SOFR 1 Month Index + 2.500% 7.833% 3/21/31 (b)(c)(d) | 11,450 | 11,522 | |
| American Airlines, Inc. Tranche B 1LN, term loan CME Term SOFR 1 Month Index + 3.500% 8.7749% 6/4/29 (b)(c)(d) | 14,615 | 14,658 | |
| Echo Global Logistics, Inc.: | |||
| 1LN, term loan: | |||
CME Term SOFR 1 Month Index + 3.500% 8.9157% 11/23/28 (b)(c)(d) | 13,179 | 12,989 | |
CME Term SOFR 3 Month Index + 4.750% 10.1657% 11/23/28 (b)(c)(d)(e) | 19,158 | 19,158 | |
| 2LN, term loan: | |||
CME Term SOFR 3 Month Index + 7.000% 12.4157% 11/23/29 (b)(c)(d)(e) | 8,145 | 8,145 | |
CME Term SOFR 3 Month Index + 8.000% 13.4157% 11/23/29 (b)(c)(d)(e) | 4,100 | 4,100 | |
| Mileage Plus Holdings LLC Tranche B 1LN, term loan CME Term SOFR 3 Month Index + 5.250% 10.7325% 7/2/27 (b)(c)(d) | 17,700 | 18,151 | |
| Rand Parent LLC Tranche B 1LN, term loan CME Term SOFR 1 Month Index + 4.250% 9.5594% 3/17/30 (b)(c)(d) | 7,779 | 7,804 | |
| SkyMiles IP Ltd. Tranche B 1LN, term loan CME Term SOFR 3 Month Index + 3.750% 9.0746% 10/20/27 (b)(c)(d) | 9,869 | 10,166 | |
| STG Logistics, Inc. 1LN, term loan CME Term SOFR 1 Month Index + 6.000% 11.4519% 3/24/28 (b)(c)(d)(e) | 12,186 | 9,505 | |
| United Airlines, Inc. Tranche 1LN, term loan CME Term SOFR 1 Month Index + 2.750% 8.0757% 2/24/31 (b)(c)(d) | 29,235 | 29,317 | |
TOTAL AIR TRANSPORTATION | 169,893 | ||
| Automotive & Auto Parts - 1.4% | |||
| American Trailer World Corp. Tranche B 1LN, term loan CME Term SOFR 1 Month Index + 3.750% 9.1657% 3/5/28 (b)(c)(d) | 24,022 | 23,556 | |
| Belron Finance U.S. LLC Tranche B 1LN, term loan: | |||
| CME Term SOFR 1 Month Index + 2.000% 7.5777% 4/28/28 (b)(c)(d) | 5,521 | 5,524 | |
| CME Term SOFR 1 Month Index + 2.250% 7.6769% 4/13/29 (b)(c)(d) | 5,201 | 5,202 | |
| Clarios Global LP Tranche B 1LN, term loan CME Term SOFR 1 Month Index + 3.250% 8.3157% 5/6/30 (b)(c)(d) | 26,414 | 26,480 | |
| CWGS Group LLC Tranche B 1LN, term loan CME Term SOFR 1 Month Index + 2.500% 7.9301% 6/3/28 (b)(c)(d) | 39,380 | 38,523 | |
| Driven Holdings LLC Tranche B 1LN, term loan CME Term SOFR 1 Month Index + 3.000% 8.4302% 12/17/28 (b)(c)(d) | 12,916 | 12,900 | |
| LS Group OpCo Acquistion LLC Tranche B 1LN, term loan CME Term SOFR 1 Month Index + 3.000% 8.3169% 4/16/31 (b)(c)(d) | 15,402 | 15,426 | |
| Power Stop LLC 1LN, term loan CME Term SOFR 1 Month Index + 4.750% 10.1932% 1/26/29 (b)(c)(d) | 18,251 | 16,517 | |
| Realtruck Group, Inc. Tranche B 1LN, term loan CME Term SOFR 1 Month Index + 3.750% 8.9302% 1/29/28 (b)(c)(d) | 15,949 | 15,807 | |
| RVR Dealership Holdings LLC Tranche B 1LN, term loan 1 month U.S. LIBOR + 4.000% 9.1682% 2/8/28 (b)(c)(d) | 22,283 | 20,844 | |
| Wand NewCo 3, Inc. Tranche B 1LN, term loan CME Term SOFR 1 Month Index + 3.750% 9.0657% 1/20/31 (b)(c)(d) | 23,965 | 24,092 | |
TOTAL AUTOMOTIVE & AUTO PARTS | 204,871 | ||
| Banks & Thrifts - 1.0% | |||
| Citadel Securities LP Tranche B 1LN, term loan CME Term SOFR 1 Month Index + 2.250% 7.5657% 7/29/30 (b)(c)(d) | 56,379 | 56,485 | |
| CQP Holdco LP Tranche B 1LN, term loan CME Term SOFR 3 Month Index + 3.000% 8.3019% 12/31/30 (b)(c)(d) | 59,491 | 59,646 | |
| Novae LLC 1LN, term loan CME Term SOFR 3 Month Index + 5.000% 10.4785% 12/22/28 (b)(c)(d) | 13,604 | 13,511 | |
| Superannuation & Investments U.S. LLC 1LN, term loan CME Term SOFR 1 Month Index + 3.750% 9.1827% 12/1/28 (b)(c)(d) | 6,432 | 6,429 | |
TOTAL BANKS & THRIFTS | 136,071 | ||
| Broadcasting - 1.4% | |||
| AppLovin Corp. Tranche B 1LN, term loan: | |||
| CME Term SOFR 1 Month Index + 2.500% 7.8157% 10/25/28 (b)(c)(d) | 14,283 | 14,294 | |
| CME Term SOFR 1 Month Index + 2.500% 7.8157% 8/19/30 (b)(c)(d) | 29,827 | 29,802 | |
| Diamond Sports Group LLC: | |||
| 1LN, term loan CME Term SOFR 1 Month Index + 8.000% 15.4287% 8/24/26 (b)(c)(d) | 3,813 | 3,632 | |
| 2LN, term loan CME Term SOFR 1 Month Index + 5.250% 10.6625% (b)(c)(d)(f) | 71,092 | 1,653 | |
| term loan 10% 8/2/27 (d) | 4,679 | 7,424 | |
| Dotdash Meredith, Inc. Tranche B 1LN, term loan CME Term SOFR 1 Month Index + 4.000% 9.4287% 12/1/28 (b)(c)(d) | 44,409 | 43,965 | |
| Nexstar Media, Inc. Tranche B, term loan CME Term SOFR 1 Month Index + 2.500% 7.9302% 9/19/26 (b)(c)(d) | 20,599 | 20,601 | |
| Sinclair Television Group, Inc.: | |||
| Tranche B 1LN, term loan: | |||
CME Term SOFR 1 Month Index + 2.500% 8.0911% 9/30/26 (b)(c)(d) | 5,178 | 4,782 | |
CME Term SOFR 1 Month Index + 3.000% 8.5911% 4/1/28 (b)(c)(d) | 2,918 | 2,273 | |
| Tranche B4 1LN, term loan CME Term SOFR 1 Month Index + 2.750% 9.1657% 4/21/29 (b)(c)(d) | 13,657 | 10,434 | |
| Univision Communications, Inc.: | |||
| 1LN, term loan CME Term SOFR 3 Month Index + 4.250% 9.5594% 6/24/29 (b)(c)(d) | 9,752 | 9,752 | |
| Tranche B 1LN, term loan: | |||
CME Term SOFR 1 Month Index + 3.250% 8.6802% 1/31/29 (b)(c)(d) | 38,730 | 38,601 | |
CME Term SOFR 1 Month Index + 3.250% 8.6946% 3/24/26 (b)(c)(d) | 8,579 | 8,576 | |
TOTAL BROADCASTING | 195,789 | ||
| Building Materials - 2.8% | |||
| Acproducts Holdings, Inc. Tranche B 1LN, term loan CME Term SOFR 3 Month Index + 4.250% 9.8135% 5/17/28 (b)(c)(d) | 48,995 | 42,417 | |
| APi Group DE, Inc. Tranche B 1LN, term loan CME Term SOFR 1 Month Index + 2.500% 7.9302% 1/3/29 (b)(c)(d) | 26,624 | 26,693 | |
| Beacon Roofing Supply, Inc. Tranche B 1LN, term loan CME Term SOFR 1 Month Index + 2.000% 7.3302% 5/19/28 (b)(c)(d) | 7,396 | 7,414 | |
| Chariot Buyer LLC Tranche B 1LN, term loan: | |||
| CME Term SOFR 1 Month Index + 3.500% 8.6657% 10/22/28 (b)(c)(d) | 7,541 | 7,528 | |
| CME Term SOFR 1 Month Index + 3.750% 9.0657% 11/3/28 (b)(c)(d) | 10,855 | 10,871 | |
| Core & Main LP Tranche B 1LN, term loan CME Term SOFR 1 Month Index + 2.250% 7.5683% 2/10/31 (b)(c)(d) | 8,259 | 8,280 | |
| Hunter Douglas, Inc. Tranche B 1LN, term loan CME Term SOFR 3 Month Index + 3.500% 8.8238% 2/25/29 (b)(c)(d) | 101,395 | 100,562 | |
| Janus International Group LLC Tranche B 1LN, term loan CME Term SOFR 1 Month Index + 3.250% 8.6226% 8/3/30 (b)(c)(d) | 6,360 | 6,368 | |
| Miwd Holdco Ii LLC Tranche B2, term loan CME Term SOFR 1 Month Index + 3.500% 3/20/31 (c)(d)(g) | 8,415 | 8,450 | |
| OPE USIC Holdings, Inc. Tranche B 1LN, term loan CME Term SOFR 1 Month Index + 3.500% 9.064% 5/14/28 (b)(c)(d) | 11,256 | 11,247 | |
| Oscar AcquisitionCo LLC 1LN, term loan CME Term SOFR 3 Month Index + 4.500% 9.9019% 4/29/29 (b)(c)(d) | 45,469 | 45,647 | |
| Smyrna Ready Mix Concrete LLC Tranche B 1LN, term loan CME Term SOFR 1 Month Index + 3.500% 8.8154% 4/2/29 (b)(c)(d) | 10,317 | 10,342 | |
| Specialty Building Products Holdings LLC Tranche B 1LN, term loan CME Term SOFR 1 Month Index + 3.250% 9.1657% 10/15/28 (b)(c)(d) | 10,937 | 10,935 | |
| SRS Distribution, Inc. Tranche B 1LN, term loan: | |||
| CME Term SOFR 1 Month Index + 3.500% 8.9302% 6/4/28 (b)(c)(d) | 40,457 | 40,742 | |
| CME Term SOFR 3 Month Index + 3.250% 8.6657% 6/2/28 (b)(c)(d) | 11,295 | 11,365 | |
| Standard Industries, Inc./New Jersey Tranche B 1LN, term loan CME Term SOFR 1 Month Index + 2.250% 7.6799% 9/22/28 (b)(c)(d) | 19,578 | 19,625 | |
| Traverse Midstream Partners Ll Tranche B, term loan CME Term SOFR 1 Month Index + 3.500% 8.8295% 2/16/28 (b)(c)(d) | 9,422 | 9,431 | |
| White Capital Buyer LLC Tranche B 1LN, term loan 1 month U.S. LIBOR + 4.000% 9.0657% 10/19/27 (b)(c)(d) | 11,643 | 11,678 | |
TOTAL BUILDING MATERIALS | 389,595 | ||
| Cable/Satellite TV - 1.7% | |||
| Charter Communication Operating LLC: | |||
| Tranche B2 1LN, term loan CME Term SOFR 1 Month Index + 1.750% 7.0519% 2/1/27 (b)(c)(d) | 65,757 | 65,668 | |
| Tranche B4 1LN, term loan CME Term SOFR 1 Month Index + 2.000% 7.3019% 12/9/30 (b)(c)(d) | 8,698 | 8,573 | |
| Coral-U.S. Co.-Borrower LLC: | |||
| Tranche B, term loan CME Term SOFR 1 Month Index + 2.250% 7.6855% 1/31/28 (b)(c)(d) | 31,425 | 30,997 | |
| Tranche B6 1LN, term loan CME Term SOFR 1 Month Index + 3.000% 8.4355% 10/15/29 (b)(c)(d) | 2,855 | 2,840 | |
| CSC Holdings LLC: | |||
| Tranche B 5LN, term loan CME Term SOFR 1 Month Index + 2.500% 7.9355% 4/15/27 (b)(c)(d) | 21,161 | 17,788 | |
| Tranche B6 LN, term loan CME Term SOFR 1 Month Index + 4.500% 9.821% 1/18/28 (b)(c)(d) | 47,655 | 45,911 | |
| Numericable LLC Tranche B 13LN, term loan CME Term SOFR 1 Month Index + 4.000% 9.5686% 8/14/26 (b)(c)(d) | 11,940 | 10,003 | |
| Virgin Media Bristol LLC: | |||
| Tranche N, term loan CME Term SOFR 1 Month Index + 2.500% 7.9355% 1/31/28 (b)(c)(d) | 21,915 | 21,493 | |
| Tranche Y 1LN, term loan CME Term SOFR 1 Month Index + 3.250% 8.6562% 3/6/31 (b)(c)(d) | 37,605 | 36,905 | |
TOTAL CABLE/SATELLITE TV | 240,178 | ||
| Capital Goods - 0.6% | |||
| Ali Group North America Corp. Tranche B 1LN, term loan CME Term SOFR 1 Month Index + 2.000% 7.4302% 7/22/29 (b)(c)(d) | 8,031 | 8,046 | |
| Chart Industries, Inc. Tranche B 1LN, term loan CME Term SOFR 1 Month Index + 3.250% 8.6734% 3/17/30 (b)(c)(d) | 22,441 | 22,497 | |
| CPM Holdings, Inc. 1LN, term loan CME Term SOFR 1 Month Index + 4.500% 9.8273% 9/28/28 (b)(c)(d) | 10,376 | 10,402 | |
| Griffon Corp. Tranche B 1LN, term loan CME Term SOFR 1 Month Index + 2.750% 7.7019% 1/24/29 (b)(c)(d) | 23,191 | 23,206 | |
| TK Elevator U.S. Newco, Inc. Tranche B 1LN, term loan CME Term SOFR 1 Month Index + 3.500% 8.7909% 4/11/30 (b)(c)(d) | 16,782 | 16,845 | |
| TNT Crane & Rigging LLC 2LN, term loan 3 month U.S. LIBOR + 8.750% 14.5715% 4/16/25 (b)(c)(d)(e) | 5,126 | 4,889 | |
TOTAL CAPITAL GOODS | 85,885 | ||
| Chemicals - 4.1% | |||
| A-Gas Finco, Inc. Tranche B 1LN, term loan CME Term SOFR 1 Month Index + 5.250% 10.5594% 12/14/29 (b)(c)(d) | 17,675 | 16,998 | |
| ARC Falcon I, Inc.: | |||
| Tranche B 1LN, term loan CME Term SOFR 1 Month Index + 3.750% 8.9157% 9/30/28 (b)(c)(d) | 38,359 | 38,311 | |
| Tranche B 2LN, term loan CME Term SOFR 1 Month Index + 7.000% 12.4157% 10/1/29 (b)(c)(d) | 3,385 | 3,038 | |
| Aruba Investment Holdings LLC: | |||
| 1LN, term loan CME Term SOFR 1 Month Index + 4.750% 10.0657% 11/24/27 (b)(c)(d) | 10,379 | 10,093 | |
| 2LN, term loan CME Term SOFR 1 Month Index + 7.750% 13.1657% 11/24/28 (b)(c)(d) | 12,310 | 11,707 | |
| Tranche B 1LN, term loan CME Term SOFR 1 Month Index + 4.000% 9.4157% 11/24/27 (b)(c)(d) | 18,932 | 18,356 | |
| Avient Corp. Tranche B8 1LN, term loan CME Term SOFR 1 Month Index + 2.000% 7.2934% 8/29/29 (b)(c)(d) | 5,888 | 5,903 | |
| Bakelite U.S. Holding Ltd. 1LN, term loan CME Term SOFR 3 Month Index + 4.000% 9.4594% 5/27/29 (b)(c)(d) | 19,393 | 19,454 | |
| Consolidated Energy Finance SA Tranche B 1LN, term loan CME Term SOFR 1 Month Index + 4.500% 9.8157% 11/15/30 (b)(c)(d) | 27,560 | 26,621 | |
| CPC Acquisition Corp. Tranche B 1LN, term loan CME Term SOFR 1 Month Index + 3.750% 9.321% 12/29/27 (b)(c)(d) | 7,689 | 6,482 | |
| Derby Buyer LLC 1LN, term loan CME Term SOFR 1 Month Index + 4.250% 9.5773% 11/1/30 (b)(c)(d) | 17,680 | 17,757 | |
| Discovery Purchaser Corp. 1LN, term loan CME Term SOFR 3 Month Index + 4.370% 9.6813% 10/4/29 (b)(c)(d) | 48,765 | 48,674 | |
| Groupe Solmax, Inc. Tranche B 1LN, term loan CME Term SOFR 3 Month Index + 4.750% 10.2519% 5/27/28 (b)(c)(d) | 27,682 | 27,219 | |
| Herens U.S. Holdco Corp. Tranche B 1LN, term loan CME Term SOFR 3 Month Index + 3.920% 9.3344% 7/3/28 (b)(c)(d) | 19,716 | 18,894 | |
| Hexion Holdings Corp. 1LN, term loan CME Term SOFR 3 Month Index + 4.500% 9.9757% 3/15/29 (b)(c)(d) | 55,130 | 54,105 | |
| Hexion, Inc. 2LN, term loan CME Term SOFR 1 Month Index + 7.430% 12.8532% 3/15/30 (b)(c)(d) | 8,290 | 7,341 | |
| INEOS U.S. Petrochem LLC: | |||
| 1LN, term loan CME Term SOFR 1 Month Index + 3.750% 9.1657% 3/1/30 (b)(c)(d) | 7,780 | 7,756 | |
| Tranche B 1LN, term loan CME Term SOFR 1 Month Index + 4.250% 9.6657% 4/2/29 (b)(c)(d) | 35,772 | 35,638 | |
| Manchester Acquisition Sub LLC Tranche B 1LN, term loan CME Term SOFR 3 Month Index + 5.750% 11.2413% 12/1/26 (b)(c)(d) | 16,216 | 15,162 | |
| Nouryon U.S.A. LLC Tranche B 1LN, term loan: | |||
| CME Term SOFR 1 Month Index + 4.000% 9.4191% 4/3/28 (b)(c)(d) | 26,443 | 26,493 | |
| CME Term SOFR 1 Month Index + 4.000% 9.4234% 4/3/28 (b)(c)(d) | 9,865 | 9,873 | |
| Olympus Water U.S. Holding Corp. Tranche B 1LN, term loan: | |||
| CME Term SOFR 1 Month Index + 4.250% 9.5764% 11/9/28 (b)(c)(d) | 26,154 | 26,236 | |
| CME Term SOFR 3 Month Index + 3.750% 9.321% 11/9/28 (b)(c)(d) | 30,049 | 30,091 | |
| SCIH Salt Holdings, Inc. Tranche B 1LN, term loan CME Term SOFR 3 Month Index + 4.000% 9.4418% 3/16/27 (b)(c)(d) | 11,320 | 11,339 | |
| The Chemours Co. LLC Tranche B2 1LN, term loan CME Term SOFR 1 Month Index + 3.500% 8.8157% 8/18/28 (b)(c)(d) | 47,669 | 47,580 | |
| Touchdown Acquirer, Inc. Tranche B 1LN, term loan: | |||
| CME Term SOFR 1 Month Index + 4.000% 1% 2/7/31 (b)(c)(d) | 2,872 | 2,882 | |
| CME Term SOFR 1 Month Index + 4.000% 9.314% 2/21/31 (b)(c)(d) | 13,118 | 13,163 | |
| U.S. Coatings Acquisition, Inc. Tranche B6 1LN, term loan CME Term SOFR 1 Month Index + 2.000% 7.3295% 12/20/29 (b)(c)(d) | 5,889 | 5,904 | |
| W.R. Grace Holding LLC Tranche B 1LN, term loan CME Term SOFR 3 Month Index + 3.750% 9.321% 9/22/28 (b)(c)(d) | 17,316 | 17,316 | |
TOTAL CHEMICALS | 580,386 | ||
| Consumer Products - 2.4% | |||
| 19Th Holdings Golf LLC Tranche B 1LN, term loan CME Term SOFR 1 Month Index + 3.250% 8.6734% 2/7/29 (b)(c)(d) | 28,697 | 28,285 | |
| Aip Rd Buyer Corp.: | |||
| 1LN, term loan CME Term SOFR 1 Month Index + 4.250% 9.5802% 12/22/28 (b)(c)(d) | 9,119 | 9,121 | |
| Tranche B 1LN, term loan CME Term SOFR 1 Month Index + 5.000% 9.8185% 12/26/28 (b)(c)(d) | 19,222 | 19,294 | |
| BCPE Empire Holdings, Inc. 1LN, term loan CME Term SOFR 1 Month Index + 4.000% 9.3157% 12/25/28 (b)(c)(d) | 39,927 | 40,024 | |
| Bombardier Recreational Products, Inc.: | |||
| Tranche B3 1LN, term loan CME Term SOFR 1 Month Index + 2.750% 8.0657% 12/13/29 (b)(c)(d) | 13,385 | 13,391 | |
| Tranche B4 1LN, term loan CME Term SOFR 1 Month Index + 2.750% 8.0657% 1/22/31 (b)(c)(d) | 14,247 | 14,247 | |
| CNT Holdings I Corp. Tranche B 1LN, term loan CME Term SOFR 1 Month Index + 3.500% 8.8295% 11/8/27 (b)(c)(d) | 26,503 | 26,573 | |
| Conair Holdings LLC Tranche B 1LN, term loan CME Term SOFR 1 Month Index + 3.750% 9.1802% 5/17/28 (b)(c)(d) | 13,735 | 13,622 | |
| Foundation Building Materials, Inc. Tranche B2 1LN, term loan CME Term SOFR 1 Month Index + 4.000% 9.3295% 1/29/31 (b)(c)(d) | 32,425 | 32,638 | |
| Gloves Buyer, Inc. Tranche B 1LN, term loan CME Term SOFR 1 Month Index + 4.000% 9.4418% 1/6/28 (b)(c)(d) | 1,519 | 1,518 | |
| Kodiak BP LLC Tranche B2 1LN, term loan CME Term SOFR 1 Month Index + 3.750% 9.0594% 3/13/28 (b)(c)(d) | 6,675 | 6,696 | |
| Kronos Acquisition Holdings, Inc. Tranche B 1LN, term loan CME Term SOFR 3 Month Index + 3.750% 9.3135% 12/22/26 (b)(c)(d) | 18,647 | 18,663 | |
| Mattress Firm, Inc. Tranche B 1LN, term loan CME Term SOFR 3 Month Index + 4.250% 9.8135% 9/24/28 (b)(c)(d) | 32,620 | 32,681 | |
| Runner Buyer, Inc. Tranche B 1LN, term loan CME Term SOFR 3 Month Index + 5.500% 10.9576% 10/21/28 (b)(c)(d) | 12,604 | 8,769 | |
| Sweetwater Borrower LLC Tranche B 1LN, term loan CME Term SOFR 1 Month Index + 4.250% 9.6802% 8/5/28 (b)(c)(d) | 31,982 | 32,022 | |
| Windsor Holdings III, LLC Tranche B 1LN, term loan CME Term SOFR 1 Month Index + 4.000% 9.3188% 8/1/30 (b)(c)(d) | 30,366 | 30,594 | |
| Woof Holdings LLC: | |||
| Tranche B 1LN, term loan CME Term SOFR 1 Month Index + 3.750% 9.321% 12/21/27 (b)(c)(d) | 14,367 | 11,143 | |
| Tranche B 2LN, term loan CME Term SOFR 3 Month Index + 7.250% 12.6729% 12/21/28 (b)(c)(d) | 2,135 | 843 | |
TOTAL CONSUMER PRODUCTS | 340,124 | ||
| Containers - 1.7% | |||
| AOT Packaging Products AcquisitionCo LLC 1LN, term loan CME Term SOFR 1 Month Index + 3.250% 8.6802% 3/3/28 (b)(c)(d) | 37,018 | 36,565 | |
| Berlin Packaging, LLC Tranche B 1LN, term loan: | |||
| CME Term SOFR 3 Month Index + 3.250% 8.5866% 3/11/28 (b)(c)(d) | 23,810 | 23,661 | |
| CME Term SOFR 3 Month Index + 3.750% 9.1971% 3/11/28 (b)(c)(d) | 10,514 | 10,515 | |
| Berry Global, Inc. Tranche AA 1LN, term loan CME Term SOFR 1 Month Index + 1.750% 7.1819% 7/1/29 (b)(c)(d) | 24,425 | 24,483 | |
| Canister International Group, Inc. 1LN, term loan CME Term SOFR 1 Month Index + 4.000% 9.3157% 3/22/29 (b)(c)(d) | 145 | 146 | |
| Charter Next Generation, Inc. Tranche B 1LN, term loan CME Term SOFR 1 Month Index + 3.500% 8.8157% 12/1/27 (b)(c)(d) | 24,247 | 24,331 | |
| Graham Packaging Co., Inc. Tranche B 1LN, term loan CME Term SOFR 1 Month Index + 3.000% 8.4302% 8/4/27 (b)(c)(d) | 18,142 | 18,175 | |
| Kloeckner Pentaplast of America, Inc. Tranche B 1LN, term loan CME Term SOFR 6 Month Index + 4.750% 10.2675% 2/9/26 (b)(c)(d) | 25,004 | 22,421 | |
| LC Ahab U.S. Bidco LLC Tranche B 1LN, term loan CME Term SOFR 1 Month Index + 3.500% 4/14/31 (c)(d)(g) | 8,915 | 8,893 | |
| Pactiv Evergreen Group Holdings, Inc. Tranche B 1LN, term loan: | |||
| CME Term SOFR 1 Month Index + 3.250% 8.6802% 2/5/26 (b)(c)(d) | 9,944 | 9,991 | |
| CME Term SOFR 1 Month Index + 3.250% 8.6802% 9/24/28 (b)(c)(d) | 10,447 | 10,498 | |
| Pregis TopCo Corp. 1LN, term loan: | |||
| CME Term SOFR 1 Month Index + 3.750% 9.0657% 8/3/26 (b)(c)(d) | 17,100 | 17,140 | |
| CME Term SOFR 1 Month Index + 3.750% 9.1802% 8/1/26 (b)(c)(d) | 1,950 | 1,951 | |
| Reynolds Consumer Products LLC Tranche B 1LN, term loan CME Term SOFR 1 Month Index + 1.750% 7.1657% 1/30/27 (b)(c)(d) | 15,745 | 15,784 | |
| Ring Container Technologies Group LLC Tranche B 1LN, term loan CME Term SOFR 1 Month Index + 3.500% 8.9302% 8/12/28 (b)(c)(d) | 9,039 | 9,065 | |
| SupplyOne, Inc. Tranche B 1LN, term loan CME Term SOFR 1 Month Index + 4.250% 3/27/31 (c)(d)(g) | 6,665 | 6,682 | |
TOTAL CONTAINERS | 240,301 | ||
| Diversified Financial Services - 3.7% | |||
| AlixPartners LLP Tranche B 1LN, term loan CME Term SOFR 1 Month Index + 2.750% 7.9302% 2/4/28 (b)(c)(d) | 14,443 | 14,477 | |
| Aretec Group, Inc. 1LN, term loan CME Term SOFR 1 Month Index + 4.500% 9.9157% 8/9/30 (b)(c)(d) | 34,591 | 34,749 | |
| BCP Renaissance Parent LLC Tranche B 1LN, term loan CME Term SOFR 1 Month Index + 3.500% 8.8285% 10/31/28 (b)(c)(d) | 8,906 | 8,937 | |
| Broadstreet Partners, Inc.: | |||
| Tranche B 1LN, term loan CME Term SOFR 1 Month Index + 3.250% 8.6802% 1/27/27 (b)(c)(d) | 6,479 | 6,485 | |
| Tranche B3 1LN, term loan CME Term SOFR 1 Month Index + 4.000% 9.0657% 1/26/29 (b)(c)(d) | 18,159 | 18,205 | |
| Clue Opco LLC Tranche B 1LN, term loan CME Term SOFR 1 Month Index + 4.500% 9.8295% 12/19/30 (b)(c)(d) | 26,158 | 25,450 | |
| DXP Enterprises, Inc. Tranche B 1LN, term loan CME Term SOFR 1 Month Index + 4.750% 10.2906% 10/6/30 (b)(c)(d) | 8,099 | 8,130 | |
| Eagle 4 Ltd. Tranche B 1LN, term loan CME Term SOFR 3 Month Index + 3.750% 9.321% 7/12/28 (b)(c)(d) | 5,720 | 5,727 | |
| FinCo I LLC Tranche B 1LN, term loan CME Term SOFR 1 Month Index + 3.000% 8.3295% 6/27/29 (b)(c)(d) | 4,683 | 4,694 | |
| Fleet U.S. Bidco, Inc. Tranche B 1LN, term loan CME Term SOFR 1 Month Index + 3.250% 8.5657% 2/3/31 (b)(c)(d) | 14,130 | 14,165 | |
| Focus Financial Partners LLC: | |||
| Tranche B 1LN, term loan CME Term SOFR 1 Month Index + 2.500% 7.8302% 6/24/28 (b)(c)(d) | 13,840 | 13,819 | |
| Tranche B7 1LN, term loan CME Term SOFR 1 Month Index + 2.750% 8.0657% 6/30/28 (b)(c)(d) | 27,046 | 27,035 | |
| Fugue Finance LLC Tranche B 1LN, term loan CME Term SOFR 1 Month Index + 3.750% 9.0738% 2/26/31 (b)(c)(d) | 16,635 | 16,692 | |
| GTCR W-2 Merger Sub LLC Tranche B 1LN, term loan CME Term SOFR 1 Month Index + 3.000% 8.3094% 1/31/31 (b)(c)(d) | 84,290 | 84,448 | |
| HarbourVest Partners LLC Tranche B 1LN, term loan CME Term SOFR 1 Month Index + 2.500% 7.8432% 4/22/30 (b)(c)(d) | 19,411 | 19,411 | |
| Heubach Holding U.S.A. LLC Tranche CME, term loan CME Term SOFR 1 Month Index + 10.000% 15.5868% 5/6/24 (b)(c)(d)(e) | 2,940 | 2,499 | |
| Hightower Holding LLC Tranche B 1LN, term loan CME Term SOFR 3 Month Index + 4.000% 9.5861% 4/21/28 (b)(c)(d) | 21,345 | 21,412 | |
| IVI America LLC Tranche B 1LN, term loan CME Term SOFR 1 Month Index + 4.500% 3/10/31 (c)(d)(g) | 7,690 | 7,676 | |
| Jane Street Group LLC Tranche B 1LN, term loan CME Term SOFR 1 Month Index + 2.500% 7.9302% 1/26/28 (b)(c)(d) | 16,283 | 16,292 | |
| LSF11 Trinity Bidco, Inc. Tranche B 1LN, term loan CME Term SOFR 1 Month Index + 4.000% 9.3154% 6/17/30 (b)(c)(d) | 4,265 | 4,284 | |
| Needle Holdings LLC 1LN, term loan CME Term SOFR 1 Month Index + 9.500% 14.83% 4/28/28 (b)(c)(d) | 9,086 | 8,632 | |
| Nexus Buyer LLC: | |||
| 2LN, term loan CME Term SOFR 1 Month Index + 6.250% 11.6657% 11/1/29 (b)(c)(d) | 14,420 | 14,325 | |
| Tranche B 1LN, term loan: | |||
CME Term SOFR 1 Month Index + 3.750% 9.1657% 11/8/26 (b)(c)(d) | 26,359 | 26,307 | |
CME Term SOFR 1 Month Index + 4.500% 9.8157% 12/13/28 (b)(c)(d) | 15,287 | 15,185 | |
| Recess Holdings, Inc. Tranche B 1LN, term loan CME Term SOFR 1 Month Index + 4.500% 9.8432% 2/14/30 (b)(c)(d) | 16,180 | 16,220 | |
| Sk Neptune Husky Finance Sarl Tranche B 1LN, term loan CME Term SOFR 3 Month Index + 5.000% 10.4338% 1/3/29 (b)(c)(d) | 11,865 | 161 | |
| TransUnion LLC: | |||
| Tranche B 1LN, term loan CME Term SOFR 1 Month Index + 2.000% 7.3273% 12/1/28 (b)(c)(d) | 12,181 | 12,190 | |
| Tranche B5 1LN, term loan CME Term SOFR 1 Month Index + 1.750% 7.1657% 11/16/26 (b)(c)(d) | 21,846 | 21,857 | |
| UFC Holdings LLC Tranche B 1LN, term loan CME Term SOFR 1 Month Index + 2.750% 8.3361% 4/29/26 (b)(c)(d) | 9,667 | 9,682 | |
| WH Borrower LLC Tranche B 1LN, term loan: | |||
| CME Term SOFR 1 Month Index + 5.500% 10.8171% 2/9/27 (b)(c)(d) | 23,367 | 23,139 | |
| CME Term SOFR 1 Month Index + 5.500% 10.8171% 2/15/27 (b)(c)(d) | 22,659 | 22,489 | |
TOTAL DIVERSIFIED FINANCIAL SERVICES | 524,774 | ||
| Diversified Media - 0.8% | |||
| Advantage Sales & Marketing, Inc. Tranche B 1LN, term loan CME Term SOFR 1 Month Index + 4.250% 9.818% 10/28/27 (b)(c)(d) | 21,912 | 21,861 | |
| Allen Media LLC Tranche B 1LN, term loan CME Term SOFR 3 Month Index + 5.500% 10.9594% 2/10/27 (b)(c)(d) | 39,487 | 35,160 | |
| CMG Media Corp. Tranche B 1LN, term loan CME Term SOFR 3 Month Index + 3.500% 8.9094% 12/17/26 (b)(c)(d) | 60,285 | 50,764 | |
TOTAL DIVERSIFIED MEDIA | 107,785 | ||
| Energy - 2.4% | |||
| Apro LLC Tranche B 1LN, term loan CME Term SOFR 1 Month Index + 3.750% 9.1879% 11/14/26 (b)(c)(d) | 17,530 | 17,534 | |
| Array Technologies, Inc. Tranche B 1LN, term loan CME Term SOFR 3 Month Index + 3.250% 8.8362% 10/14/27 (b)(c)(d) | 23,497 | 23,468 | |
| BW Gas & Convenience Holdings LLC Tranche B 1LN, term loan CME Term SOFR 3 Month Index + 3.500% 8.9302% 3/17/28 (b)(c)(d) | 8,956 | 8,912 | |
| Calpine Construction Finance Co. LP Tranche B 1LN, term loan CME Term SOFR 1 Month Index + 2.250% 7.5657% 7/20/30 (b)(c)(d) | 7,139 | 7,132 | |
| Delek U.S. Holdings, Inc. Tranche B 1LN, term loan CME Term SOFR 1 Month Index + 3.500% 8.9183% 11/19/29 (b)(c)(d) | 28,952 | 28,961 | |
| EG America LLC Tranche BC 1LN, term loan CME Term SOFR 1 Month Index + 5.500% 11.2383% 2/7/28 (b)(c)(d) | 53,116 | 52,219 | |
| Enstall Group BV Tranche B 1LN, term loan CME Term SOFR 3 Month Index + 4.750% 10.571% 8/27/28 (b)(c)(d) | 14,737 | 14,221 | |
| Epic Y-Grade Services,LP Tranche B 1LN, term loan CME Term SOFR 1 Month Index + 5.750% 11.0521% 6/29/29 (b)(c)(d) | 24,370 | 24,061 | |
| GIP II Blue Holding LP Tranche B 1LN, term loan CME Term SOFR 1 Month Index + 3.750% 9.0657% 9/29/28 (b)(c)(d) | 44,152 | 44,366 | |
| GIP III Stetson I LP Tranche B 1LN, term loan CME Term SOFR 1 Month Index + 4.250% 9.6802% 10/5/28 (b)(c)(d) | 19,920 | 19,970 | |
| Natgasoline LLC Tranche B, term loan CME Term SOFR 1 Month Index + 3.500% 8.9302% 11/14/25 (b)(c)(d) | 11,160 | 11,104 | |
| New Fortress Energy, Inc. Tranche B 1LN, term loan CME Term SOFR 1 Month Index + 5.000% 10.3295% 10/30/28 (b)(c)(d) | 55,675 | 55,894 | |
| Par Petroleum LLC Tranche B 1LN, term loan CME Term SOFR 1 Month Index + 3.750% 9.0518% 2/28/30 (b)(c)(d) | 19,411 | 19,452 | |
| Prairie ECI Acquiror LP Tranche 1LN, term loan CME Term SOFR 1 Month Index + 4.750% 10.0657% 8/1/29 (b)(c)(d) | 9,820 | 9,822 | |
| Win Waste Innovations Holdings Tranche B 1LN, term loan CME Term SOFR 1 Month Index + 2.750% 8.1802% 3/25/28 (b)(c)(d) | 9,620 | 9,060 | |
TOTAL ENERGY | 346,176 | ||
| Entertainment/Film - 0.3% | |||
| AP Core Holdings II LLC: | |||
| Tranche B1 1LN, term loan CME Term SOFR 1 Month Index + 5.500% 10.9302% 9/1/27 (b)(c)(d) | 15,011 | 14,527 | |
| Tranche B2 1LN, term loan CME Term SOFR 1 Month Index + 5.500% 10.9302% 9/1/27 (b)(c)(d) | 24,560 | 23,725 | |
TOTAL ENTERTAINMENT/FILM | 38,252 | ||
| Environmental - 0.5% | |||
| Clean Harbors, Inc. Tranche B 1LN, term loan CME Term SOFR 1 Month Index + 1.750% 7.1802% 10/8/28 (b)(c)(d) | 11,501 | 11,529 | |
| Covanta Holding Corp.: | |||
| Tranche B 1LN, term loan: | |||
CME Term SOFR 1 Month Index + 2.500% 7.8157% 11/30/28 (b)(c)(d) | 10,283 | 10,278 | |
CME Term SOFR 1 Month Index + 2.750% 8.0707% 11/30/28 (b)(c)(d) | 11,455 | 11,458 | |
| Tranche C 1LN, term loan: | |||
CME Term SOFR 1 Month Index + 2.500% 7.8273% 11/30/28 (b)(c)(d) | 786 | 786 | |
CME Term SOFR 1 Month Index + 2.750% 8.0707% 11/30/28 (b)(c)(d) | 626 | 626 | |
| Madison IAQ LLC Tranche B 1LN, term loan CME Term SOFR 1 Month Index + 3.250% 8.6799% 6/21/28 (b)(c)(d) | 37,813 | 37,808 | |
TOTAL ENVIRONMENTAL | 72,485 | ||
| Food & Drug Retail - 0.7% | |||
| Cardenas Merger Sub, LLC 1LN, term loan CME Term SOFR 6 Month Index + 6.750% 12.1594% 8/1/29 (b)(c)(d) | 25,060 | 25,171 | |
| Froneri U.S., Inc. Tranche B 1LN, term loan CME Term SOFR 1 Month Index + 2.250% 7.6657% 2/1/27 (b)(c)(d) | 12,717 | 12,725 | |
| JP Intermediate B LLC term loan CME Term SOFR 1 Month Index + 5.500% 11.0743% 11/20/27 (b)(c)(d) | 18,384 | 1,590 | |
| Northeast Grocery, Inc. Tranche B 1LN, term loan CME Term SOFR 1 Month Index + 7.500% 12.8257% 12/13/28 (b)(c)(d) | 11,810 | 11,790 | |
| Primary Products Finance LLC Tranche B 1LN, term loan CME Term SOFR 1 Month Index + 3.500% 8.9521% 4/2/29 (b)(c)(d) | 24,761 | 24,745 | |
| Upfield U.S.A. Corp. Tranche B 1LN, term loan CME Term SOFR 1 Month Index + 4.750% 10.2131% 1/3/28 (b)(c)(d) | 27,630 | 27,603 | |
TOTAL FOOD & DRUG RETAIL | 103,624 | ||
| Food/Beverage/Tobacco - 1.5% | |||
| 8th Avenue Food & Provisions, Inc.: | |||
| 2LN, term loan CME Term SOFR 1 Month Index + 7.750% 13.1802% 10/1/26 (b)(c)(d) | 2,240 | 2,009 | |
| Tranche B 1LN, term loan CME Term SOFR 1 Month Index + 3.750% 9.1802% 10/1/25 (b)(c)(d) | 4,342 | 4,171 | |
| Aspire Bakeries Holdings LLC Tranche B 1LN, term loan CME Term SOFR 1 Month Index + 4.250% 9.5654% 12/23/30 (b)(c)(d) | 6,560 | 6,571 | |
| Chobani LLC Tranche B 1LN, term loan: | |||
| CME Term SOFR 1 Month Index + 3.500% 8.6802% 10/23/27 (b)(c)(d) | 20,215 | 20,291 | |
| CME Term SOFR 1 Month Index + 3.750% 9.071% 10/25/27 (b)(c)(d) | 8,987 | 9,030 | |
| Del Monte Foods, Inc. Tranche B 1LN, term loan CME Term SOFR 1 Month Index + 4.250% 9.6802% 5/16/29 (b)(c)(d) | 43,721 | 36,944 | |
| Fiesta Purchaser, Inc. Tranche B 1LN, term loan CME Term SOFR 1 Month Index + 4.000% 9.3169% 2/12/31 (b)(c)(d) | 22,910 | 22,987 | |
| Naked Juice LLC: | |||
| 1LN, term loan CME Term SOFR 3 Month Index + 3.250% 8.6594% 1/24/29 (b)(c)(d) | 38,168 | 36,820 | |
| 2LN, term loan CME Term SOFR 3 Month Index + 6.000% 11.4019% 1/24/30 (b)(c)(d) | 11,985 | 10,007 | |
| Saratoga Food Specialties LLC Tranche B 1LN, term loan CME Term SOFR 1 Month Index + 3.750% 3/1/29 (c)(d)(g) | 8,130 | 8,150 | |
| Triton Water Holdings, Inc. Tranche B 1LN, term loan CME Term SOFR 1 Month Index + 3.250% 8.8135% 3/31/28 (b)(c)(d) | 55,730 | 55,471 | |
TOTAL FOOD/BEVERAGE/TOBACCO | 212,451 | ||
| Gaming - 4.5% | |||
| Caesars Entertainment, Inc.: | |||
| Tranche B 1LN, term loan CME Term SOFR 1 Month Index + 3.250% 8.6657% 1/26/30 (b)(c)(d) | 102,881 | 102,984 | |
| Tranche B1 1LN, term loan CME Term SOFR 1 Month Index + 2.750% 8.0657% 2/6/31 (b)(c)(d) | 62,465 | 62,496 | |
| Entain Holdings Gibraltar Ltd.: | |||
| Tranche B2 1LN, term loan CME Term SOFR 3 Month Index + 3.500% 8.9094% 10/31/29 (b)(c)(d) | 13,778 | 13,801 | |
| Tranche B4 1LN, term loan CME Term SOFR 3 Month Index + 2.250% 7.9094% 3/16/27 (b)(c)(d) | 12,788 | 12,791 | |
| Entain PLC Tranche B 1LN, term loan CME Term SOFR 1 Month Index + 2.750% 10/31/29 (c)(d)(g) | 19,490 | 19,524 | |
| Fertitta Entertainment LLC NV Tranche B 1LN, term loan CME Term SOFR 1 Month Index + 4.000% 9.069% 1/27/29 (b)(c)(d) | 156,489 | 156,770 | |
| Flutter Financing B.V. Tranche B 1LN, term loan CME Term SOFR 1 Month Index + 2.250% 7.5594% 11/25/30 (b)(c)(d) | 58,636 | 58,688 | |
| Golden Entertainment, Inc. Tranche B 1LN, term loan CME Term SOFR 1 Month Index + 2.750% 8.1682% 5/26/30 (b)(c)(d) | 26,475 | 26,475 | |
| J&J Ventures Gaming LLC: | |||
| 1LN, term loan CME Term SOFR 3 Month Index + 4.000% 9.4302% 4/26/28 (b)(c)(d) | 12,129 | 12,075 | |
| Tranche B 1LN, term loan CME Term SOFR 1 Month Index + 4.250% 9.6802% 4/26/28 (b)(c)(d) | 14,197 | 14,091 | |
| Light & Wonder International, Inc. Tranche B 1LN, term loan CME Term SOFR 1 Month Index + 2.750% 8.071% 4/16/29 (b)(c)(d) | 25,053 | 25,074 | |
| Ontario Gaming GTA LP Tranche B 1LN, term loan CME Term SOFR 1 Month Index + 4.250% 9.5594% 8/1/30 (b)(c)(d) | 18,299 | 18,387 | |
| PCI Gaming Authority 1LN, term loan CME Term SOFR 1 Month Index + 2.500% 7.9302% 5/29/26 (b)(c)(d) | 3,362 | 3,368 | |
| Penn Entertainment, Inc. Tranche B 1LN, term loan CME Term SOFR 1 Month Index + 2.750% 8.1657% 5/3/29 (b)(c)(d) | 10,139 | 10,143 | |
| Scientific Games Holdings LP term loan CME Term SOFR 3 Month Index + 3.500% 8.5563% 4/4/29 (b)(c)(d) | 49,651 | 49,643 | |
| Station Casinos LLC Tranche B 1LN, term loan CME Term SOFR 1 Month Index + 2.250% 7.5657% 3/14/31 (b)(c)(d) | 45,350 | 45,330 | |
TOTAL GAMING | 631,640 | ||
| Healthcare - 5.9% | |||
| Accelerated Health Systems LLC Tranche B1 LN, term loan CME Term SOFR 3 Month Index + 4.250% 9.7019% 2/15/29 (b)(c)(d) | 13,536 | 10,506 | |
| AHP Health Partners, Inc. Tranche B 1LN, term loan CME Term SOFR 1 Month Index + 3.500% 8.9302% 8/24/28 (b)(c)(d) | 14,419 | 14,443 | |
| Avantor Funding, Inc. Tranche B6 1LN, term loan CME Term SOFR 1 Month Index + 2.000% 7.4157% 11/8/27 (b)(c)(d) | 9,839 | 9,862 | |
| Catalent Pharma Solutions Tranche B4 1LN, term loan CME Term SOFR 1 Month Index + 3.000% 8.3154% 2/22/28 (b)(c)(d) | 11,230 | 11,272 | |
| Charlotte Buyer, Inc. Tranche B 1LN, term loan CME Term SOFR 1 Month Index + 5.250% 10.5707% 2/12/28 (b)(c)(d) | 30,517 | 30,633 | |
| DaVita, Inc. Tranche B1 1LN, term loan CME Term SOFR 1 Month Index + 2.000% 4/25/31 (c)(d)(g) | 25,085 | 24,928 | |
| Elanco Animal Health, Inc. Tranche B 1LN, term loan CME Term SOFR 1 Month Index + 1.750% 7.1773% 8/1/27 (b)(c)(d) | 15,754 | 15,717 | |
| Electron BidCo, Inc. Tranche B 1LN, term loan CME Term SOFR 1 Month Index + 3.000% 8.4302% 11/1/28 (b)(c)(d) | 11,946 | 11,963 | |
| Embecta Corp. Tranche B 1LN, term loan CME Term SOFR 1 Month Index + 3.000% 8.3157% 3/31/29 (b)(c)(d) | 26,461 | 23,161 | |
| Endo Finance Holdings, Inc. 1LN, term loan CME Term SOFR 1 Month Index + 4.500% 9.8264% 4/23/31 (b)(c)(d) | 22,135 | 22,052 | |
| Gainwell Acquisition Corp. Tranche B 1LN, term loan CME Term SOFR 3 Month Index + 4.000% 9.4094% 10/1/27 (b)(c)(d) | 91,907 | 87,513 | |
| HAH Group Holding Co. LLC: | |||
| 1LN, term loan: | |||
CME Term SOFR 1 Month Index + 5.000% 10.42% 10/29/27 (b)(c)(d) | 4,560 | 4,554 | |
CME Term SOFR 3 Month Index + 5.000% 10.42% 10/29/27 (b)(c)(d) | 19,621 | 19,596 | |
| Tranche DD 1LN, term loan CME Term SOFR 3 Month Index + 5.000% 10.42% 10/29/27 (b)(c)(d) | 577 | 576 | |
| ICU Medical, Inc. Tranche B 1LN, term loan CME Term SOFR 1 Month Index + 2.500% 7.9519% 1/6/29 (b)(c)(d) | 16,809 | 16,788 | |
| Insulet Corp. Tranche B 1LN, term loan CME Term SOFR 1 Month Index + 3.000% 8.3157% 5/4/28 (b)(c)(d) | 69,058 | 69,231 | |
| Jazz Financing Lux SARL Tranche B 1LN, term loan CME Term SOFR 1 Month Index + 3.000% 8.4302% 5/5/28 (b)(c)(d) | 49,238 | 49,515 | |
| MED ParentCo LP Tranche B 1LN, term loan CME Term SOFR 1 Month Index + 4.000% 9.3157% 4/5/31 (b)(c)(d) | 21,068 | 21,073 | |
| Medline Borrower LP Tranche B 1LN, term loan CME Term SOFR 1 Month Index + 2.750% 8.0683% 10/23/28 (b)(c)(d) | 101,201 | 101,425 | |
| National Mentor Holdings, Inc.: | |||
| Tranche B 1LN, term loan CME Term SOFR 1 Month Index + 3.750% 9.1802% 3/2/28 (b)(c)(d) | 13,296 | 12,086 | |
| Tranche C 1LN, term loan CME Term SOFR 3 Month Index + 3.750% 9.1594% 3/2/28 (b)(c)(d) | 225 | 204 | |
| Organon & Co. Tranche B 1LN, term loan CME Term SOFR 3 Month Index + 3.000% 8.4334% 6/2/28 (b)(c)(d) | 37,823 | 37,976 | |
| Pacific Dental Services, Inc. Tranche B 1LN, term loan CME Term SOFR 1 Month Index + 3.250% 8.571% 3/17/31 (b)(c)(d) | 10,770 | 10,777 | |
| Packaging Coordinators Midco, Inc. Tranche B 1LN, term loan CME Term SOFR 3 Month Index + 3.500% 9.071% 11/30/27 (b)(c)(d) | 31,706 | 31,795 | |
| Perrigo Investments LLC Tranche B 1LN, term loan CME Term SOFR 1 Month Index + 2.500% 7.6802% 4/20/29 (b)(c)(d) | 21,086 | 21,000 | |
| Phoenix Guarantor, Inc. term loan CME Term SOFR 1 Month Index + 3.250% 8.5657% 2/21/31 (b)(c)(d) | 18,275 | 18,135 | |
| Phoenix Newco, Inc. Tranche B 1LN, term loan CME Term SOFR 1 Month Index + 3.250% 8.6918% 11/15/28 (b)(c)(d) | 62,968 | 63,133 | |
| RadNet Management, Inc. Tranche B 1LN, term loan CME Term SOFR 1 Month Index + 2.500% 7.8269% 4/10/31 (b)(c)(d) | 8,700 | 8,676 | |
| Surgery Center Holdings, Inc. 1LN, term loan CME Term SOFR 1 Month Index + 3.500% 8.8154% 12/19/30 (b)(c)(d) | 18,504 | 18,601 | |
| U.S. Anesthesia Partners, Inc.: | |||
| 2LN, term loan CME Term SOFR 1 Month Index + 7.500% 12.9418% 10/1/29 (b)(c)(d)(e) | 2,820 | 2,397 | |
| Tranche B 1LN, term loan CME Term SOFR 1 Month Index + 4.250% 9.6918% 10/1/28 (b)(c)(d) | 4,972 | 4,803 | |
| U.S. Radiology Specialists, Inc. Tranche B 1LN, term loan 3 month U.S. LIBOR + 5.250% 10.7019% 12/15/27 (b)(c)(d) | 14,694 | 14,709 | |
| Upstream Newco, Inc. 1LN, term loan 1 month U.S. LIBOR + 4.250% 9.8407% 11/20/26 (b)(c)(d) | 4,415 | 4,037 | |
| VetStrategy Canada Holdings, Inc. Tranche B 1LN, term loan CME Term SOFR 1 Month Index + 5.500% 10.8094% 11/16/28 (b)(c)(d) | 27,975 | 27,996 | |
| WCG Intermediate Corp. Tranche B 1LN, term loan CME Term SOFR 1 Month Index + 4.000% 9.4418% 1/8/27 (b)(c)(d) | 18,013 | 18,059 | |
TOTAL HEALTHCARE | 839,192 | ||
| Homebuilders/Real Estate - 0.7% | |||
| Chromalloy Corp. Tranche B 1LN, term loan CME Term SOFR 1 Month Index + 3.750% 9.0576% 3/21/31 (b)(c)(d) | 12,250 | 12,306 | |
| Cushman & Wakefield U.S. Borrower LLC Tranche B 1LN, term loan: | |||
| CME Term SOFR 1 Month Index + 2.750% 8.1802% 8/21/25 (b)(c)(d) | 1,291 | 1,288 | |
| CME Term SOFR 1 Month Index + 3.250% 8.6657% 1/31/30 (b)(c)(d) | 19,251 | 19,275 | |
| CME Term SOFR 1 Month Index + 3.750% 9.0657% 1/31/30 (b)(c)(d) | 7,342 | 7,360 | |
| Fluidra Finco SL Tranche B 1LN, term loan CME Term SOFR 1 Month Index + 2.000% 7.3407% 1/27/29 (b)(c)(d) | 11,213 | 11,193 | |
| Greystar Real Estate Partners Tranche B 1LN, term loan CME Term SOFR 1 Month Index + 3.250% 8.5757% 8/21/30 (b)(c)(d) | 9,368 | 9,380 | |
| Jones DesLauriers Insurance Management, Inc. Tranche B 1LN, term loan CME Term SOFR 1 Month Index + 3.500% 8.8295% 3/15/30 (b)(c)(d) | 11,751 | 11,768 | |
| Rockwood Service Corp. Tranche B 1LN, term loan CME Term SOFR 1 Month Index + 4.000% 9.6802% 1/23/27 (b)(c)(d) | 8,169 | 8,207 | |
| Ryan Specialty Group LLC Tranche B 1LN, term loan CME Term SOFR 1 Month Index + 2.750% 8.0657% 9/1/27 (b)(c)(d) | 18,664 | 18,683 | |
TOTAL HOMEBUILDERS/REAL ESTATE | 99,460 | ||
| Hotels - 1.6% | |||
| BRE/Everbright M6 Borrower LLC Tranche B 1LN, term loan CME Term SOFR 1 Month Index + 5.000% 10.424% 9/9/26 (b)(c)(d) | 8,616 | 8,631 | |
| Four Seasons Hotels Ltd. Tranche B 1LN, term loan CME Term SOFR 1 Month Index + 2.000% 7.3157% 11/30/29 (b)(c)(d) | 31,700 | 31,726 | |
| Hilton Grand Vacations Borrower LLC Tranche B 1LN, term loan: | |||
| CME Term SOFR 1 Month Index + 2.750% 8.0657% 1/17/31 (b)(c)(d) | 17,870 | 17,900 | |
| CME Term SOFR 1 Month Index + 3.000% 7.8157% 8/2/28 (b)(c)(d) | 72,915 | 72,961 | |
| Hilton Worldwide Finance LLC Tranche B 1LN, term loan CME Term SOFR 1 Month Index + 2.000% 7.4169% 11/8/30 (b)(c)(d) | 21,135 | 21,174 | |
| Marriott Ownership Resorts, Inc. Tranche B 1LN, term loan CME Term SOFR 1 Month Index + 2.250% 7.5657% 4/1/31 (b)(c)(d) | 27,581 | 27,547 | |
| Playa Resorts Holding BV Tranche B 1LN, term loan CME Term SOFR 1 Month Index + 4.250% 8.5654% 1/5/29 (b)(c)(d) | 19,933 | 20,003 | |
| Travelport Finance Luxembourg SARL 1LN, term loan CME Term SOFR 1 Month Index + 7.000% 13.5635% 9/29/28 (b)(c)(d) | 18,005 | 16,540 | |
| Wyndham Hotels & Resorts, Inc. Tranche B 1LN, term loan CME Term SOFR 1 Month Index + 2.250% 7.6657% 5/25/30 (b)(c)(d) | 9,452 | 9,473 | |
TOTAL HOTELS | 225,955 | ||
| Insurance - 5.9% | |||
| Acrisure LLC: | |||
| Tranche B 1LN, term loan: | |||
CME Term SOFR 1 Month Index + 3.500% 8.9302% 2/15/27 (b)(c)(d) | 64,450 | 64,318 | |
CME Term SOFR 1 Month Index + 4.250% 9.6802% 2/15/27 (b)(c)(d) | 13,892 | 13,909 | |
| Tranche B-2 1LN, term loan CME Term SOFR 1 Month Index + 3.750% 9.1802% 2/15/27 (b)(c)(d) | 11,700 | 11,700 | |
| Tranche B5 1LN, term loan CME Term SOFR 1 Month Index + 4.500% 9.8157% 11/6/30 (b)(c)(d) | 77,451 | 77,597 | |
| Alliant Holdings Intermediate LLC Tranche B6 1LN, term loan CME Term SOFR 1 Month Index + 3.500% 8.8189% 11/6/30 (b)(c)(d) | 47,835 | 48,008 | |
| AmWINS Group, Inc. Tranche B 1LN, term loan: | |||
| CME Term SOFR 1 Month Index + 2.250% 7.6946% 2/19/28 (b)(c)(d) | 22,397 | 22,419 | |
| CME Term SOFR 1 Month Index + 2.750% 8.1946% 2/19/28 (b)(c)(d) | 5,979 | 5,989 | |
| Amynta Agency Borrower, Inc. Tranche B 1LN, term loan CME Term SOFR 1 Month Index + 4.250% 9.5519% 2/28/28 (b)(c)(d) | 18,553 | 18,603 | |
| AssuredPartners, Inc. Tranche B5 1LN, term loan CME Term SOFR 1 Month Index + 3.500% 8.8157% 2/14/31 (b)(c)(d) | 53,440 | 53,666 | |
| Asurion LLC: | |||
| 1LN, term loan CME Term SOFR 3 Month Index + 4.000% 9.4157% 8/19/28 (b)(c)(d) | 33,475 | 32,471 | |
| Tranche B11 1LN, term loan CME Term SOFR 1 Month Index + 4.250% 9.6657% 8/19/28 (b)(c)(d) | 58,769 | 57,236 | |
| Tranche B3 2LN, term loan CME Term SOFR 1 Month Index + 5.250% 10.6802% 1/31/28 (b)(c)(d) | 63,158 | 57,355 | |
| Tranche B4 2LN, term loan CME Term SOFR 1 Month Index + 5.250% 10.6802% 1/20/29 (b)(c)(d) | 72,741 | 65,306 | |
| Tranche B8 1LN, term loan CME Term SOFR 1 Month Index + 3.250% 8.6802% 12/23/26 (b)(c)(d) | 43,239 | 42,218 | |
| Tranche B9 1LN, term loan CME Term SOFR 1 Month Index + 3.250% 8.6802% 7/31/27 (b)(c)(d) | 32,537 | 31,561 | |
| HUB International Ltd. Tranche B 1LN, term loan CME Term SOFR 1 Month Index + 3.250% 8.5745% 6/20/30 (b)(c)(d) | 83,788 | 84,204 | |
| Truist Insurance Holdings LLC: | |||
| 2L, term loan CME Term SOFR 1 Month Index + 4.750% 3/8/32 (c)(d)(g) | 44,480 | 44,842 | |
| Tranche B 1LN, term loan CME Term SOFR 1 Month Index + 3.250% 3/22/31 (c)(d)(g) | 52,520 | 52,619 | |
| USI, Inc. Tranche B 1LN, term loan: | |||
| CME Term SOFR 1 Month Index + 3.000% 8.3019% 11/22/29 (b)(c)(d) | 43,564 | 43,649 | |
| CME Term SOFR 1 Month Index + 3.250% 8.5519% 9/27/30 (b)(c)(d) | 9,846 | 9,870 | |
TOTAL INSURANCE | 837,540 | ||
| Leisure - 2.6% | |||
| Alterra Mountain Co.: | |||
| 1LN, term loan CME Term SOFR 1 Month Index + 3.250% 8.5773% 8/17/28 (b)(c)(d) | 18,090 | 18,150 | |
| Tranche B 1LN, term loan CME Term SOFR 1 Month Index + 3.500% 8.8273% 5/31/30 (b)(c)(d) | 1,340 | 1,347 | |
| America Sports Co. Tranche B 1LN, term loan CME Term SOFR 1 Month Index + 3.250% 8.5757% 2/17/31 (b)(c)(d) | 10,255 | 10,277 | |
| Arcis Golf LLC Tranche B 1LN, term loan CME Term SOFR 1 Month Index + 3.750% 9.1802% 11/24/28 (b)(c)(d) | 11,214 | 11,228 | |
| Carnival Corp. Tranche B 1LN, term loan: | |||
| CME Term SOFR 1 Month Index + 2.750% 8.0669% 8/9/27 (b)(c)(d) | 16,924 | 17,009 | |
| CME Term SOFR 1 Month Index + 2.750% 8.0669% 10/18/28 (b)(c)(d) | 28,858 | 28,948 | |
| City Football Group Ltd. Tranche B 1LN, term loan CME Term SOFR 1 Month Index + 3.000% 8.4389% 7/21/28 (b)(c)(d) | 51,301 | 51,109 | |
| ClubCorp Holdings, Inc. Tranche B 1LN, term loan CME Term SOFR 1 Month Index + 5.000% 10.5635% 9/18/26 (b)(c)(d) | 29,165 | 29,187 | |
| Crown Finance U.S., Inc. 1LN, term loan CME Term SOFR 1 Month Index + 8.500% 13.9302% 7/31/28 (b)(c)(d) | 12,118 | 12,310 | |
| Delta 2 SARL Tranche B 1LN, term loan CME Term SOFR 1 Month Index + 3.000% 7.5594% 1/15/30 (b)(c)(d) | 36,555 | 36,582 | |
| Fitness International LLC Tranche B 1LN, term loan CME Term SOFR 1 Month Index + 5.250% 10.5795% 2/12/29 (b)(c)(d) | 12,015 | 11,835 | |
| Herschend Entertainment Co. LLC Tranche B 1LN, term loan CME Term SOFR 1 Month Index + 3.750% 8.3157% 8/27/28 (b)(c)(d) | 6,537 | 6,541 | |
| Lids Holdings, Inc. 1LN, term loan CME Term SOFR 3 Month Index + 5.500% 10.9795% 12/14/26 (b)(c)(d) | 17,611 | 17,523 | |
| SeaWorld Parks & Entertainment, Inc. Tranche B 1LN, term loan CME Term SOFR 1 Month Index + 2.500% 7.8157% 8/25/28 (b)(c)(d) | 30,232 | 30,188 | |
| Topgolf Callaway Brands Corp. Tranche B 1LN, term loan CME Term SOFR 1 Month Index + 3.000% 8.3157% 3/18/30 (b)(c)(d) | 45,530 | 45,652 | |
| United PF Holdings LLC: | |||
| 1LN, term loan CME Term SOFR 1 Month Index + 4.000% 9.5743% 12/30/26 (b)(c)(d) | 34,361 | 29,860 | |
| 2LN, term loan 3 month U.S. LIBOR + 8.500% 14.0743% 12/30/27 (b)(c)(d) | 3,500 | 2,818 | |
| Tranche B 1LN, term loan CME Term SOFR 1 Month Index + 8.500% 14.0743% 12/30/26 (b)(c)(d) | 3,513 | 3,196 | |
TOTAL LEISURE | 363,760 | ||
| Metals/Mining - 0.1% | |||
| Arsenal AIC Parent LLC Tranche B 1LN, term loan CME Term SOFR 1 Month Index + 3.750% 9.0657% 8/19/30 (b)(c)(d) | 15,860 | 15,960 | |
| Paper - 0.8% | |||
| Ahlstrom-Munksjo OYJ 1LN, term loan CME Term SOFR 3 Month Index + 4.000% 9.571% 2/4/28 (b)(c)(d) | 6,618 | 6,610 | |
| Clydesdale Acquisition Holdings, Inc. 1LN, term loan CME Term SOFR 1 Month Index + 3.670% 9.0907% 4/13/29 (b)(c)(d) | 107,289 | 107,691 | |
TOTAL PAPER | 114,301 | ||
| Publishing/Printing - 0.5% | |||
| Century DE Buyer LLC 1LN, term loan CME Term SOFR 3 Month Index + 4.000% 9.3295% 10/30/30 (b)(c)(d) | 17,585 | 17,647 | |
| Learning Care Group (U.S.) No 2, Inc. Tranche B 1LN, term loan CME Term SOFR 1 Month Index + 4.750% 10.0747% 8/11/28 (b)(c)(d) | 12,234 | 12,251 | |
| MJH Healthcare Holdings LLC Tranche B 1LN, term loan CME Term SOFR 1 Month Index + 3.500% 8.9157% 1/28/29 (b)(c)(d) | 13,077 | 13,060 | |
| RLG Holdings LLC: | |||
| 2LN, term loan CME Term SOFR 1 Month Index + 7.500% 12.9302% 7/2/29 (b)(c)(d) | 2,290 | 2,080 | |
| Tranche B 1LN, term loan CME Term SOFR 1 Month Index + 4.250% 9.6802% 7/8/28 (b)(c)(d) | 8,954 | 8,869 | |
| Vericast Corp. 1LN, term loan CME Term SOFR 3 Month Index + 7.750% 13.321% 6/16/26 (b)(c)(d) | 13,892 | 13,823 | |
TOTAL PUBLISHING/PRINTING | 67,730 | ||
| Railroad - 0.5% | |||
| AIT Worldwide Logistics Holdings, Inc. 1LN, term loan CME Term SOFR 1 Month Index + 4.750% 10.169% 4/6/28 (b)(c)(d) | 16,431 | 16,301 | |
| Genesee & Wyoming, Inc. Tranche B 1LN, term loan CME Term SOFR 1 Month Index + 2.000% 4/10/31 (c)(d)(g) | 24,480 | 24,481 | |
| Wwex Unified Topco Holdings LLC: | |||
| 1LN, term loan CME Term SOFR 1 Month Index + 4.250% 9.571% 7/26/28 (b)(c)(d) | 25,100 | 24,789 | |
| Tranche B 2LN, term loan CME Term SOFR 3 Month Index + 7.000% 12.571% 7/22/29 (b)(c)(d) | 4,920 | 4,379 | |
TOTAL RAILROAD | 69,950 | ||
| Restaurants - 1.2% | |||
| 1011778 BC ULC: | |||
| Tranche B 1LN, term loan CME Term SOFR 1 Month Index + 2.250% 9/23/30 (c)(d)(g) | 7,135 | 7,140 | |
| Tranche B5 1LN, term loan CME Term SOFR 1 Month Index + 2.250% 7.5657% 9/21/30 (b)(c)(d) | 29,805 | 29,826 | |
| Dave & Buster's, Inc. Tranche B 1LN, term loan CME Term SOFR 1 Month Index + 3.250% 8.625% 6/29/29 (b)(c)(d) | 15,536 | 15,577 | |
| Flynn Restaurant Group LP Tranche B 1LN, term loan CME Term SOFR 1 Month Index + 4.250% 9.6918% 12/1/28 (b)(c)(d) | 8,296 | 8,317 | |
| KFC Holding Co. Tranche B 1LN, term loan CME Term SOFR 1 Month Index + 1.750% 7.1834% 3/15/28 (b)(c)(d) | 13,581 | 13,562 | |
| Pacific Bells LLC Tranche B 1LN, term loan CME Term SOFR 3 Month Index + 4.500% 10.0635% 10/20/28 (b)(c)(d) | 10,606 | 10,602 | |
| PFC Acquisition Corp. Tranche B 1LN, term loan CME Term SOFR 3 Month Index + 6.250% 11.7127% 3/1/26 (b)(c)(d) | 12,375 | 12,196 | |
| Restaurant Technologies, Inc. Tranche B 1LN, term loan CME Term SOFR 3 Month Index + 4.250% 9.5519% 4/1/29 (b)(c)(d) | 25,446 | 24,964 | |
| Whatabrands LLC Tranche B 1LN, term loan CME Term SOFR 1 Month Index + 3.000% 8.6802% 8/3/28 (b)(c)(d) | 42,761 | 42,903 | |
TOTAL RESTAURANTS | 165,087 | ||
| Services - 10.9% | |||
| ABG Intermediate Holdings 2 LLC Tranche B1 LN, term loan CME Term SOFR 1 Month Index + 3.500% 8.9183% 12/21/28 (b)(c)(d) | 91,515 | 91,904 | |
| AEA International Holdings Luxembourg SARL Tranche B 1LN, term loan CME Term SOFR 1 Month Index + 3.250% 8.8094% 10/2/28 (b)(c)(d) | 5,406 | 5,419 | |
| AI Aqua Merger Sub, Inc. Tranche B 1LN, term loan: | |||
| CME Term SOFR 1 Month Index + 4.000% 9.324% 7/30/28 (b)(c)(d) | 43,507 | 43,633 | |
| CME Term SOFR 1 Month Index + 4.250% 9.5666% 7/31/28 (b)(c)(d) | 42,095 | 42,284 | |
| Allied Universal Holdco LLC Tranche B 1LN, term loan: | |||
| 1 month U.S. LIBOR + 3.750% 9.1657% 5/14/28 (b)(c)(d) | 71,215 | 71,229 | |
| CME Term SOFR 1 Month Index + 4.750% 10.0657% 5/14/28 (b)(c)(d) | 2,796 | 2,805 | |
| Amentum Government Services Holdings LLC: | |||
| Tranche B 1LN, term loan: | |||
CME Term SOFR 1 Month Index + 4.000% 9.3154% 2/15/29 (b)(c)(d) | 26,525 | 26,558 | |
CME Term SOFR 1 Month Index + 4.000% 9.4302% 1/23/27 (b)(c)(d) | 18,846 | 18,854 | |
| Tranche B 2LN, term loan CME Term SOFR 1 Month Index + 8.750% 14.1802% 1/31/28 (b)(c)(d) | 10,815 | 10,869 | |
| Anticimex Global AB: | |||
| Tranche B 1LN, term loan: | |||
CME Term SOFR 1 Month Index + 3.750% 11/16/28 (c)(d)(g) | 5,050 | 5,072 | |
CME Term SOFR 3 Month Index + 3.900% 8.95% 11/16/28 (b)(c)(d) | 6,427 | 6,431 | |
| Tranche B1 1LN, term loan CME Term SOFR 3 Month Index + 3.500% 8.45% 11/16/28 (b)(c)(d) | 33,117 | 33,151 | |
| APX Group, Inc. Tranche B 1LN, term loan CME Term SOFR 1 Month Index + 3.250% 8.0806% 7/9/28 (b)(c)(d) | 26,767 | 26,767 | |
| Aramark Services, Inc.: | |||
| Tranche B-4 1LN, term loan CME Term SOFR 1 Month Index + 1.750% 7.1802% 1/15/27 (b)(c)(d) | 4,663 | 4,654 | |
| Tranche B7 1LN, term loan CME Term SOFR 1 Month Index + 2.000% 7.3157% 4/6/28 (b)(c)(d) | 26,696 | 26,680 | |
| Tranche B8 1LN, term loan CME Term SOFR 1 Month Index + 2.000% 7.3157% 6/24/30 (b)(c)(d) | 572 | 571 | |
| Archkey Holdings, Inc. Tranche B 1LN, term loan CME Term SOFR 1 Month Index + 5.250% 10.6802% 6/30/28 (b)(c)(d) | 14,895 | 14,876 | |
| Artera Services LLC Tranche B 1LN, term loan CME Term SOFR 1 Month Index + 4.500% 9.8094% 2/10/31 (b)(c)(d) | 23,150 | 23,333 | |
| Ascend Learning LLC: | |||
| 2LN, term loan CME Term SOFR 1 Month Index + 5.750% 11.1657% 12/10/29 (b)(c)(d) | 23,960 | 23,461 | |
| Tranche B 1LN, term loan CME Term SOFR 1 Month Index + 3.500% 8.9157% 12/10/28 (b)(c)(d) | 49,105 | 48,900 | |
| Avis Budget Car Rental LLC Tranche C 1LN, term loan CME Term SOFR 1 Month Index + 3.000% 8.4157% 3/16/29 (b)(c)(d) | 10,953 | 10,898 | |
| Bifm California Buyer, Inc. Tranche 1LN, term loan CME Term SOFR 1 Month Index + 4.250% 9.5657% 5/31/28 (b)(c)(d) | 15,600 | 15,678 | |
| Brand Industrial Services, Inc. Tranche B 1LN, term loan CME Term SOFR 1 Month Index + 4.500% 9.819% 8/1/30 (b)(c)(d) | 69,547 | 69,736 | |
| Brock Holdings Iii LLC Tranche B 1LN, term loan CME Term SOFR 1 Month Index + 6.000% 5/1/30 (c)(d)(g) | 8,775 | 8,753 | |
| Cast & Crew Payroll LLC Tranche B 1LN, term loan: | |||
| CME Term SOFR 1 Month Index + 3.500% 9.1802% 2/7/26 (b)(c)(d) | 31,130 | 31,117 | |
| CME Term SOFR 1 Month Index + 3.750% 9.0657% 12/30/28 (b)(c)(d) | 37,822 | 37,818 | |
| CHG Healthcare Services, Inc. 1LN, term loan: | |||
| CME Term SOFR 1 Month Index + 3.250% 8.6802% 9/30/28 (b)(c)(d) | 5,585 | 5,592 | |
| CME Term SOFR 3 Month Index + 3.750% 9.0909% 9/30/28 (b)(c)(d) | 5,377 | 5,398 | |
| Congruex Group LLC Tranche B 1LN, term loan CME Term SOFR 3 Month Index + 5.750% 11.2295% 5/3/29 (b)(c)(d) | 17,970 | 16,982 | |
| CoreLogic, Inc. Tranche B 1LN, term loan CME Term SOFR 1 Month Index + 3.500% 8.9302% 6/2/28 (b)(c)(d) | 55,599 | 53,514 | |
| EAB Global, Inc. Tranche B 1LN, term loan CME Term SOFR 1 Month Index + 3.500% 8.9302% 8/16/28 (b)(c)(d) | 20,480 | 20,480 | |
| EmployBridge LLC Tranche B 1LN, term loan CME Term SOFR 3 Month Index + 4.750% 10.3138% 7/19/28 (b)(c)(d) | 30,218 | 24,363 | |
| Ensemble RCM LLC Tranche B 1LN, term loan CME Term SOFR 1 Month Index + 3.000% 8.3174% 8/1/29 (b)(c)(d) | 17,554 | 17,600 | |
| Filtration Group Corp.: | |||
| 1LN, term loan CME Term SOFR 1 Month Index + 4.250% 9.6946% 10/19/28 (b)(c)(d) | 9,303 | 9,332 | |
| Tranche B 1LN, term loan CME Term SOFR 1 Month Index + 3.500% 8.9446% 10/21/28 (b)(c)(d) | 11,381 | 11,400 | |
| Flexera Software LLC Tranche B 1LN, term loan CME Term SOFR 1 Month Index + 3.750% 9.1802% 3/3/28 (b)(c)(d) | 27,531 | 27,588 | |
| Franchise Group, Inc. Tranche B 1LN, term loan: | |||
| CME Term SOFR 3 Month Index + 4.750% 10.3433% 3/10/26 (b)(c)(d) | 9,039 | 7,683 | |
| CME Term SOFR 3 Month Index + 4.750% 10.363% 3/10/26 (b)(c)(d) | 30,787 | 26,015 | |
| Galaxy U.S. Opco, Inc. 1LN, term loan CME Term SOFR 1 Month Index + 4.750% 10.0795% 4/29/29 (b)(c)(d) | 22,330 | 19,985 | |
| GEMS MENASA Cayman Ltd. Tranche B 1LN, term loan CME Term SOFR 3 Month Index + 4.750% 10.1946% 7/30/26 (b)(c)(d) | 15,774 | 15,822 | |
| Greeneden U.S. Holdings II LLC Tranche B 1LN, term loan: | |||
| CME Term SOFR 1 Month Index + 3.500% 8.8157% 12/1/27 (b)(c)(d) | 13,643 | 13,689 | |
| CME Term SOFR 1 Month Index + 3.750% 9.1802% 12/1/27 (b)(c)(d) | 8,229 | 8,271 | |
| HomeServe U.S.A. Corp. Tranche B 1LN, term loan CME Term SOFR 1 Month Index + 3.000% 8.3188% 10/13/30 (b)(c)(d) | 22,840 | 22,907 | |
| Ion Trading Finance Ltd. Tranche B 1LN, term loan CME Term SOFR 3 Month Index + 4.750% 10.1519% 4/1/28 (b)(c)(d) | 22,919 | 22,914 | |
| KNS Acquisitions, Inc. Tranche B 1LN, term loan CME Term SOFR 1 Month Index + 6.250% 11.6802% 4/21/27 (b)(c)(d) | 17,487 | 15,007 | |
| KUEHG Corp. 1LN, term loan CME Term SOFR 1 Month Index + 5.000% 10.3019% 6/12/30 (b)(c)(d) | 67,606 | 67,754 | |
| Life Time, Inc. Tranche B 1LN, term loan CME Term SOFR 1 Month Index + 4.000% 9.5911% 1/15/26 (b)(c)(d) | 2,315 | 2,324 | |
| Neptune BidCo U.S., Inc.: | |||
| term loan CME Term SOFR 1 Month Index + 4.750% 10.1559% 10/11/28 (b)(c)(d) | 2,923 | 2,726 | |
| Tranche B 1LN, term loan CME Term SOFR 1 Month Index + 5.000% 10.4059% 4/11/29 (b)(c)(d) | 78,161 | 73,298 | |
| Omnia Partners LLC Tranche B 1LN, term loan CME Term SOFR 1 Month Index + 3.750% 9.0745% 7/25/30 (b)(c)(d) | 28,409 | 28,549 | |
| Optiv Security, Inc. Tranche B 1LN, term loan CME Term SOFR 1 Month Index + 5.250% 10.5745% 8/14/26 (b)(c)(d) | 24,818 | 23,801 | |
| PG Investment Co. 59 Sarl Tranche B 1LN, term loan CME Term SOFR 1 Month Index + 3.500% 8.8125% 3/24/31 (b)(c)(d) | 29,245 | 29,342 | |
| Planet U.S. Buyer LLC Tranche B 1LN, term loan CME Term SOFR 1 Month Index + 3.500% 8.8143% 2/10/31 (b)(c)(d) | 18,790 | 18,860 | |
| Sabert Corp. Tranche B 1LN, term loan CME Term SOFR 1 Month Index + 3.750% 9.1834% 12/16/26 (b)(c)(d) | 9,691 | 9,720 | |
| Sedgwick Claims Management Services, Inc. Tranche B 1LN, term loan CME Term SOFR 1 Month Index + 3.750% 9.0657% 2/24/28 (b)(c)(d) | 10,370 | 10,405 | |
| Sotheby's Tranche B 1LN, term loan CME Term SOFR 1 Month Index + 4.500% 10.0902% 1/15/27 (b)(c)(d) | 22,192 | 21,605 | |
| Spin Holdco, Inc. Tranche B 1LN, term loan CME Term SOFR 3 Month Index + 4.000% 9.5854% 3/4/28 (b)(c)(d) | 104,258 | 91,698 | |
| Staples, Inc. Tranche B 1LN, term loan 3 month U.S. LIBOR + 5.000% 10.4432% 4/16/26 (b)(c)(d) | 6,249 | 6,165 | |
| STS Operating, Inc. 1LN, term loan CME Term SOFR 1 Month Index + 4.000% 9.42% 3/25/31 (b)(c)(d) | 33,970 | 34,253 | |
| The GEO Group, Inc. Tranche B 1LN, term loan CME Term SOFR 1 Month Index + 5.250% 10.5689% 4/4/29 (b)(c)(d) | 17,920 | 18,129 | |
| Uber Technologies, Inc. Tranche B 1LN, term loan CME Term SOFR 3 Month Index + 3.000% 8.0793% 3/3/30 (b)(c)(d) | 30,850 | 31,034 | |
| United Rentals North America, Inc. Tranche B 1LN, term loan CME Term SOFR 1 Month Index + 1.750% 7.0657% 2/14/31 (b)(c)(d) | 14,370 | 14,418 | |
| Vestis Corp. Tranche B 1LN, term loan CME Term SOFR 1 Month Index + 2.250% 7.5757% 2/24/31 (b)(c)(d) | 8,040 | 8,045 | |
| WMB Holdings, Inc. Tranche B 1LN, term loan CME Term SOFR 1 Month Index + 3.250% 8.0657% 11/3/29 (b)(c)(d) | 4,903 | 4,913 | |
TOTAL SERVICES | 1,543,032 | ||
| Steel - 0.1% | |||
| Zekelman Industries, Inc. Tranche B 1LN, term loan CME Term SOFR 1 Month Index + 2.250% 7.5682% 1/24/31 (b)(c)(d) | 11,527 | 11,526 | |
| Super Retail - 2.9% | |||
| Academy Ltd. Tranche B 1LN, term loan CME Term SOFR 1 Month Index + 3.750% 9.1932% 11/6/27 (b)(c)(d) | 6,137 | 6,126 | |
| At Home Group, Inc. Tranche B 1LN, term loan CME Term SOFR 1 Month Index + 4.250% 9.6932% 7/24/28 (b)(c)(d) | 17,367 | 9,291 | |
| BJ's Wholesale Club, Inc. Tranche B 1LN, term loan CME Term SOFR 1 Month Index + 2.000% 7.3193% 2/3/29 (b)(c)(d) | 10,200 | 10,232 | |
| Empire Today LLC Tranche B 1LN, term loan CME Term SOFR 1 Month Index + 5.000% 10.5911% 4/1/28 (b)(c)(d) | 14,459 | 10,049 | |
| Great Outdoors Group LLC Tranche B 1LN, term loan CME Term SOFR 1 Month Index + 3.750% 9.1802% 3/5/28 (b)(c)(d) | 309,451 | 309,283 | |
| Harbor Freight Tools U.S.A., Inc. Tranche B 1LN, term loan CME Term SOFR 1 Month Index + 2.750% 8.1802% 10/19/27 (b)(c)(d) | 7,505 | 7,507 | |
| LBM Acquisition LLC Tranche B 1LN, term loan CME Term SOFR 1 Month Index + 3.750% 9.1773% 12/18/27 (b)(c)(d) | 21,011 | 21,020 | |
| Michaels Companies, Inc. 1LN, term loan CME Term SOFR 3 Month Index + 4.250% 9.821% 4/15/28 (b)(c)(d) | 23,240 | 21,624 | |
| RH: | |||
| Tranche B 1LN, term loan CME Term SOFR 1 Month Index + 2.500% 7.9302% 10/20/28 (b)(c)(d) | 6,654 | 6,486 | |
| Tranche B2 1LN, term loan CME Term SOFR 1 Month Index + 3.250% 8.6657% 10/20/28 (b)(c)(d) | 9,239 | 9,079 | |
TOTAL SUPER RETAIL | 410,697 | ||
| Technology - 15.0% | |||
| A&V Holdings Midco LLC Tranche B 1LN, term loan CME Term SOFR 3 Month Index + 5.370% 10.987% 3/10/27 (b)(c)(d) | 14,828 | 14,759 | |
| Acuris Finance U.S., Inc. 1LN, term loan CME Term SOFR 3 Month Index + 4.000% 9.4519% 2/16/28 (b)(c)(d) | 7,455 | 7,452 | |
| Ahead DB Holdings LLC Tranche B 1LN, term loan: | |||
| CME Term SOFR 1 Month Index + 3.750% 2/3/31 (c)(d)(g) | 3,185 | 3,188 | |
| CME Term SOFR 1 Month Index + 4.250% 9.5594% 1/24/31 (b)(c)(d) | 10,275 | 10,326 | |
| Alliance Laundry Systems LLC Tranche B 1LN, term loan CME Term SOFR 3 Month Index + 3.500% 8.8997% 10/8/27 (b)(c)(d) | 9,761 | 9,788 | |
| Anastasia Parent LLC Tranche B, term loan CME Term SOFR 3 Month Index + 3.750% 9.321% 8/10/25 (b)(c)(d) | 37,017 | 25,835 | |
| Applied Systems, Inc.: | |||
| Tranche 2LN, term loan CME Term SOFR 1 Month Index + 5.250% 10.5594% 2/23/32 (b)(c)(d) | 2,380 | 2,456 | |
| Tranche B 1LN, term loan CME Term SOFR 1 Month Index + 3.500% 8.8094% 2/24/31 (b)(c)(d) | 32,058 | 32,275 | |
| Athenahealth Group, Inc. Tranche B 1LN, term loan CME Term SOFR 1 Month Index + 3.500% 8.5657% 2/15/29 (b)(c)(d) | 81,546 | 81,342 | |
| AZZ, Inc. Tranche B 1LN, term loan CME Term SOFR 1 Month Index + 3.250% 8.5657% 5/11/29 (b)(c)(d) | 16,856 | 16,931 | |
| Boxer Parent Co., Inc. Tranche B 1LN, term loan CME Term SOFR 1 Month Index + 4.250% 9.5802% 12/29/28 (b)(c)(d) | 6,818 | 6,856 | |
| BYJU's Alpha, Inc.: | |||
| term loan: | |||
CME Term SOFR 3 Month Index + 8.000% 4/3/26 (c)(d)(e)(g) | 178 | 178 | |
CME Term SOFR 3 Month Index + 8.000% 4/3/26 (c)(d)(e)(g) | 178 | 178 | |
| Tranche B 1LN, term loan 3 month U.S. LIBOR + 8.000% 15.5% 11/24/26 (b)(c)(d) | 25,614 | 4,482 | |
| Camelot U.S. Acquisition LLC Tranche B 1LN, term loan CME Term SOFR 1 Month Index + 2.750% 8.0657% 1/31/31 (b)(c)(d) | 47,574 | 47,648 | |
| Central Parent, Inc. Tranche B 1LN, term loan CME Term SOFR 3 Month Index + 4.000% 9.3094% 7/6/29 (b)(c)(d) | 30,034 | 30,141 | |
| Cloud Software Group, Inc.: | |||
| Tranche A 1LN, term loan CME Term SOFR 3 Month Index + 4.500% 9.9094% 9/30/28 (b)(c)(d) | 5,820 | 5,814 | |
| Tranche B 1LN, term loan: | |||
CME Term SOFR 1 Month Index + 4.500% 9.9094% 3/30/29 (b)(c)(d) | 80,275 | 80,242 | |
CME Term SOFR 1 Month Index + 4.500% 9.9285% 3/24/31 (b)(c)(d) | 10,405 | 10,382 | |
| Coherent Corp. Tranche B 1LN, term loan CME Term SOFR 1 Month Index + 2.500% 7.8287% 7/2/29 (b)(c)(d) | 41,053 | 41,168 | |
| CommScope, Inc. Tranche B 1LN, term loan CME Term SOFR 1 Month Index + 3.250% 8.6802% 4/4/26 (b)(c)(d) | 25,734 | 22,592 | |
| ConnectWise LLC Tranche B 1LN, term loan CME Term SOFR 1 Month Index + 3.500% 9.0635% 9/30/28 (b)(c)(d) | 36,754 | 36,769 | |
| Constant Contact, Inc. Tranche B 1LN, term loan CME Term SOFR 1 Month Index + 4.000% 9.5605% 2/10/28 (b)(c)(d) | 15,298 | 14,883 | |
| Cotiviti, Inc.: | |||
| Tranche 1LN, term loan 7.625% 2/24/31 (d) | 8,930 | 8,848 | |
| Tranche B 1LN, term loan CME Term SOFR 1 Month Index + 3.250% 2/21/31 (c)(d)(g) | 53,470 | 53,514 | |
| Dayforce, Inc. Tranche B 1LN, term loan CME Term SOFR 1 Month Index + 2.500% 7.8157% 3/3/31 (b)(c)(d) | 12,210 | 12,225 | |
| DCert Buyer, Inc.: | |||
| 1LN, term loan CME Term SOFR 1 Month Index + 4.000% 9.3157% 10/16/26 (b)(c)(d) | 64,204 | 64,005 | |
| Tranche B 2LN, term loan CME Term SOFR 3 Month Index + 7.000% 12.3157% 2/19/29 (b)(c)(d) | 16,677 | 14,958 | |
| DG Investment Intermediate Holdings, Inc.: | |||
| 2LN, term loan CME Term SOFR 1 Month Index + 6.750% 12.1802% 3/31/29 (b)(c)(d) | 2,490 | 2,344 | |
| Tranche B 1LN, term loan: | |||
CME Term SOFR 1 Month Index + 3.750% 9.1802% 3/31/28 (b)(c)(d) | 15,194 | 15,121 | |
CME Term SOFR 1 Month Index + 4.750% 10.0657% 3/31/28 (b)(c)(d) | 5,890 | 5,886 | |
| ECL Entertainment LLC: | |||
| Tranche B 1LN, term loan CME Term SOFR 1 Month Index + 4.750% 10.0657% 8/31/30 (b)(c)(d) | 7,602 | 7,620 | |
| Tranche B 1LN, term loan CME Term SOFR 1 Month Index + 4.000% 8/7/30 (c)(d)(g) | 1,630 | 1,634 | |
| Epicor Software Corp.: | |||
| 1LN, term loan CME Term SOFR 1 Month Index + 3.750% 9.0773% 7/31/27 (b)(c)(d) | 4,025 | 4,045 | |
| Tranche B 1LN, term loan CME Term SOFR 1 Month Index + 3.250% 8.6918% 7/31/27 (b)(c)(d) | 20,788 | 20,862 | |
| Gen Digital, Inc. Tranche B 1LN, term loan CME Term SOFR 1 Month Index + 2.000% 7.4157% 9/12/29 (b)(c)(d) | 51,600 | 51,645 | |
| Go Daddy Operating Co. LLC Tranche B5 1LN, term loan CME Term SOFR 1 Month Index + 2.000% 7.3157% 11/12/29 (b)(c)(d) | 17,325 | 17,324 | |
| Helios Software Holdings, Inc. Tranche B 1LN, term loan CME Term SOFR 1 Month Index + 3.750% 9.0519% 7/15/30 (b)(c)(d) | 9,051 | 9,013 | |
| Icon Luxembourg Sarl Tranche B 1LN, term loan: | |||
| CME Term SOFR 1 Month Index + 2.000% 7.3094% 7/3/28 (b)(c)(d) | 49,050 | 49,224 | |
| CME Term SOFR 1 Month Index + 2.000% 7.3094% 7/3/28 (b)(c)(d) | 12,221 | 12,264 | |
| McAfee Corp. Tranche B 1LN, term loan CME Term SOFR 1 Month Index + 3.750% 9.1773% 3/1/29 (b)(c)(d) | 68,216 | 68,226 | |
| MH Sub I LLC: | |||
| Tranche B 1LN, term loan CME Term SOFR 1 Month Index + 4.250% 9.5657% 5/3/28 (b)(c)(d) | 117,417 | 116,937 | |
| Tranche B 2LN, term loan CME Term SOFR 1 Month Index + 6.250% 11.5657% 2/23/29 (b)(c)(d) | 12,580 | 12,410 | |
| MKS Instruments, Inc. Tranche B 1LN, term loan CME Term SOFR 1 Month Index + 2.500% 7.8234% 8/17/29 (b)(c)(d) | 33,561 | 33,582 | |
| Modena Buyer LLC 1LN, term loan CME Term SOFR 1 Month Index + 4.500% 4/21/31 (c)(d)(g) | 67,350 | 65,877 | |
| NCR Atleos Corp. Tranche B 1LN, term loan CME Term SOFR 1 Month Index + 4.750% 10.1795% 3/27/29 (b)(c)(d) | 27,110 | 27,234 | |
| Open Text Corp. Tranche B 1LN, term loan CME Term SOFR 1 Month Index + 2.750% 8.1773% 1/31/30 (b)(c)(d) | 43,112 | 43,208 | |
| Peraton Corp. Tranche B 1LN, term loan CME Term SOFR 1 Month Index + 3.750% 9.1657% 2/1/28 (b)(c)(d) | 98,417 | 98,399 | |
| Pitney Bowes, Inc. Tranche B 1LN, term loan CME Term SOFR 1 Month Index + 4.000% 9.4302% 3/19/28 (b)(c)(d) | 11,595 | 11,546 | |
| Polaris Newco LLC Tranche B 1LN, term loan CME Term SOFR 1 Month Index + 4.000% 9.5911% 6/2/28 (b)(c)(d) | 142,722 | 141,753 | |
| Project Alpha Intermediate Holding, Inc. Tranche B 1LN, term loan CME Term SOFR 1 Month Index + 4.750% 10.0627% 10/26/30 (b)(c)(d) | 33,190 | 33,292 | |
| Project Boost Purchaser LLC: | |||
| 1LN, term loan CME Term SOFR 1 Month Index + 3.500% 8.9302% 5/30/26 (b)(c)(d) | 12,019 | 12,039 | |
| Tranche B 1LN, term loan CME Term SOFR 1 Month Index + 3.500% 8.9566% 5/30/26 (b)(c)(d) | 7,112 | 7,124 | |
| Proofpoint, Inc. Tranche B 1LN, term loan CME Term SOFR 1 Month Index + 3.250% 8.6946% 8/31/28 (b)(c)(d) | 43,160 | 43,335 | |
| Rackspace Finance LLC Tranche B 1LN, term loan: | |||
| CME Term SOFR 1 Month Index + 2.750% 8.186% 5/15/28 (b)(c)(d) | 27,385 | 12,615 | |
| CME Term SOFR 1 Month Index + 6.250% 11.686% 5/15/28 (b)(c)(d) | 6,378 | 6,354 | |
| RealPage, Inc. Tranche B 1LN, term loan CME Term SOFR 1 Month Index + 3.000% 8.4302% 4/22/28 (b)(c)(d) | 43,826 | 42,213 | |
| Red Planet Borrower LLC Tranche B 1LN, term loan CME Term SOFR 1 Month Index + 3.750% 9.1657% 9/30/28 (b)(c)(d) | 36,326 | 35,536 | |
| Renaissance Holdings Corp. Tranche 1LN, term loan CME Term SOFR 1 Month Index + 4.250% 9.5773% 4/8/30 (b)(c)(d) | 45,881 | 45,893 | |
| Roper Industrial Products Investment Co. 1LN, term loan CME Term SOFR 1 Month Index + 4.000% 9.3019% 11/22/29 (b)(c)(d) | 11,368 | 11,453 | |
| Sophia LP Tranche B 1LN, term loan CME Term SOFR 1 Month Index + 3.500% 8.9157% 10/7/29 (b)(c)(d) | 34,051 | 34,142 | |
| Sovos Compliance LLC Tranche B 1LN, term loan CME Term SOFR 1 Month Index + 4.500% 9.9302% 8/11/28 (b)(c)(d) | 26,160 | 25,815 | |
| SS&C Technologies, Inc.: | |||
| Tranche B 3LN, term loan 3 month U.S. LIBOR + 1.750% 7.1802% 4/16/25 (b)(c)(d) | 6,807 | 6,805 | |
| Tranche B 4LN, term loan CME Term SOFR 1 Month Index + 1.750% 7.1802% 4/16/25 (b)(c)(d) | 6,427 | 6,425 | |
| Tranche B 5LN, term loan CME Term SOFR 1 Month Index + 1.750% 7.1802% 4/16/25 (b)(c)(d) | 30,388 | 30,381 | |
| Tranche B6 1LN, term loan CME Term SOFR 1 Month Index + 2.250% 7.6657% 3/22/29 (b)(c)(d) | 4,094 | 4,099 | |
| Tranche B7 1LN, term loan CME Term SOFR 1 Month Index + 2.250% 7.6657% 3/22/29 (b)(c)(d) | 9,676 | 9,688 | |
| Tempo Acquisition LLC Tranche B 1LN, term loan CME Term SOFR 1 Month Index + 2.750% 8.0657% 8/31/28 (b)(c)(d) | 12,503 | 12,534 | |
| TTM Technologies, Inc. Tranche B 1LN, term loan CME Term SOFR 1 Month Index + 2.750% 8.0773% 5/30/30 (b)(c)(d) | 12,833 | 12,833 | |
| UKG, Inc. Tranche B 1LN, term loan CME Term SOFR 1 Month Index + 3.500% 8.8143% 2/10/31 (b)(c)(d) | 130,134 | 130,697 | |
| Verscend Holding Corp. Tranche B 1LN, term loan CME Term SOFR 1 Month Index + 4.000% 9.4446% 8/27/25 (b)(c)(d) | 15,562 | 15,566 | |
| VFH Parent LLC Tranche B 1LN, term loan CME Term SOFR 1 Month Index + 3.000% 8.4157% 1/13/29 (b)(c)(d) | 23,916 | 23,879 | |
| VM Consolidated, Inc. Tranche B2 1LN, term loan CME Term SOFR 1 Month Index + 2.750% 8.0657% 3/27/28 (b)(c)(d) | 18,273 | 18,328 | |
| VS Buyer LLC Tranche B 1LN, term loan CME Term SOFR 1 Month Index + 3.250% 8.569% 4/4/31 (b)(c)(d) | 19,436 | 19,473 | |
| Weber-Stephen Products LLC Tranche B 1LN, term loan: | |||
| CME Term SOFR 1 Month Index + 3.250% 8.6802% 10/30/27 (b)(c)(d) | 8,255 | 7,591 | |
| CME Term SOFR 1 Month Index + 4.250% 9.6657% 10/30/27 (b)(c)(d) | 5,679 | 5,225 | |
| Webpros Investments Sarl Tranche B 1LN, term loan CME Term SOFR 1 Month Index + 4.000% 9.3165% 3/19/31 (b)(c)(d) | 6,610 | 6,643 | |
| Zelis Payments Buyer, Inc. Tranche B 1LN, term loan CME Term SOFR 1 Month Index + 2.750% 8.0657% 9/28/29 (b)(c)(d) | 27,755 | 27,780 | |
TOTAL TECHNOLOGY | 2,123,147 | ||
| Telecommunications - 3.1% | |||
| Altice Financing SA Tranche B 1LN, term loan CME Term SOFR 1 Month Index + 5.000% 10.3286% 10/31/27 (b)(c)(d) | 11,685 | 10,575 | |
| Altice France SA Tranche B14 1LN, term loan CME Term SOFR 1 Month Index + 5.500% 10.8286% 8/15/28 (b)(c)(d) | 78,288 | 58,496 | |
| Aventiv Technologies LLC: | |||
| 1LN, term loan: | |||
CME Term SOFR 3 Month Index + 5.090% 10.661% 7/31/25 (b)(c)(d) | 36,246 | 26,731 | |
13.071% 7/31/25 (b)(c)(d) | 959 | 963 | |
| Tranche 2LN, term loan CME Term SOFR 1 Month Index + 8.650% 14.221% 11/1/25 (b)(c)(d) | 30,988 | 4,881 | |
| Ciena Corp. Tranche B 1LN, term loan CME Term SOFR 1 Month Index + 2.000% 7.3154% 10/24/30 (b)(c)(d) | 6,361 | 6,372 | |
| Connect U.S. Finco LLC Tranche B 1LN, term loan CME Term SOFR 1 Month Index + 4.500% 9.8302% 9/13/29 (b)(c)(d) | 16,004 | 15,504 | |
| Consolidated Communications, Inc. Tranche B 1LN, term loan CME Term SOFR 1 Month Index + 3.500% 8.9302% 10/2/27 (b)(c)(d) | 16,633 | 15,570 | |
| Crown Subsea Communications Holding, Inc. Tranche B 1LN, term loan CME Term SOFR 1 Month Index + 4.750% 10.0674% 1/30/31 (b)(c)(d) | 42,840 | 43,108 | |
| Eos U.S. Finco LLC 1LN, term loan CME Term SOFR 3 Month Index + 6.000% 11.3094% 10/6/29 (b)(c)(d) | 6,954 | 4,920 | |
| Frontier Communications Holdings LLC Tranche B 1LN, term loan CME Term SOFR 1 Month Index + 3.750% 9.1802% 10/8/27 (b)(c)(d) | 52,506 | 52,300 | |
| GTT Communications, Inc. 1LN, term loan CME Term SOFR 3 Month Index + 9.000% 14.4094% 6/30/28 (b)(c)(d) | 5,351 | 3,766 | |
| Gtt Remainco LLC 1LN, term loan CME Term SOFR 1 Month Index + 7.000% 12.4183% 12/30/27 (b)(c)(d) | 6,461 | 5,879 | |
| Lorca Co.-Borrower LLC Tranche B 1LN, term loan CME Term SOFR 1 Month Index + 3.500% 4/17/31 (c)(d)(g) | 8,855 | 8,899 | |
| Patagonia Holdco LLC Tranche B 1LN, term loan CME Term SOFR 3 Month Index + 5.750% 11.0643% 8/1/29 (b)(c)(d) | 16,943 | 15,677 | |
| Radiate Holdco LLC Tranche B 1LN, term loan CME Term SOFR 1 Month Index + 3.250% 8.6802% 9/25/26 (b)(c)(d) | 32,880 | 26,386 | |
| SBA Senior Finance II, LLC Tranche B 1LN, term loan CME Term SOFR 1 Month Index + 2.000% 7.32% 1/27/31 (b)(c)(d) | 18,484 | 18,540 | |
| Windstream Services LLC Tranche B 1LN, term loan CME Term SOFR 1 Month Index + 6.250% 11.6657% 9/21/27 (b)(c)(d) | 25,555 | 25,438 | |
| Zayo Group Holdings, Inc. 1LN, term loan: | |||
| CME Term SOFR 1 Month Index + 3.000% 8.4302% 3/9/27 (b)(c)(d) | 82,130 | 70,876 | |
| CME Term SOFR 1 Month Index + 4.320% 9.6407% 3/9/27 (b)(c)(d) | 21,364 | 18,796 | |
TOTAL TELECOMMUNICATIONS | 433,677 | ||
| Textiles/Apparel - 0.4% | |||
| Crocs, Inc. Tranche B 1LN, term loan CME Term SOFR 1 Month Index + 2.250% 7.5773% 2/20/29 (b)(c)(d) | 21,692 | 21,768 | |
| Fanatics Commerce Intermediate Holdco LLC Tranche B 1LN, term loan CME Term SOFR 3 Month Index + 3.250% 8.6802% 11/23/28 (b)(c)(d) | 11,321 | 11,275 | |
| Tory Burch LLC Tranche B 1LN, term loan CME Term SOFR 1 Month Index + 3.500% 8.6918% 4/16/28 (b)(c)(d) | 16,723 | 16,716 | |
TOTAL TEXTILES/APPAREL | 49,759 | ||
| Transportation Ex Air/Rail - 0.1% | |||
| ASP LS Acquisition Corp.: | |||
| 2LN, term loan CME Term SOFR 3 Month Index + 7.500% 13.071% 5/7/29 (b)(c)(d) | 2,965 | 2,435 | |
| Tranche B 1LN, term loan CME Term SOFR 3 Month Index + 4.500% 10.071% 5/7/28 (b)(c)(d) | 13,003 | 12,158 | |
TOTAL TRANSPORTATION EX AIR/RAIL | 14,593 | ||
| Utilities - 1.2% | |||
| Brookfield WEC Holdings, Inc. Tranche B 1LN, term loan CME Term SOFR 1 Month Index + 2.750% 8.0657% 1/20/31 (b)(c)(d) | 58,854 | 58,879 | |
| ExGen Renewables IV, LLC Tranche B 1LN, term loan 3 month U.S. LIBOR + 2.500% 8.1048% 12/15/27 (b)(c)(d) | 3,480 | 3,476 | |
| Osmose Utilities Services, Inc. Tranche B 1LN, term loan CME Term SOFR 1 Month Index + 3.250% 8.6802% 6/23/28 (b)(c)(d) | 14,211 | 13,965 | |
| PG&E Corp. Tranche B 1LN, term loan CME Term SOFR 1 Month Index + 3.000% 7.8302% 6/23/27 (b)(c)(d) | 15,370 | 15,384 | |
| Pike Corp. Tranche B 1LN, term loan CME Term SOFR 1 Month Index + 3.000% 8.4302% 1/21/28 (b)(c)(d) | 15,389 | 15,429 | |
| Vertiv Group Corp. Tranche B 1LN, term loan CME Term SOFR 1 Month Index + 2.500% 7.9432% 3/2/27 (b)(c)(d) | 38,605 | 38,718 | |
| Vistra Operations Co. LLC Tranche B 3LN, term loan CME Term SOFR 1 Month Index + 2.000% 7.3302% 12/20/30 (b)(c)(d) | 26,117 | 26,129 | |
TOTAL UTILITIES | 171,980 | ||
| TOTAL BANK LOAN OBLIGATIONS (Cost $12,531,980) | 12,309,481 | ||
| Nonconvertible Bonds - 4.4% | |||
Principal Amount (a) (000s) | Value ($) (000s) | ||
| Aerospace - 0.1% | |||
| TransDigm, Inc. 6.375% 3/1/29 (h) | 19,405 | 19,257 | |
| Air Transportation - 0.0% | |||
| American Airlines, Inc. / AAdvantage Loyalty IP Ltd. 5.5% 4/20/26 (h) | 2,860 | 2,827 | |
| Delta Air Lines, Inc. / SkyMiles IP Ltd. 4.5% 10/20/25 (h) | 1,433 | 1,413 | |
TOTAL AIR TRANSPORTATION | 4,240 | ||
| Automotive & Auto Parts - 0.8% | |||
| Clarios Global LP / Clarios U.S. Finance Co. 6.75% 5/15/28 (h) | 7,810 | 7,826 | |
| Ford Motor Credit Co. LLC U.S. Secured Overnight Fin. Rate (SOFR) Index + 2.950% 8.2871% 3/6/26 (b)(c) | 16,070 | 16,602 | |
| Rivian Holdco & Rivian LLC & Rivian Automotive LLC CME Term SOFR 6 Month Index + 6.020% 11.3101% 10/15/26 (b)(c)(h) | 87,765 | 86,448 | |
TOTAL AUTOMOTIVE & AUTO PARTS | 110,876 | ||
| Broadcasting - 0.5% | |||
| DISH Network Corp. 11.75% 11/15/27 (h) | 36,525 | 36,819 | |
| Univision Communications, Inc.: | |||
| 6.625% 6/1/27 (h) | 26,085 | 25,172 | |
| 8% 8/15/28 (h) | 6,375 | 6,367 | |
TOTAL BROADCASTING | 68,358 | ||
| Building Materials - 0.1% | |||
| Smyrna Ready Mix Concrete LLC 8.875% 11/15/31 (h) | 11,790 | 12,417 | |
| SRS Distribution, Inc. 4.625% 7/1/28 (h) | 660 | 658 | |
TOTAL BUILDING MATERIALS | 13,075 | ||
| Cable/Satellite TV - 0.1% | |||
| CCO Holdings LLC/CCO Holdings Capital Corp.: | |||
| 5% 2/1/28 (h) | 8,110 | 7,386 | |
| 5.375% 6/1/29 (h) | 16,225 | 14,291 | |
TOTAL CABLE/SATELLITE TV | 21,677 | ||
| Capital Goods - 0.0% | |||
| Chart Industries, Inc. 7.5% 1/1/30 (h) | 1,670 | 1,708 | |
| Chemicals - 0.1% | |||
| Kronos Acquisition Holdings, Inc. / KIK Custom Products, Inc. 5% 12/31/26 (h) | 145 | 140 | |
| Olympus Water U.S. Holding Corp. 9.75% 11/15/28 (h) | 8,380 | 8,892 | |
TOTAL CHEMICALS | 9,032 | ||
| Energy - 0.4% | |||
| Citgo Petroleum Corp.: | |||
| 6.375% 6/15/26 (h) | 2,115 | 2,112 | |
| 7% 6/15/25 (h) | 9,610 | 9,600 | |
| 8.375% 1/15/29 (h) | 7,770 | 8,041 | |
| New Fortress Energy, Inc.: | |||
| 6.5% 9/30/26 (h) | 18,966 | 18,137 | |
| 6.75% 9/15/25 (h) | 10,793 | 10,661 | |
| Transocean Poseidon Ltd. 6.875% 2/1/27 (h) | 4,205 | 4,193 | |
TOTAL ENERGY | 52,744 | ||
| Gaming - 0.4% | |||
| Affinity Interactive 6.875% 12/15/27 (h) | 7,315 | 6,547 | |
| Caesars Entertainment, Inc. 7% 2/15/30 (h) | 7,670 | 7,724 | |
| Fertitta Entertainment LLC / Fertitta Entertainment Finance Co., Inc. 4.625% 1/15/29 (h) | 37,830 | 34,222 | |
| Ontario Gaming Gta LP/Otg Co.-I 8% 8/1/30 (h) | 605 | 614 | |
| Sugarhouse HSP Gaming Prop Mezz LP/Sugarhouse HSP Gaming Finance Corp. 5.875% 5/15/25 (h) | 7,363 | 7,299 | |
| VICI Properties LP / VICI Note Co.: | |||
| 3.5% 2/15/25 (h) | 1,205 | 1,181 | |
| 4.25% 12/1/26 (h) | 1,725 | 1,646 | |
| 4.625% 12/1/29 (h) | 985 | 914 | |
TOTAL GAMING | 60,147 | ||
| Healthcare - 0.1% | |||
| Embecta Corp. 6.75% 2/15/30 (h) | 8,365 | 7,150 | |
| Medline Borrower LP / Medline Co. 6.25% 4/1/29 (h) | 4,675 | 4,645 | |
TOTAL HEALTHCARE | 11,795 | ||
| Homebuilders/Real Estate - 0.3% | |||
| MPT Operating Partnership LP/MPT Finance Corp. 5% 10/15/27 | 27,055 | 22,130 | |
| Uniti Group LP/Uniti Group Finance, Inc./CSL Capital LLC 10.5% 2/15/28 (h) | 18,880 | 19,587 | |
TOTAL HOMEBUILDERS/REAL ESTATE | 41,717 | ||
| Insurance - 0.1% | |||
| Alliant Holdings Intermediate LLC/Alliant Holdings Co.-Issuer 6.75% 4/15/28 (h) | 16,655 | 16,637 | |
| Leisure - 0.2% | |||
| Carnival Corp. 7.625% 3/1/26 (h) | 14,205 | 14,293 | |
| Royal Caribbean Cruises Ltd. 8.25% 1/15/29 (h) | 7,970 | 8,410 | |
TOTAL LEISURE | 22,703 | ||
| Metals/Mining - 0.0% | |||
| Arsenal AIC Parent LLC 8% 10/1/30 (h) | 680 | 708 | |
| Paper - 0.0% | |||
| Ardagh Metal Packaging Finance U.S.A. LLC/Ardagh Metal Packaging Finance PLC 3.25% 9/1/28 (h) | 3,430 | 2,971 | |
| Restaurants - 0.0% | |||
| 1011778 BC Unlimited Liability Co./New Red Finance, Inc. 5.75% 4/15/25 (h) | 660 | 657 | |
| CEC Entertainment LLC 6.75% 5/1/26 (h) | 4,045 | 3,988 | |
TOTAL RESTAURANTS | 4,645 | ||
| Services - 0.2% | |||
| Brand Industrial Services, Inc. 10.375% 8/1/30 (h) | 4,560 | 4,893 | |
| GEMS MENASA Cayman Ltd./GEMS Education Delaware LLC 7.125% 7/31/26 (h) | 4,675 | 4,647 | |
| Neptune BidCo U.S., Inc. 9.29% 4/15/29 (h) | 6,300 | 5,938 | |
| Staples, Inc. 7.5% 4/15/26 (h) | 8,040 | 7,752 | |
| The GEO Group, Inc. 8.625% 4/15/29 (h) | 2,935 | 2,971 | |
TOTAL SERVICES | 26,201 | ||
| Super Retail - 0.1% | |||
| EG Global Finance PLC 12% 11/30/28 (h) | 20,615 | 21,281 | |
| Technology - 0.2% | |||
| Cloud Software Group, Inc. 9% 9/30/29 (h) | 8,495 | 8,174 | |
| CNT PRNT/CDK GLO II/FIN 8% 6/15/29 (h) | 3,905 | 4,017 | |
| Helios Software Holdings, Inc. / ION Corporate Solutions Finance Sarl 8.75% 5/1/29 (h) | 10,540 | 10,561 | |
TOTAL TECHNOLOGY | 22,752 | ||
| Telecommunications - 0.7% | |||
| Altice Financing SA 5.75% 8/15/29 (h) | 12,926 | 9,601 | |
| Altice France SA: | |||
| 5.125% 1/15/29 (h) | 8,087 | 5,279 | |
| 5.125% 7/15/29 (h) | 21,585 | 14,060 | |
| 5.5% 1/15/28 (h) | 8,480 | 5,729 | |
| 5.5% 10/15/29 (h) | 8,370 | 5,476 | |
| Consolidated Communications, Inc. 5% 10/1/28 (h) | 410 | 340 | |
| Frontier Communications Holdings LLC: | |||
| 5% 5/1/28 (h) | 4,005 | 3,685 | |
| 8.75% 5/15/30 (h) | 1,560 | 1,588 | |
| Intelsat Jackson Holdings SA 6.5% 3/15/30 (h) | 22,343 | 21,385 | |
| LCPR Senior Secured Financing DAC: | |||
| 5.125% 7/15/29 (h) | 810 | 675 | |
| 6.75% 10/15/27 (h) | 8,250 | 7,634 | |
| Windstream Escrow LLC 7.75% 8/15/28 (h) | 18,810 | 18,124 | |
TOTAL TELECOMMUNICATIONS | 93,576 | ||
| TOTAL NONCONVERTIBLE BONDS (Cost $641,916) | 626,100 | ||
| Common Stocks - 1.5% | |||
| Shares | Value ($) (000s) | ||
| Broadcasting - 0.0% | |||
| ION Media Networks, Inc. (e)(i) | 2,842 | 0 | |
| Capital Goods - 0.0% | |||
| TNT Crane & Rigging LLC (e)(i) | 512,868 | 3,641 | |
| TNT Crane & Rigging LLC warrants 10/31/25 (e)(i) | 86,957 | 0 | |
TOTAL CAPITAL GOODS | 3,641 | ||
| Consumer Products - 0.0% | |||
| JOANN, Inc. | 6,027,648 | 416 | |
| Diversified Financial Services - 0.3% | |||
| ACNR Holdings, Inc. (e) | 510,379 | 44,648 | |
| Carnelian Point Holdings LP warrants (e)(i) | 18,944 | 55 | |
| Lime Tree Bay Ltd. (e)(i) | 2,899 | 186 | |
TOTAL DIVERSIFIED FINANCIAL SERVICES | 44,889 | ||
| Energy - 0.9% | |||
| California Resources Corp. | 628,519 | 33,224 | |
| California Resources Corp. warrants 10/27/24 (i) | 48,025 | 827 | |
| Chesapeake Energy Corp. (j) | 587,218 | 52,779 | |
| Chesapeake Energy Corp. (k) | 4,049 | 364 | |
| EP Energy Corp. (e)(i) | 80,740 | 144 | |
| Exxon Mobil Corp. | 329,097 | 38,922 | |
TOTAL ENERGY | 126,260 | ||
| Entertainment/Film - 0.1% | |||
| New Cineworld Ltd. (e) | 533,906 | 9,151 | |
| Hotels - 0.1% | |||
| Travelport Finance Luxembourg SARL (e) | 3,686 | 10,654 | |
| Restaurants - 0.1% | |||
| Old Claimco LLC (e)(i) | 542,500 | 9,043 | |
| Telecommunications - 0.0% | |||
| GTT Communications, Inc. (e)(i) | 118,360 | 4,415 | |
| Utilities - 0.0% | |||
| TexGen Power LLC (e) | 524,336 | 534 | |
| TOTAL COMMON STOCKS (Cost $116,131) | 209,003 | ||
| Preferred Securities - 0.8% | |||
Principal Amount (a) (000s) | Value ($) (000s) | ||
| Banks & Thrifts - 0.4% | |||
| Bank of America Corp.: | |||
| CME Term SOFR 3 Month Index + 3.390% 8.7379% (b)(c)(l) | 6,970 | 7,098 | |
| 6.25% (b)(l) | 24,265 | 24,421 | |
| JPMorgan Chase & Co.: | |||
| CME Term SOFR 3 Month Index + 3.560% 8.868% (b)(c)(l) | 7,500 | 7,666 | |
| 6.1% (b)(l) | 7,795 | 7,851 | |
| 9.348% (b)(c)(l) | 11,615 | 11,886 | |
TOTAL BANKS & THRIFTS | 58,922 | ||
| Energy - 0.4% | |||
| Energy Transfer LP 3 month U.S. LIBOR + 4.020% 9.5966% (b)(c)(l) | 48,805 | 49,798 | |
| TOTAL PREFERRED SECURITIES (Cost $103,859) | 108,720 | ||
| Other - 0.7% | |||
| Shares | Value ($) (000s) | ||
| Other - 0.7% | |||
Fidelity Private Credit Co. LLC (k)(m) (Cost $100,792) | 10,118,732 | 102,908 | |
| Money Market Funds - 8.8% | |||
| Shares | Value ($) (000s) | ||
| Fidelity Cash Central Fund 5.39% (n) | 1,181,193,515 | 1,181,430 | |
| Fidelity Securities Lending Cash Central Fund 5.39% (n)(o) | 54,980,502 | 54,986 | |
| TOTAL MONEY MARKET FUNDS (Cost $1,236,391) | 1,236,416 | ||
| TOTAL INVESTMENT IN SECURITIES - 103.3% (Cost $14,731,069) | 14,592,628 |
NET OTHER ASSETS (LIABILITIES) - (3.3)% | (459,945) |
| NET ASSETS - 100.0% | 14,132,683 |
| (a) | Amount is stated in United States dollars unless otherwise noted. |
| (b) | Coupon rates for floating and adjustable rate securities reflect the rates in effect at period end. |
| (c) | Coupon is indexed to a floating interest rate which may be multiplied by a specified factor and/or subject to caps or floors. |
| (d) | Remaining maturities of bank loan obligations may be less than the stated maturities shown as a result of contractual or optional prepayments by the borrower. Such prepayments cannot be predicted with certainty. |
| (e) | Level 3 security |
| (f) | Non-income producing - Security is in default. |
| (g) | The coupon rate will be determined upon settlement of the loan after period end. |
| (h) | Security exempt from registration under Rule 144A of the Securities Act of 1933. These securities may be resold in transactions exempt from registration, normally to qualified institutional buyers. At the end of the period, the value of these securities amounted to $587,368,000 or 4.2% of net assets. |
| (i) | Non-income producing |
| (j) | Security or a portion of the security is on loan at period end. |
| (k) | Restricted securities (including private placements) - Investment in securities not registered under the Securities Act of 1933 (excluding 144A issues). At the end of the period, the value of restricted securities (excluding 144A issues) amounted to $103,272,000 or 0.7% of net assets. |
| (l) | Security is perpetual in nature with no stated maturity date. |
| (m) | Affiliated Fund |
| (n) | Affiliated fund that is generally available only to investment companies and other accounts managed by Fidelity Investments. The rate quoted is the annualized seven-day yield of the fund at period end. A complete unaudited listing of the fund's holdings as of its most recent quarter end is available upon request. In addition, each Fidelity Central Fund's financial statements are available on the SEC's website or upon request. |
| (o) | Investment made with cash collateral received from securities on loan. |
| Additional information on each restricted holding is as follows: | ||
| Security | Acquisition Date | Acquisition Cost ($) (000s) |
| Chesapeake Energy Corp. | 2/10/21 | 38 |
| Fidelity Private Credit Co. LLC | 5/01/22 - 4/08/24 | 100,792 |
| Affiliate (Amounts in thousands) | Value, beginning of period ($) | Purchases ($) | Sales Proceeds ($) | Dividend Income ($) | Realized Gain (loss) ($) | Change in Unrealized appreciation (depreciation) ($) | Value, end of period ($) | % ownership, end of period |
| Fidelity Cash Central Fund 5.39% | 1,286,453 | 1,531,706 | 1,636,728 | 30,200 | (1) | - | 1,181,430 | 2.4% |
| Fidelity Securities Lending Cash Central Fund 5.39% | 51,380 | 38,722 | 35,116 | 35 | - | - | 54,986 | 0.2% |
| Total | 1,337,833 | 1,570,428 | 1,671,844 | 30,235 | (1) | - | 1,236,416 | |
| Affiliate (Amounts in thousands) | Value, beginning of period ($) | Purchases ($) | Sales Proceeds ($) | Dividend Income ($) | Realized Gain (loss) ($) | Change in Unrealized appreciation (depreciation) ($) | Value, end of period ($) |
| Fidelity Private Credit Co. LLC | 94,881 | 7,677 | - | 6,623 | - | 350 | 102,908 |
| 94,881 | 7,677 | - | 6,623 | - | 350 | 102,908 |
| Valuation Inputs at Reporting Date: | ||||
Description (Amounts in thousands) | Total ($) | Level 1 ($) | Level 2 ($) | Level 3 ($) |
Investments in Securities: | ||||
| Equities: | ||||
Communication Services | 9,151 | - | - | 9,151 |
Consumer Discretionary | 19,697 | - | - | 19,697 |
Energy | 126,260 | 126,116 | - | 144 |
Financials | 44,889 | - | - | 44,889 |
Industrials | 3,641 | - | - | 3,641 |
Information Technology | 4,415 | - | - | 4,415 |
Utilities | 534 | - | - | 534 |
| Bank Loan Obligations | 12,309,481 | - | 12,258,432 | 51,049 |
| Corporate Bonds | 626,100 | - | 626,100 | - |
| Preferred Securities | 108,720 | - | 108,720 | - |
| Other | 102,908 | - | 102,908 | - |
| Money Market Funds | 1,236,416 | 1,236,416 | - | - |
| Total Investments in Securities: | 14,592,212 | 1,362,532 | 13,096,160 | 133,520 |
| (Amounts in thousands) | |||
| Investments in Securities: | |||
| Beginning Balance | $ | 223,482 | |
| Net Realized Gain (Loss) on Investment Securities | 5,838 | ||
| Net Unrealized Gain (Loss) on Investment Securities | (6,818) | ||
| Cost of Purchases | 12,468 | ||
| Proceeds of Sales | (61,031) | ||
| Amortization/Accretion | 566 | ||
| Transfers into Level 3 | - | ||
| Transfers out of Level 3 | (40,985) | ||
| Ending Balance | $ | 133,520 | |
| The change in unrealized gain (loss) for the period attributable to Level 3 securities held at April 30, 2024 | $ | (849) | |
| The information used in the above reconciliation represents fiscal year to date activity for any Investments in Securities identified as using Level 3 inputs at either the beginning or the end of the current fiscal period. Cost of purchases and proceeds of sales may include securities received and/or delivered through in-kind transactions, corporate actions or exchanges. Transfers into Level 3 were attributable to a lack of observable market data resulting from decreases in market activity, decreases in liquidity, security restructurings or corporate actions. Transfers out of Level 3 were attributable to observable market data becoming available for those securities. Transfers in or out of Level 3 represent the beginning value of any Security or Instrument where a change in the pricing level occurred from the beginning to the end of the period. Realized and unrealized gains (losses) disclosed in the reconciliation are included in Net Gain (Loss) on the Fund's Statement of Operations. | |||
| Statement of Assets and Liabilities | ||||
| Amounts in thousands (except per-share amounts) | April 30, 2024 (Unaudited) | |||
| Assets | ||||
| Investment in securities, at value (including securities loaned of $52,023) - See accompanying schedule: | ||||
Unaffiliated issuers (cost $13,393,886) | $ | 13,253,304 | ||
Fidelity Central Funds (cost $1,236,391) | 1,236,416 | |||
Other affiliated issuers (cost $100,792) | 102,908 | |||
| Total Investment in Securities (cost $14,731,069) | $ | 14,592,628 | ||
| Cash | 19,129 | |||
| Receivable for investments sold | 58,718 | |||
| Receivable for fund shares sold | 22,874 | |||
| Dividends receivable | 2 | |||
| Interest receivable | 73,870 | |||
| Distributions receivable from Fidelity Central Funds | 4,746 | |||
| Prepaid expenses | 4 | |||
| Other receivables | 248 | |||
Total assets | 14,772,219 | |||
| Liabilities | ||||
| Payable for investments purchased | $ | 537,699 | ||
| Payable for fund shares redeemed | 20,514 | |||
| Distributions payable | 17,831 | |||
| Accrued management fee | 7,425 | |||
| Distribution and service plan fees payable | 249 | |||
| Other payables and accrued expenses | 832 | |||
| Collateral on securities loaned | 54,986 | |||
| Total liabilities | 639,536 | |||
| Commitments and contingent liabilities (see Commitments note) | ||||
| Net Assets | $ | 14,132,683 | ||
| Net Assets consist of: | ||||
| Paid in capital | $ | 15,380,071 | ||
| Total accumulated earnings (loss) | (1,247,388) | |||
| Net Assets | $ | 14,132,683 | ||
| Net Asset Value and Maximum Offering Price | ||||
| Class A : | ||||
Net Asset Value and redemption price per share ($650,844 ÷ 69,898 shares)(a) | $ | 9.31 | ||
| Maximum offering price per share (100/97.25 of $9.31) | $ | 9.57 | ||
| Class M : | ||||
Net Asset Value and redemption price per share ($87,172 ÷ 9,375 shares)(a) | $ | 9.30 | ||
| Maximum offering price per share (100/97.25 of $9.30) | $ | 9.56 | ||
| Class C : | ||||
Net Asset Value and offering price per share ($117,590 ÷ 12,630 shares)(a) | $ | 9.31 | ||
| Fidelity Floating Rate High Income Fund : | ||||
Net Asset Value, offering price and redemption price per share ($8,661,513 ÷ 931,413 shares) | $ | 9.30 | ||
| Class I : | ||||
Net Asset Value, offering price and redemption price per share ($2,162,829 ÷ 232,785 shares) | $ | 9.29 | ||
| Class Z : | ||||
Net Asset Value, offering price and redemption price per share ($2,452,735 ÷ 263,852 shares) | $ | 9.30 | ||
(a)Redemption price per share is equal to net asset value less any applicable contingent deferred sales charge. | ||||
| Statement of Operations | ||||
| Amounts in thousands | Six months ended April 30, 2024 (Unaudited) | |||
| Investment Income | ||||
| Dividends: | ||||
| Unaffiliated issuers | $ | 7,171 | ||
| Affiliated issuers | 6,529 | |||
| Interest | 579,294 | |||
| Income from Fidelity Central Funds (including $35 from security lending) | 30,235 | |||
| Total income | 623,229 | |||
| Expenses | ||||
| Management fee | $ | 38,634 | ||
| Transfer agent fees | 4,489 | |||
| Distribution and service plan fees | 1,461 | |||
| Accounting fees | 587 | |||
| Custodian fees and expenses | 36 | |||
| Independent trustees' fees and expenses | 32 | |||
| Registration fees | 284 | |||
| Audit | 48 | |||
| Legal | 572 | |||
| Miscellaneous | 25 | |||
| Total expenses before reductions | 46,168 | |||
| Expense reductions | (637) | |||
| Total expenses after reductions | 45,531 | |||
| Net Investment income (loss) | 577,698 | |||
| Realized and Unrealized Gain (Loss) | ||||
| Net realized gain (loss) on: | ||||
| Investment Securities: | ||||
| Unaffiliated issuers | (29,057) | |||
| Fidelity Central Funds | (1) | |||
| Capital gain distributions from underlying funds: | ||||
| Affiliated issuers | 94 | |||
| Total net realized gain (loss) | (28,964) | |||
| Change in net unrealized appreciation (depreciation) on: | ||||
| Investment Securities: | ||||
| Unaffiliated issuers | 208,673 | |||
| Affiliated issuers | 350 | |||
| Unfunded commitments | (87) | |||
| Total change in net unrealized appreciation (depreciation) | 208,936 | |||
| Net gain (loss) | 179,972 | |||
| Net increase (decrease) in net assets resulting from operations | $ | 757,670 | ||
| Statement of Changes in Net Assets | ||||
| Amount in thousands | Six months ended April 30, 2024 (Unaudited) | Year ended October 31, 2023 | ||
| Increase (Decrease) in Net Assets | ||||
| Operations | ||||
| Net investment income (loss) | $ | 577,698 | $ | 963,141 |
| Net realized gain (loss) | (28,964) | (56,353) | ||
| Change in net unrealized appreciation (depreciation) | 208,936 | 303,611 | ||
| Net increase (decrease) in net assets resulting from operations | 757,670 | 1,210,399 | ||
| Distributions to shareholders | (567,624) | (961,832) | ||
| Share transactions - net increase (decrease) | 1,634,094 | 31,517 | ||
| Total increase (decrease) in net assets | 1,824,140 | 280,084 | ||
| Net Assets | ||||
| Beginning of period | 12,308,543 | 12,028,459 | ||
| End of period | $ | 14,132,683 | $ | 12,308,543 |
Fidelity Advisor® Floating Rate High Income Fund Class A |
Six months ended (Unaudited) April 30, 2024 | Years ended October 31, 2023 | 2022 | 2021 | 2020 | 2019 | |||||||
Selected Per-Share Data | ||||||||||||
| Net asset value, beginning of period | $ | 9.17 | $ | 8.98 | $ | 9.53 | $ | 8.98 | $ | 9.39 | $ | 9.61 |
| Income from Investment Operations | ||||||||||||
Net investment income (loss) A,B | .390 | .727 | .370 | .298 | .362 | .461 | ||||||
| Net realized and unrealized gain (loss) | .134 | .190 | (.556) | .525 | (.411) | (.216) | ||||||
| Total from investment operations | .524 | .917 | (.186) | .823 | (.049) | .245 | ||||||
| Distributions from net investment income | (.384) | (.727) | (.364) | (.273) | (.361) | (.465) | ||||||
| Total distributions | (.384) | (.727) | (.364) | (.273) | (.361) | (.465) | ||||||
| Net asset value, end of period | $ | 9.31 | $ | 9.17 | $ | 8.98 | $ | 9.53 | $ | 8.98 | $ | 9.39 |
Total Return C,D,E | 5.79 % | 10.55% | (1.96)% | 9.24% | (.45)% | 2.63% | ||||||
Ratios to Average Net Assets B,F,G | ||||||||||||
| Expenses before reductions | .97% H | .97% | .97% | .98% | .98% | .98% | ||||||
| Expenses net of fee waivers, if any | .96 % H | .96% | .97% | .98% | .98% | .98% | ||||||
| Expenses net of all reductions | .96% H | .96% | .97% | .97% | .98% | .98% | ||||||
| Net investment income (loss) | 8.45% H | 7.96% | 4.00% | 3.18% | 4.01% | 4.86% | ||||||
| Supplemental Data | ||||||||||||
| Net assets, end of period (in millions) | $ | 651 | $ | 601 | $ | 575 | $ | 523 | $ | 411 | $ | 546 |
Portfolio turnover rate I | 39 % H | 35% | 27% | 31% | 37% | 22% |
Fidelity Advisor® Floating Rate High Income Fund Class M |
Six months ended (Unaudited) April 30, 2024 | Years ended October 31, 2023 | 2022 | 2021 | 2020 | 2019 | |||||||
Selected Per-Share Data | ||||||||||||
| Net asset value, beginning of period | $ | 9.16 | $ | 8.96 | $ | 9.51 | $ | 8.97 | $ | 9.38 | $ | 9.59 |
| Income from Investment Operations | ||||||||||||
Net investment income (loss) A,B | .391 | .728 | .369 | .297 | .361 | .460 | ||||||
| Net realized and unrealized gain (loss) | .133 | .200 | (.555) | .514 | (.411) | (.206) | ||||||
| Total from investment operations | .524 | .928 | (.186) | .811 | (.050) | .254 | ||||||
| Distributions from net investment income | (.384) | (.728) | (.364) | (.271) | (.360) | (.464) | ||||||
| Total distributions | (.384) | (.728) | (.364) | (.271) | (.360) | (.464) | ||||||
| Net asset value, end of period | $ | 9.30 | $ | 9.16 | $ | 8.96 | $ | 9.51 | $ | 8.97 | $ | 9.38 |
Total Return C,D,E | 5.80 % | 10.69% | (1.97)% | 9.12% | (.46)% | 2.72% | ||||||
Ratios to Average Net Assets B,F,G | ||||||||||||
| Expenses before reductions | .95% H | .95% | .97% | .99% | 1.00% | .99% | ||||||
| Expenses net of fee waivers, if any | .94 % H | .95% | .96% | .99% | 1.00% | .99% | ||||||
| Expenses net of all reductions | .94% H | .95% | .96% | .99% | .99% | .99% | ||||||
| Net investment income (loss) | 8.47% H | 7.98% | 4.00% | 3.16% | 4.00% | 4.86% | ||||||
| Supplemental Data | ||||||||||||
| Net assets, end of period (in millions) | $ | 87 | $ | 86 | $ | 87 | $ | 65 | $ | 58 | $ | 84 |
Portfolio turnover rate I | 39 % H | 35% | 27% | 31% | 37% | 22% |
Fidelity Advisor® Floating Rate High Income Fund Class C |
Six months ended (Unaudited) April 30, 2024 | Years ended October 31, 2023 | 2022 | 2021 | 2020 | 2019 | |||||||
Selected Per-Share Data | ||||||||||||
| Net asset value, beginning of period | $ | 9.17 | $ | 8.97 | $ | 9.53 | $ | 8.98 | $ | 9.39 | $ | 9.61 |
| Income from Investment Operations | ||||||||||||
Net investment income (loss) A,B | .355 | .659 | .300 | .228 | .295 | .392 | ||||||
| Net realized and unrealized gain (loss) | .134 | .199 | (.565) | .524 | (.411) | (.218) | ||||||
| Total from investment operations | .489 | .858 | (.265) | .752 | (.116) | .174 | ||||||
| Distributions from net investment income | (.349) | (.658) | (.295) | (.202) | (.294) | (.394) | ||||||
| Total distributions | (.349) | (.658) | (.295) | (.202) | (.294) | (.394) | ||||||
| Net asset value, end of period | $ | 9.31 | $ | 9.17 | $ | 8.97 | $ | 9.53 | $ | 8.98 | $ | 9.39 |
Total Return C,D,E | 5.39 % | 9.84% | (2.81)% | 8.42% | (1.19)% | 1.86% | ||||||
Ratios to Average Net Assets B,F,G | ||||||||||||
| Expenses before reductions | 1.72% H | 1.72% | 1.72% | 1.73% | 1.74% | 1.73% | ||||||
| Expenses net of fee waivers, if any | 1.71 % H | 1.71% | 1.72% | 1.73% | 1.74% | 1.73% | ||||||
| Expenses net of all reductions | 1.71% H | 1.71% | 1.72% | 1.73% | 1.74% | 1.73% | ||||||
| Net investment income (loss) | 7.70% H | 7.21% | 3.24% | 2.42% | 3.26% | 4.11% | ||||||
| Supplemental Data | ||||||||||||
| Net assets, end of period (in millions) | $ | 118 | $ | 110 | $ | 114 | $ | 109 | $ | 156 | $ | 261 |
Portfolio turnover rate I | 39 % H | 35% | 27% | 31% | 37% | 22% |
Fidelity® Floating Rate High Income Fund |
Six months ended (Unaudited) April 30, 2024 | Years ended October 31, 2023 | 2022 | 2021 | 2020 | 2019 | |||||||
Selected Per-Share Data | ||||||||||||
| Net asset value, beginning of period | $ | 9.16 | $ | 8.96 | $ | 9.52 | $ | 8.97 | $ | 9.38 | $ | 9.60 |
| Income from Investment Operations | ||||||||||||
Net investment income (loss) A,B | .402 | .753 | .397 | .326 | .391 | .490 | ||||||
| Net realized and unrealized gain (loss) | .134 | .200 | (.566) | .525 | (.413) | (.218) | ||||||
| Total from investment operations | .536 | .953 | (.169) | .851 | (.022) | .272 | ||||||
| Distributions from net investment income | (.396) | (.753) | (.391) | (.301) | (.388) | (.492) | ||||||
| Total distributions | (.396) | (.753) | (.391) | (.301) | (.388) | (.492) | ||||||
| Net asset value, end of period | $ | 9.30 | $ | 9.16 | $ | 8.96 | $ | 9.52 | $ | 8.97 | $ | 9.38 |
Total Return C,D | 5.94 % | 10.99% | (1.79)% | 9.58% | (.15)% | 2.93% | ||||||
Ratios to Average Net Assets B,E,F | ||||||||||||
| Expenses before reductions | .68% G | .67% | .68% | .67% | .68% | .68% | ||||||
| Expenses net of fee waivers, if any | .67 % G | .67% | .68% | .67% | .68% | .68% | ||||||
| Expenses net of all reductions | .67% G | .67% | .68% | .67% | .68% | .68% | ||||||
| Net investment income (loss) | 8.74% G | 8.26% | 4.29% | 3.48% | 4.32% | 5.16% | ||||||
| Supplemental Data | ||||||||||||
| Net assets, end of period (in millions) | $ | 8,662 | $ | 7,026 | $ | 6,461 | $ | 6,419 | $ | 4,640 | $ | 7,130 |
Portfolio turnover rate H | 39 % G | 35% | 27% | 31% | 37% | 22% |
Fidelity Advisor® Floating Rate High Income Fund Class I |
Six months ended (Unaudited) April 30, 2024 | Years ended October 31, 2023 | 2022 | 2021 | 2020 | 2019 | |||||||
Selected Per-Share Data | ||||||||||||
| Net asset value, beginning of period | $ | 9.15 | $ | 8.96 | $ | 9.51 | $ | 8.96 | $ | 9.37 | $ | 9.59 |
| Income from Investment Operations | ||||||||||||
Net investment income (loss) A,B | .402 | .750 | .391 | .321 | .388 | .486 | ||||||
| Net realized and unrealized gain (loss) | .133 | .190 | (.554) | .525 | (.414) | (.218) | ||||||
| Total from investment operations | .535 | .940 | (.163) | .846 | (.026) | .268 | ||||||
| Distributions from net investment income | (.395) | (.750) | (.387) | (.296) | (.384) | (.488) | ||||||
| Total distributions | (.395) | (.750) | (.387) | (.296) | (.384) | (.488) | ||||||
| Net asset value, end of period | $ | 9.29 | $ | 9.15 | $ | 8.96 | $ | 9.51 | $ | 8.96 | $ | 9.37 |
Total Return C,D | 5.93 % | 10.84% | (1.73)% | 9.54% | (.20)% | 2.88% | ||||||
Ratios to Average Net Assets B,E,F | ||||||||||||
| Expenses before reductions | .70% G | .70% | .72% | .72% | .73% | .74% | ||||||
| Expenses net of fee waivers, if any | .70 % G | .70% | .72% | .72% | .72% | .74% | ||||||
| Expenses net of all reductions | .69% G | .70% | .72% | .72% | .72% | .73% | ||||||
| Net investment income (loss) | 8.72% G | 8.23% | 4.25% | 3.43% | 4.27% | 5.11% | ||||||
| Supplemental Data | ||||||||||||
| Net assets, end of period (in millions) | $ | 2,163 | $ | 1,972 | $ | 1,993 | $ | 1,167 | $ | 681 | $ | 1,190 |
Portfolio turnover rate H | 39 % G | 35% | 27% | 31% | 37% | 22% |
Fidelity Advisor® Floating Rate High Income Fund Class Z |
Six months ended (Unaudited) April 30, 2024 | Years ended October 31, 2023 | 2022 | 2021 | 2020 | 2019 | |||||||
Selected Per-Share Data | ||||||||||||
| Net asset value, beginning of period | $ | 9.16 | $ | 8.96 | $ | 9.51 | $ | 8.97 | $ | 9.37 | $ | 9.59 |
| Income from Investment Operations | ||||||||||||
Net investment income (loss) A,B | .407 | .759 | .401 | .329 | .388 | .484 | ||||||
| Net realized and unrealized gain (loss) | .133 | .198 | (.555) | .516 | (.396) | (.207) | ||||||
| Total from investment operations | .540 | .957 | (.154) | .845 | (.008) | .277 | ||||||
| Distributions from net investment income | (.400) | (.757) | (.396) | (.305) | (.392) | (.497) | ||||||
| Total distributions | (.400) | (.757) | (.396) | (.305) | (.392) | (.497) | ||||||
| Net asset value, end of period | $ | 9.30 | $ | 9.16 | $ | 8.96 | $ | 9.51 | $ | 8.97 | $ | 9.37 |
Total Return C,D | 5.98 % | 11.05% | (1.63)% | 9.52% | .01% | 2.98% | ||||||
Ratios to Average Net Assets B,E,F | ||||||||||||
| Expenses before reductions | .61% G | .62% | .62% | .62% | .63% | .63% | ||||||
| Expenses net of fee waivers, if any | .60 % G | .61% | .62% | .62% | .63% | .62% | ||||||
| Expenses net of all reductions | .60% G | .61% | .62% | .62% | .63% | .62% | ||||||
| Net investment income (loss) | 8.81% G | 8.31% | 4.35% | 3.53% | 4.37% | 5.22% | ||||||
| Supplemental Data | ||||||||||||
| Net assets, end of period (in millions) | $ | 2,453 | $ | 2,513 | $ | 2,798 | $ | 2,449 | $ | 641 | $ | 439 |
Portfolio turnover rate H | 39 % G | 35% | 27% | 31% | 37% | 22% |
| Fidelity Central Fund | Investment Manager | Investment Objective | Investment Practices | Expense RatioA |
| Fidelity Money Market Central Funds | Fidelity Management & Research Company LLC (FMR) | Each fund seeks to obtain a high level of current income consistent with the preservation of capital and liquidity. | Short-term Investments | Less than .005% |
| Fidelity Advisor Floating Rate High Income Fund | $248 |
| Gross unrealized appreciation | $318,443 |
| Gross unrealized depreciation | (416,914) |
| Net unrealized appreciation (depreciation) | $(98,471) |
| Tax cost | $14,691,099 |
Short-term | $(63,873) |
Long-term | (1,054,787) |
| Total capital loss carryforward | $(1,118,660) |
| Investment to be Acquired | Commitment Amount ($) | |
| Fidelity Advisor Floating Rate High Income Fund | Fidelity Private Credit Company LLC | 18,372 |
| Purchases ($) | Sales ($) | |
| Fidelity Advisor Floating Rate High Income Fund | 4,124,007 | 2,442,473 |
| Maximum Management Fee Rate % | |
| Class A | .69 |
| Class M | .68 |
| Class C | .69 |
| Fidelity Floating Rate High Income Fund | .65 |
| Class I | .68 |
| Class Z | .59 |
| Total Management Fee Rate % | |
| Class A | .69 |
| Class M | .68 |
| Class C | .69 |
| Fidelity Floating Rate High Income Fund | .65 |
| Class I | .68 |
| Class Z | .59 |
| Distribution Fee | Service Fee | Total Fees ($) | Retained by FDC ($) | |
| Class A | - % | .25% | 782 | 56 |
| Class M | - % | .25% | 109 | 1 |
| Class C | .75% | .25% | 570 | 111 |
| 1,461 | 168 |
| Retained by FDC ($) | |
| Class A | 33 |
| Class M | 3 |
Class C A | 1 |
| 37 |
| % of Class-Level Average Net Assets | |
| Class A | .1483 |
| Class M | .1367 |
| Class C | .1492 |
| Fidelity Floating Rate High Income Fund | .1064 |
| Class I | .1372 |
| Amount ($) | % of Class-Level Average Net AssetsA | |
| Class A | 308 | .15 |
| Class M | 40 | .14 |
| Class C | 56 | .15 |
| Fidelity Floating Rate High Income Fund | 2,704 | .11 |
| Class I | 959 | .14 |
| Class Z | 422 | .05 |
| 4,489 |
| % of Average Net Assets | |
| Fidelity Advisor Floating Rate High Income Fund | .0137 |
| % of Average Net Assets | |
| Fidelity Advisor Floating Rate High Income Fund | .01 |
| Amount ($) | |
| Fidelity Advisor Floating Rate High Income Fund | 12 |
| Total Security Lending Fees Paid to NFS ($) | Security Lending Income From Securities Loaned to NFS ($) | Value of Securities Loaned to NFS at Period End ($) | |
| Fidelity Advisor Floating Rate High Income Fund | 4 | - | - |
Six months ended April 30, 2024 | Year ended October 31, 2023 | |
| Fidelity Advisor Floating Rate High Income Fund | ||
| Distributions to shareholders | ||
| Class A | $25,779 | $44,976 |
| Class M | 3,614 | 7,043 |
| Class C | 4,276 | 8,076 |
| Fidelity Floating Rate High Income Fund | 336,493 | 526,804 |
| Class I | 89,541 | 158,730 |
| Class Z | 107,921 | 216,203 |
Total | $567,624 | $961,832 |
| Shares | Shares | Dollars | Dollars | |
Six months ended April 30, 2024 | Year ended October 31, 2023 | Six months ended April 30, 2024 | Year ended October 31, 2023 | |
| Fidelity Advisor Floating Rate High Income Fund | ||||
| Class A | ||||
| Shares sold | 11,635 | 20,522 | $108,144 | $187,909 |
| Reinvestment of distributions | 2,500 | 4,454 | 23,243 | 40,696 |
| Shares redeemed | (9,805) | (23,477) | (91,146) | (214,086) |
| Net increase (decrease) | 4,330 | 1,499 | $40,241 | $14,519 |
| Class M | ||||
| Shares sold | 1,255 | 2,976 | $11,651 | $27,078 |
| Reinvestment of distributions | 379 | 755 | 3,520 | 6,886 |
| Shares redeemed | (1,689) | (4,009) | (15,688) | (36,464) |
| Net increase (decrease) | (55) | (278) | $(517) | $(2,500) |
| Class C | ||||
| Shares sold | 2,297 | 4,587 | $21,336 | $41,782 |
| Reinvestment of distributions | 434 | 823 | 4,034 | 7,523 |
| Shares redeemed | (2,068) | (6,105) | (19,212) | (55,688) |
| Net increase (decrease) | 663 | (695) | $6,158 | $(6,383) |
| Fidelity Floating Rate High Income Fund | ||||
| Shares sold | 250,378 | 282,875 | $2,323,253 | $2,586,129 |
| Reinvestment of distributions | 30,232 | 48,217 | 280,840 | 440,050 |
| Shares redeemed | (116,129) | (284,925) | (1,077,866) | (2,593,072) |
| Net increase (decrease) | 164,481 | 46,167 | $1,526,227 | $433,107 |
| Class I | ||||
| Shares sold | 59,430 | 113,232 | $549,877 | $1,032,650 |
| Reinvestment of distributions | 7,176 | 13,504 | 66,579 | 123,082 |
| Shares redeemed | (49,215) | (133,919) | (456,107) | (1,218,642) |
| Net increase (decrease) | 17,391 | (7,183) | $160,349 | $(62,910) |
| Class Z | ||||
| Shares sold | 32,366 | 66,053 | $300,337 | $601,643 |
| Reinvestment of distributions | 8,841 | 18,534 | 82,100 | 169,022 |
| Shares redeemed | (51,763) | (122,461) | (480,801) | (1,114,981) |
| Net increase (decrease) | (10,556) | (37,874) | $(98,364) | $(344,316) |
| The Example is based on an investment of $1,000 invested at the beginning of the period and held for the entire period (November 1, 2023 to April 30, 2024). |
Annualized Expense Ratio- A | Beginning Account Value November 1, 2023 | Ending Account Value April 30, 2024 | Expenses Paid During Period- C November 1, 2023 to April 30, 2024 | |||||||
| Fidelity Advisor® Floating Rate High Income Fund | ||||||||||
| Class A | .96% | |||||||||
| Actual | $ 1,000 | $ 1,057.90 | $ 4.91 | |||||||
Hypothetical-B | $ 1,000 | $ 1,020.09 | $ 4.82 | |||||||
| Class M | .94% | |||||||||
| Actual | $ 1,000 | $ 1,058.00 | $ 4.81 | |||||||
Hypothetical-B | $ 1,000 | $ 1,020.19 | $ 4.72 | |||||||
| Class C | 1.71% | |||||||||
| Actual | $ 1,000 | $ 1,053.90 | $ 8.73 | |||||||
Hypothetical-B | $ 1,000 | $ 1,016.36 | $ 8.57 | |||||||
| Fidelity® Floating Rate High Income Fund | .67% | |||||||||
| Actual | $ 1,000 | $ 1,059.40 | $ 3.43 | |||||||
Hypothetical-B | $ 1,000 | $ 1,021.53 | $ 3.37 | |||||||
| Class I | .70% | |||||||||
| Actual | $ 1,000 | $ 1,059.30 | $ 3.58 | |||||||
Hypothetical-B | $ 1,000 | $ 1,021.38 | $ 3.52 | |||||||
| Class Z | .60% | |||||||||
| Actual | $ 1,000 | $ 1,059.80 | $ 3.07 | |||||||
Hypothetical-B | $ 1,000 | $ 1,021.88 | $ 3.02 | |||||||
- Highly liquid investments - cash or convertible to cash within three business days or less
- Moderately liquid investments - convertible to cash in three to seven calendar days
- Less liquid investments - can be sold or disposed of, but not settled, within seven calendar days
- Illiquid investments - cannot be sold or disposed of within seven calendar days
 |
Item 2.
Code of Ethics
Not applicable.
Item 3.
Audit Committee Financial Expert
Not applicable.
Item 4.
Principal Accountant Fees and Services
Not applicable.
Item 5.
Audit Committee of Listed Registrants
Not applicable.
Item 6.
Investments
(a)
Not applicable.
(b)
Not applicable
Item 7.
Disclosure of Proxy Voting Policies and Procedures for Closed-End Management Investment Companies
Not applicable.
Item 8.
Portfolio Managers of Closed-End Management Investment Companies
Not applicable.
Item 9.
Purchase of Equity Securities by Closed-End Management Investment Company and Affiliated Purchasers
Not applicable.
Item 10.
Submission of Matters to a Vote of Security Holders
There were no material changes to the procedures by which shareholders may recommend nominees to the Fidelity Advisor Series I’s Board of Trustees.
Item 11.
Controls and Procedures
(a)(i) The President and Treasurer and the Chief Financial Officer have concluded that the Fidelity Advisor Series I’s (the “Trust”) disclosure controls and procedures (as defined in Rule 30a-3(c) under the Investment Company Act) provide reasonable
assurances that material information relating to the Trust is made known to them by the appropriate persons, based on their evaluation of these controls and procedures as of a date within 90 days of the filing date of this report.
(a)(ii) There was no change in the Trust’s internal control over financial reporting (as defined in Rule 30a-3(d) under the Investment Company Act) that occurred during the period covered by this report that has materially affected, or is reasonably likely to materially affect, the Trust’s internal control over financial reporting.
Item 12.
Disclosure of Securities Lending Activities for Closed-End Management
Investment Companies
Not applicable.
Item 18.
Recovery of Erroneously Awarded Compensation
(a)
Not applicable.
(b)
Not applicable.
Item 19.
Exhibits
(a) | (1) | Not applicable. |
(a) | (2) | |
(a) | (3) | Not applicable. |
(b) |
SIGNATURES
Pursuant to the requirements of the Securities Exchange Act of 1934 and the Investment Company Act of 1940, the registrant has duly caused this report to be signed on its behalf by the undersigned, thereunto duly authorized.
Fidelity Advisor Series I
By: | /s/Stacie M. Smith |
Stacie M. Smith | |
President and Treasurer (Principal Executive Officer) | |
Date: | June 21, 2024 |
Pursuant to the requirements of the Securities Exchange Act of 1934 and the Investment Company Act of 1940, this report has been signed below by the following persons on behalf of the registrant and in the capacities and on the dates indicated.
By: | /s/Stacie M. Smith |
Stacie M. Smith | |
President and Treasurer (Principal Executive Officer) | |
Date: | June 21, 2024 |
By: | /s/John J. Burke III |
John J. Burke III | |
Chief Financial Officer (Principal Financial Officer) | |
Date: | June 21, 2024 |