UNITED STATES
SECURITIES AND EXCHANGE COMMISSION
Washington, D.C. 20549
FORM N-CSR
CERTIFIED SHAREHOLDER REPORT OF REGISTERED
MANAGEMENT INVESTMENT COMPANIES
Investment Company Act file number 811-03785
Fidelity Advisor Series I
(Exact name of registrant as specified in charter)
245 Summer St., Boston, MA 02210
(Address of principal executive offices) (Zip code)
Margaret Carey, Secretary
245 Summer St.
Boston, Massachusetts 02210
(Name and address of agent for service)
Registrant's telephone number, including area code:
617-563-7000
Date of fiscal year end: | November 30 |
Date of reporting period: | May 31, 2024 |
Item 1.
Reports to Stockholders
SEMI-ANNUAL SHAREHOLDER REPORT | AS OF MAY 31, 2024 | ||
| | Fidelity Advisor® Small Cap Fund Fidelity Advisor® Small Cap Fund Class M : FSCTX | |
| Costs of a $10,000 investment | Costs paid as a percentage of a $10,000 investment | ||
| Class M | $ 86 | 1.57% |
KEY FACTS | ||
| Fund Size | $1,955,004,625 | |
| Number of Holdings | 137 | |
| Portfolio Turnover | 36% |
(as of May 31, 2024)
MARKET SECTORS (% of Fund's net assets) | ||
| Industrials | 18.6 | |
| Information Technology | 15.6 | |
| Financials | 14.1 | |
| Health Care | 13.6 | |
| Consumer Discretionary | 12.4 | |
| Materials | 7.3 | |
| Energy | 6.1 | |
| Consumer Staples | 4.2 | |
| Real Estate | 4.1 | |
| Communication Services | 2.4 | |
| Utilities | 1.1 | |
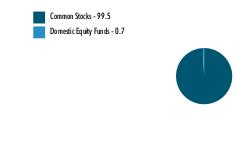
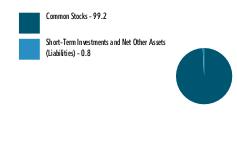
| Common Stocks | 99.5 |
| Domestic Equity Funds | 0.7 |
ASSET ALLOCATION (% of Fund's net assets) |
 |
| Short-Term Investments and Net Other Assets (Liabilities) - (0.2)% |
| United States | 89.2 |
| Canada | 3.9 |
| Thailand | 2.2 |
| Israel | 1.8 |
| United Kingdom | 1.5 |
| Japan | 0.8 |
| Grand Cayman (UK Overseas Ter) | 0.5 |
| Netherlands | 0.1 |
GEOGRAPHIC DIVERSIFICATION (% of Fund's net assets) |
 |
TOP HOLDINGS (% of Fund's net assets) | ||
| Fabrinet | 2.2 | |
| Constellium SE | 1.8 | |
| Patrick Industries Inc | 1.8 | |
| Insight Enterprises Inc | 1.7 | |
| Commercial Metals Co | 1.7 | |
| FTAI Aviation Ltd | 1.6 | |
| Liberty Energy Inc Class A | 1.5 | |
| Lamar Advertising Co Class A | 1.5 | |
| Ensign Group Inc/The | 1.4 | |
| Primerica Inc | 1.4 | |
| 16.6 | ||
| Fidelity, the Fidelity Investments Logo and all other Fidelity trademarks or service marks used herein are trademarks or service marks of FMR LLC. Any third-party marks that are used herein are trademarks or service marks of their respective owners. © 2024 FMR LLC. All rights reserved. | ||
1.9915874.100 299-TSRS-0724 |  | For additional information about the Fund; including its prospectus, financial information, holdings and proxy information, scan the QR code or visit fundresearch.fidelity.com/prospectus/sec |
SEMI-ANNUAL SHAREHOLDER REPORT | AS OF MAY 31, 2024 | ||
| | Fidelity Advisor® Dividend Growth Fund Fidelity Advisor® Dividend Growth Fund Class A : FADAX | |
| Costs of a $10,000 investment | Costs paid as a percentage of a $10,000 investment | ||
| Class A | $ 54 | 0.96% |
KEY FACTS | ||
| Fund Size | $1,516,322,845 | |
| Number of Holdings | 137 | |
| Portfolio Turnover | 60% |
(as of May 31, 2024)
MARKET SECTORS (% of Fund's net assets) | ||
| Information Technology | 26.9 | |
| Industrials | 16.0 | |
| Financials | 15.0 | |
| Energy | 11.3 | |
| Health Care | 8.2 | |
| Communication Services | 5.7 | |
| Utilities | 5.2 | |
| Consumer Staples | 3.6 | |
| Materials | 3.2 | |
| Consumer Discretionary | 2.0 | |
| Real Estate | 1.5 | |
| Common Stocks | 98.6 |
| Short-Term Investments and Net Other Assets (Liabilities) | 1.4 |
ASSET ALLOCATION (% of Fund's net assets) |
 |
| United States | 85.5 |
| Canada | 4.1 |
| United Kingdom | 1.9 |
| Norway | 1.0 |
| India | 1.0 |
| Taiwan | 0.8 |
| Netherlands | 0.7 |
| Korea (South) | 0.6 |
| France | 0.6 |
| Others | 3.8 |
GEOGRAPHIC DIVERSIFICATION (% of Fund's net assets) |
 |
TOP HOLDINGS (% of Fund's net assets) | ||
| NVIDIA Corp | 7.3 | |
| Microsoft Corp | 6.3 | |
| Meta Platforms Inc Class A | 3.5 | |
| Exxon Mobil Corp | 2.8 | |
| Broadcom Inc | 2.2 | |
| Apollo Global Management Inc | 2.0 | |
| Allison Transmission Holdings Inc | 1.8 | |
| Unitedhealth Group Inc | 1.7 | |
| Boeing Co | 1.7 | |
| Cigna Group/The | 1.6 | |
| 30.9 | ||
| Fidelity, the Fidelity Investments Logo and all other Fidelity trademarks or service marks used herein are trademarks or service marks of FMR LLC. Any third-party marks that are used herein are trademarks or service marks of their respective owners. © 2024 FMR LLC. All rights reserved. | ||
1.9915905.100 714-TSRS-0724 |  | For additional information about the Fund; including its prospectus, financial information, holdings and proxy information, scan the QR code or visit fundresearch.fidelity.com/prospectus/sec |
SEMI-ANNUAL SHAREHOLDER REPORT | AS OF MAY 31, 2024 | ||
| | Fidelity Advisor® Equity Value Fund Fidelity Advisor® Equity Value Fund Class C : FAVCX | |
| Costs of a $10,000 investment | Costs paid as a percentage of a $10,000 investment | ||
| Class C | $ 92 | 1.77% |
KEY FACTS | ||
| Fund Size | $211,209,337 | |
| Number of Holdings | 94 | |
| Portfolio Turnover | 30% |
(as of May 31, 2024)
MARKET SECTORS (% of Fund's net assets) | ||
| Financials | 24.7 | |
| Health Care | 16.1 | |
| Consumer Staples | 11.3 | |
| Industrials | 11.2 | |
| Energy | 9.1 | |
| Information Technology | 6.8 | |
| Utilities | 6.2 | |
| Communication Services | 5.2 | |
| Consumer Discretionary | 4.3 | |
| Materials | 2.4 | |
| Real Estate | 1.1 | |
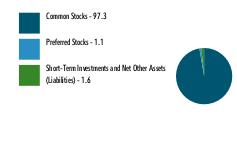
| Common Stocks | 97.3 |
| Preferred Stocks | 1.1 |
| Short-Term Investments and Net Other Assets (Liabilities) | 1.6 |
ASSET ALLOCATION (% of Fund's net assets) |
 |
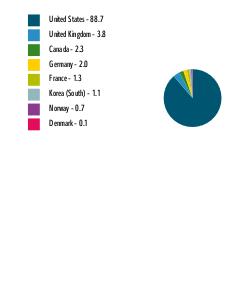
| United States | 88.7 |
| United Kingdom | 3.8 |
| Canada | 2.3 |
| Germany | 2.0 |
| France | 1.3 |
| Korea (South) | 1.1 |
| Norway | 0.7 |
| Denmark | 0.1 |
GEOGRAPHIC DIVERSIFICATION (% of Fund's net assets) |
 |
TOP HOLDINGS (% of Fund's net assets) | ||
| Exxon Mobil Corp | 4.5 | |
| JPMorgan Chase & Co | 3.9 | |
| Chubb Ltd | 3.0 | |
| Cigna Group/The | 3.0 | |
| Berkshire Hathaway Inc Class B | 2.9 | |
| Bank of America Corp | 2.9 | |
| Comcast Corp Class A | 2.7 | |
| Travelers Cos Inc/The | 2.6 | |
| Walt Disney Co/The | 2.5 | |
| PG&E Corp | 2.4 | |
| 30.4 | ||
| Fidelity, the Fidelity Investments Logo and all other Fidelity trademarks or service marks used herein are trademarks or service marks of FMR LLC. Any third-party marks that are used herein are trademarks or service marks of their respective owners. © 2024 FMR LLC. All rights reserved. | ||
1.9915857.100 884-TSRS-0724 |  | For additional information about the Fund; including its prospectus, financial information, holdings and proxy information, scan the QR code or visit fundresearch.fidelity.com/prospectus/sec |
SEMI-ANNUAL SHAREHOLDER REPORT | AS OF MAY 31, 2024 | ||
| | Fidelity Advisor® Dividend Growth Fund Fidelity Advisor® Dividend Growth Fund Class Z : FZADX | |
| Costs of a $10,000 investment | Costs paid as a percentage of a $10,000 investment | ||
| Class Z | $ 35 | 0.62% |
KEY FACTS | ||
| Fund Size | $1,516,322,845 | |
| Number of Holdings | 137 | |
| Portfolio Turnover | 60% |
(as of May 31, 2024)
MARKET SECTORS (% of Fund's net assets) | ||
| Information Technology | 26.9 | |
| Industrials | 16.0 | |
| Financials | 15.0 | |
| Energy | 11.3 | |
| Health Care | 8.2 | |
| Communication Services | 5.7 | |
| Utilities | 5.2 | |
| Consumer Staples | 3.6 | |
| Materials | 3.2 | |
| Consumer Discretionary | 2.0 | |
| Real Estate | 1.5 | |
| Common Stocks | 98.6 |
| Short-Term Investments and Net Other Assets (Liabilities) | 1.4 |
ASSET ALLOCATION (% of Fund's net assets) |
|
| United States | 85.5 |
| Canada | 4.1 |
| United Kingdom | 1.9 |
| Norway | 1.0 |
| India | 1.0 |
| Taiwan | 0.8 |
| Netherlands | 0.7 |
| Korea (South) | 0.6 |
| France | 0.6 |
| Others | 3.8 |
GEOGRAPHIC DIVERSIFICATION (% of Fund's net assets) |
|
TOP HOLDINGS (% of Fund's net assets) | ||
| NVIDIA Corp | 7.3 | |
| Microsoft Corp | 6.3 | |
| Meta Platforms Inc Class A | 3.5 | |
| Exxon Mobil Corp | 2.8 | |
| Broadcom Inc | 2.2 | |
| Apollo Global Management Inc | 2.0 | |
| Allison Transmission Holdings Inc | 1.8 | |
| Unitedhealth Group Inc | 1.7 | |
| Boeing Co | 1.7 | |
| Cigna Group/The | 1.6 | |
| 30.9 | ||
| Fidelity, the Fidelity Investments Logo and all other Fidelity trademarks or service marks used herein are trademarks or service marks of FMR LLC. Any third-party marks that are used herein are trademarks or service marks of their respective owners. © 2024 FMR LLC. All rights reserved. | ||
1.9915904.100 2529-TSRS-0724 | | For additional information about the Fund; including its prospectus, financial information, holdings and proxy information, scan the QR code or visit fundresearch.fidelity.com/prospectus/sec |
SEMI-ANNUAL SHAREHOLDER REPORT | AS OF MAY 31, 2024 | ||
| | Fidelity Advisor® Series Equity Growth Fund Fidelity Advisor® Series Equity Growth Fund : FMFMX | |
| Costs of a $10,000 investment | Costs paid as a percentage of a $10,000 investment | ||
| Fidelity Advisor® Series Equity Growth Fund | $ 0 A | 0.01% |
KEY FACTS | ||
| Fund Size | $1,258,146,234 | |
| Number of Holdings | 149 | |
| Portfolio Turnover | 47% |
(as of May 31, 2024)
MARKET SECTORS (% of Fund's net assets) | ||
| Information Technology | 42.6 | |
| Health Care | 14.5 | |
| Industrials | 12.7 | |
| Communication Services | 11.3 | |
| Consumer Discretionary | 9.1 | |
| Financials | 6.2 | |
| Energy | 2.4 | |
| Consumer Staples | 0.7 | |
| Materials | 0.2 | |
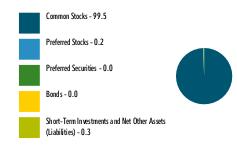
| Common Stocks | 99.5 |
| Preferred Stocks | 0.2 |
| Preferred Securities | 0.0 |
| Bonds | 0.0 |
| Short-Term Investments and Net Other Assets (Liabilities) | 0.3 |
ASSET ALLOCATION (% of Fund's net assets) |
 |
| United States | 86.6 |
| Netherlands | 4.0 |
| Taiwan | 2.1 |
| China | 1.8 |
| Israel | 1.1 |
| India | 0.9 |
| Brazil | 0.9 |
| Japan | 0.6 |
| France | 0.6 |
| Others | 1.4 |
GEOGRAPHIC DIVERSIFICATION (% of Fund's net assets) |
 |
TOP HOLDINGS (% of Fund's net assets) | ||
| Microsoft Corp | 12.6 | |
| NVIDIA Corp | 10.3 | |
| Apple Inc | 5.1 | |
| Alphabet Inc Class A | 5.0 | |
| Amazon.com Inc | 4.7 | |
| Uber Technologies Inc | 3.8 | |
| Eli Lilly & Co | 2.7 | |
| Boston Scientific Corp | 2.6 | |
| Taiwan Semiconductor Manufacturing Co Ltd ADR | 2.1 | |
| Netflix Inc | 2.1 | |
| 51.0 | ||
| Fidelity, the Fidelity Investments Logo and all other Fidelity trademarks or service marks used herein are trademarks or service marks of FMR LLC. Any third-party marks that are used herein are trademarks or service marks of their respective owners. © 2024 FMR LLC. All rights reserved. | ||
1.9915920.100 2645-TSRS-0724 |  | For additional information about the Fund; including its prospectus, financial information, holdings and proxy information, scan the QR code or visit fundresearch.fidelity.com/prospectus/sec |
SEMI-ANNUAL SHAREHOLDER REPORT | AS OF MAY 31, 2024 | ||
| | Fidelity Advisor® Value Strategies Fund Fidelity Advisor® Value Strategies Fund Class M : FASPX | |
| Costs of a $10,000 investment | Costs paid as a percentage of a $10,000 investment | ||
| Class M | $ 72 | 1.34% |
KEY FACTS | ||
| Fund Size | $2,345,592,459 | |
| Number of Holdings | 118 | |
| Portfolio Turnover | 49% |
(as of May 31, 2024)
MARKET SECTORS (% of Fund's net assets) | ||
| Industrials | 20.5 | |
| Financials | 19.3 | |
| Consumer Discretionary | 9.7 | |
| Utilities | 8.8 | |
| Energy | 8.8 | |
| Materials | 8.3 | |
| Real Estate | 6.0 | |
| Health Care | 5.9 | |
| Consumer Staples | 5.1 | |
| Information Technology | 4.3 | |
| Communication Services | 2.5 | |
| Common Stocks | 99.2 |
| Short-Term Investments and Net Other Assets (Liabilities) | 0.8 |
ASSET ALLOCATION (% of Fund's net assets) |
 |
| United States | 91.0 |
| Canada | 6.2 |
| Spain | 0.7 |
| Sweden | 0.6 |
| Puerto Rico | 0.6 |
| Switzerland | 0.5 |
| India | 0.4 |
GEOGRAPHIC DIVERSIFICATION (% of Fund's net assets) |
 |
TOP HOLDINGS (% of Fund's net assets) | ||
| Cigna Group/The | 2.2 | |
| Canadian Natural Resources Ltd | 2.1 | |
| Centene Corp | 1.8 | |
| Constellation Energy Corp | 1.8 | |
| Expro Group Holdings NV | 1.7 | |
| Apollo Global Management Inc | 1.6 | |
| Welltower Inc | 1.6 | |
| PG&E Corp | 1.5 | |
| AES Corp/The | 1.5 | |
| First Citizens BancShares Inc/NC Class A | 1.5 | |
| 17.3 | ||
| Fidelity, the Fidelity Investments Logo and all other Fidelity trademarks or service marks used herein are trademarks or service marks of FMR LLC. Any third-party marks that are used herein are trademarks or service marks of their respective owners. © 2024 FMR LLC. All rights reserved. | ||
1.9915837.100 174-TSRS-0724 |  | For additional information about the Fund; including its prospectus, financial information, holdings and proxy information, scan the QR code or visit fundresearch.fidelity.com/prospectus/sec |
SEMI-ANNUAL SHAREHOLDER REPORT | AS OF MAY 31, 2024 | ||
| | Fidelity Advisor® Equity Income Fund Fidelity Advisor® Equity Income Fund Class A : FEIAX | |
| Costs of a $10,000 investment | Costs paid as a percentage of a $10,000 investment | ||
| Class A | $ 46 | 0.87% |
KEY FACTS | ||
| Fund Size | $1,796,779,158 | |
| Number of Holdings | 116 | |
| Portfolio Turnover | 38% |
(as of May 31, 2024)
MARKET SECTORS (% of Fund's net assets) | ||
| Financials | 20.0 | |
| Health Care | 17.2 | |
| Consumer Staples | 10.9 | |
| Industrials | 8.7 | |
| Utilities | 8.3 | |
| Energy | 8.2 | |
| Information Technology | 6.4 | |
| Communication Services | 6.1 | |
| Real Estate | 4.8 | |
| Consumer Discretionary | 3.9 | |
| Materials | 3.9 | |
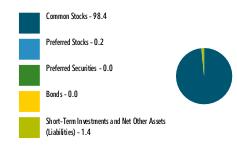
| Common Stocks | 98.4 |
| Short-Term Investments and Net Other Assets (Liabilities) | 1.6 |
ASSET ALLOCATION (% of Fund's net assets) |
 |
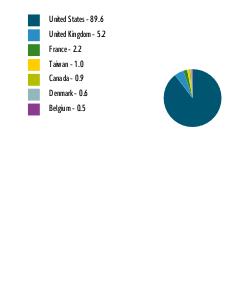
| United States | 89.6 |
| United Kingdom | 5.2 |
| France | 2.2 |
| Taiwan | 1.0 |
| Canada | 0.9 |
| Denmark | 0.6 |
| Belgium | 0.5 |
GEOGRAPHIC DIVERSIFICATION (% of Fund's net assets) |
 |
TOP HOLDINGS (% of Fund's net assets) | ||
| Exxon Mobil Corp | 3.2 | |
| Johnson & Johnson | 2.9 | |
| Comcast Corp Class A | 2.6 | |
| Wells Fargo & Co | 2.6 | |
| Merck & Co Inc | 2.5 | |
| Verizon Communications Inc | 2.1 | |
| M&T Bank Corp | 2.0 | |
| Shell PLC ADR | 2.0 | |
| Chubb Ltd | 2.0 | |
| Unilever PLC ADR | 1.9 | |
| 23.8 | ||
| Fidelity, the Fidelity Investments Logo and all other Fidelity trademarks or service marks used herein are trademarks or service marks of FMR LLC. Any third-party marks that are used herein are trademarks or service marks of their respective owners. © 2024 FMR LLC. All rights reserved. | ||
1.9915845.100 246-TSRS-0724 |  | For additional information about the Fund; including its prospectus, financial information, holdings and proxy information, scan the QR code or visit fundresearch.fidelity.com/prospectus/sec |
SEMI-ANNUAL SHAREHOLDER REPORT | AS OF MAY 31, 2024 | ||
| | Fidelity Advisor® Stock Selector Mid Cap Fund Fidelity Advisor® Stock Selector Mid Cap Fund Class C : FMCEX | |
| Costs of a $10,000 investment | Costs paid as a percentage of a $10,000 investment | ||
| Class C | $ 91 | 1.69% |
KEY FACTS | ||
| Fund Size | $2,232,237,346 | |
| Number of Holdings | 208 | |
| Portfolio Turnover | 53% |
(as of May 31, 2024)
MARKET SECTORS (% of Fund's net assets) | ||
| Industrials | 22.1 | |
| Financials | 15.2 | |
| Consumer Discretionary | 14.7 | |
| Information Technology | 9.3 | |
| Health Care | 7.4 | |
| Real Estate | 6.9 | |
| Materials | 6.8 | |
| Energy | 5.2 | |
| Consumer Staples | 4.8 | |
| Utilities | 3.5 | |
| Communication Services | 1.5 | |
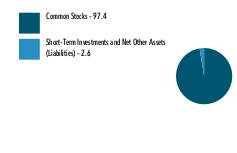
| Common Stocks | 97.4 |
| Short-Term Investments and Net Other Assets (Liabilities) | 2.6 |
ASSET ALLOCATION (% of Fund's net assets) |
 |
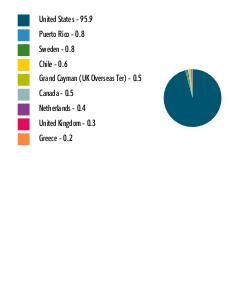
| United States | 95.9 |
| Puerto Rico | 0.8 |
| Sweden | 0.8 |
| Chile | 0.6 |
| Grand Cayman (UK Overseas Ter) | 0.5 |
| Canada | 0.5 |
| Netherlands | 0.4 |
| United Kingdom | 0.3 |
| Greece | 0.2 |
GEOGRAPHIC DIVERSIFICATION (% of Fund's net assets) |
 |
TOP HOLDINGS (% of Fund's net assets) | ||
| Carlisle Cos Inc | 1.5 | |
| Bancorp Inc/The | 1.5 | |
| Vistra Corp | 1.4 | |
| CACI International Inc | 1.3 | |
| XPO Inc | 1.2 | |
| Baldwin Insurance Group Inc/The Class A | 1.2 | |
| KBR Inc | 1.1 | |
| Wesco International Inc | 1.1 | |
| HEICO Corp Class A | 1.1 | |
| Kirby Corp | 1.1 | |
| 12.5 | ||
| Fidelity, the Fidelity Investments Logo and all other Fidelity trademarks or service marks used herein are trademarks or service marks of FMR LLC. Any third-party marks that are used herein are trademarks or service marks of their respective owners. © 2024 FMR LLC. All rights reserved. | ||
1.9915894.100 484-TSRS-0724 |  | For additional information about the Fund; including its prospectus, financial information, holdings and proxy information, scan the QR code or visit fundresearch.fidelity.com/prospectus/sec |
SEMI-ANNUAL SHAREHOLDER REPORT | AS OF MAY 31, 2024 | ||
| | Fidelity Advisor® Growth Opportunities Fund Fidelity Advisor® Growth Opportunities Fund Class A : FAGAX | |
| Costs of a $10,000 investment | Costs paid as a percentage of a $10,000 investment | ||
| Class A | $ 41 | 0.74% |
KEY FACTS | ||
| Fund Size | $21,185,633,611 | |
| Number of Holdings | 202 | |
| Portfolio Turnover | 55% |
(as of May 31, 2024)
MARKET SECTORS (% of Fund's net assets) | ||
| Information Technology | 46.5 | |
| Communication Services | 21.4 | |
| Consumer Discretionary | 9.8 | |
| Health Care | 9.4 | |
| Industrials | 6.8 | |
| Financials | 4.5 | |
| Consumer Staples | 0.5 | |
| Energy | 0.1 | |
| Materials | 0.1 | |
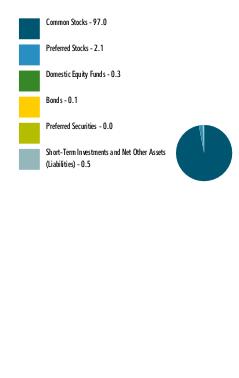
| Common Stocks | 97.0 |
| Preferred Stocks | 2.1 |
| Domestic Equity Funds | 0.3 |
| Bonds | 0.1 |
| Preferred Securities | 0.0 |
| Short-Term Investments and Net Other Assets (Liabilities) | 0.5 |
ASSET ALLOCATION (% of Fund's net assets) |
 |
| United States | 92.6 |
| China | 1.9 |
| Singapore | 1.9 |
| Taiwan | 1.4 |
| France | 0.7 |
| India | 0.3 |
| Ireland | 0.2 |
| Estonia | 0.2 |
| Canada | 0.2 |
| Others | 0.6 |
GEOGRAPHIC DIVERSIFICATION (% of Fund's net assets) |
 |
TOP HOLDINGS (% of Fund's net assets) | ||
| NVIDIA Corp | 13.3 | |
| Microsoft Corp | 9.6 | |
| Meta Platforms Inc Class A | 5.9 | |
| Apple Inc | 5.0 | |
| Amazon.com Inc | 5.0 | |
| Alphabet Inc Class C | 4.7 | |
| Uber Technologies Inc | 2.7 | |
| Roku Inc Class A | 2.3 | |
| Eli Lilly & Co | 2.2 | |
| Sea Ltd Class A ADR | 1.9 | |
| 52.6 | ||
| Fidelity, the Fidelity Investments Logo and all other Fidelity trademarks or service marks used herein are trademarks or service marks of FMR LLC. Any third-party marks that are used herein are trademarks or service marks of their respective owners. © 2024 FMR LLC. All rights reserved. | ||
1.9915861.100 248-TSRS-0724 |  | For additional information about the Fund; including its prospectus, financial information, holdings and proxy information, scan the QR code or visit fundresearch.fidelity.com/prospectus/sec |
SEMI-ANNUAL SHAREHOLDER REPORT | AS OF MAY 31, 2024 | ||
| | Fidelity Advisor® Equity Income Fund Fidelity Advisor® Equity Income Fund Class Z : FZAGX | |
| Costs of a $10,000 investment | Costs paid as a percentage of a $10,000 investment | ||
| Class Z | $ 24 | 0.45% |
KEY FACTS | ||
| Fund Size | $1,796,779,158 | |
| Number of Holdings | 116 | |
| Portfolio Turnover | 38% |
(as of May 31, 2024)
MARKET SECTORS (% of Fund's net assets) | ||
| Financials | 20.0 | |
| Health Care | 17.2 | |
| Consumer Staples | 10.9 | |
| Industrials | 8.7 | |
| Utilities | 8.3 | |
| Energy | 8.2 | |
| Information Technology | 6.4 | |
| Communication Services | 6.1 | |
| Real Estate | 4.8 | |
| Consumer Discretionary | 3.9 | |
| Materials | 3.9 | |
| Common Stocks | 98.4 |
| Short-Term Investments and Net Other Assets (Liabilities) | 1.6 |
ASSET ALLOCATION (% of Fund's net assets) |
|
| United States | 89.6 |
| United Kingdom | 5.2 |
| France | 2.2 |
| Taiwan | 1.0 |
| Canada | 0.9 |
| Denmark | 0.6 |
| Belgium | 0.5 |
GEOGRAPHIC DIVERSIFICATION (% of Fund's net assets) |
|
TOP HOLDINGS (% of Fund's net assets) | ||
| Exxon Mobil Corp | 3.2 | |
| Johnson & Johnson | 2.9 | |
| Comcast Corp Class A | 2.6 | |
| Wells Fargo & Co | 2.6 | |
| Merck & Co Inc | 2.5 | |
| Verizon Communications Inc | 2.1 | |
| M&T Bank Corp | 2.0 | |
| Shell PLC ADR | 2.0 | |
| Chubb Ltd | 2.0 | |
| Unilever PLC ADR | 1.9 | |
| 23.8 | ||
| Fidelity, the Fidelity Investments Logo and all other Fidelity trademarks or service marks used herein are trademarks or service marks of FMR LLC. Any third-party marks that are used herein are trademarks or service marks of their respective owners. © 2024 FMR LLC. All rights reserved. | ||
1.9915846.100 2532-TSRS-0724 | | For additional information about the Fund; including its prospectus, financial information, holdings and proxy information, scan the QR code or visit fundresearch.fidelity.com/prospectus/sec |
SEMI-ANNUAL SHAREHOLDER REPORT | AS OF MAY 31, 2024 | ||
| | Fidelity Advisor® Large Cap Fund Fidelity Advisor® Large Cap Fund Class M : FALGX | |
| Costs of a $10,000 investment | Costs paid as a percentage of a $10,000 investment | ||
| Class M | $ 73 | 1.32% |
KEY FACTS | ||
| Fund Size | $1,387,189,575 | |
| Number of Holdings | 185 | |
| Portfolio Turnover | 22% |
(as of May 31, 2024)
MARKET SECTORS (% of Fund's net assets) | ||
| Information Technology | 21.3 | |
| Financials | 16.5 | |
| Industrials | 16.2 | |
| Health Care | 11.6 | |
| Communication Services | 10.1 | |
| Energy | 9.5 | |
| Consumer Staples | 4.9 | |
| Consumer Discretionary | 3.1 | |
| Materials | 2.0 | |
| Utilities | 1.0 | |
| Real Estate | 0.8 | |
| Common Stocks | 97.0 |
| Short-Term Investments and Net Other Assets (Liabilities) | 3.0 |
ASSET ALLOCATION (% of Fund's net assets) |
 |
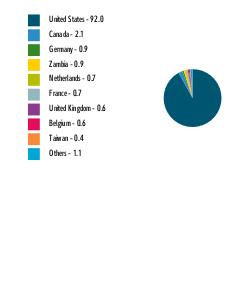
| United States | 92.0 |
| Canada | 2.1 |
| Germany | 0.9 |
| Zambia | 0.9 |
| Netherlands | 0.7 |
| France | 0.7 |
| United Kingdom | 0.6 |
| Belgium | 0.6 |
| Taiwan | 0.4 |
| Others | 1.1 |
GEOGRAPHIC DIVERSIFICATION (% of Fund's net assets) |
 |
TOP HOLDINGS (% of Fund's net assets) | ||
| Microsoft Corp | 7.3 | |
| Exxon Mobil Corp | 6.3 | |
| Wells Fargo & Co | 5.6 | |
| General Electric Co | 5.6 | |
| NVIDIA Corp | 4.4 | |
| Bank of America Corp | 2.7 | |
| Meta Platforms Inc Class A | 2.7 | |
| Apple Inc | 2.6 | |
| Boeing Co | 2.4 | |
| Alphabet Inc Class A | 2.0 | |
| 41.6 | ||
| Fidelity, the Fidelity Investments Logo and all other Fidelity trademarks or service marks used herein are trademarks or service marks of FMR LLC. Any third-party marks that are used herein are trademarks or service marks of their respective owners. © 2024 FMR LLC. All rights reserved. | ||
1.9915900.100 534-TSRS-0724 |  | For additional information about the Fund; including its prospectus, financial information, holdings and proxy information, scan the QR code or visit fundresearch.fidelity.com/prospectus/sec |
SEMI-ANNUAL SHAREHOLDER REPORT | AS OF MAY 31, 2024 | ||
| | Fidelity Advisor® Growth Opportunities Fund Fidelity Advisor® Growth Opportunities Fund Class Z : FZAHX | |
| Costs of a $10,000 investment | Costs paid as a percentage of a $10,000 investment | ||
| Class Z | $ 20 | 0.36% |
KEY FACTS | ||
| Fund Size | $21,185,633,611 | |
| Number of Holdings | 202 | |
| Portfolio Turnover | 55% |
(as of May 31, 2024)
MARKET SECTORS (% of Fund's net assets) | ||
| Information Technology | 46.5 | |
| Communication Services | 21.4 | |
| Consumer Discretionary | 9.8 | |
| Health Care | 9.4 | |
| Industrials | 6.8 | |
| Financials | 4.5 | |
| Consumer Staples | 0.5 | |
| Energy | 0.1 | |
| Materials | 0.1 | |
| Common Stocks | 97.0 |
| Preferred Stocks | 2.1 |
| Domestic Equity Funds | 0.3 |
| Bonds | 0.1 |
| Preferred Securities | 0.0 |
| Short-Term Investments and Net Other Assets (Liabilities) | 0.5 |
ASSET ALLOCATION (% of Fund's net assets) |
|
| United States | 92.6 |
| China | 1.9 |
| Singapore | 1.9 |
| Taiwan | 1.4 |
| France | 0.7 |
| India | 0.3 |
| Ireland | 0.2 |
| Estonia | 0.2 |
| Canada | 0.2 |
| Others | 0.6 |
GEOGRAPHIC DIVERSIFICATION (% of Fund's net assets) |
|
TOP HOLDINGS (% of Fund's net assets) | ||
| NVIDIA Corp | 13.3 | |
| Microsoft Corp | 9.6 | |
| Meta Platforms Inc Class A | 5.9 | |
| Apple Inc | 5.0 | |
| Amazon.com Inc | 5.0 | |
| Alphabet Inc Class C | 4.7 | |
| Uber Technologies Inc | 2.7 | |
| Roku Inc Class A | 2.3 | |
| Eli Lilly & Co | 2.2 | |
| Sea Ltd Class A ADR | 1.9 | |
| 52.6 | ||
| Fidelity, the Fidelity Investments Logo and all other Fidelity trademarks or service marks used herein are trademarks or service marks of FMR LLC. Any third-party marks that are used herein are trademarks or service marks of their respective owners. © 2024 FMR LLC. All rights reserved. | ||
1.9915862.100 2533-TSRS-0724 | | For additional information about the Fund; including its prospectus, financial information, holdings and proxy information, scan the QR code or visit fundresearch.fidelity.com/prospectus/sec |
SEMI-ANNUAL SHAREHOLDER REPORT | AS OF MAY 31, 2024 | ||
| | Fidelity Advisor® Growth & Income Fund Fidelity Advisor® Growth & Income Fund Class A : FGIRX | |
| Costs of a $10,000 investment | Costs paid as a percentage of a $10,000 investment | ||
| Class A | $ 49 | 0.90% |
KEY FACTS | ||
| Fund Size | $1,154,679,756 | |
| Number of Holdings | 188 | |
| Portfolio Turnover | 19% |
(as of May 31, 2024)
MARKET SECTORS (% of Fund's net assets) | ||
| Information Technology | 23.9 | |
| Financials | 18.7 | |
| Industrials | 16.8 | |
| Health Care | 11.9 | |
| Energy | 10.0 | |
| Consumer Staples | 6.0 | |
| Communication Services | 4.0 | |
| Utilities | 2.4 | |
| Consumer Discretionary | 2.2 | |
| Materials | 1.5 | |
| Real Estate | 1.3 | |
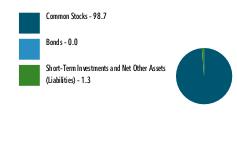
| Common Stocks | 98.7 |
| Bonds | 0.0 |
| Short-Term Investments and Net Other Assets (Liabilities) | 1.3 |
ASSET ALLOCATION (% of Fund's net assets) |
 |
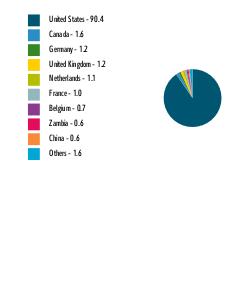
| United States | 90.4 |
| Canada | 1.6 |
| Germany | 1.2 |
| United Kingdom | 1.2 |
| Netherlands | 1.1 |
| France | 1.0 |
| Belgium | 0.7 |
| Zambia | 0.6 |
| China | 0.6 |
| Others | 1.6 |
GEOGRAPHIC DIVERSIFICATION (% of Fund's net assets) |
 |
TOP HOLDINGS (% of Fund's net assets) | ||
| Microsoft Corp | 8.8 | |
| Exxon Mobil Corp | 7.3 | |
| Wells Fargo & Co | 5.8 | |
| General Electric Co | 5.2 | |
| NVIDIA Corp | 4.1 | |
| Bank of America Corp | 2.9 | |
| Apple Inc | 2.8 | |
| Visa Inc Class A | 1.9 | |
| Unitedhealth Group Inc | 1.9 | |
| Boeing Co | 1.8 | |
| 42.5 | ||
| Fidelity, the Fidelity Investments Logo and all other Fidelity trademarks or service marks used herein are trademarks or service marks of FMR LLC. Any third-party marks that are used herein are trademarks or service marks of their respective owners. © 2024 FMR LLC. All rights reserved. | ||
1.9915865.100 272-TSRS-0724 |  | For additional information about the Fund; including its prospectus, financial information, holdings and proxy information, scan the QR code or visit fundresearch.fidelity.com/prospectus/sec |
SEMI-ANNUAL SHAREHOLDER REPORT | AS OF MAY 31, 2024 | ||
| | Fidelity Advisor® Value Strategies Fund Fidelity Advisor® Value Strategies Fund Class A : FSOAX | |
| Costs of a $10,000 investment | Costs paid as a percentage of a $10,000 investment | ||
| Class A | $ 60 | 1.10% |
KEY FACTS | ||
| Fund Size | $2,345,592,459 | |
| Number of Holdings | 118 | |
| Portfolio Turnover | 49% |
(as of May 31, 2024)
MARKET SECTORS (% of Fund's net assets) | ||
| Industrials | 20.5 | |
| Financials | 19.3 | |
| Consumer Discretionary | 9.7 | |
| Utilities | 8.8 | |
| Energy | 8.8 | |
| Materials | 8.3 | |
| Real Estate | 6.0 | |
| Health Care | 5.9 | |
| Consumer Staples | 5.1 | |
| Information Technology | 4.3 | |
| Communication Services | 2.5 | |
| Common Stocks | 99.2 |
| Short-Term Investments and Net Other Assets (Liabilities) | 0.8 |
ASSET ALLOCATION (% of Fund's net assets) |
|
| United States | 91.0 |
| Canada | 6.2 |
| Spain | 0.7 |
| Sweden | 0.6 |
| Puerto Rico | 0.6 |
| Switzerland | 0.5 |
| India | 0.4 |
GEOGRAPHIC DIVERSIFICATION (% of Fund's net assets) |
|
TOP HOLDINGS (% of Fund's net assets) | ||
| Cigna Group/The | 2.2 | |
| Canadian Natural Resources Ltd | 2.1 | |
| Centene Corp | 1.8 | |
| Constellation Energy Corp | 1.8 | |
| Expro Group Holdings NV | 1.7 | |
| Apollo Global Management Inc | 1.6 | |
| Welltower Inc | 1.6 | |
| PG&E Corp | 1.5 | |
| AES Corp/The | 1.5 | |
| First Citizens BancShares Inc/NC Class A | 1.5 | |
| 17.3 | ||
| Fidelity, the Fidelity Investments Logo and all other Fidelity trademarks or service marks used herein are trademarks or service marks of FMR LLC. Any third-party marks that are used herein are trademarks or service marks of their respective owners. © 2024 FMR LLC. All rights reserved. | ||
1.9915839.100 266-TSRS-0724 | | For additional information about the Fund; including its prospectus, financial information, holdings and proxy information, scan the QR code or visit fundresearch.fidelity.com/prospectus/sec |
SEMI-ANNUAL SHAREHOLDER REPORT | AS OF MAY 31, 2024 | ||
| | Fidelity Advisor® Equity Value Fund Fidelity Advisor® Equity Value Fund Class A : FAVAX | |
| Costs of a $10,000 investment | Costs paid as a percentage of a $10,000 investment | ||
| Class A | $ 53 | 1.01% |
KEY FACTS | ||
| Fund Size | $211,209,337 | |
| Number of Holdings | 94 | |
| Portfolio Turnover | 30% |
(as of May 31, 2024)
MARKET SECTORS (% of Fund's net assets) | ||
| Financials | 24.7 | |
| Health Care | 16.1 | |
| Consumer Staples | 11.3 | |
| Industrials | 11.2 | |
| Energy | 9.1 | |
| Information Technology | 6.8 | |
| Utilities | 6.2 | |
| Communication Services | 5.2 | |
| Consumer Discretionary | 4.3 | |
| Materials | 2.4 | |
| Real Estate | 1.1 | |
| Common Stocks | 97.3 |
| Preferred Stocks | 1.1 |
| Short-Term Investments and Net Other Assets (Liabilities) | 1.6 |
ASSET ALLOCATION (% of Fund's net assets) |
|
| United States | 88.7 |
| United Kingdom | 3.8 |
| Canada | 2.3 |
| Germany | 2.0 |
| France | 1.3 |
| Korea (South) | 1.1 |
| Norway | 0.7 |
| Denmark | 0.1 |
GEOGRAPHIC DIVERSIFICATION (% of Fund's net assets) |
|
TOP HOLDINGS (% of Fund's net assets) | ||
| Exxon Mobil Corp | 4.5 | |
| JPMorgan Chase & Co | 3.9 | |
| Chubb Ltd | 3.0 | |
| Cigna Group/The | 3.0 | |
| Berkshire Hathaway Inc Class B | 2.9 | |
| Bank of America Corp | 2.9 | |
| Comcast Corp Class A | 2.7 | |
| Travelers Cos Inc/The | 2.6 | |
| Walt Disney Co/The | 2.5 | |
| PG&E Corp | 2.4 | |
| 30.4 | ||
| Fidelity, the Fidelity Investments Logo and all other Fidelity trademarks or service marks used herein are trademarks or service marks of FMR LLC. Any third-party marks that are used herein are trademarks or service marks of their respective owners. © 2024 FMR LLC. All rights reserved. | ||
1.9915856.100 879-TSRS-0724 | | For additional information about the Fund; including its prospectus, financial information, holdings and proxy information, scan the QR code or visit fundresearch.fidelity.com/prospectus/sec |
SEMI-ANNUAL SHAREHOLDER REPORT | AS OF MAY 31, 2024 | ||
| | Fidelity Advisor® Equity Growth Fund Fidelity Advisor® Equity Growth Fund Class Z : FZAFX | |
| Costs of a $10,000 investment | Costs paid as a percentage of a $10,000 investment | ||
| Class Z | $ 31 | 0.57% |
KEY FACTS | ||
| Fund Size | $10,015,753,076 | |
| Number of Holdings | 150 | |
| Portfolio Turnover | 37% |
(as of May 31, 2024)
MARKET SECTORS (% of Fund's net assets) | ||
| Information Technology | 42.1 | |
| Health Care | 14.4 | |
| Industrials | 12.4 | |
| Communication Services | 11.2 | |
| Consumer Discretionary | 9.1 | |
| Financials | 6.2 | |
| Energy | 2.4 | |
| Consumer Staples | 0.6 | |
| Materials | 0.2 | |
| Common Stocks | 98.4 |
| Preferred Stocks | 0.2 |
| Preferred Securities | 0.0 |
| Bonds | 0.0 |
| Short-Term Investments and Net Other Assets (Liabilities) | 1.4 |
ASSET ALLOCATION (% of Fund's net assets) |
 |
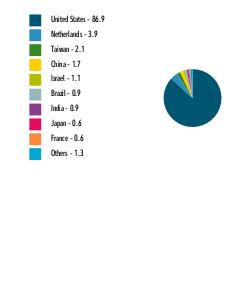
| United States | 86.9 |
| Netherlands | 3.9 |
| Taiwan | 2.1 |
| China | 1.7 |
| Israel | 1.1 |
| Brazil | 0.9 |
| India | 0.9 |
| Japan | 0.6 |
| France | 0.6 |
| Others | 1.3 |
GEOGRAPHIC DIVERSIFICATION (% of Fund's net assets) |
 |
TOP HOLDINGS (% of Fund's net assets) | ||
| Microsoft Corp | 12.6 | |
| NVIDIA Corp | 10.2 | |
| Apple Inc | 5.1 | |
| Alphabet Inc Class A | 5.0 | |
| Amazon.com Inc | 4.7 | |
| Uber Technologies Inc | 3.7 | |
| Eli Lilly & Co | 2.7 | |
| Boston Scientific Corp | 2.6 | |
| Taiwan Semiconductor Manufacturing Co Ltd ADR | 2.1 | |
| Netflix Inc | 2.1 | |
| 50.8 | ||
| Fidelity, the Fidelity Investments Logo and all other Fidelity trademarks or service marks used herein are trademarks or service marks of FMR LLC. Any third-party marks that are used herein are trademarks or service marks of their respective owners. © 2024 FMR LLC. All rights reserved. | ||
1.9915851.100 2531-TSRS-0724 |  | For additional information about the Fund; including its prospectus, financial information, holdings and proxy information, scan the QR code or visit fundresearch.fidelity.com/prospectus/sec |
SEMI-ANNUAL SHAREHOLDER REPORT | AS OF MAY 31, 2024 | ||
| | Fidelity Advisor® Value Strategies Fund Fidelity Advisor® Value Strategies Fund Class C : FVCSX | |
| Costs of a $10,000 investment | Costs paid as a percentage of a $10,000 investment | ||
| Class C | $ 100 | 1.86% |
KEY FACTS | ||
| Fund Size | $2,345,592,459 | |
| Number of Holdings | 118 | |
| Portfolio Turnover | 49% |
(as of May 31, 2024)
MARKET SECTORS (% of Fund's net assets) | ||
| Industrials | 20.5 | |
| Financials | 19.3 | |
| Consumer Discretionary | 9.7 | |
| Utilities | 8.8 | |
| Energy | 8.8 | |
| Materials | 8.3 | |
| Real Estate | 6.0 | |
| Health Care | 5.9 | |
| Consumer Staples | 5.1 | |
| Information Technology | 4.3 | |
| Communication Services | 2.5 | |
| Common Stocks | 99.2 |
| Short-Term Investments and Net Other Assets (Liabilities) | 0.8 |
ASSET ALLOCATION (% of Fund's net assets) |
|
| United States | 91.0 |
| Canada | 6.2 |
| Spain | 0.7 |
| Sweden | 0.6 |
| Puerto Rico | 0.6 |
| Switzerland | 0.5 |
| India | 0.4 |
GEOGRAPHIC DIVERSIFICATION (% of Fund's net assets) |
|
TOP HOLDINGS (% of Fund's net assets) | ||
| Cigna Group/The | 2.2 | |
| Canadian Natural Resources Ltd | 2.1 | |
| Centene Corp | 1.8 | |
| Constellation Energy Corp | 1.8 | |
| Expro Group Holdings NV | 1.7 | |
| Apollo Global Management Inc | 1.6 | |
| Welltower Inc | 1.6 | |
| PG&E Corp | 1.5 | |
| AES Corp/The | 1.5 | |
| First Citizens BancShares Inc/NC Class A | 1.5 | |
| 17.3 | ||
| Fidelity, the Fidelity Investments Logo and all other Fidelity trademarks or service marks used herein are trademarks or service marks of FMR LLC. Any third-party marks that are used herein are trademarks or service marks of their respective owners. © 2024 FMR LLC. All rights reserved. | ||
1.9915840.100 5636-TSRS-0724 | | For additional information about the Fund; including its prospectus, financial information, holdings and proxy information, scan the QR code or visit fundresearch.fidelity.com/prospectus/sec |
SEMI-ANNUAL SHAREHOLDER REPORT | AS OF MAY 31, 2024 | ||
| | Fidelity Advisor® Equity Income Fund Fidelity Advisor® Equity Income Fund Class C : FEICX | |
| Costs of a $10,000 investment | Costs paid as a percentage of a $10,000 investment | ||
| Class C | $ 86 | 1.63% |
KEY FACTS | ||
| Fund Size | $1,796,779,158 | |
| Number of Holdings | 116 | |
| Portfolio Turnover | 38% |
(as of May 31, 2024)
MARKET SECTORS (% of Fund's net assets) | ||
| Financials | 20.0 | |
| Health Care | 17.2 | |
| Consumer Staples | 10.9 | |
| Industrials | 8.7 | |
| Utilities | 8.3 | |
| Energy | 8.2 | |
| Information Technology | 6.4 | |
| Communication Services | 6.1 | |
| Real Estate | 4.8 | |
| Consumer Discretionary | 3.9 | |
| Materials | 3.9 | |
| Common Stocks | 98.4 |
| Short-Term Investments and Net Other Assets (Liabilities) | 1.6 |
ASSET ALLOCATION (% of Fund's net assets) |
|
| United States | 89.6 |
| United Kingdom | 5.2 |
| France | 2.2 |
| Taiwan | 1.0 |
| Canada | 0.9 |
| Denmark | 0.6 |
| Belgium | 0.5 |
GEOGRAPHIC DIVERSIFICATION (% of Fund's net assets) |
|
TOP HOLDINGS (% of Fund's net assets) | ||
| Exxon Mobil Corp | 3.2 | |
| Johnson & Johnson | 2.9 | |
| Comcast Corp Class A | 2.6 | |
| Wells Fargo & Co | 2.6 | |
| Merck & Co Inc | 2.5 | |
| Verizon Communications Inc | 2.1 | |
| M&T Bank Corp | 2.0 | |
| Shell PLC ADR | 2.0 | |
| Chubb Ltd | 2.0 | |
| Unilever PLC ADR | 1.9 | |
| 23.8 | ||
| Fidelity, the Fidelity Investments Logo and all other Fidelity trademarks or service marks used herein are trademarks or service marks of FMR LLC. Any third-party marks that are used herein are trademarks or service marks of their respective owners. © 2024 FMR LLC. All rights reserved. | ||
1.9915848.100 480-TSRS-0724 | | For additional information about the Fund; including its prospectus, financial information, holdings and proxy information, scan the QR code or visit fundresearch.fidelity.com/prospectus/sec |
SEMI-ANNUAL SHAREHOLDER REPORT | AS OF MAY 31, 2024 | ||
| | Fidelity Advisor® Small Cap Fund Fidelity Advisor® Small Cap Fund Class I : FSCIX | |
| Costs of a $10,000 investment | Costs paid as a percentage of a $10,000 investment | ||
| Class I | $ 59 | 1.07% |
KEY FACTS | ||
| Fund Size | $1,955,004,625 | |
| Number of Holdings | 137 | |
| Portfolio Turnover | 36% |
(as of May 31, 2024)
MARKET SECTORS (% of Fund's net assets) | ||
| Industrials | 18.6 | |
| Information Technology | 15.6 | |
| Financials | 14.1 | |
| Health Care | 13.6 | |
| Consumer Discretionary | 12.4 | |
| Materials | 7.3 | |
| Energy | 6.1 | |
| Consumer Staples | 4.2 | |
| Real Estate | 4.1 | |
| Communication Services | 2.4 | |
| Utilities | 1.1 | |
| Common Stocks | 99.5 |
| Domestic Equity Funds | 0.7 |
ASSET ALLOCATION (% of Fund's net assets) |
|
| Short-Term Investments and Net Other Assets (Liabilities) - (0.2)% |
| United States | 89.2 |
| Canada | 3.9 |
| Thailand | 2.2 |
| Israel | 1.8 |
| United Kingdom | 1.5 |
| Japan | 0.8 |
| Grand Cayman (UK Overseas Ter) | 0.5 |
| Netherlands | 0.1 |
GEOGRAPHIC DIVERSIFICATION (% of Fund's net assets) |
|
TOP HOLDINGS (% of Fund's net assets) | ||
| Fabrinet | 2.2 | |
| Constellium SE | 1.8 | |
| Patrick Industries Inc | 1.8 | |
| Insight Enterprises Inc | 1.7 | |
| Commercial Metals Co | 1.7 | |
| FTAI Aviation Ltd | 1.6 | |
| Liberty Energy Inc Class A | 1.5 | |
| Lamar Advertising Co Class A | 1.5 | |
| Ensign Group Inc/The | 1.4 | |
| Primerica Inc | 1.4 | |
| 16.6 | ||
| Fidelity, the Fidelity Investments Logo and all other Fidelity trademarks or service marks used herein are trademarks or service marks of FMR LLC. Any third-party marks that are used herein are trademarks or service marks of their respective owners. © 2024 FMR LLC. All rights reserved. | ||
1.9915873.100 298-TSRS-0724 | | For additional information about the Fund; including its prospectus, financial information, holdings and proxy information, scan the QR code or visit fundresearch.fidelity.com/prospectus/sec |
SEMI-ANNUAL SHAREHOLDER REPORT | AS OF MAY 31, 2024 | ||
| | Fidelity Advisor® Value Strategies Fund Fidelity® Value Strategies Fund : FSLSX | |
| Costs of a $10,000 investment | Costs paid as a percentage of a $10,000 investment | ||
| Fidelity® Value Strategies Fund | $ 45 | 0.83% |
KEY FACTS | ||
| Fund Size | $2,345,592,459 | |
| Number of Holdings | 118 | |
| Portfolio Turnover | 49% |
(as of May 31, 2024)
MARKET SECTORS (% of Fund's net assets) | ||
| Industrials | 20.5 | |
| Financials | 19.3 | |
| Consumer Discretionary | 9.7 | |
| Utilities | 8.8 | |
| Energy | 8.8 | |
| Materials | 8.3 | |
| Real Estate | 6.0 | |
| Health Care | 5.9 | |
| Consumer Staples | 5.1 | |
| Information Technology | 4.3 | |
| Communication Services | 2.5 | |
| Common Stocks | 99.2 |
| Short-Term Investments and Net Other Assets (Liabilities) | 0.8 |
ASSET ALLOCATION (% of Fund's net assets) |
|
| United States | 91.0 |
| Canada | 6.2 |
| Spain | 0.7 |
| Sweden | 0.6 |
| Puerto Rico | 0.6 |
| Switzerland | 0.5 |
| India | 0.4 |
GEOGRAPHIC DIVERSIFICATION (% of Fund's net assets) |
|
TOP HOLDINGS (% of Fund's net assets) | ||
| Cigna Group/The | 2.2 | |
| Canadian Natural Resources Ltd | 2.1 | |
| Centene Corp | 1.8 | |
| Constellation Energy Corp | 1.8 | |
| Expro Group Holdings NV | 1.7 | |
| Apollo Global Management Inc | 1.6 | |
| Welltower Inc | 1.6 | |
| PG&E Corp | 1.5 | |
| AES Corp/The | 1.5 | |
| First Citizens BancShares Inc/NC Class A | 1.5 | |
| 17.3 | ||
| Fidelity, the Fidelity Investments Logo and all other Fidelity trademarks or service marks used herein are trademarks or service marks of FMR LLC. Any third-party marks that are used herein are trademarks or service marks of their respective owners. © 2024 FMR LLC. All rights reserved. | ||
1.9915836.100 14-TSRS-0724 | | For additional information about the Fund; including its prospectus, financial information, holdings and proxy information, scan the QR code or visit fundresearch.fidelity.com/prospectus/sec |
SEMI-ANNUAL SHAREHOLDER REPORT | AS OF MAY 31, 2024 | ||
| | Fidelity Advisor® Equity Value Fund Fidelity Advisor® Equity Value Fund Class I : FAIVX | |
| Costs of a $10,000 investment | Costs paid as a percentage of a $10,000 investment | ||
| Class I | $ 39 | 0.74% |
KEY FACTS | ||
| Fund Size | $211,209,337 | |
| Number of Holdings | 94 | |
| Portfolio Turnover | 30% |
(as of May 31, 2024)
MARKET SECTORS (% of Fund's net assets) | ||
| Financials | 24.7 | |
| Health Care | 16.1 | |
| Consumer Staples | 11.3 | |
| Industrials | 11.2 | |
| Energy | 9.1 | |
| Information Technology | 6.8 | |
| Utilities | 6.2 | |
| Communication Services | 5.2 | |
| Consumer Discretionary | 4.3 | |
| Materials | 2.4 | |
| Real Estate | 1.1 | |
| Common Stocks | 97.3 |
| Preferred Stocks | 1.1 |
| Short-Term Investments and Net Other Assets (Liabilities) | 1.6 |
ASSET ALLOCATION (% of Fund's net assets) |
|
| United States | 88.7 |
| United Kingdom | 3.8 |
| Canada | 2.3 |
| Germany | 2.0 |
| France | 1.3 |
| Korea (South) | 1.1 |
| Norway | 0.7 |
| Denmark | 0.1 |
GEOGRAPHIC DIVERSIFICATION (% of Fund's net assets) |
|
TOP HOLDINGS (% of Fund's net assets) | ||
| Exxon Mobil Corp | 4.5 | |
| JPMorgan Chase & Co | 3.9 | |
| Chubb Ltd | 3.0 | |
| Cigna Group/The | 3.0 | |
| Berkshire Hathaway Inc Class B | 2.9 | |
| Bank of America Corp | 2.9 | |
| Comcast Corp Class A | 2.7 | |
| Travelers Cos Inc/The | 2.6 | |
| Walt Disney Co/The | 2.5 | |
| PG&E Corp | 2.4 | |
| 30.4 | ||
| Fidelity, the Fidelity Investments Logo and all other Fidelity trademarks or service marks used herein are trademarks or service marks of FMR LLC. Any third-party marks that are used herein are trademarks or service marks of their respective owners. © 2024 FMR LLC. All rights reserved. | ||
1.9915859.100 893-TSRS-0724 | | For additional information about the Fund; including its prospectus, financial information, holdings and proxy information, scan the QR code or visit fundresearch.fidelity.com/prospectus/sec |
SEMI-ANNUAL SHAREHOLDER REPORT | AS OF MAY 31, 2024 | ||
| | Fidelity® Real Estate High Income Fund Fidelity® Real Estate High Income Fund true | |
| Costs of a $10,000 investment | Costs paid as a percentage of a $10,000 investment | ||
| Fidelity® Real Estate High Income Fund | $ 40 | 0.77% |
KEY FACTS | ||
| Fund Size | $552,544,122 | |
| Number of Holdings | 335 | |
| Portfolio Turnover | 36% |
(as of May 31, 2024)
| AAA | 9.7 |
| AA | 0.9 |
| A | 1.7 |
| BBB | 8.6 |
| BB | 11.0 |
| B | 8.1 |
| CCC,CC,C | 5.2 |
| D | 0.0 |
| Not Rated | 54.2 |
| Equities | 0.0 |
| Short-Term Investments and Net Other Assets (Liabilities) | 0.6 |
QUALITY DIVERSIFICATION (% of Fund's net assets) |
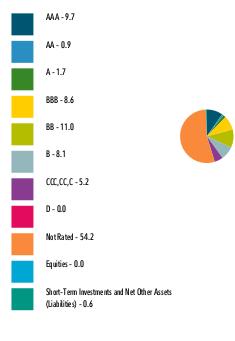 |
| We have used ratings from Moody's Investors Service, Inc. Where Moody's® ratings are not available, we have used S&P® ratings. All ratings are as of the date indicated and do not reflect subsequent changes. |
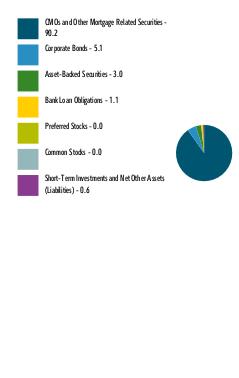
| CMOs and Other Mortgage Related Securities | 90.2 |
| Corporate Bonds | 5.1 |
| Asset-Backed Securities | 3.0 |
| Bank Loan Obligations | 1.1 |
| Preferred Stocks | 0.0 |
| Common Stocks | 0.0 |
| Short-Term Investments and Net Other Assets (Liabilities) | 0.6 |
ASSET ALLOCATION (% of Fund's net assets) |
 |
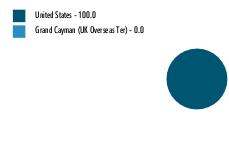
| United States | 100.0 |
| Grand Cayman (UK Overseas Ter) | 0.0 |
GEOGRAPHIC DIVERSIFICATION (% of Fund's net assets) |
 |
TOP HOLDINGS (% of Fund's net assets) | ||
| BX Commercial Mortgage Trust 2020-VIVA | 2.7 | |
| BX Trust 2019-OC11 | 2.2 | |
| Hilton USA Trust | 2.0 | |
| MHC Commercial Mortgage Trust | 1.9 | |
| BX Trust 2021-ACNT | 1.8 | |
| CAMB Commercial Mortgage Trust | 1.6 | |
| JPMorgan Chase Commercial Mortgage Securities Trust 2012-CIBX | 1.6 | |
| BX Trust 2021-VOLT | 1.5 | |
| BX Commercial Mortgage Trust 2021-SOAR | 1.2 | |
| BX Commercial Mortgage Trust 2021-VINO | 1.0 | |
| 17.5 | ||
| Fidelity, the Fidelity Investments Logo and all other Fidelity trademarks or service marks used herein are trademarks or service marks of FMR LLC. Any third-party marks that are used herein are trademarks or service marks of their respective owners. © 2024 FMR LLC. All rights reserved. | ||
1.9915903.100 671-TSRS-0724 |  | For additional information about the Fund; including its prospectus, financial information, holdings and proxy information, scan the QR code or visit fundresearch.fidelity.com/prospectus/sec |
SEMI-ANNUAL SHAREHOLDER REPORT | AS OF MAY 31, 2024 | ||
| | Fidelity Advisor® Dividend Growth Fund Fidelity Advisor® Dividend Growth Fund Class C : FDGCX | |
| Costs of a $10,000 investment | Costs paid as a percentage of a $10,000 investment | ||
| Class C | $ 96 | 1.72% |
KEY FACTS | ||
| Fund Size | $1,516,322,845 | |
| Number of Holdings | 137 | |
| Portfolio Turnover | 60% |
(as of May 31, 2024)
MARKET SECTORS (% of Fund's net assets) | ||
| Information Technology | 26.9 | |
| Industrials | 16.0 | |
| Financials | 15.0 | |
| Energy | 11.3 | |
| Health Care | 8.2 | |
| Communication Services | 5.7 | |
| Utilities | 5.2 | |
| Consumer Staples | 3.6 | |
| Materials | 3.2 | |
| Consumer Discretionary | 2.0 | |
| Real Estate | 1.5 | |
| Common Stocks | 98.6 |
| Short-Term Investments and Net Other Assets (Liabilities) | 1.4 |
ASSET ALLOCATION (% of Fund's net assets) |
|
| United States | 85.5 |
| Canada | 4.1 |
| United Kingdom | 1.9 |
| Norway | 1.0 |
| India | 1.0 |
| Taiwan | 0.8 |
| Netherlands | 0.7 |
| Korea (South) | 0.6 |
| France | 0.6 |
| Others | 3.8 |
GEOGRAPHIC DIVERSIFICATION (% of Fund's net assets) |
|
TOP HOLDINGS (% of Fund's net assets) | ||
| NVIDIA Corp | 7.3 | |
| Microsoft Corp | 6.3 | |
| Meta Platforms Inc Class A | 3.5 | |
| Exxon Mobil Corp | 2.8 | |
| Broadcom Inc | 2.2 | |
| Apollo Global Management Inc | 2.0 | |
| Allison Transmission Holdings Inc | 1.8 | |
| Unitedhealth Group Inc | 1.7 | |
| Boeing Co | 1.7 | |
| Cigna Group/The | 1.6 | |
| 30.9 | ||
| Fidelity, the Fidelity Investments Logo and all other Fidelity trademarks or service marks used herein are trademarks or service marks of FMR LLC. Any third-party marks that are used herein are trademarks or service marks of their respective owners. © 2024 FMR LLC. All rights reserved. | ||
1.9915906.100 716-TSRS-0724 | | For additional information about the Fund; including its prospectus, financial information, holdings and proxy information, scan the QR code or visit fundresearch.fidelity.com/prospectus/sec |
SEMI-ANNUAL SHAREHOLDER REPORT | AS OF MAY 31, 2024 | ||
| | Fidelity Advisor® Small Cap Fund Fidelity Advisor® Small Cap Fund Class A : FSCDX | |
| Costs of a $10,000 investment | Costs paid as a percentage of a $10,000 investment | ||
| Class A | $ 73 | 1.33% |
KEY FACTS | ||
| Fund Size | $1,955,004,625 | |
| Number of Holdings | 137 | |
| Portfolio Turnover | 36% |
(as of May 31, 2024)
MARKET SECTORS (% of Fund's net assets) | ||
| Industrials | 18.6 | |
| Information Technology | 15.6 | |
| Financials | 14.1 | |
| Health Care | 13.6 | |
| Consumer Discretionary | 12.4 | |
| Materials | 7.3 | |
| Energy | 6.1 | |
| Consumer Staples | 4.2 | |
| Real Estate | 4.1 | |
| Communication Services | 2.4 | |
| Utilities | 1.1 | |
| Common Stocks | 99.5 |
| Domestic Equity Funds | 0.7 |
ASSET ALLOCATION (% of Fund's net assets) |
|
| Short-Term Investments and Net Other Assets (Liabilities) - (0.2)% |
| United States | 89.2 |
| Canada | 3.9 |
| Thailand | 2.2 |
| Israel | 1.8 |
| United Kingdom | 1.5 |
| Japan | 0.8 |
| Grand Cayman (UK Overseas Ter) | 0.5 |
| Netherlands | 0.1 |
GEOGRAPHIC DIVERSIFICATION (% of Fund's net assets) |
|
TOP HOLDINGS (% of Fund's net assets) | ||
| Fabrinet | 2.2 | |
| Constellium SE | 1.8 | |
| Patrick Industries Inc | 1.8 | |
| Insight Enterprises Inc | 1.7 | |
| Commercial Metals Co | 1.7 | |
| FTAI Aviation Ltd | 1.6 | |
| Liberty Energy Inc Class A | 1.5 | |
| Lamar Advertising Co Class A | 1.5 | |
| Ensign Group Inc/The | 1.4 | |
| Primerica Inc | 1.4 | |
| 16.6 | ||
| Fidelity, the Fidelity Investments Logo and all other Fidelity trademarks or service marks used herein are trademarks or service marks of FMR LLC. Any third-party marks that are used herein are trademarks or service marks of their respective owners. © 2024 FMR LLC. All rights reserved. | ||
1.9915871.100 294-TSRS-0724 | | For additional information about the Fund; including its prospectus, financial information, holdings and proxy information, scan the QR code or visit fundresearch.fidelity.com/prospectus/sec |
SEMI-ANNUAL SHAREHOLDER REPORT | AS OF MAY 31, 2024 | ||
| | Fidelity Advisor® Value Strategies Fund Fidelity® Value Strategies Fund Class K : FVSKX | |
| Costs of a $10,000 investment | Costs paid as a percentage of a $10,000 investment | ||
| Class K | $ 39 | 0.73% |
KEY FACTS | ||
| Fund Size | $2,345,592,459 | |
| Number of Holdings | 118 | |
| Portfolio Turnover | 49% |
(as of May 31, 2024)
MARKET SECTORS (% of Fund's net assets) | ||
| Industrials | 20.5 | |
| Financials | 19.3 | |
| Consumer Discretionary | 9.7 | |
| Utilities | 8.8 | |
| Energy | 8.8 | |
| Materials | 8.3 | |
| Real Estate | 6.0 | |
| Health Care | 5.9 | |
| Consumer Staples | 5.1 | |
| Information Technology | 4.3 | |
| Communication Services | 2.5 | |
| Common Stocks | 99.2 |
| Short-Term Investments and Net Other Assets (Liabilities) | 0.8 |
ASSET ALLOCATION (% of Fund's net assets) |
|
| United States | 91.0 |
| Canada | 6.2 |
| Spain | 0.7 |
| Sweden | 0.6 |
| Puerto Rico | 0.6 |
| Switzerland | 0.5 |
| India | 0.4 |
GEOGRAPHIC DIVERSIFICATION (% of Fund's net assets) |
|
TOP HOLDINGS (% of Fund's net assets) | ||
| Cigna Group/The | 2.2 | |
| Canadian Natural Resources Ltd | 2.1 | |
| Centene Corp | 1.8 | |
| Constellation Energy Corp | 1.8 | |
| Expro Group Holdings NV | 1.7 | |
| Apollo Global Management Inc | 1.6 | |
| Welltower Inc | 1.6 | |
| PG&E Corp | 1.5 | |
| AES Corp/The | 1.5 | |
| First Citizens BancShares Inc/NC Class A | 1.5 | |
| 17.3 | ||
| Fidelity, the Fidelity Investments Logo and all other Fidelity trademarks or service marks used herein are trademarks or service marks of FMR LLC. Any third-party marks that are used herein are trademarks or service marks of their respective owners. © 2024 FMR LLC. All rights reserved. | ||
1.9915838.100 2104-TSRS-0724 | | For additional information about the Fund; including its prospectus, financial information, holdings and proxy information, scan the QR code or visit fundresearch.fidelity.com/prospectus/sec |
SEMI-ANNUAL SHAREHOLDER REPORT | AS OF MAY 31, 2024 | ||
| | Fidelity Advisor® Dividend Growth Fund Fidelity Advisor® Dividend Growth Fund Class M : FDGTX | |
| Costs of a $10,000 investment | Costs paid as a percentage of a $10,000 investment | ||
| Class M | $ 67 | 1.20% |
KEY FACTS | ||
| Fund Size | $1,516,322,845 | |
| Number of Holdings | 137 | |
| Portfolio Turnover | 60% |
(as of May 31, 2024)
MARKET SECTORS (% of Fund's net assets) | ||
| Information Technology | 26.9 | |
| Industrials | 16.0 | |
| Financials | 15.0 | |
| Energy | 11.3 | |
| Health Care | 8.2 | |
| Communication Services | 5.7 | |
| Utilities | 5.2 | |
| Consumer Staples | 3.6 | |
| Materials | 3.2 | |
| Consumer Discretionary | 2.0 | |
| Real Estate | 1.5 | |
| Common Stocks | 98.6 |
| Short-Term Investments and Net Other Assets (Liabilities) | 1.4 |
ASSET ALLOCATION (% of Fund's net assets) |
|
| United States | 85.5 |
| Canada | 4.1 |
| United Kingdom | 1.9 |
| Norway | 1.0 |
| India | 1.0 |
| Taiwan | 0.8 |
| Netherlands | 0.7 |
| Korea (South) | 0.6 |
| France | 0.6 |
| Others | 3.8 |
GEOGRAPHIC DIVERSIFICATION (% of Fund's net assets) |
|
TOP HOLDINGS (% of Fund's net assets) | ||
| NVIDIA Corp | 7.3 | |
| Microsoft Corp | 6.3 | |
| Meta Platforms Inc Class A | 3.5 | |
| Exxon Mobil Corp | 2.8 | |
| Broadcom Inc | 2.2 | |
| Apollo Global Management Inc | 2.0 | |
| Allison Transmission Holdings Inc | 1.8 | |
| Unitedhealth Group Inc | 1.7 | |
| Boeing Co | 1.7 | |
| Cigna Group/The | 1.6 | |
| 30.9 | ||
| Fidelity, the Fidelity Investments Logo and all other Fidelity trademarks or service marks used herein are trademarks or service marks of FMR LLC. Any third-party marks that are used herein are trademarks or service marks of their respective owners. © 2024 FMR LLC. All rights reserved. | ||
1.9915908.100 720-TSRS-0724 | | For additional information about the Fund; including its prospectus, financial information, holdings and proxy information, scan the QR code or visit fundresearch.fidelity.com/prospectus/sec |
SEMI-ANNUAL SHAREHOLDER REPORT | AS OF MAY 31, 2024 | ||
| | Fidelity Advisor® Growth & Income Fund Fidelity Advisor® Growth & Income Fund Class Z : FGIZX | |
| Costs of a $10,000 investment | Costs paid as a percentage of a $10,000 investment | ||
| Class Z | $ 26 | 0.48% |
KEY FACTS | ||
| Fund Size | $1,154,679,756 | |
| Number of Holdings | 188 | |
| Portfolio Turnover | 19% |
(as of May 31, 2024)
MARKET SECTORS (% of Fund's net assets) | ||
| Information Technology | 23.9 | |
| Financials | 18.7 | |
| Industrials | 16.8 | |
| Health Care | 11.9 | |
| Energy | 10.0 | |
| Consumer Staples | 6.0 | |
| Communication Services | 4.0 | |
| Utilities | 2.4 | |
| Consumer Discretionary | 2.2 | |
| Materials | 1.5 | |
| Real Estate | 1.3 | |
| Common Stocks | 98.7 |
| Bonds | 0.0 |
| Short-Term Investments and Net Other Assets (Liabilities) | 1.3 |
ASSET ALLOCATION (% of Fund's net assets) |
|
| United States | 90.4 |
| Canada | 1.6 |
| Germany | 1.2 |
| United Kingdom | 1.2 |
| Netherlands | 1.1 |
| France | 1.0 |
| Belgium | 0.7 |
| Zambia | 0.6 |
| China | 0.6 |
| Others | 1.6 |
GEOGRAPHIC DIVERSIFICATION (% of Fund's net assets) |
|
TOP HOLDINGS (% of Fund's net assets) | ||
| Microsoft Corp | 8.8 | |
| Exxon Mobil Corp | 7.3 | |
| Wells Fargo & Co | 5.8 | |
| General Electric Co | 5.2 | |
| NVIDIA Corp | 4.1 | |
| Bank of America Corp | 2.9 | |
| Apple Inc | 2.8 | |
| Visa Inc Class A | 1.9 | |
| Unitedhealth Group Inc | 1.9 | |
| Boeing Co | 1.8 | |
| 42.5 | ||
| Fidelity, the Fidelity Investments Logo and all other Fidelity trademarks or service marks used herein are trademarks or service marks of FMR LLC. Any third-party marks that are used herein are trademarks or service marks of their respective owners. © 2024 FMR LLC. All rights reserved. | ||
1.9915868.100 2885-TSRS-0724 | | For additional information about the Fund; including its prospectus, financial information, holdings and proxy information, scan the QR code or visit fundresearch.fidelity.com/prospectus/sec |
SEMI-ANNUAL SHAREHOLDER REPORT | AS OF MAY 31, 2024 | ||
| | Fidelity Advisor® Growth Opportunities Fund Fidelity Advisor® Growth Opportunities Fund Class I : FAGCX | |
| Costs of a $10,000 investment | Costs paid as a percentage of a $10,000 investment | ||
| Class I | $ 27 | 0.49% |
KEY FACTS | ||
| Fund Size | $21,185,633,611 | |
| Number of Holdings | 202 | |
| Portfolio Turnover | 55% |
(as of May 31, 2024)
MARKET SECTORS (% of Fund's net assets) | ||
| Information Technology | 46.5 | |
| Communication Services | 21.4 | |
| Consumer Discretionary | 9.8 | |
| Health Care | 9.4 | |
| Industrials | 6.8 | |
| Financials | 4.5 | |
| Consumer Staples | 0.5 | |
| Energy | 0.1 | |
| Materials | 0.1 | |
| Common Stocks | 97.0 |
| Preferred Stocks | 2.1 |
| Domestic Equity Funds | 0.3 |
| Bonds | 0.1 |
| Preferred Securities | 0.0 |
| Short-Term Investments and Net Other Assets (Liabilities) | 0.5 |
ASSET ALLOCATION (% of Fund's net assets) |
|
| United States | 92.6 |
| China | 1.9 |
| Singapore | 1.9 |
| Taiwan | 1.4 |
| France | 0.7 |
| India | 0.3 |
| Ireland | 0.2 |
| Estonia | 0.2 |
| Canada | 0.2 |
| Others | 0.6 |
GEOGRAPHIC DIVERSIFICATION (% of Fund's net assets) |
|
TOP HOLDINGS (% of Fund's net assets) | ||
| NVIDIA Corp | 13.3 | |
| Microsoft Corp | 9.6 | |
| Meta Platforms Inc Class A | 5.9 | |
| Apple Inc | 5.0 | |
| Amazon.com Inc | 5.0 | |
| Alphabet Inc Class C | 4.7 | |
| Uber Technologies Inc | 2.7 | |
| Roku Inc Class A | 2.3 | |
| Eli Lilly & Co | 2.2 | |
| Sea Ltd Class A ADR | 1.9 | |
| 52.6 | ||
| Fidelity, the Fidelity Investments Logo and all other Fidelity trademarks or service marks used herein are trademarks or service marks of FMR LLC. Any third-party marks that are used herein are trademarks or service marks of their respective owners. © 2024 FMR LLC. All rights reserved. | ||
1.9915864.100 688-TSRS-0724 | | For additional information about the Fund; including its prospectus, financial information, holdings and proxy information, scan the QR code or visit fundresearch.fidelity.com/prospectus/sec |
SEMI-ANNUAL SHAREHOLDER REPORT | AS OF MAY 31, 2024 | ||
| | Fidelity Advisor® Growth Opportunities Fund Fidelity Advisor® Growth Opportunities Fund Class M : FAGOX | |
| Costs of a $10,000 investment | Costs paid as a percentage of a $10,000 investment | ||
| Class M | $ 55 | 0.98% |
KEY FACTS | ||
| Fund Size | $21,185,633,611 | |
| Number of Holdings | 202 | |
| Portfolio Turnover | 55% |
(as of May 31, 2024)
MARKET SECTORS (% of Fund's net assets) | ||
| Information Technology | 46.5 | |
| Communication Services | 21.4 | |
| Consumer Discretionary | 9.8 | |
| Health Care | 9.4 | |
| Industrials | 6.8 | |
| Financials | 4.5 | |
| Consumer Staples | 0.5 | |
| Energy | 0.1 | |
| Materials | 0.1 | |
| Common Stocks | 97.0 |
| Preferred Stocks | 2.1 |
| Domestic Equity Funds | 0.3 |
| Bonds | 0.1 |
| Preferred Securities | 0.0 |
| Short-Term Investments and Net Other Assets (Liabilities) | 0.5 |
ASSET ALLOCATION (% of Fund's net assets) |
|
| United States | 92.6 |
| China | 1.9 |
| Singapore | 1.9 |
| Taiwan | 1.4 |
| France | 0.7 |
| India | 0.3 |
| Ireland | 0.2 |
| Estonia | 0.2 |
| Canada | 0.2 |
| Others | 0.6 |
GEOGRAPHIC DIVERSIFICATION (% of Fund's net assets) |
|
TOP HOLDINGS (% of Fund's net assets) | ||
| NVIDIA Corp | 13.3 | |
| Microsoft Corp | 9.6 | |
| Meta Platforms Inc Class A | 5.9 | |
| Apple Inc | 5.0 | |
| Amazon.com Inc | 5.0 | |
| Alphabet Inc Class C | 4.7 | |
| Uber Technologies Inc | 2.7 | |
| Roku Inc Class A | 2.3 | |
| Eli Lilly & Co | 2.2 | |
| Sea Ltd Class A ADR | 1.9 | |
| 52.6 | ||
| Fidelity, the Fidelity Investments Logo and all other Fidelity trademarks or service marks used herein are trademarks or service marks of FMR LLC. Any third-party marks that are used herein are trademarks or service marks of their respective owners. © 2024 FMR LLC. All rights reserved. | ||
1.9915860.100 223-TSRS-0724 | | For additional information about the Fund; including its prospectus, financial information, holdings and proxy information, scan the QR code or visit fundresearch.fidelity.com/prospectus/sec |
SEMI-ANNUAL SHAREHOLDER REPORT | AS OF MAY 31, 2024 | ||
| | Fidelity Advisor® Equity Growth Fund Fidelity Advisor® Equity Growth Fund Class I : EQPGX | |
| Costs of a $10,000 investment | Costs paid as a percentage of a $10,000 investment | ||
| Class I | $ 38 | 0.68% |
KEY FACTS | ||
| Fund Size | $10,015,753,076 | |
| Number of Holdings | 150 | |
| Portfolio Turnover | 37% |
(as of May 31, 2024)
MARKET SECTORS (% of Fund's net assets) | ||
| Information Technology | 42.1 | |
| Health Care | 14.4 | |
| Industrials | 12.4 | |
| Communication Services | 11.2 | |
| Consumer Discretionary | 9.1 | |
| Financials | 6.2 | |
| Energy | 2.4 | |
| Consumer Staples | 0.6 | |
| Materials | 0.2 | |
| Common Stocks | 98.4 |
| Preferred Stocks | 0.2 |
| Preferred Securities | 0.0 |
| Bonds | 0.0 |
| Short-Term Investments and Net Other Assets (Liabilities) | 1.4 |
ASSET ALLOCATION (% of Fund's net assets) |
|
| United States | 86.9 |
| Netherlands | 3.9 |
| Taiwan | 2.1 |
| China | 1.7 |
| Israel | 1.1 |
| Brazil | 0.9 |
| India | 0.9 |
| Japan | 0.6 |
| France | 0.6 |
| Others | 1.3 |
GEOGRAPHIC DIVERSIFICATION (% of Fund's net assets) |
|
TOP HOLDINGS (% of Fund's net assets) | ||
| Microsoft Corp | 12.6 | |
| NVIDIA Corp | 10.2 | |
| Apple Inc | 5.1 | |
| Alphabet Inc Class A | 5.0 | |
| Amazon.com Inc | 4.7 | |
| Uber Technologies Inc | 3.7 | |
| Eli Lilly & Co | 2.7 | |
| Boston Scientific Corp | 2.6 | |
| Taiwan Semiconductor Manufacturing Co Ltd ADR | 2.1 | |
| Netflix Inc | 2.1 | |
| 50.8 | ||
| Fidelity, the Fidelity Investments Logo and all other Fidelity trademarks or service marks used herein are trademarks or service marks of FMR LLC. Any third-party marks that are used herein are trademarks or service marks of their respective owners. © 2024 FMR LLC. All rights reserved. | ||
1.9915854.100 86-TSRS-0724 | | For additional information about the Fund; including its prospectus, financial information, holdings and proxy information, scan the QR code or visit fundresearch.fidelity.com/prospectus/sec |
SEMI-ANNUAL SHAREHOLDER REPORT | AS OF MAY 31, 2024 | ||
| | Fidelity Advisor® Growth & Income Fund Fidelity Advisor® Growth & Income Fund Class C : FGIUX | |
| Costs of a $10,000 investment | Costs paid as a percentage of a $10,000 investment | ||
| Class C | $ 90 | 1.66% |
KEY FACTS | ||
| Fund Size | $1,154,679,756 | |
| Number of Holdings | 188 | |
| Portfolio Turnover | 19% |
(as of May 31, 2024)
MARKET SECTORS (% of Fund's net assets) | ||
| Information Technology | 23.9 | |
| Financials | 18.7 | |
| Industrials | 16.8 | |
| Health Care | 11.9 | |
| Energy | 10.0 | |
| Consumer Staples | 6.0 | |
| Communication Services | 4.0 | |
| Utilities | 2.4 | |
| Consumer Discretionary | 2.2 | |
| Materials | 1.5 | |
| Real Estate | 1.3 | |
| Common Stocks | 98.7 |
| Bonds | 0.0 |
| Short-Term Investments and Net Other Assets (Liabilities) | 1.3 |
ASSET ALLOCATION (% of Fund's net assets) |
|
| United States | 90.4 |
| Canada | 1.6 |
| Germany | 1.2 |
| United Kingdom | 1.2 |
| Netherlands | 1.1 |
| France | 1.0 |
| Belgium | 0.7 |
| Zambia | 0.6 |
| China | 0.6 |
| Others | 1.6 |
GEOGRAPHIC DIVERSIFICATION (% of Fund's net assets) |
|
TOP HOLDINGS (% of Fund's net assets) | ||
| Microsoft Corp | 8.8 | |
| Exxon Mobil Corp | 7.3 | |
| Wells Fargo & Co | 5.8 | |
| General Electric Co | 5.2 | |
| NVIDIA Corp | 4.1 | |
| Bank of America Corp | 2.9 | |
| Apple Inc | 2.8 | |
| Visa Inc Class A | 1.9 | |
| Unitedhealth Group Inc | 1.9 | |
| Boeing Co | 1.8 | |
| 42.5 | ||
| Fidelity, the Fidelity Investments Logo and all other Fidelity trademarks or service marks used herein are trademarks or service marks of FMR LLC. Any third-party marks that are used herein are trademarks or service marks of their respective owners. © 2024 FMR LLC. All rights reserved. | ||
1.9915869.100 481-TSRS-0724 | | For additional information about the Fund; including its prospectus, financial information, holdings and proxy information, scan the QR code or visit fundresearch.fidelity.com/prospectus/sec |
SEMI-ANNUAL SHAREHOLDER REPORT | AS OF MAY 31, 2024 | ||
| | Fidelity Advisor® Stock Selector Mid Cap Fund Fidelity Advisor® Stock Selector Mid Cap Fund Class Z : FSLZX | |
| Costs of a $10,000 investment | Costs paid as a percentage of a $10,000 investment | ||
| Class Z | $ 29 | 0.53% |
KEY FACTS | ||
| Fund Size | $2,232,237,346 | |
| Number of Holdings | 208 | |
| Portfolio Turnover | 53% |
(as of May 31, 2024)
MARKET SECTORS (% of Fund's net assets) | ||
| Industrials | 22.1 | |
| Financials | 15.2 | |
| Consumer Discretionary | 14.7 | |
| Information Technology | 9.3 | |
| Health Care | 7.4 | |
| Real Estate | 6.9 | |
| Materials | 6.8 | |
| Energy | 5.2 | |
| Consumer Staples | 4.8 | |
| Utilities | 3.5 | |
| Communication Services | 1.5 | |
| Common Stocks | 97.4 |
| Short-Term Investments and Net Other Assets (Liabilities) | 2.6 |
ASSET ALLOCATION (% of Fund's net assets) |
|
| United States | 95.9 |
| Puerto Rico | 0.8 |
| Sweden | 0.8 |
| Chile | 0.6 |
| Grand Cayman (UK Overseas Ter) | 0.5 |
| Canada | 0.5 |
| Netherlands | 0.4 |
| United Kingdom | 0.3 |
| Greece | 0.2 |
GEOGRAPHIC DIVERSIFICATION (% of Fund's net assets) |
|
TOP HOLDINGS (% of Fund's net assets) | ||
| Carlisle Cos Inc | 1.5 | |
| Bancorp Inc/The | 1.5 | |
| Vistra Corp | 1.4 | |
| CACI International Inc | 1.3 | |
| XPO Inc | 1.2 | |
| Baldwin Insurance Group Inc/The Class A | 1.2 | |
| KBR Inc | 1.1 | |
| Wesco International Inc | 1.1 | |
| HEICO Corp Class A | 1.1 | |
| Kirby Corp | 1.1 | |
| 12.5 | ||
| Fidelity, the Fidelity Investments Logo and all other Fidelity trademarks or service marks used herein are trademarks or service marks of FMR LLC. Any third-party marks that are used herein are trademarks or service marks of their respective owners. © 2024 FMR LLC. All rights reserved. | ||
1.9915893.100 2888-TSRS-0724 | | For additional information about the Fund; including its prospectus, financial information, holdings and proxy information, scan the QR code or visit fundresearch.fidelity.com/prospectus/sec |
SEMI-ANNUAL SHAREHOLDER REPORT | AS OF MAY 31, 2024 | ||
| | Fidelity Advisor® Equity Growth Fund Fidelity Advisor® Equity Growth Fund Class C : EPGCX | |
| Costs of a $10,000 investment | Costs paid as a percentage of a $10,000 investment | ||
| Class C | $ 94 | 1.69% |
KEY FACTS | ||
| Fund Size | $10,015,753,076 | |
| Number of Holdings | 150 | |
| Portfolio Turnover | 37% |
(as of May 31, 2024)
MARKET SECTORS (% of Fund's net assets) | ||
| Information Technology | 42.1 | |
| Health Care | 14.4 | |
| Industrials | 12.4 | |
| Communication Services | 11.2 | |
| Consumer Discretionary | 9.1 | |
| Financials | 6.2 | |
| Energy | 2.4 | |
| Consumer Staples | 0.6 | |
| Materials | 0.2 | |
| Common Stocks | 98.4 |
| Preferred Stocks | 0.2 |
| Preferred Securities | 0.0 |
| Bonds | 0.0 |
| Short-Term Investments and Net Other Assets (Liabilities) | 1.4 |
ASSET ALLOCATION (% of Fund's net assets) |
|
| United States | 86.9 |
| Netherlands | 3.9 |
| Taiwan | 2.1 |
| China | 1.7 |
| Israel | 1.1 |
| Brazil | 0.9 |
| India | 0.9 |
| Japan | 0.6 |
| France | 0.6 |
| Others | 1.3 |
GEOGRAPHIC DIVERSIFICATION (% of Fund's net assets) |
|
TOP HOLDINGS (% of Fund's net assets) | ||
| Microsoft Corp | 12.6 | |
| NVIDIA Corp | 10.2 | |
| Apple Inc | 5.1 | |
| Alphabet Inc Class A | 5.0 | |
| Amazon.com Inc | 4.7 | |
| Uber Technologies Inc | 3.7 | |
| Eli Lilly & Co | 2.7 | |
| Boston Scientific Corp | 2.6 | |
| Taiwan Semiconductor Manufacturing Co Ltd ADR | 2.1 | |
| Netflix Inc | 2.1 | |
| 50.8 | ||
| Fidelity, the Fidelity Investments Logo and all other Fidelity trademarks or service marks used herein are trademarks or service marks of FMR LLC. Any third-party marks that are used herein are trademarks or service marks of their respective owners. © 2024 FMR LLC. All rights reserved. | ||
1.9915853.100 479-TSRS-0724 | | For additional information about the Fund; including its prospectus, financial information, holdings and proxy information, scan the QR code or visit fundresearch.fidelity.com/prospectus/sec |
SEMI-ANNUAL SHAREHOLDER REPORT | AS OF MAY 31, 2024 | ||
| | Fidelity Advisor® Growth Opportunities Fund Fidelity Advisor® Growth Opportunities Fund Class C : FACGX | |
| Costs of a $10,000 investment | Costs paid as a percentage of a $10,000 investment | ||
| Class C | $ 83 | 1.49% |
KEY FACTS | ||
| Fund Size | $21,185,633,611 | |
| Number of Holdings | 202 | |
| Portfolio Turnover | 55% |
(as of May 31, 2024)
MARKET SECTORS (% of Fund's net assets) | ||
| Information Technology | 46.5 | |
| Communication Services | 21.4 | |
| Consumer Discretionary | 9.8 | |
| Health Care | 9.4 | |
| Industrials | 6.8 | |
| Financials | 4.5 | |
| Consumer Staples | 0.5 | |
| Energy | 0.1 | |
| Materials | 0.1 | |
| Common Stocks | 97.0 |
| Preferred Stocks | 2.1 |
| Domestic Equity Funds | 0.3 |
| Bonds | 0.1 |
| Preferred Securities | 0.0 |
| Short-Term Investments and Net Other Assets (Liabilities) | 0.5 |
ASSET ALLOCATION (% of Fund's net assets) |
|
| United States | 92.6 |
| China | 1.9 |
| Singapore | 1.9 |
| Taiwan | 1.4 |
| France | 0.7 |
| India | 0.3 |
| Ireland | 0.2 |
| Estonia | 0.2 |
| Canada | 0.2 |
| Others | 0.6 |
GEOGRAPHIC DIVERSIFICATION (% of Fund's net assets) |
|
TOP HOLDINGS (% of Fund's net assets) | ||
| NVIDIA Corp | 13.3 | |
| Microsoft Corp | 9.6 | |
| Meta Platforms Inc Class A | 5.9 | |
| Apple Inc | 5.0 | |
| Amazon.com Inc | 5.0 | |
| Alphabet Inc Class C | 4.7 | |
| Uber Technologies Inc | 2.7 | |
| Roku Inc Class A | 2.3 | |
| Eli Lilly & Co | 2.2 | |
| Sea Ltd Class A ADR | 1.9 | |
| 52.6 | ||
| Fidelity, the Fidelity Investments Logo and all other Fidelity trademarks or service marks used herein are trademarks or service marks of FMR LLC. Any third-party marks that are used herein are trademarks or service marks of their respective owners. © 2024 FMR LLC. All rights reserved. | ||
1.9915863.100 482-TSRS-0724 | | For additional information about the Fund; including its prospectus, financial information, holdings and proxy information, scan the QR code or visit fundresearch.fidelity.com/prospectus/sec |
SEMI-ANNUAL SHAREHOLDER REPORT | AS OF MAY 31, 2024 | ||
| | Fidelity Advisor® Equity Growth Fund Fidelity Advisor® Equity Growth Fund Class A : EPGAX | |
| Costs of a $10,000 investment | Costs paid as a percentage of a $10,000 investment | ||
| Class A | $ 52 | 0.93% |
KEY FACTS | ||
| Fund Size | $10,015,753,076 | |
| Number of Holdings | 150 | |
| Portfolio Turnover | 37% |
(as of May 31, 2024)
MARKET SECTORS (% of Fund's net assets) | ||
| Information Technology | 42.1 | |
| Health Care | 14.4 | |
| Industrials | 12.4 | |
| Communication Services | 11.2 | |
| Consumer Discretionary | 9.1 | |
| Financials | 6.2 | |
| Energy | 2.4 | |
| Consumer Staples | 0.6 | |
| Materials | 0.2 | |
| Common Stocks | 98.4 |
| Preferred Stocks | 0.2 |
| Preferred Securities | 0.0 |
| Bonds | 0.0 |
| Short-Term Investments and Net Other Assets (Liabilities) | 1.4 |
ASSET ALLOCATION (% of Fund's net assets) |
|
| United States | 86.9 |
| Netherlands | 3.9 |
| Taiwan | 2.1 |
| China | 1.7 |
| Israel | 1.1 |
| Brazil | 0.9 |
| India | 0.9 |
| Japan | 0.6 |
| France | 0.6 |
| Others | 1.3 |
GEOGRAPHIC DIVERSIFICATION (% of Fund's net assets) |
|
TOP HOLDINGS (% of Fund's net assets) | ||
| Microsoft Corp | 12.6 | |
| NVIDIA Corp | 10.2 | |
| Apple Inc | 5.1 | |
| Alphabet Inc Class A | 5.0 | |
| Amazon.com Inc | 4.7 | |
| Uber Technologies Inc | 3.7 | |
| Eli Lilly & Co | 2.7 | |
| Boston Scientific Corp | 2.6 | |
| Taiwan Semiconductor Manufacturing Co Ltd ADR | 2.1 | |
| Netflix Inc | 2.1 | |
| 50.8 | ||
| Fidelity, the Fidelity Investments Logo and all other Fidelity trademarks or service marks used herein are trademarks or service marks of FMR LLC. Any third-party marks that are used herein are trademarks or service marks of their respective owners. © 2024 FMR LLC. All rights reserved. | ||
1.9915850.100 245-TSRS-0724 | | For additional information about the Fund; including its prospectus, financial information, holdings and proxy information, scan the QR code or visit fundresearch.fidelity.com/prospectus/sec |
SEMI-ANNUAL SHAREHOLDER REPORT | AS OF MAY 31, 2024 | ||
| | Fidelity Advisor® Stock Selector Mid Cap Fund Fidelity® Stock Selector Mid Cap Fund : FSSMX | |
| Costs of a $10,000 investment | Costs paid as a percentage of a $10,000 investment | ||
| Fidelity® Stock Selector Mid Cap Fund | $ 35 | 0.65% |
KEY FACTS | ||
| Fund Size | $2,232,237,346 | |
| Number of Holdings | 208 | |
| Portfolio Turnover | 53% |
(as of May 31, 2024)
MARKET SECTORS (% of Fund's net assets) | ||
| Industrials | 22.1 | |
| Financials | 15.2 | |
| Consumer Discretionary | 14.7 | |
| Information Technology | 9.3 | |
| Health Care | 7.4 | |
| Real Estate | 6.9 | |
| Materials | 6.8 | |
| Energy | 5.2 | |
| Consumer Staples | 4.8 | |
| Utilities | 3.5 | |
| Communication Services | 1.5 | |
| Common Stocks | 97.4 |
| Short-Term Investments and Net Other Assets (Liabilities) | 2.6 |
ASSET ALLOCATION (% of Fund's net assets) |
|
| United States | 95.9 |
| Puerto Rico | 0.8 |
| Sweden | 0.8 |
| Chile | 0.6 |
| Grand Cayman (UK Overseas Ter) | 0.5 |
| Canada | 0.5 |
| Netherlands | 0.4 |
| United Kingdom | 0.3 |
| Greece | 0.2 |
GEOGRAPHIC DIVERSIFICATION (% of Fund's net assets) |
|
TOP HOLDINGS (% of Fund's net assets) | ||
| Carlisle Cos Inc | 1.5 | |
| Bancorp Inc/The | 1.5 | |
| Vistra Corp | 1.4 | |
| CACI International Inc | 1.3 | |
| XPO Inc | 1.2 | |
| Baldwin Insurance Group Inc/The Class A | 1.2 | |
| KBR Inc | 1.1 | |
| Wesco International Inc | 1.1 | |
| HEICO Corp Class A | 1.1 | |
| Kirby Corp | 1.1 | |
| 12.5 | ||
| Fidelity, the Fidelity Investments Logo and all other Fidelity trademarks or service marks used herein are trademarks or service marks of FMR LLC. Any third-party marks that are used herein are trademarks or service marks of their respective owners. © 2024 FMR LLC. All rights reserved. | ||
1.9915891.100 2412-TSRS-0724 | | For additional information about the Fund; including its prospectus, financial information, holdings and proxy information, scan the QR code or visit fundresearch.fidelity.com/prospectus/sec |
SEMI-ANNUAL SHAREHOLDER REPORT | AS OF MAY 31, 2024 | ||
| | Fidelity Advisor® Small Cap Fund Fidelity Advisor® Small Cap Fund Class C : FSCEX | |
| Costs of a $10,000 investment | Costs paid as a percentage of a $10,000 investment | ||
| Class C | $ 114 | 2.07% |
KEY FACTS | ||
| Fund Size | $1,955,004,625 | |
| Number of Holdings | 137 | |
| Portfolio Turnover | 36% |
(as of May 31, 2024)
MARKET SECTORS (% of Fund's net assets) | ||
| Industrials | 18.6 | |
| Information Technology | 15.6 | |
| Financials | 14.1 | |
| Health Care | 13.6 | |
| Consumer Discretionary | 12.4 | |
| Materials | 7.3 | |
| Energy | 6.1 | |
| Consumer Staples | 4.2 | |
| Real Estate | 4.1 | |
| Communication Services | 2.4 | |
| Utilities | 1.1 | |
| Common Stocks | 99.5 |
| Domestic Equity Funds | 0.7 |
ASSET ALLOCATION (% of Fund's net assets) |
|
| Short-Term Investments and Net Other Assets (Liabilities) - (0.2)% |
| United States | 89.2 |
| Canada | 3.9 |
| Thailand | 2.2 |
| Israel | 1.8 |
| United Kingdom | 1.5 |
| Japan | 0.8 |
| Grand Cayman (UK Overseas Ter) | 0.5 |
| Netherlands | 0.1 |
GEOGRAPHIC DIVERSIFICATION (% of Fund's net assets) |
|
TOP HOLDINGS (% of Fund's net assets) | ||
| Fabrinet | 2.2 | |
| Constellium SE | 1.8 | |
| Patrick Industries Inc | 1.8 | |
| Insight Enterprises Inc | 1.7 | |
| Commercial Metals Co | 1.7 | |
| FTAI Aviation Ltd | 1.6 | |
| Liberty Energy Inc Class A | 1.5 | |
| Lamar Advertising Co Class A | 1.5 | |
| Ensign Group Inc/The | 1.4 | |
| Primerica Inc | 1.4 | |
| 16.6 | ||
| Fidelity, the Fidelity Investments Logo and all other Fidelity trademarks or service marks used herein are trademarks or service marks of FMR LLC. Any third-party marks that are used herein are trademarks or service marks of their respective owners. © 2024 FMR LLC. All rights reserved. | ||
1.9915872.100 297-TSRS-0724 | | For additional information about the Fund; including its prospectus, financial information, holdings and proxy information, scan the QR code or visit fundresearch.fidelity.com/prospectus/sec |
SEMI-ANNUAL SHAREHOLDER REPORT | AS OF MAY 31, 2024 | ||
| | Fidelity Advisor® Growth & Income Fund Fidelity Advisor® Growth & Income Fund Class M : FGITX | |
| Costs of a $10,000 investment | Costs paid as a percentage of a $10,000 investment | ||
| Class M | $ 61 | 1.13% |
KEY FACTS | ||
| Fund Size | $1,154,679,756 | |
| Number of Holdings | 188 | |
| Portfolio Turnover | 19% |
(as of May 31, 2024)
MARKET SECTORS (% of Fund's net assets) | ||
| Information Technology | 23.9 | |
| Financials | 18.7 | |
| Industrials | 16.8 | |
| Health Care | 11.9 | |
| Energy | 10.0 | |
| Consumer Staples | 6.0 | |
| Communication Services | 4.0 | |
| Utilities | 2.4 | |
| Consumer Discretionary | 2.2 | |
| Materials | 1.5 | |
| Real Estate | 1.3 | |
| Common Stocks | 98.7 |
| Bonds | 0.0 |
| Short-Term Investments and Net Other Assets (Liabilities) | 1.3 |
ASSET ALLOCATION (% of Fund's net assets) |
|
| United States | 90.4 |
| Canada | 1.6 |
| Germany | 1.2 |
| United Kingdom | 1.2 |
| Netherlands | 1.1 |
| France | 1.0 |
| Belgium | 0.7 |
| Zambia | 0.6 |
| China | 0.6 |
| Others | 1.6 |
GEOGRAPHIC DIVERSIFICATION (% of Fund's net assets) |
|
TOP HOLDINGS (% of Fund's net assets) | ||
| Microsoft Corp | 8.8 | |
| Exxon Mobil Corp | 7.3 | |
| Wells Fargo & Co | 5.8 | |
| General Electric Co | 5.2 | |
| NVIDIA Corp | 4.1 | |
| Bank of America Corp | 2.9 | |
| Apple Inc | 2.8 | |
| Visa Inc Class A | 1.9 | |
| Unitedhealth Group Inc | 1.9 | |
| Boeing Co | 1.8 | |
| 42.5 | ||
| Fidelity, the Fidelity Investments Logo and all other Fidelity trademarks or service marks used herein are trademarks or service marks of FMR LLC. Any third-party marks that are used herein are trademarks or service marks of their respective owners. © 2024 FMR LLC. All rights reserved. | ||
1.9915866.100 274-TSRS-0724 | | For additional information about the Fund; including its prospectus, financial information, holdings and proxy information, scan the QR code or visit fundresearch.fidelity.com/prospectus/sec |
SEMI-ANNUAL SHAREHOLDER REPORT | AS OF MAY 31, 2024 | ||
| | Fidelity Advisor® Equity Income Fund Fidelity Advisor® Equity Income Fund Class I : EQPIX | |
| Costs of a $10,000 investment | Costs paid as a percentage of a $10,000 investment | ||
| Class I | $ 33 | 0.62% |
KEY FACTS | ||
| Fund Size | $1,796,779,158 | |
| Number of Holdings | 116 | |
| Portfolio Turnover | 38% |
(as of May 31, 2024)
MARKET SECTORS (% of Fund's net assets) | ||
| Financials | 20.0 | |
| Health Care | 17.2 | |
| Consumer Staples | 10.9 | |
| Industrials | 8.7 | |
| Utilities | 8.3 | |
| Energy | 8.2 | |
| Information Technology | 6.4 | |
| Communication Services | 6.1 | |
| Real Estate | 4.8 | |
| Consumer Discretionary | 3.9 | |
| Materials | 3.9 | |
| Common Stocks | 98.4 |
| Short-Term Investments and Net Other Assets (Liabilities) | 1.6 |
ASSET ALLOCATION (% of Fund's net assets) |
|
| United States | 89.6 |
| United Kingdom | 5.2 |
| France | 2.2 |
| Taiwan | 1.0 |
| Canada | 0.9 |
| Denmark | 0.6 |
| Belgium | 0.5 |
GEOGRAPHIC DIVERSIFICATION (% of Fund's net assets) |
|
TOP HOLDINGS (% of Fund's net assets) | ||
| Exxon Mobil Corp | 3.2 | |
| Johnson & Johnson | 2.9 | |
| Comcast Corp Class A | 2.6 | |
| Wells Fargo & Co | 2.6 | |
| Merck & Co Inc | 2.5 | |
| Verizon Communications Inc | 2.1 | |
| M&T Bank Corp | 2.0 | |
| Shell PLC ADR | 2.0 | |
| Chubb Ltd | 2.0 | |
| Unilever PLC ADR | 1.9 | |
| 23.8 | ||
| Fidelity, the Fidelity Investments Logo and all other Fidelity trademarks or service marks used herein are trademarks or service marks of FMR LLC. Any third-party marks that are used herein are trademarks or service marks of their respective owners. © 2024 FMR LLC. All rights reserved. | ||
1.9915849.100 80-TSRS-0724 | | For additional information about the Fund; including its prospectus, financial information, holdings and proxy information, scan the QR code or visit fundresearch.fidelity.com/prospectus/sec |
SEMI-ANNUAL SHAREHOLDER REPORT | AS OF MAY 31, 2024 | ||
| | Fidelity Advisor® Equity Value Fund Fidelity Advisor® Equity Value Fund Class Z : FAEVX | |
| Costs of a $10,000 investment | Costs paid as a percentage of a $10,000 investment | ||
| Class Z | $ 31 | 0.59% |
KEY FACTS | ||
| Fund Size | $211,209,337 | |
| Number of Holdings | 94 | |
| Portfolio Turnover | 30% |
(as of May 31, 2024)
MARKET SECTORS (% of Fund's net assets) | ||
| Financials | 24.7 | |
| Health Care | 16.1 | |
| Consumer Staples | 11.3 | |
| Industrials | 11.2 | |
| Energy | 9.1 | |
| Information Technology | 6.8 | |
| Utilities | 6.2 | |
| Communication Services | 5.2 | |
| Consumer Discretionary | 4.3 | |
| Materials | 2.4 | |
| Real Estate | 1.1 | |
| Common Stocks | 97.3 |
| Preferred Stocks | 1.1 |
| Short-Term Investments and Net Other Assets (Liabilities) | 1.6 |
ASSET ALLOCATION (% of Fund's net assets) |
|
| United States | 88.7 |
| United Kingdom | 3.8 |
| Canada | 2.3 |
| Germany | 2.0 |
| France | 1.3 |
| Korea (South) | 1.1 |
| Norway | 0.7 |
| Denmark | 0.1 |
GEOGRAPHIC DIVERSIFICATION (% of Fund's net assets) |
|
TOP HOLDINGS (% of Fund's net assets) | ||
| Exxon Mobil Corp | 4.5 | |
| JPMorgan Chase & Co | 3.9 | |
| Chubb Ltd | 3.0 | |
| Cigna Group/The | 3.0 | |
| Berkshire Hathaway Inc Class B | 2.9 | |
| Bank of America Corp | 2.9 | |
| Comcast Corp Class A | 2.7 | |
| Travelers Cos Inc/The | 2.6 | |
| Walt Disney Co/The | 2.5 | |
| PG&E Corp | 2.4 | |
| 30.4 | ||
| Fidelity, the Fidelity Investments Logo and all other Fidelity trademarks or service marks used herein are trademarks or service marks of FMR LLC. Any third-party marks that are used herein are trademarks or service marks of their respective owners. © 2024 FMR LLC. All rights reserved. | ||
1.9915855.100 2883-TSRS-0724 | | For additional information about the Fund; including its prospectus, financial information, holdings and proxy information, scan the QR code or visit fundresearch.fidelity.com/prospectus/sec |
SEMI-ANNUAL SHAREHOLDER REPORT | AS OF MAY 31, 2024 | ||
| | Fidelity Advisor® Small Cap Fund Fidelity Advisor® Small Cap Fund Class Z : FZAOX | |
| Costs of a $10,000 investment | Costs paid as a percentage of a $10,000 investment | ||
| Class Z | $ 50 | 0.90% |
KEY FACTS | ||
| Fund Size | $1,955,004,625 | |
| Number of Holdings | 137 | |
| Portfolio Turnover | 36% |
(as of May 31, 2024)
MARKET SECTORS (% of Fund's net assets) | ||
| Industrials | 18.6 | |
| Information Technology | 15.6 | |
| Financials | 14.1 | |
| Health Care | 13.6 | |
| Consumer Discretionary | 12.4 | |
| Materials | 7.3 | |
| Energy | 6.1 | |
| Consumer Staples | 4.2 | |
| Real Estate | 4.1 | |
| Communication Services | 2.4 | |
| Utilities | 1.1 | |
| Common Stocks | 99.5 |
| Domestic Equity Funds | 0.7 |
ASSET ALLOCATION (% of Fund's net assets) |
|
| Short-Term Investments and Net Other Assets (Liabilities) - (0.2)% |
| United States | 89.2 |
| Canada | 3.9 |
| Thailand | 2.2 |
| Israel | 1.8 |
| United Kingdom | 1.5 |
| Japan | 0.8 |
| Grand Cayman (UK Overseas Ter) | 0.5 |
| Netherlands | 0.1 |
GEOGRAPHIC DIVERSIFICATION (% of Fund's net assets) |
|
TOP HOLDINGS (% of Fund's net assets) | ||
| Fabrinet | 2.2 | |
| Constellium SE | 1.8 | |
| Patrick Industries Inc | 1.8 | |
| Insight Enterprises Inc | 1.7 | |
| Commercial Metals Co | 1.7 | |
| FTAI Aviation Ltd | 1.6 | |
| Liberty Energy Inc Class A | 1.5 | |
| Lamar Advertising Co Class A | 1.5 | |
| Ensign Group Inc/The | 1.4 | |
| Primerica Inc | 1.4 | |
| 16.6 | ||
| Fidelity, the Fidelity Investments Logo and all other Fidelity trademarks or service marks used herein are trademarks or service marks of FMR LLC. Any third-party marks that are used herein are trademarks or service marks of their respective owners. © 2024 FMR LLC. All rights reserved. | ||
1.9915870.100 2540-TSRS-0724 | | For additional information about the Fund; including its prospectus, financial information, holdings and proxy information, scan the QR code or visit fundresearch.fidelity.com/prospectus/sec |
SEMI-ANNUAL SHAREHOLDER REPORT | AS OF MAY 31, 2024 | ||
| | Fidelity Advisor® Growth & Income Fund Fidelity Advisor® Growth & Income Fund Class I : FGIOX | |
| Costs of a $10,000 investment | Costs paid as a percentage of a $10,000 investment | ||
| Class I | $ 35 | 0.65% |
KEY FACTS | ||
| Fund Size | $1,154,679,756 | |
| Number of Holdings | 188 | |
| Portfolio Turnover | 19% |
(as of May 31, 2024)
MARKET SECTORS (% of Fund's net assets) | ||
| Information Technology | 23.9 | |
| Financials | 18.7 | |
| Industrials | 16.8 | |
| Health Care | 11.9 | |
| Energy | 10.0 | |
| Consumer Staples | 6.0 | |
| Communication Services | 4.0 | |
| Utilities | 2.4 | |
| Consumer Discretionary | 2.2 | |
| Materials | 1.5 | |
| Real Estate | 1.3 | |
| Common Stocks | 98.7 |
| Bonds | 0.0 |
| Short-Term Investments and Net Other Assets (Liabilities) | 1.3 |
ASSET ALLOCATION (% of Fund's net assets) |
|
| United States | 90.4 |
| Canada | 1.6 |
| Germany | 1.2 |
| United Kingdom | 1.2 |
| Netherlands | 1.1 |
| France | 1.0 |
| Belgium | 0.7 |
| Zambia | 0.6 |
| China | 0.6 |
| Others | 1.6 |
GEOGRAPHIC DIVERSIFICATION (% of Fund's net assets) |
|
TOP HOLDINGS (% of Fund's net assets) | ||
| Microsoft Corp | 8.8 | |
| Exxon Mobil Corp | 7.3 | |
| Wells Fargo & Co | 5.8 | |
| General Electric Co | 5.2 | |
| NVIDIA Corp | 4.1 | |
| Bank of America Corp | 2.9 | |
| Apple Inc | 2.8 | |
| Visa Inc Class A | 1.9 | |
| Unitedhealth Group Inc | 1.9 | |
| Boeing Co | 1.8 | |
| 42.5 | ||
| Fidelity, the Fidelity Investments Logo and all other Fidelity trademarks or service marks used herein are trademarks or service marks of FMR LLC. Any third-party marks that are used herein are trademarks or service marks of their respective owners. © 2024 FMR LLC. All rights reserved. | ||
1.9915867.100 276-TSRS-0724 | | For additional information about the Fund; including its prospectus, financial information, holdings and proxy information, scan the QR code or visit fundresearch.fidelity.com/prospectus/sec |
SEMI-ANNUAL SHAREHOLDER REPORT | AS OF MAY 31, 2024 | ||
| | Fidelity Advisor® Equity Growth Fund Fidelity Advisor® Equity Growth Fund Class M : FAEGX | |
| Costs of a $10,000 investment | Costs paid as a percentage of a $10,000 investment | ||
| Class M | $ 65 | 1.17% |
KEY FACTS | ||
| Fund Size | $10,015,753,076 | |
| Number of Holdings | 150 | |
| Portfolio Turnover | 37% |
(as of May 31, 2024)
MARKET SECTORS (% of Fund's net assets) | ||
| Information Technology | 42.1 | |
| Health Care | 14.4 | |
| Industrials | 12.4 | |
| Communication Services | 11.2 | |
| Consumer Discretionary | 9.1 | |
| Financials | 6.2 | |
| Energy | 2.4 | |
| Consumer Staples | 0.6 | |
| Materials | 0.2 | |
| Common Stocks | 98.4 |
| Preferred Stocks | 0.2 |
| Preferred Securities | 0.0 |
| Bonds | 0.0 |
| Short-Term Investments and Net Other Assets (Liabilities) | 1.4 |
ASSET ALLOCATION (% of Fund's net assets) |
|
| United States | 86.9 |
| Netherlands | 3.9 |
| Taiwan | 2.1 |
| China | 1.7 |
| Israel | 1.1 |
| Brazil | 0.9 |
| India | 0.9 |
| Japan | 0.6 |
| France | 0.6 |
| Others | 1.3 |
GEOGRAPHIC DIVERSIFICATION (% of Fund's net assets) |
|
TOP HOLDINGS (% of Fund's net assets) | ||
| Microsoft Corp | 12.6 | |
| NVIDIA Corp | 10.2 | |
| Apple Inc | 5.1 | |
| Alphabet Inc Class A | 5.0 | |
| Amazon.com Inc | 4.7 | |
| Uber Technologies Inc | 3.7 | |
| Eli Lilly & Co | 2.7 | |
| Boston Scientific Corp | 2.6 | |
| Taiwan Semiconductor Manufacturing Co Ltd ADR | 2.1 | |
| Netflix Inc | 2.1 | |
| 50.8 | ||
| Fidelity, the Fidelity Investments Logo and all other Fidelity trademarks or service marks used herein are trademarks or service marks of FMR LLC. Any third-party marks that are used herein are trademarks or service marks of their respective owners. © 2024 FMR LLC. All rights reserved. | ||
1.9915852.100 286-TSRS-0724 | | For additional information about the Fund; including its prospectus, financial information, holdings and proxy information, scan the QR code or visit fundresearch.fidelity.com/prospectus/sec |
SEMI-ANNUAL SHAREHOLDER REPORT | AS OF MAY 31, 2024 | ||
| | Fidelity Advisor® Stock Selector Mid Cap Fund Fidelity Advisor® Stock Selector Mid Cap Fund Class M : FMCAX | |
| Costs of a $10,000 investment | Costs paid as a percentage of a $10,000 investment | ||
| Class M | $ 63 | 1.17% |
KEY FACTS | ||
| Fund Size | $2,232,237,346 | |
| Number of Holdings | 208 | |
| Portfolio Turnover | 53% |
(as of May 31, 2024)
MARKET SECTORS (% of Fund's net assets) | ||
| Industrials | 22.1 | |
| Financials | 15.2 | |
| Consumer Discretionary | 14.7 | |
| Information Technology | 9.3 | |
| Health Care | 7.4 | |
| Real Estate | 6.9 | |
| Materials | 6.8 | |
| Energy | 5.2 | |
| Consumer Staples | 4.8 | |
| Utilities | 3.5 | |
| Communication Services | 1.5 | |
| Common Stocks | 97.4 |
| Short-Term Investments and Net Other Assets (Liabilities) | 2.6 |
ASSET ALLOCATION (% of Fund's net assets) |
|
| United States | 95.9 |
| Puerto Rico | 0.8 |
| Sweden | 0.8 |
| Chile | 0.6 |
| Grand Cayman (UK Overseas Ter) | 0.5 |
| Canada | 0.5 |
| Netherlands | 0.4 |
| United Kingdom | 0.3 |
| Greece | 0.2 |
GEOGRAPHIC DIVERSIFICATION (% of Fund's net assets) |
|
TOP HOLDINGS (% of Fund's net assets) | ||
| Carlisle Cos Inc | 1.5 | |
| Bancorp Inc/The | 1.5 | |
| Vistra Corp | 1.4 | |
| CACI International Inc | 1.3 | |
| XPO Inc | 1.2 | |
| Baldwin Insurance Group Inc/The Class A | 1.2 | |
| KBR Inc | 1.1 | |
| Wesco International Inc | 1.1 | |
| HEICO Corp Class A | 1.1 | |
| Kirby Corp | 1.1 | |
| 12.5 | ||
| Fidelity, the Fidelity Investments Logo and all other Fidelity trademarks or service marks used herein are trademarks or service marks of FMR LLC. Any third-party marks that are used herein are trademarks or service marks of their respective owners. © 2024 FMR LLC. All rights reserved. | ||
1.9915895.100 531-TSRS-0724 | | For additional information about the Fund; including its prospectus, financial information, holdings and proxy information, scan the QR code or visit fundresearch.fidelity.com/prospectus/sec |
SEMI-ANNUAL SHAREHOLDER REPORT | AS OF MAY 31, 2024 | ||
| | Fidelity Advisor® Equity Value Fund Fidelity Advisor® Equity Value Fund Class M : FAVTX | |
| Costs of a $10,000 investment | Costs paid as a percentage of a $10,000 investment | ||
| Class M | $ 65 | 1.25% |
KEY FACTS | ||
| Fund Size | $211,209,337 | |
| Number of Holdings | 94 | |
| Portfolio Turnover | 30% |
(as of May 31, 2024)
MARKET SECTORS (% of Fund's net assets) | ||
| Financials | 24.7 | |
| Health Care | 16.1 | |
| Consumer Staples | 11.3 | |
| Industrials | 11.2 | |
| Energy | 9.1 | |
| Information Technology | 6.8 | |
| Utilities | 6.2 | |
| Communication Services | 5.2 | |
| Consumer Discretionary | 4.3 | |
| Materials | 2.4 | |
| Real Estate | 1.1 | |
| Common Stocks | 97.3 |
| Preferred Stocks | 1.1 |
| Short-Term Investments and Net Other Assets (Liabilities) | 1.6 |
ASSET ALLOCATION (% of Fund's net assets) |
|
| United States | 88.7 |
| United Kingdom | 3.8 |
| Canada | 2.3 |
| Germany | 2.0 |
| France | 1.3 |
| Korea (South) | 1.1 |
| Norway | 0.7 |
| Denmark | 0.1 |
GEOGRAPHIC DIVERSIFICATION (% of Fund's net assets) |
|
TOP HOLDINGS (% of Fund's net assets) | ||
| Exxon Mobil Corp | 4.5 | |
| JPMorgan Chase & Co | 3.9 | |
| Chubb Ltd | 3.0 | |
| Cigna Group/The | 3.0 | |
| Berkshire Hathaway Inc Class B | 2.9 | |
| Bank of America Corp | 2.9 | |
| Comcast Corp Class A | 2.7 | |
| Travelers Cos Inc/The | 2.6 | |
| Walt Disney Co/The | 2.5 | |
| PG&E Corp | 2.4 | |
| 30.4 | ||
| Fidelity, the Fidelity Investments Logo and all other Fidelity trademarks or service marks used herein are trademarks or service marks of FMR LLC. Any third-party marks that are used herein are trademarks or service marks of their respective owners. © 2024 FMR LLC. All rights reserved. | ||
1.9915858.100 885-TSRS-0724 | | For additional information about the Fund; including its prospectus, financial information, holdings and proxy information, scan the QR code or visit fundresearch.fidelity.com/prospectus/sec |
SEMI-ANNUAL SHAREHOLDER REPORT | AS OF MAY 31, 2024 | ||
| | Fidelity Advisor® Large Cap Fund Fidelity Advisor® Large Cap Fund Class Z : FIDLX | |
| Costs of a $10,000 investment | Costs paid as a percentage of a $10,000 investment | ||
| Class Z | $ 38 | 0.70% |
KEY FACTS | ||
| Fund Size | $1,387,189,575 | |
| Number of Holdings | 185 | |
| Portfolio Turnover | 22% |
(as of May 31, 2024)
MARKET SECTORS (% of Fund's net assets) | ||
| Information Technology | 21.3 | |
| Financials | 16.5 | |
| Industrials | 16.2 | |
| Health Care | 11.6 | |
| Communication Services | 10.1 | |
| Energy | 9.5 | |
| Consumer Staples | 4.9 | |
| Consumer Discretionary | 3.1 | |
| Materials | 2.0 | |
| Utilities | 1.0 | |
| Real Estate | 0.8 | |
| Common Stocks | 97.0 |
| Short-Term Investments and Net Other Assets (Liabilities) | 3.0 |
ASSET ALLOCATION (% of Fund's net assets) |
|
| United States | 92.0 |
| Canada | 2.1 |
| Germany | 0.9 |
| Zambia | 0.9 |
| Netherlands | 0.7 |
| France | 0.7 |
| United Kingdom | 0.6 |
| Belgium | 0.6 |
| Taiwan | 0.4 |
| Others | 1.1 |
GEOGRAPHIC DIVERSIFICATION (% of Fund's net assets) |
|
TOP HOLDINGS (% of Fund's net assets) | ||
| Microsoft Corp | 7.3 | |
| Exxon Mobil Corp | 6.3 | |
| Wells Fargo & Co | 5.6 | |
| General Electric Co | 5.6 | |
| NVIDIA Corp | 4.4 | |
| Bank of America Corp | 2.7 | |
| Meta Platforms Inc Class A | 2.7 | |
| Apple Inc | 2.6 | |
| Boeing Co | 2.4 | |
| Alphabet Inc Class A | 2.0 | |
| 41.6 | ||
| Fidelity, the Fidelity Investments Logo and all other Fidelity trademarks or service marks used herein are trademarks or service marks of FMR LLC. Any third-party marks that are used herein are trademarks or service marks of their respective owners. © 2024 FMR LLC. All rights reserved. | ||
1.9915898.100 2889-TSRS-0724 | | For additional information about the Fund; including its prospectus, financial information, holdings and proxy information, scan the QR code or visit fundresearch.fidelity.com/prospectus/sec |
SEMI-ANNUAL SHAREHOLDER REPORT | AS OF MAY 31, 2024 | ||
| | Fidelity Advisor® Series Small Cap Fund Fidelity Advisor® Series Small Cap Fund : FSSFX | |
| Costs of a $10,000 investment | Costs paid as a percentage of a $10,000 investment | ||
| Fidelity Advisor® Series Small Cap Fund | $ 0 A | 0.01% |
KEY FACTS | ||
| Fund Size | $436,072,258 | |
| Number of Holdings | 137 | |
| Portfolio Turnover | 41% |
(as of May 31, 2024)
MARKET SECTORS (% of Fund's net assets) | ||
| Industrials | 18.6 | |
| Information Technology | 15.4 | |
| Financials | 14.1 | |
| Health Care | 13.4 | |
| Consumer Discretionary | 12.7 | |
| Materials | 7.2 | |
| Energy | 6.1 | |
| Consumer Staples | 4.1 | |
| Real Estate | 4.1 | |
| Communication Services | 2.5 | |
| Utilities | 1.1 | |
| Common Stocks | 99.3 |
| Domestic Equity Funds | 0.3 |
| Short-Term Investments and Net Other Assets (Liabilities) | 0.4 |
ASSET ALLOCATION (% of Fund's net assets) |
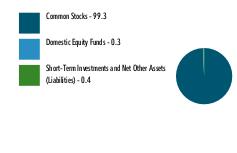 |
| United States | 89.3 |
| Canada | 3.8 |
| Thailand | 2.0 |
| Israel | 1.8 |
| United Kingdom | 1.6 |
| Japan | 0.8 |
| Grand Cayman (UK Overseas Ter) | 0.6 |
| Netherlands | 0.1 |
GEOGRAPHIC DIVERSIFICATION (% of Fund's net assets) |
 |
TOP HOLDINGS (% of Fund's net assets) | ||
| Fabrinet | 2.0 | |
| Patrick Industries Inc | 2.0 | |
| Constellium SE | 1.8 | |
| Insight Enterprises Inc | 1.7 | |
| Commercial Metals Co | 1.6 | |
| FTAI Aviation Ltd | 1.6 | |
| Liberty Energy Inc Class A | 1.6 | |
| Lamar Advertising Co Class A | 1.5 | |
| Ensign Group Inc/The | 1.4 | |
| EMCOR Group Inc | 1.4 | |
| 16.6 | ||
| Fidelity, the Fidelity Investments Logo and all other Fidelity trademarks or service marks used herein are trademarks or service marks of FMR LLC. Any third-party marks that are used herein are trademarks or service marks of their respective owners. © 2024 FMR LLC. All rights reserved. | ||
1.9915918.100 2613-TSRS-0724 |  | For additional information about the Fund; including its prospectus, financial information, holdings and proxy information, scan the QR code or visit fundresearch.fidelity.com/prospectus/sec |
SEMI-ANNUAL SHAREHOLDER REPORT | AS OF MAY 31, 2024 | ||
| | Fidelity Advisor® Value Strategies Fund Fidelity Advisor® Value Strategies Fund Class I : FASOX | |
| Costs of a $10,000 investment | Costs paid as a percentage of a $10,000 investment | ||
| Class I | $ 47 | 0.86% |
KEY FACTS | ||
| Fund Size | $2,345,592,459 | |
| Number of Holdings | 118 | |
| Portfolio Turnover | 49% |
(as of May 31, 2024)
MARKET SECTORS (% of Fund's net assets) | ||
| Industrials | 20.5 | |
| Financials | 19.3 | |
| Consumer Discretionary | 9.7 | |
| Utilities | 8.8 | |
| Energy | 8.8 | |
| Materials | 8.3 | |
| Real Estate | 6.0 | |
| Health Care | 5.9 | |
| Consumer Staples | 5.1 | |
| Information Technology | 4.3 | |
| Communication Services | 2.5 | |
| Common Stocks | 99.2 |
| Short-Term Investments and Net Other Assets (Liabilities) | 0.8 |
ASSET ALLOCATION (% of Fund's net assets) |
|
| United States | 91.0 |
| Canada | 6.2 |
| Spain | 0.7 |
| Sweden | 0.6 |
| Puerto Rico | 0.6 |
| Switzerland | 0.5 |
| India | 0.4 |
GEOGRAPHIC DIVERSIFICATION (% of Fund's net assets) |
|
TOP HOLDINGS (% of Fund's net assets) | ||
| Cigna Group/The | 2.2 | |
| Canadian Natural Resources Ltd | 2.1 | |
| Centene Corp | 1.8 | |
| Constellation Energy Corp | 1.8 | |
| Expro Group Holdings NV | 1.7 | |
| Apollo Global Management Inc | 1.6 | |
| Welltower Inc | 1.6 | |
| PG&E Corp | 1.5 | |
| AES Corp/The | 1.5 | |
| First Citizens BancShares Inc/NC Class A | 1.5 | |
| 17.3 | ||
| Fidelity, the Fidelity Investments Logo and all other Fidelity trademarks or service marks used herein are trademarks or service marks of FMR LLC. Any third-party marks that are used herein are trademarks or service marks of their respective owners. © 2024 FMR LLC. All rights reserved. | ||
1.9915841.100 694-TSRS-0724 | | For additional information about the Fund; including its prospectus, financial information, holdings and proxy information, scan the QR code or visit fundresearch.fidelity.com/prospectus/sec |
SEMI-ANNUAL SHAREHOLDER REPORT | AS OF MAY 31, 2024 | ||
| | Fidelity Advisor® Large Cap Fund Fidelity Advisor® Large Cap Fund Class C : FLCCX | |
| Costs of a $10,000 investment | Costs paid as a percentage of a $10,000 investment | ||
| Class C | $ 101 | 1.84% |
KEY FACTS | ||
| Fund Size | $1,387,189,575 | |
| Number of Holdings | 185 | |
| Portfolio Turnover | 22% |
(as of May 31, 2024)
MARKET SECTORS (% of Fund's net assets) | ||
| Information Technology | 21.3 | |
| Financials | 16.5 | |
| Industrials | 16.2 | |
| Health Care | 11.6 | |
| Communication Services | 10.1 | |
| Energy | 9.5 | |
| Consumer Staples | 4.9 | |
| Consumer Discretionary | 3.1 | |
| Materials | 2.0 | |
| Utilities | 1.0 | |
| Real Estate | 0.8 | |
| Common Stocks | 97.0 |
| Short-Term Investments and Net Other Assets (Liabilities) | 3.0 |
ASSET ALLOCATION (% of Fund's net assets) |
|
| United States | 92.0 |
| Canada | 2.1 |
| Germany | 0.9 |
| Zambia | 0.9 |
| Netherlands | 0.7 |
| France | 0.7 |
| United Kingdom | 0.6 |
| Belgium | 0.6 |
| Taiwan | 0.4 |
| Others | 1.1 |
GEOGRAPHIC DIVERSIFICATION (% of Fund's net assets) |
|
TOP HOLDINGS (% of Fund's net assets) | ||
| Microsoft Corp | 7.3 | |
| Exxon Mobil Corp | 6.3 | |
| Wells Fargo & Co | 5.6 | |
| General Electric Co | 5.6 | |
| NVIDIA Corp | 4.4 | |
| Bank of America Corp | 2.7 | |
| Meta Platforms Inc Class A | 2.7 | |
| Apple Inc | 2.6 | |
| Boeing Co | 2.4 | |
| Alphabet Inc Class A | 2.0 | |
| 41.6 | ||
| Fidelity, the Fidelity Investments Logo and all other Fidelity trademarks or service marks used herein are trademarks or service marks of FMR LLC. Any third-party marks that are used herein are trademarks or service marks of their respective owners. © 2024 FMR LLC. All rights reserved. | ||
1.9915899.100 483-TSRS-0724 | | For additional information about the Fund; including its prospectus, financial information, holdings and proxy information, scan the QR code or visit fundresearch.fidelity.com/prospectus/sec |
SEMI-ANNUAL SHAREHOLDER REPORT | AS OF MAY 31, 2024 | ||
| | Fidelity Advisor® Stock Selector Mid Cap Fund Fidelity Advisor® Stock Selector Mid Cap Fund Class A : FMCDX | |
| Costs of a $10,000 investment | Costs paid as a percentage of a $10,000 investment | ||
| Class A | $ 50 | 0.93% |
KEY FACTS | ||
| Fund Size | $2,232,237,346 | |
| Number of Holdings | 208 | |
| Portfolio Turnover | 53% |
(as of May 31, 2024)
MARKET SECTORS (% of Fund's net assets) | ||
| Industrials | 22.1 | |
| Financials | 15.2 | |
| Consumer Discretionary | 14.7 | |
| Information Technology | 9.3 | |
| Health Care | 7.4 | |
| Real Estate | 6.9 | |
| Materials | 6.8 | |
| Energy | 5.2 | |
| Consumer Staples | 4.8 | |
| Utilities | 3.5 | |
| Communication Services | 1.5 | |
| Common Stocks | 97.4 |
| Short-Term Investments and Net Other Assets (Liabilities) | 2.6 |
ASSET ALLOCATION (% of Fund's net assets) |
|
| United States | 95.9 |
| Puerto Rico | 0.8 |
| Sweden | 0.8 |
| Chile | 0.6 |
| Grand Cayman (UK Overseas Ter) | 0.5 |
| Canada | 0.5 |
| Netherlands | 0.4 |
| United Kingdom | 0.3 |
| Greece | 0.2 |
GEOGRAPHIC DIVERSIFICATION (% of Fund's net assets) |
|
TOP HOLDINGS (% of Fund's net assets) | ||
| Carlisle Cos Inc | 1.5 | |
| Bancorp Inc/The | 1.5 | |
| Vistra Corp | 1.4 | |
| CACI International Inc | 1.3 | |
| XPO Inc | 1.2 | |
| Baldwin Insurance Group Inc/The Class A | 1.2 | |
| KBR Inc | 1.1 | |
| Wesco International Inc | 1.1 | |
| HEICO Corp Class A | 1.1 | |
| Kirby Corp | 1.1 | |
| 12.5 | ||
| Fidelity, the Fidelity Investments Logo and all other Fidelity trademarks or service marks used herein are trademarks or service marks of FMR LLC. Any third-party marks that are used herein are trademarks or service marks of their respective owners. © 2024 FMR LLC. All rights reserved. | ||
1.9915892.100 251-TSRS-0724 | | For additional information about the Fund; including its prospectus, financial information, holdings and proxy information, scan the QR code or visit fundresearch.fidelity.com/prospectus/sec |
SEMI-ANNUAL SHAREHOLDER REPORT | AS OF MAY 31, 2024 | ||
| | Fidelity Advisor® Large Cap Fund Fidelity Advisor® Large Cap Fund Class A : FALAX | |
| Costs of a $10,000 investment | Costs paid as a percentage of a $10,000 investment | ||
| Class A | $ 59 | 1.07% |
KEY FACTS | ||
| Fund Size | $1,387,189,575 | |
| Number of Holdings | 185 | |
| Portfolio Turnover | 22% |
(as of May 31, 2024)
MARKET SECTORS (% of Fund's net assets) | ||
| Information Technology | 21.3 | |
| Financials | 16.5 | |
| Industrials | 16.2 | |
| Health Care | 11.6 | |
| Communication Services | 10.1 | |
| Energy | 9.5 | |
| Consumer Staples | 4.9 | |
| Consumer Discretionary | 3.1 | |
| Materials | 2.0 | |
| Utilities | 1.0 | |
| Real Estate | 0.8 | |
| Common Stocks | 97.0 |
| Short-Term Investments and Net Other Assets (Liabilities) | 3.0 |
ASSET ALLOCATION (% of Fund's net assets) |
|
| United States | 92.0 |
| Canada | 2.1 |
| Germany | 0.9 |
| Zambia | 0.9 |
| Netherlands | 0.7 |
| France | 0.7 |
| United Kingdom | 0.6 |
| Belgium | 0.6 |
| Taiwan | 0.4 |
| Others | 1.1 |
GEOGRAPHIC DIVERSIFICATION (% of Fund's net assets) |
|
TOP HOLDINGS (% of Fund's net assets) | ||
| Microsoft Corp | 7.3 | |
| Exxon Mobil Corp | 6.3 | |
| Wells Fargo & Co | 5.6 | |
| General Electric Co | 5.6 | |
| NVIDIA Corp | 4.4 | |
| Bank of America Corp | 2.7 | |
| Meta Platforms Inc Class A | 2.7 | |
| Apple Inc | 2.6 | |
| Boeing Co | 2.4 | |
| Alphabet Inc Class A | 2.0 | |
| 41.6 | ||
| Fidelity, the Fidelity Investments Logo and all other Fidelity trademarks or service marks used herein are trademarks or service marks of FMR LLC. Any third-party marks that are used herein are trademarks or service marks of their respective owners. © 2024 FMR LLC. All rights reserved. | ||
1.9915897.100 250-TSRS-0724 | | For additional information about the Fund; including its prospectus, financial information, holdings and proxy information, scan the QR code or visit fundresearch.fidelity.com/prospectus/sec |
SEMI-ANNUAL SHAREHOLDER REPORT | AS OF MAY 31, 2024 | ||
| | Fidelity Advisor® Series Growth Opportunities Fund Fidelity Advisor® Series Growth Opportunities Fund : FAOFX | |
| Costs of a $10,000 investment | Costs paid as a percentage of a $10,000 investment | ||
| Fidelity Advisor® Series Growth Opportunities Fund | $ 0 A | 0.01% |
KEY FACTS | ||
| Fund Size | $885,159,743 | |
| Number of Holdings | 182 | |
| Portfolio Turnover | 60% |
(as of May 31, 2024)
MARKET SECTORS (% of Fund's net assets) | ||
| Information Technology | 47.6 | |
| Communication Services | 22.0 | |
| Consumer Discretionary | 9.9 | |
| Health Care | 8.8 | |
| Industrials | 6.5 | |
| Financials | 3.8 | |
| Consumer Staples | 0.5 | |
| Energy | 0.1 | |
| Materials | 0.1 | |
| Common Stocks | 97.5 |
| Preferred Stocks | 1.8 |
| Bonds | 0.1 |
| Preferred Securities | 0.0 |
| Short-Term Investments and Net Other Assets (Liabilities) | 0.6 |
ASSET ALLOCATION (% of Fund's net assets) |
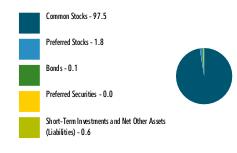 |
| United States | 93.3 |
| China | 2.2 |
| Singapore | 1.7 |
| Taiwan | 1.2 |
| France | 0.7 |
| Denmark | 0.2 |
| Ireland | 0.2 |
| Canada | 0.2 |
| Netherlands | 0.2 |
| Others | 0.1 |
GEOGRAPHIC DIVERSIFICATION (% of Fund's net assets) |
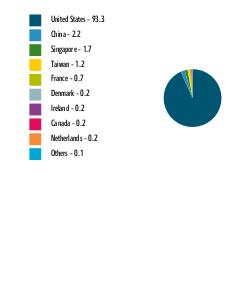 |
TOP HOLDINGS (% of Fund's net assets) | ||
| NVIDIA Corp | 13.6 | |
| Microsoft Corp | 10.9 | |
| Meta Platforms Inc Class A | 6.6 | |
| Amazon.com Inc | 5.7 | |
| Apple Inc | 5.2 | |
| Alphabet Inc Class C | 5.0 | |
| Roku Inc Class A | 2.5 | |
| Uber Technologies Inc | 2.5 | |
| Flex Ltd | 2.1 | |
| NXP Semiconductors NV | 2.1 | |
| 56.2 | ||
| Fidelity, the Fidelity Investments Logo and all other Fidelity trademarks or service marks used herein are trademarks or service marks of FMR LLC. Any third-party marks that are used herein are trademarks or service marks of their respective owners. © 2024 FMR LLC. All rights reserved. | ||
1.9915919.100 2614-TSRS-0724 |  | For additional information about the Fund; including its prospectus, financial information, holdings and proxy information, scan the QR code or visit fundresearch.fidelity.com/prospectus/sec |
SEMI-ANNUAL SHAREHOLDER REPORT | AS OF MAY 31, 2024 | ||
| | Fidelity Advisor® Equity Income Fund Fidelity Advisor® Equity Income Fund Class M : FEIRX | |
| Costs of a $10,000 investment | Costs paid as a percentage of a $10,000 investment | ||
| Class M | $ 59 | 1.11% |
KEY FACTS | ||
| Fund Size | $1,796,779,158 | |
| Number of Holdings | 116 | |
| Portfolio Turnover | 38% |
(as of May 31, 2024)
MARKET SECTORS (% of Fund's net assets) | ||
| Financials | 20.0 | |
| Health Care | 17.2 | |
| Consumer Staples | 10.9 | |
| Industrials | 8.7 | |
| Utilities | 8.3 | |
| Energy | 8.2 | |
| Information Technology | 6.4 | |
| Communication Services | 6.1 | |
| Real Estate | 4.8 | |
| Consumer Discretionary | 3.9 | |
| Materials | 3.9 | |
| Common Stocks | 98.4 |
| Short-Term Investments and Net Other Assets (Liabilities) | 1.6 |
ASSET ALLOCATION (% of Fund's net assets) |
|
| United States | 89.6 |
| United Kingdom | 5.2 |
| France | 2.2 |
| Taiwan | 1.0 |
| Canada | 0.9 |
| Denmark | 0.6 |
| Belgium | 0.5 |
GEOGRAPHIC DIVERSIFICATION (% of Fund's net assets) |
|
TOP HOLDINGS (% of Fund's net assets) | ||
| Exxon Mobil Corp | 3.2 | |
| Johnson & Johnson | 2.9 | |
| Comcast Corp Class A | 2.6 | |
| Wells Fargo & Co | 2.6 | |
| Merck & Co Inc | 2.5 | |
| Verizon Communications Inc | 2.1 | |
| M&T Bank Corp | 2.0 | |
| Shell PLC ADR | 2.0 | |
| Chubb Ltd | 2.0 | |
| Unilever PLC ADR | 1.9 | |
| 23.8 | ||
| Fidelity, the Fidelity Investments Logo and all other Fidelity trademarks or service marks used herein are trademarks or service marks of FMR LLC. Any third-party marks that are used herein are trademarks or service marks of their respective owners. © 2024 FMR LLC. All rights reserved. | ||
1.9915847.100 280-TSRS-0724 | | For additional information about the Fund; including its prospectus, financial information, holdings and proxy information, scan the QR code or visit fundresearch.fidelity.com/prospectus/sec |
SEMI-ANNUAL SHAREHOLDER REPORT | AS OF MAY 31, 2024 | ||
| | Fidelity Advisor® Stock Selector Mid Cap Fund Fidelity Advisor® Stock Selector Mid Cap Fund Class I : FMCCX | |
| Costs of a $10,000 investment | Costs paid as a percentage of a $10,000 investment | ||
| Class I | $ 38 | 0.69% |
KEY FACTS | ||
| Fund Size | $2,232,237,346 | |
| Number of Holdings | 208 | |
| Portfolio Turnover | 53% |
(as of May 31, 2024)
MARKET SECTORS (% of Fund's net assets) | ||
| Industrials | 22.1 | |
| Financials | 15.2 | |
| Consumer Discretionary | 14.7 | |
| Information Technology | 9.3 | |
| Health Care | 7.4 | |
| Real Estate | 6.9 | |
| Materials | 6.8 | |
| Energy | 5.2 | |
| Consumer Staples | 4.8 | |
| Utilities | 3.5 | |
| Communication Services | 1.5 | |
| Common Stocks | 97.4 |
| Short-Term Investments and Net Other Assets (Liabilities) | 2.6 |
ASSET ALLOCATION (% of Fund's net assets) |
|
| United States | 95.9 |
| Puerto Rico | 0.8 |
| Sweden | 0.8 |
| Chile | 0.6 |
| Grand Cayman (UK Overseas Ter) | 0.5 |
| Canada | 0.5 |
| Netherlands | 0.4 |
| United Kingdom | 0.3 |
| Greece | 0.2 |
GEOGRAPHIC DIVERSIFICATION (% of Fund's net assets) |
|
TOP HOLDINGS (% of Fund's net assets) | ||
| Carlisle Cos Inc | 1.5 | |
| Bancorp Inc/The | 1.5 | |
| Vistra Corp | 1.4 | |
| CACI International Inc | 1.3 | |
| XPO Inc | 1.2 | |
| Baldwin Insurance Group Inc/The Class A | 1.2 | |
| KBR Inc | 1.1 | |
| Wesco International Inc | 1.1 | |
| HEICO Corp Class A | 1.1 | |
| Kirby Corp | 1.1 | |
| 12.5 | ||
| Fidelity, the Fidelity Investments Logo and all other Fidelity trademarks or service marks used herein are trademarks or service marks of FMR LLC. Any third-party marks that are used herein are trademarks or service marks of their respective owners. © 2024 FMR LLC. All rights reserved. | ||
1.9915896.100 533-TSRS-0724 | | For additional information about the Fund; including its prospectus, financial information, holdings and proxy information, scan the QR code or visit fundresearch.fidelity.com/prospectus/sec |
SEMI-ANNUAL SHAREHOLDER REPORT | AS OF MAY 31, 2024 | ||
| | Fidelity Advisor® Large Cap Fund Fidelity Advisor® Large Cap Fund Class I : FALIX | |
| Costs of a $10,000 investment | Costs paid as a percentage of a $10,000 investment | ||
| Class I | $ 45 | 0.82% |
KEY FACTS | ||
| Fund Size | $1,387,189,575 | |
| Number of Holdings | 185 | |
| Portfolio Turnover | 22% |
(as of May 31, 2024)
MARKET SECTORS (% of Fund's net assets) | ||
| Information Technology | 21.3 | |
| Financials | 16.5 | |
| Industrials | 16.2 | |
| Health Care | 11.6 | |
| Communication Services | 10.1 | |
| Energy | 9.5 | |
| Consumer Staples | 4.9 | |
| Consumer Discretionary | 3.1 | |
| Materials | 2.0 | |
| Utilities | 1.0 | |
| Real Estate | 0.8 | |
| Common Stocks | 97.0 |
| Short-Term Investments and Net Other Assets (Liabilities) | 3.0 |
ASSET ALLOCATION (% of Fund's net assets) |
|
| United States | 92.0 |
| Canada | 2.1 |
| Germany | 0.9 |
| Zambia | 0.9 |
| Netherlands | 0.7 |
| France | 0.7 |
| United Kingdom | 0.6 |
| Belgium | 0.6 |
| Taiwan | 0.4 |
| Others | 1.1 |
GEOGRAPHIC DIVERSIFICATION (% of Fund's net assets) |
|
TOP HOLDINGS (% of Fund's net assets) | ||
| Microsoft Corp | 7.3 | |
| Exxon Mobil Corp | 6.3 | |
| Wells Fargo & Co | 5.6 | |
| General Electric Co | 5.6 | |
| NVIDIA Corp | 4.4 | |
| Bank of America Corp | 2.7 | |
| Meta Platforms Inc Class A | 2.7 | |
| Apple Inc | 2.6 | |
| Boeing Co | 2.4 | |
| Alphabet Inc Class A | 2.0 | |
| 41.6 | ||
| Fidelity, the Fidelity Investments Logo and all other Fidelity trademarks or service marks used herein are trademarks or service marks of FMR LLC. Any third-party marks that are used herein are trademarks or service marks of their respective owners. © 2024 FMR LLC. All rights reserved. | ||
1.9915901.100 536-TSRS-0724 | | For additional information about the Fund; including its prospectus, financial information, holdings and proxy information, scan the QR code or visit fundresearch.fidelity.com/prospectus/sec |
SEMI-ANNUAL SHAREHOLDER REPORT | AS OF MAY 31, 2024 | ||
| | Fidelity Advisor® Dividend Growth Fund Fidelity Advisor® Dividend Growth Fund Class I : FDGIX | |
| Costs of a $10,000 investment | Costs paid as a percentage of a $10,000 investment | ||
| Class I | $ 41 | 0.73% |
KEY FACTS | ||
| Fund Size | $1,516,322,845 | |
| Number of Holdings | 137 | |
| Portfolio Turnover | 60% |
(as of May 31, 2024)
MARKET SECTORS (% of Fund's net assets) | ||
| Information Technology | 26.9 | |
| Industrials | 16.0 | |
| Financials | 15.0 | |
| Energy | 11.3 | |
| Health Care | 8.2 | |
| Communication Services | 5.7 | |
| Utilities | 5.2 | |
| Consumer Staples | 3.6 | |
| Materials | 3.2 | |
| Consumer Discretionary | 2.0 | |
| Real Estate | 1.5 | |
| Common Stocks | 98.6 |
| Short-Term Investments and Net Other Assets (Liabilities) | 1.4 |
ASSET ALLOCATION (% of Fund's net assets) |
|
| United States | 85.5 |
| Canada | 4.1 |
| United Kingdom | 1.9 |
| Norway | 1.0 |
| India | 1.0 |
| Taiwan | 0.8 |
| Netherlands | 0.7 |
| Korea (South) | 0.6 |
| France | 0.6 |
| Others | 3.8 |
GEOGRAPHIC DIVERSIFICATION (% of Fund's net assets) |
|
TOP HOLDINGS (% of Fund's net assets) | ||
| NVIDIA Corp | 7.3 | |
| Microsoft Corp | 6.3 | |
| Meta Platforms Inc Class A | 3.5 | |
| Exxon Mobil Corp | 2.8 | |
| Broadcom Inc | 2.2 | |
| Apollo Global Management Inc | 2.0 | |
| Allison Transmission Holdings Inc | 1.8 | |
| Unitedhealth Group Inc | 1.7 | |
| Boeing Co | 1.7 | |
| Cigna Group/The | 1.6 | |
| 30.9 | ||
| Fidelity, the Fidelity Investments Logo and all other Fidelity trademarks or service marks used herein are trademarks or service marks of FMR LLC. Any third-party marks that are used herein are trademarks or service marks of their respective owners. © 2024 FMR LLC. All rights reserved. | ||
1.9915907.100 717-TSRS-0724 | | For additional information about the Fund; including its prospectus, financial information, holdings and proxy information, scan the QR code or visit fundresearch.fidelity.com/prospectus/sec |
Item 2.
Code of Ethics
Not applicable.
Item 3.
Audit Committee Financial Expert
Not applicable.
Item 4.
Principal Accountant Fees and Services
Not applicable.
Item 5.
Audit Committee of Listed Registrants
Not applicable.
Item 6.
Investments
(a)
Not applicable.
(b)
Not applicable
Item 7.
Financial Statements and Financial Highlights for Open-End Management Investment Companies


Contents
| Common Stocks - 99.2% | |||
| Shares | Value ($) (000s) | ||
| COMMUNICATION SERVICES - 2.6% | |||
| Diversified Telecommunication Services - 0.7% | |||
| Cellnex Telecom SA (a) | 449,600 | 16,424 | |
| Interactive Media & Services - 0.6% | |||
| Zoominfo Technologies, Inc. (b) | 1,046,000 | 12,845 | |
| Media - 1.3% | |||
| Interpublic Group of Companies, Inc. (c) | 643,800 | 20,196 | |
| Nexstar Media Group, Inc. Class A | 62,400 | 10,339 | |
| 30,535 | |||
TOTAL COMMUNICATION SERVICES | 59,804 | ||
| CONSUMER DISCRETIONARY - 9.7% | |||
| Automobile Components - 1.2% | |||
| Aptiv PLC (b) | 171,200 | 14,254 | |
| Autoliv, Inc. | 118,300 | 15,092 | |
| 29,346 | |||
| Automobiles - 0.7% | |||
| Harley-Davidson, Inc. | 466,200 | 16,727 | |
| Hotels, Restaurants & Leisure - 1.2% | |||
| Hilton Grand Vacations, Inc. (b) | 307,800 | 12,721 | |
| Marriott Vacations Worldwide Corp. | 97,700 | 8,819 | |
| Red Rock Resorts, Inc. | 122,350 | 6,270 | |
| 27,810 | |||
| Household Durables - 0.9% | |||
| Tempur Sealy International, Inc. | 409,200 | 21,017 | |
| Leisure Products - 1.4% | |||
| BRP, Inc. | 231,100 | 14,440 | |
| Brunswick Corp. | 104,200 | 8,600 | |
| Topgolf Callaway Brands Corp. (b) | 604,700 | 9,464 | |
| 32,504 | |||
| Specialty Retail - 2.7% | |||
| Lithia Motors, Inc. Class A (sub. vtg.) | 64,600 | 16,353 | |
| Signet Jewelers Ltd. | 156,700 | 17,157 | |
| Upbound Group, Inc. | 523,400 | 17,178 | |
| Victoria's Secret & Co. (b) | 549,600 | 12,525 | |
| 63,213 | |||
| Textiles, Apparel & Luxury Goods - 1.6% | |||
| Gildan Activewear, Inc. | 664,800 | 25,432 | |
| PVH Corp. | 100,300 | 12,037 | |
| 37,469 | |||
TOTAL CONSUMER DISCRETIONARY | 228,086 | ||
| CONSUMER STAPLES - 5.1% | |||
| Beverages - 0.6% | |||
| Keurig Dr. Pepper, Inc. | 391,300 | 13,402 | |
| Consumer Staples Distribution & Retail - 1.2% | |||
| U.S. Foods Holding Corp. (b) | 521,600 | 27,556 | |
| Food Products - 2.5% | |||
| Bunge Global SA | 231,400 | 24,896 | |
| Darling Ingredients, Inc. (b) | 507,322 | 20,496 | |
| Lamb Weston Holdings, Inc. | 163,900 | 14,471 | |
| 59,863 | |||
| Personal Care Products - 0.8% | |||
| Kenvue, Inc. | 943,500 | 18,210 | |
TOTAL CONSUMER STAPLES | 119,031 | ||
| ENERGY - 8.8% | |||
| Energy Equipment & Services - 3.4% | |||
| Expro Group Holdings NV (b) | 1,782,200 | 39,119 | |
| Tidewater, Inc. (b) | 111,300 | 11,501 | |
| Valaris Ltd. (b) | 372,300 | 28,816 | |
| 79,436 | |||
| Oil, Gas & Consumable Fuels - 5.4% | |||
| Antero Resources Corp. (b) | 610,100 | 21,738 | |
| Canadian Natural Resources Ltd. | 632,100 | 48,557 | |
| Targa Resources Corp. | 228,600 | 27,027 | |
| Tourmaline Oil Corp. (c) | 568,300 | 28,191 | |
| 125,513 | |||
TOTAL ENERGY | 204,949 | ||
| FINANCIALS - 19.3% | |||
| Banks - 4.3% | |||
| East West Bancorp, Inc. | 380,900 | 28,259 | |
| First Citizens Bancshares, Inc. | 20,100 | 34,138 | |
| Popular, Inc. | 161,200 | 14,348 | |
| U.S. Bancorp | 607,300 | 24,626 | |
| 101,371 | |||
| Capital Markets - 3.6% | |||
| Ameriprise Financial, Inc. | 67,000 | 29,253 | |
| LPL Financial | 94,200 | 26,961 | |
| Raymond James Financial, Inc. | 137,500 | 16,878 | |
| UBS Group AG | 379,420 | 12,071 | |
| 85,163 | |||
| Consumer Finance - 2.7% | |||
| OneMain Holdings, Inc. | 502,600 | 24,688 | |
| PROG Holdings, Inc. | 376,452 | 14,226 | |
| SLM Corp. | 1,105,684 | 23,728 | |
| 62,642 | |||
| Financial Services - 4.4% | |||
| Apollo Global Management, Inc. | 327,200 | 38,008 | |
| Global Payments, Inc. | 293,000 | 29,842 | |
| NCR Atleos Corp. | 707,400 | 19,687 | |
| WEX, Inc. (b) | 82,600 | 15,473 | |
| 103,010 | |||
| Insurance - 4.3% | |||
| American Financial Group, Inc. | 203,600 | 26,450 | |
| Assurant, Inc. | 82,800 | 14,363 | |
| First American Financial Corp. | 221,986 | 12,338 | |
| Globe Life, Inc. | 34,400 | 2,847 | |
| Reinsurance Group of America, Inc. | 100,933 | 21,176 | |
| The Travelers Companies, Inc. | 109,700 | 23,662 | |
| 100,836 | |||
TOTAL FINANCIALS | 453,022 | ||
| HEALTH CARE - 5.9% | |||
| Health Care Providers & Services - 5.4% | |||
| AdaptHealth Corp. (b) | 841,000 | 7,973 | |
| Centene Corp. (b) | 601,900 | 43,090 | |
| Cigna Group | 144,300 | 49,725 | |
| CVS Health Corp. | 417,000 | 24,853 | |
| 125,641 | |||
| Pharmaceuticals - 0.5% | |||
| Jazz Pharmaceuticals PLC (b) | 116,300 | 12,241 | |
TOTAL HEALTH CARE | 137,882 | ||
| INDUSTRIALS - 20.4% | |||
| Air Freight & Logistics - 1.0% | |||
| FedEx Corp. | 90,000 | 22,856 | |
| Building Products - 2.6% | |||
| AZZ, Inc. | 152,200 | 12,767 | |
| Builders FirstSource, Inc. (b) | 158,200 | 25,437 | |
| Johnson Controls International PLC | 298,900 | 21,494 | |
| 59,698 | |||
| Commercial Services & Supplies - 1.5% | |||
| The Brink's Co. | 202,100 | 20,865 | |
| Vestis Corp. | 1,115,500 | 13,743 | |
| 34,608 | |||
| Construction & Engineering - 2.5% | |||
| Fluor Corp. (b) | 562,100 | 24,395 | |
| MDU Resources Group, Inc. | 764,800 | 19,304 | |
| Willscot Mobile Mini Holdings (b) | 377,700 | 14,893 | |
| 58,592 | |||
| Electrical Equipment - 1.6% | |||
| Regal Rexnord Corp. | 170,900 | 25,556 | |
| Sensata Technologies PLC | 274,700 | 11,351 | |
| 36,907 | |||
| Ground Transportation - 2.7% | |||
| TFI International, Inc. (Canada) | 169,600 | 22,441 | |
| U-Haul Holding Co. (non-vtg.) | 326,200 | 19,830 | |
| XPO, Inc. (b) | 204,900 | 21,920 | |
| 64,191 | |||
| Machinery - 5.3% | |||
| Allison Transmission Holdings, Inc. | 374,700 | 28,406 | |
| Atmus Filtration Technologies, Inc. | 484,700 | 14,948 | |
| Barnes Group, Inc. (c) | 322,400 | 12,409 | |
| Chart Industries, Inc. (b) | 124,700 | 19,582 | |
| CNH Industrial NV | 1,297,700 | 13,704 | |
| Gates Industrial Corp. PLC (b) | 736,300 | 12,826 | |
| Timken Co. | 268,200 | 23,304 | |
| 125,179 | |||
| Professional Services - 0.9% | |||
| ManpowerGroup, Inc. | 163,200 | 12,178 | |
| WNS Holdings Ltd. | 183,300 | 9,203 | |
| 21,381 | |||
| Trading Companies & Distributors - 2.3% | |||
| GMS, Inc. (b) | 207,600 | 19,506 | |
| Herc Holdings, Inc. | 85,300 | 12,374 | |
| WESCO International, Inc. | 127,900 | 22,957 | |
| 54,837 | |||
TOTAL INDUSTRIALS | 478,249 | ||
| INFORMATION TECHNOLOGY - 4.3% | |||
| Communications Equipment - 1.7% | |||
| Ciena Corp. (b) | 312,600 | 15,058 | |
| Lumentum Holdings, Inc. (b) | 598,300 | 26,026 | |
| 41,084 | |||
| Electronic Equipment, Instruments & Components - 1.2% | |||
| Flex Ltd. (b) | 851,700 | 28,217 | |
| IT Services - 0.7% | |||
| GoDaddy, Inc. (b) | 119,800 | 16,728 | |
| Software - 0.7% | |||
| NCR Voyix Corp. (b) | 1,182,700 | 15,588 | |
TOTAL INFORMATION TECHNOLOGY | 101,617 | ||
| MATERIALS - 8.3% | |||
| Chemicals - 4.4% | |||
| Axalta Coating Systems Ltd. (b) | 363,700 | 12,944 | |
| Methanex Corp. | 374,500 | 20,103 | |
| Olin Corp. | 412,183 | 22,159 | |
| The Chemours Co. LLC | 817,700 | 20,295 | |
| Tronox Holdings PLC | 303,300 | 6,008 | |
| Westlake Corp. | 134,900 | 21,660 | |
| 103,169 | |||
| Containers & Packaging - 2.1% | |||
| Berry Global Group, Inc. | 214,600 | 12,850 | |
| Graphic Packaging Holding Co. | 495,500 | 14,033 | |
| O-I Glass, Inc. (b) | 831,300 | 10,549 | |
| WestRock Co. | 217,600 | 11,672 | |
| 49,104 | |||
| Metals & Mining - 1.0% | |||
| Compass Minerals International, Inc. (c) | 384,300 | 4,981 | |
| Constellium NV (b) | 862,900 | 18,699 | |
| 23,680 | |||
| Paper & Forest Products - 0.8% | |||
| Louisiana-Pacific Corp. | 209,700 | 19,225 | |
TOTAL MATERIALS | 195,178 | ||
| REAL ESTATE - 6.0% | |||
| Equity Real Estate Investment Trusts (REITs) - 6.0% | |||
| Camden Property Trust (SBI) | 191,200 | 19,627 | |
| Extra Space Storage, Inc. | 154,100 | 22,309 | |
| Prologis, Inc. | 187,737 | 20,743 | |
| Sun Communities, Inc. | 84,200 | 9,935 | |
| Ventas, Inc. | 631,500 | 31,739 | |
| Welltower, Inc. | 356,700 | 36,979 | |
| 141,332 | |||
| UTILITIES - 8.8% | |||
| Electric Utilities - 5.5% | |||
| Constellation Energy Corp. | 190,700 | 41,430 | |
| Edison International | 417,600 | 32,093 | |
| NextEra Energy, Inc. | 238,900 | 19,117 | |
| PG&E Corp. | 1,934,100 | 35,858 | |
| 128,498 | |||
| Independent Power and Renewable Electricity Producers - 2.6% | |||
| The AES Corp. | 1,601,600 | 34,579 | |
| Vistra Corp. | 273,900 | 27,138 | |
| 61,717 | |||
| Multi-Utilities - 0.7% | |||
| Sempra | 218,500 | 16,831 | |
TOTAL UTILITIES | 207,046 | ||
| TOTAL COMMON STOCKS (Cost $1,823,620) | 2,326,196 | ||
| Money Market Funds - 1.8% | |||
| Shares | Value ($) (000s) | ||
| Fidelity Cash Central Fund 5.39% (d) | 20,126,242 | 20,130 | |
| Fidelity Securities Lending Cash Central Fund 5.39% (d)(e) | 22,918,800 | 22,921 | |
| TOTAL MONEY MARKET FUNDS (Cost $43,051) | 43,051 | ||
| TOTAL INVESTMENT IN SECURITIES - 101.0% (Cost $1,866,671) | 2,369,247 |
NET OTHER ASSETS (LIABILITIES) - (1.0)% | (23,655) |
| NET ASSETS - 100.0% | 2,345,592 |
| (a) | Security exempt from registration under Rule 144A of the Securities Act of 1933. These securities may be resold in transactions exempt from registration, normally to qualified institutional buyers. At the end of the period, the value of these securities amounted to $16,424,000 or 0.7% of net assets. |
| (b) | Non-income producing |
| (c) | Security or a portion of the security is on loan at period end. |
| (d) | Affiliated fund that is generally available only to investment companies and other accounts managed by Fidelity Investments. The rate quoted is the annualized seven-day yield of the fund at period end. A complete unaudited listing of the fund's holdings as of its most recent quarter end is available upon request. In addition, each Fidelity Central Fund's financial statements are available on the SEC's website or upon request. |
| (e) | Investment made with cash collateral received from securities on loan. |
| Affiliate (Amounts in thousands) | Value, beginning of period ($) | Purchases ($) | Sales Proceeds ($) | Dividend Income ($) | Realized Gain (loss) ($) | Change in Unrealized appreciation (depreciation) ($) | Value, end of period ($) | % ownership, end of period |
| Fidelity Cash Central Fund 5.39% | 23,457 | 276,382 | 279,708 | 581 | (1) | - | 20,130 | 0.0% |
| Fidelity Securities Lending Cash Central Fund 5.39% | 36,475 | 378,978 | 392,532 | 601 | - | - | 22,921 | 0.1% |
| Total | 59,932 | 655,360 | 672,240 | 1,182 | (1) | - | 43,051 | |
| Valuation Inputs at Reporting Date: | ||||
Description (Amounts in thousands) | Total ($) | Level 1 ($) | Level 2 ($) | Level 3 ($) |
Investments in Securities: | ||||
| Equities: | ||||
Communication Services | 59,804 | 43,380 | 16,424 | - |
Consumer Discretionary | 228,086 | 228,086 | - | - |
Consumer Staples | 119,031 | 119,031 | - | - |
Energy | 204,949 | 204,949 | - | - |
Financials | 453,022 | 440,951 | 12,071 | - |
Health Care | 137,882 | 137,882 | - | - |
Industrials | 478,249 | 478,249 | - | - |
Information Technology | 101,617 | 101,617 | - | - |
Materials | 195,178 | 195,178 | - | - |
Real Estate | 141,332 | 141,332 | - | - |
Utilities | 207,046 | 207,046 | - | - |
| Money Market Funds | 43,051 | 43,051 | - | - |
| Total Investments in Securities: | 2,369,247 | 2,340,752 | 28,495 | - |
| Statement of Assets and Liabilities | ||||
| Amounts in thousands (except per-share amounts) | May 31, 2024 (Unaudited) | |||
| Assets | ||||
| Investment in securities, at value (including securities loaned of $22,568) - See accompanying schedule: | ||||
Unaffiliated issuers (cost $1,823,620) | $ | 2,326,196 | ||
Fidelity Central Funds (cost $43,051) | 43,051 | |||
| Total Investment in Securities (cost $1,866,671) | $ | 2,369,247 | ||
| Receivable for fund shares sold | 1,145 | |||
| Dividends receivable | 1,345 | |||
| Distributions receivable from Fidelity Central Funds | 74 | |||
Total assets | 2,371,811 | |||
| Liabilities | ||||
| Payable for investments purchased | $ | 7 | ||
| Payable for fund shares redeemed | 1,413 | |||
| Accrued management fee | 1,540 | |||
| Distribution and service plan fees payable | 212 | |||
| Other payables and accrued expenses | 126 | |||
| Collateral on securities loaned | 22,921 | |||
| Total liabilities | 26,219 | |||
| Net Assets | $ | 2,345,592 | ||
| Net Assets consist of: | ||||
| Paid in capital | $ | 1,748,959 | ||
| Total accumulated earnings (loss) | 596,633 | |||
| Net Assets | $ | 2,345,592 | ||
| Net Asset Value and Maximum Offering Price | ||||
| Class A : | ||||
Net Asset Value and redemption price per share ($429,285 ÷ 9,022 shares)(a) | $ | 47.58 | ||
| Maximum offering price per share (100/94.25 of $47.58) | $ | 50.48 | ||
| Class M : | ||||
Net Asset Value and redemption price per share ($251,000 ÷ 4,895 shares)(a) | $ | 51.28 | ||
| Maximum offering price per share (100/96.50 of $51.28) | $ | 53.14 | ||
| Class C : | ||||
Net Asset Value and offering price per share ($23,456 ÷ 606 shares)(a)(b) | $ | 38.70 | ||
| Fidelity Value Strategies Fund : | ||||
Net Asset Value, offering price and redemption price per share ($764,836 ÷ 12,946 shares) | $ | 59.08 | ||
| Class K : | ||||
Net Asset Value, offering price and redemption price per share ($271,809 ÷ 4,608 shares) | $ | 58.99 | ||
| Class I : | ||||
Net Asset Value, offering price and redemption price per share ($605,206 ÷ 11,193 shares) | $ | 54.07 | ||
(a)Redemption price per share is equal to net asset value less any applicable contingent deferred sales charge. | ||||
(b)Corresponding Net Asset Value does not calculate due to rounding of fractional net assets and/or shares. | ||||
| Statement of Operations | ||||
| Amounts in thousands | Six months ended May 31, 2024 (Unaudited) | |||
| Investment Income | ||||
| Dividends | $ | 18,330 | ||
| Income from Fidelity Central Funds (including $601 from security lending) | 1,182 | |||
| Total income | 19,512 | |||
| Expenses | ||||
| Management fee | ||||
| Basic fee | $ | 6,518 | ||
| Performance adjustment | 1,519 | |||
| Transfer agent fees | 824 | |||
| Distribution and service plan fees | 1,216 | |||
| Accounting fees | 144 | |||
| Custodian fees and expenses | 12 | |||
| Independent trustees' fees and expenses | 5 | |||
| Registration fees | 144 | |||
| Audit | 32 | |||
| Legal | 4 | |||
| Interest | 10 | |||
| Miscellaneous | 40 | |||
| Total expenses before reductions | 10,468 | |||
| Expense reductions | (94) | |||
| Total expenses after reductions | 10,374 | |||
| Net Investment income (loss) | 9,138 | |||
| Realized and Unrealized Gain (Loss) | ||||
| Net realized gain (loss) on: | ||||
| Investment Securities: | ||||
| Unaffiliated issuers | 90,072 | |||
| Fidelity Central Funds | (1) | |||
| Foreign currency transactions | (8) | |||
| Total net realized gain (loss) | 90,063 | |||
| Change in net unrealized appreciation (depreciation) on: | ||||
| Investment Securities: | ||||
| Unaffiliated issuers | 218,866 | |||
| Total change in net unrealized appreciation (depreciation) | 218,866 | |||
| Net gain (loss) | 308,929 | |||
| Net increase (decrease) in net assets resulting from operations | $ | 318,067 | ||
| Statement of Changes in Net Assets | ||||
| Amount in thousands | Six months ended May 31, 2024 (Unaudited) | Year ended November 30, 2023 | ||
| Increase (Decrease) in Net Assets | ||||
| Operations | ||||
| Net investment income (loss) | $ | 9,138 | $ | 11,335 |
| Net realized gain (loss) | 90,063 | 44,482 | ||
| Change in net unrealized appreciation (depreciation) | 218,866 | 15,374 | ||
| Net increase (decrease) in net assets resulting from operations | 318,067 | 71,191 | ||
| Distributions to shareholders | (54,203) | (32,384) | ||
| Share transactions - net increase (decrease) | 178,815 | 317,548 | ||
| Total increase (decrease) in net assets | 442,679 | 356,355 | ||
| Net Assets | ||||
| Beginning of period | 1,902,913 | 1,546,558 | ||
| End of period | $ | 2,345,592 | $ | 1,902,913 |
Fidelity Advisor® Value Strategies Fund Class A |
Six months ended (Unaudited) May 31, 2024 | Years ended November 30, 2023 | 2022 | 2021 | 2020 | 2019 | |||||||
Selected Per-Share Data | ||||||||||||
| Net asset value, beginning of period | $ | 42.18 | $ | 41.23 | $ | 42.62 | $ | 32.58 | $ | 33.23 | $ | 33.48 |
| Income from Investment Operations | ||||||||||||
Net investment income (loss) A,B | .15 | .23 | .24 | .37 C | .29 | .42 D | ||||||
| Net realized and unrealized gain (loss) | 6.54 | 1.65 | 2.05 | 9.96 | .87 | 3.66 | ||||||
| Total from investment operations | 6.69 | 1.88 | 2.29 | 10.33 | 1.16 | 4.08 | ||||||
| Distributions from net investment income | (.27) | (.27) | (.39) | (.29) | (.46) E | (.29) | ||||||
| Distributions from net realized gain | (1.03) | (.65) | (3.29) | - | (1.34) E | (4.04) | ||||||
| Total distributions | (1.29) F | (.93) F | (3.68) | (.29) | (1.81) F | (4.33) | ||||||
| Net asset value, end of period | $ | 47.58 | $ | 42.18 | $ | 41.23 | $ | 42.62 | $ | 32.58 | $ | 33.23 |
Total Return G,H,I | 16.06 % | 4.78% | 5.18% | 31.91% | 3.53% | 16.34% | ||||||
Ratios to Average Net Assets B,J,K | ||||||||||||
| Expenses before reductions | 1.11% L | 1.15% | 1.14% | 1.13% | 1.03% | 1.02% | ||||||
| Expenses net of fee waivers, if any | 1.10 % L | 1.15% | 1.13% | 1.13% | 1.02% | 1.02% | ||||||
| Expenses net of all reductions | 1.10% L | 1.15% | 1.13% | 1.13% | 1.01% | 1.01% | ||||||
| Net investment income (loss) | .67% L | .58% | .61% | .90% C | 1.03% | 1.39% D | ||||||
| Supplemental Data | ||||||||||||
| Net assets, end of period (in millions) | $ | 429 | $ | 355 | $ | 318 | $ | 254 | $ | 191 | $ | 204 |
Portfolio turnover rate M | 49 % L | 59% | 46% | 53% | 72% | 66% |
Fidelity Advisor® Value Strategies Fund Class M |
Six months ended (Unaudited) May 31, 2024 | Years ended November 30, 2023 | 2022 | 2021 | 2020 | 2019 | |||||||
Selected Per-Share Data | ||||||||||||
| Net asset value, beginning of period | $ | 45.28 | $ | 44.16 | $ | 45.37 | $ | 34.67 | $ | 35.23 | $ | 35.16 |
| Income from Investment Operations | ||||||||||||
Net investment income (loss) A,B | .11 | .15 | .16 | .29 C | .24 | .37 D | ||||||
| Net realized and unrealized gain (loss) | 7.04 | 1.76 | 2.17 | 10.61 | .92 | 3.93 | ||||||
| Total from investment operations | 7.15 | 1.91 | 2.33 | 10.90 | 1.16 | 4.30 | ||||||
| Distributions from net investment income | (.13) | (.14) | (.25) | (.20) | (.37) E | (.19) | ||||||
| Distributions from net realized gain | (1.03) | (.65) | (3.29) | - | (1.34) E | (4.04) | ||||||
| Total distributions | (1.15) F | (.79) | (3.54) | (.20) | (1.72) F | (4.23) | ||||||
| Net asset value, end of period | $ | 51.28 | $ | 45.28 | $ | 44.16 | $ | 45.37 | $ | 34.67 | $ | 35.23 |
Total Return G,H,I | 15.95 % | 4.51% | 4.95% | 31.59% | 3.32% | 16.07% | ||||||
Ratios to Average Net Assets B,J,K | ||||||||||||
| Expenses before reductions | 1.35% L | 1.39% | 1.37% | 1.37% | 1.25% | 1.25% | ||||||
| Expenses net of fee waivers, if any | 1.34 % L | 1.39% | 1.37% | 1.37% | 1.25% | 1.24% | ||||||
| Expenses net of all reductions | 1.34% L | 1.39% | 1.37% | 1.37% | 1.24% | 1.24% | ||||||
| Net investment income (loss) | .43% L | .34% | .37% | .66% C | .81% | 1.16% D | ||||||
| Supplemental Data | ||||||||||||
| Net assets, end of period (in millions) | $ | 251 | $ | 223 | $ | 231 | $ | 237 | $ | 204 | $ | 234 |
Portfolio turnover rate M | 49 % L | 59% | 46% | 53% | 72% | 66% |
Fidelity Advisor® Value Strategies Fund Class C |
Six months ended (Unaudited) May 31, 2024 | Years ended November 30, 2023 | 2022 | 2021 | 2020 | 2019 | |||||||
Selected Per-Share Data | ||||||||||||
| Net asset value, beginning of period | $ | 34.45 | $ | 33.87 | $ | 35.64 | $ | 27.33 | $ | 28.07 | $ | 28.95 |
| Income from Investment Operations | ||||||||||||
Net investment income (loss) A,B | (.02) | (.06) | (.06) | .04 C | .05 | .15 D | ||||||
| Net realized and unrealized gain (loss) | 5.35 | 1.34 | 1.72 | 8.37 | .71 | 3.04 | ||||||
| Total from investment operations | 5.33 | 1.28 | 1.66 | 8.41 | .76 | 3.19 | ||||||
| Distributions from net investment income | (.05) | (.05) | (.14) | (.10) | (.16) E | (.03) | ||||||
| Distributions from net realized gain | (1.03) | (.65) | (3.29) | - | (1.34) E | (4.04) | ||||||
| Total distributions | (1.08) | (.70) | (3.43) | (.10) | (1.50) | (4.07) | ||||||
| Net asset value, end of period | $ | 38.70 | $ | 34.45 | $ | 33.87 | $ | 35.64 | $ | 27.33 | $ | 28.07 |
Total Return F,G,H | 15.64 % | 3.97% | 4.37% | 30.84% | 2.73% | 15.41% | ||||||
Ratios to Average Net Assets B,I,J | ||||||||||||
| Expenses before reductions | 1.87% K | 1.93% | 1.92% | 1.92% | 1.83% | 1.82% | ||||||
| Expenses net of fee waivers, if any | 1.86 % K | 1.93% | 1.91% | 1.91% | 1.83% | 1.82% | ||||||
| Expenses net of all reductions | 1.86% K | 1.93% | 1.91% | 1.91% | 1.82% | 1.82% | ||||||
| Net investment income (loss) | (.09)% K | (.19)% | (.17)% | .11% C | .23% | .58% D | ||||||
| Supplemental Data | ||||||||||||
| Net assets, end of period (in millions) | $ | 23 | $ | 19 | $ | 18 | $ | 14 | $ | 11 | $ | 14 |
Portfolio turnover rate L | 49 % K | 59% | 46% | 53% | 72% | 66% |
Fidelity® Value Strategies Fund |
Six months ended (Unaudited) May 31, 2024 | Years ended November 30, 2023 | 2022 | 2021 | 2020 | 2019 | |||||||
Selected Per-Share Data | ||||||||||||
| Net asset value, beginning of period | $ | 52.08 | $ | 50.65 | $ | 51.53 | $ | 39.30 | $ | 39.68 | $ | 39.04 |
| Income from Investment Operations | ||||||||||||
Net investment income (loss) A,B | .27 | .41 | .43 | .58 C | .43 | .60 D | ||||||
| Net realized and unrealized gain (loss) | 8.11 | 2.02 | 2.47 | 12.00 | 1.07 | 4.46 | ||||||
| Total from investment operations | 8.38 | 2.43 | 2.90 | 12.58 | 1.50 | 5.06 | ||||||
| Distributions from net investment income | (.35) | (.35) | (.49) | (.35) | (.54) E | (.38) | ||||||
| Distributions from net realized gain | (1.03) | (.65) | (3.29) | - | (1.34) E | (4.04) | ||||||
| Total distributions | (1.38) | (1.00) | (3.78) | (.35) | (1.88) | (4.42) | ||||||
| Net asset value, end of period | $ | 59.08 | $ | 52.08 | $ | 50.65 | $ | 51.53 | $ | 39.30 | $ | 39.68 |
Total Return F,G | 16.25 % | 5.01% | 5.48% | 32.24% | 3.85% | 16.63% | ||||||
Ratios to Average Net Assets B,H,I | ||||||||||||
| Expenses before reductions | .84% J | .90% | .88% | .86% | .76% | .74% | ||||||
| Expenses net of fee waivers, if any | .83 % J | .90% | .87% | .86% | .76% | .74% | ||||||
| Expenses net of all reductions | .83% J | .90% | .87% | .86% | .75% | .74% | ||||||
| Net investment income (loss) | .94% J | .84% | .87% | 1.17% C | 1.30% | 1.66% D | ||||||
| Supplemental Data | ||||||||||||
| Net assets, end of period (in millions) | $ | 765 | $ | 629 | $ | 565 | $ | 513 | $ | 285 | $ | 332 |
Portfolio turnover rate K | 49 % J | 59% | 46% | 53% | 72% | 66% |
Fidelity® Value Strategies Fund Class K |
Six months ended (Unaudited) May 31, 2024 | Years ended November 30, 2023 | 2022 | 2021 | 2020 | 2019 | |||||||
Selected Per-Share Data | ||||||||||||
| Net asset value, beginning of period | $ | 52.04 | $ | 50.61 | $ | 51.49 | $ | 39.27 | $ | 39.65 | $ | 39.03 |
| Income from Investment Operations | ||||||||||||
Net investment income (loss) A,B | .29 | .48 | .49 | .64 C | .48 | .64 D | ||||||
| Net realized and unrealized gain (loss) | 8.11 | 2.02 | 2.46 | 11.98 | 1.07 | 4.46 | ||||||
| Total from investment operations | 8.40 | 2.50 | 2.95 | 12.62 | 1.55 | 5.10 | ||||||
| Distributions from net investment income | (.42) | (.42) | (.54) | (.40) | (.59) E | (.44) | ||||||
| Distributions from net realized gain | (1.03) | (.65) | (3.29) | - | (1.34) E | (4.04) | ||||||
| Total distributions | (1.45) | (1.07) | (3.83) | (.40) | (1.93) | (4.48) | ||||||
| Net asset value, end of period | $ | 58.99 | $ | 52.04 | $ | 50.61 | $ | 51.49 | $ | 39.27 | $ | 39.65 |
Total Return F,G | 16.31 % | 5.16% | 5.59% | 32.41% | 3.99% | 16.80% | ||||||
Ratios to Average Net Assets B,H,I | ||||||||||||
| Expenses before reductions | .74% J | .77% | .75% | .75% | .62% | .61% | ||||||
| Expenses net of fee waivers, if any | .73 % J | .77% | .75% | .75% | .61% | .61% | ||||||
| Expenses net of all reductions | .73% J | .77% | .75% | .75% | .60% | .61% | ||||||
| Net investment income (loss) | 1.04% J | .97% | .99% | 1.28% C | 1.44% | 1.79% D | ||||||
| Supplemental Data | ||||||||||||
| Net assets, end of period (in millions) | $ | 272 | $ | 219 | $ | 62 | $ | 54 | $ | 37 | $ | 49 |
Portfolio turnover rate K | 49 % J | 59% | 46% | 53% | 72% | 66% |
Fidelity Advisor® Value Strategies Fund Class I |
Six months ended (Unaudited) May 31, 2024 | Years ended November 30, 2023 | 2022 | 2021 | 2020 | 2019 | |||||||
Selected Per-Share Data | ||||||||||||
| Net asset value, beginning of period | $ | 47.79 | $ | 46.56 | $ | 47.69 | $ | 36.40 | $ | 36.90 | $ | 36.64 |
| Income from Investment Operations | ||||||||||||
Net investment income (loss) A,B | .24 | .38 | .39 | .54 C | .40 | .55 D | ||||||
| Net realized and unrealized gain (loss) | 7.43 | 1.86 | 2.28 | 11.10 | .98 | 4.12 | ||||||
| Total from investment operations | 7.67 | 2.24 | 2.67 | 11.64 | 1.38 | 4.67 | ||||||
| Distributions from net investment income | (.36) | (.36) | (.51) | (.35) | (.53) E | (.37) | ||||||
| Distributions from net realized gain | (1.03) | (.65) | (3.29) | - | (1.34) E | (4.04) | ||||||
| Total distributions | (1.39) | (1.01) | (3.80) | (.35) | (1.88) F | (4.41) | ||||||
| Net asset value, end of period | $ | 54.07 | $ | 47.79 | $ | 46.56 | $ | 47.69 | $ | 36.40 | $ | 36.90 |
Total Return G,H | 16.23 % | 5.03% | 5.44% | 32.23% | 3.80% | 16.64% | ||||||
Ratios to Average Net Assets B,I,J | ||||||||||||
| Expenses before reductions | .87% K | .90% | .89% | .88% | .78% | .78% | ||||||
| Expenses net of fee waivers, if any | .86 % K | .90% | .88% | .88% | .78% | .78% | ||||||
| Expenses net of all reductions | .86% K | .90% | .88% | .88% | .77% | .77% | ||||||
| Net investment income (loss) | .91% K | .83% | .86% | 1.15% C | 1.27% | 1.63% D | ||||||
| Supplemental Data | ||||||||||||
| Net assets, end of period (in millions) | $ | 605 | $ | 457 | $ | 352 | $ | 256 | $ | 61 | $ | 72 |
Portfolio turnover rate L | 49 % K | 59% | 46% | 53% | 72% | 66% |
| Fidelity Central Fund | Investment Manager | Investment Objective | Investment Practices | Expense RatioA |
| Fidelity Money Market Central Funds | Fidelity Management & Research Company LLC (FMR) | Each fund seeks to obtain a high level of current income consistent with the preservation of capital and liquidity. | Short-term Investments | Less than .005% |
| Gross unrealized appreciation | $586,019 |
| Gross unrealized depreciation | (86,673) |
| Net unrealized appreciation (depreciation) | $499,346 |
| Tax cost | $1,869,901 |
| Purchases ($) | Sales ($) | |
| Fidelity Advisor Value Strategies Fund | 669,506 | 533,497 |
| Maximum Management Fee Rate % | |
| Class A | .69 |
| Class M | .68 |
| Class C | .72 |
| Fidelity Value Strategies Fund | .69 |
| Class K | .56 |
| Class I | .69 |
| Total Management Fee Rate % | |
| Class A | .69 |
| Class M | .68 |
| Class C | .69 |
| Fidelity Value Strategies Fund | .65 |
| Class K | .56 |
| Class I | .69 |
| Performance Adjustment Index | |
| Fidelity Advisor Value Strategies Fund | Russell Midcap Value Index |
| Distribution Fee | Service Fee | Total Fees ($) | Retained by FDC ($) | |
| Class A | - % | .25% | 501 | 20 |
| Class M | .25% | .25% | 606 | 2 |
| Class C | .75% | .25% | 109 | 30 |
| 1,216 | 52 |
| Retained by FDC ($) | |
| Class A | 48 |
| Class M | 2 |
Class CA | -B |
50 |
| % of Class-Level Average Net Assets | |
| Class A | .1726 |
| Class M | .1616 |
| Class C | .1991 |
| Fidelity Value Strategies Fund | .1690 |
| Class I | .1733 |
| Amount ($) | % of Class-Level Average Net Assets | |
| Class A | 167 | .18 |
| Class M | 96 | .16 |
| Class C | 11 | .20 |
| Fidelity Value Strategies Fund | 298 | .17 |
| Class K | 25 | .04 |
| Class I | 227 | .18 |
824 |
| % of Average Net Assets | |
| Fidelity Advisor Value Strategies Fund | .0275 |
| % of Average Net Assets | |
| Fidelity Advisor Value Strategies Fund | .03 |
| Amount ($) | |
| Fidelity Advisor Value Strategies Fund | 12 |
| Borrower or Lender | Average Loan Balance ($) | Weighted Average Interest Rate | Interest Expense ($) | |
Fidelity Advisor Value Strategies Fund | Borrower | 15,686 | 5.57% | 10 |
| Purchases ($) | Sales ($) | Realized Gain (Loss)($) | |
| Fidelity Advisor Value Strategies Fund | 29,870 | 34,896 | 2,730 |
| Amount ($) | |
| Fidelity Advisor Value Strategies Fund | 2 |
| Total Security Lending Fees Paid to NFS ($) | Security Lending Income From Securities Loaned to NFS ($) | Value of Securities Loaned to NFS at Period End ($) | |
| Fidelity Advisor Value Strategies Fund | 63 | - | - |
Six months ended May 31, 2024 | Year ended November 30, 2023 | |
| Fidelity Advisor Value Strategies Fund | ||
| Distributions to shareholders | ||
| Class A | $10,920 | $7,159 |
| Class M | 5,651 | 4,122 |
| Class C | 616 | 374 |
| Fidelity Value Strategies Fund | 16,996 | 11,158 |
| Class K | 6,225 | 1,988 |
| Class I | 13,795 | 7,583 |
Total | $54,203 | $32,384 |
| Shares | Shares | Dollars | Dollars | |
Six months ended May 31, 2024 | Year ended November 30, 2023 | Six months ended May 31, 2024 | Year ended November 30, 2023 | |
| Fidelity Advisor Value Strategies Fund | ||||
| Class A | ||||
| Shares sold | 1,094 | 1,747 | $49,621 | $70,562 |
| Reinvestment of distributions | 207 | 158 | 9,286 | 6,023 |
| Shares redeemed | (705) | (1,186) | (32,064) | (47,456) |
| Net increase (decrease) | 596 | 719 | $26,843 | $29,129 |
| Class M | ||||
| Shares sold | 190 | 212 | $9,262 | $9,079 |
| Reinvestment of distributions | 108 | 93 | 5,214 | 3,805 |
| Shares redeemed | (336) | (614) | (16,449) | (26,529) |
| Net increase (decrease) | (38) | (309) | $(1,973) | $(13,645) |
| Class C | ||||
| Shares sold | 109 | 157 | $4,038 | $5,213 |
| Reinvestment of distributions | 16 | 11 | 583 | 360 |
| Shares redeemed | (74) | (147) | (2,722) | (4,832) |
| Net increase (decrease) | 51 | 21 | $1,899 | $741 |
| Fidelity Value Strategies Fund | ||||
| Shares sold | 2,137 | 4,397 | $119,205 | $222,550 |
| Reinvestment of distributions | 278 | 219 | 15,459 | 10,304 |
| Shares redeemed | (1,550) | (3,692) | (86,730) | (180,063) |
| Net increase (decrease) | 865 | 924 | $47,934 | $52,791 |
| Class K | ||||
| Shares sold | 952 | 4,192 | $53,499 | $211,390 |
| Reinvestment of distributions | 112 | 42 | 6,225 | 1,988 |
| Shares redeemed | (663) | (1,246) | (37,484) | (59,323) |
| Net increase (decrease) | 401 | 2,988 | $22,240 | $154,055 |
| Class I | ||||
| Shares sold | 3,041 | 4,655 | $154,974 | $215,597 |
| Reinvestment of distributions | 259 | 166 | 13,189 | 7,191 |
| Shares redeemed | (1,668) | (2,829) | (86,291) | (128,311) |
| Net increase (decrease) | 1,632 | 1,992 | $81,872 | $94,477 |
 |


Contents
| Common Stocks - 97.4% | |||
| Shares | Value ($) (000s) | ||
| COMMUNICATION SERVICES - 1.5% | |||
| Diversified Telecommunication Services - 0.4% | |||
| Frontier Communications Parent, Inc. (a)(b) | 188,000 | 5,012 | |
| GCI Liberty, Inc. Class A (Escrow) (c)(h) | 24,724 | 0 | |
| Iridium Communications, Inc. | 89,000 | 2,680 | |
| 7,692 | |||
| Entertainment - 0.4% | |||
| Liberty Media Corp. Liberty Formula One Class C | 23,500 | 1,742 | |
| TKO Group Holdings, Inc. | 60,400 | 6,588 | |
| 8,330 | |||
| Interactive Media & Services - 0.2% | |||
| IAC, Inc. (a) | 23,200 | 1,155 | |
| Ziff Davis, Inc. (a) | 26,700 | 1,538 | |
| Zoominfo Technologies, Inc. (a) | 185,700 | 2,280 | |
| 4,973 | |||
| Media - 0.5% | |||
| Nexstar Media Group, Inc. Class A | 35,200 | 5,832 | |
| The New York Times Co. Class A | 121,400 | 6,216 | |
| 12,048 | |||
TOTAL COMMUNICATION SERVICES | 33,043 | ||
| CONSUMER DISCRETIONARY - 14.7% | |||
| Automobile Components - 1.1% | |||
| Adient PLC (a) | 227,100 | 6,413 | |
| Autoliv, Inc. | 141,700 | 18,077 | |
| 24,490 | |||
| Automobiles - 0.4% | |||
| Harley-Davidson, Inc. | 270,472 | 9,705 | |
| Broadline Retail - 0.6% | |||
| Ollie's Bargain Outlet Holdings, Inc. (a) | 145,800 | 12,018 | |
| Diversified Consumer Services - 0.9% | |||
| Service Corp. International | 284,100 | 20,359 | |
| Hotels, Restaurants & Leisure - 3.1% | |||
| Aramark | 467,400 | 15,027 | |
| Brinker International, Inc. (a) | 129,900 | 9,175 | |
| Caesars Entertainment, Inc. (a) | 222,602 | 7,916 | |
| Churchill Downs, Inc. | 151,394 | 19,606 | |
| Domino's Pizza, Inc. | 15,400 | 7,832 | |
| Wyndham Hotels & Resorts, Inc. | 142,633 | 10,093 | |
| 69,649 | |||
| Household Durables - 1.5% | |||
| PulteGroup, Inc. | 121,800 | 14,290 | |
| Taylor Morrison Home Corp. (a) | 308,964 | 17,867 | |
| 32,157 | |||
| Specialty Retail - 4.8% | |||
| Aritzia, Inc. (a) | 252,300 | 6,303 | |
| Burlington Stores, Inc. (a) | 72,348 | 17,367 | |
| Dick's Sporting Goods, Inc. | 62,000 | 14,114 | |
| Five Below, Inc. (a) | 73,000 | 10,083 | |
| Floor & Decor Holdings, Inc. Class A (a)(b) | 110,000 | 12,855 | |
| JD Sports Fashion PLC | 4,524,700 | 7,437 | |
| Valvoline, Inc. (a) | 437,004 | 17,742 | |
| Williams-Sonoma, Inc. | 75,000 | 21,992 | |
| 107,893 | |||
| Textiles, Apparel & Luxury Goods - 2.3% | |||
| Crocs, Inc. (a) | 105,200 | 16,373 | |
| PVH Corp. | 162,054 | 19,448 | |
| Tapestry, Inc. | 360,949 | 15,698 | |
| 51,519 | |||
TOTAL CONSUMER DISCRETIONARY | 327,790 | ||
| CONSUMER STAPLES - 4.8% | |||
| Beverages - 0.8% | |||
| Boston Beer Co., Inc. Class A (a) | 10,100 | 3,168 | |
| Celsius Holdings, Inc. (a) | 110,000 | 8,798 | |
| Coca-Cola Consolidated, Inc. | 7,000 | 6,867 | |
| 18,833 | |||
| Consumer Staples Distribution & Retail - 2.7% | |||
| BJ's Wholesale Club Holdings, Inc. (a) | 152,800 | 13,457 | |
| Casey's General Stores, Inc. | 30,500 | 10,119 | |
| Grocery Outlet Holding Corp. (a) | 128,000 | 2,815 | |
| Performance Food Group Co. (a) | 251,000 | 17,470 | |
| Sprouts Farmers Market LLC (a) | 62,600 | 4,944 | |
| U.S. Foods Holding Corp. (a) | 198,700 | 10,497 | |
| 59,302 | |||
| Food Products - 0.8% | |||
| Darling Ingredients, Inc. (a) | 109,500 | 4,424 | |
| Lamb Weston Holdings, Inc. | 35,400 | 3,125 | |
| Lancaster Colony Corp. | 21,529 | 3,994 | |
| Post Holdings, Inc. (a) | 41,500 | 4,423 | |
| TreeHouse Foods, Inc. (a) | 63,100 | 2,291 | |
| 18,257 | |||
| Personal Care Products - 0.5% | |||
| BellRing Brands, Inc. (a) | 68,546 | 3,987 | |
| elf Beauty, Inc. (a) | 35,498 | 6,635 | |
| 10,622 | |||
TOTAL CONSUMER STAPLES | 107,014 | ||
| ENERGY - 5.2% | |||
| Energy Equipment & Services - 1.6% | |||
| Championx Corp. | 165,400 | 5,395 | |
| Liberty Energy, Inc. Class A | 449,060 | 11,087 | |
| Weatherford International PLC (a) | 164,700 | 19,820 | |
| 36,302 | |||
| Oil, Gas & Consumable Fuels - 3.6% | |||
| Chesapeake Energy Corp. | 165,100 | 15,013 | |
| Chord Energy Corp. | 84,300 | 15,630 | |
| HF Sinclair Corp. | 239,006 | 13,200 | |
| Northern Oil & Gas, Inc. | 251,800 | 10,306 | |
| Permian Resource Corp. Class A | 903,700 | 14,812 | |
| Targa Resources Corp. | 91,300 | 10,794 | |
| 79,755 | |||
TOTAL ENERGY | 116,057 | ||
| FINANCIALS - 15.2% | |||
| Banks - 4.4% | |||
| Associated Banc-Corp. | 420,253 | 9,002 | |
| Axos Financial, Inc. (a) | 100,300 | 5,403 | |
| Bancorp, Inc., Delaware (a) | 950,069 | 31,913 | |
| East West Bancorp, Inc. | 252,188 | 18,710 | |
| Pathward Financial, Inc. | 178,155 | 9,497 | |
| Piraeus Financial Holdings SA (a) | 1,022,216 | 4,016 | |
| Popular, Inc. | 209,900 | 18,683 | |
| 97,224 | |||
| Capital Markets - 3.0% | |||
| AllianceBernstein Holding LP | 341,947 | 11,472 | |
| Blue Owl Capital, Inc. Class A | 929,615 | 16,724 | |
| Bridge Investment Group Holdings, Inc. | 344,686 | 2,668 | |
| Interactive Brokers Group, Inc. | 156,048 | 19,618 | |
| Palmer Square Capital BDC, Inc. (b) | 322,593 | 5,303 | |
| Patria Investments Ltd. | 829,500 | 10,784 | |
| 66,569 | |||
| Consumer Finance - 0.8% | |||
| NerdWallet, Inc. (a) | 871,198 | 12,153 | |
| OneMain Holdings, Inc. | 136,288 | 6,694 | |
| 18,847 | |||
| Financial Services - 3.2% | |||
| AvidXchange Holdings, Inc. (a) | 614,962 | 6,512 | |
| Cannae Holdings, Inc. | 163,723 | 2,976 | |
| Essent Group Ltd. | 235,795 | 13,370 | |
| Flywire Corp. (a) | 465,370 | 7,981 | |
| Repay Holdings Corp. (a) | 774,653 | 7,545 | |
| Shift4 Payments, Inc. (a)(b) | 61,058 | 4,108 | |
| UWM Holdings Corp. Class A (b) | 906,434 | 6,680 | |
| Voya Financial, Inc. | 131,843 | 9,996 | |
| WEX, Inc. (a) | 70,379 | 13,183 | |
| 72,351 | |||
| Insurance - 3.8% | |||
| American Financial Group, Inc. | 94,265 | 12,246 | |
| Fairfax Financial Holdings Ltd. (sub. vtg.) | 3,190 | 3,591 | |
| Primerica, Inc. | 55,000 | 12,424 | |
| Reinsurance Group of America, Inc. | 88,104 | 18,484 | |
| The Baldwin Insurance Group, Inc. Class A, (a) | 699,340 | 23,554 | |
| Unum Group | 249,221 | 13,423 | |
| 83,722 | |||
TOTAL FINANCIALS | 338,713 | ||
| HEALTH CARE - 7.4% | |||
| Biotechnology - 1.0% | |||
| Repligen Corp. (a) | 71,400 | 10,645 | |
| Sarepta Therapeutics, Inc. (a) | 28,000 | 3,636 | |
| United Therapeutics Corp. (a) | 31,600 | 8,694 | |
| 22,975 | |||
| Health Care Equipment & Supplies - 2.4% | |||
| Glaukos Corp. (a) | 85,000 | 9,581 | |
| Inspire Medical Systems, Inc. (a) | 44,300 | 7,034 | |
| Masimo Corp. (a) | 119,100 | 14,828 | |
| Penumbra, Inc. (a) | 78,000 | 14,779 | |
| Tandem Diabetes Care, Inc. (a) | 150,000 | 7,685 | |
| 53,907 | |||
| Health Care Providers & Services - 3.1% | |||
| Acadia Healthcare Co., Inc. (a) | 166,600 | 11,477 | |
| agilon health, Inc. (a) | 750,000 | 4,725 | |
| Alignment Healthcare, Inc. (a) | 1,120,000 | 8,826 | |
| BrightSpring Health Services, Inc. | 440,043 | 4,950 | |
| Chemed Corp. | 30,100 | 16,687 | |
| Molina Healthcare, Inc. (a) | 23,400 | 7,361 | |
| Privia Health Group, Inc. (a) | 399,000 | 6,931 | |
| Surgery Partners, Inc. (a) | 270,500 | 7,466 | |
| 68,423 | |||
| Health Care Technology - 0.2% | |||
| Evolent Health, Inc. Class A (a) | 235,000 | 4,980 | |
| Life Sciences Tools & Services - 0.7% | |||
| 10X Genomics, Inc. (a) | 180,000 | 4,036 | |
| Bruker Corp. | 180,800 | 11,844 | |
| 15,880 | |||
TOTAL HEALTH CARE | 166,165 | ||
| INDUSTRIALS - 22.0% | |||
| Aerospace & Defense - 1.8% | |||
| HEICO Corp. Class A | 135,513 | 23,804 | |
| Howmet Aerospace, Inc. | 206,600 | 17,489 | |
| 41,293 | |||
| Building Products - 2.8% | |||
| Carlisle Companies, Inc. | 78,140 | 32,691 | |
| Fortune Brands Innovations, Inc. | 110,400 | 7,735 | |
| Owens Corning | 54,700 | 9,905 | |
| Simpson Manufacturing Co. Ltd. | 23,700 | 3,932 | |
| Trex Co., Inc. (a) | 96,500 | 8,345 | |
| 62,608 | |||
| Commercial Services & Supplies - 1.0% | |||
| The Brink's Co. | 208,492 | 21,525 | |
| Construction & Engineering - 1.2% | |||
| EMCOR Group, Inc. | 12,500 | 4,858 | |
| MDU Resources Group, Inc. | 170,100 | 4,293 | |
| Willscot Mobile Mini Holdings (a) | 451,198 | 17,791 | |
| 26,942 | |||
| Electrical Equipment - 1.6% | |||
| Acuity Brands, Inc. | 18,300 | 4,751 | |
| nVent Electric PLC | 207,500 | 16,886 | |
| Regal Rexnord Corp. | 87,633 | 13,105 | |
| 34,742 | |||
| Ground Transportation - 2.1% | |||
| Landstar System, Inc. | 117,411 | 21,372 | |
| XPO, Inc. (a) | 247,000 | 26,424 | |
| 47,796 | |||
| Machinery - 5.0% | |||
| Allison Transmission Holdings, Inc. | 104,263 | 7,904 | |
| Chart Industries, Inc. (a)(b) | 55,500 | 8,715 | |
| Crane Co. | 127,800 | 19,052 | |
| Dover Corp. | 57,900 | 10,643 | |
| ESAB Corp. | 218,900 | 22,507 | |
| Flowserve Corp. | 421,694 | 20,958 | |
| ITT, Inc. | 168,987 | 22,455 | |
| 112,234 | |||
| Marine Transportation - 1.1% | |||
| Kirby Corp. (a) | 190,994 | 23,716 | |
| Professional Services - 2.4% | |||
| CACI International, Inc. Class A (a) | 64,600 | 27,421 | |
| Dayforce, Inc. (a)(b) | 17,500 | 866 | |
| KBR, Inc. | 372,360 | 24,449 | |
| 52,736 | |||
| Trading Companies & Distributors - 3.0% | |||
| Air Lease Corp. Class A (b) | 279,600 | 13,320 | |
| Core & Main, Inc. (a) | 210,500 | 12,116 | |
| Watsco, Inc. | 37,400 | 17,761 | |
| WESCO International, Inc. | 133,913 | 24,036 | |
| 67,233 | |||
TOTAL INDUSTRIALS | 490,825 | ||
| INFORMATION TECHNOLOGY - 9.3% | |||
| Communications Equipment - 0.8% | |||
| Ciena Corp. (a) | 186,046 | 8,962 | |
| Lumentum Holdings, Inc. (a) | 216,400 | 9,413 | |
| 18,375 | |||
| Electronic Equipment, Instruments & Components - 1.0% | |||
| Avnet, Inc. | 156,700 | 8,556 | |
| Cognex Corp. | 64,371 | 2,930 | |
| Coherent Corp. (a) | 94,500 | 5,392 | |
| Jabil, Inc. | 45,200 | 5,374 | |
| 22,252 | |||
| IT Services - 1.5% | |||
| Akamai Technologies, Inc. (a) | 34,000 | 3,136 | |
| EPAM Systems, Inc. (a) | 55,200 | 9,822 | |
| GoDaddy, Inc. (a) | 13,200 | 1,843 | |
| Okta, Inc. (a) | 95,700 | 8,487 | |
| Twilio, Inc. Class A (a) | 171,500 | 9,844 | |
| 33,132 | |||
| Semiconductors & Semiconductor Equipment - 1.7% | |||
| Cirrus Logic, Inc. (a) | 125,400 | 14,383 | |
| Lattice Semiconductor Corp. (a) | 223,800 | 16,615 | |
| SolarEdge Technologies, Inc. (a) | 117,600 | 5,761 | |
| 36,759 | |||
| Software - 4.3% | |||
| Bill Holdings, Inc. (a) | 138,400 | 7,204 | |
| Blackbaud, Inc. (a) | 102,200 | 7,965 | |
| BlackLine, Inc. (a) | 152,700 | 7,287 | |
| Dynatrace, Inc. (a) | 347,800 | 15,905 | |
| Elastic NV (a) | 87,900 | 9,146 | |
| Five9, Inc. (a) | 216,200 | 10,110 | |
| Gen Digital, Inc. | 385,700 | 9,577 | |
| Pagaya Technologies Ltd. Class A (a)(b) | 415,905 | 4,912 | |
| PTC, Inc. (a) | 28,100 | 4,952 | |
| Tenable Holdings, Inc. (a) | 241,218 | 10,177 | |
| Workiva, Inc. (a) | 122,232 | 9,408 | |
| 96,643 | |||
TOTAL INFORMATION TECHNOLOGY | 207,161 | ||
| MATERIALS - 6.8% | |||
| Chemicals - 2.1% | |||
| Celanese Corp. Class A | 49,400 | 7,511 | |
| OCI NV | 316,900 | 8,691 | |
| RPM International, Inc. | 145,200 | 16,277 | |
| Westlake Corp. | 90,500 | 14,531 | |
| 47,010 | |||
| Construction Materials - 0.9% | |||
| Eagle Materials, Inc. | 85,000 | 19,753 | |
| Containers & Packaging - 0.7% | |||
| Aptargroup, Inc. | 114,100 | 16,851 | |
| Metals & Mining - 2.3% | |||
| Alcoa Corp. | 82,500 | 3,652 | |
| Cleveland-Cliffs, Inc. (a)(b) | 604,700 | 10,449 | |
| Lundin Mining Corp. | 1,234,000 | 14,187 | |
| Reliance, Inc. | 76,300 | 22,950 | |
| 51,238 | |||
| Paper & Forest Products - 0.8% | |||
| Louisiana-Pacific Corp. | 200,900 | 18,419 | |
TOTAL MATERIALS | 153,271 | ||
| REAL ESTATE - 6.9% | |||
| Equity Real Estate Investment Trusts (REITs) - 6.4% | |||
| American Homes 4 Rent Class A | 147,500 | 5,316 | |
| CubeSmart | 284,052 | 12,018 | |
| Douglas Emmett, Inc. | 194,700 | 2,716 | |
| EastGroup Properties, Inc. | 90,000 | 14,866 | |
| Equity Lifestyle Properties, Inc. | 261,900 | 16,439 | |
| Essex Property Trust, Inc. | 20,200 | 5,248 | |
| Four Corners Property Trust, Inc. | 468,800 | 11,443 | |
| Lamar Advertising Co. Class A | 86,100 | 10,169 | |
| NETSTREIT Corp. (b) | 522,100 | 9,058 | |
| Postal Realty Trust, Inc. Class A (b) | 759,830 | 10,167 | |
| Ryman Hospitality Properties, Inc. | 26,200 | 2,753 | |
| SITE Centers Corp. | 745,700 | 10,753 | |
| Tanger, Inc. | 139,600 | 3,874 | |
| Terreno Realty Corp. | 201,300 | 11,390 | |
| Ventas, Inc. | 319,200 | 16,043 | |
| 142,253 | |||
| Real Estate Management & Development - 0.5% | |||
| Jones Lang LaSalle, Inc. (a) | 63,000 | 12,730 | |
TOTAL REAL ESTATE | 154,983 | ||
| UTILITIES - 3.6% | |||
| Electric Utilities - 0.4% | |||
| Pinnacle West Capital Corp. (b) | 53,700 | 4,235 | |
| Portland General Electric Co. | 90,255 | 4,022 | |
| 8,257 | |||
| Gas Utilities - 1.1% | |||
| National Fuel Gas Co. | 106,847 | 6,107 | |
| Southwest Gas Holdings, Inc. | 138,100 | 10,715 | |
| UGI Corp. | 280,700 | 7,147 | |
| 23,969 | |||
| Independent Power and Renewable Electricity Producers - 1.7% | |||
| Ormat Technologies, Inc. | 60,600 | 4,569 | |
| Talen Energy Corp. | 47,600 | 5,481 | |
| Vistra Corp. | 294,095 | 29,139 | |
| 39,189 | |||
| Multi-Utilities - 0.2% | |||
| Algonquin Power & Utilities Corp. | 98,522 | 619 | |
| NorthWestern Energy Corp. | 62,800 | 3,263 | |
| 3,882 | |||
| Water Utilities - 0.2% | |||
| Essential Utilities, Inc. | 120,215 | 4,536 | |
TOTAL UTILITIES | 79,833 | ||
| TOTAL COMMON STOCKS (Cost $1,723,137) | 2,174,855 | ||
| U.S. Treasury Obligations - 0.1% | |||
Principal Amount (d) (000s) | Value ($) (000s) | ||
U.S. Treasury Bills, yield at date of purchase 5.31% to 5.33% 6/13/24 to 8/1/24 (e) (Cost $2,041) | 2,050 | 2,042 | |
| Money Market Funds - 5.5% | |||
| Shares | Value ($) (000s) | ||
| Fidelity Cash Central Fund 5.39% (f) | 58,941,603 | 58,953 | |
| Fidelity Securities Lending Cash Central Fund 5.39% (f)(g) | 63,423,083 | 63,429 | |
| TOTAL MONEY MARKET FUNDS (Cost $122,381) | 122,382 | ||
| TOTAL INVESTMENT IN SECURITIES - 103.0% (Cost $1,847,559) | 2,299,279 |
NET OTHER ASSETS (LIABILITIES) - (3.0)% | (67,042) |
| NET ASSETS - 100.0% | 2,232,237 |
| Futures Contracts | |||||
Number of contracts | Expiration Date | Notional Amount ($) (000s) | Value ($) (000s) | Unrealized Appreciation/ (Depreciation) ($) (000s) | |
| Purchased | |||||
| Equity Index Contracts | |||||
| CME E-mini S&P MidCap 400 Index Contracts (United States) | 80 | Jun 2024 | 23,935 | (156) | (156) |
| The notional amount of futures purchased as a percentage of Net Assets is 1.1% | |||||
| (a) | Non-income producing |
| (b) | Security or a portion of the security is on loan at period end. |
| (c) | Level 3 security |
| (d) | Amount is stated in United States dollars unless otherwise noted. |
| (e) | Security or a portion of the security was pledged to cover margin requirements for futures contracts. At period end, the value of securities pledged amounted to $969,000. |
| (f) | Affiliated fund that is generally available only to investment companies and other accounts managed by Fidelity Investments. The rate quoted is the annualized seven-day yield of the fund at period end. A complete unaudited listing of the fund's holdings as of its most recent quarter end is available upon request. In addition, each Fidelity Central Fund's financial statements are available on the SEC's website or upon request. |
| (g) | Investment made with cash collateral received from securities on loan. |
| (h) | Restricted securities (including private placements) - Investment in securities not registered under the Securities Act of 1933 (excluding 144A issues). At the end of the period, the value of restricted securities (excluding 144A issues) amounted to $0 or 0.0% of net assets. |
| Additional information on each restricted holding is as follows: | ||
| Security | Acquisition Date | Acquisition Cost ($) (000s) |
| GCI Liberty, Inc. Class A (Escrow) | 5/23/23 | 0 |
| Affiliate (Amounts in thousands) | Value, beginning of period ($) | Purchases ($) | Sales Proceeds ($) | Dividend Income ($) | Realized Gain (loss) ($) | Change in Unrealized appreciation (depreciation) ($) | Value, end of period ($) | % ownership, end of period |
| Fidelity Cash Central Fund 5.39% | 26,896 | 509,508 | 477,449 | 1,335 | (1) | (1) | 58,953 | 0.1% |
| Fidelity Securities Lending Cash Central Fund 5.39% | 38,819 | 464,002 | 439,392 | 62 | - | - | 63,429 | 0.3% |
| Total | 65,715 | 973,510 | 916,841 | 1,397 | (1) | (1) | 122,382 | |
| Valuation Inputs at Reporting Date: | ||||
Description (Amounts in thousands) | Total ($) | Level 1 ($) | Level 2 ($) | Level 3 ($) |
Investments in Securities: | ||||
| Equities: | ||||
Communication Services | 33,043 | 33,043 | - | - |
Consumer Discretionary | 327,790 | 320,353 | 7,437 | - |
Consumer Staples | 107,014 | 107,014 | - | - |
Energy | 116,057 | 116,057 | - | - |
Financials | 338,713 | 334,697 | 4,016 | - |
Health Care | 166,165 | 166,165 | - | - |
Industrials | 490,825 | 490,825 | - | - |
Information Technology | 207,161 | 207,161 | - | - |
Materials | 153,271 | 144,580 | 8,691 | - |
Real Estate | 154,983 | 154,983 | - | - |
Utilities | 79,833 | 79,833 | - | - |
| U.S. Government and Government Agency Obligations | 2,042 | - | 2,042 | - |
| Money Market Funds | 122,382 | 122,382 | - | - |
| Total Investments in Securities: | 2,299,279 | 2,277,093 | 22,186 | - |
Derivative Instruments: Liabilities | ||||
Futures Contracts | (156) | (156) | - | - |
| Total Liabilities | (156) | (156) | - | - |
| Total Derivative Instruments: | (156) | (156) | - | - |
Primary Risk Exposure / Derivative Type | Value | |
| (Amounts in thousands) | Asset ($) | Liability ($) |
| Equity Risk | ||
Futures Contracts (a) | 0 | (156) |
| Total Equity Risk | 0 | (156) |
| Total Value of Derivatives | 0 | (156) |
| Statement of Assets and Liabilities | ||||
| Amounts in thousands (except per-share amounts) | May 31, 2024 (Unaudited) | |||
| Assets | ||||
| Investment in securities, at value (including securities loaned of $62,689) - See accompanying schedule: | ||||
Unaffiliated issuers (cost $1,725,178) | $ | 2,176,897 | ||
Fidelity Central Funds (cost $122,381) | 122,382 | |||
| Total Investment in Securities (cost $1,847,559) | $ | 2,299,279 | ||
| Cash | 725 | |||
| Receivable for fund shares sold | 2,542 | |||
| Dividends receivable | 1,902 | |||
| Distributions receivable from Fidelity Central Funds | 275 | |||
| Receivable for daily variation margin on futures contracts | 275 | |||
Total assets | 2,304,998 | |||
| Liabilities | ||||
| Payable for investments purchased | $ | 5,454 | ||
| Payable for fund shares redeemed | 2,342 | |||
| Accrued management fee | 1,114 | |||
| Distribution and service plan fees payable | 352 | |||
| Other payables and accrued expenses | 70 | |||
| Collateral on securities loaned | 63,429 | |||
| Total liabilities | 72,761 | |||
| Net Assets | $ | 2,232,237 | ||
| Net Assets consist of: | ||||
| Paid in capital | $ | 1,698,884 | ||
| Total accumulated earnings (loss) | 533,353 | |||
| Net Assets | $ | 2,232,237 | ||
| Net Asset Value and Maximum Offering Price | ||||
| Class A : | ||||
Net Asset Value and redemption price per share ($674,772 ÷ 16,414 shares)(a) | $ | 41.11 | ||
| Maximum offering price per share (100/94.25 of $41.11) | $ | 43.62 | ||
| Class M : | ||||
Net Asset Value and redemption price per share ($469,782 ÷ 11,305 shares)(a) | $ | 41.56 | ||
| Maximum offering price per share (100/96.50 of $41.56) | $ | 43.07 | ||
| Class C : | ||||
Net Asset Value and offering price per share ($20,345 ÷ 575 shares)(a)(b) | $ | 35.36 | ||
| Fidelity Stock Selector Mid Cap Fund : | ||||
Net Asset Value, offering price and redemption price per share ($360,892 ÷ 8,176 shares) | $ | 44.14 | ||
| Class I : | ||||
Net Asset Value, offering price and redemption price per share ($432,557 ÷ 9,769 shares) | $ | 44.28 | ||
| Class Z : | ||||
Net Asset Value, offering price and redemption price per share ($273,889 ÷ 6,196 shares)(b) | $ | 44.21 | ||
(a)Redemption price per share is equal to net asset value less any applicable contingent deferred sales charge. | ||||
(b)Corresponding Net Asset Value does not calculate due to rounding of fractional net assets and/or shares. | ||||
| Statement of Operations | ||||
| Amounts in thousands | Six months ended May 31, 2024 (Unaudited) | |||
| Investment Income | ||||
| Dividends | $ | 13,297 | ||
| Interest | 56 | |||
| Income from Fidelity Central Funds (including $62 from security lending) | 1,397 | |||
| Total income | 14,750 | |||
| Expenses | ||||
| Management fee | ||||
| Basic fee | $ | 6,299 | ||
| Performance adjustment | (378) | |||
| Transfer agent fees | 824 | |||
| Distribution and service plan fees | 2,082 | |||
| Accounting fees | 139 | |||
| Custodian fees and expenses | 19 | |||
| Independent trustees' fees and expenses | 5 | |||
| Registration fees | 79 | |||
| Audit | 30 | |||
| Legal | 4 | |||
| Interest | 8 | |||
| Miscellaneous | 25 | |||
| Total expenses before reductions | 9,136 | |||
| Expense reductions | (93) | |||
| Total expenses after reductions | 9,043 | |||
| Net Investment income (loss) | 5,707 | |||
| Realized and Unrealized Gain (Loss) | ||||
| Net realized gain (loss) on: | ||||
| Investment Securities: | ||||
| Unaffiliated issuers | 61,245 | |||
| Redemptions in-kind | 17,089 | |||
| Fidelity Central Funds | (1) | |||
| Foreign currency transactions | 15 | |||
| Futures contracts | 6,024 | |||
| Total net realized gain (loss) | 84,372 | |||
| Change in net unrealized appreciation (depreciation) on: | ||||
| Investment Securities: | ||||
| Unaffiliated issuers | 234,316 | |||
| Assets and liabilities in foreign currencies | 1 | |||
| Futures contracts | (142) | |||
| Total change in net unrealized appreciation (depreciation) | 234,175 | |||
| Net gain (loss) | 318,547 | |||
| Net increase (decrease) in net assets resulting from operations | $ | 324,254 | ||
| Statement of Changes in Net Assets | ||||
| Amount in thousands | Six months ended May 31, 2024 (Unaudited) | Year ended November 30, 2023 | ||
| Increase (Decrease) in Net Assets | ||||
| Operations | ||||
| Net investment income (loss) | $ | 5,707 | $ | 15,131 |
| Net realized gain (loss) | 84,372 | (420) | ||
| Change in net unrealized appreciation (depreciation) | 234,175 | 23,136 | ||
| Net increase (decrease) in net assets resulting from operations | 324,254 | 37,847 | ||
| Distributions to shareholders | (13,139) | (176,342) | ||
| Share transactions - net increase (decrease) | 11,584 | (44,418) | ||
| Total increase (decrease) in net assets | 322,699 | (182,913) | ||
| Net Assets | ||||
| Beginning of period | 1,909,538 | 2,092,451 | ||
| End of period | $ | 2,232,237 | $ | 1,909,538 |
Fidelity Advisor® Stock Selector Mid Cap Fund Class A |
Six months ended (Unaudited) May 31, 2024 | Years ended November 30, 2023 | 2022 | 2021 | 2020 | 2019 | |||||||
Selected Per-Share Data | ||||||||||||
| Net asset value, beginning of period | $ | 35.44 | $ | 38.19 | $ | 45.46 | $ | 37.74 | $ | 36.07 | $ | 39.28 |
| Income from Investment Operations | ||||||||||||
Net investment income (loss) A,B | .09 | .26 | .20 | .20 | .30 C | .25 | ||||||
| Net realized and unrealized gain (loss) | 5.82 | .35 | (1.76) | 8.40 | 2.85 | 2.80 D | ||||||
| Total from investment operations | 5.91 | .61 | (1.56) | 8.60 | 3.15 | 3.05 | ||||||
| Distributions from net investment income | (.24) | (.18) | (.21) | (.35) | (.21) | (.25) | ||||||
| Distributions from net realized gain | - | (3.18) | (5.50) | (.54) | (1.27) | (6.01) | ||||||
| Total distributions | (.24) | (3.36) | (5.71) | (.88) E | (1.48) | (6.26) | ||||||
| Net asset value, end of period | $ | 41.11 | $ | 35.44 | $ | 38.19 | $ | 45.46 | $ | 37.74 | $ | 36.07 |
Total Return F,G,H | 16.70 % | 2.23% | (4.66)% | 23.19% | 8.99% | 12.13% D | ||||||
Ratios to Average Net Assets B,I,J | ||||||||||||
| Expenses before reductions | .94% K | .96% | .97% | 1.05% | 1.14% | 1.14% | ||||||
| Expenses net of fee waivers, if any | .93 % K | .96% | .97% | 1.05% | 1.14% | 1.14% | ||||||
| Expenses net of all reductions | .93% K | .96% | .97% | 1.05% | 1.13% | 1.14% | ||||||
| Net investment income (loss) | .47% K | .73% | .52% | .45% | .94% C | .75% | ||||||
| Supplemental Data | ||||||||||||
| Net assets, end of period (in millions) | $ | 675 | $ | 603 | $ | 654 | $ | 736 | $ | 626 | $ | 623 |
Portfolio turnover rate L | 53 % K,M | 44% | 64% | 43% | 86% | 57% |
Fidelity Advisor® Stock Selector Mid Cap Fund Class M |
Six months ended (Unaudited) May 31, 2024 | Years ended November 30, 2023 | 2022 | 2021 | 2020 | 2019 | |||||||
Selected Per-Share Data | ||||||||||||
| Net asset value, beginning of period | $ | 35.78 | $ | 38.50 | $ | 45.77 | $ | 37.99 | $ | 36.30 | $ | 39.43 |
| Income from Investment Operations | ||||||||||||
Net investment income (loss) A,B | .05 | .17 | .11 | .09 | .22 C | .17 | ||||||
| Net realized and unrealized gain (loss) | 5.87 | .37 | (1.80) | 8.48 | 2.86 | 2.85 D | ||||||
| Total from investment operations | 5.92 | .54 | (1.69) | 8.57 | 3.08 | 3.02 | ||||||
| Distributions from net investment income | (.14) | (.08) | (.09) | (.25) | (.12) | (.14) | ||||||
| Distributions from net realized gain | - | (3.18) | (5.50) | (.54) | (1.27) | (6.01) | ||||||
| Total distributions | (.14) | (3.26) | (5.58) E | (.79) | (1.39) | (6.15) | ||||||
| Net asset value, end of period | $ | 41.56 | $ | 35.78 | $ | 38.50 | $ | 45.77 | $ | 37.99 | $ | 36.30 |
Total Return F,G,H | 16.57 % | 1.99% | (4.90)% | 22.91% | 8.71% | 11.88% D | ||||||
Ratios to Average Net Assets B,I,J | ||||||||||||
| Expenses before reductions | 1.18% K | 1.21% | 1.22% | 1.29% | 1.38% | 1.38% | ||||||
| Expenses net of fee waivers, if any | 1.17 % K | 1.20% | 1.21% | 1.29% | 1.38% | 1.38% | ||||||
| Expenses net of all reductions | 1.17% K | 1.20% | 1.21% | 1.29% | 1.37% | 1.38% | ||||||
| Net investment income (loss) | .23% K | .49% | .27% | .20% | .70% C | .51% | ||||||
| Supplemental Data | ||||||||||||
| Net assets, end of period (in millions) | $ | 470 | $ | 429 | $ | 464 | $ | 552 | $ | 496 | $ | 544 |
Portfolio turnover rate L | 53 % K,M | 44% | 64% | 43% | 86% | 57% |
Fidelity Advisor® Stock Selector Mid Cap Fund Class C |
Six months ended (Unaudited) May 31, 2024 | Years ended November 30, 2023 | 2022 | 2021 | 2020 | 2019 | |||||||
Selected Per-Share Data | ||||||||||||
| Net asset value, beginning of period | $ | 30.42 | $ | 33.33 | $ | 40.31 | $ | 33.58 | $ | 32.15 | $ | 35.67 |
| Income from Investment Operations | ||||||||||||
Net investment income (loss) A,B | (.05) | (.02) | (.09) | (.14) | .04 C | (.01) | ||||||
| Net realized and unrealized gain (loss) | 4.99 | .29 | (1.53) | 7.51 | 2.50 | 2.46 D | ||||||
| Total from investment operations | 4.94 | .27 | (1.62) | 7.37 | 2.54 | 2.45 | ||||||
| Distributions from net investment income | - | - | - | (.10) | - | - | ||||||
| Distributions from net realized gain | - | (3.18) | (5.36) | (.54) | (1.11) | (5.97) | ||||||
| Total distributions | - | (3.18) | (5.36) | (.64) | (1.11) | (5.97) | ||||||
| Net asset value, end of period | $ | 35.36 | $ | 30.42 | $ | 33.33 | $ | 40.31 | $ | 33.58 | $ | 32.15 |
Total Return E,F,G | 16.24 % | 1.44% | (5.41)% | 22.25% | 8.10% | 11.27% D | ||||||
Ratios to Average Net Assets B,H,I | ||||||||||||
| Expenses before reductions | 1.70% J | 1.76% | 1.77% | 1.84% | 1.93% | 1.93% | ||||||
| Expenses net of fee waivers, if any | 1.69 % J | 1.75% | 1.76% | 1.84% | 1.93% | 1.93% | ||||||
| Expenses net of all reductions | 1.69% J | 1.75% | 1.76% | 1.84% | 1.92% | 1.93% | ||||||
| Net investment income (loss) | (.29)% J | (.07)% | (.28)% | (.35)% | .15% C | (.04)% | ||||||
| Supplemental Data | ||||||||||||
| Net assets, end of period (in millions) | $ | 20 | $ | 19 | $ | 22 | $ | 27 | $ | 30 | $ | 35 |
Portfolio turnover rate K | 53 % J,L | 44% | 64% | 43% | 86% | 57% |
Fidelity® Stock Selector Mid Cap Fund |
Six months ended (Unaudited) May 31, 2024 | Years ended November 30, 2023 | 2022 | 2021 | 2020 | 2019 | |||||||
Selected Per-Share Data | ||||||||||||
| Net asset value, beginning of period | $ | 38.07 | $ | 40.76 | $ | 48.16 | $ | 39.90 | $ | 38.00 | $ | 41.00 |
| Income from Investment Operations | ||||||||||||
Net investment income (loss) A,B | .16 | .37 | .32 | .34 | .40 C | .34 | ||||||
| Net realized and unrealized gain (loss) | 6.23 | .40 | (1.90) | 8.88 | 3.01 | 2.99 D | ||||||
| Total from investment operations | 6.39 | .77 | (1.58) | 9.22 | 3.41 | 3.33 | ||||||
| Distributions from net investment income | (.32) | (.27) | (.33) | (.42) | (.24) | (.32) | ||||||
| Distributions from net realized gain | - | (3.18) | (5.50) | (.54) | (1.27) | (6.01) | ||||||
| Total distributions | (.32) | (3.46) E | (5.82) E | (.96) | (1.51) | (6.33) | ||||||
| Net asset value, end of period | $ | 44.14 | $ | 38.07 | $ | 40.76 | $ | 48.16 | $ | 39.90 | $ | 38.00 |
Total Return F,G | 16.84 % | 2.52% | (4.43)% | 23.52% | 9.24% | 12.38% D | ||||||
Ratios to Average Net Assets B,H,I | ||||||||||||
| Expenses before reductions | .66% J | .71% | .72% | .79% | .89% | .94% | ||||||
| Expenses net of fee waivers, if any | .65 % J | .71% | .72% | .79% | .89% | .94% | ||||||
| Expenses net of all reductions | .65% J | .71% | .72% | .79% | .88% | .94% | ||||||
| Net investment income (loss) | .74% J | .98% | .77% | .71% | 1.19% C | .95% | ||||||
| Supplemental Data | ||||||||||||
| Net assets, end of period (in millions) | $ | 361 | $ | 327 | $ | 349 | $ | 395 | $ | 342 | $ | 362 |
Portfolio turnover rate K | 53 % J,L | 44% | 64% | 43% | 86% | 57% |
Fidelity Advisor® Stock Selector Mid Cap Fund Class I |
Six months ended (Unaudited) May 31, 2024 | Years ended November 30, 2023 | 2022 | 2021 | 2020 | 2019 | |||||||
Selected Per-Share Data | ||||||||||||
| Net asset value, beginning of period | $ | 38.19 | $ | 40.88 | $ | 48.29 | $ | 40.01 | $ | 38.15 | $ | 41.11 |
| Income from Investment Operations | ||||||||||||
Net investment income (loss) A,B | .15 | .36 | .31 | .33 | .40 C | .35 | ||||||
| Net realized and unrealized gain (loss) | 6.26 | .40 | (1.90) | 8.91 | 3.02 | 3.01 D | ||||||
| Total from investment operations | 6.41 | .76 | (1.59) | 9.24 | 3.42 | 3.36 | ||||||
| Distributions from net investment income | (.32) | (.27) | (.32) | (.42) | (.29) | (.31) | ||||||
| Distributions from net realized gain | - | (3.18) | (5.50) | (.54) | (1.27) | (6.01) | ||||||
| Total distributions | (.32) | (3.45) | (5.82) | (.96) | (1.56) | (6.32) | ||||||
| Net asset value, end of period | $ | 44.28 | $ | 38.19 | $ | 40.88 | $ | 48.29 | $ | 40.01 | $ | 38.15 |
Total Return E,F | 16.82 % | 2.49% | (4.45)% | 23.50% | 9.23% | 12.41% D | ||||||
Ratios to Average Net Assets B,G,H | ||||||||||||
| Expenses before reductions | .70% I | .73% | .74% | .82% | .90% | .91% | ||||||
| Expenses net of fee waivers, if any | .69 % I | .72% | .74% | .81% | .90% | .91% | ||||||
| Expenses net of all reductions | .69% I | .72% | .74% | .81% | .89% | .91% | ||||||
| Net investment income (loss) | .70% I | .96% | .75% | .68% | 1.18% C | .98% | ||||||
| Supplemental Data | ||||||||||||
| Net assets, end of period (in millions) | $ | 433 | $ | 341 | $ | 386 | $ | 413 | $ | 293 | $ | 312 |
Portfolio turnover rate J | 53 % I,K | 44% | 64% | 43% | 86% | 57% |
Fidelity Advisor® Stock Selector Mid Cap Fund Class Z |
Six months ended (Unaudited) May 31, 2024 | Years ended November 30, 2023 | 2022 | 2021 | 2020 | 2019 | |||||||
Selected Per-Share Data | ||||||||||||
| Net asset value, beginning of period | $ | 38.15 | $ | 40.86 | $ | 48.26 | $ | 39.97 | $ | 38.12 | $ | 41.15 |
| Income from Investment Operations | ||||||||||||
Net investment income (loss) A,B | .18 | .42 | .36 | .38 | .44 C | .41 | ||||||
| Net realized and unrealized gain (loss) | 6.26 | .38 | (1.88) | 8.92 | 3.03 | 2.99 D | ||||||
| Total from investment operations | 6.44 | .80 | (1.52) | 9.30 | 3.47 | 3.40 | ||||||
| Distributions from net investment income | (.38) | (.33) | (.38) | (.47) | (.35) | (.42) | ||||||
| Distributions from net realized gain | - | (3.18) | (5.50) | (.54) | (1.27) | (6.01) | ||||||
| Total distributions | (.38) | (3.51) | (5.88) | (1.01) | (1.62) | (6.43) | ||||||
| Net asset value, end of period | $ | 44.21 | $ | 38.15 | $ | 40.86 | $ | 48.26 | $ | 39.97 | $ | 38.12 |
Total Return E,F | 16.93 % | 2.63% | (4.30)% | 23.69% | 9.39% | 12.59% D | ||||||
Ratios to Average Net Assets B,G,H | ||||||||||||
| Expenses before reductions | .54% I | .58% | .59% | .67% | .75% | .75% | ||||||
| Expenses net of fee waivers, if any | .53 % I | .57% | .59% | .67% | .75% | .75% | ||||||
| Expenses net of all reductions | .53% I | .57% | .59% | .67% | .73% | .75% | ||||||
| Net investment income (loss) | .86% I | 1.11% | .90% | .82% | 1.33% C | 1.14% | ||||||
| Supplemental Data | ||||||||||||
| Net assets, end of period (in millions) | $ | 274 | $ | 191 | $ | 217 | $ | 67 | $ | 150 | $ | 245 |
Portfolio turnover rate J | 53 % I,K | 44% | 64% | 43% | 86% | 57% |
| Fidelity Central Fund | Investment Manager | Investment Objective | Investment Practices | Expense RatioA |
| Fidelity Money Market Central Funds | Fidelity Management & Research Company LLC (FMR) | Each fund seeks to obtain a high level of current income consistent with the preservation of capital and liquidity. | Short-term Investments | Less than .005% |
| Gross unrealized appreciation | $545,535 |
| Gross unrealized depreciation | (95,687) |
| Net unrealized appreciation (depreciation) | $449,848 |
| Tax cost | $1,849,275 |
Short-term | $(2,206) |
Long-term | (-) |
| Total capital loss carryforward | $(2,206) |
| Equity Risk | Equity risk relates to the fluctuations in the value of financial instruments as a result of changes in market prices (other than those arising from interest rate risk or foreign exchange risk), whether caused by factors specific to an individual investment, its issuer, or all factors affecting all instruments traded in a market or market segment. |
| Purchases ($) | Sales ($) | |
| Fidelity Advisor Stock Selector Mid Cap Fund | 591,481 | 540,814 |
| Shares | Total net realized gain or loss ($) | Total Proceeds ($) | |
| Fidelity Advisor Stock Selector Mid Cap Fund | 1,305 | 17,089 | 53,979 |
| Maximum Management Fee Rate % | |
| Class A | .69 |
| Class M | .68 |
| Class C | .72 |
| Fidelity Stock Selector Mid Cap Fund | .68 |
| Class I | .71 |
| Class Z | .56 |
| Total Management Fee Rate % | |
| Class A | .69 |
| Class M | .68 |
| Class C | .69 |
| Fidelity Stock Selector Mid Cap Fund | .65 |
| Class I | .69 |
| Class Z | .56 |
| Performance Adjustment Index | |
| Fidelity Advisor Stock Selector Mid Cap Fund | S&P MidCap 400 Index |
| Distribution Fee | Service Fee | Total Fees ($) | Retained by FDC ($) | |
| Class A | -% | .25% | 823 | 7 |
| Class M | .25% | .25% | 1,158 | 6 |
| Class C | .75% | .25% | 101 | 10 |
| 2,082 | 23 |
| Retained by FDC ($) | |
| Class A | 23 |
| Class M | 3 |
Class CA | -B |
26 |
| % of Class-Level Average Net Assets | |
| Class A | .1710 |
| Class M | .1648 |
| Class C | .2000 |
| Fidelity Stock Selector Mid Cap Fund | .1652 |
| Class I | .1868 |
| Amount ($) | % of Class-Level Average Net AssetsA | |
| Class A | 278 | .17 |
| Class M | 189 | .17 |
| Class C | 10 | .20 |
| Fidelity Stock Selector Mid Cap Fund | 143 | .17 |
| Class I | 181 | .19 |
| Class Z | 23 | .04 |
824 |
| % of Average Net Assets | |
| Fidelity Advisor Stock Selector Mid Cap Fund | .0268 |
| % of Average Net Assets | |
| Fidelity Advisor Stock Selector Mid Cap Fund | .03 |
| Amount ($) | |
| Fidelity Advisor Stock Selector Mid Cap Fund | 12 |
| Borrower or Lender | Average Loan Balance ($) | Weighted Average Interest Rate | Interest Expense ($) | |
Fidelity Advisor Stock Selector Mid Cap Fund | Borrower | 51,709 | 5.57% | 8 |
| Purchases ($) | Sales ($) | Realized Gain (Loss) ($) | |
| Fidelity Advisor Stock Selector Mid Cap Fund | 67,460 | 27,793 | 489 |
| Amount ($) | |
| Fidelity Advisor Stock Selector Mid Cap Fund | 2 |
| Total Security Lending Fees Paid to NFS ($) | Security Lending Income From Securities Loaned to NFS ($) | Value of Securities Loaned to NFS at Period End ($) | |
| Fidelity Advisor Stock Selector Mid Cap Fund | 6 | 1 | - |
| Expense reduction | |
| Class M | $-A |
Six months ended May 31, 2024 | Year ended November 30, 2023 | |
| Fidelity Advisor Stock Selector Mid Cap Fund | ||
| Distributions to shareholders | ||
| Class A | $3,990 | $56,107 |
| Class M | 1,689 | 39,007 |
| Class C | - | 2,087 |
| Fidelity Stock Selector Mid Cap Fund | 2,725 | 29,748 |
| Class I | 2,799 | 32,276 |
| Class Z | 1,936 | 17,117 |
Total | $13,139 | $176,342 |
| Shares | Shares | Dollars | Dollars | |
Six months ended May 31, 2024 | Year ended November 30, 2023 | Six months ended May 31, 2024 | Year ended November 30, 2023 | |
| Fidelity Advisor Stock Selector Mid Cap Fund | ||||
| Class A | ||||
| Shares sold | 341 | 965 | $13,424 | $33,647 |
| Reinvestment of distributions | 96 | 1,583 | 3,714 | 52,298 |
| Shares redeemed | (1,037) | (2,666) | (40,744) | (93,885) |
| Net increase (decrease) | (600) | (118) | $(23,606) | $(7,940) |
| Class M | ||||
| Shares sold | 301 | 696 | $11,922 | $24,702 |
| Reinvestment of distributions | 42 | 1,139 | 1,643 | 38,061 |
| Shares redeemed | (1,022) | (1,907) | (40,570) | (67,682) |
| Net increase (decrease) | (679) | (72) | $(27,005) | $(4,919) |
| Class C | ||||
| Shares sold | 37 | 78 | $1,260 | $2,379 |
| Reinvestment of distributions | - | 73 | - | 2,083 |
| Shares redeemed | (82) | (192) | (2,763) | (5,778) |
| Net increase (decrease) | (45) | (41) | $(1,503) | $(1,316) |
| Fidelity Stock Selector Mid Cap Fund | ||||
| Shares sold | 388 | 857 | $16,400 | $32,477 |
| Reinvestment of distributions | 62 | 800 | 2,573 | 28,328 |
| Shares redeemed | (851) | (1,654) | (35,668) | (61,906) |
| Net increase (decrease) | (401) | 3 | $(16,695) | $(1,101) |
| Class I | ||||
| Shares sold | 3,022 | 1,283 | $123,526 | $48,524 |
| Reinvestment of distributions | 62 | 881 | 2,573 | 31,280 |
| Shares redeemed | (2,241) | (2,678) | (93,754) | (100,697) |
| Net increase (decrease) | 843 | (514) | $32,345 | $(20,893) |
| Class Z | ||||
| Shares sold | 4,628 | 2,610 | $198,261 | $99,830 |
| Reinvestment of distributions | 40 | 461 | 1,665 | 16,346 |
| Shares redeemed | (3,489) | (3,356) | (151,878) | (124,425) |
| Net increase (decrease) | 1,179 | (285) | $48,048 | $(8,249) |
 |


Contents
| Common Stocks - 97.3% | |||
| Shares | Value ($) | ||
| COMMUNICATION SERVICES - 22.0% | |||
| Entertainment - 5.6% | |||
| Netflix, Inc. (a) | 19,900 | 12,768,238 | |
| Roku, Inc. Class A (a) | 374,996 | 21,524,770 | |
| Sea Ltd. ADR (a) | 228,940 | 15,458,029 | |
| 49,751,037 | |||
| Interactive Media & Services - 14.4% | |||
| Alphabet, Inc.: | |||
| Class A | 98,200 | 16,939,500 | |
| Class C | 249,460 | 43,396,062 | |
| Epic Games, Inc. (a)(b)(c) | 2,200 | 1,320,000 | |
| Meta Platforms, Inc. Class A | 124,189 | 57,975,151 | |
| Reddit, Inc. Class A | 2,400 | 130,176 | |
| Snap, Inc. Class A (a) | 191,200 | 2,871,824 | |
| Zoominfo Technologies, Inc. (a) | 390,782 | 4,798,803 | |
| 127,431,516 | |||
| Media - 0.3% | |||
| Magnite, Inc. (a) | 187,102 | 2,308,839 | |
| The Trade Desk, Inc. (a) | 2,300 | 213,394 | |
| 2,522,233 | |||
| Wireless Telecommunication Services - 1.7% | |||
| T-Mobile U.S., Inc. | 84,524 | 14,788,319 | |
TOTAL COMMUNICATION SERVICES | 194,493,105 | ||
| CONSUMER DISCRETIONARY - 9.9% | |||
| Automobiles - 0.0% | |||
| Neutron Holdings, Inc. (a)(b)(c) | 77,208 | 2,409 | |
| Rad Power Bikes, Inc. (a)(b)(c) | 13,874 | 6,105 | |
| Rad Power Bikes, Inc. warrants 10/6/33 (a)(b)(c) | 18,888 | 42,687 | |
| Rivian Automotive, Inc. (a) | 1,000 | 10,920 | |
| Tesla, Inc. (a) | 260 | 46,301 | |
| 108,422 | |||
| Broadline Retail - 5.7% | |||
| Amazon.com, Inc. (a) | 281,280 | 49,629,043 | |
| Lenskart Solutions Pvt Ltd. (a)(b)(c) | 12,926 | 356,218 | |
| 49,985,261 | |||
| Hotels, Restaurants & Leisure - 0.7% | |||
| Chipotle Mexican Grill, Inc. (a) | 300 | 938,856 | |
| Domino's Pizza, Inc. | 4,900 | 2,492,042 | |
| Hilton Worldwide Holdings, Inc. | 14,900 | 2,988,940 | |
| Sonder Holdings, Inc.: | |||
| Stage 1 rights (a)(c) | 1,133 | 11 | |
| Stage 2 rights (a)(c) | 1,132 | 0 | |
| Stage 3 rights (a)(c) | 1,132 | 0 | |
| Stage 4 rights (a)(c) | 1,132 | 0 | |
| Stage 5: | |||
| rights (a)(c) | 1,132 | 0 | |
| rights (a)(c) | 1,132 | 0 | |
| 6,419,849 | |||
| Specialty Retail - 2.5% | |||
| Carvana Co. Class A (a) | 78,500 | 7,848,430 | |
| Floor & Decor Holdings, Inc. Class A (a)(d) | 49,900 | 5,831,314 | |
| Lowe's Companies, Inc. | 34,000 | 7,523,860 | |
| Wayfair LLC Class A (a) | 21,586 | 1,284,151 | |
| 22,487,755 | |||
| Textiles, Apparel & Luxury Goods - 1.0% | |||
| Bombas LLC (b)(c) | 174,908 | 398,790 | |
| Hermes International SCA | 100 | 237,362 | |
| lululemon athletica, Inc. (a) | 7,301 | 2,277,839 | |
| LVMH Moet Hennessy Louis Vuitton SE | 7,100 | 5,678,183 | |
| 8,592,174 | |||
TOTAL CONSUMER DISCRETIONARY | 87,593,461 | ||
| CONSUMER STAPLES - 0.4% | |||
| Consumer Staples Distribution & Retail - 0.4% | |||
| BJ's Wholesale Club Holdings, Inc. (a) | 37,100 | 3,267,397 | |
| Food Products - 0.0% | |||
| Bowery Farming, Inc. (c) | 21,190 | 424 | |
| Bowery Farming, Inc. warrants (a)(b)(c) | 7,445 | 149 | |
| 573 | |||
| Tobacco - 0.0% | |||
| JUUL Labs, Inc. Class B (a)(b)(c) | 709 | 759 | |
TOTAL CONSUMER STAPLES | 3,268,729 | ||
| ENERGY - 0.1% | |||
| Oil, Gas & Consumable Fuels - 0.1% | |||
| Cameco Corp. | 17,200 | 954,772 | |
| FINANCIALS - 3.7% | |||
| Banks - 0.1% | |||
| Starling Bank Ltd. Series D (a)(b)(c) | 244,400 | 987,223 | |
| Capital Markets - 1.2% | |||
| Coinbase Global, Inc. (a) | 25,200 | 5,693,184 | |
| LPL Financial | 17,300 | 4,951,433 | |
| 10,644,617 | |||
| Financial Services - 2.4% | |||
| Apollo Global Management, Inc. | 7,700 | 894,432 | |
| Block, Inc. Class A (a) | 39,879 | 2,555,446 | |
| Dlocal Ltd. (a) | 44,356 | 405,857 | |
| Global Payments, Inc. | 29,800 | 3,035,130 | |
| Marqeta, Inc. Class A (a) | 838,488 | 4,460,756 | |
| Visa, Inc. Class A | 35,126 | 9,570,430 | |
| 20,922,051 | |||
| Insurance - 0.0% | |||
| Progressive Corp. | 400 | 84,472 | |
TOTAL FINANCIALS | 32,638,363 | ||
| HEALTH CARE - 8.6% | |||
| Biotechnology - 1.5% | |||
| AbbVie, Inc. | 500 | 80,620 | |
| Alnylam Pharmaceuticals, Inc. (a) | 5,263 | 781,187 | |
| ALX Oncology Holdings, Inc. (a) | 35,600 | 378,428 | |
| Argenx SE ADR (a) | 3,290 | 1,220,656 | |
| Ascendis Pharma A/S sponsored ADR (a) | 8,116 | 1,096,472 | |
| Cytokinetics, Inc. (a) | 36,541 | 1,772,604 | |
| Keros Therapeutics, Inc. (a) | 10,100 | 473,387 | |
| Moderna, Inc. (a) | 17,400 | 2,480,370 | |
| Nuvalent, Inc. Class A (a) | 14,400 | 944,928 | |
| Regeneron Pharmaceuticals, Inc. (a) | 800 | 784,128 | |
| Vaxcyte, Inc. (a) | 46,702 | 3,281,750 | |
| Zentalis Pharmaceuticals, Inc. (a) | 35,100 | 416,988 | |
| 13,711,518 | |||
| Health Care Equipment & Supplies - 2.4% | |||
| Blink Health LLC Series A1 (a)(b)(c) | 1,597 | 65,940 | |
| Boston Scientific Corp. (a) | 191,401 | 14,464,174 | |
| Penumbra, Inc. (a) | 15,495 | 2,935,838 | |
| TransMedics Group, Inc. (a) | 31,999 | 4,364,664 | |
| 21,830,616 | |||
| Health Care Providers & Services - 1.8% | |||
| agilon health, Inc. (a) | 673,683 | 4,244,203 | |
| UnitedHealth Group, Inc. | 23,291 | 11,537,663 | |
| 15,781,866 | |||
| Life Sciences Tools & Services - 0.6% | |||
| Danaher Corp. | 9,497 | 2,438,830 | |
| Thermo Fisher Scientific, Inc. | 4,700 | 2,669,506 | |
| 5,108,336 | |||
| Pharmaceuticals - 2.3% | |||
| AstraZeneca PLC sponsored ADR | 2,900 | 226,258 | |
| Eli Lilly & Co. | 20,600 | 16,899,004 | |
| Merck & Co., Inc. | 15,000 | 1,883,100 | |
| Novo Nordisk A/S Series B | 6,100 | 826,478 | |
| Structure Therapeutics, Inc. ADR (a) | 10,900 | 372,780 | |
| 20,207,620 | |||
TOTAL HEALTH CARE | 76,639,956 | ||
| INDUSTRIALS - 5.6% | |||
| Aerospace & Defense - 0.1% | |||
| Axon Enterprise, Inc. (a) | 300 | 84,501 | |
| Space Exploration Technologies Corp. Class A (a)(b)(c) | 3,000 | 291,000 | |
| 375,501 | |||
| Building Products - 1.0% | |||
| Builders FirstSource, Inc. (a) | 55,800 | 8,972,082 | |
| Commercial Services & Supplies - 0.3% | |||
| ACV Auctions, Inc. Class A (a) | 160,800 | 2,870,280 | |
| Construction & Engineering - 0.0% | |||
| Fluor Corp. (a) | 2,200 | 95,480 | |
| Electrical Equipment - 1.2% | |||
| Eaton Corp. PLC | 4,200 | 1,397,970 | |
| Nextracker, Inc. Class A (a) | 79,708 | 4,397,490 | |
| Vertiv Holdings Co. | 47,000 | 4,609,290 | |
| 10,404,750 | |||
| Ground Transportation - 3.0% | |||
| Bird Global, Inc.: | |||
| Stage 1 rights (a)(c) | 152 | 0 | |
| Stage 2 rights (a)(c) | 152 | 0 | |
| Stage 3 rights (a)(c) | 152 | 0 | |
| Lyft, Inc. (a) | 330,410 | 5,157,700 | |
| Uber Technologies, Inc. (a) | 331,576 | 21,406,547 | |
| 26,564,247 | |||
| Machinery - 0.0% | |||
| Symbotic, Inc. (a)(d) | 7,900 | 312,603 | |
TOTAL INDUSTRIALS | 49,594,943 | ||
| INFORMATION TECHNOLOGY - 47.0% | |||
| Communications Equipment - 0.3% | |||
| Arista Networks, Inc. (a) | 8,100 | 2,410,965 | |
| Electronic Equipment, Instruments & Components - 2.1% | |||
| Celestica, Inc. (a) | 8,600 | 480,912 | |
| Flex Ltd. (a) | 551,990 | 18,287,429 | |
| Jabil, Inc. | 1,587 | 188,694 | |
| 18,957,035 | |||
| IT Services - 0.6% | |||
| EPAM Systems, Inc. (a) | 8,000 | 1,423,440 | |
| MongoDB, Inc. Class A (a) | 15,100 | 3,564,506 | |
| 4,987,946 | |||
| Semiconductors & Semiconductor Equipment - 24.3% | |||
| Advanced Micro Devices, Inc. (a) | 51,100 | 8,528,590 | |
| Analog Devices, Inc. | 400 | 93,796 | |
| Applied Materials, Inc. | 12,666 | 2,724,203 | |
| Arm Holdings Ltd. ADR | 100 | 12,052 | |
| ASML Holding NV (Netherlands) | 200 | 191,354 | |
| Astera Labs, Inc. | 6,700 | 432,418 | |
| Broadcom, Inc. | 9,700 | 12,886,935 | |
| First Solar, Inc. (a) | 25,500 | 6,929,880 | |
| Marvell Technology, Inc. | 201,677 | 13,877,394 | |
| Micron Technology, Inc. | 18,000 | 2,250,000 | |
| NVIDIA Corp. | 109,476 | 120,021,820 | |
| NXP Semiconductors NV | 66,428 | 18,075,059 | |
| ON Semiconductor Corp. (a) | 219,842 | 16,057,260 | |
| Qualcomm, Inc. | 9,800 | 1,999,690 | |
| Taiwan Semiconductor Manufacturing Co. Ltd. sponsored ADR | 73,000 | 11,025,920 | |
| Xsight Labs Ltd. warrants 1/11/34 (a)(b)(c) | 1,910 | 3,514 | |
| 215,109,885 | |||
| Software - 13.7% | |||
| Cadence Design Systems, Inc. (a) | 600 | 171,786 | |
| Convoy, Inc. warrants (a)(b)(c) | 6,152 | 0 | |
| CoreWeave, Inc. (c) | 433 | 337,329 | |
| Datadog, Inc. Class A (a) | 33,300 | 3,668,994 | |
| HubSpot, Inc. (a) | 3,574 | 2,183,893 | |
| Intapp, Inc. (a) | 96,379 | 3,460,006 | |
| Microsoft Corp. | 229,983 | 95,472,843 | |
| Oracle Corp. | 63,400 | 7,429,846 | |
| Salesforce, Inc. | 16,279 | 3,816,449 | |
| Samsara, Inc. (a) | 20,100 | 681,993 | |
| ServiceNow, Inc. (a) | 6,368 | 4,183,330 | |
| Stripe, Inc. Class B (a)(b)(c) | 2,500 | 65,000 | |
| Synopsys, Inc. (a) | 600 | 336,480 | |
| 121,807,949 | |||
| Technology Hardware, Storage & Peripherals - 6.0% | |||
| Apple, Inc. | 237,213 | 45,604,199 | |
| Dell Technologies, Inc. | 41,300 | 5,763,828 | |
| Pure Storage, Inc. Class A (a) | 29,200 | 1,760,468 | |
| 53,128,495 | |||
TOTAL INFORMATION TECHNOLOGY | 416,402,275 | ||
| TOTAL COMMON STOCKS (Cost $411,289,633) | 861,585,604 | ||
| Preferred Stocks - 1.8% | |||
| Shares | Value ($) | ||
| Convertible Preferred Stocks - 1.6% | |||
| COMMUNICATION SERVICES - 0.1% | |||
| Interactive Media & Services - 0.1% | |||
| ByteDance Ltd. Series E1 (a)(b)(c) | 4,644 | 1,102,671 | |
| CONSUMER DISCRETIONARY - 0.0% | |||
| Automobiles - 0.0% | |||
| Rad Power Bikes, Inc.: | |||
| Series A(a)(b)(c) | 1,809 | 796 | |
| Series C(a)(b)(c) | 7,117 | 5,195 | |
| Series D(a)(b)(c) | 12,697 | 13,459 | |
| 19,450 | |||
| CONSUMER STAPLES - 0.0% | |||
| Consumer Staples Distribution & Retail - 0.0% | |||
| GoBrands, Inc. Series G (a)(b)(c) | 2,400 | 81,576 | |
| Tobacco - 0.0% | |||
| JUUL Labs, Inc.: | |||
| Series C(a)(b)(c) | 70,175 | 75,087 | |
| Series D(a)(b)(c) | 938 | 1,004 | |
| 76,091 | |||
TOTAL CONSUMER STAPLES | 157,667 | ||
| FINANCIALS - 0.0% | |||
| Financial Services - 0.0% | |||
| Circle Internet Financial Ltd. Series F (a)(b)(c) | 5,401 | 161,598 | |
| Tenstorrent Holdings, Inc. Series C1 (b)(c) | 2,264 | 141,998 | |
| 303,596 | |||
| HEALTH CARE - 0.1% | |||
| Health Care Equipment & Supplies - 0.1% | |||
| Blink Health LLC Series C (a)(b)(c) | 15,631 | 645,404 | |
| Health Care Technology - 0.0% | |||
| Aledade, Inc. Series E1 (a)(b)(c) | 5,837 | 229,978 | |
TOTAL HEALTH CARE | 875,382 | ||
| INDUSTRIALS - 0.9% | |||
| Aerospace & Defense - 0.7% | |||
| Relativity Space, Inc. Series E (a)(b)(c) | 36,263 | 803,225 | |
| Space Exploration Technologies Corp.: | |||
| Series I(a)(b)(c) | 3,290 | 3,191,300 | |
| Series N(a)(b)(c) | 2,559 | 2,482,230 | |
| 6,476,755 | |||
| Construction & Engineering - 0.2% | |||
| Beta Technologies, Inc. Series A (a)(b)(c) | 15,188 | 1,677,363 | |
TOTAL INDUSTRIALS | 8,154,118 | ||
| INFORMATION TECHNOLOGY - 0.4% | |||
| Electronic Equipment, Instruments & Components - 0.1% | |||
| CelLink Corp. Series D (a)(b)(c) | 12,100 | 94,259 | |
| Enevate Corp. Series E (a)(b)(c) | 285,844 | 211,525 | |
| VAST Data Ltd.: | |||
| Series A(b)(c) | 2,512 | 45,216 | |
| Series A1(b)(c) | 6,183 | 111,294 | |
| Series A2(b)(c) | 7,112 | 128,016 | |
| Series B(b)(c) | 5,659 | 101,862 | |
| Series C(b)(c) | 165 | 2,970 | |
| Series E(b)(c) | 5,408 | 97,344 | |
| 792,486 | |||
| IT Services - 0.0% | |||
| Yanka Industries, Inc.: | |||
| Series E(a)(b)(c) | 19,716 | 91,088 | |
| Series F(a)(b)(c) | 13,160 | 76,986 | |
| 168,074 | |||
| Semiconductors & Semiconductor Equipment - 0.1% | |||
| Sima Technologies, Inc.: | |||
| Series B(a)(b)(c) | 40,700 | 273,097 | |
| Series B1(a)(b)(c) | 5,810 | 44,679 | |
| Xsight Labs Ltd.: | |||
| Series D(a)(b)(c) | 17,400 | 89,436 | |
| Series D1(b)(c) | 6,366 | 47,045 | |
| 454,257 | |||
| Software - 0.2% | |||
| Anthropic PBC Series D (b)(c) | 2,890 | 86,713 | |
| Convoy, Inc. Series D (a)(b)(c) | 93,888 | 1 | |
| CoreWeave, Inc. Series C (b)(c) | 28 | 21,813 | |
| Databricks, Inc.: | |||
| Series G(a)(b)(c) | 6,600 | 518,958 | |
| Series I(b)(c) | 104 | 8,178 | |
| Moloco, Inc. Series A (b)(c) | 11,676 | 636,692 | |
| Mountain Digital, Inc. Series D (a)(b)(c) | 28,106 | 347,390 | |
| Stripe, Inc. Series H (a)(b)(c) | 5,729 | 148,954 | |
| 1,768,699 | |||
TOTAL INFORMATION TECHNOLOGY | 3,183,516 | ||
| MATERIALS - 0.1% | |||
| Metals & Mining - 0.1% | |||
| Diamond Foundry, Inc. Series C (a)(b)(c) | 23,194 | 517,690 | |
| TOTAL CONVERTIBLE PREFERRED STOCKS | 14,314,090 | ||
| Nonconvertible Preferred Stocks - 0.2% | |||
| CONSUMER DISCRETIONARY - 0.0% | |||
| Automobiles - 0.0% | |||
| Neutron Holdings, Inc. Series 1C (a)(b)(c) | 1,387,600 | 43,293 | |
| Waymo LLC Series A2 (a)(b)(c) | 2,896 | 174,194 | |
| 217,487 | |||
| FINANCIALS - 0.2% | |||
| Financial Services - 0.2% | |||
| Circle Internet Financial Ltd. Series E (a)(b)(c) | 53,240 | 1,592,941 | |
| INFORMATION TECHNOLOGY - 0.0% | |||
| IT Services - 0.0% | |||
| Gupshup, Inc. (a)(b)(c) | 17,900 | 169,871 | |
| TOTAL NONCONVERTIBLE PREFERRED STOCKS | 1,980,299 | ||
| TOTAL PREFERRED STOCKS (Cost $13,419,811) | 16,294,389 | ||
| Convertible Bonds - 0.1% | |||
Principal Amount (e) | Value ($) | ||
| CONSUMER DISCRETIONARY - 0.1% | |||
| Automobiles - 0.1% | |||
| Neutron Holdings, Inc.: | |||
| 4% 5/22/27 (b)(c) | 47,700 | 61,590 | |
| 4% 6/12/27 (b)(c) | 13,100 | 16,915 | |
| 6.5% 10/29/26 (b)(c)(f) | 424,512 | 452,148 | |
| 530,653 | |||
| INFORMATION TECHNOLOGY - 0.0% | |||
| Software - 0.0% | |||
| Convoy, Inc. 15% 9/30/26 (b)(c) | 40,971 | 0 | |
| TOTAL CONVERTIBLE BONDS (Cost $526,283) | 530,653 | ||
| Preferred Securities - 0.0% | |||
Principal Amount (e) | Value ($) | ||
| CONSUMER DISCRETIONARY - 0.0% | |||
| Automobiles - 0.0% | |||
| Rad Power Bikes, Inc. 8% 12/31/25 (b)(c) | 18,888 | 34,326 | |
| INFORMATION TECHNOLOGY - 0.0% | |||
| Electronic Equipment, Instruments & Components - 0.0% | |||
| Enevate Corp. 6% (b)(c)(g) | 14,864 | 16,314 | |
| Semiconductors & Semiconductor Equipment - 0.0% | |||
| Sima Technologies, Inc. 10% 12/31/27 (b)(c) | 42,288 | 43,439 | |
TOTAL INFORMATION TECHNOLOGY | 59,753 | ||
| TOTAL PREFERRED SECURITIES (Cost $76,040) | 94,079 | ||
| Money Market Funds - 1.0% | |||
| Shares | Value ($) | ||
| Fidelity Cash Central Fund 5.39% (h) | 2,859,066 | 2,859,638 | |
| Fidelity Securities Lending Cash Central Fund 5.39% (h)(i) | 5,505,973 | 5,506,523 | |
| TOTAL MONEY MARKET FUNDS (Cost $8,366,161) | 8,366,161 | ||
| TOTAL INVESTMENT IN SECURITIES - 100.2% (Cost $433,677,928) | 886,870,886 |
NET OTHER ASSETS (LIABILITIES) - (0.2)% | (1,711,143) |
| NET ASSETS - 100.0% | 885,159,743 |
| (a) | Non-income producing |
| (b) | Restricted securities (including private placements) - Investment in securities not registered under the Securities Act of 1933 (excluding 144A issues). At the end of the period, the value of restricted securities (excluding 144A issues) amounted to $20,458,915 or 2.3% of net assets. |
| (c) | Level 3 security |
| (d) | Security or a portion of the security is on loan at period end. |
| (e) | Amount is stated in United States dollars unless otherwise noted. |
| (f) | Security initially issued at one coupon which converts to a higher coupon at a specified date. The rate shown is the rate at period end. |
| (g) | Security is perpetual in nature with no stated maturity date. |
| (h) | Affiliated fund that is generally available only to investment companies and other accounts managed by Fidelity Investments. The rate quoted is the annualized seven-day yield of the fund at period end. A complete unaudited listing of the fund's holdings as of its most recent quarter end is available upon request. In addition, each Fidelity Central Fund's financial statements are available on the SEC's website or upon request. |
| (i) | Investment made with cash collateral received from securities on loan. |
| Additional information on each restricted holding is as follows: | ||
| Security | Acquisition Date | Acquisition Cost ($) |
| Aledade, Inc. Series E1 | 5/20/22 | 290,767 |
| Anthropic PBC Series D | 5/31/24 | 86,713 |
| Beta Technologies, Inc. Series A | 4/09/21 | 1,112,825 |
| Blink Health LLC Series A1 | 12/30/20 | 43,263 |
| Blink Health LLC Series C | 11/07/19 - 7/14/21 | 596,729 |
| Bombas LLC | 2/16/21 - 11/12/21 | 830,401 |
| Bowery Farming, Inc. warrants | 10/25/23 | 0 |
| ByteDance Ltd. Series E1 | 11/18/20 | 508,862 |
| CelLink Corp. Series D | 1/20/22 | 251,969 |
| Circle Internet Financial Ltd. Series E | 5/11/21 | 864,100 |
| Circle Internet Financial Ltd. Series F | 5/09/22 | 227,598 |
| Convoy, Inc. Series D | 10/30/19 | 1,271,244 |
| Convoy, Inc. warrants | 3/24/23 | 0 |
| Convoy, Inc. 15% 9/30/26 | 3/24/23 | 40,971 |
| CoreWeave, Inc. Series C | 5/17/24 | 21,813 |
| Databricks, Inc. Series G | 2/01/21 | 390,209 |
| Databricks, Inc. Series I | 9/14/23 | 7,644 |
| Diamond Foundry, Inc. Series C | 3/15/21 | 556,656 |
| Enevate Corp. Series E | 1/29/21 | 316,911 |
| Enevate Corp. 6% | 11/02/23 | 14,864 |
| Epic Games, Inc. | 7/13/20 - 3/29/21 | 1,730,000 |
| GoBrands, Inc. Series G | 3/02/21 | 599,322 |
| Gupshup, Inc. | 6/08/21 | 409,287 |
| JUUL Labs, Inc. Class B | 11/21/17 | 0 |
| JUUL Labs, Inc. Series C | 5/22/15 | 0 |
| JUUL Labs, Inc. Series D | 6/25/18 | 0 |
| Lenskart Solutions Pvt Ltd. | 4/30/24 | 356,216 |
| Moloco, Inc. Series A | 6/26/23 | 700,560 |
| Mountain Digital, Inc. Series D | 11/05/21 | 645,463 |
| Neutron Holdings, Inc. | 2/04/21 | 772 |
| Neutron Holdings, Inc. Series 1C | 7/03/18 | 253,709 |
| Neutron Holdings, Inc. 4% 5/22/27 | 6/04/20 | 47,700 |
| Neutron Holdings, Inc. 4% 6/12/27 | 6/12/20 | 13,100 |
| Neutron Holdings, Inc. 6.5% 10/29/26 | 10/29/21 - 4/29/24 | 424,512 |
| Rad Power Bikes, Inc. | 1/21/21 | 66,926 |
| Rad Power Bikes, Inc. warrants 10/6/33 | 10/06/23 | 0 |
| Rad Power Bikes, Inc. Series A | 1/21/21 | 8,726 |
| Rad Power Bikes, Inc. Series C | 1/21/21 | 34,331 |
| Rad Power Bikes, Inc. Series D | 9/17/21 | 121,686 |
| Rad Power Bikes, Inc. 8% 12/31/25 | 10/06/23 | 18,888 |
| Relativity Space, Inc. Series E | 5/27/21 | 828,069 |
| Sima Technologies, Inc. Series B | 5/10/21 | 208,685 |
| Sima Technologies, Inc. Series B1 | 4/25/22 - 10/17/22 | 41,198 |
| Sima Technologies, Inc. 10% 12/31/27 | 4/08/24 | 42,288 |
| Space Exploration Technologies Corp. Class A | 2/16/21 | 125,997 |
| Space Exploration Technologies Corp. Series I | 4/05/18 | 556,010 |
| Space Exploration Technologies Corp. Series N | 8/04/20 | 690,930 |
| Starling Bank Ltd. Series D | 6/18/21 - 4/05/22 | 468,193 |
| Stripe, Inc. Class B | 5/18/21 | 100,321 |
| Stripe, Inc. Series H | 3/15/21 - 5/25/23 | 229,877 |
| Tenstorrent Holdings, Inc. Series C1 | 4/23/21 | 134,645 |
| VAST Data Ltd. Series A | 11/28/23 | 27,632 |
| VAST Data Ltd. Series A1 | 11/28/23 | 68,013 |
| VAST Data Ltd. Series A2 | 11/28/23 | 78,232 |
| VAST Data Ltd. Series B | 11/28/23 | 62,249 |
| VAST Data Ltd. Series C | 11/28/23 | 1,815 |
| VAST Data Ltd. Series E | 11/28/23 | 118,976 |
| Waymo LLC Series A2 | 5/08/20 | 248,671 |
| Xsight Labs Ltd. warrants 1/11/34 | 1/11/24 | 0 |
| Xsight Labs Ltd. Series D | 2/16/21 | 139,130 |
| Xsight Labs Ltd. Series D1 | 1/11/24 | 50,903 |
| Yanka Industries, Inc. Series E | 5/15/20 | 238,154 |
| Yanka Industries, Inc. Series F | 4/08/21 | 419,499 |
| Affiliate | Value, beginning of period ($) | Purchases ($) | Sales Proceeds ($) | Dividend Income ($) | Realized Gain (loss) ($) | Change in Unrealized appreciation (depreciation) ($) | Value, end of period ($) | % ownership, end of period |
| Fidelity Cash Central Fund 5.39% | 1,286,935 | 72,041,533 | 70,468,824 | 51,115 | (6) | - | 2,859,638 | 0.0% |
| Fidelity Securities Lending Cash Central Fund 5.39% | 12,523,731 | 87,120,668 | 94,137,876 | 10,658 | - | - | 5,506,523 | 0.0% |
| Total | 13,810,666 | 159,162,201 | 164,606,700 | 61,773 | (6) | - | 8,366,161 | |
| Valuation Inputs at Reporting Date: | ||||
| Description | Total ($) | Level 1 ($) | Level 2 ($) | Level 3 ($) |
Investments in Securities: | ||||
| Equities: | ||||
Communication Services | 195,595,776 | 193,173,105 | - | 2,422,671 |
Consumer Discretionary | 87,830,398 | 80,871,696 | 5,915,545 | 1,043,157 |
Consumer Staples | 3,426,396 | 3,267,397 | - | 158,999 |
Energy | 954,772 | 954,772 | - | - |
Financials | 34,534,900 | 31,651,140 | - | 2,883,760 |
Health Care | 77,515,338 | 75,747,538 | 826,478 | 941,322 |
Industrials | 57,749,061 | 49,303,943 | - | 8,445,118 |
Information Technology | 419,755,662 | 415,805,078 | 191,354 | 3,759,230 |
Materials | 517,690 | - | - | 517,690 |
| Corporate Bonds | 530,653 | - | - | 530,653 |
| Preferred Securities | 94,079 | - | - | 94,079 |
| Money Market Funds | 8,366,161 | 8,366,161 | - | - |
| Total Investments in Securities: | 886,870,886 | 859,140,830 | 6,933,377 | 20,796,679 |
| Net Unrealized Appreciation on Unfunded Commitments | 2,075 | - | - | 2,075 |
| Total | 2,075 | - | - | 2,075 |
| Investments in Securities: | |||
| Beginning Balance | $ | 18,811,659 | |
| Net Realized Gain (Loss) on Investment Securities | (20,740) | ||
| Net Unrealized Gain (Loss) on Investment Securities | 1,420,740 | ||
| Cost of Purchases | 590,323 | ||
| Proceeds of Sales | (5,303) | ||
| Amortization/Accretion | - | ||
| Transfers into Level 3 | - | ||
| Transfers out of Level 3 | - | ||
| Ending Balance | $ | 20,796,679 | |
| The change in unrealized gain (loss) for the period attributable to Level 3 securities held at May 31, 2024 | $ | 1,420,314 | |
| The information used in the above reconciliation represents fiscal year to date activity for any Investments in Securities identified as using Level 3 inputs at either the beginning or the end of the current fiscal period. Cost of purchases and proceeds of sales may include securities received and/or delivered through in-kind transactions, corporate actions or exchanges. Transfers into Level 3 were attributable to a lack of observable market data resulting from decreases in market activity, decreases in liquidity, security restructurings or corporate actions. Transfers out of Level 3 were attributable to observable market data becoming available for those securities. Transfers in or out of Level 3 represent the beginning value of any Security or Instrument where a change in the pricing level occurred from the beginning to the end of the period. Realized and unrealized gains (losses) disclosed in the reconciliation are included in Net Gain (Loss) on the Fund's Statement of Operations. | |||
| Statement of Assets and Liabilities | ||||
May 31, 2024 (Unaudited) | ||||
| Assets | ||||
| Investment in securities, at value (including securities loaned of $5,502,369) - See accompanying schedule: | ||||
Unaffiliated issuers (cost $425,311,767) | $ | 878,504,725 | ||
Fidelity Central Funds (cost $8,366,161) | 8,366,161 | |||
| Total Investment in Securities (cost $433,677,928) | $ | 886,870,886 | ||
| Cash | 6,504 | |||
| Foreign currency held at value (cost $139) | 139 | |||
| Receivable for investments sold | 34,227,107 | |||
| Unrealized appreciation on unfunded commitments | 2,075 | |||
| Receivable for fund shares sold | 543 | |||
| Dividends receivable | 332,531 | |||
| Interest receivable | 19,519 | |||
| Distributions receivable from Fidelity Central Funds | 8,244 | |||
| Receivable from investment adviser for expense reductions | 2,422 | |||
| Other receivables | 21,027 | |||
Total assets | 921,490,997 | |||
| Liabilities | ||||
| Payable for investments purchased | $ | 2,662,436 | ||
| Payable for fund shares redeemed | 28,124,559 | |||
| Other payables and accrued expenses | 36,684 | |||
| Collateral on securities loaned | 5,507,575 | |||
| Total liabilities | 36,331,254 | |||
| Commitments and contingent liabilities (see Commitments note) | ||||
| Net Assets | $ | 885,159,743 | ||
| Net Assets consist of: | ||||
| Paid in capital | $ | 416,552,682 | ||
| Total accumulated earnings (loss) | 468,607,061 | |||
| Net Assets | $ | 885,159,743 | ||
Net Asset Value, offering price and redemption price per share ($885,159,743 ÷ 58,556,718 shares) | $ | 15.12 | ||
| Statement of Operations | ||||
Six months ended May 31, 2024 (Unaudited) | ||||
| Investment Income | ||||
| Dividends | $ | 1,494,760 | ||
| Interest | 15,983 | |||
| Income from Fidelity Central Funds (including $10,658 from security lending) | 61,773 | |||
| Total income | 1,572,516 | |||
| Expenses | ||||
| Custodian fees and expenses | $ | 21,446 | ||
| Independent trustees' fees and expenses | 1,869 | |||
| Legal | 102 | |||
| Interest | 22,908 | |||
| Miscellaneous | 25 | |||
| Total expenses before reductions | 46,350 | |||
| Expense reductions | (8,679) | |||
| Total expenses after reductions | 37,671 | |||
| Net Investment income (loss) | 1,534,845 | |||
| Realized and Unrealized Gain (Loss) | ||||
| Net realized gain (loss) on: | ||||
| Investment Securities: | ||||
| Unaffiliated issuers | 61,280,931 | |||
| Fidelity Central Funds | (6) | |||
| Foreign currency transactions | 22,930 | |||
| Total net realized gain (loss) | 61,303,855 | |||
| Change in net unrealized appreciation (depreciation) on: | ||||
| Investment Securities: | ||||
| Unaffiliated issuers | 126,575,876 | |||
| Unfunded commitments | 2,075 | |||
| Assets and liabilities in foreign currencies | (60) | |||
| Total change in net unrealized appreciation (depreciation) | 126,577,891 | |||
| Net gain (loss) | 187,881,746 | |||
| Net increase (decrease) in net assets resulting from operations | $ | 189,416,591 | ||
| Statement of Changes in Net Assets | ||||
Six months ended May 31, 2024 (Unaudited) | Year ended November 30, 2023 | |||
| Increase (Decrease) in Net Assets | ||||
| Operations | ||||
| Net investment income (loss) | $ | 1,534,845 | $ | 3,354,851 |
| Net realized gain (loss) | 61,303,855 | 3,148,109 | ||
| Change in net unrealized appreciation (depreciation) | 126,577,891 | 173,578,002 | ||
| Net increase (decrease) in net assets resulting from operations | 189,416,591 | 180,080,962 | ||
| Distributions to shareholders | (2,668,623) | (3,392,612) | ||
| Share transactions | ||||
| Proceeds from sales of shares | 49,612,355 | 164,000,171 | ||
| Reinvestment of distributions | 2,668,345 | 3,392,612 | ||
| Cost of shares redeemed | (126,583,694) | (275,043,180) | ||
Net increase (decrease) in net assets resulting from share transactions | (74,302,994) | (107,650,397) | ||
| Total increase (decrease) in net assets | 112,444,974 | 69,037,953 | ||
| Net Assets | ||||
| Beginning of period | 772,714,769 | 703,676,816 | ||
| End of period | $ | 885,159,743 | $ | 772,714,769 |
| Other Information | ||||
| Shares | ||||
| Sold | 3,574,243 | 15,984,865 | ||
| Issued in reinvestment of distributions | 213,810 | 364,014 | ||
| Redeemed | (9,080,030) | (25,592,405) | ||
| Net increase (decrease) | (5,291,977) | (9,243,526) | ||
Fidelity Advisor® Series Growth Opportunities Fund |
Six months ended (Unaudited) May 31, 2024 | Years ended November 30, 2023 | 2022 | 2021 | 2020 | 2019 | |||||||
Selected Per-Share Data | ||||||||||||
| Net asset value, beginning of period | $ | 12.10 | $ | 9.63 | $ | 18.67 | $ | 20.55 | $ | 16.27 | $ | 15.46 |
| Income from Investment Operations | ||||||||||||
Net investment income (loss) A,B | .02 | .05 | .06 | .06 | .08 | .11 C | ||||||
| Net realized and unrealized gain (loss) | 3.04 | 2.47 | (4.79) | 3.39 | 7.91 | 3.56 | ||||||
| Total from investment operations | 3.06 | 2.52 | (4.73) | 3.45 | 7.99 | 3.67 | ||||||
| Distributions from net investment income | (.04) | (.05) | (.06) | (.11) | (.13) | (.11) | ||||||
| Distributions from net realized gain | - | - | (4.25) | (5.22) | (3.59) | (2.75) | ||||||
| Total distributions | (.04) | (.05) | (4.31) | (5.33) | (3.71) D | (2.86) | ||||||
| Net asset value, end of period | $ | 15.12 | $ | 12.10 | $ | 9.63 | $ | 18.67 | $ | 20.55 | $ | 16.27 |
Total Return E,F | 25.38 % | 26.28% | (32.42)% | 21.11% | 63.04% | 32.07% | ||||||
Ratios to Average Net Assets B,G,H | ||||||||||||
| Expenses before reductions | .01% I,J | .01% | .01% | .01% | .01% | .01% | ||||||
| Expenses net of fee waivers, if any | .01 % I,J | .01% | -% K | -% K | .01% | .01% | ||||||
| Expenses net of all reductions | .01% I,J | .01% | -% K | -% K | .01% | .01% | ||||||
| Net investment income (loss) | .36% I,J | .47% | .57% | .35% | .54% | .77% C | ||||||
| Supplemental Data | ||||||||||||
| Net assets, end of period (000 omitted) | $ | 885,160 | $ | 772,715 | $ | 703,677 | $ | 776,073 | $ | 713,285 | $ | 647,544 |
Portfolio turnover rate L | 60 % I | 69% | 97% | 84% | 78% | 78% M |
| Fidelity Central Fund | Investment Manager | Investment Objective | Investment Practices | Expense RatioA |
| Fidelity Money Market Central Funds | Fidelity Management & Research Company LLC (FMR) | Each fund seeks to obtain a high level of current income consistent with the preservation of capital and liquidity. | Short-term Investments | Less than .005% |
| Asset Type | Fair Value | Valuation Technique(s) | Unobservable Input | Amount or Range/Weighted Average | Impact to Valuation from an Increase in InputA |
| Equities | $20,171,947 | Recovery value | Recovery value | $0.00 | Increase |
| Market approach | Transaction price | $1.10 - $78.20 / $26.37 | Increase | ||
| Discount rate | 40.0% | Decrease | |||
| Premium rate | 35.0% - 65.0% / 44.3% | Increase | |||
| Market comparable | Enterprise value/Revenue multiple (EV/R) | 0.9 - 23.0 / 6.8 | Increase | ||
| Enterprise value/EBITDA multiple (EV/EBITDA) | 18.6 - 21.3 / 19.2 | Increase | |||
| Enterprise value/Net income multiple (EV/NI) | 16.0 | Increase | |||
| Discounted cash flow | Weighted average cost of capital (WACC) | 28.9% | Decrease | ||
| Exit multiple | 1.5 | Increase | |||
| Black scholes | Discount rate | 4.1% - 5.2% / 4.6% | Increase | ||
| Volatility | 50.0% - 100.0% / 74.9% | Increase | |||
| Term | 1.0 - 5.0 / 3.7 | Increase | |||
| Corporate Bonds | $530,653 | Recovery value | Recovery value | $0.00 | Increase |
| Market comparable | Enterprise value/Revenue multiple (EV/R) | 1.9 | Increase | ||
| Discount rate | 29.2% | Decrease | |||
| Probability rate | 10.0% - 75.0% / 33.3% | Increase | |||
| Black scholes | Discount rate | 5.3% | Increase | ||
| Volatility | 75.0% | Decrease | |||
| Term | 0.8 | Increase | |||
| Preferred Securities | $94,079 | Recovery value | Recovery value | $0.00 | Increase |
| Market approach | Transaction price | $100.00 | Increase | ||
| Discount rate | 35.4% - 37.9% / 37.2% | Decrease | |||
| Probability rate | 0.0% - 60.0% / 36.0% | Increase | |||
| Market comparable | Enterprise value/Revenue multiple (EV/R) | 1.7 | Increase | ||
| Black scholes | Discount rate | 4.8% - 5.5% / 5.1% | Increase | ||
| Volatility | 50.0% - 100.0% / 62.4% | Increase | |||
| Term | 0.4 - 2.1 / 1.4 | Increase |
| Gross unrealized appreciation | $475,821,567 |
| Gross unrealized depreciation | (25,795,227) |
| Net unrealized appreciation (depreciation) | $450,026,340 |
| Tax cost | $436,844,546 |
Short-term | $(40,877,779) |
Long-term | - |
| Total capital loss carryforward | $(40,877,779) |
| Investment to be Acquired | Commitment Amount ($) | Unrealized Appreciation (Depreciation)($) | |
| Fidelity Advisor Series Growth Opportunities Fund | JUUL Labs, Inc. Class A | 848,583 | 2,075 |
| Purchases ($) | Sales ($) | |
| Fidelity Advisor Series Growth Opportunities Fund | 253,082,301 | 334,336,236 |
| Amount ($) | |
| Fidelity Advisor Series Growth Opportunities Fund | 3,798 |
| Borrower or Lender | Average Loan Balance ($) | Weighted Average Interest Rate | Interest Expense ($) | |
Fidelity Advisor Series Growth Opportunities Fund | Borrower | 16,438,222 | 5.57% | 22,908 |
| Purchases ($) | Sales ($) | Realized Gain (Loss)($) | |
| Fidelity Advisor Series Growth Opportunities Fund | 11,147,794 | 17,134,118 | 1,058,236 |
| Total Security Lending Fees Paid to NFS ($) | Security Lending Income From Securities Loaned to NFS ($) | Value of Securities Loaned to NFS at Period End ($) | |
| Fidelity Advisor Series Growth Opportunities Fund | 1,128 | 233 | - |
 |


Contents
| Common Stocks - 98.6% | |||
| Shares | Value ($) (000s) | ||
| COMMUNICATION SERVICES - 4.0% | |||
| Diversified Telecommunication Services - 0.5% | |||
| Cellnex Telecom SA (a) | 100,200 | 3,660 | |
| Verizon Communications, Inc. | 54,309 | 2,235 | |
| 5,895 | |||
| Entertainment - 1.2% | |||
| The Walt Disney Co. | 49,700 | 5,164 | |
| Universal Music Group NV | 208,700 | 6,504 | |
| Universal Music Group NV rights (b)(c) | 208,700 | 61 | |
| Warner Music Group Corp. Class A | 54,300 | 1,617 | |
| 13,346 | |||
| Interactive Media & Services - 0.4% | |||
| Meta Platforms, Inc. Class A | 9,400 | 4,388 | |
| Media - 1.9% | |||
| Comcast Corp. Class A | 443,658 | 17,760 | |
| Interpublic Group of Companies, Inc. | 149,300 | 4,684 | |
| 22,444 | |||
TOTAL COMMUNICATION SERVICES | 46,073 | ||
| CONSUMER DISCRETIONARY - 2.2% | |||
| Hotels, Restaurants & Leisure - 0.9% | |||
| Booking Holdings, Inc. | 450 | 1,699 | |
| Churchill Downs, Inc. | 9,200 | 1,191 | |
| Domino's Pizza, Inc. | 4,600 | 2,339 | |
| Marriott International, Inc. Class A | 12,600 | 2,913 | |
| Starbucks Corp. | 34,000 | 2,727 | |
| 10,869 | |||
| Household Durables - 0.2% | |||
| Sony Group Corp. sponsored ADR | 11,400 | 939 | |
| Whirlpool Corp. (d) | 9,400 | 874 | |
| 1,813 | |||
| Specialty Retail - 0.7% | |||
| Lowe's Companies, Inc. | 38,957 | 8,621 | |
| Textiles, Apparel & Luxury Goods - 0.4% | |||
| Compagnie Financiere Richemont SA Series A | 5,799 | 933 | |
| NIKE, Inc. Class B | 18,900 | 1,796 | |
| Puma AG | 32,044 | 1,664 | |
| 4,393 | |||
TOTAL CONSUMER DISCRETIONARY | 25,696 | ||
| CONSUMER STAPLES - 6.0% | |||
| Beverages - 2.4% | |||
| Davide Campari Milano NV | 33,700 | 338 | |
| Diageo PLC sponsored ADR | 31,300 | 4,228 | |
| Keurig Dr. Pepper, Inc. | 277,400 | 9,501 | |
| Pernod Ricard SA | 14,600 | 2,186 | |
| Remy Cointreau SA | 4,544 | 425 | |
| The Coca-Cola Co. | 175,184 | 11,024 | |
| 27,702 | |||
| Consumer Staples Distribution & Retail - 1.3% | |||
| Sysco Corp. | 72,200 | 5,258 | |
| Target Corp. | 26,500 | 4,138 | |
| Walmart, Inc. | 87,700 | 5,767 | |
| 15,163 | |||
| Household Products - 0.1% | |||
| Colgate-Palmolive Co. | 6,800 | 632 | |
| Procter & Gamble Co. | 7,900 | 1,300 | |
| 1,932 | |||
| Personal Care Products - 1.7% | |||
| Estee Lauder Companies, Inc. Class A | 25,100 | 3,096 | |
| Haleon PLC ADR | 897,409 | 7,574 | |
| Kenvue, Inc. | 446,407 | 8,616 | |
| 19,286 | |||
| Tobacco - 0.5% | |||
| Altria Group, Inc. | 59,420 | 2,748 | |
| British American Tobacco PLC sponsored ADR | 34,500 | 1,071 | |
| Philip Morris International, Inc. | 17,600 | 1,784 | |
| 5,603 | |||
TOTAL CONSUMER STAPLES | 69,686 | ||
| ENERGY - 10.0% | |||
| Oil, Gas & Consumable Fuels - 10.0% | |||
| Enterprise Products Partners LP | 23,300 | 664 | |
| Exxon Mobil Corp. (e) | 716,486 | 84,015 | |
| Galp Energia SGPS SA Class B | 80,800 | 1,699 | |
| Imperial Oil Ltd. (d) | 222,400 | 15,714 | |
| Shell PLC ADR | 184,600 | 13,435 | |
| 115,527 | |||
| FINANCIALS - 18.9% | |||
| Banks - 12.6% | |||
| Bank of America Corp. (e) | 829,042 | 33,153 | |
| HDFC Bank Ltd. sponsored ADR | 21,700 | 1,256 | |
| JPMorgan Chase & Co. | 62,943 | 12,754 | |
| M&T Bank Corp. | 41,100 | 6,231 | |
| PNC Financial Services Group, Inc. | 88,316 | 13,900 | |
| U.S. Bancorp | 276,230 | 11,201 | |
| Wells Fargo & Co. (e) | 1,120,950 | 67,167 | |
| 145,662 | |||
| Capital Markets - 2.4% | |||
| 3i Group PLC | 57,700 | 2,126 | |
| Brookfield Corp. Class A | 72,301 | 3,144 | |
| Charles Schwab Corp. | 6,600 | 484 | |
| Intercontinental Exchange, Inc. | 1,100 | 147 | |
| KKR & Co. LP | 60,713 | 6,244 | |
| Moody's Corp. | 2,700 | 1,072 | |
| Morgan Stanley | 24,330 | 2,380 | |
| MSCI, Inc. | 700 | 347 | |
| Northern Trust Corp. | 107,637 | 9,067 | |
| Raymond James Financial, Inc. | 23,250 | 2,854 | |
| 27,865 | |||
| Financial Services - 2.7% | |||
| Edenred SA | 37,609 | 1,755 | |
| Fidelity National Information Services, Inc. | 20,700 | 1,571 | |
| Global Payments, Inc. | 22,900 | 2,332 | |
| MasterCard, Inc. Class A | 7,500 | 3,353 | |
| Visa, Inc. Class A | 80,840 | 22,026 | |
| 31,037 | |||
| Insurance - 1.2% | |||
| American Financial Group, Inc. | 4,500 | 585 | |
| Arthur J. Gallagher & Co. | 14,400 | 3,648 | |
| Brookfield Reinsurance Ltd. (d) | 172 | 7 | |
| Chubb Ltd. | 12,100 | 3,277 | |
| Marsh & McLennan Companies, Inc. | 17,766 | 3,688 | |
| Prudential PLC | 76,322 | 731 | |
| The Travelers Companies, Inc. | 8,000 | 1,726 | |
| 13,662 | |||
TOTAL FINANCIALS | 218,226 | ||
| HEALTH CARE - 11.9% | |||
| Health Care Equipment & Supplies - 1.9% | |||
| Abbott Laboratories | 19,700 | 2,013 | |
| Becton, Dickinson & Co. | 14,593 | 3,385 | |
| Boston Scientific Corp. (b) | 171,720 | 12,977 | |
| Koninklijke Philips Electronics NV (depository receipt) (NY Reg.) (d) | 108,617 | 2,948 | |
| Sonova Holding AG | 2,523 | 802 | |
| 22,125 | |||
| Health Care Providers & Services - 5.2% | |||
| Cardinal Health, Inc. | 47,100 | 4,676 | |
| Cigna Group | 47,400 | 16,335 | |
| CVS Health Corp. | 29,551 | 1,761 | |
| Humana, Inc. | 12,400 | 4,441 | |
| McKesson Corp. | 18,033 | 10,271 | |
| UnitedHealth Group, Inc. | 44,100 | 21,846 | |
| 59,330 | |||
| Life Sciences Tools & Services - 0.7% | |||
| Danaher Corp. | 30,000 | 7,704 | |
| Thermo Fisher Scientific, Inc. | 1,100 | 625 | |
| 8,329 | |||
| Pharmaceuticals - 4.1% | |||
| Bristol-Myers Squibb Co. | 189,100 | 7,770 | |
| Eli Lilly & Co. (e) | 14,900 | 12,223 | |
| Galderma Group AG | 17,800 | 1,453 | |
| GSK PLC sponsored ADR | 205,347 | 9,193 | |
| Johnson & Johnson | 50,175 | 7,359 | |
| Royalty Pharma PLC | 32,200 | 883 | |
| UCB SA | 59,000 | 8,276 | |
| Zoetis, Inc. Class A | 1,500 | 254 | |
| 47,411 | |||
TOTAL HEALTH CARE | 137,195 | ||
| INDUSTRIALS - 16.7% | |||
| Aerospace & Defense - 8.6% | |||
| Airbus Group NV | 28,900 | 4,916 | |
| General Dynamics Corp. | 16,200 | 4,856 | |
| General Electric Co. (e) | 363,636 | 60,051 | |
| Howmet Aerospace, Inc. | 11,050 | 935 | |
| Huntington Ingalls Industries, Inc. | 14,300 | 3,619 | |
| Loar Holdings, Inc. (d) | 1,100 | 63 | |
| Safran SA | 9,300 | 2,178 | |
| Textron, Inc. | 19,800 | 1,735 | |
| The Boeing Co. (b) | 119,610 | 21,244 | |
| 99,597 | |||
| Air Freight & Logistics - 1.4% | |||
| Expeditors International of Washington, Inc. | 700 | 85 | |
| FedEx Corp. | 11,100 | 2,819 | |
| United Parcel Service, Inc. Class B | 93,779 | 13,029 | |
| 15,933 | |||
| Building Products - 0.0% | |||
| A.O. Smith Corp. | 1,400 | 117 | |
| Commercial Services & Supplies - 0.6% | |||
| GFL Environmental, Inc. | 174,300 | 5,488 | |
| Veralto Corp. | 9,733 | 959 | |
| 6,447 | |||
| Electrical Equipment - 2.3% | |||
| Acuity Brands, Inc. | 9,900 | 2,570 | |
| AMETEK, Inc. | 3,400 | 577 | |
| GE Vernova LLC | 86,584 | 15,230 | |
| Hubbell, Inc. Class B (e) | 12,912 | 5,021 | |
| Regal Rexnord Corp. | 17,500 | 2,617 | |
| Rockwell Automation, Inc. | 2,100 | 541 | |
| 26,556 | |||
| Ground Transportation - 0.3% | |||
| Knight-Swift Transportation Holdings, Inc. Class A | 75,300 | 3,633 | |
| Machinery - 1.8% | |||
| Allison Transmission Holdings, Inc. | 45,600 | 3,457 | |
| Caterpillar, Inc. | 1,600 | 542 | |
| Cummins, Inc. | 6,700 | 1,888 | |
| Deere & Co. | 1,800 | 675 | |
| Donaldson Co., Inc. | 74,500 | 5,489 | |
| Fortive Corp. | 30,600 | 2,278 | |
| Nordson Corp. | 17,500 | 4,108 | |
| Otis Worldwide Corp. | 9,565 | 949 | |
| Stanley Black & Decker, Inc. | 9,910 | 864 | |
| 20,250 | |||
| Professional Services - 0.5% | |||
| Equifax, Inc. | 9,500 | 2,198 | |
| RELX PLC (London Stock Exchange) | 94,538 | 4,147 | |
| 6,345 | |||
| Trading Companies & Distributors - 1.1% | |||
| Brenntag SE | 8,300 | 598 | |
| Watsco, Inc. | 21,964 | 10,431 | |
| WESCO International, Inc. | 10,400 | 1,867 | |
| 12,896 | |||
| Transportation Infrastructure - 0.1% | |||
| Aena SME SA (a) | 3,300 | 645 | |
TOTAL INDUSTRIALS | 192,419 | ||
| INFORMATION TECHNOLOGY - 23.7% | |||
| Electronic Equipment, Instruments & Components - 0.2% | |||
| CDW Corp. | 10,400 | 2,326 | |
| IT Services - 0.5% | |||
| Amdocs Ltd. | 33,800 | 2,670 | |
| IBM Corp. | 20,000 | 3,337 | |
| 6,007 | |||
| Semiconductors & Semiconductor Equipment - 8.5% | |||
| Analog Devices, Inc. | 20,300 | 4,760 | |
| Applied Materials, Inc. | 21,695 | 4,666 | |
| BE Semiconductor Industries NV | 17,900 | 2,663 | |
| Broadcom, Inc. | 5,700 | 7,573 | |
| Lam Research Corp. | 4,400 | 4,103 | |
| Marvell Technology, Inc. | 157,003 | 10,803 | |
| Microchip Technology, Inc. | 6,200 | 603 | |
| NVIDIA Corp. | 43,705 | 47,915 | |
| NXP Semiconductors NV | 24,000 | 6,530 | |
| Qualcomm, Inc. | 3,200 | 653 | |
| Taiwan Semiconductor Manufacturing Co. Ltd. sponsored ADR | 35,500 | 5,362 | |
| Teradyne, Inc. | 21,100 | 2,974 | |
| 98,605 | |||
| Software - 11.6% | |||
| Dassault Systemes SA | 11,100 | 451 | |
| Intuit, Inc. | 15,200 | 8,762 | |
| Microsoft Corp. | 242,583 | 100,706 | |
| Oracle Corp. | 86,000 | 10,078 | |
| Sage Group PLC | 168,500 | 2,213 | |
| SAP SE sponsored ADR (d) | 63,300 | 11,548 | |
| 133,758 | |||
| Technology Hardware, Storage & Peripherals - 2.9% | |||
| Apple, Inc. | 168,792 | 32,450 | |
| Samsung Electronics Co. Ltd. | 17,790 | 944 | |
| 33,394 | |||
TOTAL INFORMATION TECHNOLOGY | 274,090 | ||
| MATERIALS - 1.5% | |||
| Chemicals - 0.4% | |||
| Air Products & Chemicals, Inc. | 10,400 | 2,774 | |
| International Flavors & Fragrances, Inc. | 4,800 | 462 | |
| PPG Industries, Inc. | 6,000 | 788 | |
| Sherwin-Williams Co. | 1,600 | 486 | |
| 4,510 | |||
| Metals & Mining - 1.1% | |||
| First Quantum Minerals Ltd. | 525,000 | 6,745 | |
| Freeport-McMoRan, Inc. | 103,400 | 5,452 | |
| 12,197 | |||
TOTAL MATERIALS | 16,707 | ||
| REAL ESTATE - 1.3% | |||
| Equity Real Estate Investment Trusts (REITs) - 1.3% | |||
| American Tower Corp. | 34,500 | 6,753 | |
| Crown Castle, Inc. | 64,200 | 6,581 | |
| Public Storage | 200 | 55 | |
| Simon Property Group, Inc. | 12,600 | 1,907 | |
| Terreno Realty Corp. | 4,100 | 232 | |
| 15,528 | |||
| UTILITIES - 2.4% | |||
| Electric Utilities - 2.3% | |||
| Constellation Energy Corp. | 5,000 | 1,086 | |
| Duke Energy Corp. | 22,800 | 2,361 | |
| Edison International | 24,800 | 1,906 | |
| Entergy Corp. | 15,800 | 1,777 | |
| Eversource Energy | 37,900 | 2,245 | |
| Exelon Corp. | 18,400 | 691 | |
| FirstEnergy Corp. | 14,700 | 592 | |
| NextEra Energy, Inc. | 6,200 | 496 | |
| Southern Co. | 195,900 | 15,699 | |
| 26,853 | |||
| Multi-Utilities - 0.1% | |||
| Sempra | 16,400 | 1,263 | |
TOTAL UTILITIES | 28,116 | ||
| TOTAL COMMON STOCKS (Cost $702,544) | 1,139,263 | ||
| Convertible Bonds - 0.1% | |||
Principal Amount (f) (000s) | Value ($) (000s) | ||
| COMMUNICATION SERVICES - 0.1% | |||
| Interactive Media & Services - 0.1% | |||
Snap, Inc. 0.125% 3/1/28 (Cost $1,117) | 1,477 | 1,156 | |
| U.S. Treasury Obligations - 0.3% | |||
Principal Amount (f) (000s) | Value ($) (000s) | ||
U.S. Treasury Bills, yield at date of purchase 5.32% 8/8/24 (e) (Cost $3,059) | 3,090 | 3,060 | |
| Money Market Funds - 2.7% | |||
| Shares | Value ($) (000s) | ||
| Fidelity Cash Central Fund 5.39% (g) | 10,122,880 | 10,125 | |
| Fidelity Securities Lending Cash Central Fund 5.39% (g)(h) | 21,007,358 | 21,009 | |
| TOTAL MONEY MARKET FUNDS (Cost $31,134) | 31,134 | ||
| Purchased Options - 0.0% | ||||||
| Counterparty | Number of Contracts | Notional Amount ($) (000s) | Exercise Price ($) | Expiration Date | Value ($) (000s) | |
| Put Options | ||||||
| Exxon Mobil Corp. | Chicago Board Options Exchange | 400 | 4,690 | 110 | 06/21/24 | 11 |
| 11 | ||||||
TOTAL PURCHASED OPTIONS (Cost $110) | 11 | |||||
| TOTAL INVESTMENT IN SECURITIES - 101.7% (Cost $737,964) | 1,174,624 |
NET OTHER ASSETS (LIABILITIES) - (1.7)% | (19,944) |
| NET ASSETS - 100.0% | 1,154,680 |
| Written Options | ||||||
| Counterparty | Number of Contracts | Notional Amount ($) (000s) | Exercise Price ($) | Expiration Date | Value ($) (000s) | |
| Call Options | ||||||
| Bank of America Corp. | Chicago Board Options Exchange | 445 | 1,780 | 41.00 | 06/21/24 | (16) |
| Eli Lilly & Co. | Chicago Board Options Exchange | 7 | 574 | 850.00 | 08/16/24 | (26) |
| Exxon Mobil Corp. | Chicago Board Options Exchange | 210 | 2,462 | 130.00 | 07/19/24 | (6) |
| General Electric Co. | Chicago Board Options Exchange | 186 | 3,072 | 165.00 | 06/21/24 | (82) |
| General Electric Co. | Chicago Board Options Exchange | 183 | 3,022 | 170.00 | 06/21/24 | (42) |
| General Electric Co. | Chicago Board Options Exchange | 181 | 2,989 | 185.00 | 08/16/24 | (46) |
| Hubbell, Inc. | Chicago Board Options Exchange | 121 | 4,706 | 340.00 | 06/21/24 | (618) |
| Wells Fargo & Co. | Chicago Board Options Exchange | 638 | 3,823 | 62.50 | 08/16/24 | (100) |
| Wells Fargo & Co. | Chicago Board Options Exchange | 631 | 3,781 | 65.00 | 08/16/24 | (53) |
| Put Options | ||||||
| Air Products & Chemicals, Inc. | Chicago Board Options Exchange | 150 | 4,001 | 200.00 | 06/21/24 | 0 |
| TOTAL WRITTEN OPTIONS | (989) | |||||
| (a) | Security exempt from registration under Rule 144A of the Securities Act of 1933. These securities may be resold in transactions exempt from registration, normally to qualified institutional buyers. At the end of the period, the value of these securities amounted to $4,305,000 or 0.4% of net assets. |
| (b) | Non-income producing |
| (c) | Security or a portion of the security purchased on a delayed delivery or when-issued basis. |
| (d) | Security or a portion of the security is on loan at period end. |
| (e) | Security or a portion of the security is pledged as collateral for options written. At period end, the value of securities pledged amounted to $29,269,000. |
| (f) | Amount is stated in United States dollars unless otherwise noted. |
| (g) | Affiliated fund that is generally available only to investment companies and other accounts managed by Fidelity Investments. The rate quoted is the annualized seven-day yield of the fund at period end. A complete unaudited listing of the fund's holdings as of its most recent quarter end is available upon request. In addition, each Fidelity Central Fund's financial statements are available on the SEC's website or upon request. |
| (h) | Investment made with cash collateral received from securities on loan. |
| Affiliate (Amounts in thousands) | Value, beginning of period ($) | Purchases ($) | Sales Proceeds ($) | Dividend Income ($) | Realized Gain (loss) ($) | Change in Unrealized appreciation (depreciation) ($) | Value, end of period ($) | % ownership, end of period |
| Fidelity Cash Central Fund 5.39% | 53,015 | 70,962 | 113,852 | 963 | - | - | 10,125 | 0.0% |
| Fidelity Securities Lending Cash Central Fund 5.39% | 10,761 | 91,703 | 81,455 | 14 | - | - | 21,009 | 0.1% |
| Total | 63,776 | 162,665 | 195,307 | 977 | - | - | 31,134 | |
| Valuation Inputs at Reporting Date: | ||||
Description (Amounts in thousands) | Total ($) | Level 1 ($) | Level 2 ($) | Level 3 ($) |
Investments in Securities: | ||||
| Equities: | ||||
Communication Services | 46,073 | 35,909 | 10,164 | - |
Consumer Discretionary | 25,696 | 23,099 | 2,597 | - |
Consumer Staples | 69,686 | 66,737 | 2,949 | - |
Energy | 115,527 | 113,828 | 1,699 | - |
Financials | 218,226 | 213,614 | 4,612 | - |
Health Care | 137,195 | 126,664 | 10,531 | - |
Industrials | 192,419 | 179,935 | 12,484 | - |
Information Technology | 274,090 | 267,819 | 6,271 | - |
Materials | 16,707 | 16,707 | - | - |
Real Estate | 15,528 | 15,528 | - | - |
Utilities | 28,116 | 28,116 | - | - |
| Corporate Bonds | 1,156 | - | 1,156 | - |
| U.S. Government and Government Agency Obligations | 3,060 | - | 3,060 | - |
| Money Market Funds | 31,134 | 31,134 | - | - |
| Purchased Options | 11 | 11 | - | - |
| Total Investments in Securities: | 1,174,624 | 1,119,101 | 55,523 | - |
Derivative Instruments: Liabilities | ||||
Written Options | (989) | (989) | - | - |
| Total Liabilities | (989) | (989) | - | - |
| Total Derivative Instruments: | (989) | (989) | - | - |
Primary Risk Exposure / Derivative Type | Value | |
| (Amounts in thousands) | Asset ($) | Liability ($) |
| Equity Risk | ||
Purchased Options (a) | 11 | 0 |
Written Options (b) | 0 | (989) |
| Total Equity Risk | 11 | (989) |
| Total Value of Derivatives | 11 | (989) |
| Statement of Assets and Liabilities | ||||
| Amounts in thousands (except per-share amounts) | May 31, 2024 (Unaudited) | |||
| Assets | ||||
| Investment in securities, at value (including securities loaned of $20,464) - See accompanying schedule: | ||||
Unaffiliated issuers (cost $706,830) | $ | 1,143,490 | ||
Fidelity Central Funds (cost $31,134) | 31,134 | |||
| Total Investment in Securities (cost $737,964) | $ | 1,174,624 | ||
| Foreign currency held at value (cost $18) | 18 | |||
| Receivable for investments sold | 1,592 | |||
| Receivable for fund shares sold | 514 | |||
| Dividends receivable | 2,351 | |||
| Distributions receivable from Fidelity Central Funds | 34 | |||
| Other receivables | 4 | |||
Total assets | 1,179,137 | |||
| Liabilities | ||||
| Payable for investments purchased | ||||
Regular delivery | $ | 660 | ||
Delayed delivery | 61 | |||
| Payable for fund shares redeemed | 836 | |||
| Accrued management fee | 561 | |||
| Distribution and service plan fees payable | 249 | |||
| Written options, at value (premium received $814) | 989 | |||
| Other payables and accrued expenses | 92 | |||
| Collateral on securities loaned | 21,009 | |||
| Total liabilities | 24,457 | |||
| Net Assets | $ | 1,154,680 | ||
| Net Assets consist of: | ||||
| Paid in capital | $ | 686,821 | ||
| Total accumulated earnings (loss) | 467,859 | |||
| Net Assets | $ | 1,154,680 | ||
| Net Asset Value and Maximum Offering Price | ||||
| Class A : | ||||
Net Asset Value and redemption price per share ($557,457 ÷ 13,915 shares)(a) | $ | 40.06 | ||
| Maximum offering price per share (100/94.25 of $40.06) | $ | 42.50 | ||
| Class M : | ||||
Net Asset Value and redemption price per share ($208,994 ÷ 5,205 shares)(a) | $ | 40.16 | ||
| Maximum offering price per share (100/96.50 of $40.16) | $ | 41.62 | ||
| Class C : | ||||
Net Asset Value and offering price per share ($57,192 ÷ 1,559 shares)(a)(b) | $ | 36.67 | ||
| Class I : | ||||
Net Asset Value, offering price and redemption price per share ($220,705 ÷ 5,354 shares) | $ | 41.22 | ||
| Class Z : | ||||
Net Asset Value, offering price and redemption price per share ($110,332 ÷ 2,670 shares) | $ | 41.32 | ||
(a)Redemption price per share is equal to net asset value less any applicable contingent deferred sales charge. | ||||
(b)Corresponding Net Asset Value does not calculate due to rounding of fractional net assets and/or shares. | ||||
| Statement of Operations | ||||
| Amounts in thousands | Six months ended May 31, 2024 (Unaudited) | |||
| Investment Income | ||||
| Dividends | $ | 10,533 | ||
| Interest | 135 | |||
| Income from Fidelity Central Funds (including $14 from security lending) | 977 | |||
| Total income | 11,645 | |||
| Expenses | ||||
| Management fee | $ | 2,900 | ||
| Transfer agent fees | 452 | |||
| Distribution and service plan fees | 1,422 | |||
| Accounting fees | 84 | |||
| Custodian fees and expenses | 81 | |||
| Independent trustees' fees and expenses | 3 | |||
| Registration fees | 66 | |||
| Audit | 30 | |||
| Legal | 2 | |||
| Interest | 21 | |||
| Miscellaneous | 12 | |||
| Total expenses before reductions | 5,073 | |||
| Expense reductions | (51) | |||
| Total expenses after reductions | 5,022 | |||
| Net Investment income (loss) | 6,623 | |||
| Realized and Unrealized Gain (Loss) | ||||
| Net realized gain (loss) on: | ||||
| Investment Securities: | ||||
| Unaffiliated issuers | 32,792 | |||
| Foreign currency transactions | (7) | |||
| Written options | (1,953) | |||
| Total net realized gain (loss) | 30,832 | |||
| Change in net unrealized appreciation (depreciation) on: | ||||
| Investment Securities: | ||||
| Unaffiliated issuers | 143,481 | |||
| Assets and liabilities in foreign currencies | 1 | |||
| Written options | (135) | |||
| Total change in net unrealized appreciation (depreciation) | 143,347 | |||
| Net gain (loss) | 174,179 | |||
| Net increase (decrease) in net assets resulting from operations | $ | 180,802 | ||
| Statement of Changes in Net Assets | ||||
| Amount in thousands | Six months ended May 31, 2024 (Unaudited) | Year ended November 30, 2023 | ||
| Increase (Decrease) in Net Assets | ||||
| Operations | ||||
| Net investment income (loss) | $ | 6,623 | $ | 13,913 |
| Net realized gain (loss) | 30,832 | 15,422 | ||
| Change in net unrealized appreciation (depreciation) | 143,347 | 48,826 | ||
| Net increase (decrease) in net assets resulting from operations | 180,802 | 78,161 | ||
| Distributions to shareholders | (21,664) | (15,697) | ||
| Share transactions - net increase (decrease) | (87,091) | 199,181 | ||
| Total increase (decrease) in net assets | 72,047 | 261,645 | ||
| Net Assets | ||||
| Beginning of period | 1,082,633 | 820,988 | ||
| End of period | $ | 1,154,680 | $ | 1,082,633 |
Fidelity Advisor® Growth & Income Fund Class A |
Six months ended (Unaudited) May 31, 2024 | Years ended November 30, 2023 | 2022 | 2021 | 2020 | 2019 | |||||||
Selected Per-Share Data | ||||||||||||
| Net asset value, beginning of period | $ | 34.95 | $ | 32.90 | $ | 33.01 | $ | 27.71 | $ | 28.32 | $ | 28.69 |
| Income from Investment Operations | ||||||||||||
Net investment income (loss) A,B | .21 | .49 | .42 | .59 C | .44 | .49 | ||||||
| Net realized and unrealized gain (loss) | 5.61 | 2.13 | 1.09 | 6.08 | .90 | 2.48 | ||||||
| Total from investment operations | 5.82 | 2.62 | 1.51 | 6.67 | 1.34 | 2.97 | ||||||
| Distributions from net investment income | (.24) | (.47) | (.83) | (.48) | (.48) | (.47) | ||||||
| Distributions from net realized gain | (.47) | (.10) | (.80) | (.89) | (1.47) | (2.87) | ||||||
| Total distributions | (.71) | (.57) | (1.62) D | (1.37) | (1.95) | (3.34) | ||||||
| Net asset value, end of period | $ | 40.06 | $ | 34.95 | $ | 32.90 | $ | 33.01 | $ | 27.71 | $ | 28.32 |
Total Return E,F,G | 16.85 % | 8.11% | 4.64% | 25.08% | 4.86% | 13.65% | ||||||
Ratios to Average Net Assets B,H,I | ||||||||||||
| Expenses before reductions | .91% J | .91% | .91% | .92% | .95% | .96% | ||||||
| Expenses net of fee waivers, if any | .90 % J | .90% | .91% | .92% | .95% | .96% | ||||||
| Expenses net of all reductions | .90% J | .90% | .91% | .92% | .95% | .95% | ||||||
| Net investment income (loss) | 1.13% J | 1.47% | 1.31% | 1.85% C | 1.78% | 1.93% | ||||||
| Supplemental Data | ||||||||||||
| Net assets, end of period (in millions) | $ | 557 | $ | 477 | $ | 406 | $ | 344 | $ | 277 | $ | 288 |
Portfolio turnover rate K | 19 % J | 12% | 8% | 15% | 28% | 29% |
Fidelity Advisor® Growth & Income Fund Class M |
Six months ended (Unaudited) May 31, 2024 | Years ended November 30, 2023 | 2022 | 2021 | 2020 | 2019 | |||||||
Selected Per-Share Data | ||||||||||||
| Net asset value, beginning of period | $ | 35.03 | $ | 32.97 | $ | 33.01 | $ | 27.71 | $ | 28.31 | $ | 28.67 |
| Income from Investment Operations | ||||||||||||
Net investment income (loss) A,B | .17 | .41 | .34 | .51 C | .38 | .43 | ||||||
| Net realized and unrealized gain (loss) | 5.62 | 2.14 | 1.10 | 6.10 | .89 | 2.47 | ||||||
| Total from investment operations | 5.79 | 2.55 | 1.44 | 6.61 | 1.27 | 2.90 | ||||||
| Distributions from net investment income | (.19) | (.38) | (.68) | (.42) | (.40) | (.39) | ||||||
| Distributions from net realized gain | (.47) | (.10) | (.80) | (.89) | (1.47) | (2.87) | ||||||
| Total distributions | (.66) | (.49) D | (1.48) | (1.31) | (1.87) | (3.26) | ||||||
| Net asset value, end of period | $ | 40.16 | $ | 35.03 | $ | 32.97 | $ | 33.01 | $ | 27.71 | $ | 28.31 |
Total Return E,F,G | 16.73 % | 7.85% | 4.38% | 24.77% | 4.61% | 13.33% | ||||||
Ratios to Average Net Assets B,H,I | ||||||||||||
| Expenses before reductions | 1.14% J | 1.15% | 1.15% | 1.16% | 1.20% | 1.21% | ||||||
| Expenses net of fee waivers, if any | 1.13 % J | 1.14% | 1.15% | 1.16% | 1.20% | 1.21% | ||||||
| Expenses net of all reductions | 1.13% J | 1.14% | 1.15% | 1.16% | 1.20% | 1.20% | ||||||
| Net investment income (loss) | .89% J | 1.23% | 1.07% | 1.61% C | 1.53% | 1.68% | ||||||
| Supplemental Data | ||||||||||||
| Net assets, end of period (in millions) | $ | 209 | $ | 188 | $ | 180 | $ | 173 | $ | 153 | $ | 172 |
Portfolio turnover rate K | 19 % J | 12% | 8% | 15% | 28% | 29% |
Fidelity Advisor® Growth & Income Fund Class C |
Six months ended (Unaudited) May 31, 2024 | Years ended November 30, 2023 | 2022 | 2021 | 2020 | 2019 | |||||||
Selected Per-Share Data | ||||||||||||
| Net asset value, beginning of period | $ | 32.07 | $ | 30.24 | $ | 30.33 | $ | 25.56 | $ | 26.22 | $ | 26.79 |
| Income from Investment Operations | ||||||||||||
Net investment income (loss) A,B | .06 | .22 | .16 | .32 C | .23 | .27 | ||||||
| Net realized and unrealized gain (loss) | 5.13 | 1.96 | 1.00 | 5.62 | .82 | 2.28 | ||||||
| Total from investment operations | 5.19 | 2.18 | 1.16 | 5.94 | 1.05 | 2.55 | ||||||
| Distributions from net investment income | (.12) | (.25) | (.45) | (.28) | (.24) | (.26) | ||||||
| Distributions from net realized gain | (.47) | (.10) | (.80) | (.89) | (1.47) | (2.87) | ||||||
| Total distributions | (.59) | (.35) | (1.25) | (1.17) | (1.71) | (3.12) D | ||||||
| Net asset value, end of period | $ | 36.67 | $ | 32.07 | $ | 30.24 | $ | 30.33 | $ | 25.56 | $ | 26.22 |
Total Return E,F,G | 16.38 % | 7.32% | 3.80% | 24.14% | 4.07% | 12.74% | ||||||
Ratios to Average Net Assets B,H,I | ||||||||||||
| Expenses before reductions | 1.67% J | 1.67% | 1.67% | 1.69% | 1.73% | 1.73% | ||||||
| Expenses net of fee waivers, if any | 1.66 % J | 1.66% | 1.67% | 1.69% | 1.73% | 1.73% | ||||||
| Expenses net of all reductions | 1.66% J | 1.66% | 1.67% | 1.69% | 1.73% | 1.73% | ||||||
| Net investment income (loss) | .37% J | .71% | .55% | 1.09% C | 1.00% | 1.15% | ||||||
| Supplemental Data | ||||||||||||
| Net assets, end of period (in millions) | $ | 57 | $ | 50 | $ | 47 | $ | 41 | $ | 34 | $ | 41 |
Portfolio turnover rate K | 19 % J | 12% | 8% | 15% | 28% | 29% |
Fidelity Advisor® Growth & Income Fund Class I |
Six months ended (Unaudited) May 31, 2024 | Years ended November 30, 2023 | 2022 | 2021 | 2020 | 2019 | |||||||
Selected Per-Share Data | ||||||||||||
| Net asset value, beginning of period | $ | 35.94 | $ | 33.81 | $ | 33.95 | $ | 28.45 | $ | 29.01 | $ | 29.33 |
| Income from Investment Operations | ||||||||||||
Net investment income (loss) A,B | .27 | .59 | .51 | .69 C | .52 | .57 | ||||||
| Net realized and unrealized gain (loss) | 5.75 | 2.19 | 1.12 | 6.24 | .93 | 2.52 | ||||||
| Total from investment operations | 6.02 | 2.78 | 1.63 | 6.93 | 1.45 | 3.09 | ||||||
| Distributions from net investment income | (.28) | (.55) | (.97) | (.55) | (.54) | (.54) | ||||||
| Distributions from net realized gain | (.47) | (.10) | (.80) | (.89) | (1.47) | (2.87) | ||||||
| Total distributions | (.74) D | (.65) | (1.77) | (1.43) D | (2.01) | (3.41) | ||||||
| Net asset value, end of period | $ | 41.22 | $ | 35.94 | $ | 33.81 | $ | 33.95 | $ | 28.45 | $ | 29.01 |
Total Return E,F | 16.97 % | 8.39% | 4.86% | 25.40% | 5.16% | 13.89% | ||||||
Ratios to Average Net Assets B,G,H | ||||||||||||
| Expenses before reductions | .66% I | .66% | .66% | .67% | .70% | .70% | ||||||
| Expenses net of fee waivers, if any | .65 % I | .66% | .66% | .67% | .70% | .69% | ||||||
| Expenses net of all reductions | .65% I | .66% | .66% | .67% | .69% | .69% | ||||||
| Net investment income (loss) | 1.38% I | 1.71% | 1.56% | 2.10% C | 2.03% | 2.19% | ||||||
| Supplemental Data | ||||||||||||
| Net assets, end of period (in millions) | $ | 221 | $ | 223 | $ | 128 | $ | 76 | $ | 45 | $ | 48 |
Portfolio turnover rate J | 19 % I | 12% | 8% | 15% | 28% | 29% |
Fidelity Advisor® Growth & Income Fund Class Z |
Six months ended (Unaudited) May 31, 2024 | Years ended November 30, 2023 | 2022 | 2021 | 2020 | 2019 | |||||||
Selected Per-Share Data | ||||||||||||
| Net asset value, beginning of period | $ | 36.02 | $ | 33.88 | $ | 34.04 | $ | 28.52 | $ | 29.09 | $ | 29.35 |
| Income from Investment Operations | ||||||||||||
Net investment income (loss) A,B | .30 | .64 | .55 | .73 C | .55 | .62 | ||||||
| Net realized and unrealized gain (loss) | 5.76 | 2.19 | 1.13 | 6.26 | .93 | 2.53 | ||||||
| Total from investment operations | 6.06 | 2.83 | 1.68 | 6.99 | 1.48 | 3.15 | ||||||
| Distributions from net investment income | (.30) | (.59) | (1.05) | (.59) | (.58) | (.54) | ||||||
| Distributions from net realized gain | (.47) | (.10) | (.80) | (.89) | (1.47) | (2.87) | ||||||
| Total distributions | (.76) D | (.69) | (1.84) D | (1.47) D | (2.05) | (3.41) | ||||||
| Net asset value, end of period | $ | 41.32 | $ | 36.02 | $ | 33.88 | $ | 34.04 | $ | 28.52 | $ | 29.09 |
Total Return E,F | 17.06 % | 8.54% | 5.03% | 25.59% | 5.26% | 14.11% | ||||||
Ratios to Average Net Assets B,G,H | ||||||||||||
| Expenses before reductions | .49% I | .52% | .53% | .53% | .55% | .56% | ||||||
| Expenses net of fee waivers, if any | .48 % I | .52% | .52% | .53% | .55% | .56% | ||||||
| Expenses net of all reductions | .48% I | .52% | .52% | .53% | .55% | .55% | ||||||
| Net investment income (loss) | 1.54% I | 1.86% | 1.69% | 2.24% C | 2.18% | 2.33% | ||||||
| Supplemental Data | ||||||||||||
| Net assets, end of period (in millions) | $ | 110 | $ | 144 | $ | 60 | $ | 14 | $ | 11 | $ | 7 |
Portfolio turnover rate J | 19 % I | 12% | 8% | 15% | 28% | 29% |
| Fidelity Central Fund | Investment Manager | Investment Objective | Investment Practices | Expense RatioA |
| Fidelity Money Market Central Funds | Fidelity Management & Research Company LLC (FMR) | Each fund seeks to obtain a high level of current income consistent with the preservation of capital and liquidity. | Short-term Investments | Less than .005% |
| Gross unrealized appreciation | $456,886 |
| Gross unrealized depreciation | (22,247) |
| Net unrealized appreciation (depreciation) | $434,639 |
| Tax cost | $738,821 |
| Equity Risk | Equity risk relates to the fluctuations in the value of financial instruments as a result of changes in market prices (other than those arising from interest rate risk or foreign exchange risk), whether caused by factors specific to an individual investment, its issuer, or all factors affecting all instruments traded in a market or market segment. |
| Primary Risk Exposure / Derivative Type | Net Realized Gain (Loss)($) | Change in Net Unrealized Appreciation (Depreciation)($) |
| Fidelity Advisor Growth & Income Fund | ||
| Equity Risk | ||
| Purchased Options | - | (99) |
| Written Options | (1,953) | (136) |
| Total Equity Risk | (1,953) | (235) |
| Interest Rate Risk | ||
| Totals | (1,953) | (235) |
| Purchases ($) | Sales ($) | |
| Fidelity Advisor Growth & Income Fund | 102,660 | 161,711 |
| Maximum Management Fee Rate % | |
| Class A | .60% |
| Class M | .59% |
| Class C | .61% |
| Class I | .61% |
| Class Z | .46% |
| Total Management Fee Rate % | |
| Class A | .60 |
| Class M | .59 |
| Class C | .61 |
| Class I | .61 |
| Class Z | .46 |
| Distribution Fee | Service Fee | Total Fees ($) | Retained by FDC ($) | |
| Class A | - % | .25% | 652 | 18 |
| Class M | .25% | .25% | 501 | 6 |
| Class C | .75% | .25% | 269 | 53 |
| 1,422 | 77 |
| Retained by FDC ($) | |
| Class A | 112 |
| Class M | 6 |
Class CA | 1 |
119 |
| % of Class-Level Average Net Assets | |
| Class A | .1733 |
| Class M | .1657 |
| Class C | .1860 |
| Class I | .1866 |
| Amount ($) | % of Class-Level Average Net AssetsA | |
| Class A | 219 | .18 |
| Class M | 81 | .17 |
| Class C | 24 | .19 |
| Class I | 112 | .19 |
| Class Z | 16 | .04 |
452 |
| % of Average Net Assets | |
| Fidelity Advisor Growth & Income Fund | .0295 |
| % of Average Net Assets | |
| Fidelity Advisor Growth & Income Fund | .03 |
| Amount ($) | |
| Fidelity Advisor Growth & Income Fund | 2 |
| Borrower or Lender | Average Loan Balance ($) | Weighted Average Interest Rate | Interest Expense ($) | |
| Fidelity Advisor Growth & Income Fund | Borrower | 8,595 | 5.57% | 21 |
| Purchases ($) | Sales ($) | Realized Gain (Loss)($) | |
| Fidelity Advisor Growth & Income Fund | 6,247 | 11,098 | 1,715 |
| Amount ($) | |
| Fidelity Advisor Growth & Income Fund | 1 |
| Total Security Lending Fees Paid to NFS ($) | Security Lending Income From Securities Loaned to NFS ($) | Value of Securities Loaned to NFS at Period End ($) | |
| Fidelity Advisor Growth & Income Fund | 2 | - | - |
| Expense reduction | |
| Class M | -A |
Six months ended May 31, 2024 | Year ended November 30, 2023 | |
| Fidelity Advisor Growth & Income Fund | ||
| Distributions to shareholders | ||
| Class A | $9,641 | $7,367 |
| Class M | 3,518 | 2,629 |
| Class C | 906 | 559 |
| Class I | 4,626 | 3,171 |
| Class Z | 2,973 | 1,971 |
Total | $21,664 | $15,697 |
| Shares | Shares | Dollars | Dollars | |
Six months ended May 31, 2024 | Year ended November 30, 2023 | Six months ended May 31, 2024 | Year ended November 30, 2023 | |
| Fidelity Advisor Growth & Income Fund | ||||
| Class A | ||||
| Shares sold | 1,165 | 2,709 | $43,812 | $89,706 |
| Reinvestment of distributions | 255 | 217 | 9,257 | 7,040 |
| Shares redeemed | (1,157) | (1,605) | (43,543) | (53,452) |
| Net increase (decrease) | 263 | 1,321 | $9,526 | $43,294 |
| Class M | ||||
| Shares sold | 170 | 489 | $6,358 | $16,232 |
| Reinvestment of distributions | 95 | 79 | 3,445 | 2,574 |
| Shares redeemed | (424) | (666) | (15,997) | (22,069) |
| Net increase (decrease) | (159) | (98) | $(6,194) | $(3,263) |
| Class C | ||||
| Shares sold | 226 | 526 | $7,795 | $15,943 |
| Reinvestment of distributions | 26 | 18 | 856 | 534 |
| Shares redeemed | (256) | (541) | (8,741) | (16,496) |
| Net increase (decrease) | (4) | 3 | $(90) | $(19) |
| Class I | ||||
| Shares sold | 1,156 | 4,443 | $43,797 | $151,618 |
| Reinvestment of distributions | 116 | 88 | 4,342 | 2,946 |
| Shares redeemed | (2,122) | (2,105) | (83,501) | (72,062) |
| Net increase (decrease) | (850) | 2,426 | $(35,362) | $82,502 |
| Class Z | ||||
| Shares sold | 611 | 2,810 | $23,340 | $96,484 |
| Reinvestment of distributions | 72 | 52 | 2,690 | 1,753 |
| Shares redeemed | (2,025) | (633) | (81,001) | (21,570) |
| Net increase (decrease) | (1,342) | 2,229 | $(54,971) | $76,667 |
 |


Contents
| Common Stocks - 99.5% | |||
| Shares | Value ($) (000s) | ||
| COMMUNICATION SERVICES - 2.5% | |||
| Entertainment - 0.1% | |||
| Vivid Seats, Inc. Class A (a)(b) | 467,980 | 2,363 | |
| Interactive Media & Services - 1.4% | |||
| Cars.com, Inc. (a) | 956,100 | 19,342 | |
| Ziff Davis, Inc. (a) | 144,600 | 8,330 | |
| 27,672 | |||
| Media - 0.6% | |||
| TechTarget, Inc. (a) | 390,571 | 11,803 | |
| Wireless Telecommunication Services - 0.4% | |||
| Gogo, Inc. (a)(b) | 720,900 | 7,631 | |
TOTAL COMMUNICATION SERVICES | 49,469 | ||
| CONSUMER DISCRETIONARY - 12.4% | |||
| Automobile Components - 2.5% | |||
| Adient PLC (a) | 493,200 | 13,928 | |
| Patrick Industries, Inc. | 303,964 | 34,834 | |
| 48,762 | |||
| Diversified Consumer Services - 0.2% | |||
| Laureate Education, Inc. | 235,566 | 3,689 | |
| Hotels, Restaurants & Leisure - 1.1% | |||
| Brinker International, Inc. (a) | 299,200 | 21,132 | |
| Household Durables - 2.4% | |||
| Installed Building Products, Inc. | 32,000 | 6,779 | |
| Lovesac (a) | 184,658 | 5,191 | |
| SharkNinja, Inc. (b) | 273,866 | 20,984 | |
| Skyline Champion Corp. (a) | 199,786 | 13,907 | |
| 46,861 | |||
| Leisure Products - 1.2% | |||
| BRP, Inc. | 202,600 | 12,659 | |
| Brunswick Corp. | 135,200 | 11,158 | |
| 23,817 | |||
| Specialty Retail - 3.6% | |||
| Academy Sports & Outdoors, Inc. | 148,905 | 8,590 | |
| Boot Barn Holdings, Inc. (a)(b) | 146,000 | 17,364 | |
| Murphy U.S.A., Inc. | 61,300 | 26,895 | |
| Valvoline, Inc. (a) | 453,000 | 18,392 | |
| 71,241 | |||
| Textiles, Apparel & Luxury Goods - 1.4% | |||
| Crocs, Inc. (a) | 172,621 | 26,867 | |
TOTAL CONSUMER DISCRETIONARY | 242,369 | ||
| CONSUMER STAPLES - 4.2% | |||
| Beverages - 0.8% | |||
| The Vita Coco Co., Inc. (a)(b) | 501,196 | 14,590 | |
| Consumer Staples Distribution & Retail - 2.8% | |||
| BJ's Wholesale Club Holdings, Inc. (a) | 242,730 | 21,377 | |
| Performance Food Group Co. (a) | 215,900 | 15,027 | |
| Sprouts Farmers Market LLC (a) | 233,800 | 18,466 | |
| 54,870 | |||
| Food Products - 0.6% | |||
| Nomad Foods Ltd. | 691,716 | 12,147 | |
TOTAL CONSUMER STAPLES | 81,607 | ||
| ENERGY - 6.1% | |||
| Energy Equipment & Services - 4.4% | |||
| Cactus, Inc. | 469,700 | 24,119 | |
| Championx Corp. | 644,000 | 21,007 | |
| Liberty Energy, Inc. Class A | 1,172,400 | 28,947 | |
| TechnipFMC PLC | 468,200 | 12,262 | |
| 86,335 | |||
| Oil, Gas & Consumable Fuels - 1.7% | |||
| Antero Resources Corp. (a) | 698,300 | 24,880 | |
| Hess Midstream LP (b) | 246,048 | 8,550 | |
| 33,430 | |||
TOTAL ENERGY | 119,765 | ||
| FINANCIALS - 14.1% | |||
| Banks - 5.1% | |||
| ConnectOne Bancorp, Inc. | 956,855 | 17,836 | |
| First Interstate Bancsystem, Inc. | 602,400 | 15,988 | |
| Independent Bank Group, Inc. | 452,900 | 20,852 | |
| Metropolitan Bank Holding Corp. (a) | 266,382 | 11,201 | |
| Pinnacle Financial Partners, Inc. | 254,400 | 20,227 | |
| Trico Bancshares | 326,300 | 12,426 | |
| 98,530 | |||
| Capital Markets - 3.9% | |||
| Houlihan Lokey (b) | 153,100 | 20,722 | |
| Lazard, Inc. Class A | 358,700 | 14,431 | |
| Patria Investments Ltd. | 792,660 | 10,305 | |
| Stifel Financial Corp. | 176,800 | 14,312 | |
| TMX Group Ltd. | 626,700 | 16,820 | |
| 76,590 | |||
| Consumer Finance - 0.6% | |||
| PROG Holdings, Inc. | 308,814 | 11,670 | |
| Financial Services - 1.4% | |||
| Essent Group Ltd. (b) | 473,523 | 26,849 | |
| Insurance - 3.1% | |||
| Old Republic International Corp. | 400,300 | 12,722 | |
| Primerica, Inc. | 122,600 | 27,694 | |
| Selective Insurance Group, Inc. | 179,800 | 17,550 | |
| Stewart Information Services Corp. | 46,920 | 2,971 | |
| 60,937 | |||
TOTAL FINANCIALS | 274,576 | ||
| HEALTH CARE - 13.6% | |||
| Biotechnology - 4.8% | |||
| Allogene Therapeutics, Inc. (a) | 718,300 | 1,796 | |
| Arcellx, Inc. (a) | 76,800 | 3,994 | |
| Astria Therapeutics, Inc. (a) | 226,800 | 2,148 | |
| Blueprint Medicines Corp. (a) | 61,800 | 6,524 | |
| Celldex Therapeutics, Inc. (a) | 94,300 | 3,140 | |
| Cogent Biosciences, Inc. (a)(b) | 452,072 | 3,621 | |
| Crinetics Pharmaceuticals, Inc. (a) | 121,500 | 5,396 | |
| Cytokinetics, Inc. (a) | 160,500 | 7,786 | |
| Insmed, Inc. (a) | 200,800 | 11,054 | |
| Keros Therapeutics, Inc. (a) | 104,100 | 4,879 | |
| Legend Biotech Corp. ADR (a) | 77,800 | 3,113 | |
| Madrigal Pharmaceuticals, Inc. (a)(b) | 13,400 | 3,165 | |
| Merus BV (a) | 50,700 | 2,699 | |
| Scholar Rock Holding Corp. (a) | 189,400 | 1,778 | |
| Tyra Biosciences, Inc. (a) | 171,700 | 2,785 | |
| Vaxcyte, Inc. (a) | 152,800 | 10,737 | |
| Viking Therapeutics, Inc. (a)(b) | 164,700 | 10,254 | |
| Viridian Therapeutics, Inc. (a) | 159,200 | 1,902 | |
| Xenon Pharmaceuticals, Inc. (a) | 152,500 | 5,806 | |
| Zentalis Pharmaceuticals, Inc. (a) | 145,446 | 1,728 | |
| 94,305 | |||
| Health Care Equipment & Supplies - 3.6% | |||
| Haemonetics Corp. (a) | 138,300 | 11,628 | |
| Masimo Corp. (a) | 69,100 | 8,603 | |
| Merit Medical Systems, Inc. (a) | 169,100 | 13,722 | |
| Pulmonx Corp. (a) | 832,400 | 6,035 | |
| RxSight, Inc. (a) | 145,500 | 8,507 | |
| TransMedics Group, Inc. (a)(b) | 164,000 | 22,370 | |
| 70,865 | |||
| Health Care Providers & Services - 4.4% | |||
| Acadia Healthcare Co., Inc. (a) | 316,000 | 21,769 | |
| Chemed Corp. | 34,800 | 19,292 | |
| Option Care Health, Inc. (a) | 300,237 | 8,953 | |
| PACS Group, Inc. (a)(b) | 164,100 | 4,989 | |
| Pennant Group, Inc. (a) | 85,722 | 2,018 | |
| The Ensign Group, Inc. | 231,500 | 28,067 | |
| 85,088 | |||
| Life Sciences Tools & Services - 0.3% | |||
| Maravai LifeSciences Holdings, Inc. Class A (a) | 670,200 | 5,811 | |
| Pharmaceuticals - 0.5% | |||
| Edgewise Therapeutics, Inc. (a) | 189,700 | 3,250 | |
| Intra-Cellular Therapies, Inc. (a) | 95,100 | 6,395 | |
| 9,645 | |||
TOTAL HEALTH CARE | 265,714 | ||
| INDUSTRIALS - 18.6% | |||
| Aerospace & Defense - 0.0% | |||
| Loar Holdings, Inc. (a)(b) | 1,900 | 108 | |
| Building Products - 2.3% | |||
| AAON, Inc. | 162,500 | 12,196 | |
| CSW Industrials, Inc. | 52,534 | 13,357 | |
| Simpson Manufacturing Co. Ltd. (b) | 114,000 | 18,915 | |
| 44,468 | |||
| Construction & Engineering - 2.7% | |||
| EMCOR Group, Inc. | 70,200 | 27,284 | |
| Sterling Construction Co., Inc. (a) | 202,500 | 24,881 | |
| 52,165 | |||
| Electrical Equipment - 2.8% | |||
| Array Technologies, Inc. (a)(b) | 756,032 | 10,721 | |
| Atkore, Inc. | 79,700 | 12,126 | |
| Nextracker, Inc. Class A (a) | 348,400 | 19,221 | |
| Thermon Group Holdings, Inc. (a) | 367,100 | 12,393 | |
| 54,461 | |||
| Ground Transportation - 1.2% | |||
| ArcBest Corp. | 62,846 | 6,632 | |
| TFI International, Inc. | 133,900 | 17,712 | |
| 24,344 | |||
| Machinery - 1.3% | |||
| Terex Corp. (b) | 428,300 | 25,557 | |
| Professional Services - 2.7% | |||
| Concentrix Corp. | 119,341 | 7,319 | |
| ExlService Holdings, Inc. (a) | 654,600 | 19,546 | |
| KBR, Inc. | 404,900 | 26,586 | |
| 53,451 | |||
| Trading Companies & Distributors - 5.6% | |||
| Applied Industrial Technologies, Inc. | 96,800 | 18,682 | |
| Beacon Roofing Supply, Inc. (a) | 186,600 | 18,111 | |
| FTAI Aviation Ltd. (b) | 363,400 | 30,642 | |
| GMS, Inc. (a) | 221,618 | 20,823 | |
| Rush Enterprises, Inc. Class A | 474,891 | 21,432 | |
| 109,690 | |||
TOTAL INDUSTRIALS | 364,244 | ||
| INFORMATION TECHNOLOGY - 15.6% | |||
| Electronic Equipment, Instruments & Components - 7.1% | |||
| Advanced Energy Industries, Inc. | 194,200 | 20,863 | |
| Fabrinet (a)(b) | 179,500 | 42,992 | |
| Insight Enterprises, Inc. (a) | 173,872 | 33,992 | |
| Napco Security Technologies, Inc. (b) | 265,202 | 13,167 | |
| TD SYNNEX Corp. | 206,441 | 27,011 | |
| 138,025 | |||
| IT Services - 2.2% | |||
| ASGN, Inc. (a) | 209,300 | 19,655 | |
| Endava PLC ADR (a) | 212,408 | 5,722 | |
| Wix.com Ltd. (a) | 107,100 | 17,254 | |
| 42,631 | |||
| Semiconductors & Semiconductor Equipment - 3.9% | |||
| AEHR Test Systems (a)(b) | 200,400 | 2,307 | |
| Allegro MicroSystems LLC (a) | 519,600 | 15,661 | |
| Diodes, Inc. (a) | 238,144 | 17,654 | |
| MACOM Technology Solutions Holdings, Inc. (a) | 234,000 | 23,667 | |
| Nova Ltd. (a) | 85,889 | 17,921 | |
| 77,210 | |||
| Software - 2.4% | |||
| Five9, Inc. (a) | 129,600 | 6,060 | |
| Intapp, Inc. (a)(b) | 280,339 | 10,064 | |
| PROS Holdings, Inc. (a) | 265,800 | 7,836 | |
| Rapid7, Inc. (a) | 147,700 | 5,338 | |
| Tenable Holdings, Inc. (a) | 428,400 | 18,074 | |
| 47,372 | |||
TOTAL INFORMATION TECHNOLOGY | 305,238 | ||
| MATERIALS - 7.3% | |||
| Chemicals - 2.5% | |||
| Element Solutions, Inc. | 923,900 | 22,201 | |
| Hawkins, Inc. (b) | 77,700 | 6,785 | |
| The Chemours Co. LLC | 277,100 | 6,878 | |
| Tronox Holdings PLC | 657,000 | 13,015 | |
| 48,879 | |||
| Construction Materials - 1.3% | |||
| Eagle Materials, Inc. (b) | 106,600 | 24,773 | |
| Metals & Mining - 3.5% | |||
| Commercial Metals Co. (b) | 579,800 | 32,654 | |
| Constellium NV (a) | 1,637,500 | 35,485 | |
| 68,139 | |||
TOTAL MATERIALS | 141,791 | ||
| REAL ESTATE - 4.0% | |||
| Equity Real Estate Investment Trusts (REITs) - 3.3% | |||
| Essential Properties Realty Trust, Inc. (b) | 859,201 | 23,009 | |
| Lamar Advertising Co. Class A | 236,400 | 27,921 | |
| Urban Edge Properties | 825,400 | 14,634 | |
| 65,564 | |||
| Real Estate Management & Development - 0.7% | |||
| Colliers International Group, Inc. | 117,100 | 13,131 | |
TOTAL REAL ESTATE | 78,695 | ||
| UTILITIES - 1.1% | |||
| Gas Utilities - 1.1% | |||
| Brookfield Infrastructure Corp. A Shares | 626,167 | 21,571 | |
| TOTAL COMMON STOCKS (Cost $1,402,266) | 1,945,039 | ||
| Money Market Funds - 6.1% | |||
| Shares | Value ($) (000s) | ||
| Fidelity Cash Central Fund 5.39% (c) | 595,729 | 596 | |
| Fidelity Securities Lending Cash Central Fund 5.39% (c)(d) | 117,831,299 | 117,843 | |
| TOTAL MONEY MARKET FUNDS (Cost $118,439) | 118,439 | ||
| Equity Funds - 0.7% | |||
| Shares | Value ($) (000s) | ||
| Small Blend Funds - 0.7% | |||
iShares Russell 2000 Index ETF (b) (Cost $12,839) | 66,700 | 13,725 | |
| TOTAL INVESTMENT IN SECURITIES - 106.3% (Cost $1,533,544) | 2,077,203 |
NET OTHER ASSETS (LIABILITIES) - (6.3)% | (122,198) |
| NET ASSETS - 100.0% | 1,955,005 |
| ETF | - | EXCHANGE-TRADED FUND |
| (a) | Non-income producing |
| (b) | Security or a portion of the security is on loan at period end. |
| (c) | Affiliated fund that is generally available only to investment companies and other accounts managed by Fidelity Investments. The rate quoted is the annualized seven-day yield of the fund at period end. A complete unaudited listing of the fund's holdings as of its most recent quarter end is available upon request. In addition, each Fidelity Central Fund's financial statements are available on the SEC's website or upon request. |
| (d) | Investment made with cash collateral received from securities on loan. |
| Affiliate (Amounts in thousands) | Value, beginning of period ($) | Purchases ($) | Sales Proceeds ($) | Dividend Income ($) | Realized Gain (loss) ($) | Change in Unrealized appreciation (depreciation) ($) | Value, end of period ($) | % ownership, end of period |
| Fidelity Cash Central Fund 5.39% | 1,022 | 215,079 | 215,505 | 378 | - | - | 596 | 0.0% |
| Fidelity Securities Lending Cash Central Fund 5.39% | 45,249 | 476,097 | 403,503 | 33 | - | - | 117,843 | 0.5% |
| Total | 46,271 | 691,176 | 619,008 | 411 | - | - | 118,439 | |
| Valuation Inputs at Reporting Date: | ||||
Description (Amounts in thousands) | Total ($) | Level 1 ($) | Level 2 ($) | Level 3 ($) |
Investments in Securities: | ||||
| Equities: | ||||
Communication Services | 49,469 | 49,469 | - | - |
Consumer Discretionary | 242,369 | 242,369 | - | - |
Consumer Staples | 81,607 | 81,607 | - | - |
Energy | 119,765 | 119,765 | - | - |
Financials | 274,576 | 274,576 | - | - |
Health Care | 265,714 | 265,714 | - | - |
Industrials | 364,244 | 364,244 | - | - |
Information Technology | 305,238 | 305,238 | - | - |
Materials | 141,791 | 141,791 | - | - |
Real Estate | 78,695 | 78,695 | - | - |
Utilities | 21,571 | 21,571 | - | - |
| Money Market Funds | 118,439 | 118,439 | - | - |
| Equity Funds | 13,725 | 13,725 | - | - |
| Total Investments in Securities: | 2,077,203 | 2,077,203 | - | - |
| Statement of Assets and Liabilities | ||||
| Amounts in thousands (except per-share amounts) | May 31, 2024 (Unaudited) | |||
| Assets | ||||
| Investment in securities, at value (including securities loaned of $116,700) - See accompanying schedule: | ||||
Unaffiliated issuers (cost $1,415,105) | $ | 1,958,764 | ||
Fidelity Central Funds (cost $118,439) | 118,439 | |||
| Total Investment in Securities (cost $1,533,544) | $ | 2,077,203 | ||
| Foreign currency held at value (cost $882) | 883 | |||
| Receivable for fund shares sold | 741 | |||
| Dividends receivable | 1,367 | |||
| Distributions receivable from Fidelity Central Funds | 25 | |||
Total assets | 2,080,219 | |||
| Liabilities | ||||
| Payable to custodian bank | $ | 4,046 | ||
| Payable for investments purchased | 119 | |||
| Payable for fund shares redeemed | 1,103 | |||
| Accrued management fee | 1,660 | |||
| Distribution and service plan fees payable | 390 | |||
| Other payables and accrued expenses | 56 | |||
| Collateral on securities loaned | 117,840 | |||
| Total liabilities | 125,214 | |||
| Net Assets | $ | 1,955,005 | ||
| Net Assets consist of: | ||||
| Paid in capital | $ | 1,308,272 | ||
| Total accumulated earnings (loss) | 646,733 | |||
| Net Assets | $ | 1,955,005 | ||
| Net Asset Value and Maximum Offering Price | ||||
| Class A : | ||||
Net Asset Value and redemption price per share ($757,990 ÷ 25,084 shares)(a) | $ | 30.22 | ||
| Maximum offering price per share (100/94.25 of $30.22) | $ | 32.06 | ||
| Class M : | ||||
Net Asset Value and redemption price per share ($480,582 ÷ 18,129 shares)(a) | $ | 26.51 | ||
| Maximum offering price per share (100/96.50 of $26.51) | $ | 27.47 | ||
| Class C : | ||||
Net Asset Value and offering price per share ($41,442 ÷ 2,262 shares)(a) | $ | 18.32 | ||
| Class I : | ||||
Net Asset Value, offering price and redemption price per share ($511,846 ÷ 14,598 shares) | $ | 35.06 | ||
| Class Z : | ||||
Net Asset Value, offering price and redemption price per share ($163,145 ÷ 4,614 shares) | $ | 35.36 | ||
(a)Redemption price per share is equal to net asset value less any applicable contingent deferred sales charge. | ||||
| Statement of Operations | ||||
| Amounts in thousands | Six months ended May 31, 2024 (Unaudited) | |||
| Investment Income | ||||
| Dividends | $ | 8,483 | ||
| Income from Fidelity Central Funds (including $33 from security lending) | 411 | |||
| Total income | 8,894 | |||
| Expenses | ||||
| Management fee | ||||
| Basic fee | $ | 7,154 | ||
| Performance adjustment | 1,953 | |||
| Transfer agent fees | 799 | |||
| Distribution and service plan fees | 2,293 | |||
| Accounting fees | 127 | |||
| Custodian fees and expenses | 33 | |||
| Independent trustees' fees and expenses | 4 | |||
| Registration fees | 42 | |||
| Audit | 26 | |||
| Legal | 7 | |||
| Interest | 4 | |||
| Miscellaneous | 22 | |||
| Total expenses before reductions | 12,464 | |||
| Expense reductions | (84) | |||
| Total expenses after reductions | 12,380 | |||
| Net Investment income (loss) | (3,486) | |||
| Realized and Unrealized Gain (Loss) | ||||
| Net realized gain (loss) on: | ||||
| Investment Securities: | ||||
| Unaffiliated issuers | 118,900 | |||
| Foreign currency transactions | (44) | |||
| Total net realized gain (loss) | 118,856 | |||
| Change in net unrealized appreciation (depreciation) on: | ||||
| Investment Securities: | ||||
| Unaffiliated issuers | 219,929 | |||
| Assets and liabilities in foreign currencies | 1 | |||
| Total change in net unrealized appreciation (depreciation) | 219,930 | |||
| Net gain (loss) | 338,786 | |||
| Net increase (decrease) in net assets resulting from operations | $ | 335,300 | ||
| Statement of Changes in Net Assets | ||||
| Amount in thousands | Six months ended May 31, 2024 (Unaudited) | Year ended November 30, 2023 | ||
| Increase (Decrease) in Net Assets | ||||
| Operations | ||||
| Net investment income (loss) | $ | (3,486) | $ | (6,524) |
| Net realized gain (loss) | 118,856 | 35,517 | ||
| Change in net unrealized appreciation (depreciation) | 219,930 | (11,386) | ||
| Net increase (decrease) in net assets resulting from operations | 335,300 | 17,607 | ||
| Distributions to shareholders | (25,662) | (89,410) | ||
| Share transactions - net increase (decrease) | (78,405) | (117,828) | ||
| Total increase (decrease) in net assets | 231,233 | (189,631) | ||
| Net Assets | ||||
| Beginning of period | 1,723,772 | 1,913,403 | ||
| End of period | $ | 1,955,005 | $ | 1,723,772 |
Fidelity Advisor® Small Cap Fund Class A |
Six months ended (Unaudited) May 31, 2024 | Years ended November 30, 2023 | 2022 | 2021 | 2020 | 2019 | |||||||
Selected Per-Share Data | ||||||||||||
| Net asset value, beginning of period | $ | 25.59 | $ | 26.67 | $ | 34.34 | $ | 26.09 | $ | 24.25 | $ | 24.46 |
| Income from Investment Operations | ||||||||||||
Net investment income (loss) A,B | (.06) | (.10) | (.11) | (.17) | (.08) | (.03) | ||||||
| Net realized and unrealized gain (loss) | 5.07 | .31 | (4.04) | 9.15 | 2.85 | 2.56 | ||||||
| Total from investment operations | 5.01 | .21 | (4.15) | 8.98 | 2.77 | 2.53 | ||||||
| Distributions from net realized gain | (.38) | (1.29) | (3.52) | (.73) | (.93) | (2.74) | ||||||
| Total distributions | (.38) | (1.29) | (3.52) | (.73) | (.93) | (2.74) | ||||||
| Net asset value, end of period | $ | 30.22 | $ | 25.59 | $ | 26.67 | $ | 34.34 | $ | 26.09 | $ | 24.25 |
Total Return C,D,E | 19.68 % | 1.11% | (13.82)% | 35.20% | 11.78% | 13.97% | ||||||
Ratios to Average Net Assets B,F,G | ||||||||||||
| Expenses before reductions | 1.33% H | 1.36% | 1.33% | 1.22% | 1.22% | .98% | ||||||
| Expenses net of fee waivers, if any | 1.33 % H | 1.35% | 1.32% | 1.22% | 1.22% | .98% | ||||||
| Expenses net of all reductions | 1.33% H | 1.35% | 1.32% | 1.22% | 1.22% | .98% | ||||||
| Net investment income (loss) | (.39)% H | (.39)% | (.40)% | (.53)% | (.36)% | (.13)% | ||||||
| Supplemental Data | ||||||||||||
| Net assets, end of period (in millions) | $ | 758 | $ | 643 | $ | 676 | $ | 837 | $ | 638 | $ | 654 |
Portfolio turnover rate I | 36 % H | 29% | 47% | 41% | 47% | 56% |
Fidelity Advisor® Small Cap Fund Class M |
Six months ended (Unaudited) May 31, 2024 | Years ended November 30, 2023 | 2022 | 2021 | 2020 | 2019 | |||||||
Selected Per-Share Data | ||||||||||||
| Net asset value, beginning of period | $ | 22.52 | $ | 23.68 | $ | 30.88 | $ | 23.58 | $ | 22.06 | $ | 22.58 |
| Income from Investment Operations | ||||||||||||
Net investment income (loss) A,B | (.08) | (.14) | (.15) | (.22) | (.12) | (.07) | ||||||
| Net realized and unrealized gain (loss) | 4.45 | .27 | (3.59) | 8.25 | 2.57 | 2.29 | ||||||
| Total from investment operations | 4.37 | .13 | (3.74) | 8.03 | 2.45 | 2.22 | ||||||
| Distributions from net realized gain | (.38) | (1.29) | (3.46) | (.73) | (.93) | (2.74) | ||||||
| Total distributions | (.38) | (1.29) | (3.46) | (.73) | (.93) | (2.74) | ||||||
| Net asset value, end of period | $ | 26.51 | $ | 22.52 | $ | 23.68 | $ | 30.88 | $ | 23.58 | $ | 22.06 |
Total Return C,D,E | 19.52 % | .89% | (14.03)% | 34.91% | 11.49% | 13.73% | ||||||
Ratios to Average Net Assets B,F,G | ||||||||||||
| Expenses before reductions | 1.57% H | 1.60% | 1.57% | 1.46% | 1.45% | 1.22% | ||||||
| Expenses net of fee waivers, if any | 1.57 % H | 1.59% | 1.56% | 1.46% | 1.45% | 1.22% | ||||||
| Expenses net of all reductions | 1.57% H | 1.59% | 1.56% | 1.46% | 1.45% | 1.21% | ||||||
| Net investment income (loss) | (.63)% H | (.63)% | (.64)% | (.77)% | (.59)% | (.36)% | ||||||
| Supplemental Data | ||||||||||||
| Net assets, end of period (in millions) | $ | 481 | $ | 428 | $ | 477 | $ | 619 | $ | 503 | $ | 542 |
Portfolio turnover rate I | 36 % H | 29% | 47% | 41% | 47% | 56% |
Fidelity Advisor® Small Cap Fund Class C |
Six months ended (Unaudited) May 31, 2024 | Years ended November 30, 2023 | 2022 | 2021 | 2020 | 2019 | |||||||
Selected Per-Share Data | ||||||||||||
| Net asset value, beginning of period | $ | 15.71 | $ | 17.02 | $ | 23.16 | $ | 17.96 | $ | 17.11 | $ | 18.32 |
| Income from Investment Operations | ||||||||||||
Net investment income (loss) A,B | (.10) | (.19) | (.21) | (.29) | (.18) | (.15) | ||||||
| Net realized and unrealized gain (loss) | 3.09 | .17 | (2.56) | 6.22 | 1.96 | 1.68 | ||||||
| Total from investment operations | 2.99 | (.02) | (2.77) | 5.93 | 1.78 | 1.53 | ||||||
| Distributions from net realized gain | (.38) | (1.29) | (3.37) | (.73) | (.93) | (2.74) | ||||||
| Total distributions | (.38) | (1.29) | (3.37) | (.73) | (.93) | (2.74) | ||||||
| Net asset value, end of period | $ | 18.32 | $ | 15.71 | $ | 17.02 | $ | 23.16 | $ | 17.96 | $ | 17.11 |
Total Return C,D,E | 19.19 % | .32% | (14.51)% | 34.12% | 10.87% | 13.05% | ||||||
Ratios to Average Net Assets B,F,G | ||||||||||||
| Expenses before reductions | 2.08% H | 2.18% | 2.15% | 2.03% | 2.04% | 1.79% | ||||||
| Expenses net of fee waivers, if any | 2.07 % H | 2.17% | 2.14% | 2.03% | 2.04% | 1.79% | ||||||
| Expenses net of all reductions | 2.07% H | 2.17% | 2.14% | 2.03% | 2.03% | 1.78% | ||||||
| Net investment income (loss) | (1.14)% H | (1.21)% | (1.22)% | (1.34)% | (1.18)% | (.93)% | ||||||
| Supplemental Data | ||||||||||||
| Net assets, end of period (in millions) | $ | 41 | $ | 39 | $ | 50 | $ | 73 | $ | 81 | $ | 96 |
Portfolio turnover rate I | 36 % H | 29% | 47% | 41% | 47% | 56% |
Fidelity Advisor® Small Cap Fund Class I |
Six months ended (Unaudited) May 31, 2024 | Years ended November 30, 2023 | 2022 | 2021 | 2020 | 2019 | |||||||
Selected Per-Share Data | ||||||||||||
| Net asset value, beginning of period | $ | 29.60 | $ | 30.56 | $ | 38.84 | $ | 29.34 | $ | 27.09 | $ | 26.89 |
| Income from Investment Operations | ||||||||||||
Net investment income (loss) A,B | (.02) | (.04) | (.05) | (.10) | (.02) | .03 | ||||||
| Net realized and unrealized gain (loss) | 5.86 | .37 | (4.63) | 10.33 | 3.20 | 2.91 | ||||||
| Total from investment operations | 5.84 | .33 | (4.68) | 10.23 | 3.18 | 2.94 | ||||||
| Distributions from net realized gain | (.38) | (1.29) | (3.60) | (.73) | (.93) | (2.74) | ||||||
| Total distributions | (.38) | (1.29) | (3.60) | (.73) | (.93) | (2.74) | ||||||
| Net asset value, end of period | $ | 35.06 | $ | 29.60 | $ | 30.56 | $ | 38.84 | $ | 29.34 | $ | 27.09 |
Total Return C,D | 19.82 % | 1.37% | (13.61)% | 35.57% | 12.07% | 14.26% | ||||||
Ratios to Average Net Assets B,E,F | ||||||||||||
| Expenses before reductions | 1.08% G | 1.10% | 1.08% | .97% | .96% | .72% | ||||||
| Expenses net of fee waivers, if any | 1.07 % G | 1.10% | 1.07% | .96% | .95% | .72% | ||||||
| Expenses net of all reductions | 1.07% G | 1.10% | 1.07% | .96% | .95% | .72% | ||||||
| Net investment income (loss) | (.14)% G | (.14)% | (.15)% | (.27)% | (.09)% | .14% | ||||||
| Supplemental Data | ||||||||||||
| Net assets, end of period (in millions) | $ | 512 | $ | 434 | $ | 456 | $ | 519 | $ | 378 | $ | 434 |
Portfolio turnover rate H | 36 % G | 29% | 47% | 41% | 47% | 56% |
Fidelity Advisor® Small Cap Fund Class Z |
Six months ended (Unaudited) May 31, 2024 | Years ended November 30, 2023 | 2022 | 2021 | 2020 | 2019 | |||||||
Selected Per-Share Data | ||||||||||||
| Net asset value, beginning of period | $ | 29.83 | $ | 30.74 | $ | 39.04 | $ | 29.45 | $ | 27.15 | $ | 26.90 |
| Income from Investment Operations | ||||||||||||
Net investment income (loss) A,B | .01 | - C | - C | (.05) | .01 | .07 | ||||||
| Net realized and unrealized gain (loss) | 5.90 | .38 | (4.65) | 10.37 | 3.22 | 2.92 | ||||||
| Total from investment operations | 5.91 | .38 | (4.65) | 10.32 | 3.23 | 2.99 | ||||||
| Distributions from net realized gain | (.38) | (1.29) | (3.65) | (.73) | (.93) | (2.74) | ||||||
| Total distributions | (.38) | (1.29) | (3.65) | (.73) | (.93) | (2.74) | ||||||
| Net asset value, end of period | $ | 35.36 | $ | 29.83 | $ | 30.74 | $ | 39.04 | $ | 29.45 | $ | 27.15 |
Total Return D,E | 19.90 % | 1.53% | (13.47)% | 35.75% | 12.23% | 14.46% | ||||||
Ratios to Average Net Assets B,F,G | ||||||||||||
| Expenses before reductions | .91% H | .96% | .93% | .83% | .81% | .57% | ||||||
| Expenses net of fee waivers, if any | .90 % H | .95% | .93% | .83% | .81% | .57% | ||||||
| Expenses net of all reductions | .90% H | .95% | .93% | .83% | .80% | .57% | ||||||
| Net investment income (loss) | .03% H | .01% | -% I | (.14)% | .05% | .29% | ||||||
| Supplemental Data | ||||||||||||
| Net assets, end of period (in millions) | $ | 163 | $ | 179 | $ | 254 | $ | 117 | $ | 79 | $ | 117 |
Portfolio turnover rate J | 36 % H | 29% | 47% | 41% | 47% | 56% |
| Fidelity Central Fund | Investment Manager | Investment Objective | Investment Practices | Expense RatioA |
| Fidelity Money Market Central Funds | Fidelity Management & Research Company LLC (FMR) | Each fund seeks to obtain a high level of current income consistent with the preservation of capital and liquidity. | Short-term Investments | Less than .005% |
| Gross unrealized appreciation | $640,783 |
| Gross unrealized depreciation | (98,076) |
| Net unrealized appreciation (depreciation) | $542,707 |
| Tax cost | $1,534,496 |
| Purchases ($) | Sales ($) | |
| Fidelity Advisor Small Cap Fund | 342,684 | 447,289 |
| Maximum Management Fee Rate % | |
| Class A | .86 |
| Class M | .85 |
| Class C | .87 |
| Class I | .85 |
| Class Z | .71 |
| Total Management Fee Rate % | |
| Class A | .84 |
| Class M | .84 |
| Class C | .84 |
| Class I | .84 |
| Class Z | .71 |
| Performance Adjustment Index | |
| Fidelity Advisor Small Cap Fund | Russell 2000 Index |
| Distribution Fee | Service Fee | Total Fees ($) | Retained by FDC ($) | |
| Class A | -% | .25% | 907 | 13 |
| Class M | .25% | .25% | 1,178 | 5 |
| Class C | .75% | .25% | 208 | 22 |
| 2,293 | 40 |
| Retained by FDC ($) | |
| Class A | 40 |
| Class M | 5 |
Class CA | -B |
45 |
| % of Class-Level Average Net Assets | |
| Class A | .1871 |
| Class M | .1754 |
| Class C | .2000 |
| Class I | .1834 |
| Amount ($) | % of Class-Level Average Net AssetsA | |
| Class A | 332 | .19 |
| Class M | 204 | .18 |
| Class C | 21 | .20 |
| Class I | 221 | .19 |
| Class Z | 21 | .04 |
799 |
| % of Average Net Assets | |
| Fidelity Advisor Small Cap Fund | .0269 |
| % of Average Net Assets | |
| Fidelity Advisor Small Cap Fund | .03 |
| Amount ($) | |
| Fidelity Advisor Small Cap Fund | 12 |
| Borrower or Lender | Average Loan Balance ($) | Weighted Average Interest Rate | Interest Expense ($) | |
| Fidelity Advisor Small Cap Fund | Borrower | 25,903 | 5.57% | 4 |
| Purchases ($) | Sales ($) | Realized Gain (Loss) ($) | |
| Fidelity Advisor Small Cap Fund | 15,732 | 38,659 | 9,655 |
| Amount ($) | |
| Fidelity Advisor Small Cap Fund | 2 |
| Total Security Lending Fees Paid to NFS ($) | Security Lending Income From Securities Loaned to NFS ($) | Value of Securities Loaned to NFS at Period End ($) | |
| Fidelity Advisor Small Cap Fund | 4 | -A | - |
Six months ended May 31, 2024 | Year ended November 30, 2023 | |
| Fidelity Advisor Small Cap Fund | ||
| Distributions to shareholders | ||
| Class A | $9,571 | $32,548 |
| Class M | 7,225 | 25,778 |
| Class C | 929 | 3,770 |
| Class I | 5,633 | 19,157 |
| Class Z | 2,304 | 8,157 |
Total | $25,662 | $89,410 |
| Shares | Shares | Dollars | Dollars | |
Six months ended May 31, 2024 | Year ended November 30, 2023 | Six months ended May 31, 2024 | Year ended November 30, 2023 | |
| Fidelity Advisor Small Cap Fund | ||||
| Class A | ||||
| Shares sold | 1,650 | 2,285 | $47,375 | $58,230 |
| Reinvestment of distributions | 323 | 1,301 | 9,180 | 31,291 |
| Shares redeemed | (2,031) | (3,794) | (58,326) | (96,500) |
| Net increase (decrease) | (58) | (208) | $(1,771) | $(6,979) |
| Class M | ||||
| Shares sold | 876 | 1,617 | $21,982 | $36,375 |
| Reinvestment of distributions | 286 | 1,201 | 7,126 | 25,473 |
| Shares redeemed | (2,042) | (3,955) | (51,423) | (89,092) |
| Net increase (decrease) | (880) | (1,137) | $(22,315) | $(27,244) |
| Class C | ||||
| Shares sold | 170 | 361 | $2,950 | $5,713 |
| Reinvestment of distributions | 53 | 251 | 921 | 3,733 |
| Shares redeemed | (439) | (1,099) | (7,602) | (17,167) |
| Net increase (decrease) | (216) | (487) | $(3,731) | $(7,721) |
| Class I | ||||
| Shares sold | 1,940 | 3,104 | $64,328 | $91,158 |
| Reinvestment of distributions | 157 | 656 | 5,157 | 18,199 |
| Shares redeemed | (2,177) | (3,992) | (72,175) | (117,654) |
| Net increase (decrease) | (80) | (232) | $(2,690) | $(8,297) |
| Class Z | ||||
| Shares sold | 1,324 | 4,902 | $44,326 | $142,121 |
| Reinvestment of distributions | 65 | 273 | 2,148 | 7,632 |
| Shares redeemed | (2,775) | (7,441) | (94,372) | (217,340) |
| Net increase (decrease) | (1,386) | (2,266) | $(47,898) | $(67,587) |
 |


Contents
| Common Stocks - 97.0% | |||
| Shares | Value ($) | ||
| COMMUNICATION SERVICES - 10.0% | |||
| Diversified Telecommunication Services - 0.2% | |||
| Cellnex Telecom SA (a) | 61,000 | 2,228,334 | |
| Entertainment - 0.9% | |||
| The Walt Disney Co. | 60,175 | 6,252,784 | |
| Universal Music Group NV | 206,334 | 6,430,130 | |
| Universal Music Group NV rights (b)(c) | 206,334 | 60,448 | |
| 12,743,362 | |||
| Interactive Media & Services - 7.0% | |||
| Alphabet, Inc.: | |||
| Class A | 162,980 | 28,114,050 | |
| Class C | 143,260 | 24,921,510 | |
| Match Group, Inc. (b) | 92,200 | 2,824,086 | |
| Meta Platforms, Inc. Class A (d) | 79,100 | 36,926,253 | |
| Reddit, Inc. Class B (h) | 1,200 | 65,088 | |
| Snap, Inc. Class A (b) | 339,100 | 5,093,282 | |
| 97,944,269 | |||
| Media - 1.9% | |||
| Charter Communications, Inc. Class A (b) | 2,100 | 602,952 | |
| Comcast Corp. Class A | 529,423 | 21,192,803 | |
| Interpublic Group of Companies, Inc. | 137,920 | 4,326,550 | |
| 26,122,305 | |||
TOTAL COMMUNICATION SERVICES | 139,038,270 | ||
| CONSUMER DISCRETIONARY - 3.3% | |||
| Automobiles - 0.1% | |||
| Rivian Automotive, Inc. (b) | 70,800 | 773,136 | |
| Broadline Retail - 0.1% | |||
| Amazon.com, Inc. (b) | 8,400 | 1,482,096 | |
| Hotels, Restaurants & Leisure - 1.7% | |||
| Booking Holdings, Inc. | 4,069 | 15,365,968 | |
| Expedia Group, Inc. (b) | 19,000 | 2,144,340 | |
| Marriott International, Inc. Class A | 18,200 | 4,207,294 | |
| Starbucks Corp. | 28,000 | 2,246,160 | |
| 23,963,762 | |||
| Household Durables - 0.3% | |||
| Mohawk Industries, Inc. (b) | 21,706 | 2,646,613 | |
| Sony Group Corp. sponsored ADR | 11,500 | 946,910 | |
| Whirlpool Corp. | 7,134 | 663,676 | |
| 4,257,199 | |||
| Specialty Retail - 1.0% | |||
| JD Sports Fashion PLC | 871,100 | 1,431,720 | |
| Lowe's Companies, Inc. | 47,630 | 10,540,043 | |
| RH (b) | 4,500 | 1,223,685 | |
| 13,195,448 | |||
| Textiles, Apparel & Luxury Goods - 0.1% | |||
| Compagnie Financiere Richemont SA Series A | 3,690 | 593,783 | |
| NIKE, Inc. Class B | 9,400 | 893,470 | |
| 1,487,253 | |||
TOTAL CONSUMER DISCRETIONARY | 45,158,894 | ||
| CONSUMER STAPLES - 5.0% | |||
| Beverages - 1.8% | |||
| Diageo PLC sponsored ADR | 30,000 | 4,052,700 | |
| Keurig Dr. Pepper, Inc. | 282,600 | 9,679,050 | |
| Pernod Ricard SA | 3,500 | 524,136 | |
| The Coca-Cola Co. | 162,981 | 10,256,394 | |
| 24,512,280 | |||
| Consumer Staples Distribution & Retail - 1.5% | |||
| Performance Food Group Co. (b) | 35,200 | 2,449,920 | |
| Sysco Corp. | 83,300 | 6,065,906 | |
| Target Corp. | 26,000 | 4,060,160 | |
| U.S. Foods Holding Corp. (b) | 43,900 | 2,319,237 | |
| Walmart, Inc. | 83,900 | 5,517,264 | |
| 20,412,487 | |||
| Personal Care Products - 1.4% | |||
| Estee Lauder Companies, Inc. Class A | 23,800 | 2,935,968 | |
| Haleon PLC ADR | 1,031,038 | 8,701,961 | |
| Kenvue, Inc. | 449,107 | 8,667,765 | |
| 20,305,694 | |||
| Tobacco - 0.3% | |||
| Altria Group, Inc. | 55,580 | 2,570,575 | |
| Philip Morris International, Inc. | 10,900 | 1,105,042 | |
| 3,675,617 | |||
TOTAL CONSUMER STAPLES | 68,906,078 | ||
| ENERGY - 9.5% | |||
| Energy Equipment & Services - 0.1% | |||
| Tidewater, Inc. (b) | 17,700 | 1,828,941 | |
| Oil, Gas & Consumable Fuels - 9.4% | |||
| Cameco Corp. | 4,900 | 271,999 | |
| Exxon Mobil Corp. (d) | 749,704 | 87,910,291 | |
| Galp Energia SGPS SA Class B | 102,800 | 2,161,794 | |
| Imperial Oil Ltd. | 242,800 | 17,155,171 | |
| Kosmos Energy Ltd. (b)(e) | 437,995 | 2,671,770 | |
| MEG Energy Corp. (b) | 211,600 | 4,593,891 | |
| Shell PLC ADR | 201,800 | 14,687,004 | |
| 129,451,920 | |||
TOTAL ENERGY | 131,280,861 | ||
| FINANCIALS - 16.5% | |||
| Banks - 11.5% | |||
| Bank of America Corp. | 948,214 | 37,919,078 | |
| HDFC Bank Ltd. sponsored ADR | 4,700 | 272,083 | |
| JPMorgan Chase & Co. | 79,618 | 16,132,995 | |
| M&T Bank Corp. | 34,128 | 5,173,805 | |
| PNC Financial Services Group, Inc. | 87,641 | 13,793,817 | |
| U.S. Bancorp | 235,990 | 9,569,395 | |
| Wells Fargo & Co. | 1,286,503 | 77,087,260 | |
| 159,948,433 | |||
| Capital Markets - 2.1% | |||
| 3i Group PLC | 16,500 | 607,975 | |
| Charles Schwab Corp. | 12,200 | 894,016 | |
| CME Group, Inc. | 1,500 | 304,470 | |
| KKR & Co. LP | 106,391 | 10,941,250 | |
| Moody's Corp. | 2,100 | 833,679 | |
| Morgan Stanley | 39,425 | 3,857,342 | |
| MSCI, Inc. | 800 | 396,144 | |
| Northern Trust Corp. | 116,591 | 9,821,626 | |
| Raymond James Financial, Inc. | 12,293 | 1,508,966 | |
| 29,165,468 | |||
| Financial Services - 2.5% | |||
| Acacia Research Corp. (b) | 36,900 | 205,902 | |
| Edenred SA | 47,500 | 2,216,422 | |
| Fidelity National Information Services, Inc. | 16,000 | 1,214,080 | |
| Global Payments, Inc. | 10,300 | 1,049,055 | |
| MasterCard, Inc. Class A | 11,215 | 5,013,890 | |
| PayPal Holdings, Inc. (b) | 25,700 | 1,618,843 | |
| Visa, Inc. Class A | 86,827 | 23,656,884 | |
| 34,975,076 | |||
| Insurance - 0.4% | |||
| Arthur J. Gallagher & Co. | 10,000 | 2,533,300 | |
| Chubb Ltd. | 10,495 | 2,842,256 | |
| 5,375,556 | |||
TOTAL FINANCIALS | 229,464,533 | ||
| HEALTH CARE - 11.5% | |||
| Biotechnology - 0.6% | |||
| Alnylam Pharmaceuticals, Inc. (b) | 12,119 | 1,798,823 | |
| Argenx SE ADR (b) | 1,900 | 704,938 | |
| Insmed, Inc. (b) | 43,397 | 2,389,005 | |
| Merus BV (b) | 15,500 | 825,220 | |
| Vaxcyte, Inc. (b) | 32,800 | 2,304,856 | |
| 8,022,842 | |||
| Health Care Equipment & Supplies - 2.0% | |||
| Abbott Laboratories | 14,300 | 1,461,317 | |
| Becton, Dickinson & Co. | 10,797 | 2,504,580 | |
| Boston Scientific Corp. (b) | 279,926 | 21,154,008 | |
| Koninklijke Philips Electronics NV (depository receipt) (NY Reg.) | 52,186 | 1,416,328 | |
| Solventum Corp. | 16,312 | 967,954 | |
| 27,504,187 | |||
| Health Care Providers & Services - 5.0% | |||
| Cardinal Health, Inc. | 71,982 | 7,145,653 | |
| Cigna Group | 51,203 | 17,645,578 | |
| CVS Health Corp. | 47,468 | 2,829,093 | |
| Guardant Health, Inc. (b) | 22,800 | 617,880 | |
| Humana, Inc. | 17,200 | 6,159,664 | |
| McKesson Corp. | 22,806 | 12,990,070 | |
| UnitedHealth Group, Inc. | 45,199 | 22,390,229 | |
| 69,778,167 | |||
| Life Sciences Tools & Services - 0.4% | |||
| Danaher Corp. | 21,400 | 5,495,520 | |
| Thermo Fisher Scientific, Inc. | 1,100 | 624,778 | |
| 6,120,298 | |||
| Pharmaceuticals - 3.5% | |||
| Bristol-Myers Squibb Co. | 223,717 | 9,192,532 | |
| Eli Lilly & Co. | 14,400 | 11,812,896 | |
| Galderma Group AG | 19,300 | 1,574,978 | |
| GSK PLC sponsored ADR | 227,530 | 10,186,518 | |
| Johnson & Johnson | 53,287 | 7,815,604 | |
| UCB SA | 57,400 | 8,051,542 | |
| 48,634,070 | |||
TOTAL HEALTH CARE | 160,059,564 | ||
| INDUSTRIALS - 16.2% | |||
| Aerospace & Defense - 9.8% | |||
| Airbus Group NV | 35,600 | 6,055,625 | |
| Bombardier, Inc. Class B (sub. vtg.) (b) | 38,300 | 2,578,249 | |
| Embraer SA sponsored ADR (b) | 98,000 | 2,723,420 | |
| General Dynamics Corp. | 15,129 | 4,535,220 | |
| General Electric Co. (d) | 465,413 | 76,858,303 | |
| Huntington Ingalls Industries, Inc. | 11,519 | 2,915,459 | |
| Loar Holdings, Inc. (b) | 1,300 | 74,061 | |
| Rolls-Royce Holdings PLC (b) | 197,200 | 1,151,819 | |
| Safran SA | 1,900 | 444,990 | |
| Spirit AeroSystems Holdings, Inc. Class A (b) | 149,900 | 4,544,968 | |
| Textron, Inc. | 12,100 | 1,060,081 | |
| The Boeing Co. (b) | 188,267 | 33,438,102 | |
| 136,380,297 | |||
| Air Freight & Logistics - 1.4% | |||
| FedEx Corp. | 21,892 | 5,559,692 | |
| United Parcel Service, Inc. Class B | 98,763 | 13,721,144 | |
| 19,280,836 | |||
| Commercial Services & Supplies - 0.2% | |||
| ACV Auctions, Inc. Class A (b) | 79,300 | 1,415,505 | |
| GFL Environmental, Inc. | 29,200 | 919,309 | |
| Veralto Corp. | 7,633 | 752,461 | |
| 3,087,275 | |||
| Construction & Engineering - 0.0% | |||
| Centuri Holdings, Inc. | 5,300 | 145,485 | |
| Electrical Equipment - 3.3% | |||
| Acuity Brands, Inc. | 9,856 | 2,558,716 | |
| GE Vernova LLC | 130,953 | 23,034,633 | |
| Hubbell, Inc. Class B (d) | 10,985 | 4,271,957 | |
| Regal Rexnord Corp. | 23,300 | 3,484,282 | |
| Vertiv Holdings Co. | 121,900 | 11,954,733 | |
| 45,304,321 | |||
| Ground Transportation - 0.3% | |||
| Knight-Swift Transportation Holdings, Inc. Class A | 83,058 | 4,007,549 | |
| Machinery - 0.9% | |||
| Allison Transmission Holdings, Inc. | 19,500 | 1,478,295 | |
| Chart Industries, Inc. (b) | 12,000 | 1,884,360 | |
| Cummins, Inc. | 7,000 | 1,972,110 | |
| Deere & Co. | 1,900 | 712,044 | |
| Fortive Corp. | 30,400 | 2,262,976 | |
| Nordson Corp. | 1,500 | 352,080 | |
| Otis Worldwide Corp. | 19,696 | 1,953,843 | |
| Stanley Black & Decker, Inc. | 10,800 | 941,436 | |
| Westinghouse Air Brake Tech Co. | 8,145 | 1,378,378 | |
| 12,935,522 | |||
| Passenger Airlines - 0.1% | |||
| Ryanair Holdings PLC sponsored ADR | 9,400 | 1,143,416 | |
| Professional Services - 0.1% | |||
| Equifax, Inc. | 4,200 | 971,838 | |
| Trading Companies & Distributors - 0.1% | |||
| Watsco, Inc. | 2,200 | 1,044,780 | |
TOTAL INDUSTRIALS | 224,301,319 | ||
| INFORMATION TECHNOLOGY - 21.2% | |||
| IT Services - 0.3% | |||
| EPAM Systems, Inc. (b) | 3,000 | 533,790 | |
| IBM Corp. | 12,200 | 2,035,570 | |
| Snowflake, Inc. (b) | 1,700 | 231,506 | |
| Twilio, Inc. Class A (b) | 23,200 | 1,331,680 | |
| 4,132,546 | |||
| Semiconductors & Semiconductor Equipment - 7.5% | |||
| Analog Devices, Inc. | 12,318 | 2,888,448 | |
| Applied Materials, Inc. | 22,316 | 4,799,725 | |
| BE Semiconductor Industries NV | 1,500 | 223,152 | |
| Broadcom, Inc. | 6,640 | 8,821,572 | |
| Lam Research Corp. | 4,400 | 4,102,736 | |
| Marvell Technology, Inc. | 148,301 | 10,204,592 | |
| NVIDIA Corp. | 54,530 | 59,782,875 | |
| Qualcomm, Inc. | 24,001 | 4,897,404 | |
| Taiwan Semiconductor Manufacturing Co. Ltd. sponsored ADR | 38,600 | 5,830,144 | |
| Teradyne, Inc. | 17,000 | 2,395,980 | |
| 103,946,628 | |||
| Software - 10.7% | |||
| Adobe, Inc. (b) | 21,800 | 9,695,768 | |
| Autodesk, Inc. (b) | 16,441 | 3,314,506 | |
| Dassault Systemes SA | 3,300 | 134,118 | |
| DoubleVerify Holdings, Inc. (b) | 16,500 | 300,300 | |
| Elastic NV (b) | 21,400 | 2,226,670 | |
| Intuit, Inc. | 6,700 | 3,862,148 | |
| Microsoft Corp. | 242,153 | 100,524,974 | |
| Oracle Corp. | 99,700 | 11,683,843 | |
| PTC, Inc. (b) | 8,600 | 1,515,664 | |
| Sage Group PLC | 100,100 | 1,314,870 | |
| Salesforce, Inc. | 4,800 | 1,125,312 | |
| SAP SE sponsored ADR | 69,817 | 12,737,413 | |
| Workday, Inc. Class A (b) | 3,300 | 697,785 | |
| 149,133,371 | |||
| Technology Hardware, Storage & Peripherals - 2.7% | |||
| Apple, Inc. | 186,368 | 35,829,248 | |
| Samsung Electronics Co. Ltd. | 22,520 | 1,194,705 | |
| 37,023,953 | |||
TOTAL INFORMATION TECHNOLOGY | 294,236,498 | ||
| MATERIALS - 2.0% | |||
| Chemicals - 0.2% | |||
| Air Products & Chemicals, Inc. | 9,400 | 2,506,980 | |
| Sherwin-Williams Co. | 2,100 | 637,980 | |
| 3,144,960 | |||
| Metals & Mining - 1.8% | |||
| First Quantum Minerals Ltd. | 946,700 | 12,162,381 | |
| Freeport-McMoRan, Inc. | 151,204 | 7,972,987 | |
| Ivanhoe Mines Ltd. (b) | 316,100 | 4,564,253 | |
| 24,699,621 | |||
TOTAL MATERIALS | 27,844,581 | ||
| REAL ESTATE - 0.8% | |||
| Equity Real Estate Investment Trusts (REITs) - 0.8% | |||
| American Tower Corp. | 19,209 | 3,759,970 | |
| Crown Castle, Inc. | 49,900 | 5,114,750 | |
| Equinix, Inc. | 442 | 337,237 | |
| Simon Property Group, Inc. | 11,700 | 1,770,327 | |
| Terreno Realty Corp. | 7,300 | 413,034 | |
| 11,395,318 | |||
| UTILITIES - 1.0% | |||
| Electric Utilities - 1.0% | |||
| Duke Energy Corp. | 5,400 | 559,278 | |
| Edison International | 11,400 | 876,090 | |
| Entergy Corp. | 8,900 | 1,001,161 | |
| Southern Co. | 147,000 | 11,780,580 | |
| 14,217,109 | |||
| TOTAL COMMON STOCKS (Cost $754,253,429) | 1,345,903,025 | ||
| Money Market Funds - 2.9% | |||
| Shares | Value ($) | ||
| Fidelity Cash Central Fund 5.39% (f) | 38,497,436 | 38,505,135 | |
| Fidelity Securities Lending Cash Central Fund 5.39% (f)(g) | 1,882,937 | 1,883,125 | |
| TOTAL MONEY MARKET FUNDS (Cost $40,388,260) | 40,388,260 | ||
| TOTAL INVESTMENT IN SECURITIES - 99.9% (Cost $794,641,689) | 1,386,291,285 |
NET OTHER ASSETS (LIABILITIES) - 0.1% | 898,290 |
| NET ASSETS - 100.0% | 1,387,189,575 |
| Written Options | ||||||
| Counterparty | Number of Contracts | Notional Amount ($) | Exercise Price ($) | Expiration Date | Value ($) | |
| Call Options | ||||||
| Exxon Mobil Corp. | Chicago Board Options Exchange | 200 | 2,345,200 | 130.00 | 07/19/24 | (5,800) |
| General Electric Co. | Chicago Board Options Exchange | 200 | 3,302,800 | 165.00 | 06/21/24 | (88,000) |
| General Electric Co. | Chicago Board Options Exchange | 200 | 3,302,800 | 170.00 | 06/21/24 | (45,400) |
| Hubbell, Inc. | Chicago Board Options Exchange | 58 | 2,255,562 | 470.00 | 09/20/24 | (22,620) |
| Meta Platforms, Inc. Class A | Chicago Board Options Exchange | 50 | 2,334,150 | 575.00 | 06/21/24 | (400) |
| TOTAL WRITTEN OPTIONS | (162,220) | |||||
| (a) | Security exempt from registration under Rule 144A of the Securities Act of 1933. These securities may be resold in transactions exempt from registration, normally to qualified institutional buyers. At the end of the period, the value of these securities amounted to $2,228,334 or 0.2% of net assets. |
| (b) | Non-income producing |
| (c) | Security or a portion of the security purchased on a delayed delivery or when-issued basis. |
| (d) | Security or a portion of the security is pledged as collateral for options written. At period end, the value of securities pledged amounted to $13,540,512. |
| (e) | Security or a portion of the security is on loan at period end. |
| (f) | Affiliated fund that is generally available only to investment companies and other accounts managed by Fidelity Investments. The rate quoted is the annualized seven-day yield of the fund at period end. A complete unaudited listing of the fund's holdings as of its most recent quarter end is available upon request. In addition, each Fidelity Central Fund's financial statements are available on the SEC's website or upon request. |
| (g) | Investment made with cash collateral received from securities on loan. |
| (h) | Equity security is subject to lock-up or market standoff agreement. Fair value is based on the unadjusted market price of the equivalent equity security. As of period end, the total fair value of unadjusted equity securities subject to contractual sale restrictions is $65,088 and all restrictions are set to expire on or before September 30, 2024. Under normal market conditions, there are no circumstances that could cause the restrictions to lapse. |
| Affiliate | Value, beginning of period ($) | Purchases ($) | Sales Proceeds ($) | Dividend Income ($) | Realized Gain (loss) ($) | Change in Unrealized appreciation (depreciation) ($) | Value, end of period ($) | % ownership, end of period |
| Fidelity Cash Central Fund 5.39% | 39,337,835 | 68,758,074 | 69,590,750 | 836,558 | (24) | - | 38,505,135 | 0.1% |
| Fidelity Securities Lending Cash Central Fund 5.39% | 6,522,831 | 34,917,468 | 39,557,174 | 11,535 | - | - | 1,883,125 | 0.0% |
| Total | 45,860,666 | 103,675,542 | 109,147,924 | 848,093 | (24) | - | 40,388,260 | |
| Valuation Inputs at Reporting Date: | ||||
| Description | Total ($) | Level 1 ($) | Level 2 ($) | Level 3 ($) |
Investments in Securities: | ||||
| Equities: | ||||
Communication Services | 139,038,270 | 130,379,806 | 8,658,464 | - |
Consumer Discretionary | 45,158,894 | 43,133,391 | 2,025,503 | - |
Consumer Staples | 68,906,078 | 68,381,942 | 524,136 | - |
Energy | 131,280,861 | 129,119,067 | 2,161,794 | - |
Financials | 229,464,533 | 226,640,136 | 2,824,397 | - |
Health Care | 160,059,564 | 150,433,044 | 9,626,520 | - |
Industrials | 224,301,319 | 216,648,885 | 7,652,434 | - |
Information Technology | 294,236,498 | 291,369,653 | 2,866,845 | - |
Materials | 27,844,581 | 27,844,581 | - | - |
Real Estate | 11,395,318 | 11,395,318 | - | - |
Utilities | 14,217,109 | 14,217,109 | - | - |
| Money Market Funds | 40,388,260 | 40,388,260 | - | - |
| Total Investments in Securities: | 1,386,291,285 | 1,349,951,192 | 36,340,093 | - |
Derivative Instruments: Liabilities | ||||
Written Options | (162,220) | (162,220) | - | - |
| Total Liabilities | (162,220) | (162,220) | - | - |
| Total Derivative Instruments: | (162,220) | (162,220) | - | - |
Primary Risk Exposure / Derivative Type | Value | |
| Asset ($) | Liability ($) | |
| Equity Risk | ||
Written Options (a) | 0 | (162,220) |
| Total Equity Risk | 0 | (162,220) |
| Total Value of Derivatives | 0 | (162,220) |
| Statement of Assets and Liabilities | ||||
May 31, 2024 (Unaudited) | ||||
| Assets | ||||
| Investment in securities, at value (including securities loaned of $1,837,930) - See accompanying schedule: | ||||
Unaffiliated issuers (cost $754,253,429) | $ | 1,345,903,025 | ||
Fidelity Central Funds (cost $40,388,260) | 40,388,260 | |||
| Total Investment in Securities (cost $794,641,689) | $ | 1,386,291,285 | ||
| Foreign currency held at value (cost $2) | 2 | |||
| Receivable for investments sold | 2,193,105 | |||
| Receivable for fund shares sold | 409,937 | |||
| Dividends receivable | 2,360,437 | |||
| Distributions receivable from Fidelity Central Funds | 153,023 | |||
| Prepaid expenses | 190 | |||
| Other receivables | 3 | |||
Total assets | 1,391,407,982 | |||
| Liabilities | ||||
| Payable to custodian bank | $ | 1,280 | ||
| Payable for investments purchased | ||||
Regular delivery | 290,113 | |||
Delayed delivery | 60,448 | |||
| Payable for fund shares redeemed | 579,375 | |||
| Accrued management fee | 858,756 | |||
| Distribution and service plan fees payable | 302,788 | |||
| Written options, at value (premium received $449,350) | 162,220 | |||
| Other payables and accrued expenses | 80,302 | |||
| Collateral on securities loaned | 1,883,125 | |||
| Total liabilities | 4,218,407 | |||
| Net Assets | $ | 1,387,189,575 | ||
| Net Assets consist of: | ||||
| Paid in capital | $ | 741,558,762 | ||
| Total accumulated earnings (loss) | 645,630,813 | |||
| Net Assets | $ | 1,387,189,575 | ||
| Net Asset Value and Maximum Offering Price | ||||
| Class A : | ||||
Net Asset Value and redemption price per share ($727,472,885 ÷ 15,821,247 shares)(a) | $ | 45.98 | ||
| Maximum offering price per share (100/94.25 of $45.98) | $ | 48.79 | ||
| Class M : | ||||
Net Asset Value and redemption price per share ($195,336,027 ÷ 4,258,037 shares)(a) | $ | 45.87 | ||
| Maximum offering price per share (100/96.50 of $45.87) | $ | 47.53 | ||
| Class C : | ||||
Net Asset Value and offering price per share ($86,494,297 ÷ 2,189,754 shares)(a) | $ | 39.50 | ||
| Class I : | ||||
Net Asset Value, offering price and redemption price per share ($304,291,990 ÷ 6,163,871 shares) | $ | 49.37 | ||
| Class Z : | ||||
Net Asset Value, offering price and redemption price per share ($73,594,376 ÷ 1,492,700 shares) | $ | 49.30 | ||
(a)Redemption price per share is equal to net asset value less any applicable contingent deferred sales charge. | ||||
| Statement of Operations | ||||
Six months ended May 31, 2024 (Unaudited) | ||||
| Investment Income | ||||
| Dividends | $ | 9,770,305 | ||
| Income from Fidelity Central Funds (including $11,535 from security lending) | 848,093 | |||
| Total income | 10,618,398 | |||
| Expenses | ||||
| Management fee | ||||
| Basic fee | $ | 3,872,939 | ||
| Performance adjustment | 682,206 | |||
| Transfer agent fees | 504,410 | |||
| Distribution and service plan fees | 1,717,723 | |||
| Accounting fees | 88,233 | |||
| Custodian fees and expenses | 41,333 | |||
| Independent trustees' fees and expenses | 2,791 | |||
| Registration fees | 52,179 | |||
| Audit | 30,878 | |||
| Legal | 1,484 | |||
| Miscellaneous | 12,409 | |||
| Total expenses before reductions | 7,006,585 | |||
| Expense reductions | (55,049) | |||
| Total expenses after reductions | 6,951,536 | |||
| Net Investment income (loss) | 3,666,862 | |||
| Realized and Unrealized Gain (Loss) | ||||
| Net realized gain (loss) on: | ||||
| Investment Securities: | ||||
| Unaffiliated issuers | 52,207,799 | |||
| Fidelity Central Funds | (24) | |||
| Foreign currency transactions | (9,377) | |||
| Total net realized gain (loss) | 52,198,398 | |||
| Change in net unrealized appreciation (depreciation) on: | ||||
| Investment Securities: | ||||
| Unaffiliated issuers | 174,545,674 | |||
| Assets and liabilities in foreign currencies | (237) | |||
| Written options | 287,130 | |||
| Total change in net unrealized appreciation (depreciation) | 174,832,567 | |||
| Net gain (loss) | 227,030,965 | |||
| Net increase (decrease) in net assets resulting from operations | $ | 230,697,827 | ||
| Statement of Changes in Net Assets | ||||
Six months ended May 31, 2024 (Unaudited) | Year ended November 30, 2023 | |||
| Increase (Decrease) in Net Assets | ||||
| Operations | ||||
| Net investment income (loss) | $ | 3,666,862 | $ | 8,777,990 |
| Net realized gain (loss) | 52,198,398 | 34,462,467 | ||
| Change in net unrealized appreciation (depreciation) | 174,832,567 | 78,344,609 | ||
| Net increase (decrease) in net assets resulting from operations | 230,697,827 | 121,585,066 | ||
| Distributions to shareholders | (39,993,055) | (21,109,328) | ||
| Share transactions - net increase (decrease) | 18,489,207 | 27,953,133 | ||
| Total increase (decrease) in net assets | 209,193,979 | 128,428,871 | ||
| Net Assets | ||||
| Beginning of period | 1,177,995,596 | 1,049,566,725 | ||
| End of period | $ | 1,387,189,575 | $ | 1,177,995,596 |
Fidelity Advisor® Large Cap Fund Class A |
Six months ended (Unaudited) May 31, 2024 | Years ended November 30, 2023 | 2022 | 2021 | 2020 | 2019 | |||||||
Selected Per-Share Data | ||||||||||||
| Net asset value, beginning of period | $ | 39.63 | $ | 36.29 | $ | 38.14 | $ | 31.98 | $ | 32.80 | $ | 33.76 |
| Income from Investment Operations | ||||||||||||
Net investment income (loss) A,B | .12 | .30 | .38 | .62 C | .50 | .51 | ||||||
| Net realized and unrealized gain (loss) | 7.62 | 3.79 | .28 | 7.29 | 1.36 | 2.97 | ||||||
| Total from investment operations | 7.74 | 4.09 | .66 | 7.91 | 1.86 | 3.48 | ||||||
| Distributions from net investment income | (.30) | (.38) | (.61) | (.57) | (.60) | (.45) | ||||||
| Distributions from net realized gain | (1.09) | (.37) | (1.90) | (1.18) | (2.08) | (3.99) | ||||||
| Total distributions | (1.39) | (.75) | (2.51) | (1.75) | (2.68) | (4.44) | ||||||
| Net asset value, end of period | $ | 45.98 | $ | 39.63 | $ | 36.29 | $ | 38.14 | $ | 31.98 | $ | 32.80 |
Total Return D,E,F | 20.02 % | 11.62% | 1.49% | 25.87% | 5.91% | 14.19% | ||||||
Ratios to Average Net Assets B,G,H | ||||||||||||
| Expenses before reductions | 1.08% I | 1.16% | .92% | .80% | .75% | .91% | ||||||
| Expenses net of fee waivers, if any | 1.07 % I | 1.15% | .91% | .80% | .75% | .91% | ||||||
| Expenses net of all reductions | 1.07% I | 1.15% | .91% | .80% | .75% | .90% | ||||||
| Net investment income (loss) | .58% I | .82% | 1.07% | 1.67% C | 1.76% | 1.71% | ||||||
| Supplemental Data | ||||||||||||
| Net assets, end of period (000 omitted) | $ | 727,473 | $ | 608,811 | $ | 532,911 | $ | 468,894 | $ | 389,143 | $ | 423,325 |
Portfolio turnover rate J | 22 % I | 13% | 11% | 17% | 22% | 28% K |
Fidelity Advisor® Large Cap Fund Class M |
Six months ended (Unaudited) May 31, 2024 | Years ended November 30, 2023 | 2022 | 2021 | 2020 | 2019 | |||||||
Selected Per-Share Data | ||||||||||||
| Net asset value, beginning of period | $ | 39.49 | $ | 36.14 | $ | 37.99 | $ | 31.86 | $ | 32.69 | $ | 33.63 |
| Income from Investment Operations | ||||||||||||
Net investment income (loss) A,B | .07 | .21 | .29 | .52 C | .42 | .43 | ||||||
| Net realized and unrealized gain (loss) | 7.59 | 3.78 | .27 | 7.28 | 1.35 | 2.98 | ||||||
| Total from investment operations | 7.66 | 3.99 | .56 | 7.80 | 1.77 | 3.41 | ||||||
| Distributions from net investment income | (.19) | (.27) | (.52) | (.49) | (.52) | (.36) | ||||||
| Distributions from net realized gain | (1.09) | (.37) | (1.90) | (1.18) | (2.08) | (3.99) | ||||||
| Total distributions | (1.28) | (.64) | (2.41) D | (1.67) | (2.60) | (4.35) | ||||||
| Net asset value, end of period | $ | 45.87 | $ | 39.49 | $ | 36.14 | $ | 37.99 | $ | 31.86 | $ | 32.69 |
Total Return E,F,G | 19.86 % | 11.36% | 1.23% | 25.55% | 5.62% | 13.93% | ||||||
Ratios to Average Net Assets B,H,I | ||||||||||||
| Expenses before reductions | 1.33% J | 1.41% | 1.17% | 1.05% | 1.01% | 1.17% | ||||||
| Expenses net of fee waivers, if any | 1.32 % J | 1.40% | 1.16% | 1.05% | 1.01% | 1.16% | ||||||
| Expenses net of all reductions | 1.32% J | 1.40% | 1.16% | 1.05% | 1.00% | 1.16% | ||||||
| Net investment income (loss) | .34% J | .58% | .83% | 1.42% C | 1.50% | 1.46% | ||||||
| Supplemental Data | ||||||||||||
| Net assets, end of period (000 omitted) | $ | 195,336 | $ | 169,910 | $ | 166,368 | $ | 176,983 | $ | 153,918 | $ | 175,139 |
Portfolio turnover rate K | 22 % J | 13% | 11% | 17% | 22% | 28% L |
Fidelity Advisor® Large Cap Fund Class C |
Six months ended (Unaudited) May 31, 2024 | Years ended November 30, 2023 | 2022 | 2021 | 2020 | 2019 | |||||||
Selected Per-Share Data | ||||||||||||
| Net asset value, beginning of period | $ | 34.11 | $ | 31.34 | $ | 33.25 | $ | 28.08 | $ | 29.09 | $ | 30.44 |
| Income from Investment Operations | ||||||||||||
Net investment income (loss) A,B | (.03) | .02 | .09 | .29 C | .25 | .25 | ||||||
| Net realized and unrealized gain (loss) | 6.55 | 3.27 | .24 | 6.40 | 1.18 | 2.60 | ||||||
| Total from investment operations | 6.52 | 3.29 | .33 | 6.69 | 1.43 | 2.85 | ||||||
| Distributions from net investment income | (.04) | (.15) | (.34) | (.34) | (.36) | (.21) | ||||||
| Distributions from net realized gain | (1.09) | (.37) | (1.90) | (1.18) | (2.08) | (3.99) | ||||||
| Total distributions | (1.13) | (.52) | (2.24) | (1.52) | (2.44) | (4.20) | ||||||
| Net asset value, end of period | $ | 39.50 | $ | 34.11 | $ | 31.34 | $ | 33.25 | $ | 28.08 | $ | 29.09 |
Total Return D,E,F | 19.58 % | 10.77% | .70% | 24.90% | 5.10% | 13.33% | ||||||
Ratios to Average Net Assets B,G,H | ||||||||||||
| Expenses before reductions | 1.85% I | 1.93% | 1.69% | 1.57% | 1.53% | 1.67% | ||||||
| Expenses net of fee waivers, if any | 1.84 % I | 1.93% | 1.68% | 1.57% | 1.52% | 1.67% | ||||||
| Expenses net of all reductions | 1.84% I | 1.93% | 1.68% | 1.57% | 1.52% | 1.67% | ||||||
| Net investment income (loss) | (.18)% I | .05% | .30% | .90% C | .98% | .95% | ||||||
| Supplemental Data | ||||||||||||
| Net assets, end of period (000 omitted) | $ | 86,494 | $ | 78,499 | $ | 81,509 | $ | 89,886 | $ | 88,926 | $ | 119,072 |
Portfolio turnover rate J | 22 % I | 13% | 11% | 17% | 22% | 28% K |
Fidelity Advisor® Large Cap Fund Class I |
Six months ended (Unaudited) May 31, 2024 | Years ended November 30, 2023 | 2022 | 2021 | 2020 | 2019 | |||||||
Selected Per-Share Data | ||||||||||||
| Net asset value, beginning of period | $ | 42.48 | $ | 38.83 | $ | 40.63 | $ | 33.94 | $ | 34.63 | $ | 35.37 |
| Income from Investment Operations | ||||||||||||
Net investment income (loss) A,B | .19 | .43 | .51 | .76 C | .61 | .62 | ||||||
| Net realized and unrealized gain (loss) | 8.18 | 4.04 | .30 | 7.76 | 1.44 | 3.17 | ||||||
| Total from investment operations | 8.37 | 4.47 | .81 | 8.52 | 2.05 | 3.79 | ||||||
| Distributions from net investment income | (.39) | (.45) | (.71) | (.64) | (.66) | (.54) | ||||||
| Distributions from net realized gain | (1.09) | (.37) | (1.90) | (1.18) | (2.08) | (3.99) | ||||||
| Total distributions | (1.48) | (.82) | (2.61) | (1.83) D | (2.74) | (4.53) | ||||||
| Net asset value, end of period | $ | 49.37 | $ | 42.48 | $ | 38.83 | $ | 40.63 | $ | 33.94 | $ | 34.63 |
Total Return E,F | 20.19 % | 11.90% | 1.77% | 26.22% | 6.17% | 14.54% | ||||||
Ratios to Average Net Assets B,G,H | ||||||||||||
| Expenses before reductions | .82% I | .90% | .65% | .54% | .48% | .64% | ||||||
| Expenses net of fee waivers, if any | .82 % I | .89% | .65% | .54% | .48% | .64% | ||||||
| Expenses net of all reductions | .82% I | .89% | .65% | .54% | .48% | .64% | ||||||
| Net investment income (loss) | .84% I | 1.08% | 1.34% | 1.93% C | 2.03% | 1.98% | ||||||
| Supplemental Data | ||||||||||||
| Net assets, end of period (000 omitted) | $ | 304,292 | $ | 263,769 | $ | 224,889 | $ | 257,331 | $ | 206,090 | $ | 301,067 |
Portfolio turnover rate J | 22 % I | 13% | 11% | 17% | 22% | 28% K |
Fidelity Advisor® Large Cap Fund Class Z |
Six months ended (Unaudited) May 31, 2024 | Years ended November 30, 2023 | 2022 | 2021 | 2020 | 2019 | |||||||
Selected Per-Share Data | ||||||||||||
| Net asset value, beginning of period | $ | 42.46 | $ | 38.81 | $ | 40.61 | $ | 33.93 | $ | 34.64 | $ | 35.41 |
| Income from Investment Operations | ||||||||||||
Net investment income (loss) A,B | .22 | .48 | .55 | .81 C | .64 | .66 | ||||||
| Net realized and unrealized gain (loss) | 8.15 | 4.04 | .30 | 7.74 | 1.45 | 3.16 | ||||||
| Total from investment operations | 8.37 | 4.52 | .85 | 8.55 | 2.09 | 3.82 | ||||||
| Distributions from net investment income | (.44) | (.50) | (.76) | (.69) | (.72) | (.60) | ||||||
| Distributions from net realized gain | (1.09) | (.37) | (1.90) | (1.18) | (2.08) | (3.99) | ||||||
| Total distributions | (1.53) | (.87) | (2.65) D | (1.87) | (2.80) | (4.59) | ||||||
| Net asset value, end of period | $ | 49.30 | $ | 42.46 | $ | 38.81 | $ | 40.61 | $ | 33.93 | $ | 34.64 |
Total Return E,F | 20.23 % | 12.06% | 1.88% | 26.36% | 6.30% | 14.67% | ||||||
Ratios to Average Net Assets B,G,H | ||||||||||||
| Expenses before reductions | .71% I | .78% | .53% | .42% | .36% | .51% | ||||||
| Expenses net of fee waivers, if any | .70 % I | .77% | .53% | .42% | .36% | .51% | ||||||
| Expenses net of all reductions | .70% I | .77% | .53% | .42% | .36% | .51% | ||||||
| Net investment income (loss) | .96% I | 1.20% | 1.46% | 2.05% C | 2.15% | 2.11% | ||||||
| Supplemental Data | ||||||||||||
| Net assets, end of period (000 omitted) | $ | 73,594 | $ | 57,007 | $ | 43,889 | $ | 39,055 | $ | 30,308 | $ | 28,596 |
Portfolio turnover rate J | 22 % I | 13% | 11% | 17% | 22% | 28% K |
| Fidelity Central Fund | Investment Manager | Investment Objective | Investment Practices | Expense RatioA |
| Fidelity Money Market Central Funds | Fidelity Management & Research Company LLC (FMR) | Each fund seeks to obtain a high level of current income consistent with the preservation of capital and liquidity. | Short-term Investments | Less than .005% |
| Gross unrealized appreciation | $623,394,915 |
| Gross unrealized depreciation | (32,533,468) |
| Net unrealized appreciation (depreciation) | $590,861,447 |
| Tax cost | $795,716,968 |
| Equity Risk | Equity risk relates to the fluctuations in the value of financial instruments as a result of changes in market prices (other than those arising from interest rate risk or foreign exchange risk), whether caused by factors specific to an individual investment, its issuer, or all factors affecting all instruments traded in a market or market segment. |
| Purchases ($) | Sales ($) | |
| Fidelity Advisor Large Cap Fund | 134,740,067 | 151,684,154 |
| Maximum Management Fee Rate % | |
| Class A | .69 |
| Class M | .69 |
| Class C | .71 |
| Class I | .68 |
| Class Z | .56 |
| Total Management Fee Rate % | |
| Class A | .69 |
| Class M | .69 |
| Class C | .71 |
| Class I | .68 |
| Class Z | .56 |
| Performance Adjustment Index | |
| Fidelity Advisor Large Cap Fund | S&P 500 Index |
| Distribution Fee | Service Fee | Total Fees ($) | Retained by FDC ($) | |
| Class A | - % | .25% | 841,170 | 17,468 |
| Class M | .25% | .25% | 459,001 | 676 |
| Class C | .75% | .25% | 417,552 | 55,105 |
| 1,717,723 | 73,249 |
| Retained by FDC ($) | |
| Class A | 132,178 |
| Class M | 5,184 |
Class CA | 746 |
138,108 |
| % of Class-Level Average Net Assets | |
| Class A | .1712 |
| Class M | .1691 |
| Class C | .1911 |
| Class I | .1622 |
| Amount ($) | % of Class-Level Average Net Assets | |
| Class A | 276,783 | .17 |
| Class M | 75,037 | .17 |
| Class C | 39,175 | .19 |
| Class I | 107,077 | .16 |
| Class Z | 6,338 | .04 |
504,410 |
| % of Average Net Assets | |
| Fidelity Advisor Large Cap Fund | .0289 |
| % of Average Net Assets | |
| Fidelity Advisor Large Cap Fund | .03 |
| Amount ($) | |
| Fidelity Advisor Large Cap Fund | 2,005 |
| Purchases ($) | Sales ($) | Realized Gain (Loss)($) | |
| Fidelity Advisor Large Cap Fund | 9,676,747 | 6,741,475 | 1,816,142 |
| Amount ($) | |
| Fidelity Advisor Large Cap Fund | 1,143 |
| Total Security Lending Fees Paid to NFS ($) | Security Lending Income From Securities Loaned to NFS ($) | Value of Securities Loaned to NFS at Period End ($) | |
| Fidelity Advisor Large Cap Fund | 1,216 | - | - |
| Expense reduction ($) | |
| Class M | 28 |
Six months ended May 31, 2024 | Year ended November 30, 2023 | |
| Fidelity Advisor Large Cap Fund | ||
| Distributions to shareholders | ||
| Class A | $21,321,625 | $10,995,838 |
| Class M | 5,472,128 | 2,923,336 |
| Class C | 2,581,326 | 1,372,106 |
| Class I | 8,557,886 | 4,801,903 |
| Class Z | 2,060,090 | 1,016,145 |
Total | $39,993,055 | $21,109,328 |
| Shares | Shares | Dollars | Dollars | |
Six months ended May 31, 2024 | Year ended November 30, 2023 | Six months ended May 31, 2024 | Year ended November 30, 2023 | |
| Fidelity Advisor Large Cap Fund | ||||
| Class A | ||||
| Shares sold | 1,242,598 | 2,807,564 | $52,994,310 | $103,049,397 |
| Reinvestment of distributions | 499,997 | 303,648 | 20,119,880 | 10,211,667 |
| Shares redeemed | (1,282,834) | (2,434,322) | (54,422,615) | (88,871,917) |
| Net increase (decrease) | 459,761 | 676,890 | $18,691,575 | $24,389,147 |
| Class M | ||||
| Shares sold | 172,452 | 342,729 | $7,337,138 | $12,674,254 |
| Reinvestment of distributions | 134,296 | 85,769 | 5,397,348 | 2,880,972 |
| Shares redeemed | (351,133) | (728,972) | (14,756,263) | (26,964,973) |
| Net increase (decrease) | (44,385) | (300,474) | $(2,021,777) | $(11,409,747) |
| Class C | ||||
| Shares sold | 221,953 | 556,640 | $8,172,155 | $17,464,429 |
| Reinvestment of distributions | 70,788 | 44,771 | 2,454,927 | 1,305,531 |
| Shares redeemed | (404,026) | (900,797) | (14,826,189) | (28,576,810) |
| Net increase (decrease) | (111,285) | (299,386) | $(4,199,107) | $(9,806,850) |
| Class I | ||||
| Shares sold | 994,273 | 1,808,651 | $45,921,637 | $71,353,892 |
| Reinvestment of distributions | 160,194 | 111,978 | 6,912,377 | 4,027,848 |
| Shares redeemed | (1,199,129) | (1,504,177) | (53,799,031) | (59,011,039) |
| Net increase (decrease) | (44,662) | 416,452 | $(965,017) | $16,370,701 |
| Class Z | ||||
| Shares sold | 303,971 | 456,929 | $14,184,078 | $18,091,935 |
| Reinvestment of distributions | 44,052 | 25,887 | 1,897,330 | 929,329 |
| Shares redeemed | (198,042) | (271,001) | (9,097,875) | (10,611,382) |
| Net increase (decrease) | 149,981 | 211,815 | $6,983,533 | $8,409,882 |
 |


Contents
| Common Stocks - 98.4% | |||
| Shares | Value ($) (000s) | ||
| COMMUNICATION SERVICES - 11.2% | |||
| Entertainment - 4.7% | |||
| Live Nation Entertainment, Inc. (a) | 298,200 | 27,953 | |
| Netflix, Inc. (a) | 321,107 | 206,029 | |
| Universal Music Group NV | 5,688,584 | 177,277 | |
| Universal Music Group NV rights (a)(b) | 5,688,584 | 1,667 | |
| Warner Music Group Corp. Class A | 2,032,571 | 60,530 | |
| 473,456 | |||
| Interactive Media & Services - 6.5% | |||
| Alphabet, Inc. Class A | 2,869,774 | 495,036 | |
| Epic Games, Inc. (a)(c)(d) | 3,289 | 1,973 | |
| Meta Platforms, Inc. Class A | 314,417 | 146,779 | |
| 643,788 | |||
TOTAL COMMUNICATION SERVICES | 1,117,244 | ||
| CONSUMER DISCRETIONARY - 9.1% | |||
| Automobile Components - 0.1% | |||
| Mobileye Global, Inc. Class A (a)(e) | 324,600 | 8,329 | |
| Automobiles - 0.3% | |||
| BYD Co. Ltd. (H Shares) | 1,040,457 | 29,194 | |
| Broadline Retail - 6.2% | |||
| Amazon.com, Inc. (a) | 2,675,237 | 472,019 | |
| MercadoLibre, Inc. (a) | 54,528 | 94,092 | |
| PDD Holdings, Inc. ADR (a) | 327,209 | 49,009 | |
| Savers Value Village, Inc. (e) | 714,059 | 9,683 | |
| 624,803 | |||
| Diversified Consumer Services - 0.1% | |||
| Duolingo, Inc. (a) | 55,300 | 10,584 | |
| Hotels, Restaurants & Leisure - 1.9% | |||
| Airbnb, Inc. Class A (a) | 802,493 | 116,305 | |
| Domino's Pizza, Inc. | 113,100 | 57,520 | |
| Kura Sushi U.S.A., Inc. Class A (a)(e) | 117,348 | 11,724 | |
| Trip.com Group Ltd. ADR (a) | 178,500 | 9,195 | |
| 194,744 | |||
| Household Durables - 0.1% | |||
| Blu Investments LLC (a)(c)(d) | 12,123,162 | 4 | |
| TopBuild Corp. (a) | 12,400 | 5,183 | |
| 5,187 | |||
| Textiles, Apparel & Luxury Goods - 0.4% | |||
| LVMH Moet Hennessy Louis Vuitton SE | 44,854 | 35,872 | |
TOTAL CONSUMER DISCRETIONARY | 908,713 | ||
| CONSUMER STAPLES - 0.7% | |||
| Beverages - 0.6% | |||
| Monster Beverage Corp. (a) | 1,240,602 | 64,412 | |
| Personal Care Products - 0.1% | |||
| Puig Brands SA Class B | 176,100 | 4,993 | |
TOTAL CONSUMER STAPLES | 69,405 | ||
| ENERGY - 2.4% | |||
| Oil, Gas & Consumable Fuels - 2.4% | |||
| Canadian Natural Resources Ltd. | 241,500 | 18,554 | |
| Cheniere Energy, Inc. | 507,142 | 80,022 | |
| Range Resources Corp. | 1,424,309 | 52,571 | |
| Reliance Industries Ltd. | 2,688,705 | 92,163 | |
| 243,310 | |||
| FINANCIALS - 6.2% | |||
| Capital Markets - 0.4% | |||
| Ares Management Corp. Class A, | 148,899 | 20,871 | |
| LPL Financial | 37,700 | 10,790 | |
| Morgan Stanley | 49,400 | 4,833 | |
| MSCI, Inc. | 8,900 | 4,407 | |
| 40,901 | |||
| Consumer Finance - 0.4% | |||
| Capital One Financial Corp. | 314,200 | 43,243 | |
| Financial Services - 4.4% | |||
| Apollo Global Management, Inc. | 77,989 | 9,059 | |
| Corebridge Financial, Inc. | 812,105 | 23,689 | |
| Fiserv, Inc. (a) | 127,828 | 19,144 | |
| Global Payments, Inc. | 463,262 | 47,183 | |
| MasterCard, Inc. Class A | 371,966 | 166,295 | |
| Rocket Companies, Inc. (a)(e) | 1,284,641 | 17,857 | |
| Visa, Inc. Class A | 583,300 | 158,926 | |
| 442,153 | |||
| Insurance - 1.0% | |||
| Arthur J. Gallagher & Co. | 284,452 | 72,060 | |
| The Baldwin Insurance Group, Inc. Class A, (a) | 686,621 | 23,125 | |
| 95,185 | |||
TOTAL FINANCIALS | 621,482 | ||
| HEALTH CARE - 14.4% | |||
| Biotechnology - 3.6% | |||
| Adamas Pharmaceuticals, Inc.: | |||
| rights (a)(d) | 1,000,100 | 220 | |
| rights (a)(d) | 1,000,100 | 70 | |
| Alnylam Pharmaceuticals, Inc. (a) | 290,227 | 43,078 | |
| Arcellx, Inc. (a) | 61,713 | 3,209 | |
| Arrowhead Pharmaceuticals, Inc. (a) | 247,939 | 5,690 | |
| Beam Therapeutics, Inc. (a) | 74,295 | 1,770 | |
| BioNTech SE ADR (a) | 108,200 | 10,885 | |
| Blueprint Medicines Corp. (a) | 41,541 | 4,385 | |
| Cytokinetics, Inc. (a) | 210,481 | 10,210 | |
| Exact Sciences Corp. (a) | 932,500 | 42,382 | |
| Galapagos NV sponsored ADR (a) | 431,461 | 12,003 | |
| Gamida Cell Ltd. (d) | 1,892,438 | 0 | |
| Gamida Cell Ltd. warrants 4/21/28 (a)(d) | 353,699 | 0 | |
| Hookipa Pharma, Inc. (a) | 668,753 | 531 | |
| Immunocore Holdings PLC ADR (a) | 169,248 | 8,290 | |
| Insmed, Inc. (a) | 1,034,247 | 56,935 | |
| Janux Therapeutics, Inc. (a) | 21,500 | 1,150 | |
| Krystal Biotech, Inc. (a) | 33,271 | 5,325 | |
| Legend Biotech Corp. ADR (a) | 221,775 | 8,873 | |
| Moderna, Inc. (a) | 69,500 | 9,907 | |
| Regeneron Pharmaceuticals, Inc. (a) | 96,060 | 94,154 | |
| Repligen Corp. (a) | 178,261 | 26,577 | |
| Sarepta Therapeutics, Inc. (a) | 56,021 | 7,275 | |
| Seres Therapeutics, Inc. (a) | 234,668 | 235 | |
| Synlogic, Inc. (a) | 43,125 | 67 | |
| Vor Biopharma, Inc. (a) | 474,267 | 640 | |
| XOMA Corp. (a) | 290,689 | 7,497 | |
| 361,358 | |||
| Health Care Equipment & Supplies - 3.6% | |||
| Align Technology, Inc. (a) | 126,300 | 32,486 | |
| Boston Scientific Corp. (a) | 3,384,434 | 255,762 | |
| Glaukos Corp. (a) | 211,402 | 23,829 | |
| Hologic, Inc. (a) | 249,700 | 18,423 | |
| Inspire Medical Systems, Inc. (a) | 64,309 | 10,212 | |
| Lantheus Holdings, Inc. (a) | 93,767 | 7,673 | |
| Penumbra, Inc. (a) | 52,871 | 10,017 | |
| Pulmonx Corp. (a) | 196,800 | 1,427 | |
| RxSight, Inc. (a) | 53,800 | 3,146 | |
| 362,975 | |||
| Health Care Providers & Services - 0.9% | |||
| HealthEquity, Inc. (a) | 1,084,856 | 88,611 | |
| Life Sciences Tools & Services - 2.8% | |||
| Agilent Technologies, Inc. | 46,804 | 6,104 | |
| Bio-Techne Corp. | 253,195 | 19,544 | |
| Bruker Corp. | 1,038,887 | 68,057 | |
| Chemometec A/S | 120,373 | 6,411 | |
| Codexis, Inc. (a) | 1,123,114 | 3,796 | |
| Danaher Corp. | 314,212 | 80,690 | |
| MaxCyte, Inc. (a) | 1,127,055 | 5,049 | |
| Sartorius Stedim Biotech | 123,919 | 24,685 | |
| Thermo Fisher Scientific, Inc. | 119,814 | 68,052 | |
| 282,388 | |||
| Pharmaceuticals - 3.5% | |||
| Aclaris Therapeutics, Inc. (a) | 156,678 | 161 | |
| Chugai Pharmaceutical Co. Ltd. | 593,934 | 18,071 | |
| Eli Lilly & Co. | 326,326 | 267,698 | |
| Teva Pharmaceutical Industries Ltd. sponsored ADR (a) | 3,584,500 | 60,686 | |
| 346,616 | |||
TOTAL HEALTH CARE | 1,441,948 | ||
| INDUSTRIALS - 12.5% | |||
| Aerospace & Defense - 1.5% | |||
| General Electric Co. | 915,200 | 151,136 | |
| Loar Holdings, Inc. (a) | 9,400 | 536 | |
| 151,672 | |||
| Commercial Services & Supplies - 0.1% | |||
| Montrose Environmental Group, Inc. (a) | 82,100 | 3,860 | |
| Electrical Equipment - 2.1% | |||
| Eaton Corp. PLC | 367,285 | 122,251 | |
| GE Vernova LLC | 397,100 | 69,850 | |
| HD Hyundai Electric Co. Ltd. | 99,470 | 21,633 | |
| 213,734 | |||
| Ground Transportation - 3.7% | |||
| Uber Technologies, Inc. (a) | 5,791,369 | 373,891 | |
| Machinery - 1.5% | |||
| Chart Industries, Inc. (a) | 72,800 | 11,432 | |
| Energy Recovery, Inc. (a) | 287,293 | 3,878 | |
| Ingersoll Rand, Inc. | 1,115,395 | 103,788 | |
| Westinghouse Air Brake Tech Co. | 190,997 | 32,322 | |
| 151,420 | |||
| Professional Services - 2.7% | |||
| Equifax, Inc. | 507,513 | 117,433 | |
| KBR, Inc. | 1,276,825 | 83,836 | |
| RELX PLC sponsored ADR | 973,200 | 42,782 | |
| UL Solutions, Inc. Class A | 648,700 | 25,020 | |
| 269,071 | |||
| Trading Companies & Distributors - 0.9% | |||
| Ferguson PLC | 422,403 | 86,455 | |
TOTAL INDUSTRIALS | 1,250,103 | ||
| INFORMATION TECHNOLOGY - 41.8% | |||
| Electronic Equipment, Instruments & Components - 1.3% | |||
| Fabrinet (a) | 42,900 | 10,276 | |
| Flex Ltd. (a) | 2,117,381 | 70,149 | |
| Jabil, Inc. | 432,462 | 51,420 | |
| 131,845 | |||
| IT Services - 1.5% | |||
| Gartner, Inc. (a) | 82,739 | 34,723 | |
| MongoDB, Inc. Class A (a) | 509,507 | 120,274 | |
| 154,997 | |||
| Semiconductors & Semiconductor Equipment - 18.8% | |||
| Allegro MicroSystems LLC (a) | 1,460,269 | 44,013 | |
| ASML Holding NV (depository receipt) | 148,887 | 142,984 | |
| Astera Labs, Inc. | 17,400 | 1,123 | |
| BE Semiconductor Industries NV | 447,902 | 66,633 | |
| eMemory Technology, Inc. | 36,000 | 2,446 | |
| Marvell Technology, Inc. | 258,234 | 17,769 | |
| Micron Technology, Inc. | 1,010,700 | 126,338 | |
| NVIDIA Corp. | 933,642 | 1,023,580 | |
| NXP Semiconductors NV | 298,239 | 81,151 | |
| Qualcomm, Inc. | 343,600 | 70,112 | |
| SiTime Corp. (a) | 401,093 | 48,861 | |
| Taiwan Semiconductor Manufacturing Co. Ltd. sponsored ADR | 1,370,709 | 207,032 | |
| Universal Display Corp. | 273,851 | 48,116 | |
| 1,880,158 | |||
| Software - 15.1% | |||
| ASAPP, Inc. warrants 8/28/28 (a)(c)(d) | 2,071,818 | 3,916 | |
| Autodesk, Inc. (a) | 44,500 | 8,971 | |
| HubSpot, Inc. (a) | 159,706 | 97,588 | |
| Manhattan Associates, Inc. (a) | 259,239 | 56,913 | |
| Microsoft Corp. | 3,024,481 | 1,255,557 | |
| NICE Ltd. sponsored ADR (a) | 213,150 | 39,128 | |
| ServiceNow, Inc. (a) | 73,249 | 48,119 | |
| Volue A/S (a) | 1,205,893 | 3,880 | |
| 1,514,072 | |||
| Technology Hardware, Storage & Peripherals - 5.1% | |||
| Apple, Inc. | 2,648,519 | 509,178 | |
TOTAL INFORMATION TECHNOLOGY | 4,190,250 | ||
| MATERIALS - 0.1% | |||
| Chemicals - 0.1% | |||
| Aspen Aerogels, Inc. (a)(e) | 510,078 | 15,262 | |
| TOTAL COMMON STOCKS (Cost $5,908,974) | 9,857,717 | ||
| Convertible Preferred Stocks - 0.2% | |||
| Shares | Value ($) (000s) | ||
| CONSUMER DISCRETIONARY - 0.0% | |||
| Textiles, Apparel & Luxury Goods - 0.0% | |||
| Canva, Inc.: | |||
| Series A (c)(d) | 846 | 902 | |
| Series A2 (c)(d) | 154 | 164 | |
| 1,066 | |||
| FINANCIALS - 0.0% | |||
| Financial Services - 0.0% | |||
| Akeana Series C (c)(d) | 57,400 | 752 | |
| HEALTH CARE - 0.0% | |||
| Biotechnology - 0.0% | |||
| ElevateBio LLC Series C (a)(c)(d) | 111,100 | 340 | |
| INFORMATION TECHNOLOGY - 0.1% | |||
| Software - 0.1% | |||
| ASAPP, Inc.: | |||
| Series C (a)(c)(d) | 367,427 | 933 | |
| Series D (c)(d) | 3,611,038 | 8,125 | |
| 9,058 | |||
| MATERIALS - 0.1% | |||
| Metals & Mining - 0.1% | |||
| Illuminated Holdings, Inc.: | |||
| Series C2 (a)(c)(d) | 76,285 | 1,227 | |
| Series C3 (a)(c)(d) | 95,356 | 1,534 | |
| Series C4 (a)(c)(d) | 27,230 | 438 | |
| Series C5 (a)(c)(d) | 53,844 | 866 | |
| 4,065 | |||
| TOTAL CONVERTIBLE PREFERRED STOCKS (Cost $26,706) | 15,281 | ||
| Convertible Bonds - 0.0% | |||
Principal Amount (f) (000s) | Value ($) (000s) | ||
| MATERIALS - 0.0% | |||
| Metals & Mining - 0.0% | |||
Illuminated Holdings, Inc. 15% (c)(d)(g) (Cost $1,619) | 1,619 | 1,606 | |
| Preferred Securities - 0.0% | |||
Principal Amount (f) (000s) | Value ($) (000s) | ||
| MATERIALS - 0.0% | |||
| Metals & Mining - 0.0% | |||
Illuminated Holdings, Inc. 15% (c)(d)(g) (Cost $2,252) | 2,252 | 2,347 | |
| Money Market Funds - 1.4% | |||
| Shares | Value ($) (000s) | ||
| Fidelity Cash Central Fund 5.39% (h) | 103,407,803 | 103,428 | |
| Fidelity Securities Lending Cash Central Fund 5.39% (h)(i) | 32,022,192 | 32,025 | |
| TOTAL MONEY MARKET FUNDS (Cost $135,453) | 135,453 | ||
| TOTAL INVESTMENT IN SECURITIES - 100.0% (Cost $6,075,004) | 10,012,404 |
NET OTHER ASSETS (LIABILITIES) - 0.0% | 3,349 |
| NET ASSETS - 100.0% | 10,015,753 |
| (a) | Non-income producing |
| (b) | Security or a portion of the security purchased on a delayed delivery or when-issued basis. |
| (c) | Restricted securities (including private placements) - Investment in securities not registered under the Securities Act of 1933 (excluding 144A issues). At the end of the period, the value of restricted securities (excluding 144A issues) amounted to $25,127,000 or 0.3% of net assets. |
| (d) | Level 3 security |
| (e) | Security or a portion of the security is on loan at period end. |
| (f) | Amount is stated in United States dollars unless otherwise noted. |
| (g) | Security is perpetual in nature with no stated maturity date. |
| (h) | Affiliated fund that is generally available only to investment companies and other accounts managed by Fidelity Investments. The rate quoted is the annualized seven-day yield of the fund at period end. A complete unaudited listing of the fund's holdings as of its most recent quarter end is available upon request. In addition, each Fidelity Central Fund's financial statements are available on the SEC's website or upon request. |
| (i) | Investment made with cash collateral received from securities on loan. |
| Additional information on each restricted holding is as follows: | ||
| Security | Acquisition Date | Acquisition Cost ($) (000s) |
| Akeana Series C | 1/23/24 | 732 |
| ASAPP, Inc. warrants 8/28/28 | 8/29/23 | 0 |
| ASAPP, Inc. Series C | 4/30/21 | 2,424 |
| ASAPP, Inc. Series D | 8/29/23 | 13,944 |
| Blu Investments LLC | 5/21/20 | 21 |
| Canva, Inc. Series A | 9/22/23 | 902 |
| Canva, Inc. Series A2 | 9/22/23 | 164 |
| ElevateBio LLC Series C | 3/09/21 | 466 |
| Epic Games, Inc. | 3/29/21 | 2,911 |
| Illuminated Holdings, Inc. Series C2 | 7/07/20 | 1,907 |
| Illuminated Holdings, Inc. Series C3 | 7/07/20 | 2,861 |
| Illuminated Holdings, Inc. Series C4 | 1/08/21 | 980 |
| Illuminated Holdings, Inc. Series C5 | 6/16/21 | 2,326 |
| Illuminated Holdings, Inc. 15% | 6/14/23 | 1,619 |
| Illuminated Holdings, Inc. 15% | 9/27/23 | 2,252 |
| Affiliate (Amounts in thousands) | Value, beginning of period ($) | Purchases ($) | Sales Proceeds ($) | Dividend Income ($) | Realized Gain (loss) ($) | Change in Unrealized appreciation (depreciation) ($) | Value, end of period ($) | % ownership, end of period |
| Fidelity Cash Central Fund 5.39% | 91,729 | 909,456 | 897,757 | 4,343 | - | - | 103,428 | 0.2% |
| Fidelity Securities Lending Cash Central Fund 5.39% | 54,549 | 383,971 | 406,495 | 91 | - | - | 32,025 | 0.1% |
| Total | 146,278 | 1,293,427 | 1,304,252 | 4,434 | - | - | 135,453 | |
| Valuation Inputs at Reporting Date: | ||||
Description (Amounts in thousands) | Total ($) | Level 1 ($) | Level 2 ($) | Level 3 ($) |
Investments in Securities: | ||||
| Equities: | ||||
Communication Services | 1,117,244 | 937,994 | 177,277 | 1,973 |
Consumer Discretionary | 909,779 | 843,643 | 65,066 | 1,070 |
Consumer Staples | 69,405 | 64,412 | 4,993 | - |
Energy | 243,310 | 243,310 | - | - |
Financials | 622,234 | 621,482 | - | 752 |
Health Care | 1,442,288 | 1,392,491 | 49,167 | 630 |
Industrials | 1,250,103 | 1,142,015 | 108,088 | - |
Information Technology | 4,199,308 | 4,113,375 | 72,959 | 12,974 |
Materials | 19,327 | 15,262 | - | 4,065 |
| Corporate Bonds | 1,606 | - | - | 1,606 |
| Preferred Securities | 2,347 | - | - | 2,347 |
| Money Market Funds | 135,453 | 135,453 | - | - |
| Total Investments in Securities: | 10,012,404 | 9,509,437 | 477,550 | 25,417 |
| Statement of Assets and Liabilities | ||||
| Amounts in thousands (except per-share amounts) | May 31, 2024 (Unaudited) | |||
| Assets | ||||
| Investment in securities, at value (including securities loaned of $31,373) - See accompanying schedule: | ||||
Unaffiliated issuers (cost $5,939,551) | $ | 9,876,951 | ||
Fidelity Central Funds (cost $135,453) | 135,453 | |||
| Total Investment in Securities (cost $6,075,004) | $ | 10,012,404 | ||
| Foreign currency held at value (cost $1,063) | 1,063 | |||
| Receivable for investments sold | 34,840 | |||
| Receivable for fund shares sold | 11,847 | |||
| Dividends receivable | 6,679 | |||
| Interest receivable | 85 | |||
| Distributions receivable from Fidelity Central Funds | 365 | |||
| Prepaid expenses | 1 | |||
| Other receivables | 128 | |||
Total assets | 10,067,412 | |||
| Liabilities | ||||
| Payable for investments purchased | ||||
Regular delivery | $ | 3,769 | ||
Delayed delivery | 1,667 | |||
| Payable for fund shares redeemed | 3,672 | |||
| Accrued management fee | 5,226 | |||
| Distribution and service plan fees payable | 1,402 | |||
| Deferred taxes | 3,700 | |||
| Other payables and accrued expenses | 203 | |||
| Collateral on securities loaned | 32,020 | |||
| Total liabilities | 51,659 | |||
| Net Assets | $ | 10,015,753 | ||
| Net Assets consist of: | ||||
| Paid in capital | $ | 5,692,801 | ||
| Total accumulated earnings (loss) | 4,322,952 | |||
| Net Assets | $ | 10,015,753 | ||
| Net Asset Value and Maximum Offering Price | ||||
| Class A : | ||||
Net Asset Value and redemption price per share ($2,307,816 ÷ 115,828 shares)(a) | $ | 19.92 | ||
| Maximum offering price per share (100/94.25 of $19.92) | $ | 21.14 | ||
| Class M : | ||||
Net Asset Value and redemption price per share ($1,896,592 ÷ 99,002 shares)(a) | $ | 19.16 | ||
| Maximum offering price per share (100/96.50 of $19.16) | $ | 19.85 | ||
| Class C : | ||||
Net Asset Value and offering price per share ($170,197 ÷ 11,461 shares)(a) | $ | 14.85 | ||
| Class I : | ||||
Net Asset Value, offering price and redemption price per share ($3,048,559 ÷ 131,805 shares) | $ | 23.13 | ||
| Class Z : | ||||
Net Asset Value, offering price and redemption price per share ($2,592,589 ÷ 110,386 shares) | $ | 23.49 | ||
(a)Redemption price per share is equal to net asset value less any applicable contingent deferred sales charge. | ||||
| Statement of Operations | ||||
| Amounts in thousands | Six months ended May 31, 2024 (Unaudited) | |||
| Investment Income | ||||
| Dividends | $ | 24,555 | ||
| Interest | 85 | |||
| Income from Fidelity Central Funds (including $91 from security lending) | 4,434 | |||
| Total income | 29,074 | |||
| Expenses | ||||
| Management fee | $ | 26,417 | ||
| Transfer agent fees | 2,874 | |||
| Distribution and service plan fees | 7,923 | |||
| Accounting fees | 312 | |||
| Custodian fees and expenses | 96 | |||
| Independent trustees' fees and expenses | 19 | |||
| Registration fees | 119 | |||
| Audit | 40 | |||
| Legal | 4 | |||
| Miscellaneous | 52 | |||
| Total expenses before reductions | 37,856 | |||
| Expense reductions | (380) | |||
| Total expenses after reductions | 37,476 | |||
| Net Investment income (loss) | (8,402) | |||
| Realized and Unrealized Gain (Loss) | ||||
| Net realized gain (loss) on: | ||||
| Investment Securities: | ||||
| Unaffiliated issuers | 403,870 | |||
| Redemptions in-kind | 6,217 | |||
| Foreign currency transactions | 42 | |||
| Total net realized gain (loss) | 410,129 | |||
| Change in net unrealized appreciation (depreciation) on: | ||||
| Investment Securities: | ||||
| Unaffiliated issuers (net of increase in deferred foreign taxes of $1,553) | 1,355,532 | |||
| Assets and liabilities in foreign currencies | 20 | |||
| Total change in net unrealized appreciation (depreciation) | 1,355,552 | |||
| Net gain (loss) | 1,765,681 | |||
| Net increase (decrease) in net assets resulting from operations | $ | 1,757,279 | ||
| Statement of Changes in Net Assets | ||||
| Amount in thousands | Six months ended May 31, 2024 (Unaudited) | Year ended November 30, 2023 | ||
| Increase (Decrease) in Net Assets | ||||
| Operations | ||||
| Net investment income (loss) | $ | (8,402) | $ | (5,213) |
| Net realized gain (loss) | 410,129 | 58,197 | ||
| Change in net unrealized appreciation (depreciation) | 1,355,552 | 1,227,720 | ||
| Net increase (decrease) in net assets resulting from operations | 1,757,279 | 1,280,704 | ||
| Distributions to shareholders | (42,611) | (103,218) | ||
| Share transactions - net increase (decrease) | 590,470 | 1,647,315 | ||
| Total increase (decrease) in net assets | 2,305,138 | 2,824,801 | ||
| Net Assets | ||||
| Beginning of period | 7,710,615 | 4,885,814 | ||
| End of period | $ | 10,015,753 | $ | 7,710,615 |
Fidelity Advisor® Equity Growth Fund Class A |
Six months ended (Unaudited) May 31, 2024 | Years ended November 30, 2023 | 2022 | 2021 | 2020 | 2019 | |||||||
Selected Per-Share Data | ||||||||||||
| Net asset value, beginning of period | $ | 16.39 | $ | 13.85 | $ | 19.23 | $ | 17.06 | $ | 13.07 | $ | 11.84 |
| Income from Investment Operations | ||||||||||||
Net investment income (loss) A,B | (.03) | (.02) | (.02) | - C | (.05) | (.02) | ||||||
| Net realized and unrealized gain (loss) | 3.66 | 2.85 | (3.14) | 4.08 | 5.22 | 1.97 | ||||||
| Total from investment operations | 3.63 | 2.83 | (3.16) | 4.08 | 5.17 | 1.95 | ||||||
| Distributions from net realized gain | (.10) | (.29) | (2.22) | (1.91) | (1.18) | (.72) | ||||||
| Total distributions | (.10) | (.29) | (2.22) | (1.91) | (1.18) | (.72) | ||||||
| Net asset value, end of period | $ | 19.92 | $ | 16.39 | $ | 13.85 | $ | 19.23 | $ | 17.06 | $ | 13.07 |
Total Return D,E,F | 22.22 % | 21.03% | (18.79)% | 26.35% | 42.92% | 18.34% | ||||||
Ratios to Average Net Assets B,G,H | ||||||||||||
| Expenses before reductions | .94% I,J | .96% | .97% | .97% | .99% | 1.01% | ||||||
| Expenses net of fee waivers, if any | .93 % I,J | .96% | .97% | .97% | .99% | 1.01% | ||||||
| Expenses net of all reductions | .93% I,J | .96% | .97% | .97% | .99% | 1.01% | ||||||
| Net investment income (loss) | (.29)% I,J | (.16)% | (.11)% | (.02)% C | (.33)% | (.16)% | ||||||
| Supplemental Data | ||||||||||||
| Net assets, end of period (in millions) | $ | 2,308 | $ | 1,821 | $ | 1,422 | $ | 1,752 | $ | 1,477 | $ | 1,049 |
Portfolio turnover rate K | 37 % I,L | 43% | 40% | 44% | 52% | 49% L |
Fidelity Advisor® Equity Growth Fund Class M |
Six months ended (Unaudited) May 31, 2024 | Years ended November 30, 2023 | 2022 | 2021 | 2020 | 2019 | |||||||
Selected Per-Share Data | ||||||||||||
| Net asset value, beginning of period | $ | 15.78 | $ | 13.38 | $ | 18.64 | $ | 16.60 | $ | 12.78 | $ | 11.61 |
| Income from Investment Operations | ||||||||||||
Net investment income (loss) A,B | (.05) | (.06) | (.05) | (.04) C | (.08) | (.05) | ||||||
| Net realized and unrealized gain (loss) | 3.53 | 2.75 | (3.04) | 3.95 | 5.08 | 1.94 | ||||||
| Total from investment operations | 3.48 | 2.69 | (3.09) | 3.91 | 5.00 | 1.89 | ||||||
| Distributions from net realized gain | (.10) | (.29) | (2.17) | (1.87) | (1.18) | (.72) | ||||||
| Total distributions | (.10) | (.29) | (2.17) | (1.87) | (1.18) | (.72) | ||||||
| Net asset value, end of period | $ | 19.16 | $ | 15.78 | $ | 13.38 | $ | 18.64 | $ | 16.60 | $ | 12.78 |
Total Return D,E,F | 22.13 % | 20.71% | (18.95)% | 25.99% | 42.54% | 18.18% | ||||||
Ratios to Average Net Assets B,G,H | ||||||||||||
| Expenses before reductions | 1.18% I,J | 1.21% | 1.21% | 1.21% | 1.23% | 1.25% | ||||||
| Expenses net of fee waivers, if any | 1.17 % I,J | 1.20% | 1.21% | 1.21% | 1.23% | 1.25% | ||||||
| Expenses net of all reductions | 1.17% I,J | 1.20% | 1.21% | 1.21% | 1.23% | 1.24% | ||||||
| Net investment income (loss) | (.53)% I,J | (.40)% | (.36)% | (.26)% C | (.57)% | (.40)% | ||||||
| Supplemental Data | ||||||||||||
| Net assets, end of period (in millions) | $ | 1,897 | $ | 1,619 | $ | 1,437 | $ | 1,938 | $ | 1,747 | $ | 1,417 |
Portfolio turnover rate K | 37 % I,L | 43% | 40% | 44% | 52% | 49% L |
Fidelity Advisor® Equity Growth Fund Class C |
Six months ended (Unaudited) May 31, 2024 | Years ended November 30, 2023 | 2022 | 2021 | 2020 | 2019 | |||||||
Selected Per-Share Data | ||||||||||||
| Net asset value, beginning of period | $ | 12.28 | $ | 10.54 | $ | 15.14 | $ | 13.84 | $ | 10.90 | $ | 10.07 |
| Income from Investment Operations | ||||||||||||
Net investment income (loss) A,B | (.07) | (.10) | (.10) | (.11) C | (.13) | (.09) | ||||||
| Net realized and unrealized gain (loss) | 2.74 | 2.13 | (2.39) | 3.24 | 4.25 | 1.64 | ||||||
| Total from investment operations | 2.67 | 2.03 | (2.49) | 3.13 | 4.12 | 1.55 | ||||||
| Distributions from net realized gain | (.10) | (.29) | (2.11) | (1.83) | (1.18) | (.72) | ||||||
| Total distributions | (.10) | (.29) | (2.11) | (1.83) | (1.18) | (.72) | ||||||
| Net asset value, end of period | $ | 14.85 | $ | 12.28 | $ | 10.54 | $ | 15.14 | $ | 13.84 | $ | 10.90 |
Total Return D,E,F | 21.84 % | 20.01% | (19.38)% | 25.36% | 41.73% | 17.53% | ||||||
Ratios to Average Net Assets B,G,H | ||||||||||||
| Expenses before reductions | 1.70% I,J | 1.74% | 1.75% | 1.74% | 1.78% | 1.80% | ||||||
| Expenses net of fee waivers, if any | 1.69 % I,J | 1.74% | 1.75% | 1.74% | 1.77% | 1.80% | ||||||
| Expenses net of all reductions | 1.69% I,J | 1.74% | 1.75% | 1.74% | 1.77% | 1.79% | ||||||
| Net investment income (loss) | (1.05)% I | (.93)% J | (.89)% | (.79)% C | (1.12)% | (.95)% | ||||||
| Supplemental Data | ||||||||||||
| Net assets, end of period (in millions) | $ | 170 | $ | 133 | $ | 98 | $ | 134 | $ | 131 | $ | 101 |
Portfolio turnover rate K | 37 % I,L | 43% | 40% | 44% | 52% | 49% L |
Fidelity Advisor® Equity Growth Fund Class I |
Six months ended (Unaudited) May 31, 2024 | Years ended November 30, 2023 | 2022 | 2021 | 2020 | 2019 | |||||||
Selected Per-Share Data | ||||||||||||
| Net asset value, beginning of period | $ | 18.99 | $ | 15.95 | $ | 21.82 | $ | 19.10 | $ | 14.46 | $ | 12.98 |
| Income from Investment Operations | ||||||||||||
Net investment income (loss) A,B | - C | .02 | .02 | .05 D | (.01) | .01 | ||||||
| Net realized and unrealized gain (loss) | 4.24 | 3.31 | (3.63) | 4.61 | 5.83 | 2.19 | ||||||
| Total from investment operations | 4.24 | 3.33 | (3.61) | 4.66 | 5.82 | 2.20 | ||||||
| Distributions from net realized gain | (.10) | (.29) | (2.26) | (1.94) | (1.18) | (.72) | ||||||
| Total distributions | (.10) | (.29) | (2.26) | (1.94) | (1.18) | (.72) | ||||||
| Net asset value, end of period | $ | 23.13 | $ | 18.99 | $ | 15.95 | $ | 21.82 | $ | 19.10 | $ | 14.46 |
Total Return E,F | 22.39 % | 21.40% | (18.62)% | 26.65% | 43.32% | 18.68% | ||||||
Ratios to Average Net Assets B,G,H | ||||||||||||
| Expenses before reductions | .69% I,J | .71% | .72% | .71% | .74% | .75% | ||||||
| Expenses net of fee waivers, if any | .68 % I,J | .71% | .71% | .71% | .73% | .75% | ||||||
| Expenses net of all reductions | .68% I,J | .71% | .71% | .71% | .73% | .75% | ||||||
| Net investment income (loss) | (.04)% I,J | .09% | .14% | .24% D | (.07)% | .10% | ||||||
| Supplemental Data | ||||||||||||
| Net assets, end of period (in millions) | $ | 3,049 | $ | 2,548 | $ | 1,285 | $ | 1,067 | $ | 770 | $ | 548 |
Portfolio turnover rate K | 37 % I,L | 43% | 40% | 44% | 52% | 49% L |
Fidelity Advisor® Equity Growth Fund Class Z |
Six months ended (Unaudited) May 31, 2024 | Years ended November 30, 2023 | 2022 | 2021 | 2020 | 2019 | |||||||
Selected Per-Share Data | ||||||||||||
| Net asset value, beginning of period | $ | 19.27 | $ | 16.17 | $ | 22.07 | $ | 19.30 | $ | 14.59 | $ | 13.07 |
| Income from Investment Operations | ||||||||||||
Net investment income (loss) A,B | .01 | .04 | .04 | .07 C | .01 | .03 | ||||||
| Net realized and unrealized gain (loss) | 4.31 | 3.35 | (3.66) | 4.66 | 5.88 | 2.21 | ||||||
| Total from investment operations | 4.32 | 3.39 | (3.62) | 4.73 | 5.89 | 2.24 | ||||||
| Distributions from net realized gain | (.10) | (.29) | (2.28) | (1.96) | (1.18) | (.72) | ||||||
| Total distributions | (.10) | (.29) | (2.28) | (1.96) | (1.18) | (.72) | ||||||
| Net asset value, end of period | $ | 23.49 | $ | 19.27 | $ | 16.17 | $ | 22.07 | $ | 19.30 | $ | 14.59 |
Total Return D,E | 22.48 % | 21.48% | (18.46)% | 26.77% | 43.43% | 18.87% | ||||||
Ratios to Average Net Assets B,F,G | ||||||||||||
| Expenses before reductions | .57% H,I | .59% | .60% | .60% | .61% | .62% | ||||||
| Expenses net of fee waivers, if any | .57 % H,I | .59% | .60% | .60% | .61% | .62% | ||||||
| Expenses net of all reductions | .57% H,I | .59% | .60% | .60% | .61% | .62% | ||||||
| Net investment income (loss) | .07% H,I | .22% | .26% | .35% C | .05% | .23% | ||||||
| Supplemental Data | ||||||||||||
| Net assets, end of period (in millions) | $ | 2,593 | $ | 1,590 | $ | 645 | $ | 285 | $ | 180 | $ | 112 |
Portfolio turnover rate J | 37 % H,K | 43% | 40% | 44% | 52% | 49% K |
| Fidelity Central Fund | Investment Manager | Investment Objective | Investment Practices | Expense RatioA |
| Fidelity Money Market Central Funds | Fidelity Management & Research Company LLC (FMR) | Each fund seeks to obtain a high level of current income consistent with the preservation of capital and liquidity. | Short-term Investments | Less than .005% |
| Fidelity Advisor Equity Growth Fund | $23 |
| Gross unrealized appreciation | $4,158,339 |
| Gross unrealized depreciation | (226,377) |
| Net unrealized appreciation (depreciation) | $3,931,962 |
| Tax cost | $6,080,442 |
| Purchases ($) | Sales ($) | |
| Fidelity Advisor Equity Growth Fund | 2,135,328 | 1,644,258 |
| Shares | Total net realized gain or loss ($) | Total Proceeds ($) | |
| Fidelity Advisor Equity Growth Fund | 565 | 6,217 | 11,042 |
| Maximum Management Fee Rate % | |
| Class A | .67% |
| Class M | .66% |
| Class C | .70% |
| Class I | .67% |
| Class Z | .55% |
| Total Management Fee Rate % | |
| Class A | .67 |
| Class M | .66 |
| Class C | .67 |
| Class I | .67 |
| Class Z | .55 |
| Distribution Fee | Service Fee | Total Fees ($) | Retained by FDC ($) | |
| Class A | - % | .25% | 2,646 | 66 |
| Class M | .25% | .25% | 4,506 | 26 |
| Class C | .75% | .25% | 771 | 200 |
| 7,923 | 292 |
| Retained by FDC ($) | |
| Class A | 535 |
| Class M | 19 |
Class CA | 2 |
556 |
| % of Class-Level Average Net Assets | |
| Class A | .1635 |
| Class M | .1570 |
| Class C | .1883 |
| Class I | .1641 |
| Amount ($) | % of Class-Level Average Net AssetsA | |
| Class A | 825 | .17 |
| Class M | 688 | .16 |
| Class C | 68 | .19 |
| Class I | 1,076 | .17 |
| Class Z | 217 | .04 |
2,874 |
| % of Average Net Assets | |
| Fidelity Advisor Equity Growth Fund | .0147 |
| % of Average Net Assets | |
| Fidelity Advisor Equity Growth Fund | .01 |
| Amount ($) | |
| Fidelity Advisor Equity Growth Fund | 12 |
| Purchases ($) | Sales ($) | Realized Gain (Loss)($) | |
| Fidelity Advisor Equity Growth Fund | 102,179 | 58,966 | 8,507 |
| Amount ($) | |
| Fidelity Advisor Equity Growth Fund | 8 |
| Total Security Lending Fees Paid to NFS ($) | Security Lending Income From Securities Loaned to NFS ($) | Value of Securities Loaned to NFS at Period End ($) | |
| Fidelity Advisor Equity Growth Fund | 10 | 5 | - |
Six months ended May 31, 2024 | Year ended November 30, 2023 | |
| Fidelity Advisor Equity Growth Fund | ||
| Distributions to shareholders | ||
| Class A | $10,700 | $29,592 |
| Class M | 9,787 | 30,631 |
| Class C | 1,028 | 2,701 |
| Class I | 11,788 | 27,944 |
| Class Z | 9,308 | 12,350 |
Total | $42,611 | $103,218 |
| Shares | Shares | Dollars | Dollars | |
Six months ended May 31, 2024 | Year ended November 30, 2023 | Six months ended May 31, 2024 | Year ended November 30, 2023 | |
| Fidelity Advisor Equity Growth Fund | ||||
| Class A | ||||
| Shares sold | 11,477 | 21,267 | $213,171 | $310,421 |
| Reinvestment of distributions | 581 | 2,171 | 9,924 | 27,414 |
| Shares redeemed | (7,346) | (15,004) | (135,881) | (218,142) |
| Net increase (decrease) | 4,712 | 8,434 | $87,214 | $119,693 |
| Class M | ||||
| Shares sold | 4,160 | 7,691 | $74,406 | $107,913 |
| Reinvestment of distributions | 582 | 2,457 | 9,560 | 29,949 |
| Shares redeemed | (8,340) | (14,950) | (148,284) | (210,990) |
| Net increase (decrease) | (3,598) | (4,802) | $(64,318) | $(73,128) |
| Class C | ||||
| Shares sold | 2,198 | 4,131 | $30,534 | $45,054 |
| Reinvestment of distributions | 79 | 276 | 1,007 | 2,629 |
| Shares redeemed | (1,608) | (2,881) | (21,989) | (31,585) |
| Net increase (decrease) | 669 | 1,526 | $9,552 | $16,098 |
| Class I | ||||
| Shares sold | 24,258 | 80,228 | $524,921 | $1,321,123 |
| Reinvestment of distributions | 562 | 1,802 | 11,122 | 26,307 |
| Shares redeemed | (27,234) | (28,342) | (557,123) | (479,338) |
| Net increase (decrease) | (2,414) | 53,688 | $(21,080) | $868,092 |
| Class Z | ||||
| Shares sold | 38,100 | 58,182 | $803,473 | $985,369 |
| Reinvestment of distributions | 438 | 773 | 8,799 | 11,444 |
| Shares redeemed | (10,666) | (16,335) | (233,170) | (280,253) |
| Net increase (decrease) | 27,872 | 42,620 | $579,102 | $716,560 |
 |


Contents
| Common Stocks - 98.6% | |||
| Shares | Value ($) (000s) | ||
| COMMUNICATION SERVICES - 5.7% | |||
| Interactive Media & Services - 4.0% | |||
| Alphabet, Inc. Class A | 49,300 | 8,504 | |
| Meta Platforms, Inc. Class A | 112,800 | 52,658 | |
| 61,162 | |||
| Media - 1.1% | |||
| Comcast Corp. Class A | 404,650 | 16,198 | |
| Wireless Telecommunication Services - 0.6% | |||
| T-Mobile U.S., Inc. | 49,500 | 8,661 | |
TOTAL COMMUNICATION SERVICES | 86,021 | ||
| CONSUMER DISCRETIONARY - 2.0% | |||
| Hotels, Restaurants & Leisure - 0.3% | |||
| Churchill Downs, Inc. | 14,700 | 1,904 | |
| Hilton Worldwide Holdings, Inc. | 15,400 | 3,089 | |
| Starbucks Corp. | 100 | 8 | |
| 5,001 | |||
| Household Durables - 1.4% | |||
| D.R. Horton, Inc. | 17,900 | 2,646 | |
| JM AB (B Shares) (a) | 220,389 | 4,276 | |
| Lennar Corp. Class A | 24,500 | 3,929 | |
| Vistry Group PLC | 628,000 | 10,405 | |
| 21,256 | |||
| Textiles, Apparel & Luxury Goods - 0.3% | |||
| Gildan Activewear, Inc. | 107,400 | 4,110 | |
TOTAL CONSUMER DISCRETIONARY | 30,367 | ||
| CONSUMER STAPLES - 3.6% | |||
| Beverages - 0.5% | |||
| Keurig Dr. Pepper, Inc. | 208,000 | 7,124 | |
| Consumer Staples Distribution & Retail - 0.3% | |||
| Alimentation Couche-Tard, Inc. Class A (multi-vtg.) | 77,700 | 4,535 | |
| Personal Care Products - 0.4% | |||
| Kenvue, Inc. | 317,300 | 6,124 | |
| Tobacco - 2.4% | |||
| Altria Group, Inc. | 113,273 | 5,239 | |
| British American Tobacco PLC (United Kingdom) | 292,767 | 9,054 | |
| Philip Morris International, Inc. | 219,500 | 22,253 | |
| 36,546 | |||
TOTAL CONSUMER STAPLES | 54,329 | ||
| ENERGY - 11.3% | |||
| Energy Equipment & Services - 3.2% | |||
| Borr Drilling Ltd. | 205,300 | 1,377 | |
| Borr Drilling Ltd. | 1,018,800 | 7,020 | |
| Noble Corp. PLC (a) | 189,998 | 8,827 | |
| Seadrill Ltd. (b) | 119,000 | 6,173 | |
| Subsea 7 SA sponsored ADR | 241,600 | 4,446 | |
| Tidewater, Inc. (b) | 200,900 | 20,759 | |
| 48,602 | |||
| Oil, Gas & Consumable Fuels - 8.1% | |||
| Cameco Corp. (a) | 93,000 | 5,162 | |
| Cool Co. Ltd. | 253,118 | 3,173 | |
| Energy Transfer LP | 1,304,400 | 20,440 | |
| Enterprise Products Partners LP | 428,700 | 12,218 | |
| Exxon Mobil Corp. | 354,222 | 41,536 | |
| Marathon Petroleum Corp. | 21,200 | 3,744 | |
| Parkland Corp. | 286,300 | 8,262 | |
| Reliance Industries Ltd. GDR (c) | 94,400 | 6,594 | |
| Sitio Royalties Corp. | 353,700 | 8,287 | |
| Teekay Tankers Ltd. | 185,639 | 13,520 | |
| 122,936 | |||
TOTAL ENERGY | 171,538 | ||
| FINANCIALS - 14.9% | |||
| Banks - 2.4% | |||
| Bank of America Corp. | 279,500 | 11,177 | |
| HDFC Bank Ltd. | 216,400 | 3,976 | |
| Wells Fargo & Co. | 346,990 | 20,792 | |
| 35,945 | |||
| Capital Markets - 4.2% | |||
| Ares Capital Corp. (a) | 896,997 | 19,348 | |
| Blue Owl Capital, Inc. Class A | 410,500 | 7,385 | |
| Brookfield Corp. Class A | 497,100 | 21,619 | |
| BSE Ltd. | 122,700 | 3,960 | |
| Intercontinental Exchange, Inc. | 46,000 | 6,159 | |
| KKR & Co. LP | 45,000 | 4,628 | |
| 63,099 | |||
| Financial Services - 5.9% | |||
| Apollo Global Management, Inc. | 243,700 | 28,308 | |
| Fidelity National Information Services, Inc. | 68,300 | 5,183 | |
| Global Payments, Inc. | 149,400 | 15,216 | |
| MasterCard, Inc. Class A | 38,300 | 17,123 | |
| Visa, Inc. Class A | 89,623 | 24,419 | |
| 90,249 | |||
| Insurance - 2.4% | |||
| Arthur J. Gallagher & Co. | 43,300 | 10,969 | |
| Chubb Ltd. | 40,700 | 11,022 | |
| Fidelity National Financial, Inc. | 76,900 | 3,873 | |
| Marsh & McLennan Companies, Inc. | 24,900 | 5,169 | |
| The Travelers Companies, Inc. | 28,400 | 6,126 | |
| 37,159 | |||
TOTAL FINANCIALS | 226,452 | ||
| HEALTH CARE - 8.2% | |||
| Biotechnology - 0.3% | |||
| Gilead Sciences, Inc. | 65,600 | 4,216 | |
| Health Care Providers & Services - 4.9% | |||
| Cardinal Health, Inc. | 41,300 | 4,100 | |
| Cigna Group | 71,600 | 24,675 | |
| Elevance Health, Inc. | 21,500 | 11,577 | |
| HCA Holdings, Inc. | 7,500 | 2,548 | |
| Humana, Inc. | 15,600 | 5,587 | |
| UnitedHealth Group, Inc. | 52,497 | 26,005 | |
| 74,492 | |||
| Life Sciences Tools & Services - 0.3% | |||
| Danaher Corp. | 14,000 | 3,595 | |
| Thermo Fisher Scientific, Inc. | 1,800 | 1,022 | |
| 4,617 | |||
| Pharmaceuticals - 2.7% | |||
| Bristol-Myers Squibb Co. | 67,000 | 2,753 | |
| Eli Lilly & Co. | 27,700 | 22,723 | |
| Novo Nordisk A/S Series B sponsored ADR | 64,900 | 8,780 | |
| Royalty Pharma PLC | 258,800 | 7,094 | |
| 41,350 | |||
TOTAL HEALTH CARE | 124,675 | ||
| INDUSTRIALS - 16.1% | |||
| Aerospace & Defense - 5.9% | |||
| Airbus Group NV | 17,400 | 2,960 | |
| BAE Systems PLC | 270,500 | 4,817 | |
| General Dynamics Corp. | 30,900 | 9,263 | |
| General Electric Co. | 80,987 | 13,374 | |
| Howmet Aerospace, Inc. | 82,300 | 6,967 | |
| Huntington Ingalls Industries, Inc. | 30,800 | 7,795 | |
| Spirit AeroSystems Holdings, Inc. Class A (b) | 204,300 | 6,194 | |
| Textron, Inc. | 68,800 | 6,028 | |
| Thales SA | 36,600 | 6,647 | |
| The Boeing Co. (b) | 146,000 | 25,931 | |
| 89,976 | |||
| Commercial Services & Supplies - 0.8% | |||
| GFL Environmental, Inc. | 170,600 | 5,371 | |
| The Brink's Co. | 70,500 | 7,278 | |
| 12,649 | |||
| Construction & Engineering - 1.3% | |||
| EMCOR Group, Inc. | 34,100 | 13,253 | |
| Quanta Services, Inc. | 24,000 | 6,623 | |
| 19,876 | |||
| Electrical Equipment - 3.1% | |||
| GE Vernova LLC | 99,046 | 17,422 | |
| nVent Electric PLC | 69,600 | 5,664 | |
| Prysmian SpA | 67,600 | 4,446 | |
| Vertiv Holdings Co. | 191,900 | 18,820 | |
| 46,352 | |||
| Machinery - 1.9% | |||
| Allison Transmission Holdings, Inc. | 368,943 | 27,970 | |
| Marine Transportation - 0.8% | |||
| 2020 Bulkers Ltd. | 215,900 | 3,372 | |
| Himalaya Shipping Ltd. | 76,700 | 735 | |
| Himalaya Shipping Ltd. | 207,000 | 1,973 | |
| Stolt-Nielsen SA | 132,300 | 6,111 | |
| 12,191 | |||
| Professional Services - 1.4% | |||
| Genpact Ltd. | 107,200 | 3,544 | |
| Paycom Software, Inc. | 46,700 | 6,786 | |
| SS&C Technologies Holdings, Inc. | 173,300 | 10,753 | |
| 21,083 | |||
| Trading Companies & Distributors - 0.9% | |||
| Applied Industrial Technologies, Inc. | 19,300 | 3,725 | |
| Watsco, Inc. (a) | 20,500 | 9,735 | |
| 13,460 | |||
TOTAL INDUSTRIALS | 243,557 | ||
| INFORMATION TECHNOLOGY - 26.9% | |||
| IT Services - 0.2% | |||
| Amdocs Ltd. | 33,700 | 2,662 | |
| Semiconductors & Semiconductor Equipment - 17.2% | |||
| Amkor Technology, Inc. | 138,200 | 4,504 | |
| ASML Holding NV (Netherlands) | 4,900 | 4,688 | |
| BE Semiconductor Industries NV | 39,800 | 5,921 | |
| Broadcom, Inc. | 25,600 | 34,011 | |
| Marvell Technology, Inc. | 277,545 | 19,098 | |
| Micron Technology, Inc. | 166,700 | 20,838 | |
| NVIDIA Corp. | 100,100 | 109,740 | |
| NXP Semiconductors NV | 30,868 | 8,399 | |
| Qualcomm, Inc. | 107,000 | 21,833 | |
| Taiwan Semiconductor Manufacturing Co. Ltd. sponsored ADR | 76,500 | 11,555 | |
| Teradyne, Inc. | 108,700 | 15,320 | |
| Universal Display Corp. | 25,400 | 4,463 | |
| 260,370 | |||
| Software - 8.3% | |||
| Intuit, Inc. | 25,400 | 14,642 | |
| Microsoft Corp. | 229,500 | 95,272 | |
| Oracle Corp. | 117,700 | 13,793 | |
| Salesforce, Inc. | 10,400 | 2,438 | |
| 126,145 | |||
| Technology Hardware, Storage & Peripherals - 1.2% | |||
| Apple, Inc. | 18,096 | 3,479 | |
| Dell Technologies, Inc. | 38,200 | 5,331 | |
| Samsung Electronics Co. Ltd. | 184,410 | 9,783 | |
| 18,593 | |||
TOTAL INFORMATION TECHNOLOGY | 407,770 | ||
| MATERIALS - 3.2% | |||
| Chemicals - 0.4% | |||
| LyondellBasell Industries NV Class A | 35,500 | 3,529 | |
| Olin Corp. | 50,700 | 2,726 | |
| 6,255 | |||
| Metals & Mining - 2.8% | |||
| Arch Resources, Inc. Class A, (a) | 40,400 | 7,027 | |
| First Quantum Minerals Ltd. | 388,700 | 4,994 | |
| Franco-Nevada Corp. | 36,300 | 4,494 | |
| Freeport-McMoRan, Inc. | 151,200 | 7,973 | |
| Glencore PLC | 717,100 | 4,420 | |
| Newmont Corp. | 133,800 | 5,612 | |
| Wheaton Precious Metals Corp. | 140,400 | 7,690 | |
| 42,210 | |||
TOTAL MATERIALS | 48,465 | ||
| REAL ESTATE - 1.5% | |||
| Equity Real Estate Investment Trusts (REITs) - 0.8% | |||
| American Tower Corp. | 15,000 | 2,936 | |
| Crown Castle, Inc. | 37,300 | 3,823 | |
| Rexford Industrial Realty, Inc. | 98,500 | 4,468 | |
| 11,227 | |||
| Real Estate Management & Development - 0.7% | |||
| The St. Joe Co. | 193,900 | 10,975 | |
TOTAL REAL ESTATE | 22,202 | ||
| UTILITIES - 5.2% | |||
| Electric Utilities - 3.3% | |||
| Constellation Energy Corp. | 33,833 | 7,350 | |
| Edison International | 127,600 | 9,806 | |
| Exelon Corp. | 147,300 | 5,531 | |
| FirstEnergy Corp. | 170,500 | 6,864 | |
| NextEra Energy, Inc. | 197,100 | 15,772 | |
| Southern Co. | 71,200 | 5,706 | |
| 51,029 | |||
| Independent Power and Renewable Electricity Producers - 1.9% | |||
| The AES Corp. | 257,900 | 5,568 | |
| Vistra Corp. | 231,300 | 22,917 | |
| 28,485 | |||
TOTAL UTILITIES | 79,514 | ||
| TOTAL COMMON STOCKS (Cost $1,063,357) | 1,494,890 | ||
| Money Market Funds - 3.1% | |||
| Shares | Value ($) (000s) | ||
| Fidelity Cash Central Fund 5.39% (d) | 20,328,056 | 20,332 | |
| Fidelity Securities Lending Cash Central Fund 5.39% (d)(e) | 26,183,996 | 26,187 | |
| TOTAL MONEY MARKET FUNDS (Cost $46,519) | 46,519 | ||
| TOTAL INVESTMENT IN SECURITIES - 101.7% (Cost $1,109,876) | 1,541,409 |
NET OTHER ASSETS (LIABILITIES) - (1.7)% | (25,086) |
| NET ASSETS - 100.0% | 1,516,323 |
| (a) | Security or a portion of the security is on loan at period end. |
| (b) | Non-income producing |
| (c) | Security exempt from registration under Rule 144A of the Securities Act of 1933. These securities may be resold in transactions exempt from registration, normally to qualified institutional buyers. At the end of the period, the value of these securities amounted to $6,594,000 or 0.4% of net assets. |
| (d) | Affiliated fund that is generally available only to investment companies and other accounts managed by Fidelity Investments. The rate quoted is the annualized seven-day yield of the fund at period end. A complete unaudited listing of the fund's holdings as of its most recent quarter end is available upon request. In addition, each Fidelity Central Fund's financial statements are available on the SEC's website or upon request. |
| (e) | Investment made with cash collateral received from securities on loan. |
| Affiliate (Amounts in thousands) | Value, beginning of period ($) | Purchases ($) | Sales Proceeds ($) | Dividend Income ($) | Realized Gain (loss) ($) | Change in Unrealized appreciation (depreciation) ($) | Value, end of period ($) | % ownership, end of period |
| Fidelity Cash Central Fund 5.39% | 20,492 | 174,945 | 175,105 | 592 | - | - | 20,332 | 0.0% |
| Fidelity Securities Lending Cash Central Fund 5.39% | 18,978 | 122,497 | 115,288 | 103 | - | - | 26,187 | 0.1% |
| Total | 39,470 | 297,442 | 290,393 | 695 | - | - | 46,519 | |
| Valuation Inputs at Reporting Date: | ||||
Description (Amounts in thousands) | Total ($) | Level 1 ($) | Level 2 ($) | Level 3 ($) |
Investments in Securities: | ||||
| Equities: | ||||
Communication Services | 86,021 | 86,021 | - | - |
Consumer Discretionary | 30,367 | 15,686 | 14,681 | - |
Consumer Staples | 54,329 | 45,275 | 9,054 | - |
Energy | 171,538 | 160,394 | 11,144 | - |
Financials | 226,452 | 222,476 | 3,976 | - |
Health Care | 124,675 | 124,675 | - | - |
Industrials | 243,557 | 214,469 | 29,088 | - |
Information Technology | 407,770 | 387,378 | 20,392 | - |
Materials | 48,465 | 44,045 | 4,420 | - |
Real Estate | 22,202 | 22,202 | - | - |
Utilities | 79,514 | 79,514 | - | - |
| Money Market Funds | 46,519 | 46,519 | - | - |
| Total Investments in Securities: | 1,541,409 | 1,448,654 | 92,755 | - |
| Statement of Assets and Liabilities | ||||
| Amounts in thousands (except per-share amounts) | May 31, 2024 (Unaudited) | |||
| Assets | ||||
| Investment in securities, at value (including securities loaned of $25,902) - See accompanying schedule: | ||||
Unaffiliated issuers (cost $1,063,357) | $ | 1,494,890 | ||
Fidelity Central Funds (cost $46,519) | 46,519 | |||
| Total Investment in Securities (cost $1,109,876) | $ | 1,541,409 | ||
| Foreign currency held at value (cost $30) | 29 | |||
| Receivable for investments sold | 152 | |||
| Receivable for fund shares sold | 1,294 | |||
| Dividends receivable | 1,860 | |||
| Distributions receivable from Fidelity Central Funds | 71 | |||
| Other receivables | 7 | |||
Total assets | 1,544,822 | |||
| Liabilities | ||||
| Payable for fund shares redeemed | $ | 901 | ||
| Accrued management fee | 914 | |||
| Distribution and service plan fees payable | 320 | |||
| Deferred taxes | 118 | |||
| Other payables and accrued expenses | 59 | |||
| Collateral on securities loaned | 26,187 | |||
| Total liabilities | 28,499 | |||
| Net Assets | $ | 1,516,323 | ||
| Net Assets consist of: | ||||
| Paid in capital | $ | 1,041,060 | ||
| Total accumulated earnings (loss) | 475,263 | |||
| Net Assets | $ | 1,516,323 | ||
| Net Asset Value and Maximum Offering Price | ||||
| Class A : | ||||
Net Asset Value and redemption price per share ($578,323 ÷ 26,564 shares)(a) | $ | 21.77 | ||
| Maximum offering price per share (100/94.25 of $21.77) | $ | 23.10 | ||
| Class M : | ||||
Net Asset Value and redemption price per share ($398,729 ÷ 18,394 shares)(a) | $ | 21.68 | ||
| Maximum offering price per share (100/96.50 of $21.68) | $ | 22.47 | ||
| Class C : | ||||
Net Asset Value and offering price per share ($46,447 ÷ 2,298 shares)(a) | $ | 20.21 | ||
| Class I : | ||||
Net Asset Value, offering price and redemption price per share ($371,867 ÷ 15,794 shares)(b) | $ | 23.55 | ||
| Class Z : | ||||
Net Asset Value, offering price and redemption price per share ($120,957 ÷ 5,031 shares) | $ | 24.04 | ||
(a)Redemption price per share is equal to net asset value less any applicable contingent deferred sales charge. | ||||
(b)Corresponding Net Asset Value does not calculate due to rounding of fractional net assets and/or shares. | ||||
| Statement of Operations | ||||
| Amounts in thousands | Six months ended May 31, 2024 (Unaudited) | |||
| Investment Income | ||||
| Dividends | $ | 10,690 | ||
| Income from Fidelity Central Funds (including $103 from security lending) | 695 | |||
| Total income | 11,385 | |||
| Expenses | ||||
| Management fee | ||||
| Basic fee | $ | 4,066 | ||
| Performance adjustment | (15) | |||
| Transfer agent fees | 535 | |||
| Distribution and service plan fees | 1,788 | |||
| Accounting fees | 90 | |||
| Custodian fees and expenses | 18 | |||
| Independent trustees' fees and expenses | 3 | |||
| Registration fees | 44 | |||
| Audit | 32 | |||
| Legal | 2 | |||
| Miscellaneous | 16 | |||
| Total expenses before reductions | 6,579 | |||
| Expense reductions | (56) | |||
| Total expenses after reductions | 6,523 | |||
| Net Investment income (loss) | 4,862 | |||
| Realized and Unrealized Gain (Loss) | ||||
| Net realized gain (loss) on: | ||||
| Investment Securities: | ||||
| Unaffiliated issuers | 46,973 | |||
| Foreign currency transactions | (2) | |||
| Total net realized gain (loss) | 46,971 | |||
| Change in net unrealized appreciation (depreciation) on: | ||||
| Investment Securities: | ||||
| Unaffiliated issuers (net of increase in deferred foreign taxes of $118) | 231,129 | |||
| Assets and liabilities in foreign currencies | (4) | |||
| Total change in net unrealized appreciation (depreciation) | 231,125 | |||
| Net gain (loss) | 278,096 | |||
| Net increase (decrease) in net assets resulting from operations | $ | 282,958 | ||
| Statement of Changes in Net Assets | ||||
| Amount in thousands | Six months ended May 31, 2024 (Unaudited) | Year ended November 30, 2023 | ||
| Increase (Decrease) in Net Assets | ||||
| Operations | ||||
| Net investment income (loss) | $ | 4,862 | $ | 11,589 |
| Net realized gain (loss) | 46,971 | 22,788 | ||
| Change in net unrealized appreciation (depreciation) | 231,125 | 40,768 | ||
| Net increase (decrease) in net assets resulting from operations | 282,958 | 75,145 | ||
| Distributions to shareholders | (30,204) | (90,573) | ||
| Share transactions - net increase (decrease) | 134,403 | 14,086 | ||
| Total increase (decrease) in net assets | 387,157 | (1,342) | ||
| Net Assets | ||||
| Beginning of period | 1,129,166 | 1,130,508 | ||
| End of period | $ | 1,516,323 | $ | 1,129,166 |
Fidelity Advisor® Dividend Growth Fund Class A |
Six months ended (Unaudited) May 31, 2024 | Years ended November 30, 2023 | 2022 | 2021 | 2020 | 2019 | |||||||
Selected Per-Share Data | ||||||||||||
| Net asset value, beginning of period | $ | 18.02 | $ | 18.40 | $ | 20.29 | $ | 16.20 | $ | 17.06 | $ | 17.97 |
| Income from Investment Operations | ||||||||||||
Net investment income (loss) A,B | .07 | .18 | .21 | .14 | .27 | .24 C | ||||||
| Net realized and unrealized gain (loss) | 4.17 | .95 | (.83) | 4.19 | (.35) | 1.39 | ||||||
| Total from investment operations | 4.24 | 1.13 | (.62) | 4.33 | (.08) | 1.63 | ||||||
| Distributions from net investment income | (.13) | (.20) | (.28) | (.24) | (.25) | (.27) | ||||||
| Distributions from net realized gain | (.37) | (1.31) | (.99) | - | (.54) | (2.27) | ||||||
| Total distributions | (.49) D | (1.51) | (1.27) | (.24) | (.78) D | (2.54) | ||||||
| Net asset value, end of period | $ | 21.77 | $ | 18.02 | $ | 18.40 | $ | 20.29 | $ | 16.20 | $ | 17.06 |
Total Return E,F,G | 24.01 % | 7.00% | (3.46)% | 27.06% | (.60)% | 12.84% | ||||||
Ratios to Average Net Assets B,H,I | ||||||||||||
| Expenses before reductions | .97% J | .99% | .82% | .83% | .81% | .82% | ||||||
| Expenses net of fee waivers, if any | .96 % J | .99% | .81% | .83% | .81% | .82% | ||||||
| Expenses net of all reductions | .96% J | .99% | .81% | .83% | .80% | .81% | ||||||
| Net investment income (loss) | .74% J | 1.08% | 1.16% | .73% | 1.84% | 1.53% C | ||||||
| Supplemental Data | ||||||||||||
| Net assets, end of period (in millions) | $ | 578 | $ | 467 | $ | 452 | $ | 477 | $ | 374 | $ | 421 |
Portfolio turnover rate K | 60 % J | 65% | 57% | 54% | 113% | 75% |
Fidelity Advisor® Dividend Growth Fund Class M |
Six months ended (Unaudited) May 31, 2024 | Years ended November 30, 2023 | 2022 | 2021 | 2020 | 2019 | |||||||
Selected Per-Share Data | ||||||||||||
| Net asset value, beginning of period | $ | 17.94 | $ | 18.29 | $ | 20.14 | $ | 16.08 | $ | 16.94 | $ | 17.85 |
| Income from Investment Operations | ||||||||||||
Net investment income (loss) A,B | .05 | .14 | .17 | .09 | .23 | .20 C | ||||||
| Net realized and unrealized gain (loss) | 4.16 | .94 | (.83) | 4.17 | (.35) | 1.39 | ||||||
| Total from investment operations | 4.21 | 1.08 | (.66) | 4.26 | (.12) | 1.59 | ||||||
| Distributions from net investment income | (.10) | (.12) | (.20) | (.20) | (.21) | (.23) | ||||||
| Distributions from net realized gain | (.37) | (1.31) | (.99) | - | (.54) | (2.27) | ||||||
| Total distributions | (.47) | (1.43) | (1.19) | (.20) | (.74) D | (2.50) | ||||||
| Net asset value, end of period | $ | 21.68 | $ | 17.94 | $ | 18.29 | $ | 20.14 | $ | 16.08 | $ | 16.94 |
Total Return E,F,G | 23.92 % | 6.72% | (3.70)% | 26.77% | (.85)% | 12.59% | ||||||
Ratios to Average Net Assets B,H,I | ||||||||||||
| Expenses before reductions | 1.21% J | 1.23% | 1.06% | 1.07% | 1.05% | 1.07% | ||||||
| Expenses net of fee waivers, if any | 1.20 % J | 1.23% | 1.06% | 1.07% | 1.05% | 1.07% | ||||||
| Expenses net of all reductions | 1.20% J | 1.23% | 1.06% | 1.07% | 1.04% | 1.06% | ||||||
| Net investment income (loss) | .50% J | .84% | .92% | .49% | 1.59% | 1.28% C | ||||||
| Supplemental Data | ||||||||||||
| Net assets, end of period (in millions) | $ | 399 | $ | 334 | $ | 341 | $ | 368 | $ | 316 | $ | 376 |
Portfolio turnover rate K | 60 % J | 65% | 57% | 54% | 113% | 75% |
Fidelity Advisor® Dividend Growth Fund Class C |
Six months ended (Unaudited) May 31, 2024 | Years ended November 30, 2023 | 2022 | 2021 | 2020 | 2019 | |||||||
Selected Per-Share Data | ||||||||||||
| Net asset value, beginning of period | $ | 16.77 | $ | 17.17 | $ | 18.89 | $ | 15.10 | $ | 15.92 | $ | 16.92 |
| Income from Investment Operations | ||||||||||||
Net investment income (loss) A,B | - | .05 | .06 | (.01) | .14 | .11 C | ||||||
| Net realized and unrealized gain (loss) | 3.87 | .87 | (.77) | 3.92 | (.34) | 1.29 | ||||||
| Total from investment operations | 3.87 | .92 | (.71) | 3.91 | (.20) | 1.40 | ||||||
| Distributions from net investment income | (.07) | (.02) | (.05) | (.12) | (.08) | (.14) | ||||||
| Distributions from net realized gain | (.37) | (1.31) | (.96) | - | (.54) | (2.27) | ||||||
| Total distributions | (.43) D | (1.32) D | (1.01) | (.12) | (.62) | (2.40) D | ||||||
| Net asset value, end of period | $ | 20.21 | $ | 16.77 | $ | 17.17 | $ | 18.89 | $ | 15.10 | $ | 15.92 |
Total Return E,F,G | 23.55 % | 6.17% | (4.18)% | 26.03% | (1.41)% | 11.98% | ||||||
Ratios to Average Net Assets B,H,I | ||||||||||||
| Expenses before reductions | 1.73% J | 1.78% | 1.60% | 1.62% | 1.61% | 1.62% | ||||||
| Expenses net of fee waivers, if any | 1.72 % J | 1.77% | 1.60% | 1.62% | 1.61% | 1.61% | ||||||
| Expenses net of all reductions | 1.72% J | 1.77% | 1.60% | 1.62% | 1.60% | 1.61% | ||||||
| Net investment income (loss) | (.02)% J | .29% | .38% | (.06)% | 1.04% | .73% C | ||||||
| Supplemental Data | ||||||||||||
| Net assets, end of period (in millions) | $ | 46 | $ | 39 | $ | 45 | $ | 53 | $ | 56 | $ | 71 |
Portfolio turnover rate K | 60 % J | 65% | 57% | 54% | 113% | 75% |
Fidelity Advisor® Dividend Growth Fund Class I |
Six months ended (Unaudited) May 31, 2024 | Years ended November 30, 2023 | 2022 | 2021 | 2020 | 2019 | |||||||
Selected Per-Share Data | ||||||||||||
| Net asset value, beginning of period | $ | 19.45 | $ | 19.76 | $ | 21.72 | $ | 17.32 | $ | 18.18 | $ | 18.97 |
| Income from Investment Operations | ||||||||||||
Net investment income (loss) A,B | .10 | .24 | .27 | .20 | .32 | .29 C | ||||||
| Net realized and unrealized gain (loss) | 4.51 | 1.02 | (.89) | 4.48 | (.36) | 1.50 | ||||||
| Total from investment operations | 4.61 | 1.26 | (.62) | 4.68 | (.04) | 1.79 | ||||||
| Distributions from net investment income | (.15) | (.26) | (.35) | (.28) | (.28) | (.31) | ||||||
| Distributions from net realized gain | (.37) | (1.31) | (.99) | - | (.54) | (2.27) | ||||||
| Total distributions | (.51) D | (1.57) | (1.34) | (.28) | (.82) | (2.58) | ||||||
| Net asset value, end of period | $ | 23.55 | $ | 19.45 | $ | 19.76 | $ | 21.72 | $ | 17.32 | $ | 18.18 |
Total Return E,F | 24.17 % | 7.25% | (3.23)% | 27.37% | (.36)% | 13.13% | ||||||
Ratios to Average Net Assets B,G,H | ||||||||||||
| Expenses before reductions | .74% I | .76% | .59% | .60% | .57% | .58% | ||||||
| Expenses net of fee waivers, if any | .73 % I | .75% | .58% | .60% | .57% | .58% | ||||||
| Expenses net of all reductions | .73% I | .75% | .58% | .60% | .56% | .57% | ||||||
| Net investment income (loss) | .97% I | 1.31% | 1.39% | .96% | 2.08% | 1.77% C | ||||||
| Supplemental Data | ||||||||||||
| Net assets, end of period (in millions) | $ | 372 | $ | 256 | $ | 239 | $ | 245 | $ | 180 | $ | 173 |
Portfolio turnover rate J | 60 % I | 65% | 57% | 54% | 113% | 75% |
Fidelity Advisor® Dividend Growth Fund Class Z |
Six months ended (Unaudited) May 31, 2024 | Years ended November 30, 2023 | 2022 | 2021 | 2020 | 2019 | |||||||
Selected Per-Share Data | ||||||||||||
| Net asset value, beginning of period | $ | 19.85 | $ | 20.15 | $ | 22.15 | $ | 17.65 | $ | 18.51 | $ | 19.28 |
| Income from Investment Operations | ||||||||||||
Net investment income (loss) A,B | .12 | .27 | .31 | .23 | .35 | .32 C | ||||||
| Net realized and unrealized gain (loss) | 4.60 | 1.05 | (.91) | 4.57 | (.37) | 1.52 | ||||||
| Total from investment operations | 4.72 | 1.32 | (.60) | 4.80 | (.02) | 1.84 | ||||||
| Distributions from net investment income | (.16) | (.31) | (.41) | (.30) | (.31) | (.34) | ||||||
| Distributions from net realized gain | (.37) | (1.31) | (.99) | - | (.54) | (2.27) | ||||||
| Total distributions | (.53) | (1.62) | (1.40) | (.30) | (.84) D | (2.61) | ||||||
| Net asset value, end of period | $ | 24.04 | $ | 19.85 | $ | 20.15 | $ | 22.15 | $ | 17.65 | $ | 18.51 |
Total Return E,F | 24.22 % | 7.44% | (3.10)% | 27.61% | (.22)% | 13.25% | ||||||
Ratios to Average Net Assets B,G,H | ||||||||||||
| Expenses before reductions | .63% I | .60% | .43% | .45% | .41% | .43% | ||||||
| Expenses net of fee waivers, if any | .62 % I | .60% | .43% | .44% | .41% | .43% | ||||||
| Expenses net of all reductions | .62% I | .60% | .43% | .44% | .40% | .42% | ||||||
| Net investment income (loss) | 1.08% I | 1.47% | 1.55% | 1.12% | 2.23% | 1.92% C | ||||||
| Supplemental Data | ||||||||||||
| Net assets, end of period (in millions) | $ | 121 | $ | 33 | $ | 53 | $ | 60 | $ | 55 | $ | 13 |
Portfolio turnover rate J | 60 % I | 65% | 57% | 54% | 113% | 75% |
| Fidelity Central Fund | Investment Manager | Investment Objective | Investment Practices | Expense RatioA |
| Fidelity Money Market Central Funds | Fidelity Management & Research Company LLC (FMR) | Each fund seeks to obtain a high level of current income consistent with the preservation of capital and liquidity. | Short-term Investments | Less than .005% |
| Gross unrealized appreciation | $453,036 |
| Gross unrealized depreciation | (23,293) |
| Net unrealized appreciation (depreciation) | $429,743 |
| Tax cost | $1,111,666 |
| Purchases ($) | Sales ($) | |
| Fidelity Advisor Dividend Growth Fund | 501,303 | 391,732 |
| Maximum Management Fee Rate % | |
| Class A | .70 |
| Class M | .69 |
| Class C | .72 |
| Class I | .71 |
| Class Z | .56 |
| Total Management Fee Rate % | |
| Class A | .70 |
| Class M | .69 |
| Class C | .70 |
| Class I | .70 |
| Class Z | .56 |
| Performance Adjustment Index | |
| Fidelity Advisor Dividend Growth Fund | S&P 500 Index |
| Distribution Fee | Service Fee | Total Fees ($) | Retained by FDC ($) | |
| Class A | - % | .25% | 652 | 11 |
| Class M | .25% | .25% | 922 | 1 |
| Class C | .75% | .25% | 214 | 23 |
| 1,788 | 35 |
| Retained by FDC ($) | |
| Class A | 74 |
| Class M | 5 |
Class CA | 1 |
| 80 |
| % of Class-Level Average Net Assets | |
| Class A | .1774 |
| Class M | .1687 |
| Class C | .2000 |
| Class I | .1905 |
| Amount ($) | % of Class-Level Average Net AssetsA | |
| Class A | 221 | .18 |
| Class M | 149 | .17 |
| Class C | 20 | .20 |
| Class I | 138 | .19 |
| Class Z | 7 | .04 |
| 535 |
| % of Average Net Assets | |
| Fidelity Advisor Dividend Growth Fund | .0290 |
| % of Average Net Assets | |
| Fidelity Advisor Dividend Growth Fund | .03 |
| Amount ($) | |
| Fidelity Advisor Dividend Growth Fund | 8 |
| Purchases ($) | Sales ($) | Realized Gain (Loss)($) | |
| Fidelity Advisor Dividend Growth Fund | 19,729 | 18,126 | 3,441 |
| Amount ($) | |
| Fidelity Advisor Dividend Growth Fund | 1 |
| Total Security Lending Fees Paid to NFS ($) | Security Lending Income From Securities Loaned to NFS ($) | Value of Securities Loaned to NFS at Period End ($) | |
| Fidelity Advisor Dividend Growth Fund | 11 | 17 | - |
Six months ended May 31, 2024 | Year ended November 30, 2023 | |
| Fidelity Advisor Dividend Growth Fund | ||
| Distributions to shareholders | ||
| Class A | $12,730 | $37,337 |
| Class M | 8,696 | 26,509 |
| Class C | 995 | 3,463 |
| Class I | 6,810 | 19,107 |
| Class Z | 973 | 4,157 |
Total | $30,204 | $90,573 |
| Shares | Shares | Dollars | Dollars | |
Six months ended May 31, 2024 | Year ended November 30, 2023 | Six months ended May 31, 2024 | Year ended November 30, 2023 | |
| Fidelity Advisor Dividend Growth Fund | ||||
| Class A | ||||
| Shares sold | 1,726 | 2,879 | $34,488 | $49,306 |
| Reinvestment of distributions | 647 | 2,153 | 12,028 | 35,223 |
| Shares redeemed | (1,711) | (3,708) | (33,690) | (63,035) |
| Net increase (decrease) | 662 | 1,324 | $12,826 | $21,494 |
| Class M | ||||
| Shares sold | 996 | 1,830 | $19,526 | $30,986 |
| Reinvestment of distributions | 464 | 1,607 | 8,575 | 26,169 |
| Shares redeemed | (1,704) | (3,467) | (33,560) | (58,984) |
| Net increase (decrease) | (244) | (30) | $(5,459) | $(1,829) |
| Class C | ||||
| Shares sold | 228 | 352 | $4,245 | $5,560 |
| Reinvestment of distributions | 58 | 226 | 991 | 3,437 |
| Shares redeemed | (314) | (862) | (5,773) | (13,658) |
| Net increase (decrease) | (28) | (284) | $(537) | $(4,661) |
| Class I | ||||
| Shares sold | 3,300 | 4,019 | $70,222 | $71,380 |
| Reinvestment of distributions | 332 | 1,059 | 6,698 | 18,689 |
| Shares redeemed | (1,009) | (3,987) | (21,536) | (72,187) |
| Net increase (decrease) | 2,623 | 1,091 | $55,384 | $17,882 |
| Class Z | ||||
| Shares sold | 3,707 | 2,839 | $79,507 | $51,643 |
| Reinvestment of distributions | 43 | 210 | 891 | 3,771 |
| Shares redeemed | (374) | (4,044) | (8,209) | (74,214) |
| Net increase (decrease) | 3,376 | (995) | $72,189 | $(18,800) |
 |


Contents
| Common Stocks - 99.4% | |||
| Shares | Value ($) | ||
| COMMUNICATION SERVICES - 11.2% | |||
| Entertainment - 4.7% | |||
| Live Nation Entertainment, Inc. (a) | 37,200 | 3,487,128 | |
| Netflix, Inc. (a) | 40,423 | 25,936,205 | |
| Universal Music Group NV | 716,738 | 22,336,205 | |
| Universal Music Group NV rights (a)(b) | 733,138 | 214,783 | |
| Warner Music Group Corp. Class A | 263,167 | 7,837,113 | |
| 59,811,434 | |||
| Interactive Media & Services - 6.5% | |||
| Alphabet, Inc. Class A | 361,657 | 62,385,833 | |
| Epic Games, Inc. (a)(c)(d) | 805 | 483,000 | |
| Meta Platforms, Inc. Class A | 39,600 | 18,486,468 | |
| 81,355,301 | |||
TOTAL COMMUNICATION SERVICES | 141,166,735 | ||
| CONSUMER DISCRETIONARY - 9.1% | |||
| Automobile Components - 0.1% | |||
| Mobileye Global, Inc. Class A (a)(e) | 42,500 | 1,090,550 | |
| Automobiles - 0.3% | |||
| BYD Co. Ltd. (H Shares) | 132,092 | 3,706,406 | |
| Broadline Retail - 6.2% | |||
| Amazon.com, Inc. (a) | 337,146 | 59,486,040 | |
| MercadoLibre, Inc. (a) | 6,820 | 11,768,456 | |
| PDD Holdings, Inc. ADR (a) | 41,100 | 6,155,958 | |
| Savers Value Village, Inc. (e) | 91,400 | 1,239,384 | |
| 78,649,838 | |||
| Diversified Consumer Services - 0.1% | |||
| Duolingo, Inc. (a) | 7,100 | 1,358,940 | |
| Hotels, Restaurants & Leisure - 1.9% | |||
| Airbnb, Inc. Class A (a) | 101,169 | 14,662,423 | |
| Domino's Pizza, Inc. | 14,200 | 7,221,836 | |
| Kura Sushi U.S.A., Inc. Class A (a)(e) | 14,270 | 1,425,716 | |
| Trip.com Group Ltd. ADR (a) | 23,100 | 1,189,881 | |
| 24,499,856 | |||
| Household Durables - 0.1% | |||
| TopBuild Corp. (a) | 1,600 | 668,720 | |
| Textiles, Apparel & Luxury Goods - 0.4% | |||
| LVMH Moet Hennessy Louis Vuitton SE | 5,586 | 4,467,371 | |
TOTAL CONSUMER DISCRETIONARY | 114,441,681 | ||
| CONSUMER STAPLES - 0.7% | |||
| Beverages - 0.6% | |||
| Monster Beverage Corp. (a) | 156,358 | 8,118,107 | |
| Personal Care Products - 0.1% | |||
| Puig Brands SA Class B | 23,000 | 652,104 | |
TOTAL CONSUMER STAPLES | 8,770,211 | ||
| ENERGY - 2.5% | |||
| Oil, Gas & Consumable Fuels - 2.5% | |||
| Canadian Natural Resources Ltd. | 30,100 | 2,312,583 | |
| Cheniere Energy, Inc. | 63,900 | 10,082,781 | |
| Range Resources Corp. | 179,468 | 6,624,164 | |
| Reliance Industries Ltd. | 346,453 | 11,875,613 | |
| 30,895,141 | |||
| FINANCIALS - 6.2% | |||
| Capital Markets - 0.4% | |||
| Ares Management Corp. Class A, | 19,000 | 2,663,230 | |
| LPL Financial | 4,500 | 1,287,945 | |
| Morgan Stanley | 6,500 | 635,960 | |
| MSCI, Inc. | 1,200 | 594,216 | |
| 5,181,351 | |||
| Consumer Finance - 0.4% | |||
| Capital One Financial Corp. | 40,000 | 5,505,200 | |
| Financial Services - 4.4% | |||
| Apollo Global Management, Inc. | 9,600 | 1,115,136 | |
| Corebridge Financial, Inc. | 100,000 | 2,917,000 | |
| Fiserv, Inc. (a) | 16,300 | 2,441,088 | |
| Global Payments, Inc. | 58,400 | 5,948,040 | |
| MasterCard, Inc. Class A | 46,883 | 20,959,983 | |
| Rocket Companies, Inc. (a)(e) | 158,954 | 2,209,461 | |
| Visa, Inc. Class A | 73,500 | 20,025,810 | |
| 55,616,518 | |||
| Insurance - 1.0% | |||
| Arthur J. Gallagher & Co. | 35,869 | 9,086,694 | |
| The Baldwin Insurance Group, Inc. Class A, (a) | 88,424 | 2,978,120 | |
| 12,064,814 | |||
TOTAL FINANCIALS | 78,367,883 | ||
| HEALTH CARE - 14.5% | |||
| Biotechnology - 3.7% | |||
| Adamas Pharmaceuticals, Inc.: | |||
| rights (a)(d) | 220,830 | 48,583 | |
| rights (a)(d) | 220,830 | 15,458 | |
| Alnylam Pharmaceuticals, Inc. (a) | 36,272 | 5,383,853 | |
| Arcellx, Inc. (a) | 6,579 | 342,108 | |
| Arrowhead Pharmaceuticals, Inc. (a) | 29,295 | 672,320 | |
| Beam Therapeutics, Inc. (a) | 9,466 | 225,480 | |
| BioNTech SE ADR (a) | 14,000 | 1,408,400 | |
| Blueprint Medicines Corp. (a) | 5,700 | 601,692 | |
| Cytokinetics, Inc. (a) | 27,061 | 1,312,729 | |
| Exact Sciences Corp. (a) | 118,300 | 5,376,735 | |
| Galapagos NV sponsored ADR (a) | 55,086 | 1,532,493 | |
| Gamida Cell Ltd. (d) | 266,229 | 3 | |
| Gamida Cell Ltd. warrants 4/21/28 (a)(d) | 59,930 | 1 | |
| Hookipa Pharma, Inc. (a) | 134,300 | 106,634 | |
| Immunocore Holdings PLC ADR (a) | 23,585 | 1,155,193 | |
| Insmed, Inc. (a) | 130,346 | 7,175,547 | |
| Janux Therapeutics, Inc. (a) | 2,900 | 155,150 | |
| Krystal Biotech, Inc. (a) | 4,700 | 752,235 | |
| Legend Biotech Corp. ADR (a) | 29,702 | 1,188,377 | |
| Moderna, Inc. (a) | 9,000 | 1,282,950 | |
| Regeneron Pharmaceuticals, Inc. (a) | 12,047 | 11,807,988 | |
| Repligen Corp. (a) | 22,568 | 3,364,663 | |
| Sarepta Therapeutics, Inc. (a) | 7,300 | 947,978 | |
| Seres Therapeutics, Inc. (a)(e) | 54,600 | 54,600 | |
| Synlogic, Inc. (a) | 10,646 | 16,608 | |
| Vor Biopharma, Inc. (a) | 43,874 | 59,230 | |
| XOMA Corp. (a) | 38,107 | 982,780 | |
| 45,969,788 | |||
| Health Care Equipment & Supplies - 3.6% | |||
| Align Technology, Inc. (a) | 15,900 | 4,089,639 | |
| Boston Scientific Corp. (a) | 426,474 | 32,228,640 | |
| Glaukos Corp. (a) | 26,900 | 3,032,168 | |
| Hologic, Inc. (a) | 31,600 | 2,331,448 | |
| Inspire Medical Systems, Inc. (a) | 7,600 | 1,206,804 | |
| Lantheus Holdings, Inc. (a) | 11,200 | 916,496 | |
| Penumbra, Inc. (a) | 6,927 | 1,312,459 | |
| Pulmonx Corp. (a) | 27,500 | 199,375 | |
| RxSight, Inc. (a) | 7,500 | 438,525 | |
| 45,755,554 | |||
| Health Care Providers & Services - 0.9% | |||
| HealthEquity, Inc. (a) | 136,754 | 11,170,067 | |
| Life Sciences Tools & Services - 2.8% | |||
| Agilent Technologies, Inc. | 5,788 | 754,813 | |
| Bio-Techne Corp. | 31,502 | 2,431,639 | |
| Bruker Corp. | 130,943 | 8,578,076 | |
| Chemometec A/S | 15,600 | 830,860 | |
| Codexis, Inc. (a) | 161,901 | 547,225 | |
| Danaher Corp. | 39,551 | 10,156,697 | |
| MaxCyte, Inc. (a) | 132,900 | 595,392 | |
| Sartorius Stedim Biotech | 15,401 | 3,067,961 | |
| Thermo Fisher Scientific, Inc. | 15,080 | 8,565,138 | |
| 35,527,801 | |||
| Pharmaceuticals - 3.5% | |||
| Aclaris Therapeutics, Inc. (a) | 19,672 | 20,262 | |
| Chugai Pharmaceutical Co. Ltd. | 75,000 | 2,281,932 | |
| Eli Lilly & Co. | 41,098 | 33,714,333 | |
| Teva Pharmaceutical Industries Ltd. sponsored ADR (a) | 451,700 | 7,647,281 | |
| 43,663,808 | |||
TOTAL HEALTH CARE | 182,087,018 | ||
| INDUSTRIALS - 12.6% | |||
| Aerospace & Defense - 1.5% | |||
| General Electric Co. | 115,352 | 19,049,229 | |
| Loar Holdings, Inc. | 1,200 | 68,364 | |
| 19,117,593 | |||
| Commercial Services & Supplies - 0.0% | |||
| Montrose Environmental Group, Inc. (a) | 10,800 | 507,708 | |
| Electrical Equipment - 2.1% | |||
| Eaton Corp. PLC | 46,260 | 15,397,641 | |
| GE Vernova LLC | 50,088 | 8,810,479 | |
| HD Hyundai Electric Co. Ltd. | 12,500 | 2,718,551 | |
| 26,926,671 | |||
| Ground Transportation - 3.8% | |||
| Uber Technologies, Inc. (a) | 729,776 | 47,114,339 | |
| Machinery - 1.5% | |||
| Chart Industries, Inc. (a) | 8,800 | 1,381,864 | |
| Energy Recovery, Inc. (a) | 39,552 | 533,952 | |
| Ingersoll Rand, Inc. | 140,540 | 13,077,247 | |
| Westinghouse Air Brake Tech Co. | 24,141 | 4,085,381 | |
| 19,078,444 | |||
| Professional Services - 2.8% | |||
| Equifax, Inc. | 63,984 | 14,805,258 | |
| KBR, Inc. | 182,413 | 11,977,238 | |
| RELX PLC sponsored ADR | 122,600 | 5,389,496 | |
| UL Solutions, Inc. Class A | 81,900 | 3,158,883 | |
| 35,330,875 | |||
| Trading Companies & Distributors - 0.9% | |||
| Ferguson PLC | 53,210 | 10,890,693 | |
TOTAL INDUSTRIALS | 158,966,323 | ||
| INFORMATION TECHNOLOGY - 42.5% | |||
| Electronic Equipment, Instruments & Components - 1.5% | |||
| Fabrinet (a) | 5,500 | 1,317,415 | |
| Flex Ltd. (a) | 351,384 | 11,641,352 | |
| Jabil, Inc. | 54,415 | 6,469,944 | |
| 19,428,711 | |||
| IT Services - 1.6% | |||
| Gartner, Inc. (a) | 10,567 | 4,434,653 | |
| MongoDB, Inc. Class A (a) | 64,291 | 15,176,533 | |
| 19,611,186 | |||
| Semiconductors & Semiconductor Equipment - 19.1% | |||
| Allegro MicroSystems LLC (a) | 184,037 | 5,546,875 | |
| ASML Holding NV (depository receipt) | 18,734 | 17,991,197 | |
| Astera Labs, Inc. | 2,300 | 148,442 | |
| BE Semiconductor Industries NV | 62,876 | 9,353,937 | |
| eMemory Technology, Inc. | 4,207 | 285,854 | |
| Marvell Technology, Inc. | 39,622 | 2,726,390 | |
| Micron Technology, Inc. | 127,400 | 15,925,000 | |
| NVIDIA Corp. | 117,652 | 128,985,417 | |
| NXP Semiconductors NV | 42,581 | 11,586,290 | |
| Qualcomm, Inc. | 43,000 | 8,774,150 | |
| SiTime Corp. (a)(e) | 55,718 | 6,787,567 | |
| Taiwan Semiconductor Manufacturing Co. Ltd. sponsored ADR | 172,696 | 26,084,004 | |
| Universal Display Corp. | 34,255 | 6,018,604 | |
| 240,213,727 | |||
| Software - 15.2% | |||
| ASAPP, Inc. warrants 8/28/28 (a)(c)(d) | 294,232 | 556,098 | |
| Autodesk, Inc. (a) | 5,900 | 1,189,440 | |
| HubSpot, Inc. (a) | 20,060 | 12,257,663 | |
| Manhattan Associates, Inc. (a) | 32,624 | 7,162,273 | |
| Microsoft Corp. | 381,144 | 158,224,305 | |
| NICE Ltd. sponsored ADR (a) | 26,544 | 4,872,682 | |
| ServiceNow, Inc. (a) | 9,223 | 6,058,865 | |
| Volue A/S (a) | 133,755 | 430,308 | |
| 190,751,634 | |||
| Technology Hardware, Storage & Peripherals - 5.1% | |||
| Apple, Inc. | 333,804 | 64,173,819 | |
TOTAL INFORMATION TECHNOLOGY | 534,179,077 | ||
| MATERIALS - 0.1% | |||
| Chemicals - 0.1% | |||
| Aspen Aerogels, Inc. (a) | 62,402 | 1,867,068 | |
| TOTAL COMMON STOCKS (Cost $648,101,161) | 1,250,741,137 | ||
| Convertible Preferred Stocks - 0.2% | |||
| Shares | Value ($) | ||
| CONSUMER DISCRETIONARY - 0.0% | |||
| Textiles, Apparel & Luxury Goods - 0.0% | |||
| Canva, Inc.: | |||
| Series A (c)(d) | 106 | 113,066 | |
| Series A2 (c)(d) | 19 | 20,267 | |
| 133,333 | |||
| FINANCIALS - 0.0% | |||
| Financial Services - 0.0% | |||
| Akeana Series C (c)(d) | 8,000 | 104,800 | |
| HEALTH CARE - 0.0% | |||
| Biotechnology - 0.0% | |||
| ElevateBio LLC Series C (a)(c)(d) | 26,300 | 80,478 | |
| INFORMATION TECHNOLOGY - 0.1% | |||
| Software - 0.1% | |||
| ASAPP, Inc.: | |||
| Series C (a)(c)(d) | 90,925 | 230,950 | |
| Series D (c)(d) | 512,827 | 1,153,861 | |
| 1,384,811 | |||
| MATERIALS - 0.1% | |||
| Metals & Mining - 0.1% | |||
| Illuminated Holdings, Inc.: | |||
| Series C2 (a)(c)(d) | 21,131 | 339,998 | |
| Series C3 (a)(c)(d) | 26,414 | 425,001 | |
| Series C4 (a)(c)(d) | 6,345 | 102,091 | |
| Series C5 (a)(c)(d) | 13,150 | 211,584 | |
| 1,078,674 | |||
| TOTAL CONVERTIBLE PREFERRED STOCKS (Cost $5,043,065) | 2,782,096 | ||
| Convertible Bonds - 0.0% | |||
Principal Amount (f) | Value ($) | ||
| MATERIALS - 0.0% | |||
| Metals & Mining - 0.0% | |||
Illuminated Holdings, Inc. 15% (c)(d)(g) (Cost $248,100) | 248,100 | 246,140 | |
| Preferred Securities - 0.1% | |||
Principal Amount (f) | Value ($) | ||
| MATERIALS - 0.1% | |||
| Metals & Mining - 0.1% | |||
Illuminated Holdings, Inc. 15% (c)(d)(g) (Cost $308,400) | 308,400 | 321,379 | |
| Money Market Funds - 0.7% | |||
| Shares | Value ($) | ||
| Fidelity Cash Central Fund 5.39% (h) | 315,160 | 315,223 | |
| Fidelity Securities Lending Cash Central Fund 5.39% (h)(i) | 8,472,757 | 8,473,605 | |
| TOTAL MONEY MARKET FUNDS (Cost $8,788,828) | 8,788,828 | ||
| TOTAL INVESTMENT IN SECURITIES - 100.4% (Cost $662,489,554) | 1,262,879,580 |
NET OTHER ASSETS (LIABILITIES) - (0.4)% | (4,733,346) |
| NET ASSETS - 100.0% | 1,258,146,234 |
| (a) | Non-income producing |
| (b) | Security or a portion of the security purchased on a delayed delivery or when-issued basis. |
| (c) | Restricted securities (including private placements) - Investment in securities not registered under the Securities Act of 1933 (excluding 144A issues). At the end of the period, the value of restricted securities (excluding 144A issues) amounted to $4,388,713 or 0.3% of net assets. |
| (d) | Level 3 security |
| (e) | Security or a portion of the security is on loan at period end. |
| (f) | Amount is stated in United States dollars unless otherwise noted. |
| (g) | Security is perpetual in nature with no stated maturity date. |
| (h) | Affiliated fund that is generally available only to investment companies and other accounts managed by Fidelity Investments. The rate quoted is the annualized seven-day yield of the fund at period end. A complete unaudited listing of the fund's holdings as of its most recent quarter end is available upon request. In addition, each Fidelity Central Fund's financial statements are available on the SEC's website or upon request. |
| (i) | Investment made with cash collateral received from securities on loan. |
| Additional information on each restricted holding is as follows: | ||
| Security | Acquisition Date | Acquisition Cost ($) |
| Akeana Series C | 1/23/24 | 102,086 |
| ASAPP, Inc. warrants 8/28/28 | 8/29/23 | 0 |
| ASAPP, Inc. Series C | 4/30/21 | 599,841 |
| ASAPP, Inc. Series D | 8/29/23 | 1,980,281 |
| Canva, Inc. Series A | 9/22/23 | 113,066 |
| Canva, Inc. Series A2 | 9/22/23 | 20,267 |
| ElevateBio LLC Series C | 3/09/21 | 110,329 |
| Epic Games, Inc. | 3/29/21 | 712,425 |
| Illuminated Holdings, Inc. Series C2 | 7/07/20 | 528,275 |
| Illuminated Holdings, Inc. Series C3 | 7/07/20 | 792,420 |
| Illuminated Holdings, Inc. Series C4 | 1/08/21 | 228,420 |
| Illuminated Holdings, Inc. Series C5 | 6/16/21 | 568,080 |
| Illuminated Holdings, Inc. 15% | 6/14/23 | 248,100 |
| Illuminated Holdings, Inc. 15% | 9/27/23 | 308,400 |
| Affiliate | Value, beginning of period ($) | Purchases ($) | Sales Proceeds ($) | Dividend Income ($) | Realized Gain (loss) ($) | Change in Unrealized appreciation (depreciation) ($) | Value, end of period ($) | % ownership, end of period |
| Fidelity Cash Central Fund 5.39% | 11,953,955 | 122,955,458 | 134,594,305 | 186,594 | 115 | - | 315,223 | 0.0% |
| Fidelity Securities Lending Cash Central Fund 5.39% | 6,521,405 | 43,718,391 | 41,766,191 | 14,527 | - | - | 8,473,605 | 0.0% |
| Total | 18,475,360 | 166,673,849 | 176,360,496 | 201,121 | 115 | - | 8,788,828 | |
| Valuation Inputs at Reporting Date: | ||||
| Description | Total ($) | Level 1 ($) | Level 2 ($) | Level 3 ($) |
Investments in Securities: | ||||
| Equities: | ||||
Communication Services | 141,166,735 | 118,347,530 | 22,336,205 | 483,000 |
Consumer Discretionary | 114,575,014 | 106,267,904 | 8,173,777 | 133,333 |
Consumer Staples | 8,770,211 | 8,118,107 | 652,104 | - |
Energy | 30,895,141 | 30,895,141 | - | - |
Financials | 78,472,683 | 78,367,883 | - | 104,800 |
Health Care | 182,167,496 | 175,842,220 | 6,180,753 | 144,523 |
Industrials | 158,966,323 | 145,357,079 | 13,609,244 | - |
Information Technology | 535,563,888 | 523,552,880 | 10,070,099 | 1,940,909 |
Materials | 2,945,742 | 1,867,068 | - | 1,078,674 |
| Corporate Bonds | 246,140 | - | - | 246,140 |
| Preferred Securities | 321,379 | - | - | 321,379 |
| Money Market Funds | 8,788,828 | 8,788,828 | - | - |
| Total Investments in Securities: | 1,262,879,580 | 1,197,404,640 | 61,022,182 | 4,452,758 |
| Statement of Assets and Liabilities | ||||
May 31, 2024 (Unaudited) | ||||
| Assets | ||||
| Investment in securities, at value (including securities loaned of $8,187,022) - See accompanying schedule: | ||||
Unaffiliated issuers (cost $653,700,726) | $ | 1,254,090,752 | ||
Fidelity Central Funds (cost $8,788,828) | 8,788,828 | |||
| Total Investment in Securities (cost $662,489,554) | $ | 1,262,879,580 | ||
| Cash | 744,194 | |||
| Foreign currency held at value (cost $3) | 3 | |||
| Receivable for investments sold | 27,339,389 | |||
| Receivable for fund shares sold | 13,277 | |||
| Dividends receivable | 838,509 | |||
| Interest receivable | 12,921 | |||
| Distributions receivable from Fidelity Central Funds | 11,869 | |||
Total assets | 1,291,839,742 | |||
| Liabilities | ||||
| Payable for investments purchased | ||||
Regular delivery | $ | 1,232,725 | ||
Delayed delivery | 214,783 | |||
| Payable for fund shares redeemed | 23,236,316 | |||
| Other payables and accrued expenses | 536,859 | |||
| Collateral on securities loaned | 8,472,825 | |||
| Total liabilities | 33,693,508 | |||
| Net Assets | $ | 1,258,146,234 | ||
| Net Assets consist of: | ||||
| Paid in capital | $ | 566,034,370 | ||
| Total accumulated earnings (loss) | 692,111,864 | |||
| Net Assets | $ | 1,258,146,234 | ||
Net Asset Value, offering price and redemption price per share ($1,258,146,234 ÷ 69,083,134 shares) | $ | 18.21 | ||
| Statement of Operations | ||||
Six months ended May 31, 2024 (Unaudited) | ||||
| Investment Income | ||||
| Dividends | $ | 3,280,602 | ||
| Interest | 12,982 | |||
| Income from Fidelity Central Funds (including $14,527 from security lending) | 201,121 | |||
| Total income | 3,494,705 | |||
| Expenses | ||||
| Custodian fees and expenses | $ | 20,130 | ||
| Independent trustees' fees and expenses | 2,643 | |||
| Interest | 21,060 | |||
| Miscellaneous | 25 | |||
| Total expenses before reductions | 43,858 | |||
| Expense reductions | (1,917) | |||
| Total expenses after reductions | 41,941 | |||
| Net Investment income (loss) | 3,452,764 | |||
| Realized and Unrealized Gain (Loss) | ||||
| Net realized gain (loss) on: | ||||
| Investment Securities: | ||||
| Unaffiliated issuers (net of foreign taxes of $77,865) | 90,638,726 | |||
| Fidelity Central Funds | 115 | |||
| Foreign currency transactions | 14,969 | |||
| Total net realized gain (loss) | 90,653,810 | |||
| Change in net unrealized appreciation (depreciation) on: | ||||
| Investment Securities: | ||||
| Unaffiliated issuers (net of increase in deferred foreign taxes of $154,747) | 153,524,574 | |||
| Assets and liabilities in foreign currencies | (2,042) | |||
| Total change in net unrealized appreciation (depreciation) | 153,522,532 | |||
| Net gain (loss) | 244,176,342 | |||
| Net increase (decrease) in net assets resulting from operations | $ | 247,629,106 | ||
| Statement of Changes in Net Assets | ||||
Six months ended May 31, 2024 (Unaudited) | Year ended November 30, 2023 | |||
| Increase (Decrease) in Net Assets | ||||
| Operations | ||||
| Net investment income (loss) | $ | 3,452,764 | $ | 7,777,224 |
| Net realized gain (loss) | 90,653,810 | 64,331,601 | ||
| Change in net unrealized appreciation (depreciation) | 153,522,532 | 144,565,151 | ||
| Net increase (decrease) in net assets resulting from operations | 247,629,106 | 216,673,976 | ||
| Distributions to shareholders | (60,500,167) | (49,123,120) | ||
| Share transactions | ||||
| Proceeds from sales of shares | 82,643,515 | 213,107,203 | ||
| Reinvestment of distributions | 60,500,167 | 49,123,120 | ||
| Cost of shares redeemed | (169,918,803) | (314,349,998) | ||
Net increase (decrease) in net assets resulting from share transactions | (26,775,121) | (52,119,675) | ||
| Total increase (decrease) in net assets | 160,353,818 | 115,431,181 | ||
| Net Assets | ||||
| Beginning of period | 1,097,792,416 | 982,361,235 | ||
| End of period | $ | 1,258,146,234 | $ | 1,097,792,416 |
| Other Information | ||||
| Shares | ||||
| Sold | 4,880,671 | 15,692,482 | ||
| Issued in reinvestment of distributions | 3,972,434 | 3,914,193 | ||
| Redeemed | (10,053,341) | (22,386,584) | ||
| Net increase (decrease) | (1,200,236) | (2,779,909) | ||
Fidelity Advisor® Series Equity Growth Fund |
Six months ended (Unaudited) May 31, 2024 | Years ended November 30, 2023 | 2022 | 2021 | 2020 | 2019 | |||||||
Selected Per-Share Data | ||||||||||||
| Net asset value, beginning of period | $ | 15.62 | $ | 13.45 | $ | 19.74 | $ | 19.73 | $ | 15.53 | $ | 14.20 |
| Income from Investment Operations | ||||||||||||
Net investment income (loss) A,B | .05 | .11 | .12 | .17 C | .10 | .12 | ||||||
| Net realized and unrealized gain (loss) | 3.41 | 2.74 | (2.96) | 4.20 | 6.02 | 2.33 | ||||||
| Total from investment operations | 3.46 | 2.85 | (2.84) | 4.37 | 6.12 | 2.45 | ||||||
| Distributions from net investment income | (.11) | (.11) | (.20) | (.13) | (.13) | (.13) | ||||||
| Distributions from net realized gain | (.75) | (.57) | (3.26) | (4.23) | (1.79) | (.99) | ||||||
| Total distributions | (.87) D | (.68) | (3.45) D | (4.36) | (1.92) | (1.12) | ||||||
| Net asset value, end of period | $ | 18.21 | $ | 15.62 | $ | 13.45 | $ | 19.74 | $ | 19.73 | $ | 15.53 |
Total Return E,F | 23.20 % | 22.44% | (17.55)% | 27.43% | 44.43% | 19.73% | ||||||
Ratios to Average Net Assets B,G,H | ||||||||||||
| Expenses before reductions | .01% I,J | .01% | -% K | .01% | .01% | .01% | ||||||
| Expenses net of fee waivers, if any | .01 % I,J | .01% | -% K | -% K | .01% | .01% | ||||||
| Expenses net of all reductions | .01% I,J | .01% | -% K | -% K | .01% | .01% | ||||||
| Net investment income (loss) | .57% I,J | .77% | .84% | .95% C | .65% | .84% | ||||||
| Supplemental Data | ||||||||||||
| Net assets, end of period (000 omitted) | $ | 1,258,146 | $ | 1,097,792 | $ | 982,361 | $ | 1,123,206 | $ | 1,007,642 | $ | 977,722 |
Portfolio turnover rate L | 47 % I | 63% | 49% | 51% | 56% | 52% M |
| Fidelity Central Fund | Investment Manager | Investment Objective | Investment Practices | Expense RatioA |
| Fidelity Money Market Central Funds | Fidelity Management & Research Company LLC (FMR) | Each fund seeks to obtain a high level of current income consistent with the preservation of capital and liquidity. | Short-term Investments | Less than .005% |
| Gross unrealized appreciation | $624,895,690 |
| Gross unrealized depreciation | (25,445,928) |
| Net unrealized appreciation (depreciation) | $599,449,762 |
| Tax cost | $663,429,818 |
| Purchases ($) | Sales ($) | |
| Fidelity Advisor Series Equity Growth Fund | 282,441,727 | 364,196,497 |
| Amount ($) | |
| Fidelity Advisor Series Equity Growth Fund | 2,184 |
| Borrower or Lender | Average Loan Balance ($) | Weighted Average Interest Rate | Interest Expense ($) | |
Fidelity Advisor Series Equity Growth Fund | Borrower | 27,209,400 | 5.57% | 21,060 |
| Purchases ($) | Sales ($) | Realized Gain (Loss)($) | |
| Fidelity Advisor Series Equity Growth Fund | 15,984,709 | 13,999,378 | 2,102,263 |
| Total Security Lending Fees Paid to NFS ($) | Security Lending Income From Securities Loaned to NFS ($) | Value of Securities Loaned to NFS at Period End ($) | |
| Fidelity Advisor Series Equity Growth Fund | 1,548 | 632 | - |
 |


Contents
| Common Stocks - 96.8% | |||
| Shares | Value ($) (000s) | ||
| COMMUNICATION SERVICES - 21.3% | |||
| Entertainment - 5.9% | |||
| Netflix, Inc. (a) | 525,100 | 336,915 | |
| Roku, Inc. Class A (a) | 8,651,720 | 496,609 | |
| Sea Ltd. ADR (a)(b) | 6,053,584 | 408,738 | |
| 1,242,262 | |||
| Interactive Media & Services - 13.5% | |||
| Alphabet, Inc.: | |||
| Class A | 2,245,060 | 387,273 | |
| Class C | 5,703,680 | 992,212 | |
| Epic Games, Inc. (a)(c)(d) | 56,200 | 33,720 | |
| Meta Platforms, Inc. Class A | 2,618,485 | 1,222,387 | |
| Reddit, Inc.: | |||
| Class A (b) | 54,700 | 2,967 | |
| Class B (k) | 793,873 | 43,060 | |
| Snap, Inc. Class A (a) | 4,698,843 | 70,577 | |
| Zoominfo Technologies, Inc. (a) | 9,110,200 | 111,873 | |
| 2,864,069 | |||
| Media - 0.3% | |||
| Magnite, Inc. (a) | 4,819,031 | 59,467 | |
| The Trade Desk, Inc. (a) | 74,300 | 6,894 | |
| 66,361 | |||
| Wireless Telecommunication Services - 1.6% | |||
| T-Mobile U.S., Inc. | 1,956,125 | 342,244 | |
TOTAL COMMUNICATION SERVICES | 4,514,936 | ||
| CONSUMER DISCRETIONARY - 9.6% | |||
| Automobiles - 0.0% | |||
| Neutron Holdings, Inc. (a)(c)(d) | 474,927 | 15 | |
| Rad Power Bikes, Inc. (a)(c)(d) | 382,384 | 168 | |
| Rad Power Bikes, Inc. warrants 10/6/33 (a)(c)(d) | 449,400 | 1,016 | |
| Rivian Automotive, Inc. (a) | 22,700 | 248 | |
| Tesla, Inc. (a) | 6,940 | 1,236 | |
| 2,683 | |||
| Broadline Retail - 5.0% | |||
| Amazon.com, Inc. (a) | 5,946,340 | 1,049,172 | |
| Lenskart Solutions Pvt Ltd. (a)(c)(d) | 297,355 | 8,195 | |
| 1,057,367 | |||
| Hotels, Restaurants & Leisure - 0.8% | |||
| Chipotle Mexican Grill, Inc. (a) | 7,200 | 22,533 | |
| Domino's Pizza, Inc. | 130,200 | 66,217 | |
| Hilton Worldwide Holdings, Inc. | 393,700 | 78,976 | |
| Sonder Holdings, Inc.: | |||
| Stage 1 rights (a)(d) | 15,489 | 0 | |
| Stage 2 rights (a)(d) | 15,488 | 0 | |
| Stage 3 rights (a)(d) | 15,488 | 0 | |
| Stage 4 rights (a)(d) | 15,488 | 0 | |
| Stage 5: | |||
| rights (a)(d) | 15,488 | 0 | |
| rights (a)(d) | 15,488 | 0 | |
| 167,726 | |||
| Specialty Retail - 2.8% | |||
| Carvana Co. Class A (a)(b) | 2,075,700 | 207,528 | |
| Floor & Decor Holdings, Inc. Class A (a)(b) | 1,319,400 | 154,185 | |
| Lowe's Companies, Inc. | 898,900 | 198,918 | |
| Wayfair LLC Class A (a) | 433,529 | 25,791 | |
| 586,422 | |||
| Textiles, Apparel & Luxury Goods - 1.0% | |||
| Bombas LLC (c)(d) | 5,086,874 | 11,598 | |
| Hermes International SCA | 2,700 | 6,409 | |
| lululemon athletica, Inc. (a) | 190,010 | 59,281 | |
| LVMH Moet Hennessy Louis Vuitton SE | 172,900 | 138,276 | |
| 215,564 | |||
TOTAL CONSUMER DISCRETIONARY | 2,029,762 | ||
| CONSUMER STAPLES - 0.4% | |||
| Consumer Staples Distribution & Retail - 0.4% | |||
| BJ's Wholesale Club Holdings, Inc. (a) | 982,300 | 86,511 | |
| Food Products - 0.0% | |||
| Bowery Farming, Inc. warrants (a)(c)(d) | 219,265 | 4 | |
| Tobacco - 0.0% | |||
| JUUL Labs, Inc. Class B (a)(c)(d) | 2,772 | 3 | |
TOTAL CONSUMER STAPLES | 86,518 | ||
| ENERGY - 0.1% | |||
| Oil, Gas & Consumable Fuels - 0.1% | |||
| Cameco Corp. | 440,900 | 24,474 | |
| FINANCIALS - 4.2% | |||
| Banks - 0.2% | |||
| Starling Bank Ltd. Series D (a)(c)(d) | 6,988,700 | 28,230 | |
| Capital Markets - 1.3% | |||
| Coinbase Global, Inc. (a) | 665,200 | 150,282 | |
| LPL Financial | 461,600 | 132,115 | |
| 282,397 | |||
| Financial Services - 2.7% | |||
| Apollo Global Management, Inc. | 204,000 | 23,697 | |
| Block, Inc. Class A (a) | 1,101,100 | 70,558 | |
| Dlocal Ltd. (a) | 1,112,428 | 10,179 | |
| Global Payments, Inc. | 817,100 | 83,222 | |
| Marqeta, Inc. Class A (a) | 22,186,352 | 118,031 | |
| Rapyd Financial Network 2016 Ltd. (a)(c)(d) | 340,545 | 15,447 | |
| Visa, Inc. Class A | 928,861 | 253,077 | |
| 574,211 | |||
| Insurance - 0.0% | |||
| Progressive Corp. | 10,200 | 2,154 | |
TOTAL FINANCIALS | 886,992 | ||
| HEALTH CARE - 9.4% | |||
| Biotechnology - 1.6% | |||
| AbbVie, Inc. | 11,500 | 1,854 | |
| Alnylam Pharmaceuticals, Inc. (a) | 140,835 | 20,904 | |
| ALX Oncology Holdings, Inc. (a) | 899,000 | 9,556 | |
| Argenx SE ADR (a) | 88,399 | 32,798 | |
| Ascendis Pharma A/S sponsored ADR (a) | 67,662 | 9,141 | |
| Celldex Therapeutics, Inc. (a) | 103,662 | 3,452 | |
| Cytokinetics, Inc. (a) | 968,700 | 46,992 | |
| Keros Therapeutics, Inc. (a) | 277,800 | 13,020 | |
| Moderna, Inc. (a) | 483,200 | 68,880 | |
| Nuvalent, Inc. Class A (a) | 338,976 | 22,244 | |
| Regeneron Pharmaceuticals, Inc. (a) | 20,700 | 20,289 | |
| Vaxcyte, Inc. (a) | 1,127,343 | 79,218 | |
| Zentalis Pharmaceuticals, Inc. (a) | 886,900 | 10,536 | |
| 338,884 | |||
| Health Care Equipment & Supplies - 2.7% | |||
| Blink Health LLC Series A1 (a)(c)(d) | 56,119 | 2,317 | |
| Boston Scientific Corp. (a) | 5,060,974 | 382,458 | |
| Penumbra, Inc. (a) | 371,063 | 70,305 | |
| TransMedics Group, Inc. (a) | 849,117 | 115,820 | |
| 570,900 | |||
| Health Care Providers & Services - 1.9% | |||
| agilon health, Inc. (a) | 15,347,876 | 96,692 | |
| UnitedHealth Group, Inc. | 614,767 | 304,537 | |
| 401,229 | |||
| Life Sciences Tools & Services - 0.7% | |||
| Danaher Corp. | 250,300 | 64,277 | |
| Thermo Fisher Scientific, Inc. | 125,600 | 71,338 | |
| 135,615 | |||
| Pharmaceuticals - 2.5% | |||
| AstraZeneca PLC sponsored ADR | 93,000 | 7,256 | |
| Eli Lilly & Co. | 544,200 | 446,429 | |
| Merck & Co., Inc. | 396,500 | 49,777 | |
| Novo Nordisk A/S Series B | 162,200 | 21,976 | |
| Structure Therapeutics, Inc. ADR (a) | 263,100 | 8,998 | |
| 534,436 | |||
TOTAL HEALTH CARE | 1,981,064 | ||
| INDUSTRIALS - 6.1% | |||
| Aerospace & Defense - 0.1% | |||
| Axon Enterprise, Inc. (a) | 7,400 | 2,084 | |
| Space Exploration Technologies Corp.: | |||
| Class A (a)(c)(d) | 153,617 | 14,901 | |
| Class C (a)(c)(d) | 20,409 | 1,980 | |
| 18,965 | |||
| Building Products - 1.1% | |||
| Builders FirstSource, Inc. (a) | 1,475,277 | 237,210 | |
| Commercial Services & Supplies - 0.4% | |||
| ACV Auctions, Inc. Class A (a) | 4,256,047 | 75,970 | |
| Construction & Engineering - 0.0% | |||
| Fluor Corp. (a) | 51,600 | 2,239 | |
| Electrical Equipment - 1.3% | |||
| Eaton Corp. PLC | 114,900 | 38,244 | |
| Nextracker, Inc. Class A (a) | 2,109,633 | 116,388 | |
| Vertiv Holdings Co. | 1,244,400 | 122,038 | |
| 276,670 | |||
| Ground Transportation - 3.2% | |||
| Bird Global, Inc.: | |||
| Stage 1 rights (a)(d) | 4,240 | 0 | |
| Stage 2 rights (a)(d) | 4,240 | 0 | |
| Stage 3 rights (a)(d) | 4,240 | 0 | |
| Lyft, Inc. (a) | 7,261,190 | 113,347 | |
| Uber Technologies, Inc. (a) | 8,769,081 | 566,132 | |
| 679,479 | |||
| Machinery - 0.0% | |||
| Symbotic, Inc. (a)(b) | 231,900 | 9,176 | |
TOTAL INDUSTRIALS | 1,299,709 | ||
| INFORMATION TECHNOLOGY - 45.7% | |||
| Communications Equipment - 0.3% | |||
| Arista Networks, Inc. (a) | 215,300 | 64,084 | |
| Electronic Equipment, Instruments & Components - 1.8% | |||
| Celestica, Inc. (a) | 235,800 | 13,186 | |
| Flex Ltd. (a) | 11,205,999 | 371,255 | |
| Jabil, Inc. | 46,298 | 5,505 | |
| 389,946 | |||
| IT Services - 0.6% | |||
| EPAM Systems, Inc. (a) | 228,137 | 40,592 | |
| MongoDB, Inc. Class A (a) | 400,600 | 94,566 | |
| 135,158 | |||
| Semiconductors & Semiconductor Equipment - 24.3% | |||
| Advanced Micro Devices, Inc. (a) | 1,351,300 | 225,532 | |
| Analog Devices, Inc. | 9,400 | 2,204 | |
| Applied Materials, Inc. | 335,301 | 72,117 | |
| Arm Holdings Ltd. ADR | 2,000 | 241 | |
| ASML Holding NV (Netherlands) | 4,500 | 4,305 | |
| Astera Labs, Inc. | 188,200 | 12,146 | |
| Broadcom, Inc. | 257,000 | 341,437 | |
| First Solar, Inc. (a) | 674,968 | 183,429 | |
| Marvell Technology, Inc. | 4,439,330 | 305,470 | |
| Micron Technology, Inc. | 475,600 | 59,450 | |
| NVIDIA Corp. | 2,566,772 | 2,814,029 | |
| NXP Semiconductors NV | 1,428,767 | 388,768 | |
| ON Semiconductor Corp. (a) | 5,234,061 | 382,296 | |
| Qualcomm, Inc. | 260,500 | 53,155 | |
| Taiwan Semiconductor Manufacturing Co. Ltd. sponsored ADR | 1,931,000 | 291,658 | |
| Xsight Labs Ltd. warrants 1/11/34 (a)(c)(d) | 54,999 | 101 | |
| 5,136,338 | |||
| Software - 12.8% | |||
| Cadence Design Systems, Inc. (a) | 12,800 | 3,665 | |
| Convoy, Inc. warrants (a)(c)(d) | 68,035 | 0 | |
| CoreWeave, Inc. (c)(d) | 10,181 | 7,932 | |
| Datadog, Inc. Class A (a) | 879,700 | 96,925 | |
| HubSpot, Inc. (a) | 93,849 | 57,346 | |
| Intapp, Inc. (a)(b) | 2,549,769 | 91,537 | |
| Microsoft Corp. | 4,861,615 | 2,018,202 | |
| Oracle Corp. | 1,676,900 | 196,516 | |
| Pine Labs Private Ltd. (a)(c)(d) | 16,636 | 5,103 | |
| Salesforce, Inc. | 431,538 | 101,170 | |
| Samsara, Inc. (a) | 519,900 | 17,640 | |
| ServiceNow, Inc. (a) | 167,358 | 109,942 | |
| Stripe, Inc. Class B (a)(c)(d) | 73,500 | 1,911 | |
| Synopsys, Inc. (a) | 13,700 | 7,683 | |
| 2,715,572 | |||
| Technology Hardware, Storage & Peripherals - 5.9% | |||
| Apple, Inc. | 5,480,660 | 1,053,657 | |
| Dell Technologies, Inc. | 1,052,800 | 146,929 | |
| Pure Storage, Inc. Class A (a) | 750,200 | 45,230 | |
| 1,245,816 | |||
TOTAL INFORMATION TECHNOLOGY | 9,686,914 | ||
| TOTAL COMMON STOCKS (Cost $10,635,470) | 20,510,369 | ||
| Preferred Stocks - 2.2% | |||
| Shares | Value ($) (000s) | ||
| Convertible Preferred Stocks - 1.8% | |||
| COMMUNICATION SERVICES - 0.1% | |||
| Interactive Media & Services - 0.1% | |||
| ByteDance Ltd. Series E1 (a)(c)(d) | 116,411 | 27,641 | |
| CONSUMER DISCRETIONARY - 0.1% | |||
| Automobiles - 0.0% | |||
| Rad Power Bikes, Inc.: | |||
| Series A(a)(c)(d) | 49,852 | 22 | |
| Series C(a)(c)(d) | 196,163 | 143 | |
| Series D(a)(c)(d) | 415,700 | 441 | |
| 606 | |||
| Broadline Retail - 0.1% | |||
| Meesho: | |||
| Series E1(c)(d) | 17,820 | 1,001 | |
| Series F(a)(c)(d) | 243,800 | 13,938 | |
| 14,939 | |||
TOTAL CONSUMER DISCRETIONARY | 15,545 | ||
| CONSUMER STAPLES - 0.0% | |||
| Consumer Staples Distribution & Retail - 0.0% | |||
| GoBrands, Inc. Series G (a)(c)(d) | 70,400 | 2,393 | |
| Food Products - 0.0% | |||
| Bowery Farming, Inc.: | |||
| Series C1(a)(c)(d) | 404,785 | 8 | |
| Series D1(c)(d) | 219,265 | 4 | |
| 12 | |||
| Tobacco - 0.0% | |||
| JUUL Labs, Inc.: | |||
| Series C(a)(c)(d) | 566,439 | 606 | |
| Series D(a)(c)(d) | 3,671 | 4 | |
| 610 | |||
TOTAL CONSUMER STAPLES | 3,015 | ||
| FINANCIALS - 0.1% | |||
| Financial Services - 0.1% | |||
| Circle Internet Financial Ltd. Series F (a)(c)(d) | 155,650 | 4,657 | |
| Tenstorrent Holdings, Inc. Series C1 (c)(d) | 63,679 | 3,994 | |
| Thriveworks TopCo LLC Series B (a)(c)(d)(e) | 764,320 | 7,666 | |
| 16,317 | |||
| HEALTH CARE - 0.1% | |||
| Health Care Equipment & Supplies - 0.1% | |||
| Blink Health LLC Series C (a)(c)(d) | 234,164 | 9,669 | |
| Health Care Technology - 0.0% | |||
| Aledade, Inc. Series E1 (a)(c)(d) | 153,312 | 6,040 | |
TOTAL HEALTH CARE | 15,709 | ||
| INDUSTRIALS - 0.6% | |||
| Aerospace & Defense - 0.4% | |||
| Relativity Space, Inc. Series E (a)(c)(d) | 1,068,417 | 23,665 | |
| Space Exploration Technologies Corp.: | |||
| Series I(a)(c)(d) | 16,438 | 15,945 | |
| Series N(a)(c)(d) | 51,400 | 49,858 | |
| 89,468 | |||
| Construction & Engineering - 0.2% | |||
| Beta Technologies, Inc. Series A (a)(c)(d) | 441,839 | 48,797 | |
TOTAL INDUSTRIALS | 138,265 | ||
| INFORMATION TECHNOLOGY - 0.7% | |||
| Electronic Equipment, Instruments & Components - 0.1% | |||
| CelLink Corp. Series D (a)(c)(d) | 380,829 | 2,967 | |
| Enevate Corp. Series E (a)(c)(d) | 7,873,996 | 5,827 | |
| VAST Data Ltd.: | |||
| Series A(c)(d) | 54,250 | 977 | |
| Series A1(c)(d) | 133,528 | 2,404 | |
| Series A2(c)(d) | 153,600 | 2,765 | |
| Series B(c)(d) | 122,222 | 2,200 | |
| Series C(c)(d) | 3,563 | 64 | |
| Series E(c)(d) | 116,791 | 2,102 | |
| 19,306 | |||
| IT Services - 0.0% | |||
| Yanka Industries, Inc.: | |||
| Series E(a)(c)(d) | 341,047 | 1,576 | |
| Series F(a)(c)(d) | 380,955 | 2,229 | |
| 3,805 | |||
| Semiconductors & Semiconductor Equipment - 0.1% | |||
| Sima Technologies, Inc.: | |||
| Series B(a)(c)(d) | 1,198,500 | 8,042 | |
| Series B1(a)(c)(d) | 171,099 | 1,316 | |
| Xsight Labs Ltd.: | |||
| Series D(a)(c)(d) | 501,100 | 2,576 | |
| Series D1(c)(d) | 183,329 | 1,355 | |
| 13,289 | |||
| Software - 0.5% | |||
| Anthropic PBC Series D (c)(d) | 66,894 | 2,007 | |
| Bolt Technology OU Series E (a)(c)(d) | 290,611 | 38,571 | |
| Convoy, Inc. Series D (a)(c)(d) | 1,038,289 | 0 | |
| CoreWeave, Inc. Series C (c)(d) | 653 | 509 | |
| Databricks, Inc.: | |||
| Series G(a)(c)(d) | 181,200 | 14,248 | |
| Series H(a)(c)(d) | 32,352 | 2,544 | |
| Series I(c)(d) | 2,463 | 194 | |
| Moloco, Inc. Series A (c)(d) | 265,144 | 14,458 | |
| Mountain Digital, Inc. Series D (a)(c)(d) | 896,466 | 11,080 | |
| Skyryse, Inc. Series B (a)(c)(d) | 244,100 | 4,965 | |
| Stripe, Inc. Series H (a)(c)(d) | 165,183 | 4,295 | |
| xAI Corp. Series B (c)(d) | 1,044,317 | 12,500 | |
| 105,371 | |||
TOTAL INFORMATION TECHNOLOGY | 141,771 | ||
| MATERIALS - 0.1% | |||
| Metals & Mining - 0.1% | |||
| Diamond Foundry, Inc. Series C (a)(c)(d) | 674,317 | 15,051 | |
| TOTAL CONVERTIBLE PREFERRED STOCKS | 373,314 | ||
| Nonconvertible Preferred Stocks - 0.4% | |||
| CONSUMER DISCRETIONARY - 0.0% | |||
| Automobiles - 0.0% | |||
| Neutron Holdings, Inc. Series 1C (a)(c)(d) | 6,477,300 | 202 | |
| Waymo LLC Series A2 (a)(c)(d) | 47,838 | 2,877 | |
| 3,079 | |||
| FINANCIALS - 0.2% | |||
| Financial Services - 0.2% | |||
| Circle Internet Financial Ltd. Series E (a)(c)(d) | 1,497,818 | 44,815 | |
| INFORMATION TECHNOLOGY - 0.2% | |||
| IT Services - 0.0% | |||
| Gupshup, Inc. (a)(c)(d) | 509,400 | 4,834 | |
| Software - 0.2% | |||
| Pine Labs Private Ltd.: | |||
| Series 1(a)(c)(d) | 39,764 | 12,198 | |
| Series A(a)(c)(d) | 9,936 | 3,048 | |
| Series B(a)(c)(d) | 10,808 | 3,316 | |
| Series B2(a)(c)(d) | 8,745 | 2,683 | |
| Series C(a)(c)(d) | 16,265 | 4,990 | |
| Series C1(a)(c)(d) | 3,427 | 1,051 | |
| Series D(a)(c)(d) | 3,667 | 1,125 | |
| 28,411 | |||
TOTAL INFORMATION TECHNOLOGY | 33,245 | ||
| TOTAL NONCONVERTIBLE PREFERRED STOCKS | 81,139 | ||
| TOTAL PREFERRED STOCKS (Cost $516,479) | 454,453 | ||
| Convertible Bonds - 0.1% | |||
Principal Amount (f) (000s) | Value ($) (000s) | ||
| CONSUMER DISCRETIONARY - 0.1% | |||
| Automobiles - 0.1% | |||
| Neutron Holdings, Inc.: | |||
| 4% 5/22/27 (c)(d) | 843 | 1,088 | |
| 4% 6/12/27 (c)(d) | 232 | 299 | |
| 6.5% 10/29/26 (c)(d)(g) | 13,810 | 14,709 | |
| 16,096 | |||
| INFORMATION TECHNOLOGY - 0.0% | |||
| Software - 0.0% | |||
| Convoy, Inc. 15% 9/30/26 (c)(d) | 453 | 0 | |
| TOTAL CONVERTIBLE BONDS (Cost $15,338) | 16,096 | ||
| Preferred Securities - 0.0% | |||
Principal Amount (f) (000s) | Value ($) (000s) | ||
| CONSUMER DISCRETIONARY - 0.0% | |||
| Automobiles - 0.0% | |||
| Rad Power Bikes, Inc. 8% 12/31/25 (c)(d) | 449 | 817 | |
| INFORMATION TECHNOLOGY - 0.0% | |||
| Electronic Equipment, Instruments & Components - 0.0% | |||
| Enevate Corp. 6% (c)(d)(h) | 409 | 449 | |
| Semiconductors & Semiconductor Equipment - 0.0% | |||
| Sima Technologies, Inc. 10% 12/31/27 (c)(d) | 1,245 | 1,279 | |
TOTAL INFORMATION TECHNOLOGY | 1,728 | ||
| TOTAL PREFERRED SECURITIES (Cost $2,103) | 2,545 | ||
| Money Market Funds - 1.0% | |||
| Shares | Value ($) (000s) | ||
| Fidelity Cash Central Fund 5.39% (i) | 80,049,259 | 80,065 | |
| Fidelity Securities Lending Cash Central Fund 5.39% (i)(j) | 135,872,369 | 135,886 | |
| TOTAL MONEY MARKET FUNDS (Cost $215,951) | 215,951 | ||
| Equity Funds - 0.3% | |||
| Shares | Value ($) (000s) | ||
| Domestic Equity Funds - 0.3% | |||
iShares Russell 1000 Growth ETF (Cost $65,672) | 189,600 | 64,898 | |
| TOTAL INVESTMENT IN SECURITIES - 100.4% (Cost $11,451,013) | 21,264,312 |
NET OTHER ASSETS (LIABILITIES) - (0.4)% | (78,678) |
| NET ASSETS - 100.0% | 21,185,634 |
| ETF | - | EXCHANGE-TRADED FUND |
| (a) | Non-income producing |
| (b) | Security or a portion of the security is on loan at period end. |
| (c) | Restricted securities (including private placements) - Investment in securities not registered under the Securities Act of 1933 (excluding 144A issues). At the end of the period, the value of restricted securities (excluding 144A issues) amounted to $605,735,000 or 2.9% of net assets. |
| (d) | Level 3 security |
| (e) | Investment is owned by a wholly-owned subsidiary (Subsidiary) that is treated as a corporation for U.S. tax purposes. |
| (f) | Amount is stated in United States dollars unless otherwise noted. |
| (g) | Security initially issued at one coupon which converts to a higher coupon at a specified date. The rate shown is the rate at period end. |
| (h) | Security is perpetual in nature with no stated maturity date. |
| (i) | Affiliated fund that is generally available only to investment companies and other accounts managed by Fidelity Investments. The rate quoted is the annualized seven-day yield of the fund at period end. A complete unaudited listing of the fund's holdings as of its most recent quarter end is available upon request. In addition, each Fidelity Central Fund's financial statements are available on the SEC's website or upon request. |
| (j) | Investment made with cash collateral received from securities on loan. |
| (k) | Equity security is subject to lock-up or market standoff agreement. Fair value is based on the unadjusted market price of the equivalent equity security. As of period end, the total fair value of unadjusted equity securities subject to contractual sale restrictions is $43,060 and all restrictions are set to expire on or before September 30, 2024. Under normal market conditions, there are no circumstances that could cause the restrictions to lapse. |
| Additional information on each restricted holding is as follows: | ||
| Security | Acquisition Date | Acquisition Cost ($) (000s) |
| Aledade, Inc. Series E1 | 5/20/22 | 7,637 |
| Anthropic PBC Series D | 5/31/24 | 2,007 |
| Beta Technologies, Inc. Series A | 4/09/21 | 32,374 |
| Blink Health LLC Series A1 | 12/30/20 | 1,520 |
| Blink Health LLC Series C | 11/07/19 - 7/14/21 | 8,939 |
| Bolt Technology OU Series E | 1/03/22 | 75,500 |
| Bombas LLC | 2/16/21 - 11/12/21 | 24,316 |
| Bowery Farming, Inc. Series C1 | 5/18/21 | 24,388 |
| Bowery Farming, Inc. Series D1 | 10/25/23 | 2,072 |
| Bowery Farming, Inc. warrants | 10/25/23 | 0 |
| ByteDance Ltd. Series E1 | 11/18/20 | 12,756 |
| CelLink Corp. Series D | 1/20/22 | 7,930 |
| Circle Internet Financial Ltd. Series E | 5/11/21 | 24,310 |
| Circle Internet Financial Ltd. Series F | 5/09/22 | 6,559 |
| Convoy, Inc. Series D | 10/30/19 | 14,058 |
| Convoy, Inc. warrants | 3/24/23 | 0 |
| Convoy, Inc. 15% 9/30/26 | 3/24/23 | 453 |
| CoreWeave, Inc. | 11/29/23 | 3,155 |
| CoreWeave, Inc. Series C | 5/17/24 | 509 |
| Databricks, Inc. Series G | 2/01/21 | 10,713 |
| Databricks, Inc. Series H | 8/31/21 | 2,377 |
| Databricks, Inc. Series I | 9/14/23 | 181 |
| Diamond Foundry, Inc. Series C | 3/15/21 | 16,184 |
| Enevate Corp. Series E | 1/29/21 | 8,730 |
| Enevate Corp. 6% | 11/02/23 | 409 |
| Epic Games, Inc. | 7/13/20 - 3/29/21 | 45,615 |
| GoBrands, Inc. Series G | 3/02/21 | 17,580 |
| Gupshup, Inc. | 6/08/21 | 11,648 |
| JUUL Labs, Inc. Class B | 11/21/17 | 0 |
| JUUL Labs, Inc. Series C | 5/22/15 | 0 |
| JUUL Labs, Inc. Series D | 6/25/18 | 0 |
| Lenskart Solutions Pvt Ltd. | 4/30/24 | 8,195 |
| Meesho Series E1 | 4/18/24 | 998 |
| Meesho Series F | 9/21/21 | 18,693 |
| Moloco, Inc. Series A | 6/26/23 | 15,909 |
| Mountain Digital, Inc. Series D | 11/05/21 | 20,588 |
| Neutron Holdings, Inc. | 2/04/21 | 5 |
| Neutron Holdings, Inc. Series 1C | 7/03/18 | 1,184 |
| Neutron Holdings, Inc. 4% 5/22/27 | 6/04/20 | 843 |
| Neutron Holdings, Inc. 4% 6/12/27 | 6/12/20 | 232 |
| Neutron Holdings, Inc. 6.5% 10/29/26 | 10/29/21 - 4/29/24 | 13,811 |
| Pine Labs Private Ltd. | 6/30/21 | 6,203 |
| Pine Labs Private Ltd. Series 1 | 6/30/21 | 14,826 |
| Pine Labs Private Ltd. Series A | 6/30/21 | 3,705 |
| Pine Labs Private Ltd. Series B | 6/30/21 | 4,030 |
| Pine Labs Private Ltd. Series B2 | 6/30/21 | 3,261 |
| Pine Labs Private Ltd. Series C | 6/30/21 | 6,065 |
| Pine Labs Private Ltd. Series C1 | 6/30/21 | 1,278 |
| Pine Labs Private Ltd. Series D | 6/30/21 | 1,367 |
| Rad Power Bikes, Inc. | 1/21/21 | 1,845 |
| Rad Power Bikes, Inc. warrants 10/6/33 | 10/06/23 | 0 |
| Rad Power Bikes, Inc. Series A | 1/21/21 | 240 |
| Rad Power Bikes, Inc. Series C | 1/21/21 | 946 |
| Rad Power Bikes, Inc. Series D | 9/17/21 | 3,984 |
| Rad Power Bikes, Inc. 8% 12/31/25 | 10/06/23 | 449 |
| Rapyd Financial Network 2016 Ltd. | 3/30/21 | 25,000 |
| Relativity Space, Inc. Series E | 5/27/21 | 24,397 |
| Sima Technologies, Inc. Series B | 5/10/21 | 6,145 |
| Sima Technologies, Inc. Series B1 | 4/25/22 - 10/17/22 | 1,213 |
| Sima Technologies, Inc. 10% 12/31/27 | 4/08/24 | 1,245 |
| Skyryse, Inc. Series B | 10/21/21 | 6,024 |
| Space Exploration Technologies Corp. Class A | 2/16/21 - 4/02/24 | 10,226 |
| Space Exploration Technologies Corp. Class C | 4/02/24 | 1,980 |
| Space Exploration Technologies Corp. Series I | 4/05/18 | 2,778 |
| Space Exploration Technologies Corp. Series N | 8/04/20 | 13,878 |
| Starling Bank Ltd. Series D | 6/18/21 - 4/05/22 | 13,359 |
| Stripe, Inc. Class B | 5/18/21 | 2,949 |
| Stripe, Inc. Series H | 3/15/21 - 5/25/23 | 6,628 |
| Tenstorrent Holdings, Inc. Series C1 | 4/23/21 | 3,786 |
| Thriveworks TopCo LLC Series B | 7/23/21 - 2/25/22 | 22,050 |
| VAST Data Ltd. Series A | 11/28/23 | 597 |
| VAST Data Ltd. Series A1 | 11/28/23 | 1,469 |
| VAST Data Ltd. Series A2 | 11/28/23 | 1,690 |
| VAST Data Ltd. Series B | 11/28/23 | 1,344 |
| VAST Data Ltd. Series C | 11/28/23 | 39 |
| VAST Data Ltd. Series E | 11/28/23 | 2,569 |
| Waymo LLC Series A2 | 5/08/20 | 4,108 |
| xAI Corp. Series B | 5/13/24 | 12,500 |
| Xsight Labs Ltd. warrants 1/11/34 | 1/11/24 | 0 |
| Xsight Labs Ltd. Series D | 2/16/21 | 4,007 |
| Xsight Labs Ltd. Series D1 | 1/11/24 | 1,466 |
| Yanka Industries, Inc. Series E | 5/15/20 | 4,120 |
| Yanka Industries, Inc. Series F | 4/08/21 | 12,144 |
| Affiliate (Amounts in thousands) | Value, beginning of period ($) | Purchases ($) | Sales Proceeds ($) | Dividend Income ($) | Realized Gain (loss) ($) | Change in Unrealized appreciation (depreciation) ($) | Value, end of period ($) | % ownership, end of period |
| Fidelity Cash Central Fund 5.39% | 33,286 | 1,428,095 | 1,381,314 | 894 | (2) | - | 80,065 | 0.2% |
| Fidelity Securities Lending Cash Central Fund 5.39% | 248,823 | 832,267 | 945,204 | 266 | - | - | 135,886 | 0.5% |
| Total | 282,109 | 2,260,362 | 2,326,518 | 1,160 | (2) | - | 215,951 | |
| Valuation Inputs at Reporting Date: | ||||
Description (Amounts in thousands) | Total ($) | Level 1 ($) | Level 2 ($) | Level 3 ($) |
Investments in Securities: | ||||
| Equities: | ||||
Communication Services | 4,542,577 | 4,481,216 | - | 61,361 |
Consumer Discretionary | 2,048,386 | 1,864,085 | 144,685 | 39,616 |
Consumer Staples | 89,533 | 86,511 | - | 3,022 |
Energy | 24,474 | 24,474 | - | - |
Financials | 948,124 | 843,315 | - | 104,809 |
Health Care | 1,996,773 | 1,956,771 | 21,976 | 18,026 |
Industrials | 1,437,974 | 1,282,828 | - | 155,146 |
Information Technology | 9,861,930 | 9,667,562 | 4,305 | 190,063 |
Materials | 15,051 | - | - | 15,051 |
| Corporate Bonds | 16,096 | - | - | 16,096 |
| Preferred Securities | 2,545 | - | - | 2,545 |
| Money Market Funds | 215,951 | 215,951 | - | - |
| Equity Funds | 64,898 | 64,898 | - | - |
| Total Investments in Securities: | 21,264,312 | 20,487,611 | 170,966 | 605,735 |
| Net Unrealized Appreciation on Unfunded Commitments | 47 | - | - | 47 |
| Total | 47 | - | - | 47 |
| (Amounts in thousands) | |||
| Investments in Securities: | |||
| Beginning Balance | $ | 578,506 | |
| Net Realized Gain (Loss) on Investment Securities | (475) | ||
| Net Unrealized Gain (Loss) on Investment Securities | 16,339 | ||
| Cost of Purchases | 36,471 | ||
| Proceeds of Sales | (170) | ||
| Amortization/Accretion | - | ||
| Transfers into Level 3 | - | ||
| Transfers out of Level 3 | (24,936) | ||
| Ending Balance | $ | 605,735 | |
| The change in unrealized gain (loss) for the period attributable to Level 3 securities held at May 31, 2024 | $ | 16,323 | |
| The information used in the above reconciliation represents fiscal year to date activity for any Investments in Securities identified as using Level 3 inputs at either the beginning or the end of the current fiscal period. Cost of purchases and proceeds of sales may include securities received and/or delivered through in-kind transactions, corporate actions or exchanges. Transfers into Level 3 were attributable to a lack of observable market data resulting from decreases in market activity, decreases in liquidity, security restructurings or corporate actions. Transfers out of Level 3 were attributable to observable market data becoming available for those securities. Transfers in or out of Level 3 represent the beginning value of any Security or Instrument where a change in the pricing level occurred from the beginning to the end of the period. Realized and unrealized gains (losses) disclosed in the reconciliation are included in Net Gain (Loss) on the Fund's consolidated Statement of Operations. | |||
| Consolidated Statement of Assets and Liabilities | ||||
| Amounts in thousands (except per-share amounts) | May 31, 2024 (Unaudited) | |||
| Assets | ||||
| Investment in securities, at value (including securities loaned of $134,808) - See accompanying schedule: | ||||
Unaffiliated issuers (cost $11,235,062) | $ | 21,048,361 | ||
Fidelity Central Funds (cost $215,951) | 215,951 | |||
| Total Investment in Securities (cost $11,451,013) | $ | 21,264,312 | ||
| Cash | 12 | |||
| Foreign currency held at value (cost $508) | 508 | |||
| Receivable for investments sold | 122,005 | |||
| Unrealized appreciation on unfunded commitments | 47 | |||
| Receivable for fund shares sold | 29,709 | |||
| Dividends receivable | 8,197 | |||
| Interest receivable | 330 | |||
| Distributions receivable from Fidelity Central Funds | 245 | |||
| Prepaid expenses | 3 | |||
| Other receivables | 11 | |||
Total assets | 21,425,379 | |||
| Liabilities | ||||
| Payable for investments purchased | $ | 61,600 | ||
| Payable for fund shares redeemed | 30,391 | |||
| Accrued management fee | 8,094 | |||
| Distribution and service plan fees payable | 3,045 | |||
| Other payables and accrued expenses | 748 | |||
| Collateral on securities loaned | 135,867 | |||
| Total liabilities | 239,745 | |||
| Commitments and contingent liabilities (see Commitments note) | ||||
| Net Assets | $ | 21,185,634 | ||
| Net Assets consist of: | ||||
| Paid in capital | $ | 12,646,634 | ||
| Total accumulated earnings (loss) | 8,539,000 | |||
| Net Assets | $ | 21,185,634 | ||
| Net Asset Value and Maximum Offering Price | ||||
| Class A : | ||||
Net Asset Value and redemption price per share ($4,220,218 ÷ 27,997 shares)(a) | $ | 150.74 | ||
| Maximum offering price per share (100/94.25 of $150.74) | $ | 159.94 | ||
| Class M : | ||||
Net Asset Value and redemption price per share ($3,039,993 ÷ 20,555 shares)(a) | $ | 147.90 | ||
| Maximum offering price per share (100/96.50 of $147.90) | $ | 153.26 | ||
| Class C : | ||||
Net Asset Value and offering price per share ($1,118,426 ÷ 9,284 shares)(a) | $ | 120.47 | ||
| Class I : | ||||
Net Asset Value, offering price and redemption price per share ($9,177,714 ÷ 54,828 shares) | $ | 167.39 | ||
| Class Z : | ||||
Net Asset Value, offering price and redemption price per share ($3,629,283 ÷ 21,366 shares) | $ | 169.86 | ||
(a)Redemption price per share is equal to net asset value less any applicable contingent deferred sales charge. | ||||
| Consolidated Statement of Operations | ||||
| Amounts in thousands | Six months ended May 31, 2024 (Unaudited) | |||
| Investment Income | ||||
| Dividends | $ | 34,520 | ||
| Interest | 436 | |||
| Income from Fidelity Central Funds (including $266 from security lending) | 1,160 | |||
| Total income | 36,116 | |||
| Expenses | ||||
| Management fee | ||||
| Basic fee | $ | 57,540 | ||
| Performance adjustment | (18,807) | |||
| Transfer agent fees | 6,849 | |||
| Distribution and service plan fees | 17,219 | |||
| Accounting fees | 397 | |||
| Custodian fees and expenses | 131 | |||
| Independent trustees' fees and expenses | 42 | |||
| Registration fees | 171 | |||
| Audit | 45 | |||
| Legal | 14 | |||
| Interest | 38 | |||
| Miscellaneous | 125 | |||
| Total expenses before reductions | 63,764 | |||
| Expense reductions | (836) | |||
| Total expenses after reductions | 62,928 | |||
| Net Investment income (loss) | (26,812) | |||
| Realized and Unrealized Gain (Loss) | ||||
| Net realized gain (loss) on: | ||||
| Investment Securities: | ||||
| Unaffiliated issuers | 1,114,563 | |||
| Fidelity Central Funds | (2) | |||
| Foreign currency transactions | 515 | |||
| Total net realized gain (loss) | 1,115,076 | |||
| Change in net unrealized appreciation (depreciation) on: | ||||
| Investment Securities: | ||||
| Unaffiliated issuers | 3,176,052 | |||
| Unfunded commitments | 47 | |||
| Assets and liabilities in foreign currencies | (30) | |||
| Total change in net unrealized appreciation (depreciation) | 3,176,069 | |||
| Net gain (loss) | 4,291,145 | |||
| Net increase (decrease) in net assets resulting from operations | $ | 4,264,333 | ||
| Consolidated Statement of Changes in Net Assets | ||||
| Amount in thousands | Six months ended May 31, 2024 (Unaudited) | Year ended November 30, 2023 | ||
| Increase (Decrease) in Net Assets | ||||
| Operations | ||||
| Net investment income (loss) | $ | (26,812) | $ | (26,886) |
| Net realized gain (loss) | 1,115,076 | (315,578) | ||
| Change in net unrealized appreciation (depreciation) | 3,176,069 | 3,775,315 | ||
| Net increase (decrease) in net assets resulting from operations | 4,264,333 | 3,432,851 | ||
| Share transactions - net increase (decrease) | (360,311) | (1,067,199) | ||
| Total increase (decrease) in net assets | 3,904,022 | 2,365,652 | ||
| Net Assets | ||||
| Beginning of period | 17,281,612 | 14,915,960 | ||
| End of period | $ | 21,185,634 | $ | 17,281,612 |
Fidelity Advisor® Growth Opportunities Fund Class A |
Six months ended (Unaudited) May 31, 2024 | Years ended November 30, 2023 | 2022 | 2021 | 2020 | 2019 | |||||||
Selected Per-Share Data | ||||||||||||
| Net asset value, beginning of period | $ | 120.74 | $ | 96.87 | $ | 159.95 | $ | 141.06 | $ | 90.00 | $ | 76.87 |
| Income from Investment Operations | ||||||||||||
Net investment income (loss) A,B | (.26) | (.29) | (.38) | (1.06) | (.56) | (.18) C | ||||||
| Net realized and unrealized gain (loss) | 30.26 | 24.16 | (48.08) | 27.68 | 55.26 | 21.21 | ||||||
| Total from investment operations | 30.00 | 23.87 | (48.46) | 26.62 | 54.70 | 21.03 | ||||||
| Distributions from net realized gain | - | - | (14.62) | (7.73) | (3.64) | (7.90) | ||||||
| Total distributions | - | - | (14.62) | (7.73) | (3.64) | (7.90) | ||||||
| Net asset value, end of period | $ | 150.74 | $ | 120.74 | $ | 96.87 | $ | 159.95 | $ | 141.06 | $ | 90.00 |
Total Return D,E,F | 24.85 % | 24.64% | (33.31)% | 19.60% | 63.12% | 31.29% | ||||||
Ratios to Average Net Assets B,G,H | ||||||||||||
| Expenses before reductions | .75% I | .72% | .89% | 1.04% | 1.06% | 1.11% | ||||||
| Expenses net of fee waivers, if any | .74 % I | .72% | .89% | 1.04% | 1.06% | 1.11% | ||||||
| Expenses net of all reductions | .74% I | .72% | .89% | 1.04% | 1.06% | 1.10% | ||||||
| Net investment income (loss) | (.37)% I | (.27)% | (.35)% | (.68)% | (.52)% | (.22)% C | ||||||
| Supplemental Data | ||||||||||||
| Net assets, end of period (in millions) | $ | 4,220 | $ | 3,384 | $ | 2,749 | $ | 4,184 | $ | 3,037 | $ | 1,349 |
Portfolio turnover rate J | 55 % I | 50% K | 75% | 66% | 47% | 37% K |
Fidelity Advisor® Growth Opportunities Fund Class M |
Six months ended (Unaudited) May 31, 2024 | Years ended November 30, 2023 | 2022 | 2021 | 2020 | 2019 | |||||||
Selected Per-Share Data | ||||||||||||
| Net asset value, beginning of period | $ | 118.60 | $ | 95.39 | $ | 157.62 | $ | 139.13 | $ | 89.03 | $ | 76.28 |
| Income from Investment Operations | ||||||||||||
Net investment income (loss) A,B | (.42) | (.53) | (.64) | (1.41) | (.79) | (.37) C | ||||||
| Net realized and unrealized gain (loss) | 29.72 | 23.74 | (47.42) | 27.31 | 54.53 | 21.02 | ||||||
| Total from investment operations | 29.30 | 23.21 | (48.06) | 25.90 | 53.74 | 20.65 | ||||||
| Distributions from net realized gain | - | - | (14.17) | (7.41) | (3.64) | (7.90) | ||||||
| Total distributions | - | - | (14.17) | (7.41) | (3.64) | (7.90) | ||||||
| Net asset value, end of period | $ | 147.90 | $ | 118.60 | $ | 95.39 | $ | 157.62 | $ | 139.13 | $ | 89.03 |
Total Return D,E,F | 24.70 % | 24.33% | (33.47)% | 19.31% | 62.71% | 31.01% | ||||||
Ratios to Average Net Assets B,G,H | ||||||||||||
| Expenses before reductions | .99% I | .96% | 1.13% | 1.28% | 1.30% | 1.34% | ||||||
| Expenses net of fee waivers, if any | .98 % I | .96% | 1.13% | 1.28% | 1.30% | 1.34% | ||||||
| Expenses net of all reductions | .98% I | .96% | 1.13% | 1.28% | 1.30% | 1.34% | ||||||
| Net investment income (loss) | (.61)% I | (.51)% | (.59)% | (.93)% | (.76)% | (.46)% C | ||||||
| Supplemental Data | ||||||||||||
| Net assets, end of period (in millions) | $ | 3,040 | $ | 2,513 | $ | 2,136 | $ | 3,481 | $ | 3,153 | $ | 2,094 |
Portfolio turnover rate J | 55 % I | 50% K | 75% | 66% | 47% | 37% K |
Fidelity Advisor® Growth Opportunities Fund Class C |
Six months ended (Unaudited) May 31, 2024 | Years ended November 30, 2023 | 2022 | 2021 | 2020 | 2019 | |||||||
Selected Per-Share Data | ||||||||||||
| Net asset value, beginning of period | $ | 96.86 | $ | 78.30 | $ | 132.10 | $ | 118.14 | $ | 76.50 | $ | 67.03 |
| Income from Investment Operations | ||||||||||||
Net investment income (loss) A,B | (.62) | (.88) | (.99) | (1.85) | (1.15) | (.67) C | ||||||
| Net realized and unrealized gain (loss) | 24.23 | 19.44 | (39.09) | 23.04 | 46.43 | 18.04 | ||||||
| Total from investment operations | 23.61 | 18.56 | (40.08) | 21.19 | 45.28 | 17.37 | ||||||
| Distributions from net realized gain | - | - | (13.72) | (7.23) | (3.64) | (7.90) | ||||||
| Total distributions | - | - | (13.72) | (7.23) | (3.64) | (7.90) | ||||||
| Net asset value, end of period | $ | 120.47 | $ | 96.86 | $ | 78.30 | $ | 132.10 | $ | 118.14 | $ | 76.50 |
Total Return D,E,F | 24.38 % | 23.70% | (33.81)% | 18.70% | 61.89% | 30.31% | ||||||
Ratios to Average Net Assets B,G,H | ||||||||||||
| Expenses before reductions | 1.50% I | 1.48% | 1.65% | 1.80% | 1.81% | 1.86% | ||||||
| Expenses net of fee waivers, if any | 1.49 % I | 1.47% | 1.64% | 1.80% | 1.81% | 1.86% | ||||||
| Expenses net of all reductions | 1.49% I | 1.47% | 1.64% | 1.80% | 1.81% | 1.86% | ||||||
| Net investment income (loss) | (1.12)% I | (1.02)% | (1.10)% | (1.44)% | (1.27)% | (.98)% C | ||||||
| Supplemental Data | ||||||||||||
| Net assets, end of period (in millions) | $ | 1,118 | $ | 925 | $ | 828 | $ | 1,413 | $ | 1,159 | $ | 483 |
Portfolio turnover rate J | 55 % I | 50% K | 75% | 66% | 47% | 37% K |
Fidelity Advisor® Growth Opportunities Fund Class I |
Six months ended (Unaudited) May 31, 2024 | Years ended November 30, 2023 | 2022 | 2021 | 2020 | 2019 | |||||||
Selected Per-Share Data | ||||||||||||
| Net asset value, beginning of period | $ | 133.91 | $ | 107.16 | $ | 175.33 | $ | 153.77 | $ | 97.56 | $ | 82.42 |
| Income from Investment Operations | ||||||||||||
Net investment income (loss) A,B | (.09) | (.02) | (.12) | (.74) | (.31) | .03 C | ||||||
| Net realized and unrealized gain (loss) | 33.57 | 26.77 | (53.08) | 30.27 | 60.16 | 23.01 | ||||||
| Total from investment operations | 33.48 | 26.75 | (53.20) | 29.53 | 59.85 | 23.04 | ||||||
| Distributions from net realized gain | - | - | (14.97) | (7.97) | (3.64) | (7.90) | ||||||
| Total distributions | - | - | (14.97) | (7.97) | (3.64) | (7.90) | ||||||
| Net asset value, end of period | $ | 167.39 | $ | 133.91 | $ | 107.16 | $ | 175.33 | $ | 153.77 | $ | 97.56 |
Total Return D,E | 25.00 % | 24.96% | (33.15)% | 19.90% | 63.52% | 31.66% | ||||||
Ratios to Average Net Assets B,F,G | ||||||||||||
| Expenses before reductions | .49% H | .47% | .64% | .79% | .80% | .84% | ||||||
| Expenses net of fee waivers, if any | .49 % H | .47% | .64% | .79% | .80% | .84% | ||||||
| Expenses net of all reductions | .49% H | .47% | .64% | .79% | .80% | .84% | ||||||
| Net investment income (loss) | (.12)% H | (.02)% | (.10)% | (.43)% | (.26)% | .04% C | ||||||
| Supplemental Data | ||||||||||||
| Net assets, end of period (in millions) | $ | 9,178 | $ | 7,615 | $ | 6,873 | $ | 12,620 | $ | 8,282 | $ | 2,819 |
Portfolio turnover rate I | 55 % H | 50% J | 75% | 66% | 47% | 37% J |
Fidelity Advisor® Growth Opportunities Fund Class Z |
Six months ended (Unaudited) May 31, 2024 | Years ended November 30, 2023 | 2022 | 2021 | 2020 | 2019 | |||||||
Selected Per-Share Data | ||||||||||||
| Net asset value, beginning of period | $ | 135.80 | $ | 108.54 | $ | 177.37 | $ | 155.40 | $ | 98.44 | $ | 83.00 |
| Income from Investment Operations | ||||||||||||
Net investment income (loss) A,B | - C | .13 | .03 | (.54) | (.17) | .14 D | ||||||
| Net realized and unrealized gain (loss) | 34.06 | 27.13 | (53.71) | 30.58 | 60.77 | 23.20 | ||||||
| Total from investment operations | 34.06 | 27.26 | (53.68) | 30.04 | 60.60 | 23.34 | ||||||
| Distributions from net realized gain | - | - | (15.15) | (8.07) | (3.64) | (7.90) | ||||||
| Total distributions | - | - | (15.15) | (8.07) | (3.64) | (7.90) | ||||||
| Net asset value, end of period | $ | 169.86 | $ | 135.80 | $ | 108.54 | $ | 177.37 | $ | 155.40 | $ | 98.44 |
Total Return E,F | 25.08 % | 25.12% | (33.06)% | 20.04% | 63.72% | 31.81% | ||||||
Ratios to Average Net Assets B,G,H | ||||||||||||
| Expenses before reductions | .37% I | .35% | .52% | .67% | .69% | .72% | ||||||
| Expenses net of fee waivers, if any | .36 % I | .34% | .51% | .67% | .68% | .72% | ||||||
| Expenses net of all reductions | .36% I | .34% | .51% | .67% | .68% | .72% | ||||||
| Net investment income (loss) | -% I,J | .11% | .03% | (.31)% | (.15)% | .16% D | ||||||
| Supplemental Data | ||||||||||||
| Net assets, end of period (in millions) | $ | 3,629 | $ | 2,844 | $ | 2,330 | $ | 3,828 | $ | 2,826 | $ | 1,114 |
Portfolio turnover rate K | 55 % I | 50% L | 75% | 66% | 47% | 37% L |
| Fidelity Central Fund | Investment Manager | Investment Objective | Investment Practices | Expense RatioA |
| Fidelity Money Market Central Funds | Fidelity Management & Research Company LLC (FMR) | Each fund seeks to obtain a high level of current income consistent with the preservation of capital and liquidity. | Short-term Investments | Less than .005% |
| Asset Type | Fair Value | Valuation Technique(s) | Unobservable Input | Amount or Range/Weighted Average | Impact to Valuation from an Increase in InputA |
| Equities | $587,094 | Recovery value | Recovery value | $0.00 | Increase |
| Market approach | Transaction price | $1.10 - $78.20 / $19.15 | Increase | ||
| Discount rate | 40.0% | Decrease | |||
| Premium rate | 35.0% - 65.0% / 44.0% | Increase | |||
| Market comparable | Enterprise value/Revenue multiple (EV/R) | 0.9 - 23.0 / 6.4 | Increase | ||
| Enterprise value/EBITDA multiple (EV/EBITDA) | 18.6 - 21.3 / 19.6 | Increase | |||
| Enterprise value/Net income multiple (EV/NI) | 16.0 | Increase | |||
| Discounted cash flow | Weighted average cost of capital (WACC) | 28.9% | Decrease | ||
| Exit multiple | 1.5 | Increase | |||
| Black scholes | Discount rate | 4.1% - 5.2% / 4.7% | Increase | ||
| Volatility | 50.0% - 100.0% / 72.1% | Increase | |||
| Term | 1.0 - 5.0 / 3.6 | Increase | |||
| Corporate Bonds | $16,096 | Recovery value | Recovery value | $0.00 | Increase |
| Market comparable | Enterprise value/Revenue multiple (EV/R) | 0.8 | Increase | ||
| Discount rate | 29.2% | Decrease | |||
| Probability rate | 10.0% - 75.0% / 33.3% | Increase | |||
| Black scholes | Discount rate | 5.3% | Increase | ||
| Volatility | 75.0% | Increase | |||
| Term | 0.8 | Increase | |||
| Preferred Securities | $2,545 | Recovery value | Recovery value | $0.00 | Increase |
| Market approach | Transaction price | $100.00 | Increase | ||
| Discount rate | 35.4% -37.9% / 37.2% | Decrease | |||
| Probability rate | 0.0% - 60.0% / 36.0% | Increase | |||
| Market comparable | Enterprise value/Revenue multiple (EV/R) | 1.7 | Increase | ||
| Black scholes | Discount rate | 4.8% - 5.5% / 5.1% | Increase | ||
| Volatility | 50.0% - 100.0% / 62.1% | Increase | |||
| Term | 0.4 - 2.1 / 1.3 | Increase |
| Fidelity Advisor Growth Opportunities Fund | $11 |
| Gross unrealized appreciation | $10,563,757 |
| Gross unrealized depreciation | (814,608) |
| Net unrealized appreciation (depreciation) | $9,749,149 |
| Tax cost | $11,515,163 |
| Short-term | $(2,124,156) |
| Long-term | (110,414) |
| Total capital loss carryforward | $(2,234,570) |
| Investment to be Acquired | Commitment Amount ($) | Unrealized Appreciation (Depreciation)($) | |
| Fidelity Advisor Growth Opportunities Fund | JUUL Labs, Inc. Class A | 19,373 | 47 |
| Amount ($) | % of Net Assets | |
| Fidelity Advisor Growth Opportunities Fund | 7,666 | .04 |
| Purchases ($) | Sales ($) | |
| Fidelity Advisor Growth Opportunities Fund | 5,359,508 | 5,828,734 |
| Shares | Total net realized gain or loss ($) | Total Proceeds ($) | |
| Fidelity Advisor Growth Opportunities Fund | 90 | 9,166 | 10,082 |
| Maximum Management Fee Rate % | |
| Class A | .67 |
| Class M | .66 |
| Class C | .67 |
| Class I | .67 |
| Class Z | .54 |
| Total Management Fee Rate % | |
| Class A | .66 |
| Class M | .66 |
| Class C | .67 |
| Class I | .66 |
| Class Z | .54 |
| Performance Adjustment Index | |
| Fidelity Advisor Growth Opportunities Fund | Russell 1000 Growth Index |
| Distribution Fee | Service Fee | Total Fees ($) | Retained by FDC ($) | |
| Class A | - % | .25% | 4,849 | 86 |
| Class M | .25% | .25% | 7,125 | 23 |
| Class C | .75% | .25% | 5,245 | 611 |
| 17,219 | 720 |
| Retained by FDC ($) | |
| Class A | 1,080 |
| Class M | 42 |
Class CA | 3 |
| 1,125 |
| % of Class-Level Average Net Assets | |
| Class A | .1666 |
| Class M | .1573 |
| Class C | .1724 |
| Class I | .1660 |
| Amount ($) | % of Class-Level Average Net AssetsA | |
| Class A | 1,553 | .17 |
| Class M | 1,084 | .16 |
| Class C | 437 | .17 |
| Class I | 3,448 | .17 |
| Class Z | 327 | .04 |
| 6,849 |
| % of Average Net Assets | |
| Fidelity Advisor Growth Opportunities Fund | .0085 |
| % of Average Net Assets | |
| Fidelity Advisor Growth Opportunities Fund | .01 |
| Borrower or Lender | Average Loan Balance ($) | Weighted Average Interest Rate | Interest Expense ($) | |
Fidelity Advisor Growth Opportunities Fund | Borrower | 24,502 | 5.57% | 38 |
| Amount ($) | |
| Fidelity Advisor Growth Opportunities Fund | 73 |
| Purchases ($) | Sales ($) | Realized Gain (Loss)($) | |
| Fidelity Advisor Growth Opportunities Fund | 238,236 | 283,494 | (4,463) |
| Amount ($) | |
| Fidelity Advisor Growth Opportunities Fund | 17 |
| Total Security Lending Fees Paid to NFS ($) | Security Lending Income From Securities Loaned to NFS ($) | Value of Securities Loaned to NFS at Period End ($) | |
| Fidelity Advisor Growth Opportunities Fund | 28 | 10 | - |
| Shares | Shares | Dollars | Dollars | |
Six months ended May 31, 2024 | Year ended November 30, 2023 | Six months ended May 31, 2024 | Year ended November 30, 2023 | |
| Fidelity Advisor Growth Opportunities Fund | ||||
| Class A | ||||
| Shares sold | 2,381 | 4,751 | $332,704 | $506,438 |
| Shares redeemed | (2,408) | (5,107) | (333,412) | (529,835) |
| Net increase (decrease) | (27) | (356) | $(708) | $(23,397) |
| Class M | ||||
| Shares sold | 1,053 | 1,865 | $143,176 | $195,104 |
| Shares redeemed | (1,689) | (3,069) | (229,706) | (317,685) |
| Net increase (decrease) | (636) | (1,204) | $(86,530) | $(122,581) |
| Class C | ||||
| Shares sold | 681 | 1,331 | $75,525 | $113,706 |
| Shares redeemed | (948) | (2,350) | (105,505) | (197,044) |
| Net increase (decrease) | (267) | (1,019) | $(29,980) | $(83,338) |
| Class I | ||||
| Shares sold | 6,424 | 15,365 | $988,537 | $1,790,597 |
| Shares redeemed | (8,466) | (22,630) | (1,298,739) | (2,584,365) |
| Net increase (decrease) | (2,042) | (7,265) | $(310,202) | $(793,768) |
| Class Z | ||||
| Shares sold | 3,575 | 6,638 | $554,263 | $785,386 |
| Shares redeemed | (3,153) | (7,160) | (487,154) | (829,501) |
| Net increase (decrease) | 422 | (522) | $67,109 | $(44,115) |
 |


Contents
| Common Stocks - 97.3% | |||
| Shares | Value ($) | ||
| COMMUNICATION SERVICES - 5.2% | |||
| Entertainment - 2.5% | |||
| The Walt Disney Co. | 49,918 | 5,186,979 | |
| Media - 2.7% | |||
| Comcast Corp. Class A | 143,495 | 5,744,105 | |
TOTAL COMMUNICATION SERVICES | 10,931,084 | ||
| CONSUMER DISCRETIONARY - 4.3% | |||
| Diversified Consumer Services - 1.9% | |||
| H&R Block, Inc. | 78,532 | 3,898,328 | |
| Household Durables - 0.2% | |||
| Berkeley Group Holdings PLC | 7,000 | 472,363 | |
| Specialty Retail - 1.9% | |||
| Lowe's Companies, Inc. | 6,300 | 1,394,127 | |
| Murphy U.S.A., Inc. | 1,700 | 745,875 | |
| Ross Stores, Inc. | 13,693 | 1,913,734 | |
| 4,053,736 | |||
| Textiles, Apparel & Luxury Goods - 0.3% | |||
| Tapestry, Inc. | 14,600 | 634,954 | |
TOTAL CONSUMER DISCRETIONARY | 9,059,381 | ||
| CONSUMER STAPLES - 11.3% | |||
| Beverages - 3.6% | |||
| Coca-Cola Europacific Partners PLC | 19,073 | 1,405,871 | |
| Diageo PLC | 37,243 | 1,253,874 | |
| Keurig Dr. Pepper, Inc. | 68,421 | 2,343,419 | |
| The Coca-Cola Co. | 40,652 | 2,558,230 | |
| 7,561,394 | |||
| Consumer Staples Distribution & Retail - 1.8% | |||
| Alimentation Couche-Tard, Inc. Class A (multi-vtg.) | 9,500 | 554,477 | |
| BJ's Wholesale Club Holdings, Inc. (a) | 16,998 | 1,497,014 | |
| U.S. Foods Holding Corp. (a) | 34,354 | 1,814,922 | |
| 3,866,413 | |||
| Food Products - 2.3% | |||
| Lamb Weston Holdings, Inc. | 22,494 | 1,985,995 | |
| Mondelez International, Inc. | 21,276 | 1,458,044 | |
| Tyson Foods, Inc. Class A | 23,780 | 1,361,405 | |
| 4,805,444 | |||
| Household Products - 1.1% | |||
| Procter & Gamble Co. | 14,199 | 2,336,303 | |
| Personal Care Products - 2.5% | |||
| Haleon PLC | 387,616 | 1,610,698 | |
| Kenvue, Inc. | 187,581 | 3,620,313 | |
| 5,231,011 | |||
TOTAL CONSUMER STAPLES | 23,800,565 | ||
| ENERGY - 9.2% | |||
| Oil, Gas & Consumable Fuels - 9.2% | |||
| Antero Resources Corp. (a) | 41,021 | 1,461,578 | |
| Equinor ASA sponsored ADR | 55,889 | 1,628,605 | |
| Exxon Mobil Corp. | 80,778 | 9,472,029 | |
| Occidental Petroleum Corp. | 23,269 | 1,454,313 | |
| Ovintiv, Inc. | 26,821 | 1,385,841 | |
| Parex Resources, Inc. | 87,432 | 1,435,015 | |
| Parkland Corp. | 10,200 | 294,337 | |
| Shell PLC ADR | 31,051 | 2,259,892 | |
| 19,391,610 | |||
| FINANCIALS - 24.6% | |||
| Banks - 11.9% | |||
| Bank of America Corp. | 151,496 | 6,058,325 | |
| Cullen/Frost Bankers, Inc. | 4,143 | 420,846 | |
| JPMorgan Chase & Co. | 39,738 | 8,052,111 | |
| M&T Bank Corp. | 11,254 | 1,706,106 | |
| PNC Financial Services Group, Inc. | 15,133 | 2,381,783 | |
| U.S. Bancorp | 40,871 | 1,657,319 | |
| Wells Fargo & Co. | 81,429 | 4,879,226 | |
| 25,155,716 | |||
| Capital Markets - 2.6% | |||
| Affiliated Managers Group, Inc. | 2,085 | 339,021 | |
| BlackRock, Inc. Class A | 4,555 | 3,516,597 | |
| Northern Trust Corp. | 20,658 | 1,740,230 | |
| 5,595,848 | |||
| Financial Services - 3.5% | |||
| Apollo Global Management, Inc. | 10,700 | 1,242,912 | |
| Berkshire Hathaway, Inc. Class B (a) | 14,624 | 6,060,186 | |
| 7,303,098 | |||
| Insurance - 6.6% | |||
| Chubb Ltd. | 23,084 | 6,251,609 | |
| The Travelers Companies, Inc. | 25,190 | 5,433,483 | |
| Willis Towers Watson PLC | 8,939 | 2,282,037 | |
| 13,967,129 | |||
TOTAL FINANCIALS | 52,021,791 | ||
| HEALTH CARE - 16.0% | |||
| Health Care Providers & Services - 9.5% | |||
| Centene Corp. (a) | 65,750 | 4,707,043 | |
| Cigna Group | 18,085 | 6,232,453 | |
| CVS Health Corp. | 43,082 | 2,567,687 | |
| Elevance Health, Inc. | 5,529 | 2,977,256 | |
| UnitedHealth Group, Inc. | 7,436 | 3,683,571 | |
| 20,168,010 | |||
| Pharmaceuticals - 6.5% | |||
| AstraZeneca PLC sponsored ADR | 50,070 | 3,906,461 | |
| Bristol-Myers Squibb Co. | 70,166 | 2,883,121 | |
| Johnson & Johnson | 21,621 | 3,171,152 | |
| Roche Holding AG (participation certificate) | 5,957 | 1,520,923 | |
| Sanofi SA sponsored ADR | 46,056 | 2,258,126 | |
| 13,739,783 | |||
TOTAL HEALTH CARE | 33,907,793 | ||
| INDUSTRIALS - 11.3% | |||
| Aerospace & Defense - 3.6% | |||
| Airbus Group NV | 7,778 | 1,323,052 | |
| L3Harris Technologies, Inc. | 5,736 | 1,289,625 | |
| Lockheed Martin Corp. | 4,165 | 1,958,966 | |
| Northrop Grumman Corp. | 5,344 | 2,408,915 | |
| The Boeing Co. (a) | 3,100 | 550,591 | |
| 7,531,149 | |||
| Air Freight & Logistics - 1.2% | |||
| DHL Group | 25,206 | 1,061,182 | |
| FedEx Corp. | 6,000 | 1,523,760 | |
| 2,584,942 | |||
| Building Products - 0.4% | |||
| Johnson Controls International PLC | 12,900 | 927,639 | |
| Electrical Equipment - 0.9% | |||
| GE Vernova LLC | 2,300 | 404,570 | |
| Regal Rexnord Corp. | 8,060 | 1,205,292 | |
| Vestas Wind Systems A/S (a) | 11,800 | 331,089 | |
| 1,940,951 | |||
| Industrial Conglomerates - 1.5% | |||
| Siemens AG | 16,353 | 3,151,898 | |
| Machinery - 2.7% | |||
| Cummins, Inc. | 2,000 | 563,460 | |
| Deere & Co. | 8,313 | 3,115,380 | |
| Oshkosh Corp. | 2,690 | 305,934 | |
| Pentair PLC | 20,991 | 1,708,248 | |
| 5,693,022 | |||
| Professional Services - 1.0% | |||
| Genpact Ltd. | 23,100 | 763,686 | |
| Maximus, Inc. | 15,012 | 1,292,533 | |
| 2,056,219 | |||
TOTAL INDUSTRIALS | 23,885,820 | ||
| INFORMATION TECHNOLOGY - 5.7% | |||
| Communications Equipment - 1.9% | |||
| Cisco Systems, Inc. | 86,163 | 4,006,580 | |
| IT Services - 2.2% | |||
| Amdocs Ltd. | 29,045 | 2,294,555 | |
| Capgemini SA | 6,674 | 1,352,166 | |
| Cognizant Technology Solutions Corp. Class A | 15,022 | 993,705 | |
| 4,640,426 | |||
| Software - 1.6% | |||
| Gen Digital, Inc. | 106,283 | 2,639,007 | |
| Open Text Corp. | 24,400 | 713,700 | |
| 3,352,707 | |||
TOTAL INFORMATION TECHNOLOGY | 11,999,713 | ||
| MATERIALS - 2.3% | |||
| Chemicals - 1.7% | |||
| CF Industries Holdings, Inc. | 23,305 | 1,858,108 | |
| Nutrien Ltd. | 30,286 | 1,775,062 | |
| 3,633,170 | |||
| Containers & Packaging - 0.6% | |||
| Crown Holdings, Inc. | 15,962 | 1,343,841 | |
TOTAL MATERIALS | 4,977,011 | ||
| REAL ESTATE - 1.1% | |||
| Equity Real Estate Investment Trusts (REITs) - 1.1% | |||
| Crown Castle, Inc. | 13,835 | 1,418,088 | |
| Simon Property Group, Inc. | 5,700 | 862,467 | |
| 2,280,555 | |||
| UTILITIES - 6.3% | |||
| Electric Utilities - 4.6% | |||
| Edison International | 35,347 | 2,716,417 | |
| NextEra Energy, Inc. | 17,068 | 1,365,781 | |
| PG&E Corp. | 263,919 | 4,893,058 | |
| Southern Co. | 8,870 | 710,842 | |
| 9,686,098 | |||
| Independent Power and Renewable Electricity Producers - 0.6% | |||
| The AES Corp. | 59,806 | 1,291,212 | |
| Multi-Utilities - 1.1% | |||
| National Grid PLC | 77,333 | 876,182 | |
| National Grid PLC rights 6/10/24 (a) | 22,555 | 56,628 | |
| Sempra | 17,331 | 1,335,007 | |
| 2,267,817 | |||
TOTAL UTILITIES | 13,245,127 | ||
| TOTAL COMMON STOCKS (Cost $163,298,119) | 205,500,450 | ||
| Nonconvertible Preferred Stocks - 1.1% | |||
| Shares | Value ($) | ||
| INFORMATION TECHNOLOGY - 1.1% | |||
| Technology Hardware, Storage & Peripherals - 1.1% | |||
Samsung Electronics Co. Ltd. (Cost $2,344,042) | 55,362 | 2,418,606 | |
| Money Market Funds - 1.2% | |||
| Shares | Value ($) | ||
Fidelity Cash Central Fund 5.39% (b) (Cost $2,466,778) | 2,466,285 | 2,466,778 | |
| TOTAL INVESTMENT IN SECURITIES - 99.6% (Cost $168,108,939) | 210,385,834 |
NET OTHER ASSETS (LIABILITIES) - 0.4% | 823,503 |
| NET ASSETS - 100.0% | 211,209,337 |
| (a) | Non-income producing |
| (b) | Affiliated fund that is generally available only to investment companies and other accounts managed by Fidelity Investments. The rate quoted is the annualized seven-day yield of the fund at period end. A complete unaudited listing of the fund's holdings as of its most recent quarter end is available upon request. In addition, each Fidelity Central Fund's financial statements are available on the SEC's website or upon request. |
| Affiliate | Value, beginning of period ($) | Purchases ($) | Sales Proceeds ($) | Dividend Income ($) | Realized Gain (loss) ($) | Change in Unrealized appreciation (depreciation) ($) | Value, end of period ($) | % ownership, end of period |
| Fidelity Cash Central Fund 5.39% | 2,706,128 | 23,829,520 | 24,068,857 | 69,637 | (13) | - | 2,466,778 | 0.0% |
| Fidelity Securities Lending Cash Central Fund 5.39% | - | 1,711,492 | 1,711,491 | 116 | - | (1) | - | 0.0% |
| Total | 2,706,128 | 25,541,012 | 25,780,348 | 69,753 | (13) | (1) | 2,466,778 | |
| Valuation Inputs at Reporting Date: | ||||
| Description | Total ($) | Level 1 ($) | Level 2 ($) | Level 3 ($) |
Investments in Securities: | ||||
| Equities: | ||||
Communication Services | 10,931,084 | 10,931,084 | - | - |
Consumer Discretionary | 9,059,381 | 8,587,018 | 472,363 | - |
Consumer Staples | 23,800,565 | 20,935,993 | 2,864,572 | - |
Energy | 19,391,610 | 19,391,610 | - | - |
Financials | 52,021,791 | 52,021,791 | - | - |
Health Care | 33,907,793 | 32,386,870 | 1,520,923 | - |
Industrials | 23,885,820 | 18,018,599 | 5,867,221 | - |
Information Technology | 14,418,319 | 10,647,547 | 3,770,772 | - |
Materials | 4,977,011 | 4,977,011 | - | - |
Real Estate | 2,280,555 | 2,280,555 | - | - |
Utilities | 13,245,127 | 12,312,317 | 932,810 | - |
| Money Market Funds | 2,466,778 | 2,466,778 | - | - |
| Total Investments in Securities: | 210,385,834 | 194,957,173 | 15,428,661 | - |
| Statement of Assets and Liabilities | ||||
May 31, 2024 (Unaudited) | ||||
| Assets | ||||
| Investment in securities, at value - See accompanying schedule: | ||||
Unaffiliated issuers (cost $165,642,161) | $ | 207,919,056 | ||
Fidelity Central Funds (cost $2,466,778) | 2,466,778 | |||
| Total Investment in Securities (cost $168,108,939) | $ | 210,385,834 | ||
| Foreign currency held at value (cost $21,147) | 22,070 | |||
| Receivable for investments sold | 452,149 | |||
| Receivable for fund shares sold | 122,899 | |||
| Dividends receivable | 304,846 | |||
| Reclaims receivable | 107,335 | |||
| Distributions receivable from Fidelity Central Funds | 9,359 | |||
| Prepaid expenses | 37 | |||
Total assets | 211,404,529 | |||
| Liabilities | ||||
| Payable for fund shares redeemed | $ | 9,431 | ||
| Accrued management fee | 100,465 | |||
| Distribution and service plan fees payable | 48,138 | |||
| Audit fee payable | 28,984 | |||
| Other payables and accrued expenses | 8,174 | |||
| Total liabilities | 195,192 | |||
| Net Assets | $ | 211,209,337 | ||
| Net Assets consist of: | ||||
| Paid in capital | $ | 161,250,521 | ||
| Total accumulated earnings (loss) | 49,958,816 | |||
| Net Assets | $ | 211,209,337 | ||
| Net Asset Value and Maximum Offering Price | ||||
| Class A : | ||||
Net Asset Value and redemption price per share ($117,513,302 ÷ 4,990,130 shares)(a) | $ | 23.55 | ||
| Maximum offering price per share (100/94.25 of $23.55) | $ | 24.99 | ||
| Class M : | ||||
Net Asset Value and redemption price per share ($30,985,279 ÷ 1,315,212 shares)(a) | $ | 23.56 | ||
| Maximum offering price per share (100/96.50 of $23.56) | $ | 24.41 | ||
| Class C : | ||||
Net Asset Value and offering price per share ($13,030,752 ÷ 567,707 shares)(a) | $ | 22.95 | ||
| Class I : | ||||
Net Asset Value, offering price and redemption price per share ($36,735,135 ÷ 1,516,018 shares) | $ | 24.23 | ||
| Class Z : | ||||
Net Asset Value, offering price and redemption price per share ($12,944,869 ÷ 538,100 shares) | $ | 24.06 | ||
(a)Redemption price per share is equal to net asset value less any applicable contingent deferred sales charge. | ||||
| Statement of Operations | ||||
Six months ended May 31, 2024 (Unaudited) | ||||
| Investment Income | ||||
| Dividends | $ | 2,417,612 | ||
| Income from Fidelity Central Funds (including $116 from security lending) | 69,753 | |||
| Total income | 2,487,365 | |||
| Expenses | ||||
| Management fee | ||||
| Basic fee | $ | 635,865 | ||
| Performance adjustment | (68,281) | |||
| Transfer agent fees | 88,856 | |||
| Distribution and service plan fees | 288,443 | |||
| Accounting fees | 18,513 | |||
| Custodian fees and expenses | 9,625 | |||
| Independent trustees' fees and expenses | 479 | |||
| Registration fees | 66,752 | |||
| Audit | 33,536 | |||
| Legal | 2,769 | |||
| Miscellaneous | 3,149 | |||
| Total expenses before reductions | 1,079,706 | |||
| Expense reductions | (10,134) | |||
| Total expenses after reductions | 1,069,572 | |||
| Net Investment income (loss) | 1,417,793 | |||
| Realized and Unrealized Gain (Loss) | ||||
| Net realized gain (loss) on: | ||||
| Investment Securities: | ||||
| Unaffiliated issuers | 6,859,453 | |||
| Fidelity Central Funds | (13) | |||
| Foreign currency transactions | (1,926) | |||
| Total net realized gain (loss) | 6,857,514 | |||
| Change in net unrealized appreciation (depreciation) on: | ||||
| Investment Securities: | ||||
| Unaffiliated issuers | 9,440,380 | |||
| Fidelity Central Funds | (1) | |||
| Assets and liabilities in foreign currencies | (2,384) | |||
| Total change in net unrealized appreciation (depreciation) | 9,437,995 | |||
| Net gain (loss) | 16,295,509 | |||
| Net increase (decrease) in net assets resulting from operations | $ | 17,713,302 | ||
| Statement of Changes in Net Assets | ||||
Six months ended May 31, 2024 (Unaudited) | Year ended November 30, 2023 | |||
| Increase (Decrease) in Net Assets | ||||
| Operations | ||||
| Net investment income (loss) | $ | 1,417,793 | $ | 2,664,817 |
| Net realized gain (loss) | 6,857,514 | 5,124,506 | ||
| Change in net unrealized appreciation (depreciation) | 9,437,995 | (14,274,163) | ||
| Net increase (decrease) in net assets resulting from operations | 17,713,302 | (6,484,840) | ||
| Distributions to shareholders | (6,994,111) | (3,783,745) | ||
| Share transactions - net increase (decrease) | (6,332,549) | (24,978,755) | ||
| Total increase (decrease) in net assets | 4,386,642 | (35,247,340) | ||
| Net Assets | ||||
| Beginning of period | 206,822,695 | 242,070,035 | ||
| End of period | $ | 211,209,337 | $ | 206,822,695 |
Fidelity Advisor® Equity Value Fund Class A |
Six months ended (Unaudited) May 31, 2024 | Years ended November 30, 2023 | 2022 | 2021 | 2020 | 2019 | |||||||
Selected Per-Share Data | ||||||||||||
| Net asset value, beginning of period | $ | 22.39 | $ | 23.31 | $ | 22.52 | $ | 18.87 | $ | 18.81 | $ | 18.77 |
| Income from Investment Operations | ||||||||||||
Net investment income (loss) A,B | .16 | .27 | .20 | .16 | .24 C | .26 | ||||||
| Net realized and unrealized gain (loss) | 1.77 | (.83) | 1.30 | 3.69 | .80 | 1.25 | ||||||
| Total from investment operations | 1.93 | (.56) | 1.50 | 3.85 | 1.04 | 1.51 | ||||||
| Distributions from net investment income | (.30) | (.19) | (.11) | (.20) | (.45) | (.28) | ||||||
| Distributions from net realized gain | (.47) | (.17) | (.60) | - | (.53) | (1.19) | ||||||
| Total distributions | (.77) | (.36) | (.71) | (.20) | (.98) | (1.47) | ||||||
| Net asset value, end of period | $ | 23.55 | $ | 22.39 | $ | 23.31 | $ | 22.52 | $ | 18.87 | $ | 18.81 |
Total Return D,E,F | 8.80 % | (2.38)% | 6.63% | 20.58% | 5.68% | 9.75% | ||||||
Ratios to Average Net Assets B,G,H | ||||||||||||
| Expenses before reductions | 1.02% I | 1.14% | 1.19% | 1.14% | 1.11% | 1.00% | ||||||
| Expenses net of fee waivers, if any | 1.01 % I | 1.13% | 1.15% | 1.14% | 1.10% | 1.00% | ||||||
| Expenses net of all reductions | 1.01% I | 1.13% | 1.15% | 1.14% | 1.09% | .99% | ||||||
| Net investment income (loss) | 1.36% I | 1.24% | .90% | .73% | 1.44% C | 1.47% | ||||||
| Supplemental Data | ||||||||||||
| Net assets, end of period (000 omitted) | $ | 117,513 | $ | 110,910 | $ | 117,379 | $ | 96,669 | $ | 67,291 | $ | 71,916 |
Portfolio turnover rate J | 30 % I | 29% | 40% | 35% | 75% | 43% K |
Fidelity Advisor® Equity Value Fund Class M |
Six months ended (Unaudited) May 31, 2024 | Years ended November 30, 2023 | 2022 | 2021 | 2020 | 2019 | |||||||
Selected Per-Share Data | ||||||||||||
| Net asset value, beginning of period | $ | 22.37 | $ | 23.28 | $ | 22.50 | $ | 18.85 | $ | 18.79 | $ | 18.73 |
| Income from Investment Operations | ||||||||||||
Net investment income (loss) A,B | .13 | .22 | .14 | .11 | .20 C | .21 | ||||||
| Net realized and unrealized gain (loss) | 1.78 | (.83) | 1.29 | 3.69 | .79 | 1.26 | ||||||
| Total from investment operations | 1.91 | (.61) | 1.43 | 3.80 | .99 | 1.47 | ||||||
| Distributions from net investment income | (.25) | (.13) | (.05) | (.15) | (.40) | (.23) | ||||||
| Distributions from net realized gain | (.47) | (.17) | (.60) | - | (.53) | (1.19) | ||||||
| Total distributions | (.72) | (.30) | (.65) | (.15) | (.93) | (1.41) D | ||||||
| Net asset value, end of period | $ | 23.56 | $ | 22.37 | $ | 23.28 | $ | 22.50 | $ | 18.85 | $ | 18.79 |
Total Return E,F,G | 8.69 % | (2.60)% | 6.32% | 20.31% | 5.37% | 9.51% | ||||||
Ratios to Average Net Assets B,H,I | ||||||||||||
| Expenses before reductions | 1.26% J | 1.38% | 1.44% | 1.39% | 1.37% | 1.26% | ||||||
| Expenses net of fee waivers, if any | 1.25 % J | 1.38% | 1.40% | 1.38% | 1.36% | 1.26% | ||||||
| Expenses net of all reductions | 1.25% J | 1.37% | 1.40% | 1.38% | 1.35% | 1.26% | ||||||
| Net investment income (loss) | 1.11% J | .99% | .65% | .48% | 1.19% C | 1.21% | ||||||
| Supplemental Data | ||||||||||||
| Net assets, end of period (000 omitted) | $ | 30,985 | $ | 30,938 | $ | 33,509 | $ | 31,217 | $ | 25,905 | $ | 28,791 |
Portfolio turnover rate K | 30 % J | 29% | 40% | 35% | 75% | 43% L |
Fidelity Advisor® Equity Value Fund Class C |
Six months ended (Unaudited) May 31, 2024 | Years ended November 30, 2023 | 2022 | 2021 | 2020 | 2019 | |||||||
Selected Per-Share Data | ||||||||||||
| Net asset value, beginning of period | $ | 21.73 | $ | 22.65 | $ | 21.89 | $ | 18.33 | $ | 18.29 | $ | 18.25 |
| Income from Investment Operations | ||||||||||||
Net investment income (loss) A,B | .07 | .10 | .03 | (.01) | .10 C | .12 | ||||||
| Net realized and unrealized gain (loss) | 1.72 | (.80) | 1.25 | 3.61 | .76 | 1.24 | ||||||
| Total from investment operations | 1.79 | (.70) | 1.28 | 3.60 | .86 | 1.36 | ||||||
| Distributions from net investment income | (.10) | (.05) | - | (.04) | (.29) | (.13) | ||||||
| Distributions from net realized gain | (.47) | (.17) | (.52) | - | (.53) | (1.19) | ||||||
| Total distributions | (.57) | (.22) | (.52) | (.04) | (.82) | (1.32) | ||||||
| Net asset value, end of period | $ | 22.95 | $ | 21.73 | $ | 22.65 | $ | 21.89 | $ | 18.33 | $ | 18.29 |
Total Return D,E,F | 8.36 % | (3.10)% | 5.81% | 19.67% | 4.78% | 8.95% | ||||||
Ratios to Average Net Assets B,G,H | ||||||||||||
| Expenses before reductions | 1.78% I | 1.94% | 1.98% | 1.93% | 1.91% | 1.79% | ||||||
| Expenses net of fee waivers, if any | 1.77 % I | 1.90% | 1.90% | 1.93% | 1.90% | 1.79% | ||||||
| Expenses net of all reductions | 1.77% I | 1.90% | 1.90% | 1.93% | 1.89% | 1.79% | ||||||
| Net investment income (loss) | .59% I | .47% | .15% | (.06)% | .64% C | .68% | ||||||
| Supplemental Data | ||||||||||||
| Net assets, end of period (000 omitted) | $ | 13,031 | $ | 13,766 | $ | 17,461 | $ | 14,096 | $ | 11,555 | $ | 15,819 |
Portfolio turnover rate J | 30 % I | 29% | 40% | 35% | 75% | 43% K |
Fidelity Advisor® Equity Value Fund Class I |
Six months ended (Unaudited) May 31, 2024 | Years ended November 30, 2023 | 2022 | 2021 | 2020 | 2019 | |||||||
Selected Per-Share Data | ||||||||||||
| Net asset value, beginning of period | $ | 23.04 | $ | 23.96 | $ | 23.14 | $ | 19.39 | $ | 19.16 | $ | 19.09 |
| Income from Investment Operations | ||||||||||||
Net investment income (loss) A,B | .19 | .34 | .26 | .22 | .30 C | .31 | ||||||
| Net realized and unrealized gain (loss) | 1.83 | (.84) | 1.33 | 3.79 | .81 | 1.28 | ||||||
| Total from investment operations | 2.02 | (.50) | 1.59 | 4.01 | 1.11 | 1.59 | ||||||
| Distributions from net investment income | (.35) | (.25) | (.18) | (.26) | (.35) | (.34) | ||||||
| Distributions from net realized gain | (.47) | (.17) | (.60) | - | (.53) | (1.19) | ||||||
| Total distributions | (.83) D | (.42) | (.77) D | (.26) | (.88) | (1.52) D | ||||||
| Net asset value, end of period | $ | 24.23 | $ | 23.04 | $ | 23.96 | $ | 23.14 | $ | 19.39 | $ | 19.16 |
Total Return E,F | 8.94 % | (2.09)% | 6.86% | 20.93% | 5.95% | 10.12% | ||||||
Ratios to Average Net Assets B,G,H | ||||||||||||
| Expenses before reductions | .75% I | .88% | .94% | .90% | .77% | .72% | ||||||
| Expenses net of fee waivers, if any | .74 % I | .88% | .90% | .90% | .76% | .72% | ||||||
| Expenses net of all reductions | .74% I | .88% | .90% | .90% | .75% | .72% | ||||||
| Net investment income (loss) | 1.63% I | 1.49% | 1.15% | .97% | 1.78% C | 1.75% | ||||||
| Supplemental Data | ||||||||||||
| Net assets, end of period (000 omitted) | $ | 36,735 | $ | 35,934 | $ | 52,405 | $ | 51,171 | $ | 16,291 | $ | 18,538 |
Portfolio turnover rate J | 30 % I | 29% | 40% | 35% | 75% | 43% K |
Fidelity Advisor® Equity Value Fund Class Z |
Six months ended (Unaudited) May 31, 2024 | Years ended November 30, 2023 | 2022 | 2021 | 2020 | 2019 | |||||||
Selected Per-Share Data | ||||||||||||
| Net asset value, beginning of period | $ | 22.90 | $ | 23.82 | $ | 23.00 | $ | 19.26 | $ | 19.18 | $ | 19.12 |
| Income from Investment Operations | ||||||||||||
Net investment income (loss) A,B | .21 | .37 | .30 | .26 | .32 C | .33 | ||||||
| Net realized and unrealized gain (loss) | 1.81 | (.84) | 1.32 | 3.75 | .82 | 1.28 | ||||||
| Total from investment operations | 2.02 | (.47) | 1.62 | 4.01 | 1.14 | 1.61 | ||||||
| Distributions from net investment income | (.39) | (.28) | (.20) | (.27) | (.52) | (.37) | ||||||
| Distributions from net realized gain | (.47) | (.17) | (.60) | - | (.53) | (1.19) | ||||||
| Total distributions | (.86) | (.45) | (.80) | (.27) | (1.06) D | (1.55) D | ||||||
| Net asset value, end of period | $ | 24.06 | $ | 22.90 | $ | 23.82 | $ | 23.00 | $ | 19.26 | $ | 19.18 |
Total Return E,F | 9.02 % | (1.96)% | 7.02% | 21.07% | 6.09% | 10.27% | ||||||
Ratios to Average Net Assets B,G,H | ||||||||||||
| Expenses before reductions | .60% I | .75% | .79% | .74% | .70% | .58% | ||||||
| Expenses net of fee waivers, if any | .59 % I | .74% | .75% | .74% | .69% | .58% | ||||||
| Expenses net of all reductions | .59% I | .74% | .75% | .74% | .68% | .58% | ||||||
| Net investment income (loss) | 1.78% I | 1.63% | 1.30% | 1.12% | 1.86% C | 1.89% | ||||||
| Supplemental Data | ||||||||||||
| Net assets, end of period (000 omitted) | $ | 12,945 | $ | 15,274 | $ | 21,317 | $ | 35,306 | $ | 2,606 | $ | 3,852 |
Portfolio turnover rate J | 30 % I | 29% | 40% | 35% | 75% | 43% K |
| Fidelity Central Fund | Investment Manager | Investment Objective | Investment Practices | Expense RatioA |
| Fidelity Money Market Central Funds | Fidelity Management & Research Company LLC (FMR) | Each fund seeks to obtain a high level of current income consistent with the preservation of capital and liquidity. | Short-term Investments | Less than .005% |
Gross unrealized appreciation | $48,025,193 |
Gross unrealized depreciation | (5,918,311) |
Net unrealized appreciation (depreciation) | $42,106,882 |
Tax cost | $168,278,952 |
| Purchases ($) | Sales ($) | |
Fidelity Advisor Equity Value Fund | 30,984,984 | 41,465,401 |
| Maximum Management Fee Rate % | |
| Class A | .70 |
| Class M | .70 |
| Class C | .72 |
| Class I | .68 |
| Class Z | .56 |
Total Management Fee Rate % | |
| Class A | .70 |
| Class M | .70 |
| Class C | .72 |
| Class I | .68 |
| Class Z | .56 |
| Performance Adjustment Index | |
| Fidelity Advisor Equity Value Fund | Russell 3000 Value Index |
| Distribution Fee | Service Fee | Total Fees ($) | Retained by FDC ($) | |
Class A | - % | .25% | 142,525 | 2,430 |
Class M | .25% | .25% | 78,444 | 1,004 |
| Class C | .75% | .25% | 67,474 | 7,247 |
| 288,443 | 10,681 |
| Retained by FDC ($) | |
Class A | 18,542 |
Class M | 832 |
Class CA | 265 |
| 19,639 |
| % of Class-Level Average Net Assets | |
Class A | .1822 |
Class M | .1766 |
Class C | .2000 |
Class I | .1657 |
| Amount ($) | % of Class-Level Average Net Assets | |
Class A | 51,322 | .18 |
Class M | 13,959 | .18 |
Class C | 6,839 | .20 |
Class I | 14,992 | .17 |
Class Z | 1,744 | .04 |
| Total | 88,856 |
| % of Average Net Assets | |
| Fidelity Advisor Equity Value Fund | .0353 |
| % of Average Net Assets | |
| Fidelity Advisor Equity Value Fund | .04 |
| Amount ($) | |
| Fidelity Advisor Equity Value Fund | 400 |
| Purchases ($) | Sales ($) | Realized Gain (Loss) ($) | |
Fidelity Advisor Equity Value Fund | 1,895,190 | 7,361,594 | 674,248 |
Fidelity Advisor Equity Value Fund | Amount ($) |
| 196 |
| Total Security Lending Fees Paid to NFS ($) | Security Lending Income From Securities Loaned to NFS ($) | Value of Securities Loaned to NFS at Period End ($) | |
| Fidelity Advisor Equity Value Fund | 13 | - | - |
Six months ended May 31, 2024 | Year ended November 30, 2023 | |
| Fidelity Advisor Equity Value Fund | ||
| Distributions to shareholders | ||
| Class A | $3,749,589 | $1,831,872 |
| Class M | 985,374 | 434,839 |
| Class C | 348,269 | 171,624 |
| Class I | 1,280,447 | 936,668 |
| Class Z | 630,432 | 408,742 |
| Total | $6,994,111 | $3,783,745 |
| Shares | Shares | Dollars | Dollars | |
Six months ended May 31, 2024 | Year ended November 30, 2023 | Six months ended May 31, 2024 | Year ended November 30, 2023 | |
| Fidelity Advisor Equity Value Fund | ||||
| Class A | ||||
Shares sold | 386,075 | 785,862 | $8,878,770 | $17,424,123 |
| Reinvestment of distributions | 160,908 | 79,706 | 3,610,788 | 1,767,079 |
| Shares redeemed | (510,751) | (948,277) | (11,702,136) | (20,950,026) |
| Net increase (decrease) | 36,232 | (82,709) | $787,422 | $(1,758,824) |
| Class M | ||||
Shares sold | 44,147 | 99,039 | $1,020,866 | $2,185,687 |
| Reinvestment of distributions | 43,178 | 19,273 | 970,200 | 427,869 |
| Shares redeemed | (154,929) | (174,626) | (3,544,701) | (3,872,905) |
| Net increase (decrease) | (67,604) | (56,314) | $(1,553,635) | $(1,259,349) |
| Class C | ||||
Shares sold | 36,292 | 134,070 | $808,664 | $2,891,489 |
| Reinvestment of distributions | 14,166 | 7,175 | 310,792 | 155,486 |
| Shares redeemed | (116,321) | (278,632) | (2,603,302) | (5,991,560) |
| Net increase (decrease) | (65,863) | (137,387) | $(1,483,846) | $(2,944,585) |
| Class I | ||||
Shares sold | 215,669 | 497,498 | $5,102,852 | $11,370,113 |
| Reinvestment of distributions | 51,615 | 37,937 | 1,190,250 | 863,451 |
| Shares redeemed | (311,000) | (1,162,451) | (7,325,825) | (26,274,605) |
| Net increase (decrease) | (43,716) | (627,016) | $(1,032,723) | $(14,041,041) |
| Class Z | ||||
Shares sold | 148,557 | 439,775 | $3,453,101 | $10,048,100 |
| Reinvestment of distributions | 22,924 | 15,951 | 524,502 | 360,343 |
| Shares redeemed | (300,439) | (683,473) | (7,027,370) | (15,383,399) |
| Net increase (decrease) | (128,958) | (227,747) | $(3,049,767) | $(4,974,956) |
 |


Contents
| Nonconvertible Bonds - 5.1% | |||
Principal Amount (a) | Value ($) | ||
| Homebuilders/Real Estate - 4.9% | |||
| American Homes 4 Rent LP 5.5% 2/1/34 | 4,900,000 | 4,797,465 | |
| American Tower Corp.: | |||
| 4.05% 3/15/32 | 1,785,000 | 1,618,012 | |
| 5.45% 2/15/34 | 1,100,000 | 1,086,298 | |
| 5.65% 3/15/33 | 2,000,000 | 2,004,224 | |
| Essex Portfolio LP 5.5% 4/1/34 | 2,574,000 | 2,529,053 | |
| Extra Space Storage LP 5.4% 2/1/34 | 1,545,000 | 1,502,574 | |
| Invitation Homes Operating Partnership LP: | |||
| 4.15% 4/15/32 | 540,000 | 491,418 | |
| 5.5% 8/15/33 | 2,455,000 | 2,423,257 | |
| NNN (REIT), Inc. 5.6% 10/15/33 | 2,485,000 | 2,474,144 | |
| Safehold Operating Partnership LP 6.1% 4/1/34 | 2,792,000 | 2,767,393 | |
| Sun Communities Operating LP: | |||
| 4.2% 4/15/32 | 450,000 | 401,522 | |
| 5.7% 1/15/33 | 3,390,000 | 3,336,431 | |
| Uniti Group LP/Uniti Group Finance, Inc./CSL Capital LLC 10.5% 2/15/28 (b) | 1,635,000 | 1,635,265 | |
TOTAL HOMEBUILDERS/REAL ESTATE | 27,067,056 | ||
| Hotels - 0.2% | |||
| Times Square Hotel Trust 8.528% 8/1/26 (b) | 987,582 | 981,745 | |
| TOTAL NONCONVERTIBLE BONDS (Cost $27,934,373) | 28,048,801 | ||
| Asset-Backed Securities - 3.0% | |||
Principal Amount (a) | Value ($) | ||
| American Homes 4 Rent Series 2015-SFR2 Class XS, 0% 10/17/52 (b)(c)(d)(e) | 2,499,133 | 25 | |
| Capital Trust RE CDO Ltd. Series 2005-1A: | |||
| Class D, CME Term SOFR 1 Month Index + 1.610% 6.9299% 3/20/50 (b)(c)(e)(f) | 750,000 | 0 | |
| Class E, CME Term SOFR 1 Month Index + 2.210% 7.5299% 3/20/50 (b)(c)(e)(f) | 2,670,000 | 0 | |
| Crest Clarendon Street 2002-1 Ltd. Series 2002-1A Class PS, 12/28/35 (b)(e) | 3,000,000 | 0 | |
| Crest Ltd. Series 2004-1A Class H1, 3 month U.S. LIBOR + 3.690% 8.9627% (b)(c)(e)(f)(g) | 3,078,262 | 0 | |
| Cyrusone Data Centers Issuer I Series 2024-3A Class A2, 4.65% 5/20/49 (b) | 2,400,000 | 2,158,821 | |
| Home Partners of America Trust: | |||
| Series 2019-2 Class F, 3.866% 10/19/39 (b) | 2,025,476 | 1,808,291 | |
| Series 2021-1 Class F, 3.325% 9/17/41 (b) | 884,495 | 702,298 | |
| Series 2021-2 Class G, 4.505% 12/17/26 (b) | 5,320,161 | 4,713,827 | |
| Series 2021-3 Class F, 4.242% 1/17/41 (b) | 1,212,172 | 1,037,616 | |
| Retained Vantage Data Ctrs Iss Series 2023-2A Class A2, 5.05% 9/15/48 (b) | 1,250,000 | 1,166,623 | |
| Taberna Preferred Funding VI Ltd. Series 2006-6A Class F1, CME Term SOFR 3 Month Index + 4.760% 10.0892% (b)(c)(e)(f)(g) | 6,779,583 | 1 | |
| Tricon Residential Trust Series 2021-SFR1 Class G, 4.133% 7/17/38 (b) | 672,000 | 608,159 | |
| VB-S1 Issuer LLC Series 2024-1A: | |||
| Class D, 6.644% 5/15/54 (b) | 1,800,000 | 1,800,025 | |
| Class F, 8.871% 5/15/54 (b) | 2,300,000 | 2,310,779 | |
| TOTAL ASSET-BACKED SECURITIES (Cost $27,952,979) | 16,306,465 | ||
| Collateralized Mortgage Obligations - 0.5% | |||
Principal Amount (a) | Value ($) | ||
| Private Sponsor - 0.5% | |||
| COMM Mortgage Trust Series 2015-LC19 Class C, 4.2118% 2/10/48 (c) | 3,167,000 | 2,942,292 | |
| Countrywide Home Loans, Inc. Series 2003-R1 Class 2B4, 3.3614% 2/25/43 (b)(c) | 25,581 | 2,901 | |
TOTAL PRIVATE SPONSOR | 2,945,193 | ||
| U.S. Government Agency - 0.0% | |||
| Fannie Mae REMIC Trust: | |||
| Series 2002-W1 subordinate REMIC pass thru certificates, Class 3B3, 3.6788% 2/25/42 (b)(c)(e) | 20,367 | 8,639 | |
| Series 2002-W6 subordinate REMIC pass thru certificates, Class 3B4, 4.4917% 1/25/42 (b)(c)(e) | 17,765 | 1,530 | |
| Series 2003-W10 subordinate REMIC pass thru certificates: | |||
Class 2B4, 3.8775% 6/25/43 (b)(c)(e) | 71,784 | 22,267 | |
Class 2B5, 3.8775% 6/25/43 (b)(c)(e) | 7,561 | 425 | |
TOTAL U.S. GOVERNMENT AGENCY | 32,861 | ||
| TOTAL COLLATERALIZED MORTGAGE OBLIGATIONS (Cost $2,911,096) | 2,978,054 | ||
| Commercial Mortgage Securities - 89.6% | |||
Principal Amount (a) | Value ($) | ||
| BAMLL Commercial Mortgage Securities Trust Series 2015-200P Class F, 3.5958% 4/14/33 (b)(c) | 2,588,000 | 2,436,318 | |
| BANK sequential payer: | |||
| Series 2021-BN35 Class A5, 2.285% 6/15/64 | 2,650,000 | 2,155,255 | |
| Series 2022-BNK39 Class A4, 2.928% 2/15/55 | 1,895,000 | 1,601,208 | |
| Series 2022-BNK42: | |||
Class D, 2.5% 6/15/55 (b) | 1,664,000 | 1,097,225 | |
Class E, 2.5% 6/15/55 (b) | 1,302,000 | 775,048 | |
| Series 2022-BNK42, Class A5, 4.493% 6/15/55 (c) | 2,326,000 | 2,180,519 | |
| Bank sequential payer Series 2023-BNK46 Class A4, 5.745% 8/15/56 | 2,458,000 | 2,502,293 | |
| BANK: | |||
| Series 2017-BNK4 Class D, 3.357% 5/15/50 (b) | 2,308,000 | 1,582,253 | |
| Series 2017-BNK8 Class E, 2.8% 11/15/50 (b) | 2,625,000 | 1,011,181 | |
| Series 2018-BN10: | |||
Class B, 4.078% 2/15/61 (c) | 1,035,000 | 940,733 | |
Class C, 4.163% 2/15/61 (c) | 2,936,000 | 2,613,480 | |
| Series 2019-BN22 Class D, 2.5% 11/15/62 (b) | 2,465,000 | 1,721,575 | |
| Series 2020-BN27 Class D, 2.5% 4/15/63 (b)(e) | 921,000 | 624,466 | |
| Series 2020-BN28: | |||
Class A/S, 2.14% 3/15/63 | 717,000 | 574,811 | |
Class E, 2.5% 3/15/63 (b) | 903,000 | 569,673 | |
| Series 2020-BN30 Class MCDG, 2.9182% 12/15/53 (c)(e) | 3,921,000 | 1,602,434 | |
| Series 2021-BN33 Class B, 2.893% 5/15/64 | 903,000 | 733,176 | |
| Series 2022-BNK43 Class D, 3% 8/15/55 (b) | 2,614,000 | 1,749,105 | |
| Series 2022-BNK44: | |||
Class A/S, 5.7448% 11/15/55 (c) | 1,225,000 | 1,219,811 | |
Class C, 5.7448% 11/15/55 (c) | 5,014,000 | 4,601,786 | |
| Series 2023-BNK45 Class B, 6.148% 2/15/56 (c) | 1,330,000 | 1,329,923 | |
| Bank Series 2023-BNK46 Class B, 6.7736% 8/15/56 (c) | 1,675,000 | 1,734,123 | |
| Bank of America Commercial Mortgage Trust Series 2016-UB10 Class D, 3% 7/15/49 (b) | 726,000 | 594,314 | |
| Bank5 2023-5Yr4 Series 2023-5YR4 Class C, 7.5344% 12/15/56 (c) | 1,034,000 | 1,078,637 | |
| BBCMS Mortgage Trust: | |||
| sequential payer: | |||
Series 2020-C8 Class E, 2.25% 10/15/53 (b) | 3,013,000 | 1,711,757 | |
Series 2022-C14 Class A5, 2.946% 2/15/55 | 3,302,000 | 2,791,369 | |
Series 2022-C17: | |||
| Class A5, 4.441% 9/15/55 | 2,719,000 | 2,544,691 | |
| Class D, 2.5% 9/15/55 (b) | 1,200,000 | 748,213 | |
Series 2022-C18 Class A5, 5.71% 12/15/55 | 3,150,000 | 3,208,713 | |
Series 2023-C19 Class A5, 5.451% 4/15/56 | 2,015,000 | 2,016,350 | |
Series 2023-C20 Class A5, 5.576% 7/15/56 | 1,690,000 | 1,710,004 | |
Series 2023-C21 Class A/S, 6.2964% 9/15/56 (c) | 1,196,000 | 1,241,242 | |
Series 2023-C22 Class C, 7.1259% 11/15/56 (c) | 2,851,000 | 3,000,942 | |
Series 2024-C26 Class C, 6% 5/15/57 | 475,000 | 462,303 | |
| Series 2016-ETC Class D, 3.6089% 8/14/36 (b)(c) | 1,749,000 | 1,464,269 | |
| Series 2019-C5 Class D, 2.5% 11/15/52 (b) | 726,000 | 534,087 | |
| Series 2020-C7: | |||
Class A/S, 2.444% 4/15/53 | 225,000 | 185,117 | |
Class B, 3.152% 4/15/53 | 853,000 | 687,389 | |
| Series 2022-C15, Class A5, 3.662% 4/15/55 | 3,015,000 | 2,659,077 | |
| Series 2022-C16 Class A5, 4.6% 6/15/55 | 4,573,000 | 4,328,685 | |
| Series 2022-C17 Class B, 4.889% 9/15/55 | 1,491,000 | 1,364,162 | |
| Series 2022-C18, Class B, 6.1492% 12/15/55 (c) | 1,890,000 | 1,883,156 | |
| Series 2023 C19 Class B, 6.3323% 4/15/56 (c) | 1,080,000 | 1,084,801 | |
| Series 2023-C21 Class C, 6.2964% 9/15/56 (c) | 2,386,000 | 2,361,952 | |
| Bbcms Mtg Trust 2024-C24 sequential payer Series 2024-C24: | |||
| Class B, 5.718% 2/15/57 | 681,000 | 668,299 | |
| Class C, 6% 2/15/57 | 292,000 | 284,333 | |
| Benchmark 2024-V5 Mortgage Trust sequential payer Series 2024-V5: | |||
| Class B, 6.0594% 1/10/57 (c) | 702,000 | 697,372 | |
| Class C, 6.9726% 1/10/57 (c) | 856,000 | 871,359 | |
| Benchmark Mortgage Trust: | |||
| sequential payer: | |||
Series 2019-B14: | |||
| Class 225D, 3.2943% 12/15/62 (b)(c) | 1,680,000 | 33,949 | |
| Class 225E, 3.2943% 12/15/62 (b)(c) | 1,132,000 | 11,104 | |
Series 2021-B29, Class A5, 2.3879% 9/15/54 | 2,055,000 | 1,678,092 | |
Series 2022-B33 Class A5, 3.4582% 3/15/55 | 2,477,000 | 2,169,198 | |
Series 2023-B39 Class A5, 5.7536% 7/15/56 | 2,714,000 | 2,778,274 | |
Series 2023-C5 Class A5, 5.7653% 6/15/56 | 1,463,000 | 1,497,400 | |
| Series 2018-B7 Class D, 3% 5/15/53 (b)(c) | 833,000 | 584,148 | |
| Series 2019-B12 Class B, 3.5702% 8/15/52 | 1,186,000 | 998,430 | |
| Series 2020-B18: | |||
Class AGNG, 4.3885% 7/15/53 (b)(c) | 4,074,000 | 3,641,558 | |
Class D, 2.25% 7/15/53 (b) | 1,500,000 | 934,602 | |
| Series 2020-B21: | |||
Class A/S, 2.2543% 12/17/53 | 662,000 | 528,116 | |
Class D, 2% 12/17/53 (b)(e) | 1,638,000 | 1,021,087 | |
| Series 2020-IG3 Class 825E, 3.0763% 9/15/48 (b)(c) | 3,049,000 | 2,132,670 | |
| Series 2021-B25: | |||
Class 300D, 2.9942% 4/15/54 (b)(c) | 6,055,000 | 2,708,646 | |
Class 300E, 3.094% 4/15/54 (b)(c) | 1,113,000 | 388,023 | |
| Series 2022 B37 Class B, 5.7507% 11/15/55 (c) | 980,000 | 953,274 | |
| Series 2022-B35 Class D, 2.5% 5/15/55 (b) | 3,003,000 | 1,883,156 | |
| Series 2022-B36: | |||
Class A/S, 4.9505% 7/15/55 | 1,190,000 | 1,094,251 | |
Class D, 2.5% 7/15/55 (b) | 1,872,000 | 1,103,066 | |
| Series 2022-B37 Class C, 5.9424% 11/15/55 (c) | 2,090,000 | 1,792,230 | |
| Series 2023 B38 Class B, 6.2446% 4/15/56 (c) | 1,351,000 | 1,340,173 | |
| Series 2023-B39 Class C, 6.5744% 7/15/56 (c) | 1,859,000 | 1,862,294 | |
| Series 2023-V4: | |||
Class B, 7.4604% 11/15/56 (c) | 1,075,000 | 1,128,157 | |
Class C, 7.4604% 11/15/56 (c) | 1,075,000 | 1,105,405 | |
| BMO 2024-5C3 Mortgage Trust Series 2024-5C3: | |||
| Class B, 6.5567% 2/15/57 (c) | 944,000 | 952,383 | |
| Class C, 6.8592% 2/15/57 (c) | 249,000 | 250,907 | |
| BMO Mortgage Trust: | |||
| sequential payer Series 2022-C1 Class A5, 3.374% 2/15/55 | 3,142,000 | 2,736,573 | |
| Series 2022-C1: | |||
Class 360D, 3.9387% 2/17/55 (b)(c) | 1,638,000 | 1,028,232 | |
Class 360E, 3.9387% 2/17/55 (b)(c) | 1,970,000 | 1,188,395 | |
| Series 2023-C4: | |||
Class B, 5.396% 2/15/56 (c) | 1,186,000 | 1,160,492 | |
Class C, 5.8631% 2/15/56 (c) | 2,468,000 | 2,418,065 | |
| Series 2023-C6 Class A/S, 6.5504% 9/15/56 (c) | 1,229,000 | 1,284,609 | |
| Bx 2024 Vlt4 floater Series 2024-VLT4 Class E, 8.519% 7/15/29 (b)(c) | 2,250,000 | 2,244,375 | |
| BX Commercial Mortgage Trust: | |||
| floater: | |||
Series 2020-VKNG: | |||
| Class F, CME Term SOFR 1 Month Index + 2.860% 8.1815% 10/15/37 (b)(c)(f) | 950,600 | 933,025 | |
| Class G, CME Term SOFR 1 Month Index + 3.360% 8.6815% 10/15/37 (b)(c)(f) | 1,258,600 | 1,225,514 | |
Series 2021-LBA: | |||
| Class EJV, CME Term SOFR 1 Month Index + 2.110% 7.4315% 2/15/36 (b)(c)(f) | 2,000,000 | 1,970,000 | |
| Class FJV, CME Term SOFR 1 Month Index + 2.510% 7.8315% 2/15/36 (b)(c)(f) | 458,000 | 440,921 | |
| Class GJV, CME Term SOFR 1 Month Index + 3.110% 8.4315% 2/15/36 (b)(c)(f) | 1,033,000 | 987,076 | |
Series 2021-MC Class G, CME Term SOFR 1 Month Index + 3.200% 8.5183% 4/15/34 (b)(c)(f) | 1,572,000 | 1,327,979 | |
Series 2021-PAC Class G, CME Term SOFR 1 Month Index + 3.060% 8.3776% 10/15/36 (b)(c)(f) | 3,192,000 | 3,101,545 | |
Series 2021-SOAR: | |||
| Class G, CME Term SOFR 1 Month Index + 2.910% 8.2315% 6/15/38 (b)(c)(f) | 3,857,646 | 3,823,892 | |
| Class J, CME Term SOFR 1 Month Index + 3.860% 9.1815% 6/15/38 (b)(c)(f) | 2,630,213 | 2,598,851 | |
Series 2021-VINO: | |||
| Class F, CME Term SOFR 1 Month Index + 2.910% 8.2338% 5/15/38 (b)(c)(f) | 2,470,698 | 2,445,991 | |
| Class G, CME Term SOFR 1 Month Index + 4.060% 9.3838% 5/15/38 (b)(c)(f) | 3,600,428 | 3,560,108 | |
Series 2021-VOLT: | |||
| Class D, CME Term SOFR 1 Month Index + 1.760% 7.0813% 9/15/36 (b)(c)(f) | 1,000,000 | 990,625 | |
| Class F, CME Term SOFR 1 Month Index + 2.510% 7.8313% 9/15/36 (b)(c)(f) | 1,677,000 | 1,662,326 | |
| Class G, CME Term SOFR 1 Month Index + 2.960% 8.2813% 9/15/36 (b)(c)(f) | 5,615,000 | 5,530,775 | |
Series 2022-LBA6 Class F, CME Term SOFR 1 Month Index + 3.350% 8.6668% 1/15/39 (b)(c)(f) | 4,315,000 | 4,276,977 | |
Series 2023-VLT3 Class C, CME Term SOFR 1 Month Index + 3.430% 8.7548% 11/15/28 (b)(c)(f) | 1,000,000 | 1,001,921 | |
Series 2024-MF Class E, CME Term SOFR 1 Month Index + 3.730% 9.0551% 2/15/39 (b)(c)(f) | 1,831,000 | 1,834,215 | |
Series 2024-WPT Class E, CME Term SOFR 1 Month Index + 3.580% 8.9052% 3/15/34 (b)(c)(f) | 1,775,000 | 1,770,535 | |
Series 2024-XL5 Class E, CME Term SOFR 1 Month Index + 3.680% 9.0051% 3/15/41 (b)(c)(f) | 5,105,623 | 5,079,118 | |
| Series 2019-OC11 Class E, 3.944% 12/9/41 (b)(c) | 14,678,000 | 12,311,491 | |
| Series 2020-VIVA: | |||
Class D, 3.5488% 3/11/44 (b)(c) | 9,422,000 | 7,983,865 | |
Class E, 3.5488% 3/11/44 (b)(c) | 8,563,000 | 7,042,283 | |
| BX Commercial Mortgage Trust 2024-Xl4 floater Series 2024-XL4 Class E, CME Term SOFR 1 Month Index + 4.180% 9.5049% 2/15/39 (b)(c)(f) | 1,969,914 | 1,972,672 | |
| BX Commercial Mtg Trust floater Series 2024-MDHS Class E, CME Term SOFR 1 Month Index + 3.680% 9.0383% 5/15/41 (b)(c)(f) | 3,150,000 | 3,157,875 | |
| Bx Commercial Mtg Trust 2024-King floater Series 2024-KING Class E, CME Term SOFR 1 Month Index + 3.680% 8.988% 5/15/34 (b)(c)(f) | 5,350,000 | 5,336,364 | |
| BX Trust floater: | |||
| Series 2021-ACNT Class G, CME Term SOFR 1 Month Index + 3.400% 8.7265% 11/15/38 (b)(c)(f) | 2,396,618 | 2,351,768 | |
| Series 2021-MFM1: | |||
Class F, CME Term SOFR 1 Month Index + 3.110% 8.4315% 1/15/34 (b)(c)(f) | 639,062 | 629,459 | |
Class G, CME Term SOFR 1 Month Index + 4.010% 9.3315% 1/15/34 (b)(c)(f) | 319,531 | 312,070 | |
| Series 2024-CNYN Class E, CME Term SOFR 1 Month Index + 3.680% 9.0054% 4/15/29 (b)(c)(f) | 4,461,000 | 4,473,375 | |
| Series 2024-VLT4 Class F, CME Term SOFR 1 Month Index + 3.930% 9.2679% 7/15/29 (b)(c)(f) | 5,450,000 | 5,436,375 | |
| BXP Trust Series 2021-601L Class E, 2.7755% 1/15/44 (b)(c) | 709,000 | 427,311 | |
| CAMB Commercial Mortgage Trust floater Series 2019-LIFE Class G, CME Term SOFR 1 Month Index + 3.540% 8.864% 12/15/37 (b)(c)(f) | 8,968,000 | 8,844,145 | |
| CD Mortgage Trust: | |||
| Series 2017-CD3 Class D, 3.25% 2/10/50 (b)(e) | 4,073,000 | 1,525,830 | |
| Series 2017-CD4 Class D, 3.3% 5/10/50 (b) | 356,070 | 281,573 | |
| Series 2019-CD4 Class C, 4.3497% 5/10/50 (c) | 1,920,000 | 1,697,118 | |
| Citigroup Commercial Mortgage Trust: | |||
| Series 2020-420K: | |||
Class D, 3.3118% 11/10/42 (b)(c) | 536,000 | 446,119 | |
Class E, 3.3118% 11/10/42 (b)(c) | 3,345,000 | 2,716,679 | |
| Series 2022-GC48 Class D, 2.5% 6/15/55 (b) | 3,129,000 | 1,886,958 | |
| Series 2023-PRM3: | |||
Class C, 6.3597% 7/10/28 (b)(c) | 454,000 | 451,310 | |
Class D, 6.3597% 7/10/28 (b)(c) | 1,383,000 | 1,328,484 | |
| Series 2023-SMRT Class D, 5.8524% 10/12/40 (b)(c) | 2,611,000 | 2,511,277 | |
| COMM Mortgage Trust: | |||
| floater Series 2018-HCLV Class G, CME Term SOFR 1 Month Index + 5.350% 10.6693% 9/15/33 (b)(c)(f) | 1,487,000 | 575,792 | |
| sequential payer Series 2013-LC6 Class E, 3.5% 1/10/46 (b) | 2,840,000 | 2,563,064 | |
| Series 2012-CR1: | |||
Class D, 5.1372% 5/15/45 (b)(c) | 2,176,571 | 1,682,490 | |
Class G, 2.462% 5/15/45 (b) | 793,734 | 10,932 | |
| Series 2014-CR17 Class E, 4.756% 5/10/47 (b)(c) | 589,000 | 454,642 | |
| Series 2014-CR20: | |||
Class AM, 3.938% 11/10/47 | 299,000 | 291,378 | |
Class C, 4.4458% 11/10/47 (c) | 1,000,000 | 974,717 | |
| Series 2015-3BP Class F, 3.2384% 2/10/35 (b)(c) | 4,405,000 | 3,515,918 | |
| Series 2015-DC1 Class C, 4.2741% 2/10/48 (c) | 1,000,000 | 915,190 | |
| Series 2015-LC19 Class B, 3.829% 2/10/48 | 192,000 | 180,962 | |
| COMM Trust Series 2017-COR2 Class D, 3% 9/10/50 (b) | 1,146,000 | 891,073 | |
| Commercial Mortgage Trust Series 2016-CD2 Class D, 2.7267% 11/10/49 (c) | 1,680,000 | 883,818 | |
| CPT Mortgage Trust sequential payer Series 2019-CPT: | |||
| Class E, 2.9968% 11/13/39 (b)(c) | 2,205,000 | 1,555,423 | |
| Class F, 2.9968% 11/13/39 (b)(c) | 2,772,000 | 1,728,251 | |
| Credit Suisse Commercial Mortgage Trust floater Series 2021-SOP2 Class F, CME Term SOFR 1 Month Index + 4.330% 9.6481% 6/15/34 (b)(e)(f) | 2,561,600 | 816,716 | |
| Credit Suisse Mortgage Trust Series 2021-BRIT Class A, CME Term SOFR 1 Month Index + 3.570% 8.8907% 5/9/25 (b)(c)(f) | 3,136,168 | 3,001,391 | |
| CSAIL Commercial Mortgage Trust: | |||
| Series 2017-C8 Class C, 4.2637% 6/15/50 (c) | 1,435,000 | 1,153,637 | |
| Series 2019-C18 Class A/S, 3.3214% 12/15/52 | 921,000 | 785,904 | |
| CSMC Series 2019-UVIL Class E, 3.2833% 12/15/41 (b)(c) | 5,161,000 | 4,001,820 | |
| DBGS Mortgage Trust: | |||
| Series 2018-C1 Class C, 4.6474% 10/15/51 (c) | 777,000 | 656,085 | |
| Series 2019-1735 Class F, 4.1946% 4/10/37 (b)(c) | 1,000,000 | 561,311 | |
| DC Office Trust Series 2019-MTC Class E, 3.072% 9/15/45 (b)(c) | 1,029,000 | 561,871 | |
| Dk Trust 2024-Spbx floater Series 2024-SPBX Class E, CME Term SOFR 1 Month Index + 4.000% 9.3168% 3/15/34 (b)(c)(f) | 2,463,000 | 2,461,469 | |
| DTP Commercial Mortgage Trust 2023-Ste2 sequential payer Series 2023-STE2: | |||
| Class D, 6.7308% 1/15/41 (b)(c) | 4,760,000 | 4,700,794 | |
| Class E, 5.7759% 1/15/41 (b)(c) | 769,000 | 698,956 | |
| ELP Commercial Mortgage Trust floater Series 2021-ELP: | |||
| Class G, CME Term SOFR 1 Month Index + 3.230% 8.5475% 11/15/38 (b)(c)(f) | 1,248,547 | 1,212,012 | |
| Class J, CME Term SOFR 1 Month Index + 3.720% 9.0464% 11/15/38 (b)(c)(f) | 4,564,687 | 4,363,164 | |
| FS Commercial Mortgage Trust Series 2023-4SZN: | |||
| Class C, 8.1209% 11/10/39 (b)(c) | 2,568,000 | 2,644,450 | |
| Class D, 9.0801% 11/10/39 (b)(c) | 594,000 | 614,454 | |
| GS Mortgage Securities Trust: | |||
| sequential payer Series 2023-SHIP: | |||
Class D, 6.0706% 9/10/38 (b)(c) | 1,969,000 | 1,921,419 | |
Class E, 7.4336% 9/10/38 (b)(c) | 3,235,000 | 3,197,044 | |
| Series 2010-C1 Class B, 5.148% 8/10/43 (b) | 80,032 | 79,816 | |
| Series 2011-GC5: | |||
Class D, 5.1513% 8/10/44 (b)(c) | 1,929,752 | 917,739 | |
Class E, 5.1513% 8/10/44 (b)(c)(e) | 2,432,000 | 274,448 | |
Class F, 4.5% 8/10/44 (b)(e) | 4,308,000 | 12,924 | |
| Series 2012-GCJ9 Class D, 4.6009% 11/10/45 (b)(c) | 3,489,883 | 3,175,794 | |
| Series 2016-GS2 Class D, 2.753% 5/10/49 (b) | 2,058,050 | 1,733,813 | |
| Series 2019-GC38 Class D, 3% 2/10/52 (b) | 1,667,000 | 1,292,104 | |
| Series 2019-GC39 Class D, 3% 5/10/52 (b) | 2,830,000 | 1,605,096 | |
| Series 2019-GC42: | |||
Class C, 3.7009% 9/10/52 (c) | 1,931,000 | 1,530,401 | |
Class D, 2.8% 9/10/52 (b) | 2,307,000 | 1,567,904 | |
| Series 2019-GS5 Class C, 4.299% 3/10/50 (c) | 2,499,000 | 1,759,837 | |
| Series 2020-GC45 Class SWD, 3.2185% 12/13/39 (b)(c) | 1,764,000 | 1,336,875 | |
| Series 2020-GC47 Class D, 3.4532% 5/12/53 (b)(c) | 756,000 | 515,673 | |
| Hilton U.S.A. Trust Series 2016-HHV: | |||
| Class E, 4.1935% 11/5/38 (b)(c) | 5,078,000 | 4,742,154 | |
| Class F, 4.1935% 11/5/38 (b)(c) | 6,517,000 | 6,018,646 | |
| Home Partners of America Trust Series 2019-1: | |||
| Class E, 3.604% 9/17/39 (b) | 1,250,850 | 1,139,484 | |
| Class F, 4.101% 9/17/39 (b) | 202,965 | 182,614 | |
| Independence Plaza Trust Series 2018-INDP Class E, 4.996% 7/10/35 (b) | 2,083,000 | 1,939,074 | |
| JPMBB Commercial Mortgage Securities Trust Series 2015-C32 Class C, 4.6535% 11/15/48 (c) | 1,500,000 | 881,550 | |
| JPMCC Commercial Mortgage Securities Trust Series 2016-JP4 Class D, 3.3786% 12/15/49 (b)(c) | 2,418,000 | 1,711,693 | |
| JPMDB Commercial Mortgage Securities Trust: | |||
| Series 2018-C8 Class D, 3.259% 6/15/51 (b)(c) | 1,171,000 | 813,138 | |
| Series 2019-COR6 Class D, 2.5% 11/13/52 (b) | 1,354,000 | 680,718 | |
| Series 2020-COR7 Class D, 1.75% 5/13/53 (b)(e) | 1,535,000 | 665,594 | |
| JPMorgan Chase Commercial Mortgage Securities Trust: | |||
| sequential payer Series 2019-OSB: | |||
Class A, 3.3973% 6/5/39 (b) | 1,696,000 | 1,511,011 | |
Class D, 3.7828% 6/5/39 (b)(c) | 984,000 | 829,264 | |
| Series 2011-C3: | |||
Class E, 5.5253% 2/15/46 (b)(c)(e) | 3,008,000 | 1,231,265 | |
Class G, 4.409% 2/15/46 (b)(c) | 1,082,000 | 124,376 | |
Class H, 4.409% 2/15/46 (b)(c)(e) | 2,622,000 | 181,272 | |
| Series 2012-CBX: | |||
Class E, 4.6896% 6/15/45 (b)(c) | 2,962,493 | 2,666,244 | |
Class F, 4% 6/15/45 (b)(e) | 3,743,000 | 3,106,690 | |
Class G 4% 6/15/45 (b)(e) | 4,129,000 | 2,708,624 | |
| Series 2013-LC11: | |||
Class D, 4.1581% 4/15/46 (c) | 3,677,000 | 1,634,684 | |
Class E, 3.25% 4/15/46 (b)(c) | 104,000 | 25,484 | |
Class F, 3.25% 4/15/46 (b)(c)(e) | 5,894,000 | 208,648 | |
| Series 2014-DSTY: | |||
Class D, 3.8046% 6/10/27 (b)(c)(e) | 3,213,000 | 8,047 | |
Class E, 3.8046% 6/10/27 (b)(c)(e) | 4,232,000 | 10,322 | |
| Series 2018-AON Class F, 4.6132% 7/5/31 (b)(c) | 2,150,000 | 464,010 | |
| Series 2019-OSB Class E, 3.7828% 6/5/39 (b)(c) | 3,019,000 | 2,494,997 | |
| Series 2020-NNN: | |||
Class EFX, 3.972% 1/16/37 (b) | 2,771,000 | 1,468,630 | |
Class FFX, 4.6254% 1/16/37 (b) | 2,388,000 | 1,026,840 | |
Class GFX, 4.6882% 1/16/37 (b)(c) | 942,000 | 301,440 | |
| KNDR Trust floater Series 2021-KIND Class F, CME Term SOFR 1 Month Index + 4.060% 9.3845% 8/15/38 (b)(c)(f) | 4,435,575 | 4,188,414 | |
| LBA Trust floater Series 2024-BOLT: | |||
| Class E, CME Term SOFR 1 Month Index + 3.680% 8.986% 6/15/26 (b)(c)(f) | 1,000,000 | 997,428 | |
| Class F, CME Term SOFR 1 Month Index + 4.430% 9.7848% 6/15/26 (b)(c)(f) | 1,450,000 | 1,446,272 | |
| Market Mortgage Trust Series 2020-525M Class F, 2.9406% 2/12/40 (b)(c) | 1,976,000 | 992,635 | |
| Merit floater Series 2021-STOR: | |||
| Class F, CME Term SOFR 1 Month Index + 2.310% 7.6315% 7/15/38 (b)(c)(f) | 585,000 | 580,247 | |
| Class G, CME Term SOFR 1 Month Index + 2.860% 8.1815% 7/15/38 (b)(c)(f) | 735,000 | 729,488 | |
| Class J, CME Term SOFR 1 Month Index + 4.060% 9.3815% 7/15/38 (b)(c)(f) | 1,847,000 | 1,826,361 | |
| MHC Commercial Mortgage Trust floater Series 2021-MHC: | |||
| Class F, CME Term SOFR 1 Month Index + 2.710% 8.0324% 4/15/38 (b)(c)(f) | 1,090,540 | 1,083,042 | |
| Class G, CME Term SOFR 1 Month Index + 3.310% 8.6324% 4/15/38 (b)(c)(f) | 9,395,419 | 9,330,825 | |
| MHP Commercial Mortgage Trust floater Series 2022-MHIL: | |||
| Class E, CME Term SOFR 1 Month Index + 2.610% 7.9274% 1/15/27 (b)(c)(f) | 911,614 | 904,777 | |
| Class G, CME Term SOFR 1 Month Index + 3.950% 9.2743% 1/15/27 (b)(c)(f) | 2,144,116 | 2,133,320 | |
| Mira Trust 2023-Mile sequential payer Series 2023-MILE Class B, 7.2026% 6/10/38 (b) | 1,012,000 | 1,012,664 | |
| MOFT Trust Series 2020-ABC: | |||
| Class D, 3.4767% 2/10/42 (b)(c) | 1,144,000 | 600,293 | |
| Class E, 3.4767% 2/10/42 (b)(c) | 841,000 | 341,022 | |
| Morgan Stanley BAML Trust: | |||
| sequential payer Series 2014-C18 Class 300E, 4.6896% 8/15/31 | 1,666,000 | 952,938 | |
| Series 2012-C6 Class D, 4.3894% 11/15/45 (b)(c) | 3,633,000 | 2,930,405 | |
| Series 2012-C6, Class F, 4.3894% 11/15/45 (b)(c)(e) | 1,575,000 | 456,750 | |
| Series 2013-C13 Class E, 5.0562% 11/15/46 (b)(c) | 841,832 | 757,649 | |
| Series 2013-C9: | |||
Class D, 3.8131% 5/15/46 (b)(c) | 3,000,000 | 2,525,479 | |
Class E, 3.8131% 5/15/46 (b)(c) | 1,594,370 | 1,056,681 | |
| Series 2017-C33 Class D, 3.356% 5/15/50 (b) | 2,932,000 | 2,345,026 | |
| Morgan Stanley Capital I Trust: | |||
| sequential payer: | |||
Series 2021-L5 Class A4, 2.728% 5/15/54 | 3,744,000 | 3,147,900 | |
Series 2024-BPR2 Class A, 7.291% 5/5/29 (b) | 1,340,000 | 1,352,138 | |
| Series 2011-C2: | |||
Class D, 5.2113% 6/15/44 (b)(c) | 2,931,741 | 2,815,937 | |
Class F, 5.2113% 6/15/44 (b)(c) | 3,015,000 | 1,749,303 | |
| Series 2011-C3: | |||
Class E, 4.9433% 7/15/49 (b)(c) | 848,416 | 824,040 | |
Class F, 4.9433% 7/15/49 (b)(c) | 984,000 | 886,152 | |
Class G, 4.9433% 7/15/49 (b)(c) | 3,536,800 | 3,077,827 | |
| Series 2012-C4 Class D, 5.1638% 3/15/45 (b)(c) | 635,221 | 589,168 | |
| Series 2015-MS1: | |||
Class B, 4.023% 5/15/48 (c) | 428,000 | 402,226 | |
Class C, 4.023% 5/15/48 (c) | 270,000 | 234,841 | |
Class D, 4.023% 5/15/48 (b)(c) | 2,150,000 | 1,498,080 | |
| Series 2017 H1 Class B, 4.075% 6/15/50 | 1,000,000 | 907,862 | |
| Series 2017-H1: | |||
Class C, 4.281% 6/15/50 | 808,000 | 716,542 | |
Class D, 2.546% 6/15/50 (b) | 5,262,000 | 4,125,017 | |
| Series 2017-HR2 Class D, 2.73% 12/15/50 | 2,645,000 | 2,136,164 | |
| Series 2018-MP Class E, 4.276% 7/11/40 (b)(c) | 3,059,000 | 2,019,386 | |
| Series 2020-CNP Class D, 2.4276% 4/5/42 (b)(c) | 1,043,000 | 672,527 | |
| MSJP Commercial Securities Mortgage Trust Series 2015-HAUL Class E, 4.851% 9/5/47 (b)(c) | 1,014,000 | 814,591 | |
| MSWF Commercial Mortgage Trust sequential payer: | |||
| Series 2023-1: | |||
Class A5, 5.752% 5/15/56 | 1,899,000 | 1,935,179 | |
Class C, 6.6828% 5/15/56 (c) | 1,266,000 | 1,296,719 | |
| Series 2023-2: | |||
Class B, 6.8762% 12/15/56 (c) | 1,070,000 | 1,126,837 | |
Class C, 7.0182% 12/15/56 (c) | 834,000 | 858,458 | |
Class D, 4% 12/15/56 (b) | 351,000 | 253,559 | |
| Natixis Commercial Mortgage Securities Trust: | |||
| floater Series 2018-FL1 Class WAN2, CME Term SOFR 1 Month Index + 3.790% 9.1138% 6/15/35 (b)(c)(e)(f) | 222,000 | 11,100 | |
| Series 2019-10K: | |||
Class E, 4.1346% 5/15/39 (b)(c) | 2,293,000 | 1,953,638 | |
Class F, 4.1346% 5/15/39 (b)(c) | 3,014,000 | 2,319,764 | |
| Series 2020-2PAC: | |||
Class AMZ2, 3.5% 1/15/37 (b)(c) | 1,754,950 | 1,426,629 | |
Class AMZ3, 3.5% 1/15/37 (b)(c) | 822,675 | 595,877 | |
| Open Trust 2023-Air sequential payer Series 2023-AIR Class D, CME Term SOFR 1 Month Index + 6.680% 12.0005% 10/15/28 (b)(c)(f) | 2,374,195 | 2,383,105 | |
| OPG Trust floater Series 2021-PORT: | |||
| Class G, CME Term SOFR 1 Month Index + 2.510% 7.8295% 10/15/36 (b)(c)(f) | 865,800 | 856,601 | |
| Class J, CME Term SOFR 1 Month Index + 3.460% 8.7775% 10/15/36 (b)(c)(f) | 1,438,450 | 1,394,138 | |
| PKHL Commercial Mortgage Trust floater Series 2021-MF: | |||
| Class F, CME Term SOFR 1 Month Index + 3.460% 8.7815% 7/15/38 (b)(c)(f) | 2,225,000 | 1,444,848 | |
| Class NR, CME Term SOFR 1 Month Index + 6.110% 11.4315% 7/15/38 (b)(c)(e)(f) | 631,000 | 297,180 | |
| Prima Capital Ltd. floater Series 2021-9A Class C, CME Term SOFR 1 Month Index + 2.460% 7.7833% 12/15/37 (b)(c)(f) | 572,370 | 551,110 | |
| Providence Place Group Ltd. Partnership Series 2000-C1 Class A2, 7.75% 7/20/28 (b) | 1,282,724 | 1,295,297 | |
| SG Commercial Mortgage Securities Trust: | |||
| Series 2019-PREZ Class F, 3.4771% 9/15/39 (b)(c) | 3,206,000 | 2,365,500 | |
| Series 2020-COVE Class F, 3.7276% 3/15/37 (b)(c) | 3,855,000 | 3,480,270 | |
| SOHO Trust Series 2021-SOHO Class D, 2.6966% 8/10/38 (b)(c) | 2,499,000 | 1,410,170 | |
| SREIT Trust floater: | |||
| Series 2021-IND Class G, CME Term SOFR 1 Month Index + 3.380% 8.6973% 10/15/38 (b)(c)(f) | 3,339,000 | 3,222,136 | |
| Series 2021-MFP Class G, CME Term SOFR 1 Month Index + 3.080% 8.4051% 11/15/38 (b)(c)(f) | 2,870,589 | 2,841,883 | |
| Series 2021-MFP2: | |||
Class G, CME Term SOFR 1 Month Index + 3.080% 8.399% 11/15/36 (b)(c)(f) | 3,024,000 | 2,932,150 | |
Class J, CME Term SOFR 1 Month Index + 4.020% 9.347% 11/15/36 (b)(c)(f) | 1,803,000 | 1,760,496 | |
| STWD Trust floater sequential payer Series 2021-LIH: | |||
| Class F, CME Term SOFR 1 Month Index + 3.660% 8.982% 11/15/36 (b)(c)(f) | 3,319,000 | 3,183,605 | |
| Class G, CME Term SOFR 1 Month Index + 4.310% 9.631% 11/15/36 (b)(c)(f) | 1,134,000 | 1,083,402 | |
| TPGI Trust floater Series 2021-DGWD: | |||
| Class F, CME Term SOFR 1 Month Index + 3.110% 8.4345% 6/15/26 (b)(c)(f) | 854,400 | 852,798 | |
| Class G, CME Term SOFR 1 Month Index + 3.960% 9.2845% 6/15/26 (b)(c)(f) | 806,400 | 805,367 | |
| UBS Commercial Mortgage Trust: | |||
| Series 2012-C1: | |||
Class E, 5% 5/10/45 (b)(c) | 1,432,663 | 1,310,585 | |
Class F, 5% 5/10/45 (b)(c)(e) | 2,484,000 | 353,970 | |
| Series 2018-C8 Class C, 4.6838% 2/15/51 (c) | 756,000 | 638,944 | |
| UBS-BAMLL Trust: | |||
| Series 12-WRM Class D, 4.238% 6/10/30 (b)(c) | 2,090,000 | 1,702,096 | |
| Series 2012-WRM Class C, 4.238% 6/10/30 (b)(c) | 890,000 | 792,100 | |
| VASA Trust: | |||
| floater Series 2021-VASA Class G, CME Term SOFR 1 Month Index + 5.110% 10.4315% 7/15/39 (b)(c)(e)(f) | 693,000 | 313,968 | |
| floater sequential payer Series 2021-VASA Class F, CME Term SOFR 1 Month Index + 4.010% 9.3315% 7/15/39 (b)(c)(f) | 3,009,000 | 1,543,787 | |
| VMC Finance Ltd. floater Series 2021-HT1 Class B, CME Term SOFR 1 Month Index + 4.610% 9.9346% 1/18/37 (b)(c)(f) | 3,000,000 | 2,865,820 | |
| Wells Fargo Commercial Mortgage Trust: | |||
| floater Series 2021-SAVE: | |||
Class D, CME Term SOFR 1 Month Index + 2.610% 7.9315% 2/15/40 (b)(c)(f) | 1,000,000 | 982,552 | |
Class E, CME Term SOFR 1 Month Index + 3.760% 9.0815% 2/15/40 (b)(c)(f) | 450,400 | 438,014 | |
| sequential payer: | |||
Series 2020-C57 Class D, 2.5% 8/15/53 (b) | 2,108,000 | 1,514,781 | |
Series 2021-C60 Class A4, 2.342% 8/15/54 | 2,703,000 | 2,210,856 | |
| Series 2015-NXS4 Class D, 3.6844% 12/15/48 (c) | 1,834,000 | 1,633,711 | |
| Series 2016-BNK1 Class D, 3% 8/15/49 (b) | 1,526,000 | 613,908 | |
| Series 2016-NXS6 Class D, 3.059% 11/15/49 (b) | 1,250,000 | 1,050,822 | |
| Series 2018-C44 Class D, 3% 5/15/51 (b) | 3,949,000 | 2,756,293 | |
| Series 2019-AA Class D, 3.514% 10/15/52 | 1,459,000 | 1,273,449 | |
| Series 2019-C49: | |||
Class B, 4.546% 3/15/52 | 450,000 | 418,083 | |
Class C, 4.866% 3/15/52 (c) | 3,863,000 | 3,526,630 | |
| Series 2021-C60 Class D, 2.5% 8/15/54 (b) | 761,000 | 522,373 | |
| WF-RBS Commercial Mortgage Trust: | |||
| sequential payer Series 2011-C4I Class G, 5% 6/15/44 (c)(e) | 1,252,600 | 109,503 | |
| Series 2011-C3 Class D, 5.8545% 3/15/44 (b)(c)(e) | 1,284,756 | 491,419 | |
| Series 2011-C4: | |||
Class D, 4.9783% 6/15/44 (b)(c) | 1,616,000 | 1,356,636 | |
Class E, 4.9783% 6/15/44 (b)(c) | 1,274,000 | 1,005,442 | |
| Series 2013-C11 Class E, 4.0608% 3/15/45 (b)(c) | 4,999,000 | 3,105,849 | |
| Series 2013-C13 Class D, 4.0083% 5/15/45 (b)(c) | 1,396,513 | 1,192,622 | |
| Series 2013-C16 Class D, 4.6144% 9/15/46 (b)(c) | 406,551 | 374,027 | |
| WFCM: | |||
| Series 2022-C62 Class D, 2.5% 4/15/55 (b) | 2,352,000 | 1,426,324 | |
| Series 2022-C62, Class A4, 4% 4/15/55 | 2,074,000 | 1,877,820 | |
| Worldwide Plaza Trust Series 2017-WWP Class F, 3.5955% 11/10/36 (b)(c) | 1,695,000 | 114,728 | |
| WP Glimcher Mall Trust Series 2015-WPG: | |||
| Class PR1, 3.516% 6/5/35 (b)(c)(e) | 1,638,000 | 1,302,979 | |
| Class PR2, 3.516% 6/5/35 (b)(c)(e) | 4,354,000 | 3,352,816 | |
| TOTAL COMMERCIAL MORTGAGE SECURITIES (Cost $569,670,083) | 495,283,342 | ||
| Common Stocks - 0.0% | |||
| Shares | Value ($) | ||
| Technology - 0.0% | |||
Cyxtera Technologies, Inc. Class A (e)(h) (Cost $919,192) | 92,200 | 1 | |
| Bank Loan Obligations - 1.1% | |||
Principal Amount (a) | Value ($) | ||
| Diversified Financial Services - 1.1% | |||
| Agellan Portfolio 9% 8/7/25 (e)(i) | 908,000 | 908,000 | |
| MHP Commercial Mortgage Trust U.S. Secured Overnight Fin. Rate (SOFR) Index + 5.000% 10.3168% 1/9/25 (c)(e)(f)(i) | 4,558,038 | 4,375,716 | |
| Sunbelt Mezz U.S. Secured Overnight Fin. Rate (SOFR) Index + 4.450% 9.8777% 1/21/27 (c)(e)(f)(i) | 1,032,615 | 1,032,615 | |
| TOTAL BANK LOAN OBLIGATIONS (Cost $6,497,747) | 6,316,331 | ||
| Preferred Securities - 0.0% | |||
Principal Amount (a) | Value ($) | ||
| Homebuilders/Real Estate - 0.0% | |||
Crest Dartmouth Street 2003-1 Ltd. Series 2003-1A Class PS, 6/28/38 (b)(e) (Cost $2,796,600) | 3,100,000 | 31 | |
| Money Market Funds - 2.3% | |||
| Shares | Value ($) | ||
Fidelity Cash Central Fund 5.39% (j) (Cost $12,416,402) | 12,413,919 | 12,416,402 | |
| TOTAL INVESTMENT IN SECURITIES - 101.6% (Cost $651,098,472) | 561,349,427 |
NET OTHER ASSETS (LIABILITIES) - (1.6)% | (8,805,305) |
| NET ASSETS - 100.0% | 552,544,122 |
| (a) | Amount is stated in United States dollars unless otherwise noted. |
| (b) | Security exempt from registration under Rule 144A of the Securities Act of 1933. These securities may be resold in transactions exempt from registration, normally to qualified institutional buyers. At the end of the period, the value of these securities amounted to $388,844,839 or 70.4% of net assets. |
| (c) | Coupon rates for floating and adjustable rate securities reflect the rates in effect at period end. |
| (d) | Interest Only (IO) security represents the right to receive only monthly interest payments on an underlying pool of mortgages or assets. Principal shown is the outstanding par amount of the pool as of the end of the period. |
| (e) | Level 3 security |
| (f) | Coupon is indexed to a floating interest rate which may be multiplied by a specified factor and/or subject to caps or floors. |
| (g) | Non-income producing - Security is in default. |
| (h) | Non-income producing |
| (i) | Remaining maturities of bank loan obligations may be less than the stated maturities shown as a result of contractual or optional prepayments by the borrower. Such prepayments cannot be predicted with certainty. |
| (j) | Affiliated fund that is generally available only to investment companies and other accounts managed by Fidelity Investments. The rate quoted is the annualized seven-day yield of the fund at period end. A complete unaudited listing of the fund's holdings as of its most recent quarter end is available upon request. In addition, each Fidelity Central Fund's financial statements are available on the SEC's website or upon request. |
| Affiliate | Value, beginning of period ($) | Purchases ($) | Sales Proceeds ($) | Dividend Income ($) | Realized Gain (loss) ($) | Change in Unrealized appreciation (depreciation) ($) | Value, end of period ($) | % ownership, end of period |
| Fidelity Cash Central Fund 5.39% | 16,918,483 | 120,945,705 | 125,448,014 | 333,971 | 228 | - | 12,416,402 | 0.0% |
| Fidelity Securities Lending Cash Central Fund 5.39% | 59,900 | 519 | 60,419 | 351 | - | - | - | 0.0% |
| Total | 16,978,383 | 120,946,224 | 125,508,433 | 334,322 | 228 | - | 12,416,402 | |
| Valuation Inputs at Reporting Date: | ||||
| Description | Total ($) | Level 1 ($) | Level 2 ($) | Level 3 ($) |
Investments in Securities: | ||||
| Equities: | ||||
Information Technology | 1 | - | - | 1 |
| Corporate Bonds | 28,048,801 | - | 28,048,801 | - |
| Asset-Backed Securities | 16,306,465 | - | 16,306,439 | 26 |
| Collateralized Mortgage Obligations | 2,978,054 | - | 2,945,193 | 32,861 |
| Commercial Mortgage Securities | 495,283,342 | - | 474,115,164 | 21,168,178 |
| Bank Loan Obligations | 6,316,331 | - | - | 6,316,331 |
| Preferred Securities | 31 | - | - | 31 |
| Money Market Funds | 12,416,402 | 12,416,402 | - | - |
| Total Investments in Securities: | 561,349,427 | 12,416,402 | 521,415,597 | 27,517,428 |
| Investments in Securities: | |||
| Bank Loan Obligations | |||
| Beginning Balance | $ | 7,894,771 | |
| Net Realized Gain (Loss) on Investment Securities | (11,130,675) | ||
| Net Unrealized Gain (Loss) on Investment Securities | 9,552,087 | ||
| Cost of Purchases | - | ||
| Proceeds of Sales | - | ||
| Amortization/Accretion | 148 | ||
| Transfers into Level 3 | - | ||
| Transfers out of Level 3 | - | ||
| Ending Balance | $ | 6,316,331 | |
| The change in unrealized gain (loss) for the period attributable to Level 3 securities held at May 31, 2024 | $ | 91,013 | |
| Other Investments in Securities | |||
| Beginning Balance | $ | 39,273 | |
| Net Realized Gain (Loss) on Investment Securities | 4,098 | ||
| Net Unrealized Gain (Loss) on Investment Securities | (8,454) | ||
| Cost of Purchases | - | ||
| Proceeds of Sales | (6,913) | ||
| Amortization/Accretion | 4,906 | ||
| Transfers into Level 3 | 9 | ||
| Transfers out of Level 3 | - | ||
| Ending Balance | $ | 32,919 | |
| The change in unrealized gain (loss) for the period attributable to Level 3 securities held at May 31, 2024 | $ | (8,454) | |
| Commercial Mortgage Securities | |||
| Beginning Balance | $ | 33,436,562 | |
| Net Realized Gain (Loss) on Investment Securities | - | ||
| Net Unrealized Gain (Loss) on Investment Securities | 3,320,453 | ||
| Cost of Purchases | - | ||
| Proceeds of Sales | - | ||
| Amortization/Accretion | (178,818) | ||
| Transfers into Level 3 | 10,321,697 | ||
| Transfers out of Level 3 | (25,731,716) | ||
| Ending Balance | $ | 21,168,178 | |
| The change in unrealized gain (loss) for the period attributable to Level 3 securities held at May 31, 2024 | $ | 3,320,453 | |
| The information used in the above reconciliation represents fiscal year to date activity for any Investments in Securities identified as using Level 3 inputs at either the beginning or the end of the current fiscal period. Cost of purchases and proceeds of sales may include securities received and/or delivered through in-kind transactions, corporate actions or exchanges. Transfers into Level 3 were attributable to a lack of observable market data resulting from decreases in market activity, decreases in liquidity, security restructurings or corporate actions. Transfers out of Level 3 were attributable to observable market data becoming available for those securities. Transfers in or out of Level 3 represent the beginning value of any Security or Instrument where a change in the pricing level occurred from the beginning to the end of the period. Realized and unrealized gains (losses) disclosed in the reconciliation are included in Net Gain (Loss) on the Fund's Statement of Operations. | |||
| Statement of Assets and Liabilities | ||||
May 31, 2024 (Unaudited) | ||||
| Assets | ||||
| Investment in securities, at value - See accompanying schedule: | ||||
Unaffiliated issuers (cost $638,682,070) | $ | 548,933,025 | ||
Fidelity Central Funds (cost $12,416,402) | 12,416,402 | |||
| Total Investment in Securities (cost $651,098,472) | $ | 561,349,427 | ||
| Cash | 7,641 | |||
| Receivable for investments sold | 756 | |||
| Interest receivable | 2,766,991 | |||
| Distributions receivable from Fidelity Central Funds | 66,331 | |||
| Prepaid expenses | 104 | |||
Total assets | 564,191,250 | |||
| Liabilities | ||||
| Payable for investments purchased | $ | 10,124,477 | ||
| Distributions payable | 1,094,173 | |||
| Accrued management fee | 326,990 | |||
| Other payables and accrued expenses | 101,488 | |||
| Total liabilities | 11,647,128 | |||
| Net Assets | $ | 552,544,122 | ||
| Net Assets consist of: | ||||
| Paid in capital | $ | 736,133,318 | ||
| Total accumulated earnings (loss) | (183,589,196) | |||
| Net Assets | $ | 552,544,122 | ||
Net Asset Value, offering price and redemption price per share ($552,544,122 ÷ 78,364,032 shares) | $ | 7.05 | ||
| Statement of Operations | ||||
Six months ended May 31, 2024 (Unaudited) | ||||
| Investment Income | ||||
| Interest | $ | 17,385,403 | ||
| Income from Fidelity Central Funds (including $351 from security lending) | 334,322 | |||
| Total income | 17,719,725 | |||
| Expenses | ||||
| Management fee | $ | 1,840,318 | ||
| Transfer agent fees | 19,052 | |||
| Accounting fees | 50,302 | |||
| Custodian fees and expenses | 2,400 | |||
| Independent trustees' fees and expenses | 1,203 | |||
| Audit | 92,930 | |||
| Legal | 198 | |||
| Miscellaneous | 2,868 | |||
| Total expenses before reductions | 2,009,271 | |||
| Expense reductions | (13,790) | |||
| Total expenses after reductions | 1,995,481 | |||
| Net Investment income (loss) | 15,724,244 | |||
| Realized and Unrealized Gain (Loss) | ||||
| Net realized gain (loss) on: | ||||
| Investment Securities: | ||||
| Unaffiliated issuers | (9,212,929) | |||
| Fidelity Central Funds | 228 | |||
| Total net realized gain (loss) | (9,212,701) | |||
| Change in net unrealized appreciation (depreciation) on investment securities | 42,711,493 | |||
| Net gain (loss) | 33,498,792 | |||
| Net increase (decrease) in net assets resulting from operations | $ | 49,223,036 | ||
| Statement of Changes in Net Assets | ||||
Six months ended May 31, 2024 (Unaudited) | Year ended November 30, 2023 | |||
| Increase (Decrease) in Net Assets | ||||
| Operations | ||||
| Net investment income (loss) | $ | 15,724,244 | $ | 38,526,384 |
| Net realized gain (loss) | (9,212,701) | (52,783,174) | ||
| Change in net unrealized appreciation (depreciation) | 42,711,493 | (2,181,571) | ||
| Net increase (decrease) in net assets resulting from operations | 49,223,036 | (16,438,361) | ||
| Distributions to shareholders | (15,673,331) | (35,594,064) | ||
| Distributions to shareholders from tax return of capital | - | (596,734) | ||
| Total Distributions | (15,673,331) | (36,190,798) | ||
| Share transactions | ||||
| Proceeds from sales of shares | 33,425,000 | 139,500 | ||
| Reinvestment of distributions | 8,491,093 | 30,125,106 | ||
| Cost of shares redeemed | (40,000,000) | (182,770,119) | ||
Net increase (decrease) in net assets resulting from share transactions | 1,916,093 | (152,505,513) | ||
| Total increase (decrease) in net assets | 35,465,798 | (205,134,672) | ||
| Net Assets | ||||
| Beginning of period | 517,078,324 | 722,212,996 | ||
| End of period | $ | 552,544,122 | $ | 517,078,324 |
| Other Information | ||||
| Shares | ||||
| Sold | 4,736,393 | 21,270 | ||
| Issued in reinvestment of distributions | 1,219,908 | 4,386,440 | ||
| Redeemed | (5,930,104) | (26,753,543) | ||
| Net increase (decrease) | 26,197 | (22,345,833) | ||
Fidelity® Real Estate High Income Fund |
Six months ended (Unaudited) May 31, 2024 | Years ended November 30, 2023 | 2022 | 2021 | 2020 | 2019 | |||||||
Selected Per-Share Data | ||||||||||||
| Net asset value, beginning of period | $ | 6.60 | $ | 7.17 | $ | 8.24 | $ | 7.80 | $ | 8.77 | $ | 8.44 |
| Income from Investment Operations | ||||||||||||
Net investment income (loss) A,B | .209 | .423 | .345 | .305 | .341 | .418 | ||||||
| Net realized and unrealized gain (loss) | .486 | (.594) | (1.059) | .469 | (.972) | .338 | ||||||
| Total from investment operations | .695 | (.171) | (.714) | .774 | (.631) | .756 | ||||||
| Distributions from net investment income | (.245) | (.392) | (.324) | (.334) | (.339) | (.426) | ||||||
| Distributions from tax return of capital | - | (.007) | (.032) | - | - | - | ||||||
| Total distributions | (.245) | (.399) | (.356) | (.334) | (.339) | (.426) | ||||||
| Net asset value, end of period | $ | 7.05 | $ | 6.60 | $ | 7.17 | $ | 8.24 | $ | 7.80 | $ | 8.77 |
Total Return C,D | 10.06 % | (2.44)% | (8.84)% | 10.07% | (7.06)% | 9.15% | ||||||
Ratios to Average Net Assets B,E,F | ||||||||||||
| Expenses before reductions | .77% G | .78% | .78% | .78% | .79% | .80% | ||||||
| Expenses net of fee waivers, if any | .77 % G | .78% | .78% | .78% | .79% | .80% | ||||||
| Expenses net of all reductions | .77% G | .78% | .78% | .78% | .79% | .79% | ||||||
| Net investment income (loss) | 6.05% G | 6.13% | 4.48% | 3.74% | 4.41% | 4.83% | ||||||
| Supplemental Data | ||||||||||||
| Net assets, end of period (000 omitted) | $ | 552,544 | $ | 517,078 | $ | 722,213 | $ | 945,943 | $ | 757,024 | $ | 821,523 |
Portfolio turnover rate H | 36 % G | 32% | 16% | 22% | 27% | 26% |
| Fidelity Central Fund | Investment Manager | Investment Objective | Investment Practices | Expense RatioA |
| Fidelity Money Market Central Funds | Fidelity Management & Research Company LLC (FMR) | Each fund seeks to obtain a high level of current income consistent with the preservation of capital and liquidity. | Short-term Investments | Less than .005% |
| Asset Type | Fair Value | Valuation Technique(s) | Unobservable Input | Amount or Range/Weighted Average | Impact to Valuation from an Increase in InputA |
| Equities | $1 | Recovery value | Recovery value | $0.00 | Increase |
| Bank Loan Obligations | $6,316,331 | Discounted cash flow | Yield | 9.5% - 11.9% / 11.2% | Decrease |
| Commercial Mortgage Securities | $21,168,178 | Indicative market price | Evaluated bid | $0.24 - $83.00 / $58.51 | Increase |
| Asset-Backed Securities | $26 | Recovery value | Recovery value | $0.00 | Increase |
| Indicative market price | Evaluated bid | $0.00 | Increase | ||
| Preferred Securities | $31 | Recovery value | Recovery value | $0.00 | Increase |
| Collateralized Mortgage Obligations | $32,861 | Indicative market price | Evaluated bid | $5.62 - $42.42 / $32.64 | Increase |
| Gross unrealized appreciation | $7,803,589 |
| Gross unrealized depreciation | (95,973,527) |
| Net unrealized appreciation (depreciation) | $(88,169,938) |
| Tax cost | $649,519,365 |
Short-term | $(11,068,368) |
Long-term | (70,193,033) |
| Total capital loss carryforward | $(81,261,401) |
| Purchases ($) | Sales ($) | |
| Fidelity Real Estate High Income Fund | 104,975,759 | 93,451,181 |
| Maximum Management Fee Rate % | |
| Fidelity Real Estate High Income Fund | .72 |
| Total Management Fee Rate % | |
| Fidelity Real Estate High Income Fund | .72 |
| % of Average Net Assets | |
| Fidelity Real Estate High Income Fund | 0.0396 |
| % of Average Net Assets | |
| Fidelity Real Estate High Income Fund | .04 |
| Amount ($) | |
| Fidelity Real Estate High Income Fund | 489 |
| Total Security Lending Fees Paid to NFS ($) | Security Lending Income From Securities Loaned to NFS ($) | Value of Securities Loaned to NFS at Period End ($) | |
| Fidelity Real Estate High Income Fund | 35 | - | - |
| Fund | Number of Unaffiliated Shareholders | Unaffiliated Shareholders % |
Fidelity Real Estate High Income Fund | 3 | 70% |
 |


Contents
| Common Stocks - 99.3% | |||
| Shares | Value ($) | ||
| COMMUNICATION SERVICES - 2.4% | |||
| Entertainment - 0.1% | |||
| Vivid Seats, Inc. Class A (a) | 98,898 | 499,435 | |
| Interactive Media & Services - 1.3% | |||
| Cars.com, Inc. (a) | 202,800 | 4,102,644 | |
| Ziff Davis, Inc. (a) | 32,384 | 1,865,642 | |
| 5,968,286 | |||
| Media - 0.6% | |||
| TechTarget, Inc. (a) | 85,600 | 2,586,832 | |
| Wireless Telecommunication Services - 0.4% | |||
| Gogo, Inc. (a)(b) | 154,200 | 1,632,207 | |
TOTAL COMMUNICATION SERVICES | 10,686,760 | ||
| CONSUMER DISCRETIONARY - 12.7% | |||
| Automobile Components - 2.7% | |||
| Adient PLC (a) | 115,100 | 3,250,424 | |
| Patrick Industries, Inc. | 73,281 | 8,398,003 | |
| 11,648,427 | |||
| Diversified Consumer Services - 0.3% | |||
| Laureate Education, Inc. | 75,544 | 1,183,019 | |
| Hotels, Restaurants & Leisure - 1.1% | |||
| Brinker International, Inc. (a) | 66,900 | 4,725,147 | |
| Household Durables - 2.4% | |||
| Installed Building Products, Inc. | 7,200 | 1,525,248 | |
| Lovesac (a) | 48,024 | 1,349,955 | |
| SharkNinja, Inc. | 61,104 | 4,681,788 | |
| Skyline Champion Corp. (a) | 44,591 | 3,103,980 | |
| 10,660,971 | |||
| Leisure Products - 1.2% | |||
| BRP, Inc. | 45,400 | 2,836,688 | |
| Brunswick Corp. | 30,200 | 2,492,406 | |
| 5,329,094 | |||
| Specialty Retail - 3.6% | |||
| Academy Sports & Outdoors, Inc. | 32,350 | 1,866,272 | |
| Boot Barn Holdings, Inc. (a) | 32,600 | 3,877,118 | |
| Murphy U.S.A., Inc. | 13,700 | 6,010,875 | |
| Valvoline, Inc. (a) | 101,100 | 4,104,660 | |
| 15,858,925 | |||
| Textiles, Apparel & Luxury Goods - 1.4% | |||
| Crocs, Inc. (a) | 38,582 | 6,004,902 | |
TOTAL CONSUMER DISCRETIONARY | 55,410,485 | ||
| CONSUMER STAPLES - 4.1% | |||
| Beverages - 0.7% | |||
| The Vita Coco Co., Inc. (a) | 111,800 | 3,254,498 | |
| Consumer Staples Distribution & Retail - 2.7% | |||
| BJ's Wholesale Club Holdings, Inc. (a) | 54,120 | 4,766,348 | |
| Performance Food Group Co. (a) | 38,600 | 2,686,560 | |
| Sprouts Farmers Market LLC (a) | 52,100 | 4,114,858 | |
| 11,567,766 | |||
| Food Products - 0.7% | |||
| Nomad Foods Ltd. | 172,253 | 3,024,763 | |
TOTAL CONSUMER STAPLES | 17,847,027 | ||
| ENERGY - 6.1% | |||
| Energy Equipment & Services - 4.4% | |||
| Cactus, Inc. | 104,300 | 5,355,805 | |
| Championx Corp. | 139,200 | 4,540,704 | |
| Liberty Energy, Inc. Class A | 261,500 | 6,456,435 | |
| TechnipFMC PLC | 105,700 | 2,768,283 | |
| 19,121,227 | |||
| Oil, Gas & Consumable Fuels - 1.7% | |||
| Antero Resources Corp. (a) | 157,200 | 5,601,036 | |
| Hess Midstream LP | 54,699 | 1,900,790 | |
| 7,501,826 | |||
TOTAL ENERGY | 26,623,053 | ||
| FINANCIALS - 14.1% | |||
| Banks - 5.1% | |||
| ConnectOne Bancorp, Inc. | 235,876 | 4,396,729 | |
| First Interstate Bancsystem, Inc. | 134,400 | 3,566,976 | |
| Independent Bank Group, Inc. | 101,534 | 4,674,625 | |
| Metropolitan Bank Holding Corp. (a) | 56,529 | 2,377,044 | |
| Pinnacle Financial Partners, Inc. | 56,800 | 4,516,168 | |
| Trico Bancshares | 73,500 | 2,798,880 | |
| 22,330,422 | |||
| Capital Markets - 4.0% | |||
| Houlihan Lokey | 34,000 | 4,601,900 | |
| Lazard, Inc. Class A | 80,000 | 3,218,400 | |
| Patria Investments Ltd. | 189,600 | 2,464,800 | |
| Stifel Financial Corp. | 39,400 | 3,189,430 | |
| TMX Group Ltd. | 139,900 | 3,754,754 | |
| 17,229,284 | |||
| Consumer Finance - 0.6% | |||
| PROG Holdings, Inc. | 69,008 | 2,607,812 | |
| Financial Services - 1.3% | |||
| Essent Group Ltd. | 101,300 | 5,743,710 | |
| Insurance - 3.1% | |||
| Old Republic International Corp. | 89,300 | 2,837,954 | |
| Primerica, Inc. | 26,300 | 5,940,907 | |
| Selective Insurance Group, Inc. | 40,127 | 3,916,796 | |
| Stewart Information Services Corp. | 11,429 | 723,570 | |
| 13,419,227 | |||
TOTAL FINANCIALS | 61,330,455 | ||
| HEALTH CARE - 13.6% | |||
| Biotechnology - 4.8% | |||
| Allogene Therapeutics, Inc. (a) | 159,300 | 398,250 | |
| Arcellx, Inc. (a) | 16,700 | 868,400 | |
| Astria Therapeutics, Inc. (a) | 53,200 | 503,804 | |
| Blueprint Medicines Corp. (a) | 13,900 | 1,467,284 | |
| Celldex Therapeutics, Inc. (a) | 20,177 | 671,894 | |
| Cogent Biosciences, Inc. (a) | 96,384 | 772,036 | |
| Crinetics Pharmaceuticals, Inc. (a) | 25,000 | 1,110,250 | |
| Cytokinetics, Inc. (a) | 36,300 | 1,760,913 | |
| Insmed, Inc. (a) | 44,900 | 2,471,745 | |
| Keros Therapeutics, Inc. (a) | 23,100 | 1,082,697 | |
| Legend Biotech Corp. ADR (a) | 16,500 | 660,165 | |
| Madrigal Pharmaceuticals, Inc. (a)(b) | 3,000 | 708,480 | |
| Merus BV (a) | 11,400 | 606,936 | |
| Scholar Rock Holding Corp. (a) | 44,400 | 416,916 | |
| Tyra Biosciences, Inc. (a) | 40,300 | 653,666 | |
| Vaxcyte, Inc. (a) | 35,900 | 2,522,693 | |
| Viking Therapeutics, Inc. (a) | 34,200 | 2,129,292 | |
| Viridian Therapeutics, Inc. (a) | 31,700 | 378,815 | |
| Xenon Pharmaceuticals, Inc. (a) | 32,600 | 1,241,082 | |
| Zentalis Pharmaceuticals, Inc. (a) | 34,130 | 405,464 | |
| 20,830,782 | |||
| Health Care Equipment & Supplies - 3.6% | |||
| Haemonetics Corp. (a) | 31,200 | 2,623,296 | |
| Masimo Corp. (a) | 15,400 | 1,917,300 | |
| Merit Medical Systems, Inc. (a) | 37,900 | 3,075,585 | |
| Pulmonx Corp. (a) | 185,700 | 1,346,325 | |
| RxSight, Inc. (a) | 31,100 | 1,818,417 | |
| TransMedics Group, Inc. (a) | 35,300 | 4,814,920 | |
| 15,595,843 | |||
| Health Care Providers & Services - 4.4% | |||
| Acadia Healthcare Co., Inc. (a) | 70,500 | 4,856,745 | |
| Chemed Corp. | 7,800 | 4,324,086 | |
| Option Care Health, Inc. (a) | 68,166 | 2,032,710 | |
| PACS Group, Inc. (a) | 36,700 | 1,115,680 | |
| Pennant Group, Inc. (a) | 31,630 | 744,570 | |
| The Ensign Group, Inc. | 51,700 | 6,268,108 | |
| 19,341,899 | |||
| Life Sciences Tools & Services - 0.3% | |||
| Maravai LifeSciences Holdings, Inc. Class A (a) | 149,500 | 1,296,165 | |
| Pharmaceuticals - 0.5% | |||
| Edgewise Therapeutics, Inc. (a) | 40,800 | 698,904 | |
| Intra-Cellular Therapies, Inc. (a) | 20,600 | 1,385,144 | |
| 2,084,048 | |||
TOTAL HEALTH CARE | 59,148,737 | ||
| INDUSTRIALS - 18.6% | |||
| Aerospace & Defense - 0.0% | |||
| Loar Holdings, Inc. (a)(b) | 400 | 22,788 | |
| Building Products - 2.3% | |||
| AAON, Inc. | 36,200 | 2,716,810 | |
| CSW Industrials, Inc. | 11,685 | 2,971,028 | |
| Simpson Manufacturing Co. Ltd. | 25,400 | 4,214,368 | |
| 9,902,206 | |||
| Construction & Engineering - 2.7% | |||
| EMCOR Group, Inc. | 15,700 | 6,101,962 | |
| Sterling Construction Co., Inc. (a) | 45,200 | 5,553,724 | |
| 11,655,686 | |||
| Electrical Equipment - 2.8% | |||
| Array Technologies, Inc. (a)(b) | 169,088 | 2,397,668 | |
| Atkore, Inc. (b) | 17,800 | 2,708,270 | |
| Nextracker, Inc. Class A (a) | 77,700 | 4,286,709 | |
| Thermon Group Holdings, Inc. (a) | 82,800 | 2,795,328 | |
| 12,187,975 | |||
| Ground Transportation - 1.3% | |||
| ArcBest Corp. | 15,745 | 1,661,412 | |
| TFI International, Inc. | 29,900 | 3,955,172 | |
| 5,616,584 | |||
| Machinery - 1.3% | |||
| Terex Corp. | 95,500 | 5,698,485 | |
| Professional Services - 2.6% | |||
| Concentrix Corp. | 27,513 | 1,687,372 | |
| ExlService Holdings, Inc. (a) | 146,048 | 4,360,993 | |
| KBR, Inc. | 85,167 | 5,592,065 | |
| 11,640,430 | |||
| Trading Companies & Distributors - 5.6% | |||
| Applied Industrial Technologies, Inc. | 21,600 | 4,168,800 | |
| Beacon Roofing Supply, Inc. (a) | 41,600 | 4,037,696 | |
| FTAI Aviation Ltd. | 81,100 | 6,838,352 | |
| GMS, Inc. (a) | 49,400 | 4,641,624 | |
| Rush Enterprises, Inc. Class A | 105,998 | 4,783,690 | |
| 24,470,162 | |||
TOTAL INDUSTRIALS | 81,194,316 | ||
| INFORMATION TECHNOLOGY - 15.4% | |||
| Electronic Equipment, Instruments & Components - 6.9% | |||
| Advanced Energy Industries, Inc. | 43,300 | 4,651,719 | |
| Fabrinet (a) | 36,400 | 8,718,894 | |
| Insight Enterprises, Inc. (a) | 38,498 | 7,526,359 | |
| Napco Security Technologies, Inc. | 59,782 | 2,968,176 | |
| TD SYNNEX Corp. | 46,113 | 6,033,425 | |
| 29,898,573 | |||
| IT Services - 2.2% | |||
| ASGN, Inc. (a) | 46,700 | 4,385,597 | |
| Endava PLC ADR (a) | 47,401 | 1,276,983 | |
| Wix.com Ltd. (a) | 23,900 | 3,850,290 | |
| 9,512,870 | |||
| Semiconductors & Semiconductor Equipment - 3.9% | |||
| AEHR Test Systems (a)(b) | 42,900 | 493,779 | |
| Allegro MicroSystems LLC (a) | 115,900 | 3,493,226 | |
| Diodes, Inc. (a) | 53,658 | 3,977,668 | |
| MACOM Technology Solutions Holdings, Inc. (a) | 52,200 | 5,279,508 | |
| Nova Ltd. (a) | 18,272 | 3,812,453 | |
| 17,056,634 | |||
| Software - 2.4% | |||
| Five9, Inc. (a) | 32,900 | 1,538,404 | |
| Intapp, Inc. (a)(b) | 62,519 | 2,244,432 | |
| PROS Holdings, Inc. (a) | 55,300 | 1,630,244 | |
| Rapid7, Inc. (a) | 34,000 | 1,228,760 | |
| Tenable Holdings, Inc. (a) | 95,600 | 4,033,364 | |
| 10,675,204 | |||
TOTAL INFORMATION TECHNOLOGY | 67,143,281 | ||
| MATERIALS - 7.2% | |||
| Chemicals - 2.5% | |||
| Element Solutions, Inc. | 206,100 | 4,952,583 | |
| Hawkins, Inc. | 17,300 | 1,510,636 | |
| The Chemours Co. LLC | 59,300 | 1,471,826 | |
| Tronox Holdings PLC | 142,300 | 2,818,963 | |
| 10,754,008 | |||
| Construction Materials - 1.3% | |||
| Eagle Materials, Inc. | 23,800 | 5,530,882 | |
| Metals & Mining - 3.4% | |||
| Commercial Metals Co. | 129,300 | 7,282,176 | |
| Constellium NV (a) | 353,900 | 7,669,013 | |
| 14,951,189 | |||
TOTAL MATERIALS | 31,236,079 | ||
| REAL ESTATE - 4.0% | |||
| Equity Real Estate Investment Trusts (REITs) - 3.3% | |||
| Essential Properties Realty Trust, Inc. (b) | 191,692 | 5,133,512 | |
| Lamar Advertising Co. Class A | 52,700 | 6,224,397 | |
| Urban Edge Properties | 184,200 | 3,265,866 | |
| 14,623,775 | |||
| Real Estate Management & Development - 0.7% | |||
| Colliers International Group, Inc. | 26,100 | 2,926,639 | |
TOTAL REAL ESTATE | 17,550,414 | ||
| UTILITIES - 1.1% | |||
| Gas Utilities - 1.1% | |||
| Brookfield Infrastructure Corp. A Shares | 139,657 | 4,811,184 | |
| TOTAL COMMON STOCKS (Cost $309,415,581) | 432,981,791 | ||
| Money Market Funds - 4.6% | |||
| Shares | Value ($) | ||
| Fidelity Cash Central Fund 5.39% (c) | 2,850,733 | 2,851,303 | |
| Fidelity Securities Lending Cash Central Fund 5.39% (c)(d) | 17,254,334 | 17,256,060 | |
| TOTAL MONEY MARKET FUNDS (Cost $20,107,363) | 20,107,363 | ||
| Equity Funds - 0.3% | |||
| Shares | Value ($) | ||
| Small Blend Funds - 0.3% | |||
iShares Russell 2000 Index ETF (b) (Cost $1,173,495) | 6,780 | 1,395,121 | |
| TOTAL INVESTMENT IN SECURITIES - 104.2% (Cost $330,696,439) | 454,484,275 |
NET OTHER ASSETS (LIABILITIES) - (4.2)% | (18,412,017) |
| NET ASSETS - 100.0% | 436,072,258 |
| ETF | - | EXCHANGE-TRADED FUND |
| (a) | Non-income producing |
| (b) | Security or a portion of the security is on loan at period end. |
| (c) | Affiliated fund that is generally available only to investment companies and other accounts managed by Fidelity Investments. The rate quoted is the annualized seven-day yield of the fund at period end. A complete unaudited listing of the fund's holdings as of its most recent quarter end is available upon request. In addition, each Fidelity Central Fund's financial statements are available on the SEC's website or upon request. |
| (d) | Investment made with cash collateral received from securities on loan. |
| Affiliate | Value, beginning of period ($) | Purchases ($) | Sales Proceeds ($) | Dividend Income ($) | Realized Gain (loss) ($) | Change in Unrealized appreciation (depreciation) ($) | Value, end of period ($) | % ownership, end of period |
| Fidelity Cash Central Fund 5.39% | 4,018,838 | 45,025,016 | 46,192,387 | 107,372 | (164) | - | 2,851,303 | 0.0% |
| Fidelity Securities Lending Cash Central Fund 5.39% | 8,318,910 | 74,976,619 | 66,039,469 | 4,822 | - | - | 17,256,060 | 0.1% |
| Total | 12,337,748 | 120,001,635 | 112,231,856 | 112,194 | (164) | - | 20,107,363 | |
| Valuation Inputs at Reporting Date: | ||||
| Description | Total ($) | Level 1 ($) | Level 2 ($) | Level 3 ($) |
Investments in Securities: | ||||
| Equities: | ||||
Communication Services | 10,686,760 | 10,686,760 | - | - |
Consumer Discretionary | 55,410,485 | 55,410,485 | - | - |
Consumer Staples | 17,847,027 | 17,847,027 | - | - |
Energy | 26,623,053 | 26,623,053 | - | - |
Financials | 61,330,455 | 61,330,455 | - | - |
Health Care | 59,148,737 | 59,148,737 | - | - |
Industrials | 81,194,316 | 81,194,316 | - | - |
Information Technology | 67,143,281 | 67,143,281 | - | - |
Materials | 31,236,079 | 31,236,079 | - | - |
Real Estate | 17,550,414 | 17,550,414 | - | - |
Utilities | 4,811,184 | 4,811,184 | - | - |
| Money Market Funds | 20,107,363 | 20,107,363 | - | - |
| Equity Funds | 1,395,121 | 1,395,121 | - | - |
| Total Investments in Securities: | 454,484,275 | 454,484,275 | - | - |
| Statement of Assets and Liabilities | ||||
May 31, 2024 (Unaudited) | ||||
| Assets | ||||
| Investment in securities, at value (including securities loaned of $16,979,429) - See accompanying schedule: | ||||
Unaffiliated issuers (cost $310,589,076) | $ | 434,376,912 | ||
Fidelity Central Funds (cost $20,107,363) | 20,107,363 | |||
| Total Investment in Securities (cost $330,696,439) | $ | 454,484,275 | ||
| Cash | 2,359 | |||
| Foreign currency held at value (cost $397,164) | 394,750 | |||
| Receivable for investments sold | 2,196,373 | |||
| Receivable for fund shares sold | 9,948 | |||
| Dividends receivable | 307,984 | |||
| Distributions receivable from Fidelity Central Funds | 14,625 | |||
| Receivable from investment adviser for expense reductions | 9,354 | |||
Total assets | 457,419,668 | |||
| Liabilities | ||||
| Payable for investments purchased | $ | 27,388 | ||
| Payable for fund shares redeemed | 4,055,617 | |||
| Other payables and accrued expenses | 8,855 | |||
| Collateral on securities loaned | 17,255,550 | |||
| Total liabilities | 21,347,410 | |||
| Net Assets | $ | 436,072,258 | ||
| Net Assets consist of: | ||||
| Paid in capital | $ | 291,014,957 | ||
| Total accumulated earnings (loss) | 145,057,301 | |||
| Net Assets | $ | 436,072,258 | ||
Net Asset Value, offering price and redemption price per share ($436,072,258 ÷ 33,371,890 shares) | $ | 13.07 | ||
| Statement of Operations | ||||
Six months ended May 31, 2024 (Unaudited) | ||||
| Investment Income | ||||
| Dividends | $ | 1,919,597 | ||
| Interest | 982 | |||
| Income from Fidelity Central Funds (including $4,822 from security lending) | 112,194 | |||
| Total income | 2,032,773 | |||
| Expenses | ||||
| Custodian fees and expenses | $ | 21,511 | ||
| Independent trustees' fees and expenses | 946 | |||
| Legal | 1,031 | |||
| Interest | 8,258 | |||
| Miscellaneous | 25 | |||
| Total expenses before reductions | 31,771 | |||
| Expense reductions | (16,180) | |||
| Total expenses after reductions | 15,591 | |||
| Net Investment income (loss) | 2,017,182 | |||
| Realized and Unrealized Gain (Loss) | ||||
| Net realized gain (loss) on: | ||||
| Investment Securities: | ||||
| Unaffiliated issuers | 23,377,242 | |||
| Fidelity Central Funds | (164) | |||
| Foreign currency transactions | (922) | |||
| Total net realized gain (loss) | 23,376,156 | |||
| Change in net unrealized appreciation (depreciation) on: | ||||
| Investment Securities: | ||||
| Unaffiliated issuers | 52,567,861 | |||
| Assets and liabilities in foreign currencies | (9,078) | |||
| Total change in net unrealized appreciation (depreciation) | 52,558,783 | |||
| Net gain (loss) | 75,934,939 | |||
| Net increase (decrease) in net assets resulting from operations | $ | 77,952,121 | ||
| Statement of Changes in Net Assets | ||||
Six months ended May 31, 2024 (Unaudited) | Year ended November 30, 2023 | |||
| Increase (Decrease) in Net Assets | ||||
| Operations | ||||
| Net investment income (loss) | $ | 2,017,182 | $ | 3,709,239 |
| Net realized gain (loss) | 23,376,156 | 13,558,563 | ||
| Change in net unrealized appreciation (depreciation) | 52,558,783 | (5,211,618) | ||
| Net increase (decrease) in net assets resulting from operations | 77,952,121 | 12,056,184 | ||
| Distributions to shareholders | (16,299,236) | (34,872,065) | ||
| Share transactions | ||||
| Proceeds from sales of shares | 27,307,471 | 80,869,900 | ||
| Reinvestment of distributions | 16,299,236 | 34,872,065 | ||
| Cost of shares redeemed | (75,861,282) | (93,134,248) | ||
Net increase (decrease) in net assets resulting from share transactions | (32,254,575) | 22,607,717 | ||
| Total increase (decrease) in net assets | 29,398,310 | (208,164) | ||
| Net Assets | ||||
| Beginning of period | 406,673,948 | 406,882,112 | ||
| End of period | $ | 436,072,258 | $ | 406,673,948 |
| Other Information | ||||
| Shares | ||||
| Sold | 2,218,011 | 7,324,557 | ||
| Issued in reinvestment of distributions | 1,401,482 | 3,216,980 | ||
| Redeemed | (6,161,057) | (8,100,778) | ||
| Net increase (decrease) | (2,541,564) | 2,440,759 | ||
Fidelity Advisor® Series Small Cap Fund |
Six months ended (Unaudited) May 31, 2024 | Years ended November 30, 2023 | 2022 | 2021 | 2020 | 2019 | |||||||
Selected Per-Share Data | ||||||||||||
| Net asset value, beginning of period | $ | 11.32 | $ | 12.16 | $ | 17.04 | $ | 12.88 | $ | 11.72 | $ | 11.41 |
| Income from Investment Operations | ||||||||||||
Net investment income (loss) A,B | .06 | .10 | .11 | .11 | .09 | .09 | ||||||
| Net realized and unrealized gain (loss) | 2.15 | .11 | (1.91) | 4.49 | 1.42 | 1.32 | ||||||
| Total from investment operations | 2.21 | .21 | (1.80) | 4.60 | 1.51 | 1.41 | ||||||
| Distributions from net investment income | (.12) | (.11) | (.12) | (.12) | (.07) | (.11) C | ||||||
| Distributions from net realized gain | (.34) | (.94) | (2.97) | (.32) | (.28) | (.99) C | ||||||
| Total distributions | (.46) | (1.05) | (3.08) D | (.44) | (.35) | (1.10) | ||||||
| Net asset value, end of period | $ | 13.07 | $ | 11.32 | $ | 12.16 | $ | 17.04 | $ | 12.88 | $ | 11.72 |
Total Return E,F | 19.99 % | 2.11% | (13.01)% | 36.69% | 13.21% | 15.27% | ||||||
Ratios to Average Net Assets B,G,H | ||||||||||||
| Expenses before reductions | .01% I,J | .01% | .01% | .01% | .01% | .01% | ||||||
| Expenses net of fee waivers, if any | .01 % I,J | .01% | -% K | -% K | .01% | .01% | ||||||
| Expenses net of all reductions | .01% I,J | .01% | -% K | -% K | .01% | .01% | ||||||
| Net investment income (loss) | .95% I,J | .93% | .92% | .68% | .85% | .89% | ||||||
| Supplemental Data | ||||||||||||
| Net assets, end of period (000 omitted) | $ | 436,072 | $ | 406,674 | $ | 406,882 | $ | 508,445 | $ | 467,212 | $ | 469,471 |
Portfolio turnover rate L | 41 % I | 40% | 57% | 51% | 58% | 76% |
| Fidelity Central Fund | Investment Manager | Investment Objective | Investment Practices | Expense RatioA |
| Fidelity Money Market Central Funds | Fidelity Management & Research Company LLC (FMR) | Each fund seeks to obtain a high level of current income consistent with the preservation of capital and liquidity. | Short-term Investments | Less than .005% |
| Gross unrealized appreciation | $142,622,266 |
| Gross unrealized depreciation | (20,558,277) |
| Net unrealized appreciation (depreciation) | $122,063,989 |
| Tax cost | $332,420,286 |
| Purchases ($) | Sales ($) | |
| Fidelity Advisor Series Small Cap Fund | 85,663,170 | 125,159,073 |
| Amount ($) | |
| Fidelity Advisor Series Small Cap Fund | 2,920 |
| Borrower or Lender | Average Loan Balance ($) | Weighted Average Interest Rate | Interest Expense ($) | |
| Fidelity Advisor Series Small Cap Fund | Borrower | 7,468,286 | 5.58% | 8,102 |
| Purchases ($) | Sales ($) | Realized Gain (Loss)($) | |
| Fidelity Advisor Series Small Cap Fund | 5,639,411 | 8,734,007 | 1,426,376 |
| Total Security Lending Fees Paid to NFS ($) | Security Lending Income From Securities Loaned to NFS ($) | Value of Securities Loaned to NFS at Period End ($) | |
| Fidelity Advisor Series Small Cap Fund | 503 | - | - |
| Average Loan Balance ($) | Weighted Average Interest Rate | Interest Expense ($) | |
| Fidelity Advisor Series Small Cap Fund | 966,000 | 5.83% | 156 |
 |


Contents
| Common Stocks - 98.4% | |||
| Shares | Value ($) (000s) | ||
| COMMUNICATION SERVICES - 6.1% | |||
| Diversified Telecommunication Services - 2.4% | |||
| Quebecor, Inc. Class B (sub. vtg.) | 237,200 | 5,003 | |
| Verizon Communications, Inc. | 920,290 | 37,870 | |
| 42,873 | |||
| Media - 3.7% | |||
| Comcast Corp. Class A | 1,161,600 | 46,499 | |
| Omnicom Group, Inc. | 99,100 | 9,212 | |
| WPP PLC | 997,600 | 10,442 | |
| 66,153 | |||
TOTAL COMMUNICATION SERVICES | 109,026 | ||
| CONSUMER DISCRETIONARY - 3.9% | |||
| Automobile Components - 0.7% | |||
| Lear Corp. | 105,400 | 13,212 | |
| Broadline Retail - 0.6% | |||
| eBay, Inc. | 218,900 | 11,869 | |
| Distributors - 0.5% | |||
| LKQ Corp. | 207,100 | 8,912 | |
| Household Durables - 0.4% | |||
| Whirlpool Corp. (a) | 70,400 | 6,549 | |
| Specialty Retail - 0.5% | |||
| Lowe's Companies, Inc. | 38,300 | 8,475 | |
| Textiles, Apparel & Luxury Goods - 1.2% | |||
| Tapestry, Inc. | 496,700 | 21,601 | |
TOTAL CONSUMER DISCRETIONARY | 70,618 | ||
| CONSUMER STAPLES - 10.9% | |||
| Beverages - 5.2% | |||
| Carlsberg A/S Series B | 79,200 | 10,745 | |
| Coca-Cola Europacific Partners PLC | 317,600 | 23,410 | |
| Diageo PLC | 371,600 | 12,511 | |
| Keurig Dr. Pepper, Inc. | 822,800 | 28,181 | |
| The Coca-Cola Co. (b) | 290,300 | 18,269 | |
| 93,116 | |||
| Consumer Staples Distribution & Retail - 1.3% | |||
| Albertsons Companies, Inc. | 490,600 | 10,126 | |
| Sysco Corp. | 195,700 | 14,251 | |
| 24,377 | |||
| Food Products - 0.5% | |||
| Tyson Foods, Inc. Class A | 145,400 | 8,324 | |
| Household Products - 0.7% | |||
| Reckitt Benckiser Group PLC | 237,300 | 13,581 | |
| Personal Care Products - 3.2% | |||
| Kenvue, Inc. | 1,246,205 | 24,052 | |
| Unilever PLC sponsored ADR | 610,800 | 33,441 | |
| 57,493 | |||
TOTAL CONSUMER STAPLES | 196,891 | ||
| ENERGY - 8.2% | |||
| Oil, Gas & Consumable Fuels - 8.2% | |||
| Enterprise Products Partners LP | 884,100 | 25,197 | |
| Exxon Mobil Corp. (b) | 493,200 | 57,831 | |
| Imperial Oil Ltd. | 61,500 | 4,345 | |
| Parkland Corp. | 252,400 | 7,283 | |
| Shell PLC ADR | 489,200 | 35,604 | |
| TotalEnergies SE | 238,900 | 17,503 | |
| 147,763 | |||
| FINANCIALS - 19.9% | |||
| Banks - 10.9% | |||
| Bank of America Corp. | 725,000 | 28,993 | |
| Cullen/Frost Bankers, Inc. | 66,300 | 6,735 | |
| East West Bancorp, Inc. | 136,100 | 10,097 | |
| Huntington Bancshares, Inc. | 771,400 | 10,738 | |
| KBC Group NV | 125,200 | 9,143 | |
| KeyCorp | 382,600 | 5,498 | |
| M&T Bank Corp. | 241,900 | 36,672 | |
| PNC Financial Services Group, Inc. | 79,600 | 12,528 | |
| U.S. Bancorp (a) | 770,400 | 31,240 | |
| Wells Fargo & Co. (b) | 742,550 | 44,494 | |
| 196,138 | |||
| Capital Markets - 2.7% | |||
| Bank of New York Mellon Corp. | 436,400 | 26,014 | |
| CME Group, Inc. (b) | 38,900 | 7,896 | |
| Northern Trust Corp. | 161,600 | 13,613 | |
| 47,523 | |||
| Financial Services - 3.0% | |||
| Fidelity National Information Services, Inc. | 232,000 | 17,604 | |
| Global Payments, Inc. | 245,300 | 24,984 | |
| Visa, Inc. Class A | 42,100 | 11,471 | |
| 54,059 | |||
| Insurance - 3.3% | |||
| Chubb Ltd. | 129,884 | 35,175 | |
| First American Financial Corp. | 122,200 | 6,792 | |
| The Travelers Companies, Inc. | 80,400 | 17,342 | |
| 59,309 | |||
TOTAL FINANCIALS | 357,029 | ||
| HEALTH CARE - 17.2% | |||
| Biotechnology - 1.4% | |||
| Gilead Sciences, Inc. (a) | 375,200 | 24,114 | |
| Health Care Equipment & Supplies - 0.6% | |||
| Baxter International, Inc. | 276,600 | 9,429 | |
| Solventum Corp. | 31,775 | 1,886 | |
| 11,315 | |||
| Health Care Providers & Services - 4.4% | |||
| Cigna Group | 75,400 | 25,984 | |
| Elevance Health, Inc. (b) | 61,400 | 33,063 | |
| UnitedHealth Group, Inc. | 39,400 | 19,518 | |
| 78,565 | |||
| Pharmaceuticals - 10.8% | |||
| Bristol-Myers Squibb Co. | 543,200 | 22,320 | |
| GSK PLC sponsored ADR | 483,900 | 21,664 | |
| Johnson & Johnson | 346,071 | 50,758 | |
| Merck & Co., Inc. (b) | 348,000 | 43,688 | |
| Organon & Co. | 422,530 | 9,013 | |
| Roche Holding AG (participation certificate) | 87,800 | 22,417 | |
| Royalty Pharma PLC | 473,000 | 12,965 | |
| Sanofi SA sponsored ADR | 234,300 | 11,488 | |
| 194,313 | |||
TOTAL HEALTH CARE | 308,307 | ||
| INDUSTRIALS - 8.8% | |||
| Aerospace & Defense - 2.2% | |||
| General Dynamics Corp. (b) | 80,300 | 24,072 | |
| Lockheed Martin Corp. | 34,300 | 16,133 | |
| 40,205 | |||
| Air Freight & Logistics - 0.3% | |||
| FedEx Corp. | 21,484 | 5,456 | |
| Construction & Engineering - 0.4% | |||
| VINCI SA | 57,000 | 7,113 | |
| Electrical Equipment - 0.9% | |||
| Regal Rexnord Corp. | 107,100 | 16,016 | |
| Industrial Conglomerates - 0.7% | |||
| 3M Co. | 120,700 | 12,087 | |
| Machinery - 1.4% | |||
| Allison Transmission Holdings, Inc. | 155,100 | 11,758 | |
| Parker Hannifin Corp. (b) | 25,100 | 13,341 | |
| 25,099 | |||
| Professional Services - 2.9% | |||
| Concentrix Corp. | 119,600 | 7,335 | |
| Genpact Ltd. | 426,800 | 14,110 | |
| ManpowerGroup, Inc. | 115,600 | 8,626 | |
| SS&C Technologies Holdings, Inc. | 355,500 | 22,059 | |
| 52,130 | |||
TOTAL INDUSTRIALS | 158,106 | ||
| INFORMATION TECHNOLOGY - 6.4% | |||
| Communications Equipment - 1.6% | |||
| Cisco Systems, Inc. | 635,153 | 29,535 | |
| IT Services - 2.1% | |||
| Amdocs Ltd. | 279,422 | 22,074 | |
| Capgemini SA | 77,000 | 15,600 | |
| 37,674 | |||
| Semiconductors & Semiconductor Equipment - 1.7% | |||
| Microchip Technology, Inc. | 117,250 | 11,400 | |
| Taiwan Semiconductor Manufacturing Co. Ltd. sponsored ADR | 124,900 | 18,865 | |
| 30,265 | |||
| Software - 1.0% | |||
| Gen Digital, Inc. | 373,200 | 9,267 | |
| Microsoft Corp. (b) | 19,500 | 8,095 | |
| 17,362 | |||
TOTAL INFORMATION TECHNOLOGY | 114,836 | ||
| MATERIALS - 3.9% | |||
| Chemicals - 1.6% | |||
| Celanese Corp. Class A | 29,800 | 4,531 | |
| CF Industries Holdings, Inc. | 198,900 | 15,858 | |
| Olin Corp. | 161,500 | 8,682 | |
| 29,071 | |||
| Construction Materials - 0.3% | |||
| Eagle Materials, Inc. | 19,200 | 4,462 | |
| Containers & Packaging - 2.0% | |||
| Berry Global Group, Inc. | 226,000 | 13,533 | |
| Crown Holdings, Inc. | 212,100 | 17,857 | |
| Sonoco Products Co. | 86,600 | 5,315 | |
| 36,705 | |||
TOTAL MATERIALS | 70,238 | ||
| REAL ESTATE - 4.8% | |||
| Equity Real Estate Investment Trusts (REITs) - 4.8% | |||
| Alexandria Real Estate Equities, Inc. | 50,200 | 5,974 | |
| American Tower Corp. | 100,700 | 19,711 | |
| COPT Defense Properties (SBI) | 581,400 | 14,343 | |
| Crown Castle, Inc. | 185,600 | 19,024 | |
| Gaming & Leisure Properties | 200,400 | 8,998 | |
| Public Storage | 33,700 | 9,228 | |
| Realty Income Corp. | 175,900 | 9,333 | |
| 86,611 | |||
| UTILITIES - 8.3% | |||
| Electric Utilities - 6.5% | |||
| American Electric Power Co., Inc. | 128,400 | 11,588 | |
| Duke Energy Corp. | 291,000 | 30,139 | |
| Edison International | 96,864 | 7,444 | |
| Eversource Energy | 162,300 | 9,613 | |
| Exelon Corp. | 322,500 | 12,110 | |
| FirstEnergy Corp. | 631,200 | 25,412 | |
| PG&E Corp. | 506,500 | 9,391 | |
| Portland General Electric Co. | 108,200 | 4,821 | |
| PPL Corp. | 216,100 | 6,338 | |
| 116,856 | |||
| Multi-Utilities - 1.8% | |||
| Sempra | 420,200 | 32,368 | |
TOTAL UTILITIES | 149,224 | ||
| TOTAL COMMON STOCKS (Cost $1,477,042) | 1,768,649 | ||
| Money Market Funds - 1.6% | |||
| Shares | Value ($) (000s) | ||
| Fidelity Cash Central Fund 5.39% (c) | 24,248,957 | 24,254 | |
| Fidelity Securities Lending Cash Central Fund 5.39% (c)(d) | 3,698,580 | 3,699 | |
| TOTAL MONEY MARKET FUNDS (Cost $27,953) | 27,953 | ||
| TOTAL INVESTMENT IN SECURITIES - 100.0% (Cost $1,504,995) | 1,796,602 |
NET OTHER ASSETS (LIABILITIES) - 0.0% | 177 |
| NET ASSETS - 100.0% | 1,796,779 |
| Written Options | ||||||
| Counterparty | Number of Contracts | Notional Amount ($) (000s) | Exercise Price ($) | Expiration Date | Value ($) (000s) | |
| Call Options | ||||||
| CME Group, Inc. Class A | Chicago Board Options Exchange | 92 | 1,867 | 230.00 | 09/20/24 | (15) |
| Elevance Health, Inc. | Chicago Board Options Exchange | 116 | 6,246 | 550.00 | 06/21/24 | (57) |
| Exxon Mobil Corp. | Chicago Board Options Exchange | 728 | 8,537 | 130.00 | 07/19/24 | (21) |
| General Dynamics Corp. | Chicago Board Options Exchange | 159 | 4,766 | 290.00 | 06/21/24 | (186) |
| Merck & Co., Inc. | Chicago Board Options Exchange | 509 | 6,390 | 135.00 | 06/21/24 | (9) |
| Microsoft Corp. | Chicago Board Options Exchange | 45 | 1,868 | 450.00 | 09/20/24 | (40) |
| Parker Hannifin Corp. | Chicago Board Options Exchange | 68 | 3,614 | 620.00 | 08/16/24 | (13) |
| The Coca-Cola Co. | Chicago Board Options Exchange | 858 | 5,399 | 62.50 | 06/21/24 | (84) |
| The Coca-Cola Co. | Chicago Board Options Exchange | 278 | 1,749 | 62.50 | 07/19/24 | (37) |
| Wells Fargo & Co. | Chicago Board Options Exchange | 1,850 | 11,085 | 62.50 | 06/21/24 | (63) |
| TOTAL WRITTEN OPTIONS | (525) | |||||
| (a) | Security or a portion of the security is on loan at period end. |
| (b) | Security or a portion of the security is pledged as collateral for options written. At period end, the value of securities pledged amounted to $51,521,000. |
| (c) | Affiliated fund that is generally available only to investment companies and other accounts managed by Fidelity Investments. The rate quoted is the annualized seven-day yield of the fund at period end. A complete unaudited listing of the fund's holdings as of its most recent quarter end is available upon request. In addition, each Fidelity Central Fund's financial statements are available on the SEC's website or upon request. |
| (d) | Investment made with cash collateral received from securities on loan. |
| Affiliate (Amounts in thousands) | Value, beginning of period ($) | Purchases ($) | Sales Proceeds ($) | Dividend Income ($) | Realized Gain (loss) ($) | Change in Unrealized appreciation (depreciation) ($) | Value, end of period ($) | % ownership, end of period |
| Fidelity Cash Central Fund 5.39% | 32,020 | 147,504 | 155,270 | 746 | - | - | 24,254 | 0.1% |
| Fidelity Securities Lending Cash Central Fund 5.39% | 7,825 | 46,485 | 50,611 | 2 | - | - | 3,699 | 0.0% |
| Total | 39,845 | 193,989 | 205,881 | 748 | - | - | 27,953 | |
| Valuation Inputs at Reporting Date: | ||||
Description (Amounts in thousands) | Total ($) | Level 1 ($) | Level 2 ($) | Level 3 ($) |
Investments in Securities: | ||||
| Equities: | ||||
Communication Services | 109,026 | 98,584 | 10,442 | - |
Consumer Discretionary | 70,618 | 70,618 | - | - |
Consumer Staples | 196,891 | 160,054 | 36,837 | - |
Energy | 147,763 | 130,260 | 17,503 | - |
Financials | 357,029 | 347,886 | 9,143 | - |
Health Care | 308,307 | 285,890 | 22,417 | - |
Industrials | 158,106 | 150,993 | 7,113 | - |
Information Technology | 114,836 | 99,236 | 15,600 | - |
Materials | 70,238 | 70,238 | - | - |
Real Estate | 86,611 | 86,611 | - | - |
Utilities | 149,224 | 149,224 | - | - |
| Money Market Funds | 27,953 | 27,953 | - | - |
| Total Investments in Securities: | 1,796,602 | 1,677,547 | 119,055 | - |
Derivative Instruments: Liabilities | ||||
Written Options | (525) | (525) | - | - |
| Total Liabilities | (525) | (525) | - | - |
| Total Derivative Instruments: | (525) | (525) | - | - |
Primary Risk Exposure / Derivative Type | Value | |
| (Amounts in thousands) | Asset ($) | Liability ($) |
| Equity Risk | ||
Written Options (a) | 0 | (525) |
| Total Equity Risk | 0 | (525) |
| Total Value of Derivatives | 0 | (525) |
| Statement of Assets and Liabilities | ||||
| Amounts in thousands (except per-share amounts) | May 31, 2024 (Unaudited) | |||
| Assets | ||||
| Investment in securities, at value (including securities loaned of $3,716) - See accompanying schedule: | ||||
Unaffiliated issuers (cost $1,477,042) | $ | 1,768,649 | ||
Fidelity Central Funds (cost $27,953) | 27,953 | |||
| Total Investment in Securities (cost $1,504,995) | $ | 1,796,602 | ||
| Foreign currency held at value (cost $242) | 242 | |||
| Receivable for investments sold | 3,194 | |||
| Receivable for fund shares sold | 343 | |||
| Dividends receivable | 5,237 | |||
| Distributions receivable from Fidelity Central Funds | 129 | |||
| Other receivables | 23 | |||
Total assets | 1,805,770 | |||
| Liabilities | ||||
| Payable for investments purchased | $ | 2,882 | ||
| Payable for fund shares redeemed | 498 | |||
| Accrued management fee | 874 | |||
| Distribution and service plan fees payable | 439 | |||
| Written options, at value (premium received $890) | 525 | |||
| Other payables and accrued expenses | 74 | |||
| Collateral on securities loaned | 3,699 | |||
| Total liabilities | 8,991 | |||
| Net Assets | $ | 1,796,779 | ||
| Net Assets consist of: | ||||
| Paid in capital | $ | 1,424,378 | ||
| Total accumulated earnings (loss) | 372,401 | |||
| Net Assets | $ | 1,796,779 | ||
| Net Asset Value and Maximum Offering Price | ||||
| Class A : | ||||
Net Asset Value and redemption price per share ($787,074 ÷ 23,788 shares)(a) | $ | 33.09 | ||
| Maximum offering price per share (100/94.25 of $33.09) | $ | 35.11 | ||
| Class M : | ||||
Net Asset Value and redemption price per share ($554,438 ÷ 16,153 shares)(a) | $ | 34.32 | ||
| Maximum offering price per share (100/96.50 of $34.32) | $ | 35.56 | ||
| Class C : | ||||
Net Asset Value and offering price per share ($51,581 ÷ 1,533 shares)(a)(b) | $ | 33.64 | ||
| Class I : | ||||
Net Asset Value, offering price and redemption price per share ($336,463 ÷ 9,466 shares)(b) | $ | 35.55 | ||
| Class Z : | ||||
Net Asset Value, offering price and redemption price per share ($67,223 ÷ 1,894 shares) | $ | 35.49 | ||
(a)Redemption price per share is equal to net asset value less any applicable contingent deferred sales charge. | ||||
(b)Corresponding Net Asset Value does not calculate due to rounding of fractional net assets and/or shares. | ||||
| Statement of Operations | ||||
| Amounts in thousands | Six months ended May 31, 2024 (Unaudited) | |||
| Investment Income | ||||
| Dividends | $ | 26,811 | ||
| Income from Fidelity Central Funds (including $2 from security lending) | 748 | |||
| Total income | 27,559 | |||
| Expenses | ||||
| Management fee | $ | 4,507 | ||
| Transfer agent fees | 749 | |||
| Distribution and service plan fees | 2,597 | |||
| Accounting fees | 121 | |||
| Custodian fees and expenses | 23 | |||
| Independent trustees' fees and expenses | 4 | |||
| Registration fees | 50 | |||
| Audit | 32 | |||
| Legal | 2 | |||
| Interest | 18 | |||
| Miscellaneous | 17 | |||
| Total expenses before reductions | 8,120 | |||
| Expense reductions | (82) | |||
| Total expenses after reductions | 8,038 | |||
| Net Investment income (loss) | 19,521 | |||
| Realized and Unrealized Gain (Loss) | ||||
| Net realized gain (loss) on: | ||||
| Investment Securities: | ||||
| Unaffiliated issuers | 70,004 | |||
| Foreign currency transactions | 18 | |||
| Written options | 1,005 | |||
| Total net realized gain (loss) | 71,027 | |||
| Change in net unrealized appreciation (depreciation) on: | ||||
| Investment Securities: | ||||
| Unaffiliated issuers | 116,152 | |||
| Assets and liabilities in foreign currencies | (13) | |||
| Written options | 387 | |||
| Total change in net unrealized appreciation (depreciation) | 116,526 | |||
| Net gain (loss) | 187,553 | |||
| Net increase (decrease) in net assets resulting from operations | $ | 207,074 | ||
| Statement of Changes in Net Assets | ||||
| Amount in thousands | Six months ended May 31, 2024 (Unaudited) | Year ended November 30, 2023 | ||
| Increase (Decrease) in Net Assets | ||||
| Operations | ||||
| Net investment income (loss) | $ | 19,521 | $ | 41,473 |
| Net realized gain (loss) | 71,027 | 47,960 | ||
| Change in net unrealized appreciation (depreciation) | 116,526 | (47,655) | ||
| Net increase (decrease) in net assets resulting from operations | 207,074 | 41,778 | ||
| Distributions to shareholders | (66,674) | (103,407) | ||
| Share transactions - net increase (decrease) | (150,624) | 11,415 | ||
| Total increase (decrease) in net assets | (10,224) | (50,214) | ||
| Net Assets | ||||
| Beginning of period | 1,807,003 | 1,857,217 | ||
| End of period | $ | 1,796,779 | $ | 1,807,003 |
Fidelity Advisor® Equity Income Fund Class A |
Six months ended (Unaudited) May 31, 2024 | Years ended November 30, 2023 | 2022 | 2021 | 2020 | 2019 | |||||||
Selected Per-Share Data | ||||||||||||
| Net asset value, beginning of period | $ | 30.62 | $ | 31.78 | $ | 32.34 | $ | 27.88 | $ | 30.22 | $ | 31.53 |
| Income from Investment Operations | ||||||||||||
Net investment income (loss) A,B | .35 | .69 | .61 | .58 | .65 | .67 | ||||||
| Net realized and unrealized gain (loss) | 3.30 | (.04) | 2.32 | 4.53 | (.67) | 2.08 | ||||||
| Total from investment operations | 3.65 | .65 | 2.93 | 5.11 | (.02) | 2.75 | ||||||
| Distributions from net investment income | (.39) | (.64) | (.58) | (.65) | (.66) | (.65) | ||||||
| Distributions from net realized gain | (.80) | (1.17) | (2.91) | - C | (1.67) | (3.41) | ||||||
| Total distributions | (1.18) D | (1.81) | (3.49) | (.65) | (2.32) D | (4.06) | ||||||
| Net asset value, end of period | $ | 33.09 | $ | 30.62 | $ | 31.78 | $ | 32.34 | $ | 27.88 | $ | 30.22 |
Total Return E,F,G | 12.16 % | 2.34% | 9.34% | 18.46% | .02% | 11.73% | ||||||
Ratios to Average Net Assets B,H,I | ||||||||||||
| Expenses before reductions | .88% J | .89% | .89% | .90% | .92% | .93% | ||||||
| Expenses net of fee waivers, if any | .87 % J | .89% | .89% | .89% | .92% | .92% | ||||||
| Expenses net of all reductions | .87% J | .89% | .89% | .89% | .92% | .92% | ||||||
| Net investment income (loss) | 2.21% J | 2.30% | 1.98% | 1.80% | 2.51% | 2.37% | ||||||
| Supplemental Data | ||||||||||||
| Net assets, end of period (in millions) | $ | 787 | $ | 721 | $ | 741 | $ | 675 | $ | 591 | $ | 660 |
Portfolio turnover rate K | 38 % J | 47% | 47% | 48% | 65% | 48% |
Fidelity Advisor® Equity Income Fund Class M |
Six months ended (Unaudited) May 31, 2024 | Years ended November 30, 2023 | 2022 | 2021 | 2020 | 2019 | |||||||
Selected Per-Share Data | ||||||||||||
| Net asset value, beginning of period | $ | 31.72 | $ | 32.84 | $ | 33.30 | $ | 28.69 | $ | 31.02 | $ | 32.24 |
| Income from Investment Operations | ||||||||||||
Net investment income (loss) A,B | .33 | .64 | .56 | .52 | .60 | .62 | ||||||
| Net realized and unrealized gain (loss) | 3.41 | (.03) | 2.38 | 4.66 | (.68) | 2.15 | ||||||
| Total from investment operations | 3.74 | .61 | 2.94 | 5.18 | (.08) | 2.77 | ||||||
| Distributions from net investment income | (.34) | (.56) | (.49) | (.57) | (.59) | (.58) | ||||||
| Distributions from net realized gain | (.80) | (1.17) | (2.91) | - C | (1.67) | (3.41) | ||||||
| Total distributions | (1.14) | (1.73) | (3.40) | (.57) | (2.25) D | (3.99) | ||||||
| Net asset value, end of period | $ | 34.32 | $ | 31.72 | $ | 32.84 | $ | 33.30 | $ | 28.69 | $ | 31.02 |
Total Return E,F,G | 12.00 % | 2.12% | 9.08% | 18.16% | (.22)% | 11.46% | ||||||
Ratios to Average Net Assets B,H,I | ||||||||||||
| Expenses before reductions | 1.12% J | 1.13% | 1.13% | 1.14% | 1.16% | 1.16% | ||||||
| Expenses net of fee waivers, if any | 1.11 % J | 1.13% | 1.13% | 1.13% | 1.16% | 1.16% | ||||||
| Expenses net of all reductions | 1.11% J | 1.13% | 1.13% | 1.13% | 1.15% | 1.16% | ||||||
| Net investment income (loss) | 1.97% J | 2.06% | 1.74% | 1.56% | 2.28% | 2.14% | ||||||
| Supplemental Data | ||||||||||||
| Net assets, end of period (in millions) | $ | 554 | $ | 524 | $ | 571 | $ | 555 | $ | 534 | $ | 642 |
Portfolio turnover rate K | 38 % J | 47% | 47% | 48% | 65% | 48% |
Fidelity Advisor® Equity Income Fund Class C |
Six months ended (Unaudited) May 31, 2024 | Years ended November 30, 2023 | 2022 | 2021 | 2020 | 2019 | |||||||
Selected Per-Share Data | ||||||||||||
| Net asset value, beginning of period | $ | 31.11 | $ | 32.23 | $ | 32.75 | $ | 28.21 | $ | 30.52 | $ | 31.73 |
| Income from Investment Operations | ||||||||||||
Net investment income (loss) A,B | .24 | .46 | .37 | .32 | .45 | .45 | ||||||
| Net realized and unrealized gain (loss) | 3.34 | (.02) | 2.35 | 4.60 | (.66) | 2.12 | ||||||
| Total from investment operations | 3.58 | .44 | 2.72 | 4.92 | (.21) | 2.57 | ||||||
| Distributions from net investment income | (.26) | (.39) | (.32) | (.37) | (.43) | (.37) | ||||||
| Distributions from net realized gain | (.80) | (1.17) | (2.91) | - C | (1.67) | (3.41) | ||||||
| Total distributions | (1.05) D | (1.56) | (3.24) D | (.38) D | (2.10) | (3.78) | ||||||
| Net asset value, end of period | $ | 33.64 | $ | 31.11 | $ | 32.23 | $ | 32.75 | $ | 28.21 | $ | 30.52 |
Total Return E,F,G | 11.72 % | 1.57% | 8.46% | 17.51% | (.77)% | 10.86% | ||||||
Ratios to Average Net Assets B,H,I | ||||||||||||
| Expenses before reductions | 1.64% J | 1.68% | 1.68% | 1.70% | 1.72% | 1.72% | ||||||
| Expenses net of fee waivers, if any | 1.63 % J | 1.67% | 1.68% | 1.69% | 1.72% | 1.71% | ||||||
| Expenses net of all reductions | 1.63% J | 1.67% | 1.68% | 1.69% | 1.72% | 1.71% | ||||||
| Net investment income (loss) | 1.44% J | 1.52% | 1.19% | 1.00% | 1.71% | 1.58% | ||||||
| Supplemental Data | ||||||||||||
| Net assets, end of period (in millions) | $ | 52 | $ | 51 | $ | 68 | $ | 52 | $ | 63 | $ | 84 |
Portfolio turnover rate K | 38 % J | 47% | 47% | 48% | 65% | 48% |
Fidelity Advisor® Equity Income Fund Class I |
Six months ended (Unaudited) May 31, 2024 | Years ended November 30, 2023 | 2022 | 2021 | 2020 | 2019 | |||||||
Selected Per-Share Data | ||||||||||||
| Net asset value, beginning of period | $ | 32.81 | $ | 33.91 | $ | 34.28 | $ | 29.51 | $ | 31.85 | $ | 32.99 |
| Income from Investment Operations | ||||||||||||
Net investment income (loss) A,B | .42 | .82 | .73 | .70 | .75 | .78 | ||||||
| Net realized and unrealized gain (loss) | 3.54 | (.04) | 2.47 | 4.80 | (.70) | 2.21 | ||||||
| Total from investment operations | 3.96 | .78 | 3.20 | 5.50 | .05 | 2.99 | ||||||
| Distributions from net investment income | (.42) | (.71) | (.65) | (.73) | (.72) | (.72) | ||||||
| Distributions from net realized gain | (.80) | (1.17) | (2.91) | - C | (1.67) | (3.41) | ||||||
| Total distributions | (1.22) | (1.88) | (3.57) D | (.73) | (2.39) | (4.13) | ||||||
| Net asset value, end of period | $ | 35.55 | $ | 32.81 | $ | 33.91 | $ | 34.28 | $ | 29.51 | $ | 31.85 |
Total Return E,F | 12.29 % | 2.60% | 9.62% | 18.75% | .27% | 12.00% | ||||||
Ratios to Average Net Assets B,G,H | ||||||||||||
| Expenses before reductions | .63% I | .65% | .65% | .65% | .67% | .67% | ||||||
| Expenses net of fee waivers, if any | .62 % I | .65% | .65% | .65% | .67% | .67% | ||||||
| Expenses net of all reductions | .62% I | .64% | .65% | .65% | .66% | .67% | ||||||
| Net investment income (loss) | 2.46% I | 2.54% | 2.22% | 2.05% | 2.77% | 2.63% | ||||||
| Supplemental Data | ||||||||||||
| Net assets, end of period (in millions) | $ | 336 | $ | 368 | $ | 359 | $ | 244 | $ | 178 | $ | 227 |
Portfolio turnover rate J | 38 % I | 47% | 47% | 48% | 65% | 48% |
Fidelity Advisor® Equity Income Fund Class Z |
Six months ended (Unaudited) May 31, 2024 | Years ended November 30, 2023 | 2022 | 2021 | 2020 | 2019 | |||||||
Selected Per-Share Data | ||||||||||||
| Net asset value, beginning of period | $ | 32.76 | $ | 33.86 | $ | 34.24 | $ | 29.48 | $ | 31.82 | $ | 32.96 |
| Income from Investment Operations | ||||||||||||
Net investment income (loss) A,B | .45 | .86 | .77 | .75 | .79 | .82 | ||||||
| Net realized and unrealized gain (loss) | 3.52 | (.03) | 2.46 | 4.78 | (.70) | 2.21 | ||||||
| Total from investment operations | 3.97 | .83 | 3.23 | 5.53 | .09 | 3.03 | ||||||
| Distributions from net investment income | (.45) | (.76) | (.70) | (.77) | (.76) | (.77) | ||||||
| Distributions from net realized gain | (.80) | (1.17) | (2.91) | - C | (1.67) | (3.41) | ||||||
| Total distributions | (1.24) D | (1.93) | (3.61) | (.77) | (2.43) | (4.17) D | ||||||
| Net asset value, end of period | $ | 35.49 | $ | 32.76 | $ | 33.86 | $ | 34.24 | $ | 29.48 | $ | 31.82 |
Total Return E,F | 12.36 % | 2.75% | 9.77% | 18.89% | .43% | 12.18% | ||||||
Ratios to Average Net Assets B,G,H | ||||||||||||
| Expenses before reductions | .46% I | .51% | .51% | .51% | .53% | .53% | ||||||
| Expenses net of fee waivers, if any | .45 % I | .50% | .51% | .51% | .52% | .53% | ||||||
| Expenses net of all reductions | .45% I | .50% | .51% | .51% | .52% | .52% | ||||||
| Net investment income (loss) | 2.63% I | 2.69% | 2.36% | 2.18% | 2.91% | 2.77% | ||||||
| Supplemental Data | ||||||||||||
| Net assets, end of period (in millions) | $ | 67 | $ | 143 | $ | 117 | $ | 35 | $ | 26 | $ | 27 |
Portfolio turnover rate J | 38 % I | 47% | 47% | 48% | 65% | 48% |
| Fidelity Central Fund | Investment Manager | Investment Objective | Investment Practices | Expense RatioA |
| Fidelity Money Market Central Funds | Fidelity Management & Research Company LLC (FMR) | Each fund seeks to obtain a high level of current income consistent with the preservation of capital and liquidity. | Short-term Investments | Less than .005% |
| Fidelity Advisor Equity Income Fund | $22 |
| Gross unrealized appreciation | $347,174 |
| Gross unrealized depreciation | (56,602) |
| Net unrealized appreciation (depreciation) | $290,572 |
| Tax cost | $1,506,395 |
| Equity Risk | Equity risk relates to the fluctuations in the value of financial instruments as a result of changes in market prices (other than those arising from interest rate risk or foreign exchange risk), whether caused by factors specific to an individual investment, its issuer, or all factors affecting all instruments traded in a market or market segment. |
| Purchases ($) | Sales ($) | |
| Fidelity Advisor Equity Income Fund | 333,645 | 517,642 |
| Maximum Management Fee Rate % | |
| Class A | .59 |
| Class M | .58 |
| Class C | .62 |
| Class I | .60 |
| Class Z | .46 |
| Total Management Fee Rate % | |
| Class A | .59 |
| Class M | .58 |
| Class C | .60 |
| Class I | .60 |
| Class Z | .46 |
| Distribution Fee | Service Fee | Total Fees ($) | Retained by FDC ($) | |
| Class A | -% | .25% | 960 | 15 |
| Class M | .25% | .25% | 1,377 | 2 |
| Class C | .75% | .25% | 260 | 25 |
| 2,597 | 42 |
| Retained by FDC ($) | |
| Class A | 49 |
| Class M | 4 |
Class CA | 1 |
54 |
| % of Class-Level Average Net Assets | |
| Class A | .1733 |
| Class M | .1645 |
| Class C | .2000 |
| Class I | .1823 |
| Amount ($) | % of Class-Level Average Net AssetsA | |
| Class A | 327 | .17 |
| Class M | 225 | .17 |
| Class C | 26 | .20 |
| Class I | 161 | .18 |
| Class Z | 10 | .04 |
749 |
| % of Average Net Assets | |
| Fidelity Advisor Equity Income Fund | .0270 |
| % of Average Net Assets | |
| Fidelity Advisor Equity Income Fund | .03 |
| Amount ($) | |
| Fidelity Advisor Equity Income Fund | 10 |
| Borrower or Lender | Average Loan Balance ($) | Weighted Average Interest Rate | Interest Expense ($) | |
| Fidelity Advisor Equity Income Fund | Borrower | 38,781 | 5.58% | 18 |
| Purchases ($) | Sales ($) | Realized Gain (Loss) ($) | |
| Fidelity Advisor Equity Income Fund | 34,852 | 64,723 | 9,892 |
| Amount ($) | |
| Fidelity Advisor Equity Income Fund | 2 |
| Total Security Lending Fees Paid to NFS ($) | Security Lending Income From Securities Loaned to NFS ($) | Value of Securities Loaned to NFS at Period End ($) | |
| Fidelity Advisor Equity Income Fund | -A | - | - |
Six months ended May 31, 2024 | Year ended November 30, 2023 | |
| Fidelity Advisor Equity Income Fund | ||
| Distributions to shareholders | ||
| Class A | $27,716 | $42,683 |
| Class M | 18,650 | 29,792 |
| Class C | 1,669 | 3,243 |
| Class I | 13,460 | 20,598 |
| Class Z | 5,179 | 7,091 |
Total | $66,674 | $103,407 |
| Shares | Shares | Dollars | Dollars | |
Six months ended May 31, 2024 | Year ended November 30, 2023 | Six months ended May 31, 2024 | Year ended November 30, 2023 | |
| Fidelity Advisor Equity Income Fund | ||||
| Class A | ||||
| Shares sold | 1,042 | 2,279 | $33,511 | $68,819 |
| Reinvestment of distributions | 848 | 1,379 | 26,508 | 40,735 |
| Shares redeemed | (1,654) | (3,435) | (53,076) | (103,441) |
| Net increase (decrease) | 236 | 223 | $6,943 | $6,113 |
| Class M | ||||
| Shares sold | 524 | 1,149 | $17,401 | $35,935 |
| Reinvestment of distributions | 563 | 955 | 18,243 | 29,202 |
| Shares redeemed | (1,465) | (2,966) | (48,760) | (92,623) |
| Net increase (decrease) | (378) | (862) | $(13,116) | $(27,486) |
| Class C | ||||
| Shares sold | 120 | 318 | $3,951 | $9,791 |
| Reinvestment of distributions | 52 | 107 | 1,636 | 3,202 |
| Shares redeemed | (268) | (919) | (8,749) | (28,147) |
| Net increase (decrease) | (96) | (494) | $(3,162) | $(15,154) |
| Class I | ||||
| Shares sold | 743 | 2,502 | $25,532 | $80,562 |
| Reinvestment of distributions | 381 | 615 | 12,766 | 19,428 |
| Shares redeemed | (2,865) | (2,500) | (97,195) | (80,714) |
| Net increase (decrease) | (1,741) | 617 | $(58,897) | $19,276 |
| Class Z | ||||
| Shares sold | 364 | 2,114 | $12,423 | $67,614 |
| Reinvestment of distributions | 136 | 201 | 4,557 | 6,342 |
| Shares redeemed | (2,967) | (1,415) | (99,372) | (45,290) |
| Net increase (decrease) | (2,467) | 900 | $(82,392) | $28,666 |
 |
Item 8.
Changes in and Disagreements with Accountants for Open-End Management Investment Companies
See Item 7.
Item 9.
Proxy Disclosures for Open-End Management Investment Companies
See Item 7.
Item 10.
Remuneration Paid to Directors, Officers, and Others of Open-End Management Investment Companies
See Item 7.
Item 11.
Statement Regarding Basis for Approval of Investment Advisory Contract
See Item 7.
Item 12.
Disclosure of Proxy Voting Policies and Procedures for Closed-End Management Investment Companies
Not applicable.
Item 13.
Portfolio Managers of Closed-End Management Investment Companies
Not applicable.
Item 14.
Purchases of Equity Securities by Closed-End Management Investment Company and Affiliated Purchasers
Not applicable.
Item 15.
Submission of Matters to a Vote of Security Holders
There were no material changes to the procedures by which shareholders may recommend nominees to the Fidelity Advisor Series I’s Board of Trustees.
Item 16.
Controls and Procedures
(a)(i) The President and Treasurer and the Chief Financial Officer have concluded that the Fidelity Advisor Series I’s (the “Trust”) disclosure controls and procedures (as defined in Rule 30a-3(c) under the Investment Company Act) provide reasonable assurances that material information relating to the Trust is made known to them by the appropriate persons, based on their evaluation of these controls and procedures as of a date within 90 days of the filing date of this report.
(a)(ii) There was no change in the Trust’s internal control over financial reporting (as defined in Rule 30a-3(d) under the Investment Company Act) that occurred during the period covered by this report that has materially affected, or is reasonably likely to materially affect, the Trust’s internal control over financial reporting.
Item 17.
Disclosure of Securities Lending Activities for Closed-End Management Investment Companies
Not applicable.
Item 18.
Recovery of Erroneously Awarded Compensation
(a)
Not applicable.
(b)
Not applicable.
Item 19.
Exhibits
(a) | (1) | Not applicable. |
(a) | (2) | |
(a) | (3) | Not applicable. |
(b) |
SIGNATURES
Pursuant to the requirements of the Securities Exchange Act of 1934 and the Investment Company Act of 1940, the registrant has duly caused this report to be signed on its behalf by the undersigned, thereunto duly authorized.
Fidelity Advisor Series I
By: | /s/Stacie M. Smith |
Stacie M. Smith | |
President and Treasurer (Principal Executive Officer) | |
Date: | July 23, 2024 |
Pursuant to the requirements of the Securities Exchange Act of 1934 and the Investment Company Act of 1940, this report has been signed below by the following persons on behalf of the registrant and in the capacities and on the dates indicated.
By: | /s/Stacie M. Smith |
Stacie M. Smith | |
President and Treasurer (Principal Executive Officer) | |
Date: | July 23, 2024 |
By: | /s/John J. Burke III |
John J. Burke III | |
Chief Financial Officer (Principal Financial Officer) | |
Date: | July 23, 2024 |