Exhibit (99.14)
Section C
The Government’s Financial Framework
| | | | | |
Introduction | | | C.3 | |
| | | | | |
1. The economic slowdown: major repercussions on public finances | | | C.5 | |
| | | | | |
2. Updating of the financial framework | | | C.11 | |
| | | | | |
| 2.1 Budgetary revenue | | | C.11 | |
| | | | | |
| 2.1.1 Own-source revenue excluding government enterprises | | | C.12 | |
| | | | | |
| 2.1.2 Revenue from government enterprises | | | C.19 | |
| | | | | |
| 2.1.3 Revenues from federal transfers | | | C.21 | |
| | | | | |
| 2.2 Budgetary expenditure | | | C.23 | |
| | | | | |
| 2.2.1 Adjustments to program spending in 2008-2009 | | | C.24 | |
| | | | | |
| 2.2.2 Maintaining spending in 2009-2010 to support the economy | | | C.25 | |
| | | | | |
| 2.2.3 The government’s priorities in 2009-2010 | | | C.27 | |
| | | | | |
| 2.2.4 Importance of government spending in the economy | | | C.29 | |
| | | | | |
| 2.2.5 Debt service | | | C.30 | |
| | | | | |
| 2.3 Boosting investment to modernize infrastructures | | | C.32 | |
| | | | | |
| 2.4 Accelerating investment to support the economy and employment in Québec | | | C.34 | |
| | | | | |
| 2.5 Consolidated entities | | | C.35 | |
| | | | | |
| 2.5.1 Non-budget-funded bodies and special funds | | | C.36 | |
| | | | | |
| 2.5.2 Generations Fund | | | C.37 | |
| | | | | |
| 2.5.3 Health and education networks | | | C.38 | |
| | | | | |
| 2.5.4 Statement of consolidated operations | | | C.39 | |
| | | | | |
3. Non-budgetary transactions | | | C.41 | |
| | | | | |
| 3.1 Summary of non-budgetary transactions | | | C.42 | |
| | | | | |
4. Consolidated net financial requirements | | | C.47 | |
| | | | | |
Appendix 1: Investments of $50.6 billion in the Québec Infrastructures Plan | | | C.49 | |
| | | | | |
Appendix 2: Investment projects by government enterprises | | | C.57 | |
C.2
Introduction
This section of the Budget Plan presents the preliminary results for fiscal 2008-2009 and the government’s budgetary and financial stance for 2009-2010 and 2010-2011.
The information provided concerns:
| • | | consolidated financial and budgetary transactions for the period from 2008-2009 to 2010-2011, including the impact of the various measures announced in the present Budget; |
| |
| • | | the change in revenue and expenditure, as well as adjustments made since last year’s Budget; |
| |
| • | | the government’s main expenditure items, capital expenditures, non-budgetary transactions and net financial requirements. |
All of the financial results presented incorporate the measures announced in the November 4, 2008 Update on Québec’s Economic and Financial Situation and the January 14, 2009 Economic Statement. Section A also contains five-year financial forecasts, up to 2013-2014.
C.3
[This page intentionally left blank.]
C.4
| 1. | | The economic slowdown: major repercussions on public finances |
The financial crisis that has prevailed for over a year now and the repercussions it is having on Québec’s economic growth pose major challenges in the realm of public finances. The rapid downturn in economic conditions in late 2008 and early 2009 has caused the government’s financial framework to deteriorate significantly.
Therefore, the 2009-2010 Budget forecasts that a balanced budget will be achieved in 2008-2009 by using $2 billion from the $2.3-billion budgetary reserve.
A budgetary deficit of $3.9 billion is forecast for 2009-2010 and of $3.8 billion for 2010-2011.
| • | | In 2009-2010, the deficit stems essentially from the impact of the deterioration of the economic situation on own-source revenue, the increase in the program spending objective and the cost of economic support measures. |
| |
| • | | In 2010-2011, the deficit arises from, among other things, changes made by the federal government to the equalization program, for which the estimated shortfall is $695 million. It also takes into account the $1 065-million impact of the plan to restore fiscal balance. |
TABLE C.1
Summary of consolidated budgetary transactions — 2009-2010 Budget
(millions of dollars)
| | | | | | | | | | | | | | | | | |
| | | Actual results | | | Preliminary | | | Forecast | |
| | | 2007-2008 | | | 2008-2009 | | | 2009-2010 | | | 2010-2011 | |
Budgetary revenue | | | 63 093 | | | | 62 479 | | | | 62 212 | | | | 64 017 | |
% change | | | 4.0 | | | | - 1.0 | | | | - 0.4 | | | | 2.9 | |
Budgetary expenditure | | | - 61 847 | | | | - 63 989 | | | | - 66 093 | | | | - 68 525 | |
% change | | | 5.2 | | | | 3.5 | | | | 3.3 | | | | 3.7 | |
Net results of consolidated entities | | | 404 | | | | 205 | | | | 355 | | | | 563 | |
| | | | | | | | | | | | | |
SURPLUS (DEFICIT) FOR THE PURPOSES OF THE PUBLIC ACCOUNTS | | | 1 650 | | | | - 1 305 | | | | - 3 526 | | | | - 3 945 | |
| Deposit of dedicated revenues in the Generations Fund | | | - 449 | | | | - 569 | | | | - 715 | | | | - 880 | |
| | | | | | | | | | | | | |
BUDGETARY BALANCE BEFORE BUDGETARY RESERVE AND IMPACT OF THE PLAN TO RESTORE FISCAL BALANCE | | | 1 201 | | | | - 1 874 | | | | - 4 241 | | | | - 4 825 | |
| Deposit in the Generations Fund from the budgetary reserve | | | - 200 | | | | - 132 | | | | — | | | | — | |
| Use of the budgetary reserve | | | - 1 001 | | | | 2 006 | | | | 295 | | | | — | |
| Impact of the plan to restore fiscal balance | | | | | | | | | | | — | | | | 1 065 | |
| | | | | | | | | | | | | |
BUDGETARY BALANCE FOR THE PURPOSES OF THE BALANCED BUDGET ACT | | | 0 | | | | 0 | | | | - 3 946 | | | | - 3 760 | |
| | | | | | | | | | | | | |
C.5
Substantial budget surpluses were generated in 2006-2007 and 2007-2008, making it possible to accumulate $2.3 billion in the budgetary reserve. Use of this reserve is now making it possible to achieve a balanced budget in 2008-2009.
| • | | In 2008-2009, the government will use $2 billion of the sums accumulated in the budgetary reserve, or $636 million more than forecast in the last Budget, to counter the impact of the economic slowdown and maintain a balanced budget. |
| |
| • | | The balance of the reserve, i.e. $295 million, will be used in 2009-2010 to reduce the anticipated budgetary deficit. |
TABLE C.2
Use of budgetary reserve1
(millions of dollars)
| | | | | | | | | | | | | | | | | |
| | | 2006-2007 | | | 2007-2008 | | | 2008-2009P | | | 2009-2010P | |
| 2008-2009 Budget | | | 1 300 | | | | 517 | 2 | | | - 1 370 | | | | - 447 | |
| Change | | | — | | | | 484 | | | | - 636 | 3 | | | 152 | |
| | | | | | | | | | | | | |
2009-2010 Budget | | | 1 300 | | | | 1 001 | | | | - 2 006 | | | | - 295 | |
| | | | | | | | | | | | | |
BALANCE OF THE BUDGETARY RESERVE, END OF YEAR | | | 1 300 | | | | 2 301 | | | | 295 | | | | 0 | |
| | | | | | | | | | | | | |
| | | |
| P: | | Preliminary results for 2008-2009 and forecasts for 2009-2010. |
| |
| 1 | | Except in the case of the balance of the budgetary reserve, a positive entry indicates an allocation to the reserve and a negative entry, a use of the reserve. |
| |
| 2 | | Including an amount of $200 million deposited in the Generations Fund from the budgetary reserve. |
| |
| 3 | | Including an amount of $132 million deposited in the Generations Fund from the budgetary reserve. |
C.6
| • | | A balanced budget in 2008-2009 |
The present Budget confirms that a balanced budget will be achieved in 2008-2009.
Overall, the pressure exerted on the financial framework as a result of the greater-than-anticipated deterioration of the economic situation requires, among other things, increased use of the budgetary reserve as well as use of the contingency reserve1 in order to maintain a balanced budget.
TABLE C.3
Summary of consolidated budgetary transactions in 2008-2009
(millions of dollars)
| | | | | | | | | | | | | |
| | | March 2008 | | | | | | | March 2009 | |
| | | Budget | | | Adjustments | | | BudgetP | |
Budgetary revenue | | | | | | | | | | | | |
| Own-source revenue excluding government enterprises | | | 44 292 | | | | - 471 | | | | 43 821 | |
| Revenue from government enterprises | | | 4 625 | | | | 109 | | | | 4 734 | |
| | | | | | | | | | |
| Total own-source revenue | | | 48 917 | | | | - 362 | | | | 48 555 | |
| Federal transfers | | | 14 063 | | | | - 139 | | | | 13 924 | |
| | | | | | | | | | |
Total | | | 62 980 | | | | - 501 | | | | 62 479 | |
Budgetary expenditure | | | | | | | | | | | | |
| Program spending | | | - 56 948 | | | | - 452 | | | | - 57 400 | |
| Debt service | | | - 6 907 | | | | 318 | | | | - 6 589 | |
| | | | | | | | | | |
Total | | | - 63 855 | | | | - 134 | | | | - 63 989 | |
| Net results of consolidated entities | | | 447 | | | | - 242 | | | | 205 | |
| Contingency reserve | | | - 200 | | | | 200 | | | | — | |
| | | | | | | | | | |
SURPLUS (DEFICIT) FOR THE PURPOSES OF THE PUBLIC ACCOUNTS | | | - 628 | | | | - 677 | | | | - 1 305 | |
| Deposit of dedicated revenues in the Generations Fund | | | - 742 | | | | 173 | | | | - 569 | |
| | | | | | | | | | |
BUDGETARY BALANCE BEFORE BUDGETARY RESERVE | | | - 1 370 | | | | - 504 | | | | - 1 874 | |
| Deposit in the Generations Fund from the budgetary reserve | | | — | | | | - 132 | | | | - 132 | |
| Use of the budgetary reserve | | | 1 370 | | | | 636 | | | | 2 006 | |
| | | | | | | | | | |
BUDGETARY BALANCE FOR THE PURPOSES OF THE BALANCED BUDGET ACT | | | 0 | | | | 0 | | | | 0 | |
| | | | | | | | | | |
| | | |
| P: | | Preliminary results for 2008-2009. |
| | | |
| 1 | | When the Economic Statement was published on January 14, 2009, the government was planning to use the contingency reserve in 2009-2010 to finance new economic support measures. Because of the rapid deterioration of the economy in early 2009, the government is obliged to use the contingency reserve as of this year in order to achieve a balanced budget. |
C.7
Since the March 2008 Budget, a number of factors have enabled the government to offset the shortfall stemming from the economic slowdown. These factors are:
| • | | savings of $318 million on debt service due to lower-than-expected interest rates; |
| |
| • | | an increase of $109 million in revenue from government enterprises, mainly on account of Hydro-Québec’s higher-than-anticipated profits; |
| |
| • | | use of the $200-million contingency reserve; |
| |
| • | | increased use, in the amount of $636 million, of the budgetary reserve. |
These positive contributions have made it possible for the government to:
| • | | offset losses of $471 million in own-source revenue caused by the effects of the economic slowdown, which reduced revenue from corporate taxes by almost 18%; |
| |
| • | | increase program spending by $452 million, including $115 million for the allowance for doubtful accounts of Revenu Québec; |
| |
| • | | finance the additional deficits of certain consolidated entities for $242 million, including $56 million for La Financière agricole du Québec, whose deficit should reach $371 million in 2008-2009, and $39 million for institutions of the health2 and education networks; |
| |
| • | | offset a $139-million downward revision in federal transfers; |
| |
| • | | deposit $132 million in the Generations Fund, an amount equal to the gain made on sales of Société immobilière du Québec assets in 2008. |
Taking into account the aforementioned program spending increase, program spending growth in 2008-2009 amounts to 4.7%.
| | | |
| 2 | | The expression “health network” always refers to the health and social services network. |
C.8
| • | | Budgetary deficit in 2009-2010 and 2010-2011 |
In 2009-2010, the budgetary deficit will amount to $3.9 billion following the use of the reserve’s $295-million balance. In 2010-2011, the deficit is expected to be $3.8 billion.
TABLE C.4
Total adjustments since the 2008-2009 BudgetF
(millions of dollars)
| | | | | | | | | |
| | | 2009-2010 | | | 2010-2011 | |
BALANCE IN THE 2008-2009 BUDGET | | | 0 | | | | - 143 | |
| | | | | | | |
Decrease in revenue | | | | | | | | |
| Economic slowdown | | | - 2 507 | | | | - 2 422 | |
| Equalization | | | - 75 | | | | - 695 | |
| | | | | | | |
| | | | - 2 582 | | | | - 3 117 | |
Increase in spending | | | | | | | | |
| Increase in program spending objective | | | - 1 051 | | | | - 1 151 | |
Economic support measures1 | | | - 826 | | | | - 607 | |
| Debt service savings | | | 915 | | | | 336 | |
| | | | | | | |
| | | | - 962 | | | | - 1 422 | |
| Use of the reserve | | | - 152 | | | | — | |
| Impact of the plan to restore balance | | | — | | | | 1 065 | |
| Other factors | | | - 250 | | | | - 143 | |
| | | | | | | |
BUDGETARY BALANCE FOR THE PURPOSES OF THE BALANCED BUDGET ACT | | | - 3 946 | | | | - 3 760 | |
| | | | | | | |
| | | |
| F: | | Forecasts. |
| |
| 1 | | Including tax expenditures. |
C.9
| • | | 2009-2010: deficit of $3.9 billion |
Compared with the March 2008 Budget, the deficit can be explained primarily by:
| • | | the decline in revenue caused by the economic slowdown, which lowers own-source revenue by $2.5 billion; |
| |
| • | | the $1-billion increase in the program spending objective, which brings the spending growth rate to 4.5%; |
| |
| • | | the cost of new measures taken to support the economy and maintain employment, which represents $826 million. |
These factors are partly offset by the $915-million downward adjustment in debt service.
| • | | 2010-2011: deficit of $3.8 billion |
Apart from the recurrence of the factors identified in 2009-2010, the deficit in 2010-2011 is due to changes made by the federal government to the equalization program that lower revenue by an estimated $695 million.
Furthermore, the $1 065-million impact of the plan to restore fiscal balance reduces the deficit.
C.10
| 2. | | Updating of the financial framework |
This section explains the adjustments made to the financial framework for 2008-2009 since the last Budget and presents the main factors affecting growth in the government’s revenue and expenditure for subsequent years.
The government’s budgetary revenue should total $62.2 billion in 2009-2010, i.e. $47.4 billion in own-source revenue and $14.8 billion in federal transfers. Budgetary revenue should fall by 0.4% in 2009-2010 and climb by 2.9% in 2010-2011.
TABLE C.5
Consolidated Revenue Fund
Change in budgetary revenue
(millions of dollars)
| | | | | | | | | | | | | | | | | | | | | |
| | | March 2008 | | | | | | | | |
| | | Budget | | | | | | | March 2009 BudgetP | |
| | | 2008-2009 | | | Adjustments | | | 2008-2009 | | | 2009-2010 | | | 2010-2011 | |
Own-source revenue | | | | | | | | | | | | | | | | | | | | |
| Own-source revenue excluding government enterprises | | | 44 292 | | | | - 471 | | | | 43 821 | | | | 42 612 | | | | 44 314 | |
% change | | | 0.1 | | | | | | | | - 1.4 | | | | - 2.8 | | | | 4.0 | |
| Government enterprises | | | 4 625 | | | | 109 | | | | 4 734 | | | | 4 759 | | | | 4 813 | |
% change | | | - 8.5 | | | | | | | | - 5.8 | | | | 0.5 | | | | 1.1 | |
| | | | | | | | | | | | | | | | |
Total | | | 48 917 | | | | - 362 | | | | 48 555 | | | | 47 371 | | | | 49 127 | |
% change | | | - 0.8 | | | | | | | | - 1.8 | | | | - 2.4 | | | | 3.7 | |
| Federal transfers | | | 14 063 | | | | - 139 | | | | 13 924 | | | | 14 841 | | | | 14 890 | |
% change | | | 3.2 | | | | | | | | 2.2 | | | | 6.6 | | | | 0.3 | |
| | | | | | | | | | | | | | | | |
Budgetary revenue | | | 62 980 | | | | - 501 | | | | 62 479 | | | | 62 212 | | | | 64 017 | |
% change | | | 0.1 | | | | | | | | - 1.0 | | | | - 0.4 | | | | 2.9 | |
| | | |
| P: | | Preliminary results for 2008-2009 and forecasts for subsequent years. |
C.11
| 2.1.1 | | Own-source revenue excluding government enterprises |
| |
| • | | Downward adjustments in 2008-2009 |
Preliminary results for fiscal 2008-2009 show that own-source revenue, excluding the profits of government enterprises, is adjusted downward by $471 million compared with the March 2008 Budget and posts a decline of 1.4% compared with the previous year.
As for tax receipts, a major trend shift was observed in 2008-2009. During the first half of the year, such receipts were higher than forecast in the last Budget. However, this trend was reversed in late 2008 and even accentuated in early 2009, reflecting a sudden deterioration in the economic situation, particularly with regard to corporate taxes.
TABLE C.6
Consolidated Revenue Fund
Summary of adjustments in own-source revenue excluding government enterprises in 2008-2009
(millions of dollars)
| | | | | | | | | | | | | | | | | | | | | |
| | | Adjustments | | | Adjustments since November 4, 2008 | | | Adjustments | |
| | | announced on | | | November and | | | January to | | | | | | | since March | |
| | | November 4, 20081 | | | December | | | March | | | Total | | | 2008 Budget | |
| Economic slowdown | | | 123 | | | | - 240 | | | | - 433 | | | | - 673 | | | | - 550 | |
| Economic support measures affecting revenue | | | - 32 | | | | 0 | | | | - 34 | | | | - 34 | | | | - 66 | |
| Other adjustment factors | | | 115 | | | | 0 | | | | 30 | | | | 30 | | | | 145 | |
| | | | | | | | | | | | | | | | |
TOTAL | | | 206 | | | | - 240 | | | | - 437 | | | | - 677 | | | | - 471 | |
| | | | | | | | | | | | | | | | |
| | | |
| 1 | | Update on Québec’s Economic and Financial Situation, November 2008. |
C.12
| • | | Adjustments in own-source revenue by source |
Revenue from corporate taxes is revised downward by $619 million in 2008-2009, leading to a 17.6% drop in revenue from this source compared with the previous year. This substantial adjustment is due essentially to the economic slowdown.
| • | | First, the downward revision of corporate profits as of the last quarter of 2008 has resulted in lower-than-expected tax receipts. |
| |
| • | | Second, businesses are claiming more refunds than anticipated owing to the fact that they are incurring losses or are reporting lower-than-expected taxable income, which requires that they be refunded instalment overpayments. |
Overall, revenue from personal income tax is revised upward by $23 million. Essentially, the downward adjustment in employment and wages in late 2008-2009 was more than offset by higher tax receipts early in the fiscal year.
Contributions to the Health Services Fund are adjusted downward by $18 million, in accordance with the negative adjustment of salaries and wages late in the year.
TABLE C.7
Consolidated Revenue Fund
Change in own-source revenue excluding government enterprises
(millions of dollars)
| | | | | | | | | | | | | | | | | | | | | |
| | | March 2008 | | | | | | | | |
| | | Budget | | | | | | | March 2009 BudgetP | |
| | | 2008-2009 | | | Adjustments | | | 2008-2009 | | | 2009-2010 | | | 2010-2011 | |
| Corporate taxes | | | 4 591 | | | | - 619 | | | | 3 972 | | | | 3 266 | | | | 3 268 | |
% change | | | - 4.4 | | | | | | | | - 17.6 | | | | - 17.8 | | | | 0.1 | |
| Personal income tax | | | 18 200 | | | | 23 | | | | 18 223 | | | | 18 203 | | | | 19 256 | |
% change | | | - 0.4 | | | | | | | | - 2.3 | | | | - 0.1 | | | | 5.8 | |
| Health Services Fund | | | 5 594 | | | | - 18 | | | | 5 576 | | | | 5 597 | | | | 5 808 | |
% change | | | 3.2 | | | | | | | | 3.2 | | | | 0.4 | | | | 3.8 | |
| Consumption taxes | | | 13 544 | | | | - 52 | | | | 13 492 | | | | 13 184 | | | | 13 569 | |
% change | | | 2.3 | | | | | | | | 4.1 | | | | - 2.3 | | | | 2.9 | |
| Other revenues | | | 2 363 | | | | 195 | | | | 2 558 | | | | 2 362 | | | | 2 413 | |
% change | | | - 5.4 | | | | | | | | - 1.8 | | | | - 7.7 | | | | 2.2 | |
| | | | | | | | | | | | | | | | |
Own-source revenue excluding government enterprises | | | 44 292 | | | | - 471 | | | | 43 821 | | | | 42 612 | | | | 44 314 | |
% change | | | 0.1 | | | | | | | | - 1.4 | | | | - 2.8 | | | | 4.0 | |
| | | |
| P: | | Preliminary results for 2008-2009 and forecasts for subsequent years. |
C.13
Consumption tax revenue is adjusted downward by $52 million on account of two main factors.
| • | | High fuel prices, primarily during the first two quarters of 2008-2009, helped to reduce consumption as well as revenue from the tax applicable to fuel products. Revenue from fuel was down $75 million. |
| |
| • | | However, this adjustment is partly offset by revenue from the Québec sales tax, which is up $27 million. Higher-than-forecast tax revenue early in the year was only partly offset by the decrease in Québec sales tax revenue stemming from weaker household consumption in the last two quarters of 2008-2009. |
Other revenues have been adjusted upward by $195 million compared with the forecast in the last Budget owing essentially to the recording of an amount of $115 million in regard to the payment of compensation by tobacco manufacturers following the settlement of lawsuits pertaining to tobacco smuggling activities that took place in the early 1990s.
C.14
| • | | A decline in own-source revenue in 2009-2010 because of the recession |
Own-source revenue, excluding that from government enterprises, will fall by 2.8% in 2009-2010 because of the impact of the economic recession anticipated that year and the additional cost of the fiscal measures announced in this and previous budgets.
| • | | It is anticipated that nominal GDP, which reflects the change in the government’s main tax bases, will decrease by 0.1%. In addition, revenue growth will be reduced by over 2.0% that year on account of the economic support measures. |
In 2010-2011, own-source revenue, excluding that of government enterprises, will grow by 4.0%, a rate similar to the increase in nominal GDP, i.e. 3.9%.
| • | | Change in revenue by source |
Revenue from corporate taxes will continue to fall in 2009-2010. Essentially, three factors explain the anticipated decline of 17.8%.
| • | | First, corporate profits are expected to decrease by 15.3% in 2009. |
| |
| • | | In addition, the accumulation of losses by corporations will allow them to continue claiming larger refunds in 2009-2010. Indeed, businesses can clain refunds, particularly by applying losses for the current year against their tax payable for the three previous years. This is one of the factors that contributes to the volatility of revenue from this source during a recession. |
| |
| • | | Lastly, the decline in revenue in 2009-2010 also stems from the additional reductions in the tax burden of businesses announced in this and previous budgets, particularly through: |
| | • | | the gradual elimination of the tax on capital; |
| |
| | • | | the introduction of an investment tax credit in all regions of Québec; |
| |
| | • | | the increase from $400 000 to $500 000 in the limit for the application of the reduced tax rate for small businesses. |
C.15
In 2010-2011, revenue from corporate taxes will rise slightly, i.e. by 0.1%. Indeed, growth in profits as of 2010 will lead to a gradual increase in taxable income and revenue from this source. However, losses accumulated by businesses will continue to curb growth in revenue from this source.
Personal income tax, the principal source of government revenue, will fall by a slight 0.1% in 2009-2010, to $18.2 billion.
| • | | This reflects first and foremost the impact of the measures announced since the last Budget in order to stimulate the economy. Indeed, the $250 million granted to individuals for the refundable tax credit for home improvement and renovation is applicable to the 2009 taxation year and will reduce by an equivalent amount revenue from this source in 2009-2010. |
| |
| • | | Considering the impact of this measure, the change in personal income tax is compatible with the weak growth of 0.5% in salaries and wages. |
In 2010-2011, growth in revenue from personal income tax should be 5.8%, while the progression in salaries and wages will amount to 3.0%.
| • | | Excluding the impact of the refundable tax credit for home improvement and renovation, which ends on December 31, 2009, revenue from personal income tax would instead climb by 4.4%, an increase compatible with the growth in salaries and wages, taking into account the progressive nature of the tax system. |
Contributions to the Health Services Fund should rise by only 0.4% in 2009-2010 and 3.8% in 2010-2011, in accordance with the anticipated growth in salaries and wages.
In 2009-2010, consumption taxes will decline by 2.3% owing basically to an expected 2.8% drop in revenue from the Québec sales tax. This decrease reflects the anticipated slowing of growth in household spending in 2009, as well as the reduction in the number of housing starts, whose value accounts for a large share of the QST tax base.
In 2010-2011, consumption taxes are expected to climb by 2.9%. This growth rate, which is less than that of household consumption, reflects in particular the drop in housing starts in 2010.
C.16
| • | | Change in revenue compatible with that of the economy |
Overall, growth in own-source revenue, excluding government enterprises, is expected to be similar to nominal economic growth for the next two years, once the financial impact of fiscal measures is eliminated. For example, in 2009-2010, fiscal measures will curtail revenue growth by more than 2.0 percentage points which explains, for the most part, the difference between the change in revenue and the change in nominal GDP.
TABLE C.8
Consolidated Revenue Fund
Change in own-source revenue on a comparable basisP
(millions of dollars)
| | | | | | | | | | | | | |
| | | 2008-2009 | | | 2009-2010 | | | 2010-2011 | |
Own-source revenue excluding government enterprises | | | 43 821 | | | | 42 612 | | | | 44 314 | |
% change | | | - 1.4 | | | | - 2.8 | | | | 4.0 | |
Less: | | | | | | | | | | | | |
| 2009-2010 Budget measures | | | | | | | | | | | | |
| - Personal income tax reduction | | | | | | | - 61 | | | | - 84 | |
| - Corporate tax reduction | | | | | | | - 35 | | | | - 63 | |
| - Other fiscal measures | | | | | | | 74 | | | | 72 | |
| Measures announced since the 2008-2009 Budget | | | | | | | | | | | | |
| - Economic Statement of January 14, 2009 | | | 0 | | | | - 260 | | | | - 20 | |
- Measures announced on December 19, 20081 | | | - 40 | | | | 0 | | | | 0 | |
- Update on Québec’s Economic and Financial Situation of November 4, 20082 | | | - 26 | | | | - 176 | | | | - 179 | |
| Measures announced in previous budgets | | | | | | | | | | | | |
| - Personal income tax reduction | | | - 1 366 | | | | - 1 380 | | | | - 1 457 | |
| - Corporate tax reduction | | | - 405 | | | | - 770 | | | | - 1 055 | |
- Other fiscal measures3 | | | 2 | | | | 45 | | | | 42 | |
Other factors4 | | | - 52 | | | | - 508 | | | | - 462 | |
| | | | | | | | | | |
Subtotal | | | - 1 887 | | | | - 3 071 | | | | - 3 206 | |
| | | | | | | | | | |
Revenue before measures | | | 45 708 | | | | 45 683 | | | | 47 520 | |
% change | | | | | | | - 0.1 | | | | 4.0 | |
| | | | | | | | | | | |
Growth rate of nominal GDP in %5 | | | | | | | - 0.1 | | | | 3.9 | |
Elasticity6 | | | | | | | 1.0 | | | | 1.0 | |
| | | |
| P: | | Preliminary results for 2008-2009 and forecasts for subsequent years. |
| |
| 1 | | Corresponds to the impact of the 25% reduction in minimum withdrawals from Registered Retirement Income Funds (RRIFs) in 2008, the cost of which is applied against the 2008-2009 fiscal year. |
| |
| 2 | | Excluding the cost of Québec proposals that had to be harmonized with the federal tax system but were not adopted by the federal government. |
| |
| 3 | | Including the impact on the revenue of the following funds: Fonds du patrimoine minier, Fonds pour le développement des enfants de moins de 5 ans en situation de pauvreté and Fonds pour le développement de services de répit et d’accompagnement des aidants naturels. |
| |
| 4 | | Includes, notably, the agreement concluded with tobacco manufacturers and the agreement on a new fiscal and financial partnership with the municipalities. |
| |
| 5 | | For the calendar year ending three months before the end of the fiscal year. |
| |
| 6 | | Elasticity between growth in revenue on a comparable basis and growth in gross domestic product. For example, an elasticity rate of 1.0 means that 1% growth in GDP results in 1% growth in own-source revenue. |
C.17
Sensitivity of own-source revenue to economic fluctuations
| |
| Generally speaking, a downward adjustment of 1% in nominal GDP leads to a decrease of about $500 million in own-source revenue, with a margin of error of roughly $50 million. This sensitivity rule implies that there is an adjustment of each of the tax bases that is proportional to the adjustment in nominal GDP, which is defined as the market value of all goods and services produced in a particular geographic area over a given period of time. |
| • | | In actual fact, a change in nominal GDP rarely entails a proportional adjustment of each of the tax bases. However, the sensitivity rule provides a good estimate of the significance and extent of the adjustment in own-source revenue. |
For example, the forecast in this Budget revises own-source revenue in 2009-2010 by more than $3.1 billion compared with last year’s Budget.
| • | | Essentially, this revision is due to the downward adjustment of nominal GDP in 2009, compared with what was originally announced. Indeed, the adjustment to the economic outlook reduces the forecast for own-source revenue in 2009-2010 by $2.5 billion. |
| | • | | Accordingly, nominal GDP in 2009 will be 4.4% less than anticipated last year if the impact of the adjustment in nominal GDP in 2008 and 2009 is taken into account. |
| |
| | • | | Based on the sensitivity rule, a $2.2-billion downward adjustment should be expected. Therefore, the adjustment of own-source revenue corresponds, for the most part, to the impact measured by the sensitivity rule. |
| • | | The balance of the adjustment results from the cost of new measures to support the economy and from other factors. |
Illustration of the impact of the revised economic scenario on own-source revenue
(millions of dollars)
| | | | | | | | | |
| | | 2008-2009 | | | 2009-2010 | |
Cumulative adjustment of nominal GDP growth1 since the March 2008 Budget | | | - 0.8 | % | | | - 4.4 | %2 |
| Anticipated impact of the revised economic scenario on own-source revenue | | | - 400 | | | | - 2 200 | |
| Projected impact of the economic slowdown on own-source revenue | | | - 550 | | | | - 2 507 | |
| | | |
| 1 | | For the calendar year ending three months before the end of the fiscal year. |
| |
| 2 | | Includes adjustments of - 0.8% and - 3.6% in nominal GDP in 2008 and 2009 respectively. |
C.18
| 2.1.2 | | Revenue from government enterprises |
| |
| • | | Upward adjustment in 2008-2009 |
The profits of government enterprises are adjusted upward by $109 million for 2008-2009. This adjustment is due mainly to a $363-million increase in Hydro-Québec’s profits, generated for the most part by growth in net sales of electricity outside Québec. This increase is offset by a $291-million decline in the profits of other government enterprises compared with the forecast in the 2008-2009 Budget, of which a difference of $260 million can be attributed to allowances for losses at the Société générale de financement du Québec.
TABLE C.9
Consolidated Revenue Fund
Change in revenue from government enterprises
(millions of dollars)
| | | | | | | | | | | | | | | | | | | | | |
| | | March 2008 | | | | | | | | |
| | | Budget | | | | | | | March 2009 BudgetP | |
| | | 2008-2009 | | | Adjustments | | | 2008-2009 | | | 2009-2010 | | | 2010-2011 | |
| Hydro-Québec | | | 2 500 | | | | 363 | | | | 2 863 | | | | 2 700 | | | | 2 700 | |
| Loto-Québec | | | 1 295 | | | | 25 | | | | 1 320 | | | | 1 295 | | | | 1 295 | |
| Société des alcools du Québec | | | 785 | | | | 12 | | | | 797 | | | | 800 | | | | 830 | |
| Other | | | 45 | | | | - 291 | | | | - 246 | | | | - 36 | | | | - 12 | |
| | | | | | | | | | | | | | | | |
Revenue from government enterprises | | | 4 625 | | | | 109 | | | | 4 734 | | | | 4 759 | | | | 4 813 | |
% change | | | - 8.5 | | | | | | | | - 5.8 | | | | 0.5 | | | | 1.1 | |
| | | |
| P: | | Preliminary results for 2008-2009 and forecasts for subsequent years. |
C.19
| • | | Outlook for 2009-2010 and 2010-2011 |
Revenue from government enterprises for 2009-2010 is estimated at nearly $4.8 billion. Such revenue will remain at roughly the same level in 2010-2011.
The profits of government enterprises over the next two years will be fairly stable compared with those of 2008-2009. It should be noted, however, that Hydro-Québec forecasts a decline of $163 million in its profits in 2009-2010 and 2010-2011 compared with those anticipated for 2008-2009.
C.20
| 2.1.3 | | Revenues from federal transfers |
In 2008-2009, federal transfer revenues should reach $13.9 billion, or $139 million less than forecast in the March 2008 Budget. This adjustment can be explained by two main factors.
First, the value of the special Québec abatement was revised upward because of the taking into account of the most recent fiscal data. It should be noted that the value of the special Québec abatement (16.5% of basic federal personal income tax collected in Québec) reduces by an equivalent amount Québec’s revenues from federal transfers.
Second, the taking into account of the population data of the 2006 census, which have been final since last fall, reduced federal transfers to Québec for health, post-secondary education and other social programs, since these transfers are allocated among the provinces on a per capita basis.
For 2009-2010 and 2010-2011, federal transfer revenues are expected to amount to $14.8 billion and $14.9 billion respectively.
TABLE C.10
Consolidated Revenue Fund
Change in federal transfer revenues1
(millions of dollars)
| | | | | | | | | | | | | | | | | | | | | |
| | | March 2008 | | | | | | | | |
| | | Budget | | | | | | | March 2009 BudgetP | |
| | | 2008-2009 | | | Adjustments | | | 2008-2009 | | | 2009-2010 | | | 2010-2011 | |
| Equalization | | | 8 028 | | | | 0 | | | | 8 028 | | | | 8 355 | | | | 8 469 | |
% change | | | 12.1 | | | | | | | | 12.1 | | | | 4.1 | | | | 1.4 | |
| Health transfers | | | 3 833 | | | | - 92 | | | | 3 741 | | | | 4 137 | | | | 4 253 | |
% change | | | - 2.3 | | | | | | | | - 4.7 | | | | 10.6 | | | | 2.8 | |
| Transfers for post-secondary education and other social programs | | | 1 320 | | | | - 53 | | | | 1 267 | | | | 1 413 | | | | 1 406 | |
% change | | | - 12.9 | | | | | | | | - 16.4 | | | | 11.5 | | | | - 0.5 | |
| Other programs | | | 882 | | | | 6 | | | | 888 | | | | 936 | | | | 762 | |
% change | | | - 14.0 | | | | | | | | - 13.6 | | | | 5.4 | | | | - 18.6 | |
| | | | | | | | | | | | | | | | |
Federal transfers | | | 14 063 | | | | - 139 | | | | 13 924 | | | | 14 841 | | | | 14 890 | |
% change | | | 3.2 | | | | | | | | 2.2 | | | | 6.6 | | | | 0.3 | |
| | | |
| P: | | Preliminary results for 2008-2009 and forecasts for subsequent years. |
| |
| 1 | | These results concern the federal transfer revenues of the Consolidated Revenue Fund. The federal transfer revenues of non-budget-funded bodies and special funds are presented in section 2.5.1. Section 2.5.4 presents federal transfer revenues in respect of specified purpose accounts for 2008-2009. |
C.21
On November 3, 2008, the federal government announced that it was changing the equalization program, in particular so as to limit its growth to that of Canada’s nominal GDP. At the same time, the federal government announced that Québec’s equalization entitlements for 2009-2010 would be $8 355 million, which is $75 million less than the equalization revenue anticipated in the March 2008 Budget.
For 2010-2011 and subsequent years, the federal government has not provided the provinces with any information on the effects of the changes to the equalization program. However, Québec estimates that these changes will have major impacts. Compared with the March 2008 Budget, the negative impacts of the changes are estimated at $695 million in 2010-2011 and over $1 billion per year thereafter.
In 2009-2010, health transfers and transfers for post-secondary education and other social programs are expected to grow by 10.6% and 11.5%, respectively, notably because of the tax relief announced in the 2009 federal budget and the economic slowdown that will reduce the value of the special Québec abatement, which is subtracted in part from these transfers. A reduction in the value of the special Québec abatement increases federal transfer revenues by an equivalent amount.
C.22
| 2.2 | | Budgetary expenditure |
In 2009-2010, budgetary expenditure will reach $66.1 billion, an increase of 3.3% compared with 2008-2009.
| • | | Program spending will total $60 billion and show an increase of 4.5%. Debt service, for its part, will amount to $6.1 billion. |
The government plans to limit program spending growth for 2010-2011 to 3.2%. Taking into account the forecast for the change in debt service, total growth in budgetary expenditure will be 3.7%.
TABLE C.11
Consolidated Revenue Fund
Change in budgetary expenditure
(millions of dollars)
| | | | | | | | | | | | | | | | | | | | | |
| | | March 2008 | | | | | | | | |
| | | Budget | | | | | | | March 2009 BudgetP | |
| | | 2008-2009 | | | Adjustments | | | 2008-2009 | | | 2009-2010 | | | 2010-2011 | |
| Program spending | | | 56 948 | | | | 452 | | | | 57 400 | | | | 59 989 | | | | 61 879 | |
% change | | | 4.2 | | | | | | | | 4.7 | | | | 4.5 | | | | 3.2 | |
| Debt service | | | 6 907 | | | | - 318 | | | | 6 589 | | | | 6 104 | | | | 6 646 | |
% change | | | - 1.4 | | | | | | | | - 6.2 | | | | - 7.4 | | | | 8.9 | |
| | | | | | | | | | | | | | | | |
| | | | | | | | | | | | | | | | | | | | | |
Budgetary expenditure | | | 63 855 | | | | 134 | | | | 63 989 | | | | 66 093 | | | | 68 525 | |
% change | | | 3.6 | | | | | | | | 3.5 | | | | 3.3 | | | | 3.7 | |
| | | | | | | | | | | | | | | | |
Nominal GDP growth rate in %1 | | | 3.2 | | | | | | | | 2.4 | | | | - 0.1 | | | | 3.9 | |
Inflation rate in Québec in %1 | | | 1.4 | | | | | | | | 2.1 | | | | 0.4 | | | | 2.0 | |
| | | |
| P: | | Preliminary results for 2008-2009 and forecasts for subsequent years. |
| |
| 1 | | For the calendar year ending three months before the end of the fiscal year. |
C.23
| 2.2.1 | | Adjustments to program spending in 2008-2009 |
Program spending in 2008-2009 stands at $57.4 billion, an increase of 4.7% compared with 2007-2008. This represents an upward revision of $452 million relative to the target of $56.9 billion set in the last Budget.
This adjustment can be explained mainly by:
| • | | the increase in the allowance for doubtful accounts, because of the rise in assessments made by Revenu Québec in recent years; |
| |
| • | | costs associated with the harmonization of the accounting method for capital expenditures of the health and education networks; |
| |
| • | | the cost of the elections held in December 2008; |
| |
| • | | additional financing of $1 billion for businesses, mainly small- and medium-sized enterprises (SMEs) (Renfort program); |
| |
| • | | full indexing of last resort assistance benefits. |
TABLE C.12
Program spending adjustments in 2008-2009
(millions of dollars)
| | | | | |
PROGRAM SPENDING OBJECTIVE PRESENTED IN THE 2008-2009 BUDGET | | | 56 948 | |
| | | | |
Adjustments | | | | |
| Increase in the allowance for doubtful accounts | | | 115 | |
| Harmonization of the accounting method for capital expenditures of the health and education networks | | | 100 | |
| 2008 Québec elections | | | 77 | |
| Renfort program | | | 41 | |
| Full indexing of last resort assistance benefits | | | 8 | |
| Other factors | | | 111 | |
| | | | |
Subtotal | | | 452 | |
| | | | |
| | | | | |
REVISED PROGRAM SPENDING | | | 57 400 | |
| | | | |
| | | |
| Source: | | Secrétariat du Conseil du trésor. |
C.24
| 2.2.2 | | Maintaining spending in 2009-2010 to support the economy |
The current economic slowdown requires that the government take concrete steps to support the economy and employment.
To mitigate the effects of the slowdown, program spending growth for 2009-2010 is being revised and raised from 3.0% to 4.5% compared with the previous Budget, including the cost of the measures contained in the present Budget.
| • | | The government will inject additional funds of over $900 million into Québec’s economy in 2009-2010, i.e. $752 million for budget-funded public services and $192 million for the measures announced in this Budget. |
| |
| • | | Other spending increases were announced in the Update on Québec’s Economic and Financial Situation, for a total of $416 million in 2009-2010. |
In all, program spending will be raised by $1.4 billion in 2009-2010 and 2010-2011 compared with the data presented in March 2008.
In 2010-2011, when the economy recovers, program spending growth will be rolled back to 3.2%, or the same rate as that forecast in last year’s Budget.
C.25
TABLE C.13
Change in program spending
(millions of dollars)
| | | | | | | | | |
| | | 2009-2010 | | | 2010-2011 | |
PROGRAM SPENDING OBJECTIVE IN THE 2008-2009 BUDGET | | | 58 629 | | | | 60 478 | |
% change | | | 3.0 | | | | 3.2 | |
| | | | | | | |
ADJUSTMENTS | | | | | | | | |
2009-2010 Budget | | | | | | | | |
| Increase in program spending to mitigate the effects of the economic slowdown | | | 752 | | | | 810 | |
| 2009-2010 Budget measures | | | | | | | | |
| - Additional immediate actions to support businesses and workers | | | 128 | | | | 58 | |
| - Preparing Québec for economic recovery | | | 12 | | | | 19 | |
| - Additional support for Quebecers | | | 30 | | | | 35 | |
| - New initiatives to fight tax evasion | | | 22 | | | | 22 | |
| | | | | | | |
| Subtotal | | | 192 | | | | 134 | |
| | | | | | | |
Total increases in the 2009-2010 Budget | | | 944 | | | | 944 | |
Increases announced in the Update on Québec’s Economic and Financial Situation | | | | | | | | |
| - Support measures for individuals and businesses | | | 117 | | | | 116 | |
| - Recurrence of 2008-2009 increases | | | 299 | | | | 341 | |
| | | | | | | |
Subtotal | | | 416 | | | | 457 | |
| | | | | | | |
TOTAL ADJUSTMENTS | | | 1 360 | | | | 1 401 | |
| | | | | | | |
PROGRAM SPENDING OBJECTIVE IN THE 2009-2010 BUDGET | | | 59 989 | | | | 61 879 | |
% change | | | 4.5 | | | | 3.2 | |
C.26
| 2.2.3 | | The government’s priorities in 2009-2010 |
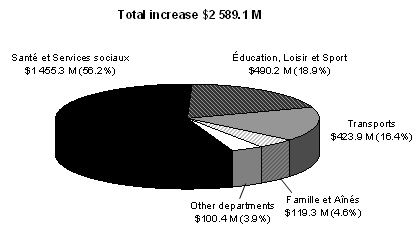
Program spending will climb from $57 400 million in 2008-2009 to $59 989 million in 2009-2010, an increase of $2 589 million, or 4.5%.
Despite the current economic slowdown, the government will continue to invest in its fundamental missions, including health and education.
Spending on health and education accounts for 75% of the rise in program spending in 2009-2010.
TABLE C.14
Growth in program spending in 2009-2010P
(millions of dollars)
| | | | | | | | | | | | | | | | | |
| | | | | | | | | | | Growth | |
| | | 2008-2009 | | | 2009-2010 | | | $M | | | % | |
| Santé et Services sociaux | | | 25 417.1 | | | | 26 872.4 | | | | 1 455.3 | | | | 5.7 | |
| Éducation, Loisir et Sport | | | 13 940.8 | | | | 14 431.0 | | | | 490.2 | | | | 3.5 | |
| Transports | | | 2 347.0 | | | | 2 770.9 | | | | 423.9 | | | | 18.1 | |
| Famille et Aînés | | | 1 947.2 | | | | 2 066.5 | | | | 119.3 | | | | 6.1 | |
| Other departments | | | 13 747.7 | | | | 13 848.1 | | | | 100.4 | | | | 0.7 | |
| | | | | | | | | | | | | |
TOTAL | | | 57 399.8 | | | | 59 988.9 | | | | 2 589.1 | | | | 4.5 | |
| | | | | | | | | | �� | | | |
| | | |
| P: | | Preliminary results for 2008-2009 and forecasts for 2009-2010. |
| |
| Source: | | Secrétariat du Conseil du trésor. |
| • | | Health: 5.7% increase in 2009-2010 |
The budget allocated to health and social services is being raised by $1 455 million, or 5.7%, in 2009-2010. This increase, which accounts for 56.2% of the total growth in program spending, will make it possible to cover needs related to health services aimed at dealing with, among other things, population ageing and certain widespread social problems.
| • | | Education: 3.5% budget increase |
The budget of the ministère de l’Éducation, du Loisir et du Sport is also being increased by a substantial 3.5%, or an additional $490 million. This increase accounts for 18.9% of total program spending growth. Overall, the education budget will make it possible to maintain the quality of educational services and to pursue actions undertaken in recent years, particularly in regard to disabled students or students with adjustment or learning difficulties.
C.27
The program spending budget of other departments is being raised by 3.6%, or $644 million, in 2009-2010. This increase will make it possible to continue supporting the government’s other priorities, particularly:
| • | | $424 million for the ministère des Transports, a climb of 18.1% generated notably by the rise in costs associated with investment in public infrastructures; |
| |
| • | | $119 million for the ministère de la Famille et des Aînés, an increase of 6.1% reflecting, among other things, the growth in the number of daycare spaces; |
| |
| • | | $100 million for other departments, whose expenditure budget shows a 0.7% increase compared with the previous year. |
CHART C.1
Breakdown of program spending growth in 2009-2010F
(millions of dollars and percent)
| | | |
| F: | | Forecasts. |
| |
| Source: | | Secrétariat du Conseil du trésor. |
C.28
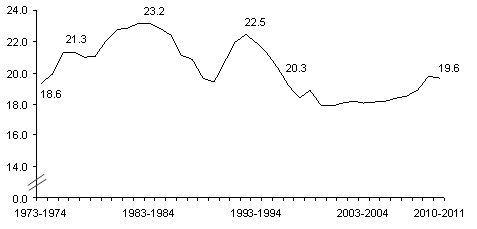
| 2.2.4 | | Importance of government spending in the economy |
The forecast for program spending in 2009-2010 reflects the government’s determination to do everything possible to get through the economic slowdown.
Because of the increase in program spending and the weak growth of GDP in 2009, the weight of program spending in the economy will climb to 19.8% in 2009-2010, the highest level since 1995-1996.
When the economy recovers, the government plans to stay the course of disciplined spending management and, between now and 2013-2014, gradually bring the weight of spending in the economy down to a rate equal to that observed prior to the economic recession.
| • | | In 2010-2011, the rate will fall 0.2 percentage points, to 19.6%. |
CHART C.2
Program spending
(as a percentage of GDP)
| | | |
| Note: | | Preliminary results for 2008-2009 and forecasts for subsequent years. |
C.29
In 2008-2009, debt service should amount to nearly $6.6 billion, i.e. $4.4 billion for direct debt service, $2.1 billion for interest ascribed to the retirement plans and $19 million for employee future benefits.
Overall, debt service is revised downward by $318 million compared with the March 2008 Budget. This adjustment is due mainly to the fact that interest rates were lower than anticipated.
Debt service should fall by 6.2% in 2008-2009 and 7.4% in 2009-2010. It is expected to climb by 8.9% in 2010-2011. This variance can be attributed esssentially to the change in interest rates.
TABLE C.15
Consolidated Revenue Fund
Change in debt service
(millions of dollars)
| | | | | | | | | | | | | | | | | | | | | |
| | | March 2008 | | | | | | | | |
| | | Budget | | | | | | | March 2009 BudgetP | |
| | | 2008-2009 | | | Adjustments | | | 2008-2009 | | | 2009-2010 | | | 2010-2011 | |
| Direct debt service | | | - 4 718 | | | | 297 | | | | - 4 421 | | | | - 3 760 | | | | - 4 016 | |
| Interest ascribed to the retirement plans | | | - 2 171 | | | | 22 | | | | - 2 149 | | | | - 2 344 | | | | - 2 636 | |
Employee future benefits1 | | | - 18 | | | | - 1 | | | | - 19 | | | | 0 | | | | 6 | |
| | | | | | | | | | | | | | | | |
Debt service | | | - 6 907 | | | | 318 | | | | - 6 589 | | | | - 6 104 | | | | - 6 646 | |
% change | | | - 1.4 | | | | | | | | - 6.2 | | | | - 7.4 | | | | 8.9 | |
| | | |
| P: | | Preliminary results for 2008-2009 and forecasts for subsequent years. |
| |
| 1 | | Including interest on the survivor’s pension plan and interest on the obligation relating to accumulated sick leave. |
C.30
| • | | A smaller proportion of revenue is being devoted to servicing the debt |
The share of budgetary revenue devoted to debt service, which includes the debt service of the Consolidated Revenue Fund and that of consolidated entities, should stand at 11.4% in 2010-2011, compared with 17.7% in 1997-1998.
CHART C.3
Consolidated debt service
(as a percentage of budgetary revenue)
Note: Preliminary results for 2008-2009 and forecasts for subsequent years.
C.31
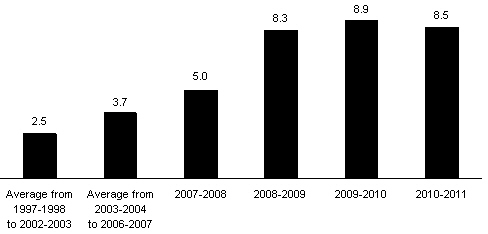
| 2.3 | | Boosting investment to modernize infrastructures |
The economic and financial difficulties currently affecting industrialized countries as a whole require immediate action to support businesses and workers that are hardest hit.
To that end, the government is injecting $8.3 billion over two years in order to renovate, modernize and develop Québec’s public infrastructures. These additional investments will help to revitalize the economy, support numerous jobs and build a stronger, more modern Québec.
TABLE C.16
Plan to support jobs and economic recovery — Infrastructures
(millions of dollars)
| | | | | | | | | | | | | | | | | | | | | |
| | | Investments as of 2009 to support jobs | | | | | | | |
| | | and the economy | | | Subsequent | | | | |
| | | 2009-2010 | | | 2010-2011 | | | Subtotal | | | years | | | Total | |
2009-2010 Budget | | | | | | | | | | | | | | | | | | | | |
| 2009-2010 Budget measures | | | 81 | | | | 92 | | | | 173 | | | | 951 | | | | 1 124 | |
| Additional investments by government corporations | | | 50 | | | | 140 | | | | 190 | | | | 156 | | | | 346 | |
| | | | | | | | | | | | | | | | |
Subtotal | | | 131 | | | | 232 | | | | 363 | | | | 1 107 | | | | 1 470 | |
Québec Infrastructures Plan | | | | | | | | | | | | | | | | | | | | |
| Acceleration announced on January 14, 2009 | | | 1 034 | 1 | | | 407 | | | | 1 441 | | | | 2 643 | | | | 4 084 | |
2007-2012 Québec Infrastructures Plan2 | | | 3 404 | | | | 3 045 | | | | 6 449 | | | | 3 477 | | | | 9 926 | |
| | | | | | | | | | | | | | | | |
Subtotal | | | 4 438 | | | | 3 452 | | | | 7 890 | | | | 6 120 | | | | 14 010 | |
| | | | | | | | | | | | | | | | |
INJECTION OF LIQUID ASSETS INTO THE ECONOMY | | | 4 569 | | | | 3 684 | | | | 8 253 | | | | 7 227 | | | | 15 480 | |
| | | |
| 1 | | Acceleration of investments under the 2008-2013 Québec Infrastructures Plan. The acceleration for 2008-2009 will be realized as of the first quarter of 2009. |
| |
| 2 | | Amount of additional investments compared with 2007-2008. |
In addition to the investments already announced, the 2009-2010 Budget provides for new projects totalling $1.5 billion, of which $363 million will be disbursed in 2009-2010 and 2010-2011.
Furthermore, additional investments of $7.9 billion will be made over the next two years under the Québec Infrastructures Plan:
| • | | $1.4 billion because of the acceleration announced last January 14; |
| |
| • | | $6.4 billion in additional investments compared with 2007-2008, following the implementation of the plan adopted in fall 2007. |
C.32
| • | | 2009-2010 Budget: $1.5 billion in new public investments to support the economy and employment |
To further support the economy and employment, the government is announcing new intiatives totalling almost $1.5 billion:
| • | | $670 million for developing Québec’s North: |
| | • | | $438 million for improvement work on Highway 389 between Baie-Comeau and the Labrador border; |
| |
| | • | | $130 million for extending Highway 167 to the Otish Mountains; |
| |
| | • | | $102 million for launching an airport infrastructure repair program for northern Québec; |
| • | | $254 million for fostering sustainable development: |
| | • | | $204 million for accelerating implementation of the plan to modernize the management of public dams; |
| |
| | • | | $50 million for expanding the national park network in southern Québec; |
| • | | $200 million for building 3 000 social housing units under the AccèsLogis Québec program; |
| |
| • | | $346 million for modernizing the assets of Loto-Québec and the Société de l’assurance automobile du Québec: |
| | • | | $306 million for renovating the Casino de Montréal; |
| |
| | • | | $40 million for expanding the head office of the Société de l’assurance automobile du Québec. |
TABLE C.17
New investment projects for supporting the economy and employment
(millions of dollars)
| | | | | |
| Plan Nord infrastructures | | | 670 | |
| Measures to foster sustainable development | | | 254 | |
| Social housing units | | | 200 | |
| New initiatives of the Société de l’assurance automobile du Québec and Loto-Québec | | | 346 | |
| | | | |
TOTAL NEW INVESTMENTS ANNOUNCED IN THE 2009-2010 BUDGET | | | 1 470 | |
| | | | |
Added to these measures are investments under the financial assistance program for infrastructures for biological conversion of organic material, aimed at developing green energy.
C.33
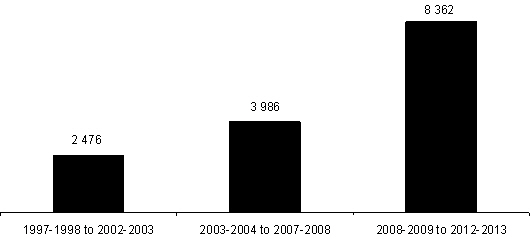
| 2.4 | | Accelerating investment to support the economy and employment in Québec |
The Québec government is stepping up the pace of its investments in order to support the economy and employment in Québec during the economic crisis.
In 2009-2010 and 2010-2011, infrastructure investments will reach an average of nearly $9 billion per year, a level not seen since the early 1980s.
CHART C.4
Investments by the Québec government1
(billions of dollars)
| | | |
| 1 | | Excluding investments made by departments and budget-funded bodies and by special funds other than the Fonds de conservation et d’amélioration du réseau routier. |
The 2008-2013 Québec Infrastructures Plan and the investment projects of government enterprises are described in the appendices to this section.
C.34
| 2.5 | | Consolidated entities |
The government’s financial forecasts must take into account all financial transactions related to activities under its control.
Accordingly, in addition to the financial transactions of departments, budget-funded bodies and government enterprises, which are included in the financial transactions of the Consolidated Revenue Fund, the government’s reporting entity also encompasses consolidated entities whose financial transactions must also be taken into account in the government’s financial forecasts.
These consolidated entities are grouped as follows:
| • | | non-budget-funded bodies and special funds; |
| |
| • | | the Generations Fund; |
| |
| • | | the health and education networks. |
The financial forecasts for the health and education networks are presented in the Budget for the second year in a row, following the government’s adoption of the recommendations of the Task Force on Government Accounting in December 2007.
At that time, the government changed its accounting policies, in accordance with generally accepted accounting principles (GAAP), in order to include public health and social services institutions, school boards and CEGEPs as well as the Université du Québec and its branches in its reporting entity.
C.35
| 2.5.1 | | Non-budget-funded bodies and special funds |
Non-budget-funded bodies and special funds include more than 100 government entities whose mission is to sell goods and services or fund government programs. For instance:
| • | | the Fonds de conservation et d’amélioration du réseau routier finances investments for maintaining and developing Québec roads; |
| |
| • | | La Financière agricole du Québec is responsible for administering farm insurance programs and other financial support programs for agricultural producers. |
For fiscal 2008-2009, the net results of non-budget-funded bodies and special funds show a deficit of $175 million, a deterioration of $30 million compared with the results forecast in the March 2008 Budget.
For 2009-2010 and 2010-2011, the net results of non-budget-funded bodies and special funds are expected to show deficits of $240 million and $111 million respectively. These deficits can be attributed mainly to La Financière agricole du Québec, whose deficit is expected to be more than $350 million in 2009-2010.
TABLE C.18
Non-budget-funded bodies and special funds
Summary of budgetary transactions
(millions of dollars)
| | | | | | | | | | | | | | | | | | | | | |
| | | March 2008 | | | | | | | | |
| | | Budget | | | | | | | March 2009 BudgetP | |
| | | 2008-2009 | | | Adjustments | | | 2008-2009 | | | 2009-2010 | | | 2010-2011 | |
| Own-source revenue | | | 4 319 | | | | - 702 | | | | 3 617 | | | | 3 819 | | | | 3 911 | |
| Federal transfers | | | 1 115 | | | | - 144 | | | | 971 | | | | 1 315 | | | | 997 | |
| | | | | | | | | | | | | | | | |
Subtotal | | | 5 434 | | | | - 846 | | | | 4 588 | | | | 5 134 | | | | 4 908 | |
| Expenditure excluding debt service | | | - 3 749 | | | | - 16 | | | | - 3 765 | | | | - 4 196 | | | | - 3 634 | |
| Debt service | | | - 1 830 | | | | 832 | | | | - 998 | | | | - 1 178 | | | | - 1 385 | |
| | | | | | | | | | | | | | | | |
Subtotal | | | - 5 579 | | | | 816 | | | | - 4 763 | | | | - 5 374 | | | | - 5 019 | |
| | | | | | | | | | | | | | | | |
NET RESULTS | | | - 145 | | | | - 30 | | | | - 175 | | | | - 240 | | | | - 111 | |
| | | | | | | | | | | | | | | | |
| | | |
| P: | | Preliminary results for 2008-2009 and forecasts for subsequent years. |
C.36
Deposits in the Generations Fund should reach $701 million for 2008-2009. This amount includes the additional deposit of $132 million from the budgetary reserve, which corresponds to profits made on the sale of immovables by the Société immobilière du Québec in March 2008.
For 2009-2010 and 2010-2011, total deposits in the Generations Fund are expected to amount to $715 million and $880 million respectively. As a result, $3.5 billion will have been accumulated in the Generations Fund as at March 31, 2011. Section I presents the results of and change in the Generations Fund in greater detail.
TABLE C.19
Deposits in the Generations Fund
(millions of dollars)
| | | | | | | | | | | | | | | | | | | | | |
| | | March 2008 | | | | | | | | |
| | | Budget | | | | | | | March 2009 BudgetP | |
| | | 2008-2009 | | | Adjustments | | | 2008-2009 | | | 2009-2010 | | | 2010-2011 | |
Dedicated revenues | | | | | | | | | | | | | | | | | | | | |
| Water-power royalties | | | 625 | | | | — | | | | 625 | | | | 647 | | | | 678 | |
| Unclaimed property | | | 15 | | | | - 15 | | | | 0 | | | | — | | | | — | |
| Investment income | | | 102 | | | | - 158 | | | | - 56 | | | | 68 | | | | 202 | |
| | | | | | | | | | | | | | | | |
Subtotal | | | 742 | | | | - 173 | | | | 569 | | | | 715 | | | | 880 | |
Deposit from the budgetary reserve1 | | | — | | | | 132 | | | | 132 | | | | — | | | | — | |
| | | | | | | | | | | | | | | | |
TOTAL | | | 742 | | | | - 41 | | | | 701 | | | | 715 | | | | 880 | |
| | | | | | | | | | | | | | | | |
| | | |
| P: | | Preliminary results for 2008-2009 and forecasts for subsequent years. |
| |
| 1 | | An amount of $132 million stemming from the sale of Société immobilière du Québec assets was deposited in the Generations Fund from the budgetary reserve. |
C.37
| 2.5.3 | | Health and education networks |
With the implementation of the recommendations of the Task Force on Government Accounting in December 2007, the government added 210 entities of the health and social services network and 130 entities of the education network to its financial forecasts.
These entities consist of 18 health and social services agencies, 192 public health and social services institutions, 72 school boards and 48 CEGEPs, as well as the Université du Québec and its nine branches.
In the 2008-2009 Budget, the government provided for an amount of $150 million to cover any deficits incurred by institutions in the two networks in 2008-2009. The present Budget is revising this amount upward by $39 million, to $189 million.
For 2009-2010 and 2010-2011, the government is providing for amounts of $120 million and $206 million respectively to cover any overruns that might be incurred in the networks, particularly because of the effects of harmonizing their accounting policies with generally accepted accounting principles.
In addition, work is still ongoing with the ministère de la Santé et des Services sociaux and the ministère de l’Éducation, du Loisir et du Sport to finalize the implementation of a monitoring and budgetary control process for the networks. Once this work is complete, it will be possible to rigorously monitor the results of all network entities with a view to making them subject, in the near future, to a budgetary process similar to that applied for non-budget-funded bodies and special funds. In particular, this process provides for:
| • | | tabling of detailed financial forecasts for preparing the government’s financial framework; |
| |
| • | | monitoring of actual data for the government’s Monthly Report on Financial Transactions. |
Lastly, the government is taking advantage of this Budget to reiterate its determination to eliminate operating deficits in the health network. For this purpose, steps will be taken with the ministère de la Santé et des Services sociaux to introduce a plan aimed at restoring fiscal balance to the annual results of all health network institutions between now and the end of 2011-2012.
C.38
| 2.5.4 | | Statement of consolidated operations |
For the purposes of the Budget documents, the results of consolidated entities are presented on a net basis.3 However, to reconcile the Budget documents and the Public Accounts, the revenue and expenditure of consolidated entities4 and the specified purpose accounts must be added to the revenue and expenditure of the Consolidated Revenue Fund.
The following table shows, for fiscal 2008-2009, the statement of consolidated operations harmonizing the Budget data with those of the Public Accounts. The deficit for the purposes of the Public Accounts will amount to $1 305 million in 2008-2009.
TABLE C.20
Consolidated financial framework
(millions of dollars)
| | | | | | | | | | | | | | | | | | | | | |
| | | 2007-2008 | | | | |
| | | Public Accounts | | | 2008-2009P | |
| | | Consolidated | | | Consolidated | | | Consolidated | | | Specified purpose | | | Consolidated | |
| | | levels | | | Revenue Fund | | | entities | | | accounts | | | levels | |
Revenue | | | | | | | | | | | | | | | | | | | | |
| Own-source revenue | | | 54 011 | | | | 48 555 | | | | 4 186 | | | | 245 | | | | 52 986 | |
| Federal transfers | | | 14 733 | | | | 13 924 | | | | 971 | | | | 316 | | | | 15 211 | |
| | | | | | | | | | | | | | | | |
Total revenue | | | 68 744 | | | | 62 479 | | | | 5 157 | | | | 561 | | | | 68 197 | |
Expenditure | | | | | | | | | | | | | | | | | | | | |
| Expenditure excluding debt service | | | - 59 030 | | | | - 57 400 | | | | - 3 954 | | | | - 561 | | | | - 61 915 | |
| Debt service | | | - 8 064 | | | | - 6 589 | | | | - 998 | | | | — | | | | - 7 587 | |
| | | | | | | | | | | | | | | | |
Total expenditure | | | - 67 094 | | | | - 63 989 | | | | - 4 952 | | | | - 561 | | | | - 69 502 | |
| | | | | | | | | | | | | | | | |
TOTAL | | | 1 650 | | | | - 1 510 | | | | 205 | | | | 0 | | | | - 1 305 | 1 |
| | | | | | | | | | | | | | | | |
| | | |
| P: | | Preliminary. |
| |
| 1 | | Deficit for the purposes of the Public Accounts. |
| | | |
| 3 | | Net results represent the difference between the revenue and expenditure of consolidated entities. |
| |
| 4 | | After eliminating transactions between related entities. |
C.39
[This page intentionally left blank.]
C.40
| 3. | | Non-budgetary transactions |
The government’s consolidated net financial requirements stem from its budgetary and non-budgetary transactions. They represent the amount of liquid assets needed for the government’s operating and investment activities for a given fiscal year.
Non-budgetary transactions are aimed at presenting budgetary transactions on a cash basis and investments made by the government. For example, an increase in capital expenditures requires an outflow of funds but does not have an immediate impact on budgetary transactions. In addition, an increase in the retirement plans liability caused by, among other things, the government’s expenditure as an employer does not entail an outflow of funds in the short term, but has an impact on the government’s budgetary transactions.
Non-budgetary transactions are presented by agregates:
| • | | investments, loans and advances; |
| |
| • | | capital expenditures; |
| |
| • | | net investments in the networks; |
| |
| • | | retirement plans;5 |
| |
| • | | other accounts. |
| | | |
| 5 | | Including employee future benefits. |
C.41
| 3.1 | | Summary of non-budgetary transactions |
Consolidated non-budgetary transactions consist of the non-budgetary transactions of the Consolidated Revenue Fund and those of consolidated entities. For 2008-2009, consolidated non-budgetary requirements amount to $695 million, or $779 million less than forecast in the March 2008 Budget.
For 2009-2010 and 2010-2011, consolidated non-budgetary requirements amount to $3.0 billion and $4.7 billion respectively.
TABLE C.21
Summary of consolidated non-budgetary transactions1
(millions of dollars)
| | | | | | | | | | | | | | | | | | | | | |
| | | March 2008 | | | | | | | | |
| | | Budget | | | | | | | March 2009 BudgetP | |
| | | 2008-2009 | | | Adjustments | | | 2008-2009 | | | 2009-2010 | | | 2010-2011 | |
Consolidated Revenue Fund | | | | | | | | | | | | | | | | | | | | |
| Investments, loans and advances | | | - 18 | | | | 147 | | | | 129 | | | | - 1 119 | | | | - 1 161 | |
| Capital expenditures | | | - 140 | | | | 13 | | | | - 127 | | | | - 179 | | | | - 164 | |
| Retirement plans | | | 2 398 | | | | - 98 | | | | 2 300 | | | | 2 490 | | | | 2 205 | |
| Other accounts | | | - 935 | | | | 569 | | | | - 366 | | | | - 406 | | | | - 137 | |
| | | | | | | | | | | | | | | | |
Total | | | 1 305 | | | | 631 | | | | 1 936 | | | | 786 | | | | 743 | |
Consolidated entities | | | | | | | | | | | | | | | | | | | | |
| Investments, loans and advances | | | - 382 | | | | 236 | | | | - 146 | | | | - 226 | | | | - 409 | |
| Capital expenditures | | | - 1 794 | | | | - 484 | | | | - 2 278 | | | | - 3 125 | | | | - 3 193 | |
| Net investments in the networks | | | - 1 030 | | | | 215 | | | | - 815 | | | | - 1 004 | | | | - 2 291 | |
| Other accounts | | | 427 | | | | 181 | | | | 608 | | | | 526 | | | | 440 | |
| | | | | | | | | | | | | | | | |
Total | | | - 2 779 | | | | 148 | | | | - 2 631 | | | | - 3 829 | | | | - 5 453 | |
Consolidated non-budgetary transactions | | | | | | | | | | | | | | | | | | | | |
| Investments, loans and advances | | | - 400 | | | | 383 | | | | - 17 | | | | - 1 345 | | | | - 1 570 | |
| Capital expenditures | | | - 1 934 | | | | - 471 | | | | - 2 405 | | | | - 3 304 | | | | - 3 357 | |
| Net investments in the networks | | | - 1 030 | | | | 215 | | | | - 815 | | | | - 1 004 | | | | - 2 291 | |
| Retirement plans | | | 2 398 | | | | - 98 | | | | 2 300 | | | | 2 490 | | | | 2 205 | |
| Other accounts | | | - 508 | | | | 750 | | | | 242 | | | | 120 | | | | 303 | |
| | | | | | | | | | | | | | | | |
TOTAL CONSOLIDATED NON-BUDGETARY REQUIREMENTS | | | - 1 474 | | | | 779 | | | | - 695 | | | | - 3 043 | | | | - 4 710 | |
| | | | | | | | | | | | | | | | |
| | | |
| P: | | Preliminary results for 2008-2009 and forecasts for subsequent years. |
| |
| 1 | | A negative entry indicates a financial requirement and a positive entry, a source of financing. |
C.42
| • | | Investments, loans and advances |
Consolidated financial requirements for investments, loans and advances for 2008-2009 amount to $17 million. The forecasts for 2009-2010 and 2010-2011 stand at $1.3 billion and $1.6 billion respectively.
For 2008-2009, investments, loans and advances of the Consolidated Revenue Fund show a financial surplus of $129 million, or $147 million more than forecast in last year’s Budget. Furthermore, in 2009-2010 and 2010-2011, financial requirements will amount to roughly $1.1 billion per year. This increase is due to, among other things, capital funding of $625 million that will be granted to the Société générale de financement du Québec in 2009-2010 for implementing the assistance program for high-performance industries that are experiencing financial difficulties because of the economic situation.
With regard to consolidated entities, the financial requirements of $146 million for 2008-2009 arise mainly from investments, loans and advances attributable to Investissement Québec and the Green Fund.
TABLE C.22
Consolidated non-budgetary transactions for investments, loans and advances1
(millions of dollars)
| | | | | | | | | | | | | | | | | | | | | |
| | | March 2008 | | | | | | | | |
| | | Budget | | | | | | | March 2009 BudgetP | |
| | | 2008-2009 | | | Adjustments | | | 2008-2009 | | | 2009-2010 | | | 2010-2011 | |
| Consolidated Revenue Fund | | | - 18 | | | | 147 | | | | 129 | | | | - 1 119 | | | | - 1 161 | |
| Consolidated entities | | | - 382 | | | | 236 | | | | - 146 | | | | - 226 | | | | - 409 | |
| | | | | | | | | | | | | | | | |
CONSOLIDATED NON-BUDGETARY TRANSACTIONS | | | - 400 | | | | 383 | | | | - 17 | | | | - 1 345 | | | | - 1 570 | |
| | | | | | | | | | | | | | | | |
| | | |
| P: | | Preliminary results for 2008-2009 and forecasts for subsequent years. |
| |
| 1 | | A negative entry indicates a financial requirement and a positive entry, a source of financing. |
C.43
For 2008-2009, consolidated investments in fixed assets amount to $3.8 billion. Taking into account a depreciation expense of $1.4 billion for these capital expenditures, the financial requirements associated with them total $2.4 billion.
TABLE C.23
Reconciliation of 2008-2009 capital investments and financial requirementsP, 1
(millions of dollars)
| | | | | | | | | | | | | |
| | | | | | | | | | | Financial | |
| | | Level of | | | | | | | requirements (capital | |
| | | investment | | | Depreciation | | | expenditures) | |
| Departments and organizations | | | - 382 | | | | 255 | | | | - 127 | |
| Non-budget-funded bodies and special funds | | | - 3 460 | | | | 1 182 | | | | - 2 278 | |
| | | | | | | | | | |
TOTAL | | | - 3 842 | | | | 1 437 | | | | - 2 405 | |
| | | | | | | | | | |
| | | |
| P: | | Preliminary results. |
| |
| 1 | | A negative entry indicates a financial requirement and a positive entry, a source of financing. |
These financial requirements are explained largely by investments of $2.8 billion in road infrastructures financed by the Fonds de conservation et d’amélioration du réseau routier, which take into account the investment acceleration provided for in the 2008-2013 Québec Infrastructures Plan and presented in the Economic Statement of January 14, 2009. These additional investments in the road network also explain the increase in financial requirements for 2009-2010 and 2010-2011.
| • | | Net investments in the networks |
The financial requirements related to net investments in the networks amount to $815 million for 2008-2009, $1 billion for 2009-2010 and $2.3 billion for 2010-2011.
Network funding comes for the most part from Financement-Québec and the Corporation d’hébergement du Québec.
C.44
For 2008-2009, the balance of non-budgetary transactions in regard to the retirement plans is $2.3 billion, which reduces the government’s financing needs.
In 2009-2010 and 2010-2011, the retirement plans should help to reduce financing needs by $2.5 billion and $2.2 billion respectively.
Financial requirements of other accounts consist of a series of changes in assets and liabilities such as accounts receivable and accounts payable.
Consolidated financial surpluses for other accounts amount to $242 million in 2008-2009. In 2009-2010 and 2010-2011, they will total $120 million and $303 million respectively.
C.45
[This page intentionally left blank.]
C.46
| 4. | | Consolidated net financial requirements |
Overall, net financial requirements represent the liquid assets the government needs in a given fiscal year to finance the budgetary balance and non-budgetary transactions.
As a whole, consolidated net financial requirements stand at $126 million in 2008-2009, $6.3 billion in 2009-2010 and $7.6 billion in 2010-2011.
| • | | The net financial surpluses of the Consolidated Revenue Fund amount to $2.3 billion in 2008-2009. Net financial requirements of $2.8 billion and $3.0 billion are expected for 2009-2010 and 2010-2011 respectively. These variations mainly reflect the change in the deficits forecast for the coming years and the depletion of the budgetary reserve. |
| |
| • | | The net financial requirements of non-budget-funded bodies and special funds will total $3.1 billion in 2008-2009, $4.2 billion in 2009-2010 and $5.5 billion in 2010-2011. These requirements stem primarily from two sources: |
| | • | | investments by the Fonds de conservation et d’amélioration du réseau routier; |
| |
| | • | | investments by Financement-Québec and the Corporation d’hébergement du Québec in the health and education networks. |
| • | | Deposits in the Generations Fund will amount to $701 million in 2008-2009, $715 million in 2009-2010 and $880 million in 2010-2011. |
C.47
TABLE C.24
Consolidated net financial requirements1
(millions of dollars)
| | | | | | | | | | | | | | | | | | | | | |
| | | March 2008 | | | | | | | | |
| | | Budget | | | | | | | March 2009 BudgetP | |
| | | 2008-2009 | | | Adjustments | | | 2008-2009 | | | 2009-2010 | | | 2010-2011 | |
Budgetary balance for the purposes of the Balanced Budget Act | | | 0 | | | | 0 | | | | 0 | | | | - 3 946 | | | | - 3 760 | |
| Deposits of dedicated revenues in the Generations Fund | | | 742 | | | | - 173 | | | | 569 | | | | 715 | | | | 880 | |
| | | | | | | | | | | | | | | | |
Consolidated budgetary balance | | | 742 | | | | - 173 | | | | 569 | | | | - 3 231 | | | | - 2 880 | |
| Consolidated non-budgetary requirements | | | - 1 474 | | | | 779 | | | | - 695 | | | | - 3 043 | | | | - 4 710 | |
| | | | | | | | | | | | | | | | |
Consolidated net financial requirements | | | - 732 | | | | 606 | | | | - 126 | | | | - 6 274 | | | | - 7 590 | |
| Including: | | | | | | | | | | | | | | | | | | | | |
| Consolidated Revenue Fund | | | 1 600 | | | | 700 | | | | 2 300 | | | | - 2 800 | | | | - 3 000 | |
| Non-budget-funded bodies and special funds | | | - 3 074 | | | | - 53 | | | | - 3 127 | | | | - 4 189 | | | | - 5 470 | |
| Deposit in the Generations Fund | | | 742 | | | | - 41 | | | | 701 | 2 | | | 715 | | | | 880 | |
| | | |
| P: | | Preliminary results for 2008-2009 and forecasts for subsequent years. |
| |
| 1 | | A negative entry indicates a financial requirement and a positive entry, a source of financing. |
| |
| 2 | | Including the deposit of $132 million from the budgetary reserve. |
C.48
| | |
| Appendix 1: | | Investments of $50.6 billion in the Québec Infrastructures Plan |
The government acted swiftly to support the economy and employment in Québec by raising public infrastructure investments by $4.1 billion on January 14, 2009. This measure brings the budget for the Québec Infrastructures Plan to $41.8 billion for the 2008-2013 period.
The federal government and the municipalities are also taking part in implementing some of the projects under this plan. In this regard, the Québec government and the federal government signed the Canada-Québec Infrastructure Framework Agreement on September 3, 2008. Further investments of close to $4 billion will be added to those of the Québec Infrastructures Plan between now and 2014.
Thanks to the Québec Infrastructures Plan, investments of $50.6 billion will be injected into the economy, including the contribution of $4.6 billion from the federal government and that of $4.2 billion from the municipalities.
TABLE C.25
Infrastructure investments
(billions of dollars)
| | | | | |
| 2007-2012 Québec Infrastructures Plan announced on October 11, 2007 | | | 37.7 | |
| - Intensification of public investments to counter the economic slowdown, announced on January 14, 2009 | | | 4.1 | |
| | | | |
2008-2013 QUÉBEC INFRASTRUCTURES PLAN | | | 41.8 | |
| | | | |
Contribution of partners in projects planned under the Québec Infrastructures Plan | | | | |
| - Federal government’s share further, notably, to the Canada-Québec Infrastructure Framework Agreement | | | 4.6 | |
| - Municipalities’ share | | | 4.2 | |
| | | | |
TOTAL INVESTMENTS 2008-2013 | | | 50.6 | |
| | | | |
C.49
| • | | Average annual investments under the Québec Infrastructures Plan |
Average annual investments under the Québec Infrastructures Plan will reach almost $8.4 billion over the period from 2008-2009 to 2012-2013.
| • | | This is $4 billion more on average than the level of the previous five years and more than three times that of 10 years ago. |
CHART C.5
Change in average annual investments under the Québec Infrastructures Plan
(millions of dollars)
C.50
| • | | Major investments in all sectors |
Major investments will be made in the coming years to maintain, improve and develop infrastructures:
| • | | $19.2 billion for transportation infrastructures, including roads, public transit and ferries; |
| |
| • | | $8.8 billion for health infrastructures, including in particular hopitals and residential and long-term care centres; |
| |
| • | | $6 billion for education infrastuctures including universities, CEGEPSs and school boards; |
| |
| • | | $3.6 billion for municipal infrastructures, including those financed by the Société de financement des infrastructures locales du Québec; |
| |
| • | | $4.2 billion for other sectors, including cultural facilities, public housing, research infrastructures, court houses and public security facilities. |
CHART C.6
2008-2013 Québec Infrastructures Plan Investments by sector
(billions of dollars and percent)
| | | |
| 1 | | Including the road network ($16.2 MM), public transit ($2.6 MM) and maritime infrastructures ($0.4 MM). |
| |
| 2 | | Including cultural facilities, public housing, research infrastructures, court houses and public security facilities. |
C.51
The road network is one of the government’s priorities in regard to infrastructures. Owing to the ageing of road infrastructures, the government was obliged to adopt an ambitious rehabilitation and modernization plan starting in 2007.
| • | | The government has set itself the objective of bringing the road network into line with the best road infrastructures in the United States. |
| |
| • | | With the contribution of partners, this plan will make it possible to accelerate the repair of Québec’s road network so that by 2022, 83% of its roads and 80% of its structures will have been brought up to par and will thus comply with the highest quality standards in North America. |
In 2009-2010, the government will step up the pace of its investments, bringing the sums invested that year to nearly $3.3 billion.
| • | | Coupled with the $450-million contribution of the partners involved in implementing major road projects, road network investments will total $3.7 billion. |
CHART C.7
Breakdown road work in 2009-2010
(millions of dollars)
| | | |
| 1 | | Federal, municipal and other partners. |
| |
| 2 | | Projects carried out under public-private partnerships for highways 25 and 30. |
C.52
The Québec Infrastructures Plan, made public on January 14, 2009, provides for investments of $2.6 billion in public transit for the period from 2008-2009 to 2012-2013.
| • | | Added to these investments are those of the Société de financement des infrastructures locales du Québec and the Green Fund for implementing programs to improve public transit services. |
Investments of $8.8 billion will be made in health over the period from 2008-2009 to 2012-2013. In addition to carrying out maintenance work on assets for health and social services institutions, the government will implement upgrading and replacement projects.
The investments in health also target the renovation of emergency wards and radiation oncology and cardiology units as well as the addition of 1 000 beds in residential and long-term care centres (CHSLDs).
Investments of $6 billion will be made in education over the period from 2008-2009 to 2012-2013. Initiatives are aimed at carrying out work to maintain assets, renovate buildings and purchase equipment.
C.53
Investments in culture will amount to close to $1.2 billion for the period from 2008-2009 to 2012-2013.
These investments are aimed at undertaking the construction of the Montréal Symphony Orchestra’s new concert hall, to be carried out by a public-private partnership, the expansion of the Musée national des beaux-arts du Québec and the Montréal Museum of Fine Arts as well as the completion of the Quartier des spectacles de Montréal.
The investments allocated under the reading and book policy will remain at the level of $15 million per year.
| • | | Municipal infrastructures |
Investments in municipal infrastructures will reach more than $3.6 billion for the the 2008-2013 period. The government plans to invest an average of $725 million per year.
These investments are intended to help municipalities complete the bringing of their drinking water treatment and waste water purification facilities up to standard. They include $600 million to carry out work on facilities in Baie-Comeau, Laval, Montréal, Shawinigan and Thetford Mines.
The Société de financement des infrastructures locales du Québec will contribute $371 million to finance these investments in 2009-2010.
The government will allocate over $1.2 billion to public housing for the 2008-2009 to 2012-2013 period. Close to $675 million is being set aside to complete the delivery of the 24 000 housing units6 provided for under the AccèsLogis Québec and Affordable Housing Québec programs.
| • | | Over $90 million per year is being provided to modernize and carry out major renovation work on low-rental housing units. |
| | | |
| 6 | | Added to this are the 3 000 housing units announced in this Budget. Investments of $200 million will be included when the next Québec Infrastructures Plan is updated. |
C.54
| • | | Research infrastructures |
In the framework of the Québec Research and Innovation Strategy,7 the government plans to support research infrastructure investments in order to ensure that Québec remains competitive internationally.
Investments of $920 million are provided for research infrastructures under the 2008-2013 Québec Infrastructures Plan. These investments are aimed at supporting the research assistance program and projects co-funded with the Canada Foundation for Innovation.
| • | | Justice and public security |
The Société immobilière du Québec will make investments of nearly $1 billion in the justice and public security sector.
TABLE C.26
Investments under the 2008-2013 Québec Infrastructures Plan by type of investment and by sector
(Contribution of Québec, millions of dollars)
| | | | | | | | | | | | | | | | | | | | | | | | | | | | | |
| | | Asset maintenance | | | | | | | | | | | | | | | | |
| | | | | | | Absorption of | | | | | | | | | | | | | | | | | | | 2008-2013 | |
| | | | | | | maintenance | | | | | | | Improvement | | | | | | | | | | | Québec | |
| | | Regular | | | deficit over | | | | | | | and | | | | | | | Project | | | Infrastructures | |
| Sector | | Budget | | | 15 years | | | Subtotal | | | replacement | | | Subtotal | | | completion | | | Plan | |
| Road network | | | 8 378.0 | | | | 2 070.0 | | | | 10 448.0 | | | | 1 336.8 | | | | 11 784.8 | | | | 4 366.5 | | | | 16 151.3 | |
| Public transit | | | 973.7 | | | | 514.0 | | | | 1 487.7 | | | | 665.6 | | | | 2 153.3 | | | | 485.5 | | | | 2 638.8 | |
| Maritime infrastructures | | | — | | | | — | | | | — | | | | 350.0 | | | | 350.0 | | | | — | | | | 350.0 | |
| Health | | | 4 325.4 | | | | 1 051.8 | | | | 5 377.2 | | | | 2 127.2 | | | | 7 504.4 | | | | 1 277.5 | | | | 8 781.9 | |
| Education | | | 4 345.5 | | | | 1 167.9 | | | | 5 513.4 | | | | 471.7 | | | | 5 985.1 | | | | 56.0 | | | | 6 041.1 | |
| Culture | | | 629.6 | | | | 234.2 | | | | 863.8 | | | | 148.0 | | | | 1 011.8 | | | | 170.2 | | | | 1 182.0 | |
| Municipal infrastructures | | | 1 785.6 | | | | 1 603.9 | | | | 3 389.5 | 1 | | | 40.0 | | | | 3 429.5 | | | | 200.0 | | | | 3 629.5 | |
| Public housing | | | 260.1 | | | | 223.0 | | | | 483.1 | | | | 115.4 | | | | 598.5 | | | | 559.2 | | | | 1 157.7 | |
| Research | | | 17.4 | | | | — | | | | 17.4 | | | | 100.0 | | | | 117.4 | | | | 802.2 | | | | 919.6 | |
| Justice and public security | | | 291.1 | | | | — | | | | 291.1 | | | | 665.1 | | | | 956.2 | | | | — | | | | 956.2 | |
| | | | | | | | | | | | | | | | | | | | | | |
TOTAL | | | 21 006.4 | | | | 6 864.8 | | | | 27 871.2 | | | | 6 019.8 | | | | 33 891.0 | | | | 7 917.1 | | | | 41 808.1 | |
| | | | | | | | | | | | | | | | | | | | | | |
| | | |
| 1 | | Including an envelope of $1.2 MM to bring drinking water purification and sewage treatment facilities of municipalities included under the “Improvement and replacement” heading of the 2007-2012 Québec Infrastructures Plan up to standard. |
| | | |
| 7 | | An Innovative, Prosperous Québec, 2008. |
C.55
TABLE C.27
Investments under the 2008-2013 Québec Infrastructures Plan by sector
(Contribution of Québec, millions of dollars)
| | | | | | | | | | | | | | | | | | | | | | | | | |
| Sector | | 2008-2009 | | | 2009-2010 | | | 2010-2011 | | | 2011-2012 | | | 2012-2013 | | | Total | |
| Road network | | | 2 002.9 | | | | 2 257.2 | | | | 2 396.3 | | | | 2 593.1 | | | | 2 535.3 | | | | 11 784.8 | |
| Public transit | | | 542.3 | | | | 567.9 | | | | 537.0 | | | | 343.6 | | | | 162.5 | | | | 2 153.3 | |
| Maritime infrastructures | | | — | | | | 15.4 | | | | 24.0 | | | | 148.5 | | | | 162.1 | | | | 350.0 | |
| Health | | | 1 378.3 | | | | 1 475.3 | | | | 1 350.1 | | | | 1 583.3 | | | | 1 717.4 | | | | 7 504.4 | |
| Education | | | 1 300.7 | | | | 1 278.6 | | | | 1 119.3 | | | | 1 133.4 | | | | 1 153.1 | | | | 5 985.1 | |
| Culture | | | 191.5 | | | | 235.9 | | | | 259.1 | | | | 155.8 | | | | 169.5 | | | | 1 011.8 | |
| Municipal infrastructures | | | 542.1 | | | | 738.6 | | | | 647.7 | | | | 748.8 | | | | 752.3 | | | | 3 429.5 | |
| Public housing | | | 92.8 | | | | 94.7 | | | | 128.9 | | | | 143.7 | | | | 138.4 | | | | 598.5 | |
| Research | | | 4.0 | | | | 3.7 | | | | 3.6 | | | | 3.0 | | | | 103.1 | | | | 117.4 | |
| Justice and public security | | | 165.4 | | | | 265.6 | | | | 218.3 | | | | 225.2 | | | | 81.7 | | | | 956.2 | |
| | | | | | | | | | | | | | | | | | | |
Subtotal | | | 6 220.0 | | | | 6 932.9 | | | | 6 684.3 | | | | 7 078.4 | | | | 6 975.4 | | | | 33 891.0 | |
| | | | | | | | | | | | | | | | | | | |
Project completion | | | 2 035.5 | | | | 2 004.4 | | | | 1 782.3 | | | | 1 338.3 | | | | 756.6 | | | | 7 917.1 | |
| | | | | | | | | | | | | | | | | | | |
2008-2013 QUÉBEC INFRASTRUCTURES PLAN | | | 8 255.5 | | | | 8 937.3 | | | | 8 466.6 | | | | 8 416.7 | | | | 7 732.0 | | | | 41 808.1 | |
| | | | | | | | | | | | | | | | | | | |
TABLE C.28
2008-2013 Québec Infrastructures Plan
(Contribution of Québec, millions of dollars)
| | | | | | | | | | | | | | | | | | | | | | | | | |
| | | 2008-2009 | | | 2009-2010 | | | 2010-2011 | | | 2011-2012 | | | 2012-2013 | | | Total | |
| 2007-2012 Québec Infrastructures Plan | | | 7 740.4 | | | | 8 418.9 | | | | 8 059.5 | | | | 7 447.9 | | | | 6 057.0 | | | | 37 723.7 | |
| Acceleration announced on January 14, 2009 | | | 515.1 | 1 | | | 518.4 | | | | 407.1 | | | | 968.8 | | | | 1 675.0 | | | | 4 084.4 | 2 |
| | | | | | | | | | | | | | | | | | | |
2008-2013 Québec Infrastructures Plan | | | 8 255.5 | | | | 8 937.3 | | | | 8 466.6 | | | | 8 416.7 | | | | 7 732.0 | | | | 41 808.1 | |
| | | | | | | | | | | | | | | | | | | |
| | | |
| 1 | | This amount will be realized as of the first quarter of 2009. |
| |
| 2 | | Acceleration announced on January 14, 2009. |
| |
| Note: | | Compared with the 2007-2008 level of investment under the 2007-2012 Québec Infrastructures Plan, the additional investments amount to $3 404.6 M in 2009-2010, $3 045.2 M in 2010-2011, $2 433.6 M in 2011-2012 and $1 042.7 M in 2012-2013, for a total of $9 926.1 M. |
C.56
| | |
| Appendix 2: | | Investment projects by government enterprises |
Certain government enterprises will make substantial investments in the coming years that will contribute to Québec’s economic recovery. In 2009-2010, investments by these corporations will increase by over $1 billion compared with 2008-2009. They will rise again in 2010-2011 to the unprecedented level of $5.5 billion, or $1.3 billion more than in fiscal 2008-2009.
Hydro-Québec alone will boost its investments by $1 billion in 2009-2010 and $1.3 billion in 2010-2011 compared with 2008-2009.
For example, the La Romaine hydroelectric project, which will begin in 2009 and continue until 2020, and the Eastmain-1-A/Rupert and La Sarcelle project, which will be completed in 2012, rank first and third respectively among the largest infrastructure projects in Canada and will help to secure Québec’s energy wealth over the long term.
The Eastmain-1-A/Rupert and La Sarcelle project alone will generate investments of $1.3 billion in 2009 and $921 million in 2010. As for the la Romaine project, it will really get underway in 2010 with expenditures estimated at $0.5 billion.
At the same time, renovation work on the Gentilly power station will generate economic spinoffs of $352 million and $414 million in 2009 and 2010 respectively.
Hydro-Québec’s other projects will also have significant spinoffs in Québec. Overall, they are estimated at close to $3.2 billion in 2010 and almost $3.5 billion in 2011.
| • | | Loto-Québec and the Société des alcools du Québec |
Loto-Québec and the Société des alcools du Québec will also boost their investments through various projects.
Loto-Québec’s investments will reach $184 million in 2009-2010 compared with $166 million in 2008-2009. Of that amount, $41.5 million will be devoted to renovating the Casino de Montréal. In 2010-2011, Loto-Québec will invest an additional $110 million in this renovation project, out of total investments of $155 million.
C.57
The Société des alcools du Québec, for its part, will also increase its investments in 2009-2010 through expenditures of $56 million, allocated mainly to deploying its network of outlets and to implementing computer resource projects, compared with total investments of $37 million in 2008-2009. The Société plans to invest $45 million in 2010-2011.
TABLE C.29
Projected investment by government enterprises
(millions of dollars)
| | | | | | | | | | | | | |
| | | 2008-2009 | | | 2009-2010 | | | 2010-2011 | |
HYDRO-QUÉBEC1 | | | | | | | | | | | | |
Major projects | | | | | | | | | | | | |
| Eastmain-1-A/Rupert and La Sarcelle | | | 997.0 | | | | 1 331.0 | | | | 921.0 | |
| Gentilly-2 — repair project | | | 127.0 | | | | 352.0 | | | | 414.0 | |
| La Romaine complex | | | 59.0 | | | | 121.0 | | | | 496.0 | |
| Chute-Allard and Rapides-des-Cœurs | | | 228.0 | | | | 53.0 | | | | — | |
| Transmission integration — Wind turbines (990 MW and 2000 MW) | | | 95.0 | | | | 166.0 | | | | 235.0 | |
| Interconnection with Ontario | | | 249.0 | | | | 251.0 | | | | 46.0 | |
| Global Energy Efficiency Plan (GEEP) | | | 236.0 | | | | 303.0 | | | | 342.0 | |
| | | | | | | | | | |
Subtotal major projects | | | 1 990.0 | | | | 2 577.0 | | | | 2 454.0 | |
| Other projects | | | 2 002.0 | | | | 2 419.0 | | | | 2 840.0 | |
| | | | | | | | | | |
Total Hydro-Québec | | | 3 992.0 | | | | 4 996.0 | | | | 5 294.0 | |
| | | | | | | | | | | | | |
LOTO-QUÉBEC | | | | | | | | | | | | |
| Casino de Montréal | | | — | | | | 41.5 | | | | 110.0 | |
| Other projects | | | 166.2 | 2 | | | 142.3 | | | | 45.0 | |
| | | | | | | | | | |
Total Loto-Québec | | | 166.2 | | | | 183.8 | | | | 155.0 | |
| | | | | | | | | | | | | |
SOCIÉTÉ DES ALCOOLS DU QUÉBEC | | | | | | | | | | | | |
| Outlet network | | | 11.0 | | | | 17.0 | | | | — | |
| Other projects | | | 26.3 | | | | 39.0 | | | | 45.0 | 3 |
| | | | | | | | | | |
Total Société des alcools du Québec | | | 37.3 | | | | 56.0 | | | | 45.0 | |
| | | | | | | | | | |
TOTAL INVESTMENTS | | | 4 195.5 | | | | 5 235.8 | | | | 5 494.0 | |
| | | | | | | | | | |
| | | |
| 1 | | For the fiscal year ending December 31. |
| |
| 2 | | This amount includes $47 million for improvement work on casinos as a whole, including nearly $8 million for expanding the Casino de Charlevoix and $13 million for building the casino in Mont-Tremblant. |
| |
| 3 | | The breakdown between outlet deployment and other projects remains to be determined for fiscal 2010-2011. |
C.58