Exhibit (99.15)
Section D
Debt, Financing and Debt Management
| | | | | |
1. Debt | | | D.3 | |
| | | | | |
| 1.1 Gross debt | | | D.4 | |
| | | | | |
| 1.1.1 Change in gross debt in 2008-2009 | | | D.5 | |
| | | | | |
1.2 Total debt under the Act to reduce the debt and establish the Generations Fund | | | D.7 | |
| | | | | |
| 1.3 Debt representing accumulated deficits | | | D.9 | |
| | | | | |
| 1.4 Public sector debt | | | D.11 | |
| | | | | |
| 1.5 Comparison of the debt of Canadian provinces | | | D.13 | |
| | | | | |
| 1.6 Retirement plans | | | D.15 | |
| | | | | |
| 1.7 Retirement Plans Sinking Fund | | | D.18 | |
| | | | | |
| 1.8 Employee future benefits | | | D.23 | |
| | | | | |
| 1.9 Generations Fund | | | D.24 | |
| | | | | |
| 1.10 Returns of the Caisse de dépôt et placement du Québec on funds deposited by the ministère des Finances | | | D.25 | |
| | | | | |
| 1.10.1 Retirement Plans Sinking Fund | | | D.25 | |
| | | | | |
| 1.10.2 Generations Fund | | | D.27 | |
| | | | | |
| 1.10.3 Accumulated Sick Leave Fund | | | D.28 | |
| | | | | |
| 1.10.4 Budgetary Reserve Fund | | | D.28 | |
| | | | | |
| 1.11 Impact of the return of the Retirement Plans Sinking Fund in 2008 on debt service | | | D.29 | |
| | | | | |
2. Financing | | | D.31 | |
| | | | | |
| 2.1 Financing strategy | | | D.31 | |
| | | | | |
| 2.1.1 Diversification by market | | | D.31 | |
| | | | | |
| 2.1.2 Diversification by instrument | | | D.32 | |
| | | | | |
| 2.1.3 Diversification by maturity | | | D.33 | |
| | | | | |
| 2.2 Financing program | | | D.34 | |
| | | | | |
| 2.2.1 Yield | | | D.36 | |
| | | | | |
3. Debt management | | | D.39 | |
| | | | | |
| 3.1 Structure of the debt by currency | | | D.39 | |
| | | | | |
| 3.2 Structure of the debt by interest rate | | | D.41 | |
| | | | | |
4. Credit Ratings | | | D.43 | |
| | | | | |
| 4.1 The Québec government’s credit rating | | | D.43 | |
| | | | | |
| 4.2 Comparison of the credit ratings of Canadian provinces | | | D.48 | |
| | | | | |
5. Additional information | | | D.51 | |
D.2
| 1. | | Debt |
| |
| | | Several concepts of debt can be used to measure a government’s indebtedness. |
| |
| | | This section details the components of the debt concepts used by the Québec government and compares the indebtedness of the Canadian provinces. |
| |
| | | The following table shows the Québec government’s debt according to the main debt concepts used. |
TABLE D.1
Debt of the Québec government as at March 31
(millions of dollars)
| | | | | | | | | | | | | | | | | |
| | | 2008 | | | 2009P | | | 2010P | | | 2011P | |
GROSS DEBT | | | 148 015 | | | | 151 447 | | | | 160 273 | | | | 170 180 | |
As a % of GDP | | | 49.9 | | | | 49.9 | | | | 52.8 | | | | 54.0 | |
| Less: Financial assets, net of other liabilities | | | - 23 697 | | | | - 22 415 | | | | - 23 287 | | | | - 24 610 | |
| Less: Non-financial assets | | | - 30 147 | | | | - 33 556 | | | | - 37 984 | | | | - 43 688 | |
| | | | | | | | | | | | | |
DEBT REPRESENTING ACCUMULATED DEFICITS IN ACCORDANCE WITH THE PUBLIC ACCOUNTS1, 2 | | | 94 171 | | | | 95 476 | | | | 99 002 | | | | 101 882 | |
As a % of GDP | | | 31.7 | | | | 31.4 | | | | 32.6 | | | | 32.3 | |
| Plus: Balance of the budgetary reserve | | | 2 301 | | | | 295 | | | | — | | | | — | |
| | | | | | | | | | | | | |
DEBT REPRESENTING ACCUMULATED DEFICITS AFTER TAKING INTO ACCOUNT THE BUDGETARY RESERVE2 | | | 96 472 | | | | 95 771 | | | | 99 002 | | | | 101 882 | |
As a % of GDP | | | 32.5 | | | | 31.5 | | | | 32.6 | | | | 32.3 | |
| | | |
| P: | | Preliminary results for 2009 and forecasts for subsequent years. |
| |
| 1 | | Before taking into account the budgetary reserve. |
| |
| 2 | | Including the impact of the plan to restore fiscal balance. |
D.3
The government’s gross debt is the sum of the consolidated direct debt, the net retirement plans liability and the net employee future benefits liability, minus the balance of the Generations Fund.
Preliminary results show that, as at March 31, 2009, the gross debt should amount to $151 447 million, or 49.9% of GDP. As at March 31, 2011, the gross debt is expected to be $170 180 million, or 54% of GDP.
TABLE D.2
Gross debt as at March 31
(millions of dollars)
| | | | | | | | | | | | | | | | | |
| | | 2008 | | | 2009P | | | 2010P | | | 2011P | |
Direct debt of the Consolidated Revenue Fund1 | | | 82 315 | | | | 86 941 | | | | 92 020 | | | | 97 172 | |
| Debt of consolidated entities | | | 35 774 | | | | 37 924 | | | | 42 113 | | | | 47 583 | |
| | | | | | | | | | | | | |
Consolidated direct debt2 | | | 118 089 | | | | 124 865 | | | | 134 133 | | | | 144 755 | |
| Plus: Net retirement plans liability | | | 30 426 | | | | 28 391 | | | | 28 720 | | | | 28 941 | |
| Plus: Net employee future benefits liability | | | 733 | | | | 125 | | | | 69 | | | | 13 | |
| Less: Generations Fund | | | - 1 233 | | | | - 1 934 | | | | - 2 649 | | | | - 3 529 | |
| | | | | | | | | | | | | |
GROSS DEBT | | | 148 015 | | | | 151 447 | | | | 160 273 | | | | 170 180 | |
As a % of GDP | | | 49.9 | | | | 49.9 | | | | 52.8 | | | | 54.0 | |
| | | |
| P: | | Preliminary results for 2009 and forecasts for subsequent years. |
| |
| 1 | | Excluding pre-financing. |
| |
| 2 | | The consolidated direct debt reflects all of the government’s financial requirements that give rise to borrowings on financial markets. |
The consolidated direct debt consists of the direct debt of the Consolidated Revenue Fund and the direct debt of entities whose results are consolidated line by line with those of the government. The main consolidated entities are Financement-Québec, the Fonds de conservation et d’amélioration du réseau routier, the Corporation d’hébergement du Québec, the Société québécoise d’assainissement des eaux, the Société immobilière du Québec, Investissement Québec, Immobilière SHQ, the Agence métropolitaine de transport and the Société du Palais des congrès de Montréal. As at March 31, 2009, the consolidated direct debt is expected to total $124 865 million.
The net retirement plans liability represents the gross retirement plans liability minus the balance of the Retirement Plans Sinking Fund (RPSF), an asset established to pay the retirement benefits of public and parapublic sector employees. As at March 31, 2009, the net retirement plans liability should amount to $28 391 million.
D.4
The net liability for employee future benefits consists of the government’s commitments for accumulated sick leave and the survivor’s pension plan, minus assets constituted in regard to these commitments. As at March 31, 2009, the net employee future benefits liability should stand at $125 million.
As at March 31, 2009, the sums accumulated in the Generations Fund are expected to amount to $1 934 million.
| | 1.1.1 | | Change in gross debt in 2008-2009 |
In 2008-2009, the government’s gross debt should increase by $3 432 million. Even though the budget will be balanced this year, the gross debt continues to rise for the following reasons:
| | • | | First of all, the government invests in its corporations. It makes such investments through advances and direct capital outlays or by allowing these corporations to keep part of their profits to finance their own investments. |
| |
| | | | For example, Hydro-Québec pays 75% of its net profits as dividends to the government and keeps 25% to fund its investments, particularly hydroelectric dams. The portion of profits that the government is leaving Hydro-Québec in 2008-2009 ($611 million) constitutes an investment by the government in Hydro-Québec, which creates a financial requirement for the government and thus leads to an increase in the gross debt. |
| |
| | | | In addition, the government invested $250 million in the Société générale de financement. This investment is part of the $1 000-million contribution announced in the January 2009 Economic Statement in order to stimulate investment in Québec businesses. |
| |
| | | | Overall, the government’s investments, loans and advances should lead to a $17-million increase in the gross debt in 2008-2009. This amount includes the withdrawal of $805 million from the $1 100 million deposited with the Caisse de dépôt et placement du Québec in 2007-2008 under the Act to establish a budgetary surplus reserve fund. |
| |
| | • | | In addition, net investments in the health and social services and education networks, which include loans made by Financement-Québec and the Corporation d’hébergement du Québec to network institutions to fund their capital expenditures, should raise the gross debt by $815 million in 2008-2009. |
D.5
| | • | | Secondly, the government makes investments in fixed assets (e.g. roads) that require borrowings. When these capital expenditures are made, they are posted to the government’s balance sheet. Subsequently, they are gradually recorded as expenditures based on the useful life of the assets concerned. In 2008-2009, net capital expenditures should cause the gross debt to increase by $2 405 million. |
| |
| | • | | Lastly, changes in some of the government’s other asset and liability items, such as accounts payable and accounts receivable, should raise the gross debt by $896 million in 2008-2009. |
TABLE D.3
Main factors responsible for growth in the Québec government’s debt
(millions of dollars)
| | | | | | | | | | | | | | | | | | | | | | | | | | | | | | | | | |
| | | Debt, | | | Budgetary | | | Investments, | | | Net | | | | | | | | | | | | | |
| | | beginning of | | | deficit | | | loans and | | | investment in | | | Net capital | | | Other | | | Generations | | | Debt, end of | |
| | | year | | | (surplus) | | | advances | | | the networks | | | expenditures1 | | | factors2 | | | Fund | | | year3 | |
Before accounting reform | | | | | | | | | | | | | | | | | | | | | | | | | | | | | | | | |
Total debt | | | | | | | | | | | | | | | | | | | | | | | | | | | | | | | | |
| 1998-1999 | | | 98 385 | | | | - 126 | | | | 1 402 | | | | | | | | 217 | | | | 1 235 | | | | | | | | 101 113 | |
| 1999-2000 | | | 101 113 | | | | - 7 | | | | 2 006 | | | | | | | | 359 | | | | - 1 351 | | | | | | | | 102 120 | |
| 2000-2001 | | | 102 120 | | | | - 427 | | | | 1 632 | | | | | | | | 473 | | | | 1 050 | | | | | | | | 104 848 | |
| 2001-2002 | | | 104 848 | | | | - 22 | | | | 1 142 | | | | | | | | 995 | | | | 212 | | | | | | | | 107 175 | |
| 2002-2003 | | | 107 175 | | | | 728 | | | | 1 651 | | | | | | | | 1 482 | | | | 306 | | | | | | | | 111 342 | |
| 2003-2004 | | | 111 342 | | | | 358 | | | | 1 125 | | | | | | | | 1 019 | | | | 881 | | | | | | | | 114 725 | |
| 2004-2005 | | | 114 725 | | | | 664 | | | | 979 | | | | | | | | 1 083 | | | | - 855 | | | | | | | | 116 596 | |
| 2005-2006 | | | 116 596 | | | | - 37 | | | | 1 182 | | | | | | | | 1 166 | | | | - 605 | | | | | | | | 118 302 | |
| 2006-2007 | | | 118 302 | | | | - 20 | | | | 1 977 | | | | | | | | 1 117 | | | | 1 641 | | | | - 576 | | | | 122 441 | |
| | | | | | | | | | | | | | | | | | | | | | | | | |
After accounting reform | | | | | | | | | | | | | | | | | | | | | | | | | | | | | | | | |
Gross debt | | | | | | | | | | | | | | | | | | | | | | | | | | | | | | | | |
| 2007-2008 | | | 143 449 | | | | — | | | | 2 410 | | | | 487 | | | | 1 457 | | | | 861 | | | | - 649 | | | | 148 015 | |
2008-2009P | | | 148 015 | | | | — | | | | 17 | | | | 815 | | | | 2 405 | | | | 896 | | | | - 701 | | | | 151 447 | |
2009-2010P | | | 151 447 | | | | 3 946 | | | | 1 345 | | | | 1 004 | | | | 3 304 | | | | - 58 | | | | - 715 | | | | 160 273 | |
2010-2011P | | | 160 273 | | | | 3 760 | | | | 1 570 | | | | 2 291 | | | | 3 357 | | | | - 191 | | | | - 880 | | | | 170 180 | |
| | | |
| Note: | | A positive entry indicates a financial requirement and a negative entry, a source of financing. |
| |
| P: | | Preliminary results for 2008-2009 and forecasts for subsequent years. |
| |
| 1 | | Capital expenditures made during the year minus the yearly depreciation expenditure. |
| |
| 2 | | Includes notably the change in “Other accounts,” such as accounts receivable and accounts payable, as well as the change in the value of the debt in foreign currency. |
| |
| 3 | | Excluding pre-financing. |
D.6
| | | |
| | 1.2 | | Total debt under the Act to reduce the debt and establish the Generations Fund |
When the government created the Generations Fund in June 2006, the concept of total debt was used to set the debt/GDP ratio targets in the Act to reduce the debt and establish the Generations Fund.
Total debt corresponds to the sum of the following elements:
| | • | | debt issued on financial markets by the government and entities consolidated line by line; |
| |
| | • | | the net retirement plans liability of public and parapublic sector employees; |
minus the balance of the Generations Fund.
When the Generations Fund was created, line-by-line consolidated entities corresponded to those entities that were included in the government’s reporting entity at the time. However, the reporting entity has been broadened since the fund’s creation. With the reform of government accounting in December 2007, entities in the health and social services and education networks were consolidated. The concept of debt was broadened to include the debt of entities that make loans to the networks, namely, Financement-Québec and the Corporation d’hébergement du Québec (CHQ), and to reclassify the debt of the Société québécoise d’assainissement des eaux (SQAE) and the net employee future benefits liability. In addition, since the 2007-2008 fiscal year, the results of Immobilière SHQ have also been consolidated line by line with those of the government. This broader concept of direct debt corresponds to gross debt as described above.
For the purpose of monitoring the targets incorporated in the Act to reduce the debt and establish the Generations Fund, the concept of total debt corresponds to the reporting entity that was in effect when the Generations Fund was created.
Preliminary results show that the total debt should amount to $129 916 million as at March 31, 2009, or 42.8% of GDP. Under the Act to reduce the debt and establish the Generations Fund, the total debt will have to represent 38% of GDP as at March 31, 2013, 32% of GDP as at March 31, 2020 and 25% of GDP as at March 31, 2026.
D.7
On account of the deficits anticipated for the coming fiscal years, the weight of the total debt as a percentage of GDP is expected to rise temporarily even though deposits continue to be made in the Generations Fund.
Therefore, until the tabling of the 2011-2012 Budget, that is, when the economic recovery will be well under way, the government will review the targets provided for in the Act to reduce the debt and establish the Generations Fund.
TABLE D.4
Total debt and gross debt of the Québec government
(millions of dollars)
| | | | | | | | | | | | | | | | | |
| | | 2008 | | | 2009P | | | 2010P | | | 2011P | |
TOTAL DEBT UNDER THE ACT TO REDUCE THE DEBT AND ESTABLISH THE GENERATIONS FUND | | | 125 915 | | | | 129 916 | | | | 138 015 | | | | 145 913 | |
As a % of GDP | | | 42.4 | | | | 42.8 | | | | 45.5 | | | | 46.3 | |
| | | | | | | | | | | | | | | | | |
| Plus: Debt of Financement-Québec | | | 14 274 | | | | 14 361 | | | | 15 223 | | | | 17 573 | |
| Debt of the CHQ and other entities | | | 2 806 | | | | 2 809 | | | | 2 701 | | | | 2 660 | |
| Debt of the SQAE | | | 2 416 | | | | 2 359 | | | | 2 231 | | | | 1 889 | |
| Debt of Immobilière SHQ | | | 1 871 | | | | 1 877 | | | | 2 034 | | | | 2 132 | |
| Net employee future benefits liability | | | 733 | | | | 125 | | | | 69 | | | | 13 | |
| | | | | | | | | | | | | |
GROSS DEBT | | | 148 015 | | | | 151 447 | | | | 160 273 | | | | 170 180 | |
As a % of GDP | | | 49.9 | | | | 49.9 | | | | 52.8 | | | | 54.0 | |
| | | |
| P: | | Preliminary results for 2009 and forecasts for subsequent years. |
D.8
| | | | |
| | 1.3 | | Debt representing accumulated deficits |
Debt representing accumulated deficits is a simple concept that reflects the financial position of a government well, since it takes all of its liabilities and assets into account. The federal government, Ontario and Alberta use debt representing accumulated deficits as a measure of indebtedness in their budget documents.
The debt representing accumulated deficits corresponds to the difference between the government’s liabilities and its financial and non-financial assets as a whole. The debt representing accumulated deficits is calculated by subtracting financial assets net of other liabilities as well as non-financial assets from the gross debt.
Preliminary results show that the debt representing accumulated deficits should amount to $95 771 million as at March 31, 2009, or 31.5% of GDP.
TABLE D.5
Debt representing accumulated deficits as at March 31
(millions of dollars)
| | | | | | | | | | | | | | | | | |
| | | 2008 | | | 2009P | | | 2010P | | | 2011P | |
| Gross debt | | | 148 015 | | | | 151 447 | | | | 160 273 | | | | 170 180 | |
| Less: Financial assets, net of other liabilities | | | - 23 697 | | | | - 22 415 | | | | - 23 287 | | | | - 24 610 | |
| Less: Non-financial assets | | | - 30 147 | | | | - 33 556 | | | | - 37 984 | | | | - 43 688 | |
| | | | | | | | | | | | | |
DEBT REPRESENTING ACCUMULATED DEFICITS IN ACCORDANCE WITH THE PUBLIC ACCOUNTS 1, 2 | | | 94 171 | | | | 95 476 | | | | 99 002 | | | | 101 882 | |
As a % of GDP | | | 31.7 | | | | 31.4 | | | | 32.6 | | | | 32.3 | |
| Plus: Balance of the budgetary reserve | | | 2 301 | | | | 295 | | | | — | | | | — | |
| | | | | | | | | | | | | |
DEBT REPRESENTING ACCUMULATED DEFICITS AFTER TAKING INTO ACCOUNT THE BUDGETARY RESERVE2 | | | 96 472 | | | | 95 771 | | | | 99 002 | | | | 101 882 | |
As a % of GDP | | | 32.5 | | | | 31.5 | | | | 32.6 | | | | 32.3 | |
| | | |
| P: | | Preliminary results for 2009 and forecasts for subsequent years. |
| |
| 1 | | Before taking into account the budgetary reserve. |
| |
| 2 | | Including the impact of the plan to restore fiscal balance. |
D.9
Net financial assets and non-financial assets
of the Québec government
Net financial assets correspond to the difference between financial assets and financial liabilities. Financial assets consist primarily of the value of the government’s investments in its corporations, accounts receivable and long-term investments.
Financial liabilities include mainly accounts payable.
Net financial assets as at March 31, 2008
(millions of dollars)
| | | | | | | | | |
FINANCIAL ASSETS | | | | | | | | |
Investments in government enterprises1 | | | 24 608 | | | | | |
| Accounts receivable | | | 14 389 | | | | | |
| Long-term investments | | | 5 384 | | | | | |
| Other | | | 989 | | | | | |
| | | | | | | | |
| Subtotal | | | | | | | 45 370 | |
FINANCIAL LIABILITIES | | | | | | | | |
| Accounts payable | | | 14 254 | | | | | |
| Deferred revenue | | | 2 821 | | | | | |
| Federal transfers to be repaid | | | 1 903 | | | | | |
| Deferred foreign exchange gains | | | 1 146 | | | | | |
| Other | | | 1 549 | | | | | |
| | | | | | | | |
| Subtotal | | | | | | | 21 673 | |
| | | | | | | | |
Total financial assets, net of liabilities | | | | | | | 23 697 | |
| | | | | | | | |
| | | |
| 1 | | Corresponds for the most part to net profits of Hydro-Québec not paid to the government as dividends and investments in the Société générale de financement du Québec. |
Non-financial assets consist of government capital assets, loans made to the health and social services and education networks to fund their capital expenditures, as well as inventories and prepaid expenses.
Non-financial assets as at March 31, 2008
(millions of dollars)
| | | | | | | | | |
| Capital assets | | | | | | | 19 483 | |
| Net investment in the health and social services and education networks | | | | | | | | |
| Health and social services network | | | 4 596 | | | | | |
| Education network | | | 5 876 | | | | 10 472 | |
| | | | | | | | |
| Inventories and prepaid expenses | | | | | | | 192 | |
| | | | | | | | |
Total non-financial assets | | | | | | | 30 147 | |
| | | | | | | | |
D.10
Public sector debt includes the government’s gross debt as well as the debt of the health and social services and education networks, Hydro-Québec, municipalities and other government enterprises. This debt has served notably to finance public infrastructures, such as roads, schools, hospitals, hydroelectric dams and water treatment plants.
Preliminary results show that, as at March 31, 2009, the public sector debt should be $208 362 million, or 68.6% of GDP.
TABLE D.6
Public sector debt as at March 31
(millions of dollars)
| | | | | | | | | | | | | | | | | | | | | |
| | | Before accounting reform | | | After accounting reform | |
| | | 2005 | | | 2006 | | | 2007 | | | 2008 | | | 2009P | |
Government debt1, 2 | | | 116 596 | | | | 118 302 | | | | 143 449 | | | | 148 015 | | | | 151 447 | |
Health and social services and education networks3 | | | 12 301 | | | | 13 078 | | | | 2 023 | | | | 1 552 | | | | 911 | |
| Hydro-Québec | | | 33 032 | | | | 32 367 | | | | 32 674 | | | | 32 399 | | | | 36 572 | |
Other government enterprises4 | | | 3 726 | | | | 3 540 | | | | 31 | | | | 25 | | | | 171 | |
Municipalities5 | | | 17 053 | | | | 18 347 | | | | 16 409 | | | | 17 321 | | | | 19 261 | |
| | | | | | | | | | | | | | | | |
TOTAL | | | 182 708 | | | | 185 634 | | | | 194 586 | | | | 199 312 | | | | 208 362 | |
As a % of GDP | | | 69.5 | | | | 68.5 | | | | 69.1 | | | | 67.2 | | | | 68.6 | |
| | | |
| P: | | Preliminary results. |
| |
| 1 | | Excluding pre-financing. |
| |
| 2 | | Before the accounting reform the data correspond to the concept of total debt under the Act to reduce the debt and establish the Generations Fund, while after the accounting reform they correspond to the concept of gross debt. |
| |
| 3 | | Corresponds to the long-term debt for which the government subsidizes debt service through transfers for repaying the principal and paying the interest on borrowings. |
| |
| 4 | | Excluding debt guaranteed by a third party or secured by assets such as inventories and accounts receivable. |
| |
| 5 | | Includes the long-term debt for which the government subsidizes debt service through transfers for repaying the principal and paying the interest on borrowings. The government-subsidized long-term debt should amount to $2 700 million as at March 31, 2009. |
D.11
Information provided to regulatory authorities
and data on Québec’s debt
To borrow on foreign financial markets, the Québec government must satisfy the requirements of the regulatory authorities of those markets. Accordingly, Québec must file a variety of information with the Securities and Exchange Commission (SEC) in the United States, the Financial Services Authority (FSA) in the United Kingdom, the Australian Stock Exchange and the regulatory authority in Japan.
Each year, Québec files an information document (Form 18-K) with the SEC that contains all the information required under the Securities Act of 1933. The annual filing of Form 18-K avoids having to file a prospectus for each borrowing, which would entail additional time and costs. The information in Form 18-K must reflect the borrower’s financial position as faithfully as possible. This requirement provides investors with the relevant information to make informed investment decisions.
Concerning the debt, the SEC legislation requires the inclusion of “funded debt”, i.e. the debt with a term exceeding one year that was contracted on financial markets, and the “floating debt”, i.e. the short-term debt that is continually rolled over to fund operations. Québec also provides information concerning the liability for the retirement plans of the public and parapublic sectors.
The information on the public sector debt in Form 18-K is divided into four categories:
| | • | | the debt contracted by the government to meet its financial requirements and fund government enterprises; |
| |
| | • | | the debt of public sector entities (mainly Hydro-Québec) for which the government guarantees the payment of the interest and the repayment of the principal in the event of the entity’s default of payment; |
| |
| | • | | the debt of the municipalities; |
| |
| | • | | the debt of other institutions of the public sector issued in their own name (educational institutions, health and social services institutions and other government enterprises). |
Moreover, Québec provides other regulatory authorities around the world with the same information supplied to the SEC.
As regards the public sector debt shown on the preceding page, the data on the debt of the health and social services and education networks, Hydro-Québec, government enterprises and municipalities reflect the requirements of the SEC for the purposes of the presentation of information in the annual Form 18-K and those of the other regulatory authorities with which the government must file information.
D.12
| | 1.5 | | Comparison of the debt of Canadian provinces |
It is worthwhile to compare the concepts of debt used by the Québec government with those used by other governments in Canada.
An analysis of the budget documents of the federal and provincial governments shows that the concepts of debt used to assess financial position vary widely from province to province.
The preferred concept of debt in British Columbia and Saskatchewan is direct debt. Alberta, New Brunswick, Newfoundland and Labrador, Manitoba and Nova Scotia use the concept of net debt. As for Prince Edward Island, its recent budget documents make no reference to its debt.
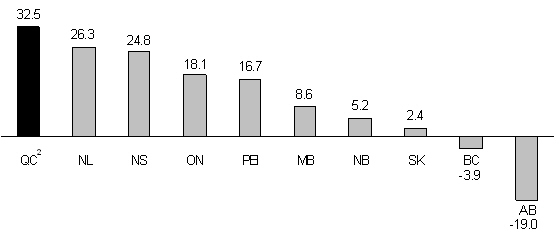
Four governments use the concept of debt representing accumulated deficits as a measure of indebtedness in their budget documents. They are the government of Québec, the federal government and the governments of Ontario and Alberta.
On the basis of the concept of debt representing accumulated deficits, Québec is the most indebted province. Indeed, as at March 31, 2008, its debt/GDP ratio was 32.5%.
CHART D.1
Debt representing accumulated deficits1 as at March 31, 2008
(as a percentage of GDP)
| | | |
| 1 | | A negative entry means that the government has an accumulated surplus. |
| |
| 2 | | After taking the budgetary reserve into account. |
| |
| Sources: | | Ministère des Finances du Québec, the governments’ public accounts and Statistics Canada. |
D.13
The following table shows the debt of the federal government and each of the provinces as at March 31, 2008. Figures surrounded by boxes indicate the concept of debt used by each government in its budget documents to measure its level of debt.
TABLE D.7
Debt as at March 31, 2008 according to the various concepts
(millions of dollars)
| | | | | | | | | | | | | | | | | | | | | | | | | | | | | | | | | | | | | | | | | | | | | |
| | | QC | | | Fed. | | | ON | | | BC | | | AB | | | NB | | | NL | | | MB | | | SK | | | NS | | | PEI | |
Consolidated |
direct debt | | | 118 089 | | | | 390 697 | | | | 162 056 | | | | 34 185 | | | | 2 522 | | | | 5 300 | | | | 6 825 | | | | 11 786 | | | | 7 156 | | | | 9 292 | | | | 1 044 | |
| Net retirement plans liability | | | 30 426 | | | | 137 371 | | | | - 3 714 | | | | 2 | | | | 7 883 | | | | - 245 | | | | 1 459 | | | | 2 300 | | | | 5 088 | | | | 328 | | | | - 43 | |
| Net employee future benefits liability | | | 733 | | | | 47 901 | | | | 4 738 | | | | 1 648 | | | | 219 | | | | 641 | | | | 1 513 | | | | — | | | | 387 | | | | 1 293 | | | | 82 | |
| Generations Fund | | | - 1 233 | | | | — | | | | — | | | | — | | | | — | | | | — | | | | — | | | | — | | | | — | | | | — | | | | — | |
| | | | | | | | | | | | | | | | | | | | | | | | | | | | | | | | | | |
Gross debt1 | | | 148 015 | | | | 575 969 | | | | 163 080 | | | | 35 835 | | | | 10 624 | | | | 5 696 | | | | 9 797 | | | | 14 086 | | | | 12 631 | | | | 10 913 | | | | 1 083 | |
As a % of GDP | | | 49.9 | | | | 37.5 | | | | 27.9 | | | | 18.6 | | | | 4.1 | | | | 21.1 | | | | 33.2 | | | | 29.0 | | | | 24.5 | | | | 33.1 | | | | 23.8 | |
| Less: | | | | | | | | | | | | | | | | | | | | | | | | | | | | | | | | | | | | | | | | | | | | |
Net financial assets2 | | | - 21 396 | | | | - 59 688 | | | | - 20 662 | | | | - 13 552 | | | | - 45 670 | | | | 1 247 | | | | 391 | | | | - 3 898 | | | | - 6 866 | | | | 1 202 | | | | 264 | |
| | | | | | | | | | | | | | | | | | | | | | | | | | | | | | | | | | |
Net debt3 | | | 126 619 | 4 | | | 516 281 | | | | 142 418 | | | | 22 283 | | | | - 35 046 | | | | 6 943 | | | | 10 188 | | | | 10 188 | | | | 5 765 | | | | 12 115 | | | | 1 347 | |
As a % of GDP | | | 42.7 | | | | 33.6 | | | | 24.3 | | | | 11.6 | | | | - 13.5 | | | | 25.8 | | | | 34.5 | | | | 21.0 | | | | 11.2 | | | | 36.7 | | | | 29.6 | |
| Less: | | | | | | | | | | | | | | | | | | | | | | | | | | | | | | | | | | | | | | | | | | | | |
| Non-financial assets | | | - 30 147 | | | | - 58 644 | | | | - 36 801 | | | | - 29 734 | | | | - 14 140 | | | | - 5 538 | | | | - 2 436 | | | | - 5 995 | | | | - 4 547 | | | | - 3 928 | | | | - 587 | |
| | | | | | | | | | | | | | | | | | | | | | | | | | | | | | | | | | |
Debt
representing
accumulated |
deficits3 | | | 96 472 | 4 | | | 457 637 | | | | 105 617 | | | | - 7 451 | | | | - 49 186 | | | | 1 405 | | | | 7 752 | | | | 4 193 | | | | 1 218 | | | | 8 187 | | | | 760 | |
As a % of GDP | | | 32.5 | | | | 29.8 | | | | 18.1 | | | | - 3.9 | | | | - 19.0 | | | | 5.2 | | | | 26.3 | | | | 8.6 | | | | 2.4 | | | | 24.8 | | | | 16.7 | |
| | | |
| Note: | | The boxes indicate the debt concept used in the government’s budget documents. |
| |
| 1 | | Gross debt is not disclosed in most of the governments’ public accounts. However, the components of gross debt, i.e. consolidated direct debt, the net retirement plans liability and the net employee future benefits liability, are disclosed. |
| |
| 2 | | Financial assets, net of other liabilities. |
| |
| 3 | | A negative entry indicates that the government has net assets or an accumulated surplus. |
| |
| 4 | | After taking the budgetary reserve into account. |
| |
| Sources: | | Ministère des Finances du Québec, the governments’ public accounts and Statistics Canada. |
D.14
The Québec government participates financially in the retirement plans of its employees. As at December 31, 2007, these plans had 531 451 participants and 257 426 beneficiaries.
TABLE D.8
Retirement plans of public and parapublic sector employees as at December 31, 2007
| | | | | | | | | |
| | | Active participants | | | Beneficiaries | |
| Government and Public Employees Retirement Plan (RREGOP) | | | 495 000 | | | | 159 509 | |
| Pension Plan of Management Personnel (PPMP) | | | 26 550 | | | | 18 965 | |
| Other plans: | | | | | | | | |
- Teachers Pension Plan (TPP) and Pension Plan of Certain Teachers (PPCT)1 | | | 510 | | | | 48 694 | |
- Civil Service Superannuation Plan (CSSP)1 | | | 460 | | | | 23 744 | |
| - Superannuation Plan for the Members of the Sûreté du Québec (SPMSQ) | | | 5 200 | | | | 4 393 | |
| - Pension Plan of Peace Officers in Correctional Services (PPPOCS) | | | 3 100 | | | | 1 377 | |
| - Pension Plan of the Judges of the Court of Québec (PPJCQ) | | | 270 | | | | 312 | |
| - Pension Plan for Federal Employees Transferred to Employment with the Gouvernement du Québec (PPFEQ) | | | 240 | | | | 108 | |
| - Pension Plan of the Members of the National Assembly (PPMNA) | | | 121 | | | | 324 | |
| | | | | | | |
| Total for other plans | | | 9 901 | | | | 78 952 | |
| | | | | | | |
TOTAL | | | 531 451 | | | | 257 426 | |
| | | | | | | |
| | | |
| 1 | | These plans have not accepted any new participants since July 1, 1973. |
| |
| Sources: | | Commission administrative des régimes de retraite et d’assurances. |
These plans are defined benefit retirement plans, which means that they guarantee participants a certain level of income upon retirement. Benefits are calculated on the basis of participants’ average income for the best paid years (generally five) and their number of years of service. The pension usually represents 2% of an employee’s average income per year of service, for a maximum of 70%. Benefits are partially indexed to inflation.
D.15
The Commission administrative des régimes de retraite et d’assurances (CARRA) is responsible for administering the retirement plans. In 2008-2009, the government should pay $4 132 million to cover its share of the benefits paid to its retired employees.
| | • | | Retirement plans liability |
In its financial statements, the government discloses the present value of the retirement benefits it will pay to its employees, taking into account the conditions governing their plans, as well as their years of service. This value is called the retirement plans liability.
CARRA performs actuarial valuations of the liability for each retirement plan in conformity with the rules set for the public sector by the Canadian Institute of Actuaries (CIA) and the Canadian Institute of Chartered Accountants (CICA).
As at March 31, 2009, the government’s retirement plans liability should be $64 471 million, an amount that is recognized in the government’s gross debt.
TABLE D.9
Retirement plans liability
(millions of dollars)
| | | | | |
| | | March 31, 2009P | |
| Government and Public Employees Retirement Plan (RREGOP) | | | 32 946 | |
| Pension Plan of Management Personnel (PPMP) | | | 6 380 | |
| Other plans: | | | | |
| - Teachers Pension Plan (TPP) and Pension Plan of Certain Teachers (PPCT) | | | 15 438 | |
| - Civil Service Superannuation Plan (CSSP) | | | 5 025 | |
| - Superannuation Plan for the Members of the Sûreté du Québec (SPMSQ) | | | 3 217 | |
| - Pension Plan of Peace Officers in Correctional Services (PPPOCS) | | | 830 | |
| - Pension Plan of the Judges of the Court of Québec (PPJCQ) | | | 467 | |
| - Pension Plan of the Members of the National Assembly (PPMNA) | | | 168 | |
| | | | |
| Total for other plans | | | 25 145 | |
| | | | |
RETIREMENT PLANS LIABILITY | | | 64 471 | |
| | | | |
D.16
| | • | | Annual retirement plans expenditure |
Every year, the government records its expenditure as an employer with regard to the retirement plans.
In 2008-2009, this expenditure should total $1 979 million. It comprises two components:
| | • | | the net cost of vested benefits, that is, the present value of retirement benefits that employees have accumulated for work performed during the year, i.e. $1 503 million; |
| |
| | • | | the amortization of revisions to the government’s actuarial obligations that arise from the updating of actuarial valuations, for a cost of $476 million. |
TABLE D.10
Retirement plans expenditure
(millions of dollars)
| | | | | |
| | | 2008-2009P | |
| Net cost of vested benefits | | | 1 503 | |
| Amortization of revisions arising from actuarial valuations | | | 476 | |
| | | | |
RETIREMENT PLANS EXPENDITURE | | | 1 979 | |
| | | | |
D.17
| | 1.7 | | Retirement Plans Sinking Fund |
The Retirement Plans Sinking Fund (RPSF) was created in 1993. The RPSF is an asset that can be used to pay the retirement benefits of public and parapublic sector employees.
As at March 31, 2009, the book value of the RPSF should amount to $36 080 million.
TABLE D.11
Change in the Retirement Plans Sinking Fund (RPSF)
(millions of dollars)
| | | | | | | | | | | | | | | | | |
| | | Book value, | | | | | | | Investment | | | Book value, | |
| | | beginning of | | | | | | | income | | | end of | |
| | | year | | | Deposits | | | imputed | | | year | |
| 1993–1994 | | | — | | | | 850 | | | | 4 | | | | 854 | |
| 1994–1995 | | | 854 | | | | — | | | | – 5 | | | | 849 | |
| 1995–1996 | | | 849 | | | | — | | | | 74 | | | | 923 | |
| 1996–1997 | | | 923 | | | | — | | | | 91 | | | | 1 014 | |
| 1997–1998 | | | 1 095 | 1 | | | — | | | | 84 | | | | 1 179 | |
| 1998–1999 | | | 1 179 | | | | 944 | | | | 86 | | | | 2 209 | |
| 1999–2000 | | | 2 209 | | | | 2 612 | | | | 219 | | | | 5 040 | |
| 2000–2001 | | | 5 040 | | | | 1 607 | | | | 412 | | | | 7 059 | |
| 2001–2002 | | | 7 059 | | | | 2 535 | | | | 605 | | | | 10 199 | |
| 2002–2003 | | | 10 199 | | | | 900 | | | | 741 | | | | 11 840 | |
| 2003–2004 | | | 11 840 | | | | 1 502 | | | | 862 | | | | 14 204 | |
| 2004–2005 | | | 14 204 | | | | 3 202 | | | | 927 | | | | 18 333 | |
| 2005–2006 | | | 18 333 | | | | 3 000 | | | | 1 230 | | | | 22 563 | |
| 2006–2007 | | | 22 437 | 1 | | | 3 000 | | | | 1 440 | | | | 26 877 | |
| 2007–2008 | | | 26 877 | | | | 3 000 | | | | 1 887 | | | | 31 764 | |
2008–2009P | | | 31 764 | | | | 2 100 | | | | 2 216 | | | | 36 080 | |
| | | |
| P: | | Preliminary results. |
| |
| 1 | | Taking into account restatements arising from the government accounting reforms of 1997-1998 and 2006-2007. |
D.18
The information on the RPSF shown in the preceding table was established on the basis of the government’s accounting policies, which are in full compliance with generally accepted accounting principles (GAAP) for Canada’s public sector following the reform of government accounting in 2007. The government is obliged to apply its accounting policies in the same way, year after year, in presenting its financial statements.
On the basis of the strict and consistent application of the government’s accounting policies, the book value of the RPSF as at March 31, 2009 is higher than its market value. As a result of the accounting policies, the difference between these two items will be fully amortized in the coming years. In addition, the financial impact of gradually amortizing the difference is fully incorporated in the government’s financial framework over the entire planning horizon. Section 1.11 describes these items in greater detail.
The government’s accounting policies apply when the RPSF’s book value is higher than its market value as well as when it is lower. As shown by the following table, the book value of the RPSF has been lower than its market value 8 times in the past 15 years.
TABLE D.12
Book value and market value of the Retirement Plans Sinking Fund as at March 31
(millions of dollars)
| | | | | | | | | | | | | |
| | | Book value | | | Market value | | | Difference | |
| 1994–1995 | | | 849 | | | | 831 | | | | 18 | |
| 1995–1996 | | | 923 | | | | 954 | | | | - 31 | |
| 1996–1997 | | | 1 014 | | | | 1 095 | | | | - 81 | |
| 1997–1998 | | | 1 179 | | | | 1 321 | | | | - 142 | |
| 1998–1999 | | | 2 209 | | | | 2 356 | | | | - 147 | |
| 1999–2000 | | | 5 040 | | | | 5 703 | | | | - 663 | |
| 2000–2001 | | | 7 059 | | | | 7 052 | | | | 7 | |
| 2001–2002 | | | 10 199 | | | | 9 522 | | | | 677 | |
| 2002–2003 | | | 11 840 | | | | 9 240 | | | | 2 600 | |
| 2003–2004 | | | 14 204 | | | | 12 886 | | | | 1 318 | |
| 2004–2005 | | | 18 333 | | | | 17 362 | | | | 971 | |
| 2005–2006 | | | 22 563 | | | | 23 042 | | | | - 479 | |
| 2006–2007 | | | 26 877 | | | | 28 859 | | | | - 1 982 | |
| 2007–2008 | | | 31 764 | | | | 32 024 | | | | - 260 | |
| 2008–2009 | | | 36 080 | | | | 26 101 | 1 | | | 9 979 | |
| | | |
| 1 | | Market value as at December 31, 2008. |
D.19
| | • | | Amounts deposited in the RPSF have no impact on gross debt |
The government issues bonds on financial markets in order to make deposits in the RPSF. However, the amounts deposited in the RPSF do not affect the government’s gross debt.
Indeed, the amount of borrowings contracted to make deposits in the RPSF increases the direct debt. At the same time, however, these deposits reduce the net retirement plans liability by the same amount. Therefore, the net impact on the gross debt is nil.
TABLE D.13
Illustration of the impact on the government’s gross debt of borrowing $1 billion on financial markets and depositing it in the RPSF1
(millions of dollars)
| | | | | | | | | | | | | | | | |
| | | | | | Before | | | After | | | | |
| | | | | | deposit | | | deposit | | | Change | |
| (A | ) | | Consolidated direct debt | | | 123 865 | | | | 124 865 | | | | 1 000 | |
| | | | Retirement plans liability | | | 64 471 | | | | 64 471 | | | | — | |
| | | | Less: Book value of the RPSF | | | - 35 080 | | | | - 36 080 | | | | - 1 000 | |
| | | | | | | | | | | | | |
| (B | ) | | Net retirement plans liability | | | 29 391 | | | | 28 391 | | | | - 1 000 | |
| (C | ) | | Net employee future benefits liability | | | 125 | | | | 125 | | | | — | |
| (D | ) | | Less: Generations Fund | | | - 1 934 | | | | - 1 934 | | | | — | |
| | | | | | | | | | | | | |
| (E | ) | | GROSS DEBT (E=A+B+C+D) | | | 151 447 | | | | 151 447 | | | | — | |
| | | | | | | | | | | | | |
| | | |
| 1 | | Illustration based on preliminary results as at March 31, 2009. |
D.20
| | • | | A decline in debt service |
Deposits in the RPSF entail a reduction in the government’s debt service. The rates of return on funds managed by the Caisse de dépôt et placement du Québec are generally higher than interest rates on Québec government bonds issued to finance deposits in the RPSF. Therefore, the income of the RPSF, which is applied against the government’s debt service, is usually higher than the additional interest charges that arise from new borrowings. This leads to a net decrease in the government’s debt service.
Since the RPSF was created, its return has been higher than the cost of new long-term borrowings by the government 11 years out of 15.
TABLE D.14
Comparison of the RPSF’s annual return and the Québec government’s borrowing costs
(percent)
| | | | | | | | | | | | | |
| | | Return of the | | | Cost of new | | | | |
| | | RPSF1 | | | borrowings2 | | | Difference | |
| 1994–1995 | | | - 6.0 | | | | 5.9 | | | | - 11.9 | |
| 1995–1996 | | | 17.0 | | | | 5.3 | | | | 11.7 | |
| 1996–1997 | | | 16.1 | | | | 6.3 | | | | 9.8 | |
| 1997–1998 | | | 13.4 | | | | 5.7 | | | | 7.7 | |
| 1998–1999 | | | 10.4 | | | | 5.8 | | | | 4.6 | |
| 1999–2000 | | | 15.3 | | | | 7.2 | | | | 8.1 | |
| 2000–2001 | | | 7.2 | | | | 6.2 | | | | 1.0 | |
| 2001–2002 | | | - 4.7 | | | | 5.5 | | | | - 10.2 | |
| 2002–2003 | | | - 8.5 | | | | 4.7 | | | | - 13.2 | |
| 2003–2004 | | | 14.9 | | | | 4.6 | | | | 10.3 | |
| 2004–2005 | | | 11.4 | | | | 4.4 | | | | 7.0 | |
| 2005–2006 | | | 13.5 | | | | 4.4 | | | | 9.1 | |
| 2006–2007 | | | 13.5 | | | | 4.4 | | | | 9.1 | |
| 2007–2008 | | | 5.2 | | | | 4.8 | | | | 0.4 | |
| 2008–2009 | | | - 25.6 | | | | 4.2 | | | | - 29.8 | |
| | | |
| 1 | | On a calendar year basis. |
| |
| 2 | | On a fiscal year basis. |
D.21
| | • | | A flexible deposit policy |
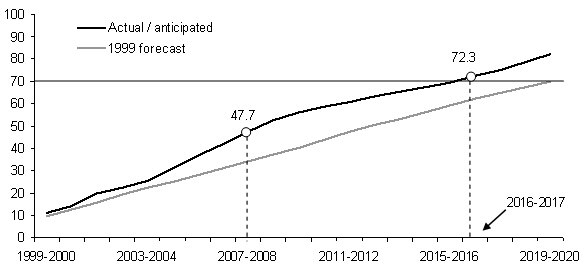
In December 1999, as part of an agreement concluded for the renewal of its employees’ collective agreements, the government set the objective that the funds accumulated in the RPSF would be equal, in 2020, to 70% of its actuarial obligations in regard to the retirement plans of public and parapublic sector employees.
However, the government has all the flexibility needed to apply this policy. Deposits in the RPSF are made only when market conditions are favourable, particularly with respect to interest rates and market receptiveness to bond issues.
The RPSF’s assets represent roughly 50% of the government’s actuarial obligations in regard to the retirement plans of public and parapublic sector employees. The target of 70% should be attained three years earlier than anticipated, i.e. in 2016-2017.
CHART D.2
The RPSF in proportion to the government’s actuarial obligations regarding the retirement plans of public and parapublic sector employees
(percent)
D.22
| | 1.8 | | Employee future benefits |
In addition to the retirement plans, the government records under its debt the value of its commitments regarding two future benefits programs for its employees, namely, accumulated sick leave, which is payable notably when an employee retires, and pensions paid to the survivors of a government employee. These programs give rise to long-term obligations whose costs are covered in full by the government.
As planned, the government created the Accumulated Sick Leave Fund in 2008-2009, in which were deposited sums that will be used to make the necessary payments. Therefore, the balance of the net employee future benefits liability should be $125 million as at March 31, 2009.
TABLE D.15
Net employee future benefits liability
(millions of dollars)
| | | | | |
| | | March 31, 2009P | |
| Accumulated sick leave | | | 781 | |
| Survivor’s pension plan | | | 404 | |
| Accumulated Sick Leave Fund | | | - 616 | |
| Survivor’s Pension Plan Fund | | | - 444 | |
| | | | |
NET EMPLOYEE FUTURE BENEFITS LIABILITY | | | 125 | |
| | | | |
D.23
The Generations Fund was created in June 2006 by the adoption of the Act to reduce the debt and establish the Generations Fund. The sums accumulated in the fund are dedicated exclusively to repaying the debt.
Section I presents the results of the Generations Fund in accordance with the requirements of the Act.
As at March 31, 2009, the book value of the Generations Fund should amount to $1 934 million. The following table shows the book and market values of the Generations Fund for the past three years.
TABLE D.16
Book value and market value of the Generations Fund as at March 31
(millions of dollars)
| | | | | | | | | | | | | |
| | | Book value | | | Market value | | | Difference | |
| 2006–2007 | | | 584 | | | | 586 | | | | - 2 | |
| 2007–2008 | | | 1 233 | | | | 1 199 | | | | 34 | |
| 2008–2009 | | | 1 934 | | | | 1 660 | 1 | | | 274 | |
| | | | | | | | | | |
| | | |
| 1 | | Market value of $1 297 million as at December 31, 2008 plus the amounts that will be allocated to the Generations Fund from January 1 to March 31, 2009. |
D.24
| | 1.10 | | Returns of the Caisse de dépôt et placement du Québec on funds deposited by the ministère des Finances |
In 2008, the return on the net assets of all depositors with the Caisse de dépôt et placement du Québec was - 25.0%. This section describes in greater detail the returns on four funds deposited with the Caisse by the ministère des Finances.
TABLE D.17
Market value and return in 2008 of funds deposited with the Caisse de dépôt et placement by the ministère des Finances
(millions of dollars and percent)
| | | | | | | | | | | | | |
| | | | | | | | | | | Market value | |
| | | | | | | | | | | as at December 31, | |
| Name | | Acronym | | | Return | | | 2008 | |
| | | | | | % | | | $M | |
| Retirement Plans Sinking Fund | | RPSF | | | - 25.58 | | | | 26 101 | |
| Generations Fund | | GF | | | - 22.35 | | | | 1 297 | |
| Accumulated Sick Leave Fund | | ASLF | | | 0.57 | | | | 602 | |
| Budgetary Reserve Fund | | BRF | | | 2.46 | | | | 337 | |
| | | | | | | | | | |
| 1.10.1 | | Retirement Plans Sinking Fund |
The Retirement Plans Sinking Fund (RPSF) showed a return of - 25.58% in 2008. Its market value was $26 101 million as at December 31, 2008.
The assets of the RPSF are managed by the Caisse de dépôt et placement du Québec in accordance with an investment policy established by the ministère des Finances. This investment policy was established taking several factors into account, including the return, standard deviation and correlation forecasts for various categories of assets prepared by the Caisse de dépôt et placement du Québec, as well as opportunities for investing in these assets.
D.25
The investment policy of the RPSF consists of 30% fixed-income securities (bonds, etc.), 35.5% stock markets and 34.5% other investments (real estate, private equity, etc.). These weightings are similar to those used on average by all depositors with the Caisse.
TABLE D.18
Investment policy of the RPSF as at January 1, 20091
(percent)
| | | | | | | | | |
| | | Reference | | | Average reference portfolio of | |
| | | portfolio of the RPSF | | | depositors as a whole2 | |
| Fixed-income securities | | | 30.0 | | | | 32.0 | |
| Stock markets | | | 35.5 | | | | 34.3 | |
| Other investments | | | 34.5 | | | | 33.7 | |
| | | | | | | |
TOTAL | | | 100.0 | | | | 100.0 | |
| | | | | | | |
| | | |
| 1 | | The detailed investment policy, which shows the percentages invested in each of the various asset categories offered by the Caisse, is presented in the additional information section. |
| |
| 2 | | Data for 2007. Source: Caisse de dépôt et placement du Québec, Annual Report 2007. The annual report for 2008 has not been published yet. |
With its investment policy, the RPSF should generate a long-term annual return of 7.0%. This return is comparable to that forecast by most retirement plans in Canada. According to a recent survey by Morneau Sobeco,1 the anticipated long-term return on assets of two retirement plans out of three in Canada is equal to or above 7%.
It is important to note that the RPSF’s investment policy is based on a long-term horizon and constitutes the reference portfolio for the Caisse. However, through active management, the Caisse adjusts the allocation of RPSF’s assets, particularly to take fluctuations in the economic and financial situation into account. The RPSF’s reference portfolio would have generated a return of-19.15% in 2008. The spread between this return and that realized, i.e.-25.58%, reflects the Caisse’s active management.
| | | |
| 1 | | Morneau Sobeco (2008), 2008 Survey of Economic Assumptions in Accounting for Pensions and Other Post-Retirement Benefits. |
D.26
The Generations Fund posted a return of - 22.35% in 2008. As at December 31, 2008, its market value was $1 297 million.
The assets of the Generations Fund are managed by the Caisse de dépôt et placement du Québec in keeping with an investment policy established by the ministère des Finances. This investment policy was established taking several factors into account, including the return, standard deviation and correlation forecasts for various categories of assets prepared by the Caisse de dépôt et placement du Québec, as well as opportunities for investing in these assets.
The investment policy of the Generations Fund consists of 37% fixed-income securities (bonds, etc.), 35% stock markets and 28% other investments (real estate, private equity, etc.).
TABLE D.19
Investment policy of the Generations Fund as at January 1, 20091
(percent)
| | | | | | | | | |
| | | Reference | | | Average reference | |
| | | portfolio of the | | | portfolio of depositors as a | |
| | | Generations Fund | | | whole2 | |
| Fixed-income securities | | | 37.0 | | | | 32.0 | |
| Stock markets | | | 35.0 | | | | 34.3 | |
| Other investments | | | 28.0 | | | | 33.7 | |
| | | | | | | |
TOTAL | | | 100.0 | | | | 100.0 | |
| | | | | | | |
| | | |
| 1 | | The detailed investment policy, which shows the percentages invested in each of the various asset categories offered by the Caisse, is presented in the additional information section. |
| |
| 2 | | Data for 2007. Source: Caisse de dépôt et placement du Québec, Annual Report 2007. The annual report for 2008 has not been published yet. |
The investment policy of the Generations Fund aims to achieve an annual long-term return of 6.8%. It is important to note that the investment policy of the Generations Fund is based on a long-term horizon and constitutes the reference portfolio for the Caisse. However, through active management, the Caisse adjusts the allocation of the Generations Fund’s assets, particularly to take fluctuations in the economic and financial situation into account. The reference portfolio of the Generations Fund would have generated a return of - 17.64% in 2008. The spread between this return and that realized, i.e. - 22.35%, reflects the Caisse’s active management.
D.27
| | |
| 1.10.3 | | Accumulated Sick Leave Fund |
The Accumulated Sick Leave Fund (ASLF) was created in the fall of 2008 following the adoption of Bill 80 by the National Assembly last June. Deposits totalling $600 million were subsequently made and initially placed in short-term investments, which explains the return of 0.57% posted by the ASLF in 2008. Its market value was $602 million as at December 31, 2008.
The assets of the ASLF are managed by the Caisse de dépôt et placement du Québec in keeping with an investment policy established by the ministère des Finances. As of January 1, 2009, the ASLF’s investment policy has been identical to that of the RPSF, since the creation of the ASLF stems from a long-term commitment made by the government in regard to employee future benefits, which is similar to the commitment regarding the retirement plans.
It is important to note that the ASLF’s investment policy constitutes the reference portfolio for the Caisse. However, through active management, the Caisse adjusts the allocation of the ASLF’s assets, particularly to take fluctuations in the economic and financial situation into account.
| | |
| 1.10.4 | | Budgetary Reserve Fund |
The Budgetary Reserve Fund (BRF) consists of budgetary surpluses realized by the government.
The BRF posted a return of 2.46% in 2008. Its market value was $337 million as at December 31, 2008.
Contrary to the three other funds which fall under the responsibility of the ministère des Finances, the BRF by definition has a short-term investment horizon. Consequently, its investment policy consists of 100% short-term investments, whose principal is guaranteed and whose liquidity is high.
D.28
| | 1.11 | | Impact of the return of the Retirement Plans Sinking Fund in 2008 on debt service |
As indicated in section 1.7, the income of the RPSF is applied against the government’s debt service. The losses of the Caisse in 2008 will affect the RPSF’s income and therefore debt service as of 2009-2010.
The impact of the losses of 2008 on the RPSF’s income will be taken into account in the government’s balance sheet and results by applying the accounting policy adopted in the wake of the December 2007 reform of government accounting in accordance with generally accepted accounting principles (GAAP).
“When determining a government’s retirement benefit liability and expense, plan assets would be valued at market-related values. Under this method, plan assets are recorded at market value or they are adjusted to market value over a period not to exceed five years. Values adjusted to market closely approximate current economic value in a manner that can minimize short-term fluctuations. Market-related values would be used because they are objective and verifiable. Once a basis of valuation is chosen it would be applied consistently.” Canadian Institute of Chartered Accountants (CICA), Public Sector Accounting Handbook, section 3250, paragraph .035.
Under the accounting policy, the “adjusted market value” of the RPSF is adjusted every year based on the returns realized by the fund. If, for a given year, the realized return differs from the long-term return, the difference between the two is spread over five years. All other things being equal, this means that the adjusted market value and the market value will converge over a five-year period. It is important to note that this method is applied when returns are higher than expected as well as when they are lower.2
| | | |
| 2 | | Before the accounting reform of 2007, the value of the RPSF was adjusted only once every three years, that is, when actuarial valuations were carried out. Since the reform, it has been adjusted every year. |
D.29
In addition, the differences between actual and expected return, which are spread over five years, are taken into account in RPSF income by amortizing them over a period of about 14 years, that is, the expected average remaining service life (EARSL) of retirement plan participants. This amortization mechanism and the period used are prescribed by GAAP.3
Income imputed to the RPSF is calculated based on the adjusted market value. Therefore, it will begin to reflect, as of 2009-2010, the losses incurred by the Caisse in 2008. This will reduce the income credited to the RPSF because the adjusted market value on which this income is calculated will be lower than if there had not been any losses at the Caisse in 2008.
Overall, the losses of the Caisse in 2008 will cause debt service to rise by $285 million in 2009-2010 and $595 million in 2010-2011.
TABLE D.20
Impact of the return of the RPSF in 2008 on debt service
(millions of dollars)
| | | | | | | | | |
| | | 2009-2010F | | | 2010-2011F | |
| Increase in debt service | | | 285 | | | | 595 | |
| | | | | | | |
| | | |
| 3 | | “...actuarial gains and losses should be amortized to the liability or asset and the related expense in a systematic and rational manner over the expected average remaining service life of the related employee group.” Canadian Institute of Chartered Accountants (CICA), Public Sector Accounting Handbook, section 3250, paragraph .062. For the purposes of retirement assets, the CICA defines actuarial gains (losses) as changes in the value of plan assets that are caused notably by variances between actual results and expected results. |
D.30
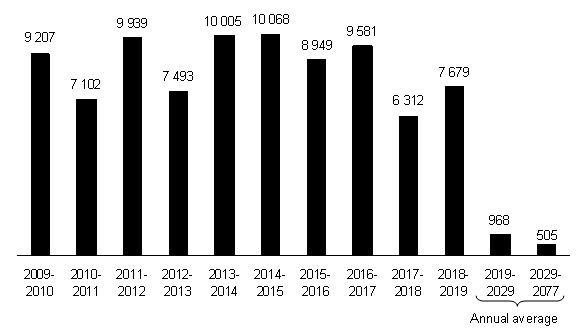
Borrowings in fiscal 2008-2009 should total $12 941 million, i.e. $9 227 million for the Consolidated Revenue Fund, $1 039 million for the Financing Fund and $2 675 million for Financement-Québec.
It should be noted that pre-financing of $5 984 million was carried out in the last few months of the fiscal year. It will be used to cover part of the borrowing program in 2009-2010.
The government aims to borrow at the lowest possible cost. To that end, it applies a strategy for diversifying sources of funding by market, financial instrument and maturity.
| | 2.1.1 | | Diversification by market |
Financing transactions are conducted regularly on most markets, i.e. in Canada, the United States, Europe and Asia.
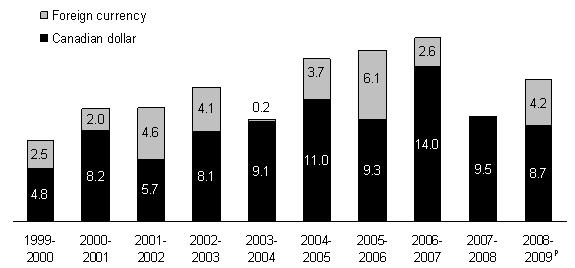
Over the past 10 years, one quarter of borrowings, on average, has been contracted in foreign currency.
In 2008-2009, the government contracted 32.6% of its borrowings on foreign markets in five different currencies:
| | | | |
| | • | | one borrowing for 1 250 million euros (CAN$1 975 million) in April 2008; |
| | | |
| | • | | one borrowing for 1 000 million US dollars (CAN$996 million) in May 2008; |
| | | |
| | • | | five borrowings in Swiss francs totalling 1 050 million Swiss francs (CAN$1 091 million), one of which was contracted in May 2008, another in November 2008 and three in February 2009; |
| | | |
| | • | | one borrowing for 5 000 million yen (CAN$48 million) in August 2008; |
| | | |
| | • | | two borrowings totalling 712 million Hong-Kong dollars, one of which was contracted in January 2009 (CAN$38 million) and the other in February 2009 (CAN$76 million). |
D.31
CHART D.3
History of borrowings by currency1
(billions)
| | | |
| P: | | Preliminary results. |
| |
| 1 | | Borrowings of the Consolidated Revenue Fund, borrowings for the Financing Fund and borrowings of Financement-Québec. |
| 2.1.2 | | Diversification by instrument |
To satisfy investors’ needs, an extensive array of financial products is used in the course of financing transactions.
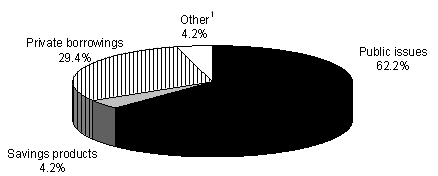
Long-term instruments consist primarily of public bond issues, private borrowings and savings products.
The long-term instruments used in 2008-2009 consisted mainly of public issues (62.2%) and private issues (29.4%).
D.32
CHART D.4
Borrowings in 2008-2009P by instrument
| | | |
| P: | | Preliminary results. |
| |
| 1 | | Includes the Immigrant Investor Program and borrowings from the Canada Pension Plan Investment Fund. |
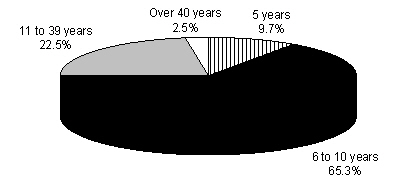
| | 2.1.3 | | Diversification by maturity |
Maturities of new borrowings are distributed over time to obtain a stable refinancing profile and thus ensure the government’s regular and constant presence on capital markets.
In 2008-2009, 65.3% of borrowings contracted had a maturity of 6 to 10 years; 22.5%, 11 to 39 years; and 2.5%, over 40 years.
CHART D.5
Borrowings in 2008-2009P by maturity
D.33
This diversification by maturity has an impact on the maturity of the debt shown in the following chart. As at March 31, 2009, the average maturity of the debt should be 10.9 years.
CHART D.6
Maturity of the debt as at March 31, 2009P
(millions of dollars)
| | | |
| P: | | Preliminary results. |
| |
| Note: | | Direct debt of the Consolidated Revenue Fund, debt incurred to make advances to the Financing Fund and debt of Financement-Québec. |
The financing program of the Consolidated Revenue Fund makes it possible to refinance maturing borrowings, contribute to the Retirement Plans Sinking Fund and meet new financial requirements, particularly for capital investments and investments in government corporations.
The Financing Fund makes loans to consolidated organizations (e.g. Fonds de conservation et d’amélioration du réseau routier, Investissement Québec, Société immobilière du Québec, Corporation d’hébergement du Québec) and to certain government enterprises.
Financement-Québec makes borrowings on financial markets to meet the needs of institutions in the health and social services and education networks.
D.34
In 2008-2009, the government contracted borrowings totalling $12 941 million, including $5 984 million in pre-financing conducted over the last few months of the year.
In 2009-2010, the financing program is expected to amount to $9 778 million. It would have amounted to $15 762 million had there not been any pre-financing in 2008-2009. In 2010-2011, the financing program will total $15 353 million.
TABLE D.21
The government’s financing program
(millions of dollars)
| | | | | | | | | | | | | |
| | | 2008-2009P | | | 2009-2010P | | | 2010-2011P | |
CONSOLIDATED REVENUE FUND | | | | | | | | | | | | |
Net financial requirements (surplus)1, 2 | | | - 57 | | | | 5 017 | | | | 5 040 | |
| Repayment of borrowings | | | 4 571 | | | | 5 245 | | | | 3 813 | |
| Change in cash position | | | - 2 413 | | | | - 5 984 | | | | — | |
| Retirement Plans Sinking Fund and funds dedicated to employee future benefits — Deposits | | | 2 700 | | | | — | | | | — | |
Transactions under the credit policy3 | | | - 1 558 | | | | — | | | | — | |
| Pre-financing | | | 5 984 | | | | — | | | | — | |
| | | | | | | | | | |
TOTAL — Consolidated Revenue Fund | | | 9 227 | | | | 4 278 | | | | 8 853 | |
FINANCING FUND | | | 1 039 | | | | 2 750 | | | | 3 750 | |
FINANCEMENT-QUÉBEC | | | 2 675 | | | | 2 750 | | | | 2 750 | |
| | | | | | | | | | |
TOTAL | | | 12 941 | | | | 9 778 | | | | 15 353 | |
| | | | | | | | | | |
| | | |
| P: | | Preliminary results for 2008-2009 and forecasts for subsequent years. |
| |
| Note: | | A negative entry indicates a source of financing and a positive entry, a financial requirement. |
| |
| 1 | | Excluding consolidated entities. |
| |
| 2 | | Net financial requirements are adjusted to take into account the non-receipt of RPSF income and of funds dedicated to employee future benefits. |
| |
| 3 | | Under its credit policy, which is designed to limit financial risk with respect to counterparties, the government received $1 558 million in 2008-2009 following exchange rate movements. These receipts reduce financial requirements that have to be met through new borrowings. |
D.35
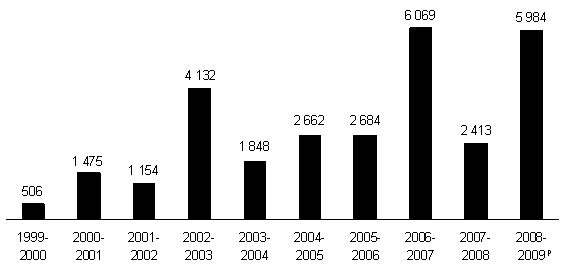
Pre-financing
The government makes advance borrowings, or borrowings that would normally be made in the following fiscal year.
Over the past 10 years, the government has obtained an average of nearly $2.9 billion in pre-financing per year.
Pre-financing
(millions of dollars)
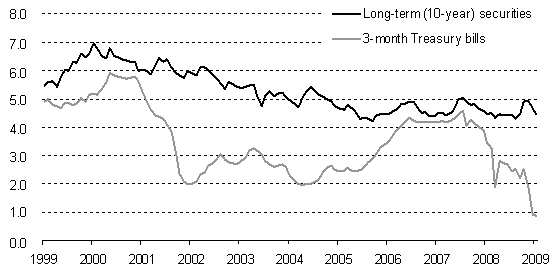
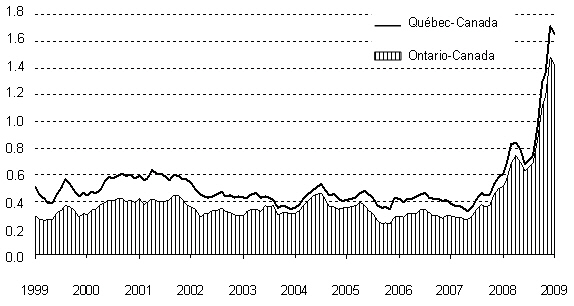
The following charts show the change in yield on 10-year bonds and 3-month Treasury bills, as well as the yield spread on long-term securities.
Over the past year, the spread between Québec long-term and short-term yields has increased substantially, reflecting the change in market conditions observed on financial markets. In addition, since the early 2000s, the yield on long-term Québec securities has dropped from 6.9% to 4.5%, making it possible to refinance borrowings at better interest rates.
D.36
CHART D.7
Yield on Québec securities
(percent)
| | | |
| Sources: | | PC-Bond, a business unit of TSX Inc., and ministère des Finances du Québec. |
CHART D.8
Yield spread on long-term (10-year) securities
(percent)
| | | |
| Source: | | PC-Bond, a business unit of TSX Inc. |
D.37
[This page intentionally left blank.]
D.38
| 3. | | Debt management |
| |
| | | The government’s debt management strategy aims to minimize the cost of the debt and limit the risk related to fluctuations in foreign exchange and interest rates. |
| |
| | | The government uses a range of financial instruments, particularly interest rate and currency swap agreements, to achieve desired debt proportions by currency and interest rate. |
| |
| | | Debt management enables the government to save money on debt service. |
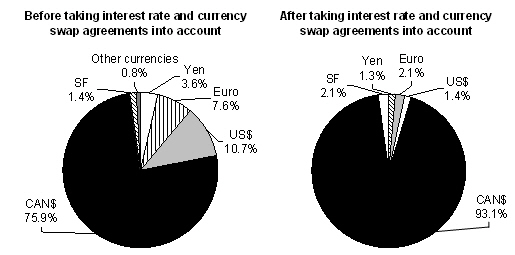
| | 3.1 | | Structure of the debt by currency |
| | | As at March 31, 2009, the proportion of the government’s gross debt in Canadian dollars should amount to 93.1% and the proportion in foreign currency, 6.9%. |
TABLE D.22
Structure of the gross debt as at March 31, 2009P
(millions of dollars)
| | | | | | | | | | | | | | | | | | | | | | | | | | | | | | | | | | | | | | | | | |
| | | | | | | | | | | | | | | | | | | | | | | | | | | Net | | | | | | | | | | |
| | | Consolidated direct debt | | | Net | | | employee | | | | | | | | | | |
| | | Consolidated | | | | | | | | | | | | | | | | | | | retirement | | | future | | | Less: | | | | | | | |
| | | Revenue | | | | | | | Consolidated | | | | | | | | | | | plans | | | benefits | | | Generations | | | Gross | | | | |
| Currency | | Fund | | | % | | | entities | | | Total | | | % | | | liability | | | liability | | | Fund | | | debt | | | % | |
| Canadian dollar | | | 82 083 | | | | 88.3 | | | | 37 924 | | | | 120 007 | | | | 91.7 | | | | 28 391 | | | | 125 | | | | - 1 934 | | | | 146 589 | | | | 93.1 | |
| US dollar | | | 2 315 | | | | 2.5 | | | | — | | | | 2 315 | | | | 1.7 | | | | — | | | | — | | | | — | | | | 2 315 | | | | 1.4 | |
| Euro | | | 3 226 | | | | 3.5 | | | | — | | | | 3 226 | | | | 2.5 | | | | — | | | | — | | | | — | | | | 3 226 | | | | 2.1 | |
| Swiss franc | | | 3 226 | | | | 3.5 | | | | — | | | | 3 226 | | | | 2.5 | | | | — | | | | — | | | | — | | | | 3 226 | | | | 2.1 | |
| Yen | | | 2 075 | | | | 2.2 | | | | — | | | | 2 075 | | | | 1.6 | | | | — | | | | — | | | | — | | | | 2 075 | | | | 1.3 | |
| | | | | | | | | | | | | | | | | | | | | | | | | | | | | | | |
Subtotal | | | 92 925 | | | | 100.0 | | | | 37 924 | | | | 130 849 | | | | 100.0 | | | | 28 391 | | | | 125 | | | | - 1 934 | | | | 157 431 | | | | 100.0 | |
| Pre-financing | | | - 5 984 | | | | | | | | — | | | | - 5 984 | | | | | | | | — | | | | — | | | | — | | | | - 5 984 | | | | | |
| | | | | | | | | | | | | | | | | | | | | | | | | | | | | | | | | | |
TOTAL | | | 86 941 | | | | | | | | 37 924 | | | | 124 865 | | | | | | | | 28 391 | | | | 125 | | | | - 1 934 | | | | 151 447 | | | | | |
| | | | | | | | | | | | | | | | | | | | | | | | | | | | | | | | | | |
| | | |
| P: | | Preliminary results. |
| |
| Note: | | The debt in foreign currency is expressed in the Canadian equivalent based on the exchange rates in effect on March 12, 2009. |
D.39
Before interest rate and currency swap agreements are taken into account, the proportion of the debt in foreign currency as at March 31, 2009 should be 24.1%. After interest rate and currency swap agreements are taken into account, the proportion should be 6.9%.
CHART D.9
Structure of the gross debt by currency as at March 31, 2009P
D.40
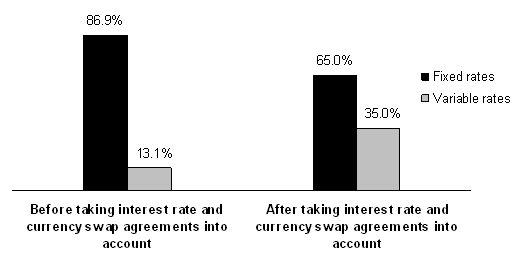
| | 3.2 | | Structure of the debt by interest rate |
The government keeps part of its debt at variable rates and part at fixed rates. Since short-term interest rates are generally lower than long-term rates, keeping part of the debt at variable rates makes it possible to achieve substantial savings on debt service.
Before interest rate and currency swap agreements are taken into account, the proportion of the gross debt at variable rates should be 13.1% as at March 31, 2009. After interest rate and currency swap agreements are taken into account, the proportion should be 35.0%.
CHART D.10
Structure of the gross debt by interest rate as at March 31, 2009P
D.41
[This page intentionally left blank.]
D.42
| | 4.1 | | The Québec government’s credit rating |
A borrower’s credit rating measures its capacity to pay the interest on its debt and repay the principal at maturity. To establish the credit rating of a borrower like the Québec government, credit rating agencies analyze several economic, fiscal and financial factors. Among the main factors are the size, structure and vitality of the economy, the situation on the labour market, fiscal competitiveness, public finance situation and indebtedness.
To express the quality of a borrower’s credit, credit rating agencies use rating scales, namely, a scale for short-term debt and a scale for long-term debt.
The following table shows the rating scales used by agencies for short-term debt. Québec’s credit rating is in the upper category of all of the agencies’ rating scales.
TABLE D.23
Rating scales for short-term debt
| | | | | | | | | |
| | | | | Standard & | | Fitch | | |
| Definition | | Moody’s | | Poor’s | | Ratings | | DBRS |
Very strong capacity to pay interest and repay principal over the short term. | | P-1 | | A-1+ | | F1+ | | R-1high |
| | | | A-1 | | F1 | | R-1middle |
| | | | | | | | R-1low |
| |
Very adequate capacity to pay interest and repay principal over the short term, despite greater sensitivity to economic conditions than the upper level. | | P-2 | | A-2 | | F2 | | R-2high |
| |
Adequate capacity to pay interest and repay principal over the short term. Difficult economic conditions may reduce this capacity. | | P-3 | | A-3 | | F3 | | R-2middle |
| | | | | | | R-2low |
| | | | | | | R-3 |
| |
Uncertain capacity to pay interest and repay principal over the short-term. Securities in this category are considered speculative securities. | | Not Prime1 | | B-1 | | B | | R-4 |
| | | | B-2 | | C | | R-5 |
| | | | B-3 | | | | |
| | | | C | | | | |
| |
Incapacity to pay interest and repay principal over the short-term. Securities in this category are considered default securities. | | Not Prime1 | | D | | D | | D |
| | | |
| Note: | | The credit ratings for Québec’s short-term debt are identified in bold. |
| |
| 1 | | Moody’s uses the “Not Prime” category for all securities not shown in the upper categories. |
D.43
Credit rating agencies also use standard rating scales to assess the long-term debt of borrowers. For example, an “AA” credit rating means that the borrower has a very strong capacity to pay the interest and repay the principal on its long-term debt.
TABLE D.24
Rating scales for long-term debt
| | | | | | | | | | | | | | | | | | | | | |
| | | | | | | | | | | | | | | | | | | Japan Credit | |
| | | | | | | Standard & | | | | | | | | | | | Rating | |
| Definition | | Moody’s | | | Poor’s | | | Fitch Ratings | | | DBRS | | | Agency | |
Extremely strong capacity to pay interest and repay principal. | | Aaa | | AAA | | AAA | | AAA | | AAA |
| |
Very strong capacity to pay interest and repay principal. | | Aa1 | | AA+ | | AA+ | | AA (high) | | AA+ |
| | Aa2 | | AA | | AA | | AA | | AA |
| | Aa3 | | AA- | | AA- | | AA (low) | | AA- |
| |
Strong capacity to pay interest and repay principal, despite greater sensitivity to economic conditions than levels AAA and AA. | | | A1 | | | | A+ | | | | A+ | | | A (high) | | | A+ | |
| | | A2 | | | | A | | | | A | | | | A | | | | A | |
| | | A3 | | | | A- | | | | A- | | | A (low) | | | A- | |
| | | | | | | | | | | | | | | | | | | | |
| |
Adequate capacity to pay interest and repay principal. Difficult economic conditions may reduce this capacity. | | Baa1 | | BBB+ | | BBB+ | | BBB (high) | | BBB+ |
| | Baa2 | | BBB | | BBB | | BBB | | BBB |
| | Baa3 | | BBB- | | BBB- | | BBB (low) | | BBB- |
| |
Uncertain capacity to pay interest and repay principal, particularly under difficult economic conditions. | | Ba1 | | BB+ | | BB+ | | BB (high) | | BB+ |
| | | Ba2 | | | | BB | | | | BB | | | | BB | | | | BB | |
| | | Ba3 | | | BB- | | | | BB- | | | | BB (low) | | | | BB- | |
| |
Very uncertain capacity to pay interest and repay principal, particularly under difficult economic conditions. | | | B1 | | | | B+ | | | | B+ | | | B (high) | | | B+ | |
| | | B2 | | | | B | | | | B | | | | B | | | | B | |
| | | B3 | | | | B- | | | | B- | | | B (low) | | | B- | |
| | | |
| Note: | | The credit ratings for Québec’s long-term debt are identified in bold. |
Agencies add an “outlook” to the rating that indicates the trend the credit rating may follow in the future. The outlook may be positive, stable or negative.
D.44
| | • | | The Québec government’s credit rating |
The Québec government is rated by five credit rating agencies.
TABLE D.25
The Québec government’s current credit ratings
| | | | | | | | | |
| Agency | | Rating | | | Outlook | |
| Moody’s | | Aa2 | | Stable |
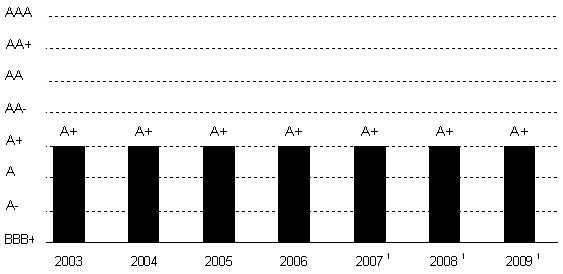
| Standard & Poor’s (S&P) | | A+ | | Positive |
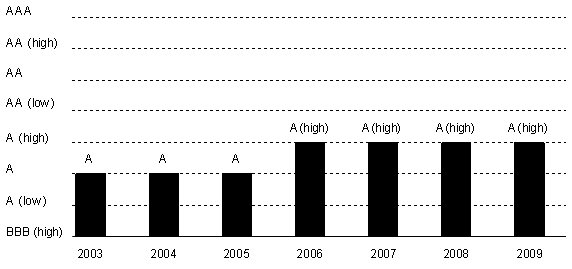
| Dominion Bond Rating Service (DBRS) | | A (high) | | Stable |
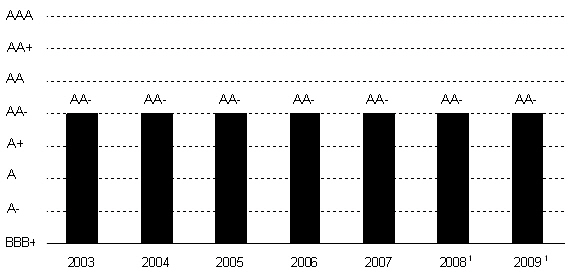
| Fitch Ratings (Fitch) | | AA– | | Positive |
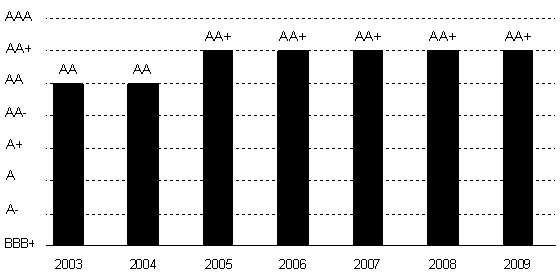
| Japan Credit Rating Agency (JCR) | | AA+ | | Stable |
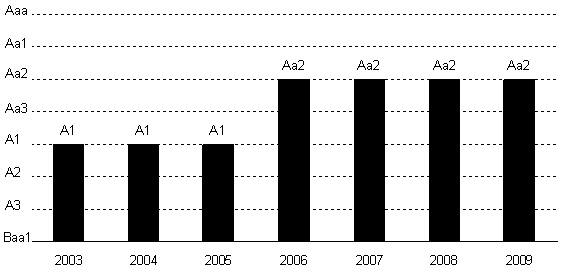
| | • | | Change in Québec’s credit rating |
The following charts show the change in the Québec government’s credit rating in the last six years.
CHART D.11
Credit rating assigned to Québec by Moody’s
D.45
CHART D.12
Credit rating assigned to Québec by Standard & Poor’s
| | | |
| 1 | | A positive outlook has been assigned since July 5, 2007. |
CHART D.13
Credit rating assigned to Québec by DBRS
D.46
CHART D.14
Credit rating assigned to Québec by Fitch
| | | |
| 1 | | A positive outlook has been assigned since January 9, 2008. |
CHART D.15
Credit rating assigned to Québec by JCR
D.47
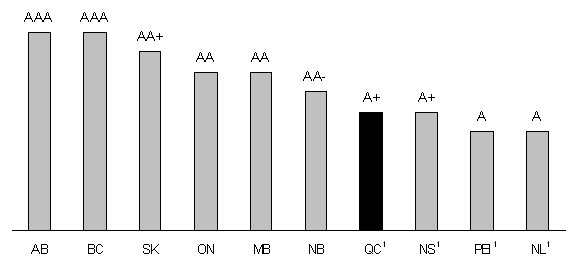
| | 4.2 | | Comparison of the credit ratings of Canadian provinces |
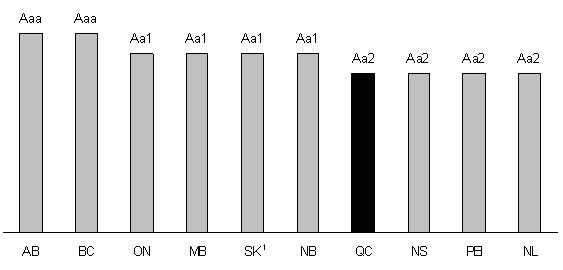
The following charts show the credit ratings of Canadian provinces in early March 2009. No chart is given for JCR since Québec is the only province that receives a credit rating from that agency.
CHART D.16
Credit ratings of Canadian provinces — Moody’s
CHART D.17
Credit ratings of Canadian provinces — Standard & Poor’s
D.48
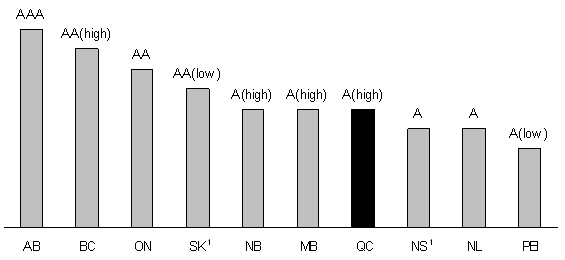
CHART D.18
Credit ratings of Canadian provinces — DBRS
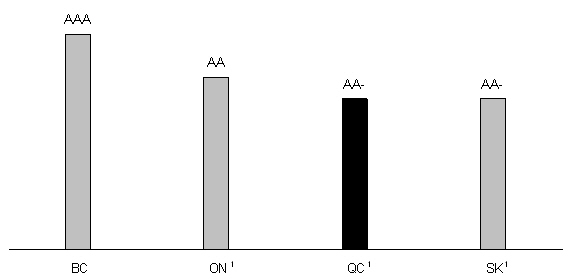
CHART D.19
Credit ratings of Canadian provinces — Fitch
| | | |
| Note: | | British Columbia, Ontario, Saskatchewan and Québec are the only provinces rated by this agency. |
| |
| 1 | | Positive outlook. |
D.49
[This page intentionally left blank.]
D.50
| 5. | | Additional information |
TABLE D.26
Summary of consolidated financing transactions
(millions of dollars)
| | | | | | | | | | | | | | | | | | | | | |
| | | 2008-2009P | | | | | | | |
| | | March 2008 | | | Preliminary | | | | | | | | | | |
| | | Budget | | | results | | | Change | | | 2009-2010P | | | 2010-2011P | |
CHANGE IN CASH POSITION | | | | | | | | | | | | | | | | | | | | |
| Consolidated Revenue Fund | | | 1 987 | | | | - 3 571 | | | | - 5 558 | | | | 5 984 | | | | — | |
| Consolidated entities | | | — | | | | 977 | | | | 977 | | | | — | | | | — | |
| | | | | | | | | | | | | | | | |
TOTAL — Change in cash position | | | 1 987 | | | | - 2 594 | | | | - 4 581 | | | | 5 984 | | | | — | |
| | | | | | | | | | | | | | | | |
Net borrowings | | | | | | | | | | | | | | | | | | | | |
| Consolidated Revenue Fund | | | | | | | | | | | | | | | | | | | | |
| New borrowings | | | 6 612 | | | | 10 075 | 1 | | | 3 463 | | | | 4 278 | | | | 8 853 | |
| Repayment of borrowings | | | - 4 316 | | | | - 3 861 | 1 | | | 455 | | | | - 5 245 | | | | - 3 813 | |
| | | | | | | | | | | | | | | | |
| | | | 2 296 | | | | 6 214 | | | | 3 918 | | | | - 967 | | | | 5 040 | |
| | | | | | | | | | | | | | | | | | | | | |
Consolidated entities2 | | | | | | | | | | | | | | | | | | | | |
| New borrowings | | | 5 339 | | | | 4 802 | 3 | | | - 537 | | | | 7 082 | | | | 7 614 | |
| Repayment of borrowings | | | - 2 265 | | | | - 2 652 | | | | - 387 | | | | - 2 893 | | | | - 2 144 | |
| | | | | | | | | | | | | | | | |
| | | | 3 074 | | | | 2 150 | | | | - 924 | | | | 4 189 | | | | 5 470 | |
| | | | | | | | | | | | | | | | |
TOTAL — Net borrowings | | | 5 370 | | | | 8 364 | | | | 2 994 | | | | 3 222 | | | | 10 510 | |
| | | | | | | | | | | | | | | | |
Retirement Plans Sinking Fund and funds dedicated to employee future benefits | | | - 5 883 | | | | - 4 943 | | | | 940 | | | | - 2 217 | | | | - 2 040 | |
| | | | | | | | | | | | | | | | |
Generations Fund | | | - 742 | | | | - 701 | | | | 41 | | | | - 715 | | | | - 880 | |
| | | | | | | | | | | | | | | | |
TOTAL CONSOLIDATED FINANCING TRANSACTIONS | | | 732 | | | | 126 | | | | - 606 | | | | 6 274 | | | | 7 590 | |
| | | | | | | | | | | | | | | | |
| | | |
| P: | | Preliminary results for 2008-2009 and forecasts for subsequent years. |
| |
| Note: | | A negative entry indicates a financial requirement and a positive entry, a source of financing. For the change in cash position, a negative entry indicates an increase and a positive entry, a decrease. |
| |
| 1 | | Receipts totalling $1 558 million related to transactions carried out under the credit policy increase new borrowings by $848 million and reduce the repayment of borrowings by $710 million. |
| |
| 2 | | The data forecast in the March 2008 Budget have been adjusted to include the forecast for the net borrowings of Immobilière SHQ which was consolidated in 2007-2008. |
| |
| 3 | | Includes a $1 088-million increase in temporary borrowings. |
D.51
TABLE D.27
Gouvernement du Québec
Summary of long-term borrowings in 2008-2009P
(millions of dollars)
| | | | | | | | | | | | | | | | | |
| | | Consolidated | | | Consolidated | | | | | | | |
| Currency | | Revenue Fund | | | entities1 | | | Total | | | % | |
CANADIAN DOLLAR | | | | | | | | | | | | | | | | |
| Public issues | | | 1 939 | | | | 2 047 | | | | 3 986 | | | | 45.7 | |
| Private issues | | | 1 971 | | | | 1 667 | | | | 3 638 | | | | 41.7 | |
| Savings products | | | 548 | | | | — | | | | 548 | | | | 6.3 | |
| Immigrant Investor Program | | | 540 | | | | — | | | | 540 | | | | 6.2 | |
| Canada Pension Plan Investment Fund | | | 5 | | | | — | | | | 5 | | | | 0.1 | |
| | | | | | | | | | | | | |
Subtotal | | | 5 003 | | | | 3 714 | | | | 8 717 | | | | 67.4 | |
OTHER CURRENCIES | | | | | | | | | | | | | | | | |
| Euro | | | 1 975 | | | | — | | | | 1 975 | | | | 46.8 | |
| Swiss franc | | | 1 091 | | | | — | | | | 1 091 | | | | 25.8 | |
| US dollar | | | 996 | | | | — | | | | 996 | | | | 23.6 | |
| Hong-Kong dollar | | | 114 | | | | — | | | | 114 | | | | 2.7 | |
| Yen | | | 48 | | | | — | | | | 48 | | | | 1.1 | |
| | | | | | | | | | | | | |
Subtotal | | | 4 224 | | | | — | | | | 4 224 | | | | 32.6 | |
| | | | | | | | | | | | | |
TOTAL | | | 9 227 | | | | 3 714 | | | | 12 941 | | | | 100.0 | |
| | | | | | | | | | | | | |
| | | |
| P: | | Preliminary results. |
| |
| 1 | | Includes borrowings for the Financing Fund and borrowings of Financement-Québec. |
D.52
TABLE D.28
Gouvernement du Québec
Borrowings for the Consolidated Revenue Fund in 2008-2009P
| | | | | | | | | | | | | | | | | | | | | | | | | | | |
| Amount in | | | Face value | | | | | | | | | | | | | | | |
| Canadian | | | in foreign | | | Interest | | | Date of | | Date of | | | Price to | | | Yield to | |
| dollars1 | | | currency | | | rate2 | | | issue | | maturity | | | investor | | | investor3 | |
| (millions) | | | % | | | | | | | | | | | $ | | | % | |
| | 511 | | | | — | | | | 5.00 | | | April 7 | | | 2038-12-01 | | | | 102.117 | | | | 4.866 | |
| | 1 975 | | | | €1 250 | | | | 4.75 | 4 | | April 29 | | | 2018-04-29 | | | | 99.922 | | | | 4.760 | |
| | 338 | | | | — | | | | 4.50 | | | May 1 | | | 2018-12-01 | | | | 98.680 | | | | 4.659 | |
| | 996 | | | | US$1 000 | | | | 4.625 | | | May 14 | | | 2018-05-14 | | | | 99.399 | | | | 4.701 | |
| | 237 | | | 250 SF | | | | 3.375 | 4 | | May 19 | | | 2018-01-19 | | | | 99.351 | | | | 3.457 | |
| | 452 | | | | — | | | | 5.00 | | | June 16 | | | 2038-12-01 | | | | 101.301 | | | | 4.917 | |
| | 529 | 5 | | | — | | | | 1.797 | 6 | | June 20 | | | 2028-01-01 | | | | 100.000 | | | | 1.797 | |
| | 48 | 5 | | 5 000 yen | | | | 1.80 | | | August 20 | | | 2018-08-20 | | | | 100.000 | | | | 1.800 | |
| | 30 | 5 | | | — | | | | 6.35 | | | October 15 | | | 2065-09-21 | | | | 120.022 | | | | 5.242 | |
| | 118 | 5 | | | — | | | | 4.50 | | | November 4 | | | 2026-12-01 | | | | 114.877 | | | | 3.392 | |
| | 118 | 5 | | | — | | | | 4.25 | | | November 4 | | | 2031-12-01 | | | | 115.258 | | | | 3.300 | |
| | 160 | 5 | | | — | | | | 3.25 | | | November 4 | | | 2036-12-01 | | | | 99.182 | | | | 3.295 | |
| | 89 | 5 | | | — | | | | 4.50 | | | November 19 | | | 2026-12-01 | | | | 114.848 | | | | 3.394 | |
| | 84 | 5 | | | — | | | | 4.25 | | | November 19 | | | 2031-12-01 | | | | 115.223 | | | | 3.302 | |
| | 160 | 5 | | | — | | | | 3.25 | | | November 19 | | | 2036-12-01 | | | | 99.145 | | | | 3.297 | |
| | 263 | | | 250 SF | | | | 3.50 | 4 | | November 21 | | | 2014-11-21 | | | | 99.930 | | | | 3.513 | |
| | 3 | 5 | | | — | | | | 5.10 | | | December 1 | | | 2049-09-21 | | | | 99.025 | | | | 5.157 | |
| | 12 | 5 | | | — | | | | 5.10 | | | December 1 | | | 2053-09-21 | | | | 99.416 | | | | 5.133 | |
| | 10 | 5 | | | — | | | | 5.10 | | | December 1 | | | 2057-09-21 | | | | 99.831 | | | | 5.109 | |
| | 8 | 5 | | | — | | | | 5.10 | | | December 1 | | | 2058-09-21 | | | | 99.938 | | | | 5.103 | |
| | 6 | 5 | | | — | | | | 5.10 | | | December 1 | | | 2059-09-21 | | | | 100.047 | | | | 5.097 | |
| | 100 | 5 | | | — | | | | 3.25 | | | December 15 | | | 2036-12-01 | | | | 96.915 | | | | 3.422 | |
| | 117 | 5 | | | — | | | | 4.50 | | | December 16 | | | 2021-12-01 | | | | 109.037 | | | | 3.620 | |
| | 173 | 5 | | | — | | | | 4.25 | | | December 16 | | | 2031-12-01 | | | | 111.952 | | | | 3.489 | |
| | 492 | | | | — | | | | 4.50 | | | December 19 | | | 2018-12-01 | | | | 98.313 | | | | 4.714 | |
| | 38 | 5 | | HK$240 | | | | 3.35 | 4 | | January 13 | | | 2014-01-13 | | | | 100.000 | | | | 3.350 | |
| | 146 | | | | — | | | | 4.50 | | | February 3 | | | 2018-12-01 | | | | 99.664 | | | | 4.542 | |
| | 76 | 5 | | HK$472 | | | | 3.00 | 4 | | February 11 | | | 2014-02-11 | | | | 100.000 | | | | 3.000 | |
| | 293 | | | 275 SF | | | | 3.125 | 4 | | February 11 | | | 2015-12-11 | | | | 99.414 | | | | 3.223 | |
| | 215 | | | 200 SF | | | | 3.875 | 4 | | February 11 | | | 2018-12-11 | | | | 100.265 | | | | 3.843 | |
| | 25 | 5 | | | — | | | | 5.00 | | | February 11 | | | 2061-09-21 | | | | 100.609 | | | | 4.967 | |
| | 83 | | | 75 SF | | | | 3.125 | 4 | | February 27 | | | 2015-12-11 | | | | 101.883 | | | | 2.817 | |
| | 229 | 5 | | | — | | | Various | | | March 2 | | | 2065-06-01 | | | | 97.408 | | | | 4.513 | |
| | 548 | 7 | | | — | | | Various | | | Various | | | Various | | | Various | | | Various | |
| | 5 | 8 | | | — | | | Various | | | Various | | | Various | | | Various | | | Various | |
| | 540 | 9 | | | — | | | Various | | | Various | | | Various | | | Various | | | Various | |
| | | | | | | | | | | | | | | | | | | | | | | | | |
| | 9 227 | | | | | | | | | | | | | | | | | | | | | | | | | |
| | | | | | | | | | | | | | | | | | | | | | | | | |
| | | |
| P: | | Preliminary results. |
| |
| 1 | | Borrowings in foreign currency given in Canadian equivalent of their value on the date of borrowing. |
| |
| 2 | | Interest payable semi-annually except if another frequency is indicated in a note. |
| |
| 3 | | Yield to investor is determined on the basis of interest payable semi-annually. |
| |
| 4 | | Interest payable annually. |
| |
| 5 | | Private borrowings. |
| |
| 6 | | Interest payable quarterly. |
| |
| 7 | | Savings products issued by Épargne Placements Québec. |
| |
| 8 | | Borrowings from the Canada Pension Plan Investment Fund. |
| |
| 9 | | Immigrant investor Program. |
D.53
TABLE D.29
Gouvernement du Québec
Borrowings for the Financing Fund in 2008-2009P
| | | | | | | | | | | | | | | | | | | | | | | | | | | |
| Amount in | | | Face value | | | | | | | | | | | | | | | | |
| Canadian | | | in foreign | | | Interest | | | Date of | | | Date of | | | Price to | | | Yield to | |
| dollars | | | currency | | | rate1 | | | issue | | | maturity | | | investor | | | investor2 | |
| (millions) | | | % | | | | | | | | | | | $ | | | % | |
| BORROWINGS FOR CONSOLIDATED ENTITIES | | | | | | | |
| | 155 | | | | — | | | | 4.50 | | | May 1 | | | | 2018-12-01 | | | | 98.680 | | | | 4.659 | |
| | 55 | | | | — | | | | 5.00 | | | June 16 | | | | 2038-12-01 | | | | 101.301 | | | | 4.917 | |
| | 477 | | | | — | | | | 4.50 | | | October 31 | | | | 2018-12-01 | | | | 95.379 | | | | 5.091 | |
| | 352 | | | | — | | | | 4.50 | | | February 3 | | | | 2018-12-01 | | | | 99.664 | | | | 4.542 | |
| | | | | | | | | | | | | | | | | | | | |
| | 1 039 | | | | | | | | | | | | | | | | | | | | | | | | | |
| | | | | | | | | | | | | | | | | | | | |
| | | |
| P: | | Preliminary results. |
| |
| 1 | | Interest payable semi-annually except if another frequency is indicated in a note. |
| |
| 2 | | Yield to investor is determined on the basis of interest payable semi-annually. |
D.54
TABLE D.30
Borrowings by Financement-Québec in 2008-2009P
| | | | | | | | | | | | | | | | | | | | | | | | | | | |
| Amount in | | | Face value | | | | | | | | | | | | | | | | |
| Canadian | | | in foreign | | | Interest | | | Date of | | Date of | | | Price to | | | Yield to | |
| dollars | | | currency | | | rate1 | | | issue | | maturity | | | investor | | | investor2 | |
| (millions) | | | % | | | | | | | | | | | $ | | | % | |
| | 63 | 3 | | | — | | | | 5.25 | | | May 5 | | | 2034-06-01 | | | | 103.706 | | | | 4.994 | |
| | 42 | 3 | | | — | | | | 5.25 | | | May 22 | | | 2034-06-01 | | | | 105.464 | | | | 4.877 | |
| | 505 | | | | — | | | | 4.25 | | | May 26 | | | 2015-12-01 | | | | 100.871 | | | | 4.114 | |
| | 600 | 3 | | | — | | | | 4.09 | | | October 6 | | | 2013-09-23 | | | | 100.001 | | | | 4.090 | |
| | 95 | 3 | | | — | | | | 5.25 | | | October 20 | | | 2034-06-01 | | | | 95.223 | | | | 5.603 | |
| | 38 | 3 | | | — | | | | 5.25 | | | October 28 | | | 2034-06-01 | | | | 95.526 | | | | 5.580 | |
| | 59 | 3 | | | — | | | Variable | 4 | | November 20 | | | 2014-12-01 | | | | 94.227 | | | Variable | |
| | 503 | | | | — | | | | 4.25 | | | December 15 | | | 2015-12-01 | | | | 100.670 | | | | 4.138 | |
| | 23 | 3 | | | — | | | Variable | 4 | | January 20 | | | 2014-12-01 | | | | 92.052 | | | Variable | |
| | 498 | 3 | | | — | | | | 3.25 | | | February 17 | | | 2014-06-01 | | | | 99.660 | | | | 3.320 | |
| | 115 | 3 | | | — | | | Variable | 4 | | February 18 | | | 2014-12-01 | | | | 92.046 | | | Variable | |
| | 69 | 3 | | | — | | | Variable | 4 | | February 25 | | | 2014-12-01 | | | | 92.045 | | | Variable | |
| | 65 | 3 | | | — | | | Variable | 4 | | March 2 | | | 2014-12-01 | | | | 92.039 | | | Variable | |
| | | | | | | | | | | | | | | | | | | | |
| | 2 675 | | | | | | | | | | | | | | | | | | | | | | | | | |
| | | | | | | | | | | | | | | | | | | | |
| | | |
| P: | | Preliminary results. |
| |
| 1 | | Interest payable semi-annually except if another frequency is indicated in a note. |
| |
| 2 | | Yield to investor is determined on the basis of interest payable semi-annually. |
| |
| 3 | | Private borrowings. |
| |
| 4 | | Interest payable quarterly. |
D.55
TABLE D.31
Borrowings by Hydro-Québec in 20081
| | | | | | | | | | | | | | | | | | | | | | | | | | | |
| Amount in | | | Face value | | | | | | | | | | | | | | | | |
| Canadian | | | in foreign | | | Interest | | | Date of | | Date of | | | Price to | | | Yield to | |
| dollars | | | currency | | | rate2 | | | issue | | maturity | | | investor | | | investor3 | |
| (millions) | | | % | | | | | | | | | | | $ | | | % | |
| | 503 | | | | — | | | | 5.00 | | | February 19 | | | 2045-02-15 | | | | 100.691 | | | | 4.959 | |
| | 500 | | | | — | | | | 5.00 | | | April 25 | | | 2045-02-15 | | | | 99.926 | | | | 5.004 | |
| | 515 | | | | — | | | | 5.00 | | | May 16 | | | 2045-02-15 | | | | 102.903 | | | | 4.830 | |
| | 513 | | | | — | | | | 5.00 | | | September 2 | | | 2045-02-15 | | | | 102.586 | | | | 4.848 | |
| | | | | | | | | | | | | | | | | | | | |
| | 2 031 | | | | | | | | | | | | | | | | | | | | | | | | | |
| | | | | | | | | | | | | | | | | | | | |
| | | |
| 1 | | Borrowings contracted from January 1 to December 31, 2008. |
| |
| 2 | | Interest payable semi-annually except if another frequency is indicated in a note. |
| |
| 3 | | Yield to investor is determined on the basis of interest payable semi-annually. |
D.56
TABLE D.32
Investment policies as at January 1, 2009
(percent)
| | | | | | | | | | | | | |
| | | | | | | | | | | Average reference | |
| | | | | | | | | | | portfolio of depositors | |
| Specialized portfolio | | RPSF | | | Generations Fund | | | as a whole1 | |
| Short-term securities | | | 1.0 | | | | 1.0 | | | | 1.4 | |
| Bonds | | | 29.0 | | | | 36.0 | | | | 27.4 | |
| Real return bonds | | | 0.0 | | | | 0.0 | | | | 0.8 | |
| Long-term bonds | | | 0.0 | | | | 0.0 | | | | 2.4 | |
| | | | | | | | | | |
Total – Fixed income | | | 30.0 | | | | 37.0 | | | | 32.0 | |
| | | | | | | | | | |
| Canadian equity | | | 13.0 | | | | 10.0 | | | | 12.2 | |
| US equity – hedged | | | 0.5 | | | | 0.5 | | | | 3.7 | |
| US equity – unhedged | | | 2.0 | | | | 1.5 | | | | | |
| Foreign equity – hedged | | | 2.5 | | | | 2.0 | | | | 5.8 | |
| Foreign equity – unhedged | | | 4.0 | | | | 2.0 | | | | | |
| Emerging market equity | | | 4.0 | | | | 4.0 | | | | 3.1 | |
| Québec International | | | 9.5 | | | | 15.0 | | | | 9.5 | |
| | | | | | | | | | |
Total – Stock markets | | | 35.5 | | | | 35.0 | | | | 34.3 | |
| | | | | | | | | | |
| Investments and infrastructures | | | 6.0 | | | | 5.0 | | | | 5.4 | |
| Private equity | | | 8.0 | | | | 6.0 | | | | 7.9 | |
| Real estate debt | | | 7.0 | | | | 7.0 | | | | 6.5 | |
| Real estate | | | 8.5 | | | | 7.0 | | | | 9.1 | |
| Commodities | | | 1.5 | | | | 0.0 | | | | 1.9 | |
| Hedge funds | | | 3.5 | | | | 3.0 | | | | 2.9 | |
| | | | | | | | | | |
Total – Other investments | | | 34.5 | | | | 28.0 | | | | 33.7 | |
| | | | | | | | | | |
TOTAL | | | 100.0 | | | | 100.0 | | | | 100.0 | |
| | | | | | | | | | |
| | | |
| 1 | | Source: Caisse de dépôt et placement du Québec, Annual Report 2007. The annual report for 2008 has not been published yet. |
D.57