OMB APPROVAL
OMB Number: 3235-0570
Expires: April 30, 2008
Estimated average burden
hours per response... 19.4
UNITED STATES
SECURITIES AND EXCHANGE COMMISSION
Washington, D.C. 20549
FORM N-CSR
CERTIFIED SHAREHOLDER REPORT OF REGISTERED
MANAGEMENT INVESTMENT COMPANIES
Investment Company Act file number 811-3790
The Quantitative Group of Funds
(Exact name of registrant as specified in charter)
55 Old Bedford Road, Lincoln, MA 01773
(Address of principal executive offices)
Elizabeth A. Watson,
Quantitative Investment Advisors, Inc.
55 Old Bedford Road, Lincoln, MA 01773
(Name and address of agent for service)
Registrant’s telephone number, including area code: (781) 676-5900
Date of fiscal year end: | March 31 |
Date of reporting period: | April 1, 2006 through March 31, 2007 |
ITEM 1. REPORTS TO SHAREOWNERS.

QUANT FUNDS
ANNUAL
REPORT
MARCH 31, 2007
U.S. EQUITY FUNDS
Quant Small Cap Fund
Quant Long/Short Fund
INTERNATIONAL EQUITY FUNDS
Quant Emerging Markets Fund
Quant Foreign Value Fund
QUANT FUNDS
Quant Small Cap Fund
Quant Long/Short Fund
Quant Emerging Markets Fund
Quant Foreign Value Fund
ANNUAL REPORT
March 31, 2007
TABLE OF CONTENTS
| President's Letter | 1 | ||||||
| Fund Expenses | 2 | ||||||
| Portfolio Manager Commentaries | |||||||
| Quant Small Cap Fund | 3 | ||||||
| Quant Long/Short Fund | 5 | ||||||
| Quant Emerging Markets Fund | 7 | ||||||
| Quant Foreign Value Fund | 9 | ||||||
| Schedules of Investments | |||||||
| Quant Small Cap Fund | 11 | ||||||
| Quant Long/Short Fund | 13 | ||||||
| Quant Emerging Markets Fund | 16 | ||||||
| Quant Foreign Value Fund | 18 | ||||||
| Statements of Assets and Liabilities | 20 | ||||||
| Statements of Operations | 21 | ||||||
| Statements of Changes in Net Assets | 22 | ||||||
| Statement of Cash Flows for Quant Long/Short Fund | 24 | ||||||
| Financial Highlights | 25 | ||||||
| Notes to Financial Statements | 29 | ||||||
| Report of Independent Registered Accounting Firm | 36 | ||||||
| Information for Shareholders | 37 | ||||||
| Privacy Policy | 39 | ||||||
| Trustees and Officers | 42 | ||||||
| Service Providers | back cover | ||||||
This report must be preceded or accompanied by a current Quant Funds prospectus. You should read the prospectus carefully before investing because it contains more complete information on the Quant Funds' investment objectives, risks, charges and expenses. Please consider this information carefully. For a prospectus and other information, visit www.quantfunds.com or call (800) 326-2151.
NOT FDIC INSURED • MAY LOSE VALUE • NO BANK GUARANTEE
Neither the Quant Funds nor U.S. Boston Capital Corporation is a bank.
QUANT FUNDS
Dear Fellow Shareholder:
We are pleased to provide you with the Quant Funds' Annual Report for the year ended March 31, 2007 to update you on recent market conditions and the performance of the Quant Funds.
Equity markets experienced volatility but generally trended upward during the Funds' 2007 fiscal year despite continuing socioeconomic uncertainties. Most notably, the equity markets have been buffeted by concerns about the impact of the price of energy and the direction of interest rates on the prospects for continued economic growth both in specific markets and globally. In February, the importance of continued growth in the emerging markets, particularly China, was felt when a sharp decline and rebound in the Chinese stock market was tracked by more established markets, including the United States.
World equity market performance was positive for the 12-months ended March 31, 2007. The U.S. equity market was up 11.83% (as represented by the S&P 500 Index). The U.S. small cap equities market also ended up 5.91% (as represented by the Russell 2000 Index), but significantly underperformed the broader U.S. market. Established foreign equity markets ended significantly higher than the U.S. market at 20.69% (as represented by the Morgan Stanley Capital International Europe, Australasia and Far East ("MSCI EAFE") Index). Equities in the emerging markets edged ahead of more established foreign markets ending up 21.03% (as represented by the Morgan Stanley Capital International Emerging Markets ("MSCI EM") Index).
12-month
Index Performance
S&P 500  | 11.83 | % | |||||
Russell 2000  | 5.91 | % | |||||
MSCI EAFE  | 20.69 | % | |||||
MSCI EM  | 21.03 | % | |||||
We are cautiously optimistic about prospects for continued economic growth in 2008 both in the U.S. and in the foreign markets. Factors that may dampen growth in the U.S. include the rising price of energy, a weak housing market, the collapse of the sub-prime mortgage market and speculation about interest rates. In spite of these negative factors, the U.S. equity markets had reached new highs by the beginning of May 2007. Globally, economic, political and social tensions, particularly with respect to the Middle East, continue to contribute to equity market uncertainty. This uncertainty is most apparent in continuing concerns about the price of energy.
Looking ahead, the portfolio managers for each of the Quant Funds are optimistic about the prospects for good investment opportunities for the next fiscal year. We invite you to review the Investment Commentary for your Fund which provides valuable insight from the Fund's portfolio manager.
We thank you for your continued confidence in Quant Funds. Please feel free to email us at feedback@quantfunds.com or call us at 800-326-2151 with any questions or for assistance on your account.
Sincerely,

Willard Umphrey
President and Chairman
Any statements in this Shareholder Letter regarding market or economic trends or the factors influencing the historical or future performance of the Quant Funds are the views of Fund management as of the date of this report. These views are subject to change at any time based upon market and other conditions, and Fund management disclaims any responsibility to update such views. These views may not be relied upon as investment advice or as an indication of trading intent on behalf of any Quant Fund. Any references to specific securities are not recommendations of such securities and may not be representative of any Quant Fund's current or future investments.
Past performance is no guarantee of future results, and there is no guarantee that market forecasts will be realized.
1
QUANT FUNDS
FUND EXPENSES
We believe it's important for Fund shareholders to have a clear understanding of fund expenses and the impact expenses have on investment returns. The following is important information about each Fund's Expense Example, which appears below.
Expense Example
As a shareholder of a fund, you incur two types of costs: (1) transaction costs, including deferred sales charges (on Ordinary Shares when redeemed) or redemption fees (on Institutional Shares redeemed within 60 days of purchase), and (2) ongoing costs, including management fees, distribution (12b-1) fees (on Ordinary Shares) and other Fund expenses. The example is intended to help you understand your ongoing costs (in dollars) of investing in a Fund and to compare these costs with the ongoing costs of investing in other mutual funds. These examples are based on $1,000 invested at the beginning of the period and held for the entire period from October 1, 2006 to March 31, 2007.
Actual Expenses and Returns
The example provides information about actual account returns and actual expenses. You may use the information in this section, together with the amount you invested, to estimate the expenses that you paid over the period. To estimate the expenses you paid over the period, simply divide your account value by $1,000, then multiply the result by the number under the heading "Expenses Paid During the Period."
Hypothetical Example for Comparison Purposes
The example shows you hypothetical account values and hypothetical expenses based on the Fund's actual expense ratio and an assumed rate of return of 5% per year before expenses, which is not the Fund's actual return.
The hypothetical account values and hypothetical expenses may not be used to estimate the actual ending account balance or expenses you paid for the period. You may use this information to compare the ongoing expenses of investing in the Fund with the ongoing expenses of other funds. To do so, compare the Fund's 5% hypothetical example with the 5% hypothetical examples that appear in the shareholder reports of other funds.
Please note that the expenses shown in the table are meant to highlight your ongoing costs. They do not reflect any transactional costs, such as deferred sales charges or redemption fees (where applicable). Thus, the "hypothetical" lines in the table are useful in comparing ongoing costs only, and will not help you determine the relative costs of owning different funds. In addition, if these transactional costs were included, your costs would have been higher. See the Funds' prospectus for a complete description of these transactional costs.
Expense Example for the 6 months ended March 31,2007
| Quant Fund | Share Class | Total Return Description | Beginning Account Value 10/01/2006 | Ending Account Value 03/31/2007 | Annualized Expense Ratio | Expenses Paid 10/01/2006- 03/31/2007 | |||||||||||||||||||||
| Small Cap | Ordinary | Actual | $ | 1,000.00 | $ | 1,126.96 | 1.81 | % | $ | 9.65 | |||||||||||||||||
| Hypothetical | $ | 1,000.00 | $ | 1,015.86 | 1.81 | % | $ | 9.14 | |||||||||||||||||||
| Institutional | Actual | $ | 1,000.00 | $ | 1,129.79 | 1.31 | % | $ | 6.95 | ||||||||||||||||||
| Hypothetical | $ | 1,000.00 | $ | 1,018.40 | 1.31 | % | $ | 6.59 | |||||||||||||||||||
| Long/Short | Ordinary | Actual | $ | 1,000.00 | $ | 1,099.66 | 1.83 | % | $ | 9.61 | |||||||||||||||||
| Hypothetical | $ | 1,000.00 | $ | 1,015.77 | 1.83 | % | $ | 9.23 | |||||||||||||||||||
| Institutional | Actual | $ | 1,000.00 | $ | 1,102.13 | 1.34 | % | $ | 7.06 | ||||||||||||||||||
| Hypothetical | $ | 1,000.00 | $ | 1,018.21 | 1.34 | % | $ | 6.78 | |||||||||||||||||||
| Emerging Markets | Ordinary | Actual | $ | 1,000.00 | $ | 1,237.24 | 1.66 | % | $ | 9.28 | |||||||||||||||||
| Hypothetical | $ | 1,000.00 | $ | 1,016.34 | 1.66 | % | $ | 8.36 | |||||||||||||||||||
| Institutional | Actual | $ | 1,000.00 | $ | 1,239.64 | 1.40 | % | $ | 7.86 | ||||||||||||||||||
| Hypothetical | $ | 1,000.00 | $ | 1,017.92 | 1.40 | % | $ | 7.08 | |||||||||||||||||||
| Foreign Value | Ordinary | Actual | $ | 1,000.00 | $ | 1,198.54 | 1.59 | % | $ | 8.74 | |||||||||||||||||
| Hypothetical | $ | 1,000.00 | $ | 1,016.98 | 1.59 | % | $ | 8.01 | |||||||||||||||||||
| Institutional | Actual | $ | 1,000.00 | $ | 1,200.33 | 1.34 | % | $ | 7.38 | ||||||||||||||||||
| Hypothetical | $ | 1,000.00 | $ | 1,018.23 | 1.34 | % | $ | 6.77 | |||||||||||||||||||
2
QUANT SMALL CAP FUND
INVESTMENT PROFILE
All Data as of March 31, 2007
Fund Information
| Net Assets Under Management | $137.4 Million | ||||||
| Number of Companies | 68 | ||||||
| Price to Book Ratio | 4.2 | ||||||
| Price to Earnings Ratio | 22.8 | ||||||
| Ordinary | Institutional | ||||||||||
| Total Expense Ratio - Gross | 1.82 | % | 1.31 | % | |||||||
| - Net | 1.82 | % | 1.31 | % | |||||||
| Ticker Symbol | USBNX | QBNAX | |||||||||
Investment Commentary
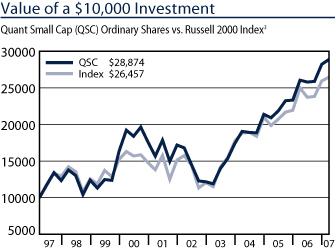
For the year ended March 31, 2007, Quant Small Cap Fund's Ordinary Shares (the "Fund") outperformed its benchmark, the Russell 2000 Index (the "Index"). The Fund achieved a return of 12.01% at net asset value compared to 5.91% for the Index.
It was a good year for the Fund and for the equity markets but the rewards did not come easily. The markets rose early in 2006 but were soon undermined by a series of events which drained investor confidence and enthusiasm. Foremost of these was the ongoing campaign by the Federal Reserve to fight inflation, which led to two additional short-term interest rate increases in May and June. After posting a series of strong monthly gains, the Russell 2000 Index peaked in early May, coincident with the Fed's meeting. Despite a rally in the last days of June, the equity markets were on the defensive for much of the late spring and summer. Market sentiment improved in August and September when the Fed met and left short-term interest rates unchanged. The absence of any major hurricane activity also had a positive impact causing energy prices to decline. Reports of lower inflation followed and market interest rates fell. The combination of lower rates and falling energy prices helped stocks to move higher through the end of the year. Volatility returned however early in 2007 as a number of factors combined to disrupt the uptrend in stock prices. A drop in the Chinese stock market late in February, the collapse of the sub-prime mortgage market in the U.S., and remarks made by the former Chairman of the Federal Reserve concerning the potential for a recession, all converged within days to turn investors from bullish to anxious. The Chinese market rebounded quickly though and the current Fed Chairman Ben Bernanke reassured investors on the economy. This helped to bolster the equity markets, although sub-prime mortgage issues continued to linger. The Fed met again in late March taking no action on interest rates. Stocks rallied on this news and by the end of the month, little damage had been done.
Over the past year the best performing sectors in the Russell 2000 Index were defensive in nature. Consumer Staples rose over 27% followed by the Utilities which gained over 20%. Health Care turned in the only negative sector performance for the year although the loss was small. Information Technology was also a poor performer in the Index posting less than a 1% gain for the fiscal year. The Fund's outperformance relative to the benchmark Index was significant for the year ended March 31, 2007. This was due in large part to the Fund's relative performance in Financials. Holdings such as Entertainment Properties Trust and Ventas Inc. were strong contributors in this sector. The Fund also benefited from good stock selection in Health Care which gained 19% versus a slight negative return for the Index's same sector. Omnicell Inc. and Psychiatric Solutions Inc. were standout performers for the Fund in this sector. Holdings in Consum er Discretionary, such as clothing retailer Guess? Inc. and auction house Sotheby's, also contributed to the Fund's outperformance for the period. Core Laboratories N.V., an energy service company, was the best contributor to performance for the fiscal year and is now one of the Fund's largest holdings. Despite our overall success, there were a few areas of disappointment as well. Our underweight and poor selection in the Materials sector detracted from performance. Here, mining company Coeur d'Alene Mines Corp. was the culprit, falling over 37% for the fiscal year. Our stock selection also was sub par in the Consumer Staples sector as grocer Wild Oats Markets Inc. disappointed falling over 10% last year. In terms of other sectors, the Fund's returns in Utilities and Information Technology were negative versus positive for the Index, marginally detracting from performance.
Since our last report in September of 2006, we have increased the Fund's exposure in the Consumer Discretionary and Health Care sectors. Conversely, we have reduced the Fund's emphasis in Financials and Energy. At the end of March, our largest weights were in Consumer Discretionary and Industrials both just above 17%, and Financials at 16%. In relation to the Index, as of March 31, 2007, we have underweight Financials, Information Technology, Utilities and Materials and overweight the Consumer Discretionary, Industrial, Health Care, Energy and Telecommunications Services and Consumer Staples sectors. Clearly, there are issues both economic and geopolitical, that may potentially have an impact on the financial markets. Tensions in the Middle East, a weak housing market in the U.S. and uncertainty over the Fed's next move are on this list of concerns. While periods of weakness may occur, it may be difficult to disrupt the stock ma rket's uptrend, as the fundamental underpinning of corporate profits continues to be strong.
This past fiscal year proved to be another successful year for the Fund. We enjoyed good absolute and relative returns by outperforming in many sectors where the Index performance was modest, validating our emphasis on strong stock selection. We continue to believe our strategy of superior stock selection in quality companies will provide the best reward to investors over a market cycle. We look forward to another successful year ahead and thank you for your support.
The Fund is co-managed by Robert von Pentz, CFA, and Rhys Williams of Columbia Partners, L.L.C. Investment Management.
3
QUANT SMALL CAP FUND
Top 10 Holdings
| Percentage of total net assets | 34.2 | % | |||||
| Entertainment Properties Trust | 4.8 | % | |||||
| Core Laboratories N.V. | 4.7 | % | |||||
| Sierra Health Services, Inc. | 4.3 | % | |||||
| Crown Castle International Corporation | 4.0 | % | |||||
| Ventas, Inc. | 3.2 | % | |||||
| Vail Resorts, Inc. | 3.1 | % | |||||
| Sotheby's | 3.0 | % | |||||
| Psychiatric Solutions, Inc. | 2.4 | % | |||||
| NICE-Systems, Ltd. | 2.4 | % | |||||
| NutriSystem Inc. | 2.3 | % | |||||
There is no guarantee that such securities will continue to be viewed favorably or held in the Fund's portfolio.
Sector Allocation
| Percentage of total net assets | 100.0 | % | |||||
| Industrials | 17.6 | % | |||||
| Consumer Discretionary | 17.0 | % | |||||
| Financials | 16.3 | % | |||||
| Health Care | 13.4 | % | |||||
| Information Technology | 13.3 | % | |||||
| Energy | 5.6 | % | |||||
| Telecommunication Services | 5.5 | % | |||||
| Consumer Staples | 4.2 | % | |||||
| Materials | 2.9 | % | |||||
| Cash and Other Assets (Net) | 4.2 | % | |||||
Average Annual Total Returns
| Three Months | Six Months | 1-Year | 5-Year | 10-Year | Since Inception | Inception Date | |||||||||||||||||||||||||
| Ordinary Shares | 3.33 | % | 12.70 | % | 12.01 | % | 11.65 | % | 11.28 | % | 14.52 | % | 08/03/92 | ||||||||||||||||||
| Ordinary Shares (adjusted)1 | 2.30 | % | 11.57 | % | 10.89 | % | 11.43 | % | 11.17 | % | 14.44 | % | 08/03/92 | ||||||||||||||||||
| Institutional Shares2 | 3.45 | % | 12.98 | % | 12.58 | % | 12.22 | % | 11.84 | % | 13.54 | % | 01/06/93 | ||||||||||||||||||
| Russell 20003 | 1.95 | % | 11.02 | % | 5.91 | % | 10.95 | % | 10.23 | % | 11.68 | % | ———— | ||||||||||||||||||
1 Reflects deduction of a 1% deferred sales charge.
2 Institutional Shares may only be purchased by certain categories of investors and are not subject to sales charges or distribution fees.
3 The Russell 2000 Index is a market capitalization-weighted index of 2,000 small company stocks. It is widely recognized as representative of the general market for small company stocks. Index returns assume the reinvestment of dividends and, unlike Fund returns, do not reflect any fees or expenses. You cannot invest directly in an Index. The beginning date for the Index is 9/30/92.
Small company stocks may trade less frequently and in a limited volume, and their prices may fluctuate more than stocks of other companies. Small company stocks may therefore be more vulnerable to adverse developments than those of larger companies.
Performance data quoted represents past performance and is no guarantee of future results. Current performance may be lower or higher than performance data quoted. Investment return and principal value will fluctuate so that an investor's shares, when redeemed, may be worth more or less than original cost. For the most recent month-end performance, visit the Fund's website at www.quantfunds.com. Before investing, carefully consider the Fund's investment objectives, risks, charges and expenses. For this and other information obtain the Fund's prospectus by calling (800) 326-2151 or visiting www.quantfunds.com. Please read the prospectus carefully before you invest.
4
QUANT LONG/SHORT FUND
INVESTMENT PROFILE
All Data as of March 31, 2007
Fund Information
| Net Assets Under Management | $76.7 Million | ||||||
| Number of Companies | 125 | ||||||
| Price to Book Ratio | 2.9 | ||||||
| Price to Earnings Ratio | 16.1 | ||||||
| Ordinary | Institutional | ||||||||||
| Total Expense Ratio - Gross | 1.72 | % | 1.23 | % | |||||||
| - Net | 1.69 | % | 1.20 | % | |||||||
| Ticker Symbol | USBOX | QGIAX | |||||||||
Investment Commentary
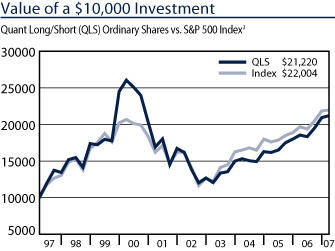
For the year ended March 31, 2007, Quant Long/Short Fund's Ordinary Shares (the "Fund") outperformed its benchmark, the S&P 500 Index (the "Index"). The Fund achieved a return of 15.63% at net asset value compared to 11.83% for the Index. Our investment process incorporates perspectives on valuation, quality and sentiment. Overall, these factors offered positive performance. Specifically, our valuation components, earnings yield and free cash flow, have served as strong predictors of stock price appreciation. Over this same period, our sentiment perspectives have had weak forecasting skill.
Performance results for the Fund are primarily driven by stock selection positions. While this strategy remains consistent over time, during the October 1, 2006 to March 31, 2007 period, we changed the investment strategy on November 1, 2006 to relieve the Fund's long only constraint, and the Fund began adding short sales. Short positions of up to 33% may be added to the long portfolio. These short positions are then matched by additional long positions, resulting in 100% market exposure.
The Fund's sector and industry exposures relative to the benchmark are a function of our bottom-up stock selection process. Positions in the Consumer Discretionary, Health Care, Technology and Industrials sector contributed to the bulk of the Fund's performance success. Poor stock picking among financial stocks modestly detracted from the Fund's performance for the period. At the stock level, the largest positive contributor to the Fund's results was an overweight position in Big Lots Inc. Shares of the largest U.S. seller of overstocked and discontinued goods rose after the company announced that it's fiscal fourth quarter profit more than doubled. In addition, an overweight position in Kerr-McGee Corp. bolstered performance results. Shares of Kerr-McGee soared higher after Anadarko Petroleum Corp. agreed to pay $21 billion in cash for the company and Western Gas Resources to more than double Anadarko's sales and create the lar gest independent oil and gas producer in the U.S. Barnes & Noble was overweight and the stock fell, working to offset some of the Fund's gains. The U.S. book retailer's stock dropped sharply as fewer new books caused fiscal first quarter sales to come in short of analyst estimates. In addition, the book retailer indicated that profits this year may also be lower.
During the year we increased our positions among retail, apparel and industrial services stocks. In addition, we have decreased our positions within biotechnology, chemicals and defense/aerospace stocks. Our sector and industry exposures relative to the benchmark are a function of bottom-up stock selection.
Going forward, a more material risk for U.S. economic prospects may lie with recent hints of a slowdown in business expenditures. If strong corporate profits are not recycling into fresh investments, the already tepid outlook for 2007 earnings growth may deteriorate further. These cautionary signs, though, have yet to manifest themselves in weaker employment conditions or softer wages. Consumer spending behavior may therefore be able to outperform the fearful expectations that have arisen in the wake of sluggish home prices. In a similar vein, equity prices are cheap on many measures, and skittish investors have driven short interest on both the Nasdaq and the New York Stock Exchange to record levels. If incoming economic data do not confirm the fears of gloomier observers, equities may use their current consolidation phase as a healthy foundation for a more prosperous second quarter. We are presently finding attractive investme nt opportunities in pockets of the medical providers & services, industrial services, apparel and retail industries.
The Fund's portfolio is managed by a team of portfolio managers at SSgA Funds Management, Inc.. The lead portfolio manager is James Johnson, CFA.
5
QUANT LONG/SHORT FUND
Top 10 Long Holdings
| Percentage of total net assets | 35.5 | % | |||||
| Exxon Mobil Corporation | 4.5 | % | |||||
| Big Lots, Inc. | 4.2 | % | |||||
| Bank of America Corporation | 4.2 | % | |||||
| CIGNA Corporation | 3.5 | % | |||||
| Citigroup Inc. | 3.4 | % | |||||
| Sears Holdings Corporation | 3.3 | % | |||||
| AGCO Corporation | 3.2 | % | |||||
| Pactiv Corporation | 3.2 | % | |||||
| The First Marblehead Corporation | 3.0 | % | |||||
| Hewlett-Packard Company | 3.0 | % | |||||
There is no guarantee that such securities will continue to be viewed favorably or held in the Fund's portfolio.
Top 10 Short Holdings
| Percentage of total net assets | -16.4 | % | |||||
| Palm, Inc. | -2.1 | % | |||||
| Rite Aid Corporation | -2.0 | % | |||||
| Intuitive Surgical, Inc. | -1.7 | % | |||||
| Coldwater Creek, Inc. | -1.7 | % | |||||
| The Timken Company | -1.7 | % | |||||
| Chico's FAS, Inc. | -1.6 | % | |||||
| Boyd Gaming Corporation | -1.5 | % | |||||
| USG Corporation | -1.4 | % | |||||
| Hovanian Enterprise, Inc. | -1.4 | % | |||||
| Abraxis BioScience, Inc. | -1.3 | % | |||||
There is no guarantee that such securities will continue to be viewed favorably or held in the Fund's portfolio.
Sector Allocation
| Percentage of total net assets | 100.0 | % | |||||
| Consumer Discretionary | 25.9 | % | |||||
| Financials | 22.9 | % | |||||
| Information Technology | 20.6 | % | |||||
| Industrials | 19.7 | % | |||||
| Health Care | 17.0 | % | |||||
| Energy | 7.8 | % | |||||
| Materials | 4.7 | % | |||||
| Consumer Staples | 4.5 | % | |||||
| Telecommunication Services | 2.5 | % | |||||
| Utilities | 1.9 | % | |||||
| Cash and Other Assets (Net) | 1.4 | % | |||||
| Short Positions | -28.9 | % | |||||
Average Annual Total Returns
| Three Months | Six Months | 1-Year | 5-Year | 10-Year | Since Inception | Inception Date | |||||||||||||||||||||
| Ordinary Shares 2.40% | 9.97 | % | 15.63 | % | 5.82 | % | 7.92 | % | 11.54 | % | 05/06/85 | ||||||||||||||||
| Ordinary Shares (adjusted)1 1.38% | 8.87 | % | 14.47 | % | 5.61 | % | 7.81 | % | 11.48 | % | 05/06/85 | ||||||||||||||||
| Institutional Shares2 2.53% | 10.21 | % | 16.22 | % | 6.33 | % | 8.46 | % | 10.36 | % | 03/25/91 | ||||||||||||||||
| S & P 5003 0.64% | 7.38 | % | 11.83 | % | 6.26 | % | 8.20 | % | 12.30 | % | ———— | ||||||||||||||||
1 Reflects deduction of a 1% deferred sales charge.
2 Institutional Shares may only be purchased by certain categories of investors and are not subject to sales charges or distribution fees.
3 The S&P 500 Index is an unmanaged index of stocks chosen for their size and industry characteristics. It is widely recognized as representative of stocks in the United States. Index returns assume the reinvestment of dividends and, unlike Fund returns, do not reflect any fees or expenses. You cannot invest directly in the Index. The beginning date for the Index is 6/30/85.
Short selling involves certain risks including the possibility that short positions do not limit the Fund's stock market exposure as expected, that the future value of a short position increases above its recorded value potentially resulting in an unlimited loss and that the lender of a security sold short could terminate the loan at a price or time that is disadvantageous to the Fund.
Performance data quoted represents past performance and is no guarantee of future results. Current performance may be lower or higher than performance data quoted. Investment return and principal value will fluctuate so that an investor's shares, when redeemed, may be worth more or less than original cost. For the most recent month-end performance, visit the Fund's website at www.quantfunds.com. Before investing, carefully consider the Fund's investment objectives, risks, charges and expenses. For this and other information obtain the Fund's prospectus by calling (800) 326-2151 or visiting www.quantfunds.com. Please read the prospectus carefully before you invest.
6
QUANT EMERGING MARKETS FUND
INVESTMENT PROFILE
All Data as of March 31, 2007
Fund Information
| Net Assets Under Management | $289.5 Million | ||||||
| Number of Companies | 68 | ||||||
| Price to Book Ratio | 2.7 | ||||||
| Price to Earnings Ratio | 13.2 | ||||||
| Ordinary | Institutional | ||||||||||
| Total Expense Ratio - Gross | 1.67 | % | 1.41 | % | |||||||
| - Net | 1.67 | % | 1.41 | % | |||||||
| Ticker Symbol | QFFOX | QEMAX | |||||||||
Investment Commentary
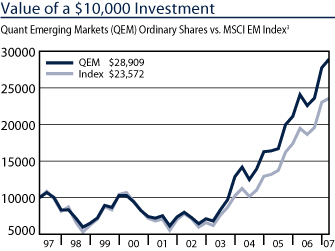
For the year ended March 31, 2007, Quant Emerging Markets Fund's Ordinary Shares (the "Fund") outperformed its benchmark, the MSCI Emerging Markets Index (the "Index"). The Fund achieved a return of 21.36% at net asset value compared to 21.03% for the Index.
The Fund outperformed the Index by a small margin over the period due to risk in both country selection and stock selection. The Fund employs quantitative models to select stocks that are representative of the country, and tend to mirror the stock market's performance in that country. The strategy seeks to derive more of the Fund's value added from stock selection than from country selection. In the process there is some exposure to the various countries, but this exposure is controlled.
Among the top contributing stocks in this period, two are Korean companies in the shipbuilding business. Hyundai Mipo focuses on repairing and building ships along with other metals products, while Hyundai Heavy Industries manufactures ships across a broader product line which includes oil tankers, passenger ships and cargo vessels. The company also produces industrial components. In both of these cases, the companies' stock prices rose in excess of 100% in the trailing twelve months and the Fund's portfolio's overweight in these securities contributed positively to its relative performance. Strong global demand for steel helped bid up the price of China's Angang Steel more than 85% over the twelve months. The portfolio benefited from an overweight position in this stock as well.
Although their impact was less, the overweight positions in the Fund's portfolio that detracted from performance were from more varied industries. High Tech Computers in Taiwan, which sells Microsoft Pocket PCs, the Korean Import/Export Conglomerate LG International and the Thai Farm Feed Company, Charoen Pokphand Foods all had negative returns over the twelve months and detracted from relative performance of the portfolio.
Total returns in emerging market countries ranged from a low of -11.2% in Jordan to a high of 82.6% in Peru over the twelve month period. Most markets returned in excess of 20% for the year. There were many sectors that were strong over the past year across these countries and benefited from the strengthening economies. Financial institutions along with commodity manufacturers and utilities all had a strong showing. Energy prices dipped temporarily during the year, but appeared to be rising again at the end of the quarter ended March 31, 2007.
We believe that the emerging markets continue to have healthy growth prospects ahead. Growth in most emerging markets countries has moderated over the last 18 months or so. The governments in these markets have become much more rational and skilled in the use of fiscal tools, such as interest rate policy to manage their economies. This should help with sustainable growth and healthier markets in this area. China remains the outlier in terms of growth. Growth is still very strong and needs to be reigned in. The government appears to be taking steps to address this area.
Finally, one major potential global threat is the price of energy. It is expected that rising energy prices will affect pricing across the full manufacturing and distribution chain of good and services. Although the extent of the price increase is not clear, it is expected to be significant. Economies that are fully dependent upon others for their energy needs will most likely suffer the most.
The Fund's portfolio is managed by a team of portfolio managers at Panagora Asset Management, Inc. The Fund's co-lead portfolio managers are David P. Nolan and Richard T. Wilk.
7
QUANT EMERGING MARKETS FUND
Top 10 Holdings
| Percentage of total net assets | 27.8 | % | |||||
| Gazprom | 5.2 | % | |||||
| Petroleo Brasileiro SA | 3.0 | % | |||||
| China Mobile Limited | 2.8 | % | |||||
| Companhia Vale do Rio Doce | 2.8 | % | |||||
| Grupo Mexico SAB de CV | 2.5 | % | |||||
| iShares MSCI Emerging Markets Index Fund | 2.4 | % | |||||
| Shinhan Financial Group Co., Ltd. | 2.4 | % | |||||
| Hyundai Mipo Dockyard Co., Ltd. | 2.3 | % | |||||
| Kookmin Bank | 2.2 | % | |||||
| Partner Communications Company Ltd. | 2.2 | % | |||||
There is no guarantee that such securities will continue to be viewed favorably or held in the Fund's portfolio.
Top 10 Country Allocations
| Percentage of total net assets | 85.3 | % | |||||
| South Korea | 16.1 | % | |||||
| Taiwan | 11.7 | % | |||||
| China | 11.6 | % | |||||
| Brazil | 11.5 | % | |||||
| South Africa | 9.8 | % | |||||
| Russia | 8.5 | % | |||||
| Mexico | 6.7 | % | |||||
| India | 3.6 | % | |||||
| Israel | 3.1 | % | |||||
| Turkey | 2.7 | % | |||||
Sector Allocation
| Percentage of total net assets | 100.0 | % | |||||
| Financials | 19.9 | % | |||||
| Energy | 17.3 | % | |||||
| Materials | 13.7 | % | |||||
| Information Technology | 12.8 | % | |||||
| Telecommunication Services | 9.5 | % | |||||
| Industrials | 8.6 | % | |||||
| Consumer Discretionary | 6.3 | % | |||||
| Utilities | 3.9 | % | |||||
| Consumer Staples | 3.7 | % | |||||
| Exchange Traded Funds | 3.5 | % | |||||
| Health Care | 0.8 | % | |||||
Average Annual Total Returns
| Three Months | Six Months | 1-Year | 5-Year | 10-Year | Since Inception | Inception Date | |||||||||||||||||||||
| Ordinary Shares | 5.28 | % | 23.72 | % | 21.36 | % | 29.58 | % | 11.33 | % | 8.56 | % | 09/30/94 | ||||||||||||||||||
| Ordinary Shares (adjusted)1 | 4.22 | % | 22.49 | % | 20.14 | % | 29.32 | % | 11.22 | % | 8.48 | % | 09/30/94 | ||||||||||||||||||
| Institutional Shares2 | 5.39 | % | 23.96 | % | 21.68 | % | 30.11 | % | 11.85 | % | 11.65 | % | 04/02/96 | ||||||||||||||||||
| MSCI EM | 2.35 | % | 19.11 | % | 21.03 | % | 24.84 | % | 8.77 | % | 6.46 | % | ———— | ||||||||||||||||||
1 Reflects deduction of a 1% deferred sales charge.
2 Institutional Shares may only be purchased by certain categories of investors and are not subject to sales charges or distribution fees.
3 The Morgan Stanley Capital International Emerging Markets ("MSCI EM") Index is an unmanaged index comprised of stocks located in countries other than the United States. It is widely recognized as representative of the general market for emerging markets. Index returns assume the reinvestment of dividends and, unlike Fund returns, do not reflect fees or expenses. You cannot invest directly in an Index. The beginning date for the Index is 6/30/85.
Investing in foreign markets, particularly emerging markets, can be more volatile than the U.S. market due to increased risks of adverse issuer, political, regulatory, market or economic developments and can perform differently than the U.S. market.
Performance data quoted represents past performance and is no guarantee of future results. Current performance may be lower or higher than performance data quoted. Investment return and principal value will fluctuate so that an investor's shares, when redeemed, may be worth more or less than original cost. For the most recent month-end performance, visit the Fund's website at www.quantfunds.com. Before investing, carefully consider the Fund's investment objectives, risks, charges and expenses. For this and other information obtain the Fund's prospectus by calling (800) 326-2151 or visiting www.quantfunds.com. Please read the prospectus carefully before you invest.
8
QUANT FOREIGN VALUE FUND
INVESTMENT PROFILE
All Data as of March 31, 2007
Fund Information
| Net Assets Under Management | $893.3 Million | ||||||
| Number of Companies | 54 | ||||||
| Price to Book Ratio | 2.7 | ||||||
| Price to Earnings Ratio | 14.6 | ||||||
| Ordinary | Institutional | ||||||||||
| Total Expense Ratio - Gross | 1.60 | % | 1.35 | % | |||||||
| - Net | 1.60 | % | 1.35 | % | |||||||
| Ticker Symbol | QFVOX | QFVIX | |||||||||
Investment Commentary
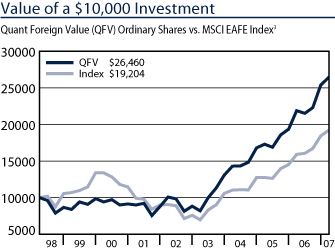
For the fiscal year ended March 31, 2007, the Quant Foreign Value Fund's Ordinary Shares (the "Fund") outperformed its benchmark, the Morgan Stanley Capital International Europe, Australasia and Far East (MSCI EAFE) Index (the "Index"). The Fund achieved a return of 22.08% at net asset value compared to 20.69% for the Index.
Market Conditions and Investment Strategies
Performance contributors spanned the globe, with holdings in 17 of 18 countries experiencing gains. All countries, except South Korea, delivered positive returns. Among the top performing countries were Japan, Finland, Norway, England and South Africa.
The Fund benefited from out-of-favor domestics stocks in Japan, including milk production, breweries, railways and telecommunications. The Fund's increase in Japanese holdings during the first and second quarters of 2006 proved a wise decision, as the returns flowed through to year end. Investments in Finland, including construction/engineering company YIT Oyj, cargo handling corporation Cargotec and industrial crane maker KCI Konecranes produced positive results. Prospects for a merger, and potential bidding war between Barclays and Royal Bank of Scotland, positively affected performance of Dutch bank ABN AMRO. British homebuilders, including Bellway and Crest Nicholson, posted strong gains for the first three quarters of the fiscal year. These stocks slightly underperformed in the 4th quarter in line with a minor drop in the housing market. However, George Wimpey was one of the Fund's top quarterly performers, due to its annou nced merger with another U.K. builder, Taylor Woodrow. A small South African copper mining company, Metorex, advanced on news of mine progress in the Democratic Republic of Congo, a country with many copper prospects. South African platinum producer, Impala Platinum, increased strongly due to a second-half depreciation in the South African Rand.
Only nine of 56 companies held during the period declined, an indication of the Fund's broad- based performance. Makers of display devices, electronics, seafood and energy slightly underperformed. Much of the decline centered on investments in South Korea, including Samsung Electronics and Samsung SDI, which posted lower results due to increased industry competition. The Fund's two Norwegian seafood companies were also slight impediments. Among economic sectors the most important gains were realized in Industrials, Materials, Consumer Discretionary and Financials. Information Technology underperformed.
Portfolio Changes
During the second half of the fiscal year, Fund management purchased European financial, industrial, packaging and holding companies. Among the more notable investments: Bank of Ireland, a $231 billion bank with operations primarily in Ireland and the United Kingdom. In addition, a new investment was made in a packaging company that produces paper, paper board, cardboard boxes and other packaging. During this time frame, the Fund sold auto, paper and energy companies. The Fund's position in Repsol, a Spanish energy company with operations in Argentina and Venezuela, was sold and the Fund's long-standing position in Peugeot was liquidated due to deterioration in the company's cash flow. Among sectors, the Fund maintained a healthy exposure to Materials, Industrials, Consumer Discretionary, and Financials. Energy and Health Care remain underweight based on valuation concerns.
Outlook for 2007
Asia continues to lead economic growth rates with resource rich countries that are experiencing strong cash inflows being reinvested to expand capacity. The larger economies of Europe and North America are growing more slowly; however, the size of these markets is also stimulating better business conditions. One note of caution: Previously, we noted that U.S. equity valuations were much higher than international valuations, leading to the conclusion that there were better investment opportunities outside the U.S. At the end of March 2007, the valuations in non-U.S. equities also increased in anticipation of strong economic and business conditions worldwide. Non-U.S. valuations remain below U.S. equity valuations, but remain high on an absolute basis. Specifically, the price to cash flow ratio in U.S. equities was 11.8; international equities price to cash flow was 10.0. A normal global price to cash flow ratio ranges from 5-8. T herefore, overall markets remain vulnerable to a correction. Sticking to a strict value discipline, Fund management continues to find the best investments overseas, focusing on attractively-priced companies generating free cash flow. The Fund's portfolio holdings are reporting healthy product demand; future prospects (volume growth and pricing) appear promising based on current economic conditions. Fund management believes current investments are properly positioned to capitalize on demand for materials and industrials – both of which will be required to facilitate expected worldwide economic growth.
The Fund's lead portfolio manager is Bernard R. Horn, Jr., of Polaris Capital Management, Inc.
9
QUANT FOREIGN VALUE FUND
Top 10 Holdings
| Percentage of total net assets | 21.8 | % | |||||
| ABN-AMRO Holdings NV | 2.4 | % | |||||
| Yara International ASA | 2.3 | % | |||||
| KCI Konecranes OYJ | 2.3 | % | |||||
| Andritz AG | 2.2 | % | |||||
| Sasol Ltd. | 2.2 | % | |||||
| Greencore Group PLC | 2.1 | % | |||||
| Impala Platinum Holdings Ltd. | 2.1 | % | |||||
| George Wimpy PLC | 2.1 | % | |||||
| Yit-Yhtyma OYJ | 2.1 | % | |||||
| Bellway PLC | 2.0 | % | |||||
There is no guarantee that such securities will continue to be viewed favorably or held in the Fund's portfolio.
Top 10 Country Allocations
| Percentage of total net assets | 79.2 | % | |||||
| Japan | 18.5 | % | |||||
| United Kingdom | 11.5 | % | |||||
| Finland | 9.9 | % | |||||
| South Africa | 8.0 | % | |||||
| Norway | 7.6 | % | |||||
| Ireland | 6.0 | % | |||||
| France | 5.8 | % | |||||
| South Korea | 5.3 | % | |||||
| Belgium | 3.6 | % | |||||
| Sweden | 3.0 | % | |||||
Sector Allocation
| Percentage of total net assets | 100.0 | % | |||||
| Materials | 26.4 | % | |||||
| Industrials | 20.4 | % | |||||
| Consumer Discretionary | 15.5 | % | |||||
| Financials | 14.2 | % | |||||
| Consumer Staples | 7.9 | % | |||||
| Telecommunication Services | 5.9 | % | |||||
| Information Technology | 3.7 | % | |||||
| Utilities | 3.7 | % | |||||
| Energy | 2.3 | % | |||||
Average Annual Total Returns
| Three Months | Six Months | 1-Year | 5-Year | 10-Year | Since Inception | Inception Date | |||||||||||||||||||||
| Ordinary Shares | 5.34 | % | 19.85 | % | 22.08 | % | 21.55 | % | N/A | 11.71 | % | 05/15/98 | |||||||||||||||||||
| Ordinary Shares (adjusted)1 | 4.29 | % | 18.66 | % | 20.86 | % | 21.31 | % | N/A | 11.59 | % | 05/15/98 | |||||||||||||||||||
| Institutional Shares2 | 5.46 | % | 20.03 | % | 22.37 | % | 21.85 | % | N/A | 15.19 | % | 12/18/98 | |||||||||||||||||||
| MSCI EAFE | 4.15 | % | 14.98 | % | 20.69 | % | 16.24 | % | 8.67 | % | 7.63 | % | ———— | ||||||||||||||||||
1 Reflects deduction of a 1% deferred sales charge.
2 Institutional Shares may only be purchased by certain categories of investors and are not subject to sales charges or distribution fees.
3 The Morgan Stanley Capital International Europe, Australasia, and Far East ("MSCI EAFE") Index is an unmanaged index comprised of stocks in countries other than the United States. It is widely recognized as representative of the general market for foreign markets. Index returns assume the reinvestment of dividends and, unlike Fund returns, do not reflect any fees or expenses. You cannot invest directly in an Index. The beginning date for the Index is 6/30/98.
Investing in foreign markets, particularly emerging markets, can be more volatile than the U.S. market due to increased risks of adverse issuer, political, regulatory, market or economic developments and can perform differently than the U.S. market.
Performance data quoted represents past performance and is no guarantee of future results. Current performance may be lower or higher than performance data quoted. Investment return and principal value will fluctuate so that an investor's shares, when redeemed, may be worth more or less than original cost. For the most recent month-end performance, visit the Fund's website at www.quantfunds.com. Before investing, carefully consider the Fund's investment objectives, risks, charges and expenses. For this and other information obtain the Fund's prospectus by calling (800) 326-2151 or visiting www.quantfunds.com. Please read the prospectus carefully before you invest.
10
QUANT SMALL CAP FUND
SCHEDULE OF INVESTMENTS
March 31, 2007
| Common Stock—95.8% | |||||||||||
| Shares | Value | ||||||||||
| AEROSPACE & DEFENSE—1.5% | |||||||||||
| BE Aerospace, Inc. (a) | 62,871 | $ | 1,993,011 | ||||||||
| CHEMICALS—1.7% | |||||||||||
| Cambrex Corporation | 97,207 | 2,391,292 | |||||||||
| COMMERCIAL SERVICES & SUPPLIES—13.5% | |||||||||||
| AMN Healthcare Services, Inc. (a) | 62,496 | 1,413,659 | |||||||||
| CRA International, Inc. (a) | 21,745 | 1,134,654 | |||||||||
| Huron Consulting Group, Inc. (a) | 38,059 | 2,315,510 | |||||||||
| inVentiv Health, Inc. (a) | 33,457 | 1,281,069 | |||||||||
| Kforce Inc. (a) | 150,149 | 2,067,552 | |||||||||
| Mobile Mini, Inc. (a) | 51,262 | 1,372,796 | |||||||||
| Sotheby's (a) | 92,008 | 4,092,516 | |||||||||
| Symmetry Holdings Inc. | 97,662 | 778,366 | |||||||||
| Waste Connections, Inc. (a) | 73,700 | 2,206,578 | |||||||||
| Williams Scotsman International, Inc. (a) | 95,182 | 1,871,278 | |||||||||
| 18,533,978 | |||||||||||
| COMMUNICATIONS EQUIPMENT—7.7% | |||||||||||
| ARRIS Group, Inc. (a) | 34,525 | 486,112 | |||||||||
| Comtech Telecommunications Corp. (a) | 35,702 | 1,382,739 | |||||||||
| Comverse Technology, Inc. (a) | 53,529 | 1,142,844 | |||||||||
| DSP Group Inc. (a) | 60,820 | 1,155,580 | |||||||||
| NICE-Systems, Ltd. (a) (b) | 95,448 | 3,247,141 | |||||||||
| Polycom, Inc. (a) | 51,453 | 1,714,928 | |||||||||
| Sierra Wireless, Inc. (a) | 91,961 | 1,442,868 | |||||||||
| 10,572,212 | |||||||||||
| DIVISIFIED FINANCIAL SERVICES—0.0% | |||||||||||
| Leesport Financial Corporation | 145 | 3,135 | |||||||||
| ENERGY EQUIPMENT & SERVICES—5.2% | |||||||||||
| Core Laboratories N.V. (a) | 77,100 | 6,463,293 | |||||||||
| Dril-Quip, Inc. (a) | 15,102 | 653,615 | |||||||||
| 7,116,908 | |||||||||||
| FOOD PRODUCTS—4.2% | |||||||||||
| The Great Atlantic & Pacific Tea Company, Inc. | 52,295 | 1,735,148 | |||||||||
| The Hain Celestial Group, Inc. (a) | 39,853 | 1,198,380 | |||||||||
| United Natural Foods, Inc. (a) | 39,724 | 1,217,143 | |||||||||
| Wild Oats Markets, Inc. (a) | 85,519 | 1,556,446 | |||||||||
| 5,707,117 | |||||||||||
| HEALTH CARE EQUIPMENT & SERVICES—12.2% | |||||||||||
| AngioDynamics, Inc. (a) | 20,280 | 342,529 | |||||||||
| Omnicell Inc. (a) | 117,940 | 2,467,305 | |||||||||
| Psychiatric Solutions, Inc. (a) | 81,734 | 3,294,698 | |||||||||
| Schein (Henry), Inc. (a) | 43,462 | 2,398,233 | |||||||||
| Sierra Health Services, Inc. (a) | 141,720 | 5,834,612 | |||||||||
| Stereotaxis, Inc. (a) | 34,790 | 414,001 | |||||||||
| Sunrise Senior Living, Inc. (a) | 50,184 | 1,983,272 | |||||||||
| 16,734,650 | |||||||||||
| Shares | Value | ||||||||||
| HOTELS, RESTAURANTS & LEISURE—7.1% | |||||||||||
| California Pizza Kitchen, Inc. (a) | 19,049 | $ | 626,522 | ||||||||
| National CineMedia, Inc. (a) | 22,978 | 613,512 | |||||||||
| RARE Hospitality International, Inc. (a) | 80,421 | 2,419,868 | |||||||||
| Sonic Corp. (a) | 82,522 | 1,838,590 | |||||||||
| Vail Resorts, Inc. (a) | 77,157 | 4,191,940 | |||||||||
| 9,690,432 | |||||||||||
| INSURANCE—1.4% | |||||||||||
| FPIC Insurance Group, Inc. (a) | 5,910 | 264,000 | |||||||||
| Selective Insurance Group, Inc. | 67,582 | 1,720,638 | |||||||||
| 1,984,638 | |||||||||||
| INTERNET & CATALOG RETAIL—2.3% | |||||||||||
| NutriSystem Inc. (a) | 60,909 | 3,192,241 | |||||||||
| LEISURE EQUIPMENT & PRODUCTS—0.7% | |||||||||||
| LeapFrog Enterprises, Inc. (a) | 95,229 | 1,018,950 | |||||||||
| MACHINERY—2.6% | |||||||||||
| Gardner Denver, Inc. (a) | 73,332 | 2,555,620 | |||||||||
| TurboChef Technologies, Inc. (a) | 69,775 | 1,061,976 | |||||||||
| 3,617,596 | |||||||||||
| MEDIA—4.2% | |||||||||||
| Entercom Communications Corporation | 91,746 | 2,585,402 | |||||||||
| Lions Gate Entertainment Corporation (a) | 209,919 | 2,397,275 | |||||||||
| Regal Entertainment Group | 42,756 | 849,562 | |||||||||
| 5,832,239 | |||||||||||
| METALS & MINING —1.2% | |||||||||||
| Coeur d'Alene Mines Corporation (a) | 395,212 | 1,624,321 | |||||||||
| OIL & GAS—0.4% | |||||||||||
| Edge Petroleum Corporation (a) | 49,062 | 614,256 | |||||||||
| PHARMACEUTICALS—1.2% | |||||||||||
| American Oriental Bioengineering, Inc. (a) | 175,465 | 1,647,616 | |||||||||
| REAL ESTATE—14.9% | |||||||||||
| American Campus Communities, Inc. | 60,185 | 1,823,004 | |||||||||
| Entertainment Properties Trust | 108,894 | 6,560,863 | |||||||||
| FelCor Lodging Trust Inc. | 70,045 | 1,819,069 | |||||||||
| Grubb & Ellis Company (a) | 122,060 | 1,434,205 | |||||||||
| Hersha Hospitality Trust | 152,538 | 1,796,898 | |||||||||
| Strategic Hotel & Resorts, Inc. | 115,130 | 2,633,023 | |||||||||
| Ventas, Inc. | 103,641 | 4,366,395 | |||||||||
| 20,433,457 | |||||||||||
| RETAILING-—2.7% | |||||||||||
| GUESS?, Inc. (a) | 69,642 | 2,819,804 | |||||||||
| Urban Outfitters, Inc. (a) | 31,641 | 838,803 | |||||||||
| 3,658,607 | |||||||||||
| SOFTWARE & SERVICES—5.6% | |||||||||||
| Euronet Worldwide, Inc. (a) | 46,692 | 1,254,147 | |||||||||
| Internet Capital Group, Inc. (a) | 80,765 | 864,185 | |||||||||
| Macrovision Corporation (a) | 75,293 | 1,886,090 | |||||||||
| STEC, Inc (a) | 73,974 | 520,777 | |||||||||
| Ulticom, Inc. (a) | 167,009 | 1,369,474 | |||||||||
| Verint Systems Inc. (a) | 57,241 | 1,840,298 | |||||||||
| 7,734,971 | |||||||||||
The accompanying notes are an integral part of these financial statements.
11
QUANT SMALL CAP FUND
SCHEDULE OF INVESTMENTS (continued)
March 31, 2007
| Shares | Value | ||||||||||
| TELECOMMUNICATION SERVICES—0.2% | |||||||||||
| Atlantic Tele-Network, Inc. | 7,786 | $ | 203,448 | ||||||||
| WIRELESS TELECOMMUNICATION SERVICES—5.3% | |||||||||||
| Crown Castle International Corporation (a) | 171,367 | 5,506,022 | |||||||||
| SBA Communications Corporation (a) | 60,600 | 1,790,730 | |||||||||
| 7,296,752 | |||||||||||
| TOTAL COMMON STOCK (Cost $90,856,082) | 131,601,827 | ||||||||||
| Short Term Investments—4.1% | |||||||||||
| Par Value | Value | ||||||||||
| State Street Bank & Trust Repurchase Agreement 1.7%, 04/02/07, (Dated 03/30/07), Collateralized by $5,800,000 par U.S. Treasury Bill—Zero Coupon, 05/03/07, Market Value $5,771,000.00, Repurchase Proceeds $5,656,801.27 (Cost $5,656,000) | $ | 5,656,000 | $ | 5,656,000 | |||||||
| TOTAL INVESTMENTS—99.9% (Cost $96,512,082) (c) | 137,257,827 | ||||||||||
| OTHER ASSETS & LIABILITIES (NET)—0.1% | 140,026 | ||||||||||
| NET ASSETS—100% | $ | 137,397,853 | |||||||||
(a) Non-income producing security
(b) ADR—American Depositary Receipts
(c) At March 31, 2007, the unrealized appreciation of investments based on aggregate cost for federal tax purposes of $96,242,092 was as follows:
| Aggregate gross unrealized appreciation for all investments in which there is an excess of value over tax cost | $ | 42,755,457 | |||||
| Aggregate gross unrealized depreciation for all investments in which there is an excess of tax cost over value | (1,739,722 | ) | |||||
| Net unrealized appreciation | $ | 41,015,735 | |||||
The percentage of each investment category is calculated as a percentage of net assets.
The accompanying notes are an integral part of these financial statements.
12
QUANT LONG/SHORT FUND
SCHEDULE OF INVESTMENTS
March 31, 2007
| Common Stock—98.6% | |||||||||||
| Shares | Value | ||||||||||
| Long Positions—127.5% | |||||||||||
| AEROSPACE & DEFENSE—2.0% | |||||||||||
| Lockheed Martin Corporation* | 15,900 | $ | 1,542,618 | ||||||||
| AUTOMOBILES & COMPONENTS—0.1% | |||||||||||
| ArvinMeritor, Inc. | 2,700 | 49,275 | |||||||||
| BANKS—5.9% | |||||||||||
| Bank of America Corporation* | 63,400 | 3,234,668 | |||||||||
| Comerica Incorporated* | 900 | 53,208 | |||||||||
| National City Corporation | 3,600 | 134,100 | |||||||||
| Wells Fargo & Company* | 31,800 | 1,094,874 | |||||||||
| 4,516,850 | |||||||||||
| CHEMICALS—0.3% | |||||||||||
| Hercules Incorporated (a) | 12,500 | 244,250 | |||||||||
| COMMERCIAL SERVICES AND SUPPLIES—8.7% | |||||||||||
| Career Education Corporation (a)* | 68,400 | 2,086,200 | |||||||||
| Convergys Corporation (a) | 8,600 | 218,526 | |||||||||
| Deluxe Corporation | 26,100 | 875,133 | |||||||||
| Emdeon Corporation (a)* | 109,400 | 1,655,222 | |||||||||
| ITT Educational Services, Inc. (a) | 22,500 | 1,833,525 | |||||||||
| 6,668,606 | |||||||||||
| COMMUNICATIONS EQUIPMENT—5.8% | |||||||||||
| Avaya, Inc. (a) | 108,700 | 1,283,747 | |||||||||
| Cisco Systems, Inc. (a) | �� | 35,000 | 893,550 | ||||||||
| Motorola, Inc.* | 127,400 | 2,251,158 | |||||||||
| 4,428,455 | |||||||||||
| COMPUTERS & PERIPHERALS—6.9% | |||||||||||
| Hewlett-Packard Company* | 57,000 | 2,287,980 | |||||||||
| International Business Machines | 3,100 | 292,206 | |||||||||
| Lexmark International, Inc. (a) | 22,600 | 1,321,196 | |||||||||
| Network Appliance, Inc. (a) | 39,400 | 1,438,888 | |||||||||
| 5,340,270 | |||||||||||
| CONSTRUCTION & ENGINEERING—1.5% | |||||||||||
| Quanta Services, Inc. (a) | 46,200 | 1,165,164 | |||||||||
| CONTAINERS & PACKAGING—3.7% | |||||||||||
| Jarden Corporation (a) | 10,600 | 405,980 | |||||||||
| Pactiv Corporation (a) | 72,000 | 2,429,280 | |||||||||
| 2,835,260 | |||||||||||
| DIVERSIFIED FINANCIAL SERVICES—9.8% | |||||||||||
| Affiliated Managers Group, Inc. (a) | 5,600 | 606,760 | |||||||||
| American Express Company* | 7,600 | 428,640 | |||||||||
| AmeriCredit Corporation (a) | 7,600 | 173,736 | |||||||||
| Ameriprise Financial, Inc. | 3,600 | 205,704 | |||||||||
| Capital One Financial Corporation | 2,300 | 173,558 | |||||||||
| Citigroup Inc.* | 50,266 | 2,580,656 | |||||||||
| E*TRADE Financial Corporation (a) | 9,900 | 210,078 | |||||||||
| JPMorgan Chase & Co. | 18,200 | 880,516 | |||||||||
| The First Marblehead Corporation* | 51,350 | 2,305,102 | |||||||||
| 7,564,750 | |||||||||||
| Shares | Value | ||||||||||
| DIVERSIFIED TELECOMMUNICATION SERVICES—2.5% | |||||||||||
| AT&T Corporation | 38,087 | $ | 1,501,770 | ||||||||
| CenturyTel, Inc. | 8,500 | 384,115 | |||||||||
| 1,885,885 | |||||||||||
| ELECTRIC UTILITIES—1.1% | |||||||||||
| American Electric Power Company, Inc. | 10,600 | 516,750 | |||||||||
| FirstEnergy Corp. | 800 | 52,992 | |||||||||
| OGE Energy Corp. | 8,100 | 314,280 | |||||||||
| 884,022 | |||||||||||
| ELECTRONIC EQUIPMENT & INSTRUMENTS—0.5% | |||||||||||
| Thermo Fisher Scientific, Inc. (a) | 7,700 | 359,975 | |||||||||
| ENERGY EQUIPMENT & SERVICES—0.3% | |||||||||||
| Tidewater, Inc. | 3,700 | 216,746 | |||||||||
| FOOD & STAPLES RETAILING—2.7% | |||||||||||
| Carolina Group | 6,100 | 461,221 | |||||||||
| Coca-Cola Enterprises, Inc. | 1,600 | 32,400 | |||||||||
| ConAgra Foods, Inc.* | 30,000 | 747,300 | |||||||||
| Dean Foods Company | 7,700 | 359,898 | |||||||||
| General Mills, Inc. | 7,800 | 454,116 | |||||||||
| 2,054,935 | |||||||||||
| GAS UTILITIES—0.8% | |||||||||||
| UGI Corporation | 22,100 | 590,291 | |||||||||
| HEALTH CARE EQUIPMENT & SERVICES—1.3% | |||||||||||
| DENTSPLY International, Inc. | 3,200 | 104,800 | |||||||||
| Humana Inc. (a) | 2,500 | 145,050 | |||||||||
| McKesson Corporation | 7,100 | 415,634 | |||||||||
| Waters Corporation (a) | 6,000 | 348,000 | |||||||||
| 1,013,484 | |||||||||||
| HEALTH CARE PROVIDERS & SERVICES—7.4% | |||||||||||
| AMERIGROUP Corporation (a)* | 40,500 | 1,231,200 | |||||||||
| CIGNA Corporation* | 18,700 | 2,667,742 | |||||||||
| Wellcare Health Plans, Inc. (a) | 20,800 | 1,773,200 | |||||||||
| 5,672,142 | |||||||||||
| HOTELS, RESTAURANTS & LEISURE—0.7% | |||||||||||
| McDonald's Corporation | 11,000 | 495,550 | |||||||||
| HOUSEHOLD PRODUCTS—1.8% | |||||||||||
| Energizer Holdings, Inc. (a)* | 16,700 | 1,425,011 | |||||||||
| INDUSTRIAL CONGLOMERATES—0.5% | |||||||||||
| Cooper Industries, Ltd | 5,000 | 224,950 | |||||||||
| General Electric Company | 4,700 | 166,192 | |||||||||
| 391,142 | |||||||||||
| INSURANCE—5.6% | |||||||||||
| AFLAC Inc. | 2,800 | 131,768 | |||||||||
| American International Group, Inc. | 10,800 | 725,976 | |||||||||
| MetLife, Inc. | 17,100 | 1,079,865 | |||||||||
| RenaissanceRe Holdings, Ltd. | 29,500 | 1,479,130 | |||||||||
| The Travelers Companies, Inc. | 16,900 | 874,913 | |||||||||
| 4,291,652 | |||||||||||
The accompanying notes are an integral part of these financial statements.
13
QUANT LONG/SHORT FUND
SCHEDULE OF INVESTMENTS (continued)
March 31, 2007
| Shares | Value | ||||||||||
| LEISURE EQUIPMENT & PRODUCTS—4.0% | |||||||||||
| Hasbro, Inc. | 59,400 | $ | 1,700,028 | ||||||||
| Mattel, Inc. | 49,000 | 1,350,930 | |||||||||
| 3,050,958 | |||||||||||
| MACHINERY—5.3% | |||||||||||
| AGCO Corporation (a) | 66,400 | 2,454,808 | |||||||||
| Terex Corporation (a) | 22,500 | 1,614,600 | |||||||||
| 4,069,408 | |||||||||||
| MARINE—1.7% | |||||||||||
| Overseas Shipholding Group, Inc.* | 20,100 | 1,258,260 | |||||||||
| MEDIA—4.3% | |||||||||||
| CBS Corporation Class B* | 72,200 | 2,208,598 | |||||||||
| Gannett Co., Inc. | 1,300 | 73,177 | |||||||||
| Omnicom Group, Inc. | 10,100 | 1,034,038 | |||||||||
| 3,315,813 | |||||||||||
| METALS & MINING—0.7% | |||||||||||
| Nucor Corporation | 7,700 | 501,501 | |||||||||
| OIL & GAS—7.5% | |||||||||||
| ChevronTexaco Corporation | 2,600 | 192,296 | |||||||||
| Exxon Mobil Corporation* | 46,100 | 3,478,245 | |||||||||
| Plains Exploration & Production Company (a) | 2,200 | 99,308 | |||||||||
| Tesoro Corporation | 11,100 | 1,114,773 | |||||||||
| TODCO (a) | 21,000 | 846,930 | |||||||||
| 5,731,552 | |||||||||||
| PHARMACEUTICALS & BIOTECHNOLOGY—8.3% | |||||||||||
| AmerisourceBergen Corporation | 17,400 | 917,850 | |||||||||
| Endo Pharmaceuticals Holdings, Inc. (a)* | 70,100 | 2,060,940 | |||||||||
| Merck & Co., Inc. | 33,500 | 1,479,695 | |||||||||
| Pfizer Inc.* | 75,700 | 1,912,182 | |||||||||
| 6,370,667 | |||||||||||
| REAL ESTATE—1.6% | |||||||||||
| Corrections Corporation of America (a) | 23,300 | 1,230,473 | |||||||||
| RETAILING—13.6% | |||||||||||
| Big Lots, Inc (a)* | 103,700 | 3,243,736 | |||||||||
| Kohl's Corporation | 23,100 | 1,769,691 | |||||||||
| Payless ShoeSource, Inc. (a)* | 65,100 | 2,161,320 | |||||||||
| Sears Holdings Corporation (a) | 13,900 | 2,504,224 | |||||||||
| Sherwin-Williams Company | 12,000 | 792,480 | |||||||||
| 10,471,451 | |||||||||||
| SEMICONDUCTOR EQUIPMENT—2.5% | |||||||||||
| LSI Logic Corporation (a) | 134,900 | 1,408,356 | |||||||||
| RF Micro Devices, Inc. (a) | 22,000 | 137,060 | |||||||||
| Texas Instruments Incorporated | 11,700 | 352,170 | |||||||||
| 1,897,586 | |||||||||||
| SOFTWARE & SERVICES—4.9% | |||||||||||
| BMC Software, Inc. (a)* | 67,900 | 2,090,641 | |||||||||
| CSG Systems International, Inc (a) | 18,200 | 455,364 | |||||||||
| McAfee, Inc. (a) | 5,100 | 148,308 | |||||||||
| Mentor Graphics Corporation (a) | 65,300 | 1,067,002 | |||||||||
| 3,761,315 | |||||||||||
| Shares | Value | ||||||||||
| SPECIALTY RETAIL—2.8% | |||||||||||
| Aeropostale, Inc. (a) | 35,500 | $ | 1,428,165 | ||||||||
| American Eagle Outfitters, Inc. | 18,150 | 544,319 | |||||||||
| AutoZone, Inc. (a) | 1,300 | 166,582 | |||||||||
| 2,139,066 | |||||||||||
| TEXTILES & APPAREL—0.4% | |||||||||||
| Jones Apparel Group, Inc. | 10,400 | 319,592 | |||||||||
| TOTAL LONG POSITIONS—127.5% (Cost $86,377,868) (b) | 97,753,975 | ||||||||||
| Short Positions—(28.9%) | |||||||||||
| AIRLINES—(0.4%) | |||||||||||
| AirTran Holdings, Inc. (a) | (29,700 | ) | (305,019 | ) | |||||||
| BUILDING PRODUCTS—(1.4%) | |||||||||||
| USG Corporation | (22,900 | ) | (1,068,972 | ) | |||||||
| COMMERCIAL SERVICES AND SUPPLIES—(0.9%) | |||||||||||
| Stericycle, Inc. (a) | (4,900 | ) | (399,350 | ) | |||||||
| The Brink's Company | (4,700 | ) | (298,215 | ) | |||||||
| (697,565 | ) | ||||||||||
| COMMUNICATIONS EQUIPMENT—(0.8%) | |||||||||||
| Ciena Corporation (a) | (21,900 | ) | (612,105 | ) | |||||||
| COMPUTERS & PERIPHERALS—(3.8%) | |||||||||||
| Intuitive Surgical, Inc. (a) | (10,800 | ) | (1,312,956 | ) | |||||||
| Palm, Inc. (a) | (88,400 | ) | (1,602,692 | ) | |||||||
| (2,915,648 | ) | ||||||||||
| DIVERSIFIED TELECOMMUNICATION SERVICES—(0.1%) | |||||||||||
| NeuStar, Inc. (a) | (2,300 | ) | (65,412 | ) | |||||||
| FOOD & STAPLES RETAILING—(2.0%) | |||||||||||
| Rite Aid Corporation (a) | (263,400 | ) | (1,519,818 | ) | |||||||
| HEALTH CARE PROVIDERS & SERVICES—(2.0%) | |||||||||||
| Pharmaceutical Product Development, Inc. | (21,600 | ) | (727,704 | ) | |||||||
| Tenet Healthcare Corporation (a) | (123,900 | ) | (796,677 | ) | |||||||
| (1,524,381 | ) | ||||||||||
| HOTELS, RESTAURANTS & LEISURE—(2.7%) | |||||||||||
| Boyd Gaming Corporation | (23,800 | ) | (1,133,832 | ) | |||||||
| Panera Bread Company (a) | (1,300 | ) | (76,778 | ) | |||||||
| Royal Caribbean Cruises, Ltd. | (12,700 | ) | (535,432 | ) | |||||||
| Scientific Games Corporation (a) | (10,700 | ) | (351,281 | ) | |||||||
| (2,097,323 | ) | ||||||||||
| HOUSEHOLD DURABLES—(1.4%) | |||||||||||
| Hovnanian Enterprises, Inc. (a) | (41,500 | ) | (1,044,140 | ) | |||||||
| INTERNET CATELOG & REATIL—(1.7%) | |||||||||||
| Coldwater Creek, Inc. (a) | (62,600 | ) | (1,269,528 | ) | |||||||
| IT CONSULTING & SERVICES—(1.1%) | |||||||||||
| Unisys Corporation | (95,600 | ) | (805,908 | ) | |||||||
The accompanying notes are an integral part of these financial statements.
14
QUANT LONG/SHORT FUND
SCHEDULE OF INVESTMENTS (continued)
March 31, 2007
| Shares | Value | ||||||||||
| MACHINERY—(2.5%) | |||||||||||
| Joy Global, Inc. | (11,300 | ) | $ | (484,770 | ) | ||||||
| The Timken Company | (41,700 | ) | (1,263,927 | ) | |||||||
| Trinity Industries, Inc. (a) | (4,800 | ) | (201,216 | ) | |||||||
| (1,949,913 | ) | ||||||||||
| OFFICE ELECTRONICS—(0.3%) | |||||||||||
| Zebra Technologies Corporation (a) | (6,600 | ) | (254,826 | ) | |||||||
| PHARMACUITICAL & BIOTECHNOLOGY—(1.6%) | |||||||||||
| Abraxis BioScience, Inc. (a) | (37,000 | ) | (988,270 | ) | |||||||
| Gen-Probe Incorporated (a) | (4,300 | ) | (202,444 | ) | |||||||
| (1,190,714 | ) | ||||||||||
| SEMICONDUCTOR EQUIPMENT—(1.9%) | |||||||||||
| Microchip Technology Incorporated | (25,200 | ) | (895,356 | ) | |||||||
| PMC-Sierra, Inc. (a) | (83,100 | ) | (582,531 | ) | |||||||
| (1,477,887 | ) | ||||||||||
| SOFTWARE & SERVICES—(1.8%) | |||||||||||
| Novell, Inc. (a) | (88,000 | ) | (635,360 | ) | |||||||
| VeriFone Holdings, Inc. (a) | (21,100 | ) | (775,003 | ) | |||||||
| (1,410,363 | ) | ||||||||||
| SPECIALTY RETAIL—(2.5%) | |||||||||||
| Chico's FAS, Inc. (a) | (49,800 | ) | (1,216,614 | ) | |||||||
| Tractor Supply Company (a) | (14,300 | ) | (736,450 | ) | |||||||
| (1,953,064 | ) | ||||||||||
| TOTAL SHORT POSITIONS (28.9%) (Proceeds $21,608,475) (b) | (22,162,586 | ) | |||||||||
| TOTAL LONG POSITIONS 127.5% | 97,753,975 | ||||||||||
| TOTAL SHORT POSITIONS (28.9%) | (22,162,586 | ) | |||||||||
| TOTAL LONG + SHORT 98.6% | 75,591,389 | ||||||||||
| OTHER ASSETS & LIABILITIES (NET)—1.4% | 1,063,267 | ||||||||||
| NET ASSETS—100% | $ | 76,654,656 | |||||||||
(a) Non-income producing security
(b) At March 31, 2007, the unrealized appreciation of investments based on aggregate cost for federal tax purposes of $64,790,395 was as follows:
| Aggregate gross unrealized appreciation for all investments in which there is an excess of value over tax cost | $ | 13,549,081 | |||||
| Aggregate gross unrealized depreciation for all investments in which there is an excess of tax cost over value | (2,748,087 | ) | |||||
| Net unrealized appreciation | $ | 10,800,994 | |||||
The percentage of each investment category is calculated as a percentage of net assets.
* All or a portion of this security is held as collateral for securities sold short.
The accompanying notes are an integral part of these financial statements.
15
QUANT EMERGING MARKETS FUND
SCHEDULE OF INVESTMENTS
March 31, 2007
| Common Stock—89.8% | |||||||||||
| Shares | Value | ||||||||||
| BRAZIL—7.5% | |||||||||||
| Companhia Energetica de Minas Gerais (a) | 27,007 | $ | 1,313,891 | ||||||||
| Gerdau SA (a) | 181,287 | 3,286,733 | |||||||||
| Petroleo Brasileiro SA (a) | 96,859 | 8,654,352 | |||||||||
| Unibanco-Uniao de Bancos Brasileiros SA (b) | 59,031 | 5,162,851 | |||||||||
| Usinas Siderurgicas de Minas Gerais SA (a) | 69,600 | 3,394,274 | |||||||||
| 21,812,101 | |||||||||||
| CHINA—11.6% | |||||||||||
| Angang Steel Company Limited | 3,675,000 | 6,377,563 | |||||||||
| China Life Insurance Co., Limited | 1,004,000 | 2,891,039 | |||||||||
| China Mobile Limited | 894,000 | 8,134,761 | |||||||||
| China Shipping Development Company, Ltd. | 2,770,000 | 4,225,652 | |||||||||
| Hopson Development Holdings Limited | 1,802,000 | 4,524,718 | |||||||||
| Jiangxi Copper Company Limited | 2,517,000 | 3,044,057 | |||||||||
| PetroChina Company Limited | 3,564,000 | 4,223,635 | |||||||||
| 33,421,425 | |||||||||||
| CZECH REPUBLIC—1.9% | |||||||||||
| Ceske Energeticke Zavody | 124,233 | 5,584,971 | |||||||||
| HUNGARY—2.1% | |||||||||||
| MOL Hungarian Oil an Gas Nyrt. | 17,400 | 2,006,250 | |||||||||
| OTP Bank Nyrt. | 85,692 | 3,924,472 | |||||||||
| 5,930,722 | |||||||||||
| INDIA—3.6% | |||||||||||
| Infosys Technologies Limited (a) | 79,400 | 3,989,850 | |||||||||
| Mahindra & Mahindra Ltd. (b) | 118,400 | 2,130,016 | |||||||||
| State Bank of India (b) | 71,727 | 4,375,347 | |||||||||
| 10,495,213 | |||||||||||
| ISRAEL—3.1% | |||||||||||
| Partner Communications Company Ltd. | 438,714 | 6,446,216 | |||||||||
| Teva Pharmaceutical Industries Ltd. | 64,628 | 2,389,946 | |||||||||
| 8,836,162 | |||||||||||
| MALAYSIA—1.8% | |||||||||||
| Bumiputra-Commerce Holdings Bhd | 1,830,900 | 5,268,967 | |||||||||
| MEXICO—6.7% | |||||||||||
| America Movil SAB de CV | 2,074,410 | 4,976,631 | |||||||||
| Consorcio Ara S.A. de CV | 965,200 | 1,663,716 | |||||||||
| Controladora Comercial Mexicana SA de CV | 1,485,700 | 4,195,092 | |||||||||
| Grupo Mexico SAB de CV | 1,528,000 | 7,124,027 | |||||||||
| Telefonos De Mexico SA de CV (Telmex) | 860,000 | 1,430,219 | |||||||||
| 19,389,685 | |||||||||||
| PHILIPPINES—1.6% | |||||||||||
| First Philippine Holdings Corporation | 2,662,800 | 3,918,317 | |||||||||
| Petron Corporation | 7,805,598 | 760,338 | |||||||||
| 4,678,655 | |||||||||||
| Shares | Value | ||||||||||
| RUSSIA—8.5% | |||||||||||
| Gazprom (a) | 358,013 | $ | 15,000,745 | ||||||||
| LUKoil (a) | 62,900 | 5,440,850 | |||||||||
| Tatneft (a) | 44,546 | 4,231,870 | |||||||||
| 24,673,465 | |||||||||||
| SOUTH AFRICA—9.8% | |||||||||||
| African Bank Investments Limited | 805,148 | 3,348,797 | |||||||||
| Ellerine Holdings Limited | 386,624 | 4,351,842 | |||||||||
| Foschini Limited | 336,469 | 3,191,490 | |||||||||
| MTN Group Limited | 140,672 | 1,902,017 | |||||||||
| Nampak Limited | 912,654 | 2,782,436 | |||||||||
| Sasol Ltd. | 37,525 | 1,246,798 | |||||||||
| Standard Bank Group Limited | 420,984 | 6,171,735 | |||||||||
| Steinhoff International Holdings Limited | 619,758 | 1,986,458 | |||||||||
| Telkom South Africa Limited | 45,518 | 1,037,198 | |||||||||
| Tiger Brands Limited | 93,763 | 2,278,113 | |||||||||
| 28,296,884 | |||||||||||
| SOUTH KOREA—16.1% | |||||||||||
| Daelim Industrial Co., Ltd. | 51,000 | 4,883,988 | |||||||||
| GS Engineering & Construction Corp | 36,750 | 3,288,888 | |||||||||
| Hyundai Heavy Industries Co., Ltd. | 25,550 | 5,105,383 | |||||||||
| Hyundai Mipo Dockyard Co., Ltd. | 36,650 | 6,758,543 | |||||||||
| Hyundai Motor Company | 27,890 | 1,959,429 | |||||||||
| Kookmin Bank | 72,300 | 6,485,752 | |||||||||
| Samsung Electronics Co., Ltd. | 9,540 | 5,708,689 | |||||||||
| Shinhan Financial Group Co., Ltd. | 118,320 | 6,790,966 | |||||||||
| SK Corporation | 49,380 | 4,849,564 | |||||||||
| SK Telecom Co., Ltd. | 4,680 | 952,564 | |||||||||
| 46,783,766 | |||||||||||
| TAIWAN—10.7% | |||||||||||
| AU Optronics Corp | 1,129,770 | 1,614,933 | |||||||||
| China Steel Corporation | 3,991,000 | 4,498,770 | |||||||||
| Delta Electronics Inc. | 1,099,518 | 3,555,407 | |||||||||
| D-Link Corporation | 3,099,000 | 5,441,278 | |||||||||
| Hon Hai Precision Industry Co., Ltd. | 907,182 | 6,086,262 | |||||||||
| MediaTek Incorporation | 326,750 | 3,752,342 | |||||||||
| Siliconware Precision Industries Company | 3,145,297 | 5,893,273 | |||||||||
| 30,842,265 | |||||||||||
| THAILAND—2.1% | |||||||||||
| Charoen Pokphand Foods Public Company Limited | 28,441,400 | 3,785,688 | |||||||||
| PTT Public Company Limited | 385,100 | 2,298,940 | |||||||||
| 6,084,628 | |||||||||||
| TURKEY—2.7% | |||||||||||
| Turkcell Iletisim Hizmetleri AS | 364,889 | 1,862,482 | |||||||||
| Turkiye Garanti Bankasi AS | 607,435 | 2,729,309 | |||||||||
| Turkiye Sise ve Cam Fabrikalari AS (c) | 641,603 | 2,444,641 | |||||||||
| Yapi ve Kredi Bankasi AS (c) | 332,199 | 706,908 | |||||||||
| 7,743,340 | |||||||||||
| TOTAL COMMON STOCK (Cost $184,064,592) | 259,842,249 | ||||||||||
The accompanying notes are an integral part of these financial statements.
16
QUANT EMERGING MARKETS FUND
SCHEDULE OF INVESTMENTS (continued)
March 31, 2007
| Preferred Stock—4.0% | |||||||||||
| Shares | Value | ||||||||||
| BRAZIL—4.0% | |||||||||||
| Banco Bradesco SA (a) | 88,683 | $ | 3,586,341 | ||||||||
| Companhia Vale do Rio Doce (a) | 256,326 | 8,017,877 | |||||||||
| 11,604,218 | |||||||||||
| TOTAL PREFERRED STOCK (Cost $7,671,774) | 11,604,218 | ||||||||||
| Exchange Traded Funds—3.4% | |||||||||||
| OTHER—2.4% | |||||||||||
| iShares MSCI Emerging Market Index Fund | 58,800 | 6,850,200 | |||||||||
| TAIWAN—1.0% | |||||||||||
| iShares MSCI Taiwan Index Fund | 208,100 | 2,900,914 | |||||||||
| TOTAL EXCHANGE TRADED FUNDS (Cost $9,460,700) | 9,751,114 | ||||||||||
| Short Term Investments—3.0% | |||||||||||
| Par Value | Value | ||||||||||
| UNITED STATES—3.0% | |||||||||||
| State Street Bank & Trust Repurchase Agreement 1.7%, 04/02/07, (Dated 03/30/07), Collateralized by $8,990,000 par U.S. Treasury Bill—Zero Coupon, 05/03/07, Market Value $8,945,050.00, Repurchase Proceeds $8,766,241.71 (Cost $8,765,000) | $ | 8,765,000 | $ | 8,765,000 | |||||||
| TOTAL INVESTMENTS—100.2% (Cost $209,962,066) (d) | 289,962,581 | ||||||||||
| OTHER ASSETS & LIABILITIES (Net)—(0.2)% | (505,901 | ) | |||||||||
| NET ASSETS—100% | $ | 289,456,680 | |||||||||
(a) ADR—American Depositary Receipts
(b) GDR—Global Depositary Receipts
(c) Non-income producing security
(d) At March 31, 2007, the unrealized appreciation of investments based on aggregate cost for federal tax purposes of $209,962,066 was as follows:
| Aggregate gross unrealized appreciation for all investments in which there is an excess of value over tax cost | $ | 80,533,029 | |||||
| Aggregate gross unrealized depreciation for all investments in which there is an excess of tax cost over value | (532,514 | ) | |||||
| Net unrealized appreciation | $ | 80,000,515 | |||||
The percentage of each investment category is calculated as a percentage of net assets.
| SECTOR ALLOCATIONS (as a percentage of Total Common, Preferred Stock, and Exchange Traded Funds) | |||||||
| Financial | 19.9 | % | |||||
| Energy | 17.3 | % | |||||
| Material | 13.7 | % | |||||
| Information Technology | 12.8 | % | |||||
| Telecommunication Services | 9.5 | % | |||||
| Industrial | 8.6 | % | |||||
| Consumer Discretionary | 6.3 | % | |||||
| Utilities | 3.9 | % | |||||
| Consumer Staples | 3.7 | % | |||||
| Exchange Traded Funds | 3.5 | % | |||||
| Health Care | 0.8 | % | |||||
The accompanying notes are an integral part of these financial statements.
17
QUANT FOREIGN VALUE FUND
SCHEDULE OF INVESTMENTS
March 31, 2007
| Common Stock—95.3% | |||||||||||
| Shares | Value | ||||||||||
| AUSTRALIA—2.0% | |||||||||||
| BHP Billiton Ltd. | 590,850 | $ | 14,312,069 | ||||||||
| BHP Billiton PLC | 155,380 | 3,465,368 | |||||||||
| 17,777,437 | |||||||||||
| AUSTRIA—2.2% | |||||||||||
| Andritz AG | 76,890 | 19,310,962 | |||||||||
| BELGIUM—3.6% | |||||||||||
| KBC Group NV | 118,656 | 14,775,685 | |||||||||
| Solvay SA | 113,980 | 17,536,346 | |||||||||
| 32,312,031 | |||||||||||
| CANADA—1.9% | |||||||||||
| Methanex Corporation | 756,107 | 16,876,631 | |||||||||
| 16,876,631 | |||||||||||
| FINLAND—9.9% | |||||||||||
| Cargotec Corp., Class B | 279,350 | 16,890,588 | |||||||||
| KCI Konecranes OYJ | 598,080 | 20,076,804 | |||||||||
| Kone Corporation OYJ-B | 291,100 | 16,651,104 | |||||||||
| UPM-Kymmene OYJ | 625,500 | 15,952,898 | |||||||||
| YIT Oyj | 535,800 | 18,487,748 | |||||||||
| 88,059,142 | |||||||||||
| FRANCE—5.8% | |||||||||||
| Christian Dior SA | 140,673 | 17,120,393 | |||||||||
| Compagnie de Saint Gobain SA | 175,320 | 17,156,397 | |||||||||
| Imerys SA | 184,998 | 17,195,445 | |||||||||
| 51,472,235 | |||||||||||
| GERMANY—1.9% | |||||||||||
| Continental AG | 134,337 | 17,384,135 | |||||||||
| IRELAND—6.0% | |||||||||||
| Bank of Ireland | 745,100 | 16,093,432 | |||||||||
| CRH PLC | 394,990 | 16,893,753 | |||||||||
| Greencore Group PLC | 3,052,882 | 18,766,704 | |||||||||
| Smurfit Kappa PLC | 94,600 | 2,365,889 | |||||||||
| 54,119,778 | |||||||||||
| JAPAN—18.5% | |||||||||||
| Asahi Breweries Ltd. | 1,013,200 | 16,288,419 | |||||||||
| Central Japan Railway Company | 1,402 | 15,979,926 | |||||||||
| Iino Kaiun Kaisha | 1,533,600 | 16,410,231 | |||||||||
| Kansai Electric Power Company Inc. | 539,200 | 15,547,893 | |||||||||
| KDDI Corporation | 2,136 | 17,096,721 | |||||||||
| Maruichi Steel Tube Ltd. | 547,800 | 17,053,953 | |||||||||
| Meiji Dairies Corporation | 2,201,000 | 17,317,441 | |||||||||
| Nippon Yusen Kabushiki Kaisha | 2,184,000 | 17,555,225 | |||||||||
| Showa Denko K.K. | 4,322,000 | 16,285,850 | |||||||||
| Tokyo Electric Power Company Inc. | 468,100 | 16,045,958 | |||||||||
| 165,581,617 | |||||||||||
| Shares | Value | ||||||||||
| MEXICO—1.8% | |||||||||||
| Cemex S.A. de CV (a) | 490,593 | $ | 16,066,921 | ||||||||
| NETHERLANDS—2.4% | |||||||||||
| ABN-AMRO Holdings NV | 495,134 | 21,335,846 | |||||||||
| NORWAY—7.6% | |||||||||||
| Aker Seafoods ASA | 1,137,962 | 6,758,428 | |||||||||
| Austevoll Seafood ASA | 810,908 | 7,604,264 | |||||||||
| Camillo Eitzen & Co. ASA | 1,448,379 | 15,250,108 | |||||||||
| DNB Holding ASA | 1,224,533 | 17,284,965 | |||||||||
| Eitzen Maritime Services ASA (b) | 231,851 | 83,915 | |||||||||
| Yara International ASA | 750,600 | 20,714,851 | |||||||||
| 67,696,531 | |||||||||||
| PORTUGAL—2.0% | |||||||||||
| Portugal Telecom SGPS SA | 1,303,624 | 17,486,982 | |||||||||
| SOUTH AFRICA—8.0% | |||||||||||
| Impala Platinum Holdings Ltd. | 594,665 | 18,612,157 | |||||||||
| Metorex Ltd. (b) | 5,192,918 | 16,451,963 | |||||||||
| Sappi Ltd. | 1,154,683 | 17,435,159 | |||||||||
| Sasol Ltd. | 581,135 | 19,308,679 | |||||||||
| 71,807,958 | |||||||||||
| SOUTH KOREA—5.3% | |||||||||||
| Samsung Electronics Company Ltd. | 26,947 | 16,124,952 | |||||||||
| Samsung SDI Company Ltd. | 243,521 | 15,555,734 | |||||||||
| SK Telecom Company Ltd. | 78,194 | 15,915,556 | |||||||||
| 47,596,242 | |||||||||||
| SPAIN—1.9% | |||||||||||
| Banco Bilbao Vizcaya Argentaria | 682,910 | 16,786,902 | |||||||||
| SWEDEN—3.0% | |||||||||||
| Autoliv Inc. (b) | 169,230 | 9,664,725 | |||||||||
| Investor AB | 709,156 | 16,853,363 | |||||||||
| 26,518,088 | |||||||||||
| UNITED KINGDOM—11.5% | |||||||||||
| Barratt Developments PLC | 718,560 | 15,629,664 | |||||||||
| Bellway PLC | 568,580 | 17,795,616 | |||||||||
| Crest Nicholson PLC | 1,380,327 | 16,832,461 | |||||||||
| George Wimpey PLC | 1,481,836 | 18,537,028 | |||||||||
| Lloyds TSB Group PLC | 1,573,827 | 17,348,796 | |||||||||
| Persimmon PLC | 607,050 | 16,800,960 | |||||||||
| 102,944,525 | |||||||||||
| TOTAL COMMON STOCK (Cost $630,445,660) | 851,133,963 | ||||||||||
The accompanying notes are an integral part of these financial statements.
18
QUANT FOREIGN VALUE FUND
SCHEDULE OF INVESTMENTS (continued)
March 31, 2007
| Short Term Investments—4.6% | |||||||||||
| Par Value | Value | ||||||||||
| UNITED STATES—4.6% | |||||||||||
| State Street Bank & Trust Repurchase Agreement 1.7%, 04/02/07, (Dated 3/30/07), Collateralized by $42,245,000 U.S. Treasury Note 3.875%, 07/31/07, Market Value $42,342,247.99, Repurchase Proceeds $41,515,880.58 (Cost $41,510,000) | $ | 41,510,000 | $ | 41,510,000 | |||||||
| TOTAL INVESTMENTS—99.9% (Cost $671,955,660) (c) | 892,643,963 | ||||||||||
| OTHER ASSETS & LIABILITIES (NET)—0.1% | 659,739 | ||||||||||
| NET ASSETS—100% | $ | 893,303,702 | |||||||||
(a) ADR—American Depository Receipts
(b) Non-income producing security
(c) At March 31, 2007, the unrealized appreciation of investments based on aggregate cost for federal tax purposes of $673,314,079 was as follows:
| Aggregate gross unrealized appreciation for all investments in which there is an excess of value over tax cost | $ | 223,856,661 | |||||
| Aggregate gross unrealized depreciation for all investments in which there is an excess of tax cost over value | (4,526,777 | ) | |||||
| Net unrealized appreciation | $ | 219,329,884 | |||||
The percentage of each investment category is calculated as a percentage of net assets.
| SECTOR ALLOCATIONS (as a percentage of Total Common and Preferred Stock) | |||||||
| Material | 26.4 | % | |||||
| Industrial | 20.4 | % | |||||
| Consumer Discretionary | 15.5 | % | |||||
| Financial | 14.2 | % | |||||
| Consumer Staples | 7.9 | % | |||||
| Telecommunication Services | 5.9 | % | |||||
| Information Technology | 3.7 | % | |||||
| Utilities | 3.7 | % | |||||
| Energy | 2.3 | % | |||||
The accompanying notes are an integral part of these financial statements.
19
QUANT FUNDS
STATEMENTS OF ASSETS AND LIABILITIES
March 31, 2007
| Small Cap | Long/Short | Emerging Markets | Foreign Value | ||||||||||||||||
| Assets: | |||||||||||||||||||
| Investments at value (Note 2) | $ | 131,601,827 | $ | 97,753,975 | $ | 281,197,581 | $ | 851,133,963 | |||||||||||
| Repurchase Agreements | 5,656,000 | — | 8,765,000 | 41,510,000 | |||||||||||||||
| Foreign currency at value (Cost $285,906 for Emerging Markets and $1,222,149 for Foreign Value) | — | — | 285,544 | 1,223,749 | |||||||||||||||
| Cash | 1,484 | 85,149 | 1,436 | 1,214 | |||||||||||||||
| Cash on deposit with brokers for securities sold short | — | 1,190,116 | — | — | |||||||||||||||
| Dividends, interest and foreign tax reclaims receivable | 225,011 | 56,389 | 453,548 | 4,642,729 | |||||||||||||||
| Receivable for investments sold | 15 | — | 1,615,065 | 6,053,548 | |||||||||||||||
| Receivable for shares of beneficial interest sold | 113,764 | 20,000 | 787,526 | 3,218,575 | |||||||||||||||
| Other assets | 13,864 | 7,527 | 7,239 | 22,389 | |||||||||||||||
| Total assets | 137,611,965 | 99,113,156 | 293,112,939 | 907,806,167 | |||||||||||||||
| Liabilities: | |||||||||||||||||||
| Securities sold short, at value (proceeds of $21,608,475) | — | 22,162,586 | — | — | |||||||||||||||
| Payable for investments purchased | — | — | 2,985,551 | 12,473,352 | |||||||||||||||
| Payable for shares of beneficial interest repurchased | — | 169,375 | 157,603 | 848,535 | |||||||||||||||
| Payable for compensation of manager (Note 3) | 113,735 | 64,691 | 232,629 | 722,551 | |||||||||||||||
| Payable for distribution fees (Note 3) | 51,831 | 31,859 | 55,755 | 157,451 | |||||||||||||||
| Payable to custodian | 3,120 | 7,968 | 22,401 | 41,751 | |||||||||||||||
| Payable to transfer agent (Note 3) | 14,132 | 14,754 | 37,900 | 139,428 | |||||||||||||||
| Payable for foreign capital gain tax | — | — | 115,499 | — | |||||||||||||||
| Payable for dividend expense on securities sold short | — | — | — | — | |||||||||||||||
| Other accrued expenses | 31,294 | 7,267 | 48,921 | 119,397 | |||||||||||||||
| Total liabilities | $ | 214,112 | $ | 22,458,500 | $ | 3,656,259 | $ | 14,502,465 | |||||||||||
| Net assets | $ | 137,397,853 | $ | 76,654,656 | $ | 289,456,680 | $ | 893,303,702 | |||||||||||
| Net Assets Consist of: | |||||||||||||||||||
| Shares of beneficial interest | $ | 93,472,754 | $ | 64,921,484 | $ | 207,154,607 | $ | 668,666,007 | |||||||||||
| Underdistributed/(overdistributed) net investment income | — | — | (18,663 | ) | 4,871,970 | ||||||||||||||
| Accumulated net realized gain/(loss) on investments and foreign denominated assets, liabilities and currency | 3,179,354 | 911,176 | 2,438,653 | (956,908 | ) | ||||||||||||||
| Unrealized appreciation/(depreciation) of investments and foreign denominated assets, liabilities and currency | 40,745,745 | 10,821,996 | 79,882,083 | 220,722,633 | |||||||||||||||
| Net assets | $ | 137,397,853 | $ | 76,654,656 | $ | 289,456,680 | $ | 893,303,702 | |||||||||||
| Investments at cost | $ | 96,512,082 | $ | 86,377,868 | $ | 209,962,066 | $ | 671,955,660 | |||||||||||
| Net assets | |||||||||||||||||||
| Ordinary Shares | $ | 124,997,369 | $ | 75,375,416 | $ | 276,698,086 | $ | 778,104,295 | |||||||||||
| Institutional Shares | $ | 12,400,484 | $ | 1,279,240 | $ | 12,758,594 | $ | 115,199,407 | |||||||||||
| Shares of beneficial interest outstanding (unlimited number of shares authorized) | |||||||||||||||||||
| Ordinary Shares | 5,235,382 | 4,423,959 | 11,857,402 | 33,720,836 | |||||||||||||||
| Institutional Shares | 464,199 | 71,866 | 539,094 | 4,967,713 | |||||||||||||||
| Net asset value and offering price per share* | |||||||||||||||||||
| Ordinary Shares | $ | 23.88 | $ | 17.04 | $ | 23.34 | $ | 23.07 | |||||||||||
| Institutional Shares | $ | 26.71 | $ | 17.80 | $ | 23.67 | $ | 23.19 | |||||||||||
* A deferred sales charge amounting to 1% of the net asset value of the Ordinary Shares redeemed is withheld and paid to the Distributor. No deferred sales charge is withheld from redemptions of the Institutional Shares. A redemption fee of 2% is withheld and paid to the Funds on redemptions of Institutional Shares made within 60 days of purchase.
The accompanying notes are an integral part of these financial statements.
20
QUANT FUNDS
STATEMENTS OF OPERATIONS
Year Ended March 31, 2007
| Small Cap | Long/Short | Emerging Markets | Foreign Value | ||||||||||||||||
| Investment Income: | |||||||||||||||||||
| Dividends* | $ | 1,089,068 | $ | 1,045,005 | $ | 4,589,722 | $ | 14,266,367 | |||||||||||
| Interest | 99,057 | — | 90,875 | 826,221 | |||||||||||||||
| Miscellaneous | — | 3,345 | — | 7 | |||||||||||||||
| Total Investment Income | 1,188,125 | 1,048,350 | 4,680,597 | 15,092,595 | |||||||||||||||
| Expenses: | |||||||||||||||||||
| Dividend expense on securities sold short | — | 14,164 | — | — | |||||||||||||||
| Compensation of manager (Note 3) | 1,163,756 | 576,504 | 1,922,070 | 6,061,408 | |||||||||||||||
| Distribution fees, Ordinary Shares (Note 3) | 525,578 | 328,398 | 467,528 | 1,356,215 | |||||||||||||||
| Custodian fees | 38,480 | 29,971 | 271,515 | 513,767 | |||||||||||||||
| Transfer agent fees (Note 3) : | |||||||||||||||||||
| Ordinary Shares | 184,683 | 113,365 | 313,637 | 927,327 | |||||||||||||||
| Institutional Shares | 18,624 | 1,990 | 8,530 | 110,469 | |||||||||||||||
| Audit and legal | 29,898 | 17,152 | 47,731 | 151,917 | |||||||||||||||
| Registration fees | 34,264 | 30,588 | 60,750 | 128,123 | |||||||||||||||
| Insurance | 13,320 | 7,638 | 20,890 | 66,660 | |||||||||||||||
| Compensation of Trustees (Note 3) | 6,426 | 3,714 | 10,531 | 33,099 | |||||||||||||||
| Printing | 14,574 | 8,400 | 24,133 | 75,822 | |||||||||||||||
| Miscellaneous | 35,771 | 23,313 | 50,493 | 143,189 | |||||||||||||||
| Total expenses before waivers/reimbursements/reductions | 2,065,374 | 1,155,197 | 3,197,808 | 9,567,996 | |||||||||||||||
| Waivers and/or reimbursements of expenses (Note 3) | — | — | — | — | |||||||||||||||
| Fees reduced by credits allowed by custodian (Note 3) | (36 | ) | (19,169 | ) | (1,869 | ) | (424 | ) | |||||||||||
| Expenses, Net | 2,065,338 | 1,136,028 | 3,195,939 | 9,567,572 | |||||||||||||||
| Net investment income/(loss) | (877,213 | ) | (87,678 | ) | 1,484,658 | 5,525,023 | |||||||||||||
| Realized and Unrealized Gain/(Loss) on Investments, Foreign Currency, and Foreign Translation: | |||||||||||||||||||
| Net realized gain/(loss) (Note 2) on: Investments | 8,372,273 | 4,833,850 | 3,687,459 | 3,125,506 | |||||||||||||||
| Securities sold short transactions | — | (237,322 | ) | — | — | ||||||||||||||
| Foreign denominated assets, liabilities, and currency | 4 | — | (71,919 | ) | (651,952 | ) | |||||||||||||
| Change in unrealized appreciation/(depreciation) of: Investments | 6,011,039 | 5,931,276 | 36,617,953 | 123,406,514 | |||||||||||||||
| Securities sold short transactions | — | (554,111 | ) | — | — | ||||||||||||||
| Foreign denominated assets, liabilities, and currency | — | — | 16,488 | 26,987 | |||||||||||||||
| Net realized and unrealized gain/(loss) | 14,383,316 | 9,973,693 | 40,249,981 | 125,907,055 | |||||||||||||||
| Net increase/(decrease) in net assets from operations | $ | 13,506,103 | $ | 9,886,015 | $ | 41,734,639 | $ | 131,432,078 | |||||||||||
* Dividends are net of foreign withholding taxes of $1,457 for Small Cap, $488,568 for Emerging Markets and $1,353,087 for Foreign Value.
The accompanying notes are an integral part of these financial statements.
21
QUANT FUNDS
STATEMENTS OF CHANGES IN NET ASSETS
| Small Cap | Long/Short | ||||||||||||||||||
| Year Ended March 31, 2007 | Year Ended March 31, 2006 | Year Ended March 31, 2007 | Year Ended March 31, 2006 | ||||||||||||||||
| Increase (Decrease) in Net Assets: | |||||||||||||||||||
| Operations: | |||||||||||||||||||
| Net investment income/(loss) | $ | (877,213 | ) | $ | (913,312 | ) | $ | (87,678 | ) | $ | 119,244 | ||||||||
| Net realized gain/(loss) on Investments foreign denominated assets, liabilities, and currency | 8,372,277 | 13,739,169 | 4,596,528 | 6,557,703 | |||||||||||||||
| Unrealized appreciation/(depreciation) of investments, foreign denominated assets, liabilities, and currency | 6,011,039 | 8,842,777 | 5,377,165 | 701,430 | |||||||||||||||
| Net increase/(decrease) from operations | 13,506,103 | 21,668,634 | 9,886,015 | 7,378,377 | |||||||||||||||
| Distributions to shareholders from: | |||||||||||||||||||
| Net investment income | |||||||||||||||||||
| Ordinary shares | — | — | (110,630 | ) | (35,346 | ) | |||||||||||||
| Institutional shares | — | — | (6,451 | ) | (4,557 | ) | |||||||||||||
| Net realized gains | |||||||||||||||||||
| Ordinary shares | (8,077,132 | ) | (11,455,318 | ) | — | — | |||||||||||||
| Institutional shares | (737,056 | ) | (1,327,896 | ) | — | — | |||||||||||||
| Total distributions | (8,814,188 | ) | (12,783,214 | ) | (117,081 | ) | (39,903 | ) | |||||||||||
| Fund share transactions (note 8) | 21,528,547 | 12,476,747 | 5,925,852 | 6,781,809 | |||||||||||||||
| Increase/(decrease) in net assets | 26,220,462 | 21,362,167 | 15,694,786 | 14,120,283 | |||||||||||||||
| Net assets beginning of period | 111,177,391 | 89,815,224 | 60,959,870 | 46,839,587 | |||||||||||||||
| Net assets end of period* | $ | 137,397,853 | $ | 111,177,391 | $ | 76,654,656 | $ | 60,959,870 | |||||||||||
| * Includes undistributed net investment income/(loss) of: | $ | — | $ | — | $ | — | $ | 117,007 | |||||||||||
The accompanying notes are an integral part of these financial statements.
22
QUANT FUNDS
STATEMENTS OF CHANGES IN NET ASSETS (continued)
| Emerging Markets | Foreign Value | ||||||||||||||||||
| Year Ended March 31, 2007 | Year Ended March 31, 2006 | Year Ended March 31, 2007 | Year Ended March 31, 2006 | ||||||||||||||||
| Increase (Decrease) in Net Assets: | |||||||||||||||||||
| Operations: | |||||||||||||||||||
| Net investment income/(loss) | $ | 1,484,658 | $ | 1,101,406 | $ | 5,525,023 | $ | 4,311,338 | |||||||||||
| Net realized gain/(loss) on investments foreign denominated assets, liabilities, and currency | 3,615,540 | 5,753,010 | 2,473,554 | 31,982,527 | |||||||||||||||
| Unrealized appreciation/(depreciation) of Investments, foreign denominated assets, liabilities, and currency | 36,634,441 | 28,809,828 | 123,433,501 | 46,351,089 | |||||||||||||||
| Net increase/(decrease) from operations | 41,734,639 | 35,664,244 | 131,432,078 | 82,644,954 | |||||||||||||||
| Distributions to shareholders from: | |||||||||||||||||||
| Net investment income | |||||||||||||||||||
| Ordinary shares | (2,130,462 | ) | (1,206,849 | ) | (1,794,854 | ) | (2,226,536 | ) | |||||||||||
| Institutional shares | (68,884 | ) | (21,130 | ) | (448,687 | ) | (213,426 | ) | |||||||||||
| Net realized gains | |||||||||||||||||||
| Ordinary shares | (4,665,791 | ) | (3,620,548 | ) | (27,366,385 | ) | (1,332,469 | ) | |||||||||||
| Institutional shares | (124,122 | ) | (50,994 | ) | (3,849,548 | ) | (104,281 | ) | |||||||||||
| Total distributions | (6,989,259 | ) | (4,899,521 | ) | (33,459,474 | ) | (3,876,712 | ) | |||||||||||
| Fund share transactions (note 8) | 108,916,113 | 52,267,192 | 322,745,234 | 169,845,562 | |||||||||||||||
| Increase/(decrease) in net assets | 143,661,493 | 83,031,915 | 420,717,838 | 248,613,804 | |||||||||||||||
| Net assets beginning of period | 145,795,187 | 62,763,272 | 472,585,864 | 223,972,060 | |||||||||||||||
| Net assets end of period* | $ | 289,456,680 | $ | 145,795,187 | $ | 893,303,702 | $ | 472,585,864 | |||||||||||
| * Includes undistributed net investment income/(loss) of: | $ | — | $ | 621,680 | $ | 4,871,970 | $ | 2,242,437 | |||||||||||
The accompanying notes are an integral part of these financial statements.
23
QUANT LONG/SHORT FUND
STATEMENT OF CASH FLOWS
Year Ended March 31, 2007
| Increase (Decrease) in cash— | |||||||
| Cash flows from operating activities: | |||||||
| Net increase/(decrease) in net assets from operations | $ | 9,886,015 | |||||
| Purchase of investment securities | (88,130,423 | ) | |||||
| Sale of investment securities | 60,291,668 | ||||||
| Increase in deposits with brokers for short sales | (1,190,116 | ) | |||||
| Decrease in dividends and interest receivable | 2,035 | ||||||
| Increase in accrued expenses | 36,853 | ||||||
| Increase in securities sold short | 21,608,475 | ||||||
| Unrealized appreciation on securities | (5,377,165 | ) | |||||
| Net realized gains from investments | (4,833,850 | ) | |||||
| Net cash used in operating activities | (7,706,508 | ) | |||||
| Cash flows from financing activities: | |||||||
| Proceeds from shares sold | 10,941,834 | ||||||
| Payment on shares redeemed | (4,956,807 | ) | |||||
| Cash distributions paid | (5,760 | ) | |||||
| Net cash provided by financing activities | 5,979,267 | ||||||
| Net increase/(decrease) in cash | (1,727,241 | ) | |||||
| Cash: | |||||||
| Beginning balance | 1,812,390 | ||||||
| Ending balance | $ | 85,149 | |||||
Supplemental disclosure of cash flow information:
Noncash financing activities excluded consist of reinvestment of dividend and capital gain distributions of $111,321. For purposes of reporting the statement of cash flows, the Fund considers all cash accounts that are not subject to withdrawal restrictions or penalties to be cash equivalents. Securities and Exchange Commission regulations do not require cash flow statements for Small Cap, Emerging Markets and Foreign Value Funds.
The accompanying notes are an integral part of these financial statements.
24
QUANT SMALL CAP FUND
FINANCIAL HIGHLIGHTS
(For a share outstanding throughout each period)
| Ordinary Shares | |||||||||||||||||||||||
| Years Ending March 31, | |||||||||||||||||||||||
| 2007 | 2006 | 2005 | 2004 | 2003 | |||||||||||||||||||
| Net Asset Value, Beginning of Period | $ | 22.99 | $ | 21.13 | $ | 19.93 | $ | 12.44 | $ | 18.71 | |||||||||||||
| Income from Investment Operations: | |||||||||||||||||||||||
| Net investment income (loss) (a)(b)(c) | (0.19 | ) | (0.22 | ) | (0.24 | ) | (0.19 | ) | (0.12 | ) | |||||||||||||
| Net realized and unrealized gain/(loss) on securities | 2.91 | 5.16 | 2.18 | 7.68 | (5.32 | ) | |||||||||||||||||
| Total from Investment Operations | 2.72 | 4.94 | 1.94 | 7.49 | (5.44 | ) | |||||||||||||||||
| Less Distributions: | |||||||||||||||||||||||
| Dividends from net investment income | — | — | — | — | — | ||||||||||||||||||
| Distributions from realized capital gains | (1.83 | ) | (3.08 | ) | (0.74 | ) | — | (0.83 | ) | ||||||||||||||
| Total Distributions | (1.83 | ) | (3.08 | ) | (0.74 | ) | — | (0.83 | ) | ||||||||||||||
| Net Asset Value, End of Period | $ | 23.88 | $ | 22.99 | $ | 21.13 | $ | 19.93 | $ | 12.44 | |||||||||||||
| Total Return (d) | 12.01 | % | 24.51 | % | 9.76 | % | 60.21 | % | (29.24 | )% | |||||||||||||
| Net Assets, End of Period (000's) | $ | 124,998 | $ | 98,879 | $ | 80,199 | $ | 69,851 | $ | 42,545 | |||||||||||||
| Ratios and Supplemental Data: | |||||||||||||||||||||||
| Ratios of expenses to average net assets: (e) | |||||||||||||||||||||||
| Excluding credits | 1.82 | % | 1.88 | % | 1.98 | % | 2.00 | % | 2.04 | % | |||||||||||||
| Gross | 1.82 | % | 1.88 | % | 1.98 | % | 2.00 | % | 2.04 | % | |||||||||||||
| Including custody credits | 1.82 | % | 1.88 | % | 1.98 | % | 2.00 | % | 2.04 | % | |||||||||||||
| Ratio of net investment income (loss) to average net assets (c) | (0.80 | )% | (1.00 | )% | (1.17 | )% | (1.13 | )% | (0.81 | )% | |||||||||||||
| Portfolio Turnover | 41 | % | 57 | % | 43 | % | 67 | % | 62 | % | |||||||||||||
| Institutional Shares | |||||||||||||||||||||||
| Years Ending March 31, | |||||||||||||||||||||||
| 2007 | 2006 | 2005 | 2004 | 2003 | |||||||||||||||||||
| Net Asset Value, Beginning of Period | $ | 25.39 | $ | 22.96 | $ | 21.48 | $ | 13.34 | $ | 19.88 | |||||||||||||
| Income from Investment Operations: | |||||||||||||||||||||||
| Net investment income (loss) (a)(b)(c) | (0.08 | ) | (0.12 | ) | (0.14 | ) | (0.11 | ) | (0.05 | ) | |||||||||||||
| Net realized and unrealized gain/(loss) on securities | 3.23 | 5.63 | 2.36 | 8.25 | (5.66 | ) | |||||||||||||||||
| Total from Investment Operations | 3.15 | 5.51 | 2.22 | 8.14 | (5.71 | ) | |||||||||||||||||
| Less Distributions: | |||||||||||||||||||||||
| Dividends from net investment income | — | — | — | — | — | ||||||||||||||||||
| Distributions from realized capital gains | (1.83 | ) | (3.08 | ) | (0.74 | ) | — | (0.83 | ) | ||||||||||||||
| Total Distributions | (1.83 | ) | (3.08 | ) | (0.74 | ) | — | (0.83 | ) | ||||||||||||||
| Net Asset Value, End of Period | $ | 26.71 | $ | 25.39 | $ | 22.96 | $ | 21.48 | $ | 13.34 | |||||||||||||
| Total Return (d) | 12.58 | % | 25.06 | % | 10.37 | % | 61.02 | % | (28.87 | )% | |||||||||||||
| Net Assets, End of Period (000's) | $ | 12,400 | $ | 12,298 | $ | 9,616 | $ | 8,089 | $ | 5,459 | |||||||||||||
| Ratios and Supplemental Data: | |||||||||||||||||||||||
| Ratios of expenses to average net assets: (e) | |||||||||||||||||||||||
| Excluding credits | 1.31 | % | 1.38 | % | 1.48 | % | 1.50 | % | 1.54 | % | |||||||||||||
| Gross | 1.31 | % | 1.38 | % | 1.48 | % | 1.50 | % | 1.54 | % | |||||||||||||
| Including custody credits | 1.31 | % | 1.38 | % | 1.48 | % | 1.50 | % | 1.54 | % | |||||||||||||
| Ratio of net investment income (loss) to average net assets (c) | (0.30 | )% | (0.50 | )% | (0.65 | )% | (0.63 | )% | (0.31 | )% | |||||||||||||
| Portfolio Turnover | 41 | % | 57 | % | 43 | % | 67 | % | 62 | % | |||||||||||||
(a) Per share numbers have been calculated using the average shares method.
(b) Reflects expense waivers/reimbursements and reductions in effect during the period. See Note 3 to the Financial Statements.
(c) Net investment income (loss) per share and the ratio of net investment income (loss) to average net assets reflect net investment income prior to certain reclassifications for federal income or excise taxes.
(d) Total Return does not include the deferred sales charge of 1% for the Ordinary Shares. The total return would have been lower if certain fees had not been waived or if custodial fees had not been reduced by credits allowed by the custodian. See Note 3 to the financial statements.
(e) Ratios of expenses to average net assets:
— Excluding Credits (total expenses less fee waivers and reimbursements by the investment advisor, if any).
— Gross (total expenses excluding account fee waivers, reimbursements by the investment advisor, and custody earnings credits, if any).
— Including Credits (total expenses less fee waivers, reimbursements by the investment advisor, and custody earnings credits, if any).
The accompanying notes are an integral part of these financial statements.
25
QUANT LONG/SHORT FUND
FINANCIAL HIGHLIGHTS (continued)
(For a share outstanding throughout each period)
| Ordinary Shares | |||||||||||||||||||||||
| Years Ended March 31, | |||||||||||||||||||||||
| 2007 | 2006 | 2005 | 2004 | 2003 | |||||||||||||||||||
| Net Asset Value, Beginning of Period | $ | 14.76 | $ | 12.88 | $ | 12.19 | $ | 9.58 | $ | 12.87 | |||||||||||||
| Income from Investment Operations: | |||||||||||||||||||||||
| Net investment income (loss) (a)(b)(c) | (0.02 | ) | 0.03 | 0.01 | (0.02 | ) | (0.06 | ) | |||||||||||||||
| Net realized and unrealized gain/(loss) on securities | 2.33 | 1.86 | 0.68 | 2.63 | (3.23 | ) | |||||||||||||||||
| Total from Investment Operations | 2.31 | 1.89 | 0.69 | 2.61 | (3.29 | ) | |||||||||||||||||
| Less Distributions: | |||||||||||||||||||||||
| Dividends from net investment income | (0.03 | ) | (0.01 | ) | — | — | — | ||||||||||||||||
| Distributions from realized capital gains | — | — | — | — | — | ||||||||||||||||||
| Total Distributions | (0.03 | ) | (0.01 | ) | — | — | — | ||||||||||||||||
| Net Asset Value, End of Period | $ | 17.04 | $ | 14.76 | $ | 12.88 | $ | 12.19 | $ | 9.58 | |||||||||||||
| Total Return (d) | 15.63 | % | 14.67 | % | 5.66 | % | 27.24 | % | (25.56 | )% | |||||||||||||
| Net Assets, End of Period (000's) | $ | 75,376 | $ | 59,975 | $ | 46,015 | $ | 43,463 | $ | 36,484 | |||||||||||||
| Ratios and Supplemental Data: | |||||||||||||||||||||||
| Ratios of expenses to average net assets: (e) | |||||||||||||||||||||||
| Excluding credits | 1.74 | % | 1.65 | % | 1.77 | % | 1.81 | % | 1.79 | % | |||||||||||||
| Gross | 1.74 | % | 1.65 | % | 1.77 | % | 1.81 | % | 1.79 | % | |||||||||||||
| Including custody credits | 1.71 | % | 1.61 | % | 1.76 | % | 1.80 | % | 1.76 | % | |||||||||||||
| Ratio of net investment income (loss) to average net assets (c) | (0.14 | )% | 0.21 | % | 0.08 | % | (0.20 | )% | (0.61 | )% | |||||||||||||
| Portfolio Turnover Excluding Short Sales | 83 | %(f) | 105 | % | 160 | % | 180 | % | 36 | % | |||||||||||||
| Institutional Shares | |||||||||||||||||||||||
| Years Ended March 31, | |||||||||||||||||||||||
| 2007 | 2006 | 2005 | 2004 | 2003 | |||||||||||||||||||
| Net Asset Value, Beginning of Period | $ | 15.40 | $ | 13.43 | $ | 12.65 | $ | 9.90 | $ | 13.23 | |||||||||||||
| Income from Investment Operations: | |||||||||||||||||||||||
| Net investment income (loss) (a)(b)(c) | 0.06 | 0.10 | 0.07 | 0.03 | (0.01 | ) | |||||||||||||||||
| Net realized and unrealized gain/(loss) on securities | 2.44 | 1.94 | 0.71 | 2.72 | (3.32 | ) | |||||||||||||||||
| Total from Investment Operations | 2.50 | 2.04 | 0.78 | 2.75 | (3.33 | ) | |||||||||||||||||
| Less Distributions: | |||||||||||||||||||||||
| Dividends from net investment income | (0.10 | ) | (0.07 | ) | — | — | — | ||||||||||||||||
| Distributions from realized capital gains | — | — | — | — | — | ||||||||||||||||||
| Total Distributions | (0.10 | ) | (0.07 | ) | — | — | — | ||||||||||||||||
| Net Asset Value, End of Period | $ | 17.80 | $ | 15.40 | $ | 13.43 | $ | 12.65 | $ | 9.90 | |||||||||||||
| Total Return (d) | 16.22 | % | 15.19 | % | 6.17 | % | 27.28 | % | (25.17 | )% | |||||||||||||
| Net Assets, End of Period (000's) | $ | 1,279 | $ | 984 | $ | 825 | $ | 747 | $ | 590 | |||||||||||||
| Ratios and Supplemental Data: | |||||||||||||||||||||||
| Ratios of expenses to average net assets: (e) | |||||||||||||||||||||||
| Excluding credits | 1.25 | % | 1.16 | % | 1.27 | % | 1.31 | % | 1.29 | % | |||||||||||||
| Gross | 1.25 | % | 1.16 | % | 1.27 | % | 1.31 | % | 1.29 | % | |||||||||||||
| Including custody credits | 1.22 | % | 1.11 | % | 1.26 | % | 1.30 | % | 1.26 | % | |||||||||||||
| Ratio of net investment income (loss) to average net assets (c) | 0.35 | % | 0.71 | % | 0.54 | % | 0.30 | % | (0.13 | )% | |||||||||||||
| Portfolio Turnover Excluding Short Sales | 83 | %(f) | 105 | % | 160 | % | 180 | % | 36 | % | |||||||||||||
(a) Per share numbers have been calculated using the average shares method.
(b) Reflects expense waivers/reimbursements and reductions in effect during the period. See Note 3 to the Financial Statements.
(c) Net investment income (loss) per share and the ratio of net investment income (loss) to average net assets reflect net investment income prior to certain reclassifications for federal income or excise taxes.
(d) Total Return does not include the deferred sales charge of 1% for the Ordinary Shares. The total return would have been lower if certain fees had not been waived or if custodial fees had not been reduced by credits allowed by the custodian. See Note 3 to the financial statements.
(e) Ratios of expenses to average net assets:
— Excluding Credits (total expenses less fee waivers and reimbursements by the investment advisor, if any).
— Gross (total expenses excluding account fee waivers, reimbursements by the investment advisor, and custody earnings credits, if any.)
— Including Credits (total expenses less fee waivers, reimbursements by the investment advisor, and custody earnings credits, if any).
(f) Portfolio turnover is calculated on long security positions only. Short positions are generally held for less than one year.
The accompanying notes are an integral part of these financial statements.
26
QUANT EMERGING MARKETS FUND
FINANCIAL HIGHLIGHTS (continued)
(For a share outstanding throughout each period)
| Ordinary Shares | |||||||||||||||||||||||
| Years Ended March 31, | |||||||||||||||||||||||
| 2007 | 2006 | 2005 | 2004 | 2003 | |||||||||||||||||||
| Net Asset Value, Beginning of Period | $ | 19.85 | $ | 14.23 | $ | 12.71 | $ | 6.12 | $ | 7.24 | |||||||||||||
| Income from Investment Operations: | |||||||||||||||||||||||
| Net investment income (loss) (a)(b)(c) | 0.16 | 0.21 | 0.14 | 0.04 | 0.06 | ||||||||||||||||||
| Net realized and unrealized gain/(loss) on securities | 4.02 | 6.28 | 1.86 | 6.58 | (1.14 | ) | |||||||||||||||||
| Total from Investment Operations | 4.18 | 6.49 | 2.00 | 6.62 | (1.08 | ) | |||||||||||||||||
| Less Distributions: | |||||||||||||||||||||||
| Dividends from net investment income | (0.22 | ) | (0.22 | ) | (0.20 | ) | (0.03 | ) | (0.04 | ) | |||||||||||||
| Distributions from realized capital gains | (0.47 | ) | (0.65 | ) | (0.28 | ) | — | — | |||||||||||||||
| Total Distributions | (0.69 | ) | (0.87 | ) | (0.48 | ) | (0.03 | ) | (0.04 | ) | |||||||||||||
| Net Asset Value, End of Period | $ | 23.34 | $ | 19.85 | $ | 14.23 | $ | 12.71 | $ | 6.12 | |||||||||||||
| Total Return (d) | 21.36 | % | 46.77 | % | 15.89 | % | 108.18 | % | (14.97 | )% | |||||||||||||
| Net Assets, End of Period (000's) | $ | 276,698 | $ | 144,088 | $ | 61,681 | $ | 39,977 | $ | 11,207 | |||||||||||||
| Ratios and Supplemental Data: | |||||||||||||||||||||||
| Ratios of expenses to average net assets: (e) | |||||||||||||||||||||||
| Excluding credits | 1.67 | % | 1.83 | % | 1.96 | % | 2.07 | % | 2.30 | % | |||||||||||||
| Gross | 1.67 | % | 1.83 | % | 1.96 | % | 2.07 | % | 2.46 | % | |||||||||||||
| Including custody credits | 1.67 | % | 1.83 | % | 1.96 | % | 2.07 | % | 2.29 | % | |||||||||||||
| Ratio of net investment income (loss) to average net assets (c) | 0.77 | % | 1.23 | % | 1.12 | % | 0.39 | % | 0.88 | % | |||||||||||||
| Portfolio Turnover | 24 | % | 34 | % | 53 | % | 45 | % | 150 | % | |||||||||||||
| Institutional Shares | |||||||||||||||||||||||
| Years Ended March 31, | |||||||||||||||||||||||
| 2007 | 2006 | 2005 | 2004 | 2003 | |||||||||||||||||||
| Net Asset Value, Beginning of Period | $ | 20.11 | $ | 14.39 | $ | 12.82 | $ | 6.17 | $ | 7.30 | |||||||||||||
| Income from Investment Operations: | |||||||||||||||||||||||
| Net investment income (loss) (a)(b)(c) | 0.21 | 0.29 | 0.24 | 0.04 | 0.07 | ||||||||||||||||||
| Net realized and unrealized gain/(loss) on securities | 4.08 | 6.35 | 1.84 | 6.68 | (1.13 | ) | |||||||||||||||||
| Total from Investment Operations | 4.29 | 6.64 | 2.08 | 6.72 | (1.06 | ) | |||||||||||||||||
| Less Distributions: | |||||||||||||||||||||||
| Dividends from net investment income | (0.26 | ) | (0.27 | ) | (0.23 | ) | (0.07 | ) | (0.07 | ) | |||||||||||||
| Distributions from realized capital gains | (0.47 | ) | (0.65 | ) | (0.28 | ) | — | — | |||||||||||||||
| Total Distributions | (0.73 | ) | (0.92 | ) | (0.51 | ) | (0.07 | ) | (0.07 | ) | |||||||||||||
| Net Asset Value, End of Period | $ | 23.67 | $ | 20.11 | $ | 14.39 | $ | 12.82 | $ | 6.17 | |||||||||||||
| Total Return (d) | 21.68 | % | 47.39 | % | 16.42 | % | 109.05 | % | (14.58 | )% | |||||||||||||
| Net Assets, End of Period (000's) | $ | 12,759 | $ | 1,707 | $ | 1,082 | $ | 2,365 | $ | 282 | |||||||||||||
| Ratios and Supplemental Data: | |||||||||||||||||||||||
| Ratios of expenses to average net assets: (e) | |||||||||||||||||||||||
| Excluding credits | 1.41 | % | 1.45 | % | 1.46 | % | 1.57 | % | 1.80 | % | |||||||||||||
| Gross | 1.41 | % | 1.45 | % | 1.46 | % | 1.57 | % | 1.96 | % | |||||||||||||
| Including custody credits | 1.41 | % | 1.45 | % | 1.46 | % | 1.57 | % | 1.79 | % | |||||||||||||
| Ratio of net investment income (loss) to average net assets (c) | 1.02 | % | 1.75 | % | 1.84 | % | 0.36 | % | 1.22 | % | |||||||||||||
| Portfolio Turnover | 24 | % | 34 | % | 53 | % | 45 | % | 150 | % | |||||||||||||
(a) Per share numbers have been calculated using the average shares method.
(b) Reflects expense waivers/reimbursements and reductions in effect during the period. See Note 3 to the Financial Statements.
(c) Net investment income (loss) per share and the ratio of net investment income (loss) to average net assets reflect net investment income prior to certain reclassifications for federal income or excise taxes.
(d) Total Return does not include the deferred sales charge of 1% for the Ordinary Shares. The total return would have been lower if certain fees had not been waived or if custodial fees had not been reduced by credits allowed by the custodian. See Note 3 to the financial statements.
(e) Ratios of expenses to average net assets:
— Excluding Credits (total expenses less fee waivers and reimbursements by the investment advisor, if any).
— Gross (total expenses excluding account fee waivers, reimbursements by the investment advisor, and custody earnings credits, if any).
— Including Credits (total expenses less fee waivers, reimbursements by the investment advisor, and custody earnings credits, if any).
The accompanying notes are an integral part of these financial statements.
27
QUANT FOREIGN VALUE FUND
FINANCIAL HIGHLIGHTS (continued)
(For a share outstanding throughout each period)
| Ordinary Shares | |||||||||||||||||||||||
| Years Ended March 31, | |||||||||||||||||||||||
| 2007 | 2006 | 2005 | 2004 | 2003 | |||||||||||||||||||
| Net Asset Value, Beginning of Period | $ | 19.91 | $ | 15.92 | $ | 13.50 | $ | 7.80 | $ | 9.67 | |||||||||||||
| Income from Investment Operations: | |||||||||||||||||||||||
| Net investment income (loss) (a)(b)(c) | 0.18 | 0.24 | (f) | 0.15 | 0.22 | 0.10 | |||||||||||||||||
| Net realized and unrealized gain/(loss) on securities | 4.12 | 3.96 | 2.66 | 5.60 | (1.91 | ) | |||||||||||||||||
| Total from Investment Operations | 4.30 | 4.20 | 2.81 | 5.82 | (1.81 | ) | |||||||||||||||||
| Less Distributions: | |||||||||||||||||||||||
| Dividends from net investment income | (0.07 | ) | (0.13 | ) | (0.12 | ) | (0.12 | ) | (0.06 | ) | |||||||||||||
| Distributions from realized capital gains | (1.07 | ) | (0.08 | ) | (0.27 | ) | — | — | |||||||||||||||
| Total Distributions | (1.14 | ) | (0.21 | ) | (0.39 | ) | (0.12 | ) | (0.06 | ) | |||||||||||||
| Net Asset Value, End of Period | $ | 23.07 | $ | 19.91 | $ | 15.92 | $ | 13.50 | $ | 7.80 | |||||||||||||
| Total Return (d) | 22.08 | % | 26.59 | % | 20.99 | % | 74.77 | % | (18.80 | )% | |||||||||||||
| Net Assets, End of Period (000's) | $ | 778,104 | $ | 441,614 | $ | 202,655 | $ | 88,425 | $ | 29,468 | |||||||||||||
| Ratios and Supplemental Data: | |||||||||||||||||||||||
| Ratios of expenses to average net assets: (e) | |||||||||||||||||||||||
| Excluding credits | 1.60 | % | 1.69 | % | 1.80 | % | 1.81 | % | 1.93 | % | |||||||||||||
| Gross | 1.60 | % | 1.69 | % | 1.80 | % | 1.81 | % | 1.93 | % | |||||||||||||
| Including custody credits | 1.60 | % | 1.69 | % | 1.80 | % | 1.81 | % | 1.93 | % | |||||||||||||
| Ratio of net investment income (loss) to average net assets (c) | 0.88 | % | 1.41 | %(f) | 1.04 | % | 1.90 | % | 1.20 | % | |||||||||||||
| Portfolio Turnover | 19 | % | 29 | % | 10 | % | 48 | % | 7 | % | |||||||||||||
| Institutional Shares | |||||||||||||||||||||||
| Years Ended March 31, | |||||||||||||||||||||||
| 2007 | 2006 | 2005 | 2004 | 2003 | |||||||||||||||||||
| Net Asset Value, Beginning of Period | $ | 20.01 | $ | 15.98 | $ | 13.53 | $ | 7.83 | $ | 9.72 | |||||||||||||
| Income from Investment Operations: | |||||||||||||||||||||||
| Net investment income (loss) (a)(b)(c) | 0.25 | 0.29 | (g) | 0.17 | 0.30 | 0.12 | |||||||||||||||||
| Net realized and unrealized gain/(loss) on securities | 4.12 | 3.98 | 2.70 | 5.56 | (1.92 | ) | |||||||||||||||||
| Total from Investment Operations | 4.37 | 4.27 | 2.87 | 5.86 | (1.80 | ) | |||||||||||||||||
| Less Distributions: | |||||||||||||||||||||||
| Dividends from net investment income | (0.12 | ) | (0.16 | ) | (0.15 | ) | (0.16 | ) | (0.09 | ) | |||||||||||||
| Distributions from realized capital gains | (1.07 | ) | (0.08 | ) | (0.27 | ) | — | — | |||||||||||||||
| Total Distributions | (1.19 | ) | (0.24 | ) | (0.42 | ) | (0.16 | ) | (0.09 | ) | |||||||||||||
| Net Asset Value, End of Period | $ | 23.19 | $ | 20.01 | $ | 15.98 | $ | 13.53 | $ | 7.83 | |||||||||||||
| Total Return (d) | 22.37 | % | 26.96 | % | 21.35 | % | 75.07 | % | (18.62 | )% | |||||||||||||
| Net Assets, End of Period (000's) | $ | 115,200 | $ | 30,972 | $ | 21,317 | $ | 11,875 | $ | 862 | |||||||||||||
| Ratios and Supplemental Data: | |||||||||||||||||||||||
| Ratios of expenses to average net assets: (e) | |||||||||||||||||||||||
| Excluding credits | 1.35 | % | 1.45 | % | 1.55 | % | 1.56 | % | 1.68 | % | |||||||||||||
| Gross | 1.35 | % | 1.45 | % | 1.55 | % | 1.56 | % | 1.68 | % | |||||||||||||
| Including custody credits | 1.35 | % | 1.45 | % | 1.55 | % | 1.56 | % | 1.68 | % | |||||||||||||
| Ratio of net investment income (loss) to average net assets (c) | 1.13 | % | 1.70 | %(g) | 1.22 | % | 2.52 | % | 1.40 | % | |||||||||||||
| Portfolio Turnover | 19 | % | 29 | % | 10 | % | 48 | % | 7 | % | |||||||||||||
(a) Per share numbers have been calculated using the average shares method.
(b) Reflects expense waivers/reimbursements and reductions in effect during the period. See Note 3 to the Financial Statements.
(c) Net investment income (loss) per share and the ratio of net investment income (loss) to average net assets reflect net investment income prior to certain reclassifications for federal income or excise taxes.
(d) Total Return does not include the deferred sales charge of 1% for the Ordinary Shares. The total return would have been lower if certain fees had not been waived or if custodial fees had not been reduced by credits allowed by the custodian. See Note 3 to the financial statements.
(e) Ratios of expenses to average net assets:
— Excluding Credits (total expenses less fee waivers and reimbursements by the investment advisor, if any).
— Gross (total expenses excluding account fee waivers, reimbursements by the investment advisor, and custody earnings credits, if any).
— Including Credits (total expenses less fee waivers, reimbursements by the investment advisor, and custody earnings credits, if any).
(f) Includes non-recurring income of $277,072.
(g) Includes non-recurring income of $22,928.
The accompanying notes are an integral part of these financial statements.
28
QUANT FUNDS
NOTES TO FINANCIAL STATEMENTS
1. Organization of the Trust.
The Quantitative Group of Funds d/b/a "Quant Funds" (the "Trust") is organized as a Massachusetts business trust and is registered under the Investment Company Act of 1940, as amended, as a non-diversified, open-end management investment company. The Trust currently has four series (each a "Fund" and collectively the "Funds") each with a distinct investment objective.
Quant Small Cap Fund ("Small Cap") seeks maximum long-term capital appreciation.
Quant Long/Short Fund ("Long/Short") seeks long-term growth of capital. Prior to November 1, 2006, Quant Long/Short Fund used a long only investment strategy and its investment objective was long-term growth of capital and income.
Quant Emerging Markets Fund ("Emerging Markets") seeks long-term growth of capital.
Quant Foreign Value Fund ("Foreign Value") seeks long-term capital growth and income.
Each Fund offers two classes of shares designated as Ordinary Shares and Institutional Shares. The classes differ principally in their respective sales charges, distribution fees and shareholder servicing fees and arrangements. Each class of shares represents an interest in the same portfolio of investments of the respective Fund and has equal rights to voting, redemptions, dividends and liquidation, except that each class bears its own transfer agent fees and only Ordinary Shares bear distribution fees and have exclusive voting rights with respect to the distribution plan that has been adopted by Ordinary Share shareholders. There is no distribution plan for Institutional Shares. Only Ordinary Shares may be subject to a deferred sales charge.
At times, a Fund's investments may represent industries or industry sectors that are interrelated or have common risks, making it more susceptible to any economic, political, or regulatory developments or other risks affecting those industries and sectors. To the extent that a Fund is permitted to invest in foreign markets, emerging markets or countries with limited or developing markets such investments may subject the Fund to a greater degree of risk than in the U.S. market or a developed market. Risks associated with these foreign and developing markets include political, social or economic factors and may affect the price of a Fund's investments and income generated by these investments, as well as a Fund's ability to repatriate such amounts. Information regarding each Fund's principal risks is contained in the Fund's prospectus. Please refer to those documents when considering a Fund's risks.
2. Significant Accounting Policies.
Each Fund's financial statements have been prepared in conformity with U.S. generally accepted accounting principles, that require the management of the Funds to, among other things, make estimates and assumptions that affect the reported amounts of assets and liabilities, the disclosure of contingent assets and liabilities at the date of the financial statements, and the reported amounts of income, expenses and gains and losses on investments during the reporting year. Actual results could differ from those estimates.
The following is a summary of significant accounting policies followed by each Fund in the preparation of its financial statements, which are consistent with those policies generally accepted in the investment company industry.
Security Valuation.
Portfolio securities are valued each business day at the last reported sale price on the principal exchange or market on which they are traded. If there is no such reported sale, the securities generally are valued at the mean between the last reported bid and asked prices. For certain securities, where no such sales have been reported, the Fund may value such securities at the last reported bid price. In the event that there is information suggesting that valuation of such securities based upon bid and/or asked prices may not be accurate, a Fund may value such securities in good faith at fair value in accordance with procedures established by the Funds' Trustees (the "Trustees"), which may include a determination to value such securities at the last reported sales price. Short-term investments that mature in 60 days or less are valued at amortized cost. Securities quoted in foreign currencies are translated into U.S. dollars ba sed upon the prevailing exchange rate on each business day. Other assets and securities for which no quotations are readily available are valued at fair value as determined in good faith using procedures approved by the Trustees. As a result, changes in the value of those currencies in relation to the U.S. dollar may affect the Fund's NAV. Because foreign markets may be open at different times than the New York Stock Exchange, the value of the Fund's shares may change on days when shareholders are not able to buy or sell them. If events materially affecting the values of the Fund's foreign investments occur between the close of foreign markets and the close of regular trading on the New York Stock Exchange, these investments may be valued at their fair value as determined in good faith using procedures approved by the Trustees. At March 31, 2007 there were no securities fair valued.
29
QUANT FUNDS
NOTES TO FINANCIAL STATEMENTS (continued)
Security Transactions and Related Investment Income.
Security transactions are accounted for on the trade date (the date the order to buy or sell is executed). Dividend income, less foreign taxes withheld, is recorded on the ex-dividend date, except that certain dividends from foreign securities where the ex-dividend date may have passed are recorded as soon as the Fund becomes aware of the ex-dividend data in the exercise of reasonable diligence. Distributions received on securities that represent a return of capital or a capital gain are recorded as a reduction of cost of investments and/or as a realized gain. Each Fund estimates the components of distributions that may be considered nontaxable distributions or capital gain distributions for tax purposes. Interest income is recorded on the accrual basis and includes accretion of discounts and amortization of premiums. In determining the net gain or loss on securities sold, the cost of securities is determined on the identified c ost basis. Each Fund's investment income and realized and unrealized gains and losses are allocated among classes based upon the daily relative net assets.
Repurchase Agreements.
The Funds' custodian takes possession through the federal book-entry system of securities collateralizing repurchase agreements. Collateral is marked-to-market daily to ensure that the market value of the underlying assets remains sufficient to protect the Funds. The Funds may experience costs and delays in liquidating the collateral if the issuer defaults or enters into bankruptcy.
Foreign Currency Transactions.
All monetary items denominated in foreign currencies are translated into U.S. dollars based on the prevailing exchange rate at the close of each business day. Income and expenses denominated in foreign currencies are translated at the prevailing rates of exchange when accrued or incurred.
Reported net realized gains and losses on foreign currency transactions represent net gains and losses from currency gains and losses realized between the trade and settlement dates on investment transactions, and the difference between the amount of net investment income accrued and the U.S. dollar amount actually received. The effects of changes in foreign currency exchange rates on investments in securities are not segregated in the Statement of Operations from the effects of changes in market prices of those securities, but are included with the net realized and unrealized gain or loss on investments.
Short Sales.
Quant Long/Short Fund may engage in short sales (selling securities it does not own) as part of its normal investment activities. Upon selling a security short, Long/Short will segregate cash, cash equivalents or other appropriate liquid securities in an amount equal to the current market value of the securities sold short and will maintain such collateral until Long/Short replaces the borrowed security. Long/Short is required to pay any dividends or interest due on securities sold short. Such dividends and interest are recorded as an expense. Liabilities for securities sold short are valued daily and recorded as unrealized appreciation (depreciation) on investments and securities sold short. Long/Short records realized gain (loss) on a security sold short when a short position is terminated by Long/Short. Long/Short will incur a loss if the price of a security increases between the date of the short sale and the date on which L ong/Short replaces the borrowed security. Long/Short will realize a gain if the price of borrowed security declines between the date of a short sale and the date Long/Short replaces the borrowed security.
Expenses and Class Allocations.
The majority of the expenses of the Funds are attributed to the individual Fund for which they are incurred. Expenses that are not attributed to a specific Fund are allocated in proportion to the respective net assets of the Funds. Expenses allocable to a Fund are borne pro rata by the holders of both classes of shares of such Fund, except that 12b-1 Plan expenses will not be borne by the holders of Institutional Shares and each class has its own transfer agency fee.
Distribution fees on Ordinary Shares are calculated based on the average daily net asset value attributable to the Ordinary Shares of the respective Fund. Institutional Shares are not subject to a distribution plan. Shareholders of each class share all expenses and fees paid to the transfer agent, Quantitative Institutional Services, for its services, which are allocated based on the net assets in each class and the ratable allocation of related out-of-pocket expenses. Income, common expenses and realized and unrealized gains and losses are calculated at the Fund level and allocated daily to each class of shares based on their respective percentage of adjusted net assets at the beginning of the day. (See Note 3)
30
QUANT FUNDS
NOTES TO FINANCIAL STATEMENTS (continued)
Distributions to Shareholders.
Distributions to shareholders are recorded as of the ex-dividend date. Distributions paid by each Fund with respect to each class of shares are calculated in the same manner, at the same time, and in the same amount, except that Ordinary Shares and Institutional Shares can bear different transfer agent and distribution fees. Distributions from net investment income for each Fund, if any, are declared and paid annually. Distributions from net realized gains for each Fund, if any, are generally declared and paid annually.
New Accounting Pronouncements.
In July 2006, Financial Account Standards Board Interpretation No. 48, Accounting for Uncertainty in Income Taxes – an interpretation of FASB Statement 109 (FIN 48) was issued and is effective for fiscal years beginning after December 15, 2006. FIN 48 sets forth a threshold for financial statement recognition, measurement and disclosure of a tax position taken or expected to be taken on a tax return. The Manager is currently evaluating the impact, if any, that the adoption of FIN 48 will have on each Fund's net assets and results of operations.
In September 2006, the Financial Accounting Standards Board (FASB) issued Statement of Financial Accounting Standards No. 157, "Fair Value Measurements" (SFAS No. 157). SFAS No. 157 defines fair value, establishes a framework for measuring fair value in accordance with generally accepted accounting principles and expands disclosure about fair value measurements. SFAS No. 157 is effective for fiscal years beginning after November 15, 2007. Management is currently evaluating the impact that the adoption of SFAS No. 157 will have on the Funds' financial statement disclosures.
3. Management Fee, Advisory Contracts and Other Affiliate Transactions.
The Funds have entered into a management agreement (the "Management Agreement") with Quantitative Investment Advisors, Inc. (the "Manager") d/b/a Quantitative Advisors. Compensation of the Manager, for management and administration of the Funds, including selection and monitoring of the portfolio advisors, is paid monthly based on the average daily net asset value of each Fund for the month. The annual rate of such fees is 1.00% of the average daily total net assets of Small Cap, Long/Short, Emerging Markets, and Foreign Value. Prior to November 1, 2006 the annual rate for Long/Short was 0.75% of the average daily net total assets.
Under the Management Agreement, the Manager has agreed to reduce its compensation, and if necessary, assume expenses, with respect to Small Cap to the extent that the total expenses of this Fund individually exceeds 2% of average net assets for any fiscal year. Fund expenses subject to this limitation are exclusive of brokerage, interest, taxes and extraordinary expenses, which include incremental custody costs associated with international securities. Expenses are calculated gross of custody credits, if applicable.
For the year ended March 31, 2007 aggregate management fees were $9,723,738 and no fees were reduced or waived.
The Manager has entered into advisory contracts with the following subadvisors (collectively the "Advisors") to provide investment advisory services to the following Funds: Columbia Partners, L.L.C., Investment Management (Small Cap,), SSgA Funds Management, Inc. (Long/Short), PanAgora Asset Management, Inc. (Emerging Markets), and Polaris Capital Management, Inc. (Foreign Value).
For services rendered, the Manager pays to the Advisor of a Fund a fee based on a percentage of the average daily total net assets of the Fund. The fee for each Fund is determined separately. The fees paid by the Manager to the Advisors of the Funds are as follows: Small Cap – 0.50% of average daily total net assets; Emerging Markets – 0.40% of average daily total net assets; Long/Short – 0.50% of the first $20 million and 0.35% of amounts in excess of $20 million of average daily total net assets, with an annual minimum of $25,000; and Foreign Value – 0.35% of the first $35 million, 0.40% of amounts in excess of $35 million but less than $200 million and 0.50% for assets in excess of $200 million of average daily total net assets. Prior to November 1, 2006, the fees paid by the Manager to the Advisor of Long/Short was 0.375% of the first $20 million and 0.30% of amounts in excess of $20 million of average da ily total net assets, with an annual minimum of $25,000.
The Funds have entered into a distribution agreement (the "Distribution Agreement") with U.S. Boston Capital Corporation (the "Distributor"). For its services under the Distribution Agreement, the Distributor receives a monthly fee at the annual rate of (i) 0.50% of the average daily total net asset value of Ordinary Share accounts of Small Cap and Long/Short and (ii) 0.25% of the average daily total net asset value of Ordinary Share accounts of Foreign Value open during the period the plan is in effect. The Distributor is contractually reducing the monthly fee it receives from Emerging Markets to 0.25% of the average daily total net asset
31
QUANT FUNDS
NOTES TO FINANCIAL STATEMENTS (continued)
value of Ordinary Shareholder accounts of Emerging Markets for the period from November 1, 2005 through July 31, 2007. This reduction is subject to review and there is no guarantee that the Distributor will continue the reduction. Holders of Institutional Shares bear no portion of the 12b-1 Plan expenses of the Funds and are not entitled to vote on matters involving the 12b-1 Plan. During the year ended March 31, 2007, the aggregate distribution fees of the Funds were $2,677,719.
A deferred sales charge of 1% of the net asset value of Ordinary Shares redeemed of Small Cap, Long/Short, Emerging Markets and Foreign Value is withheld from the redemption proceeds and paid to the Distributor. The deferred sales charge is not imposed on redemptions of Institutional Shares and certain other transactions. The Funds have been advised that during the twelve months ended March 31, 2007, such fees earned by the Distributor were $106,833.
Transfer agent functions are provided to the Funds by Quantitative Institutional Services, a division of the Manager (the "Transfer Agent") pursuant to a transfer agent agreement (the "Transfer Agent Agreement"). The Transfer Agent Agreement provides for base fees that are payable to the Transfer Agent at an annual rate of 0.16% of the average daily total net asset value of each class of shares of the Funds and for reimbursement of out of pocket expenses. During the twelve months ended March 31, 2007, the aggregate fees of the Funds were $1,678,625.
The Transfer Agent also provides the Fund with other services consisting of in-house legal services, preparation and review of semi-annual and annual reports and EDGAR administration services. These services are provided as additional services agreed to by the Board of Trustees of the Funds under the provisions of the Transfer Agent Agreement. For the twelve months ended March 31, 2007, aggregate transfer agent fees for these services were $133,391.
The By Laws of the Fund, as amended from time to time, permit the Board of Trustees of the Fund to approve reimbursement to the Manager for certain costs associated with providing regulatory and compliance services to the Fund. For the twelve months ended March 31, 2007, the Trustees have approved reimbursements that amounted to $137,600.
Custody and fund accounting services are provided by State Street Kansas City. Custody credits generated by interest earned on uninvested cash balances maintained by the Funds are used to offset custodial expenses of the Funds.
The Trustees receive an annual Trustee's fee of $10,000. The fees are allocated to each Fund in proportion to its respective net assets. Prior to October 1, 2006, the Trustees received an annual Trustee's fee of $5,000 except the audit committee members who received an annual fee of $6,000.
4. Purchases and Sales.
During the twelve months ended March 31, 2007, purchases of investment securities other than U.S. Government obligations and short-term investments, for Small Cap, Long/Short, Emerging Markets and Foreign Value were $54,279,633, $88,130,423, $144,231,578, and $406,594,825, respectively. Sales of such securities for the Funds were $46,509,207, $60,291,668, $45,840,550, and $110,483,891, respectively. Securities sold short are excluded from the Long/Short Fund numbers as they are generally held for less than one year.
5. Contingent Liability.
The Trust insures itself and all Funds under a policy with ICI Mutual Insurance Company ("ICI Mutual"). The annual premium is allocated among the Funds and the Transfer Agent. Additionally, the Funds have committed to ICI Mutual up to 300% of the annual premium, one third of which was provided in cash, with each Fund's pro rata portion recorded as an asset. The remainder is secured with an irrevocable letter of credit.
6. Concentration of Risk.
The relatively large investments of Emerging Markets in countries with limited or developing capital markets may involve greater risks than investments in more developed markets and the prices of such investments may be volatile. The consequences of political, social or economic changes in these markets may have disruptive effects on the market prices of the Fund's investments and the income they generate, as well as the Fund's ability to repatriate such amounts.
7. Federal Income Taxes.
It is the policy of the Funds to distribute all of their taxable income within the prescribed time and otherwise comply with the provisions of the Internal Revenue Code ("IRC") applicable to regulated investment companies. Therefore no Federal income tax provision is required.
32
QUANT FUNDS
NOTES TO FINANCIAL STATEMENTS (continued)
The tax components of capital shown in the following tables represent: (1) losses or deductions the Portfolios may be able to offset against income and gains realized in future years, (2) distribution requirements the Portfolios must satisfy under the income tax regulations, and (3) unrealized appreciation or depreciation of investments for federal income tax purposes.
Certain Funds had capital loss carryovers at March 31, 2007. The accumulated capital losses noted in the table may be available to offset future realized capital gains and thereby reduce future taxable gain distributions. Foreign Value acquired capital loss carryovers for federal income tax purposes of $8,053,584 when the net assets of State Street Research International Equity Fund (SSR), a series of State Street Research Financial Trust, were acquired in a merger which occurred on May 2, 2003 pursuant to a Plan of Reorganization approved by the shareholders of SSR on April 25, 2003. Foreign Value is the surviving fund in the merger for purposes of maintaining the financial statements and performance history in the post-reorganization periods and the acquired capital loss carryovers may be subject to limitations on their use under the Internal Revenue Code, as amended, and may therefore expire unutilized. As of March 31, 2007 t he capital loss carryovers were as follows:
| Portfolio | Capital Loss Expires March 31, 2010 | Capital Loss Expires March 31, 2011 | Capital Loss Expires March 31, 2012 | Capital Loss Expires March 31, 2013 | Total Capital Loss | ||||||||||||||||||
| Small Cap Fund | $ | — | $ | — | $ | — | $ | — | $ | — | |||||||||||||
| Long/Short Fund | — | — | — | — | — | ||||||||||||||||||
| Emerging Markets Fund | — | — | — | — | — | ||||||||||||||||||
| Foreign Value Fund | (1,659,479 | ) | (932,449 | ) | — | — | (2,591,928 | ) | |||||||||||||||
During the fiscal year, Emerging Markets and Foreign Value incurred Post-October losses of $18,662 and $233,684, respectively.
The primary differences between book and tax appreciation or depreciation of investments consist of wash sale loss deferrals, return of capital distributions by real estate investment trusts ("REITs"), mark to market on passive foreign investment companies ("PFICs") held and foreign capital gains taxes accrued. The net tax appreciation/depreciation in the table includes unrealized tax gain (loss) on foreign currency and investments.
| March 31, 2007 | |||||||||||||||||||||||
| Portfolio | Undistributed Ordinary Income | Undistributed Long-Term Gains | Accumulated Capital Losses | Post- October Deferral | Net Tax Appreciation/ Depreciation | ||||||||||||||||||
| Small Cap Fund | $ | — | $ | 3,179,354 | $ | — | $ | — | $ | 41,015,735 | |||||||||||||
| Long/Short Fund | — | 911,173 | — | — | 10,800,994 | ||||||||||||||||||
| Emerging Markets Fund | — | 2,438,652 | — | (18,662 | ) | 79,882,083 | |||||||||||||||||
| Foreign Value Fund | 4,871,970 | — | (2,591,928 | ) | (233,684 | ) | 219,364,214 | ||||||||||||||||
At March 31, 2007 the tax composition of dividends was as follows:
| Portfolio | Ordinary Income | Long Term Capital Gains | Tax Return Of Capital | ||||||||||||
| Small Cap Fund | $ | — | $ | 8,814,188 | $ | — | |||||||||
| Long/Short Fund | 117,007 | 74 | — | ||||||||||||
| Emerging Markets Fund | 2,672,460 | 4,316,799 | — | ||||||||||||
| Foreign Value Fund | 2,243,541 | 31,215,933 | — | ||||||||||||
For the twelve months ended March 31, 2007 Small Cap and Long/Short incurred net operating losses of $877,213 and $87,678, respectively. These losses were reclassified to Shares of Beneficial Interest.
Capital loss carryovers in the amount of $0, $3,683,826, $0, and $1,395,926 were utilized by Small Cap, Long/Short, Emerging Markets and Foreign Value, respectively during the fiscal year ending March 31, 2007.
33
QUANT FUNDS
NOTES TO FINANCIAL STATEMENTS (continued)
8. Transactions in Shares of Beneficial Interest.
Transactions in shares of beneficial interest were as follows:
| Year Ended March 31, 2007 | Year Ended March 31, 2006 | ||||||||||||||||||
| Shares | Dollars | Shares | Dollars | ||||||||||||||||
| Small Cap | |||||||||||||||||||
| Ordinary Shares | |||||||||||||||||||
| Shares sold | 953,368 | $ | 22,186,587 | 294,518 | $ | 6,459,521 | |||||||||||||
| Shares issued in reinvestment of distributions | 329,592 | 7,689,374 | 521,194 | 11,122,291 | |||||||||||||||
| Shares redeemed | (348,451 | ) | (8,048,760 | ) | (309,548 | ) | (6,655,536 | ) | |||||||||||
| Net Change | 934,509 | 21,827,201 | 506,164 | 10,926,276 | |||||||||||||||
| Institutional Shares | |||||||||||||||||||
| Shares sold | 135,911 | 3,538,475 | 24,093 | 588,442 | |||||||||||||||
| Shares issued in reinvestment of distributions | 27,407 | 714,231 | 54,915 | 1,292,152 | |||||||||||||||
| Shares redeemed | (183,389 | ) | (4,552,491 | ) | (13,607 | ) | (330,123 | ) | |||||||||||
| Redemption fees | — | 1,131 | — | — | |||||||||||||||
| Net Change | (20,071 | ) | (298,654 | ) | 65,401 | 1,550,471 | |||||||||||||
| Total Net Change For Fund | $ | 21,528,547 | $ | 12,476,747 | |||||||||||||||
| Long/Short | |||||||||||||||||||
| Ordinary Shares | |||||||||||||||||||
| Shares sold | 683,703 | $ | 10,810,200 | 754,982 | $ | 10,404,047 | |||||||||||||
| Shares issued in reinvestment of distributions | 6,310 | 104,870 | 2,314 | 33,410 | |||||||||||||||
| Shares redeemed | (330,389 | ) | (5,124,566 | ) | (265,055 | ) | (3,688,147 | ) | |||||||||||
| Net Change | 359,624 | 5,790,504 | 492,241 | 6,749,310 | |||||||||||||||
| Institutional Shares | |||||||||||||||||||
| Shares sold | 7,690 | 130,513 | 5,378 | 76,134 | |||||||||||||||
| Shares issued in reinvestment of distributions | 372 | 6,451 | 302 | 4,550 | |||||||||||||||
| Shares redeemed | (105 | ) | (1,617 | ) | (3,176 | ) | (48,185 | ) | |||||||||||
| Redemption fees | — | 1 | — | — | |||||||||||||||
| Net Change | 7,957 | 135,348 | 2,504 | 32,499 | |||||||||||||||
| Total Net Change For Fund | $ | 5,925,852 | $ | 6,781,809 | |||||||||||||||
| Emerging Markets | |||||||||||||||||||
| Ordinary Shares | |||||||||||||||||||
| Shares sold | 6,811,013 | $ | 143,688,252 | 4,076,268 | $ | 70,343,772 | |||||||||||||
| Shares issued in reinvestment of distributions | 304,486 | 6,561,672 | 282,375 | 4,721,307 | |||||||||||||||
| Shares redeemed | (2,517,124 | ) | (51,086,597 | ) | (1,435,106 | ) | (22,966,509 | ) | |||||||||||
| Net Change | 4,598,375 | 99,163,327 | 2,923,537 | 52,098,570 | |||||||||||||||
| Institutional Shares | |||||||||||||||||||
| Shares sold | 465,283 | 10,002,242 | 9,349 | 160,448 | |||||||||||||||
| Shares issued in reinvestment of distributions | 8,841 | 193,006 | 4,263 | 72,124 | |||||||||||||||
| Shares redeemed | (19,919 | ) | (444,789 | ) | (3,953 | ) | (63,950 | ) | |||||||||||
| Redemption fees | — | 2,327 | — | — | |||||||||||||||
| Net Change | 454,205 | 9,752,786 | 9,659 | 168,622 | |||||||||||||||
| Total Net Change For Fund | $ | 108,916,113 | $ | 52,267,192 | |||||||||||||||
34
QUANT FUNDS
NOTES TO FINANCIAL STATEMENTS (continued)
| Year Ended March 31, 2007 | Year Ended March 31, 2006 | ||||||||||||||||||
| Shares | Dollars | Shares | Dollars | ||||||||||||||||
| Foreign Value | |||||||||||||||||||
| Ordinary Shares | |||||||||||||||||||
| Shares sold | 15,336,477 | $ | 327,075,272 | 13,484,712 | $ | 233,143,864 | |||||||||||||
| Shares issued in reinvestment of distributions | 1,320,453 | 28,020,004 | 201,938 | 3,410,738 | |||||||||||||||
| Shares redeemed | (5,111,094 | ) | (104,933,240 | ) | (4,240,514 | ) | (70,950,401 | ) | |||||||||||
| Net Change | 11,545,836 | 250,162,036 | 9,446,136 | 165,604,201 | |||||||||||||||
| Institutional Shares | |||||||||||||||||||
| Shares sold | 3,391,983 | 71,945,944 | 504,191 | 8,822,178 | |||||||||||||||
| Shares issued in reinvestment of distributions | 187,569 | 3,997,093 | 18,026 | 305,537 | |||||||||||||||
| Shares redeemed | (159,948 | ) | (3,366,356 | ) | (307,861 | ) | (4,886,354 | ) | |||||||||||
| Redemption fees | — | 6,517 | — | — | |||||||||||||||
| Net Change | 3,419,604 | 72,583,198 | 214,356 | 4,241,361 | |||||||||||||||
| Total Net Change For Fund | $ | 322,745,234 | $ | 169,845,562 | |||||||||||||||
Federal Tax Information (Unaudited)
Designation Requirements at March 31, 2007.
| Qualified Dividend Income Percentage | |||||||
| Long/Short Fund | 100 | % | |||||
| Emerging Markets Fund | 100 | % | |||||
| Foreign Value Fund | 100 | % | |||||
35
QUANT FUNDS
REPORT OF INDEPENDENT REGISTERED PUBLIC ACCOUNTING FIRM
To the Shareholders and Trustees of the Quantitative Group of Funds d/b/a Quant Funds
In our opinion, the accompanying statements of assets and liabilities, including the schedules of investments, and the related statements of operations and of changes in net assets and of cash flows (for the Quant Long/Short Fund), and the financial highlights present fairly, in all material respects, the financial position of Quantitative Group of Funds d/b/a Quant Funds (hereafter referred to as the "Funds") at March 31, 2007, the results of each of their operations for the year then ended, the changes in each of their net assets for each of the two years in the period then ended, the cash flows for the Quant Long/Short Fund for the year then ended and the financial highlights for each of the five years in the period then ended, in conformity with accounting principles generally accepted in the United States of America. These financial statements and financial highlights (hereafter referred to as "financial statements") are th e responsibility of the Funds' management; our responsibility is to express an opinion on these financial statements based on our audits. We conducted our audits of these financial statements in accordance with the standards of the Public Company Accounting Oversight Board (United States). Those standards require that we plan and perform the audit to obtain reasonable assurance about whether the financial statements are free of material misstatement. An audit includes examining, on a test basis, evidence supporting the amounts and disclosures in the financial statements, assessing the accounting principles used and significant estimates made by management, and evaluating the overall financial statement presentation. We believe that our audits, which included confirmation of securities at March 31, 2007 by correspondence with the custodian and brokers, provide a reasonable basis for our opinion.
PricewaterhouseCoopers LLP
Kansas City, Missouri
May 24, 2007
36
QUANT FUNDS
INFORMATION FOR SHAREHOLDERS
Proxy voting results for Special Shareholder Meeting - October 24, 2006
Quant Growth and Income Fund, a series of Quantitative Group of Funds
| For | Against | Abstain | |||||||||||||
| 1 To approve a change to the Fund's investment objective to long-term growth of capital. | |||||||||||||||
| Shares Voted | 2,275,358.033 | 117,987.362 | 156,633.594 | ||||||||||||
| Percent of Outstanding Shares | 54.360 | % | 0.191 | % | 1.353 | % | |||||||||
| 2 To approve a change to the Fund's primary investment focus requiring that the Fund invest at least 80% of the Fund's net assets (plus any borrowings for investment purposes) in common stock. | |||||||||||||||
| Shares Voted | 2,127,868.386 | 170,753.24 | 1 41,357.362 | ||||||||||||
| Percent of Outstanding Shares | 50.836 | % | 4.079 | % | 0.988 | % | |||||||||
| 3 To approve an amendment to the existing subadvisory agreement between Quantitative Investment Advisors, Inc. and SSgA Funds Management, Inc. to increase the subadvisory fees paid by Quantative Investment Advisors, Inc. (and not the Fund) to SSgA Funds Management, Inc. with respect to the fund. | |||||||||||||||
| Shares Voted | 2,070,357.642 | 199,287.138 | 70,334.209 | ||||||||||||
| Percent of Outstanding Shares | 49.462 | % | 4.761 | % | 1.680 | % | |||||||||
| 4 To approve an amendment to the existing management contract between the Quant Funds and Quantative Investment Advisors, Inc. to increase the management fees paid by the Fund. | |||||||||||||||
| Shares Voted | 2,042,780.358 | 265,742.148 | 31,456.483 | ||||||||||||
| Percent of Outstanding Shares | 48.803 | % | 6.349 | % | 0.752 | % | |||||||||
| 5 To approve an amendment to the management contract eliminating the 2% expense limitation provision with respect to the Fund. | |||||||||||||||
| Shares Voted | 2,188,835.641 | 87,277.001 | 63,866.347 | ||||||||||||
| Percent of Outstanding Shares | 52.292 | % | 2.085 | % | 1.526 | % | |||||||||
| 6A To approve the elimination of the Fund's fundamental restriction prohibiting short sales other than short sales against the box. | |||||||||||||||
| Shares Voted | 2,075,699.108 | 184,986.742 | 79,293.139 | ||||||||||||
| Percent of Outstanding Shares | 49.590 | % | 4.419 | % | 1.894 | % | |||||||||
| 6B To approve changes in the Fund's fundamental restrictions with respect to borrowing. | |||||||||||||||
| Shares Voted | 2,102,221.012 | 191,164.902 | 46,593.075 | ||||||||||||
| Percent of Outstanding Shares | 50.223 | % | 4.567 | % | 1.113 | % | |||||||||
| 6C To approve changes in the Fund's fundamental restrictions with respect to senior securities. | |||||||||||||||
| Shares Voted | 2,100,804.002 | 171,766.712 | 67,408.275 | ||||||||||||
| Percent of Outstanding Shares | 50.189 | % | 4.104 | % | 1.610 | % | |||||||||
| 6D To approve changes in the Fund's fundamental restrictions with respect to loans. | |||||||||||||||
| Shares Voted | 2,100,027.830 | 173,350.196 | 66,600.963 | ||||||||||||
| Percent of Outstanding Shares | 50.171 | % | 4.141 | % | 1.591 | % | |||||||||
| 6E To approve changes in the Fund's fundamental restrictions with respect to industry concentration. | |||||||||||||||
| Shares Voted | 2,245,956.914 | 46,997.732 | 47,024.343 | ||||||||||||
| Percent of Outstanding Shares | 53.657 | % | 1.123 | % | 1.123 | % | |||||||||
37
QUANT FUNDS
INFORMATION FOR SHAREHOLDERS (continued)
| For | Against | Abstain | |||||||||||||
| 6F To approve changes in the Fund's fundamental restrictions with respect to commodities and commodities contracts. | |||||||||||||||
| Shares Voted | 2,230,044.861 | 43,333.165 | 66,600.963 | ||||||||||||
| Percent of Outstanding Shares | 53.277 | % | 1.035 | % | 1.591 | % | |||||||||
| 6G To approve changes in the Fund's fundamental restrictions with respect to real estate. | |||||||||||||||
| Shares Voted | 2,234,072.050 | 58,882.596 | 47,024.343 | ||||||||||||
| Percent of Outstanding Shares | 53.373 | % | 1.407 | % | 1.123 | % | |||||||||
| 6H To approve changes in the Fund's fundamental restrictions with respect to acting as an underwriter. | |||||||||||||||
| Shares Voted | 2,228,972.843 | 44,668.331 | 66,337.815 | ||||||||||||
| Percent of Outstanding Shares | 53.251 | % | 1.067 | % | 1.585 | % | |||||||||
| 6I To approve the elimination of the Fund's fundamental restrictions with respect to exercising control. | |||||||||||||||
| Shares Voted | 2,243,548.094 | 45,927.272 | 50,503.623 | ||||||||||||
| Percent of Outstanding Shares | 53.600 | % | 1.097 | % | 1.207 | % | |||||||||
| 6J To approve the elimination of the Fund's fundamental restrictions with respect to ownership of certain securities. | |||||||||||||||
| Shares Voted | 2,085,558.910 | 188,434.882 | 65,985.197 | ||||||||||||
| Percent of Outstanding Shares | 49.825 | % | 4.502 | % | 1.576 | % | |||||||||
| 6K To approve the elimination of the Fund's fundamental restrictions with respect to ownership of more than 10% of certain securities. | |||||||||||||||
| Shares Voted | 2,230,064.916 | 60,659.340 | 49,254.733 | ||||||||||||
| Percent of Outstanding Shares | 53.277 | % | 1.449 | % | 1.177 | % | |||||||||
| 6L To approve the elimination of the Fund's fundamental restrictions with respect to ownership of certain securities representing more than 10% of the Fund's net assets. | |||||||||||||||
| Shares Voted | 2,228,430.323 | 45,210.851 | 66,337.815 | ||||||||||||
| Percent of Outstanding Shares | 53.238 | % | 1.080 | % | 1.585 | % | |||||||||
| 6M To approve the elimination of the Fund's fundamental restrictions with respect to joint participations. | |||||||||||||||
| Shares Voted | 2,228,816.026 | 62,978.690 | 48,184.273 | ||||||||||||
| Percent of Outstanding Shares | 53.248 | % | 1.505 | % | 1.151 | % | |||||||||
| 6N To approve the elimination of the Fund's fundamental restrictions with respect to puts and calls. | |||||||||||||||
| Shares Voted | 2,216,931.162 | 44,825.148 | 78,222.679 | ||||||||||||
| Percent of Outstanding Shares | 52.964 | % | 1.071 | % | 1.869 | % | |||||||||
| 6O To approve the elimination of the Fund's fundamental restrictions with respect to interests in oil and gas programs. | |||||||||||||||
| Shares Voted | 2,239,139.622 | 42,193.308 | 58,646.059 | ||||||||||||
| Percent of Outstanding Shares | 53.494 | % | 1.008 | % | 1.401 | % | |||||||||
38
QUANT FUNDS
INFORMATION FOR SHAREHOLDERS (continued)
Quarterly Portfolio Disclosure
Each Quant Fund files its complete schedule of portfolio holdings with the Securities and Exchange Commission (SEC) for the first and third quarters of each fiscal year on Form N-Q. The funds' Forms N-Q are available on the SEC's website at www.sec.gov and may be reviewed and copied at the SEC's Public Reference Room in Washington, D.C. (Call 1-800-SEC-0330 for more information.). For a complete list of a fund's portfolio holdings, you may also view the most recent quarterly holdings report, semiannual report or annual report on the Quant Funds' web site at www.quantfunds.com.
Portfolio Proxy Voting Policies and Information
Information on how the Quant Funds voted proxies related to portfolio securities for the 12-month period ended June 30, 2005 is available without charge online at www.quantfunds.com and at www.sec.gov. You may also call 1-800-326-2151 to request a free copy of the proxy voting information or the proxy voting policies.
Household Delivery of Fund Documents
With your consent, Quant may send a single proxy statement, prospectus and shareholder report to your residence for you and any other member of your household who has an account with the Quant Funds. If you wish to revoke your consent to this practice, you may do so by notifying Quant, by phone or in writing (see "For Account Information"). Quant will begin mailing separate proxy statements, prospectuses and shareholder reports to you within 30 days after receiving your notice.
PRIVACY POLICY
Please read this important notice about the privacy of our customers' personal information from Quantitative Investment Advisors, Inc., Quantitative Group of Funds, and U.S. Boston Capital Corporation (collectively, "Quantitative").
Quantitative Respects Your Privacy
Quantitative considers the privacy of our customers and former customers a matter of great importance. We respect your privacy and believe that any nonpublic personal information we have should be treated with the highest regard for its confidentiality. Nonpublic personal information includes much of the information you provide to us and the related information about you and your transactions involving your Quantitative investment products or services. Examples of nonpublic personal information include the information you provide on new account applications for Quantitative investment products or services, your share balance or transactional history and the fact that you are a shareholder or client of Quantitative.
Quantitative Privacy Policy
As noted above, Quantitative places a high priority on protecting the privacy of its customers' financial information and other personal details. This Privacy Policy outlines our guidelines and practices for how we collect, use and protect information about individual customers.
Employees. Quantitative employees understand that they must keep your personal and financial information confidential when they have access to it and when they see it as they communicate with you and process transactions on your or your financial intermediary's instructions. Employees are required to refrain from disclosing information to unauthorized persons.
Vendors. When Quantitative hires vendors, such as mail houses or data processors, to assist in delivering services to clients, we require these vendors to commit contractually to keep the information they handle in strict confidence.
39
QUANT FUNDS
PRIVACY POLICY (continued)
Your Personal Information
We collect and record personal information that customers provide:
• on forms and applications
• through electronic media
• through information (commonly referred to as "cookies")
collected from the Web browser of your PC that allows our
website to recognize your browser
• by telephone
• in correspondence
We also collect and record information from:
• your financial advisor
• other firms, such as those from whom you transfer assets
• your transactions with us and our affiliates
• third parties who may notify us of your change of address
Personal information may include:
• names
• phone numbers
• other account information
• addresses
• Social Security and/or Tax ID numbers
• your investments in the Quantitative Group of Funds,
such as your account balance and transaction activity
How Quantitative Uses Information
Quantitative gathers information to help us find better ways to serve clients and enhance other products and programs. For instance,
• we may share information with our affiliates when providing services to you or the Quantitative Group of Funds;
• we may use information to send notices to you about products and services that we feel might interest you; or
• we may employ an unaffiliated company to survey all our customers about our products or the quality of our communications or services.
Information gathered on clients is not sold to other firms, such as direct marketers. The details Quantitative collects will not generate any correspondence, e-mails or phone calls from unaffiliated marketers.
Quantitative may have to provide information to legally authorized agencies or individuals, such as the Securities and Exchange Commission, Internal Revenue Service or other regulatory agencies, or as otherwise required by law. We also share client information with firms that we contracted with to deliver services to our customers or to other financial institutions with which we have joint marketing arrangements. We do not disclose any nonpublic personal information about customers or former customers to other parties, except as permitted by law. As noted above, however, these firms have contractually committed to protect the confidentiality of all Quantitative information to which they have access.
We will send customers an updated Privacy Policy each year.
Security
Quantitative maintains physical, electronic and procedural safeguards that meet federal standards for guarding customer information.
We employ various forms of Internet security, such as
• data encryption
• Secure Sockets Layer (SSL) protocol
• user names and passwords
Passwords. If you access information through the Quantitative Group of Funds' web site, www.quantfunds.com, you should not give your user name or passwords to anyone for any reason. Choosing to provide this information to a third party invites problems and puts the confidentiality of your personal information at risk.
40
QUANT FUNDS
PRIVACY POLICY (continued)
External Links
To provide you with more information that may be helpful, the Quantitative Group of Funds web site may contain links to other web sites that are not affiliated with or maintained by Quantitative. Quantitative does not monitor the privacy practices of these third-party sites, and we do not exercise any authority over the sites. As a result, Quantitative does not assume any responsibility for the content or data collection policies of the sites. When you access any of these third-party sites, Quantitative cannot guarantee that your privacy will be protected in the same way as it is on the Quantitative Group of Funds' web site.
Changes to the privacy policy
Quantitative reserves the right to change, modify, add or remove portions of this privacy policy as permitted by law at any time. Customers may want to review the policy periodically for changes. Customers can review the privacy policy by clicking on the link that appears on the www.quantfunds.com home page.
Questions. If you have any questions or concerns about maintaining the privacy of your customer information at Quantitative, please contact us at 800-326-2151 Monday through Friday, between the hours of 9:00 am and 5:00 pm Eastern Time.
This policy is effective September 30, 2005.
41
QUANT FUNDS
TRUSTEES AND OFFICERS
The business address of each non-interested Trustee is c/o Quant Funds, 55 Old Bedford Road, Lincoln, MA 01773. Each Trustee and officer holds office until his or her successor is chosen and qualified or until his or her earlier death, resignation, retirement or removal. Messrs. Armstrong, Bulbrook, and Marshall are members of the Funds' Audit Committee. The Fund's Statement of Additional Information ("SAI") includes additional information about the Fund Trustees and is available without charge, upon request. To obtain a free copy of the current SAI, please access the Funds' web site at www.QuantFunds.com or call shareholder services at 1-800-326-2141.
| Name, Address and (Age) | Position(s) Held With Funds, Term of Office And Length of Time Served | Principal Occupation(s) During Past Five Years | Number of Portfolios in Fund Complex Overseen by Director | Other Directorships Held by Director | |||||||||||||||
| Non-Interested Trustees | |||||||||||||||||||
| Robert M. Armstrong (68) | Trustee (1985 to Present) | President, Alumni Career, Services; Independent financial and career consulting services | 4 | NewPage Corporation; NewPage Holding Corporation | |||||||||||||||
| John M. Bulbrook (64) | Trustee (1985 to Present) | CEO and Treasurer, John M. Bulbrook Insurance Agency, Inc. | 4 | John M. Bulbrook Insurance Agency, Inc. | |||||||||||||||
| Edward E. Burrows (74) | Trustee (1985 to Present) | Independent consulting actuary-employee benefit plans | 4 | None | |||||||||||||||
| William H. Dunlap (56) | Trustee 10/17/2006 to Present | President, EQ Rider, Inc.; Principal, William H. Dunlap & Company (consulting firm) | 4 | Merrimack County Savings Bank | |||||||||||||||
| Clinton S. Marshall (50) | Trustee (April 2003 to Present) | Owner, Coastal CFO Solutions, CFO, Fore River Company, Finance Director, Northern York County Family YMCA, CFO, Great Works Internet, CFO, Holographix, CFO, EVibe.com, CFO, HealthWatch Technologies. | 4 | Great Works Internet | |||||||||||||||
| Interested Trustees and Officers | |||||||||||||||||||
| Deborah A. Kessinger (44) | Assistant Clerk (April 2005 to present), Chief Compliance Officer (December 2005 to present) | Senior Counsel (since 9/2004) and Chief Compliance Officer (since 12/2005), U.S. Boston Capital Corporation; Senior Counsel (since 9/2004) and Chief Compliance Officer (since 11/2006), Quantitative Investment Advisors, Inc.; Chief Compliance Officer and General Counsel, Wainwright Investment Counsel, LLC (2000-2004); Compliance Attorney, Forefield, Inc. (2001-2004) | N/A | None | |||||||||||||||
42
QUANT FUNDS
TRUSTEES AND OFFICERS (continued)
| Name, Address and (Age) | Position(s) Held With Funds, Term of Office And Length of Time Served | Principal Occupation(s) During Past Five Years | Number of Portfolios in Fund Complex Overseen by Director | Other Directorships Held by Director | |||||||||||||||
| Interested Trustees and Officers (continued) | |||||||||||||||||||
| Leon Okurowski (64) | Vice President and Treasurer (1985 to Present) | Director and Vice President, U.S. Boston Capital Corporation; Treasurer, Quantitative Investment Advisors, Inc.; Trustee, Quant Funds (4/17/1985-9/30/2004) | N/A | AB&T; Everest USB Canadian Storage, Inc.; Quantitative Investment Advisors, Inc.; Sugarbush Solutions, Inc. U.S. Boston Corporation; U.S. Boston Asset Management Corporation; USB Corporation; USB Everest Management, LLC; USB Everest Storage LLC; USB Greenville-86, Inc.; U SB-85 Restaurant Associates, Inc.; USB Atlantic Associates, Inc.; U.S. Boston Insurance Agency, Inc.; U.S. Boston Capital Corporation | |||||||||||||||
| Willard L. Umphrey* (65) | Trustee, President, Chairman (1985 to Present) | Director, U.S. Boston Capital Corporation; President, Quantitative Investment Advisors, Inc. | 4 | AB&T; U.S. Boston Corporation; U.S. Boston Asset Management Corporation; Quantitative Investment Advisors, Inc.; Sugarbush Solutions, Inc., USB Corporation; USB Greenville-86, Inc.; USB-85 Restaurant Associates, Inc.; USB Atlantic Associates, Inc.; U.S. Boston Insurance Agency, Inc.; U.S. Boston Capital Corporation; Pear Tree Royalty Company, Inc ..; Waterfront Parking Corporation | |||||||||||||||
| Steven M. Warner (60) | Assistant Treasurer 10/17/2006 - Present | Controller (since 6/06), USB Corporation; Controller (since 6/06), Quantitative Investment Advisors, Inc.; Consultant (2002-2006); Sr. Vice President of Finance (2000-2002), Corporate Vice President of Finance (1999-2002) Vice President of Finance (1992-2000) and Asst. Vice President of Financial Planning and Analysis (1987-1992), Pioneer Investment Management Shareholder Services, Inc. | N/A | None | |||||||||||||||
43
QUANT FUNDS
TRUSTEES AND OFFICERS (continued)
| Name, Address and (Age) | Position(s) Held With Funds, Term of Office And Length of Time Served | Principal Occupation(s) During Past Five Years | Number of Portfolios in Fund Complex Overseen by Director | Other Directorships Held by Director | |||||||||||||||
| Interested Trustees and Officers (continued) | |||||||||||||||||||
| Elizabeth A. Watson (52) | Clerk (July 2004 to Present), Chief Legal Officer (January 2007 to Present) | Chief Compliance Officer of the Quantitative Group of Funds (7/2004-12/2005); President and General Counsel (since 5/2004), U.S. Boston Capital Corporation; Vice President and General Counsel (since 5/2004), and Chief Compliance Officer (7/2004-10/2006), Quantitative Investment Advisors, Inc.; Principal (2002-2004), Watson & Associates (law firm); Senior Counsel (1998-2002) and Director of Legal Product Management (1995-2002), Pioneer Investment Management USA Inc. (investment management firm) | N/A | None | |||||||||||||||
* Trustees have been determined to be "Interested Trustees" by virtue of, among other things, affiliation with one or more of the trust, the Fund's investment advisor, Quantitative Advisors and the Fund's distributor, U.S. Boston Capital Corporation.
44
QUANT FUNDS
NOTES
This page intentionally left blank.
QUANT FUNDS
NOTES
This page intentionally left blank.
QUANT FUNDS
NOTES
This page intentionally left blank.
QUANT FUNDS
SERVICE PROVIDERS
| Manager | Quantitative Advisors, 55 Old Bedford Road, Lincoln, MA 01772 | ||||||
| Advisers | Columbia Partners, L.L.C., Investment Management, 1775 Pennsylvania Avenue, N.W., Washington, DC 20006 SSgA Funds Management, Inc., State Street Financial Center, One Lincoln Street, Boston, MA 02111 PanAgora Asset Management, Inc., 260 Franklin Street, Boston, MA 02110 Polaris Capital Management, Inc., 125 Summer Street, Boston, MA 02110 | ||||||
| Distributor | U.S. Boston Capital Corporation, 55 Old Bedford Road, Lincoln, MA 01773 | ||||||
| Custodian | State Street Kansas City, 801 Pennsylvania Avenue, Kansas City, MO 64105 | ||||||
| Fund Accountant | State Street Kansas City, 801 Pennsylvania Avenue, Kansas City, MO 64105 | ||||||
| Transfer Agent | Quantitative Institutional Services, 55 Old Bedford Road, Lincoln, MA 01773 | ||||||
| Independent Registered Public Accounting Firm | PricewaterhouseCoopers LLP, 1055 Broadway, 10th Floor, Kansas City, MO 64105 | ||||||
| Legal Counsel | Kirkpatrick & Lockhart Preston Gates Ellis LLP, State Street Financial Center, One Lincoln Street, Boston, MA 02111 | ||||||
| For Account Information | For Quant Funds information, contact your financial adviser or, if you receive account statements directly from Quant Funds, you can also call 1-800-326-2151. Telephone representatives are available from 9:00 a.m. to 5:00 p.m. Eastern Time. Or visit our website, www.QuantFunds.com. | ||||||
PRSRT STD
U.S. POSTAGE
PAID
BOSTON, MA
PERMIT NO. 56689

55 Old Bedford Road
Lincoln, MA 01773
www.quantfunds.com
Address Service Requested
© 2007 U.S. Boston Capital Corporation
Distributor of the Quant Funds
Member NASD, SIPC
ITEM 2. CODE OF ETHICS.
(a) Disclose whether, as of the end of the period covered by the report, the registrant has adopted a code of ethics that applies to the registrant’s principal executive officer, principal financial officer, principal accounting officer or controller, or persons performing similar functions, regardless of whether these individuals are employed by the registrant or a third party. If the registrant has not adopted such a code of ethics, explain why it has not done so.
The registrant has adopted, as of the end of the period covered by this report, a code of ethics that applies to the registrant’s principal executive officer, principal financial officer, principal accounting officer, and controller.
(b) For purposes of this Item, the term “code of ethics” means written standards that are reasonably designed to deter wrongdoing and to promote:
(1) Honest and ethical conduct, including the ethical handling of actual or apparent conflicts of interest between personal and professional relationships;
(2) Full, fair, accurate, timely, and understandable disclosure in reports and documents that a registrant files with, or submits to, the Commission and in other public communications made by the registrant;
| (3) Compliance with applicable governmental laws, rules, and |
| regulations; |
(4) The prompt internal reporting of violations of the code to an appropriate person or persons identified in the code; and
| (5) Accountability for adherence to the code. |
(c) The registrant must briefly describe the nature of any amendment, during the period covered by the report, to a provision of its code of ethics that applies to the registrant’s principal executive officer, principal financial officer, principal accounting officer or controller, or persons performing similar functions, regardless of whether these individuals are employed by the registrant or a third party, and that relates to any element of the code of ethics definition enumerated in paragraph (b) of this Item. The registrant must file a copy of any such amendment as an exhibit pursuant to Item 12(a)(1), unless the registrant has elected to satisfy paragraph (f) of this Item by posting its code of ethics on its website pursuant to paragraph (f)(2) of this Item, or by undertaking to provide its code of ethics to any person without charge, upon request, pursuant to paragraph (f)(3) of this Item.
The Registrant has made no amendment to the code of ethics during the period covered by this report.
(d) If the registrant has, during the period covered by the report, granted a waiver, including an implicit waiver, from a provision of the code of ethics to the registrant’s principal executive officer, principal financial officer, principal accounting officer or controller, or persons performing similar functions, regardless of whether these individuals are employed by the registrant or a third party, that relates to one or more of the items set forth in paragraph (b) of this Item, the registrant must briefly describe the nature of the waiver, the name of the person to whom the waiver was granted, and the date of the waiver.
Not applicable.
(e) If the registrant intends to satisfy the disclosure requirement under paragraph (c) or (d) of this Item regarding an amendment to, or a waiver from, a provision of its code of ethics that applies to the registrant’s principal executive officer, principal financial officer, principal accounting officer or controller, or persons performing similar functions and that relates to any element of the code of ethics definition enumerated in paragraph (b) of this Item by posting such information on its Internet website, disclose the registrant’s Internet address and such intention.
Not applicable.
(f) The registrant must:
(1) File with the Commission, pursuant to Item 12(a)(1), a copy of its code of ethics that applies to the registrant’s principal executive officer, principal financial officer, principal accounting officer or controller, or persons performing similar functions, as an exhibit to its annual report on this Form N-CSR;
(2) Post the text of such code of ethics on its Internet website and disclose, in its most recent report on this Form N-CSR, its Internet address and the fact that it has posted such code of ethics on its Internet website; or
(3) Undertake in its most recent report on this Form N-CSR to provide to any person without charge, upon request, a copy of such code of ethics and explain the manner in which such request may be made.
See Item 12(a)(1).
ITEM 3. AUDIT COMMITTEE FINANCIAL EXPERT.
(a) (1) Disclose that the registrant’s board of trustees has determined that the registrant either:
(i) Has at least one audit committee financial expert serving on its audit committee; or
| (ii) Does not have an audit committee financial expert serving on its audit committee. |
The registrant’s Board of Trustees has determined that the registrant has at least one audit committee financial expert.
(2) If the registrant provides the disclosure required by paragraph (a)(1)(i) of this Item, it must disclose the name of the audit committee financial expert and whether that person is “independent.” In order to be considered “independent” for purposes of this Item, a member of an audit committee may not, other than in his or her capacity as a member of the audit committee, the board of trustees, or any other board committee:
(i) Accept directly or indirectly any consulting, advisory, or other compensatory fee from the issuer; or
(ii) Be an “interested person” of the investment company as defined in Section 2(a)(19) of the Act (15 U.S.C. 80a-2(a)(19)).
Mr. Clinton S. Marshall, an independent trustee, is such an audit committee financial expert.
(3) If the registrant provides the disclosure required by paragraph (a)(1)(ii) of this Item, it must explain why it does not have an audit committee financial expert.
Not applicable.
ITEM 4. PRINCIPAL ACCOUNTANT FEES AND SERVICES.
(a) Disclose, under the caption AUDIT FEES, the aggregate fees billed for each of the last two fiscal years for professional services rendered by the principal accountant for the audit of the registrant’s annual financial statements or services that are normally provided by the accountant in connection with statutory and regulatory filings or engagements for those fiscal years.
Audit Fees
Fees for audit services provided to the Fund, including fees associated with the routine filings of its Form N-1A, totaled $109,150 in 2007, and $102,000 in 2006.
(b) Disclose, under the caption AUDIT-RELATED FEES, the aggregate fees billed in each of the last two fiscal years for assurance and related services by the principal accountant that are reasonably related to the performance of the audit of the registrant’s financial statements and are not reported under paragraph (a) of this Item. Registrants shall describe the nature of the services comprising the fees disclosed under this category.
Audit-Related Fees
Fees for audit-related services provided to the Fund during the fiscal years ended March 31, 2007 and 2006 totaled $40,000 and $32,861, respectively. These fees were paid for the annual audit of the Transfer Agent.
(c) Disclose, under the caption TAX FEES, the aggregate fees billed in each of the last two fiscal years for professional services rendered by the principal accountant for tax compliance, tax advice, and tax planning. Registrants shall describe the nature of the services comprising the fees disclosed under this category.
Tax Fees
Fees for tax compliance services, primarily for tax returns, and tax advisory services totaled $21,150 in 2007 and $19,800 in 2006.
(d) Disclose, under the caption ALL OTHER FEES, the aggregate fees billed in each of the last two fiscal years for products and services provided by the principal accountant, other than the services reported in paragraphs (a) through (c) of this Item. Registrants shall describe the nature of the services comprising the fees disclosed under this category.
All Other Fees
There were no other fees during the fiscal years ended March 31, 2007 and 2006.
(e)(1) Disclose the audit committee’s pre-approval policies and procedures described in paragraph (c)(7) of Rule 2-01 of Regulation S-X.
To the extent required by applicable law, pre-approval by the Audit Committee of the Board is needed for:
(i) | all audit and permissible non-audit services rendered to the Fund and |
(ii) all permissible non-audit services rendered to Quantitative Investment Advisors, Inc. if the services relate directly to the operations and financial reporting of the Registrant. Pre-approval is currently on an engagement-by-engagement basis. In the event pre-approval of such services is necessary between regular meetings of the Audit Committee and it is not practical to wait to seek pre-approval at the next regular meeting of the Audit Committee, such pre-approval of services may be referred to the President of the Fund for approval; provided that the President may not pre-approve any individual engagement for such services exceeding $5,000 or multiple engagements for such services in the aggregate exceeding $5,000 between such regular meetings of the Audit Committee. Any engagement pre-approved by the President between regular meetings of the Audit Committee shall be presented for ratification by the entire Audit Committee at its next regularly scheduled meeting.
(e)(2) Disclose the percentage of services described in each of paragraphs (b)
through (d) of this Item that were approved by the audit committee pursuant
to paragraph (c)(7)(i)(C) of Rule 2-01 of Regulation S-X.
For the fiscal years ended March 31, 2007 and 2006, there were no services provided to an affiliate that required the Audit Committee’s pre-approval under paragraph (c)(7)(i)(c) of Rule 2-01 of Regulation S-X.
(f) If greater than 50 percent, disclose the percentage of hours expended on the principal accountant’s engagement to audit the registrant’s financial statements for the most recent fiscal year that were attributed to work performed by persons other than the principal accountant’s full-time, permanent employees.
Not applicable.
(g) Disclose the aggregate non-audit fees billed by the registrant’s accountant for services rendered to the registrant, and rendered to the registrant’s investment adviser (not including any sub-adviser whose role is primarily portfolio management and is subcontracted with or overseen by another investment adviser), and any entity controlling, controlled by, or under common control with the adviser that provides ongoing services to the registrant for each of the last two fiscal years of the registrant.
Fees for non-audit services provided to the Registrant, including fees rendered to the Registrant’s investment adviser (not including any sub-adviser whose role is primarily portfolio management and is subcontracted with or overseen by another investment adviser), and any entity controlling, controlled by, or under common control with the adviser that provides ongoing services to the Registrant for each of the last two fiscal years of the registrant, totaled $0 in 2007 and $0 in 2006.
(h) Disclose whether the registrant’s audit committee of the board of directors has considered whether the provision of non-audit services that were rendered to the registrant’s investment adviser (not including any subadviser whose role is primarily portfolio management and is subcontracted with or overseen by another investment adviser), and any entity controlling, controlled by, or under common control with the investment adviser that provides ongoing services to the registrant that were not pre-approved pursuant to paragraph (c)(7)(ii) of Rule 2-01 of Regulation S-X is compatible with maintaining the principal accountant’s independence.
For the fiscal years ended March 31, 2007 and 2006, no non-audit services were provided by the Registrant’s independent registered public accounting firm to Quantitative Investment Advisors, Inc.
ITEM 5. AUDIT COMMITTEE OF LISTED REGISTRANTS.
(a) If the registrant is a listed issuer as defined in Rule 10A-3 under the Exchange Act (17 CFR 240.10A-3), state whether or not the registrant has a separately-designated standing audit committee established in accordance with Section 3(a)(58)(A) of the Exchange Act (15 U.S.C. 78c(a)(58)(A)). If the registrant has such a committee, however designated, identify each committee member. If the entire board of directors is acting as the
registrant’s audit committee as specified in Section 3(a)(58)(B) of the Exchange Act (15 U.S.C. 78c(a)(58)(B)), so state.
The Registrant has a separately-designated standing Audit Committee established in accordance with Section 3(a)(58)(A) of the Securities Exchange Act (15 U.S.C. 78c(a)(58)(B)).
(b) If applicable, provide the disclosure required by Rule 10A-3(d) under the Exchange Act (17 CFR 240.10A-3(d)) regarding an exemption from the listing standards for audit committees.
Not applicable.
ITEM 6. SCHEDULE OF INVESTMENTS
File Schedule I – Investments in securities of unaffiliated issuers as of the close of the reporting period as set forth in § 210.12-12 of Regulation S-X [17 CFR 210.12-12], unless the schedule is included as part of the report to shareholders filed under Item 1 of this Form.
A schedule of investments of the Registrant is included as part of the report to shareholders of the Registrant under Item 1 of this Form N-CSR.
ITEM 7. DISCLOSURE OF PROXY VOTING POLICIES AND PROCEDURES FOR CLOSED-END MANAGEMENT INVESTMENT COMPANIES.
A closed-end management investment company that is filing an annual report on this Form N-CSR must, unless it invests exclusively in non-voting securities, describe the policies and procedures that it uses to determine how to vote proxies relating to portfolio securities, including the procedures that the company uses when a vote presents a conflict between the interests of its shareholders, on the one hand, and those of the company’s investment adviser; principal underwriter; or any affiliated person (as defined in Section 2(a)(3) of the Investment Company Act of 1940 (15 U.S.C. 80a-2(a)(3)) and the rules thereunder) of the company, its investment adviser, or its principal underwriter, on the other. Include any policies and procedures of the company’s investment adviser, or any other third party, that the company uses, or that are used on the company’s behalf, to determine how to vote proxies relating to portfolio securities.
Not applicable to open-end management investment companies.
ITEM 8. PORTFOLIO MANAGERS OF CLOSED-END MANAGEMENT INVESTMENT COMPANIES.
If the registrant is a closed-end management investment company that is filing an annual report on this Form N-CSR, provide the following information:
(1) State the name, title, and length of service of the person or persons Employed by or associated with the registrant or an investment adviser of the registrant who are primarily responsible for the day-to-day management of the registrant’s portfolio (“Portfolio Manager”). Also state each Portfolio Manager’s business experience during the past 5 years.
Not applicable to open-end management investment companies.
ITEM 9. PURCHASES OF EQUITY SECURITIES BY CLOSED-END MANAGEMENT INVESTMENT COMPANY AND AFFILIATED PURCHASERS.
If the registrant is a closed-end management investment company provide the information specified in paragraph (b) of this Item with respect to any purchase made by or on behalf of the registrant or any “affiliated purchaser,” as defined in Rule 10b-18(a)(3) under the Exchange Act (17 CFR 240.10b-18(a)(3)), of shares or other units of any class of the registrant’s equity securities that is registered by the registrant pursuant to Section 12 of the Exchange Act (15 U.S.C. 781).
Not applicable to open-end management investment companies.
ITEM 10. SUBMISSION OF MATTERS TO A VOTE OF SECURITY HOLDERS.
Describe any material changes to the procedures by which shareholders may recommend nominees to the registrant’s board of directors, where those changes were implemented after the registrant last provided disclosure in response to the requirements of Item 407(c)(2)(iv) of Regulation S-K (17 CFR 229.407) (as required by Item 22(b)(15) of Schedule 14A (17 CFR 240.14a-101), or this Item, indicated that the registrant did not have in place such procedures, will constitute a material change.
There have been no material changes to the procedures by which shareholders may send recommendations to the Board for nominees to the Registrant’s Board since the Registrant last provided disclosure as to such procedures in response to the requirements of Item 407(c)(2)(iv) of Regulation S-K (17 CFR 229.407) (as required by Item 22(b)(15) of Schedule 14A (17 CFR 240.14a-101), or this Item.
ITEM 11. CONTROLS AND PROCEDURES.
(a) Disclose the conclusions of the registrant’s principal executive and principal financial officers, or persons performing similar functions, regarding the effectiveness of the registrant’s disclosure controls and procedures (as defined in Rule 30a-3(c) under the Act (17 CFR 270.30a-3(c))) as of a date within 90 days of the filing date of the report that includes the disclosure required by this paragraph, based on the evaluation of these controls and procedures required by Rule 30a-3(b) under the Act (17 CFR 270.30a-3(b)) and Rules 13a-15(b) or 15d-15(b) under the Exchange Act (17 CFR 240.13a-15(b) or 240.15d-15(b)).
The Registrant’s principal executive officer and principal financial officer have concluded, that the Registrant’s disclosure controls and procedures are effective based on their evaluation of these controls and procedures as of a date within 90 days of the filing date of this report.
(b) Disclose any change in the registrant’s internal control over financial reporting (as defined in Rule 30a-3(d) under the Act (17 CFR 270.30a-3(d)) that occurred during the second fiscal quarter of the period covered by this report that has materially affected, or is reasonably likely to materially affect, the registrant’s internal control over financial reporting.
There were no changes in the Registrant’s internal controls over financial reporting that has materially affected, or is reasonably likely to materially affect, the registrant’s internal control over financial reporting.
ITEM 12. EXHIBITS.
File the exhibits listed below as part of this Form. Letter or number the exhibits in the sequence indicated.
(a) Any code of ethics, or amendment thereto, that is the subject of the disclosure required by Item 2, to the extent that the registrant intends to satisfy the Item 2 requirements through filing of an exhibit.
Filed herewith.
(b) A separate certification for each principal executive and principal financial officer of the registrant as required by Rule 30a-2 under the Act (17 CFR 270.30a-2(a)).
Filed herewith.
SIGNATURES
Pursuant to the requirements of the Securities Exchange Act of 1934 and the Investment Company Act of 1940, the registrant has duly caused this report to be signed on its behalf by the undersigned, thereunto duly authorized.
Quantitative Group of Funds
By /s/ Willard L. Umphrey
Willard L. Umphrey, President
Date: May 24, 2007
Pursuant to the requirements of the Securities Exchange Act of 1934 and the Investment Company Act of 1940, this report has been signed below by the following persons on behalf of the registrant and in the capacities and on the dates indicated.
By /s/ Willard L. Umphrey
Willard L. Umphrey, President
Date: May 24, 2007
By /s/ Leon Okurowski
Leon Okurowski, Treasurer
Date: May 24, 2007