OMB APPROVAL
OMB Number: 3235-0570
Expires: August 31, 2011
Estimated average burden
hours per response..... 18.9
UNITED STATES
SECURITIES AND EXCHANGE COMMISSION
Washington, D.C. 20549
FORM N-CSR
CERTIFIED SHAREHOLDER REPORT OF REGISTERED
MANAGEMENT INVESTMENT COMPANIES
Investment Company Act file number 811-3790
The Quantitative Group of Funds
(Exact name of registrant as specified in charter)
55 Old Bedford Road, Lincoln, MA 01773
(Address of principal executive offices)
Sandra I. Madden
Quantitative Investment Advisors, Inc.
55 Old Bedford Road, Lincoln, MA 01773
(Name and address of agent for service)
Registrant’s telephone number, including area code: (781) 676-5900
Date of fiscal year end: | March 31 |
Date of reporting period: | April 1, 2009 through September 30, 2009 |
ITEM 1. REPORTS TO SHAREOWNERS.
Unassociated Document
Quant Long/Short Fund
Quant Emerging Markets Fund
Quant Foreign Value Fund
Quant Foreign Value Small Cap Fund
September 30, 2009
President’s Letter | 1 | |
Fund Expenses | 2 | |
Portfolio Manager Commentaries |
| |
Quant Small Cap Fund | 4 | |
Quant Long/Short Fund | 6 | |
Quant Emerging Markets Fund | 8 | |
Quant Foreign Value Fund | 10 | |
Quant Foreign Value Small Cap Fund | 12 | |
Schedules of Investments |
| |
Quant Small Cap Fund | 14 | |
Quant Long/Short Fund | 18 | |
Quant Emerging Markets Fund | 26 | |
Quant Foreign Value Fund | 33 | |
Quant Foreign Value Small Cap Fund | 36 | |
Statements of Assets and Liabilities | 40 | |
Statements of Operations | 44 | |
Statements of Changes in Net Assets | 46 | |
Statement of Cash Flows for Quant Long/Short Fund | 51 | |
Financial Highlights | 52 | |
Notes to Financial Statements | 62 | |
Information for Shareholders | 74 | |
Management Contract and Advisory Contract Approval | 75 | |
Trustees and Officers | 78 | |
Service Providers | back cover |

President and Chairman
1
2
| Quant Fund | | Share Class | | Total Return Description | | Beginning Account Value 04/01/09 | | Ending Account Value 09/30/09 | | Annualized Expense Ratio | | Expenses Paid* 04/01/09 09/30/09 | ||||||||||||||
|---|---|---|---|---|---|---|---|---|---|---|---|---|---|---|---|---|---|---|---|---|---|---|---|---|---|---|
| Small Cap | Ordinary | Actual | $ | 1,000.00 | $ | 1,382.60 | 1.72 | % | $ | 10.27 | ||||||||||||||||
| Hypothetical | $ | 1,000.00 | $ | 1,016.44 | 1.72 | % | $ | 8.69 | ||||||||||||||||||
| Institutional | Actual | $ | 1,000.00 | $ | 1,384.00 | 1.59 | % | $ | 9.50 | |||||||||||||||||
| Hypothetical | $ | 1,000.00 | $ | 1,017.10 | 1.59 | % | $ | 8.04 | ||||||||||||||||||
| Long/Short | Ordinary | Actual | $ | 1,000.00 | $ | 1,257.30 | 2.22 | % | $ | 12.56 | ||||||||||||||||
| Hypothetical | $ | 1,000.00 | $ | 1,013.94 | 2.22 | % | $ | 11.21 | ||||||||||||||||||
| Institutional | Actual | $ | 1,000.00 | $ | 1,254.10 | 2.76 | % | $ | 15.60 | |||||||||||||||||
| Hypothetical | $ | 1,000.00 | $ | 1,011.23 | 2.76 | % | $ | 13.92 | ||||||||||||||||||
| Emerging Markets | Ordinary | Actual | $ | 1,000.00 | $ | 1,572.10 | 1.78 | % | $ | 11.48 | ||||||||||||||||
| Hypothetical | $ | 1,000.00 | $ | 1,016.14 | 1.78 | % | $ | 9.00 | ||||||||||||||||||
| Institutional | Actual | $ | 1,000.00 | $ | 1,573.40 | 1.58 | % | $ | 10.19 | |||||||||||||||||
| Hypothetical | $ | 1,000.00 | $ | 1,017.15 | 1.58 | % | $ | 7.99 | ||||||||||||||||||
| Foreign Value | Ordinary | Actual | $ | 1,000.00 | $ | 1,734.60 | 1.67 | % | $ | 11.45 | ||||||||||||||||
| Hypothetical | $ | 1,000.00 | $ | 1,016.70 | 1.67 | % | $ | 8.44 | ||||||||||||||||||
| Institutional | Actual | $ | 1,000.00 | $ | 1,733.50 | 1.43 | % | $ | 9.80 | |||||||||||||||||
| Hypothetical | $ | 1,000.00 | $ | 1,017.90 | 1.43 | % | $ | 7.23 | ||||||||||||||||||
| Foreign Value | Ordinary | Actual | $ | 1,000.00 | $ | 1,927.40 | 1.71 | % | $ | 10.49 | ||||||||||||||||
| Small Cap | Hypothetical | $ | 1,000.00 | $ | 1,013.79 | 1.71 | % | $ | 7.22 | |||||||||||||||||
| Institutional | Actual | $ | 1,000.00 | $ | 1,929.50 | 1.57 | % | $ | 9.64 | |||||||||||||||||
| Hypothetical | $ | 1,000.00 | $ | 1,014.38 | 1.57 | % | $ | 6.63 | ||||||||||||||||||
| * | Expenses paid are equal to the Fund’s annualized expense ratios, multiplied by the average account value over the period, multiplied by 183/365 (to reflect the one-half year period). |
3
Fund Information | |||||||||||
| Net Assets Under Management | $90.9 Million | ||||||||||
| Number of Companies | 71 | ||||||||||
| Price to Book Ratio | 2.6 | ||||||||||
| Price to Earnings Ratio | 17.6 | ||||||||||
| Ordinary | Institutional | ||||||||||
| Total Expense Ratio (Net) | 1.72% | 1.59% | |||||||||
| Ticker Symbol | USBNX | QBNAX | |||||||||
The Fund is co-managed by Robert von Pentz, CFA, and Rhys Williams, CFA of Columbia Partners, L.L.C. Investment Management.
4
Percentage of total net assets | 39.3 | % | ||||
| Entertainment Properties Trust | 4.9 | % | ||||
| Core Laborotories N.V. | 4.5 | % | ||||
| Compass Minerals International, Inc. | 4.4 | % | ||||
| Regal Entertainment Group | 4.3 | % | ||||
| Ventas, Inc. | 4.1 | % | ||||
| SBA Communications Corporation | 4.0 | % | ||||
| Guess?, Inc. | 3.8 | % | ||||
| Alliance Data Systems Corporation | 3.2 | % | ||||
| Dean Foods Company | 3.1 | % | ||||
| NICE-Systems Ltd. | 3.0 | % |
Percentage of total net assets | 100.0 | % | ||||
| Information Technology | 18.8 | % | ||||
| Consumer Discretionary | 16.0 | % | ||||
| Financials | 15.5 | % | ||||
| Industrials | 10.2 | % | ||||
| Consumer Staples | 9.3 | % | ||||
| Materials | 8.2 | % | ||||
| Health Care | 7.6 | % | ||||
| Energy | 6.5 | % | ||||
| Telecommunication Services | 5.7 | % | ||||
| Utilities | 1.1 | % | ||||
| Cash and Other Assets (Net) | 1.1 | % |
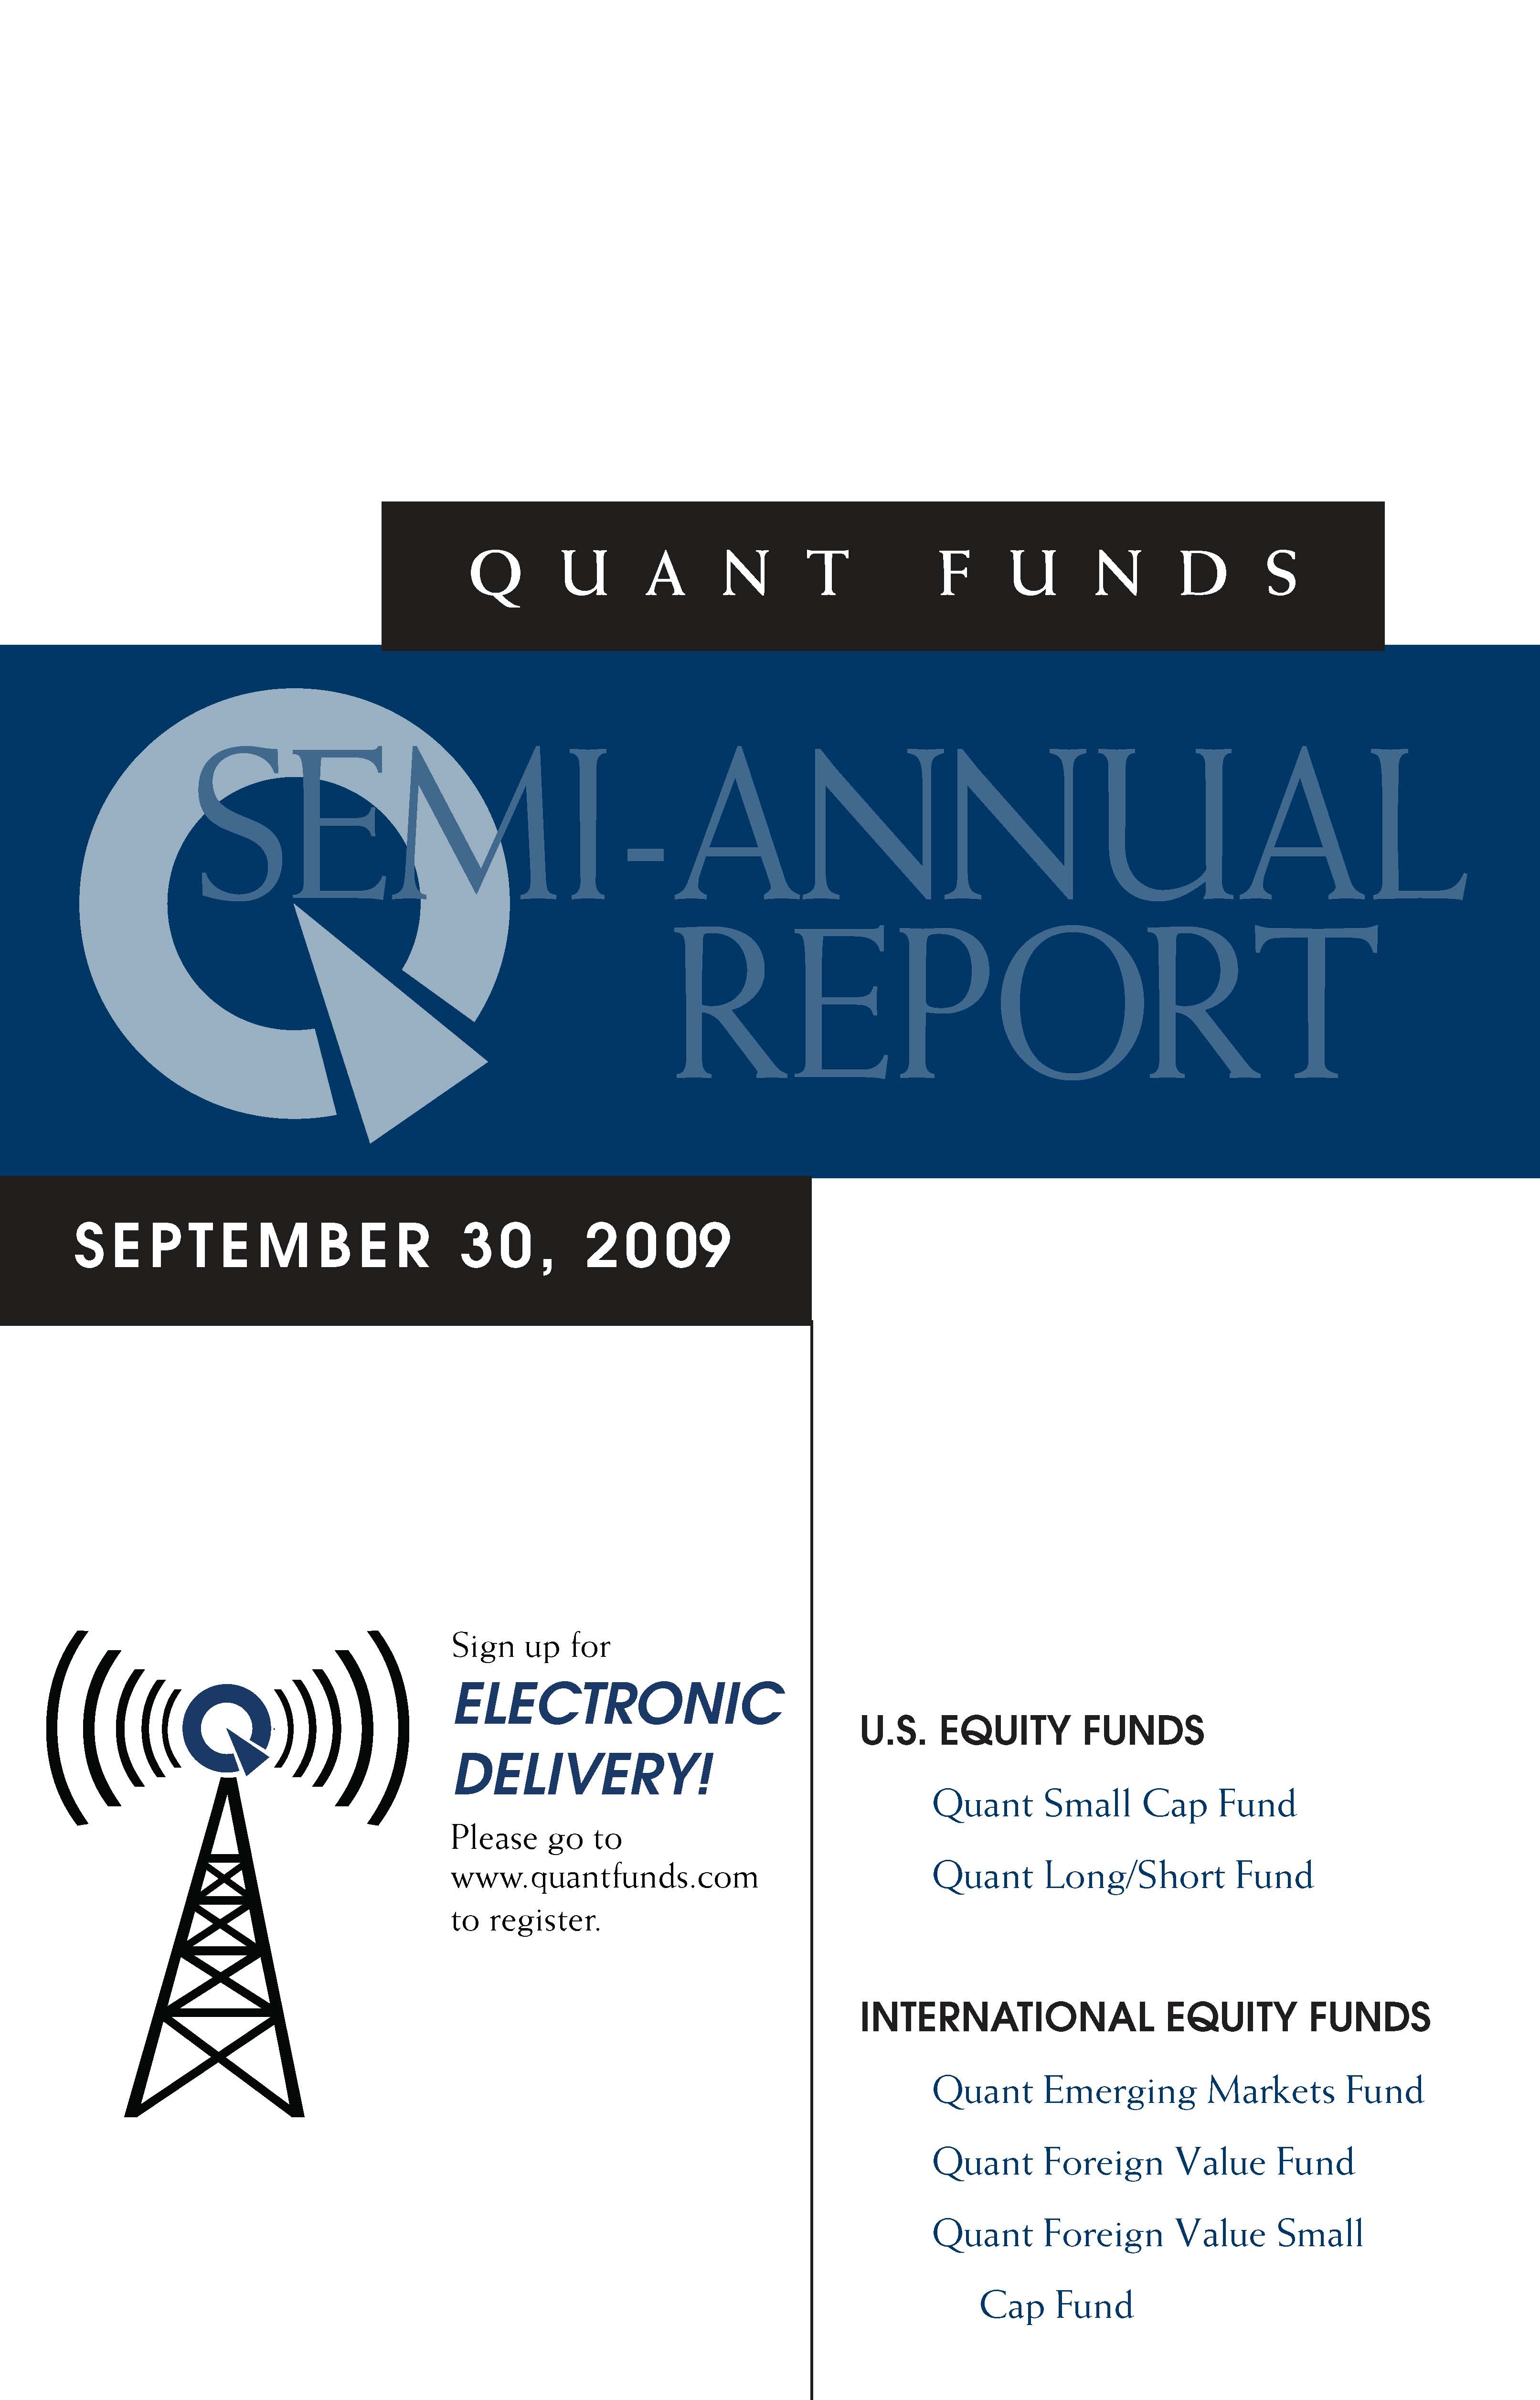
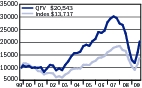
Russell 2000 Index

| | 3Q 2009 | | Six Months | | One Year | | Five Year | | Ten Year | | Since Inception | | Inception Date | |||||||||||||||||
|---|---|---|---|---|---|---|---|---|---|---|---|---|---|---|---|---|---|---|---|---|---|---|---|---|---|---|---|---|---|---|
| Ordinary Shares | 17.75 | % | 38.26 | % | (16.03 | )% | (0.83 | )% | 3.88 | % | 9.19 | % | 08/03/92 | |||||||||||||||||
Institutional Shares1 | 17.83 | % | 38.40 | % | (15.88 | )% | (0.47 | )% | 4.34 | % | 8.31 | % | 01/06/93 | |||||||||||||||||
Russell 20002 | 19.28 | % | 43.96 | % | (9.55 | )% | 2.41 | % | 4.88 | % | 8.51 | % | ||||||||||||||||||
5
Fund Information | |||||||||||
| Net Assets Under Management | $52.6 Million | ||||||||||
| Number of Companies | 170 | ||||||||||
| Price to Book Ratio | 2.3 | ||||||||||
| Price to Earnings Ratio | 14.1 | ||||||||||
| Ordinary | Institutional | ||||||||||
| Total Expense Ratio (Net) | 2.22% | 2.76% | |||||||||
| Ticker Symbol | USBOX | QGIAX | |||||||||
The Fund’s portfolio is managed by a team of portfolio managers at Analytic Investors, LLC. The lead portfolio managers are Harindra de Silva, Ph.D.,CFA, Dennis Bein, CFA, and Steve Sapra, CFA.
6
Percentage of total net assets | 39.1 | % | ||||
| Chevron Corporation | 5.7 | % | ||||
| Comcast Corporation | 4.6 | % | ||||
| Intel Corporation | 4.3 | % | ||||
| Occidental Petroleum Corporation | 4.3 | % | ||||
| Exxon Mobil Corporation | 3.7 | % | ||||
| Amgen Inc. | 3.7 | % | ||||
| Corning Incorporated | 3.5 | % | ||||
| AmerisourceBergen Corporation | 3.4 | % | ||||
| Texas Instruments Inc. | 3.0 | % | ||||
| Murphy Oil Corporation | 2.9 | % |
Percentage of total net assets | 100.0 | % | ||||
| Financials | 22.3 | % | ||||
| Information Technology | 22.2 | % | ||||
| Health Care | 21.5 | % | ||||
| Energy | 18.0 | % | ||||
| Industrials | 13.5 | % | ||||
| Consumer Staples | 10.7 | % | ||||
| Consumer Discretionary | 10.3 | % | ||||
| Telecommunication Services | 4.7 | % | ||||
| Utilities | 4.3 | % | ||||
| Materials | 2.1 | % | ||||
| Cash and Other Assets (Net) | 0.3 | % | ||||
| *Short Positions | (29.9 | )% | ||||
Percentage of total net assets | (15.7 | )% | ||||
| Hologic, Inc. | (2.5 | )% | ||||
| Vertex Pharmaceuticals Incorporated | (1.8 | )% | ||||
| Cypress Semiconductor Corporation | (1.7 | )% | ||||
| El Paso Corporation | (1.6 | )% | ||||
| Plains Exploration & Production Company | (1.6 | )% | ||||
| Liberty Media Capital | (1.5 | )% | ||||
| Ciena Corporation | (1.4 | )% | ||||
| Rambus Inc. | (1.3 | )% | ||||
| King Pharmaceuticals, Inc. | (1.3 | )% | ||||
| Lazard, Ltd. | (1.0 | )% |
| | 3Q 2009 | | Six Months | | One Year | | Five Year | | Ten Year | | Since Inception | | Inception Date | |||||||||||||||||
|---|---|---|---|---|---|---|---|---|---|---|---|---|---|---|---|---|---|---|---|---|---|---|---|---|---|---|---|---|---|---|
| Ordinary Shares | 8.82 | % | 25.73 | % | (14.05 | )% | (1.90 | )% | (2.67 | )% | 8.23 | % | 05/06/85 | |||||||||||||||||
Institutional Shares1 | 8.73 | % | 25.41 | % | (14.51 | )% | (1.83 | )% | (2.40 | )% | 6.17 | % | 03/25/91 | |||||||||||||||||
S & P 5002 | 15.61 | % | 34.02 | % | (6.91 | )% | 1.02 | % | (0.15 | )% | 9.92 | % | ||||||||||||||||||
7
Fund Information | |||||||||||
| Net Assets Under Management | $251.9 Million | ||||||||||
| Number of Companies | 181 | ||||||||||
| Price to Book Ratio | 1.9 | ||||||||||
| Price to Earnings Ratio | 13.3 | ||||||||||
| Ordinary | Institutional | ||||||||||
| Total Expense Ratio (Net) | 1.78% | 1.58% | |||||||||
| Ticker Symbol | QFFOX | QEMAX | |||||||||
The Fund’s portfolio is managed by a team of portfolio managers at PanAgora Asset Management, Inc.
8
Percentage of total net assets | 25.0 | % | ||||
| Petroleo Brasileiro SA | 4.5 | % | ||||
| WisdomTree India Earnings Fund | 3.9 | % | ||||
| Gazprom | 2.7 | % | ||||
| iPath MSCI India Index ETN | 2.6 | % | ||||
| Taiwan Semiconductor Manufacturing Company Ltd. | 2.4 | % | ||||
| China Construction Bank Corporation | 2.0 | % | ||||
| Samsung Electronics Co., Ltd. | 1.9 | % | ||||
| LUKOIL | 1.7 | % | ||||
| Bank of China Ltd. | 1.7 | % | ||||
| CNOOC Limited | 1.6 | % |
Percentage of total net assets | 89.2 | % | ||||
| China | 18.5 | % | ||||
| Brazil | 15.5 | % | ||||
| South Korea | 13.7 | % | ||||
| Taiwan | 11.9 | % | ||||
| India | 7.9 | % | ||||
| Russia | 7.0 | % | ||||
| South Africa | 5.7 | % | ||||
| Thailand | 3.4 | % | ||||
| Mexico | 2.9 | % | ||||
| Indonesia | 2.7 | % |
Percentage of total net assets | 100.0 | % | ||||
| Financials | 21.2 | % | ||||
| Energy | 14.1 | % | ||||
| Information Technology | 13.8 | % | ||||
| Materials | 13.3 | % | ||||
| Exchange Traded Funds | 8.2 | % | ||||
| Industrials | 7.4 | % | ||||
| Telecommunication Services | 7.2 | % | ||||
| Consumer Discretionary | 6.7 | % | ||||
| Utilities | 3.5 | % | ||||
| Consumer Staples | 2.9 | % | ||||
| Health Care | 1.4 | % | ||||
| Cash and Other Assets (Net) | 0.3 | % |
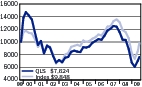
| | 3Q 2009 | | Six Months | | One Year | | Five Year | | Ten Year | | Since Inception | | Inception Date | |||||||||||||||||
|---|---|---|---|---|---|---|---|---|---|---|---|---|---|---|---|---|---|---|---|---|---|---|---|---|---|---|---|---|---|---|
| Ordinary Shares | 20.23 | % | 57.21 | % | 4.84 | % | 12.99 | % | 11.48 | % | 6.15 | % | 09/30/94 | |||||||||||||||||
Institutional Shares1 | 20.25 | % | 57.34 | % | 5.05 | % | 13.34 | % | 11.93 | % | 8.37 | % | 04/02/96 | |||||||||||||||||
MSCI EM2 | 21.04 | % | 63.21 | % | 19.44 | % | 17.68 | % | 11.71 | % | 5.65 | % | ||||||||||||||||||
9
Fund Information | |||||||||||
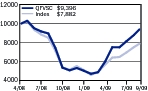
| Net Assets Under Management | $481.7 Million | ||||||||||
| Number of Companies | 51 | ||||||||||
| Price to Book Ratio | 1.3 | ||||||||||
| Price to Earnings Ratio | 10.1 | ||||||||||
| Ordinary | Institutional | ||||||||||
| Total Expense Ratio (Net) | 1.67% | 1.43% | |||||||||
| Ticker Symbol | QFVOX | QFVIX | |||||||||
The Fund’s lead portfolio manager is Bernard R. Horn, Jr., of Polaris Capital Management, LLC
10
Percentage of total net assets | 29.4 | % | ||||
| Smurfit Kappa PLC | 3.8 | % | ||||
| Samsung Electronics Company Ltd. | 3.5 | % | ||||
| Taylor Wimpey PLC | 3.2 | % | ||||
| Kone Corporation OYJ-B | 2.9 | % | ||||
| Yit OYJ | 2.9 | % | ||||
| Trevi Finanziaria SpA | 2.8 | % | ||||
| Methanex Corporation | 2.6 | % | ||||
| Bellway PLC | 2.6 | % | ||||
| Christian Dior S.A. | 2.6 | % | ||||
| Technip S.A. | 2.5 | % |
Percentage of total net assets | 100.0 | % | ||||
| Materials | 20.1 | % | ||||
| Industrials | 19.8 | % | ||||
| Consumer Discretionary | 16.4 | % | ||||
| Financials | 15.0 | % | ||||
| Energy | 5.9 | % | ||||
| Consumer Staples | 5.5 | % | ||||
| Information Technology | 3.9 | % | ||||
| Utilities | 3.8 | % | ||||
| Telecommunication Services | 3.1 | % | ||||
| Health Care | 1.6 | % | ||||
| Cash and Other Assets (net) | 4.9 | % |
Percentage of total net assets | 77.9 | % | ||||
| Japan | 13.4 | % | ||||
| United Kingdom | 10.9 | % | ||||
| Germany | 10.1 | % | ||||
| Finland | 9.3 | % | ||||
| Ireland | 9.1 | % | ||||
| Sweden | 6.9 | % | ||||
| France | 6.1 | % | ||||
| South Korea | 5.1 | % | ||||
| Belgium | 4.2 | % | ||||
| Italy | 2.8 | % |
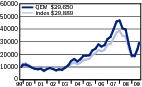
| | 3Q 2009 | | Six Months | | One Year | | Five Year | | Ten Year | | Since Inception | | Inception Date | |||||||||||||||||
|---|---|---|---|---|---|---|---|---|---|---|---|---|---|---|---|---|---|---|---|---|---|---|---|---|---|---|---|---|---|---|
| Ordinary Shares | 26.73 | % | 73.46 | % | 15.55 | % | 4.71 | % | 7.47 | % | 5.63 | % | 05/15/98 | |||||||||||||||||
Institutional Shares1 | 26.83 | % | 73.35 | % | 15.59 | % | 4.92 | % | 7.73 | % | 7.85 | % | 12/18/98 | |||||||||||||||||
MSCI EAFE2 | 19.52 | % | 50.41 | % | 3.80 | % | 6.57 | % | 2.97 | % | 3.72 | % | ||||||||||||||||||
11
Fund Information | |||||||||||
| Net Assets Under Management | $78.9 Million | ||||||||||
| Number of Companies | 53 | ||||||||||
| Price to Book Ratio | 1.5 | ||||||||||
| Price to Earnings Ratio | 10.1 | ||||||||||
| Ordinary | Institutional | ||||||||||
| Total Expense Ratio (Net) | 1.71% | 1.57% | |||||||||
| Ticker Symbol | QUSOX | QUSIX | |||||||||
The Fund’s lead portfolio manager is Bernard R. Horn, Jr., of Polaris Capital Management, LLC
12
Percentage of total net assets | 19.9 | % | ||||
| LIC Housing Finance Ltd. Derivative | 2.1 | % | ||||
| Drägerwerk AG | 2.1 | % | ||||
| Bank Vozrozhdenie | 2.1 | % | ||||
| Character Group plc | 2.0 | % | ||||
| Sinopec Kantons Houldings Limited | 2.0 | % | ||||
| United Drug | 2.0 | % | ||||
| Grafton Group plc | 1.9 | % | ||||
| New Clicks Holdings | 1.9 | % | ||||
| China Fishery Group Limited | 1.9 | % | ||||
| KRBL Limited Derivative | 1.9 | % |
Percentage of total net assets | 75.6 | % | ||||
| United Kingdom | 20.8 | % | ||||
| India | 9.5 | % | ||||
| Ireland | 9.4 | % | ||||
| China | 7.3 | % | ||||
| Singapore | 5.4 | % | ||||
| Norway | 5.4 | % | ||||
| Japan | 5.4 | % | ||||
| Sweden | 5.0 | % | ||||
| Germany | 3.9 | % | ||||
| Switzerland | 3.5 | % |
Percentage of total net assets | 100.0 | % | ||||
| Industrials | 22.5 | % | ||||
| Consumer Discretionary | 17.9 | % | ||||
| Financials | 13.2 | % | ||||
| Consumer Staples | 10.9 | % | ||||
| Information Technology | 10.5 | % | ||||
| Health Care | 5.9 | % | ||||
| Materials | 4.9 | % | ||||
| Exchange Traded Funds | 3.7 | % | ||||
| Telecommunication Services | 3.5 | % | ||||
| Energy | 2.0 | % | ||||
| Cash and Other Assets (Net) | 5.0 | % |
| | 3Q 2009 | | Six Months | | One Year | | Five Year | | Ten Year | | Since Inception | | Inception Date | |||||||||||||||||
|---|---|---|---|---|---|---|---|---|---|---|---|---|---|---|---|---|---|---|---|---|---|---|---|---|---|---|---|---|---|---|
| Ordinary Shares | 25.37 | % | 92.74 | % | 26.30 | % | — | — | (4.29 | )% | 05/01/08 | |||||||||||||||||||
Institutional Shares1 | 25.34 | % | 92.95 | % | 26.54 | % | — | — | (4.16 | )% | 05/01/08 | |||||||||||||||||||
S&P/EPAC Small Cap Index2 | 21.68 | % | 61.06 | % | 10.46 | % | — | — | (14.42 | )% | ||||||||||||||||||||
13
| Shares | Value | |||||||||
|---|---|---|---|---|---|---|---|---|---|---|
BANKS—1.1% | ||||||||||
| CoBiz Financial, Inc. | 84,898 | $ | 422,792 | |||||||
| Pinnacle Financial Partners, Inc. (a)(b) | 42,490 | 540,048 | ||||||||
| 962,840 | ||||||||||
BIOTECHNOLOGY—1.0% | ||||||||||
| United Therapeutics Corporation (a) | 17,742 | 869,181 | ||||||||
CHEMICALS—1.1% | ||||||||||
| LSB Industries, Inc. (a)(b) | 63,084 | 982,218 | ||||||||
COMMERCIAL SERVICES & SUPPLIES—5.4% | ||||||||||
| Clean Harbors, Inc. (a) | 6,458 | 363,327 | ||||||||
| Coinstar, Inc. (a) | 23,220 | 765,796 | ||||||||
| FTI Consulting, Inc. (a) | 32,504 | 1,384,995 | ||||||||
| Kforce, Inc. (a) | 65,799 | 790,904 | ||||||||
| Waste Connections, Inc. (a) | 56,303 | 1,624,905 | ||||||||
| 4,929,927 | ||||||||||
COMMUNICATIONS EQUIPMENT—4.8% | ||||||||||
| Atheros Communications, Inc. (a) | 32,475 | 861,562 | ||||||||
| Comtech Telecommunications Corp. (a) | 25,103 | 833,921 | ||||||||
| NICE-Systems, Ltd. (a)(c) | 88,697 | 2,699,937 | ||||||||
| 4,395,420 | ||||||||||
COMPUTERS & PERIPHERALS—0.9% | ||||||||||
| Synaptics Incorporated (a)(b) | 31,907 | 804,056 | ||||||||
CONSTRUCTION & ENGINEERING—0.2% | ||||||||||
| Mastec, Inc. (a) | 11,920 | 144,828 | ||||||||
CONTAINERS & PACKAGING—2.7% | ||||||||||
| Silgan Holdings, Inc. | 31,059 | 1,637,741 | ||||||||
| Sonoco Products Company | 30,160 | 830,606 | ||||||||
| 2,468,347 | ||||||||||
DIVERSIFIED FINANCIALS—2.3% | ||||||||||
| Fifth Street Finance Corp. | 67,919 | 742,355 | ||||||||
| optionsXpress Holdings, Inc. (a) | 45,419 | 784,840 | ||||||||
| Tower Bancorp, Inc. (a) | 23,152 | 608,203 | ||||||||
| 2,135,398 | ||||||||||
DIVERSIFIED TELECOMMUNICATION SERVICES—0.5% | ||||||||||
| Hughes Communications, Inc. (a) | 15,661 | 475,155 | ||||||||
ELECTRIC UTILITIES—1.1% | ||||||||||
| Ormat Technologies, Inc. | 25,331 | 1,034,011 | ||||||||
14
| Shares | Value | |||||||||
|---|---|---|---|---|---|---|---|---|---|---|
ELECTRICAL EQUIPMENT—0.7% | ||||||||||
| American Superconductor Corporation (a) | 18,078 | $ | 606,336 | |||||||
ENERGY EQUIPMENT & SERVICES—4.5% | ||||||||||
| Core Laboratories N.V. (b) | 39,970 | 4,120,507 | ||||||||
FOOD DRUG & RETAILING—2.3% | ||||||||||
| United Natural Foods, Inc. (a) | 86,520 | 2,069,558 | ||||||||
FOOD PRODUCTS—5.8% | ||||||||||
| Central Garden & Pet Company (a) | 35,144 | 412,942 | ||||||||
| Dean Foods Company (a) | 158,458 | 2,818,968 | ||||||||
| Diamond Foods, Inc. | 59,657 | 1,892,320 | ||||||||
| Smart Balance, Inc. (a) | 19,220 | 118,011 | ||||||||
| 5,242,241 | ||||||||||
HEALTH CARE EQUIPMENT & SUPPLIES—2.4% | ||||||||||
| Haemonetics Corporation (a) | 12,508 | 701,949 | ||||||||
| SXC Health Solutions, Corp. (a) | 1,896 | 88,714 | ||||||||
| ZOLL Medical Corporation (a) | 62,635 | 1,347,905 | ||||||||
| 2,138,568 | ||||||||||
HEALTH CARE PROVIDERS & SERVICES—4.3% | ||||||||||
| Henry Schein, Inc. (a) | 29,870 | 1,640,162 | ||||||||
| Psychiatric Solutions, Inc. (a)(b) | 37,517 | 1,003,955 | ||||||||
| Universal Health Services, Inc. | 20,881 | 1,293,160 | ||||||||
| 3,937,277 | ||||||||||
HOTELS, RESTAURANTS & LEISURE—0.7% | ||||||||||
| California Pizza Kitchen, Inc. (a) | 41,839 | 653,525 | ||||||||
INSURANCE—0.8% | ||||||||||
| Aspen Insurance Holdings Limited | 28,620 | 757,571 | ||||||||
INTERNET SOFTWARE & SERVICES—4.8% | ||||||||||
| 3PAR, Inc. (a)(b) | 45,075 | 497,178 | ||||||||
| Athenahealth, Inc. (a)(b) | 23,219 | 890,913 | ||||||||
| Blue Coat Systems, Inc. (a) | 34,497 | 779,287 | ||||||||
| Constant Contact, Inc. (a)(b) | 45,836 | 882,343 | ||||||||
| Internet Capital Group, Inc. (a) | 152,145 | 1,271,932 | ||||||||
| 4,321,653 | ||||||||||
IT CONSULTING & SERVICES—3.2% | ||||||||||
| Alliance Data Systems Corporation (a)(b) | 47,973 | 2,930,191 | ||||||||
MACHINERY—4.0% | ||||||||||
| ESCO Technologies, Inc. (a)(b) | 29,182 | 1,149,771 | ||||||||
| Gardner Denver, Inc. (a) | 30,186 | 1,052,887 | ||||||||
15
| Shares | Value | |||||||||
|---|---|---|---|---|---|---|---|---|---|---|
MACHINERY (continued) | ||||||||||
| Harsco Corporation | 39,217 | $ | 1,388,674 | |||||||
| 3,591,332 | ||||||||||
MEDIA—8.2% | ||||||||||
| Acacia Research Corporation (a)(b) | 119,369 | 1,039,704 | ||||||||
| Discovery Communications, Inc. (a) | 9,358 | 270,353 | ||||||||
| inVentiv Health, Inc. (a) | 58,988 | 986,869 | ||||||||
| Regal Entertainment Group | 314,012 | 3,868,628 | ||||||||
| TiVo, Inc. (a) | 121,492 | 1,258,657 | ||||||||
| 7,424,211 | ||||||||||
METALS & MINING—4.4% | ||||||||||
| Compass Minerals International, Inc. (b) | 64,635 | 3,982,809 | ||||||||
OIL & GAS—1.9% | ||||||||||
| Aegean Marine Petroleum Network, Inc. (a) | 19,529 | 439,402 | ||||||||
| Natural Gas Services Group, Inc. (a)(b) | 41,147 | 725,010 | ||||||||
| SandRidge Energy, Inc. (a) | 44,611 | 578,159 | ||||||||
| 1,742,571 | ||||||||||
PERSONAL PRODUCTS—1.2% | ||||||||||
| NBTY, Inc. (a)(b) | 28,133 | 1,113,504 | ||||||||
REAL ESTATE—11.2% | ||||||||||
| AMB Property Corporation | 27,608 | 633,603 | ||||||||
| Entertainment Properties Trust (b) | 129,119 | 4,408,123 | ||||||||
| Hersha Hospitality Trust | 451,779 | 1,400,515 | ||||||||
| Ventas, Inc. (b) | 97,208 | 3,742,508 | ||||||||
| 10,184,749 | ||||||||||
SEMICONDUCTOR EQUIPMENT & PRODUCTS—0.4% | ||||||||||
| Entegris, Inc. (a) | 77,888 | 385,546 | ||||||||
SOFTWARE—4.7% | ||||||||||
| Blackboard, Inc. (a) | 59,357 | 2,242,507 | ||||||||
| STEC, Inc. (a)(b) | 30,077 | 883,963 | ||||||||
| Ulticom, Inc. (b) | 154,514 | 448,091 | ||||||||
| Verint Systems, Inc. (a)(b) | 48,297 | 700,307 | ||||||||
| 4,274,868 | ||||||||||
SPECIAL RETAIL—2.4% | ||||||||||
| Urban Outfitters, Inc. (a) | 27,483 | 829,162 | ||||||||
| Zumiez, Inc. (a)(b) | 81,540 | 1,338,072 | ||||||||
| 2,167,234 | ||||||||||
16
| Shares | Value | |||||||||
|---|---|---|---|---|---|---|---|---|---|---|
TEXTILES & APPAREL—4.7% | ||||||||||
| GUESS?, Inc. (b) | 92,673 | $ | 3,432,608 | |||||||
| Phillips-Van Heusen Corporation (b) | 19,506 | 834,662 | ||||||||
| 4,267,270 | ||||||||||
WIRELESS TELECOMMUNICATION SERVICES—5.2% | ||||||||||
| Crown Castle International Corporation (a)(b) | 31,250 | 980,000 | ||||||||
| Iridium Communications, Inc. | 13,668 | 154,038 | ||||||||
| SBA Communications Corporation (a)(b) | 133,438 | 3,606,829 | ||||||||
| 4,740,867 | ||||||||||
TOTAL COMMON STOCK | ||||||||||
| (Cost $85,035,767) | 89,853,769 | |||||||||
SHORT TERM INVESTMENTS—1.1% | ||||||||||
| Par Value | Value | |||||||||
| State Street Bank & Trust Co., Repurchase Agreement .01%, 10/01/09, (Dated 09/30/09), Collateralized by $1,000,000 par U.S. Treasury Bill—zero coupon due 03/25/10, Market Value $999,100, Repurchase Proceeds $977,000 (Cost $977,000) | $ | 977,000 | $ | 977,000 | ||||||
TOTAL INVESTMENTS (EXCLUDING INVESTMENTS PURCHASED WITH CASH COLLATERAL FROM SECURITIES LOANED)—100.0% (Cost $86,012,767) | 90,830,769 | |||||||||
INVESTMENTS PURCHASED WITH CASH COLLATERAL FROM SECURITIES LOANED—30.3% | ||||||||||
Money Market—30.3% | ||||||||||
| JP Morgan Prime Money Market Fund—Inst. (Cost $27,564,722) | 27,564,722 | 27,564,722 | ||||||||
TOTAL INVESTMENTS—130.3% (d) (Cost $113,577,489) | 118,395,491 | |||||||||
OTHER ASSETS & LIABILITIES (NET)—(30.3%) | (27,509,055 | ) | ||||||||
NET ASSETS—100% | $ | 90,886,436 | ||||||||
| (a) | Non-income producing security | |||||||||
| (b) | All or a portion of this security was out on loan. | |||||||||
| (c) | ADR—American Depositary Receipts | |||||||||
17
Long Positions—129.6%
| Shares | Value | |||||||||
|---|---|---|---|---|---|---|---|---|---|---|
AEROSPACE & DEFENSE—4.7% | ||||||||||
| General Dynamics Corporation (b) | 12,778 | $ | 825,459 | |||||||
| Lockheed Martin Corporation (b) | 14,638 | 1,142,935 | ||||||||
| Raytheon Company (b) | 10,936 | 524,600 | ||||||||
| 2,492,994 | ||||||||||
AIRLINES—1.7% | ||||||||||
| Southwest Airlines Co. (b) | 90,993 | 873,533 | ||||||||
AUTOMOBILES—1.7% | ||||||||||
| Ford Motor Company (a)(b) | 114,596 | 826,237 | ||||||||
| Gentex Corporation (b) | 1,252 | 17,716 | ||||||||
| Johnson Controls, Inc. (b) | 1,580 | 40,385 | ||||||||
| 884,338 | ||||||||||
BANKS—8.5% | ||||||||||
| Bank of America Corporation (b) | 12,815 | 216,830 | ||||||||
| Bank of Hawaii Corporation (b) | 15,433 | 641,087 | ||||||||
| BOK Financial Corporation (b) | 1,879 | 87,035 | ||||||||
| Cullen/Frost Bankers, Inc. (b) | 4,153 | 214,461 | ||||||||
| Hudson City Bancorp, Inc. (b) | 11,977 | 157,497 | ||||||||
| Northern Trust Corporation (b) | 16,062 | 934,166 | ||||||||
| The Bank of New York Mellon Corporation (b) | 42,165 | 1,222,363 | ||||||||
| U.S. Bancorp (b) | 45,452 | 993,581 | ||||||||
| 4,467,020 | ||||||||||
BEVERAGES—0.1% | ||||||||||
| Brown-Forman Corporation (b) | 246 | 11,862 | ||||||||
| The Pepsi Bottling Group, Inc. | 814 | 29,662 | ||||||||
| 41,524 | ||||||||||
BIOTECHNOLOGY—1.0% | ||||||||||
| Gilead Sciences, Inc. (a)(b) | 11,865 | 552,672 | ||||||||
CHEMICALS—1.7% | ||||||||||
| Cabot Corporation (b) | 5,810 | 134,269 | ||||||||
| CF Industries Holdings, Inc. | 289 | 24,920 | ||||||||
| Eastman Chemical Company (b) | 3,283 | 175,772 | ||||||||
| Terra Industries, Inc. (b) | 5,415 | 187,738 | ||||||||
| The Dow Chemical Company (b) | 13,482 | 351,476 | ||||||||
| 874,175 | ||||||||||
COMMUNICATIONS EQUIPMENT—5.4% | ||||||||||
| Corning Incorporated (b) | 119,776 | 1,833,771 | ||||||||
| Motorola, Inc. (b) | 84,380 | 724,824 | ||||||||
18
| Shares | Value | |||||||||
|---|---|---|---|---|---|---|---|---|---|---|
COMMUNICATIONS EQUIPMENT (continued) | ||||||||||
| QUALCOMM Incorporated (b) | 6,683 | $ | 300,601 | |||||||
| 2,859,196 | ||||||||||
COMPUTERS & PERIPHERALS—1.9% | ||||||||||
| Dell, Inc. (a)(b) | 23,601 | 360,151 | ||||||||
| Hewlett-Packard Company (b) | 9 | 425 | ||||||||
| International Business Machines (b) | 4,990 | 596,854 | ||||||||
| NCR Corporation (a)(b) | 3,559 | 49,185 | ||||||||
| 1,006,615 | ||||||||||
CONSTRUCTION ENGINEERING—2.3% | ||||||||||
| Fluor Corporation | 24,044 | 1,222,637 | ||||||||
DISTRIBUTORS—0.1% | ||||||||||
| Genuine Parts Company | 1,512 | 57,547 | ||||||||
DIVERSIFIED FINANCIAL SERVICES—12.6% | ||||||||||
| American Express Company (b) | 34,797 | 1,179,618 | ||||||||
| BlackRock, Inc. (b) | 2,590 | 561,564 | ||||||||
| Discover Financial Services (b) | 57,670 | 935,984 | ||||||||
| Franklin Resources, Inc. (b) | 8,556 | 860,734 | ||||||||
| T. Rowe Price Group, Inc. (b) | 30,530 | 1,395,221 | ||||||||
| The Charles Schwab Corporation (b) | 50,912 | 974,965 | ||||||||
| Visa, Inc. (b) | 10,047 | 694,348 | ||||||||
| 6,602,434 | ||||||||||
DIVERSIFIED TELECOMMUNICATION SERVICES—3.2% | ||||||||||
| AT&T Corporation (b) | 26,179 | 707,095 | ||||||||
| Sprint Nextel Corporation (b) | 245,131 | 968,267 | ||||||||
| 1,675,362 | ||||||||||
ELECTRIC UTILITIES—3.5% | ||||||||||
| NRG Energy, Inc. (b) | 51,275 | 1,445,442 | ||||||||
| PPL Corporation (b) | 12,334 | 374,214 | ||||||||
| 1,819,656 | ||||||||||
ELECTRONIC EQUIPMENT & INSTRUMENTS—2.2% | ||||||||||
| Broadcom Corporation (a)(b) | 5,462 | 167,629 | ||||||||
| Ingram Micro, Inc. (a)(b) | 9,142 | 154,043 | ||||||||
| Molex Incorporated (b) | 1,172 | 24,471 | ||||||||
| Tech Data Corporation (a)(b) | 19,049 | 792,629 | ||||||||
| 1,138,772 | ||||||||||
19
| Shares | Value | |||||||||
|---|---|---|---|---|---|---|---|---|---|---|
ENERGY EQUIPMENT & SERVICES—0.1% | ||||||||||
| BJ Services Company (b) | 1,691 | $ | 32,856 | |||||||
FOOD PRODUCTS—4.5% | ||||||||||
| Sara Lee Corporation (b) | 76,007 | 846,718 | ||||||||
| Tyson Foods, Inc. (b) | 120,107 | 1,516,951 | ||||||||
| 2,363,669 | ||||||||||
FOOD STAPLES & DRUG RETAILING—4.3% | ||||||||||
| BJ’s Wholesale Club, Inc. (a) | 1 | 36 | ||||||||
| Costco Wholesale Corporation (b) | 7,666 | 432,822 | ||||||||
| SYSCO Corporation (b) | 54,628 | 1,357,506 | ||||||||
| Walgreen Co. (b) | 13,187 | 494,117 | ||||||||
| 2,284,481 | ||||||||||
HEALTH CARE EQUIPMENT & SERVICES—5.0% | ||||||||||
| CareFusion Corporation (a) | 1,099 | 23,947 | ||||||||
| Humana Inc. (a)(b) | 3,822 | 142,561 | ||||||||
| McKesson Corporation (b) | 16,468 | 980,669 | ||||||||
| Medtronic, Inc. | 416 | 15,309 | ||||||||
| Stryker Corporation (b) | 21,289 | 967,159 | ||||||||
| Zimmer Holdings, Inc. (a)(b) | 8,880 | 474,636 | ||||||||
| 2,604,281 | ||||||||||
HEALTH CARE PROVIDERS & SERVICES—2.3% | ||||||||||
| Cardinal Health, Inc. (b) | 20,290 | 543,772 | ||||||||
| Coventry Health Care, Inc. (a) | 1,699 | 33,912 | ||||||||
| Hill-Rom Holdings, Inc. (b) | 6,418 | 139,784 | ||||||||
| Tenet Healthcare Corporation (a)(b) | 87,765 | 516,058 | ||||||||
| 1,233,526 | ||||||||||
HOTELS, RESTAURANTS & LEISURE—0.3% | ||||||||||
| Starbucks Corporation (a)(b) | 6,556 | 135,381 | ||||||||
HOUSEHOLD PRODUCTS—0.0% | ||||||||||
| Procter & Gamble Company (b) | 415 | 24,037 | ||||||||
INDUSTRIAL CONGLOMERATES—2.2% | ||||||||||
| KBR, Inc. (b) | 48,522 | 1,130,077 | ||||||||
INSURANCE—1.2% | ||||||||||
| AFLAC Inc. (b) | 1,413 | 60,392 | ||||||||
| Torchmark Corporation (b) | 6,694 | 290,720 | ||||||||
| Unum Group (b) | 14,289 | 306,356 | ||||||||
| 657,468 | ||||||||||
20
| Shares | Value | |||||||||
|---|---|---|---|---|---|---|---|---|---|---|
IT CONSULTING & SERVICES—0.1% | ||||||||||
| Sun Microsystems, Inc. (a)(b) | 4,453 | $ | 40,478 | |||||||
MACHINERY—2.6% | ||||||||||
| AGCO Corporation (a)(b) | 37,059 | 1,023,940 | ||||||||
| Harsco Corporation (b) | 8,155 | 288,769 | ||||||||
| Illinois Tool Works Inc. (b) | 410 | 17,511 | ||||||||
| Joy Global, Inc. (b) | 677 | 33,132 | ||||||||
| 1,363,352 | ||||||||||
MEDIA—5.4% | ||||||||||
| Comcast Corporation (b) | 141,791 | 2,394,850 | ||||||||
| DISH Network Corporation (a) | 20,730 | 399,260 | ||||||||
| The DIRECTV Group, Inc. (a)(b) | 2,522 | 69,557 | ||||||||
| 2,863,667 | ||||||||||
METALS & MINING—0.0% | ||||||||||
| Schnitzer Steel Industries, Inc. (b) | 283 | 15,070 | ||||||||
OIL & GAS—17.9% | ||||||||||
| Chevron Corporation | 42,191 | 2,971,512 | ||||||||
| Exxon Mobil Corporation (b) | 28,433 | 1,950,788 | ||||||||
| Hess Corporation | 13,421 | 717,487 | ||||||||
| Marathon Oil Corporation | 1 | 32 | ||||||||
| Murphy Oil Corporation (b) | 26,448 | 1,522,611 | ||||||||
| Occidental Petroleum Corporation (b) | 28,559 | 2,239,026 | ||||||||
| 9,401,456 | ||||||||||
PAPER & FOREST PRODUCTS—0.4% | ||||||||||
| International Paper Company (b) | 7,967 | 177,107 | ||||||||
| MeadWestvaco Corporation (b) | 193 | 4,306 | ||||||||
| Sonoco Products Company (b) | 1,747 | 48,112 | ||||||||
| 229,525 | ||||||||||
PERSONAL PRODUCTS—0.4% | ||||||||||
| The Estee Lauder Companies, Inc. (b) | 5,341 | 198,044 | ||||||||
PHARMACEUTICALS & BIOTECHNOLOGY—13.2% | ||||||||||
| Abbott Laboratories | 2,535 | 125,406 | ||||||||
| AmerisourceBergen Corporation (b) | 80,621 | 1,804,298 | ||||||||
| Amgen Inc. (a)(b) | 32,061 | 1,931,034 | ||||||||
| Biogen Idec, Inc. (a)(b) | 15,484 | 782,252 | ||||||||
| Forest Laboratories, Inc. (a)(b) | 3,736 | 109,988 | ||||||||
| Johnson & Johnson (b) | 8,801 | 535,893 | ||||||||
| Merck & Co., Inc. (b) | 11,839 | 374,468 | ||||||||
| Pfizer Inc. (b) | 37,886 | 627,013 | ||||||||
21
| Shares | Value | |||||||||
|---|---|---|---|---|---|---|---|---|---|---|
PHARMACEUTICALS & BIOTECHNOLOGY (continued) | ||||||||||
| Schering-Plough Corporation | 9,143 | $ | 258,290 | |||||||
| Wyeth | 7,487 | 363,718 | ||||||||
| 6,912,360 | ||||||||||
REAL ESTATE—0.0% | ||||||||||
| Public Storage (b) | 47 | 3,536 | ||||||||
RETAILING—2.3% | ||||||||||
| Big Lots, Inc. (a)(b) | 17,037 | 426,266 | ||||||||
| RadioShack Corporation (b) | 7,159 | 118,625 | ||||||||
| The Gap, Inc. (b) | 3,866 | 82,732 | ||||||||
| Thor Industries, Inc. (b) | 7,547 | 233,580 | ||||||||
| Williams-Sonoma, Inc. (b) | 16,962 | 343,141 | ||||||||
| 1,204,344 | ||||||||||
SEMICONDUCTOR EQUIPMENT—7.3% | ||||||||||
| Intel Corporation (b) | 116,230 | 2,274,621 | ||||||||
| Texas Instruments Inc. (b) | 67,007 | 1,587,396 | ||||||||
| 3,862,017 | ||||||||||
SOFTWARE & SERVICES—5.3% | ||||||||||
| Computer Sciences Corporation (a)(b) | 584 | 30,783 | ||||||||
| eBay, Inc. (a)(b) | 44,789 | 1,057,468 | ||||||||
| Electronic Arts, Inc. (a)(b) | 42,926 | 817,740 | ||||||||
| Microsoft Corporation (b) | 33,387 | 864,390 | ||||||||
| 2,770,381 | ||||||||||
TEXTILES & APPAREL—0.5% | ||||||||||
| Guess?, Inc. (b) | 6,847 | 253,613 | ||||||||
TOBACCO—1.4% | ||||||||||
| Philip Morris International Inc. (a)(b) | 14,795 | 721,108 | ||||||||
UTILITIES—0.8% | ||||||||||
| Energen Corporation (b) | 9,766 | 420,915 | ||||||||
WIRELESS TELECOMMUNICATIONS—1.5% | ||||||||||
| NII Holdings, Inc. (a)(b) | 25,208 | 755,736 | ||||||||
| United States Cellular Corporation (a)(b) | 1,038 | 40,555 | ||||||||
| 796,291 | ||||||||||
TOTAL LONG POSITIONS—129.6% | ||||||||||
| (Cost $59,347,771) | 68,090,408 | |||||||||
22
| Shares | Value | |||||||||
|---|---|---|---|---|---|---|---|---|---|---|
BANKS—(0.9%) | ||||||||||
| Comerica Inc. | (3,903 | ) | $ | (115,802 | ) | |||||
| Huntington Bancshares Incorporated | (39,488 | ) | (185,988 | ) | ||||||
| Synovus Financial Corp. | (20,021 | ) | (75,079 | ) | ||||||
| Zions Bancorporation | �� | (6,608 | ) | (118,746 | ) | |||||
| (495,615 | ) | |||||||||
BIOTECHNOLOGY—(2.5%) | ||||||||||
| BioMarin Pharmaceutical, Inc. (a) | (1 | ) | (18 | ) | ||||||
| Dendreon Corporation (a) | (12,467 | ) | (348,951 | ) | ||||||
| Vertex Pharmaceuticals Incorporated (a) | (25,004 | ) | (947,652 | ) | ||||||
| (1,296,621 | ) | |||||||||
BUILDING PRODUCTS—(0.4%) | ||||||||||
| Owens Corning (a) | (8,744 | ) | (196,303 | ) | ||||||
COMMERCIAL SERVICES AND SUPPLIES—(0.4%) | ||||||||||
| Weight Watchers International, Inc. | (8,460 | ) | (232,142 | ) | ||||||
COMMUNICATIONS EQUIPMENT—(1.4%) | ||||||||||
| Ciena Corporation (a) | (45,357 | ) | (738,412 | ) | ||||||
CONSTRUCTION & ENGINEERING—(0.1%) | ||||||||||
| Eagle Materials, Inc. | (1,331 | ) | (38,040 | ) | ||||||
DIVERSIFIED FINANCIAL SERVICES—(3.3%) | ||||||||||
| Affiliated Managers Group, Inc. (a) | (1,754 | ) | (114,027 | ) | ||||||
| AmeriCredit Corp. (a) | (6,838 | ) | (107,972 | ) | ||||||
| Capital One Financial Corporation | (1 | ) | (36 | ) | ||||||
| First Horizon National Corporation | (18,744 | ) | (247,989 | ) | ||||||
| Jefferies Group, Inc. | (7,176 | ) | (195,402 | ) | ||||||
| Lazard, Ltd | (12,825 | ) | (529,801 | ) | ||||||
| Legg Mason, Inc. | (1,292 | ) | (40,091 | ) | ||||||
| Marshall & Ilsley Corporation | (2,711 | ) | (21,878 | ) | ||||||
| SLM Corporation | (43,665 | ) | (380,759 | ) | ||||||
| The Nasdaq Stock Market, Inc. (a) | (1,167 | ) | (24,565 | ) | ||||||
| The Student Loan Corporation | (1,935 | ) | (89,784 | ) | ||||||
| (1,752,304 | ) | |||||||||
ELECTRONIC EQUIPMENT & INSTRUMENTS—(0.3%) | ||||||||||
| Itron, Inc. (a) | (2,353 | ) | (150,921 | ) | ||||||
FOOD & STAPLES RETAILING—(0.2%) | ||||||||||
| Ralcorp Holdings, Inc. (a) | (1,786 | ) | (104,428 | ) | ||||||
23
| Shares | Value | |||||||||
|---|---|---|---|---|---|---|---|---|---|---|
HEALTH CARE EQUIPMENT & SERVICES—(3.0%) | ||||||||||
| Hologic, Inc. (a) | (78,808 | ) | $ | (1,287,723 | ) | |||||
| Inverness Medical Innovations, Inc. (a) | (7,699 | ) | (298,182 | ) | ||||||
| (1,585,905 | ) | |||||||||
HEALTH CARE PROVIDERS & SERVICES—(0.5%) | ||||||||||
| DaVita, Inc. (a) | (4,158 | ) | (235,509 | ) | ||||||
HOUSEHOLD DURABLES—(0.6%) | ||||||||||
| Toll Brothers, Inc. (a) | (17,642 | ) | (344,725 | ) | ||||||
INSURANCE—(1.7%) | ||||||||||
| Genworth Financial, Inc. | (20,338 | ) | (243,039 | ) | ||||||
| Hartford Financial Services Group, Inc. | (16,170 | ) | (428,505 | ) | ||||||
| Markel Corporation (a) | (221 | ) | (72,890 | ) | ||||||
| Prudential Financial Inc. | (3,144 | ) | (156,917 | ) | ||||||
| (901,351 | ) | |||||||||
MACHINERY—(0.3%) | ||||||||||
| The Manitowoc Company, Inc. | (14,739 | ) | (139,578 | ) | ||||||
MEDIA—(1.7%) | ||||||||||
| Central European Media Enterprises, Ltd. (a) | (2,193 | ) | (75,110 | ) | ||||||
| Clear Channel Outdoor Holdings, Inc. (a) | (6,615 | ) | (46,305 | ) | ||||||
| Liberty Media Capital (a) | (36,810 | ) | (770,065 | ) | ||||||
| (891,480 | ) | |||||||||
OIL & GAS—(6.1%) | ||||||||||
| El Paso Corporation | (81,405 | ) | (840,100 | ) | ||||||
| EXCO Resources, Inc. (a) | (12,079 | ) | (225,757 | ) | ||||||
| Exterran Holdings, Inc. (a) | (5,060 | ) | (120,124 | ) | ||||||
| Forest Oil Corporation (a) | (3,029 | ) | (59,278 | ) | ||||||
| Plains Exploration & Production Company (a) | (29,439 | ) | (814,283 | ) | ||||||
| Quicksilver Resources, Inc. (a) | (35,660 | ) | (506,015 | ) | ||||||
| SandRidge Energy, Inc. (a) | (25,090 | ) | (325,166 | ) | ||||||
| Teekay Corporation | (13,690 | ) | (299,400 | ) | ||||||
| (3,190,123 | ) | |||||||||
PHARMACEUTICALS & BIOTECHNOLOGY—(1.5%) | ||||||||||
| King Pharmaceuticals, Inc. (a) | (63,893 | ) | (688,128 | ) | ||||||
| Perrigo Company | (2,571 | ) | (87,388 | ) | ||||||
| Valeant Pharmaceuticals International | (335 | ) | (9,400 | ) | ||||||
| (784,916 | ) | |||||||||
24
| Shares | Value | |||||||||
|---|---|---|---|---|---|---|---|---|---|---|
REAL ESTATE—(0.7%) | ||||||||||
| Apartment Investment and Management Company | (4,435 | ) | $ | (65,417 | ) | |||||
| CB Richard Ellis Group, Inc. (a) | (20,619 | ) | (242,067 | ) | ||||||
| The St. Joe Company | (1,952 | ) | (56,842 | ) | ||||||
| (364,326 | ) | |||||||||
SEMICONDUCTOR EQUIPMENT—(3.0%) | ||||||||||
| Cypress Semiconductor Corporation (a) | (84,394 | ) | (871,790 | ) | ||||||
| Rambus Inc. (a) | (39,947 | ) | (695,078 | ) | ||||||
| (1,566,868 | ) | |||||||||
SOFTWARE & SERVICES—(0.4%) | ||||||||||
| Nuance Communications, Inc. (a) | (15,313 | ) | (229,083 | ) | ||||||
WIRELESS TELECOMMUNICATIONS—(0.9%) | ||||||||||
| SBA Communications Corporation (a) | (17,173 | ) | (464,186 | ) | ||||||
TOTAL SHORT POSITIONS (29.9%) | ||||||||||
| (Proceeds $12,035,555) | (15,702,836 | ) | ||||||||
TOTAL INVESTMENTS (EXCLUDING INVESTMENTS PURCHASED WITH CASH COLLATERAL FROM SECURITIES LOANED)—99.7% | ||||||||||
| (Cost $47,312,216) | 52,387,572 | |||||||||
INVESTMENTS PURCHASED WITH CASH COLLATERAL FROM SECURITIES LOANED—15.1% | ||||||||||
| Par Value | Value | |||||||||
Registered Money Market—15.1% | ||||||||||
| State Street Navigator Securities Lending Prime Portfolio (Cost $8,243,546) | $ | 8,243,546 | $ | 8,243,546 | ||||||
TOTAL INVESTMENTS 114.8% | ||||||||||
| (Cost $55,555,762) | 60,631,118 | |||||||||
OTHER ASSETS & LIABILITIES (NET)—(14.8%) | (8,079,210 | ) | ||||||||
NET ASSETS—100% | $ | 52,551,908 | ||||||||
| (a) | Non-Income producing security | |||||||||
| (b) | All or a portion of this security was out on loan. | |||||||||
| Short Security positions are held with cash collateral from securities loaned. | ||||||||||
| The percentage of each investment category is calculated as a percentage of net assets. | ||||||||||
25
| Shares | Value | |||||||||
|---|---|---|---|---|---|---|---|---|---|---|
BRAZIL—12.0% | ||||||||||
| Banco Bradesco SA (c) | 72,054 | $ | 1,433,154 | |||||||
| Banco do Brasil SA | 169,441 | 2,981,963 | ||||||||
| Brasil Telecom Participacoes SA (a) | 48,274 | 889,011 | ||||||||
| Centrais Eletricas Brasileiras SA (a) | 94,743 | 1,473,561 | ||||||||
| Companhia de Bebidas das Americas (c) | 29,755 | 2,447,646 | ||||||||
| Companhia de Saneamento Basico do Estado de Sao Paulo | 80,314 | 1,543,325 | ||||||||
| Empresa Brasileira de Aeronautica SA (a) | 49,971 | 288,638 | ||||||||
| Gerdau SA (c) | 163,548 | 2,198,085 | ||||||||
| Light SA (a) | 42,233 | 587,842 | ||||||||
| M. Dias Branco SA (a) | 4,099 | 84,195 | ||||||||
| Petroleo Brasileiro SA | 236,314 | 5,439,930 | ||||||||
| Petroleo Brasileiro SA (c) | 151,567 | 5,958,099 | ||||||||
| Redecard SA (a) | 39,209 | 602,094 | ||||||||
| Souza Cruz SA | 44,738 | 1,568,370 | ||||||||
| Sul America SA | 23,585 | 504,913 | ||||||||
| Tele Norte Leste Participacoes SA (c) | 94,432 | 1,774,377 | ||||||||
| Vivo Participacoes SA (a)(c) | 15,831 | 399,733 | ||||||||
| 30,174,936 | ||||||||||
CHILE—0.9% | ||||||||||
| Banco Santander Chile (c) | 36,283 | 2,087,724 | ||||||||
| Enersis SA (c) | 14,071 | 259,610 | ||||||||
| 2,347,334 | ||||||||||
CHINA—18.5% | ||||||||||
| Bank of China Ltd. | 8,126,648 | 4,278,259 | ||||||||
| Central China Real Estate Ltd. (a) | 1,813,000 | 474,886 | ||||||||
| China Construction Bank Corporation | 6,374,221 | 5,099,344 | ||||||||
| China Foods Ltd. (a) | 392,000 | 271,616 | ||||||||
| China Mobile Limited | 269,417 | 2,624,626 | ||||||||
| China Molybdenum Co., Ltd. (a) | 1,519,330 | 1,215,456 | ||||||||
| China Petroleum & Chemical Corporation | 2,955,026 | 2,516,522 | ||||||||
| China Pharmaceutical Group Limited | 2,281,768 | 1,274,838 | ||||||||
| China Telecom Corporation Limited | 3,112,462 | 1,473,892 | ||||||||
| CNOOC Limited | 2,993,829 | 4,032,951 | ||||||||
| CNPC Hong Kong Limited | 1,612,100 | 1,279,271 | ||||||||
| Digital China Holdings Limited | 293,000 | 277,120 | ||||||||
| Dongfeng Motor Group Company Limited | 1,960,140 | 2,073,941 | ||||||||
| Geely Automobile Holdings Limited (a)(b) | 5,960,000 | 1,622,648 | ||||||||
| Golden Eagle Retail Group Ltd. (a)(b) | 301,078 | 504,254 | ||||||||
| Great Eagle Holdings Limited (a) | 82,000 | 203,994 | ||||||||
| GZI Real Estate Investment Trust | 661,000 | 243,076 | ||||||||
| Hang Seng Bank Limited (a) | 50,100 | 721,435 | ||||||||
26
| Shares | Value | |||||||||
|---|---|---|---|---|---|---|---|---|---|---|
CHINA (continued) | ||||||||||
| Hopewell Holdings Limited (a) | 350,500 | $ | 1,101,241 | |||||||
| Huabao International Holdings Limited (a) | 811,587 | 870,225 | ||||||||
| Industrial & Commercial Bank of China Ltd. | 753,896 | 567,121 | ||||||||
| Lite-On Technology Corp. | 638,405 | 837,028 | ||||||||
| NetEase.com, Inc. (a)(c) | 320 | 14,618 | ||||||||
| Renhe Commercial Holdings | 6,828,000 | 1,374,402 | ||||||||
| Shanghai Industrial Holdings Limited | 95,000 | 429,642 | ||||||||
| Shenzhen International Holdings Limited | 12,070,952 | 825,492 | ||||||||
| Shenzhou International Group | 429,000 | 430,658 | ||||||||
| Sino Biopharmaceutical Limited | �� | 1,244,000 | 287,322 | |||||||
| Sinolink Worldwide Holdings Limited | 3,532,000 | 888,691 | ||||||||
| Sinotrans Shipping Limited | 2,433,500 | 982,814 | ||||||||
| Skyworth Digital Holdings Limited | 2,932,000 | 1,358,169 | ||||||||
| Tencent Holdings Limited | 175,407 | 2,835,917 | ||||||||
| TPV Technology Limited (a) | 496,000 | 307,198 | ||||||||
| Yanzhou Coal Mining Company Limited | 1,413,335 | 2,024,247 | ||||||||
| Zhejiang Expressway Co., Ltd., (a) | 1,389,358 | 1,220,834 | ||||||||
| 46,543,748 | ||||||||||
CZECH REPUBLIC—0.7% | ||||||||||
| Komercni Banka AS | 9,286 | 1,849,372 | ||||||||
EGYPT—0.1% | ||||||||||
| Commercial International Bank | 34,965 | 368,397 | ||||||||
HUNGARY—0.8% | ||||||||||
| Egis Gyogyszergyar Nyrt. | 3,503 | 372,515 | ||||||||
| Magyar Telekom Telecommunications PLC | 355,278 | 1,551,715 | ||||||||
| 1,924,230 | ||||||||||
INDONESIA—2.7% | ||||||||||
| PT Aneka Tambang Tbk (a) | 5,423,500 | 1,374,814 | ||||||||
| PT Astra International Tbk (a) | 373,747 | 1,289,650 | ||||||||
| PT Bank Mandiri (a) | 3,579,000 | 1,740,435 | ||||||||
| PT Bank Rakyat Indonesia (a) | 2,074,500 | 1,609,803 | ||||||||
| PT Semen Gresik Tbk | 1,074,500 | 700,398 | ||||||||
| 6,715,100 | ||||||||||
ISRAEL—1.1% | ||||||||||
| Partner Communications Company Ltd. | 70,430 | 1,329,608 | ||||||||
| Teva Pharmaceutical Industries Ltd. | 30,862 | 1,547,396 | ||||||||
| 2,877,004 | ||||||||||
27
| Shares | Value | |||||||||
|---|---|---|---|---|---|---|---|---|---|---|
MALAYSIA—2.4% | ||||||||||
| British American Tobacco Malaysia Berhad | 24,993 | $ | 318,027 | |||||||
| Hong Leong Bank Berhad (a) | 114,400 | 217,165 | ||||||||
| Hong Leong Financial Group Berhad (a) | 12,000 | 18,654 | ||||||||
| KLCC Property Holdings Berhad (a) | 137,400 | 131,802 | ||||||||
| Lafarge Malayan Cement Berhad | 192,400 | 348,555 | ||||||||
| Public Bank Berhad | 436,294 | 1,285,813 | ||||||||
| RHB Capital Berhad | 229,900 | 336,779 | ||||||||
| Telekom Malaysia Berhad | 1,446,900 | 1,283,439 | ||||||||
| Tenaga Nasional Berhad | 871,746 | 2,062,872 | ||||||||
| 6,003,106 | ||||||||||
MEXICO—2.9% | ||||||||||
| America Movil SAB de C.V., Series L | 428,081 | 938,307 | ||||||||
| Banco Compartamos SA de C.V. (a)(b) | 171,459 | 627,002 | ||||||||
| Cemex SAB de C.V. (a)(c) | 31,338 | 404,887 | ||||||||
| Coca-Cola Femsa SAB de C.V., Series L (a) | 20,258 | 97,312 | ||||||||
| Embotelladoras Arca SAB de C.V. (a) | 37,774 | 93,500 | ||||||||
| Gruma SAB de C.V. (a) | 252,098 | 442,244 | ||||||||
| Grupo Bimbo SAB de C.V., Series A (a) | 144,990 | 808,434 | ||||||||
| Grupo Carso SAB de C.V., Series A | 327,665 | 1,059,932 | ||||||||
| Grupo Mexico SAB de C.V., Series B (a) | 269,953 | 498,196 | ||||||||
| Grupo Simec SA de C.V., Series B (a) | 66,767 | 177,299 | ||||||||
| Grupo Televisa SA (c) | 105,757 | 1,966,023 | ||||||||
| Industrias CH SAB de C.V. Series B (a) | 52,499 | 184,232 | ||||||||
| 7,297,368 | ||||||||||
PHILIPPINES—0.8% | ||||||||||
| Metropolitan Bank & Trust Company | 124,100 | 100,841 | ||||||||
| Petron Corporation (a) | 2,814,161 | 302,917 | ||||||||
| Philippines Long Distance Telelephone Company (c) | 19,447 | 999,576 | ||||||||
| SM Investments Corporation (a) | 73,390 | 503,414 | ||||||||
| 1,906,748 | ||||||||||
POLAND—0.8% | ||||||||||
| Asseco Poland SA | 17,863 | 383,523 | ||||||||
| KGHM Polska Miedz SA | 54,226 | 1,627,684 | ||||||||
| 2,011,207 | ||||||||||
RUSSIA—7.0% | ||||||||||
| Evraz Group SA (a)(d) | 55,197 | 1,437,882 | ||||||||
| Gazprom (c) | 288,663 | 6,711,415 | ||||||||
| LUKOIL (c) | 81,169 | 4,399,360 | ||||||||
| Mobile TeleSystems (a)(c) | 23,478 | 1,133,283 | ||||||||
28
| Shares | Value | |||||||||
|---|---|---|---|---|---|---|---|---|---|---|
RUSSIA (continued) | ||||||||||
| Novolipetsk Steel (a)(d) | 20,359 | $ | 518,136 | |||||||
| Severstal (a)(d) | 286,061 | 2,205,530 | ||||||||
| Surgutneftegaz (a)(c) | 142,086 | 1,216,256 | ||||||||
| 17,621,862 | ||||||||||
SINGAPORE—0.5% | ||||||||||
| Yangzijiang Shipbuilding Holdings Limited (a) | 1,995,000 | 1,366,438 | ||||||||
SOUTH AFRICA—5.7% | ||||||||||
| Absa Group Limited | 152,950 | 2,433,088 | ||||||||
| ArcelorMittal South Africa Limited | 141,591 | 2,252,392 | ||||||||
| Barloworld Limited (a) | 185,648 | 1,205,906 | ||||||||
| Group Five Limited | 27,845 | 162,231 | ||||||||
| Investec Limited | 186,817 | 1,414,841 | ||||||||
| Kumba Iron Ore Limited | 44,944 | 1,477,578 | ||||||||
| Metropolitan Holdings Limited | 738,880 | 1,252,771 | ||||||||
| Remgro Limited | 45,732 | 537,132 | ||||||||
| Sanlam Limited (a) | 626,653 | 1,703,805 | ||||||||
| Santam Limited | 28,915 | 339,229 | ||||||||
| Vodacom Group (Proprietary) Limited (a) | 127,137 | 946,344 | ||||||||
| Woolworths Holdings Limited | 355,762 | 761,657 | ||||||||
| 14,486,974 | ||||||||||
SOUTH KOREA—13.7% | ||||||||||
| Busan Bank | 143,180 | 1,591,902 | ||||||||
| Cheil Worldwide Inc. (a) | 3,417 | 842,468 | ||||||||
| Daegu Bank (a) | 105,590 | 1,514,510 | ||||||||
| Daewoo Shipbuilding & Marine Engineering Co., Ltd. (a) | 9,290 | 135,615 | ||||||||
| Daishin Securities Company (a) | 89,830 | 1,235,091 | ||||||||
| Dongbu Insurance Co., Ltd. | 7,160 | 219,677 | ||||||||
| Hanwha Chemical Corporation (a) | 129,280 | 1,404,442 | ||||||||
| Hyosung Corporation (a) | 10,561 | 606,815 | ||||||||
| Hyundai Department Store Co., Ltd. (a) | 24,697 | 2,305,682 | ||||||||
| Hyundai Heavy Industries Co., Ltd. (a) | 7,650 | 1,168,682 | ||||||||
| Kangwon Land, Inc. (a) | 76,720 | 1,132,975 | ||||||||
| Korea Zinc Co., Ltd. (a) | 16,173 | 2,408,964 | ||||||||
| KP Chemical Corp. (a) | 123,744 | 793,978 | ||||||||
| LG Chem Ltd. (a) | 17,951 | 3,336,532 | ||||||||
| LG Corp. | 40,727 | 2,730,688 | ||||||||
| LG Display Co., Ltd. (a) | 62,110 | 1,786,997 | ||||||||
| LG Electronics, Inc. | 20,002 | 2,130,491 | ||||||||
| LS Industrial Systems Co., Ltd. (a) | 11,887 | 938,248 | ||||||||
| Samsung Electronics Co., Ltd. | 6,932 | 4,794,891 | ||||||||
29
| Shares | Value | |||||||||
|---|---|---|---|---|---|---|---|---|---|---|
SOUTH KOREA (continued) | ||||||||||
| Samsung Heavy Industries Co., Ltd. (a) | 64,866 | $ | 1,409,352 | |||||||
| SK Holdings Co., Ltd. | 6,520 | 622,533 | ||||||||
| Woori Investment & Securities Co., Ltd. (a) | �� | 94,180 | 1,338,863 | |||||||
| 34,449,396 | ||||||||||
TAIWAN—11.9% | ||||||||||
| Advanced Semiconductor Engineering Inc. | 949,000 | 780,797 | ||||||||
| AU Optronics Corp. | 2,391,592 | 2,324,787 | ||||||||
| China Bills Finance Corporation | 509,470 | 145,323 | ||||||||
| Compal Electronics, Inc. | 1,609,005 | 1,874,370 | ||||||||
| CTCI Corporation | 350,000 | 340,768 | ||||||||
| Eternal Chemical Co., Ltd. (a) | 474,000 | 478,453 | ||||||||
| Formosa Plastics Corporation (a) | 377,679 | 769,503 | ||||||||
| Fubon Financial Holding Co., Ltd. (a) | 1,034,000 | 1,167,544 | ||||||||
| HannStar Display Corporation (a) | 320,181 | 70,315 | ||||||||
| Hua Nan Financial Holdings Co., Ltd. | 1,407,768 | 884,562 | ||||||||
| KGI Securities Co., Ltd. (a) | 385,668 | 207,542 | ||||||||
| Macronix International Co., Ltd. | 1,733,136 | 954,227 | ||||||||
| MediaTek, Inc. | 170,852 | 2,848,596 | ||||||||
| Quanta Computer, Inc. | 1,386,082 | 2,910,306 | ||||||||
| Siliconware Precision Industries Company | 1,136,422 | 1,604,876 | ||||||||
| Taiwan Cooperative Bank | 703,383 | 433,215 | ||||||||
| Taiwan Semiconductor Manufacturing Company Ltd. | 2,977,962 | 5,974,821 | ||||||||
| TSRC Corp. | 661,000 | 760,763 | ||||||||
| U-Ming Marine Transport Corporation | 603,485 | 1,015,570 | ||||||||
| United Microelectronics Corporation (a) | 4,461,593 | 2,185,831 | ||||||||
| Wistron Corporation | 724,943 | 1,348,500 | ||||||||
| WPG Holdings Co., Ltd. (a) | 551,529 | 780,595 | ||||||||
| 29,861,264 | ||||||||||
THAILAND—3.4% | ||||||||||
| Bangkok Bank PCL (b)(e) | 375,500 | 1,359,937 | ||||||||
| CP ALL PCL | 806,572 | 485,247 | ||||||||
| Krung Thai Bank PCL (e) | 5,057,926 | 1,074,866 | ||||||||
| PTT Chemical PCL | 155,681 | 341,324 | ||||||||
| PTT Exploration & Production PCL | 364,460 | 1,576,308 | ||||||||
| PTT PCL | 190,611 | 1,483,354 | ||||||||
| Siam Cement PCL (a)(e) | 192,640 | 1,280,038 | ||||||||
| Siam Commercial Bank PCL | 136,638 | 346,094 | ||||||||
| Thai Airways International PCL (a) | 891,200 | 594,845 | ||||||||
| 8,542,013 | ||||||||||
30
| Shares | Value | |||||||||
|---|---|---|---|---|---|---|---|---|---|---|
TURKEY—2.1% | �� | |||||||||
| Akbank TAS (a) | 50,173 | $ | 290,603 | |||||||
| Akcansa Cimento AS (a) | 30,177 | 121,944 | ||||||||
| Albaraka Turk Katilim Bankasi AS (a) | 80,540 | 111,198 | ||||||||
| Turkcell Iletisim Hizmetleri AS | 134,767 | 962,103 | ||||||||
| Turkiye Halk Bankasi AS (a) | 258,194 | 1,530,245 | ||||||||
| Turkiye Is Bankasi | 553,940 | 2,163,828 | ||||||||
| 5,179,921 | ||||||||||
TOTAL COMMON STOCK | ||||||||||
| (Cost $180,277,314) | 221,526,418 | |||||||||
Preferred Stock—3.5% | ||||||||||
BRAZIL—3.5% | ||||||||||
| Companhia Brasileira de Distribuicao Grupo Pao de Acucar | 47,108 | 1,327,322 | ||||||||
| Companhia Paranaense de Energia-Copel | 14,404 | 254,468 | ||||||||
| Eletropaulo Metropolitana SA | 88,250 | 1,802,746 | ||||||||
| Itau Unibanco Holding SA | 38,277 | 770,048 | ||||||||
| Metalurgica Gerdau SA (a) | 98,721 | 1,649,476 | ||||||||
| Telemar Norte Leste SA | 33,881 | 1,111,006 | ||||||||
| Telecomunicacoes de Sao Paulo SA | 31,198 | 780,763 | ||||||||
| Vale SA (a) | 64,086 | 1,321,770 | ||||||||
TOTAL PREFERRED STOCK | ||||||||||
| (Cost $6,788,534) | 9,017,599 | |||||||||
| Exchange Traded Funds—8.2% | ||||||||||
INDIA—7.9% | ||||||||||
| iPath MSCI India Index ETN (a) | 111,402 | 6,564,920 | ||||||||
| PowerShares India Portfolio | 171,659 | 3,634,021 | ||||||||
| WisdomTree India Earnings Fund | 461,276 | 9,700,634 | ||||||||
| 19,899,575 | ||||||||||
OTHER—0.3% | ||||||||||
| iShares MSCI Emerging Markets Index Fund | 20,187 | 785,476 | ||||||||
TOTAL EXCHANGE TRADED FUNDS | ||||||||||
| (Cost $18,020,282) | 20,685,051 | |||||||||
31
| Par Value | Value | |||||||||
|---|---|---|---|---|---|---|---|---|---|---|
| State Street Bank & Trust Co., Repurchase Agreement .01%, 10/01/09, (Dated 09/30/09), Collateralized by $200,000 U.S. Treasury Bills—zero coupon due 03/25/10, Market Value $199,820, Repurchase Proceeds $192,000 (Cost $192,000) | $ | 192,000 | $ | 192,000 | ||||||
TOTAL INVESTMENTS (EXCLUDING INVESTMENTS PURCHASED WITH CASH COLLATERAL FROM SECURITIES LOANED) (Cost $205,278,130) | 251,421,068 | |||||||||
INVESTMENTS PURCHASED WITH CASH COLLATERAL FROM SECURITIES LOANED—1.6% | ||||||||||
Money Market—1.6% | ||||||||||
| JP Morgan Prime Money Market Fund—Inst. (Cost $4,052,135) | 4,052,135 | 4,052,135 | ||||||||
TOTAL INVESTMENTS—101.4% (Cost $209,330,265) | 255,473,203 | |||||||||
OTHER ASSETS & LIABILITIES (Net)—(1.4%) | (3,606,305 | ) | ||||||||
NET ASSETS—100% | $ | 251,866,898 | ||||||||
| (a) | Non-income producing security. | |||||||||
| (b) | All or a portion of this security was out on loan. | |||||||||
| (c) | ADR—American Depositary Receipts | |||||||||
| (d) | GDR—Global Depositary Receipts | |||||||||
| (e) | NVDR—Non Voting Depositary Receipts | |||||||||
| SECTOR ALLOCATIONS (as a percentage of Total Common, Preferred Stock, and Exchange Traded Funds) | ||||||||
|---|---|---|---|---|---|---|---|---|
| Financials | 21.3 | % | ||||||
| Energy | 14.2 | % | ||||||
| Information Technology | 13.8 | % | ||||||
| Materials | 13.3 | % | ||||||
| Exchange Traded Funds | 8.2 | % | ||||||
| Industrials | 7.4 | % | ||||||
| Telecommunication Services | 7.3 | % | ||||||
| Consumer Discretionary | 6.7 | % | ||||||
| Utilities | 3.5 | % | ||||||
| Consumer Staples | 2.9 | % | ||||||
| Health Care | 1.4 | % | ||||||
32
| Shares | Value | |||||||||
|---|---|---|---|---|---|---|---|---|---|---|
AUSTRALIA—2.4% | ||||||||||
| BHP Billiton Ltd. | 341,850 | $ | 11,377,972 | |||||||
AUSTRIA—2.1% | ||||||||||
| Andritz AG | 207,460 | 10,342,697 | ||||||||
BELGIUM—4.2% | ||||||||||
| KBC Groep N.V. (a) | 230,385 | 11,568,168 | ||||||||
| Solvay S.A. | 84,380 | 8,757,735 | ||||||||
| 20,325,903 | ||||||||||
CANADA—2.6% | ||||||||||
| Methanex Corporation | 719,207 | 12,496,061 | ||||||||
FINLAND—9.3% | ||||||||||
| Cargotec Corp., Class B | 386,850 | 9,099,730 | ||||||||
| Kone Corporation OYJ-B | 376,800 | 13,846,193 | ||||||||
| Konecranes OYJ | 275,280 | 7,844,467 | ||||||||
| Yit OYJ | 726,067 | 13,818,276 | ||||||||
| 44,608,666 | ||||||||||
FRANCE—6.1% | ||||||||||
| Christian Dior S.A. | 125,573 | 12,399,378 | ||||||||
| Imerys S.A. | 84,552 | 4,850,382 | ||||||||
| Technip S.A. | 188,600 | 12,042,753 | ||||||||
| 29,292,513 | ||||||||||
GERMANY—10.1% | ||||||||||
| BASF SE | 205,700 | 10,895,889 | ||||||||
| Demag Cranes AG | 128,000 | 4,594,988 | ||||||||
| Hannover Rueckvers | 181,700 | 8,327,510 | ||||||||
| Muenchener Ruckvers AG | 41,100 | 6,555,226 | ||||||||
| Symrise AG | 494,700 | 9,429,446 | ||||||||
| Tognum AG | 507,500 | 8,671,191 | ||||||||
| 48,474,250 | ||||||||||
INDIA—2.5% | ||||||||||
| Infosys Technologies Ltd (b) | 48,800 | 2,366,312 | ||||||||
| State Bank of India (b) | 105,000 | 9,544,500 | ||||||||
| 11,910,812 | ||||||||||
IRELAND—9.1% | ||||||||||
| Bank of Ireland | 715,939 | 3,581,805 | ||||||||
| CRH PLC | 413,406 | 11,459,105 | ||||||||
| Greencore Group PLC | 4,411,976 | 10,134,206 | ||||||||
33
| Shares | Value | |||||||||
|---|---|---|---|---|---|---|---|---|---|---|
IRELAND (continued) | ||||||||||
| Smurfit Kappa PLC (a) | 2,342,260 | $ | 18,502,427 | |||||||
| 43,677,543 | ||||||||||
ITALY—2.8% | ||||||||||
| Trevi Finanziaria SpA | 776,466 | 13,505,297 | ||||||||
JAPAN—13.4% | ||||||||||
| Asahi Breweries Ltd. | 460,500 | 8,448,031 | ||||||||
| Culture Convenience Club Co., Ltd. | 429,900 | 2,805,001 | ||||||||
| Iino Kaiun Kaisha, Ltd. | 1,076,000 | 5,217,407 | ||||||||
| Kansai Electric Power Company Inc. | 389,700 | 9,448,064 | ||||||||
| KDDI Corporation | 1,204 | 6,806,592 | ||||||||
| Meiji Dairies Corporation | 186,300 | 7,971,946 | ||||||||
| Nippon Yusen Kabushiki Kaisha | 2,061,000 | 7,990,246 | ||||||||
| Showa Denko K.K. | 3,379,000 | 6,908,631 | ||||||||
| Tokyo Electric Power Company Inc. | 343,300 | 9,032,696 | ||||||||
| 64,628,614 | ||||||||||
NORWAY—2.3% | ||||||||||
| Camillo Eitzen & Co. ASA | 588,679 | 698,759 | ||||||||
| DnB NOR ASA (a) | 890,626 | 10,309,705 | ||||||||
| 11,008,464 | ||||||||||
SOUTH AFRICA—1.9% | ||||||||||
| Metorex Ltd. (a) | 4,759,918 | 2,082,287 | ||||||||
| Sasol Ltd. | 190,535 | 7,132,907 | ||||||||
| 9,215,194 | ||||||||||
SOUTH KOREA—5.1% | ||||||||||
| Samsung Electronics Company Ltd. | 24,085 | 16,659,686 | ||||||||
| SK Telecom Company Ltd. | 51,793 | 8,022,255 | ||||||||
| 24,681,941 | ||||||||||
SWEDEN—6.9% | ||||||||||
| Autoliv Inc. | 237,234 | 7,971,062 | ||||||||
| Duni AB | 1,179,500 | 7,944,696 | ||||||||
| Investor AB | 502,056 | 9,155,698 | ||||||||
| Svenska Handelsbanken AB | 328,500 | 8,379,862 | ||||||||
| 33,451,318 | ||||||||||
SWITZERLAND—1.6% | ||||||||||
| Novartis AG | 155,500 | 7,770,130 | ||||||||
THAILAND—1.9% | ||||||||||
| Thai Oil Plc | 6,724,400 | 9,107,426 | ||||||||
34
| Shares | Value | |||||||||
|---|---|---|---|---|---|---|---|---|---|---|
UNITED KINGDOM—10.9% | ||||||||||
| Barratt Developments PLC (a) | 2,975,894 | $ | 11,686,009 | |||||||
| Bellway PLC | 937,770 | 12,462,643 | ||||||||
| Lloyds TSB Group PLC (a) | 2,812,529 | 4,667,131 | ||||||||
| Persimmon PLC (a) | 1,109,088 | 8,100,015 | ||||||||
| Taylor Wimpey PLC (a) | 23,010,191 | 15,508,963 | ||||||||
| 52,424,761 | ||||||||||
TOTAL COMMON STOCK | ||||||||||
| (Cost $567,856,157) | 458,299,562 | |||||||||
Short Term Investments—4.9% | ||||||||||
| Par Value | Value | |||||||||
COMMERCIAL PAPER—4.9% | ||||||||||
| State Street Global Advisors FDS, 0.06%, due 10/01/2009 (Cost $18,728,649) | $ | 18,728,649 | 18,728,649 | |||||||
| Toyota Motor Credit, 0.04%, due 10/01/2009 (Cost $4,926,000) | $ | 4,926,000 | 4,926,000 | |||||||
TOTAL SHORT TERM INVESTMENTS—4.9% | 23,654,649 | |||||||||
TOTAL INVESTMENTS—100.1% (Cost $591,510,806) | 481,954,211 | |||||||||
OTHER ASSETS & LIABILITIES (NET)—(0.1%) | (262,546 | ) | ||||||||
NET ASSETS—100% | $ | 481,691,665 | ||||||||
| (a) | Non-income producing security | |||||||||
| (b) | ADR—American Depository Receipts | |||||||||
| SECTOR ALLOCATIONS (as a percentage of Total Common and Preferred Stock) | ||||||||
|---|---|---|---|---|---|---|---|---|
| Materials | 21.1 | % | ||||||
| Industrials | 20.9 | % | ||||||
| Consumer Discretionary | 17.2 | % | ||||||
| Financials | 15.7 | % | ||||||
| Energy | 6.2 | % | ||||||
| Consumer Staples | 5.8 | % | ||||||
| Information Technology | 4.2 | % | ||||||
| Utilities | 4.0 | % | ||||||
| Telecommunication Services | 3.2 | % | ||||||
| Health Care | 1.7 | % | ||||||
35
| Shares | Value | |||||||||
|---|---|---|---|---|---|---|---|---|---|---|
AUSTRALIA—1.8% | ||||||||||
| Austal Limited | 623,200 | $ | 1,429,365 | |||||||
BELGIUM—1.8% | ||||||||||
| Barco NV (a) | 32,100 | 1,399,333 | ||||||||
CAMBODIA—1.7% | ||||||||||
| NagaCorp Ltd. | 10,124,937 | 1,332,564 | ||||||||
CHINA—9.0% | ||||||||||
| Sichuan Expressway Company Limited | 3,548,000 | 1,405,457 | ||||||||
| Sichuan Xinhua Winshare Chainstore Co., Ltd. | 3,818,500 | 1,399,287 | ||||||||
| Sinopec Kantons Holdings Limited | 4,500,400 | 1,550,450 | ||||||||
| VTech Holdings Limited | 165,200 | 1,422,842 | ||||||||
| 5,778,036 | ||||||||||
FRANCE—1.8% | ||||||||||
| Bonduelle SA | 13,700 | 1,404,877 | ||||||||
GERMANY—1.8% | ||||||||||
| Demag Cranes AG | 40,800 | 1,464,652 | ||||||||
INDIA—9.5% | ||||||||||
| KRBL Limited Derivative (a) | 489,500 | 1,502,765 | ||||||||
| LIC Housing Finance Ltd. Derivative | 102,900 | 1,651,545 | ||||||||
| NIIT Technologies Derivative | 550,300 | 1,408,768 | ||||||||
| South Indian Bank Derivative | 570,600 | 1,472,148 | ||||||||
| Usha Martin Group Derivative | 1,036,900 | 1,451,660 | ||||||||
| 7,486,886 | ||||||||||
IRELAND—9.4% | ||||||||||
| Glanbia plc | 343,400 | 1,456,794 | ||||||||
| Grafton Group plc | 269,000 | 1,526,806 | ||||||||
| Greencore Group plc | 645,546 | 1,482,609 | ||||||||
| IFG Group plc | 633,700 | 1,381,242 | ||||||||
| United Drug | 456,200 | 1,541,584 | ||||||||
| 7,389,035 | ||||||||||
ITALY—3.3% | ||||||||||
| De’Longhi SpA | 366,100 | 1,340,213 | ||||||||
| Trevi Finanziaria SpA | 73,700 | 1,281,885 | ||||||||
| 2,622,098 | ||||||||||
JAPAN—5.4% | ||||||||||
| Accordia Golf Co., Ltd. | 1,453 | 1,376,620 | ||||||||
| Culture Convenience Club Co., Ltd. | 223,000 | 1,455,025 | ||||||||
| Iino Kaiun Kaisha, Ltd. | 291,700 | 1,414,422 | ||||||||
| 4,246,067 | ||||||||||
36
| Shares | Value | |||||||||
|---|---|---|---|---|---|---|---|---|---|---|
NORWAY—5.4% | ||||||||||
| ABG Sundal Collier Holding ASA | 1,163,000 | $ | 1,448,895 | |||||||
| SpareBank 1 Nord-Norge | 167,680 | 1,407,174 | ||||||||
| SpareBank 1 Midt-Norge | 80,900 | 1,434,819 | ||||||||
| 4,290,888 | ||||||||||
RUSSIA—2.1% | ||||||||||
| Bank Vozrozhdenie | 41,000 | 1,637,540 | ||||||||
SINGAPORE—5.4% | ||||||||||
| Breadtalk Group Ltd. | 3,485,000 | 1,286,252 | ||||||||
| China Fishery Group Limited | 1,460,300 | 1,502,899 | ||||||||
| MobileOne | 1,196,100 | 1,502,660 | ||||||||
| 4,291,811 | ||||||||||
SOUTH AFRICA—3.2% | ||||||||||
| Metorex Limited (a) | 2,324,900 | 1,017,057 | ||||||||
| New Clicks Holdings | 496,600 | 1,507,542 | ||||||||
| 2,524,599 | ||||||||||
SWEDEN—5.0% | ||||||||||
| Duni AB | 191,777 | 1,291,742 | ||||||||
| Nolato AB | 168,500 | 1,322,104 | ||||||||
| Transcom WorldWide S.A. (a) | 308,900 | 1,328,069 | ||||||||
| 3,941,915 | ||||||||||
SWITZERLAND—3.5% | ||||||||||
| Bobst Group SA (a) | 34,437 | 1,324,181 | ||||||||
| Vetropack Holding AG | 826 | 1,405,788 | ||||||||
| 2,729,969 | ||||||||||
UNITED KINGDOM—20.8% | ||||||||||
| Alternative Networks plc | 723,900 | 1,233,680 | ||||||||
| Character Group plc (a) | 1,402,900 | 1,571,444 | ||||||||
| Clarkson plc | 98,304 | 1,348,113 | ||||||||
| CSR plc (a) | 185,300 | 1,390,961 | ||||||||
| Filtrona plc | 526,000 | 1,420,798 | ||||||||
| Galliford Try | 1,429,789 | 1,338,450 | ||||||||
| Halfords Group plc | 253,553 | 1,429,000 | ||||||||
| Hampson Industries plc | 829,951 | 966,184 | ||||||||
| Healthcare Locums plc | 358,600 | 1,497,700 | ||||||||
| Keller Group plc | 122,300 | 1,422,771 | ||||||||
| The Restaurant Group plc | 457,600 | 1,413,245 | ||||||||
| Vitec Group plc | 241,561 | 1,410,892 | ||||||||
| 16,443,238 | ||||||||||
37
| Shares | Value | |||||||||
|---|---|---|---|---|---|---|---|---|---|---|
TOTAL COMMON STOCK | ||||||||||
| (Cost $61,185,461) | $ | 70,412,873 | ||||||||
Preferred Stock—2.1% | ||||||||||
GERMANY—2.1% | ||||||||||
| Drägerwerk AG | ||||||||||
| (Cost $1,511,493) | 42,800 | 1,640,382 | ||||||||
Exchange Traded Funds—3.7% | ||||||||||
OTHER—3.7% | ||||||||||
| iShares MSCI EAFE Small Cap Index Fund | 39,600 | 1,437,084 | ||||||||
| SPDR S&P International Small Cap Fund | 56,600 | 1,448,960 | ||||||||
TOTAL EXCHANGE TRADED FUNDS (Cost $2,736,503) | 2,886,044 | |||||||||
Short Term Investments—13.1% | ||||||||||
| Par Value | Value | |||||||||
COMMERCIAL PAPER—13.1% | ||||||||||
| State Street Global Advisors FDS, 0.060%, due 10/01/2009 (Cost $5,245,540) | $ | 5,245,540 | $ | 5,245,540 | ||||||
| Toyota Motor Credit, 0.04%, due 10/01/2009 (Cost $5,098,000) | $ | 5,098,000 | 5,098,000 | |||||||
TOTAL SHORT TERM INVESTMENTS—13.1% | 10,343,540 | |||||||||
TOTAL INVESTMENTS—108.1% (Cost $75,776,997) | 85,282,839 | |||||||||
OTHER ASSETS & LIABILITIES (NET)—(8.1%) | (6,364,201 | ) | ||||||||
NET ASSETS—100% | $ | 78,918,638 | ||||||||
| (a) | Non-income producing security | |||||||||
38
>
| SECTOR ALLOCATIONS (as a percentage of Total Common, Preferred Stock and Exchange Traded Funds) | ||||||||
|---|---|---|---|---|---|---|---|---|
| Industrials | 23.8 | % | ||||||
| Consumer Discretionary | 18.8 | % | ||||||
| Financials | 13.9 | % | ||||||
| Consumer Staples | 11.5 | % | ||||||
| Information Technology | 11.0 | % | ||||||
| Health Care | 6.2 | % | ||||||
| Materials | 5.1 | % | ||||||
| Exchange Traded Funds | 3.9 | % | ||||||
| Telecommunication Services | 3.7 | % | ||||||
| Energy | 2.1 | % | ||||||
39
| Small Cap | Long/Short | |||||||||||||||||
|---|---|---|---|---|---|---|---|---|---|---|---|---|---|---|---|---|---|---|
Assets: | ||||||||||||||||||
| Investments at value (Includes collateral from securities on loan of $27,564,722; $8,243,546; $4,052,135; $0: $0, respectively)* (Note 2) | $ | 117,418,491 | $ | 76,333,954 | ||||||||||||||
| Repurchase agreements/commercial paper | 977,000 | — | ||||||||||||||||
| Foreign currency at value (Cost $382,231 for Emerging Markets, $277,905 for Foreign Value, and $63,795 for Foreign Value Small Cap) | — | — | ||||||||||||||||
| Cash | 1,763 | 222,034 | ||||||||||||||||
| Dividend, interest and foreign tax reclaims receivable | 106,517 | 66,017 | ||||||||||||||||
| Receivable for investments sold | 576,722 | — | ||||||||||||||||
| Receivable for shares of beneficial interest sold | 67,043 | 111,243 | ||||||||||||||||
| Unrealized gain/(loss) on forward foreign currency contracts (Note 2) | — | — | ||||||||||||||||
| Other assets | 13,863 | 7,527 | ||||||||||||||||
| Total Assets | 119,161,399 | 76,740,775 | ||||||||||||||||
Liabilities: | ||||||||||||||||||
| Securities sold short , at value (proceeds of $12,035,555) | — | 15,702,836 | ||||||||||||||||
| Payable for investments purchased | 379,977 | — | ||||||||||||||||
| Payable for shares of beneficial interest repurchased | 156,000 | 147,686 | ||||||||||||||||
| Payable to broker on securities sold short | — | — | ||||||||||||||||
| Payable for compensation of manager (Note 3) | 73,673 | 43,579 | ||||||||||||||||
| Payable for distribution fees (Note 3) | 17,108 | 10,870 | ||||||||||||||||
| Payable to custodian | 16,917 | 3,720 | ||||||||||||||||
| Payable to transfer agent (Note 3) | 11,788 | 14,547 | ||||||||||||||||
| Payable for collateral received for securities loaned | 27,564,722 | 8,243,546 | ||||||||||||||||
| Payable for foreign capital gain tax | — | — | ||||||||||||||||
| Payable For dividend expense on securities sold short | — | 7,953 | ||||||||||||||||
| Unrealized gain/(loss) on forward foreign currency contracts (Note 2) | — | — | ||||||||||||||||
| Other accrued expenses and liabilities | 54,778 | 14,130 | ||||||||||||||||
| Total Liabilities | 28,274,963 | 24,188,867 | ||||||||||||||||
Net Assets | $ | 90,886,436 | $ | 52,551,908 | ||||||||||||||
40
| Emerging Markets | Foreign Value | Foreign Value Small Cap | ||||||||
|---|---|---|---|---|---|---|---|---|---|---|
| $255,281,203 | $ | 458,299,562 | $ | 74,939,299 | ||||||
| 192,000 | 23,654,649 | 10,343,540 | ||||||||
| 384,370 | 284,089 | 63,894 | ||||||||
| 1,761 | — | — | ||||||||
| 737,186 | 958,633 | 219,580 | ||||||||
| 2,023,968 | — | 1,122,622 | ||||||||
| 108,812 | 266,871 | 21,500 | ||||||||
| — | — | — | ||||||||
| 8,305 | 36,614 | 32,307 | ||||||||
| 258,737,605 | 496,500,418 | 86,742,742 | ||||||||
| — | — | — | ||||||||
| 1,486,323 | — | 7,717,590 | ||||||||
| 554,821 | 872,066 | 1,501 | ||||||||
| — | — | — | ||||||||
| 207,742 | 380,289 | 56,101 | ||||||||
| 47,646 | 79,853 | 12,706 | ||||||||
| 28,096 | 39,217 | 2,813 | ||||||||
| 37,617 | 93,539 | 10,411 | ||||||||
| 4,052,135 | — | — | ||||||||
| 377,425 | 276,646 | 1,585 | ||||||||
| — | — | — | ||||||||
| — | — | — | ||||||||
| 78,902 | 67,143 | 21,397 | ||||||||
| 6,870,707 | 14,808,753 | 7,824,104 | ||||||||
| $251,866,898 | $ | 481,691,665 | $ | 78,918,638 | ||||||
41
| Small Cap | Long/Short | |||||||||
|---|---|---|---|---|---|---|---|---|---|---|
Net Assets Consist Of : | ||||||||||
| Shares of beneficial interest | $ | 123,917,333 | $ | 73,687,209 | ||||||
| Underdistributed/(overdistributed) net investment income | 931,548 | 30,636 | ||||||||
| Accumulated net realized gain/(loss) on investments and foreign denominated assets, liabilities and currency | (38,780,447 | ) | (26,463,327 | ) | ||||||
| Unrealized appreciation/(depreciation) of investments and foreign denominated assets, liabilities and currency | 4,818,002 | 5,297,390 | ||||||||
Net Assets | $ | 90,886,436 | $ | 52,551,908 | ||||||
| Investments at cost | $ | 113,577,489 | $ | 67,591,317 | ||||||
Net assets | ||||||||||
| Ordinary Shares | $ | 84,485,089 | $ | 51,829,125 | ||||||
| Institutional Shares | $ | 6,401,347 | $ | 722,783 | ||||||
| Shares of beneficial interest outstanding (unlimited number of shares authorized) | ||||||||||
| Ordinary Shares | 5,981,163 | 5,004,116 | ||||||||
| Institutional Shares | 401,872 | 67,491 | ||||||||
| Net asset value and offering price per share** | ||||||||||
| Ordinary Shares | $ | 14.13 | $ | 10.36 | ||||||
| Institutional Shares | $ | 15.93 | $ | 10.71 | ||||||
| * | Includes securities on loan to brokers with market value of $26,985,226; $8,011,166; $3,770,755; $0; $0, respectively. |
| ** | Prior to August 07, 2008, a deferred sales charge of 1% of the net asset value of the Ordinary Shares redeemed was withheld and paid to the Distributor. The fee was eliminated on this date. No deferred sales charge is withheld from redemptions of Institutional Shares. Prior to July 30, 2007 a redemption fee of 2% was withheld and paid to the Funds on redemptions of Institutional Shares made within 60 days of purchase. The fee was eliminated on this date. |
42
| Emerging Markets | Foreign Value | Foreign Value Small Cap | ||||||||
|---|---|---|---|---|---|---|---|---|---|---|
| $310,574,053 | $ | 772,185,509 | $ | 69,961,680 | ||||||
| 2,432,844 | 13,996,968 | 495,387 | ||||||||
| (107,010,873) | (194,710,174 | ) | (1,040,077 | ) | ||||||
| 45,870,874 | (109,780,638 | ) | 9,501,648 | |||||||
| $251,866,898 | $ | 481,691,665 | $ | 78,918,638 | ||||||
| $209,330,265 | $ | 604,510,806 | $ | 75,776,997 | ||||||
| $230,348,604 | $ | 409,275,721 | $ | 71,959,871 | ||||||
| $21,518,294 | $ | 72,415,944 | $ | 6,958,767 | ||||||
| 12,149,794 | 33,842,830 | 7,748,031 | ||||||||
| 1,121,751 | 5,985,544 | 748,448 | ||||||||
| $18.96 | $ | 12.09 | $ | 9.29 | ||||||
| $19.18 | $ | 12.10 | $ | 9.30 | ||||||
43
| Small Cap | Long/Short | |||||||||
|---|---|---|---|---|---|---|---|---|---|---|
Investment Income: | ||||||||||
| Dividends* | $ | 1,389,685 | $ | 555,273 | ||||||
| Interest | 76 | — | ||||||||
| Sec Lending Income | 52,599 | 32,548 | ||||||||
| Miscellaneous | 467 | 467 | ||||||||
Total Investment Income | 1,442,827 | 588,288 | ||||||||
Expenses: | ||||||||||
| Dividend expense on securities sold short | — | 61,792 | ||||||||
| Stock loan fees | — | 30,898 | ||||||||
| Compensation of manager (Note 3) | 409,154 | 250,594 | ||||||||
| Distribution fees, Ordinary Shares (Note 3) | 93,429 | 61,788 | ||||||||
| Administrative Fees (Note 3) | 14,376 | 8,885 | ||||||||
| Custodian and fund accounting fees | 32,300 | 44,428 | ||||||||
| Transfer agent fees (Note 3): | ||||||||||
| Ordinary Shares | 65,314 | 43,587 | ||||||||
| Institutional Shares | 5,881 | 684 | ||||||||
| Audit and legal | 13,317 | 8,305 | ||||||||
| Registration fees | 19,071 | 15,847 | ||||||||
| Insurance | 5,350 | 3,337 | ||||||||
| Compensation of trustees (Note 3) | 6,195 | 3,859 | ||||||||
| Printing | 14,334 | 8,950 | ||||||||
| Miscellaneous | 20,583 | 14,705 | ||||||||
| Total expenses before waivers/ reimbursements/reductions | 699,304 | 557,659 | ||||||||
| Waivers and/or reimbursements of expenses (Note 3) | — | — | ||||||||
| Fees reduced by credits allowed by custodian (Note 3) | — | (7 | ) | |||||||
Expenses, Net | 699,304 | 557,652 | ||||||||
| Net investment income/(loss) | 743,523 | 30,636 | ||||||||
Realized and unrealized gain/(loss) on investments, foreign currency, and foreign translation: | ||||||||||
| Net realized gain/(loss) (Note 2) on: | ||||||||||
| Investments | (2,771,491 | ) | 4,063,717 | |||||||
| Securities sold short transactions | (6,702,180 | ) | ||||||||
| Foreign denominated assets, liabilities, and currency | — | — | ||||||||
| Change in unrealized appreciation/(depreciation) of: | ||||||||||
| Investments | 28,030,048 | 16,740,764 | ||||||||
| Securities sold short transactions | — | (3,084,950 | ) | |||||||
| Foreign denominated assets, liabilities, and currency | — | — | ||||||||
| Net realized and unrealized gain/(loss) on investment and foreign currency | 25,258,557 | 11,017,351 | ||||||||
| Net increase/(decrease) in net assets resulting from operations | $ | 26,002,080 | $ | 11,047,987 | ||||||
| * | Dividends are net of withholding taxes of $5,780 for Small Cap., net of foreign withholding taxes of $805,181 for Emerging Markets, $578,055 for Foreign Value, and $29,225 for Foreign Value Small Cap. |
44
| Emerging Markets | Foreign Value | Foreign Value Small Cap | ||||||||
|---|---|---|---|---|---|---|---|---|---|---|
| $4,653,932 | $ | 3,885,907 | $ | 852,303 | ||||||
| (507) | 6,732 | 3,099 | ||||||||
| 13,841 | 400,935 | |||||||||
| 500 | 467 | |||||||||
| 4,667,766 | 4,294,041 | 855,402 | ||||||||
| — | — | — | ||||||||
| — | — | |||||||||
| 1,177,988 | 1,789,137 | 213,355 | ||||||||
| 265,663 | 366,100 | 46,541 | ||||||||
| 41,229 | 58,424 | 6,252 | ||||||||
| 200,800 | 129,240 | 20,651 | ||||||||
| 174,308 | 250,016 | 30,222 | ||||||||
| 18,575 | 54,332 | 4,375 | ||||||||
| 38,086 | 53,687 | 5,706 | ||||||||
| 29,464 | 35,954 | 10,798 | ||||||||
| 15,211 | 21,270 | 2,232 | ||||||||
| 17,723 | 25,068 | 2,679 | ||||||||
| 40,960 | 57,457 | 6,060 | ||||||||
| 49,582 | 68,018 | 11,557 | ||||||||
| 2,069,589 | 2,908,703 | 360,428 | ||||||||
| — | — | — | ||||||||
| — | (3 | ) | (3 | ) | ||||||
| 2,069,589 | 2,908,700 | 360,425 | ||||||||
| 2,598,177 | 1,385,341 | 494,977 | ||||||||
| (8,059,773) | (66,663,455 | ) | (55,367 | ) | ||||||
| (146,488) | 2,953 | 17,178 | ||||||||
| 109,655,466 | 247,578,829 | 23,627,654 | ||||||||
| — | — | |||||||||
| (139,902) | (200,272 | ) | (4,702 | ) | ||||||
| 101,309,303 | 180,718,055 | 23,584,763 | ||||||||
| $103,907,480 | $ | 182,103,396 | $ | 24,079,740 | ||||||
45
| Small Cap | |||||||||||
|---|---|---|---|---|---|---|---|---|---|---|---|
| Six Months Ended September 30, 2009 | Year Ended March 31, 2009 | ||||||||||
| (unaudited) | |||||||||||
Increase (Decrease) in Net Assets: | |||||||||||
| Operations: | |||||||||||
| Net investment income/(loss) | $ | 743,523 | $ | 373,179 | |||||||
| Net realized gain/(loss) on investments | |||||||||||
| Foreign denominated assets, liabilities, and currency | (2,771,491 | ) | (36,195,225 | ) | |||||||
| Unrealized appreciation/(depreciation) of investments, foreign denominated assets, liabilities, and currency | 28,030,048 | (31,601,323 | ) | ||||||||
| Net increase/(decrease) from operations | 26,002,080 | (67,423,369 | ) | ||||||||
| Distributions to shareholders from: | |||||||||||
| Net investment income | |||||||||||
| Ordinary shares | — | — | |||||||||
| Institutional shares | — | — | |||||||||
| Net realized gains | |||||||||||
| Ordinary shares | — | (381,648 | ) | ||||||||
| Institutional shares | — | (40,740 | ) | ||||||||
| Total distributions | — | (422,388 | ) | ||||||||
| Fund share transactions (Note 8) | (4,339,633 | ) | (7,161,857 | ) | |||||||
| Contributions to capital from investment manager/brokers | 25 | 82 | |||||||||
| Increase/(decrease) in net assets | 21,662,472 | (75,007,532 | ) | ||||||||
| Net assets beginning of period | 69,223,964 | 144,231,496 | |||||||||
| Net assets end of period* | $ | 90,886,436 | $ | 69,223,964 | |||||||
| * Includes undistributed net investment income/(loss) of: | $ | 931,548 | $ | 188,025 | |||||||
46
| Long/Short | |||||||||||
|---|---|---|---|---|---|---|---|---|---|---|---|
| Six Months Ended September 30, 2009 | Year Ended March 31, 2009 | ||||||||||
| (unaudited) | |||||||||||
Increase (Decrease) in Net Assets: | |||||||||||
| Operations: | |||||||||||
| Net investment income/(loss) | $ | 30,636 | $ | (229,042 | ) | ||||||
| Net realized gain/(loss) on investments | |||||||||||
| Foreign denominated assets, liabilities, and currency | (2,638,463 | ) | (23,010,657 | ) | |||||||
| Unrealized appreciation/(depreciation) of investments, foreign denominated assets, liabilities, and currency | 13,655,814 | (6,796,334 | ) | ||||||||
| Net increase/(decrease) from operations | 11,047,987 | (30,036,033 | ) | ||||||||
| Distributions to shareholders from: | |||||||||||
| Net investment income | |||||||||||
| Ordinary shares | — | (59,856 | ) | ||||||||
| Institutional shares | — | (3,214 | ) | ||||||||
| Net realized gains | |||||||||||
| Ordinary shares | — | — | |||||||||
| Institutional shares | — | — | |||||||||
| Total distributions | — | (63,070 | ) | ||||||||
| Fund share transactions (Note 8) | (2,094,629 | ) | 2,920,805 | ||||||||
| Contributions to capital from investment manager/brokers | 677 | — | |||||||||
| Increase/(decrease) in net assets | 8,954,035 | (27,178,298 | ) | ||||||||
| Net assets beginning of period | 43,597,873 | 70,776,171 | |||||||||
| Net assets end of period* | $ | 52,551,908 | $ | 43,597,873 | |||||||
| * Includes undistributed net investment income/(loss) of: | $ | 30,636 | $ | — | |||||||
47
| Emerging Markets | |||||||||||
|---|---|---|---|---|---|---|---|---|---|---|---|
| Six Months Ended September 30, 2009 | Year Ended March 31, 2009 | ||||||||||
| (unaudited) | |||||||||||
Increase (Decrease) in Net Assets: | |||||||||||
| Operations: | |||||||||||
| Net investment income/(loss) | $ | 2,598,177 | $ | 5,928,753 | |||||||
| Net realized gain/(loss) on investments | |||||||||||
| Foreign denominated assets, liabilities, and currency | (8,206,261 | ) | (99,226,631 | ) | |||||||
| Unrealized appreciation/(depreciation) of investments, foreign denominated assets, liabilities, and currency | 109,515,564 | (169,104,542 | ) | ||||||||
| Net increase/(decrease) from operations | 103,907,480 | (262,402,420 | ) | ||||||||
| Distributions to shareholders from: | |||||||||||
| Net investment income | |||||||||||
| Ordinary shares | — | (5,862,199 | ) | ||||||||
| Institutional shares | — | (959,785 | ) | ||||||||
| Net realized gains | |||||||||||
| Ordinary shares | — | (1,700,443 | ) | ||||||||
| Institutional shares | — | (252,143 | ) | ||||||||
| Total distributions | — | (8,774,570 | ) | ||||||||
| Fund share transactions (Note 8) | (41,837,580 | ) | (70,992,161 | ) | |||||||
| Contributions to capital from investment manager/brokers | — | 3,640 | |||||||||
| Increase/(decrease) in net assets | 62,069,900 | (342,165,511 | ) | ||||||||
| Net assets beginning of period | 189,796,998 | 531,962,509 | |||||||||
| Net assets end of period* | $ | 251,866,898 | $ | 189,796,998 | |||||||
| * Includes undistributed net investment income/(loss) of: | $ | 2,432,844 | $ | (165,333 | ) | ||||||
48
| Foreign Value | |||||||||||
|---|---|---|---|---|---|---|---|---|---|---|---|
| Six Months Ended September 30, 2009 | Year Ended March 31, 2009 | ||||||||||
| (unaudited) | |||||||||||
Increase (Decrease) in Net Assets: | |||||||||||
| Operations: | |||||||||||
| Net investment income/(loss) | $ | 1,385,341 | $ | 13,529,799 | |||||||
| Net realized gain/(loss) on investments | |||||||||||
| Foreign denominated assets, liabilities, and currency | (66,660,502 | ) | (127,091,858 | ) | |||||||
| Unrealized appreciation/(depreciation) of investments, foreign denominated assets, liabilities, and currency | 247,378,557 | (327,704,407 | ) | ||||||||
| Net increase/(decrease) from operations | 182,103,396 | (441,266,466 | ) | ||||||||
| Distributions to shareholders from: | |||||||||||
| Net investment income | |||||||||||
| Ordinary shares | — | (2,839,312 | ) | ||||||||
| Institutional shares | — | (913,157 | ) | ||||||||
| Net realized gains | |||||||||||
| Ordinary shares | — | (36,958,948 | ) | ||||||||
| Institutional shares | — | (8,845,161 | ) | ||||||||
| Total distributions | — | (49,556,578 | ) | ||||||||
| Fund share transactions (Note 8) | 58,700,602 | (190,425,771 | ) | ||||||||
| Contributions to capital from investment manager/brokers | — | 1,812 | |||||||||
| Increase/(decrease) in net assets | 240,803,998 | (681,247,003 | ) | ||||||||
| Net assets beginning of period | 240,887,667 | 922,134,670 | |||||||||
| Net assets end of period* | $ | 481,691,665 | $ | 240,887,667 | |||||||
| * Includes undistributed net investment income/(loss) of: | $ | 13,996,968 | $ | 12,611,627 | |||||||
49
| Foreign Value | |||||||||||
|---|---|---|---|---|---|---|---|---|---|---|---|
| Small Cap | |||||||||||
| Six Months Ended September 30, 2009 | Period Ended March 31, 2009 | ||||||||||
| (unaudited) | |||||||||||
Increase (Decrease) in Net Assets: | |||||||||||
| Operations: | |||||||||||
| Net investment income/(loss) | $ | 494,977 | $ | 129,233 | |||||||
| Net realized gain/(loss) on investments | |||||||||||
| Foreign denominated assets, liabilities, and currency | (38,189 | ) | (979,743 | ) | |||||||
| Unrealized appreciation/(depreciation) of investments, foreign denominated assets, liabilities, and currency | 23,622,952 | (14,121,304 | ) | ||||||||
| Net increase/(decrease) from operations | 24,079,740 | (14,971,814 | ) | ||||||||
| Distributions to shareholders from: | |||||||||||
| Net investment income | |||||||||||
| Ordinary shares | — | (113,257 | ) | ||||||||
| Institutional shares | — | (27,588 | ) | ||||||||
| Net realized gains | |||||||||||
| Ordinary shares | — | (56,483 | ) | ||||||||
| Institutional shares | — | (12,325 | ) | ||||||||
| Total distributions | — | (209,653 | ) | ||||||||
| Fund share transactions (Note 8) | 32,268,691 | 37,751,610 | |||||||||
| Contributions to capital from investment manager/brokers | — | 64 | |||||||||
| Increase/(decrease) in net assets | 56,348,431 | 22,570,207 | |||||||||
| Net assets beginning of period | 22,570,207 | — | |||||||||
| Net assets end of period* | $ | 78,918,638 | 22,570,207 | ||||||||
| * Includes undistributed net investment income/(loss) of: | $ | 495,387 | 410 | ||||||||
50
Increase(Decrease) in cash— | ||||||
Cash flows from operating activities: | ||||||
| Net increase/(decrease) in net assets from operations | $ | 11,047,987 | ||||
| Purchase of investment securities | (68,354,313 | ) | ||||
| Sale of investment securities | 76,767,269 | |||||
| Decrease in receivable for investment sold | 47,215 | |||||
| Decrease in dividends and interest receivable | 8,278 | |||||
| Increase in accrued expenses | 12,203 | |||||
| Decrease in securities sold short | (113,956 | ) | ||||
| Decrease in dividends payable for securities sold short | (17,688 | ) | ||||
| Unrealized appreciation on securities | (13,655,814 | ) | ||||
| Net realized gains from investments | (4,063,717 | ) | ||||
| Net cash used in operating activities | (9,370,523 | ) | ||||
Cash flows from financing activities: | ||||||
| Proceeds from shares sold | 2,563,154 | |||||
| Payment on shares redeemed | (4,606,876 | ) | ||||
| Cash distributions paid | — | |||||
| Net cash provided by financing activities | (2,043,722 | ) | ||||
| Net increase/(decrease) in cash | (366,258 | ) | ||||
Cash: | ||||||
| Beginning balance—04/01/09 | 588,292 | |||||
| Ending balance—09/30/09 | $ | 222,034 |
51
| Ordinary Shares | |||||||||||||||||||||||||||
|---|---|---|---|---|---|---|---|---|---|---|---|---|---|---|---|---|---|---|---|---|---|---|---|---|---|---|---|
| For the six months ended September 30, | Years Ending March 31, | ||||||||||||||||||||||||||
| 2009 | 2009 | 2008 | 2007 | 2006 | 2005 | ||||||||||||||||||||||
| (unaudited) | |||||||||||||||||||||||||||
| Net Asset Value, Beginning of Period | $ | 10.22 | $ | 19.45 | $ | 23.88 | $ | 22.99 | $ | 21.13 | $ | 19.93 | |||||||||||||||
Income from Investment Operations: | |||||||||||||||||||||||||||
| Net investment income (loss) (a)(b)(c) | 0.11 | 0.06 | 0.07 | (0.19 | ) | (0.22 | ) | (0.24 | ) | ||||||||||||||||||
| Net realized and unrealized gain/(loss) on securities | 3.80 | (9.23 | ) | (3.56 | ) | 2.91 | 5.16 | 2.18 | |||||||||||||||||||
| Total from Investment Operations | 3.91 | (9.17 | ) | (3.49 | ) | 2.72 | 4.94 | 1.94 | |||||||||||||||||||
Less Distributions: | |||||||||||||||||||||||||||
| Dividends from net investment income | — | — | (0.11 | ) | — | — | — | ||||||||||||||||||||
| Distributions from realized capital gains | — | (0.06 | ) | (0.83 | ) | (1.83 | ) | (3.08 | ) | (0.74 | ) | ||||||||||||||||
| Total Distributions | — | (0.06 | ) | (0.94 | ) | (1.83 | ) | (3.08 | ) | (0.74 | ) | ||||||||||||||||
| Net Asset Value, End of Period | $ | 14.13 | $ | 10.22 | $ | 19.45 | $ | 23.88 | $ | 22.99 | $ | 21.13 | |||||||||||||||
| Total Return (d) | 38.26 | % | (47.11%) | (15.17%) | 12.01 | % | 24.51 | % | 9.76 | % | |||||||||||||||||
| Net Assets, End of Period (000’s) | $ | 84,485 | $ | 61,943 | $ | 119,949 | $ | 124,998 | $ | 98,879 | $ | 80,199 | |||||||||||||||
Ratios and Supplemental Data: | |||||||||||||||||||||||||||
| Ratios of expenses to average net assets: (e) | |||||||||||||||||||||||||||
| Gross | 1.72%(f) | 1.64 | % | 1.59 | %* | 1.82 | % | 1.88 | % | 1.98 | % | ||||||||||||||||
| Net | 1.72%(f) | 1.64 | % | 1.59 | %* | 1.82 | % | 1.88 | % | 1.98 | % | ||||||||||||||||
| Ratio of net investment income (loss) to average net assets (c) | 1.78%(f) | 0.31 | % | 0.31 | % | (0.80 | )% | (1.00 | )% | (1.17 | )% | ||||||||||||||||
Portfolio Turnover | 27 | % | 72 | % | 39 | % | 41 | % | 57 | % | 43 | % | |||||||||||||||
| * | Expense ratio decline from the prior year was the result of the reduction of the 12b-1 fee from 50 basis points to 25 basis points on June 1, 2007. |
52
| Institutional Shares | |||||||||||||||||||||||||||
|---|---|---|---|---|---|---|---|---|---|---|---|---|---|---|---|---|---|---|---|---|---|---|---|---|---|---|---|
| For the six months ended September 30, | Years Ending March 31, | ||||||||||||||||||||||||||
| 2009 | 2009 | 2008 | 2007 | 2006 | 2005 | ||||||||||||||||||||||
| (unaudited) | |||||||||||||||||||||||||||
| Net Asset Value, Beginning of Period | $ | 11.51 | $ | 21.86 | $ | 26.71 | $ | 25.39 | $ | 22.96 | $ | 21.48 | |||||||||||||||
Income from Investment Operations: | |||||||||||||||||||||||||||
| Net investment income (loss) (a)(b)(c) | 0.15 | 0.10 | 0.12 | (0.08 | ) | (0.12 | ) | (0.14 | ) | ||||||||||||||||||
| Net realized and unrealized gain/(loss) on securities | 4.27 | (10.39 | ) | (3.94 | ) | 3.23 | 5.63 | 2.36 | |||||||||||||||||||
| Total from Investment Operations | 4.42 | (10.29 | ) | (3.82 | ) | 3.15 | 5.51 | 2.22 | |||||||||||||||||||
Less Distributions: | |||||||||||||||||||||||||||
| Dividends from net investment income | — | — | (0.20 | ) | — | — | — | ||||||||||||||||||||
| Distributions from realized capital gains | — | (0.06 | ) | (0.83 | ) | (1.83 | ) | (3.08 | ) | (0.74 | ) | ||||||||||||||||
| Total Distributions | — | (0.06 | ) | (1.03 | ) | (1.83 | ) | (3.08 | ) | (0.74 | ) | ||||||||||||||||
| Net Asset Value, End of Period | $ | 15.93 | $ | 11.51 | $ | 21.86 | $ | 26.71 | $ | 25.39 | $ | 22.96 | |||||||||||||||
| Total Return (d) | 38.40 | % | (47.04 | )% | (14.87 | )% | 12.58 | % | 25.06 | % | 10.37 | % | |||||||||||||||
| Net Assets, End of Period (000’s) | $ | 6,401 | $ | 7,281 | $ | 24,282 | $ | 12,400 | $ | 12,298 | $ | 9,616 | |||||||||||||||
Ratios and Supplemental Data: | |||||||||||||||||||||||||||
| Ratios of expenses to average net assets: (e) | |||||||||||||||||||||||||||
| Gross | 1.59%(f) | 1.42 | % | 1.30 | % | 1.31 | % | 1.38 | % | 1.48 | % | ||||||||||||||||
| Net | 1.59%(f) | 1.42 | % | 1.30 | % | 1.31 | % | 1.38 | % | 1.48 | % | ||||||||||||||||
| Ratio of net investment income (loss) to average net assets (c) | 2.23%(f) | 0.48 | % | 0.45 | % | (0.30 | )% | (0.50 | )% | (0.65 | )% | ||||||||||||||||
Portfolio Turnover | 27 | % | 72 | % | 39 | % | 41 | % | 57 | % | 43 | % | |||||||||||||||
| (a) | Per share numbers have been calculated using the average shares method. |
| (b) | Reflects expense waivers/reimbursements and reductions in effect during the period. See Note 3 to the Financial Statements. |
| (c) | Net investment income (loss) per share and the ratio of net investment income (loss) to average net assets reflect net investment income prior to certain reclassifications for federal income or excise taxes. |
| (d) | Total Return does not include the deferred sales charge of 1% for the Ordinary Shares. The total return would have been lower if certain fees had not been waived or if custodial fees had not been reduced by credits allowed by the custodian. See Note 3 to the financial statements. |
| (e) | Ratios of expenses to average net assets: — Gross (total expenses before fee waivers, reimbursements by the investment advisor, and custody earnings credits, if any). — Net (total expenses net of fee waivers, reimbursements by the investment advisor, and custody earnings credits, if any). |
| (f) | Annualized. |
53
| Ordinary Shares | ||||||||||||||||||||||||||||||||||
|---|---|---|---|---|---|---|---|---|---|---|---|---|---|---|---|---|---|---|---|---|---|---|---|---|---|---|---|---|---|---|---|---|---|---|
| For the six months ended September 30, | Years Ended March 31, | |||||||||||||||||||||||||||||||||
| 2009 | 2009 | 2008 | 2007 | 2006 | 2005 | |||||||||||||||||||||||||||||
| (unaudited) | ||||||||||||||||||||||||||||||||||
| Net Asset Value, Beginning of Period | $ | 8.24 | $ | 14.07 | $ | 17.04 | $ | 14.76 | $ | 12.88 | $ | 12.19 | ||||||||||||||||||||||
Income from Investment Operations: | ||||||||||||||||||||||||||||||||||
| Net investment income (loss) (a)(b)(c) | 0.01 | (0.04 | ) | (0.09 | ) | (0.02 | ) | 0.03 | 0.01 | |||||||||||||||||||||||||
| Net realized and unrealized gain/(loss) on securities | 2.11 | (5.78 | ) | (2.30 | ) | 2.33 | 1.86 | 0.68 | ||||||||||||||||||||||||||
| Total from Investment Operations | 2.12 | (5.82 | ) | (2.39 | ) | 2.31 | 1.89 | 0.69 | ||||||||||||||||||||||||||
Less Distributions: | ||||||||||||||||||||||||||||||||||
| Dividends from net investment income | — | (0.01 | ) | — | (0.03 | ) | (0.01 | ) | — | |||||||||||||||||||||||||
| Distributions from realized capital gains | — | — | (0.58 | ) | — | — | — | |||||||||||||||||||||||||||
| Total Distributions | — | (0.01 | ) | (0.58 | ) | (0.03 | ) | (0.01 | ) | — | ||||||||||||||||||||||||
| Net Asset Value, End of Period | $ | 10.36 | $ | 8.24 | $ | 14.07 | $ | 17.04 | $ | 14.76 | $ | 12.88 | ||||||||||||||||||||||
| Total Return (d) | 25.73 | % | (41.36 | )% | (14.43 | )% | 15.63 | % | 14.67 | % | 5.66 | % | ||||||||||||||||||||||
| Net Assets, End of Period (000’s) | $ | 51,829 | $ | 43,014 | $ | 69,767 | $ | 75,376 | $ | 59,975 | $ | 46,015 | ||||||||||||||||||||||
Ratios and Supplemental Data: | ||||||||||||||||||||||||||||||||||
| Ratios of expenses to average net assets: (e) | ||||||||||||||||||||||||||||||||||
| Gross | 2.22%(g) | 2.71 | % | 2.18 | % | 1.74 | % | 1.65 | % | 1.77 | % | |||||||||||||||||||||||
| Net including dividend and interest expense for securities sold short | 2.22%(g) | 2.71 | % | 2.12 | % | 1.71 | % | 1.61 | % | 1.76 | % | |||||||||||||||||||||||
| Net excluding dividend and interest expense for securities sold short | 1.98%(g) | 1.98 | % | 1.90 | % | 1.69 | % | — | — | |||||||||||||||||||||||||
| Ratio of net investment income (loss) to average net assets (c) | 0.07%(g) | (0.38 | )% | (0.52 | )% | (0.14 | )% | 0.21 | % | 0.08 | % | |||||||||||||||||||||||
Portfolio Turnover Excluding Short Positions (f) | 107 | % | 207 | % | 171 | % | 83 | % | 105 | % | 160 | % | ||||||||||||||||||||||
| Note: | This fund changed its investment strategy on November 1, 2006. |
54
| Institutional Shares | ||||||||||||||||||||||||||||||
|---|---|---|---|---|---|---|---|---|---|---|---|---|---|---|---|---|---|---|---|---|---|---|---|---|---|---|---|---|---|---|
| For the six months ended September 30, | Years Ending March 31, | |||||||||||||||||||||||||||||
| 2009 | 2009 | 2008 | 2007 | 2006 | 2005 | |||||||||||||||||||||||||
| (unaudited) | ||||||||||||||||||||||||||||||
| Net Asset Value, Beginning of Period | $ | 8.54 | $ | 14.71 | $ | 17.80 | $ | 15.40 | $ | 13.43 | $ | 12.65 | ||||||||||||||||||
Income from Investment Operations: | ||||||||||||||||||||||||||||||
| Net investment income (loss) (a)(b)(c) | (0.02 | ) | (0.10 | ) | (0.10 | ) | 0.06 | 0.10 | 0.07 | |||||||||||||||||||||
| Net realized and unrealized gain/(loss) on securities | 2.19 | (6.02 | ) | (2.41 | ) | 2.44 | 1.94 | 0.71 | ||||||||||||||||||||||
| Total from Investment Operations | 2.17 | (6.12 | ) | (2.51 | ) | 2.50 | 2.04 | 0.78 | ||||||||||||||||||||||
Less Distributions: | ||||||||||||||||||||||||||||||
| Dividends from net investment income | — | (0.05 | ) | — | (0.10 | ) | (0.07 | ) | — | |||||||||||||||||||||
| Distributions from realized capital gains | — | — | (0.58 | ) | — | — | — | |||||||||||||||||||||||
| Total Distributions | — | (0.05 | ) | (0.58 | ) | (0.10 | ) | (0.07 | ) | — | ||||||||||||||||||||
| Net Asset Value, End of Period | $ | 10.71 | $ | 8.54 | $ | 14.71 | $ | 17.80 | $ | 15.40 | $ | 13.43 | ||||||||||||||||||
| Total Return (d) | 25.41 | % | (41.66 | )% | (14.49 | )% | 16.22 | % | 15.19 | % | 6.17 | % | ||||||||||||||||||
| Net Assets, End of Period (000’s) | $ | 723 | $ | 584 | $ | 1,009 | $ | 1,279 | $ | 984 | $ | 825 | ||||||||||||||||||
Ratios and Supplemental Data: | ||||||||||||||||||||||||||||||
| Ratios of expenses to average net assets: (e) | ||||||||||||||||||||||||||||||
| Gross | 2.76%(g) | 3.19 | % | 2.23 | % | 1.25 | % | 1.16 | % | 1.27 | % | |||||||||||||||||||
| Net including dividend and interest expense for securities sold short | 2.76%(g) | 3.19 | % | 2.17 | % | 1.22 | % | 1.11 | % | 1.26 | % | |||||||||||||||||||
| Net excluding dividend and interest expense for securities sold short | 2.51%(g) | 2.46 | % | 1.95 | % | 1.20 | % | — | — | |||||||||||||||||||||
| Ratio of net investment income (loss) to average net assets (c) | (0.20 | )%(g) | (0.86 | )% | (0.56 | )% | 0.35 | % | 0.71 | % | 0.54 | % | ||||||||||||||||||
Portfolio Turnover Excluding Short Positions (f) | 107 | % | 207 | % | 171 | % | 83 | % | 105 | % | 160 | % | ||||||||||||||||||
| (a) | Per share numbers have been calculated using the average shares method. |
| (b) | Reflects expense waivers/reimbursements and reductions in effect during the period. See Note 3 to the Financial Statements. |
| (c) | Net investment income (loss) per share and the ratio of net investment income (loss) to average net assets reflect net investment income prior to certain reclassifications for federal income or excise taxes. |
| (d) | Total Return does not include the deferred sales charge of 1% for the Ordinary Shares. The total return would have been lower if certain fees had not been waived or if custodial fees had not been reduced by credits allowed by the custodian. See Note 3 to the financial statements. |
| (e) | Ratios of expenses to average net assets: — Gross (total expenses before fee waivers, reimbursements by the investment advisor, and custody earnings credits, if any). — Net (total expenses net fee waivers, reimbursements by the investment advisor, and custody earnings credits, if any). |
| (f) | Portfolio turnover is calculated on long security positions only. Short positions are generally held for less than one year. |
| (g) | Annualized. |
55
| Ordinary Shares | |||||||||||||||||||||||||||
|---|---|---|---|---|---|---|---|---|---|---|---|---|---|---|---|---|---|---|---|---|---|---|---|---|---|---|---|
| For the six months ended September 30, | Years Ended March 31, | ||||||||||||||||||||||||||
| 2009 | 2009 | 2008 | 2007 | 2006 | 2005 | ||||||||||||||||||||||
| (unaudited) | |||||||||||||||||||||||||||
| Net Asset Value, Beginning of Period | $ | 12.06 | $ | 27.04 | $ | 23.34 | $ | 19.85 | $ | 14.23 | $ | 12.71 | |||||||||||||||
Income from Investment Operations: | |||||||||||||||||||||||||||
| Net investment income (loss) (a)(b)(c) | 0.17 | 0.33 | 0.26 | 0.16 | 0.21 | 0.14 | |||||||||||||||||||||
| Net realized and unrealized gain/(loss) on securities | 6.73 | (14.76 | ) | 4.42 | 4.02 | 6.28 | 1.86 | ||||||||||||||||||||
| Total from Investment Operations | 6.90 | (14.43 | ) | 4.68 | 4.18 | 6.49 | 2.00 | ||||||||||||||||||||
Less Distributions: | |||||||||||||||||||||||||||
| Dividends from net investment income | — | (0.43 | ) | (0.16 | ) | (0.22 | ) | (0.22 | ) | (0.20 | ) | ||||||||||||||||
| Distributions from realized capital gains | — | (0.12 | ) | (0.82 | ) | (0.47 | ) | (0.65 | ) | (0.28 | ) | ||||||||||||||||
| Total Distributions | — | (0.55 | ) | (0.98 | ) | (0.69 | ) | (0.87 | ) | (0.48 | ) | ||||||||||||||||
| Net Asset Value, End of Period | $ | 18.96 | $ | 12.06 | $ | 27.04 | $ | 23.34 | $ | 19.85 | $ | 14.23 | |||||||||||||||
| Total Return (d) | 57.21 | % | (53.27 | )% | 19.35 | % | 21.36 | % | 46.77 | % | 15.89 | % | |||||||||||||||
| Net Assets, End of Period (000’s) | $ | 230,349 | $ | 164,133 | $ | 491,462 | $ | 276,698 | $ | 144,088 | $ | 61,681 | |||||||||||||||
Ratios and Supplemental Data: | |||||||||||||||||||||||||||
| Ratios of expenses to average net assets: (e) | |||||||||||||||||||||||||||
| Gross | 1.78%(f) | 1.67 | % | 1.60 | % | 1.67 | % | 1.83 | % | 1.96 | % | ||||||||||||||||
| Net | 1.78%(f) | 1.67 | % | 1.60 | % | 1.67 | % | 1.83 | % | 1.96 | % | ||||||||||||||||
| Ratio of net investment income (loss) to average net assets (c) | 2.16%(f) | 1.66 | % | 0.91 | % | 0.77 | % | 1.23 | % | 1.12 | % | ||||||||||||||||
Portfolio Turnover | 79 | % | 67 | % | 18 | % | 24 | % | 34 | % | 53 | % | |||||||||||||||
56
| Institutional Shares | |||||||||||||||||||||||||||
|---|---|---|---|---|---|---|---|---|---|---|---|---|---|---|---|---|---|---|---|---|---|---|---|---|---|---|---|
| For the six months ended September 30, | Years Ending March 31, | ||||||||||||||||||||||||||
| 2009 | 2009 | 2008 | 2007 | 2006 | 2005 | ||||||||||||||||||||||
| (unaudited) | |||||||||||||||||||||||||||
| Net Asset Value, Beginning of Period | $ | 12.19 | $ | 27.46 | $ | 23.67 | $ | 20.11 | $ | 14.39 | $ | 12.82 | |||||||||||||||
Income from Investment Operations: | |||||||||||||||||||||||||||
| Net investment income (loss) (a)(b)(c) | 0.22 | 0.34 | 0.33 | 0.21 | 0.29 | 0.24 | |||||||||||||||||||||
| Net realized and unrealized gain/(loss) on securities | 6.77 | (14.98 | ) | 4.50 | 4.08 | 6.35 | 1.84 | ||||||||||||||||||||
| Total from Investment Operations | 6.99 | (14.64 | ) | 4.83 | 4.29 | 6.64 | 2.08 | ||||||||||||||||||||
Less Distributions: | |||||||||||||||||||||||||||
| Dividends from net investment income | — | (0.51 | ) | (0.22 | ) | (0.26 | ) | (0.27 | ) | (0.23 | ) | ||||||||||||||||
| Distributions from realized capital gains | — | (0.12 | ) | (0.82 | ) | (0.47 | ) | (0.65 | ) | (0.28 | ) | ||||||||||||||||
| Total Distributions | — | (0.63 | ) | (1.04 | ) | (0.73 | ) | (0.92 | ) | (0.51 | ) | ||||||||||||||||
| Net Asset Value, End of Period | $ | 19.18 | $ | 12.19 | $ | 27.46 | $ | 23.67 | $ | 20.11 | $ | 14.39 | |||||||||||||||
| Total Return (d) | 57.34 | % | (53.17 | )% | 19.67 | % | 21.68 | % | 47.39 | % | 16.42 | % | |||||||||||||||
| Net Assets, End of Period (000’s) | $ | 21,518 | $ | 25,664 | $ | 40,501 | $ | 12,759 | $ | 1,707 | $ | 1,082 | |||||||||||||||
Ratios and Supplemental Data: | |||||||||||||||||||||||||||
| Ratios of expenses to average net assets: (e) | |||||||||||||||||||||||||||
| Gross | 1.58%(f) | 1.48 | % | 1.39 | % | 1.41 | % | 1.45 | % | 1.46 | % | ||||||||||||||||
| Net | 1.58%(f) | 1.48 | % | 1.39 | % | 1.41 | % | 1.45 | % | 1.46 | % | ||||||||||||||||
| Ratio of net investment income (loss) to average net assets (c) | 2.66%(f) | 1.82 | % | 1.12 | % | 1.02 | % | 1.75 | % | 1.84 | % | ||||||||||||||||
Portfolio Turnover | 79 | % | 67 | % | 18 | % | 24 | % | 34 | % | 53 | % | |||||||||||||||
| (a) | Per share numbers have been calculated using the average shares method. |
| (b) | Reflects expense waivers/reimbursements and reductions in effect during the period. See Note 3 to the Financial Statements. |
| (c) | Net investment income (loss) per share and the ratio of net investment income (loss) to average net assets reflect net investment income prior to certain reclassifications for federal income or excise taxes. |
| (d) | Total Return does not include the deferred sales charge of 1% for the Ordinary Shares. The total return would have been lower if certain fees had not been waived or if custodial fees had not been reduced by credits allowed by the custodian. See Note 3 to the financial statements. |
| (e) | Ratios of expenses to average net assets: — Gross (total expenses before fee waivers, reimbursements by the investment advisor, and custody earnings credits, if any). — Net (total expenses net of fee waivers, reimbursements by the investment advisor, and custody earnings credits, if any). |
| (f) | Annualized. |
57
| Ordinary Shares | |||||||||||||||||||||||||||
|---|---|---|---|---|---|---|---|---|---|---|---|---|---|---|---|---|---|---|---|---|---|---|---|---|---|---|---|
| For the six months ended September 30, | Years Ended March 31, | ||||||||||||||||||||||||||
| 2009 | 2009 | 2008 | 2007 | 2006 | 2005 | ||||||||||||||||||||||
| (unaudited) | |||||||||||||||||||||||||||
| Net Asset Value, Beginning of Period | $ | 6.97 | $ | 19.87 | $ | 23.07 | $ | 19.91 | $ | 15.92 | $ | 13.50 | |||||||||||||||
Income from Investment Operations: | |||||||||||||||||||||||||||
| Net investment income (loss) (a)(b)(c) | 0.04 | 0.35 | 0.19 | 0.18 | 0.24 | (f) | 0.15 | ||||||||||||||||||||
| Net realized and unrealized gain/(loss) on securities | 5.08 | (11.53 | ) | (2.11 | ) | 4.12 | 3.96 | 2.66 | |||||||||||||||||||
| Total from Investment Operations | 5.12 | (11.18 | ) | (1.92 | ) | 4.30 | 4.20 | 2.81 | |||||||||||||||||||
Less Distributions: | |||||||||||||||||||||||||||
| Dividends from net investment income | — | (0.11 | ) | (0.19 | ) | (0.07 | ) | (0.13 | ) | (0.12 | ) | ||||||||||||||||
| Distributions from realized capital gains | — | (1.61 | ) | (1.09 | ) | (1.07 | ) | (0.08 | ) | (0.27 | ) | ||||||||||||||||
| Total Distributions | 12.09 | (1.72 | ) | (1.28 | ) | (1.14 | ) | (0.21 | ) | (0.39 | ) | ||||||||||||||||
| Net Asset Value, End of Period | $ | 12.09 | $ | 6.97 | $ | 19.87 | $ | 23.07 | $ | 19.91 | $ | 15.92 | |||||||||||||||
| Total Return (d) | 73.46 | % | (55.95 | )% | (8.71 | )% | 22.08 | % | 26.59 | % | 20.99 | % | |||||||||||||||
| Net Assets, End of Period (000’s) | $ | 409,276 | $ | 193,798 | $ | 781,136 | $ | 778,104 | $ | 441,614 | $ | 202,655 | |||||||||||||||
Ratios and Supplemental Data: | |||||||||||||||||||||||||||
| Ratios of expenses to average net assets: (e) | |||||||||||||||||||||||||||
| Gross | 1.67%(h) | 1.62 | % | 1.56 | % | 1.60 | % | 1.69 | % | 1.80 | % | ||||||||||||||||
| Net | 1.67%(h) | 1.62 | % | 1.56 | % | 1.60 | % | 1.69 | % | 1.80 | % | ||||||||||||||||
| Ratio of net investment income (loss) to average net assets (c) | 0.71%(h) | 2.49 | % | 0.83 | % | 0.88 | % | 1.41 | %(f) | 1.04 | % | ||||||||||||||||
Portfolio Turnover | 9 | % | 20 | % | 44 | % | 19 | % | 29 | % | 10 | % | |||||||||||||||
58
| Institutional Shares | |||||||||||||||||||||||||||
|---|---|---|---|---|---|---|---|---|---|---|---|---|---|---|---|---|---|---|---|---|---|---|---|---|---|---|---|
| For the six months ended September 30, | Years Ending March 31, | ||||||||||||||||||||||||||
| 2009 | 2009 | 2008 | 2007 | 2006 | 2005 | ||||||||||||||||||||||
| (unaudited) | |||||||||||||||||||||||||||
| Net Asset Value, Beginning of Period | $ | 6.98 | $ | 19.98 | $ | 23.19 | $ | 20.01 | $ | 15.98 | $ | 13.53 | |||||||||||||||
Income from Investment Operations: | �� | ||||||||||||||||||||||||||
| Net investment income (loss) (a)(b)(c) | 0.05 | 0.38 | 0.26 | 0.25 | 0.29 | (g) | 0.17 | ||||||||||||||||||||
| Net realized and unrealized gain/(loss) on securities | 5.07 | (11.60 | ) | (2.13 | ) | 4.12 | 3.98 | 2.70 | |||||||||||||||||||
| Total from Investment Operations | 5.12 | (11.22 | ) | (1.87 | ) | 4.37 | 4.27 | 2.87 | |||||||||||||||||||
Less Distributions: | |||||||||||||||||||||||||||
| Dividends from net investment income | — | (0.17 | ) | (0.25 | ) | (0.12 | ) | (0.16 | ) | (0.15 | ) | ||||||||||||||||
| Distributions from realized capital gains | — | (1.61 | ) | (1.09 | ) | (1.07 | ) | (0.08 | ) | (0.27 | ) | ||||||||||||||||
| Total Distributions | — | (1.78 | ) | (1.34 | ) | (1.19 | ) | (0.24 | ) | (0.42 | ) | ||||||||||||||||
| Net Asset Value, End of Period | $ | 12.10 | $ | 6.98 | $ | 19.98 | $ | 23.19 | $ | 20.01 | $ | 15.98 | |||||||||||||||
| Total Return (d) | 73.35 | % | (55.85 | )% | (8.49 | )% | 22.37 | % | 26.96 | % | 21.35 | % | |||||||||||||||
| Net Assets, End of Period (000’s) | $ | 72,416 | $ | 47,090 | $ | 140,999 | $ | 115,200 | $ | 30,972 | $ | 21,317 | |||||||||||||||
Ratios and Supplemental Data: | |||||||||||||||||||||||||||
| Ratios of expenses to average net assets: (e) | |||||||||||||||||||||||||||
| Gross | 1.43%(h) | 1.38 | % | 1.32 | % | 1.35 | % | 1.45 | % | 1.55 | % | ||||||||||||||||
| Net | 1.43%(h) | 1.38 | % | 1.32 | % | 1.35 | % | 1.45 | % | 1.55 | % | ||||||||||||||||
| Ratio of net investment income (loss) to average net assets (c) | 1.06%(h) | 2.77 | % | 1.18 | % | 1.13 | % | 1.70 | %(g) | 1.22 | % | ||||||||||||||||
Portfolio Turnover | 9 | % | 20 | % | 44 | % | 19 | % | 29 | % | 10 | % | |||||||||||||||
| (a) | Per share numbers have been calculated using the average shares method. |
| (b) | Reflects expense waivers/reimbursements and reductions in effect during the period. See Note 3 to the Financial Statements. |
| (c) | Net investment income (loss) per share and the ratio of net investment income (loss) to average net assets reflect net investment income prior to certain reclassifications for federal income or excise taxes. |
| (d) | Total Return does not include the deferred sales charge of 1% for the Ordinary Shares. The total return would have been lower if certain fees had not been waived or if custodial fees had not been reduced by credits allowed by the custodian. See Note 3 to the financial statements. |
| (e) | Ratios of expenses to average net assets: — Gross (total expenses before fee waivers, reimbursements by the investment advisor, and custody earnings credits, if any). — Net (total expenses net of fee waivers, reimbursements by the investment advisor, and custody earnings credits, if any). |
| (f) | Includes non-recurring income of $277,072. |
| (g) | Includes non-recurring income of $22,928. |
| (h) | Annualized. |
59
| Ordinary Shares | |||||||||||
|---|---|---|---|---|---|---|---|---|---|---|---|
| For the six months ended September 30, 2009 | Period Ending March 31, 2009 | ||||||||||
| (unaudited) | |||||||||||
| Net Asset Value, Beginning of Period | $ | 4.82 | $ | 10.00 | |||||||
Income from Investment Operations: | |||||||||||
| Net investment income (loss) (a)(b)(c) | 0.08 | 0.03 | |||||||||
| Net realized and unrealized gain/(loss) on securities | 4.39 | (5.15 | ) | ||||||||
| Total from Investment Operations | 4.47 | (5.12 | ) | ||||||||
Less Distributions: | |||||||||||
| Dividends from net investment income | — | (0.04 | ) | ||||||||
| Distributions from realized capital gains | — | (0.02 | ) | ||||||||
| Total Distributions | — | (0.06 | ) | ||||||||
| Net Asset Value, End of Period* | $ | 9.29 | $ | 4.82 | |||||||
| Total Return (d) | 92.74 | % | (51.25 | )% | |||||||
| Net Assets, End of Period (000’s) | $ | 71,960 | $ | 18,978 | |||||||
Ratios and Supplemental Data: | |||||||||||
| Ratios of expenses to average net assets: (e) | |||||||||||
| Gross | 1.71 | %(g) | 2.00 | %(g) | |||||||
| Net | 1.71 | %(g) | 1.97 | %(g) | |||||||
| Ratio of net investment income (loss) to average net assets (c) | 2.31 | %(g) | 0.66 | %(g) | |||||||
Portfolio Turnover | 8 | % | 10 | % | |||||||
60
| Institutional Shares | |||||||||||
|---|---|---|---|---|---|---|---|---|---|---|---|
| For the six months ended September 30, 2009 | Period Ending March 31, 2009 | ||||||||||
| (unaudited) | |||||||||||
| Net Asset Value, Beginning of Period | $ | 4.82 | $ | 10.00 | |||||||
Income from Investment Operations: | |||||||||||
| Net investment income (loss) (a)(b)(c) | 0.09 | 0.07 | |||||||||
| Net realized and unrealized gain/(loss) on securities | 4.39 | (5.19 | ) | ||||||||
| Total from Investment Operations | 4.48 | (5.12 | ) | ||||||||
Less Distributions: | |||||||||||
| Dividends from net investment income | — | (0.04 | ) | ||||||||
| Distributions from realized capital gains | — | (0.02 | ) | ||||||||
| Total Distributions | — | (0.06 | ) | ||||||||
| Net Asset Value, End of Period* | $ | 9.30 | $ | 4.82 | |||||||
| Total Return (d) | 92.95 | % | (51.20 | )% | |||||||
| Net Assets, End of Period (000’s) | $ | 6,959 | $ | 3,592 | |||||||
Ratios and Supplemental Data: | |||||||||||
| Ratios of expenses to average net assets: (e) | |||||||||||
| Gross | 1.57 | %(g) | 1.88 | %(g) | |||||||
| Net | 1.57 | %(g) | 1.85 | %(g) | |||||||
| Ratio of net investment income (loss) to average net assets (c) | 2.39 | %(g) | 1.10 | %(g) | |||||||
Portfolio Turnover | 8 | % | 10 | % | |||||||
| * | Fund commenced operations May 1, 2008. |
| (a) | Per share numbers have been calculated using the average shares method. |
| (b) | Reflects expense waivers/reimbursements and reductions in effect during the period. See Note 3 to the Financial Statements. |
| (c) | Net investment income (loss) per share and the ratio of net investment income (loss) to average net assets reflect net investment income prior to certain reclassifications for federal income or excise taxes. |
| (d) | Total Return does not include the deferred sales charge of 1% for the Ordinary Shares. The total return would have been lower if certain fees had not been waived or if custodial fees had not been reduced by credits allowed by the custodian. See Note 3 to the financial statements. |
| (e) | Ratios of expenses to average net assets: — Gross (total expenses before fee waivers, reimbursements by the investment advisor, and custody earnings credits, if any). — Net (total expenses net of fee waivers, reimbursements by the investment advisor, and custody earnings credits, if any). |
| (g) | Annualized. |
61
62
• | Level 1 – quoted prices in active markets for identical investments. |
• | Level 2 – other significant observable inputs (which could include quoted prices for similar investments, interest rates, credit risk, etc.) |
• | Level 3 – significant unobservable inputs (including the Fund’s own assumptions in determining the fair value of investments.) |
63
| Level 1 | | Level 2 | | Level 3 | | Total | ||||||||||||
|---|---|---|---|---|---|---|---|---|---|---|---|---|---|---|---|---|---|---|
Small Cap | ||||||||||||||||||
| Investments in Securities | $ | 89,853,769 | $ | 28,541,722 | $ | — | $ | 118,395,491 | ||||||||||
Long/Short | ||||||||||||||||||
| Investments in Securities | 68,090,408 | 8,243,546 | — | 76,333,954 | ||||||||||||||
| Liabilities in Securities Sold Short | (15,702,836 | ) | — | — | (15,702,836 | ) | ||||||||||||
Emerging Markets | ||||||||||||||||||
| Investments in Securities | 251,229,068 | 4,244,135 | — | 255,473,203 | ||||||||||||||
| Other Financial Instruments | 2,802 | — | 2,802 | |||||||||||||||
Foreign Value | ||||||||||||||||||
| Investments in Securities | 449,192,136 | 45,762,075 | — | 494,954,211 | ||||||||||||||
Foreign Value Small Cap | ||||||||||||||||||
| Investments in Securities | 65,814,873 | 11,981,080 | — | 77,795,953 | ||||||||||||||
| Other Financial Instruments | 23,177 | 7,486,886 | — | 7,510,063 | ||||||||||||||
64
65
daily. eSecLending provides indemnification insurance via highly rated third party insurers to cover these potential risks.
| | Value of Collateral | | Value of Loaned Securities | | |||||||
|---|---|---|---|---|---|---|---|---|---|---|---|
| Quant Small Cap Fund | $ | 27,564,722 | 26,985,226 | ||||||||
| Long/ Short Fund | 8,243,546 | 8,011,166 | |||||||||
| Quant Emerging Markets Fund | 4,052,135 | 3,770,755 | |||||||||
66
while Institutional Shares do not. Distributions from net investment income for each Fund, if any, are declared and paid annually. Distributions from net realized gains for each Fund, if any, are generally declared and paid annually.
3. | Management Fee, Advisory Contracts and Other Affiliate Transactions |
67
expenses, which include incremental custody costs associated with international securities. Expenses are calculated gross of custody credits, if applicable.
| Small Cap* | 0.47% of average daily total net assets | |||||
| Long/Short** | 0.45% of the first $100 million and | |||||
| 0.40% of amounts in excess of $100 million; | ||||||
| Emerging Markets | 0.40% of average daily total net assets; | |||||
| Foreign Value | 0.35% of the first $35 million, | |||||
| 0.40% of amounts in excess of $35 million but less than $200 million and | ||||||
| 0.50% of assets in excess of $200 million of average daily total net assets | ||||||
| Foreign Value Small Cap | 0.35% of the first $35 million and | |||||
| 0.40% of amounts in excess of $35 million but less than $200 million and | ||||||
| 0.50% of amounts in excess of $200 million. | ||||||
| * | Prior to January 1, 2009 the fee paid was 0.50% of average daily total net assets. |
| ** | Effective January 1, 2009 through December 31, 2009 the fee paid is 0.425% of the first $100 million and 0.40% of amounts in excess of $100 million. |
68
“Transfer Agent Agreement”). The Transfer Agent and Service Agreement provides for base fees that are payable to the Transfer Agent at an annual rate of 0.16% of the average daily total net asset value of each class of shares of the Funds and for reimbursement of out of pocket expenses. During the six months ended September 30, 2009, the aggregate fees of the Funds were $647,294.
69
Fund’s investments and the income they generate, as well as the Fund’s ability to repatriate such amounts.
| Portfolio | | Capital Loss Expires March 31, 2010 | | Capital Loss Expires March 31, 2011 | | Capital Loss Expires March 31, 2016 | | Capital Loss Expires March 31, 2017 | | Total Capital Loss | ||||||||||||
|---|---|---|---|---|---|---|---|---|---|---|---|---|---|---|---|---|---|---|---|---|---|---|
| Small Cap Fund | $ | — | $ | — | $ | — | $ | 12,418,995 | $ | 12,418,995 | ||||||||||||
| Long/Short Fund | — | — | — | 2,671,166 | 2,671,166 | |||||||||||||||||
| Emerging Markets Fund | — | — | — | 44,819,035 | 44,819,035 | |||||||||||||||||
| Foreign Value Fund | 263,553 | 932,449 | — | 80,608,820 | 81,804,822 | |||||||||||||||||
| Foreign Value Small Cap Fund | — | — | — | — | — | |||||||||||||||||
| Portfolio | | Tax Cost | | Gross Unrealized Gain | | Gross Unrealized Loss | | Net Unrealized Gain (Loss) | ||||||||||
|---|---|---|---|---|---|---|---|---|---|---|---|---|---|---|---|---|---|---|
| Small Cap | $ | 87,233,419 | $ | 12,780,462 | $ | (7,962,461 | ) | $ | 4,818,001 | |||||||||
| Long/Short | 64,636,398 | 9,563,809 | (599,120 | ) | 8,964,689 | |||||||||||||
| Emerging Markets | 206,414,857 | 53,615,366 | (7,472,427 | ) | 46,142,939 | |||||||||||||
| Foreign Value | 604,513,129 | 33,214,691 | (142,771,286 | ) | (109,556,595 | ) | ||||||||||||
| Foreign Value Small Cap | 75,776,998 | 11,573,978 | (2,068,136 | ) | 9,505,842 | |||||||||||||
70
| Six Months Ended September 30, 2009 | Year Ended March 31, 2009 | ||||||||||||||||||
|---|---|---|---|---|---|---|---|---|---|---|---|---|---|---|---|---|---|---|---|
| Shares | Dollars | Shares | Dollars | ||||||||||||||||
Small Cap | |||||||||||||||||||
Ordinary Shares | |||||||||||||||||||
| Shares sold | 221,355 | $ | 2,639,324 | 1,197,486 | $ | 15,152,296 | |||||||||||||
| Shares issued in reinvestment of distributions | — | — | 37,692 | 358,457 | |||||||||||||||
| Shares redeemed | (303,053 | ) | (3,774,239 | ) | (1,338,280 | ) | (18,046,224 | ) | |||||||||||
| Net Change | (81,698 | ) | (1,134,915 | ) | (103,102 | ) | (2,535,471 | ) | |||||||||||
Institutional Shares | |||||||||||||||||||
| Shares sold | 20,689 | 292,131 | 421,457 | 7,599,757 | |||||||||||||||
| Shares issued in reinvestment of distributions | — | — | 3,767 | 40,377 | |||||||||||||||
| Shares redeemed | (251,213 | ) | (3,496,849 | ) | (903,658 | ) | (12,266,520 | ) | |||||||||||
| Redemption fees | — | — | |||||||||||||||||
| Net Change | (230,524 | ) | (3,204,718 | ) | (478,434 | ) | (4,626,386 | ) | |||||||||||
Total Net Change For Fund | ($4,339,633 | ) | ($7,161,857 | ) | |||||||||||||||
Long/Short | |||||||||||||||||||
Ordinary Shares | |||||||||||||||||||
| Shares sold | 274,099 | $ | 2,628,858 | 924,988 | $ | 9,582,942 | |||||||||||||
| Shares issued in reinvestment of distributions | — | — | 5,990 | 54,807 | |||||||||||||||
| Shares redeemed | (489,249 | ) | (4,711,222 | ) | (669,798 | ) | (6,697,973 | ) | |||||||||||
| Net Change | (215,150 | ) | (2,082,364 | ) | 261,180 | 2,939,776 | |||||||||||||
Institutional Shares | |||||||||||||||||||
| Shares sold | 3,422 | $ | 31,752 | 4,938 | $ | 48,902 | |||||||||||||
| Shares issued in reinvestment of distributions | — | — | 338 | 3,215 | |||||||||||||||
| Shares redeemed | (4,322 | ) | (44,017 | ) | (5,468 | ) | (71,088 | ) | |||||||||||
| Redemption fees | |||||||||||||||||||
| Net Change | (900 | ) | (12,265 | ) | (192 | ) | (18,971 | ) | |||||||||||
Total Net Change For Fund | ($2,094,629 | ) | $ | 2,920,805 | |||||||||||||||
71
| Six Months Ended September 30, 2009 | Year Ended March 31, 2009 | ||||||||||||||||||
|---|---|---|---|---|---|---|---|---|---|---|---|---|---|---|---|---|---|---|---|
| Shares | Dollars | Shares | Dollars | ||||||||||||||||
Emerging Markets | |||||||||||||||||||
Ordinary Shares | |||||||||||||||||||
| Shares sold | 2,219,960 | $ | 34,841,181 | 6,642,687 | $ | 128,661,844 | |||||||||||||
| Shares issued in reinvestment of distributions | — | — | 613,797 | 7,122,537 | |||||||||||||||
| Shares redeemed | (3,680,372 | ) | (60,637,266 | ) | (11,822,136 | ) | (218,677,577 | ) | |||||||||||
| Net Change | (1,460,412 | ) | (25,796,085 | ) | (4,565,652 | ) | (82,893,196 | ) | |||||||||||
Institutional Shares | |||||||||||||||||||
| Shares sold | 438,901 | 6,837,720 | 1,428,165 | 25,597,502 | |||||||||||||||
| Shares issued in reinvestment of distributions | — | — | 103,193 | 1,210,553 | |||||||||||||||
| Shares redeemed | (1,422,072 | ) | (22,879,215 | ) | (901,592 | ) | (14,907,020 | ) | |||||||||||
| Redemption fees | |||||||||||||||||||
| Net Change | (983,171 | ) | (16,041,495 | ) | 629,766 | 11,901,035 | |||||||||||||
Total Net Change For Fund | ($41,837,580 | ) | ($70,992,161 | ) | |||||||||||||||
Foreign Value | |||||||||||||||||||
| Ordinary Shares | |||||||||||||||||||
| Shares sold | 10,306,237 | $ | 109,882,515 | 8,562,360 | $ | 102,085,370 | |||||||||||||
| Shares issued in reinvestment of distributions | — | — | 5,653,414 | 38,564,826 | |||||||||||||||
| Shares redeemed | (4,251,526 | ) | (42,891,310 | ) | (25,737,478 | ) | (313,926,849 | ) | |||||||||||
| Net Change | 6,054,711 | 66,991,205 | (11,521,704 | ) | (173,276,653 | ) | |||||||||||||
Institutional Shares | |||||||||||||||||||
| Shares sold | 272,021 | 2,313,944 | 2,211,766 | 27,949,404 | |||||||||||||||
| Shares issued in reinvestment of distributions | — | — | 1,355,181 | 9,305,002 | |||||||||||||||
| Shares redeemed | (1,028,118 | ) | (10,604,547 | ) | (3,882,303 | ) | (54,403,524 | ) | |||||||||||
Redemption fees | |||||||||||||||||||
| Net Change | (756,097 | ) | (8,290,603 | ) | (315,356 | ) | (17,149,118 | ) | |||||||||||
Total Net Change For Fund | $ | 58,700,602 | ($190,425,771 | ) | |||||||||||||||
72
| Six Months Ended September 30, 2009 | Year Ended March 31, 2009 | ||||||||||||||||||
|---|---|---|---|---|---|---|---|---|---|---|---|---|---|---|---|---|---|---|---|
| Shares | Dollars | Shares | Dollars | ||||||||||||||||
Foreign Value Small Cap | |||||||||||||||||||
Ordinary Shares | |||||||||||||||||||
| Shares sold | 4,079,920 | $ | 34,133,829 | 4,338,927 | $ | 32,806,653 | |||||||||||||
| Shares issued in reinvestment of distributions | — | — | 33,329 | 168,643 | |||||||||||||||
| Shares redeemed | (271,916 | ) | (1,983,653 | ) | (432,229 | ) | (2,265,355 | ) | |||||||||||
| Net Change | 3,808,004 | 32,150,176 | 3,940,027 | 30,709,941 | |||||||||||||||
Institutional Shares | |||||||||||||||||||
| Shares sold | 85,788 | $ | 581,282 | 1,218,834 | $ | 11,453,722 | |||||||||||||
| Shares issued in reinvestment of distributions | — | — | 7,888 | 39,913 | |||||||||||||||
| Shares redeemed | (82,693 | ) | (462,767 | ) | (481,369 | ) | (4,451,966 | ) | |||||||||||
| Net Change | 3,095 | 118,515 | 745,353 | 7,041,669 | |||||||||||||||
| Total Net Change for Fund | $ | 32,268,691 | $ | 37,751,610 | |||||||||||||||
73
74
CONTRACT APPROVAL (continued)
Management
75
CONTRACT APPROVAL (continued)
funds in its Selected Peer Group, and that the Fund’s total expense ratio was below the average and the median of the Fund’s Sub-Advised Peer Group.
76
CONTRACT APPROVAL (continued)
77
| Name and (Age) | | Position(s) Held With Funds, Term of Office And Length of Time Served | | Principal Occupation(s) During Past Five Years | | Number of Portfolios in Fund Complex Overseen by Trustee | | Other Directorships Held by Trustee | ||||||||||
|---|---|---|---|---|---|---|---|---|---|---|---|---|---|---|---|---|---|---|
Non-Interested Trustees | ||||||||||||||||||
| Robert M. Armstrong (70) | Trustee (1985 to Present) | Independent financial and career consulting services | 5 | NewPage Corporation; NewPage Holding Corporation; NewPage Group | ||||||||||||||
| John M. Bulbrook (67) | Trustee (1985 to Present) | CEO and Treasurer, John M. Bulbrook Insurance Agency, Inc. | 5 | John M. Bulbrook Insurance Agency, Inc. | ||||||||||||||
| William H. Dunlap (58) | Trustee (10/17/2006 to Present) | President, EQ Rider, Inc.; Principal, William H. Dunlap & Company (consulting firm) | 5 | Merrimack County Savings Bank; Merrimack Bank Corp. | ||||||||||||||
| Clinton S. Marshall (52) | Trustee (April 2003 to Present) | Owner, Coastal CFO Solutions; CFO, Fore River Company | 5 | The Pool Association | ||||||||||||||
78
| Name and (Age) | | Position(s) Held With Funds, Term of Office And Length of Time Served | | Principal Occupation(s) During Past Five Years | | Number of Portfolios in Fund Complex Overseen by Trustee | | Other Directorships Held by Trustee | |||||||||||||||
|---|---|---|---|---|---|---|---|---|---|---|---|---|---|---|---|---|---|---|---|---|---|---|---|
Interested Trustees and Officers | |||||||||||||||||||||||
| Willard L. Umphrey* (68) | Trustee, President, Chairman (1985 to Present) | Director, U.S. Boston Capital Corporation; President, Quantitative Investment Advisors, Inc. | 5 | U.S. Boston Corporation; U.S. Boston Asset Management Corporation; Quantitative Investment Advisors, Inc.; Sugarbush Solutions, Inc., USB Corporation; USB Greenville-86, Inc.; USB Atlantic Associates, Inc.; U.S. Boston Insurance Agency, Inc.; U.S. Boston Capital Corporation; Pear Tree Partners Management, LLC; Waterfront Parking Corporation | |||||||||||||||||||
| Leon Okurowski (66) | Vice President and Treasurer (1985 to Present) | Director and Vice President, U.S. Boston Capital Corporation; Treasurer, Quantitative Investment Advisors, Inc.; Trustee, Quant Funds (4/17/1985– 9/30/2004) | N/A | Everest USB Canadian Storage, Inc.; Quantitative Investment Advisors, Inc.; Sugarbush Solutions, Inc. U.S. Boston Corporation; U.S. Boston Asset Management Corporation; USB Corporation; USB Everest Management, LLC; USB Everest Storage LLC; USB Greenville-86, Inc.; USB Atlantic Associates, Inc.; U.S. Boston Insurance Agency, Inc.; U.S. Boston Capital Corporation | |||||||||||||||||||
79
| Name and (Age) | | Position(s) Held With Funds, Term of Office And Length of Time Served | Principal Occupation(s) During Past Five Years | | | Number of Portfolios in Fund Complex Overseen by Trustee | | Other Directorships Held by Trustee | ||||||||||
|---|---|---|---|---|---|---|---|---|---|---|---|---|---|---|---|---|---|---|
| Interested Trustees and Officers (continued) | ||||||||||||||||||
| Deborah A. Kessinger (46) | Assistant Clerk (April 2005 to present), Chief Compliance Officer (December 2005 to present) | Senior Counsel (since 9/2004) and Chief Compliance Officer (since 12/2005), U.S. Boston Capital Corporation; Senior Counsel (since 9/2004), Chief Compliance Officer (since 11/2006) and President (since August 2007), Quantitative Investment Advisors, Inc.; Chief Compliance Officer and General Counsel, Wainwright Investment Counsel, LLC (2000-2004); Compliance Attorney, Forefield, Inc. (2001–2004) and Compliance Consultant (2007–Present) | N/A | None | ||||||||||||||
| Sandra I. Madden (43) | Clerk and Chief Legal Officer (Since April 2008) | Senior Counsel (Since 3/2008), Quantitative Investment Advisors, Inc.; Counsel (8/2005–3/2008) MetLife Advisers LLC; Sr. Associate Counsel (1999–2005) Investors Bank and Trust (financial services provider). | N/A | None | ||||||||||||||
80
| Name and (Age) | | Position(s) Held With Funds, Term of Office And Length of Time Served | Principal Occupation(s) During Past Five Years | | | Number of Portfolios in Fund Complex Overseen by Trustee | | Other Directorships Held by Trustee | |||||||||||
|---|---|---|---|---|---|---|---|---|---|---|---|---|---|---|---|---|---|---|---|
Interested Trustees and Officers (continued) | |||||||||||||||||||
| Jennifer Dougherty (43) | Assistant Treasurer (July 2008 to Present) | Chief Financial Officer (since 2/2009) and Director of Operations (since 10/2007) Quantitative Investment Advisors, Inc.; Managing Director of Executive Education (2004–2007) Harvard Business School | N/A | None | |||||||||||||||
| * | Trustee has been determined to be an “Interested Trustee” by virtue of, among other things, affiliation with one or more of the trust, the Fund’s investment advisor, Quantitative Advisors and the Fund’s distributor, U.S. Boston Capital Corporation. |
81
This page intentionally left blank.
This page intentionally left blank.
This page intentionally left blank.
Manager | Quantitative Advisors, 55 Old Bedford Road, Lincoln, MA 01772 | |||||
Advisers | Columbia Partners, L.L.C., Investment Management, 5425 Wisconsin Avenue, Suite 700, Chevy Chase, MD 20815 Analytic Investors, LLC, 555 West Fifth Street, 50th Floor, Los Angeles, CA 90013 PanAgora Asset Management, Inc., 470 Atlantic Avenue, 8th Floor, Boston, MA 02210 Polaris Capital Management, LLC, 125 Summer Street, Boston, MA 02210 | |||||
Distributor | U.S. Boston Capital Corporation, 55 Old Bedford Road, Lincoln, MA 01773 | |||||
Custodian | State Street, 801 Pennsylvania Avenue, Kansas City, MO 64105 | |||||
Fund Accountant | State Street, 801 Pennsylvania Avenue, Kansas City, MO 64105 | |||||
Transfer Agent | Quantitative Institutional Services, 55 Old Bedford Road, Lincoln, MA 01773 | |||||
Independent Registered Public Accounting Firm | Tait, Weller & Baker LLP, 1818 Market Street, Suite 2400 Philadelphia, PA 19103 | |||||
Legal Counsel | Goodwin Procter LLP, 901 New York Avenue, NW, Washington, DC 20001 | |||||
For Account Information | For Quant Funds information, contact your financial adviser or, if you receive account statements directly from Quant Funds, you can also call 1-800-326-2151. Telephone representatives are available from 8:30 a.m. to 4:30 p.m. Eastern Time. Or visit our website, www.quantfunds.com. | |||||

ITEM 2. | Code of Ethics |
| Not applicable for report period. |
ITEM 3. | Audit Committee Financial Expert |
| Not applicable for report period. |
ITEM 4. | Principal Accountant Fees and Services |
| Not applicable for report period. |
ITEM 5. | Audit Committee of Listed Registrants |
| Not applicable. |
ITEM 6. | Schedule of Investments |
| Not applicable. |
ITEM 7. Disclosure of Proxy Voting Policies and Procedures for Closed-End Management Investment Companies
| Not applicable. |
ITEM 8. | Portfolio Managers of Closed-End Management Investment Companies. |
| Not applicable. |
ITEM 9 | Purchase of Equity Securities by Closed-End Management Investment Company and Affiliated Purchasers |
| Not applicable. |
ITEM 10 | Submission of Matters to a Vote of Security Holders |
| Not applicable. |
ITEM 11. | Controls and Procedures |
(a) The President and Treasurer of the registrant have concluded, based on their evaluation of the effectiveness of the registrant’s disclosure controls and procedures (as defined in Rule 30a-3(c) under the Act) as of a date within 90 days of the filing date of this report on Form N-CSR, that the design and operation of such procedures provide reasonable assurance that information required to be disclosed by the registrant in this report on Form N-CSR is recorded, processed,
summarized, and reported within the time periods specified in the Securities and Exchange Commission’s rules and forms.
(b) There has been no change in the registrant’s internal controls over financial reporting (as defined in Rule 30a-3(d) under the Act) that occurred during the second fiscal quarter of the period covered by this report that has materially affected, or is reasonably likely to materially affect, the registrant’s internal control over financial reporting.
ITEM 12. | Exhibits |
(a) | Certifications pursuant to Rule 30a-2(a) by the chief executive and financial officers. |
(b) | Certification pursuant to Rule 30a-2(b) and Section 906 by the chief executive and financial officers. |
SIGNATURES
Pursuant to the requirements of the Securities Exchange Act of 1934 and the Investment Company Act of 1940, the registrant has duly caused this report to be signed on its behalf by the undersigned, thereunto duly authorized.
Quantitative Group of Funds
By /s/ Willard L. Umphrey
Willard L. Umphrey, President
Date: November 24, 2008
Pursuant to the requirements of the Securities Exchange Act of 1934 and the Investment Company Act of 1940, this report has been signed below by the following persons on behalf of the registrant and in the capacities and on the dates indicated.
By /s/ Willard L. Umphrey
Willard L. Umphrey, President
Date: November 24, 2008
By /s/ Leon Okurowski
Leon Okurowski, Treasurer
Date: November 24, 2008
EXHIBIT LIST
(a) | Certifications pursuant to Rule 30a-2(a) by the chief executive and financial officers. |
(b) | Certification pursuant to Rule 30a-2(b) and Section 906 by the chief executive and |
| financial officers. |