| OMB APPROVAL |
| OMB Number: | 3235-0570 |
| Expires: August 31, 2011 |
| Estimated average burden |
| hours per response..... 18.9 |
UNITED STATES
SECURITIES AND EXCHANGE COMMISSION
Washington, D.C. 20549
FORM N-CSR
CERTIFIED SHAREHOLDER REPORT OF REGISTERED
MANAGEMENT INVESTMENT COMPANIES
Investment Company Act file number 811-3790
The Quantitative Group of Funds
(Exact name of registrant as specified in charter)
55 Old Bedford Road, Lincoln, MA 01773
(Address of principal executive offices)
Sandra I. Madden
Quantitative Investment Advisors, Inc.
55 Old Bedford Road, Lincoln, MA 01773
(Name and address of agent for service)
Registrant’s telephone number, including area code: (781) 676-5900
Date of fiscal year end: | March 31 |
Date of reporting period: | April 1, 2007 through March 31, 2008 |
ITEM 1. REPORTS TO SHAREOWNERS.

QUANT FUNDS
ANNUAL
REPORT
MARCH 31, 2009
U.S. EQUITY FUNDS
Quant Small Cap Fund
Quant Long/Short Fund
INTERNATIONAL EQUITY FUNDS
Quant Emerging Markets Fund
Quant Foreign Value Fund
Quant Foreign Value Small
Cap Fund
QUANT FUNDS
Quant Small Cap Fund
Quant Long/Short Fund
Quant Emerging Markets Fund
Quant Foreign Value Fund
Quant Foreign Value Small Cap Fund
ANNUAL REPORT
March 31, 2009
TABLE OF CONTENTS
| President's Letter | 1 | ||||||
| Fund Expenses | 2 | ||||||
| Portfolio Manager Commentaries | |||||||
| Quant Small Cap Fund | 4 | ||||||
| Quant Long/Short Fund | 6 | ||||||
| Quant Emerging Markets Fund | 8 | ||||||
| Quant Foreign Value Fund | 10 | ||||||
| Quant Foreign Value Small Cap Fund | 12 | ||||||
| Schedules of Investments | |||||||
| Quant Small Cap Fund | 14 | ||||||
| Quant Long/Short Fund | 18 | ||||||
| Quant Emerging Markets Fund | 29 | ||||||
| Quant Foreign Value Fund | 35 | ||||||
| Quant Foreign Value Small Cap Fund | 39 | ||||||
| Statements of Assets and Liabilities | 44 | ||||||
| Statements of Operations | 48 | ||||||
| Statements of Changes in Net Assets | 50 | ||||||
| Statement of Cash Flows for Quant Long/Short Fund | 55 | ||||||
| Financial Highlights | 56 | ||||||
| Notes to Financial Statements | 66 | ||||||
| Information for Shareholders | 81 | ||||||
| Privacy Policy | 81 | ||||||
| Trustees and Officers | 85 | ||||||
| Service Providers | back cover | ||||||
This report must be preceded or accompanied by a current Quant Funds prospectus for individuals who are not current shareholders of the Funds. You should read the prospectus carefully before investing because it contains more complete information on the Quant Funds' investment objectives, risks, charges and expenses. Please consider this information carefully. For a prospectus and other information, visit www.quantfunds.com or call (800) 326-2151.
NOT FDIC INSURED MAY LOSE VALUE NO BANK GUARANTEE
Neither the Quant Funds nor U.S. Boston Capital Corporation is a bank.
QUANT FUNDS
Dear Fellow Shareholder,
We are pleased to provide you with the Quantitative Group of Funds' Annual Report for the twelve months ended March 31, 2009 to update you on recent market conditions and the performance of the Quant Funds.
For current performance information, please visit our website at www.quantfunds.com. We thank you for your continued confidence in the Quant Funds. Please feel free to e-mail us at feedback@quantfunds.com or call us at 800-326-2151 with any questions or for assistance on your account.
Sincerely,

Willard Umphrey
President and Chairman
Any statements in this report regarding market or economic trends or the factors influencing the historical or future performance of the Quant Funds are the views of Fund management as of the date of this report. These views are subject to change at any time based upon market and other conditions, and Fund management disclaims any responsibility to update such views. These views may not be relied upon as investment advice or as an indication of trading intent on behalf of any Quant Fund. Any references to specific securities are not recommendations of such securities and may not be representative of any Quant Fund's current or future investments.
Past performance is no guarantee of future results, and there is no guarantee that market forecasts will be realized.
1
QUANT FUNDS
FUND EXPENSES
We believe it's important for Fund shareholders to have a clear understanding of fund ex- penses and the impact expenses have on investment returns. The following is important information about each Fund's Expense Example, which appears below.
Expense Example
As a shareholder of a Fund, you incur two types of costs: (1) transaction costs, and (2) ongoing costs, including management fees, distribution (12b-1) fees (on Ordinary Shares) and other Fund expenses. The example is intended to help you understand your ongoing costs (in dollars) of investing in a Fund and to compare these costs with the ongoing costs of investing in other mutual funds. These examples are based on $1,000 invested at the beginning of the period and held for the entire period from October 1, 2008 to March 31, 2009.
Actual Expenses and Returns
The example provides information about actual account returns and actual expenses. You may use the information in this section, together with the amount you invested, to estimate the expenses that you paid over the period. To estimate the expenses you paid over the period, simply divide your account value by $1,000, then multiply the result by the number under the heading "Expenses Paid During the Period."
Hypothetical Example for Comparison Purposes
The example shows you hypothetical account values and hypothetical expenses based on the Fund's actual expense ratio and an assumed rate of return of 5% per year before expenses, which is not the Fund's actual return.
The hypothetical account values and hypothetical expenses may not be used to estimate the actual ending account balance or expenses you paid for the period. You may use this information to compare the ongoing expenses of investing in the Fund with the ongoing expenses of other funds. To do so, compare the Fund's 5% hypothetical example with the 5% hypothetical examples that appear in the shareholder reports of other funds.
Please note that the expenses shown in the table are meant to highlight your ongoing costs. They do not reflect any transactional costs. Thus, the "hypothetical" lines in the table are useful in comparing ongoing costs only, and will not help you determine the relative costs of owning different funds. In addition, if these transactional costs were included, your costs would have been higher. See the Funds' prospectus for a complete description of these transactional costs.
2
QUANT FUNDS
Expense Example for the 6 months ended March 31, 2009
| Quant Fund | Share Class | Total Return Description | Beginning Account Value 10/01/08 | Ending Account Value 03/31/09 | Annualized Expense Ratio | Expenses Paid* 10/01/08 03/31/09 | |||||||||||||||||||||
| Small Cap | Ordinary | Actual | $ | 1,000.00 | $ | 607.30 | 1.78 | % | $ | 7.13 | |||||||||||||||||
| Hypothetical | $ | 1,000.00 | $ | 1,016.06 | 1.78 | % | $ | 8.95 | |||||||||||||||||||
| Institutional | Actual | $ | 1,000.00 | $ | 607.80 | 1.53 | % | $ | 6.13 | ||||||||||||||||||
| Hypothetical | $ | 1,000.00 | $ | 1,017.30 | 1.53 | % | $ | 7.70 | |||||||||||||||||||
| Long/Short | Ordinary | Actual | $ | 1,000.00 | $ | 683.60 | 3.10 | % | $ | 13.01 | |||||||||||||||||
| Hypothetical | $ | 1,000.00 | $ | 1,009.47 | 3.10 | % | $ | 15.53 | |||||||||||||||||||
| Institutional | Actual | $ | 1,000.00 | $ | 681.70 | 3.50 | % | $ | 14.67 | ||||||||||||||||||
| Hypothetical | $ | 1,000.00 | $ | 1,007.48 | 3.50 | % | $ | 17.52 | |||||||||||||||||||
| Emerging Markets | Ordinary | Actual | $ | 1,000.00 | $ | 666.80 | 1.82 | % | $ | 7.56 | |||||||||||||||||
| Hypothetical | $ | 1,000.00 | $ | 1,015.86 | 1.82 | % | $ | 9.15 | |||||||||||||||||||
| Institutional | Actual | $ | 1,000.00 | $ | 667.70 | 1.62 | % | $ | 6.74 | ||||||||||||||||||
| Hypothetical | $ | 1,000.00 | $ | 1,016.85 | 1.62 | % | $ | 8.15 | |||||||||||||||||||
| Foreign Value | Ordinary | Actual | $ | 1,000.00 | $ | 666.20 | 1.75 | % | $ | 7.27 | |||||||||||||||||
| Hypothetical | $ | 1,000.00 | $ | 1,016.21 | 1.75 | % | $ | 8.80 | |||||||||||||||||||
| Institutional | Actual | $ | 1,000.00 | $ | 666.80 | 1.52 | % | $ | 6.32 | ||||||||||||||||||
| Hypothetical | $ | 1,000.00 | $ | 1,017.35 | 1.52 | % | $ | 7.64 | |||||||||||||||||||
| Foreign Value | Ordinary | Actual | $ | 1,000.00 | $ | 655.30 | 2.03 | % | $ | 7.04 | |||||||||||||||||
| Small Cap | Hypothetical | $ | 1,000.00 | $ | 1,012.45 | 2.03 | % | $ | 8.56 | ||||||||||||||||||
| Institutional | Actual | $ | 1,000.00 | $ | 655.90 | 1.85 | % | $ | 6.42 | ||||||||||||||||||
| Hypothetical | $ | 1,000.00 | $ | 1,013.20 | 1.85 | % | $ | 7.81 | |||||||||||||||||||
* Expenses paid are equal to the Fund's annualized expense ratios, multiplied by the average account value over the period, multiplied by 182/365 (to reflect the one-half year period).
3
QUANT SMALL CAP FUND
INVESTMENT PROFILE
All Data as of March 31, 2009
Investment Commentary
For the 12-month period ended March 31, 2009, the Quant Small Cap Fund's Ordinary Shares (the "Fund") underperformed its benchmark, the Russell 2000 Index. The Fund achieved a return of -47.11% at net asset value compared to -37.50% for the Russell 2000 Index.
Market Conditions and Investment Strategies
It has been a trying time for investors. Seldom in history have the markets been so volatile and difficult to grasp. As expressed in our commentary last fall, this has been an unprecedented and uncharacteristic period of underperformance for the Quant Small Cap Fund. According to BAS - Merrill Lynch Research, the majority of small cap managers underperformed the benchmark index in 2008.
We hoped that the worst was behind us, but the New Year began where the Old Year ended, as the bear market persisted. The dark clouds of pessimism finally broke with the markets' capitulation in early March. A few rays of light began to shine through as consumer spending and new home sales rose in February followed by an uptick in consumer confidence. As hope emerged, the market rallied as many investors were convinced that the bottom was in. Stocks rose sharply off the lows, but not enough to overcome the damage done earlier in the year.
Our underperformance versus the Index was mainly a result of our stock selection in Health Care. Over half of our underperformance came in this sector and was primarily due to Psychiatric Solutions Inc. The company, which manages psychiatric hospitals, came under pressure after management reduced earnings guidance. Expectations were high that the business would not be economically sensitive, so there was a significant negative reaction in the stock, which fell over 50% for the year, and cost 4.5% of relative performance. Much of the remaining underperformance was attributable to our Real Estate Investment Trust (REIT) holdings which were impacted by concerns over the industry's sensitivity to the economic downturn. While we reduced our exposure to the group, we believe they remain sound investments and will rebound strongly once signs of recovery appear.
Our best sector was Telecommunication Services, where we added over 2% of relative performance, as SBA Communications Corp. gained over 20% contributing positively to performance. Dean Foods Co. and Diamond Foods Inc. were defensive staples plays in a down market and combined to add nearly 1% to relative performance. Cinema owner Regal Entertainment Group, which fell less than the Index, was also a positive contributor.
Portfolio Changes
The Consumer Discretionary, Health Care and Energy sectors declined over the past year, while Industrials, Information Technology, Consumer Staples and Materials rose in weighting. We made changes to holdings and sector emphasis during the year, but our strategy of buying high quality companies remains intact.
A Look Ahead
We believe that the monetary and fiscal stimulus being provided by the government will begin to have positive effects later in the year. The persistent negativity that has prevailed throughout this bear market has produced many attractive stock valuations that we believe will be rewarded in the longer term. Although no one can precisely identify the timing of when sentiment towards stocks will turn and be sustained, at some point the fear of being out of the market will replace the fear of being in.
Fund Information
| Net Assets Under Management | $69.2 Million | ||||||
| Number of Companies | 63 | ||||||
| Price to Book Ratio | 2.3 | ||||||
| Price to Earnings Ratio | 13.7 | ||||||
| Ordinary | Institutional | ||||||||||
| Total Expense Ratio (Net) | 1.64 | % | 1.42 | % | |||||||
| Ticker Symbol | USBNX | QBNAX | |||||||||
The Fund is co-managed by Robert von Pentz, CFA, and Rhys Williams, CFA of Columbia Partners, L.L.C. Investment Management.
4
QUANT SMALL CAP FUND
Top 10 Holdings
| Percentage of total net assets | 39.2 | % | |||||
| SBA Communications Corporation | 4.8 | % | |||||
| Regal Entertainment Group | 4.6 | % | |||||
| Dean Foods Company | 4.2 | % | |||||
| Entertainment Properties Trust | 4.2 | % | |||||
| Core Laboratories N.V. | 4.0 | % | |||||
| NICE-Systems, Ltd. | 3.9 | % | |||||
| Compass Minerals International, Inc. | 3.8 | % | |||||
| Ventas, Inc. | 3.7 | % | |||||
| Crown Castle International Corporation | 3.0 | % | |||||
| Guess?, Inc. | 3.0 | % | |||||
There is no guarantee that such securities will continue to be viewed favorably or held in the Fund's portfolio.
Sector Allocation
| Percentage of total net assets | 100.0 | % | |||||
| Industrials | 13.5 | % | |||||
| Consumer Discretionary | 10.5 | % | |||||
| Financials | 12.9 | % | |||||
| Health Care | 11.4 | % | |||||
| Information Technology | 15.0 | % | |||||
| Energy | 5.1 | % | |||||
| Telecommunication Services | 8.0 | % | |||||
| Consumer Staples | 10.4 | % | |||||
| Materials | 7.9 | % | |||||
| Utilities | 1.1 | % | |||||
| Cash and Other Assets (Net) | 4.2 | % | |||||
Value of a $10,000 Investment
Quant Small Cap (QSC) Ordinary Shares vs. Russell 2000 Index
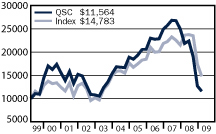
Average Annual Total Returns
| 1Q 2009 | Six Months | One Year | Five Year | Ten Year | Since Inception | Inception Date | |||||||||||||||||||||||||
| Ordinary Shares | (8.71 | )% | (39.27 | )% | (47.11 | )% | (7.24 | )% | 1.46 | % | 7.38 | % | 08/03/92 | ||||||||||||||||||
| Institutional Shares1 | (8.76 | )% | (39.22 | )% | (47.04 | )% | (6.87 | )% | 1.92 | % | 6.43 | % | 01/06/93 | ||||||||||||||||||
| Russell 20002 | (14.95 | )% | (37.16 | )% | (37.50 | )% | (5.24 | )% | 1.93 | % | 6.42 | % | |||||||||||||||||||
1 Institutional Shares may only be purchased by certain categories of investors and are not subject to sales charges or distribution fees.
2 The Russell 2000 Index is a market capitalization-weighted index of 2,000 small company stocks. It is widely recognized as representative of the general market for small company stocks. Index returns assume the reinvestment of dividends and, unlike Fund returns, do not reflect any fees or expenses. You cannot invest directly in an Index. The beginning date for the Index is 9/30/92.
Small company stocks may trade less frequently and in a limited volume, and their prices may fluctuate more than stocks of other companies. Small company stocks may therefore be more vulnerable to adverse developments than those of larger companies.
Performance data quoted represents past performance and is no guarantee of future results and the information above does not reflect the deduction of taxes that a shareholder would pay on fund distributions or the redemption of shares. Current Fund performance may be lower or higher than performance data quoted. Investment return and principal value will fluctuate so that an investor's shares, when redeemed, may be worth more or less than original cost. For the most recent month-end performance, visit the Fund's website at www.quantfunds.com. Before investing, carefully consider the Fund's investment objectives, risks, charges and expenses. For this and other information obtain the Fund's prospectus by calling (800) 326-2151 or visiting www.quantfunds.com. Please read the prosp ectus carefully before you invest.
5
QUANT LONG/SHORT FUND
INVESTMENT PROFILE
All Data as of March 31, 2009
Investment Commentary
For the 12-month period ended March 31, 2009, the Quant Long/Short Fund's Ordinary Shares (the "Fund") underperformed its benchmark, the S&P 500 Index (the "Index"). The Fund achieved a return of -41.36% at net asset value compared to - -38.09% for the Index.
Market Conditions and Investment Strategies
The Quant Long/Short Fund seeks to add value though both long and short positions, maintaining approximately 100% net equity exposure and keeping size, style, sector and beta characteristics similar to the benchmark. The Fund employs a disciplined, yet adaptive quantitative process that analyzes over 70 characteristics that impact equity returns. Analytic's approach is systematic in the way the importance of these characteristics are measured, but is also able to recognize and adapt to changes based on both the business cycle and economic conditions. The strategy primarily adds value by buying stocks with the most attractive factor profiles and shorting stocks with the least attractive factor profiles, within a set of risk constraints. Performance is therefore driven purely by the performance of the valuation model and is only minimally affected by market-wide factors.
The prior twelve months proved to be difficult for the Quant Long/Short Fund. Although the Fund began strong during the second quarter of 2008, the outperformance was quickly negated by a shift in sentiment during the starting days of the third quarter. In July, the market witnessed a strong reversal to factors that had driven performance during the second quarter. In particular, momentum factors and characteristics commonly associated with growth securities, such as Growth in Profitability and Recent EPS Growth, detracted from performance. At the same time, valuation factors were rewarded. Thematically, however, one constant remained - companies exhibiting higher quality characteristics were rewarded consistently during the period. Conversely, lower-quality characteristics were penalized as investors shied away from highly-leveraged companies and gravitated to companies with strong balance sheets.
During the fourth quarter of 2008, the valuation factors saw a mild reversal thereby hurting performance. As well, companies with higher than average Dividend Yield partook in a short term rally. Given there was a significant underexposure to the factor during the period, performance lagged. This trend, however, reversed again during much of the first quarter of 2009. Although high quality drove most of the quarter's outperformance, there was a marked trend reversal in the middle of March. The low quality rally that ensued reversed some of the gains made during the prior two months.
Portfolio Changes
During the prior twelve months ending March 31, 2009, the Fund systematically decreased exposure to securities with above average leverage levels and increased exposure to securities exhibiting high quality characteristics through strong Profit Margin, Asset Utilization, and Interest Coverage ratios. This move to higher quality companies remained consistent over the past twelve months, as investors avoided weak balance sheets and the perception of risk.
A Look Ahead
Going forward, we expect the model to continue to favor companies with above average exposures to Interest Coverage Ratio, Asset Utilization, and Recent Earnings Growth and to continue to shy away from highly-levered companies.
Fund Information
| Net Assets Under Management | $43.6 Million | ||||||
| Number of Companies | 274 | ||||||
| Price to Book Ratio | 1.2 | ||||||
| Price to Earnings Ratio | 8.1 | ||||||
| Ordinary | Institutional | ||||||||||
| Total Expense Ratio (Net) | 2.71 | % | 3.19 | % | |||||||
| Ticker Symbol | USBOX | QGIAX | |||||||||
The Fund's portfolio is managed by a team of portfolio managers at Analytic Investors, LLC. The lead portfolio managers are Harindra de Silva, Ph.D.,CFA, Dennis Bein, CFA, and Steve Sapra, CFA.
6
QUANT LONG/SHORT FUND
Top 10 Long Holdings
| Percentage of total net assets | 32.4 | % | |||||
| Exxon Mobil Corporation | 5.5 | % | |||||
| Microsoft Corporation | 4.4 | % | |||||
| Hewlett-Packard Company | 3.9 | % | |||||
| Cheveron Texaco Corporation | 3.7 | % | |||||
| Intel Corporation | 3.1 | % | |||||
| Comcast Corporation | 2.6 | % | |||||
| AmerisourceBergen Corporation | 2.4 | % | |||||
| Texas Instruments Inc. | 2.3 | % | |||||
| Corning Incorporated | 2.3 | % | |||||
| The Charles Schwab Corporation | 2.2 | % | |||||
There is no guarantee that such securities will continue to be viewed favorably or held in the Fund's portfolio.
Top 10 Short Holdings
| Percentage of total net assets | (10.5 | )% | |||||
| Pitney Bowes, Inc. | (1.5 | )% | |||||
| International Rectifier Corp. | (1.3 | )% | |||||
| Taubman Centers, Inc. | (1.1 | )% | |||||
| Jefferies Group, Inc. | (1.0 | )% | |||||
| Lam Research Corporation | (1.0 | )% | |||||
| Lazard, Ltd | (1.0 | )% | |||||
| Legg Mason, Inc. | (1.0 | )% | |||||
| AutoZone, Inc. | (0.9 | )% | |||||
| Plains Exploration & Production Company | (0.9 | )% | |||||
| ON Semiconductor Corporation | (0.8 | )% | |||||
There is no guarantee that such securities will continue to be viewed unfavorably or that such short positions will continue.
Sector Allocation
| Percentage of total net assets | 100.0 | % | |||||
| Information Technology | 26.2 | % | |||||
| Financials | 21.4 | % | |||||
| Health Care | 16.3 | % | |||||
| Energy | 15.9 | % | |||||
| Consumer Staples | 13.3 | % | |||||
| Industrials | 12.2 | % | |||||
| Consumer Discretionary | 11.4 | % | |||||
| Telecommunication Services | 4.0 | % | |||||
| Materials | 3.9 | % | |||||
| Utilities | 3.2 | % | |||||
| Cash and Other Assets (Net) | 1.4 | % | |||||
| Short Positions | (29.2 | )% | |||||
Value of a $10,000 Investment
Quant Long/Short (QLS) Ordinary Shares vs. S&P 500 Index
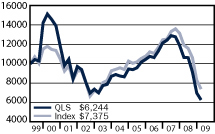
Average Annual Total Returns
| 1Q 2009 | Six Months | One Year | Five Year | Ten Year | Since Inception | Inception Date | |||||||||||||||||||||||||
| Ordinary Shares | (10.24 | )% | (31.64 | )% | (41.36 | )% | (6.80 | )% | (4.60 | )% | 7.38 | % | 05/06/85 | ||||||||||||||||||
| Institutional Shares1 | (10.39 | )% | (31.83 | )% | (41.66 | )% | (6.64 | )% | (4.27 | )% | 5.02 | % | 03/25/91 | ||||||||||||||||||
| S & P 5002 | (11.01 | )% | (30.54 | )% | (38.09 | )% | (4.76 | )% | (3.00 | )% | 8.80 | % | |||||||||||||||||||
1 Institutional Shares may only be purchased by certain categories of investors and are not subject to sales charges or distribution fees.
2 The S&P 500 Index is an unmanaged index of stocks chosen to their size industry characteristics. It is widely recognized as representative of stocks in the United States. Index returns assume the reinvestment of dividends and, unlike Fund returns, do not reflect any fees or expenses. You cannot invest directly in the Index. The beginning date for the Index is 06/30/85.
Short selling involves certain risks including the possibility that short positions do not limit the Fund's stock market exposure as expected, that the future value of a short position increases above its recorded value potentially resulting in an unlimited loss and that the lender of a security sold short could terminate the loan at a price or time that is disadvantageous to the Fund.
Performance data quoted represents past performance and is no guarantee of future results and the information above does not reflect the deduction of taxes that a shareholder would pay on fund distributions or the redemption of shares. Current Fund performance may be lower or higher than performance data quoted. Investment return and principal value will fluctuate so that an investor's shares, when redeemed, may be worth more or less than original cost. For the most recent month-end performance, visit the Fund's website at www.quantfunds.com. Before investing, carefully consider the Fund's investment objectives, risks, charges and expenses. For this and other information obtain the Fund's prospectus by calling (800) 326-2151 or visiting www.quantfunds.com. Please read the prosp ectus carefully before you invest.
7
QUANT EMERGING MARKETS FUND
INVESTMENT PROFILE
All Data as of March 31, 2009
Investment Commentary
For the 12-month period ended March 31, 2009, the Quant Quant Emerging Markets Fund's Ordinary Shares (the "Fund") un- derperformed its benchmark, the MSCI Emerging Markets Index (the "Index"). The Fund produced a return of -53.27% at net asset value compared to -46.9% for the Index.
Market Conditions and Investment Strategies
On a sector basis, portfolio underperformance was largely due to security selection in Industrials (-14.9%), Materials (-14.2%), and Energy (-.86%). Sectors that contributed to relative portfolio value were Financials (+.13%) and Consumer Discretionary (+.10%). On a country basis, positions held in China (-17.4%), South Korea (-12.6%), and Taiwan (-.68%) were the largest detractors. Positions held in India (+.38%) and the United States (+11.7%) contributed.
Portfolio Changes
In February 2009, The Quant Emerging Markets Fund transitioned from the 4 factor PanAgora Emerging Markets Stock Selector strategy to the PanAgora Dynamic Emerging Markets strategy. The Dynamic investment process uses a contextual modeling approach that integrates multiple sources of excess return (alpha) within multi-factor models to develop individual return forecasts for all securities in the investable universe.
A Look Ahead
With the emerging markets equities rallying off its lows set back in mid-November, there should be some concern as to the sustainability of the current rally. Investors need to be asking themselves whether we have indeed found the lows for the markets and have seen the end of one of the worst bear markets since the 1930s; or if we are simply in the midst of bear market rally with some legs to it. A bear market rally with legs refers to a bear market rally that can last a considerable amount of time longer and return a considerable amount more than a typical rally. How investors should position their portfolios must be predicated on the answer to this question.
The bear market rally with legs scenario may be supported by the flows into emerging markets over the last four weeks. These are assets that had been on the sidelines and are now being put to work. One recent survey showed that fund managers have increased their global expectations and risk appetite. A macroeconomic driver that often leads to the next bull market (national highway network - 1950s, space program - 1960s, tech-induced productivity gains - 1990s) is not apparent. Finally, the economic underpinnings for a sustained bull market are not in place that would signify a true bottom.
It is important to remember that with bear market rallies comes the eventual test of the lows. Investors need to keep an eye towards this and position their portfolios appropriately. China will likely continue to be the most favored country for investors in the near term as the $600 billion stimulus package continues to work its way into the economy. Material and energy suppliers like Brazil and Russia will benefit from growth surprises from China.
Fund Information
| Net Assets Under Management | $189.8 Million | ||||||
| Number of Companies | 139 | ||||||
| Price to Book Ratio | 1.3 | ||||||
| Price to Earnings Ratio | 8.1 | ||||||
| Ordinary | Institutional | ||||||||||
| Total Expense Ratio (Net) | 1.67 | % | 1.48 | % | |||||||
| Ticker Symbol | QFFOX | QEMAX | |||||||||
The Fund's portfolio is managed by a team of portfolio managers at PanAgora Asset Management, Inc.
8
QUANT EMERGING MARKETS FUND
Top 10 Long Holdings
| Percentage of total net assets | 25.4 | % | |||||
| China Mobile Limited | 3.0 | % | |||||
| Gazprom | 3.0 | % | |||||
| Samsung Electronics Co., Ltd. | 2.9 | % | |||||
| Quanta Computer | 2.7 | % | |||||
| Posco | 2.6 | % | |||||
| CNOOC Limited | 2.4 | % | |||||
| Teva Pharmacutical Industries Ltd. | 2.3 | % | |||||
| PetroChina Company Limited | 2.2 | % | |||||
| China Construction Bank Corporation | 2.2 | % | |||||
| China Petroleum & Chemical Corporation | 2.1 | % | |||||
There is no guarantee that such securities will continue to be viewed favorably or held in the Fund's portfolio.
Sector Allocation
| Percentage of total net assets | 100.0 | % | |||||
| Financials | 18.5 | % | |||||
| Energy | 17.3 | % | |||||
| Materials | 14.0 | % | |||||
| Telecommunication Services | 13.1 | % | |||||
| Information Technology | 10.8 | % | |||||
| Industrial | 9.4 | % | |||||
| Consumer Staples | 5.9 | % | |||||
| Utilities | 5.6 | % | |||||
| Healthcare | 3.1 | % | |||||
| Consumer Discretionary | 2.3 | % | |||||
Top 10 Country Allocations
| Percentage of total net assets | 91.4 | % | |||||
| China | 20.0 | % | |||||
| South Korea | 16.8 | % | |||||
| Brazil | 15.0 | % | |||||
| Taiwan | 11.1 | % | |||||
| South Africa | 7.1 | % | |||||
| Russia | 6.2 | % | |||||
| Israel | 5.4 | % | |||||
| Malaysia | 4.1 | % | |||||
| Mexico | 2.9 | % | |||||
| Thailand | 2.8 | % | |||||
Value of a $10,000 Investment
Quant Emerging Markets (QEM) Ordinary Shares vs. MSCI EM Index
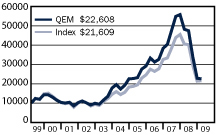
Average Annual Total Returns
| 1Q 2009 | Six Months | One Year | Five Year | Ten Year | Since Inception | Inception Date | |||||||||||||||||||||||||
| Ordinary Shares | (1.04 | )% | (33.32 | )% | (53.27 | )% | 2.86 | % | 8.50 | % | 3.10 | % | 09/30/94 | ||||||||||||||||||
| Institutional Shares1 | (1.02 | )% | (33.23 | )% | (53.17 | )% | 3.19 | % | 8.95 | % | 4.99 | % | 04/02/96 | ||||||||||||||||||
| MSCI EM2 | 1.02 | % | (26.82 | )% | (46.90 | )% | 6.25 | % | 8.14 | % | 2.33 | % | |||||||||||||||||||
1 Institutional Shares may only be purchased by certain categories of investors and are not subject to sales charges or distribution fees.
2 The Morgan Stanley Capital International Emerging Markets ("MSCI EM") Index is an unmanaged index comprised of stocks located in countries other than the United States. It is widely recognized as representative of the general market for emerging markets. Index returns assume the reinvestment of dividends and, unlike Fund returns, do not reflect fees or expenses. You cannot invest directly in an Index. The beginning date for the Index is 06/30/85.
Investing in foreign markets, particularly emerging markets, can be more volatile than the U.S. market due to increased risks of adverse issuer, political, regulatory, market or economic developments and can perform differently than the U.S. market.
Performance data quoted represents past performance and is no guarantee of future results and the information above does not reflect the deduction of taxes that a shareholder would pay on fund distributions or the redemption of shares. Current Fund performance may be lower or higher than performance data quoted. Investment return and principal value will fluctuate so that an investor's shares, when redeemed, may be worth more or less than original cost. For the most recent month-end performance, visit the Fund's website at www.quantfunds.com. Before investing, carefully consider the Fund's investment objectives, risks, charges and expenses. For this and other information obtain the Fund's prospectus by calling (800) 326-2151 or visiting www.quantfunds.com. Please read the prosp ectus carefully before you invest.
9
QUANT FOREIGN VALUE FUND
INVESTMENT PROFILE
All Data as of March 31, 2009
Investment Commentary
For the 12-month period ended March 31, 2009, the Quant Foreign Value Fund's Ordinary Shares (the "Fund") underperformed its benchmark, the Morgan Stanley Capital International Europe, Australasia, Far East Index (the "Index"). The Fund achieved a return of -55.95% at net asset value compared to -46.20% for the Index.
Market Conditions and Investment Strategies
Market volatility, endemic to most of 2008, followed course in the first quarter of 2009, backed mainly by concerns in the financial sector. Discussions about bank nationalization and constricted credit contributed to declines in all bank stocks, regardless of fundamentals. The Fund's management cut back on financials due to dilution that may be accompanied by additional capital injections by governments. However, the Fund remained focused on fundamentally strong smaller community banks; historically, when markets are recovering, smaller banks can rebound substantially.
Credit concerns permeated other sectors that rely on global trade and infrastructure financing, namely industrials and materials. Industrials, uncertain about future product demand and mispriced due to pessimistic market perception, continued to suffer. While many of the Fund's industrials had weak performance, meetings with some of these companies suggested that fundamentals were resilient. In fact, a number of the weakest performers more recently reported strong results.
Stocks in the materials sector remained soft worldwide, trading in-line with macro-economic conditions. To counterbalance general sector weakness, the Fund held materials companies that are low cost producers. These select companies continued to generate cash, while competitors lost money and/or closed operations - laying the foundation for a possible rebound when the economy recovers.
The portfolio experienced sector outperformance versus some of MSCI World Index sector benchmarks during the year. Defensive sectors, comprised of utilities, telecommunications and information technology, proved to be low risk stocks that buffered market and portfolio volatility.
Portfolio Changes
During the year, Fund management trimmed holdings in financials, Japanese domestic-oriented stocks and a few materials and industrials, where analysis revealed deterioration in fundamentals in relation to evolving market dynamics. By executing sells, management was able to improve the valuation of the portfolio and reduce exposure in some sectors that may experience further weakness. Preservation of capital remains a top priority in the current strategy.
A Look Ahead
During the year, Fund management made portfolio changes, selling stocks where future prospects may jeopardize cash flow. Management remains vigilant in their research effort, as ever-changing market dynamics and increased unemployment point to continued volatility. There are early indications that the economy is flattening out in certain sectors, yet the overall economy is not likely to recover until unemployment figures begin to level off or improve.
Fund management is being conservative in portfolio strategy, carefully scrutinizing new buying opportunities and deploying cash during periods of extreme market weakness, when quality companies can be bought at low valuations.
We remain confident that the Fund's investment philosophy, discipline and current strategy result in investments that should be fundamentally sound in the current economic crisis. Growing evidence indicates that portfolio companies with healthy cash flows and manageable debt levels may gain strength as the credit crisis persists and competitors struggle or fail. When the markets normalize, the portfolio should be well situated with admirably performing companies.
Fund Information
| Net Assets Under Management | $240.9 Million | ||||||
| Number of Companies | 51 | ||||||
| Price to Book Ratio | 0.9 | ||||||
| Price to Earnings Ratio | 6.0 | ||||||
| Ordinary | Institutional | ||||||||||
| Total Expense Ratio (Net) | 1.62 | % | 1.38 | % | |||||||
| Ticker Symbol | QFVOX | QFVIX | |||||||||
The Fund's lead portfolio manager is Bernard R. Horn, Jr., of Polaris Capital Management, LLC
10
QUANT FOREIGN VALUE FUND
Top 10 Holdings
| Percentage of total net assets | 34.1 | % | |||||
| Bellway PLC | 5.1 | % | |||||
| Samsung Electronics Company Ltd. | 4.1 | % | |||||
| Persimmon PLC | 3.4 | % | |||||
| CRH PLC | 3.3 | % | |||||
| Kone Corporation OYJ-B | 3.2 | % | |||||
| BHP Billiton Ltd. | 3.1 | % | |||||
| Andritz AG | 3.1 | % | |||||
| SK Telecom Company Ltd. | 3.0 | % | |||||
| Sasol Ltd. | 2.9 | % | |||||
| Christian Dior S.A. | 2.9 | % | |||||
There is no guarantee that such securities will continue to be viewed favorably or held in the Fund's portfolio.
Top 10 Country Allocations
| Percentage of total net assets | 82.3 | % | |||||
| Japan | 16.5 | % | |||||
| United Kingdom | 13.1 | % | |||||
| Germany | 10.1 | % | |||||
| Finland | 9.1 | % | |||||
| Ireland | 7.7 | % | |||||
| South Korea | 7.1 | % | |||||
| France | 6.7 | % | |||||
| Sweden | 5.7 | % | |||||
| South Africa | 3.2 | % | |||||
| Australia | 3.1 | % | |||||
Sector Allocation
| Percentage of total net assets | 100.0 | % | |||||
| Industrials | 21.6 | % | |||||
| Materials | 21.3 | % | |||||
| Consumer Discretionary | 19.3 | % | |||||
| Financials | 11.2 | % | |||||
| Energy | 7.8 | % | |||||
| Consumer Staples | 5.7 | % | |||||
| Telecommunications Services | 4.9 | % | |||||
| Information Technology | 4.2 | % | |||||
| Utilities | 4.0 | % | |||||
Value of a $10,000 Investment
Quant Foreign Value (QFV) Ordinary Shares vs. MSCI EAFE Index

Average Annual Total Returns
| 1Q 2009 | Six Months | One Year | Five Year | Ten Year | Since Inception | Inception Date | |||||||||||||||||||||||||
| Ordinary Shares | (9.32 | )% | (33.38 | )% | (55.95 | )% | (5.54 | )% | 2.52 | % | 0.67 | % | 05/15/98 | ||||||||||||||||||
| Institutional Shares1 | (9.31 | )% | (33.32 | )% | (55.85 | )% | (5.30 | )% | 2.76 | % | 2.61 | % | 12/18/98 | ||||||||||||||||||
| MSCI EAFE2 | (13.85 | )% | (31.00 | )% | (46.20 | )% | (1.75 | )% | (0.47 | )% | 0.11 | % | |||||||||||||||||||
1 Institutional Shares may only be purchased by certain categories of investors and are not subject to sales charges or distribution fees.
2 The Morgan Stanley Capital International Europe, Australasia, and Far East ("MSCI EAFE") Index is an unmanaged index comprised of stocks located in countries other than the United States. It is widely recognized as representative of the general market for foreign markets. Index returns assume the reinvestment of dividends and, unlike Fund returns, do not reflect fees or expenses. You cannot invest directly in an Index. The beginning date for the Index is 05/29/98.
Investing in foreign markets, particularly emerging markets, can be more volatile than the U.S. market due to increased risks of adverse issuer, political, regulatory, market or economic developments and can perform differently than the U.S. market.
Performance data quoted represents past performance and is no guarantee of future results and the information above does not reflect the deduction of taxes that a shareholder would pay on fund distributions or the redemption of shares. Current Fund performance may be lower or higher than performance data quoted. Investment return and principal value will fluctuate so that an investor's shares, when redeemed, may be worth more or less than original cost. For the most recent month-end performance, visit the Fund's website at www.quantfunds.com. Before investing, carefully consider the Fund's investment objectives, risks, charges and expenses. For this and other information obtain the Fund's prospectus by calling (800) 326-2151 or visiting www.quantfunds.com. Please read the prosp ectus carefully before you invest.
11
QUANT FOREIGN VALUE SMALL CAP FUND
INVESTMENT PROFILE
All Data as of March 31, 2009
Investment Commentary
The Quant Foreign Value Small Cap Fund commenced operations on May 1, 2008. For the eleven month period ended March 31, 2009, the Fund's Ordinary Shares (the "Fund") yielded a return of -51.25% at net asset value compared to a return of - -50.18% for the S&P/Citigroup EPAC Small Cap Index ("the Index")
Market Conditions and Investment Strategies
World economic conditions deteriorated sharply during the first eleven months of the fund's history. The difficulties faced initially by United States lenders to sub-prime mortgage borrowers spread throughout the world and resulted in the worst financial crisis since the 1930s. Virtually every industrial sector and stock market in the world declined sharply, and most non US markets under-performed the US market. The markets have been indiscriminate with both large and small and value and growth oriented companies being punished. There were a number of other negative influences on performance. The portfolio has had a large exposure to the Industrial sector that was under particular pressure. Collectively, portfolio holdings within this sector under performed with Bobst, a Swiss machinery producer, and Italian foundation and construction contractor Trevi Finazieria particularly hard hit. The Financial sector, reflecting the full f orce of the crisis, also declined sharply. A depreciating Russian bank investment was one of the poorer portfolio performers.
One successful tactic was to hold a cash reserve in anticipation of lower common stock prices as economic conditions deteriorated. In addition, stock selections in the Consumer Discretionary sector outperformed, led by a Japanese entertainment retailer, Culture Convenience Club. The Energy sector was under more pressure than any single sector as oil prices plummeted. Fortunately the portfolio had a small exposure to this sector and the Chinese portfolio holding Sinopec Kantons (petrochemical trading) was one of the few holdings to appreciate.
Portfolio Changes
Portfolio transactions during this first eleven months of operation primarily involved making the 52 individual initial portfolio investments by September 30, 2008. In addition, temporary investments were made in the two value oriented international small cap exchange traded funds (ETFs) while research on new holdings was being completed. Subsequent investments included Glanbia, an Irish producer of dairy products, and Healthcare Locums, a specialist healthcare recruitment business based in the UK. Five common stocks, Heidelberger Druckmaschinen, Makino Milling Machine, Salcomp, Marazzi Group and Uponor, were subsequently sold. Marazzi was acquired, but the other four were sold because their cash flows were especially vulnerable to the deteriorating business environment.
A Look Ahead
Fund management will continue to seek out and hold investments that we believe represent exceptional value as stock prices return to a more rational equilibrium. The Fund's philosophy remains steadfast: invest in companies that generate considerable free cash flow relative to the market value of the company. In an economic environment where credit is constrained, those companies with strong cash flow and low or manageable debt should be well positioned to not only survive the current downturn, but to prosper during a recovery.
Fund Information
| Net Assets Under Management | $22.6 Million | ||||||
| Number of Companies | 51 | ||||||
| Price to Book Ratio | 0.8 | ||||||
| Price to Earnings Ratio | 5.7 | ||||||
| Ordinary | Institutional | ||||||||||
| Total Expense Ratio (Net) | 1.97 | % | 1.85 | % | |||||||
| Ticker Symbol | QUSOX | QUSIX | |||||||||
The Fund's lead portfolio manager is Bernard R. Horn, Jr., of Polaris Capital Management, LLC
12
QUANT FOREIGN VALUE SMALL CAP FUND
Top 10 Holdings
| Percentage of total net assets | 22.6 | % | |||||
| CSR plc | 2.3 | % | |||||
| SpareBank 1 Nord-Norge | 2.3 | % | |||||
| Usha Martin Group | 2.3 | % | |||||
| Healthcare Locums plc | 2.3 | % | |||||
| NagaCorp | 2.3 | % | |||||
| Galliford Try | 2.3 | % | |||||
| Sichuan Xinhua Winshare Chainstore Co., Ltd. | 2.2 | % | |||||
| Sinopec Kantons Holdings Limited | 2.2 | % | |||||
| New Clicks Holdings | 2.2 | % | |||||
| Austal Limited | 2.2 | % | |||||
There is no guarantee that such securities will continue to be viewed favorably or held in the Fund's portfolio.
Sector Allocation
| Percentage of total net assets | 100.0 | % | |||||
| Industrials | 23.6 | % | |||||
| Consumer Discretionary | 21.8 | % | |||||
| Financials | 15.9 | % | |||||
| Information Technology | 13.1 | % | |||||
| Consumer Staples | 11.8 | % | |||||
| Materials | 4.4 | % | |||||
| Exchange Traded Funds | 4.3 | % | |||||
| Heatlh Care | 3.3 | % | |||||
| Telecommunication Services | 1.8 | % | |||||
Top 10 Country Allocations
| Percentage of total net assets | 77.0 | % | |||||
| United Kingdom | 22.0 | % | |||||
| China | 10.7 | % | |||||
| India | 10.0 | % | |||||
| Norway | 6.1 | % | |||||
| Sweden | 5.9 | % | |||||
| Ireland | 5.8 | % | |||||
| Japan | 5.3 | % | |||||
| Italy | 3.8 | % | |||||
| Switzerland | 3.7 | % | |||||
| Singapore | 3.7 | % | |||||
Value of a $10,000 Investment
Quant Foreign Value Small Cap (QFVSC) Ordinary Shares vs. EPAC EMI Index
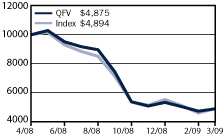
Average Annual Total Returns
| 1Q 2009 | Six Months | One Year | Five Year | Ten Year | Since Inception | Inception Date | |||||||||||||||||||||||||
| Ordinary Shares | (8.37 | )% | (34.47 | )% | (51.25 | )% | 05/01/08 | ||||||||||||||||||||||||
| Institutional Shares1 | (8.37 | )% | (34.41 | )% | (51.20 | )% | 05/01/08 | ||||||||||||||||||||||||
| S&P/EPAC Small Cap Index | (11.36 | )% | (31.42 | )% | (50.18 | )% | |||||||||||||||||||||||||
1 Institutional Shares may only be purchased by certain categories of investors and are not subject to sales charges or distribution fees.
2 The S&P/Citigroup Extended Market Europe Pacific Asia Composite ( "S&P/Citigroup EMI EPAC") Index measures the bottom 20% of institutionary investable capital of developed and emerging (after 09/30/1994) countries, selected by the index sponsor outside of the United States. It is widely recognized as representative of the general market for foreign markets. Index returns assume the reinvestment of dividends and, unlike Fund returns, do no reflect any fees or expenses. You cannot invest directly in an Index. The Index was established in 1989.
Investing in foreign markets, particularly emerging markets, can be more volatile than the U.S. market due to increased risks of adverse issuer, political, regulatory, market or economic developments and can perform differently than the U.S. market.
Performance data quoted represents past performance and is no guarantee of future results and the information above does not reflect the deduction of taxes that a shareholder would pay on fund distributions or the redemption of shares. Current Fund performance may be lower or higher than performance data quoted. Investment return and principal value will fluctuate so that an investor's shares, when redeemed, may be worth more or less than original cost. For the most recent month-end performance, visit the Fund's website at www.quantfunds.com. Before investing, carefully consider the Fund's investment objectives, risks, charges and expenses. For this and other information obtain the Fund's prospectus by calling (800) 326-2151 or visiting www.quantfunds.com. Please read the prosp ectus carefully before you invest.
13
QUANT SMALL CAP FUND
SCHEDULE OF INVESTMENTS
March 31, 2009
| Common Stock -95.8% | |||||||||||
| Shares | Value | ||||||||||
| BANKS-0.8% | |||||||||||
| CoBiz Financial, Inc. | 29,069 | $ | 152,612 | ||||||||
| Pinnacle Financial Partners, Inc. (a) | 9,559 | 226,644 | |||||||||
| UCBH Holdings, Inc. (b) | 47,591 | 71,862 | |||||||||
| Wintrust Financial Corporation | 8,433 | 103,726 | |||||||||
| 554,844 | |||||||||||
| BIOTECHNOLOGY-1.2% | |||||||||||
| Kendle International, Inc. (a) | 17,841 | 373,947 | |||||||||
| Sequenom, Inc. (a)(b) | 33,208 | 472,218 | |||||||||
| 846,165 | |||||||||||
| CHEMICALS-1.0% | |||||||||||
| LSB Industries, Inc. (a)(b) | 66,742 | 660,078 | |||||||||
| COMMERCIAL SERVICES & SUPPLIES-7.8% | |||||||||||
| Clean Harbors, Inc. (a) | 21,031 | 1,009,488 | |||||||||
| FTI Consulting, Inc. (a) | 28,736 | 1,421,857 | |||||||||
| Kforce, Inc. (a) | 99,449 | 699,127 | |||||||||
| Waste Connections, Inc. (a) | 59,567 | 1,530,872 | |||||||||
| Watson Wyatt Worldwide, Inc. | 14,879 | 734,576 | |||||||||
| 5,395,920 | |||||||||||
| COMMUNICATIONS EQUIPMENT-4.0% | |||||||||||
| NICE-Systems, Ltd. (a)(b)(c) | 109,907 | 2,732,288 | |||||||||
| CONTAINERS & PACKAGING-3.1% | |||||||||||
| Silgan Holdings, Inc. | 28,574 | 1,501,278 | |||||||||
| Sonoco Products Company | 31,908 | 669,430 | |||||||||
| 2,170,708 | |||||||||||
| DIVERSIFIED COMMUNICATION SERVICES-0.3% | |||||||||||
| Hughes Communications, Inc. (a) | 18,882 | 227,150 | |||||||||
| ELECTRIC UTILITIES-1.1% | |||||||||||
| Ormat Technologies, Inc. | 26,800 | 735,928 | |||||||||
| ELECTRICAL EQUIPMENT-1.1% | |||||||||||
| American Superconductor Corporation (a) | 41,596 | 720,027 | |||||||||
| ENERGY EQUIPMENT & SERVICES-4.0% | |||||||||||
| Core Laboratories N.V. | 37,548 | 2,747,012 | |||||||||
| FOOD PRODUCTS-10.4% | |||||||||||
| Dean Foods Company (a) | 160,044 | 2,893,595 | |||||||||
| Diamond Foods, Inc. | 63,116 | 1,762,830 | |||||||||
| The Hain Celestial Group, Inc. (a)(b) | 37,353 | 531,907 | |||||||||
| Smart Balance, Inc. (a) | 20,334 | 122,817 | |||||||||
The accompanying notes are an integral part of these financial statements.
14
QUANT SMALL CAP FUND
SCHEDULE OF INVESTMENTS (continued)
March 31, 2009
| Shares | Value | ||||||||||
| FOOD PRODUCTS (continued) | |||||||||||
| United Natural Foods, Inc. (a)(b) | 101,033 | $ | 1,916,596 | ||||||||
| 7,227,745 | |||||||||||
| HEALTH CARE EQUIPMENT & SERVICES-8.9% | |||||||||||
| Haemonetics Corporation (a) | 13,233 | 728,874 | |||||||||
| inVentiv Health, Inc. (a) | 62,408 | 509,249 | |||||||||
| Omnicell, Inc. (a) | 122,079 | 954,658 | |||||||||
| Psychiatric Solutions, Inc. (a) | 39,692 | 624,355 | |||||||||
| Schein (Henry), Inc. (a)(b) | 31,602 | 1,264,396 | |||||||||
| Universal Health Services, Inc. | 22,092 | 847,007 | |||||||||
| Varian Medical Systems, Inc. (a) | 12,350 | 293,189 | |||||||||
| ZOLL Medical Corporation (a) | 66,266 | 951,580 | |||||||||
| 6,173,308 | |||||||||||
| HOTELS, RESTAURANTS & LEISURE-1.6% | |||||||||||
| California Pizza Kitchen, Inc. (a) | 32,292 | 422,380 | |||||||||
| Royal Caribbean Cruises Ltd. | 84,830 | 679,488 | |||||||||
| 1,101,868 | |||||||||||
| INSURANCE-2.5% | |||||||||||
| Aspen Insurance Holdings Limited | 30,280 | 680,089 | |||||||||
| Brown & Brown, Inc. | 56,036 | 1,059,641 | |||||||||
| 1,739,730 | |||||||||||
| MACHINERY-4.6% | |||||||||||
| ESCO Technologies, Inc. (a) | 30,874 | 1,194,824 | |||||||||
| Gardner Denver, Inc. (a) | 50,072 | 1,088,565 | |||||||||
| Harsco Corporation (b) | 41,491 | 919,855 | |||||||||
| 3,203,244 | |||||||||||
| MEDIA-5.2% | |||||||||||
| Entercom Communications Corporation | 9,204 | 10,124 | |||||||||
| Lions Gate Entertainment Corporation (a) | 92,720 | 468,236 | |||||||||
| Regal Entertainment Group | 235,987 | 3,164,586 | |||||||||
| 3,642,946 | |||||||||||
| METALS & MINING-3.8% | |||||||||||
| Compass Minerals International, Inc. | 46,473 | 2,619,683 | |||||||||
| OIL & GAS-1.1% | |||||||||||
| Natural Gas Services Group, Inc. (a) | 90,373 | 813,357 | |||||||||
| PHARMACEUTICALS-1.3% | |||||||||||
| Par Pharmaceutical Companies, Inc. (a)(b) | 89,788 | 850,292 | |||||||||
The accompanying notes are an integral part of these financial statements.
15
QUANT SMALL CAP FUND
SCHEDULE OF INVESTMENTS (continued)
March 31, 2009
| Shares | Value | ||||||||||
| REAL ESTATE-9.6% | |||||||||||
| AMB Property Corporation (b) | 29,209 | $ | 420,610 | ||||||||
| Entertainment Properties Trust | 183,183 | 2,886,964 | |||||||||
| Hersha Hospitality Trust | 396,983 | 754,267 | |||||||||
| Ventas, Inc. (b) | 114,272 | 2,583,690 | |||||||||
| 6,645,531 | |||||||||||
| RETAILING-3.7% | |||||||||||
| GUESS?, Inc. | 98,047 | 2,066,831 | |||||||||
| Urban Outfitters, Inc. (a) | 29,077 | 475,991 | |||||||||
| 2,542,822 | |||||||||||
| SOFTWARE & SERVICES-10.7% | |||||||||||
| Acacia Research (a) | 126,290 | 515,263 | |||||||||
| Alliance Data Systems Corporation (a)(b) | 42,296 | 1,562,837 | |||||||||
| Blackboard, Inc. (a)(b) | 62,799 | 1,993,240 | |||||||||
| Constant Contact, Inc. (a) | 48,493 | 678,417 | |||||||||
| Internet Capital Group, Inc. (a) | 158,699 | 639,557 | |||||||||
| STEC, Inc. (a) | 56,403 | 415,690 | |||||||||
| Synaptics Incorporated (a)(b) | 19,921 | 533,086 | |||||||||
| Ulticom, Inc. (a)(b) | 163,473 | 899,102 | |||||||||
| Verint Systems, Inc. (a)(b) | 54,161 | 189,564 | |||||||||
| 7,426,756 | |||||||||||
| TELECOMMUNICATION SERVICES-0.2% | |||||||||||
| Atlantic Tele-Network, Inc. | 8,799 | 168,765 | |||||||||
| WIRELESS TELECOMMUNICATION SERVICES-7.8% | |||||||||||
| Crown Castle International Corporation (a) | 101,875 | 2,079,269 | |||||||||
| SBA Communications Corporation (a) | 141,175 | 3,289,378 | |||||||||
| 5,368,647 | |||||||||||
| TOTAL COMMON STOCK (Cost $89,526,860) | 66,314,814 | ||||||||||
| Short Term Investments-4.6% | |||||||||||
| Par Value | Value | ||||||||||
| State Street Bank & Trust Co., Repurchase Agreement 0.01%, 4/01/09, (Dated 3/31/09), Collateralized by $3,245,000 par U.S. Treasury Bill-zero coupon due 9/10/09, Market Value $3,239,808, Repurchase Proceeds $3,172,001 (Cost $3,172,000) | $ | 3,172,000 | $ | 3,172,000 | |||||||
The accompanying notes are an integral part of these financial statements.
16
QUANT SMALL CAP FUND
SCHEDULE OF INVESTMENTS (continued)
March 31, 2009
| Par Value | Value | ||||||||||
| TOTAL INVESTMENTS (EXCLUDING INVESTMENTS PURCHASED WITH CASH COLLATERAL FROM SECURITIES LOANED)-100.4% (Cost $92,698,860) | $ | 69,486,814 | |||||||||
| INVESTMENTS PURCHASED WITH CASH COLLATERAL FROM SECURITIES LOANED-9.6% | |||||||||||
| Money Market-9.6% | |||||||||||
| JP Morgan Prime Money Market Fund-Inst. (Cost $6,611,099) | $ | 6,611,099 | 6,611,099 | ||||||||
| TOTAL INVESTMENTS-110.0% (d) (Cost $99,309,959) | 76,097,913 | ||||||||||
| OTHER ASSETS & LIABILITIES (NET)-(10.0%) | (6,873,949 | ) | |||||||||
| NET ASSETS-100% | $ | 69,223,964 | |||||||||
(a) Non-income producing security
(b) All or a portion of this security was out on loan.
(c) ADR-American Depositary Receipts
(d) At March 31, 2009, the unrealized appreciation of investments based on
aggregate cost for federal tax purposes of $99,963,860 was as follows:
| Aggregate gross unrealized appreciation for all investments in which there is an excess of value over tax cost | $ | 1,752,081 | |||||
| Aggregate gross unrealized depreciation for all investments in which there is an excess of tax cost over value | (25,618,028 | ) | |||||
| Net unrealized appreciation/(depreciation) | $ | (23,865,947 | ) | ||||
The percentage of each investment category is calculated as a percentage of net assets.
The accompanying notes are an integral part of these financial statements.
17
QUANT LONG/SHORT FUND
SCHEDULE OF INVESTMENTS
March 31, 2009
| Common Stock-98.5% | |||||||||||
| Long Positions-127.8% | |||||||||||
| Shares | Value | ||||||||||
| AEROSPACE & DEFENSE-2.3% | |||||||||||
| General Dynamics Corporation (b) | 3,873 | $ | 161,078 | ||||||||
| Lockheed Martin Corporation (b) | 7,115 | 491,149 | |||||||||
| Raytheon Company (b) | 9,244 | 359,961 | |||||||||
| 1,012,188 | |||||||||||
| AIRLINES-0.7% | |||||||||||
| Southwest Airlines Co. (b) | 50,590 | 320,235 | |||||||||
| AUTOMOBILES-0.7% | |||||||||||
| Federal-Mogul Corporation (a)(b) | 6,806 | 45,464 | |||||||||
| Ford Motor Company (a)(b) | 94,348 | 248,135 | |||||||||
| WABCO Holdings Inc. (b) | 2,237 | 27,538 | |||||||||
| 321,137 | |||||||||||
| BANKS-7.5% | |||||||||||
| BancorpSouth, Inc. (b) | 2,351 | 48,995 | |||||||||
| Bank of America Corporation (b) | 60,787 | 414,567 | |||||||||
| Bank of Hawaii Corporation (b) | 1,514 | 49,932 | |||||||||
| BB&T Corporation (b) | 13,713 | 232,024 | |||||||||
| BOK Financial Corporation (b) | 317 | 10,952 | |||||||||
| Hudson City Bancorp, Inc. | 6,124 | 71,590 | |||||||||
| MBIA, Inc. (a)(b) | 28,786 | 131,840 | |||||||||
| Northern Trust Corporation (b) | 9,565 | 572,178 | |||||||||
| SunTrust Banks, Inc. | 15,825 | 185,786 | |||||||||
| TFS Financial Corporation (b) | 31,073 | 376,915 | |||||||||
| The Bank of New York Mellon Corporation (b) | 25,449 | 718,934 | |||||||||
| U.S. Bancorp (b) | 26,718 | 390,350 | |||||||||
| Wells Fargo & Company (b) | 5,988 | 85,269 | |||||||||
| 3,289,332 | |||||||||||
| BEVERAGES-0.3% | |||||||||||
| Brown-Forman Corporation (b) | 3,443 | 133,692 | |||||||||
| BIOTECHNOLOGY-1.2% | |||||||||||
| Gilead Sciences, Inc. (a)(b) | 10,971 | 508,177 | |||||||||
| CHEMICALS-3.6% | |||||||||||
| Ashland, Inc. (b) | 70,263 | 725,817 | |||||||||
| E. I. du Pont de Nemours and Company (b) | 13,812 | 308,422 | |||||||||
| Ecolab, Inc. (b) | 8,764 | 304,374 | |||||||||
| Monsanto Company (b) | 856 | 71,134 | |||||||||
| Rohm and Haas Company (b) | 260 | 20,498 | |||||||||
| Terra Industries, Inc., (b) | 2,354 | 66,124 | |||||||||
| The Dow Chemical Company (b) | 5,700 | 48,051 | |||||||||
The accompanying notes are an integral part of these financial statements.
18
QUANT LONG/SHORT FUND
SCHEDULE OF INVESTMENTS (continued)
March 31, 2009
| Shares | Value | ||||||||||
| CHEMICALS (continued) | |||||||||||
| The Mosaic Company | 472 | $ | 19,814 | ||||||||
| 1,564,234 | |||||||||||
| COMMERCIAL SERVICES AND SUPPLIES-1.8% | |||||||||||
| C.H. Robinson Worldwide, Inc. (b) | 10,683 | 487,252 | |||||||||
| Cree, Inc. (a)(b) | 8,306 | 195,440 | |||||||||
| Genpact Limited (a)(b) | 905 | 8,018 | |||||||||
| Steelcase, Inc. (b) | 15,448 | 77,395 | |||||||||
| 768,105 | |||||||||||
| COMMUNICATIONS EQUIPMENT-3.8% | |||||||||||
| Cisco Systems, Inc. (a)(b) | 17,393 | 291,681 | |||||||||
| Corning Incorporated | 74,965 | 994,785 | |||||||||
| Motorola, Inc. (b) | 85,587 | 362,033 | |||||||||
| 1,648,499 | |||||||||||
| COMPUTERS & PERIPHERALS-4.9% | |||||||||||
| Dell, Inc. (a)(b) | 13,757 | 130,416 | |||||||||
| Hewlett-Packard Company (b) | 53,354 | 1,710,529 | |||||||||
| International Business Machines (b) | 3,221 | 312,083 | |||||||||
| 2,153,028 | |||||||||||
| CONSTRUCTION ENGINEERING-2.9% | |||||||||||
| Fluor Corporation (b) | 17,324 | 598,544 | |||||||||
| Jacobs Engineering Group, Inc. (a)(b) | 11,620 | 449,229 | |||||||||
| Quanta Services, Inc. (a)(b) | 9,593 | 205,770 | |||||||||
| 1,253,543 | |||||||||||
| CONSUMER SERVICES-1.3% | |||||||||||
| H&R Block, Inc. (b) | 31,691 | 576,459 | |||||||||
| DISTRIBUTORS-0.3% | |||||||||||
| CarMax, Inc. (a)(b) | 10,671 | 132,747 | |||||||||
| DIVERSIFIED FINANCIAL SERVICES-9.5% | |||||||||||
| BlackRock, Inc. (b) | 5,247 | 682,320 | |||||||||
| CME Group, Inc. (b) | 84 | 20,697 | |||||||||
| Discover Financial Services (b) | 15,232 | 96,114 | |||||||||
| Investment Technology Group, Inc. (a) | 53 | 1,352 | |||||||||
| Janus Capital Group, Inc. (b) | 83,054 | 552,309 | |||||||||
| JPMorgan Chase & Co. | 3,514 | 93,402 | |||||||||
| Principal Financial Group, Inc. (b) | 13,879 | 113,530 | |||||||||
| SEI Investments Company (b) | 2,295 | 28,022 | |||||||||
| State Street Corporation (b) | 13,075 | 402,449 | |||||||||
| T. Rowe Price Group, Inc. (b) | 13,351 | 385,310 | |||||||||
The accompanying notes are an integral part of these financial statements.
19
QUANT LONG/SHORT FUND
SCHEDULE OF INVESTMENTS (continued)
March 31, 2009
| Shares | Value | ||||||||||
| DIVERSIFIED FINANCIAL SERVICES (continued) | |||||||||||
| The Charles Schwab Corporation (b) | 62,880 | $ | 974,640 | ||||||||
| Visa, Inc. (b) | 14,584 | 810,870 | |||||||||
| 4,161,015 | |||||||||||
| DIVERSIFIED TELECOMMUNICATION SERVICES-3.6% | |||||||||||
| AT&T Corporation | 32,641 | 822,553 | |||||||||
| Clearwire Corporation (a)(b) | 22,346 | 115,082 | |||||||||
| Sprint Nextel Corporation (a)(b) | 106,235 | 379,259 | |||||||||
| Verizon Communications Inc. (b) | 8,275 | 249,905 | |||||||||
| 1,566,799 | |||||||||||
| ELECTRIC UTILITIES-3.2% | |||||||||||
| Calpine Corporation (a)(b) | 49,947 | 340,139 | |||||||||
| Mirant Corporation (a)(b) | 24,624 | 280,714 | |||||||||
| NRG Energy, Inc. (a)(b) | 14,078 | 247,773 | |||||||||
| PPL Corporation (b) | 13,816 | 396,657 | |||||||||
| Reliant Energy, Inc. (a)(b) | 9,291 | 29,638 | |||||||||
| The AES Corporation (a)(b) | 13,814 | 80,259 | |||||||||
| 1,375,180 | |||||||||||
| ELECTRONIC EQUIPMENT & INSTRUMENTS-2.4% | |||||||||||
| Agilent Technologies, Inc. (a) | 7,062 | 108,543 | |||||||||
| Ingram Micro, Inc. (a)(b) | 27,979 | 353,654 | |||||||||
| Intersil Corporation (b) | 5,876 | 67,574 | |||||||||
| Jabil Circuit, Inc. (b) | 11,444 | 63,629 | |||||||||
| Molex Incorporated (b) | 8,858 | 121,709 | |||||||||
| Tech Data Corporation (a)(b) | 7,625 | 166,073 | |||||||||
| Tyco Electronics, Ltd. (b) | 16,485 | 181,994 | |||||||||
| 1,063,176 | |||||||||||
| ENERGY EQUIPMENT & SERVICES-1.9% | |||||||||||
| Baker Hughes Incorporated (b) | 3,223 | 92,017 | |||||||||
| Dresser-Rand Group, Inc. (a)(b) | 1,115 | 24,642 | |||||||||
| Halliburton Company (b) | 19,063 | 294,905 | |||||||||
| National Oilwell Varco, Inc. (a) | 19 | 545 | |||||||||
| Schlumberger Limited (b) | 9,333 | 379,106 | |||||||||
| TETRA Technologies, Inc. (a)(b) | 5,785 | 18,801 | |||||||||
| 810,016 | |||||||||||
| FOOD PRODUCTS-3.0% | |||||||||||
| Bunge Limited (b) | 7,010 | 397,117 | |||||||||
| Corn Products International, Inc. (b) | 8,947 | 189,676 | |||||||||
| Hormel Foods Corporation (b) | 2,460 | 78,007 | |||||||||
The accompanying notes are an integral part of these financial statements.
20
QUANT LONG/SHORT FUND
SCHEDULE OF INVESTMENTS (continued)
March 31, 2009
| Shares | Value | ||||||||||
| FOOD PRODUCTS (continued) | |||||||||||
| Tyson Foods, Inc. (b) | 67,477 | $ | 633,609 | ||||||||
| 1,298,409 | |||||||||||
| FOOD STAPLES & DRUG RETAILING-6.8% | |||||||||||
| Archer-Daniels-Midland Company (b) | 14,103 | 391,781 | |||||||||
| Costco Wholesale Corporation (b) | 16,002 | 741,213 | |||||||||
| CVS Caremark Corporation (b) | 14,507 | 398,798 | |||||||||
| Dean Foods Company (a)(b) | 5,376 | 97,198 | |||||||||
| SYSCO Corporation (b) | 41,534 | 946,975 | |||||||||
| Walgreen Co. | 15,376 | 399,161 | |||||||||
| 2,975,126 | |||||||||||
| HEALTH CARE EQUIPMENT & SERVICES-2.9% | |||||||||||
| Express Scripts, Inc. (a)(b) | 999 | 46,124 | |||||||||
| McKesson Corporation (b) | 18,572 | 650,763 | |||||||||
| Stryker Corporation (b) | 13,974 | 475,675 | |||||||||
| UnitedHealth Group Inc. (b) | 4,779 | 100,024 | |||||||||
| 1,272,586 | |||||||||||
| HEALTH CARE PROVIDERS & SERVICES-2.9% | |||||||||||
| Aetna, Inc. (b) | 3,048 | 74,158 | |||||||||
| Cardinal Health, Inc. (b) | 27,886 | 877,851 | |||||||||
| Health Management Associates, Inc. (a)(b) | 4,298 | 11,089 | |||||||||
| Health Net, Inc. (a)(b) | 3,680 | 53,286 | |||||||||
| Hill-Rom Holdings, Inc. (b) | 11,818 | 116,880 | |||||||||
| Tenet Healthcare Corporation (a)(b) | 95,784 | 111,110 | |||||||||
| WebMD Health Corp. (a) | 329 | 7,337 | |||||||||
| 1,251,711 | |||||||||||
| HOTELS, RESTAURANTS & LEISURE-0.8% | |||||||||||
| Interval Leisure Group, Inc. (a)(b) | 358 | 1,897 | |||||||||
| Marriott International, Inc. (b) | 4,227 | 69,154 | |||||||||
| MGM MIRAGE (a)(b) | 48,261 | 112,448 | |||||||||
| Royal Caribbean Cruises, Ltd. (b) | 3,374 | 27,026 | |||||||||
| Starwood Hotels & Resorts Worldwide, Inc. (b) | 9,785 | 124,269 | |||||||||
| 334,794 | |||||||||||
| HOUSEHOLD DURABLES-0.1% | |||||||||||
| Garmin Ltd. (b) | 1,665 | 35,315 | |||||||||
| HOUSEHOLD PRODUCTS-1.1% | |||||||||||
| Procter & Gamble Company | 9,744 | 458,845 | |||||||||
| INDUSTRIAL CONGLOMERATES-1.5% | |||||||||||
| General Electric Company (b) | 13,765 | 139,164 | |||||||||
The accompanying notes are an integral part of these financial statements.
21
QUANT LONG/SHORT FUND
SCHEDULE OF INVESTMENTS (continued)
March 31, 2009
| Shares | Value | ||||||||||
| INDUSTRIAL CONGLOMERATES (continued) | |||||||||||
| KBR, Inc. (b) | 37,368 | $ | 516,052 | ||||||||
| 655,216 | |||||||||||
| INSURANCE-2.1% | |||||||||||
| AFLAC Inc. (b) | 21,537 | 416,956 | |||||||||
| American Financial Group, Inc. (b) | 527 | 8,459 | |||||||||
| The Travelers Companies, Inc. | 3,523 | 143,175 | |||||||||
| Torchmark Corporation (b) | 2,823 | 74,047 | |||||||||
| Unum Group (b) | 21,468 | 268,350 | |||||||||
| 910,987 | |||||||||||
| INTERNET SOFTWARE & SERVICES-0.0% | |||||||||||
| Google, Inc. (a)(b) | 53 | 18,447 | |||||||||
| IT CONSULTING & SERVICES-1.9% | |||||||||||
| Accenture, Ltd. (b) | 19,757 | 543,120 | |||||||||
| MasterCard Incorporated (b) | 628 | 105,177 | |||||||||
| The Western Union Company (b) | 15,389 | 193,440 | |||||||||
| 841,737 | |||||||||||
| MACHINERY-3.0% | |||||||||||
| AGCO Corporation (a)(b) | 29,152 | 571,379 | |||||||||
| Flowserve Corporation (b) | 748 | 41,978 | |||||||||
| Harsco Corporation (b) | 16,927 | 375,271 | |||||||||
| John Bean Technologies Corporation (a)(b) | 2,669 | 27,918 | |||||||||
| The Timken Company (b) | 21,699 | 302,918 | |||||||||
| 1,319,464 | |||||||||||
| MEDIA-4.5% | |||||||||||
| Comcast Corporation (b) | 83,881 | 1,144,137 | |||||||||
| DISH Network Corporation (a)(b) | 5,257 | 58,405 | |||||||||
| Disney (Walt) Company (b) | 12,181 | 221,207 | |||||||||
| Liberty Media Capital (a)(b) | 24,453 | 170,682 | |||||||||
| The DIRECTV Group, Inc. (a)(b) | 7,182 | 163,678 | |||||||||
| The Interpublic Group of Companies, Inc. (a)(b) | 34,906 | 143,812 | |||||||||
| Ticketmaster Entertainment, Inc. (a) | 14,152 | 52,221 | |||||||||
| 1,954,142 | |||||||||||
| METALS & MINING-0.2% | |||||||||||
| Commercial Metals Company (b) | 4,418 | 51,028 | |||||||||
| Titanium Metals Corporation (b) | 9,239 | 50,537 | |||||||||
| 101,565 | |||||||||||
| OIL & GAS-13.9% | |||||||||||
| Anadarko Petroleum Corporation (b) | 1,752 | 68,135 | |||||||||
The accompanying notes are an integral part of these financial statements.
22
QUANT LONG/SHORT FUND
SCHEDULE OF INVESTMENTS (continued)
March 31, 2009
| Shares | Value | ||||||||||
| OIL & GAS (continued) | |||||||||||
| Cabot Oil & Gas Corporation (b) | 9,731 | $ | 229,360 | ||||||||
| Chevron Corporation (b) | 24,254 | 1,630,839 | |||||||||
| CNX Gas Corporation (a)(b) | 1,372 | 32,530 | |||||||||
| EOG Resources, Inc. (b) | 6,772 | 370,835 | |||||||||
| Exxon Mobil Corporation | 35,383 | 2,409,582 | |||||||||
| Murphy Oil Corporation (b) | 6,580 | 294,587 | |||||||||
| Occidental Petroleum Corporation | 3,127 | 174,018 | |||||||||
| Pioneer Natural Resources Company (b) | 29,649 | 488,319 | |||||||||
| Sunoco, Inc. (b) | 335 | 8,871 | |||||||||
| Tesoro Corporation (b) | 15,609 | 210,253 | |||||||||
| Whiting Petroleum Corporation (a)(b) | 4,990 | 128,991 | |||||||||
| 6,046,320 | |||||||||||
| PAPER & FOREST PRODUCTS-0.1% | |||||||||||
| Domtar Corporation (a)(b) | 3,012 | 2,862 | |||||||||
| International Paper Company (b) | 4,854 | 34,172 | |||||||||
| 37,034 | |||||||||||
| PERSONAL PRODUCTS-0.5% | |||||||||||
| Bare Escentuals, Inc. (a)(b) | 17,866 | 73,251 | |||||||||
| The Estee Lauder Companies, Inc. (b) | 5,094 | 125,567 | |||||||||
| 198,818 | |||||||||||
| PHARMACEUTICALS & BIOTECHNOLOGY-9.5% | |||||||||||
| AmerisourceBergen Corporation (b) | 31,974 | 1,044,271 | |||||||||
| Amgen Inc. (a) | 7,053 | 349,265 | |||||||||
| Forest Laboratories Inc. (a)(b) | 2,747 | 60,324 | |||||||||
| Johnson & Johnson (b) | 9,889 | 520,161 | |||||||||
| Medco Health Solutions, Inc. (a)(b) | 13,348 | 551,806 | |||||||||
| Merck & Co., Inc. (b) | 13,046 | 348,980 | |||||||||
| Pfizer Inc. (b) | 41,119 | 560,041 | |||||||||
| Schering-Plough Corporation | 10,049 | 236,654 | |||||||||
| Sepracor, Inc. (a)(b) | 10,707 | 156,965 | |||||||||
| Wyeth (b) | 7,215 | 310,534 | |||||||||
| 4,139,001 | |||||||||||
| REAL ESTATE-2.3% | |||||||||||
| Boston Properties, Inc. (b) | 2,882 | 100,956 | |||||||||
| Public Storage (b) | 8,897 | 491,559 | |||||||||
| Rayonier, Inc. (b) | 9,384 | 283,585 | |||||||||
| SL Green Realty Corp. (b) | 10,330 | 111,564 | |||||||||
| 987,664 | |||||||||||
The accompanying notes are an integral part of these financial statements.
23
QUANT LONG/SHORT FUND
SCHEDULE OF INVESTMENTS (continued)
March 31, 2009
| Shares | Value | ||||||||||
| RETAILING-3.5% | |||||||||||
| Amazon.com, Inc. (a)(b) | 381 | $ | 27,981 | ||||||||
| Best Buy Co., Inc. (b) | 2,514 | 95,431 | |||||||||
| Big Lots, Inc. (a)(b) | 8,748 | 181,783 | |||||||||
| BJ's Wholesale Club, Inc. (a)(b) | 6,817 | 218,076 | |||||||||
| Foot Locker, Inc. (b) | 18,614 | 195,075 | |||||||||
| Saks Inc. (a)(b) | 3,079 | 5,758 | |||||||||
| Wal-Mart Stores, Inc. | 15,120 | 787,752 | |||||||||
| Williams-Sonoma, Inc. (b) | 1,294 | 13,043 | |||||||||
| 1,524,899 | |||||||||||
| SEMICONDUCTOR EQUIPMENT-6.7% | |||||||||||
| Analog Devices, Inc. (b) | 4,346 | 83,748 | |||||||||
| Atmel Corporation (a)(b) | 73,313 | 266,126 | |||||||||
| Intel Corporation (b) | 89,387 | 1,345,274 | |||||||||
| Marvell Technology Group, Ltd. (a) | 24,967 | 228,698 | |||||||||
| Texas Instruments Inc. (b) | 60,573 | 1,000,060 | |||||||||
| 2,923,906 | |||||||||||
| SOFTWARE & SERVICES-6.3% | |||||||||||
| Computer Sciences Corporation (a)(b) | 144 | 5,305 | |||||||||
| eBay, Inc. (a)(b) | 22,908 | 287,724 | |||||||||
| Electronic Arts, Inc. (a)(b) | 22,015 | 400,453 | |||||||||
| Microsoft Corporation (b) | 104,544 | 1,920,473 | |||||||||
| salesforce.com, inc. (a)(b) | 1,201 | 39,309 | |||||||||
| Synopsys, Inc. (a)(b) | 5,260 | 109,040 | |||||||||
| 2,762,304 | |||||||||||
| TEXTILES & APPAREL-0.2% | |||||||||||
| Guess?, Inc. (b) | 3,583 | 75,529 | |||||||||
| TOBACCO-1.7% | |||||||||||
| Altria Group, Inc. | 18,455 | 295,649 | |||||||||
| Philip Morris International Inc. (b) | 12,470 | 443,683 | |||||||||
| 739,332 | |||||||||||
| WIRELESS TELECOMMUNICATIONS-0.4% | |||||||||||
| NII Holdings, Inc. (a)(b) | 5,376 | 80,640 | |||||||||
| Telephone and Data Systems, Inc. (b) | 3,679 | 97,530 | |||||||||
| 178,170 | |||||||||||
| TOTAL LONG POSITIONS-127.8% (Cost $63,474,976) (c) | 55,698,883 | ||||||||||
The accompanying notes are an integral part of these financial statements.
24
QUANT LONG/SHORT FUND
SCHEDULE OF INVESTMENTS (continued)
March 31, 2009
| Short Positions-(29.3%) | |||||||||||
| Shares | Value | ||||||||||
| AIRLINES(0.2%) | |||||||||||
| AMR Corporation (a) | (19,744 | ) | $ | (62,983 | ) | ||||||
| Continental Airlines, Inc. (a) | (43 | ) | (379 | ) | |||||||
| (63,362 | ) | ||||||||||
| BANKS-(1.8%) | |||||||||||
| KeyCorp | (21,499 | ) | (169,197 | ) | |||||||
| Regions Financial Corporation | (46,797 | ) | (199,355 | ) | |||||||
| Synovus Financial Corp. | (6,996 | ) | (22,737 | ) | |||||||
| Webster Financial Corporation | (42,702 | ) | (181,484 | ) | |||||||
| Wilmington Trust Corporation | (1,231 | ) | (11,928 | ) | |||||||
| Zions Bancorporation | (21,614 | ) | (212,466 | ) | |||||||
| (797,167 | ) | ||||||||||
| BIOTECHNOLOGY-(0.3%) | |||||||||||
| BioMarin Pharmaceutical, Inc. (a) | (10,504 | ) | (129,724 | ) | |||||||
| BUILDING PRODUCTS-(0.3%) | |||||||||||
| Owens Corning (a) | (14,250 | ) | (128,820 | ) | |||||||
| COMMERCIAL SERVICES AND SUPPLIES-(2.2%) | |||||||||||
| Fiserv, Inc. (a) | (4,340 | ) | (158,236 | ) | |||||||
| FTI Consulting, Inc. (a) | (939 | ) | (46,462 | ) | |||||||
| Pitney Bowes, Inc. | (27,299 | ) | (637,432 | ) | |||||||
| The Dun & Bradstreet Corporation | (1,198 | ) | (92,246 | ) | |||||||
| Weight Watchers International, Inc. | (1,950 | ) | (36,172 | ) | |||||||
| (970,548 | ) | ||||||||||
| COMMUNICATIONS EQUIPMENT-(1.0%) | |||||||||||
| ADC Telecommunications, Inc. (a) | (68,038 | ) | (298,687 | ) | |||||||
| Ciena Corporation (a) | (10,182 | ) | (79,216 | ) | |||||||
| CommScope, Inc. (a) | (3,148 | ) | (35,761 | ) | |||||||
| (413,664 | ) | ||||||||||
| COMPUTERS & PERIPHERALS-(0.6%) | |||||||||||
| SeaGate Technology | (46,101 | ) | (277,067 | ) | |||||||
| CONSTRUCTION & ENGINEERING-(0.6%) | |||||||||||
| Eagle Materials, Inc. | (11,228 | ) | (272,279 | ) | |||||||
| CONTAINERS & PACKAGING-(0.2%) | |||||||||||
| Jarden Corporation (a) | (4,969 | ) | (62,957 | ) | |||||||
| DIVERSIFIED FINANCIAL SERVICES-(5.8%) | |||||||||||
| Affiliated Managers Group, Inc. (a) | (4,575 | ) | (190,823 | ) | |||||||
| Ameriprise Financial, Inc. | (2,725 | ) | (55,835 | ) | |||||||
| Capital One Financial Corporation | (9,854 | ) | (120,613 | ) | |||||||
| CapitalSource, Inc. | (61,239 | ) | (74,712 | ) | |||||||
The accompanying notes are an integral part of these financial statements.
25
QUANT LONG/SHORT FUND
SCHEDULE OF INVESTMENTS (continued)
March 31, 2009
| Shares | Value | ||||||||||
| DIVERSIFIED FINANCIAL SERVICES (continued) | |||||||||||
| First Horizon National Corporation | (897 | ) | $ | (9,634 | ) | ||||||
| Jefferies Group, Inc. | (31,813 | ) | (439,020 | ) | |||||||
| Lazard, Ltd | (14,360 | ) | (422,184 | ) | |||||||
| Legg Mason, Inc. | (26,327 | ) | (418,599 | ) | |||||||
| Marshall & Ilsley Corporation | (28,056 | ) | (157,955 | ) | |||||||
| MF Global, Ltd. (a) | (9,791 | ) | (41,416 | ) | |||||||
| MSCI Inc. (a) | (1,697 | ) | (28,696 | ) | |||||||
| SLM Corporation (a) | (58,178 | ) | (287,981 | ) | |||||||
| The Goldman Sachs Group, Inc. | (1,444 | ) | (153,093 | ) | |||||||
| The Student Loan Corporation | (329 | ) | (14,292 | ) | |||||||
| Walter Industries, Inc. | (4,767 | ) | (109,021 | ) | |||||||
| (2,523,874 | ) | ||||||||||
| ENERGY EQUIPMENT & SERVICES-(0.2%) | |||||||||||
| Global Industries, Ltd. (a) | (26,948 | ) | (103,480 | ) | |||||||
| HEALTH CARE EQUIPMENT & SERVICES-(0.0%) | |||||||||||
| Hologic, Inc. (a) | (1,227 | ) | (16,061 | ) | |||||||
| HEALTH CARE PROVIDERS & SERVICES-(0.2%) | |||||||||||
| DaVita, Inc. (a) | (1,688 | ) | (74,188 | ) | |||||||
| HOUSEHOLD DURABLES-(1.7%) | |||||||||||
| KB Home | (1,814 | ) | (23,909 | ) | |||||||
| M.D.C. Holdings, Inc. | (10,563 | ) | (328,932 | ) | |||||||
| Mohawk Industries, Inc. (a) | (698 | ) | (20,849 | ) | |||||||
| NVR, Inc. (a) | (245 | ) | (104,799 | ) | |||||||
| Toll Brothers, Inc. (a) | (14,701 | ) | (266,970 | ) | |||||||
| (745,459 | ) | ||||||||||
| HOUSEHOLD PRODUCTS-(0.2%) | |||||||||||
| Energizer Holdings, Inc. (a) | (1,971 | ) | (97,939 | ) | |||||||
| INSURANCE-(2.0%) | |||||||||||
| Allstate Corporation | (7,987 | ) | (152,951 | ) | |||||||
| Everest Re Group, Ltd. | (656 | ) | (46,445 | ) | |||||||
| Genworth Financial, Inc. | (33,475 | ) | (63,602 | ) | |||||||
| Hartford Financial Services Group, Inc. | (23,141 | ) | (181,657 | ) | |||||||
| Lincoln National Corporation | (559 | ) | (3,740 | ) | |||||||
| Markel Corporation (a) | (155 | ) | (44,001 | ) | |||||||
| OneBeacon Insurance Group, Ltd. | (2,766 | ) | (26,719 | ) | |||||||
| PartnerRe, Ltd. | (809 | ) | (50,215 | ) | |||||||
| Protective Life Corporation | (16,227 | ) | (85,192 | ) | |||||||
| XL Capital, Ltd. | (40,993 | ) | (223,822 | ) | |||||||
| (878,344 | ) | ||||||||||
The accompanying notes are an integral part of these financial statements.
26
QUANT LONG/SHORT FUND
SCHEDULE OF INVESTMENTS (continued)
March 31, 2009
| Shares | Value | ||||||||||
| INTERNET & CATALOG RETAIL-(0.1%) | |||||||||||
| Expedia, Inc. (a) | (2,243 | ) | $ | (20,366 | ) | ||||||
| MACHINERY-(0.5%) | |||||||||||
| Ingersoll-Rand Company Limited | (14,495 | ) | (200,031 | ) | |||||||
| Oshkosh Corporation | (1,950 | ) | (13,143 | ) | |||||||
| (213,174 | ) | ||||||||||
| MEDIA-(0.3%) | |||||||||||
| CBS Corporation Class B | (23,291 | ) | (89,438 | ) | |||||||
| Gannett Co., Inc. | (22,701 | ) | (49,942 | ) | |||||||
| (139,380 | ) | ||||||||||
| METALS & MINING-(0.7%) | |||||||||||
| Century Aluminum Company (a) | (55,340 | ) | (116,768 | ) | |||||||
| Freeport-McMoRan Copper & Gold, Inc. | (3,245 | ) | (123,667 | ) | |||||||
| Patriot Coal Corporation (a) | (12,192 | ) | (45,232 | ) | |||||||
| (285,667 | ) | ||||||||||
| OIL & GAS-(1.7%) | |||||||||||
| Cimarex Energy Co. | (3,804 | ) | (69,918 | ) | |||||||
| Helix Energy Solutions Group, Inc. (a) | (8,164 | ) | (41,963 | ) | |||||||
| Plains Exploration & Production Company (a) | (22,214 | ) | (382,747 | ) | |||||||
| W&T Offshore, Inc. | (20,355 | ) | (125,183 | ) | |||||||
| Quicksilver Resources, Inc. (a) | (21,044 | ) | (116,584 | ) | |||||||
| (736,395 | ) | ||||||||||
| PHARMACEUTICALS & BIOTECHNOLOGY-(0.9%) | |||||||||||
| King Pharmaceuticals, Inc. (a) | (24,524 | ) | (173,385 | ) | |||||||
| Perrigo Company | (8,005 | ) | (198,764 | ) | |||||||
| (372,149 | ) | ||||||||||
| REAL ESTATE-(2.0%) | |||||||||||
| Annaly Capital Management, Inc. | (14,742 | ) | (204,472 | ) | |||||||
| Apartment Investment and Management Company | (16,569 | ) | (90,798 | ) | |||||||
| CB Richard Ellis Group, Inc. (a) | (14,447 | ) | (58,221 | ) | |||||||
| Taubman Centers, Inc. | (27,449 | ) | (467,731 | ) | |||||||
| UDR, Inc. | (4,572 | ) | (39,365 | ) | |||||||
| (860,587 | ) | ||||||||||
| RETAILING-(1.1%) | |||||||||||
| AnnTaylor Stores Corporation (a) | (2,621 | ) | (13,629 | ) | |||||||
| AutoZone, Inc. (a) | (2,471 | ) | (401,834 | ) | |||||||
| O'Reilly Automotive, Inc. (a) | (1,397 | ) | (48,909 | ) | |||||||
| United Rentals, Inc. (a) | (7,914 | ) | (33,318 | ) | |||||||
| (497,690 | ) | ||||||||||
The accompanying notes are an integral part of these financial statements.
27
QUANT LONG/SHORT FUND
SCHEDULE OF INVESTMENTS (continued)
March 31, 2009
| Shares | Value | ||||||||||
| SEMICONDUCTOR EQUIPMENT-(3.9%) | |||||||||||
| Integrated Device Technology, Inc. (a) | (12,877 | ) | $ | (58,590 | ) | ||||||
| International Rectifier Corp. (a) | (42,565 | ) | (575,053 | ) | |||||||
| KLA-Tencor Corporation | (14,208 | ) | (284,160 | ) | |||||||
| Lam Research Corporation (a) | (18,985 | ) | (432,289 | ) | |||||||
| Novellus Systems, Inc. (a) | (389 | ) | (6,469 | ) | |||||||
| ON Semiconductor Corporation (a) | (88,350 | ) | (344,565 | ) | |||||||
| (1,701,126 | ) | ||||||||||
| SOFTWARE & SERVICES-(0.1%) | |||||||||||
| Cadence Design Systems, Inc. (a) | (7,681 | ) | (32,260 | ) | |||||||
| WIRELESS TELECOMMUNICATIONS-(0.7%) | |||||||||||
| SBA Communications Corporation (a) | (13,653 | ) | (318,115 | ) | |||||||
| TOTAL SHORT POSITIONS (29.3%) (Proceeds $12,149,511) | (12,731,842 | ) | |||||||||
| TOTAL INVESTMENTS (EXCLUDING INVESTMENTS PURCHASED WITH CASH COLLATERAL FROM SECURITIES LOANED)-98.5% (Cost $51,325,464) (c) | 42,967,041 | ||||||||||
| INVESTMENTS PURCHASED WITH CASH COLLATERAL FROM SECURITIES LOANED-51.0% | |||||||||||
| Par Value | Value | ||||||||||
| Non-Registered Money Market-51.0% | |||||||||||
| State Street Navigator Securities Lending Prime Portfolio (Cost $22,233,297) | $ | 22,233,297 | $ | 22,233,297 | |||||||
| TOTAL INVESTMENTS-149.5% (Cost $73,558,761) (c) | 65,200,338 | ||||||||||
| OTHER ASSETS & LIABILITIES (NET)-(49.5%) | (21,602,465 | ) | |||||||||
| NET ASSETS-100% | $ | 43,597,873 | |||||||||
(a) Non-Income producing security
(b) All or a portion of this security was out on loan.
(c) At March 31, 2009, the unrealized appreciation of investments based on aggregate cost for federal tax purposes of $92,763,083 was as follows:
| Aggregate gross unrealized appreciation for all investments in which there is an excess of value over tax cost | $ | 3,439,445 | |||||
| Aggregate gross unrealized depreciation for all investments in which there is an excess of tax cost over value | (18,270,348 | ) | |||||
| Net unrealized appreciation/(depreciation) | $ | (14,830,903 | ) | ||||
The percentage of each investment category is calculated as a percentage of net assets.
All long security holdings are held as collateral for short security positions.
The accompanying notes are an integral part of these financial statements.
28
QUANT EMERGING MARKETS FUND
SCHEDULE OF INVESTMENTS
March 31, 2009
| Common Stock-91.7% | |||||||||||
| Shares | Value | ||||||||||
| BRAZIL-8.8% | |||||||||||
| Banco do Brasil SA | 25,917 | $ | 189,934 | ||||||||
| Brasil Telecom Participacoes SA | 57,918 | 1,544,094 | |||||||||
| Empresa Brasileira de Aeronautica (Embraer) | 305,938 | 1,032,663 | |||||||||
| Gerdau SA (c) | 339,161 | 1,855,211 | |||||||||
| Itau Unibanco Banco Multiplo SA (c) | 259,645 | 2,824,938 | |||||||||
| Petroleo Brasileiro SA (c) | 153,329 | 3,756,560 | |||||||||
| CIA Saneamento Basico De SP | 352,611 | 3,952,025 | |||||||||
| Usinas Siderurgicas de Minas Gerais SA (c) | 122,751 | 1,571,213 | |||||||||
| 16,726,638 | |||||||||||
| CHILE-1.5% | |||||||||||
| Banco Santander-Chile (c) | 56,783 | 1,950,496 | |||||||||
| Enersis S.A. (c) | 65,453 | 988,340 | |||||||||
| 2,938,836 | |||||||||||
| CHINA-20.0% | |||||||||||
| Angang Steel Company Limited | 1,000 | 1,010 | |||||||||
| Chaoda Modern Argriculture (Holdings) Limited | 2,406,306 | 1,434,460 | |||||||||
| China Blue Chemical Ltd. | 520,000 | 285,160 | |||||||||
| China Construction Bank Corporation (b) | 7,501,755 | 4,259,033 | |||||||||
| China Mobile Limited | 728,500 | 6,359,059 | |||||||||
| China Petroleum & Chemical Corporation (Sinopec Corp.) | 6,584,000 | 4,213,733 | |||||||||
| China Pharmaceutical Group Limited | 1,142,000 | 456,797 | |||||||||
| China Shipping Development Company, Ltd. | 837,688 | 791,205 | |||||||||
| China Sky One Medical Inc. (a) | 10,900 | 125,350 | |||||||||
| China Telecom Corporation Limited | 2,800,000 | 1,163,347 | |||||||||
| China Unicom (Hong Kong) Limited | 84 | 90 | |||||||||
| CNOOC Limited | 4,959,452 | 4,933,823 | |||||||||
| CNPC (Hong Kong) Limited | 2,540,000 | 1,078,264 | |||||||||
| Dongfeng Motor Group | 4,126,000 | 2,150,830 | |||||||||
| Huabao Intl Hldg Inc. | 205,000 | 168,760 | |||||||||
| Industrial and Commercial Bank of China (b) | 3,286,000 | 1,700,229 | |||||||||
| Lite-On Technology Corp. | 699,000 | 472,019 | |||||||||
| NetEase.com, Inc. (a)(c) | 11,241 | 301,821 | |||||||||
| PetroChina Company Limited | 5,444,301 | 4,327,313 | |||||||||
| Shenzhen Investment Limited | 3,366,594 | 829,697 | |||||||||
| Shenzhen International Holdings Limited | 12,326,253 | 564,618 | |||||||||
| Tencent Holdings Ltd | 145,800 | 1,081,735 | |||||||||
| Yanzhou Coal Mining | 1,732,000 | 1,244,797 | |||||||||
| 37,943,150 | |||||||||||
The accompanying notes are an integral part of these financial statements.
29
QUANT EMERGING MARKETS FUND
SCHEDULE OF INVESTMENTS (continued)
March 31, 2009
| Shares | Value | ||||||||||
| CZECH REPUBLIC-0.8% | |||||||||||
| Ceske Energeticke Zavody | 579 | $ | 20,504 | ||||||||
| Komerycni banka | 14,538 | 1,450,835 | |||||||||
| 1,471,339 | |||||||||||
| EGYPT-0.2% | |||||||||||
| Commercial International Bank | 59,780 | 345,330 | |||||||||
| HUNGARY-0.6% | |||||||||||
| Egis Gyogyszergyar Rt. (Egis) | 3,503 | 172,121 | |||||||||
| Magyar Telekom Telecommunica | 428,365 | 990,379 | |||||||||
| 1,162,500 | |||||||||||
| INDIA-0.3% | |||||||||||
| Infosys Technologies Limited (c) | 14,302 | 380,862 | |||||||||
| Mahindra & Mahindra Ltd. (d) | 16,110 | 122,436 | |||||||||
| Tata Motors Limited (c) | 2,404 | 11,852 | |||||||||
| 515,150 | |||||||||||
| ISRAEL-5.4% | |||||||||||
| Bank Leumi Le-Israel | 984,817 | 1,945,951 | |||||||||
| Mizrahi Tefahot Bank | 35,931 | 171,961 | |||||||||
| Partner Communications Company Ltd. | 247,364 | 3,684,600 | |||||||||
| Teva Pharmaceutical Industries Ltd. | 99,952 | 4,463,887 | |||||||||
| 10,266,399 | |||||||||||
| MALAYSIA-4.1% | |||||||||||
| Asiatic Development | 1,026,000 | 1,204,575 | |||||||||
| British American Tobacco | 15,112 | 188,615 | |||||||||
| PPB Group | 826,261 | 2,221,193 | |||||||||
| Public Bank Berhad | 399,394 | 827,163 | |||||||||
| Tenaga Nasional | 1,493,300 | 2,498,733 | |||||||||
| UMW Holdings | 552,028 | 794,993 | |||||||||
| 7,735,272 | |||||||||||
| MEXICO-2.9% | |||||||||||
| America Movil SAB de CV | 102,576 | 139,198 | |||||||||
| Consorcio Ara S.A. de CV | 2,562,666 | 668,835 | |||||||||
| Controladora Comercial Mexicana SA de CV | 101,300 | 28,576 | |||||||||
| Fomento Economico Mexicano S.A.B. de C.V. | 952,403 | 2,409,315 | |||||||||
| Grupo Carso SA DE Cv-ser A1 (b) | 383,626 | 928,367 | |||||||||
| Grupo Mexico SAB de CV | 1,210,637 | 878,915 | |||||||||
| Telefonos De Mexico SAB de CV International (Telmex) | 553,790 | 417,631 | |||||||||
| 5,470,837 | |||||||||||
The accompanying notes are an integral part of these financial statements.
30
QUANT EMERGING MARKETS FUND
SCHEDULE OF INVESTMENTS (continued)
March 31, 2009
| Shares | Value | ||||||||||
| PHILIPPINES-0.9% | |||||||||||
| AYALA Corporation | 76,270 | $ | 325,124 | ||||||||
| First Philippine Holdings Corporation (a) | 1,490,274 | 817,222 | |||||||||
| Petron Corporation | 4,906,064 | 588,829 | |||||||||
| 1,731,175 | |||||||||||
| POLAND-1.3% | |||||||||||
| KGHM Polska Miedz S.A. | 19,845 | 258,781 | |||||||||
| Telekomunikacja PO | 396,009 | 2,124,827 | |||||||||
| 2,383,608 | |||||||||||
| RUSSIA-6.2% | |||||||||||
| Gazprom (c) | 389,127 | 5,778,536 | |||||||||
| JSC MMC Norilsk Nickel (c) | 300,609 | 1,803,654 | |||||||||
| LUKoil (c) | 103,217 | 3,870,638 | |||||||||
| SISTEMA JSFC (d) | 43,988 | 251,611 | |||||||||
| 11,704,439 | |||||||||||
| SOUTH AFRICA-7.1% | |||||||||||
| Adcock Ingram Holdings Ltd. (a) | 155,156 | 585,571 | |||||||||
| African Bank Investments Limited | 295,412 | 780,436 | |||||||||
| African Rainbow Minerals Limited | 171,865 | 2,495,252 | |||||||||
| ArcelorMittal South Africa | 193,355 | 1,481,772 | |||||||||
| Aveng Ltd. | 172,175 | 470,204 | |||||||||
| Liberty Holdings Ltd. | 202,017 | 1,334,249 | |||||||||
| Metropolitan Holdings Ltd. | 130,450 | 143,596 | |||||||||
| MTN Group Limited | 27,337 | 300,918 | |||||||||
| Murray & Roberts Holdings Limited | 196,328 | 833,577 | |||||||||
| Nampak Limited | 387,255 | 511,536 | |||||||||
| Remgro Limited | 217,919 | 1,542,082 | |||||||||
| Shoprite Holdings Ltd. | 89,342 | 473,837 | |||||||||
| Standard Bank Group Limited | 297,417 | 2,478,800 | |||||||||
| 13,431,830 | |||||||||||
| SOUTH KOREA-16.8% | |||||||||||
| Dongbu Insurance Co., Ltd. | 144,460 | 2,140,922 | |||||||||
| Hyundai Heavy Industries Co., Ltd. | 7,001 | 989,478 | |||||||||
| Hyundai Marine & Fire Insurance, Co., Ltd. | 176,413 | 1,594,189 | |||||||||
| Hyundai Mipo Dockyard Co., Ltd. | 19,340 | 1,810,613 | |||||||||
| Korea Exchange Bank | 137,503 | 616,316 | |||||||||
| Korea Zinc Inc. | 17,328 | 1,415,553 | |||||||||
| KT&G Corporation | 25,764 | 1,417,416 | |||||||||
| LG Chemical | 30,529 | 1,927,438 | |||||||||
| LG Corp. | 99,900 | 3,553,284 | |||||||||
| LG Electronics Inc. | 7,381 | 487,709 | |||||||||
The accompanying notes are an integral part of these financial statements.
31
QUANT EMERGING MARKETS FUND
SCHEDULE OF INVESTMENTS (continued)
March 31, 2009
| Shares | Value | ||||||||||
| SOUTH KOREA (continued) | |||||||||||
| LG Household & Healthcare | 2,042 | $ | 222,173 | ||||||||
| LIG Insurance Co., Ltd. | 19,230 | 185,592 | |||||||||
| PacifiCorp | 5,451 | 341,660 | |||||||||
| Posco | 19,422 | 5,117,888 | |||||||||
| Samsung C&T Corp. | 28,567 | 820,921 | |||||||||
| Samsung Electronics Co., Ltd. | 13,916 | 5,714,287 | |||||||||
| Samsung Heavy Industries | 108,400 | 2,006,174 | |||||||||
| SK Holdings Co., Ltd. | 14,320 | 1,112,886 | |||||||||
| SK Telecom | 3,148 | 436,954 | |||||||||
| 31,911,453 | |||||||||||
| TAIWAN-11.1% | |||||||||||
| China Steel Corporation | 3,772,729 | 2,469,763 | |||||||||
| Chunghwa Picture Tubes Ltd. | 1,186,000 | 143,739 | |||||||||
| Chunghwa Telecom Co., Ltd. | 1,951,329 | 3,561,785 | |||||||||
| D-Link Corporation | 33,619 | 23,842 | |||||||||
| Delta Electronics Inc. | 582 | 1,071 | |||||||||
| Formosa Petrochemical Corp | 65,000 | 128,612 | |||||||||
| Formosa Plastics Corporation | 319,000 | 480,682 | |||||||||
| Far EasTone Telecom | 185,916 | 191,333 | |||||||||
| Fubon Financial HL | 1,034,000 | 623,535 | |||||||||
| HTC Corporation | 29,738 | 365,674 | |||||||||
| MediaTek Incorporation | 58,517 | 550,452 | |||||||||
| Nan Ya Plastics Corporation | 594,000 | 679,618 | |||||||||
| Powertech Technology Inc. | 195,890 | 353,517 | |||||||||
| President Chain Store Corp. | 30,631 | 70,183 | |||||||||
| President Securities Corp. | 292,365 | 108,628 | |||||||||
| Quanta Computer | 4,381,169 | 5,535,890 | |||||||||
| Siliconware Precision Industries Company | 32,422 | 34,131 | |||||||||
| Taiwan Semiconductor Mfg. Co. Ltd. | 1,414,000 | 2,143,182 | |||||||||
| U-Ming Marine Transport Corporation | 410,485 | 618,536 | |||||||||
| Unimicron Technology Corp. | 2,206,082 | 1,314,073 | |||||||||
| Utd Micro Elect | 4,980,000 | 1,630,042 | |||||||||
| 21,028,288 | |||||||||||
| THAILAND-2.8% | |||||||||||
| Advanced Info Service PCL | 286,363 | 687,344 | |||||||||
| Cp All Pcl | 2,732,600 | 970,838 | |||||||||
| Electricity Generating PCL | 36,000 | 67,249 | |||||||||
| Krung Thai Bank Pub.,Co.,Ltd. | 9,186,600 | 1,144,925 | |||||||||
| PTT Aromatics and Refining Public Company Limited | 81 | 21 | |||||||||
| PTT Chemical | 317,205 | 259,381 | |||||||||
| Ptt Explortn & Prd. | 480,200 | 1,316,776 | |||||||||
The accompanying notes are an integral part of these financial statements.
32
QUANT EMERGING MARKETS FUND
SCHEDULE OF INVESTMENTS (continued)
March 31, 2009
| Shares | Value | ||||||||||
| THAILAND (continued) | |||||||||||
| PTT Public Company Limited | 213,238 | $ | 925,946 | ||||||||
| Thanachart Capital PCL | 267,126 | 52,800 | |||||||||
| 5,425,280 | |||||||||||
| TURKEY-0.9% | |||||||||||
| Turkiye Garanti Bankasi AS (a) | 381,419 | 539,577 | |||||||||
| Turkiye IS Bankasi AS C | 561,035 | 1,257,768 | |||||||||
| 1,797,345 | |||||||||||
| TOTAL COMMON STOCK (Cost $238,292,077) | 173,988,869 | ||||||||||
| Preferred Stock-6.2% | |||||||||||
| BRAZIL-6.2% | |||||||||||
| Bradespar SA | 170,305 | 1,674,973 | |||||||||
| Cia Paranaense de Energia-PFB | 11,700 | 122,492 | |||||||||
| Eletropaulo Metropolitana Preferred-B | 141,041 | 2,000,473 | |||||||||
| Itau Unibanco Banco Multiplo SA | 277,394 | 3,090,925 | |||||||||
| Metalurgica Gerdau S.A. | 67,130 | 492,842 | |||||||||
| Telemar Norte Leste SA | 90,544 | 2,057,148 | |||||||||
| Telecomunicacoes de Sao Paulo S.A. | 22,461 | 470,208 | |||||||||
| Usinas Siderurgicas de Minas Gerais-pf A | 149,119 | 1,910,993 | |||||||||
| TOTAL PREFERRED STOCK (Cost $11,029,372) | 11,820,054 | ||||||||||
| Short Term Investments-1.0% | |||||||||||
| Par Value | Value | ||||||||||
| State Street Bank & Trust Co., Repurchase Agreement 0.01%, 4/01/09, (Dated 3/31/09), Collateralized by $2,010,000 par U.S. Treasury Bill-zero coupon due 9/10/09, Market Value $3,239,808, Repurchase Proceeds $1,967,001 (Cost $1,967,000) | $ | 1,967,000 | $ | 1,967,000 | |||||||
| TOTAL INVESTMENTS (EXCLUDING INVESTMENTS PURCHASED WITH CASH COLLATERAL FROM SECURITIES LOANED) (Cost $251,288,449) | 187,775,923 | ||||||||||
The accompanying notes are an integral part of these financial statements.
33
QUANT EMERGING MARKETS FUND
SCHEDULE OF INVESTMENTS (continued)
March 31, 2009
| Par Value | Value | ||||||||||
| INVESTMENTS PURCHASED WITH CASH COLLATERAL FROM SECURITIES LOANED-3.6% | |||||||||||
| Money Market-3.6% | |||||||||||
| JP Morgan Prime Money Market Fund-Inst. (Cost $6,774,600) | $ | 6,774,600 | $ | 6,774,600 | |||||||
| TOTAL INVESTMENTS-102.5% (Cost $258,063,049) (e) | 194,550,523 | ||||||||||
| OTHER ASSETS & LIABILITIES (Net)-(2.5%) | (4,753,525 | ) | |||||||||
| NET ASSETS-100% | $ | 189,796,998 | |||||||||
(a) Non-income producing security.
(b) All or a portion of this security was out on loan.
(c) ADR-American Depositary Receipts
(d) GDR-Global Depositary Receipts
(e) At March 31, 2009, the unrealized appreciation of investments based on aggregate cost for federal tax purposes of $259,098,474 was as follows:
| Aggregate gross unrealized appreciation for all investments in which there is an excess of value over tax cost | $ | 10,111,113 | |||||
| Aggregate gross unrealized depreciation for all investments in which there is an excess of tax cost over value | (74,659,064 | ) | |||||
| Net unrealized appreciation / (depreciation) | $ | (64,547,951 | ) | ||||
The percentage of each investment category is calculated as a percentage of net assets.
| SECTOR ALLOCATIONS (as a percentage of Total Common and Preferred Stock) | |||||||
| Financials | 18.5 | % | |||||
| Energy | 17.3 | % | |||||
| Materials | 14.0 | % | |||||
| Telecommunication Services | 13.1 | % | |||||
| Information Technology | 10.8 | % | |||||
| Industrials | 9.4 | % | |||||
| Consumer Staples | 5.9 | % | |||||
| Utilities | 5.6 | % | |||||
| Healthcare | 3.1 | % | |||||
| Consumer Discretionary | 2.3 | % | |||||
The accompanying notes are an integral part of these financial statements.
34
QUANT FOREIGN VALUE FUND
SCHEDULE OF INVESTMENTS
March 31, 2009
| Common Stock-96.7% | |||||||||||
| Shares | Value | ||||||||||
| AUSTRALIA-3.1% | |||||||||||
| BHP Billiton Ltd. | 341,850 | $ | 7,551,911 | ||||||||
| AUSTRIA-3.1% | |||||||||||
| Andritz AG (b) | 243,460 | 7,476,982 | |||||||||
| BELGIUM-2.8% | |||||||||||
| KBC Groep N.V. | 52,156 | 843,079 | |||||||||
| Solvay S.A. | 84,380 | 5,902,311 | |||||||||
| 6,745,390 | |||||||||||
| CANADA-2.3% | |||||||||||
| Methanex Corporation | 719,207 | 5,619,567 | |||||||||
| FINLAND-9.1% | |||||||||||
| Cargotec Corp., Class B | 386,850 | 3,590,879 | |||||||||
| Kone Corporation OYJ-B | 376,800 | 7,794,632 | |||||||||
| Konecranes OYJ | 346,080 | 5,782,387 | |||||||||
| Yit OYJ | 698,367 | 4,676,654 | |||||||||
| 21,844,552 | |||||||||||
| FRANCE-6.7% | |||||||||||
| Christian Dior S.A. | 125,573 | 6,872,954 | |||||||||
| Imerys S.A. | 69,460 | 2,538,022 | |||||||||
| Tecnip S.A. | 188,600 | 6,654,979 | |||||||||
| 16,065,955 | |||||||||||
| GERMANY-10.1% | |||||||||||
| BASF SE | 205,700 | 6,216,397 | |||||||||
| Demag Cranes AG | 128,000 | 2,223,522 | |||||||||
| Hannover Rueckvers | 181,700 | 5,782,642 | |||||||||
| Muenchener Rueckvers AG | 39,900 | 4,857,085 | |||||||||
| Tognum AG | 601,900 | 5,235,863 | |||||||||
| 24,315,509 | |||||||||||
| IRELAND-7.1% | |||||||||||
| Bank of Ireland | 715,939 | 493,673 | |||||||||
| CRH PLC | 364,488 | 7,895,029 | |||||||||
| Greencore Group PLC | 4,895,391 | 4,480,044 | |||||||||
| Smurfit Kappa PLC | 2,295,113 | 4,187,768 | |||||||||
| 17,056,514 | |||||||||||
| ITALY-2.1% | |||||||||||
| Trevi Finanziaria SpA | 776,466 | 5,148,166 | |||||||||
The accompanying notes are an integral part of these financial statements.
35
QUANT FOREIGN VALUE FUND
SCHEDULE OF INVESTMENTS (continued)
March 31, 2009
| Shares | Value | ||||||||||
| JAPAN-16.4% | |||||||||||
| Asahi Breweries Ltd. | 362,300 | $ | 4,296,957 | ||||||||
| Culture Convenience Club Co., Ltd. | 310,300 | 2,112,375 | |||||||||
| Iino Kaiun Kaisha, Ltd. | 882,700 | 3,881,369 | |||||||||
| Kansai Electric Power Company Inc. | 216,100 | 4,663,950 | |||||||||
| KDDI Corporation | 904 | 4,212,072 | |||||||||
| Maruichi Steel Tube Ltd. | 166,400 | 3,540,961 | |||||||||
| Meiji Dairies Corporation | 1,140,000 | 4,654,438 | |||||||||
| Nippon Yusen Kabushiki Kaisha | 1,062,000 | 4,037,860 | |||||||||
| Showa Denko K.K. | 2,813,000 | 3,432,737 | |||||||||
| Tokyo Electric Power Company Inc. | 192,200 | 4,768,413 | |||||||||
| 39,601,132 | |||||||||||
| NORWAY-1.3% | |||||||||||
| Camillo Eitzen & Co. ASA | 649,849 | 1,036,557 | |||||||||
| DnB NOR ASA | 446,823 | 2,005,549 | |||||||||
| 3,042,106 | |||||||||||
| SOUTH AFRICA-3.2% | |||||||||||
| Metorex Ltd. (a) | 4,759,918 | 823,364 | |||||||||
| Sasol Ltd. | 241,135 | 6,951,868 | |||||||||
| 7,775,232 | |||||||||||
| SOUTH KOREA-7.1% | |||||||||||
| Samsung Electronics Company Ltd. | 24,085 | 9,889,955 | |||||||||
| SK Telecom Company Ltd. | 51,793 | 7,189,052 | |||||||||
| 17,079,007 | |||||||||||
| SPAIN-1.8% | |||||||||||
| Banco Bilbao Vizcaya Argentaria | 527,146 | 4,271,026 | |||||||||
| SWEDEN-5.7% | |||||||||||
| Autoliv Inc. (c) | 181,134 | 3,363,658 | |||||||||
| Duni AB | 1,179,500 | 4,129,897 | |||||||||
| Investor AB (b) | 502,056 | 6,341,203 | |||||||||
| 13,834,758 | |||||||||||
| THAILAND-2.0% | |||||||||||
| Thai Oil Plc | 6,724,400 | 4,834,970 | |||||||||
| UNITED KINGDOM-12.8% | |||||||||||
| Barratt Developments PLC | 3,975,894 | 5,044,851 | |||||||||
| Bellway PLC | 1,267,770 | 12,279,904 | |||||||||
| Lloyds TSB Group PLC | 1,692,427 | 1,710,703 | |||||||||
| Persimmon PLC | 1,670,288 | 8,250,582 | |||||||||
The accompanying notes are an integral part of these financial statements.
36
QUANT FOREIGN VALUE FUND
SCHEDULE OF INVESTMENTS (continued)
March 31, 2009
| Shares | Value | ||||||||||
| UNITED KINGDOM (continued) | |||||||||||
| Taylor Wimpey PLC | 11,580,983 | $ | 3,435,648 | ||||||||
| 30,721,688 | |||||||||||
| TOTAL COMMON STOCK (Cost $591,248,480) | 232,984,465 | ||||||||||
| Warrants-0.9% | |||||||||||
| UNITED KINGDOM-0.3% | |||||||||||
| CRH PLC | 35,885 | 778,972 | |||||||||
| IRELAND-0.6% | |||||||||||
| CRH PLC | 68,253 | 1,484,313 | |||||||||
| TOTAL WARRANTS-0.9% (Cost $1,134,694) | 2,263,285 | ||||||||||
| Short Term Investments-1.1% | |||||||||||
| Par Value | Value | ||||||||||
| COMMERCIAL PAPER-1.1% | |||||||||||
| HSBC Finance Corp, 0.08%, due 4/01/2009 (Cost $2,603,000) | $ | 2,603,000 | $ | 2,603,000 | |||||||
| TOTAL INVESTMENTS (EXCLUDING INVESTMENTS PURCHASED WITH CASH COLLATERAL FROM SECURITIES LOANED) 98.7% (Cost $594,986,174) | 237,850,750 | ||||||||||
| INVESTMENTS PURCHASED WITH CASH COLLATERAL FROM SECURITIES LOANED-5.7% | |||||||||||
| Money Market-5.7% | |||||||||||
| JP Morgan Prime Money Market Fund - Inst. (Cost $13,667,353) | 13,667,353 | 13,667,353 | |||||||||
| TOTAL INVESTMENTS-104.4% (Cost $608,653,527) (d) | 251,518,103 | ||||||||||
| OTHER ASSETS & LIABILITIES (NET)-(4.4%) | (10,630,436 | ) | |||||||||
| NET ASSETS-100% | $ | 240,887,667 | |||||||||
The accompanying notes are an integral part of these financial statements.
37
QUANT FOREIGN VALUE FUND
SCHEDULE OF INVESTMENTS (continued)
March 31, 2009
(a) Non-income producing security
(b) All or a portion of this security was out on loan.
(c) ADR-American Depository Receipts
(d) At March 31, 2009, the unrealized appreciation of investments based on aggregate cost for federal tax purposes of $608,653,549 was as follows:
| Aggregate gross unrealized appreciation for all investments in which there is an excess of value over tax cost | $ | 2,524,954 | |||||
| Aggregate gross unrealized depreciation for all investments in which there is an excess of tax cost over value | (359,660,400 | ) | |||||
| Net unrealized appreciation / (depreciation) | $ | (357,135,446 | ) | ||||
The percentage of each investment category is calculated as a percentage of net assets.
| SECTOR ALLOCATIONS (as a percentage of Total Common stock and Warrants) | |||||||
| Industrials | 21.6 | % | |||||
| Materials | 21.3 | % | |||||
| Consumer Discretionary | 19.3 | % | |||||
| Financials | 11.2 | % | |||||
| Energy | 7.8 | % | |||||
| Consumer Staples | 5.7 | % | |||||
| Telecommunication Services | 4.9 | % | |||||
| Information Technology | 4.2 | % | |||||
| Utilities | 4.0 | % | |||||
The accompanying notes are an integral part of these financial statements.
38
QUANT FOREIGN VALUE SMALL CAP FUND
SCHEDULE OF INVESTMENTS
March 31, 2009
| Common Stock-87.4% | |||||||||||
| Shares | Value | ||||||||||
| AUSTRALIA-2.1% | |||||||||||
| Austal Limited | 402,800 | $ | 485,214 | ||||||||
| BELGIUM-1.8% | |||||||||||
| Barco NV | 28,600 | 407,694 | |||||||||
| CHINA-10.7% | |||||||||||
| NagaCorp Ltd. | 5,660,900 | 511,304 | |||||||||
| Sichuan Expressway Company Limited (a) | 2,408,000 | 450,526 | |||||||||
| Sichuan Xinhua Winshare Chainstore Co., Ltd. | 1,722,900 | 504,640 | |||||||||
| Sinopec Kantons Holdings Limited | 3,125,000 | 504,029 | |||||||||
| VTech Holdings Limited | 115,200 | 445,189 | |||||||||
| 2,415,688 | |||||||||||
| FRANCE-1.9% | |||||||||||
| Bonduelle SA | 6,100 | 421,917 | |||||||||
| GERMANY-1.6% | |||||||||||
| Demag Cranes AG | 20,600 | 357,848 | |||||||||
| INDIA-10.0% | |||||||||||
| KRBL Limited Derivative (a) | 431,300 | 431,300 | |||||||||
| LIC Housing Finance Ltd. Derivative (a) | 102,900 | 454,818 | |||||||||
| NIIT Technologies Derivative (a) | 423,000 | 439,920 | |||||||||
| South Indian Bank Derivative (a) | 425,600 | 429,856 | |||||||||
| Usha Martin Group Derivative (a) | 952,100 | 514,134 | |||||||||
| 2,270,028 | |||||||||||
| IRELAND-5.8% | |||||||||||
| Glanbia plc | 138,900 | 381,270 | |||||||||
| Grafton Group plc | 196,700 | 443,418 | |||||||||
| Greencore Group plc | 426,500 | 390,237 | |||||||||
| IFG Group Plc | 167,800 | 100,130 | |||||||||
| 1,315,055 | |||||||||||
| ITALY-3.8% | |||||||||||
| De'Longhi SpA | 245,229 | 455,260 | |||||||||
| Trevi Finanziaria SpA | 62,100 | 411,739 | |||||||||
| 866,999 | |||||||||||
| JAPAN-5.3% | |||||||||||
| Accordia Golf Co., Ltd. | 753 | 404,769 | |||||||||
| Culture Convenience Club Co., Ltd. | 60,000 | 408,451 | |||||||||
| Iino Kaiun Kaisha, Ltd. | 86,700 | 381,234 | |||||||||
| 1,194,454 | |||||||||||
The accompanying notes are an integral part of these financial statements.
39
QUANT FOREIGN VALUE SMALL CAP FUND
SCHEDULE OF INVESTMENTS (continued)
March 31, 2009
| Shares | Value | ||||||||||
| NORWAY-6.1% | |||||||||||
| ABG Sundal Collier Holding ASA | 603,800 | $ | 387,034 | ||||||||
| SpareBank 1 Nord-Norge | 66,700 | 514,638 | |||||||||
| SpareBank 1 Midt-Norge | 130,680 | 471,181 | |||||||||
| 1,372,853 | |||||||||||
| RUSSIA-0.6% | |||||||||||
| Bank Vozrozhdenie | 17,400 | 129,282 | |||||||||
| SINGAPORE-3.7% | |||||||||||
| Breadtalk Group Ltd. | 2,138,000 | 407,626 | |||||||||
| China Fishery Group Limited | 1,087,000 | 425,210 | |||||||||
| 832,836 | |||||||||||
| SOUTH AFRICA-2.4% | |||||||||||
| Metorex Limited (a) | 238,700 | 41,290 | |||||||||
| New Clicks Holdings | 313,700 | 493,304 | |||||||||
| 534,594 | |||||||||||
| SWEDEN-5.9% | |||||||||||
| Duni AB | 122,600 | 429,271 | |||||||||
| Nolato AB | 111,900 | 475,862 | |||||||||
| Transcom WorldWide S.A. | 242,900 | 429,659 | |||||||||
| 1,334,792 | |||||||||||
| SWITZERLAND-3.7% | |||||||||||
| Bobst Group SA | 18,000 | 367,234 | |||||||||
| Vetropack Holding AG | 426 | 467,269 | |||||||||
| 834,503 | |||||||||||
| UNITED KINGDOM-22.0% | |||||||||||
| Alternative Networks PLC | 220,145 | 363,526 | |||||||||
| Character Group plc | 769,600 | 324,588 | |||||||||
| Clarkson PLC | 25,000 | 173,709 | |||||||||
| CSR plc (a) | 150,400 | 526,816 | |||||||||
| Filtrona plc | 223,600 | 413,188 | |||||||||
| Galliford Try | 886,800 | 507,143 | |||||||||
| Halfords Group plc | 110,196 | 460,432 | |||||||||
| Hampson Industries PLC | 311,900 | 403,561 | |||||||||
| Healthcare Locums plc | 280,000 | 512,405 | |||||||||
| Keller Group plc | 59,400 | 417,615 | |||||||||
| The Restaurant Group plc | 229,200 | 442,378 | |||||||||
| Vitec Group plc | 186,100 | 415,065 | |||||||||
| 4,960,426 | |||||||||||
| TOTAL COMMON STOCK (Cost $32,945,305) | 19,734,183 | ||||||||||
The accompanying notes are an integral part of these financial statements.
40
QUANT FOREIGN VALUE SMALL CAP FUND
SCHEDULE OF INVESTMENTS (continued)
March 31, 2009
| Preferred Stock-0.8% | |||||||||||
| Shares | Value | ||||||||||
| GERMANY-0.8% | |||||||||||
| Dragerwerk AG (Cost $527,966) | 8,400 | $ | 180,338 | ||||||||
| Exchange Traded Funds-3.9% | |||||||||||
| OTHER-3.9% | |||||||||||
| iShares MSCI EAFE Small Cap Index Fund | 19,500 | 440,700 | |||||||||
| SPDR S&P International Small Cap Fund | 27,600 | 443,532 | |||||||||
| TOTAL EXCHANGE TRADED FUNDS (Cost $1,447,294) | 884,232 | ||||||||||
| Short Term Investments-10.8% | |||||||||||
| Par Value | Value | ||||||||||
| COMMERCIAL PAPER-10.8% | |||||||||||
| HSBC Finance Corp, 0.08%, due 4/01/2009 (Cost $2,446,000) | $ | 2,446,000 | $ | 2,446,000 | |||||||
| TOTAL INVESTMENTS-102.9% (Cost $37,366,565) (b) | 23,244,753 | ||||||||||
| OTHER ASSETS & LIABILITIES (NET)-(2.9%) | (674,546 | ) | |||||||||
| NET ASSETS-100% | $ | 22,570,207 | |||||||||
(a) Non-income producing security
(b) At March 31, 2009, the unrealized appreciation of investments based on aggregate cost for federal tax purposes of $37,366,566 was as follows:
| Aggregate gross unrealized appreciation for all investments in which there is an excess of value over tax cost | $ | 74,538 | |||||
| Aggregate gross unrealized depreciation for all investments in which there is an excess of tax cost over value | (14,196,351 | ) | |||||
| Net unrealized appreciation / (depreciation) | $ | (14,121,813 | ) | ||||
The percentage of each investment category is calculated as a percentage of net assets.
The accompanying notes are an integral part of these financial statements.
41
QUANT FOREIGN VALUE SMALL CAP FUND
SCHEDULE OF INVESTMENTS (continued)
March 31, 2009
| SECTOR ALLOCATIONS (as a percentage of Total Common, Preferred Stock, and Exchange Traded Funds) | |||||||
| Industrials | 23.6 | % | |||||
| Consumer Discretionary | 21.8 | % | |||||
| Financials | 15.9 | % | |||||
| Information Technology | 13.1 | % | |||||
| Consumer Staples | 11.8 | % | |||||
| Materials | 4.4 | % | |||||
| Exchange Traded Funds | 4.3 | % | |||||
| Health Care | 3.3 | % | |||||
| Telecommunication Services | 1.8 | % | |||||
The accompanying notes are an integral part of these financial statements.
42
QUANT FUNDS
This page intentionally left blank.
43
QUANT FUNDS
STATEMENT OF ASSETS AND LIABILITIES
March 31, 2009
| Small Cap | Long/Short | Emerging Markets | Foreign Value | Foreign Value Small Cap | |||||||||||||||||||
| Assets: | |||||||||||||||||||||||
| Investments at value (Includes collateral from securities on loan of $6,611,099; $22,233,297; $6,774,600; $13,667,353; $0, respectively)* (Note 2) | $ | 72,925,913 | $ | 77,932,180 | $ | 192,583,523 | $ | 248,915,103 | $ | 20,798,753 | |||||||||||||
| Repurchase agreements/commercial paper | 3,172,000 | - | 1,967,000 | 2,603,000 | 2,446,000 | ||||||||||||||||||
| Foreign currency at value (Cost $1,484,550 for Emerging Markets and $561,303 for Foreign Value) | - | - | 1,511,832 | 553,922 | - | ||||||||||||||||||
| Cash | 1,397 | 588,292 | 1,858 | 890 | 877 | ||||||||||||||||||
| Dividend, interest and foreign tax reclaims receivable | 218,990 | 74,295 | 1,213,142 | 2,758,467 | 112,473 | ||||||||||||||||||
| Receivable for investments sold | 57,343 | 47,215 | - | 384,207 | - | ||||||||||||||||||
| Receivable for shares of beneficial interest sold | 12,925 | 13,787 | 103,459 | 309,511 | 2,625 | ||||||||||||||||||
| Unrealized gain/(loss) on forward foreign currency contracts (Note 2) | - | - | - | 2,885 | - | ||||||||||||||||||
| Other assets | 13,863 | 7,527 | 7,238 | 22,386 | 9,129 | ||||||||||||||||||
| Total Assets | 76,402,431 | 78,663,296 | 197,388,052 | 255,550,371 | 23,369,857 | ||||||||||||||||||
| Liabilities: | |||||||||||||||||||||||
| Securities sold short, at value (proceeds of $12,149,511) | - | 12,731,842 | - | - | - | ||||||||||||||||||
| Payable for investments purchased | 416,087 | - | 2,258 | - | 698,230 | ||||||||||||||||||
| Payable for shares of beneficial interest repurchased | 23,617 | - | 294,502 | 397,629 | 35,456 | ||||||||||||||||||
| Payable to broker on securities sold short | - | - | - | - | - | ||||||||||||||||||
| Payable for compensation of manager (Note 3) | 55,556 | 35,977 | 152,022 | 198,818 | 27,492 | ||||||||||||||||||
| Payable for distribution fees (Note 3) | 12,404 | 9,000 | 33,042 | 40,026 | 3,923 | ||||||||||||||||||
| Payable to custodian | 5,102 | 11,487 | 28,805 | 19,133 | 3,276 | ||||||||||||||||||
| Payable to transfer agent (Note 3) | 4,220 | 10,159 | 25,343 | 50,724 | 4,219 | ||||||||||||||||||
| Payable for collateral received for securities loaned | 6,611,099 | 22,233,297 | 6,774,600 | 13,667,353 | - | ||||||||||||||||||
| Payable for foreign capital gain tax | - | - | 222,951 | 258,241 | 16,683 | ||||||||||||||||||
| Payable For dividend expense on securities sold short | - | 25,640 | - | - | - | ||||||||||||||||||
| Unrealized gain/(loss) on forward foreign currency contracts (Note 2) | - | - | - | - | 410 | ||||||||||||||||||
| Other accrued expenses and liabilities | 50,382 | 8,021 | 57,531 | 30,780 | 9,961 | ||||||||||||||||||
| Total Liabilities | 7,178,467 | 35,065,423 | 7,591,054 | 14,662,704 | 799,650 | ||||||||||||||||||
| Net assets | $ | 69,223,964 | $ | 43,597,873 | $ | 189,796,998 | $ | 240,887,667 | $ | 22,570,207 | |||||||||||||
44
QUANT FUNDS
STATEMENT OF ASSETS AND LIABILITIES (continued)
March 31, 2009
The accompanying notes are an integral part of these financial statements.
45
QUANT FUNDS
STATEMENT OF ASSETS AND LIABILITIES (continued)
March 31, 2009
| Small Cap | Long/Short | Emerging Markets | Foreign Value | Foreign Value Small Cap | |||||||||||||||||||
| Net Assets Consist Of: | |||||||||||||||||||||||
| Shares of beneficial interest | $ | 128,256,941 | $ | 75,781,161 | $ | 352,411,633 | $ | 713,484,907 | $ | 37,692,989 | |||||||||||||
| Underdistributed/(overdistributed) net investment income | 188,025 | - | (165,333 | ) | 12,611,627 | 410 | |||||||||||||||||
| Accumulated net realized gain/(loss) on investments and foreign denominated assets, liabilities and currency | (36,008,956 | ) | (23,824,864 | ) | (98,804,612 | ) | (128,049,672 | ) | (1,001,888 | ) | |||||||||||||
| Unrealized appreciation/(depreciation) of investments and foreign denominated assets, liabilities and currency | (23,212,046 | ) | (8,358,424 | ) | (63,644,690 | ) | (357,159,195 | ) | (14,121,304 | ) | |||||||||||||
| Net assets | $ | 69,223,964 | $ | 43,597,873 | $ | 189,796,998 | $ | 240,887,667 | $ | 22,570,207 | |||||||||||||
| Investments at cost | $ | 99,309,959 | $ | 85,708,273 | $ | 258,063,049 | $ | 608,653,527 | $ | 37,366,565 | |||||||||||||
| Net assets | |||||||||||||||||||||||
| Ordinary Shares $61,942,814 | $ | 43,013,505 | $ | 164,132,683 | $ | 193,797,897 | $ | 1 | 8,978,433 | ||||||||||||||
| Institutional Shares | $ | 7,281,150 | $ | 584,368 | $ | 25,664,315 | $ | 47,089,770 | $ | 3,591,774 | |||||||||||||
| Shares of beneficial interest outstanding (unlimited number of shares authorized) | |||||||||||||||||||||||
| Ordinary Shares | 6,062,861 | 5,219,266 | 13,610,206 | 27,788,119 | 3,940,027 | ||||||||||||||||||
| Institutional Shares | 632,396 | 68,391 | 2,104,922 | 6,741,641 | 745,353 | ||||||||||||||||||
| Net asset value and offering price per share** | |||||||||||||||||||||||
| Ordinary Shares | $ | 10.22 | $ | 8.24 | $ | 12.06 | $ | 6.97 | $ | 4.82 | |||||||||||||
| Institutional Shares | $ | 11.51 | $ | 8.54 | $ | 12.19 | $ | 6.98 | $ | 4.82 | |||||||||||||
* Includes securities on loan to brokers with market value of $6,467,488; $22,139,012; $6,526,616; $13,012,571; $0, respectively.
** Prior to August 07, 2008, a deferred sales charge of 1% of the net asset value of the Ordinary Shares redeemed was withheld and paid to the Distributor. The fee was eliminated on this date. No deferred sales charge is withheld from redemptions of Institutional Shares. Prior to July 30, 2007 a redemption fee of 2% was withheld and paid to the Funds on redemptions of Institutional Shares made within 60 days of purchase. The fee was eliminated on this date.
46
QUANT FUNDS
STATEMENT OF ASSETS AND LIABILITIES (continued)
March 31, 2009
The accompanying notes are an integral part of these financial statements.
47
QUANT FUNDS
STATEMENT OF OPERATIONS
Year Ended March 31, 2009
| Small Cap | Long/Short | Emerging Markets | Foreign Value | Foreign Value Small Cap | |||||||||||||||||||
| Investment Income: | |||||||||||||||||||||||
| Dividends* | $ | 1,817,106 | $ | 1,328,138 | $ | 11,704,242 | $ | 21,008,440 | $ | 439,631 | |||||||||||||
| Interest | 4,621 | - | 9,872 | 103,040 | 19,550 | ||||||||||||||||||
| Sec Lending Income | 338,077 | 34,508 | 49,203 | 843,358 | - | ||||||||||||||||||
| Miscellaneous | - | - | 155 | 1,343 | - | ||||||||||||||||||
| Total Investment Income | 2,159,804 | 1,362,646 | 11,763,472 | 21,956,181 | 459,181 | ||||||||||||||||||
| Expenses: | |||||||||||||||||||||||
| Dividend expense on securities sold short | - | 426,821 | - | - | - | ||||||||||||||||||
| Stock loan fees** | - | 118,572 | - | - | - | ||||||||||||||||||
| Compensation of manager (Note 3) | 1,114,281 | 585,446 | 3,532,156 | 5,330,934 | 169,837 | ||||||||||||||||||
| Distribution fees, Ordinary Shares (Note 3) | 231,485 | 144,346 | 799,113 | 1,120,825 | 32,633 | ||||||||||||||||||
| Custodian and fund accounting fees | 63,991 | 98,807 | 440,720 | 369,763 | 34,124 | ||||||||||||||||||
| Transfer agent fees (Note 3): | |||||||||||||||||||||||
| Ordinary Shares | 159,356 | 100,353 | 519,677 | 747,641 | 22,870 | ||||||||||||||||||
| Institutional Shares | 30,546 | 1,540 | 53,938 | 140,175 | 6,409 | ||||||||||||||||||
| Audit and legal | 26,862 | 14,950 | 79,914 | 120,832 | 5,115 | ||||||||||||||||||
| Registration fees | 45,227 | 34,425 | 84,611 | 107,361 | 21,783 | ||||||||||||||||||
| Insurance | 13,020 | 6,924 | 40,051 | 61,289 | 2,047 | ||||||||||||||||||
| Compensation of trustees (Note 3) | 13,251 | 7,038 | 40,788 | 62,328 | 2,087 | ||||||||||||||||||
| Printing | 32,456 | 17,195 | 99,156 | 151,553 | 5,186 | ||||||||||||||||||
| Miscellaneous | 56,602 | 36,076 | 144,595 | 213,814 | 32,482 | ||||||||||||||||||
| Total expenses before waivers/ reimbursements/reductions | 1,787,077 | 1,592,493 | 5,834,719 | 8,426,515 | 334,573 | ||||||||||||||||||
| Waivers and/or reimbursements of expenses (Note 3) | - | - | - | - | (274 | ) | |||||||||||||||||
| Fees reduced by credits allowed by custodian (Note 3) | (452 | ) | (805 | ) | - | (133 | ) | (4,351 | ) | ||||||||||||||
| Expenses, net | 1,786,625 | 1,591,688 | 5,834,719 | 8,426,382 | 329,948 | ||||||||||||||||||
| Net investment income/(loss) | 373,179 | (229,042 | ) | 5,928,753 | 13,529,799 | 129,233 | |||||||||||||||||
| Realized and unrealized gain/(loss) on investments, foreign currency, and foreign translation: | |||||||||||||||||||||||
| Net realized gain/(loss) (Note 2) on: | |||||||||||||||||||||||
| Investments | (36,194,761 | ) | (31,423,362 | ) | (97,625,022 | ) | (126,372,006 | ) | (933,324 | ) | |||||||||||||
| Securities sold short transactions | - | 8,412,705 | - | - | - | ||||||||||||||||||
| Foreign denominated assets, liabilities, and currency | (464 | ) | - | (1,601,609 | ) | (719,852 | ) | (46,419 | ) | ||||||||||||||
| Change in unrealized appreciation/(depreciation) of: | |||||||||||||||||||||||
| Investments | (31,601,323 | ) | (4,495,603 | ) | (169,287,642 | ) | (327,651,156 | ) | (14,121,812 | ) | |||||||||||||
| Securities sold short transactions | - | (2,300,731 | ) | - | - | - | |||||||||||||||||
| Foreign denominated assets, liabilities, and currency | - | - | 183,100 | (53,251 | ) | 508 | |||||||||||||||||
| Net realized and unrealized gain/(loss) on invesment and foreign currency | (67,796,548 | ) | (29,806,991 | ) | (268,331,173 | ) | (454,796,265 | ) | (15,101,047 | ) | |||||||||||||
| Net increase/(decrease) in net assets resulting from operations | $ | (67,423,369 | ) | $ | (30,036,033 | ) | $ | (262,402,420 | ) | $ | (441,266,466 | ) | $ | (14,971,814 | ) | ||||||||
* Dividends are net of witholding taxes of $11,241 for Small Cap., $28 for Long/Short, net of foreign withholding taxes of $1,560,596 for Emerging Markets, $2,273,390 for Foreign Value, and $28,583 for Foreign Value Small Cap.
** Stock loan fees of $104,145 are offset by credit for balances of ($67) on cash collateral for short sale borrowings at Morgan Stanley, Long/Short Fund's prime broker, through November 7,2008. Stock loan fees were $14,494 for short sale borrowings at State Street.
48
QUANT FUNDS
STATEMENT OF OPERATIONS (continued)
Year Ended March 31, 2009
The accompanying notes are an integral part of these financial statements.
49
QUANT FUNDS
STATEMENT OF CHANGES IN NET ASSETS
| Small Cap | |||||||||||
| Year Ended March 31, 2009 | Year Ended March 31, 2008 | ||||||||||
| Increase (Decrease) in Net Assets: | |||||||||||
| Operations: | |||||||||||
| Net investment income/(loss) | $ | 373,179 | $ | 541,002 | |||||||
| Net realized gain/(loss) on investments Foreign denominated assets, liabilities, and currency | (36,195,225 | ) | 3,687,730 | ||||||||
| Unrealized appreciation/(depreciation) of investments, foreign denominated assets, liabilities, and currency | (31,601,323 | ) | (32,356,469 | ) | |||||||
| Net increase/(decrease) from operations | (67,423,369 | ) | (28,127,737 | ) | |||||||
| Distributions to shareholders from: | |||||||||||
| Net investment income | |||||||||||
| Ordinary shares | - | (695,910 | ) | ||||||||
| Institutional shares | - | (212,209 | ) | ||||||||
| Net realized gains | |||||||||||
| Ordinary shares | (381,648 | ) | (5,163,768 | ) | |||||||
| Institutional shares | (40,740 | ) | (912,696 | ) | |||||||
| Total distributions | (422,388 | ) | (6,984,583 | ) | |||||||
| Fund share transactions (Note 8) | (7,161,857 | ) | 41,945,963 | ||||||||
| Contributions to capital from investment manager/brokers | 82 | - | |||||||||
| Increase/(decrease) in net assets | (75,007,532 | ) | 6,833,643 | ||||||||
| Net assets beginning of period | 144,231,496 | 137,397,853 | |||||||||
| Net assets end of period* | $ | 69,223,964 | $ | 144,231,496 | |||||||
| * Includes undistributed net investment income/(loss) of: | $ | 188,025 | $ | - | |||||||
The accompanying notes are an integral part of these financial statements.
50
QUANT FUNDS
STATEMENT OF CHANGES IN NET ASSETS (continued)
| Long/Short | |||||||||||
| Year Ended March 31, 2009 | Year Ended March 31, 2008 | ||||||||||
| Increase (Decrease) in Net Assets: | |||||||||||
| Operations: | |||||||||||
| Net investment income/(loss) | $ | (229,042 | ) | $ | (414,875 | ) | |||||
| Net realized gain/(loss) on investments Foreign denominated assets, liabilities, and currency | (23,010,657 | ) | 708,912 | ||||||||
| Unrealized appreciation/(depreciation) of investments, foreign denominated assets, liabilities, and currency | (6,796,334 | ) | (12,384,086 | ) | |||||||
| Net increase/(decrease) from operations | (30,036,033 | ) | (12,090,049 | ) | |||||||
| Distributions to shareholders from: | |||||||||||
| Net investment income | |||||||||||
| Ordinary shares | (59,856 | ) | - | ||||||||
| Institutional shares | (3,214 | ) | - | ||||||||
| Net realized gains | |||||||||||
| Ordinary shares | - | (2,784,569 | ) | ||||||||
| Institutional shares | - | (40,493 | ) | ||||||||
| Total distributions | (63,070 | ) | (2,825,062 | ) | |||||||
| Fund share transactions (Note 8) | 2,920,805 | 9,036,626 | |||||||||
| Contributions to capital from investment manager/brokers | - | - | |||||||||
| Increase/(decrease) in net assets | (27,178,298 | ) | (5,878,485 | ) | |||||||
| Net assets beginning of period | 70,776,171 | 76,654,656 | |||||||||
| Net assets end of period* | $ | 43,597,873 | $ | 70,776,171 | |||||||
| * Includes undistributed net investment income/(loss) of: | $ | - | $ | - | |||||||
The accompanying notes are an integral part of these financial statements.
51
QUANT FUNDS
STATEMENT OF CHANGES IN NET ASSETS (continued)
| Emerging Markets | |||||||||||
| Year Ended March 31, 2009 | Year Ended March 31, 2008 | ||||||||||
| Increase (Decrease) in Net Assets: | |||||||||||
| Operations: | |||||||||||
| Net investment income/(loss) | $ | 5,928,753 | $ | 4,342,943 | |||||||
| Net realized gain/(loss) on investments Foreign denominated assets, liabilities, and currency | (99,226,631 | ) | 14,231,373 | ||||||||
| Unrealized appreciation/(depreciation) of investments, foreign denominated assets, liabilities, and currency | (169,104,542 | ) | 25,577,768 | ||||||||
| Net increase/(decrease) from operations | (262,402,420 | ) | 44,152,084 | ||||||||
| Distributions to shareholders from: | |||||||||||
| Net investment income | |||||||||||
| Ordinary shares | (5,862,199 | ) | (2,737,870 | ) | |||||||
| Institutional shares | (959,785 | ) | (245,672 | ) | |||||||
| Net realized gains | |||||||||||
| Ordinary shares | (1,700,443 | ) | (13,996,034 | ) | |||||||
| Institutional shares | (252,143 | ) | (912,227 | ) | |||||||
| Total distributions | (8,774,570 | ) | (17,891,803 | ) | |||||||
| Fund share transactions (Note 8) | (70,992,161 | ) | 216,245,548 | ||||||||
| Contributions to capital from investment manager/brokers | 3,640 | - | |||||||||
| Increase/(decrease) in net assets | (342,165,511 | ) | 242,505,829 | ||||||||
| Net assets beginning of period | 531,962,509 | 289,456,680 | |||||||||
| Net assets end of period* | $ | 189,796,998 | $ | 531,962,509 | |||||||
| * Includes undistributed net investment income/(loss) of: | $ | (165,333 | ) | $ | 1,158,902 | ||||||
The accompanying notes are an integral part of these financial statements.
52
QUANT FUNDS
STATEMENT OF CHANGES IN NET ASSETS (continued)
| Foreign Value | |||||||||||
| Year Ended March 31, 2009 | Year Ended March 31, 2008 | ||||||||||
| Increase (Decrease) in Net Assets: | |||||||||||
| Operations: | |||||||||||
| Net investment income/(loss) | $ | 13,529,799 | $ | 9,809,059 | |||||||
| Net realized gain/(loss) on investments Foreign denominated assets, liabilities, and currency | (127,091,858 | ) | 114,355,156 | ||||||||
| Unrealized appreciation/(depreciation) of investments, foreign denominated assets, liabilities, and currency | (327,704,407 | ) | (250,177,422 | ) | |||||||
| Net increase/(decrease) from operations | (441,266,466 | ) | (126,013,207 | ) | |||||||
| Distributions to shareholders from: | |||||||||||
| Net investment income | |||||||||||
| Ordinary shares | (2,839,312 | ) | (8,306,521 | ) | |||||||
| Institutional shares | (913,157 | ) | (1,625,215 | ) | |||||||
| Net realized gains | |||||||||||
| Ordinary shares | (36,958,948 | ) | (47,842,406 | ) | |||||||
| Institutional shares | (8,845,161 | ) | (7,292,444 | ) | |||||||
| Total distributions | (49,556,578 | ) | (65,066,586 | ) | |||||||
| Fund share transactions (Note 8) | (190,425,771 | ) | 219,910,761 | ||||||||
| Contributions to capital from investment manager/brokers | 1,812 | - | |||||||||
| Increase/(decrease) in net assets | (681,247,003 | ) | 28,830,968 | ||||||||
| Net assets beginning of period | 922,134,670 | 893,303,702 | |||||||||
| Net assets end of period* | $ | 240,887,667 | $ | 922,134,670 | |||||||
| * Includes undistributed net investment income/(loss) of: | $ | 12,611,627 | $ | 4,568,838 | |||||||
The accompanying notes are an integral part of these financial statements.
53
QUANT FUNDS
STATEMENT OF CHANGES IN NET ASSETS (continued)
| Foreign Value Small Cap | |||||||
| Period Ended March 31, 2009 | |||||||
| Increase (Decrease) in Net Assets: | |||||||
| Operations: | |||||||
| Net investment income/(loss) | $ | 129,233 | |||||
| Net realized gain/(loss) on investments Foreign denominated assets, liabilities, and currency | (979,743 | ) | |||||
| Unrealized appreciation/(depreciation) of investments, foreign denominated assets, liabilities, and currency | (14,121,304 | ) | |||||
| Net increase/(decrease) from operations | (14,971,814 | ) | |||||
| Distributions to shareholders from: | |||||||
| Net investment income | |||||||
| Ordinary shares | (113,257 | ) | |||||
| Institutional shares | (27,588 | ) | |||||
| Net realized gains | |||||||
| Ordinary shares | (56,483 | ) | |||||
| Institutional shares | (12,325 | ) | |||||
| Total distributions | (209,653 | ) | |||||
| Fund share transactions (Note 8) | 37,751,610 | ||||||
| Contributions to capital from investment manager/brokers | 64 | ||||||
| Increase/(decrease) in net assets | 22,570,207 | ||||||
| Net assets beginning of period | - | ||||||
| Net assets end of period* | $ | 22,570,207 | |||||
| * Includes undistributed net investment income/(loss) of: | $ | 410 | |||||
The accompanying notes are an integral part of these financial statements.
54
QUANT LONG/SHORT FUND
STATEMENT OF CASH FLOWS
Year Ended March 31, 2009
| Increase (Decrease) in cash- | |||||||
| Cash flows from operating activities: | |||||||
| Net increase/(decrease) in net assets from operations | $ | (30,036,033 | ) | ||||
| Purchase of investment securities | (157,149,129 | ) | |||||
| Sale of investment securities | 155,953,939 | ||||||
| Decrease in deposits with brokers for short sales | (9,342 | ) | |||||
| Increase in dividends and interest receivable | 1,031 | ||||||
| Decrease in accrued expenses | (12,096 | ) | |||||
| Increase in securities sold short | (9,997,929 | ) | |||||
| Increase in dividends payable for securities sold short | (5,775 | ) | |||||
| Unrealized appreciation on securities | 6,796,334 | ||||||
| Net realized gains from investments | 31,424,461 | ||||||
| Net cash used in operating activities | 27,001,494 | ||||||
| Cash flows from financing activities: | |||||||
| Proceeds from shares sold | 9,623,783 | ||||||
| Payment on shares redeemed | (6,869,151 | ) | |||||
| Cash distributions paid | (5,048 | ) | |||||
| Net cash provided by financing activities | 2,749,584 | ||||||
| Net increase/(decrease) in cash | (284,955 | ) | |||||
| Cash: | |||||||
| Beginning balance-04/01/08 | 873,247 | ||||||
| Ending balance-03/31/09 | $ | 588,292 | |||||
Supplemental disclosure of cash flow information:
Noncash financing activities that are excluded consist of reinvestment of dividend and capital gain distributions of $58,022. For purposes of reporting the statement of cash flows, the Fund considers all cash accounts that are not subject to withdrawal restrictions or penalties to be cash equivalents. Security and Exchange Commission regulations do not require cash flow statements for Small Cap, Emerging Markets, Foreign Value, and Foreign Value Small Cap Funds.
The accompanying notes are an integral part of these financial statements.
55
QUANT SMALL CAP FUND
FINANCIAL HIGHLIGHTS
(For a share outstanding throughout each period)
| Ordinary Shares | |||||||||||||||||||||||
| Years Ending March 31, | |||||||||||||||||||||||
| 2009 | 2008 | 2007 | 2006 | 2005 | |||||||||||||||||||
| Net Asset Value, Beginning of Period | $ | 19.45 | $ | 23.88 | $ | 22.99 | $ | 21.13 | $ | 19.93 | |||||||||||||
| Income from Investment Operations: | |||||||||||||||||||||||
| Net investment income (loss) (a)(b)(c) | 0.06 | 0.07 | (0.19 | ) | (0.22 | ) | (0.24 | ) | |||||||||||||||
| Net realized and unrealized gain/(loss) on securities | (9.23 | ) | (3.56 | ) | 2.91 | 5.16 | 2.18 | ||||||||||||||||
| Total from Investment Operations | (9.17 | ) | (3.49 | ) | 2.72 | 4.94 | 1.94 | ||||||||||||||||
| Less Distributions: | |||||||||||||||||||||||
| Dividends from net investment income | - | (0.11 | ) | - | - | - | |||||||||||||||||
| Distributions from realized capital gains | (0.06 | ) | (0.83 | ) | (1.83 | ) | (3.08 | ) | (0.74 | ) | |||||||||||||
| Total Distributions | (0.06 | ) | (0.94 | ) | (1.83 | ) | (3.08 | ) | (0.74 | ) | |||||||||||||
| Net Asset Value, End of Period | $ | 10.22 | $ | 19.45 | $ | 23.88 | $ | 22.99 | $ | 21.13 | |||||||||||||
| Total Return (d) | (47.11 | )% | (15.17 | )% | 12.01 | % | 24.51 | % | 9.76 | % | |||||||||||||
| Net Assets, End of Period (000's) | $ | 61,943 | $ | 119,949 | $ | 124,998 | $ | 98,879 | $ | 80,199 | |||||||||||||
| Ratios and Supplemental Data: | |||||||||||||||||||||||
| Ratios of expenses to average net assets: (e) | |||||||||||||||||||||||
| Gross | 1.64 | %* | 1.59 | %* | 1.82 | % | 1.88 | % | 1.98 | % | |||||||||||||
| Net | 1.64 | %* | 1.59 | %* | 1.82 | % | 1.88 | % | 1.98 | % | |||||||||||||
| Ratio of net investment income (loss) to average net assets (c) | 0.31 | % | 0.31 | % | (0.80 | )% | (1.00 | )% | (1.17 | )% | |||||||||||||
| Portfolio Turnover | 72 | % | 39 | % | 41 | % | 57 | % | 43 | % | |||||||||||||
* Expense ratio decline from the prior year was the result of the reduction of the 12b-1 fee from 50 basis points to 25 basis pointson June 1, 2007.
The accompanying notes are an integral part of these financial statements.
56
QUANT SMALL CAP FUND
FINANCIAL HIGHLIGHTS (continued)
(For a share outstanding throughout each period)
| Institutional Shares | |||||||||||||||||||||||
| Years Ending March 31, | |||||||||||||||||||||||
| 2009 | 2008 | 2007 | 2006 | 2005 | |||||||||||||||||||
| Net Asset Value, Beginning of Period | $ | 21.86 | $ | 26.71 | $ | 25.39 | $ | 22.96 | $ | 21.48 | |||||||||||||
| Income from Investment Operations: | |||||||||||||||||||||||
| Net investment income (loss) (a)(b)(c) | 0.10 | 0.12 | (0.08 | ) | (0.12 | ) | (0.14 | ) | |||||||||||||||
| Net realized and unrealized gain/(loss) on securities | (10.39 | ) | (3.94 | ) | 3.23 | 5.63 | 2.36 | ||||||||||||||||
| Total from Investment Operations | (10.29 | ) | (3.82 | ) | 3.15 | 5.51 | 2.22 | ||||||||||||||||
| Less Distributions: | |||||||||||||||||||||||
| Dividends from net investment income | - | (0.20 | ) | - | - | - | |||||||||||||||||
| Distributions from realized capital gains | (0.06 | ) | (0.83 | ) | (1.83 | ) | (3.08 | ) | (0.74 | ) | |||||||||||||
| Total Distributions | (0.06 | ) | (1.03 | ) | (1.83 | ) | (3.08 | ) | (0.74 | ) | |||||||||||||
| Net Asset Value, End of Period | $ | 11.51 | $ | 21.86 | $ | 26.71 | $ | 25.39 | $ | 22.96 | |||||||||||||
| Total Return (d) | (47.04 | )% | (14.87 | )% | 12.58 | % | 25.06 | % | 10.37 | % | |||||||||||||
| Net Assets, End of Period (000's) | $ | 7,281 | $ | 24,282 | $ | 12,400 | $ | 12,298 | $ | 9,616 | |||||||||||||
| Ratios and Supplemental Data: | |||||||||||||||||||||||
| Ratios of expenses to average net assets: (e) | |||||||||||||||||||||||
| Gross | 1.42 | % | 1.30 | % | 1.31 | % | 1.38 | % | 1.48 | % | |||||||||||||
| Net | 1.42 | % | 1.30 | % | 1.31 | % | 1.38 | % | 1.48 | % | |||||||||||||
| Ratio of net investment income (loss) to average net assets (c) | 0.48 | % | 0.45 | % | (0.30 | )% | (0.50 | )% | (0.65 | )% | |||||||||||||
| Portfolio Turnover | 72 | % | 39 | % | 41 | % | 57 | % | 43 | % | |||||||||||||
(a) Per share numbers have been calculated using the average shares method.
(b) Reflects expense waivers/reimbursements and reductions in effect during the period. See Note 3 to the Financial Statements.
(c) Net investment income (loss) per share and the ratio of net investment income (loss) to average net assets reflect net investment income prior to certain reclassifications for federal income or excise taxes.
(d) Total Return does not include the deferred sales charge of 1% for the Ordinary Shares. The total return would have been lower if certain fees had not been waived or if custodial fees had not been reduced by credits allowed by the custodian. See Note 3 to the financial statements.
(e) Ratios of expenses to average net assets:
- Gross (total expenses before fee waivers, reimbursements by the investment advisor, and custody earnings credits, if any).
- Net (total expenses net of fee waivers, reimbursements by the investment advisor, and custody earnings credits, if any).
The accompanying notes are an integral part of these financial statements.
57
QUANT LONG/SHORT FUND
FINANCIAL HIGHLIGHTS
(For a share outstanding throughout each period)
| Ordinary Shares | |||||||||||||||||||||||
| Years Ended March 31, | |||||||||||||||||||||||
| 2009 | 2008 | 2007 | 2006 | 2005 | |||||||||||||||||||
| Net Asset Value, Beginning of Period | $ | 14.07 | $ | 17.04 | $ | 14.76 | $ | 12.88 | $ | 12.19 | |||||||||||||
| Income from Investment Operations: | |||||||||||||||||||||||
| Net investment income (loss) (a)(b)(c) | (0.04 | ) | (0.09 | ) | (0.02 | ) | 0.03 | 0.01 | |||||||||||||||
| Net realized and unrealized gain/(loss) on securities | (5.78 | ) | (2.30 | ) | 2.33 | 1.86 | 0.68 | ||||||||||||||||
| Total from Investment Operations | (5.82 | ) | (2.39 | ) | 2.31 | 1.89 | 0.69 | ||||||||||||||||
| Less Distributions: | |||||||||||||||||||||||
| Dividends from net investment income | (0.01 | ) | - | (0.03 | ) | (0.01 | ) | - | |||||||||||||||
| Distributions from realized capital gains | - | (0.58 | ) | - | - | - | |||||||||||||||||
| Total Distributions | (0.01 | ) | (0.58 | ) | (0.03 | ) | (0.01 | ) | - | ||||||||||||||
| Net Asset Value, End of Period | $ | 8.24 | $ | 14.07 | $ | 17.04 | $ | 14.76 | $ | 12.88 | |||||||||||||
| Total Return (d) | (41.36 | )% | (14.43 | )% | 15.63 | % | 14.67 | % | 5.66 | % | |||||||||||||
| Net Assets, End of Period (000's) | $ | 43,014 | $ | 69,767 | $ | 75,376 | $ | 59,975 | $ | 46,015 | |||||||||||||
| Ratios and Supplemental Data: | |||||||||||||||||||||||
| Ratios of expenses to average net assets: (e) | |||||||||||||||||||||||
| Gross | 2.71 | % | 2.18 | % | 1.74 | % | 1.65 | % | 1.77 | % | |||||||||||||
| Net including dividend and interest expense for securities sold short | 2.71 | % | 2.12 | % | 1.71 | % | 1.61 | % | 1.76 | % | |||||||||||||
| Net excluding dividend and interest expense for securities sold short | 1.98 | % | 1.90 | % | 1.69 | % | - | - | |||||||||||||||
| Ratio of net investment income (loss) to average net assets (c) | (0.38 | )% | (0.52 | )% | (0.14 | )% | 0.21 | % | 0.08 | % | |||||||||||||
| Portfolio Turnover Excluding Short Positions (f) | 207 | % | 171 | % | 83 | % | 105 | % | 160 | % | |||||||||||||
Note: This fund changed its investment strategy on November 1, 2006.
The accompanying notes are an integral part of these financial statements.
58
QUANT LONG/SHORT FUND
FINANCIAL HIGHLIGHTS (continued)
(For a share outstanding throughout each period)
| Institutional Shares | |||||||||||||||||||||||
| Years Ending March 31, | |||||||||||||||||||||||
| 2009 | 2008 | 2007 | 2006 | 2005 | |||||||||||||||||||
| Net Asset Value, Beginning of Period | $ | 14.71 | $ | 17.80 | $ | 15.40 | $ | 13.43 | $ | 12.65 | |||||||||||||
| Income from Investment Operations: | |||||||||||||||||||||||
| Net investment income (loss) (a)(b)(c) | (0.10 | ) | (0.10 | ) | 0.06 | 0.10 | 0.07 | ||||||||||||||||
| Net realized and unrealized gain/(loss) on securities | (6.02 | ) | (2.41 | ) | 2.44 | 1.94 | 0.71 | ||||||||||||||||
| Total from Investment Operations | (6.12 | ) | (2.51 | ) | 2.50 | 2.04 | 0.78 | ||||||||||||||||
| Less Distributions: | |||||||||||||||||||||||
| Dividends from net investment income | (0.05 | ) | - | (0.10 | ) | (0.07 | ) | - | |||||||||||||||
| Distributions from realized capital gains | - | (0.58 | ) | - | - | - | |||||||||||||||||
| Total Distributions | (0.05 | ) | (0.58 | ) | (0.10 | ) | (0.07 | ) | - | ||||||||||||||
| Net Asset Value, End of Period | $ | 8.54 | $ | 14.71 | $ | 17.80 | $ | 15.40 | $ | 13.43 | |||||||||||||
| Total Return (d) | (41.66 | )% | (14.49 | )% | 16.22 | % | 15.19 | % | 6.17 | % | |||||||||||||
| Net Assets, End of Period (000's) | $ | 584 | $ | 1,009 | $ | 1,279 | $ | 984 | $ | 825 | |||||||||||||
| Ratios and Supplemental Data: | |||||||||||||||||||||||
| Ratios of expenses to average net assets: (e) | |||||||||||||||||||||||
| Gross | 3.19 | % | 2.23 | % | 1.25 | % | 1.16 | % | 1.27 | % | |||||||||||||
| Net including dividend and interest expense for securities sold short | 3.19 | % | 2.17 | % | 1.22 | % | 1.11 | % | 1.26 | % | |||||||||||||
| Net excluding dividend and interest expense for securities sold short | 2.46 | % | 1.95 | % | 1.20 | % | - | - | |||||||||||||||
| Ratio of net investment income (loss) to average net assets (c) | (0.86 | )% | (0.56 | )% | 0.35 | % | 0.71 | % | 0.54 | % | |||||||||||||
| Portfolio Turnover Excluding Short Positions (f) | 207 | % | 171 | % | 83 | % | 105 | % | 160 | % | |||||||||||||
Note: This fund changed its investment strategy on November 1, 2006 from Growth & Income to Long/Short.
(a) Per share numbers have been calculated using the average shares method.
(b) Reflects expense waivers/reimbursements and reductions in effect during the period. See Note 3 to the Financial Statements.
(c) Net investment income (loss) per share and the ratio of net investment income (loss) to average net assets reflect net investment income prior to certain reclassifications for federal income or excise taxes.
(d) Total Return does not include the deferred sales charge of 1% for the Ordinary Shares. The total return would have been lower if certain fees had not been waived or if custodial fees had not been reduced by credits allowed by the custodian. See Note 3 to the financial statements.
(e) Ratios of expenses to average net assets:
- Gross (total expenses before fee waivers, reimbursements by the investment advisor, and custody earnings credits, if any).
- Net (total expenses net fee waivers, reimbursements by the investment advisor, and custody earnings credits, if any).
(f) Portfolio turnover is calculated on long security positions only. Short positions are generally held for less than one year.
The accompanying notes are an integral part of these financial statements.
59
QUANT EMERGING MARKETS FUND
FINANCIAL HIGHLIGHTS
(For a share outstanding throughout each period)
| Ordinary Shares | |||||||||||||||||||||||
| Years Ended March 31, | |||||||||||||||||||||||
| 2009 | 2008 | 2007 | 2006 | 2005 | |||||||||||||||||||
| Net Asset Value, Beginning of Period | $ | 27.04 | $ | 23.34 | $ | 19.85 | $ | 14.23 | $ | 12.71 | |||||||||||||
| Income from Investment Operations: | |||||||||||||||||||||||
| Net investment income (loss) (a)(b)(c) | 0.33 | 0.26 | 0.16 | 0.21 | 0.14 | ||||||||||||||||||
| Net realized and unrealized gain/(loss) on securities | (14.76 | ) | 4.42 | 4.02 | 6.28 | 1.86 | |||||||||||||||||
| Total from Investment Operations | (14.43 | ) | 4.68 | 4.18 | 6.49 | 2.00 | |||||||||||||||||
| Less Distributions: | |||||||||||||||||||||||
| Dividends from net investment income | (0.43 | ) | (0.16 | ) | (0.22 | ) | (0.22 | ) | (0.20 | ) | |||||||||||||
| Distributions from realized capital gains | (0.12 | ) | (0.82 | ) | (0.47 | ) | (0.65 | ) | (0.28 | ) | |||||||||||||
| Total Distributions | (0.55 | ) | (0.98 | ) | (0.69 | ) | (0.87 | ) | (0.48 | ) | |||||||||||||
| Net Asset Value, End of Period | $ | 12.06 | $ | 27.04 | $ | 23.34 | $ | 19.85 | $ | 14.23 | |||||||||||||
| Total Return (d) | (53.27 | )% | 19.35 | % | 21.36 | % | 46.77 | % | 15.89 | % | |||||||||||||
| Net Assets, End of Period (000's) | $ | 164,133 | $ | 491,462 | $ | 276,698 | $ | 144,088 | $ | 61,681 | |||||||||||||
| Ratios and Supplemental Data: | |||||||||||||||||||||||
| Ratios of expenses to average net assets: (e) | |||||||||||||||||||||||
| Gross | 1.67 | % | 1.60 | % | 1.67 | % | 1.83 | % | 1.96 | % | |||||||||||||
| Net | 1.67 | % | 1.60 | % | 1.67 | % | 1.83 | % | 1.96 | % | |||||||||||||
| Ratio of net investment income (loss) to average net assets (c) | 1.66 | % | 0.91 | % | 0.77 | % | 1.23 | % | 1.12 | % | |||||||||||||
| Portfolio Turnover | 67 | % | 18 | % | 24 | % | 34 | % | 53 | % | |||||||||||||
The accompanying notes are an integral part of these financial statements.
60
QUANT EMERGING MARKETS FUND
FINANCIAL HIGHLIGHTS (continued)
(For a share outstanding throughout each period)
| Institutional Shares | |||||||||||||||||||||||
| Years Ending March 31, | |||||||||||||||||||||||
| 2009 | 2008 | 2007 | 2006 | 2005 | |||||||||||||||||||
| Net Asset Value, Beginning of Period | $ | 27.46 | $ | 23.67 | $ | 20.11 | $ | 14.39 | $ | 12.82 | |||||||||||||
| Income from Investment Operations: | |||||||||||||||||||||||
| Net investment income (loss) (a)(b)(c) | 0.34 | 0.33 | 0.21 | 0.29 | 0.24 | ||||||||||||||||||
| Net realized and unrealized gain/(loss) on securities | (14.98 | ) | 4.50 | 4.08 | 6.35 | 1.84 | |||||||||||||||||
| Total from Investment Operations | (14.64 | ) | 4.83 | 4.29 | 6.64 | 2.08 | |||||||||||||||||
| Less Distributions: | |||||||||||||||||||||||
| Dividends from net investment income | (0.51 | ) | (0.22 | ) | (0.26 | ) | (0.27 | ) | (0.23 | ) | |||||||||||||
| Distributions from realized capital gains | (0.12 | ) | (0.82 | ) | (0.47 | ) | (0.65 | ) | (0.28 | ) | |||||||||||||
| Total Distributions | (0.63 | ) | (1.04 | ) | (0.73 | ) | (0.92 | ) | (0.51 | ) | |||||||||||||
| Net Asset Value, End of Period | $ | 12.19 | $ | 27.46 | $ | 23.67 | $ | 20.11 | $ | 14.39 | |||||||||||||
| Total Return (d) | (53.17 | )% | 19.67 | % | 21.68 | % | 47.39 | % | 16.42 | % | |||||||||||||
| Net Assets, End of Period (000's) | $ | 25,664 | $ | 40,501 | $ | 12,759 | $ | 1,707 | $ | 1,082 | |||||||||||||
| Ratios and Supplemental Data: | |||||||||||||||||||||||
| Ratios of expenses to average net assets: (e) | |||||||||||||||||||||||
| Gross | 1.48 | % | 1.39 | % | 1.41 | % | 1.45 | % | 1.46 | % | |||||||||||||
| Net | 1.48 | % | 1.39 | % | 1.41 | % | 1.45 | % | 1.46 | % | |||||||||||||
| Ratio of net investment income (loss) to average net assets (c) | 1.82 | % | 1.12 | % | 1.02 | % | 1.75 | % | 1.84 | % | |||||||||||||
| Portfolio Turnover | 67 | % | 18 | % | 24 | % | 34 | % | 53 | % | |||||||||||||
(a) Per share numbers have been calculated using the average shares method.
(b) Reflects expense waivers/reimbursements and reductions in effect during the period. See Note 3 to the Financial Statements.
(c) Net investment income (loss) per share and the ratio of net investment income (loss) to average net assets reflect net investment income prior to certain reclassifications for federal income or excise taxes.
(d) Total Return does not include the deferred sales charge of 1% for the Ordinary Shares. The total return would have been lower if certain fees had not been waived or if custodial fees had not been reduced by credits allowed by the custodian. See Note 3 to the financial statements.
(e) Ratios of expenses to average net assets:
- Gross (total expenses before fee waivers, reimbursements by the investment advisor, and custody earnings credits, if any).
- Net (total expenses net of fee waivers, reimbursements by the investment advisor, and custody earnings credits, if any).
The accompanying notes are an integral part of these financial statements.
61
QUANT FOREIGN VALUE FUND
FINANCIAL HIGHLIGHTS
(For a share outstanding throughout each period)
| Ordinary Shares | |||||||||||||||||||||||
| Years Ended March 31, | |||||||||||||||||||||||
| 2009 | 2008 | 2007 | 2006 | 2005 | |||||||||||||||||||
| Net Asset Value, Beginning of Period | $ | 19.87 | $ | 23.07 | $ | 19.91 | $ | 15.92 | $ | 13.50 | |||||||||||||
| Income from Investment Operations: | |||||||||||||||||||||||
| Net investment income (loss) (a)(b)(c) | 0.35 | 0.19 | 0.18 | 0.24 | (f) | 0.15 | |||||||||||||||||
| Net realized and unrealized gain/(loss) on securities | (11.53 | ) | (2.11 | ) | 4.12 | 3.96 | 2.66 | ||||||||||||||||
| Total from Investment Operations | (11.18 | ) | (1.92 | ) | 4.30 | 4.20 | 2.81 | ||||||||||||||||
| Less Distributions: | |||||||||||||||||||||||
| Dividends from net investment income | (0.11 | ) | (0.19 | ) | (0.07 | ) | (0.13 | ) | (0.12 | ) | |||||||||||||
| Distributions from realized capital gains | (1.61 | ) | (1.09 | ) | (1.07 | ) | (0.08 | ) | (0.27 | ) | |||||||||||||
| Total Distributions | (1.72 | ) | (1.28 | ) | (1.14 | ) | (0.21 | ) | (0.39 | ) | |||||||||||||
| Net Asset Value, End of Period | $ | 6.97 | $ | 19.87 | $ | 23.07 | $ | 19.91 | $ | 15.92 | |||||||||||||
| Total Return (d) | (55.95 | )% | (8.71 | )% | 22.08 | % | 26.59 | % | 20.99 | % | |||||||||||||
| Net Assets, End of Period (000's) | $ | 193,798 | $ | 781,136 | $ | 778,104 | $ | 441,614 | $ | 202,655 | |||||||||||||
| Ratios and Supplemental Data: | |||||||||||||||||||||||
| Ratios of expenses to average net assets: (e) | |||||||||||||||||||||||
| Gross | 1.62 | % | 1.56 | % | 1.60 | % | 1.69 | % | 1.80 | % | |||||||||||||
| Net | 1.62 | % | 1.56 | % | 1.60 | % | 1.69 | % | 1.80 | % | |||||||||||||
| Ratio of net investment income (loss) to average net assets (c) | 2.49 | % | 0.83 | % | 0.88 | % | 1.41 | %(f) | 1.04 | % | |||||||||||||
| Portfolio Turnover | 20 | % | 44 | % | 19 | % | 29 | % | 10 | % | |||||||||||||
The accompanying notes are an integral part of these financial statements.
62
QUANT FOREIGN VALUE FUND
FINANCIAL HIGHLIGHTS (continued)
(For a share outstanding throughout each period)
| Institutional Shares | |||||||||||||||||||||||
| Years Ending March 31, | |||||||||||||||||||||||
| 2009 | 2008 | 2007 | 2006 | 2005 | |||||||||||||||||||
| Net Asset Value, Beginning of Period | $ | 19.98 | $ | 23.19 | $ | 20.01 | $ | 15.98 | $ | 13.53 | |||||||||||||
| Income from Investment Operations: | |||||||||||||||||||||||
| Net investment income (loss) (a)(b)(c) | 0.38 | 0.26 | 0.25 | 0.29 | (g) | 0.17 | |||||||||||||||||
| Net realized and unrealized gain/(loss) on securities | (11.60 | ) | (2.13 | ) | 4.12 | 3.98 | 2.70 | ||||||||||||||||
| Total from Investment Operations | (11.22 | ) | (1.87 | ) | 4.37 | 4.27 | 2.87 | ||||||||||||||||
| Less Distributions: | |||||||||||||||||||||||
| Dividends from net investment income | (0.17 | ) | (0.25 | ) | (0.12 | ) | (0.16 | ) | (0.15 | ) | |||||||||||||
| Distributions from realized capital gains | (1.61 | ) | (1.09 | ) | (1.07 | ) | (0.08 | ) | (0.27 | ) | |||||||||||||
| Total Distributions | (1.78 | ) | (1.34 | ) | (1.19 | ) | (0.24 | ) | (0.42 | ) | |||||||||||||
| Net Asset Value, End of Period | $ | 6.98 | $ | 19.98 | $ | 23.19 | $ | 20.01 | $ | 15.98 | |||||||||||||
| Total Return (d) | (55.85 | )% | (8.49 | )% | 22.37 | % | 26.96 | % | 21.35 | % | |||||||||||||
| Net Assets, End of Period (000's) | $ | 47,090 | $ | 140,999 | $ | 115,200 | $ | 30,972 | $ | 21,317 | |||||||||||||
| Ratios and Supplemental Data: | |||||||||||||||||||||||
| Ratios of expenses to average net assets: (e) | |||||||||||||||||||||||
| Gross | 1.38 | % | 1.32 | % | 1.35 | % | 1.45 | % | 1.55 | % | |||||||||||||
| Net | 1.38 | % | 1.32 | % | 1.35 | % | 1.45 | % | 1.55 | % | |||||||||||||
| Ratio of net investment income (loss) to average net assets (c) | 2.77 | % | 1.18 | % | 1.13 | % | 1.70 | %(g) | 1.22 | % | |||||||||||||
| Portfolio Turnover | 20 | % | 44 | % | 19 | % | 29 | % | 10 | % | |||||||||||||
(a) Per share numbers have been calculated using the average shares method.
(b) Reflects expense waivers/reimbursements and reductions in effect during the period. See Note 3 to the Financial Statements.
(c) Net investment income (loss) per share and the ratio of net investment income (loss) to average net assets reflect net investment income prior to certain reclassifications for federal income or excise taxes.
(d) Total Return does not include the deferred sales charge of 1% for the Ordinary Shares. The total return would have been lower if certain fees had not been waived or if custodial fees had not been reduced by credits allowed by the custodian. See Note 3 to the financial statements.
(e) Ratios of expenses to average net assets:
- Gross (total expenses before fee waivers, reimbursements by the investment advisor, and custody earnings credits, if any).
- Net (total expenses net of fee waivers, reimbursements by the investment advisor, and custody earnings credits, if any).
(f) Includes non-recurring income of $277,072.
(g) Includes non-recurring income of $22,928.
The accompanying notes are an integral part of these financial statements.
63
QUANT FOREIGN VALUE SMALL CAP FUND
FINANCIAL HIGHLIGHTS
(For a share outstanding throughout each period)
| Ordinary Shares | |||||||
| Period Ended March 31, 2009 | |||||||
| Net Asset Value, Beginning of Period | $ | 10.00 | |||||
| Income from Investment Operations: | |||||||
| Net investment income (loss) (a)(b)(c) | 0.03 | ||||||
| Net realized and unrealized gain/(loss) on securities | (5.15 | ) | |||||
| Total from Investment Operations | (5.12 | ) | |||||
| Less Distributions: | |||||||
| Dividends from net investment income | (0.04 | ) | |||||
| Distributions from realized capital gains | (0.02 | ) | |||||
| Total Distributions | (0.06 | ) | |||||
| Net Asset Value, End of Period* | $ | 4.82 | |||||
| Total Return (d) | (51.25 | )% | |||||
| Net Assets, End of Period (000's) | $ | 18,978 | |||||
| Ratios and Supplemental Data: | |||||||
| Ratios of expenses to average net assets: (e) | |||||||
| Gross | 2.00 | %** | |||||
| Net | 1.97 | %** | |||||
| Ratio of net investment income (loss) to average net assets (c) | 0.66 | %** | |||||
| Portfolio Turnover | 10 | % | |||||
The accompanying notes are an integral part of these financial statements.
64
QUANT FOREIGN VALUE SMALL CAP FUND
FINANCIAL HIGHLIGHTS (continued)
(For a share outstanding throughout each period)
| Institutional Shares | |||||||
| Period Ending March 31, 2009 | |||||||
| Net Asset Value, Beginning of Period | $ | 10.00 | |||||
| Income from Investment Operations: | |||||||
| Net investment income (loss) (a)(b)(c) | 0.07 | ||||||
| Net realized and unrealized gain/(loss) on securities | (5.19 | ) | |||||
| Total from Investment Operations | (5.12 | ) | |||||
| Less Distributions: | |||||||
| Dividends from net investment income | (0.04 | ) | |||||
| Distributions from realized capital gains | (0.02 | ) | |||||
| Total Distributions | (0.06 | ) | |||||
| Net Asset Value, End of Period* | $ | 4.82 | |||||
| Total Return (d) | (51.20 | )% | |||||
| Net Assets, End of Period (000's) | $ | 3,592 | |||||
| Ratios and Supplemental Data: | |||||||
| Ratios of expenses to average net assets: (e) | |||||||
| Gross | 1.88 | %** | |||||
| Net | 1.85 | %** | |||||
| Ratio of net investment income (loss) to average net assets (c) | 1.10 | %** | |||||
| Portfolio Turnover | 10 | % | |||||
* Fund commenced operations May 2, 2008.
** Annualized.
(a) Per share numbers have been calculated using the average shares method.
(b) Reflects expense waivers/reimbursements and reductions in effect during the period. See Note 3 to the Financial Statements.
(c) Net investment income (loss) per share and the ratio of net investment income (loss) to average net assets reflect net investment income prior to certain reclassifications for federal income or excise taxes.
(d) Total Return does not include the deferred sales charge of 1% for the Ordinary Shares. The total return would have been lower if certain fees had not been waived or if custodial fees had not been reduced by credits allowed by the custodian. See Note 3 to the financial statements.
(e) Ratios of expenses to average net assets:
- Gross (total expenses before fee waivers, reimbursements by the investment advisor, and custody earnings credits, if any).
- Net (total expenses net of fee waivers, reimbursements by the investment advisor, and custody earnings credits, if any).
The accompanying notes are an integral part of these financial statements.
65
QUANT FUNDS
NOTES TO FINANCIAL STATEMENTS
1. Organization of the Trust
The Quantitative Group of Funds d/b/a "Quant Funds" (the "Trust") is organized as a Massachusetts business trust and is registered under the Investment Company Act of 1940, as amended, as a non-diversified, open-end management investment company. The Trust currently has five series (each a "Fund" and collectively the "Funds") each with a distinct investment objective.
Quant Small Cap Fund ("Small Cap") seeks maximum long-term capital appreciation.
Quant Long/Short Fund ("Long/Short") seeks long-term growth of capital. Prior to November 1, 2006, Quant Long/Short Fund used a long only investment strategy and its investment objective was long-term growth of capital and income.
Quant Emerging Markets Fund ("Emerging Markets") seeks long-term growth of capital.
Quant Foreign Value Fund ("Foreign Value") seeks long-term capital growth and income.
Quant Foreign Value Small Cap Fund ("Foreign Value Small Cap") seeks long-term capital growth and income.
Each Fund offers two classes of shares designated as Ordinary Shares and Institutional Shares. The classes differ principally in their respective expense structure and minimum investment requirements. Each class of shares represents an interest in the same portfolio of investments of the respective Fund and has equal rights to voting, redemptions, dividends and liquidation, except that each class bears its own transfer agent fees and only Ordinary Shares bear distribution (Rule 12b-1) fees and have exclusive voting rights with respect to the distribution plan that has been adopted by Ordinary Share shareholders. There is no distribution plan for Institutional Shares.
At times, a Fund's investments may represent industries or industry sectors that are interrelated or have common risks, making it more susceptible to any economic, political, or regulatory developments or other risks affecting those industries and sectors. To the extent that a Fund is permitted to invest in foreign markets, emerging markets or countries with limited or developing markets such investments may subject the Fund to a greater degree of risk than in the U.S. market or a developed market. Risks associated with these foreign and developing markets include political, social or economic factors and may affect the price of a Fund's investments and income generated by these investments, as well as a Fund's ability to repatriate such amounts. Information regarding each Fund's principal risks is contained in the Fund's prospectus. Please refer to those documents when considering a Fund's risks.
2. Significant Accounting Policies
Each Fund's financial statements have been prepared in conformity with U.S. generally accepted accounting principles, that require the management of the Funds to, among other things, make estimates and assumptions that affect the reported amounts of assets and liabilities, the disclosure of contingent assets and liabilities at the date of the financial
66
QUANT FUNDS
NOTES TO FINANCIAL STATEMENTS (continued)
statements, and the reported amounts of income, expenses and gains and losses on investments during the reporting year. Actual results could differ from those estimates.
The following is a summary of significant accounting policies followed by each Fund in the preparation of its financial statements, which are consistent with those policies generally accepted in the investment company industry.
Security Valuation
Portfolio securities are valued each business day at the last reported sale price on the principal exchange or market on which they are traded. If there is no such reported sale, the securities generally are valued at the mean between the last reported bid and asked prices. For certain securities, where no such sales have been reported, a Fund may value such securities at the last reported bid price. In the event that there is information suggesting that valuation of such securities based upon bid and/or asked prices may not be accurate, a Fund may value such securities in good faith at fair value in accordance with procedures established by the Funds' Board of Trustees (the "Trustees"), which may include a determination to value such securities at the last reported sales price. Short-term investments that mature in 60 days or less are valued at amortized cost. Securities quoted in foreign currencies are translated into U.S. dol lars based upon the prevailing exchange rate on each business day. Other assets and securities for which no quotations are readily available are valued at fair value as determined in good faith using procedures approved by the Trustees. As a result, changes in the value of those currencies in relation to the U.S. dollar may affect a Fund's NAV. Because foreign markets may be open at different times than the New York Stock Exchange, the value of a Fund's shares may change on days when shareholders are not able to buy or sell them. If events materially affecting the values of a Fund's foreign investments occur between the close of foreign markets and the close of regular trading on the New York Stock Exchange, these investments may be valued at their fair value as determined in good faith using procedures approved by the Trustees.
Financial Accounting Standards Board issued statement 157 (FAS 157) which establishes a framework for measuring fair value and expands disclosure in financial statement about fair value measurements. In accordance with FAS 157, fair value is defined as the price that would be received to sell an asset or paid to transfer a liability in an orderly transaction between market participants at the measurement date. For net asset value determination purposes, various inputs are summarized in the three broad levels listed below.
Level 1 - quoted prices in active markets for identical investments.
Level 2 - other significant observable inputs (which could include quoted prices for similar investments, interest rates, credit risk, etc.)
Level 3 - significant unobservable inputs (including the Fund's own assumptions in determining the fair value of investments.)
67
QUANT FUNDS
NOTES TO FINANCIAL STATEMENTS (continued)
The following is a summary of the inputs used as of March 31, 2009 in valuing the Funds' investments carried at value:
| Level 1 | Level 2 | Level 3 | Total | ||||||||||||||||
| Small Cap | |||||||||||||||||||
| Investments in Securities | $ | 66,314,814 | $ | 9,783,099 | $ | - | $ | 76,097,913 | |||||||||||
| Long/Short | |||||||||||||||||||
| Investments in Securities | 55,698,883 | 22,233,297 | - | 77,932,180 | |||||||||||||||
| Liabilities in Securities Sold Short | (12,731,842 | ) | - | - | (12,731,842 | ) | |||||||||||||
| Emerging Markets | |||||||||||||||||||
| Investments in Securities | 185,808,923 | 8,741,600 | - | 194,550,523 | |||||||||||||||
| Foreign Value | |||||||||||||||||||
| Investments in Securities | 230,412,780 | 21,105,323 | - | 251,518,103 | |||||||||||||||
| Other Financial Instruments | (694 | ) | 2,885 | - | 2,191 | ||||||||||||||
| Foreign Value Small Cap | |||||||||||||||||||
| Investments in Securities | 18,399,443 | 4,845,310 | - | 23,244,753 | |||||||||||||||
| Other Financial Instruments | - | (410 | ) | - | (410 | ) | |||||||||||||
Security Transactions and Related Investment Income
Security transactions are accounted for on the trade date (the date the order to buy or sell is executed). Dividend income, less foreign taxes withheld, is recorded on the ex-dividend date, except that certain dividends from foreign securities where the ex-dividend date may have passed are recorded as soon as a Fund becomes aware of the ex-dividend data in the exercise of reasonable diligence. Distributions received on securities that represent a return of capital or a capital gain are recorded as a reduction of cost of investments and/or as a realized gain. Each Fund estimates the components of distributions that may be considered nontaxable distributions or capital gain distributions for tax purposes. Interest income is recorded on the accrual basis and includes accretion of discounts and amortization of premiums. In determining the net gain or loss on securities sold, the cost of securities is determined on the identified cos t basis. Each Fund's investment income and realized and unrealized gains and losses are allocated among classes based upon the daily relative net assets.
Repurchase Agreements
The Funds' custodian takes possession through the federal book-entry system of securities collateralizing repurchase agreements. Collateral is marked-to-market daily to ensure that the market value of the underlying assets remains sufficient to protect the Funds. The Funds may experience costs and delays in liquidating the collateral if the issuer defaults or enters into bankruptcy.
Foreign Currency Transactions
All monetary items denominated in foreign currencies are translated into U.S. dollars based on the prevailing exchange rate at the close of each business day. Income and expenses
68
QUANT FUNDS
NOTES TO FINANCIAL STATEMENTS (continued)
denominated in foreign currencies are translated at the prevailing rates of exchange when accrued or incurred.
Reported net realized gains and losses on foreign currency transactions represent net gains and losses from currency gains and losses realized between the trade and settlement dates on investment transactions, and the difference between the amount of net investment income accrued and the U.S. dollar amount actually received. The effects of changes in foreign currency exchange rates on investments in securities are not segregated in the Statement of Operations from the effects of changes in market prices of those securities, but are included with the net realized and unrealized gain or loss on investments.
Forward Foreign Currency Contracts
The Funds may enter into forward foreign currency contracts to manage their exposure to fluctuations in certain foreign currencies. Foreign Value and Foreign Value Small Cap may enter into forward foreign currency contracts for investment purposes as well. A forward currency contract is a commitment to purchase or sell a foreign currency at a future date at a set price. The forward currency contracts are valued at the forward rate and are marked-to-market daily. The change in market value is recorded by the Fund as an unrealized gain or loss. When the contract is closed, the Fund records a realized gain or loss equal to the difference between the value of the contract at the time it was opened and the value at the time it was closed. In addition to the risks of financial investments mentioned above, risks arise from unanticipated movements in currency values.
Forward Foreign Currency Contracts at 03/31/09:
Foreign Value Fund
| Currency to deliver | Local Value | In exchange for | Settlement Date | Unrealized appreciation (depreciation) | |||||||||||||||
| Japanese Yen | 2,283,633 | USD | 23,165 | 04/01/09 | $ | 134 | |||||||||||||
| Japanese Yen | 21,279,498 | USD | 217,360 | 04/01/09 | 2,751 | ||||||||||||||
| Japanese Yen | 1,772,131 | USD | 17,908 | 04/03/09 | - | ||||||||||||||
| $ | 2,885 | ||||||||||||||||||
Foreign Value Small Cap
| Currency to deliver | Local Value | In exchange for | Settlement Date | Unrealized appreciation (depreciation) | |||||||||||||||
| United States Dollar 67,168 | Euro | 50,548 | 04/01/09 | $ | (139 | ) | |||||||||||||
| United States Dollar 21,902 | Euro | 16,606 | 04/02/09 | 119 | |||||||||||||||
| United States Dollar 22,273 | Euro | 16,772 | 04/03/09 | - | |||||||||||||||
| United States Dollar | 7,110 | GBP | 4,963 | 04/01/09 | (14 | ) | |||||||||||||
| United States Dollar | 48,362 | GBP | 33,903 | 04/02/09 | 108 | ||||||||||||||
| United States Dollar | 62,609 | SEK | 512,765 | 04/01/09 | (484 | ) | |||||||||||||
| $ | (410 | ) | |||||||||||||||||
69
QUANT FUNDS
NOTES TO FINANCIAL STATEMENTS (continued)
Short Sales
Quant Long/Short Fund may engage in short sales (selling securities it does not own) as part of its normal investment activities. Upon selling a security short, Long/Short Fund's Custodian will segregate cash, cash equivalents or other appropriate liquid securities in an amount equal to the current market value of the securities sold short and will maintain such collateral until Long/Short Fund replaces the borrowed security. Long/Short Fund is required to pay any dividends or interest due on securities sold short. Such dividends and interest are recorded as an expense. Liabilities for securities sold short are valued daily and recorded as unrealized appreciation (depreciation) on investments and securities sold short. Long/Short Fund records realized gain (loss) on a security sold short when a short position is terminated by Long/Short Fund. Long/Short Fund will incur a loss if the price of a security increases between the date of the short sale and the date on which Long/Short Fund replaces the borrowed security. Long/Short will realize a gain if the price of borrowed security declines between the date of a short sale and the date Long/Short Fund replaces the borrowed security.
Securities Lending
To generate additional income, each Fund may lend up to 30% of its assets pursuant to agreements ("borrower agreements") requiring that the loan be continuously secured by cash or securities. Securities are loaned by eSecLending, as lending agent to the Small Cap Fund, the Emerging Markets Fund and the Foreign Value Fund, to certain pre-approved brokers ("the borrowers"). The borrowers are required to provide cash or securities as collateral against loaned securities in the amount of 105% of the market value of borrowings for the Emerging Markets and Foreign Value Funds, and 102% of the borrowings for the Small Cap Fund. Collateral is marked-to-market daily.
The Quant Long/Short Fund uses State Street Bank and Trust Company ("State Street") as lending agent for the Quant Long/Short Fund pursuant to a Securities Lending Authorization Agreement. The initial collateral received shall have (depending on the nature of the loaned securities and the collateral received) a value of 102% or 105% of the market value of the loaned securities, or such other value, but not less than 102% of the market value of the loaned securities, as may be applicable in the jurisdiction in which such loaned securities are customarily traded. Collateral is marked-to-market daily. State Street provides indemnification against borrower default.
Cash collateral is invested in a registered money market fund that may be managed by a Fund's securities lending agent or one of its affiliates.
Risks such as delay in recovery of securities may occur should the borrower of the securities fail financially or should the value of the securities loaned increase above the value of the collateral received. eSecLending provides indemnification insurance via highly rated third party insurers to cover these potential risks.
70
QUANT FUNDS
NOTES TO FINANCIAL STATEMENTS (continued)
At March 31, 2009, the following Fund had collateral and loans outstanding of:
| Value of Collateral | Value of Loaned Securities | ||||||||||
| Small Cap Fund | $ | 6,611,099 | $ | 6,467,488 | |||||||
| Long/Short Fund | 22,233,297 | 22,139,012 | |||||||||
| Emerging Markets Fund | 6,774,600 | 6,256,616 | |||||||||
| Foreign Value Fund | 13,667,353 | 13,012,571 | |||||||||
Expenses and Class Allocations
The majority of the expenses of the Funds are attributed to the individual Fund and Class for which they are incurred. Expenses that are not attributed to a specific Fund are allocated in proportion to the respective net assets of the Funds. Expenses allocable to a Fund are borne pro rata by the holders of both classes of shares of such Fund, except that 12b-1 Plan expenses will not be borne by the holders of Institutional Shares.
Distribution fees on Ordinary Shares are calculated based on the average daily net asset value attributable to the Ordinary Shares of the respective Fund. Institutional Shares are not subject to a distribution plan. Shareholders of each class share all expenses and fees paid to the transfer agent, Quantitative Institutional Services, for its services, which are allocated based on the net assets in each class and the ratable allocation of related out-of-pocket expenses. Income, common expenses and realized and unrealized gains and losses are calculated at the Fund level and allocated daily to each class of shares based on their respective percentage of adjusted net assets at the beginning of the day. (See Note 3)
Distributions to Shareholders
Distributions to shareholders are recorded as of the ex-dividend date. Distributions paid by each Fund with respect to each class of shares are calculated in the same manner, at the same time, and in the same amount, except that Ordinary Shares incur 12b-1 distribution fees while Institutional Shares do not. Distributions from net investment income for each Fund, if any, are declared and paid annually. Distributions from net realized gains for each Fund, if any, are generally declared and paid annually.
New Accounting Pronouncements
In July 2006, Financial Accounting Standards Board Interpretation No. 48, Accounting for Uncertainty in Income Taxes - an interpretation of FASB Statement 109 (FIN 48) was issued and is effective for fiscal years beginning after December 15, 2006.
FIN 48 provides guidance for how uncertain tax positions should be recognized, measured, presented and disclosed in the financial statements. FIN 48 required the evaluation of tax positions taken or expected to be taken in the course of preparing the Funds' tax returns to determine whether the tax positions are "more-likely-than-not" of being sustained by the applicable tax authority. Tax positions not deemed to meet the more-likely-than-not threshold would have to be recorded as a tax benefit or expense in the current year. Management has analyzed the Funds' tax positions taken on federal income tax returns for all open years (tax
71
QUANT FUNDS
NOTES TO FINANCIAL STATEMENTS (continued)
years ended March 31, 2006-2009) and has determined that there were no uncertain tax positions to be reflected in the Funds' financial statements at March 31, 2009.
3. Management Fee, Advisory Contracts and Other Affiliate Transactions
The Funds have entered into a management agreement (the "Management Agreement") with Quantitative Investment Advisors, Inc. d/b/a Quantitative Advisors (the "Manager"). Compensation of the Manager, for management and administration of the Funds, including selection and monitoring of the portfolio advisors, is paid monthly based on the average daily net asset value of each Fund for the month. The annual rate of such fees is 1.00% of the average daily total net assets of Small Cap, Long/Short, Emerging Markets, Foreign Value, and Foreign Value Small Cap Funds
Under the Management Agreement, the Manager has agreed to reduce its compensation, and if necessary, assume expenses, with respect to Small Cap to the extent that the total expenses of this Fund individually exceeds 2% of average net assets for any fiscal year. Fund expenses subject to this limitation are exclusive of brokerage, interest, taxes and extraordinary expenses, which include incremental custody costs associated with international securities. Expenses are calculated gross of custody credits, if applicable.
The Manager, has contractually agreed to maintain the Foreign Value Small Cap Fund's total annual operating expenses at 2.00% and 2.25% of average daily net assets for the Institutional Shares and the Ordinary Shares, respectively, until July, 31, 2009.
For the twelve months ended March 31, 2009 aggregate management fees were $10,732,654 and $274 was waived from Foreign Value Small Cap Fund (Institutional Shares).
The Manager has entered into advisory contracts with the following subadvisors (collectively the "Advisors") to provide investment advisory services to the following Funds: Columbia Partners, L.L.C., Investment Management (Small Cap), Analytic Investors, LLC (Long/Short), PanAgora Asset Management, Inc. (Emerging Markets), and Polaris Capital Management, LLC (Foreign Value and Foreign Value Small Cap.)
For services rendered, the Manager pays to the Advisor of a Fund a fee based on a percentage of the average daily total net assets of the Fund. The fee for each Fund is determined separately. Currently, the fees paid by the Manager to the Advisors of the Funds are as follows:
| Small Cap* | 0.47% of average daily total net assets | ||||||
| Long/Short** | 0.45% of the first $100 million and 0.40% of amounts in excess of $100 million; | ||||||
| Emerging Markets | 0.40% of average daily total net assets; | ||||||
72
QUANT FUNDS
NOTES TO FINANCIAL STATEMENTS (continued)
| Foreign Value | 0.35% of the first $35 million, 0.40% of amounts in excess of $35 million but less than $200 million and 0.50% of assets in excess of $200 million of average daily total net assets | ||||||
| Foreign Value Small Cap | 0.35% of the first $35 million and 0.40% of amounts in excess of $35 million but less than $200 million and 0.50% of amounts in excess of $200 million. | ||||||
* Prior to January 1, 2009 the fee paid was 0.50% of average daily total net assets.
** Effective January 1, 2009 through December 31, 2009 the fee paid is 0.425% of the first $100 million and 0.40% of amounts in excess of $100 million.
The Funds have entered into a distribution agreement (the "Distribution Agreement") with U.S. Boston Capital Corporation (the "Distributor"). For its services under the Distribution Agreement, the Distributor received a monthly fee at the annual rate of (i) 0.25% of the average daily net asset value of the Ordinary Shares of Small Cap, (ii) 0.25% of the average daily net asset value of the Ordinary Shares of Long/Short, (iii) 0.25% of the average daily net asset value of the Ordinary Shares of Emerging Markets, (iv) a contractual rate of 0.25% of the average daily net asset value of the Ordinary Shares for Foreign Value and Foreign Value Small Cap Fund.
Holders of Institutional Shares pay no portion of the 12b-1 Plan expenses of the Funds and are not entitled to vote on matters involving the 12b-1 Plan. During the year ended March 31, 2009 the aggregate distribution fees of the Funds were $2,328,402.
Prior to August 7, 2008, a deferred sales charge of 1% of the net asset value of certain Ordinary Shares redeemed of the Funds was withheld from redemption proceeds and paid to the Distributor. From April 1, 2008 through August 7, 2008, such fees earned by the Distributor were $48,204.
Transfer agent functions are provided to the Funds by Quantitative Institutional Services, a division of the Manager (the "Transfer Agent") pursuant to a transfer agent agreement (the "Transfer Agent Agreement"). The Transfer Agent Agreement provides for base fees that are payable to the Transfer Agent at an annual rate of 0.16% of the average daily total net asset value of each class of shares of the Funds and for reimbursement of out of pocket expenses. During the twelve months ended March 31, 2009, the aggregate fees of the Funds were $1,782,505.
The Manager also provides the Funds with other services consisting of in-house legal services, preparation and review of semi-annual and annual reports, administrative, and EDGAR administration services.
These services are provided as additional services agreed to by the Board of Trustees of the Funds. For the period of April 1 through October 31, 2008, aggregate fees for these services were $109,360. At the approval of the Board an Administration Agreement commenced on
73
QUANT FUNDS
NOTES TO FINANCIAL STATEMENTS (continued)
November 1, 2008 to provide these administrative services to the Funds. For the period of November 1, 2008 through March 31, fees paid pursuant to the Administration Agreement were $104,165.
The By-Laws of the Trust, as amended from time to time, permit the Board of Trustees of the Funds to approve reimbursement to the Manager for certain costs associated with providing regulatory and compliance services to the Funds. For the twelve months ended March 31, 2009, the Trustees have approved reimbursements that amounted to $180,622.
Custody and fund accounting services are provided by State Street Kansas City. Custody credits generated by interest earned on un-invested cash balances maintained by the Funds are used to offset custodial expenses of the Funds.
For the fiscal year ended March 31, 2009, each Trustee received an annual Trustee's fee of $21,000, with the exception of the Chairman of the Audit Committee, who is paid $24,000 annually. The fees are allocated to each Fund in proportion to its respective net assets.
4. Purchases and Sales
During the twelve months ended March 31, 2009, purchases of investment securities other than U.S. Government obligations and short-term investments, for Small Cap, Long/Short, Emerging Markets, Foreign Value, and Foreign Value Small Cap were $78036,898, $157,149,129, $234,243,047, $102,269,197, and $38,026,463, respectively. Sales of such securities for the Funds were $80,828,504, $156,001,154, $294,862,689, $315,276,714, and $2,172,575, respectively. Securities sold short are excluded from the Long/Short Fund numbers as they are generally held for less than one year.
5. Contingent Liability
The Trust maintains a joint fidelity bond with the Funds' Transfer Agent through ICI Mutual Insurance Company ("ICI Mutual"). The annual premium is allocated among the Funds and the Transfer Agent. Additionally, the Funds have committed to ICI Mutual up to 300% of the annual premium, one third of which was provided in cash, with each Fund's pro rata portion recorded as an asset. The remainder is secured with an irrevocable letter of credit.
6. Concentration of Risk
The relatively large investments of Emerging Markets in countries with limited or developing capital markets may involve greater risks than investments in more developed markets and the prices of such investments may be volatile. The consequences of political, social or economic changes in these markets may have disruptive effects on the market prices of the Fund's investments and the income they generate, as well as the Fund's ability to repatriate such amounts.
7. Federal Income Taxes
It is the policy of the Funds to distribute all of their taxable income within the prescribed time and otherwise comply with the provisions of the Internal Revenue Code ("IRC") applicable to regulated investment companies. Therefore no Federal income tax provision is required.
74
QUANT FUNDS
NOTES TO FINANCIAL STATEMENTS (continued)
The tax components of capital shown in the following tables represent: (1) losses or deductions the portfolios may be able to offset against income and gains realized in future years, (2) distribution requirements the portfolios must satisfy under the income tax regulations, and (3) unrealized appreciation or depreciation of investments for federal income tax purposes.
Certain Funds had capital loss carryovers at March 31, 2009. The accumulated capital losses noted in the table may be available to offset future realized capital gains and thereby reduce future taxable gain distributions. Foreign Value acquired capital loss carryovers for federal income tax purposes of $8,053,584 when the net assets of State Street Research International Equity Fund (SSR), a series of State Street Research Financial Trust ("SSR"), were acquired in a merger which occurred on May 2, 2003 pursuant to a Plan of Reorganization approved by the shareholders of SSR on April 25, 2003. Foreign Value is the surviving fund in the merger for purposes of maintaining the financial statements and performance history in the post-reorganization periods and the acquired capital loss carryovers may be subject to limitations on their use under the Internal Revenue Code, as amended, and may therefore expire unutilized. As of March 31 , 2009 the capital loss carryovers were as follows:
| Portfolio | Capital Loss Expires March 31, 2010 | Capital Loss Expires March 31, 2011 | Capital Loss Expires March 31, 2016 | Capital Loss Expires March 31, 2017 | Total Capital Loss | ||||||||||||||||||
| Small Cap Fund | $ | - | $ | - | $ | - | $ | 12,418,995 | $ | 12,418,995 | |||||||||||||
| Long/Short Fund | - | - | - | 2,671,166 | 2,671,166 | ||||||||||||||||||
| Emerging Markets Fund | - | - | - | 44,819,035 | 44,819,035 | ||||||||||||||||||
| Foreign Value Fund | 263,553 | 932,449 | - | 80,608,820 | 81,804,822 | ||||||||||||||||||
| Foreign Value Small Cap Fund | - | - | - | - | - | ||||||||||||||||||
The primary differences between book and tax appreciation or depreciation of investments consist of wash sale loss deferrals, return of capital distributions by real estate investment trusts ("REITs"), mark to market on passive foreign investment companies ("PFICs") held and foreign capital gains taxes accrued. The net tax appreciation/(depreciation) in the table below includes unrealized tax gain/(loss) on foreign currency and investments.
| March 31, 2009 | |||||||||||||||||||||||
| Portfolio | Undistributed Ordinary Income | Undistributed Long-Term Gains | Accumulated Capital Losses | Post- October Deferral | Net Tax Appreciation/ (Depreciation) | ||||||||||||||||||
| Small Cap Fund | $ | 188,025 | $ | - | $ | (12,418,995 | ) | $ | (22,936,059 | ) | $ | (23,865,947 | ) | ||||||||||
| Long/Short Fund | - | - | (2,671,166 | ) | (14,098,893 | ) | (15,413,229 | ) | |||||||||||||||
| Emerging Markets Fund | - | - | (44,819,035 | ) | (53,116,139 | ) | (64,680,113 | ) | |||||||||||||||
| Foreign Value Fund | 12,614,509 | - | (81,804,822 | ) | (46,244,829 | ) | (357,162,102 | ) | |||||||||||||||
| Foreign Value Small Cap Fund | - | - | - | (1,001,888 | ) | (14,120,894 | ) | ||||||||||||||||
75
QUANT FUNDS
NOTES TO FINANCIAL STATEMENTS (continued)
At March 31, 2009, the tax composition of dividends was as follows:
| Portfolio | Ordinary Income | Long Term Capital Gains | Tax Return Of Capital | ||||||||||||
| Small Cap Fund | $ | 297 | $ | 422,091 | $ | - | |||||||||
| Long/Short Fund | 63,070 | - | - | ||||||||||||
| Emerging Markets Fund | 6,822,704 | 1,951,866 | - | ||||||||||||
| Foreign Value Fund | 3,753,515 | 45,803,063 | - | ||||||||||||
| Foreign Value Small Cap Fund | 209,653 | - | - | ||||||||||||
Accounting principles generally accepted in the United States require that certain components of net assets be reclassified between financial and tax reporting. These reclassifications have no effect on net assets or net asset value per share. For the year ended March 31, 2009, permanent differences in book and tax accounting have been reclassified to shares of beneficial interest, undistributed/(over-distributed) net investment income and accumulated net realized gain/(loss) on investments and foreign denominated assets, liabilities and currency.
| Increase/(Decrease) | |||||||||||||||
| Shares of Beneficial Interest | Undistributed/ (Over-Distributed) Net Investment Income | Accumulated Net Gain/ (Loss) on Investments and Foreign Denominated Assets, Liabilities and Currency | |||||||||||||
| Small Cap Fund | $ | - | (185,154 | ) | 185,154 | ||||||||||
| Long/Short Fund | $ | (294,129 | ) | 292,112 | 2,017 | ||||||||||
| Emerging Mkts. Fund | $ | - | (431,004 | ) | 431,004 | ||||||||||
| Foreign Value Fund | $ | 15,332,099 | (1,734,541 | ) | (13,597,558 | ) | |||||||||
| Foreign Value Small Cap Fund | $ | (58,685 | ) | 12,022 | 46,663 | ||||||||||
The permanent differences primarily relate to net operating losses, wash sales, return of capital distributions by real estate investment trusts (REITs), foreign currency reclasses and adjustments for sale of shares in passive foreign investment corporations (PFICs).
76
QUANT FUNDS
NOTES TO FINANCIAL STATEMENTS (continued)
8. Transactions in Shares of Beneficial Interest
Transactions in shares of beneficial interest were as follows:
| Year Ended March 31, 2009 | Year Ended March 31, 2008 | ||||||||||||||||||
| Shares | Dollars | Shares | Dollars | ||||||||||||||||
| Small Cap | |||||||||||||||||||
| Ordinary Shares | |||||||||||||||||||
| Shares sold | 1,197,486 | $ | 15,152,296 | 1,740,611 | $ | 42,043,144 | |||||||||||||
| Shares issued in reinvestment of distributions | 37,692 | 358,457 | 244,051 | 5,552,163 | |||||||||||||||
| Shares redeemed | (1,338,280 | ) | (18,046,224 | ) | (1,054,081 | ) | (23,511,728 | ) | |||||||||||
| Net Change | (103,102 | ) | (2,535,471 | ) | 930,581 | 24,083,579 | |||||||||||||
| Institutional Shares | |||||||||||||||||||
| Shares sold | 421,457 | 7,599,757 | 952,662 | 25,586,118 | |||||||||||||||
| Shares issued in reinvestment of distributions | 3,767 | 40,377 | 34,448 | 879,797 | |||||||||||||||
| Shares redeemed | (903,658 | ) | (12,266,520 | ) | (340,479 | ) | (8,605,316 | ) | |||||||||||
| Redemption fees | - | 1,785 | |||||||||||||||||
| Net Change | (478,434 | ) | (4,626,386 | ) | 646,631 | 17,862,384 | |||||||||||||
| Total Net Change For Fund | $ | (7,161,857 | ) | $ | 41,945,963 | ||||||||||||||
| Long/Short | |||||||||||||||||||
| Ordinary Shares | |||||||||||||||||||
| Shares sold | 924,988 | $ | 9,582,942 | 921,368 | $ | 15,283,887 | |||||||||||||
| Shares issued in reinvestment of distributions | 5,990 | 54,807 | 162,497 | 2,585,330 | |||||||||||||||
| Shares redeemed | (669,798 | ) | (6,697,973 | ) | (549,738 | ) | (8,781,876 | ) | |||||||||||
| Net Change | 261,180 | 2,939,776 | 534,127 | 9,087,341 | |||||||||||||||
| Institutional Shares | |||||||||||||||||||
| Shares sold | 4,938 | 48,902 | 10,341 | 187,384 | |||||||||||||||
| Shares issued in reinvestment of distributions | 338 | 3,215 | 2,428 | 40,493 | |||||||||||||||
| Shares redeemed | (5,468 | ) | (71,088 | ) | (16,052 | ) | (278,592 | ) | |||||||||||
| Redemption fees | - | ||||||||||||||||||
| Net Change | (192 | ) | (18971 | ) | (3,283 | ) | (50,715 | ) | |||||||||||
| Total Net Change For Fund | $ | 2,920,805 | $ | 9,036,626 | |||||||||||||||
77
QUANT FUNDS
NOTES TO FINANCIAL STATEMENTS (continued)
| Year Ended March 31, 2009 | Year Ended March 31, 2008 | ||||||||||||||||||
| Shares | Dollars | Shares | Dollars | ||||||||||||||||
| Emerging Markets | |||||||||||||||||||
| Ordinary Shares | |||||||||||||||||||
| Shares sold | 6,642,687 | $ | 128,661,844 | 12,479,147 | $ | 366,999,287 | |||||||||||||
| Shares issued in reinvestment of distributions | 613,797 | 7,122,537 | 496,720 | 16,083,794 | |||||||||||||||
| Shares redeemed | (11,822,136 | ) | (218,677,577 | ) | (6,657,410 | ) | (194,403,433 | ) | |||||||||||
| Net Change | (4,565,652 | ) | (82,893,196 | ) | 6,318,457 | 188,679,648 | |||||||||||||
| Institutional Shares | |||||||||||||||||||
| Shares sold | 1,428,165 | 25,597,502 | 1,309,790 | 38,527,679 | |||||||||||||||
| Shares issued in reinvestment of distributions | 103,193 | 1,210,553 | 35,236 | 1,157,848 | |||||||||||||||
| Shares redeemed | (901,592 | ) | (14,907,020 | ) | (408,965 | ) | (12,123,141 | ) | |||||||||||
| Redemption fees | - | 3,514 | |||||||||||||||||
| Net Change | 629,766 | 11,901,035 | 936,061 | 27,565,900 | |||||||||||||||
| Total Net Change For Fund | $ | (70,992,161 | ) | $ | 216,245,548 | ||||||||||||||
| Foreign Value | |||||||||||||||||||
| Ordinary Shares | |||||||||||||||||||
| Shares sold | 8,562,360 | $ | 102,085,370 | 26,503,037 | $ | 611,689,722 | |||||||||||||
| Shares issued in reinvestment of distributions | 5,653,414 | 38,564,826 | 2,546,681 | 54,549,910 | |||||||||||||||
| Shares redeemed | (25,737,478 | ) | (313,926,849 | ) | (23,460,731 | ) | (496,738,229 | ) | |||||||||||
| Net Change | (11,521,704 | ) | (173,276,653 | ) | 5,588,987 | 169,501,403 | |||||||||||||
| Institutional Shares | |||||||||||||||||||
| Shares sold | 2,211,766 | 27,949,404 | 4,720,359 | 108,421,800 | |||||||||||||||
| Shares issued in reinvestment of distributions | 1,355,181 | 9,305,002 | 356,499 | 7,671,854 | |||||||||||||||
| Shares redeemed | (3,882,303 | ) | (54,403,524 | ) | (2,987,574 | ) | (65,693,840 | ) | |||||||||||
| Redemption fees | - | 9,544 | |||||||||||||||||
| Net Change | (315,356 | ) | (17,149,118 | ) | 2,089,284 | 50,409,358 | |||||||||||||
| Total Net Change For Fund | $ | (190,425,771 | ) | $ | 219,910,761 | ||||||||||||||
78
QUANT FUNDS
NOTES TO FINANCIAL STATEMENTS (continued)
| Year Ended March 31, 2009 | |||||||||||
| Shares | Dollars | ||||||||||
| Foreign Value Small Cap | |||||||||||
| Ordinary Shares | |||||||||||
| Shares sold | 4,338,927 | $ | 32,806,653 | ||||||||
| Shares issued in reinvestment of distributions | 33,329 | 168,643 | |||||||||
| Shares redeemed | (432,229 | ) | (2,265,355 | ) | |||||||
| Net Change | 3,940,027 | 30,709,941 | |||||||||
| Institutional Shares | |||||||||||
| Shares sold | 1,218,834 | $ | 11,453,722 | ||||||||
| Shares issued in reinvestment of distributions | 7,888 | 39,913 | |||||||||
| Shares redeemed | (481,369 | ) | (4,451,966 | ) | |||||||
| Net Change | 745,353 | 7,041,669 | |||||||||
| Total Net Change for Fund | $ | 37,751,610 | |||||||||
Federal Tax Information
Designation Requirements at March 31, 2009 (unaudited).
| Qualified Dividend Income Percentage | |||||||
| Long/ Short Fund | 100 | % | |||||
| Emerging Markets Fund | 100 | % | |||||
| Foreign Value Fund | 100 | % | |||||
| Foreign Value Small Cap Fund | 100 | % | |||||
Subsequent Events
In April 2009, the Financial Accounting Standards Board ("FASB") issued FASB Staff Position No. 157-4, "Determining Fair Value When the Volume and Level of Activity for the Asset or Liability Have Significantly Decreased and Identifying Transactions That Are Not Orderly" ("FSP 157-4"). FSP 157-4 provides additional guidance for estimating fair value in accordance with FASB Statement of Financial Accounting Standards No. 157, "Fair Value Measurements" ("FAS 157"), when the volume and level of activity for the asset or liability have significantly decreased as well as guidance on identifying circumstances that indicate a transaction is not orderly. FSP 157-4 is effective for fiscal years and interim periods ending after June 15, 2009. Management is currently evaluating the impact the adoption of FSP 157-4 will have on the Funds' financial statement disclosures.
79
QUANT FUNDS
REPORT OF INDEPENDENT REGISTERED PUBLIC
ACCOUNTING FIRM
To the Shareholders and Trustees of the Quantitative Group of Funds d/b/a Quant Funds
We have audited the accompanying statements of assets and liabilities of the Quant Small Cap Fund (formerly, Quantitative Small Cap Fund), Quant Long/Short Fund (formerly, Quantitative Long/Short Fund), Quant Emerging Markets Fund (formerly, Quantitative Emerging Markets Fund), Quant Foreign Value Fund (formerly, Quantitative Foreign Value Fund), and Quant Foreign Value Small Cap Fund, each series of the Quantitative Group of Funds d/b/a "Quant Funds" (the "Trust"), including the schedules of investments, as of March 31, 2009, and the related statements of operations for the year then ended (with respect to Quant Foreign Value Small Cap Fund, the period May 2, 2008, commencement of operations, to March 31, 2009), the statements of changes in net assets for each of the two years in the period then ended (with respect to Quant Foreign Value Small Cap Fund, the period May 2, 2008 to March 31, 2009), the statement of cash flows of t he Quant Long/Short Fund for the year then ended, and the financial highlights for each of the two years in the period then ended (with respect to Quant Foreign Value Small Cap Fund, the period May 2, 2008 to March 31, 2009). These financial statements and financial highlights are the responsibility of the Trust's management. Our responsibility is to express an opinion on these financial statements and financial highlights based on our audits. The financial highlights for each of the three years in the period ended March 31, 2007 were audited by other auditors whose report dated May 24, 2007 expressed an unqualified opinion on such financial highlights.
We conducted our audits in accordance with the standards of the Public Company Accounting Oversight Board (United States). Those standards require that we plan and perform the audit to obtain reasonable assurance about whether the financial statements and financial highlights are free of material misstatement. The Trust is not required to have, nor were we engaged to perform, an audit of its internal control over financial reporting. Our audits included consideration of internal control over financial reporting as a basis for designing audit procedures that are appropriate in the circumstances, but not for the purpose of expressing an opinion on the effectiveness of the Trust's internal control over financial reporting. Accordingly, we express no such opinion. An audit includes examining on a test basis, evidence supporting the amounts and disclosures in the financial statements. Our procedures included confirmation of securitie s owned as of March 31, 2009 by correspondence with the custodian and brokers or by other appropriate auditing procedures where replies from brokers were not received. An audit also includes assessing the accounting principles used and significant estimates made by management, as well as evaluating the overall financial statement presentation. We believe that our audits provide a reasonable basis for our opinion.
In our opinion, the financial statements and financial highlights referred to above present fairly, in all material respects, the financial position of the above mentioned series of the Quant Funds, as of March 31, 2009, the results of their operations, the changes in their net assets, the statement of cash flows of the Quant Long/Short Fund and the financial highlights for the periods indicated above, in conformity with accounting principles generally accepted in the United States of America.

TAIT, WELLER & BAKER LLP
Philadelphia, Pennsylvania
May 20, 2009
80
QUANT FUNDS
INFORMATION FOR SHAREHOLDERS
Quarterly Portfolio Disclosure
Each Quant Fund files its complete schedule of portfolio holdings with the Securities and Exchange Commission (SEC) for the first and third quarters of each fiscal year on Form N-Q. The Funds' Forms N-Q are available on the SEC's website at www.sec.gov and may be reviewed and copied at the SEC's Public Reference Room in Washington, D.C. (Call 1-800-SEC-0330 for more information). For a complete list of a fund's portfolio holdings, you may also view the most recent quarterly holdings report, semi-annual report or annual report on the Quant Funds' web site at www.quantfunds.com.
Portfolio Proxy Voting Policies and Information
Information on the Quant Funds proxy voting policies and on how the Quant Funds voted proxies related to portfolio securities for the 12-month period ended June 30 is available without charge online at www.quantfunds.com and at www.sec.gov. You may also call 1-800-326-2151 to request a free copy of the proxy voting information or the proxy voting policies.
Household Delivery of Fund Documents
With your consent, Quant may send a single proxy statement, prospectus and shareholder report to your residence for you and any other member of your household who has an account with the Quant Funds. If you wish to revoke your consent to this practice, you may do so by notifying Quant, by phone or in writing (see "For Account Information"). Quant will begin mailing separate proxy statements, prospectuses and shareholder reports to you within 30 days after receiving your notice.
PRIVACY POLICY
Please read this important notice about the privacy of our customers' personal information from Quantitative Investment Advisors, Inc., Quantitative Group of Funds, and U.S. Boston Capital Corporation (collectively, "Quantitative").
Quantitative Respects Your Privacy
Quantitative considers the privacy of our customers and former customers a matter of great importance. We respect your privacy and believe that any nonpublic personal information we have should be treated with the highest regard for its confidentiality. Nonpublic personal information includes much of the information you provide to us and the related information about you and your transactions involving your Quantitative investment products or services. Examples of nonpublic personal information include the information you provide on new account applications for Quantitative investment products or services, your share balance or transactional history and the fact that you are a shareholder or client of Quantitative.
81
QUANT FUNDS
PRIVACY POLICY (continued)
Quantitative Privacy Policy
As noted above, Quantitative places a high priority on protecting the privacy of its customers' financial information and other personal details. This Privacy Policy outlines our guidelines and practices for how we collect, use and protect information about individual customers.
Employees. Quantitative employees understand that they must keep your personal and financial information confidential when they have access to it and when they see it as they communicate with you and process transactions on your or your financial intermediary's instructions. Employees are required to refrain from disclosing information to unauthorized persons.
Vendors. When Quantitative hires vendors, such as mail houses or data processors, to assist in delivering services to clients, we require these vendors to commit contractually to keep the information they handle in strict confidence.
Your Personal Information
We collect and record personal information that customers provide:
on forms and applications
through electronic media
through information (commonly referred to as "cookies") collected from the Web browser of your PC that allows our website to recognize your browser
by telephone
in correspondence
We also collect and record information from:
your financial advisor
other firms, such as those from whom you transfer assets
your transactions with us and our affiliates
third parties who may notify us of your change of address
Personal information may include:
names
phone numbers
other account information
addresses
Social Security and/or Tax ID numbers
your investments in the Quantitative Group of Funds, such as your account balance and transaction activity
82
QUANT FUNDS
PRIVACY POLICY (continued)
How Quantitative Uses Information
Quantitative gathers information to help us find better ways to serve clients and enhance other products and programs. For instance,
we may share information with our affiliates when providing services to you or the Quantitative Group of Funds;
we may use information to send notices to you about products and services that we feel might interest you; or
we may employ an unaffiliated company to survey all our customers about our products or the quality of our communications or services.
Information gathered on clients is not sold to other firms, such as direct marketers. The details Quantitative collects will not generate any correspondence, e-mails or phone calls from unaffiliated marketers.
Quantitative may have to provide information to legally authorized agencies or individuals, such as the Securities and Exchange Commission, Internal Revenue Service or other regulatory agencies, or as otherwise required by law. We also share client information with firms that we contracted with to deliver services to our customers or to other financial institutions with which we have joint marketing arrangements. We do not disclose any nonpublic personal information about customers or former customers to other parties, except as permitted by law. As noted above, however, these firms have contractually committed to protect the confidentiality of all Quantitative information to which they have access.
We will send customers an updated Privacy Policy each year.
Security
Quantitative maintains physical, electronic and procedural safeguards that meet federal standards for guarding customer information.
We employ various forms of Internet security, such as
data encryption
Secure Sockets Layer (SSL) protocol
user names and passwords
Passwords. If you access information through the Quantitative Group of Funds' web site, www.quantfunds.com, you should not give your user name or passwords to anyone for any reason. Choosing to provide this information to a third party invites problems and puts the confidentiality of your personal information at risk.
External Links
To provide you with more information that may be helpful, the Quantitative Group of Funds web site may contain links to other web sites that are not affiliated with or maintained by Quantitative. Quantitative does not monitor the privacy practices of these third-party sites,
83
QUANT FUNDS
PRIVACY POLICY (continued)
and we do not exercise any authority over the sites. As a result, Quantitative does not assume any responsibility for the content or data collection policies of the sites. When you access any of these third-party sites, Quantitative cannot guarantee that your privacy will be protected in the same way as it is on the Quantitative Group of Funds' web site.
Changes to the privacy policy
Quantitative reserves the right to change, modify, add or remove portions of this privacy policy as permitted by law at any time. Customers may want to review the policy periodically for changes. Customers can review the privacy policy by clicking on the link that appears on the www.quantfunds.com home page.
Questions. If you have any questions or concerns about maintaining the privacy of your customer information at Quantitative, please contact us at 800-326-2151 Monday through Friday, between the hours of 9:00 am and 5:00 pm Eastern Time.
84
QUANT FUNDS
TRUSTEES AND OFFICERS
The business address of each non-interested Trustee is c/o Quant Funds, 55 Old Bedford Road, Lincoln, MA 01773. Each Trustee and officer holds office until his or her successor is chosen and qualified or until his or her earlier death, resignation, retirement or removal. Messrs. Armstrong, Bulbrook, Dunlap and Marshall are members of the Funds' Audit Committee. Mr. Marshall is the Chair of the Audit Committee. The Fund's Statement of Additional Infor- mation ("SAI") includes additional information about the Fund Trustees and is available without charge, upon request. To obtain a free copy of the current SAI, please access the Funds' web site at www.quantfunds.com or call shareholder services at 1-800-326-2141.
| Name and (Age) | Position(s) Held With Funds, Term of Office And Length of Time Served | Principal Occupation(s) During Past Five Years | Number of Portfolios in Fund Complex Overseen by Trustee | Other Directorships Held by Trustee | |||||||||||||||
| Non-Interested Trustees | |||||||||||||||||||
| Robert M. Armstrong (70) | Trustee (1985 to Present) | Independent financial and career consulting services | 5 | NewPage Corporation; NewPage Holding Corporation; NewPage Group | |||||||||||||||
| John M. Bulbrook (66) | Trustee (1985 to Present) | CEO and Treasurer, John M. Bulbrook Insurance Agency, Inc. | 5 | John M. Bulbrook Insurance Agency, Inc. | |||||||||||||||
| William H. Dunlap (58) | Trustee (10/17/2006 to Present) | President, EQ Rider, Inc.; Principal, William H. Dunlap & Company (consulting firm) | 5 | Merrimack County Savings Bank; Merrimack Bank Corp. | |||||||||||||||
| Clinton S. Marshall (51) | Trustee (April 2003 to Present) | Owner, Coastal CFO Solutions, CFO, Fore River Company, Finance Director, Northern York County Family YMCA, CFO | 5 | The Pool Association | |||||||||||||||
85
QUANT FUNDS
TRUSTEES AND OFFICERS (continued)
| Name and (Age) | Position(s) Held With Funds, Term of Office And Length of Time Served | Principal Occupation(s) During Past Five Years | Number of Portfolios in Fund Complex Overseen by Trustee | Other Directorships Held by Trustee | |||||||||||||||
| Interested Trustees and Officers | |||||||||||||||||||
| Willard L. Umphrey* (67) | Trustee, President, Chairman (1985 to Present) | Director, U.S. Boston Capital Corporation; President, Quantitative Investment Advisors, Inc. | 5 | U.S. Boston Corporation; U.S. Boston Asset Management Corporation; Quantitative Investment Advisors, Inc.; Sugarbush Solutions, Inc., USB Corporation; USB Greenville-86, Inc.; USB Atlantic Associates, Inc.; U.S. Boston Insurance Agency, Inc.; U.S. Boston Capital Corporation; Pear Tr ee Partners Management, LLC; Waterfront Parking Corporation | |||||||||||||||
| Leon Okurowski (66) | Vice President and Treasurer (1985 to Present) | Director and Vice President, U.S. Boston Capital Corporation; Treasurer, Quantitative Investment Advisors, Inc.; Trustee, Quant Funds (4/17/1985-9/30/2004) | N/A | Everest USB Canadian Storage, Inc.; Quantitative Investment Advisors, Inc.; Sugarbush Solutions, Inc. U.S. Boston Corporation; U.S. Boston Asset Management Corporation; USB Corporation; USB Everest Management, LLC; USB Everest Storage LLC; USB Greenville-86, Inc.; USB Atlantic Assoc iates, Inc.; U.S. Boston Insurance Agency, Inc.; U.S. Boston Capital Corporation | |||||||||||||||
86
QUANT FUNDS
TRUSTEES AND OFFICERS (continued)
| Name and (Age) | Position(s) Held With Funds, Term of Office And Length of Time Served | Principal Occupation(s) During Past Five Years | Number of Portfolios in Fund Complex Overseen by Trustee | Other Directorships Held by Trustee | |||||||||||||||
| Interested Trustees and Officers (continued) | |||||||||||||||||||
| Deborah A. Kessinger (46) | Assistant Clerk (April 2005 to present), Chief Compliance Officer (December 2005 to present) | Senior Counsel (since 9/2004) and Chief Compliance Officer (since 12/2005), U.S. Boston Capital Corporation; Senior Counsel (since 9/2004), Chief Compliance Officer (since 11/2006) and President (since August 2007), Quantitative Investment Advisors, Inc.; Chief Compliance Officer and General Counsel, Wainwright Investment Counsel, LLC (2000-2004); Compliance Attorney, Forefield, Inc. (2001-2004) and Compliance Consultant (2007- Present) | N/A | None | |||||||||||||||
| Sandra I. Madden (42) | Clerk and Chief Legal Officer (Since April 2008) | Senior Counsel (Since 3/2008), Quantitative Investment Advisors, Inc.; Counsel (8/2005-3/2008) MetLife Advisers LLC; Sr. Associate Counsel (1999-2005) Investors Bank and Trust (financial services provider). | N/A | None | |||||||||||||||
87
QUANT FUNDS
TRUSTEES AND OFFICERS (continued)
| Name and (Age) | Position(s) Held With Funds, Term of Office And Length of Time Served | Principal Occupation(s) During Past Five Years | Number of Portfolios in Fund Complex Overseen by Trustee | Other Directorships Held by Trustee | |||||||||||||||
| Interested Trustees and Officers (continued) | |||||||||||||||||||
| Jennifer Dougherty (42) | Assistant Treasurer (July 2008 to Present) | Chief Financial Officer (since 2/2009) and Director of Operations (since 10/2007) Quantitative Investment Advisors, Inc.; Managing Director of Executive Education (2004-2007) Harvard Business School | N/A | None | |||||||||||||||
* Trustee has been determined to be an "Interested Trustee" by virtue of, among other things, affiliation with one or more of the trust, the Fund's investment advisor, Quantitative Advisors and the Fund's distributor, U.S. Boston Capital Corporation.
88
QUANT FUNDS
NOTES
This page intentionally left blank.
QUANT FUNDS
NOTES
This page intentionally left blank.
QUANT FUNDS
NOTES
This page intentionally left blank.
QUANT FUNDS
NOTES
This page intentionally left blank.
QUANT FUNDS
SERVICE PROVIDERS
| Manager | Quantitative Advisors, 55 Old Bedford Road, Lincoln, MA 01772 | ||||||
| Advisers | Columbia Partners, L.L.C., Investment Management, 5425 Wisconsin Avenue, Suite 700, Chevy Chase, MD 20815 Analytic Investors, LLC, 555 West Fifth Street, 50th Floor, Los Angeles, CA 90013 PanAgora Asset Management, Inc., 470 Atlantic Avenue, 8th Floor, Boston, MA 02210 Polaris Capital Management, LLC, 125 Summer Street, Boston, MA 02210 | ||||||
| Distributor | U.S. Boston Capital Corporation, 55 Old Bedford Road, Lincoln, MA 01773 | ||||||
| Custodian | State Street Kansas City, 801 Pennsylvania Avenue, Kansas City, MO 64105 | ||||||
| Fund Accountant | State Street Kansas City, 801 Pennsylvania Avenue, Kansas City, MO 64105 | ||||||
| Transfer Agent | Quantitative Institutional Services, 55 Old Bedford Road, Lincoln, MA 01773 | ||||||
| Independent Registered Public Accounting Firm | Tait, Weller & Baker LLP, 1818 Market Street, Suite 2400 Philadelphia, PA 19103 | ||||||
| Legal Counsel | Goodwin Procter LLP, 901 New York Avenue, NW, Washington, DC 20001 | ||||||
| For Account Information | For Quant Funds information, contact your financial adviser or, if you receive account statements directly from Quant Funds, you can also call 1-800-326-2151. Telephone representatives are available from 9:00 a.m. to 5:00 p.m. Eastern Time. Or visit our website, www.quantfunds.com. | ||||||

55 Old Bedford Road, Suite 202
Lincoln, MA 01773
www.quantfunds.com
(c)2009 U.S. Boston Capital Corporation
Distributor of the Quant Funds
Member FINRA, SIPC
ITEM 2. | Code of Ethics |
As of the end of the period covered by this Form N-CSR, the registrant has adopted a code of ethics (as defined in Item 2(b) of Form N-CSR) that applies to the registrant’s principal executive officer, principal financial officer and principal accounting officer and controller (the “Code”). During the period covered by the report, there was no amendment to the Code or any waivers granted from its provisions. A copy of the Code is filed with this report as an exhibit.
ITEM 3. | Audit Committee Financial Expert |
The registrant’s Board of Trustees has determined that Mr. Clinton S. Marshall is an “audit committee financial expert” as defined in Item 3 of Form N-CSR. Mr. Marshall is “independent” under the standards set forth in Item 3 of Form N-CSR.
ITEM 4. | Principal Accountant Fees and Services |
The following chart shows the aggregate fees billed in each of the last two fiscal years for services rendered by the registrant’s principal accountant, Tait, Weller and Baker, LLP (“Tait Weller”). The registrant’s Audit Committee approved the selection of Tait Weller as independent registered public accounting firm on September 14, 2007.
|
| 2008 | 2009 |
Audit Fees* | Tait Weller | $98,000 | $103,000 |
Audit-Related Fees** | Tait Weller | $32,000 | $33,600 |
Tax Fees*** | Tait Weller | $16,000 | $16,800 |
All Other Fees | Tait Weller | 0 | 0 |
* Audit fees include all services related to the audit of the financial statements, including review of the registration statement and the issuance of related consents.
** These amounts represent fees paid for the annual audit of the registrant’s transfer agent, Quantitative Institutional Services, Inc., a division of Quantitative Advisors, Inc., the registrant’s investment advisor.
*** | Tax fees include review of the registrant’s tax filings. |
(e)(1) | To the extent required by applicable law, pre-approval by the Audit Committee of the Board is needed for: |
| (i) | all audit and permissible non-audit services rendered to the Fund and |
(ii) all permissible non-audit services rendered to Quantitative Investment Advisors, Inc. if the services relate directly to the operations and financial reporting of the Registrant. Pre-approval is currently on an engagement-by-engagement basis. In the event pre-approval of such services is necessary between regular meetings of the Audit Committee and it is not practical to wait to seek pre-approval at the next regular meeting of the Audit Committee, such pre-
approval of services may be referred to the President of the Fund for approval; provided that the President may not pre-approve any individual engagement for such services exceeding $5,000 or multiple engagements for such services in the aggregate exceeding $5,000 between such regular meetings of the Audit Committee. Any engagement pre-approved by the President between regular meetings of the Audit Committee shall be presented for ratification by the entire Audit Committee at its next regularly scheduled meeting.
(e)(2) No services in 2007 or 2008 were approved by the Audit Committee pursuant to Rule 2-01(c)(7)(i)(C) of Regulation S-X.
(f) | Not applicable. |
(g) | The following chart shows the aggregate non-audit fees billed by Tait Weller for services rendered to the registrant and the registrant’s investment advisor (not including any subadviser whose role is primarily portfolio management and is subcontracted with or overseen by another investment adviser) and any entity controlling, controlled by, or under common control with the adviser that provides ongoing services to the registrant. |
|
| 2008 | 2009 |
Non-Audit Fees | Tait Weller | $0 | $0 |
(h) | The Audit Committee of the registrant’s Board of Trustees considered the provision of non-audit services that were rendered to the registrant’s investment adviser (not including any subadviser whose role is primarily portfolio management and is subcontracted with or overseen by another investment adviser), and any entity controlling, controlled by or under common control with the investment adviser that provides ongoing services to the registrant that were not pre-approved pursuant to paragraph (c)(7)(ii) of Rule 2-01 of Regulation S-X and concluded that such services are compatible with maintaining the principal accountant’s independence. |
ITEM 5. | Audit Committee of Listed Registrants |
| Not applicable. |
ITEM 6. | Schedule of Investments |
| Not applicable. |
ITEM 7. Disclosure of Proxy Voting Policies and Procedures for Closed-End Management Investment Companies
| Not applicable. |
ITEM 8. | Portfolio Managers of Closed-End Management Investment Companies. |
| Not applicable. |
ITEM 9 Purchase of Equity Securities by Closed-End Management Investment Company and Affiliated Purchasers
| Not applicable. |
ITEM 10 | Submission of Matters to a Vote of Security Holders |
| Not applicable. |
ITEM 11. | Controls and Procedures |
(a) The President and Treasurer of the registrant have concluded, based on their evaluation of the effectiveness of the registrant’s disclosure controls and procedures (as defined in Rule 30a-3(c) under the Act) as of a date within 90 days of the filing date of this report on Form N-CSR, that the design and operation of such procedures provide reasonable assurance that information required to be disclosed by the registrant in this report on Form N-CSR is recorded, processed, summarized, and reported within the time periods specified in the Securities and Exchange Commission’s rules and forms.
(b) There has been no change in the registrant’s internal controls over financial reporting (as defined in Rule 30a-3(d) under the Act) that occurred during the second fiscal quarter of the period covered by this report that has materially affected, or is reasonably likely to materially affect, the registrant’s internal control over financial reporting.
ITEM 12. | Exhibits |
(a)(1) | Code of ethics |
(a)(2) | Certifications pursuant to Rule 30a-2(a) by the chief executive and financial officers. |
(b) Certification pursuant to Rule 30a-2(b) and Section 906 by the chief executive and financial officers.
SIGNATURES
Pursuant to the requirements of the Securities Exchange Act of 1934 and the Investment Company Act of 1940, the registrant has duly caused this report to be signed on its behalf by the undersigned, thereunto duly authorized.
Quantitative Group of Funds
By ____________________________
Willard L. Umphrey, President
Date:
Pursuant to the requirements of the Securities Exchange Act of 1934 and the Investment Company Act of 1940, this report has been signed below by the following persons on behalf of the registrant and in the capacities and on the dates indicated.
By ______________________________
Willard L. Umphrey, President
Date:
By ______________________________
Leon Okurowski, Treasurer
Date:
EXHIBIT LIST
(a)(1) | Code of ethics |
(a)(2) | Certifications pursuant to Rule 30a-2(a) by the chief executive and financial officers. |
(b) Certification pursuant to Rule 30a-2(b) and Section 906 by the chief executive and financial officers.