OMB APPROVAL
OMB Number: 3235-0570
Expires: August 31, 2011
Estimated average burden
hours per response..... 18.9
UNITED STATES
SECURITIES AND EXCHANGE COMMISSION
Washington, D.C. 20549
FORM N-CSR
CERTIFIED SHAREHOLDER REPORT OF REGISTERED
MANAGEMENT INVESTMENT COMPANIES
Investment Company Act file number 811-3790
The Quantitative Group of Funds
(Exact name of registrant as specified in charter)
55 Old Bedford Road, Lincoln, MA 01773
(Address of principal executive offices)
Willard L. Umphrey
Quantitative Investment Advisors, Inc.
55 Old Bedford Road, Lincoln, MA 01773
(Name and address of agent for service)
Registrant’s telephone number, including area code: (781) 676-5900
Date of fiscal year end: March 31
Date of reporting period: April 1, 2010 through September 30, 2010
ITEM 1. REPORTS TO SHAREOWNERS.
QUANT FUNDS
Quant Small Cap Fund
Quant Long/Short Fund
Quant Emerging Markets Fund
Quant Foreign Value Fund
Quant Foreign Value Small Cap Fund
SEMI-ANNUAL REPORT
September 30, 2010
TABLE OF CONTENTS
| President’s Letter | 2 | |
| Fund Expenses | 3 | |
| Portfolio Manager Commentaries | 5 | |
| Quant Small Cap Fund | 5 | |
| Quant Long/Short Fund | 9 | |
| Quant Emerging Markets Fund | 13 | |
| Quant Foreign Value Fund | 16 | |
| Quant Foreign Value Small Cap Fund | 20 | |
| Schedules of Investments | 24 | |
| Quant Small Cap Fund | 24 | |
| Quant Long/Short Fund | 30 | |
| Quant Emerging Markets Fund | 37 | |
| Quant Foreign Value Fund | 45 | |
| Quant Foreign Value Small Cap Fund | 48 | |
| Statements of Assets and Liabilities | 52 | |
| Statements of Operations | 56 | |
| Statements of Changes in Net Assets | 59 | |
| Statement of Cash Flows for Quant Long/Short Fund | 64 | |
| Financial Highlights | 65 | |
| Notes to Financial Statements | 76 | |
| Information for Shareholders | 87 | |
| Management Contract and Advisory Contract Approval | 88 | |
| Service Providers | back cover | |
This report must be preceded or accompanied by a current Quant Funds prospectus for individuals who are not current shareholders of the Funds. You should read the prospectus carefully before investing because it contains more complete information on the Quant Funds’ investment objectives, risks, charges and expenses. Please consider this information carefully. For a prospectus and other information, visit www.quantfunds.com or call (800) 326-2151.
NOT FDIC INSURED • MAY LOSE VALUE • NO BANK GUARANTEE
Neither the Quant Funds nor U.S. Boston Capital Corporation is a bank.
QUANT FUNDS
Dear Fellow Shareholder,
We are pleased to provide you with the Quantitative Group of Funds’ Semi-Annual Report for the six months ended September 30, 2010 to update you on recent market conditions and the performance of the Quant Funds.
For current performance information, please visit our website at www.quantfunds.com. We thank you for your continued confidence in the Quant Funds. Please feel free to e-mail us at feedback@quantfunds.com or call us at 800-326-2151 with any questions or for assistance on your account.
Sincerely,

Willard Umphrey
President and Chairman
Any statements in this report regarding market or economic trends or the factors influencing the historical or future performance of the Quant Funds are the views of Fund management as of the date of this report. These views are subject to change at any time based upon market and other conditions, and Fund management disclaims any responsibility to update such views. These views may not be relied upon as investment advice or as an indication of trading intent on behalf of any Quant Fund. Any references to specific securities are not recommendations of such securities and may not be representative of any Quant Fund’s current or future investments.
Past performance is no guarantee of future results, and there is no guarantee that market forecasts will be realized.
QUANT FUNDS
FUND EXPENSES
We believe it’s important for Fund shareholders to have a clear understanding of fund expenses and the impact expenses have on investment returns. The following is important information about each Fund’s Expense Example, which appears below.
Expense Example
As a shareholder of a Fund, you incur two types of costs: (1) transaction costs, and (2) ongoing costs, including management fees, distribution (12b-1) fees (on Ordinary Shares) and other Fund expenses. The example is intended to help you understand your ongoing costs (in dollars) of investing in a Fund and to compare these costs with the ongoing costs of investing in other mutual funds. These examples are based on $1,000 invested at the beginning of the period and held for the entire period from April 1, 2010 to September 30, 2010.
Actual Expenses and Returns
The example provides information about actual account returns and actual expenses. You may use the information in this section, together with the amount you invested, to estimate the expenses that you paid over the period. To estimate the expenses you paid over the period, simply divide your account value by $1,000, then multiply the result by the number under the heading “Expenses Paid During the Period.”
Hypothetical Example for Comparison Purposes
The example shows you hypothetical account values and hypothetical expenses based on the Fund’s actual expense ratio and an assumed rate of return of 5% per year before expenses, which is not the Fund’s actual return.
The hypothetical account values and hypothetical expenses may not be used to estimate the actual ending account balance or expenses you paid for the period. You may use this information to compare the ongoing expenses of investing in the Fund with the ongoing expenses of other funds. To do so, compare the Fund’s 5% hypothetical example with the 5% hypothetical examples that appear in the shareholder reports of other funds.
Please note that the expenses shown in the table are meant to highlight your ongoing costs. They do not reflect any transactional costs. Thus, the “hypothetical” lines in the table are useful in comparing ongoing costs only, and will not help you determine the relative costs of owning different funds. In addition, if these transactional costs were included, your costs would have been higher. See the Funds’ prospectus for a complete description of these transactional costs.
QUANT FUNDS
Expense Example for the 6 months ended September 30, 2010
| Quant Fund | Share Class | Total Return Description | Beginning Account Value 04/01/10 | Ending Account Value 09/30/10 | Annualized Expense Ratio | Expenses Paid* 04/01/10 09/30/10 | ||||||||||||
| Small Cap | Ordinary | Actual | $ | 1,000.00 | $ | 1,016.40 | 1.64 | % | $ | 8.27 | ||||||||
| Hypothetical | $ | 1,000.00 | $ | 1,016.86 | 1.64 | % | $ | 8.28 | ||||||||||
| Institutional | Actual | $ | 1,000.00 | $ | 1,017.20 | 1.40 | % | $ | 7.06 | |||||||||
| Hypothetical | $ | 1,000.00 | $ | 1,018.06 | 1.40 | % | $ | 7.07 | ||||||||||
| Long/Short | Ordinary | Actual | $ | 1,000.00 | $ | 938.40 | 1.99 | % | $ | 9.66 | ||||||||
| Hypothetical | $ | 1,000.00 | $ | 1,015.10 | 1.99 | % | $ | 10.04 | ||||||||||
| Institutional | Actual | $ | 1,000.00 | $ | 939.80 | 1.76 | % | $ | 8.54 | |||||||||
| Hypothetical | $ | 1,000.00 | $ | 1,016.27 | 1.76 | % | $ | 8.87 | ||||||||||
| Emerging Markets | Ordinary | Actual | $ | 1,000.00 | $ | 1,079.60 | 1.73 | % | $ | 9.04 | ||||||||
| Hypothetical | $ | 1,000.00 | $ | 1,016.37 | 1.73 | % | $ | 8.77 | ||||||||||
| Institutional | Actual | $ | 1,000.00 | $ | 1,081.00 | 1.48 | % | $ | 7.70 | |||||||||
| Hypothetical | $ | 1,000.00 | $ | 1,017.67 | 1.48 | % | $ | 7.46 | ||||||||||
| Foreign Value | Ordinary | Actual | $ | 1,000.00 | $ | 1,034.50 | 1.61 | % | $ | 8.21 | ||||||||
| Hypothetical | $ | 1,000.00 | $ | 1,017.00 | 1.61 | % | $ | 8.14 | ||||||||||
| Institutional | Actual | $ | 1,000.00 | $ | 1,035.30 | 1.36 | % | $ | 6.93 | |||||||||
| Hypothetical | $ | 1,000.00 | $ | 1,018.26 | 1.36 | % | $ | 6.87 | ||||||||||
| Foreign Value | Ordinary | Actual | $ | 1,000.00 | $ | 1,059.30 | 1.70 | % | $ | 8.79 | ||||||||
| Small Cap | Hypothetical | $ | 1,000.00 | $ | 1,016.53 | 1.70 | % | $ | 8.61 | |||||||||
| Institutional | Actual | $ | 1,000.00 | $ | 1,060.20 | 1.48 | % | $ | 7.65 | |||||||||
| Hypothetical | $ | 1,000.00 | $ | 1,017.65 | 1.48 | % | $ | 7.49 | ||||||||||
| * | Expenses paid are equal to the Fund’s annualized expense ratios, multiplied by the average account value over the period, multiplied by 183/365 (to reflect the one-half year period). |
QUANT SMALL CAP FUND
INVESTMENT PROFILE
All Data as of September 30, 2010
Investment Commentary
For the semi-annual period ended September 30, 2010, the Quant Small Cap Fund’s Ordinary Shares (the “Fund”) outperformed its benchmark, the Russell 2000 Index (the “Index”). The Fund achieved a return of 1.64% at net asset value compared to 0.25% for the Index.
| Fund Information | ||||||||
| Net Assets Under Management | $102.6 Million | |||||||
| Number of Companies | 171 | |||||||
| Price to Book Ratio | 3.2 | |||||||
| Price to Earnings Ratio | 26.4 | |||||||
| Ordinary | Institutional | |||||||
| Total Expense Ratio (Net) | 1.64 | % | 1.40 | % | ||||
| Ticker Symbol | USBNX | QBNAX | ||||||
Market Conditions and Investment Strategies
Equity markets continued the strong first quarter rally into April followed by what seemed to be an orderly decline prompted by profit taking. But a series of events occurred including Europe’s sovereign debt crisis, the U.S. government’s plan for new financial regulation, the out of control Gulf oil spill, and ending with the stock market’s “Flash Crash” on May 6th. These events combined with a weak first quarter GDP, and a large drop in consumer confidence, put equity markets in full retreat by the end of the June. Market sentiment continued to be driven by talk of a double dip recession throughout the summer months. August was a dismal month for equities, but September, traditionally a weak month, turned in an historic and quite unexpected rally.
The Russell 2000 Index sector returns for the six month period were mixed. The Information Technology sector was the best performer gaining nearly 8%. Utilities were next with a return of over 6%, while Materials, Telecommunications Services, Consumer Staples, Industrials and Energy also posted positive returns. Underperforming were Financials, Health Care and Consumer Discretionary, all with negative returns of over 3%.
Analyzing our relative performance for the six month period, our best performance was in Financials where we gained over 1.5% versus the Index with Real Estate Investment Trust (REIT) holdings Entertainment Properties Trust and Ventas Inc. contributing a combined 1% to returns. We also added over 1.4% versus the Index in Industrials, primarily from stock selection, as patent licensing firm Acacia Research Corp. gained over 60% for the period. We added nearly 1.3% in Information Technology, mostly due to 3Par Inc., a computer storage company, which gained over 230% after a takeover battle was won by Hewlett-Packard Co. In Energy, we picked up 1% versus the benchmark as energy service company Core Laboratories N.V. rose 35% for the period.
Conversely, our stock selections in the Consumer Discretionary sector cost 3% of relative return as several holdings, including Chico’s FAS Inc., True Religion Apparel Inc., and Guess? Inc. all posted negative returns for the period.
Portfolio Changes
The Financials, Industrials and Materials sector weights all increased over the past six months. Our exposure to the Consumer Discretionary, Health Care, Energy and Consumer Staples sectors all declined. Changes in all other sectors were not material.
A Look Ahead
As we approach the end of the year, we are encouraged by the direction of the market but are reluctant to predict that a new bull market is imminent. The September advance occurred on light volume with poor breadth and with the Financials sector lagging, all which may be indications that the rally is exhausted. However, there is a large contingent of investors who have found refuge in low yielding bonds and have missed the rally. They may capitulate and drive prices higher as performance anxiety sets in towards year-end. Whatever the market’s direction, we will remain vigilant in the search for new market opportunities and be mindful to adjust the existing portfolio as conditions warrant.
The Fund is co-managed by Robert von Pentz, CFA, and Rhys Williams, CFA of Columbia Partners, L.L.C. Investment Management.
QUANT SMALL CAP FUND
Top 10 Holdings
| Percentage of total net assets | 36.6% |
| Core Laboratories N.V. | 4.7% |
| SBA Communications Corporation | 4.7% |
| Entertainment Properties Trust | 4.4% |
| Compass Minerals International, Inc. | 4.1% |
| Regal Entertainment Group | 3.4% |
| GUESS?, Inc. | 3.4% |
| Ventas, Inc. | 3.3% |
| Hersha Hospitality Trust | 2.9% |
| Gardner Denver, Inc. | 2.9% |
| Alliance Data Systems Corporation | 2.8% |
There is no guarantee that such securities will continue to be viewed favorably or held in the Fund’s portfolio.
Sector Allocation
| Percentage of total net assets | 100.0% |
| Financials | 19.8% |
| Information Technology | 17.0% |
| Consumer Discretionary | 12.7% |
| Industrials | 12.5% |
| Materials | 10.1% |
| Health Care | 8.5% |
| Energy | 5.3% |
| Telecommunication Services | 4.7% |
| Consumer Staples | 3.6% |
| Cash and Other Assets (Net) | 5.8% |
Value of a $10,000 Investment
Quant Small Cap (QSC) Ordinary Shares vs.
Russell 2000 Index
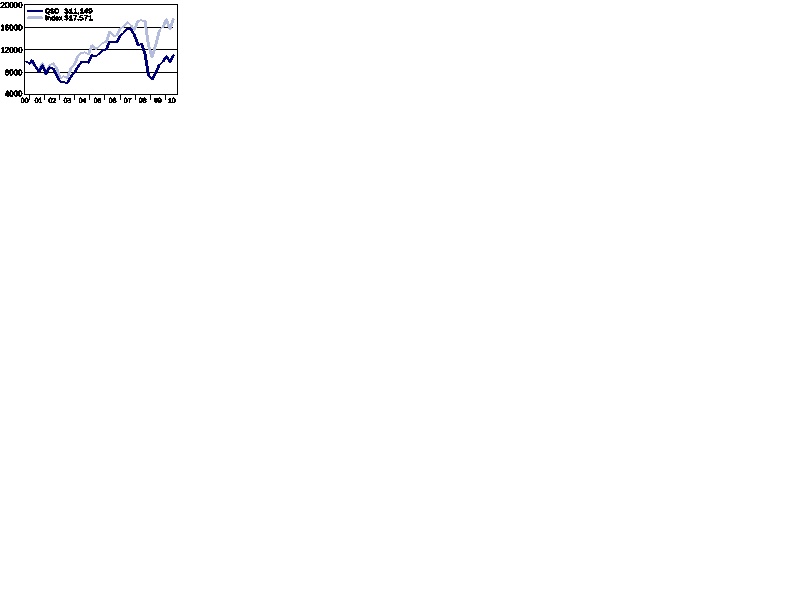
Average Annual Total Returns
| 3Q 2010 | Six Months | One Year | Five Year | Ten Year | Since Inception | Inception Date | |
| Ordinary Shares | 12.59% | 1.64% | 18.56% | (1.60)% | 0.88% | 9.69% | 08/03/92 |
Institutional Shares1 | 12.65% | 1.72% | 18.94% | (1.27)% | 1.31% | 8.88% | 01/06/93 |
Russell 20002 | 11.29% | 0.25% | 13.35% | 1.60% | 4.00% | 8.55% | ---------- |
1 Institutional Shares may only be purchased by certain categories of investors and are not subject to sales charges or distribution fees.
2 The Russell 2000 Index is a market capitalization-weighted index of 2,000 small company stocks. It is widely recognized as representative of the general market for small company stocks. Index returns assume the reinvestment of dividends and, unlike Fund returns, do no reflect any fees or expenses. You cannot invest directly in an Index. The beginning date of the Index is 08/03/92.
Small company stocks may trade less frequently and in a limited volume, and their prices may fluctuate more than stocks of other companies. Small company stocks may therefore be more vulnerable to adverse developments than those of larger companies. The Fund may invest in issuers in the real estate industry. Changes in real estate values or economic downturns can have a significant negative effect on these issuers.
Performance data quoted represents past performance and is no guarantee of future results and the information above does not reflect the deduction of taxes that a shareholder would pay on fund distributions or the redemption of shares. Current Fund performance may be lower or higher than performance data quoted. Investment return and principal value will fluctuate so that an investor’s shares, when redeemed, may be worth more or less than original cost. For the most recent month-end performance, visit the Fund’s website at www.quantfunds.com. Before investing, carefully consider the Fund’s investment objectives, risks, charges and expenses. For this and other information obtain the Fund’s prospectus by calling ( 800) 326-2151 or visiting www.quantfunds.com. Please read the prospectus carefully before you invest.
QUANT LONG/SHORT FUND
INVESTMENT PROFILE
All Data as of September 30, 2010
Investment Commentary
For the semi-annual period ended September 30, 2010, the Quant Long/Short Fund’s Ordinary Shares (the “Fund”) underperformed its benchmark, the S&P 500 Index (the “Index”). The Fund achieved a return of –6.16% at net asset value compared to –1.42% for the Index.
| Fund Information | ||||||||
| Net Assets Under Management | $48.1 Million | |||||||
| Number of Companies | 137 | |||||||
| Price to Book Ratio | 1.8 | |||||||
| Price to Earnings Ratio | 11.3 | |||||||
| Ordinary | Institutional | |||||||
| Total Expense Ratio (Net) | 1.99 | % | 1.76 | % | ||||
| Ticker Symbol | USBOX | QGIAX | ||||||
Market Conditions and Investment Strategies
The Quant Long/Short Fund seeks to add value through both long and short positions, maintaining approximately 100% net equity exposure and keeping size, style, sector and beta characteristics similar to the benchmark. The Fund employs a disciplined, yet adaptive quantitative process that analyzes over 70 characteristics that impact equity prices. Analytic’s approach is systematic in the way the importance of these characteristics are measured, but is also able to recognize and adapt to changes based on both the business cycle and economic conditions. The strategy primarily attempts to add value by buying stocks with the most attractive factor profiles and shorting stocks with the least attractive factor profiles, within a set of risk constraints. Performance is therefore driven by the performance of the valuation model and is only m inimally affected by market-wide factors.
Stocks returns were modestly negative for the period. Equities were down –9.5% for the first five months of the period, however, the conventional wisdom that September is a bad month for stocks did not hold true, as the semi-annual periods losses were virtually erased in the final month of the period alone.
While returns to factors within the Valuation category were mixed during the period, a positive exposure to the category helped to add value, as positive returns to certain factors (Dividend Yield) were enough to offset the negative returns experienced by others (Sales to Price ratios). Also, tilts away Growth characteristics helped throughout the period, as investors penalized such measures.
Unfortunately, the negative returns during the beginning of the period to traditional Quality factors, like Return on Assets, were not offset by the positive returns those characteristics experienced during the end of the period, thereby detracting from performance as the Fund was overweight such characteristics.
It is important to note that a majority of the underperformance occurred in August, which was marked by a sell-off that punished the valuation and top-line factors that had performed so well in the beginning of the year. This sentiment shift was particularly noticeable in the negative payoffs to Sales to Price and Asset Utilization, factors that had exhibited strong performance during the prior months as investors bought companies that were well positioned to benefit from a strengthening recovery. Adding to the aberration of August were the positive payoffs awarded to certain risk factors, which are rarely present during a pronounced market sell-off. The return to a focus on relative valuation and growth potential in September, along with the subsequent market rally, run counter to the renewed economic growth fears expressed in August.
Portfolio Changes
During the semi-annual period ended September 30, 2010, the Fund systematically increased exposure to securities with above average Valuation characteristics while decreasing exposure to securities with above average Risk characteristics. The Fund also decreased exposure to companies with attractive Growth characteristics.
A Look Ahead
Looking ahead, we expect the model to increase exposure to companies exhibiting above average Valuation characteristics, as well as maintain negative exposure to certain Growth characteristics. Exposures to companies with attractive Risk characteristics may decrease.
The Fund’s portfolio is managed by a team of portfolio managers at Analytic Investors, LLC. The lead portfolio managers are Harindra de Silva, Ph.D.,CFA, Dennis Bein, CFA, and Steve Sapra, CFA.
QUANT LONG/SHORT FUND
Top 10 Long Holdings
| Percentage of total net assets | 45.1% |
| International Business Machines | 6.1% |
| Apple, Inc. | 5.5% |
| ConocoPhillips | 5.3% |
| Microsoft Corporation | 4.7% |
| Time Warner, Inc. | 4.5% |
| Amgen, Inc. | 4.3% |
Cognizant Technology Solutions Corporation | 4.0% |
| Cardinal Health, Inc. | 3.7% |
| McKesson Corporation | 3.6% |
| The PNC Financial Services Group, Inc. | 3.4% |
There is no guarantee that such securities will continue to be viewed favorably or held in the Fund’s portfolio.
Top 10 Short Holdings
| Percentage of total net assets | (19.8)% |
| Liberty Media Capital | (3.2)% |
| Ciena Corporation | (2.4)% |
| Vertex Pharmaceuticals Incorporated | (2.1)% |
| Human Genome Sciences, Inc. | (2.1)% |
| Monster Worldwide, Inc. | (2.0)% |
| MEMC Electronic Materials, Inc. | (2.0)% |
| Brocade Communications Systems, Inc. | (1.9)% |
| Novell, Inc. | (1.5)% |
| Alere, Inc. | (1.5)% |
| Dendreon Corporation | (1.1)% |
Sector Allocation
| Percentage of total net assets | 100.0% |
| Information Technology | 31.5% |
| Consumer Discretionary | 20.4% |
| Health Care | 19.8% |
| Financials | 16.6% |
| Energy | 10.9% |
| Consumer Staples | 9.9% |
| Industirals | 6.8% |
| Materials | 4.7% |
| Telecommunication Services | 4.7% |
| Utilities | 3.7% |
| Cash and Other Assets (Net) | 1.1% |
| Short Positions | (30.1)% |
Value of a $10,000 Investment
| Quant Long/Short (QLS) Ordinary Shares vs. S&P 500 Index |
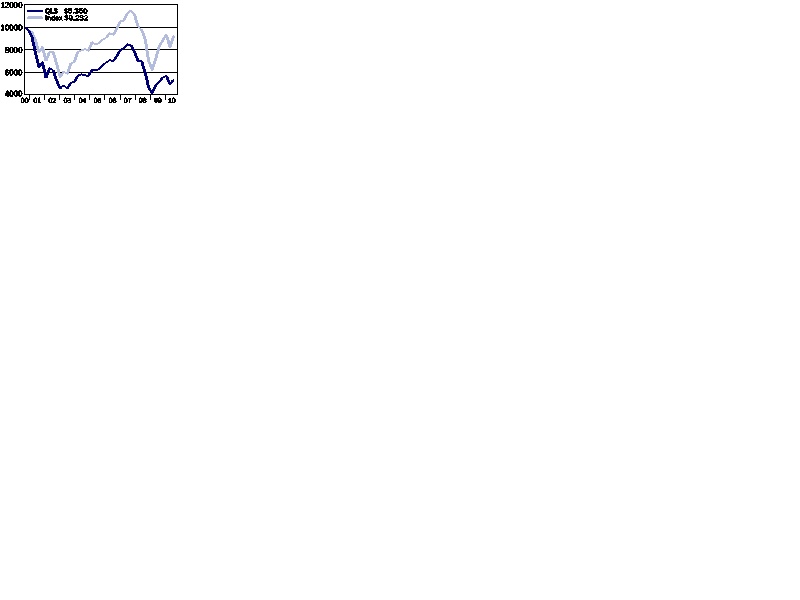
Average Annual Total Returns
| 3Q 2010 | Six Months | One Year | Five Year | Ten Year | Since Inception | Inception Date | |
| Ordinary Shares | 6.81% | (6.16)% | 3.22% | (4.40)% | (5.27)% | 8.03% | 05/06/85 |
Institutional Shares1 | 6.84% | (6.02)% | 3.95% | (4.29)% | (4.99)% | 6.06% | 03/25/91 |
S&P 5002 | 11.29% | (1.42)% | 10.16% | 0.64% | (0.43)% | 9.93% | ---------- |
1 Institutional Shares may only be purchased by certain categories of investors and are not subject to sales charges or distribution fees.
2 The S&P 500 Index is an unmanaged index of stocks chosen to their size industry characteristics. It is widely recognized as representative of stocks in the United States. Index returns assume the reinvestment of dividends and, unlike Fund returns, do not reflect any fees or expenses. You cannot invest directly in the Index. The beginning date for the Index is 05/29/85.
Short selling involves certain risks including the possibility that short positions do not limit the Fund’s stock market exposure as expected, that the future value of a short position increases above its recorded value potentially resulting in an unlimited loss and that the lender of a security sold short could terminate the loan at a price or time that is disadvantageous to the Fund.
Performance data quoted represents past performance and is no guarantee of future results and the information above does not reflect the deduction of taxes that a shareholder would pay on fund distributions or the redemption of shares. Current Fund performance may be lower or higher than performance data quoted. Investment return and principal value will fluctuate so that an investor’s shares, when redeemed, may be worth more or less than original cost. For the most recent month-end performance, visit the Fund’s website at www.quantfunds.com. Before investing, carefully consider the Fund’s investment objectives, risks, charges and expenses. For this and other information obtain the Fund’s prospectus by calling ( 800) 326-2151 or visiting www.quantfunds.com. Please read the prospectus carefully before you invest.
QUANT EMERGING MARKETS FUND
INVESTMENT PROFILE
All Data as of September 30, 2010
Investment Commentary
For the semi-annual period ended September 30, 2010, the Quant Emerging Markets Fund’s Ordinary Shares (the “Fund”) underperformed its benchmark, the MSCI Emerging Markets (the “Index”). The Fund achieved a return of 7.96% at net asset value compared to 8.37% for the Index.
| Fund Information | ||||||||
| Net Assets Under Management | $252.7 Million | |||||||
| Number of Companies | 255 | |||||||
| Price to Book Ratio | 1.9 | |||||||
| Price to Earnings Ratio | 11.5 | |||||||
| Ordinary | Institutional | |||||||
| Total Expense Ratio (Net) | 1.73 | % | 1.48 | % | ||||
| Ticker Symbol | QFFOX | QEMAX | ||||||
Market Conditions and Investment Strategies
On a sector basis, portfolio underperformance was primarily due to security selection in Telecommunication Services and Information Technology. Sectors that contributed to relative portfolio value were Financials and Materials. On a country basis, positions held in South Africa and Taiwan were the top detractors. Positions held in South Korea and India contributed.
The top detractor to relative performance stemmed from the Materials sector with an out of benchmark position held of the Luxembourg-based steel product producer and distributor, Evraz Group S.A. The top contributor to overall portfolio performance was an overweight position of the South Korea-based chemical product manufacturer, Hanwha Chemical Corporation.
In the six month period ending September 30, 2010, the Dynamic Alpha model performed relatively well across the MSCI Emerging Markets Index with the top three alpha deciles outperforming. Momentum factors worked well as both Earnings Momentum and Price Momentum displayed strong positive performance in the top two deciles. The performance of Quality factors was somewhat volatile throughout the period with Operating Efficiency working considerably well and Capital Expenditures working poorly. Valuation factors generally did not perform well during the period as both Earnings Yield and Discounted Cash Flow showed negative performance in the top deciles.
Portfolio Changes
There have been no significant changes in the Dynamic Emerging Markets Equity strategy in the past year.
A Look Ahead
As a quantitative investment firm, we tend not to provide strategy-specific forward looking commentary. We believe that our systematic investment approach ensures that we deliver a portfolio of our highest conviction of ideas to all of our clients.
The Fund’s portfolio is managed by a team of portfolio managers at PanAgora Asset Management, Inc.
Top 10 Holdings
| Percentage of total net assets | 19.8% |
| Petroleo Brasileiro SA | 3.1% |
| Samsung Electronics Co Ltd. | 2.6% |
| Vale SA | 2.4% |
| Vanguard Emerging Markets ETF | 2.0% |
Taiwan Semiconductor Manufacturing Co Ltd. | 1.9% |
| CNOOC Ltd. | 1.8% |
| China Construction Bank Corp | 1.7% |
| Bank of China Ltd | 1.5% |
| China Mobile Ltd. | 1.4% |
| Lukoil OAO | 1.4% |
There is no guarantee that such securities will continue to be viewed favorably or held in the Fund’s portfolio.
Top 10 Country Allocations
| Percentage of total net assets | 87.9% |
| China | 19.9% |
| Brazil | 15.4% |
| South Korea | 12.8% |
| Taiwan | 9.9% |
| India | 8.8% |
| Russia | 5.4% |
| South Africa | 5.3% |
| Malaysia | 3.8% |
| Turkey | 3.4% |
| Indonesia | 3.2% |
Sector Allocation
| Percentage of total net assets | 100.0% |
| Financials | 24.1% |
| Materials | 14.5% |
| Energy | 13.0% |
| Information Technology | 13.0% |
| Industrials | 8.7% |
| Consumer Discretionary | 8.5% |
| Consumer Staples | 6.8% |
| Telecommunication Services | 5.9% |
| Health Care | 1.7% |
| Utilities | 1.5% |
| Exchange Traded Funds | 2.0% |
| Cash and Other Assets (Net) | 0.3% |
Value of a $10,000 Investment
Quant Emerging Markets (QEM) Ordinary Shares vs. MSCI EM Index
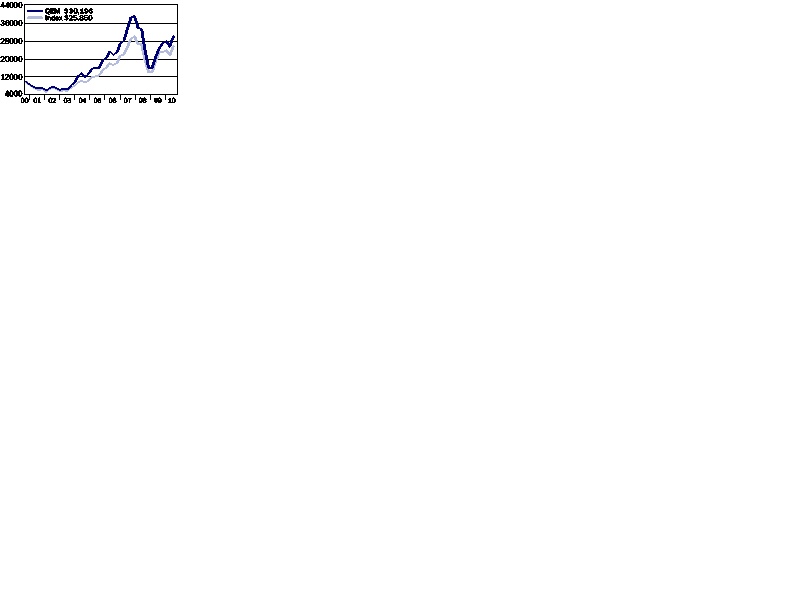
Average Annual Total Returns
| 3Q 2010 | Six Months | One Year | Five Year | Ten Year | Since Inception | Inception Date | |
| Ordinary Shares | 18.27% | 7.96% | 21.25% | 9.24% | 14.18% | 7.04% | 09/30/94 |
Institutional Shares1 | 18.35% | 8.10% | 21.62% | 9.53% | 14.60% | 9.24% | 04/02/96 |
MSCI EM2 | 18.16% | 8.37% | 20.54% | 13.08% | 13.77% | 6.52% | ---------- |
1 Institutional Shares may only be purchased by certain categories of investors and are not subject to sales charges or distribution fees.
2 The Morgan Stanley Capital International Emerging Markets (“MSCI EM”) Index is an unmanaged index comprised of stocks located in countries other than the United States. It is widely recognized as representative of the general market for emerging markets. Index returns assume the reinvestment of dividends and, unlike Fund returns, do not reflect fees or expenses. You cannot invest directly in an Index. The beginning date for the Index is 09/30/94.
Investing in foreign markets, particularly emerging markets, can be more volatile than the U.S. market due to increased risks of adverse issuer, political, regulatory, market or economic developments and can perform differently than the U.S. market.
Performance data quoted represents past performance and is no guarantee of future results and the information above does not reflect the deduction of taxes that a shareholder would pay on fund distributions or the redemption of shares. Current Fund performance may be lower or higher than performance data quoted. Investment return and principal value will fluctuate so that an investor’s shares, when redeemed, may be worth more or less than original cost. For the most recent month-end performance, visit the Fund’s website at www.quantfunds.com. Before investing, carefully consider the Fund’s investment objectives, risks, charges and expenses. For this and other information obtain the Fund’s prospectus by calling ( 800) 326-2151 or visiting www.quantfunds.com. Please read the prospectus carefully before you invest.
QUANT FOREIGN VALUE FUND
INVESTMENT PROFILE
All Data as of September 30, 2010
Investment Commentary
For the semi-annual period ended September 30, 2010, the Quant Foreign Value Fund’s Ordinary Shares (the “Fund”) outperformed its benchmark, the MSCI EAFE Index (the “Index”). The Fund achieved a return of 3.45% at net asset value compared to 0.51% for the Index.
| Fund Information | ||||||||
| Net Assets Under Management | $400.8 Million | |||||||
| Number of Companies | 51 | |||||||
| Price to Book Ratio | 2.1 | |||||||
| Price to Earnings Ratio | 83.6 | |||||||
| Ordinary | Institutional | |||||||
| Total Expense Ratio (Net) | 1.61 | % | 1.36 | % | ||||
| Ticker Symbol | QFVOX | QFVIX | ||||||
Market Conditions and Investment Strategies
For the sixth month period, the Fund’s benchmark beating returns can be attributed to portfolio outperformance in 8 out of 10 sectors. Financials were the top contributors, with State Bank of India posting double-digit returns. India remains an “under-banked” country relative to developed markets, and an emerging middle class is expected to utilize more banking services, gaining comfort with the concept of leverage. Other financials posting strong results including Scandinavian banks DnB NOR and Svenska Handelsbanken, as well as British-based Lloyds TSB Group.
Late cycle companies (primarily industrial companies that depend on capital spending) also added to the Fund’s positive gains for the period. After the 2007-2009 recession, concerns arose about replenishment of new orders. Recent discussions with company management teams pointed to increases in pre-order activity. Renewed strength of these late cycle companies portends underlying economic growth in emerging and some developed countries.
Stabilized Asian refining and higher global oil prices boosted energy holdings. Japanese consumer staples companies Meiji Holdings and Asahi Breweries also performed well. In healthcare, both pharmaceutical companies posted positive returns.
Materials started to rebound in the September quarter, as demand outstripped supply in some commodities. Yet, the Fund’s materials holdings remained in negative territory for the 6 month period. Irish building materials group CRH benefited from strong European business, but performance was impinged by weak volumes due to slow U.S. infrastructure spending at the state and local level.
In consumer discretionary, performance was hampered by British homebuilders. Constricted spending, reduced U.K. government funding and questions surrounding homebuyer taxes had a negative impact. However, budget cuts and less regulation may prove positive for the U.K. homebuilder industry. With negative news already priced into the homebuilder stocks and substantial upside in a recovery, we feel the stocks are undervalued on a three-to-five year view.
Portfolio Changes
During the six month period, we purchased a French biotech company designing therapeutic vaccines for specific cancers and Hepatitis C. We also invested in a German manufacturer of banking machines and point of sale hardware and software.
Japan’s Culture Convenience was eliminated from the portfolio due to concerns about the video rental industry. The Fund had only a small weighting in the stock that was slowly reduced over the past six months as fundamentals deteriorated.
A Look Ahead
We expect a slow economic recovery, punctuated by periods of good and bad news that will likely result in market volatility. More normal business cycles have returned, after an unprecedented growth trajectory in markets from the 1990s-2007. Today, expectations of individuals, corporations, and governments will be more cautious, conservative, and likely result in a more sustainable path to growth. Such rational behavior and environment can still result in very satisfactory investment returns, just not excessive and unsustainable returns.
The Fund’s pure value philosophy is expected to perform best in markets displaying volatility since these markets tend to present the best value opportunities. We continue to take advantage of market advance to sell holdings at a profit, while awaiting market declines to buy good companies at compelling valuations.
The Fund’s lead portfolio manager is Bernard R. Horn, Jr., of Polaris Capital Management, LLC
QUANT FOREIGN VALUE FUND
Top 10 Holdings
| Percentage of total net assets | 27.2% |
| Thai Oil PLC | 2.9% |
| DnB NOR ASA | 2.9% |
| State Bank of India | 2.9% |
| Samsung Electronics Company Ltd. | 2.8% |
| Kone OYJ-B | 2.7% |
| Duni AB | 2.7% |
| Svenska Handelsbanken AB | 2.7% |
| Technip S.A. | 2.6% |
| Investor AB | 2.5% |
| Smurfit Kappa Group PLC | 2.5% |
There is no guarantee that such securities will continue to be viewed favorably or held in the Fund’s portfolio.
Top 10 Country Allocations
| Percentage of total net assets | 74.9% |
| Germany | 13.1% |
| Japan | 11.5% |
| Sweden | 10.2% |
| United Kingdom | 9.8% |
| France | 6.7% |
| Finland | 6.3% |
| Ireland | 5.8% |
| South Korea | 4.7% |
| India | 3.7% |
| Norway | 3.1% |
Sector Allocation
| Percentage of total net assets | 100.0% |
| Financials | 17.9% |
| Industrials | 17.9% |
| Materials | 16.9% |
| Consumer Discretionary | 14.7% |
| Energy | 8.3% |
| Information Technology | 5.7% |
| Consumer Staples | 5.5% |
| Telecommunication Services | 3.4% |
| Health Care | 2.8% |
| Utilities | 1.6% |
| Cash and Other Assets (Net) | 5.3% |
Value of a $10,000 Investment
Quant Foreign Value (QFV) Ordinary Shares vs. MSCI EAFE Index
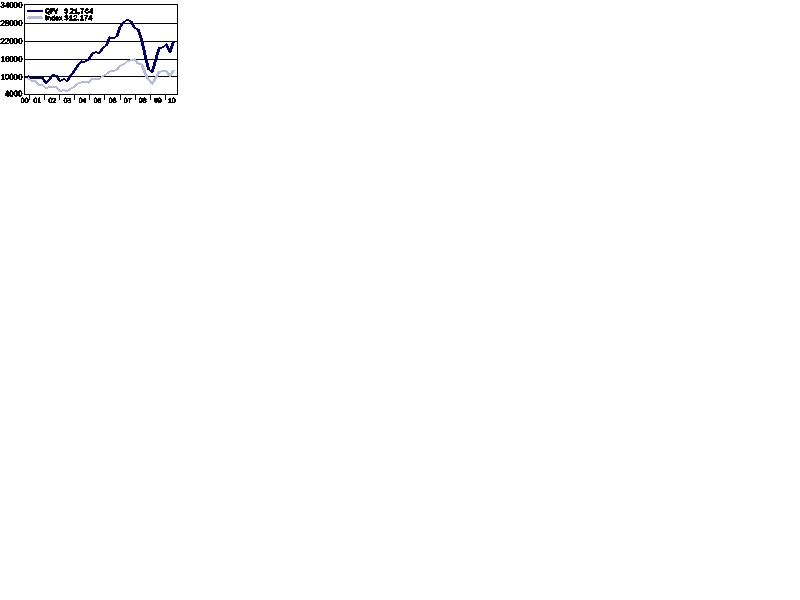
Average Annual Total Returns
| 3Q 2010 | Six Months | One Year | Five Year | Ten Year | Since Inception | Inception Date | |
| Ordinary Shares | 18.49% | 3.45% | 9.77% | 1.97% | 8.56% | 5.96% | 05/15/98 |
Institutional Shares1 | 18.47% | 3.53% | 9.97% | 2.16% | 8.82% | 8.03% | 12/18/98 |
MSCI EAFE2 | 16.53% | 0.51% | 3.71% | 2.45% | 2.99% | 3.77% | ---------- |
1 Institutional Shares may only be purchased by certain categories of investors and are not subject to sales charges or distribution fees.
2 The Morgan Stanley Capital International Europe, Australasia, and Far East (“MSCI EAFE”) Index is an unmanaged index comprised of stocks located in countries other than the United States. It is widely recognized as representative of the general market for emerging markets. Index returns assume the reinvestment of dividends and, unlike Fund returns, do not reflect fees or expenses. You cannot invest directly in an Index. The beginning date for the Index is 05/29/98.
Investing in foreign markets, particularly emerging markets, can be more volatile than the U.S. market due to increased risks of adverse issuer, political, regulatory, market or economic developments and can perform differently than the U.S. market.
Performance data quoted represents past performance and is no guarantee of future results and the information above does not reflect the deduction of taxes that a shareholder would pay on fund distributions or the redemption of shares. Current Fund performance may be lower or higher than performance data quoted. Investment return and principal value will fluctuate so that an investor’s shares, when redeemed, may be worth more or less than original cost. For the most recent month-end performance, visit the Fund’s website at www.quantfunds.com. Before investing, carefully consider the Fund’s investment objectives, risks, charges and expenses. For this and other information obtain the Fund’s prospectus by calling ( 800) 326-2151 or visiting www.quantfunds.com. Please read the prospectus carefully before you invest.
QUANT FOREIGN VALUE SMALL CAP FUND
INVESTMENT PROFILE
All Data as of September 30, 2010
Investment Commentary
For the semi-annual period ended September 30, 2010, the Quant Foreign Value Small Cap Fund’s Ordinary Shares (the “Fund”) outperformed its benchmark, the S&P/Citigroup EPAC Small Cap Index (the “Index”). The Fund achieved a return of 5.93% at net asset value compared to 4.25% for the Index.
| Fund Information | ||||||||
| Net Assets Under Management | $100.8 Million | |||||||
| Number of Companies | 69 | |||||||
| Price to Book Ratio | 2.3 | |||||||
| Price to Earnings Ratio | 21.3 | |||||||
| Ordinary | Institutional | |||||||
| Total Expense Ratio (Net) | 1.70 | % | 1.48 | % | ||||
| Ticker Symbol | QFVOX | QFVIX | ||||||
Market Conditions and Investment Strategies
We are pleased with the semi-annual performance of the Fund, as returns benefited from sector outperformance in energy, consumer discretionary, consumer staples, telecom and utilities.
Consumer discretionary stocks offered the greatest contribution, with two thirds of portfolio holdings producing double digit returns. British toy company Character Group was up strongly, attributable to the company’s two pronged business strategy: product expansion through the purchase of licenses and franchises from other toy manufacturers and continuation of the company’s stock buyback program. Clicks Group, the South African health and beauty retail chain, also experienced large gains, as its business model exhibited a strong growth trajectory.
Consumer staples rebounded from last quarter’s negative performance, bolstered by KRBL Limited, Thai Union and Glanbia, all of which posted double digit returns for the six month period. Comprising about 13% of the portfolio, defensive sectors including energy, telecom and utilities were not the strongest performers, yet each had meaningful positive gains. Defensive names were added due to their steady risk diversification characteristics. In telecom, Alternative Networks manages business telephone networks in the U.K. market; the company has been taking market share from competitors.
Detracting from better results were the late-cycle companies (namely materials and industrials), which suffered due to concerns about dwindling order books. In Industrials, Hampson Industries suffered on news of delayed orders from Boeing/Airbus, while Transcom Worldwide continues to undergo a restructuring. In materials, USHA Martin and Vetropack Holdings both decreased. However, recent discussions with company management teams have pointed to increases in pre-order activity. A resumption of order activity suggests underlying economic growth, especially in foreign economies. Many of the industrial and material com panies in the portfolio have substantial exposure to emerging markets, which may drive a strong recovery in sales and cash flow.
Portfolio Changes
During the six month period, we sold holdings in the healthcare and materials sectors, utilizing market volatility to sell at rich valuations. One Russian bank stock was sold at a profit when analysis projected margin deterioration due to increasing competition.
We executed 13 new buys during the six month period, adding stocks in 8 out of 10 sectors. Such purchases directly align with our objective of bolstering the number of portfolio holdings that meet the strict fundamental criteria related to cash flow and valuations.
A Look Ahead
We expect volatility to persist, with periods of good and bad news impacting more traditional business cycles. In our opinion, such volatility is normal; the early 1990s through 2007 period proved an anomaly when virtually all sectors experienced unprecedented, strong growth. However, more normal business cycles and security markets have returned, portending a future of satisfactory investment returns, just not excessive and unsustainable returns.
Volatility allows us to take advantage of market advances to sell holdings at a profit; market declines allow us to buy good companies at compelling valuations.
The Fund’s lead portfolio manager is Bernard R. Horn, Jr., of Polaris Capital Management, LLC
QUANT FOREIGN VALUE SMALL CAP FUND
Top 10 Holdings
| Percentage of total net assets | 19.2% |
| Alternative Networks plc | 2.4% |
| Manila Water Company, Inc. | 2.1% |
| Prosafe SE | 2.1% |
| South Indian Bank Derivative | 1.9% |
| Drädagerwerk AG | 1.9% |
| China Hongxing Sports Limited | 1.8% |
| M1 Ltd. | 1.8% |
| NagaCorp Ltd. | 1.8% |
| KRBL Limited Derivative | 1.7% |
| LIC Housing Finance Ltd. Derivative | 1.7% |
There is no guarantee that such securities will continue to be viewed favorably or held in the Fund’s portfolio.
Top 10 Country Allocations
| Percentage of total net assets | 68.0% |
| United Kingdom | 17.2% |
| China | 13.8% |
| India | 8.3% |
| Ireland | 5.6% |
| Japan | 4.8% |
| Norway | 4.5% |
| Sweden | 4.3% |
| Germany | 3.3% |
| Singapore | 3.2% |
| South Africa | 3.0% |
Sector Allocation
| Percentage of total net assets | 100.0% |
| Consumer Discretionary | 24.2% |
| Industrials | 17.3% |
| Consumer Staples | 9.9% |
| Financials | 8.8% |
| Health Care | 7.5% |
| Information Technology | 7.0% |
| Materials | 6.5% |
| Utilites | 5.2% |
| Telecommunication Services | 4.2% |
| Energy | 3.7% |
| Cash and Other Assets (Net) | 5.6% |
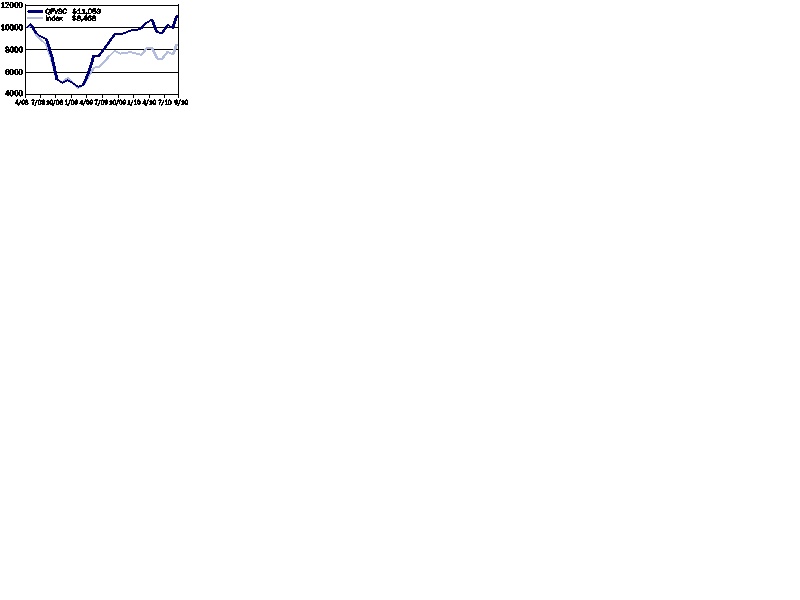
Value of a $10,000 Investment
Quant Foreign Value Small Cap (QFVSC) Ordinary Shares vs. EPAC EMI Index
Average Annual Total Returns
| 3Q 2010 | Six Months | One Year | Five Year | Ten Year | Since Inception | Inception Date | |
| Ordinary Shares | 16.10% | 5.93% | 17.62% | — | — | 4.22% | 5/1/2008 |
| Institutional Shares1 | 16.17% | 6.02% | 17.89% | — | — | 4.41% | 5/1/2008 |
| S&P/EPAC Small Cap Index | 17.13% | 4.25% | 7.39% | — | — | (5.98)% | ---------- |
1 Institutional Shares may only be purchased by certain categories of investors and are not subject to sales charges or distribution fees.
2 The S&P/ Extended Market Europe Pacific Asia Composite (“S&P/ EMI EPAC”) Index measures the bottom 20% of institutionary investable capital of developed and emerging (after 09/30/1994) countries, selected by the index sponsor outside of the United States. It is widely recognized as representative of the general market for foreign markets. Index returns assume the reinvestment of dividends and, unlike Fund returns, do no reflect any fees or expenses. You cannot invest directly in an Index. The beginning date for the Index is 05/01/08.
Investing in foreign markets, particularly emerging markets, can be more volatile than the U.S. market due to increased risks of adverse issuer, political, regulatory, market or economic developments and can perform differently than the U.S. market.
Performance data quoted represents past performance and is no guarantee of future results and the information above does not reflect the deduction of taxes that a shareholder would pay on fund distributions or the redemption of shares. Current Fund performance may be lower or higher than performance data quoted. Investment return and principal value will fluctuate so that an investor’s shares, when redeemed, may be worth more or less than original cost. For the most recent month-end performance, visit the Fund’s website at www.quantfunds.com. Before investing, carefully consider the Fund’s investment objectives, risks, charges and expenses. For this and other information obtain the Fund’s prospectus by calling ( 800) 326-2151 or visiting www.quantfunds.com. Please read the prospectus carefully before you invest.
QUANT SMALL CAP FUND
SCHEDULE OF INVESTMENTS
September 30, 2010 (unaudited)
Common Stock—94.2%
| Shares | Value | |||||||
| AEROSPACE & DEFENSE—0.1% | ||||||||
Hawk Corporation, Class A (a) | 661 | $ | 28,602 | |||||
Sparton Corporation (a) | 4,914 | 29,926 | ||||||
| 58,528 | ||||||||
| AIRLINES—0.0% | ||||||||
Republic Airways Holdings, Inc. (a) | 3,509 | 29,055 | ||||||
| BANKS—2.5% | ||||||||
Arlington Asset Investment Corp. | 1,208 | 28,158 | ||||||
Bank of the Ozarks, Inc. | 7,458 | 276,618 | ||||||
CoBiz Financial, Inc. | 112,690 | 626,556 | ||||||
F.N.B. Corporation | 59,840 | 512,230 | ||||||
Pinnacle Financial Partners, Inc. (a) | 27,658 | 254,177 | ||||||
WestAmerica Bancorporation | 16,056 | 874,892 | ||||||
| 2,572,631 | ||||||||
| BIOTECHNOLOGY—0.1% | ||||||||
BioDelivery Sciences International, Inc. (a) | 9,845 | 28,846 | ||||||
CytRx Corporation (a) | 40,020 | 30,011 | ||||||
Inhibitex, Inc. (a) | 15,103 | 27,185 | ||||||
| 86,042 | ||||||||
| CHEMICALS—3.3% | ||||||||
Balchem Corporation | 36,339 | 1,121,422 | ||||||
Ferro Corporation (a) | 87,999 | 1,134,307 | ||||||
Innospec, Inc. (a) | 1,941 | 29,561 | ||||||
LSB Industries, Inc. (a) | 56,336 | 1,046,160 | ||||||
Material Sciences Corporation (a) | 6,693 | 29,851 | ||||||
OMNOVA Solutions, Inc. (a) | 3,877 | 27,876 | ||||||
Quaker Chemical Corporation | 880 | 28,653 | ||||||
| 3,417,830 | ||||||||
| COMMERCIAL SERVICES & SUPPLIES—6.6% | ||||||||
Acacia Research Corporation (a) | 142,512 | 2,508,212 | ||||||
Aegean Marine Petroleum Network, Inc. | 23,855 | 396,947 | ||||||
APAC Customer Services, Inc. (a) | 5,235 | 29,630 | ||||||
Ballantyne Strong, Inc. (a) | 3,402 | 29,427 | ||||||
CAI International, Inc. (a) | 1,937 | 29,384 | ||||||
Clean Harbors, Inc. (a) | 5,835 | 395,321 | ||||||
Collectors Universe, Inc. | 2,121 | 28,570 | ||||||
Diamond Management & Technology Consultants, Inc. (a) | 2,306 | 28,825 | ||||||
Kforce, Inc. (a) | 64,328 | 882,580 | ||||||
MediaMind Technologies, Inc. (a) | 26,064 | 359,684 | ||||||
National Technical Systems, Inc. | 4,121 | 31,732 | ||||||
RCM Technologies, Inc. (a) | 5,804 | 29,252 | ||||||
The Providence Service Corporation (a) | 1,939 | 31,780 | ||||||
Waste Connections, Inc. | 50,280 | 1,994,105 | ||||||
| 6,775,449 | ||||||||
| COMMUNICATIONS EQUIPMENT—3.4% | ||||||||
Atheros Communications, Inc. (a) | 10,004 | 263,605 | ||||||
Hughes Communications, Inc. (a) | 15,378 | 419,050 | ||||||
NICE-Systems Ltd. (a)(c) | 79,909 | 2,500,353 | ||||||
Powerwave Technologies, Inc. (a) | 15,677 | 28,532 | ||||||
Westell Technologies, Inc., Class A (a) | 12,542 | 28,847 | ||||||
Ulticom, Inc. | 33,928 | 268,710 | ||||||
| 3,509,097 | ||||||||
| COMPUTERS & PERIPHERALS—0.1% | ||||||||
Key Tronic Corporation (a) | 5,061 | 30,113 | ||||||
TransAct Technologies, Inc. (a) | 3,698 | 29,584 | ||||||
| 59,697 | ||||||||
| CONSTRUCTION & ENGINEERING—0.3% | ||||||||
MasTec, Inc. (a) | 29,348 | 302,871 | ||||||
| CONSTRUCTION MATERIALS—0.0% | ||||||||
United States Lime & Minerals, Inc. (a) | 762 | 29,459 | ||||||
| CONTAINERS & PACKAGING—2.7% | ||||||||
Silgan Holdings, Inc. | 55,449 | 1,757,734 | ||||||
Sonoco Products Company | 27,546 | 921,138 | ||||||
UFP Technologies, Inc. (a) | 2,622 | 30,861 | ||||||
| 2,709,733 | ||||||||
| DISTRIBUTORS—0.0% | ||||||||
Navarre Corporation (a) | 11,224 | 29,182 | ||||||
| DIVERSIFIED FINANCIALS—3.8% | ||||||||
Dominion Resources Black Warrior Trust | 2,185 | 29,716 | ||||||
Fifth Street Finance Corp. | 83,053 | 925,210 | ||||||
First Cash Financial Services, Inc. (a) | 42,734 | 1,185,869 | ||||||
optionsXpress Holdings, Inc. (a) | 40,573 | 623,201 | ||||||
Kohlberg Capital Corporation | 4,452 | 29,784 | ||||||
Meta Financial Group, Inc. | 916 | 29,266 | ||||||
NewStar Financial, Inc. (a) | 4,175 | 30,937 | ||||||
Texas Pacific Land Trust | 785 | 31,400 | ||||||
Tower Bancorp, Inc. | 30,334 | 614,870 | ||||||
TradeStation Group, Inc. (a) | 61,263 | 403,111 | ||||||
Virtus Investment Partners, Inc. (a) | 971 | 29,382 | ||||||
| 3,932,746 | ||||||||
| ELECTRICAL EQUIPMENT—1.7% | ||||||||
Infinera Corporation (a) | 82,517 | 962,973 | ||||||
Powell Industries, Inc. (a) | 943 | 29,346 | ||||||
Power-One, Inc. (a)(b) | 71,633 | 651,144 | ||||||
Preformed Line Products Company | 850 | 29,640 | ||||||
| 1,673,103 | ||||||||
| ELECTRONIC EQUIPMENT & INSTRUMENTS—4.8% | ||||||||
DDi Corp. | 3,300 | 30,492 | ||||||
eMagin Corporation (a) | 8,967 | 28,605 | ||||||
ePlus, Inc. (a) | 1,349 | 28,936 | ||||||
Finisar Corporation (a) | 95,339 | 1,791,421 | ||||||
Measurement Specialties, Inc. (a) | 1,661 | 30,695 | ||||||
OSI Systems, Inc. (a) | 36,895 | 1,340,026 | ||||||
Richardson Electronics, Ltd. | 2,820 | 29,610 | ||||||
Riverbed Technology (a) | 35,664 | 1,625,565 | ||||||
SL Industries, Inc. (a) | 2,060 | 29,025 | ||||||
SMTC Corporation (a) | 8,435 | 29,016 | ||||||
| 4,963,391 | ||||||||
| ENERGY EQUIPMENT & SERVICES—4.7% | ||||||||
Core Laboratories N.V. | 55,052 | 4,846,778 | ||||||
| FOOD DRUG & RETAILING—2.1% | ||||||||
Arden Group, Inc., Class A | 345 | 28,463 | ||||||
United Natural Foods, Inc. (a) | 64,824 | 2,148,267 | ||||||
| 2,176,730 | ||||||||
| FOOD PRODUCTS—1.4% | ||||||||
Diamond Foods, Inc. | 33,779 | 1,384,601 | ||||||
Inventure Foods, Inc. (a) | 7,839 | 29,553 | ||||||
Overhill Farms, Inc. (a) | 6,010 | 27,406 | ||||||
| 1,441,560 | ||||||||
| HEALTH CARE EQUIPMENT & SUPPLIES—2.9% | ||||||||
Kensey Nash Corporation (a) | 961 | 27,763 | ||||||
LeMaitre Vascular, Inc. (a) | 4,139 | 29,180 | ||||||
Matrixx Initiatives, Inc. (a) | 5,701 | 29,075 | ||||||
Nutraceutical International Corporation (a) | 1,899 | 29,795 | ||||||
NuVasive, Inc. (a) | 18,120 | 636,737 | ||||||
Shamir Optical Industry, Ltd. | 2,656 | 28,525 | ||||||
Sirona Dental Systems, Inc. (a) | 18,850 | 679,354 | ||||||
SXC Health Solutions, Corp. (a) | 40,459 | 1,475,540 | ||||||
Synergetics USA, Inc. (a) | 10,377 | 29,056 | ||||||
Vascular Solutions, Inc. (a) | 2,587 | 29,699 | ||||||
| 2,994,724 | ||||||||
| HEALTH CARE PROVIDERS & SERVICES—5.0% | ||||||||
BioScrip, Inc. (a) | 196,885 | 1,015,927 | ||||||
Continucare Corporation (a) | 7,176 | 30,139 | ||||||
eResearch Technology, Inc. (a) | 136,026 | 1,017,474 | ||||||
Five Star Quality Care, Inc. (a) | 5,758 | 29,078 | ||||||
Health Grades, Inc. (a) | 3,522 | 28,845 | ||||||
Henry Schein, Inc. (a) | 25,799 | 1,511,305 | ||||||
Metropolitan Health Networks, Inc. (a) | 7,754 | 29,465 | ||||||
Psychemedics Corporation | 3,086 | 28,700 | ||||||
Universal Health Services, Inc. | 37,295 | 1,449,284 | ||||||
| 5,140,217 | ||||||||
| HOTELS, RESTAURANTS & LEISURE—0.5% | ||||||||
AFC Enterprises, Inc. (a) | 2,357 | 29,227 | ||||||
California Pizza Kitchen, Inc. (a) | 26,072 | 444,788 | ||||||
Famous Dave’s of America, Inc. (a) | 3,149 | 29,947 | ||||||
Full House Resorts, Inc. (a) | 9,014 | 28,304 | ||||||
Krispy Kreme Doughnuts, Inc. (a) | 6,541 | 29,958 | ||||||
| 562,224 | ||||||||
| HOUSEHOLD DURABLES—0.0% | ||||||||
Emerson Radio Corp. (a) | 12,878 | 28,976 | ||||||
| INSURANCE—0.8% | ||||||||
Aspen Insurance Holdings Limited | 26,142 | 791,580 | ||||||
NYMAGIC, Inc. | 1,122 | 28,802 | ||||||
Primus Guaranty, Ltd. (a) | 6,244 | 28,472 | ||||||
| 848,854 | ||||||||
| INTERNET & CATALOG RETAIL—0.1% | ||||||||
Overstock.com, Inc. (a) | 1,874 | 29,459 | ||||||
Stamps.com Inc. (a) | 2,255 | 29,315 | ||||||
| 58,774 | ||||||||
| INTERNET SOFTWARE & SERVICES—1.7% | ||||||||
A.D.A.M., Inc. (a) | 4,431 | 28,093 | ||||||
HealthStream, Inc. (a) | 5,495 | 29,233 | ||||||
Internet Capital Group, Inc. (a) | 156,089 | 1,721,662 | ||||||
| 1,778,988 | ||||||||
| IT CONSULTING & SERVICES—2.8% | ||||||||
| Alliance Data Systems Corporation (a) | 43,316 | 2,826,802 | ||||||
| Internap Network Services Corporation (a) | 5,935 | 29,141 | ||||||
| 2,855,943 | ||||||||
| MACHINERY—3.7% | ||||||||
Gardner Denver, Inc. | 55,353 | 2,971,350 | ||||||
The Middleby Corporation (a) | 13,337 | 845,432 | ||||||
| 3,816,782 | ||||||||
| MARINE—0.0% | ||||||||
International Shipholding Corporation | 1,051 | 29,680 | ||||||
| MEDIA—3.5% | ||||||||
Journal Communications, Inc., Class A (a) | 6,708 | 30,253 | ||||||
ReachLocal, Inc. (a) | 2,190 | 30,178 | ||||||
Regal Entertainment Group | 269,757 | 3,539,212 | ||||||
| 3,599,643 | ||||||||
| METALS & MINING—4.1% | ||||||||
Compass Minerals International, Inc. | 54,399 | 4,168,051 | ||||||
Great Northern Iron Ore Properties | 240 | 28,356 | ||||||
| 4,196,407 | ||||||||
| MULTILINE RETAIL—0.9% | ||||||||
Fred’s, Inc., Class A | 74,778 | 882,380 | ||||||
Gordmans, Inc. (a) | 2,613 | 30,180 | ||||||
| 912,560 | ||||||||
| OIL & GAS—0.6% | ||||||||
L & L Energy, Inc. (a) | 3,737 | 29,971 | ||||||
Natural Gas Services Group, Inc. (a) | 37,099 | 547,952 | ||||||
Whiting USA Trust I | 1,415 | 29,559 | ||||||
| 607,482 | ||||||||
| PERSONAL PRODUCTS—0.1% | ||||||||
Natural Alternatives International, Inc. (a) | 3,776 | 29,868 | ||||||
The Female Health Company | 5,590 | 28,789 | ||||||
| 58,657 | ||||||||
| PHARMACEUTICALS—0.5% | ||||||||
Hi-Tech Pharmacal Co., Inc. (a) | 1,431 | 28,963 | ||||||
Penwest Pharmaceuticals Co. (a) | 5,781 | 28,847 | ||||||
Supergen, Inc. (a) | 13,671 | 28,572 | ||||||
Targacept, Inc. (a) | 20,440 | 456,630 | ||||||
| 543,012 | ||||||||
| REAL ESTATE—12.7% | ||||||||
AMB Property Corporation | 24,654 | 652,591 | ||||||
American Campus Communities, Inc. | 41,290 | 1,256,868 | ||||||
Dynex Capital, Inc. | 2,649 | 28,556 | ||||||
Entertainment Properties Trust | 104,488 | 4,511,792 | ||||||
Hersha Hospitality Trust | 580,209 | 3,005,483 | ||||||
Newcastle Investment Corp. (a) | 9,246 | 28,663 | ||||||
RAIT Financial Trust (a) | 16,968 | 27,997 | ||||||
Resource Capital Corp. | 4,371 | 27,756 | ||||||
Ventas, Inc. | 66,312 | 3,419,710 | ||||||
Winthrop Realty Trust | 2,277 | 28,144 | ||||||
| 12,987,560 | ||||||||
| ROAD & RAIL—0.1% | ||||||||
RailAmerica, Inc. (a) | 9,567 | 92,130 | ||||||
| SEMICONDUCTOR EQUIPMENT & PRODUCTS—0.7% | ||||||||
8x8, Inc. (a) | 13,112 | 28,191 | ||||||
AXT, Inc. (a) | 4,299 | 28,459 | ||||||
Nova Measuring Instruments Ltd. (a) | 4,832 | 28,751 | ||||||
Ramtron International Corporation (a) | 7,692 | 28,460 | ||||||
RF Micro Devices, Inc. (a) | 95,981 | 589,323 | ||||||
| 703,184 | ||||||||
| SOFTWARE—3.5% | ||||||||
Blackboard, Inc. (a)(b) | 53,009 | 1,910,444 | ||||||
Magic Software Enterprises Ltd. | 11,224 | 28,060 | ||||||
Peerless Systems Corporation (a) | 9,043 | 29,028 | ||||||
Phoenix Technologies Ltd. (a) | 7,303 | 28,482 | ||||||
SuccessFactors, Inc. (a) | 11,591 | 291,050 | ||||||
Verint Systems Inc. (a) | 43,133 | 1,274,580 | ||||||
| 3,561,644 | ||||||||
| SPECIALTY RETAIL—2.0% | ||||||||
America’s Car-Mart, Inc. (a) | 1,127 | 28,378 | ||||||
Borders Group, Inc. (a) | 23,644 | 28,136 | ||||||
Chico’s FAS, Inc. | 161,933 | 1,703,535 | ||||||
Hastings Entertainment, Inc. (a) | 4,438 | 30,134 | ||||||
Kirkland’s, Inc. (a) | 2,095 | 29,037 | ||||||
PC Connection, Inc. (a) | 4,205 | 28,720 | ||||||
Select Comfort Corporation (a) | 4,163 | 28,225 | ||||||
The Talbots, Inc. (a) | 11,716 | 153,480 | ||||||
Winmark Corporation | 860 | 28,758 | ||||||
| 2,058,403 | ||||||||
| TEXTILES & APPAREL—5.7% | ||||||||
Cherokee, Inc. | 1,538 | 28,053 | ||||||
Crocs, Inc. (a) | 88,660 | 1,153,467 | ||||||
GUESS?, Inc. | 84,932 | 3,450,787 | ||||||
Kid Brands, Inc. (a) | 3,362 | 28,913 | ||||||
LaCrosse Footwear, Inc. | 2,118 | 29,250 | ||||||
Phillips-Van Heusen Corporation | 17,990 | 1,082,278 | ||||||
| 5,772,748 | ||||||||
| WIRELESS TELECOMMUNICATION SERVICES—4.7% | ||||||||
SBA Communications Corporation (a) | 119,164 | 4,802,309 | ||||||
USA Mobility, Inc. | 1,776 | 28,469 | ||||||
| 4,830,778 | ||||||||
| TOTAL COMMON STOCK | ||||||||
(Cost $78,615,969) | 96,653,252 | |||||||
| Short Term Investments—6.7% | ||||||||
| Par Value | Value | |||||||
State Street Bank & Trust Co., Repurchase Agreement .01%, 10/01/10, (Dated 09/30/10), Collateralized by $6,580,000 par U.S. Treasury Note—2.5% due 04/30/15, Market Value $7,045,206, Repurchase Proceeds $6,907,002 (Cost $6,907,000) | $ | 6,907,000 | 6,907,000 | |||||
TOTAL INVESTMENTS (EXCLUDING INVESTMENTS PURCHASED WITH CASH COLLATERAL FROM SECURITIES LOANED)—100.9% (Cost $85,522,969) | 103,560,252 | |||||||
INVESTMENTS PURCHASED WITH CASH COLLATERAL FROM SECURITIES LOANED—1.1% | ||||||||
| Money Market—1.1% | ||||||||
JP Morgan Prime Money Market Fund—Inst. (Cost $1,167,707) | $ | 1,167,707 | $ | 1,167,707 | ||||
TOTAL INVESTMENTS—102.0% (Cost $86,690,676) | 104,727,959 | |||||||
| OTHER ASSETS & LIABILITIES (NET)—(2.0%) | (2,141,541 | ) | ||||||
| NET ASSETS—100% | $ | 102,586,418 | ||||||
| (a) | Non-income producing security |
| (b) | All or a portion of this security was out on loan. |
| (c) | ADR—American Depositary Receipts |
The Portfolio is actively managed and holdings are subject to change.
There is no guarantee the Fund will continue to invest in the securities referenced.
Reference to specific securities or holdings should not be considered recommendations for action by investors.
The accompanying notes are an integral part of these financial statements..
QUANT LONG/SHORT FUND
SCHEDULE OF INVESTMENTS
September 30, 2010 (unaudited)
Common Stock—98.9%
Long Positions—129.0%
| Shares | Value | |||||||
| AEROSPACE & DEFENSE—1.2% | ||||||||
General Dynamics Corporation | 3,900 | 244,959 | ||||||
Lockheed Martin Corporation (b) | 5,057 | 360,463 | ||||||
| 605,422 | ||||||||
| AIRLINES—0.8% | ||||||||
Continental Airlines, Inc. (a) | 14,850 | 368,874 | ||||||
| AUTOMOBILES & COMPONENTS—2.8% | ||||||||
Ford Motor Company (a)(b) | 105,494 | 1,291,247 | ||||||
The Goodyear Tire & Rubber Company (a) | 6,294 | 67,660 | ||||||
| 1,358,907 | ||||||||
| BANKS—7.6% | ||||||||
East West Bancorp, Inc. | 19,535 | 318,030 | ||||||
M&T Bank Corporation (b) | 11,956 | 978,120 | ||||||
New York Community Bancorp, Inc. (b) | 45,847 | 745,014 | ||||||
The PNC Financial Services Group, Inc. | 31,203 | 1,619,748 | ||||||
| 3,660,912 | ||||||||
| BUILDING PRODUCTS—0.9% | ||||||||
Owens Corning (a)(b) | 16,290 | 417,513 | ||||||
| CHEMICALS—2.8% | ||||||||
Airgas, Inc. | 434 | 29,490 | ||||||
E. I. du Pont de Nemours and Company | 2,551 | 113,826 | ||||||
Eastman Chemical Company (b) | 3,070 | 227,180 | ||||||
Huntsman Corporation | 67,863 | 784,496 | ||||||
The Dow Chemical Company | 6,778 | 186,124 | ||||||
| �� | 1,341,116 | |||||||
| COMMERCIAL SERVICES & SUPPLIES—1.7% | ||||||||
Career Education Corporation (a) | 4,737 | 101,703 | ||||||
Con-way, Inc. | 2,749 | 85,192 | ||||||
ITT Educational Services, Inc. (a)(b) | 8,983 | 631,235 | ||||||
| 818,130 | ||||||||
| COMMUNICATIONS EQUIPMENT—0.4% | ||||||||
Harris Corporation | 146 | 6,466 | ||||||
JDS Uniphase Corporation (a)(b) | 15,195 | 188,266 | ||||||
| 194,732 | ||||||||
| COMPUTERS & PERIPHERALS—12.7% | ||||||||
Apple, Inc. (a)(b) | 9,343 | 2,651,076 | ||||||
International Business Machines | 21,818 | 2,926,667 | ||||||
Lexmark International, Inc. (a) | 6,028 | 268,969 | ||||||
SanDisk Corporation (a)(b) | 7,068 | 259,042 | ||||||
| 6,105,754 | ||||||||
| CONSTRUCTION & ENGINEERING—0.1% | ||||||||
Chicago Bridge & Iron Company N.V. (a) | 1,066 | 26,064 | ||||||
| CONSUMER SERVICES—0.4% | ||||||||
H&R Block, Inc. | 14,001 | 181,313 | ||||||
| CONTAINERS & PACKAGING—0.0% | ||||||||
Pactiv Corporation (a) | 609 | 20,085 | ||||||
| DISTRIBUTORS—0.8% | ||||||||
WESCO International, Inc. (a) | 10,146 | 398,636 | ||||||
| DIVERSIFIED FINANCIAL SERVICES—3.7% | ||||||||
Capital One Financial Corporation (b) | 3,864 | 152,821 | ||||||
Citigroup, Inc. (a) | 108,616 | 423,602 | ||||||
JPMorgan Chase & Co. | 4,962 | 188,903 | ||||||
Morgan Stanley | 6,682 | 164,912 | ||||||
NYSE Euronext | 6,219 | 177,677 | ||||||
The Goldman Sachs Group, Inc. (b) | 4,539 | 656,249 | ||||||
| 1,764,164 | ||||||||
| DIVERSIFIED TELECOMMUNICATION SERVICES—2.4% | ||||||||
AT&T Corporation (b) | 13,365 | 382,239 | ||||||
Qwest Communications International, Inc. | 7,337 | 46,003 | ||||||
Sprint Nextel Corporation (a)(b) | 149,466 | 692,028 | ||||||
| 1,120,270 | ||||||||
| ELECTRIC UTILITIES—3.6% | ||||||||
Constellation Energy Group, Inc., (b) | 10,811 | 348,547 | ||||||
DTE Energy Company | 2,236 | 102,699 | ||||||
Exelon Corporation | 30,109 | 1,282,041 | ||||||
| 1,733,287 | ||||||||
| ELECTRICAL EQUIPMENT—0.3% | ||||||||
Rockwell Automation, Inc. (b) | 2,237 | 138,090 | ||||||
| ELECTRONIC EQUIPMENT & INSTRUMENTS—4.1% | ||||||||
Jabil Circuit, Inc. (b) | 86,240 | 1,242,718 | ||||||
Molex Incorporated | 814 | 17,037 | ||||||
Tech Data Corporation (a)(b) | 17,426 | 702,268 | ||||||
| 1,962,023 | ||||||||
| FOOD PRODUCTS—4.7% | ||||||||
Sara Lee Corporation (b) | 24,767 | 332,621 | ||||||
The Hershey Company (b) | 13,946 | 663,690 | ||||||
Tyson Foods, Inc. (b) | 80,134 | 1,283,747 | ||||||
| 2,280,058 | ||||||||
| FOOD STAPLES & DRUG RETAILING—2.1% | ||||||||
Supervalu, Inc. (b) | 86,252 | 994,486 | ||||||
| HEALTH CARE EQUIPMENT & SERVICES—4.1% | ||||||||
Covidien plc | 2,136 | 85,846 | ||||||
McKesson Corporation | 27,852 | 1,720,697 | ||||||
Medtronic, Inc. | 2,363 | 79,349 | ||||||
WellPoint, Inc. (a) | 1,619 | 91,700 | ||||||
| 1,977,592 | ||||||||
| HEALTH CARE PROVIDERS & SERVICES—3.7% | ||||||||
Cardinal Health, Inc. (b) | 54,167 | 1,789,678 | ||||||
| HOTELS, RESTAURANTS & LEISURE—0.1% | ||||||||
Marriott International, Inc. | 1,256 | 45,002 | ||||||
| HOUSEHOLD DURABLES—0.4% | ||||||||
Newell Rubbermaid, Inc. | 9,690 | 172,579 | ||||||
Whirlpool Corporation | 265 | 21,454 | ||||||
| 194,033 | ||||||||
| HOUSEHOLD PRODUCTS—0.5% | ||||||||
Kimberly-Clark Corporation | 974 | 63,359 | ||||||
The Clorox Company (b) | 2,352 | 157,019 | ||||||
| 220,378 | ||||||||
| INSURANCE—1.9% | ||||||||
Prudential Financial, Inc. | 17,223 | 933,142 | ||||||
| IT CONSULTING & SERVICES—3.9% | ||||||||
Cognizant Technology Solutions Corporation (a) | 29,505 | 1,902,187 | ||||||
| LEASURE EQUIPMENT & PRODUCTS—0.1% | ||||||||
Eastman Kodak Company (b) | 8,039 | 33,764 | ||||||
| MACHINERY—1.8% | ||||||||
Joy Global, Inc. (b) | 12,577 | 884,415 | ||||||
| MEDIA—11.0% | ||||||||
Comcast Corporation (b) | 35,771 | 646,740 | ||||||
DISH Network Corporation (a) | 5,531 | 105,974 | ||||||
Gannett Co., Inc. | 13,617 | 166,536 | ||||||
Netflix, Inc. (a)(b) | 4,408 | 714,801 | ||||||
The New York Times Company (a)(b) | 27,383 | 211,945 | ||||||
Time Warner Cable, Inc. | 19,070 | 1,029,589 | ||||||
Time Warner, Inc. | 70,349 | 2,156,197 | ||||||
Viacom, Inc. (a)(b) | 6,648 | 240,591 | ||||||
| 5,272,373 | ||||||||
| METALS & MINING—1.4% | ||||||||
AK Steel Holding Corporation | 665 | 9,184 | ||||||
Newmont Mining Corporation | 10,273 | 645,247 | ||||||
| 654,431 | ||||||||
| OIL & GAS—10.9% | ||||||||
Apache Corporation (b) | 5,011 | 489,875 | ||||||
Chevron Corporation | 5,780 | 468,469 | ||||||
ConocoPhillips (b) | 44,237 | 2,540,531 | ||||||
Devon Energy Corporation | 15,531 | 1,005,477 | ||||||
Frontline Ltd. | 694 | 19,730 | ||||||
Marathon Oil Corporation | 11,665 | 386,112 | ||||||
Valero Energy Corporation | 18,755 | 328,400 | ||||||
| 5,238,594 | ||||||||
| PAPER & FOREST PRODUCTS—0.5% | ||||||||
International Paper Company | 12,031 | 261,674 | ||||||
| PHARMACEUTICALS & BIOTECHNOLOGY—12.0% | ||||||||
Amgen, Inc. (a) | 37,270 | 2,053,950 | ||||||
Biogen Idec, Inc. (a)(b) | 24,736 | 1,388,184 | ||||||
Celgene Corporation (a)(b) | 3,975 | 229,000 | ||||||
Eli Lilly and Company (b) | 34,400 | 1,256,632 | ||||||
Gilead Sciences, Inc. (a)(b) | 14,848 | 528,737 | ||||||
Johnson & Johnson | 5,117 | 317,049 | ||||||
| 5,773,552 | ||||||||
| REAL ESTATE—3.4% | ||||||||
Chimera Investment Corporation (b) | 367,626 | 1,452,123 | ||||||
Forest City Enterprises, Inc. (a) | 14,753 | 189,281 | ||||||
| 1,641,404 | ||||||||
| RETAILING—4.8% | ||||||||
Amazon.com, Inc. (a) | 5,407 | 849,223 | ||||||
Best Buy Co., Inc. (b) | 23,659 | 965,997 | ||||||
PetSmart, Inc. (b) | 8,496 | 297,360 | ||||||
priceline.com Incorporated (a) | 576 | 200,644 | ||||||
| 2,313,224 | ||||||||
| SEMICONDUCTOR EQUIPMENT—4.5% | ||||||||
Advanced Micro Devices, Inc. (a)(b) | 151,403 | 1,076,475 | ||||||
Micron Technology, Inc. (a)(b) | 143,827 | 1,036,993 | ||||||
Teradyne, Inc. (a) | 3,074 | 34,244 | ||||||
| 2,147,712 | ||||||||
| SOFTWARE & SERVICES—5.9% | ||||||||
McAfee, Inc. (a) | 715 | 33,791 | ||||||
Microsoft Corporation | 92,768 | 2,271,888 | ||||||
VMware, Inc. (a)(b) | 6,278 | 533,254 | ||||||
| 2,838,933 | ||||||||
| TOBACCO—2.6% | ||||||||
Philip Morris International, Inc. | 22,788 | 1,276,584 | ||||||
| UTILITIES—0.1% | ||||||||
Allegheny Energy, Inc. | 890 | 21,823 | ||||||
| WIRELESS TELECOMMUNICATIONS—2.3% | ||||||||
MetroPCS Communications, Inc. (a)(b) | 42,310 | 442,562 | ||||||
NII Holdings, Inc. (a) | 16,458 | 676,424 | ||||||
| 1,118,986 | ||||||||
| TOTAL LONG POSITIONS—129.0% | ||||||||
(Cost $61,813,835) | 62,029,317 | |||||||
| Short Positions—(30.1%) | ||||||||
| AUTOMOBILES & COMPONENTS—(0.4%) | ||||||||
LKQ Corporation (a) | (9,503 | ) | (197,663 | ) | ||||
| BANKS—(0.4%) | ||||||||
Wilmington Trust Corporation | (21,062 | ) | (189,137 | ) | ||||
| BIOTECHNOLOGY—(5.2%) | ||||||||
Dendreon Corporation (a) | (12,640 | ) | (520,515 | ) | ||||
Human Genome Sciences, Inc. (a) | (33,551 | ) | (999,484 | ) | ||||
Vertex Pharmaceuticals Incorporated (a) | (29,003 | ) | (1,002,634 | ) | ||||
| (2,522,633 | ) | |||||||
| CHEMICALS—(0.9%) | ||||||||
Intrepid Potash, Inc. (a) | (16,202 | ) | (422,386 | ) | ||||
| COMMERCIAL SERVICES AND SUPPLIES—(2.2%) | ||
Genpact Limited | (4,818) | (85,423) |
Monster Worldwide, Inc. (a) | (74,550) | (966,168) |
(1,051,591) | ||
| COMMUNICATIONS EQUIPMENT—(2.4%) | ||
Ciena Corporation (a) | (73,774) | (1,148,661) |
| CONSUMER SERVIES & SUPPLIES—(0.4%) | ||
Apollo Group, Inc. (a) | (4,129) | (212,024) |
| DIVERSIFIED FINANCIAL SERVICES—(0.5%) | ||
Interactive Brokers Group, Inc. (a) | (1,281) | (22,046) |
Marshall & Ilsley Corporation | (20,698) | (145,714) |
Morningstar, Inc. (a) | (1,166) | (51,957) |
| (219,717) | ||
| DIVERSIFIED TELECOMMUNICATION SERVICES—(0.4%) | ||
Clearwire Corporation (a) | (26,804) | (216,844) |
| ENERGY EQUIPMENT & SERVICES—(0.7%) | ||
Cobalt International Energy, Inc. (a) | (37,074) | (354,057) |
| FOOD & DRUG RETAILING—(0.0%) | ||
Central European Distribution Corporation (a) | (189) | (4,219) |
| HEALTH CARE EQUIPMENT & SERVICES—(0.1%) | ||
Boston Scientific Corporation (a) | (3,661) | (22,442) |
Hologic, Inc. (a) | (2,646) | (42,362) |
| (64,804) | ||
| HEALTH CARE PROVIDERS & SERVICES—(1.5%) | ||
Alere, Inc. (a) | (23,183) | (717,050) |
| LEISURE EQUIPMENTS & PRODUCTS—(0.2%) | ||
IAC/InterActiveCorp (a) | (3,595) | (94,441) |
| MEDIA—(6.7%) | ||
Brocade Communications Systems, Inc. (a) | (152,445) | (890,279) |
Clear Channel Outdoor Holdings, Inc. (a) | (25,473) | (291,156) |
DreamWorks Animation SKG, Inc. (a) | (2,922) | (93,241) |
Lamar Advertising Company (a) | (12,602) | (400,996) |
Liberty Media Capital (a) | (29,450) | (1,533,167) |
| (3,208,839) | ||
| OIL & GAS—(0.6%) | ||
Comstock Resources, Inc. (a) | (13,170) | (296,193) |
| PHARMACEUTICALS & BIOTECHNOLOGY—(0.7%) | ||
King Pharmaceuticals, Inc. (a) | (32,066) | (319,377) |
| REAL ESTATE—(0.4%) | ||
Corrections Corporation of America (a) | (1,647) | (40,648) |
Douglas Emmett, Inc. | (9,325) | (163,281) |
| (203,929) | ||
| SEMICONDUCTOR EQUIPMENT—(3.3%) | ||
Cypress Semiconductor Corporation (a) | (13,431) | (168,962) |
MEMC Electronic Materials, Inc. (a) | (79,658) | (949,523) |
Rambus, Inc. (a) | (22,418) | (467,191) |
| (1,585,676) |
| SOFTWARE & SERVICES—(2.3%) | ||||||||
Novell, Inc. (a) | (120,806 | ) | (721,212 | ) | ||||
Nuance Communications, Inc. (a) | (23,918 | ) | (374,077 | ) | ||||
| (1,095,289 | ) | |||||||
| UTILITIES—(0.8%) | ||||||||
RRI Energy, Inc. (a) | (102,439 | ) | (363,659 | ) | ||||
| TOTAL SHORT POSITIONS—(30.1%) | ||||||||
(Proceeds $13,667,463) | (14,488,189 | ) | ||||||
TOTAL INVESTMENTS (EXCLUDING INVESTMENTS PURCHASED WITH CASH COLLATERAL FROM SECURITIES LOANED)—98.9% | ||||||||
(Cost $48,146,372) | 47,541,128 | |||||||
Short Term Investments—0.4%
| Par Value | Value | |||||||
| T Bills—0.4% | ||||||||
U.S. Treasury Bill, due 2/10/2011 (c) (Cost $199,835) | $ | 200,000 | $ | 199,896 | ||||
INVESTMENTS PURCHASED WITH CASH COLLATERAL FROM SECURITIES LOANED—15.3% | ||||||||
| Registered Money Market—15.3% | ||||||||
State Street Navigator Securities Lending Prime Portfolio (Cost $7,352,939) | $ | 7,352,939 | 7,352,939 | |||||
| TOTAL INVESTMENTS—114.6% | ||||||||
(Cost $55,699,146) | 55,093,963 | |||||||
| OTHER ASSETS & LIABILITIES (NET)—(14.6%) | (7,018,541 | ) | ||||||
| NET ASSETS—100% | $ | 48,075,422 | ||||||
| (a) | Non-Income producing security | ||||
| (b) | All or a portion of this security was out on loan. | ||||
| (c) | At September 30, 2010, Certain United States Treasury Bills with a market value of $199,896 were pledged to cover margin requirements for futures contracts. | ||||
| Futures Contracts at September 30, 2010: Contracts—$50 times premium/delivery month/commitment | |||||
| S&P 500 E Mini Index | Unrealized Appreciation | ||||
| 9/Dec2010/Long | $ | 9,494 | |||
| Short security positions may be held with cash collateral for securities loaned. | |||||
| The percentage of each investment category is calculated as a percentage of net assets. | |||||
The accompanying notes are an integral part of these financial statements.
QUANT EMERGING MARKETS FUND
SCHEDULE OF INVESTMENTS
September 30, 2010 (unaudited)
Common Stock—91.0%
| Shares | Value | |||||||
| BRAZIL—8.7% | ||||||||
Banco Bradesco SA (c) | 5,229 | 106,567 | ||||||
Banco do Brasil SA | 143,610 | 2,718,707 | ||||||
BR Malls Participacoes SA (a) | 37,089 | 309,002 | ||||||
Brasil Telecom Participacoes SA | 41,026 | 362,591 | ||||||
Cielo SA | 85,749 | 744,216 | ||||||
Companhia de Bebidas das Americas (c) | 15,506 | 1,919,333 | ||||||
Cosan SA Industria e Comercio | 71,002 | 1,051,727 | ||||||
Energias do Brasil SA (a) | 43,527 | 938,657 | ||||||
Equatorial Energia SA (a) | 25,646 | 154,885 | ||||||
Light SA | 8,035 | 102,260 | ||||||
M. Dias Branco SA (a) | 4,099 | 100,205 | ||||||
Petroleo Brasileiro SA | 183,687 | 3,290,175 | ||||||
Petroleo Brasileiro SA (c) | 134,987 | 4,430,273 | ||||||
Redentor Energia SA | 25,646 | 116,655 | ||||||
Souza Cruz SA (a) | 42,613 | 2,123,118 | ||||||
Sul America SA (a) | 23,619 | 264,413 | ||||||
Tele Norte Leste Participacoes SA (c) | 101,544 | 1,429,740 | ||||||
Vale SA | 57,936 | 1,785,325 | ||||||
| 21,947,849 | ||||||||
| CHILE—1.5% | ||||||||
Banco Santander Chile (c) | 21,605 | 2,085,963 | ||||||
Enersis SA (c) | 44,064 | 1,035,945 | ||||||
Lan Airlines SA (b)(c) | 25,723 | 757,285 | ||||||
| 3,879,193 | ||||||||
| CHINA—19.9% | ||||||||
Bank of China Ltd. | 7,250,902 | 3,821,426 | ||||||
Bosideng International Holdings Ltd. | 1,386,000 | 603,657 | ||||||
Central China Real Estate Ltd. (a) | 1,269,770 | 310,877 | ||||||
China Coal Energy Co., Ltd. | 1,051,000 | 1,736,205 | ||||||
China Construction Bank Corporation | 4,942,709 | 4,330,961 | ||||||
China Mobile Limited | 356,734 | 3,654,449 | ||||||
China Petroleum & Chemical Corporation | 2,522,000 | 2,235,856 | ||||||
China Pharmaceutical Group Limited | 1,958,752 | 1,009,601 | ||||||
China Shenhua Energy Co., Ltd. | 462,000 | 1,910,985 | ||||||
China Shineway Pharmaceutical Group Limited | 50,000 | 176,535 | ||||||
China State Construction Engineering Corporation | 1,336,000 | 805,680 | ||||||
China Unicom (Hong Kong) Ltd. (a) | 1,242,000 | 1,814,868 | ||||||
China Yuchai International Ltd. | 22,321 | 427,001 | ||||||
CNOOC Limited | 2,338,058 | 4,537,227 | ||||||
COSCO International Holdings Ltd. | 856,000 | 511,802 | ||||||
Daphne International Holdings Ltd. | 318,000 | 375,757 | ||||||
Dongfeng Motor Group Company Limited | 1,301,069 | 2,665,678 | ||||||
Fosun International | 515,000 | 409,452 | ||||||
Fufeng Group Limited (a) | 288,000 | 205,595 | ||||||
Great Wall Motor Co., Ltd. (b) | 530,000 | 1,441,015 | ||||||
Greentown China Holdings Ltd. | 393,000 | 427,411 | ||||||
GZI Real Estate Investment Trust | 233,000 | 117,093 | ||||||
Haitian International Holdings Ltd. | 118,000 | 115,560 | ||||||
Industrial & Commercial Bank of China Ltd. | 157,215 | 117,093 | ||||||
Kingboard Chemical Holdings, Ltd. | 29,500 | 149,771 | ||||||
Kowloon Development Co., Ltd. | 130,000 | 145,235 | ||||||
Lianhua Supermarket Holdings Co., Ltd. | 64,000 | 261,014 | ||||||
Real Gold Mining Limited (b) | 168,500 | 300,067 | ||||||
Renhe Commercial Holdings (a) | 6,230,230 | 1,164,079 | ||||||
Shenzhen Investment Ltd. | 828,000 | 299,811 | ||||||
Silver Grant International Industries Ltd. | 366,000 | 115,547 | ||||||
Sino Biopharmaceutical Limited (b) | 918,036 | 370,266 | ||||||
Sinolink Worldwide Holdings Limited | 3,205,055 | 503,855 | ||||||
Soho China Limited | 1,972,000 | 1,405,214 | ||||||
Tencent Holdings Limited | 118,169 | 2,580,974 | ||||||
Texwinca Holdings Ltd. | 196,000 | 223,517 | ||||||
TPV Technology Limited | 930,000 | 613,569 | ||||||
Tsingtao Brewery Co., Ltd. | 16,000 | 91,644 | ||||||
Weichai Power Company Ltd. (a) | 160,000 | 1,700,921 | ||||||
Yanzhou Coal Mining Company Limited | 956,448 | 2,346,598 | ||||||
Yue Yuen Industrial Holdings Ltd. | 188,000 | 695,264 | ||||||
Zhaojin Mining Industry Co. Ltd., H Shares | 69,500 | 214,039 | ||||||
Zhejiang Expressway Co., Ltd. (a) | 1,180,000 | 1,116,062 | ||||||
Zijin Mining Group Co., Ltd. | 1,080,285 | 918,740 | ||||||
| 48,977,971 | ||||||||
| CZECH REPUBLIC—0.7% | ||||||||
Komercni Banka AS | 7,920 | 1,724,621 | ||||||
| HUNGARY—0.5% | ||||||||
Egis Gyogyszergyar Nyrt. | 2,555 | 279,968 | ||||||
Magyar Telekom Telecommunications PLC | 162,058 | 529,546 | ||||||
Richter Gedeon Nyrt. | 1,436 | 331,638 | ||||||
| 1,141,152 | ||||||||
| INDIA—8.8% | ||||||||
ACC Limited | 39,575 | 876,313 | ||||||
Allahabad Bank | 226,017 | 1,171,707 | ||||||
Andhra Bank | 346,779 | 1,232,074 | ||||||
Apollo Tyres Ltd. | 244,797 | 441,272 | ||||||
Balrampur Chini Mills | 569,740 | 1,179,166 | ||||||
Bank of Baroda | 105,012 | 2,046,139 | ||||||
Canara Bank | 139,315 | 1,804,259 | ||||||
Chambal Fertilisers & Chemicals Limited | 558,541 | 858,290 | ||||||
Great Eastern Shipping Company Limited | 75,354 | 528,073 | ||||||
Hindalco Industries Ltd. | 359,602 | 1,567,732 | ||||||
Indian Bank | 206,230 | 1,271,755 | ||||||
Indian Overseas Bank | 120,612 | 352,965 | ||||||
Jet Airways (India) Ltd. | 39,309 | 714,622 | ||||||
Lupin Limited | 55,900 | 484,483 | ||||||
Oil and Natural Gas Corp. Limited | 69,802 | 2,172,895 | ||||||
Oriental Bank of Commerce | 154,841 | 1,588,038 | ||||||
Patni Computer Systems | 89,695 | 828,384 | ||||||
Rolta India Limited | 122,669 | 442,247 | ||||||
Tata Chemicals Ltd. | 144,873 | 1,299,295 | ||||||
Tata Global Beverages Ltd. | 54,340 | 146,386 | ||||||
Tata Motors Ltd. | 2,953 | 71,950 | ||||||
Tata Steel Limited | 31,422 | 455,928 | ||||||
Union Bank of India | 54,022 | 466,524 | ||||||
Welspun Corp Ltd. | 37,339 | 223,527 | ||||||
| 22,224,024 | ||||||||
| INDONESIA—3.2% | ||||||||
PT Astra International Tbk (a) | 427,504 | 2,715,908 | ||||||
PT Bank Mandiri (a) | 222,356 | 179,380 | ||||||
PT Bank Rakyat Indonesia (a) | 1,392,457 | 1,560,176 | ||||||
PT Charoen Pokphand Indonesia Tbk | 307,000 | 299,261 | ||||||
PT Indika Energy Tbk | 1,000,000 | 372,549 | ||||||
PT Indo Tambangraya Megah Tbk | 127,000 | 591,955 | ||||||
PT Kalbe Farma Tbk | 880,000 | 251,429 | ||||||
PT Semen Gresik | 1,073,143 | 1,190,377 | ||||||
PT United Tractors Tbk | 409,000 | 937,148 | ||||||
| 8,098,183 | ||||||||
| MALAYSIA—3.8% | ||||||||
Affin Holdings Berhad (a) | 106,500 | 107,638 | ||||||
Alliance Financial Group Berhad | 137,800 | 137,934 | ||||||
Gamuda Berhad | 436,700 | 548,881 | ||||||
Genting Malaysia Berhad | 213,400 | 234,346 | ||||||
Hong Leong Bank Berhad | 282,116 | 832,548 | ||||||
Hong Leong Financial Group Berhad (a) | 155,700 | 456,962 | ||||||
IOI Corporation Berhad | 589,300 | 1,044,208 | ||||||
KLCC Property Holdings Berhad | 137,400 | 147,326 | ||||||
Kuala Lumpur Kepong Berhad | 70,200 | 386,589 | ||||||
Lafarge Malayan Cement Berhad | 250,371 | 639,918 | ||||||
RHB Capital Berhad | 528,170 | 1,237,016 | ||||||
Malayan Banking Berhad | 316,900 | 903,375 | ||||||
Multi-Purpose Holdings Berhad | 106,100 | 76,301 | ||||||
Parkson Holdings Berhad | 39,800 | 75,036 | ||||||
PLUS Expressways Berhad | 382,100 | 516,151 | ||||||
Tan Chong Motor Holdings Berhad | 124,200 | 239,790 | ||||||
Telekom Malaysia Berhad | 980,754 | 1,086,550 | ||||||
Tenaga Nasional Berhad | 8,060 | 23,029 | ||||||
Top Glove Berhad | 542,400 | 901,364 | ||||||
| 9,594,962 | ||||||||
| MEXICO—3.1% | ||||||||
Alfa SA | 178,194 | 1,375,759 | ||||||
America Movil SAB de C.V., Series L | 468,700 | 1,250,005 | ||||||
Coca-Cola FEMSA SAB de C.V. (c) | 14,811 | 1,158,516 | ||||||
Embotelladoras Arca, S. A. B. de C.V. | 71,070 | 288,138 | ||||||
Fomento Economico Mexicano SAB (c) | 42,806 | 2,171,548 | ||||||
Grupo Aeroportuario del Sureste, S. A. B. de C.V., Series B | 20,302 | 95,975 | ||||||
Grupo Bimbo SAB de C.V. | 79,401 | 578,440 | ||||||
Grupo Carso SAB de C.V., Series A | 26,964 | 135,796 | ||||||
Kimberly-Clark de Mexico SA de C.V., Class A | 44,323 | 283,762 | ||||||
Organizacion Soriana S.A.B. de C.V., Class B | 133,502 | 368,942 | ||||||
Telefonos de Mexico SA (c) | 7,515 | 112,199 | ||||||
| 7,819,080 | ||||||||
| PHILIPPINES—0.4% | ||||||||
SM Investments Corporation (a) | 86,426 | 1,122,543 | ||||||
| POLAND—0.7% | ||||||||
KGHM Polska Miedz SA | 47,071 | 1,890,188 | ||||||
| RUSSIA—5.4% | ||||||||
Evraz Group SA (a)(b)(d) | 46,413 | 1,385,428 | ||||||
Gazprom (a)(c) | 143,893 | 3,020,314 | ||||||
LUKoil (c) | 62,670 | 3,559,656 | ||||||
Mobile TeleSystems (a)(c) | 38,555 | 818,523 | ||||||
Norilsk Nickel Mining and Metallurgical Co. (c) | 117,348 | 2,000,783 | ||||||
Severstal (a) (d) | 141,012 | 2,086,978 | ||||||
Tatneft (c) | 21,397 | 669,512 | ||||||
| 13,541,194 | ||||||||
| SINGAPORE—0.8% | ||||||||
Yangzijiang Shipbuilding Holdings Limited | 1,522,940 | 2,036,140 | ||||||
| SOUTH AFRICA—5.3% | ||||||||
Absa Group Limited (a) | 121,236 | 2,320,803 | ||||||
Adcock Ingram Holdings Ltd. | 28,479 | 258,345 | ||||||
African Rainbow Minerals Ltd. | 37,668 | 904,032 | ||||||
Barloworld Limited (a) | 121,019 | 809,098 | ||||||
Emira Property Fund (a) | 31,776 | 59,240 | ||||||
FirstRand Limited | 85,575 | 262,349 | ||||||
Fountainhead Property Trust Management Limited | 201,541 | 199,238 | ||||||
Gold Fields Ltd. (c) | 8,746 | 133,551 | ||||||
Grindrod Limited | 32,962 | 79,109 | ||||||
Group Five Limited | 18,891 | 98,503 | ||||||
Imperial Holdings Limited | 97,229 | 1,575,804 | ||||||
Investec Limited (a) | 173,717 | 1,475,850 | ||||||
Kumba Iron Ore Limited (a) | 2,119 | 109,864 | ||||||
Metropolitan Holdings Limited | 529,847 | 1,241,356 | ||||||
Netcare Limited | 89,434 | 176,824 | ||||||
RMB Holdings Ltd. | 286,235 | 1,551,803 | ||||||
Sanlam Limited (a) | 498,596 | 1,873,296 | ||||||
Santam Limited | 7,287 | 117,747 | ||||||
Sasol Ltd. | 896 | 40,049 | ||||||
| 13,286,862 | ||||||||
| SOUTH KOREA—12.8% | ||||||||
Busan Bank | 124,406 | 1,532,912 | ||||||
Daegu Bank (a) | 80,030 | 1,052,795 | ||||||
Daishin Securities Company (a) | 56,179 | 739,035 | ||||||
Daum Communications Corp. | 5,321 | 367,722 | ||||||
Dongbu Insurance Co., Ltd. | 5,885 | 181,931 | ||||||
Dongkuk Steel Mill Company, Ltd. | 51,880 | 1,242,117 | ||||||
GS Engineering & Construction Corp. | 9,687 | 745,056 | ||||||
Halla Climate Control Corp. | 23,300 | 436,268 | ||||||
Hana Financial Group, Inc. | 18,360 | 543,433 | ||||||
Hanwha Chemical Corporation (a) | 108,441 | 2,601,062 | ||||||
Hyundai Department Store Co., Ltd. (a) | 14,092 | 1,705,500 | ||||||
Hyundai Marine & Fire Insurance Co., Ltd. | 18,940 | 368,751 | ||||||
Hyundai Motor Company | 5,121 | 687,141 | ||||||
Kangwon Land, Inc. (a) | 87,858 | 1,910,878 | ||||||
Korea Exchange Bank | 111,500 | 1,349,441 | ||||||
Korean Reinsurance Company, Ltd. | 9,432 | 93,886 | ||||||
KP Chemical Corp. (a) | 105,471 | 1,267,224 | ||||||
KT Corporation | 1,970 | 78,955 | ||||||
LG Corp. | 35,272 | 2,552,019 | ||||||
LG Display Co., Ltd. (a) | 59,314 | 2,049,526 | ||||||
LG Electronics, Inc. | 17,390 | 1,465,625 | ||||||
NEOWIZ Games Corporation | 22,068 | 891,236 | ||||||
Orion Corporation | 1,533 | 556,599 | ||||||
Pohang Iron and Steel Company | 878 | 397,323 | ||||||
Samsung C&T Corporation | 4,531 | 247,164 | ||||||
Samsung Electronics Co., Ltd. | 9,470 | 6,453,137 | ||||||
SeAH Besteel Corporation | 6,270 | 156,166 | ||||||
SK C&C Co., Ltd. | 1,763 | 156,934 | ||||||
SK Communications Co., Ltd. | 24,021 | 396,049 | ||||||
| 32,225,885 | ||||||||
| TAIWAN—9.9% | ||||||||
Acer, Inc. | 559,559 | 1,422,114 | ||||||
Advantech Co., Ltd. | 75,000 | 197,334 | ||||||
AU Optronics Corp. | 1,487,043 | 1,542,186 | ||||||
China Bills Finance Corporation (a) | 407,576 | 112,195 | ||||||
Chunghwa Telecom Co., Ltd. | 885,000 | 1,982,939 | ||||||
Coretronic Corp. | 282,000 | 433,270 | ||||||
Delta Electronics, Inc. | 416,000 | 1,737,689 | ||||||
Eternal Chemical Co., Ltd. | 707,269 | 740,288 | ||||||
Farglory Land Development Co., Ltd. | 172,000 | 418,418 | ||||||
Formosa Chemicals & Fiber Corporation | 356,000 | 860,330 | ||||||
Foxconn Technology Co., Ltd. | 34,200 | 108,375 | ||||||
Huaku Development Co., Ltd. | 77,000 | 213,194 | ||||||
Lite-On Technology Corp. (a) | 1,127,682 | 1,422,168 | ||||||
MediaTek, Inc. (a) | 176 | 2,473 | ||||||
Nan Ya Plastics Corporation | 70,000 | 153,258 | ||||||
Novatek Microelectronics Corp., Ltd. | 112,000 | 317,270 | ||||||
Pou Chen Corporation | 1,531,000 | 1,340,296 | ||||||
Powertech Technology, Inc. | 263,000 | 846,038 | ||||||
President Chain Store Corp. | 197,000 | 848,119 | ||||||
Quanta Computer, Inc. (a) | 57,299 | 92,987 | ||||||
SoftWorld International Corp. | 99,604 | 438,377 | ||||||
Taiwan Semiconductor Manufacturing Company Ltd. | 2,477,386 | 4,916,471 | ||||||
TECO Electric & Machinery Co., Ltd. | 801,000 | 464,065 | ||||||
Tong Yang Industry Co., Ltd. | 209,000 | 359,912 | ||||||
Tripod Technology Corporation | 76,000 | 290,703 | ||||||
TSRC Corp. | 232,336 | 358,453 | ||||||
Tung Ho Steel Enterprise Corporation | 204,889 | 191,500 | ||||||
U-Ming Marine Transport Corporation (a) | 678,231 | 1,332,951 | ||||||
United Microelectronics Corporation (a) | 2,622,022 | 1,162,396 | ||||||
Wintek Corporation | 350,000 | 548,389 | ||||||
WPG Holdings Co., Ltd. (a) | 828,929 | 1,645,043 | ||||||
| 26,499,201 | ||||||||
| THAILAND—2.1% | ||||||||
Banpu PCL | 8,000 | 189,786 | ||||||
Charoen Pokphand Foods PCL (e) | 435,700 | 362,485 | ||||||
CP ALL PCL | 439,735 | 612,152 | ||||||
Krung Thai Bank PCL | 4,023,091 | 2,240,206 | ||||||
Thai Airways International PCL (a) | 1,498,986 | 1,938,557 | ||||||
| 5,343,186 | ||||||||
| TURKEY—3.4% | ||||||||
Akbank TAS (a) | 66,897 | 407,965 | ||||||
Albaraka Turk Katilim Bankasi AS (a) | 80,540 | 149,847 | ||||||
Arcelik AS | 176,820 | 968,660 | ||||||
Eregli Demir ve Celik Fabrikalari TAS | 162,613 | 577,079 | ||||||
Ford Otomotiv Sanayi AS | 27,935 | 238,695 | ||||||
Haci Omer Sabanci Holding AS (a) | 36,619 | 189,252 | ||||||
Selcuk Ecza Deposu Ticaret Ve Sanayi AS | 93,444 | 163,553 | ||||||
Tofas Turk Otomobil Fabrikasi AS | 77,507 | 400,567 | ||||||
Tupras—Turkiye Petrol Rafinerileri AS | 6,765 | 181,805 | ||||||
Turkiye Halk Bankasi AS (a) | 224,268 | 2,070,832 | ||||||
Turkiye Is Bankasi AS | 590,178 | 2,501,099 | ||||||
Turkiye Sise ve Cam Fabrikalari AS | 442,862 | 787,337 | ||||||
| 8,636,691 | ||||||||
| TOTAL COMMON STOCK | ||||||||
(Cost $184,833,474) | 229,988,925 | |||||||
| Preferred Stock—6.7% | ||||||||
| BRAZIL—6.7% | ||||||||
Banco ABC Brasil | 15,311 | 153,363 | ||||||
Banrisul SA | 112,602 | 1,130,532 | ||||||
Bradespar SA | 61,572 | 1,469,282 | ||||||
Brasil Telecom Participacoes SA | 79,817 | 524,369 | ||||||
Cia Brasileira de Distribuicao Grupo Pao de Acucar | 39,893 | 1,371,528 | ||||||
Companhia Paranaense de Energia-COPEL | 14,404 | 316,138 | ||||||
Eletropaulo Metropolitana SA | 65,487 | 1,165,277 | ||||||
Industrias Klabin de Papel e Celulose | 360,663 | 998,772 | ||||||
Itau Unibanco Holding SA | 34,751 | 828,643 | ||||||
Marcopolo SA | 54,626 | 180,241 | ||||||
Metalurgica Gerdau SA (a) | 82,433 | 1,326,932 | ||||||
Suzano Papel e Celulose SA | 63,353 | 599,114 | ||||||
Telecomunicacoes de Sao Paulo SA | 37,880 | 926,243 | ||||||
Telemar Norte Leste SA | 9,860 | 260,849 | ||||||
Ultrapar Participacoes SA | 26,001 | 1,559,570 | ||||||
Vale SA (a) | 154,325 | 4,210,021 | ||||||
| TOTAL PREFERRED STOCK | ||||||||
(Cost $14,707,945) | 17,020,874 | |||||||
| Exchange Traded Funds—2.0% | ||||||||
| UNITED STATES—2.0% | ||||||||
Vanguard Emerging Markets ETF (Cost $5,012,283) | 111,657 | 5,069,228 | ||||||
| Short Term Investments—6.9% | ||||||||
| Par Value | Value | |||||||
State Street Bank & Trust Co., Repurchase Agreement . 01%, 10/01/10, (Dated 09/30/10), Collateralized by $16,545,000 par U.S. Treasury Note—2.5% due 04/30/2015, Market Value $17,714,732, Repurchase Proceeds $17,366,005 (Cost $17,366,000) | $ | 17,366,000 | 17,366,000 | |||||
TOTAL INVESTMENTS (EXCLUDING INVESTMENTS PURCHASED WITH CASH COLLATERAL FROM SECURITIES LOANED) (Cost $221,919,702) | 269,445,027 | |||||||
INVESTMENTS PURCHASED WITH CASH COLLATERAL FROM SECURITIES LOANED—1.7% | ||||||||
| Money Market—1.7% | ||||||||
JP Morgan Prime Money Market Fund—Inst. (Cost $4,259,949) | 4,259,949 | 4,259,949 | ||||||
| TOTAL INVESTMENTS—108.3% | ||||||||
(Cost $226,179,651) | 273,704,976 | |||||||
| OTHER ASSETS & LIABILITIES (Net)—(8.3%) | (20,986,076 | ) | ||||||
| NET ASSETS—100% | $ | 252,718,900 | ||||||
| (a) | Non-income producing security. | |
| (b) | All or a portion of this security was out on loan. | |
| (c) | ADR—American Depositary Receipts | |
| (d) | GDR—Global Depositary Receipts | |
| (e) | NVDR—Non Voting Depository Receipts | |
The percentage of each investment category is calculated as a percentage of net assets.
SECTOR ALLOCATIONS (as a percentage of Total Net Assets) | |
| Financials | 24.1% |
| Materials | 14.5% |
| Energy | 13.0% |
| Information Technology | 13.0% |
| Industrials | 8.7% |
| Consumer Discretionary | 8.5% |
| Consumer Staples | 6.8% |
| Telecommunication Services | 5.9% |
| Health Care | 1.7% |
| Utilities | 1.5% |
| Exchange Traded Funds | 2.0% |
| Cash and Other Assets (Net) | 0.3% |
| 100.0% | |
The accompanying notes are an integral part of these financial statements.
QUANT FOREIGN VALUE FUND
SCHEDULE OF INVESTMENTS
September 30, 2010 (unaudited)
Common Stock—94.7%
| Shares | Value | |||||||
| AUSTRALIA—1.9% | ||||||||
BHP Billiton Ltd. | 208,300 | 7,812,365 | ||||||
| AUSTRIA—2.0% | ||||||||
Andritz AG | 114,860 | 8,046,358 | ||||||
| BELGIUM—3.1% | ||||||||
KBC Groep N.V. (a) | 167,985 | 7,517,464 | ||||||
Solvay S.A. | 45,180 | 4,808,057 | ||||||
| 12,325,521 | ||||||||
| CANADA—2.1% | ||||||||
Methanex Corporation | 341,607 | 8,367,410 | ||||||
CYPRUS—0.7% | ||||||||
Prosafe SE | 422,862 | 2,597,594 | ||||||
| FINLAND—6.3% | ||||||||
Kone OYJ-B | 210,900 | 10,870,631 | ||||||
Konecranes OYJ | 148,280 | 5,531,557 | ||||||
YIT OYJ | 384,617 | 9,096,347 | ||||||
| 25,498,535 | ||||||||
| FRANCE—6.7% | ||||||||
Christian Dior S.A. | 67,973 | 8,863,463 | ||||||
Imerys S.A. | 69,252 | 4,138,389 | ||||||
Technip S.A. | 131,550 | 10,553,785 | ||||||
Transgene S.A. | 142,827 | 3,195,326 | ||||||
| 26,750,963 | ||||||||
| GERMANY—13.1% | ||||||||
BASF SE | 130,100 | 8,184,176 | ||||||
Demag Cranes AG | 128,000 | 4,897,741 | ||||||
Hannover Rueckvers | 156,800 | 7,194,989 | ||||||
Muenchener Rueckvers AG | 41,100 | 5,679,034 | ||||||
Symrise AG | 342,950 | 9,507,810 | ||||||
Tognum AG | 388,200 | 8,576,582 | ||||||
Wincor Nixdorf AG | 131,700 | 8,566,033 | ||||||
| 52,606,365 | ||||||||
| INDIA—3.7% | ||||||||
Infosys Technologies Ltd. (b) | 48,800 | 3,284,728 | ||||||
State Bank of India (c) | 81,050 | 11,614,465 | ||||||
| 14,899,193 | ||||||||
| IRELAND—5.8% | ||||||||
CRH plc | 334,800 | 5,477,940 | ||||||
Greencore Group plc | 4,794,128 | 7,693,082 | ||||||
Smurfit Kappa Group plc (a) | 998,510 | 10,008,267 | ||||||
| 23,179,289 | ||||||||
| ITALY—2.3% | ||||||||
Trevi Finanziaria SpA | 648,666 | 9,165,912 | ||||||
| JAPAN—11.5% | ||||||||
Asahi Breweries Ltd. | 363,200 | 7,260,522 | ||||||
Iino Kaiun Kaisha, Ltd. | 1,076,000 | 5,744,506 | ||||||
Kansai Electric Power Company Inc. | 273,000 | 6,624,024 | ||||||
KDDI Corporation | 1,204 | 5,757,697 | ||||||
Meiji Holdings Co., Ltd. | 151,800 | 7,141,178 | ||||||
Nippon Yusen Kabushiki Kaisha | 1,715,000 | 7,020,948 | ||||||
Showa Denko K.K. | 3,379,000 | 6,471,630 | ||||||
| 46,020,505 | ||||||||
| NORWAY—3.1% | ||||||||
Camillo Eitzen & Co. ASA (a) | 588,679 | 953,967 | ||||||
DnB NOR ASA | 856,692 | 11,630,815 | ||||||
| 12,584,782 | ||||||||
| SOUTH AFRICA—2.8% | ||||||||
Metorex Ltd. | 4,915,693 | 2,844,080 | ||||||
Sasol Ltd. | 190,535 | 8,516,370 | ||||||
| 11,360,450 | ||||||||
| SOUTH KOREA—4.7% | ||||||||
Samsung Electronics Company Ltd. | 16,285 | 11,097,079 | ||||||
SK Telecom Company Ltd. | 51,793 | 7,789,958 | ||||||
| 18,887,037 | ||||||||
| SWEDEN—10.2% | ||||||||
Autoliv Inc. | 139,634 | 9,122,289 | ||||||
Duni AB | 1,179,500 | 10,761,941 | ||||||
Investor AB-B Shares | 502,056 | 10,155,734 | ||||||
Svenska Handelsbanken AB-A Shares | 328,500 | 10,722,271 | ||||||
| 40,762,235 | ||||||||
| SWITZERLAND—2.0% | ||||||||
Novartis AG | 138,400 | 7,951,104 | ||||||
| THAILAND—2.9% | ||||||||
Thai Oil PCL | 6,724,400 | 11,687,384 | ||||||
| UNITED KINGDOM—9.8% | ||||||||
Barratt Developments plc (a) | 5,339,856 | 8,294,076 | ||||||
BBA Aviation plc | 571,376 | 1,693,184 | ||||||
Bellway plc | 791,028 | 7,166,641 | ||||||
Lloyds TSB Group plc (a) | 6,182,217 | 7,207,439 | ||||||
Persimmon plc (a) | 1,109,088 | 6,967,475 | ||||||
Taylor Wimpey plc (a) | 17,610,191 | 7,852,690 | ||||||
| 39,181,505 | ||||||||
| TOTAL COMMON STOCK | ||||||||
(Cost $413,212,633) | 379,684,507 | |||||||
| Short Term Investments—5.4% | ||||||||
| Par Value | Value | |||||||
| COMMERCIAL PAPER—5.4% | ||||||||
General Electric Capital Corporation, 0.08%, due 10/01/2010 | ||||||||
(Cost $10,730,000) | $ | 10,730,000 | 10,730,000 | |||||
State Street Global Advisors FDS, 0.00%, due 10/01/2010 | ||||||||
(Cost $10,922,300) | $ | 10,922,300 | 10,922,300 | |||||
| TOTAL SHORT TERM INVESTMENTS—5.4% | 21,652,300 | |||||||
| TOTAL INVESTMENTS—100.1% | ||||||||
(Cost $434,864,933) | 401,336,807 | |||||||
| OTHER ASSETS & LIABILITIES (NET)—(0.1%) | (584,277 | ) | ||||||
| NET ASSETS—100% | $ | 400,752,530 | ||||||
| (a) | Non-income producing security |
| (b) | ADR—American Depository Receipts |
| (c) | GDR—Global Depository Receipts |
The percentage of each investment category is calculated as a percentage of net assets.
SECTOR ALLOCATIONS (as a percentage of Total Net Assets) | |
| Financials | 17.9% |
| Industrials | 17.9% |
| Materials | 16.9% |
| Consumer Discretionary | 14.7% |
| Energy | 8.3% |
| Information Technology | 5.7% |
| Consumer Staples | 5.5% |
| Telecommunication Services | 3.4% |
| Health Care | 2.8% |
| Utilities | 1.6% |
| Other Assets & Liabilities | 5.3% |
| 100.0% | |
The accompanying notes are an integral part of these financial statements.
QUANT FOREIGN VALUE SMALL CAP FUND
SCHEDULE OF INVESTMENTS
September 30, 2010 (unaudited)
Common Stock—92.5%
| Shares | Value | |||||||
| AUSTRALIA—2.6% | ||||||||
Austal Limited | 545,400 | 1,287,992 | ||||||
Sigma Pharmaceuticals Ltd. | 2,784,100 | 1,288,125 | ||||||
| 2,576,117 | ||||||||
| BELGIUM—2.8% | ||||||||
Agfa-Gevaert Group | 197,400 | 1,452,391 | ||||||
Kinepolis Group | 21,100 | 1,376,547 | ||||||
| 2,828,938 | ||||||||
| BRAZIL—2.0% | ||||||||
Equatorial Energia S.A. | 194,485 | 1,174,564 | ||||||
Redentor Energia SA | 194,485 | 884,648 | ||||||
| 2,059,212 | ||||||||
| CAMBODIA—1.7% | ||||||||
NagaCorp Ltd. | 9,993,637 | 1,764,227 | ||||||
| CANADA—1.2% | ||||||||
Astral Media, Inc. | 32,700 | 1,227,699 | ||||||
| CHINA—13.8% | ||||||||
China Fishery Group Limited | 904,923 | 1,361,097 | ||||||
China Gerui Advanced Materials Group Limited | 199,400 | 1,138,574 | ||||||
China Hongxing Sports Limited | 13,500,700 | 1,846,039 | ||||||
China Natural Gas, Inc. | 177,900 | 1,053,168 | ||||||
Lihua International, Inc. | 136,100 | 1,178,626 | ||||||
Samson Holding Ltd. | 7,665,000 | 1,372,895 | ||||||
Sichuan Expressway Company Limited | 2,002,500 | 1,341,795 | ||||||
Texwinca Holdings Limited | 1,127,300 | 1,285,562 | ||||||
VST Holdings Ltd. | 3,432,900 | 915,676 | ||||||
VTech Holdings Limited | 107,900 | 1,101,872 | ||||||
Xinhua Winshare Publishing and Media Co., Ltd. | 2,398,300 | 1,282,513 | ||||||
| 13,877,817 | ||||||||
| CYPRUS—2.1% | ||||||||
Prosafe SE | 338,600 | 2,079,982 | ||||||
| FRANCE—1.2% | ||||||||
Bonduelle SA | 12,900 | 1,222,817 | ||||||
| GERMANY—1.4% | ||||||||
Demag Cranes AG | 37,000 | 1,415,753 | ||||||
| INDIA—8.3% | ||||||||
KRBL Limited Derivative (a) | 2,168,500 | 1,734,800 | ||||||
LIC Housing Finance Ltd. Derivative (a) | 52,900 | 1,691,213 | ||||||
NIIT Technologies Derivative (a) | 334,900 | 1,510,399 | ||||||
South Indian Bank Derivative (a) | 3,600,000 | 1,908,000 | ||||||
Usha Martin Group Derivative (a) | 807,100 | 1,565,774 | ||||||
| 8,410,186 | ||||||||
| IRELAND—5.6% | ||||||||
Glanbia plc | 329,700 | 1,555,920 | ||||||
Greencore Group plc | 751,901 | 1,206,651 | ||||||
IFG Group plc | 839,235 | 1,483,768 | ||||||
United Drug plc | 415,200 | 1,411,116 | ||||||
| 5,657,455 | ||||||||
| ITALY—2.5% | ||||||||
De’Longhi SpA | 280,400 | 1,529,190 | ||||||
Trevi Finanziaria SpA | 73,700 | 1,041,410 | ||||||
| 2,570,600 | ||||||||
| JAPAN—4.8% | ||||||||
Accordia Golf Co., Ltd. | 1,253 | 1,178,906 | ||||||
Chugoku Marine Paints, Ltd. | 159,300 | 1,138,402 | ||||||
DaiichiKosho Co. Ltd. | 82,600 | 1,285,372 | ||||||
Iino Kaiun Kaisha, Ltd. | 233,100 | 1,244,465 | ||||||
| 4,847,145 | ||||||||
| LUXEMBOURG—1.0% | ||||||||
Transcom WorldWide S.A. (a)(b) | 353,500 | 997,650 | ||||||
| NETHERLANDS—1.7% | ||||||||
Dockwise Ltd. | 67,700 | 1,676,353 | ||||||
| NORWAY—4.5% | ||||||||
ABG Sundal Collier Holding ASA | 972,500 | 1,093,521 | ||||||
Pronova BioPharma ASA | 409,300 | 746,233 | ||||||
SpareBank 1SMN | 170,904 | 1,420,275 | ||||||
SpareBank NOrd-Norge | 72,500 | 1,272,631 | ||||||
| 4,532,660 | ||||||||
| PHILIPPINES—2.1% | ||||||||
Manila Water Company, Inc. | 4,974,800 | 2,151,571 | ||||||
| SINGAPORE—3.2% | ||||||||
Breadtalk Group Ltd. | 3,117,600 | 1,361,760 | ||||||
M1 Ltd. | 1,092,400 | 1,817,347 | ||||||
| 3,179,107 | ||||||||
| SOUTH AFRICA—3.0% | ||||||||
Clicks Group Limited | 260,000 | 1,641,714 | ||||||
Metorex Limited (a) | 2,360,000 | 1,365,429 | ||||||
| 3,007,143 | ||||||||
| SWEDEN—4.3% | ||||||||
Duni AB | 173,700 | 1,584,866 | ||||||
Loomis AB | 117,300 | 1,403,908 | ||||||
Nolato AB | 114,900 | 1,362,451 | ||||||
| 4,351,225 | ||||||||
| SWITZERLAND—2.8% | ||||||||
Bobst Group SA (a) | 33,500 | 1,485,701 | ||||||
Vetropack Holding AG | 826 | 1,347,403 | ||||||
| 2,833,104 | ||||||||
| THAILAND—2.7% | ||||||||
Hana Microelectronics PCL | 1,337,400 | 1,123,681 | ||||||
Thai Union Frozen Products plc | 829,900 | 1,579,134 | ||||||
| 2,702,815 | ||||||||
| UNITED KINGDOM—17.2% | ||||||||
Alternative Networks plc | 816,900 | 2,460,589 | ||||||
BBA Aviation plc | 455,402 | 1,349,513 | ||||||
Character Group plc (a) | 667,900 | 1,586,316 | ||||||
Clarkson plc | 97,500 | 1,539,713 | ||||||
CSR plc (a) | 185,300 | 1,046,336 | ||||||
Galliford Try plc | 245,878 | 1,276,248 | ||||||
Halfords Group plc | 151,200 | 1,053,078 | ||||||
Hampson Industries plc | 1,430,207 | 708,616 | ||||||
Healthcare Locums plc | 385,900 | 776,937 | ||||||
Keller Group plc | 129,000 | 1,198,149 | ||||||
The Restaurant Group plc | 375,000 | 1,557,762 | ||||||
Vitec Group plc | 184,848 | 1,465,368 | ||||||
Wetherspoon (JD) plc | 193,500 | 1,336,733 | ||||||
| 17,355,358 | ||||||||
| TOTAL COMMON STOCK | ||||||||
(Cost $78,270,199) | 93,324,934 | |||||||
| Rights—0.0% | ||||||||
| THAILAND—0.0% | ||||||||
Thai Union Frozen Products plc | 41,495 | 10,091 | ||||||
Preferred Stock—1.9% | ||||||||
| GERMANY—1.9% | ||||||||
Drädagerwerk AG | ||||||||
(Cost $603,624) | 20,900 | $ | 1,904,693 | |||||
| Short Term Investments—7.5% | ||||||||
| Par Value | Value | |||||||
| COMMERCIAL PAPER—7.5% | ||||||||
State Street Global Advisors FDS, 0.00%, due 10/01/2010 | ||||||||
(Cost $7,550,693) | $ | 7,550,693 | 7,550,693 | |||||
| TOTAL INVESTMENTS—101.9% | ||||||||
(Cost $86,424,516) | 102,790,411 | |||||||
| OTHER ASSETS & LIABILITIES (NET)—(1.9%) | (1,942,933 | ) | ||||||
| NET ASSETS—100% | $ | 100,847,478 | ||||||
| (a) | Non-income producing security |
| (b) | SDR—Special Depository Receipts |
The percentage of each investment category is calculated as a percentage of net assets.
SECTOR ALLOCATIONS (as a percentage of Total Net Assets) | |
| Consumer Discretionary | 24.2% |
| Industrials | 17.3% |
| Consumer Staples | 9.9% |
| Financials | 8.8% |
| Health Care | 7.5% |
| Information Technology | 7.0% |
| Materials | 6.5% |
| Utilities | 5.2% |
| Telecommunication Services | 4.2% |
| Energy | 3.7% |
| Cash and Other Assets | 5.6% |
The accompanying notes are an integral part of these financial statements.
QUANT FUNDS
QUANT FUNDS
STATEMENT OF ASSETS AND LIABILITIES
September 30, 2010 (unaudited)
| Small Cap | Long/Short | |||||||
| Assets: | ||||||||
| Investments at Value (Includes collateral from securities on loan of $1,167,707; $7,352,939; $4,259,949; $0; $0, respectively* (Note 2) | $ | 97,820,959 | $ | 69,582,152 | ||||
| Repurchase Agreements/Commercial Paper | 6,907,000 | |||||||
| Foreign Currency at Value (Cost $297,820 for Emerging Markets, $43 for Foreign Value and $13,934 for Foreign Value Small Cap) | — | — | ||||||
| Cash | 1,376 | 286,771 | ||||||
| Dividends, Interest and Foreign Tax Reclaims Receivable | 99,399 | 117,155 | ||||||
| Receivable for Investments Sold | 3,120,714 | — | ||||||
| Receivable for Shares of Beneficial Interest Sold | 1,742 | 851 | ||||||
| Other Assets | 13,863 | 7,527 | ||||||
Total Assets | $ | 107,965,053 | $ | 69,994,456 | ||||
| Liabilities: | ||||||||
| Securities Sold Short, at Value (proceeds of $13,667,463) | $ | — | $ | 14,488,189 | ||||
| Payable for Investments Purchased | 4,068,140 | — | ||||||
| Payable for Shares of Beneficial Interest Repurchased | 670 | 13,323 | ||||||
| Payable for Compensation of Manager (Note 3) | 81,671 | 38,944 | ||||||
| Payable for Distribution Fees (Note 3) | 19,082 | 9,784 | ||||||
| Payable to Custodian | 3,735 | 8,797 | ||||||
| Payable to Transfer Agent (Note 3) | 6,798 | 9,307 | ||||||
| Payable for Collateral Received for Securities Loaned | 1,167,707 | 7,352,939 | ||||||
| Payable for Foreign Capital Gain Tax | — | — | ||||||
| Payable For Dividend Expense On Securities Sold Short | — | 933 | ||||||
| Unrealized gain/loss on forward foreign currency contracts (Note 2) | — | — | ||||||
| Variation margin payable | — | 1,890 | ||||||
| Other Accrued Expenses | 30,832 | (5,072 | ) | |||||
Total Liabilities | $ | 5,378,635 | $ | 21,919,034 | ||||
| Net Assets | $ | 102,586,418 | $ | 48,075,422 | ||||
| * | Includes securities on loan to brokers with market value of $1,140,243; $7,158,938; $4,063,420; $0; $0, respectively. |
QUANT FUNDS
STATEMENT OF ASSETS AND LIABILITIES (continued)
Emerging Markets | Foreign Value | Foreign Value Small Cap | ||||||||
| $ | 256,338,976 | $ | 379,684,507 | $ | 95,239,718 | |||||
| 17,366,000 | 21,652,300 | 7,550,693 | ||||||||
| 298,056 | 48 | 15,345 | ||||||||
| 1,415 | 93,735 | — | ||||||||
| 400,291 | 971,427 | 250,014 | ||||||||
| 1,053,124 | — | — | ||||||||
| 282,003 | 27,836 | 24,102 | ||||||||
| 7,239 | 22,387 | 9,403 | ||||||||
| $ | 275,747,104 | $ | 402,452,240 | $ | 103,089,275 | |||||
| $ | — | $ | — | $ | — | |||||
| 17,546,575 | 779,958 | 2,024,491 | ||||||||
| 94,466 | 148,694 | — | ||||||||
| 179,203 | 306,360 | 78,189 | ||||||||
| 38,917 | 62,758 | 17,793 | ||||||||
| 16,407 | (541 | ) | 11,539 | |||||||
| 28,479 | 57,230 | 13,208 | ||||||||
| 4,259,949 | — | — | ||||||||
| 812,393 | 352,607 | 64,971 | ||||||||
| — | — | — | ||||||||
| 34,461 | 5,218 | 14,752 | ||||||||
| — | — | — | ||||||||
| 17,354 | (12,574 | ) | 16,854 | |||||||
| $ | 23,028,204 | $ | 1,699,710 | $ | 2,241,797 | |||||
| $ | 252,718,900 | $ | 400,752,530 | $ | 100,847,478 | |||||
The accompanying notes are an integral part of these financial statements.
QUANT FUNDS
STATEMENT OF ASSETS AND LIABILITIES (continued)
| Small Cap | Long/Short | |||||||
| Net Assets Consist Of: | ||||||||
| Shares of Beneficial Interest | $ | 119,061,702 | $ | 67,465,635 | ||||
| Undistributed Net Investment Income | 445,576 | 327,127 | ||||||
| Accumulated Net Realized Gain/(Loss) on Investments and Foreign Denominated Assets, Liabilities and Currency | (34,958,143 | ) | (19,121,652 | ) | ||||
| Unrealized Appreciation/(Depreciation) of Investments and Foreign Denominated Assets, Liabilities and Currency | 18,037,283 | (605,182 | ) | |||||
| Unrealized Appreciation/(Depreciation) of Futures Contracts | — | 9,494 | ||||||
| Net Assets | $ | 102,586,418 | $ | 48,075,422 | ||||
| Investments at Cost | $ | 86,690,676 | $ | 69,366,609 | ||||
| Net assets | ||||||||
| Ordinary Shares | $ | 95,912,784 | $ | 47,750,796 | ||||
| Institutional Shares | $ | 6,673,634 | $ | 324,626 | ||||
| Shares of Beneficial Interest Outstanding (Unlimited Number of Shares Authorized) | ||||||||
| Ordinary Shares | 5,735,952 | 4,475,435 | ||||||
| Institutional Shares | 353,410 | 29,263 | ||||||
| Net Asset Value and Offering Price Per Share | ||||||||
| Ordinary Shares | $ | 16.72 | $ | 10.67 | ||||
| Institutional Shares | $ | 18.88 | $ | 11.09 | ||||
QUANT FUNDS
STATEMENT OF ASSETS AND LIABILITIES (continued)
Emerging Markets | Foreign Value | Foreign Value Small Cap | ||||||||
| $ | 267,319,396 | $ | 667,997,207 | $ | 75,679,851 | |||||
| 5,042,467 | 6,173,236 | 1,109,727 | ||||||||
| (66,296,455 | ) | (239,550,218 | ) | 7,749,545 | ||||||
| 46,653,492 | ** | (33,867,695 | ) | 16,308,355 | ||||||
| — | — | — | ||||||||
| $ | 252,718,900 | $ | 400,752,530 | $ | 100,847,478 | |||||
| $ | 226,179,651 | $ | 434,864,933 | $ | 86,424,516 | |||||
| $ | 222,539,759 | $ | 330,395,642 | $ | 91,718,214 | |||||
| $ | 30,179,141 | $ | 70,356,888 | $ | 9,129,264 | |||||
| 9,707,343 | 25,655,267 | 8,422,162 | ||||||||
| 1,299,445 | 5,457,193 | 835,820 | ||||||||
| $ | 22.92 | $ | 12.88 | $ | 10.89 | |||||
| $ | 23.22 | $ | 12.89 | $ | 10.92 | |||||
| ** | Includes foreign capital gains tax of $115,499. |
The accompanying notes are an integral part of these financial statements.
QUANT FUNDS
STATEMENT OF OPERATIONS
Six Months Ended September 30, 2010 (unaudited)
| Small Cap | Long/Short | |||||||
| Investment Income: | ||||||||
Dividends* | $ | 679,680 | $ | 673,452 | ||||
Interest | 234 | — | ||||||
Securities Lending Income | 4,314 | 7,450 | ||||||
Miscellaneous | — | 148 | ||||||
| Total Investment Income | 684,228 | 681,050 | ||||||
| Expenses: | ||||||||
Dividend Expense On Securities Sold Short | — | 18,715 | ||||||
Stock Loan Fees | — | 44,658 | ||||||
Compensation of Manager (Note 3) | 502,434 | 247,648 | ||||||
Distribution Fees, Ordinary Shares (Note 3) | 117,495 | 61,332 | ||||||
Administrative Fees (Note 3) | 15,589 | 7,798 | ||||||
Custodian and Fund Accounting Fees | 28,504 | 31,120 | ||||||
Regulatory and Compliance (Note 3) | 10,902 | 5,450 | ||||||
Transfer Agent Fees (Note 3): | ||||||||
Ordinary Shares | 80,732 | 43,004 | ||||||
Institutional Shares | 5,416 | 484 | ||||||
Audit and Legal | 13,378 | 6,689 | ||||||
Registration Fees | 15,971 | 11,507 | ||||||
Insurance | 3,991 | 1,998 | ||||||
Compensation of Trustees (Note 3) | 6,447 | 3,224 | ||||||
Printing | 7,033 | 3,520 | ||||||
Miscellaneous | 6,718 | 4,576 | ||||||
Total Expenses Before Waivers/Reimbursements/Reductions | 814,610 | 491,723 | ||||||
Waivers and/or Reimbursements of Expenses (Note 3) | — | — | ||||||
Fees Reduced by Credits Allowed by Custodian (Note 3) | — | (11 | ) | |||||
| Expenses, Net | 814,610 | 491,712 | ||||||
| Net Investment Income/(Loss) | (130,382 | ) | 189,338 | |||||
| Realized and Unrealized Gain/(Loss) on Investments, Foreign Currency, and Foreign Translation: | ||||||||
| Net Realized Gain/(Loss) (Note 2) on: | ||||||||
Investments | 3,011,192 | 3,303,437 | ||||||
Securities Sold Short Transactions | — | (912,423 | ) | |||||
Foreign Denominated Assets, Liabilities, and Currency | — | — | ||||||
Futures Contracts | — | 62,885 | ||||||
| Change in Unrealized Appreciation/(Depreciation) of: | ||||||||
Investments | (1,286,455 | ) | (7,121,147 | ) | ||||
Securities Sold Short Transactions | — | 1,270,535 | ||||||
Foreign Denominated Assets, Liabilities, and Currency | — | — | ||||||
Futures Contracts | — | 9,494 | ||||||
Net Realized and Unrealized Gain/(Loss) | 1,724,737 | (3,387,219 | ) | |||||
Net Increase/(Decrease) in Net Assets From Operations | $ | 1,594,355 | $ | (3,197,881 | ) | |||
| * | Dividends are net of foreign withholding taxes of $7,391 for Small Cap, $483,400 for Emerging Markets, $630,900 for Foreign Value and $81,335 for Foreign Value Small Cap |
QUANT FUNDS
STATEMENT OF OPERATIONS (continued)
Emerging Markets | Foreign Value | Foreign Value Small Cap | ||||||||
| $ | 4,613,601 | $ | 4,625,957 | $ | 1,690,544 | |||||
| 81 | 5,976 | 2,579 | ||||||||
| 456 | — | — | ||||||||
| 34 | — | — | ||||||||
| 4,614,172 | 4,631,933 | 1,693,123 | ||||||||
| — | — | — | ||||||||
| — | — | — | ||||||||
| 1,058,961 | 2,000,658 | 496,748 | ||||||||
| 231,551 | 418,534 | 114,260 | ||||||||
| 32,885 | 62,951 | 16,186 | ||||||||
| 182,780 | 110,885 | 63,362 | ||||||||
| 22,982 | 44,007 | 11,284 | ||||||||
| 152,227 | 277,828 | 74,388 | ||||||||
| 21,365 | 53,757 | 6,426 | ||||||||
| 28,207 | 54,004 | 13,852 | ||||||||
| 23,620 | 24,591 | 15,499 | ||||||||
| 8,391 | 16,053 | 4,205 | ||||||||
| 13,584 | 26,011 | 6,684 | ||||||||
| 14,723 | 28,168 | 7,495 | ||||||||
| 11,463 | 22,976 | 7,635 | ||||||||
| 1,802,739 | 3,140,423 | 838,024 | ||||||||
| — | — | — | ||||||||
| — | — | — | ||||||||
| 1,802,739 | 3,140,423 | 838,024 | ||||||||
| 2,811,433 | 1,491,510 | 855,099 | ||||||||
| 11,482,902 | (5,253,137 | ) | 7,790,365 | |||||||
| — | — | — | ||||||||
| (137,468 | ) | (4,626 | ) | (117,219 | ) | |||||
| — | — | — | ||||||||
| 3,241,801 | 12,061,453 | (3,806,383 | ) | |||||||
| — | — | — | ||||||||
| (444,580 | ) | (13,482 | ) | (22,030 | ) | |||||
| — | — | — | ||||||||
| 14,142,655 | 6,790,208 | 3,844,733 | ||||||||
| $ | 16,954,088 | $ | 8,281,718 | $ | 4,699,832 | |||||
The accompanying notes are an integral part of these financial statements.
QUANT FUNDS
STATEMENT OF CHANGES IN NET ASSETS
| Small Cap | ||||||||
Six Months Ended September 30, 2010 | Year Ended March 31, 2010 | |||||||
| (unaudited) | ||||||||
| Increase (Decrease) in Net Assets: | ||||||||
| Operations: | ||||||||
Net investment income/(loss) | $ | (130,382 | ) | $ | 747,601 | |||
Net realized gain/(loss) on investments | ||||||||
Foreign denominated assets, liabilities, and currency | 3,011,192 | (2,131,430 | ) | |||||
Net realized gain/(loss) on futures contracts | — | — | ||||||
Unrealized appreciation/(depreciation) of investments, foreign denominated assets, liabilities, and currency | (1,286,455 | ) | 42,535,784 | |||||
Change in Unrealized appreciation (depreciation) of futures contracts | — | — | ||||||
Net increase/(decrease) from operations | $ | 1,594,355 | $ | 41,151,955 | ||||
| Distributions to shareholders from: | ||||||||
Net investment income | ||||||||
Ordinary shares | $ | — | $ | (166,855 | ) | |||
Institutional shares | — | (21,762 | ) | |||||
Net realized gains | ||||||||
Ordinary shares | — | — | ||||||
Institutional shares | — | — | ||||||
| Total distributions | $ | — | $ | (188,617 | ) | |||
| Fund share transactions (Note 8) | (5,597,411 | ) | (3,597,853 | ) | ||||
| Contributions to capital from mgrs/brokers | — | 25 | ||||||
| Increase/(decrease) in net assets | $ | (4,003,056 | ) | $ | 37,365,510 | |||
| Net assets beginning of period | 106,589,474 | 69,223,964 | ||||||
| Net assets end of period* | $ | 102,586,418 | $ | 106,589,474 | ||||
* Includes undistributed net investment income/(loss) of: | $ | 445,576 | $ | 575,958 | ||||
The accompanying notes are an integral part of these financial statements.
QUANT FUNDS
STATEMENT OF CHANGES IN NET ASSETS (continued)
| Long/Short | ||||||||
Six Months Ended September 30, 2010 | Year Ended March 31, 2010 | |||||||
| (unaudited) | ||||||||
| Increase (Decrease) in Net Assets: | ||||||||
| Operations: | ||||||||
Net investment income/(loss) | $ | 189,338 | $ | 258,344 | ||||
Net realized gain/(loss) on investments | ||||||||
Foreign denominated assets, liabilities, and currency | 2,391,014 | 2,249,050 | ||||||
Net realized gain/(loss) on futures contracts | 62,885 | — | ||||||
Unrealized appreciation/(depreciation) of investments, foreign denominated assets, liabilities, and currency | (5,850,612 | ) | 13,603,852 | |||||
Change in Unrealized appreciation (depreciation) of futures contracts | 9,494 | — | ||||||
Net increase/(decrease) from operations | $ | (3,197,881 | ) | $ | 16,111,246 | |||
| Distributions to shareholders from: | ||||||||
Net investment income | ||||||||
Ordinary shares | $ | — | $ | (120,372 | ) | |||
Institutional shares | — | (2,488 | ) | |||||
Net realized gains | ||||||||
Ordinary shares | — | — | ||||||
Institutional shares | — | — | ||||||
| Total distributions | $ | — | $ | (122,860 | ) | |||
| Fund share transactions (Note 8) | (3,531,073 | ) | (4,782,560 | ) | ||||
| Contributions to capital from mgrs/brokers | — | 677 | ||||||
| Increase/(decrease) in net assets | $ | (6,728,954 | ) | $ | 11,206,503 | |||
| Net assets beginning of period | 54,804,376 | 43,597,873 | ||||||
| Net assets end of period* | $ | 48,075,422 | $ | 54,804,376 | ||||
* Includes undistributed net investment income/(loss) of: | $ | 327,127 | $ | 137,790 | ||||
The accompanying notes are an integral part of these financial statements.
QUANT FUNDS
STATEMENT OF CHANGES IN NET ASSETS (continued)
| Emerging Markets | ||||||||
Six Months Ended September 30, 2010 | Year Ended March 31, 2010 | |||||||
| (unaudited) | ||||||||
| Increase (Decrease) in Net Assets: | ||||||||
| Operations: | ||||||||
Net investment income/(loss) | $ | 2,811,433 | $ | 2,615,809 | ||||
Net realized gain/(loss) on investments | ||||||||
Foreign denominated assets, liabilities, and currency | 11,345,434 | 21,873,966 | ||||||
Net realized gain/(loss) on futures contracts | — | — | ||||||
Unrealized appreciation/(depreciation) of investments, foreign denominated assets, liabilities, and currency | 2,797,221 | 107,500,961 | ||||||
Change in Unrealized appreciation (depreciation) of futures contracts | — | — | ||||||
Net increase/(decrease) from operations | $ | 16,954,088 | $ | 131,990,736 | ||||
| Distributions to shareholders from: | ||||||||
Net investment income | ||||||||
Ordinary shares | $ | — | $ | (824,167 | ) | |||
Institutional shares | — | (111,587 | ) | |||||
Net realized gains | ||||||||
Ordinary shares | — | — | ||||||
Institutional shares | — | — | ||||||
| Total distributions | $ | — | $ | (935,754 | ) | |||
| Fund share transactions (Note 8) | 3,791,206 | (88,878,390 | ) | |||||
| Contributions to capital from mgrs/brokers | 16 | — | ||||||
| Increase/(decrease) in net assets | $ | 20,745,310 | $ | 42,176,592 | ||||
| Net assets beginning of period | 231,973,590 | 189,796,998 | ||||||
| Net assets end of period* | $ | 252,718,900 | $ | 231,973,590 | ||||
* Includes undistributed net investment income/(loss) of: | $ | 5,042,467 | $ | 2,231,034 | ||||
The accompanying notes are an integral part of these financial statements.
QUANT FUNDS
STATEMENT OF CHANGES IN NET ASSETS (continued)
| Foreign Value | ||||||||
Six Months Ended September 30, 2010 | Year Ended March 31, 2010 | |||||||
| (unaudited) | ||||||||
| Increase (Decrease) in Net Assets: | ||||||||
| Operations: | ||||||||
Net investment income/(loss) | $ | 1,491,510 | $ | 4,669,469 | ||||
Net realized gain/(loss) on investments | ||||||||
Foreign denominated assets, liabilities, and currency | (5,257,763 | ) | (106,488,180 | ) | ||||
Net realized gain/(loss) on futures contracts | — | — | ||||||
Unrealized appreciation/(depreciation) of investments, foreign denominated assets, liabilities, and currency | 12,047,971 | 311,243,529 | ||||||
Change in Unrealized appreciation (depreciation) of futures contracts | — | — | ||||||
Net increase/(decrease) from operations | $ | 8,281,718 | $ | 209,424,818 | ||||
| Distributions to shareholders from: | ||||||||
Net investment income | ||||||||
Ordinary shares | $ | — | $ | (10,593,651 | ) | |||
Institutional shares | — | (2,023,876 | ) | |||||
Net realized gains | ||||||||
Ordinary shares | — | — | ||||||
Institutional shares | — | — | ||||||
| Total distributions | $ | — | $ | (12,617,527 | ) | |||
| Fund share transactions (Note 8) | (45,222,169 | ) | (2,423 | ) | ||||
| Contributions to capital from mgrs/brokers | 71 | 375 | ||||||
| Increase/(decrease) in net assets | $ | (36,940,380 | ) | $ | 196,805,243 | |||
| Net assets beginning of period | 437,692,910 | 240,887,667 | ||||||
| Net assets end of period* | $ | 400,752,530 | $ | 437,692,910 | ||||
* Includes undistributed net investment income/(loss) of: | $ | 6,173,236 | $ | 4,681,726 | ||||
The accompanying notes are an integral part of these financial statements.
QUANT FUNDS
STATEMENT OF CHANGES IN NET ASSETS (continued)
| Foreign Value | ||||||||
| Small Cap | ||||||||
Six Months Ended September 30, 2010 | Period Ended March 31, 2010 | |||||||
| (unaudited) | ||||||||
| Increase (Decrease) in Net Assets: | ||||||||
| Operations: | ||||||||
Net investment income/(loss) | $ | 855,099 | $ | 653,192 | ||||
Net realized gain/(loss) on investments | ||||||||
Foreign denominated assets, liabilities, and currency | 7,673,146 | 1,051,032 | ||||||
Net realized gain/(loss) on futures contracts | — | — | ||||||
Unrealized appreciation/(depreciation) of investments, foreign denominated assets, liabilities, and currency | (3,828,413 | ) | 34,258,072 | |||||
Change in Unrealized appreciation (depreciation) of futures contracts | — | — | ||||||
Net increase/(decrease) from operations | $ | 4,699,832 | $ | 35,962,296 | ||||
| Distributions to shareholders from: | ||||||||
Net investment income | ||||||||
Ordinary shares | $ | — | $ | (345,343 | ) | |||
Institutional shares | — | (29,098 | ) | |||||
Net realized gains | ||||||||
Ordinary shares | — | — | ||||||
Institutional shares | — | — | ||||||
| Total distributions | $ | — | $ | (374,441 | ) | |||
| Fund share transactions (Note 8) | (36,925,756 | ) | 74,915,340 | |||||
| Contributions to capital from mgrs/brokers | — | — | ||||||
| Increase/(decrease) in net assets | $ | (32,225,924 | ) | $ | 110,503,195 | |||
| Net assets beginning of period | 133,073,402 | 22,570,207 | ||||||
| Net assets end of period* | $ | 100,847,478 | $ | 133,073,402 | ||||
* Includes undistributed net investment income/(loss) of: | $ | 1,109,727 | $ | 254,628 | ||||
The accompanying notes are an integral part of these financial statements.
QUANT LONG/SHORT FUND
STATEMENT OF CASH FLOWS
Six Months Ended September 30, 2010 (unaudited)
| Increase(Decrease) in cash— | ||||
| Cash flows from operating activities: | ||||
Net increase/(decrease) in net assets from operations | $ | (3,197,881 | ) | |
Purchase of investment securities | (69,452,265 | ) | ||
Sale of investment securities | 73,576,161 | |||
Decrease in deposits with brokers for short sales | — | |||
Decrease Receivable for Investments Sold | — | |||
Decrease in dividends and interest receivable | 13,388 | |||
Decrease in accrued expenses | (23,022 | ) | ||
Increase in securities sold short | 106,401 | |||
Decrease in dividends payable for securities sold short | (1,301 | ) | ||
Increase in Futures Margin payable | 1,890 | |||
Unrealized appreciation on securities | 5,850,611 | |||
Net realized gains from investments | (3,303,437 | ) | ||
Net cash used in operating activities | 6,768,426 | |||
| Cash flows from financing activities: | ||||
Proceeds from shares sold | 873,216 | |||
Payment on shares redeemed | (4,390,805 | ) | ||
Paid in Surplus | — | |||
Cash distributions paid | — | |||
Net cash provided by financing activities | (3,517,589 | ) | ||
| Net increase/(decrease) in cash | $ | 52,956 | ||
| Cash: | ||||
Beginning balance—04/01/10 | 233,815 | |||
Ending balance—09/30/10 | $ | 286,771 | ||
| Supplemental disclosure of cash flow information: |
For purposes of reporting the statement of cash flows, the Fund considers all cash accounts that are not subject to withdrawal restrictions or penalties to be cash equivalents. Securities and Exchange Commission regulations do not require cash flow statements for Small Cap, Emerging Markets, Foreign Value, and Foreign Value Small Cap Funds.
The accompanying notes are an integral part of these financial statements.
QUANT SMALL CAP FUND
FINANCIAL HIGHLIGHTS
(For a share outstanding throughout each period)
| Ordinary Shares | ||||||||||||||||||||||||
For the six months ended September 30, | Years Ending March 31, | |||||||||||||||||||||||
| 2010 | 2010 | 2009 | 2008 | 2007 | 2006 | |||||||||||||||||||
| (unaudited) | ||||||||||||||||||||||||
| Net Asset Value, Beginning of Period | $ | 16.45 | $ | 10.22 | $ | 19.45 | $ | 23.88 | $ | 22.99 | $ | 21.13 | ||||||||||||
| Income from Investment Operations: | ||||||||||||||||||||||||
Net investment income (loss) (a)(b)(c) | (0.02 | ) | 0.11 | 0.06 | 0.07 | (0.19 | ) | (0.22 | ) | |||||||||||||||
Net realized and unrealized gain/(loss) on securities | 0.29 | 6.15 | (9.23 | ) | (3.56 | ) | 2.91 | 5.16 | ||||||||||||||||
| Total from Investment Operations | 0.27 | 6.26 | (9.17 | ) | (3.49 | ) | 2.72 | 4.94 | ||||||||||||||||
| Less Distributions: | ||||||||||||||||||||||||
Dividends from net investment income | — | (0.03 | ) | — | (0.11 | ) | — | — | ||||||||||||||||
Distributions from realized capital gains | — | — | (0.06 | ) | (0.83 | ) | (1.83 | ) | (3.08 | ) | ||||||||||||||
| Total Distributions | — | (0.03 | ) | (0.06 | ) | (0.94 | ) | (1.83 | ) | (3.08 | ) | |||||||||||||
| Net Asset Value, End of Period | $ | 16.72 | $ | 16.45 | $ | 10.22 | $ | 19.45 | $ | 23.88 | $ | 22.99 | ||||||||||||
| Total Return (d) | 1.64 | % | 61.27 | % | (47.11 | )% | (15.17 | )% | 12.01 | % | 24.51 | % | ||||||||||||
| Net Assets, End of Period (000’s) | $ | 95,913 | $ | 99,444 | $ | 61,943 | $ | 119,949 | $ | 124,998 | $ | 98,879 | ||||||||||||
| Ratios and Supplemental Data: | ||||||||||||||||||||||||
| Ratios of expenses to average net assets: (e) | ||||||||||||||||||||||||
Gross | 1.64 | % | 1.65 | % | 1.64 | % | 1.59 | %* | 1.82 | % | 1.88 | % | ||||||||||||
Net | 1.64 | % | 1.65 | % | 1.64 | % | 1.59 | %* | 1.82 | % | 1.88 | % | ||||||||||||
Ratio of net investment income (loss) to average net assets (c) | (0.27 | )% | 0.81 | % | 0.31 | % | 0.31 | % | (0.80 | )% | (1.00 | )% | ||||||||||||
| Portfolio Turnover | 29 | % | 50 | % | 72 | % | 39 | % | 41 | % | 57 | % | ||||||||||||
* Expense ratio declined from year ended March 31, 2007 to 2008.The prior year was the result of the reduction of the 12b-1 fee from 50 basis points to 25 basis points on June 1, 2007. |
The accompanying notes are an integral part of these financial statements.
QUANT SMALL CAP FUND
FINANCIAL HIGHLIGHTS (continued)
(For a share outstanding throughout each period)
| Institutional Shares | ||||||||||||||||||||||||
For the six months ended September 30, | Years Ending March 31, | |||||||||||||||||||||||
| 2010 | 2010 | 2009 | 2008 | 2007 | 2006 | |||||||||||||||||||
| (unaudited) | ||||||||||||||||||||||||
| Net Asset Value, Beginning of Period | $ | 18.56 | $ | 11.51 | $ | 21.86 | $ | 26.71 | $ | 25.39 | $ | 22.96 | ||||||||||||
| Income from Investment Operations: | ||||||||||||||||||||||||
Net investment income (loss) (a)(b)(c) | — | 0.20 | 0.10 | 0.12 | (0.08 | ) | (0.12 | ) | ||||||||||||||||
Net realized and unrealized gain/(loss) on securities | 0.32 | 6.91 | (10.39 | ) | (3.94 | ) | 3.23 | 5.63 | ||||||||||||||||
| Total from Investment Operations | 0.32 | 7.11 | (10.29 | ) | (3.82 | ) | 3.15 | 5.51 | ||||||||||||||||
| Less Distributions: | ||||||||||||||||||||||||
Dividends from net investment income | — | �� | (0.06 | ) | — | (0.20 | ) | — | — | |||||||||||||||
Distributions from realized capital gains | — | — | (0.06 | ) | (0.83 | ) | (1.83 | ) | (3.08 | ) | ||||||||||||||
| Total Distributions | — | (0.06 | ) | (0.06 | ) | (1.03 | ) | (1.83 | ) | (3.08 | ) | |||||||||||||
| Net Asset Value, End of Period | $ | 18.88 | $ | 18.56 | $ | 11.51 | $ | 21.86 | $ | 26.71 | $ | 25.39 | ||||||||||||
| Total Return (d) | 1.72 | % | 61.83 | % | (47.04 | )% | (14.87 | )% | 12.58 | % | 25.06 | % | ||||||||||||
| Net Assets, End of Period (000’s) | $ | 6,674 | $ | 7,146 | $ | 7,281 | $ | 24,282 | $ | 12,400 | $ | 12,298 | ||||||||||||
| Ratios and Supplemental Data: | ||||||||||||||||||||||||
| Ratios of expenses to average net assets: (e) | ||||||||||||||||||||||||
Gross | 1.40 | % | 1.41 | % | 1.42 | % | 1.30 | % | 1.31 | % | 1.38 | % | ||||||||||||
Net | 1.40 | % | 1.41 | % | 1.42 | % | 1.30 | % | 1.31 | % | 1.38 | % | ||||||||||||
Ratio of net investment income (loss) to average net assets (c) | (0.05 | )% | 1.35 | % | 0.48 | % | 0.45 | % | (0.30 | )% | (0.50 | )% | ||||||||||||
| Portfolio Turnover | 28 | % | 50 | % | 72 | % | 39 | % | 41 | % | 57 | % | ||||||||||||
| (a) | Per share numbers have been calculated using the average shares method. |
| (b) | Reflects expense waivers/reimbursements and reductions in effect during the period. See Note 3 to the Financial Statements. |
| (c) | Net investment income (loss) per share and the ratio of net investment income (loss) to average net assets reflect net investment income prior to certain reclassifications for federal income or excise taxes. |
| (d) | Total Return does not include the deferred sales charge of 1% for the Ordinary Shares. The total return would have been lower if certain fees had not been waived or if custodial fees had not been reduced by credits allowed by the custodian. See Note 3 to the financial statements. |
| (e) | Ratios of expenses to average net assets: |
| — Gross (total expenses before fee waivers, reimbursements by the investment advisor, and custody earnings credits, if any). |
| — Net (total expenses net of fee waivers, reimbursements by the investment advisor, and custody earnings credits, if any). |
The accompanying notes are an integral part of these financial statements.
QUANT LONG/SHORT FUND
FINANCIAL HIGHLIGHTS (continued)
(For a share outstanding throughout each period)
| Ordinary Shares | ||||||||||||||||||||||||
For the six months ended September 30, | ||||||||||||||||||||||||
| 2010 | 2010 | 2009 | 2008 | 2007 | 2006 | |||||||||||||||||||
| (unaudited) | ||||||||||||||||||||||||
| Net Asset Value, Beginning of Period | $ | 11.37 | $ | 8.24 | $ | 14.07 | $ | 17.04 | $ | 14.76 | $ | 12.88 | ||||||||||||
| Income from Investment Operations: | ||||||||||||||||||||||||
Net investment income (loss) (a)(b)(c) | 0.04 | 0.05 | (0.04 | ) | (0.09 | ) | (0.02 | ) | 0.03 | |||||||||||||||
Net realized and unrealized gain/(loss) on securities | (0.74 | ) | 3.10 | (5.78 | ) | (2.30 | ) | 2.33 | 1.86 | |||||||||||||||
| Total from Investment Operations | (0.70 | ) | 3.15 | (5.82 | ) | (2.39 | ) | 2.31 | 1.89 | |||||||||||||||
| Less Distributions: | ||||||||||||||||||||||||
Dividends from net investment income | — | (0.02 | ) | (0.01 | ) | — | (0.03 | ) | (0.01 | ) | ||||||||||||||
Distributions from realized capital gains | — | — | — | (0.58 | ) | — | — | |||||||||||||||||
| Total Distributions | — | (0.02 | ) | (0.01 | ) | (0.58 | ) | (0.03 | ) | (0.01 | ) | |||||||||||||
| Net Asset Value, End of Period | $ | 10.67 | $ | 11.37 | $ | 8.24 | $ | 14.07 | $ | 17.04 | $ | 14.76 | ||||||||||||
| Total Return (d) | (6.16 | )% | 38.30 | % | (41.36 | )% | (14.43 | )% | 15.63 | % | 14.67 | % | ||||||||||||
| Net Assets, End of Period (000’s) | $ | 47,751 | $ | 54,213 | $ | 43,014 | $ | 69,767 | $ | 75,376 | $ | 59,975 | ||||||||||||
| Ratios and Supplemental Data: | ||||||||||||||||||||||||
| Ratios of expenses to average net assets: (e) | ||||||||||||||||||||||||
Gross | 1.99 | % | 2.10 | % | 2.71 | % | 2.18 | % | 1.74 | % | 1.65 | % | ||||||||||||
Net including dividend and interest expense for securities sold short | 1.99 | % | 2.10 | % | 2.71 | % | 2.12 | % | 1.71 | % | 1.61 | % | ||||||||||||
Net excluding dividend and interest expense for securities sold short | 1.91 | % | 1.92 | % | 1.98 | % | 1.90 | % | 1.69 | % | — | |||||||||||||
| Ratio of net investment income (loss) to average net assets (c) | 0.76 | % | 0.50 | % | (0.38 | )% | (0.52 | )% | (0.14 | )% | 0.21 | % | ||||||||||||
| Portfolio Turnover Excluding Short Positions (f) | 110 | % | 191 | % | 207 | % | 171 | % | 83 | % | 105 | % | ||||||||||||
Note: This fund changed its investment strategy on November 1, 2006. |
The accompanying notes are an integral part of these financial statements.
QUANT LONG/SHORT FUND
FINANCIAL HIGHLIGHTS (continued)
(For a share outstanding throughout each period)
| Institutional Shares | |||||||||||||||||||||||||
For the six months ended September 30, | Years Ending March 31, | ||||||||||||||||||||||||
| 2010 | 2010 | 2009 | 2008 | 2007 | 2006 | ||||||||||||||||||||
| (unaudited) | |||||||||||||||||||||||||
| Net Asset Value, Beginning of Period | $ | 11.80 | $ | 8.54 | $ | 14.71 | $ | 17.80 | $ | 15.40 | $ | 13.43 | |||||||||||||
| Income from Investment Operations: | |||||||||||||||||||||||||
Net investment income (loss) (a)(b)(c) | 0.05 | 0.08 | (0.10 | ) | (0.10 | ) | 0.06 | 0.10 | |||||||||||||||||
Net realized and unrealized gain /(loss) on securities | (0.76 | ) | 3.22 | (6.02 | ) | (2.41 | ) | 2.44 | 1.94 | ||||||||||||||||
| Total from Investment Operations | (0.71 | ) | 3.30 | (6.12 | ) | (2.51 | ) | 2.50 | 2.04 | ||||||||||||||||
| Less Distributions: | |||||||||||||||||||||||||
Dividends from net investment income | — | (0.04 | ) | (0.05 | ) | — | (0.10 | ) | (0.07 | ) | |||||||||||||||
Distributions from realized capital gains | — | — | — | (0.58 | ) | — | — | ||||||||||||||||||
| Total Distributions | — | (0.04 | ) | (0.05 | ) | (0.58 | ) | (0.10 | ) | (0.07 | ) | ||||||||||||||
| Net Asset Value, End of Period | $ | 11.09 | $ | 11.80 | $ | 8.54 | $ | 14.71 | $ | 17.80 | $ | 15.40 | |||||||||||||
| Total Return (d) | (6.02 | )% | 38.71 | % | (41.66 | )% | (14.49 | )% | 16.22 | % | 15.19 | % | |||||||||||||
| Net Assets, End of Period (000’s) | $ | 325 | $ | 591 | $ | 584 | $ | 1,009 | $ | 1,279 | $ | 984 | |||||||||||||
| Ratios and Supplemental Data: | |||||||||||||||||||||||||
| Ratios of expenses to average net assets: (e) | |||||||||||||||||||||||||
Gross | 1.76 | % | 1.81 | % | 3.19 | % | 2.23 | % | 1.25 | % | 1.16 | % | |||||||||||||
Net including dividend and interest expense for securities sold short | 1.76 | % | 1.81 | % | 3.19 | % | 2.17 | % | 1.22 | % | 1.11 | % | |||||||||||||
Net excluding dividend and interest expense for securities sold short | 1.68 | % | 1.63 | % | 2.46 | % | 1.95 | % | 1.20 | % | — | ||||||||||||||
| Ratio of net investment income (loss) to average net assets (c) | 0.88 | % | 0.75 | % | (0.86 | )% | (0.56 | )% | 0.35 | % | 0.71 | % | |||||||||||||
| Portfolio Turnover Excluding Short Positions (f) | 110 | % | 191 | % | 207 | % | 171 | % | 83 | % | 105 | % | |||||||||||||
Note: This Fund changed its investment strategy on November 1, 2006 from Growth & Income to Long/Short. |
(a) Per share numbers have been calculated using the average shares method. |
(b) Reflects expense waivers/reimbursements and reductions in effect during the period. See Note 3 to the Financial Statements. |
(c) Net investment income (loss) per share and the ratio of net investment income (loss) to average net assets reflect net investment income prior to certain reclassifications for federal income or excise taxes. |
(d) Total Return does not include the deferred sales charge of 1% for the Ordinary Shares. The total return would have been lower if certain fees had not been waived or if custodial fees had not been reduced by credits allowed by the custodian. See Note 3 to the financial statements. |
(e) Ratios of expenses to average net assets: |
| — Gross (total expenses before fee waivers, reimbursements by the investment advisor, and custody earnings credits, if any). |
| — Net (total expenses net fee waivers, reimbursements by the investment advisor, and custody earnings credits, if any). |
(f) Portfolio turnover is calculated on long security positions only. Short positions are generally held for less than one year. |
The accompanying notes are an integral part of these financial statements.
QUANT EMERGING MARKETS FUND
FINANCIAL HIGHLIGHTS (continued)
(For a share outstanding throughout each period)
| Ordinary Shares | ||||||||||||||||||||||||
For the six months ended September 30, | Years Ended March 31, | |||||||||||||||||||||||
| 2010 | 2010 | 2009 | 2008 | 2007 | 2006 | |||||||||||||||||||
| (unaudited) | ||||||||||||||||||||||||
| Net Asset Value, Beginning of Period | $ | 21.23 | $ | 12.06 | $ | 27.04 | $ | 23.34 | $ | 19.85 | $ | 14.23 | ||||||||||||
| Income from Investment Operations: | ||||||||||||||||||||||||
Net investment income (loss) (a)(b)(c) | 0.27 | 0.18 | 0.33 | 0.26 | 0.16 | 0.21 | ||||||||||||||||||
Net realized and unrealized gain/(loss) on securities | 1.42 | 9.05 | (14.76 | ) | 4.42 | 4.02 | 6.28 | |||||||||||||||||
| Total from Investment Operations | 1.69 | 9.23 | (14.43 | ) | 4.68 | 4.18 | 6.49 | |||||||||||||||||
| Less Distributions: | ||||||||||||||||||||||||
Dividends from net investment income | — | (0.06 | ) | (0.43 | ) | (0.16 | ) | (0.22 | ) | (0.22 | ) | |||||||||||||
Distributions from realized capital gains | — | — | (0.12 | ) | (0.82 | ) | (0.47 | ) | (0.65 | ) | ||||||||||||||
| Total Distributions | — | (0.06 | ) | (0.55 | ) | (0.98 | ) | (0.69 | ) | (0.87 | ) | |||||||||||||
| Net Asset Value, End of Period | $ | 22.92 | $ | 21.23 | $ | 12.06 | $ | 27.04 | $ | 23.34 | $ | 19.85 | ||||||||||||
| Total Return (d) | 7.96 | % | 76.56 | % | (53.27 | )% | 19.35 | % | 21.36 | % | 46.77 | % | ||||||||||||
| Net Assets, End of Period (000’s) | $ | 222,540 | $ | 205,727 | $ | 164,133 | $ | 491,462 | $ | 276,698 | $ | 144,088 | ||||||||||||
| Ratios and Supplemental Data: | ||||||||||||||||||||||||
| Ratios of expenses to average net assets: (e) | ||||||||||||||||||||||||
Gross | 1.73 | % | 1.74 | % | 1.67 | % | 1.60 | % | 1.67 | % | 1.83 | % | ||||||||||||
Net | 1.73 | % | 1.74 | % | 1.67 | % | 1.60 | % | 1.67 | % | 1.83 | % | ||||||||||||
| Ratio of net investment income (loss) to average net assets (c) | 2.63 | % | 0.99 | % | 1.66 | % | 0.91 | % | 0.77 | % | 1.23 | % | ||||||||||||
| Portfolio Turnover | 40 | % | 120 | % | 67 | % | 18 | % | 24 | % | 34 | % | ||||||||||||
The accompanying notes are an integral part of these financial statements.
QUANT EMERGING MARKETS FUND
FINANCIAL HIGHLIGHTS (continued)
(For a share outstanding throughout each period)
| Institutional Shares | ||||||||||||||||||||||||
For the six months ended September 30, | Years Ending March 31, | |||||||||||||||||||||||
| 2010 | 2010 | 2009 | 2008 | 2007 | 2006 | |||||||||||||||||||
| (unaudited) | ||||||||||||||||||||||||
| Net Asset Value, Beginning of Period | $ | 21.48 | $ | 12.19 | $ | 27.46 | $ | 23.67 | $ | 20.11 | $ | 14.39 | ||||||||||||
| Income from Investment Operations: | ||||||||||||||||||||||||
Net investment income (loss) (a)(b)(c) | 0.30 | 0.27 | 0.34 | 0.33 | 0.21 | 0.29 | ||||||||||||||||||
Net realized and unrealized gain/(loss) on securities | 1.44 | 9.11 | (14.98 | ) | 4.50 | 4.08 | 6.35 | |||||||||||||||||
| Total from Investment Operations | 1.74 | 9.38 | (14.64 | ) | 4.83 | 4.29 | 6.64 | |||||||||||||||||
| Less Distributions: | ||||||||||||||||||||||||
Dividends from net investment income | — | (0.09 | ) | (0.51 | ) | (0.22 | ) | (0.26 | ) | (0.27 | ) | |||||||||||||
Distributions from realized capital gains | — | — | (0.12 | ) | (0.82 | ) | (0.47 | ) | (0.65 | ) | ||||||||||||||
| Total Distributions | — | (0.09 | ) | (0.63 | ) | (1.04 | ) | (0.73 | ) | (0.92 | ) | |||||||||||||
| Net Asset Value, End of Period | $ | 23.22 | $ | 21.48 | $ | 12.19 | $ | 27.46 | $ | 23.67 | $ | 20.11 | ||||||||||||
| Total Return (d) | 8.10 | % | 77.02 | % | (53.17 | )% | 19.67 | % | 21.68 | % | 47.39 | % | ||||||||||||
| Net Assets, End of Period (000’s) | $ | 30,179 | $ | 26,247 | $ | 25,664 | $ | 40,501 | $ | 12,759 | $ | 1,707 | ||||||||||||
| Ratios and Supplemental Data: | ||||||||||||||||||||||||
| Ratios of expenses to average net assets: (e) | ||||||||||||||||||||||||
Gross | 1.48 | % | 1.50 | % | 1.48 | % | 1.39 | % | 1.41 | % | 1.45 | % | ||||||||||||
Net | 1.48 | % | 1.50 | % | 1.48 | % | 1.39 | % | 1.41 | % | 1.45 | % | ||||||||||||
| Ratio of net investment income (loss) to average net assets (c) | 2.85 | % | 1.48 | % | 1.82 | % | 1.12 | % | 1.02 | % | 1.75 | % | ||||||||||||
| Portfolio Turnover | 40 | % | 120 | % | 67 | % | 18 | % | 24 | % | 34 | % | ||||||||||||
(a) Per share numbers have been calculated using the average shares method. |
(b) Reflects expense waivers/reimbursements and reductions in effect during the period. See Note 3 to the Financial Statements. |
(c) Net investment income (loss) per share and the ratio of net investment income (loss) to average net assets reflect net investment income prior to certain reclassifications for federal income or excise taxes. |
(d) Total Return does not include the deferred sales charge of 1% for the Ordinary Shares. The total return would have been lower if certain fees had not been waived or if custodial fees had not been reduced by credits allowed by the custodian. See Note 3 to the financial statements. |
(e) Ratios of expenses to average net assets: |
| — Gross (total expenses before fee waivers, reimbursements by the investment advisor, and custody earnings credits, if any). |
| — Net (total expenses net of fee waivers, reimbursements by the investment advisor, and custody earnings credits, if any). |
The accompanying notes are an integral part of these financial statements.
QUANT FOREIGN VALUE FUND
FINANCIAL HIGHLIGHTS (continued)
(For a share outstanding throughout each period)
| Ordinary Shares | |||||||||||||||||||||||||
For the six months ended September 30, | Years Ended March 31, | ||||||||||||||||||||||||
| 2010 | 2010 | 2009 | 2008 | 2007 | 2006 | ||||||||||||||||||||
| (unaudited) | |||||||||||||||||||||||||
| Net Asset Value, Beginning of Period | $ | 12.45 | $ | 6.97 | $ | 19.87 | $ | 23.07 | $ | 19.91 | $ | 15.92 | |||||||||||||
| Income from Investment Operations: | |||||||||||||||||||||||||
Net investment income (loss) (a)(b)(c) | 0.04 | 0.13 | 0.35 | 0.19 | 0.18 | 0.24 | (f) | ||||||||||||||||||
Net realized and unrealized gain/(loss) on securities | 0.39 | 5.71 | (11.53 | ) | (2.11 | ) | 4.12 | 3.96 | |||||||||||||||||
| Total from Investment Operations | 0.43 | 5.84 | (11.18 | ) | (1.92 | ) | 4.30 | 4.20 | |||||||||||||||||
| Less Distributions: | |||||||||||||||||||||||||
Dividends from net investment income | — | (0.36 | ) | (0.11 | ) | (0.19 | ) | (0.07 | ) | (0.13 | ) | ||||||||||||||
Distributions from realized capital gains | — | — | (1.61 | ) | (1.09 | ) | (1.07 | ) | (0.08 | ) | |||||||||||||||
| Total Distributions | — | (0.36 | ) | (1.72 | ) | (1.28 | ) | (1.14 | ) | (0.21 | ) | ||||||||||||||
| Net Asset Value, End of Period | $ | 12.88 | $ | 12.45 | $ | 6.97 | $ | 19.87 | $ | 23.07 | $ | 19.91 | |||||||||||||
| Total Return (d) | 3.45 | % | 84.05 | % | (55.95 | )% | (8.71 | )% | 22.08 | % | 26.59 | % | |||||||||||||
| Net Assets, End of Period (000’s) | $ | 330,396 | $ | 369,626 | $ | 193,798 | $ | 781,136 | $ | 778,104 | $ | 441,614 | |||||||||||||
| Ratios and Supplemental Data: | |||||||||||||||||||||||||
| Ratios of expenses to average net assets: (e) | |||||||||||||||||||||||||
Gross | 1.61 | % | 1.62 | % | 1.62 | % | 1.56 | % | 1.60 | % | 1.69 | % | |||||||||||||
Net | 1.61 | % | 1.62 | % | 1.62 | % | 1.56 | % | 1.60 | % | 1.69 | % | |||||||||||||
| Ratio of net investment income (loss) to average net assets (c) | 0.71 | % | 1.17 | % | 2.49 | % | 0.83 | % | 0.88 | % | 1.41 | %(f) | |||||||||||||
| Portfolio Turnover | 4 | % | 24 | % | 20 | % | 44 | % | 19 | % | 29 | % | |||||||||||||
The accompanying notes are an integral part of these financial statements.
QUANT FOREIGN VALUE FUND
FINANCIAL HIGHLIGHTS (continued)
(For a share outstanding throughout each period)
| Institutional Shares | |||||||||||||||||||||||||
For the six months ended September 30, | Years Ending March 31, | ||||||||||||||||||||||||
| 2010 | 2010 | 2009 | 2008 | 2007 | 2006 | ||||||||||||||||||||
| (unaudited) | |||||||||||||||||||||||||
| Net Asset Value, Beginning of Period | $ | 12.45 | $ | 6.98 | $ | 19.98 | $ | 23.19 | $ | 20.01 | $ | 15.98 | |||||||||||||
| Income from Investment Operations: | |||||||||||||||||||||||||
Net investment income (loss) (a)(b)(c) | 0.05 | 0.14 | 0.38 | 0.26 | 0.25 | 0.29 | (g) | ||||||||||||||||||
Net realized and unrealized gain/(loss) on securities | 0.39 | 5.71 | (11.60 | ) | (2.13 | ) | 4.12 | 3.98 | |||||||||||||||||
| Total from Investment Operations | 0.44 | 5.85 | (11.22 | ) | (1.87 | ) | 4.37 | 4.27 | |||||||||||||||||
| Less Distributions: | |||||||||||||||||||||||||
Dividends from net investment income | — | (0.38 | ) | (0.17 | ) | (0.25 | ) | (0.12 | ) | (0.16 | ) | ||||||||||||||
Distributions from realized capital gains | — | — | (1.61 | ) | (1.09 | ) | (1.07 | ) | (0.08 | ) | |||||||||||||||
| Total Distributions | — | (0.38 | ) | (1.78 | ) | (1.34 | ) | (1.19 | ) | (0.24 | ) | ||||||||||||||
| Net Asset Value, End of Period | $ | 12.89 | $ | 12.45 | $ | 6.98 | $ | 19.98 | $ | 23.19 | $ | 20.01 | |||||||||||||
| Total Return (d) | 3.53 | % | 84.12 | % | (55.85 | )% | (8.49 | )% | 22.37 | % | 26.96 | % | |||||||||||||
| Net Assets, End of Period (000’s) | $ | 70,357 | $ | 68,067 | $ | 47,090 | $ | 140,999 | $ | 115,200 | $ | 30,972 | |||||||||||||
| Ratios and Supplemental Data: | |||||||||||||||||||||||||
| Ratios of expenses to average net assets: (e) | |||||||||||||||||||||||||
Gross | 1.36 | % | 1.37 | % | 1.38 | % | 1.32 | % | 1.35 | % | 1.45 | % | |||||||||||||
Net | 1.36 | % | 1.37 | % | 1.38 | % | 1.32 | % | 1.35 | % | 1.45 | % | |||||||||||||
Ratio of net investment income (loss) to average net assets (c) | 0.92 | % | 1.29 | % | 2.77 | % | 1.18 | % | 1.13 | % | 1.70 | %(g) | |||||||||||||
| Portfolio Turnover | 4 | % | 24 | % | 20 | % | 44 | % | 19 | % | 29 | % | |||||||||||||
(a) Per share numbers have been calculated using the average shares method. |
(b) Reflects expense waivers/reimbursements and reductions in effect during the period. See Note 3 to the Financial Statements. |
(c) Net investment income (loss) per share and the ratio of net investment income (loss) to average net assets reflect net investment income prior to certain reclassifications for federal income or excise taxes. |
(d) Total Return does not include the deferred sales charge of 1% for the Ordinary Shares. The total return would have been lower if certain fees had not been waived or if custodial fees had not been reduced by credits allowed by the custodian. See Note 3 to the financial statements. |
(e) Ratios of expenses to average net assets: |
| — Gross (total expenses before fee waivers, reimbursements by the investment advisor, and custody earnings credits, if any). |
| — Net (total expenses net of fee waivers, reimbursements by the investment advisor, and custody earnings credits, if any). |
(f) Includes non-recurring income of $277,072. |
(g) Includes non-recurring income of $22,928. |
The accompanying notes are an integral part of these financial statements.
QUANT FOREIGN VALUE SMALL CAP FUND
FINANCIAL HIGHLIGHTS (continued)
(For a share outstanding throughout each period)
| Ordinary Shares | ||||||||||||
For the six months ended September 30, | Period Ending March 31, | |||||||||||
| 2010 | 2010 | 2009 | ||||||||||
| (unaudited) | ||||||||||||
| Net Asset Value, Beginning of Period | $ | 10.28 | $ | 4.82 | $ | 10.00 | ||||||
| Income from Investment Operations: | ||||||||||||
Net investment income (loss) (a)(b)(c) | 0.08 | 0.07 | 0.03 | |||||||||
Net realized and unrealized gain/(loss) on securities | 0.55 | 5.42 | (5.15 | ) | ||||||||
| Total from Investment Operations | 0.63 | 5.49 | (5.12 | ) | ||||||||
| Less Distributions: | ||||||||||||
Dividends from net investment income | — | (0.03 | ) | (0.04 | ) | |||||||
Distributions from realized capital gains | — | — | (0.02 | ) | ||||||||
| Total Distributions | — | (0.03 | ) | (0.06 | ) | |||||||
| Net Asset Value, End of Period* | $ | 10.89 | $ | 10.28 | $ | 4.82 | ||||||
| Total Return (d) | 5.93 | % | 114.00 | % | (51.25 | )% | ||||||
| Net Assets, End of Period (000’s) | $ | 91,718 | $ | 124,971 | $ | 18,978 | ||||||
| Ratios and Supplemental Data: | ||||||||||||
| Ratios of expenses to average net assets: (e) | ||||||||||||
Gross | 1.70 | % | 1.64 | % | 2.00 | %** | ||||||
Net | 1.70 | % | 1.64 | % | 1.97 | %** | ||||||
| Ratio of net investment income (loss) to average net assets (c) | 1.71 | % | 0.82 | % | 0.66 | %** | ||||||
| Portfolio Turnover | 23 | % | 14 | % | 10 | % | ||||||
The accompanying notes are an integral part of these financial statements.
QUANT FOREIGN VALUE SMALL CAP FUND
FINANCIAL HIGHLIGHTS (continued)
(For a share outstanding throughout each period)
| Institutional Shares | ||||||||||||
For the six months ended September 30, | Period Ending March 31, | |||||||||||
| 2010 | 2010 | 2009 | ||||||||||
| (unaudited) | ||||||||||||
| Net Asset Value, Beginning of Period | $ | 10.30 | $ | 4.82 | $ | 10.00 | ||||||
| Income from Investment Operations: | ||||||||||||
Net investment income (loss) (a)(b)(c) | 0.09 | 0.11 | 0.07 | |||||||||
Net realized and unrealized gain/(loss) on securities | 0.44 | 5.41 | (5.19 | ) | ||||||||
| Total from Investment Operations | 0.53 | 5.52 | (5.12 | ) | ||||||||
| Less Distributions: | ||||||||||||
Dividends from net investment income | — | (0.04 | ) | (0.04 | ) | |||||||
Distributions from realized capital gains | — | — | (0.02 | ) | ||||||||
| Total Distributions | — | (0.04 | ) | (0.06 | ) | |||||||
| Net Asset Value, End of Period* | $ | 10.92 | $ | 10.30 | $ | 4.82 | ||||||
| Total Return (d) | 6.02 | % | 114.55 | % | (51.20 | )% | ||||||
| Net Assets, End of Period (000’s) | $ | 9,129 | $ | 8,103 | $ | 3,592 | ||||||
| Ratios and Supplemental Data: | ||||||||||||
| Ratios of expenses to average net assets: (e) | ||||||||||||
Gross | 1.48 | % | 1.43 | % | 1.88 | %** | ||||||
Net | 1.48 | % | 1.43 | % | 1.85 | %** | ||||||
| Ratio of net investment income (loss) to average net assets (c) | 1.80 | % | 1.27 | % | 1.10 | %** | ||||||
| Portfolio Turnover | 23 | % | 14 | % | 10 | % | ||||||
* Fund commenced operations May 1, 2008. |
** Annualized. |
(a) Per share numbers have been calculated using the average shares method. |
(b) Reflects expense waivers/reimbursements and reductions in effect during the period. See Note 3 to the Financial Statements. |
(c) Net investment income (loss) per share and the ratio of net investment income (loss) to average net assets reflect net investment income prior to certain reclassifications for federal income or excise taxes. |
(d) Total Return does not include the deferred sales charge of 1% for the Ordinary Shares. The total return would have been lower if certain fees had not been waived or if custodial fees had not been reduced by credits allowed by the custodian. See Note 3 to the financial statements. |
(e) Ratios of expenses to average net assets: |
| — Gross (total expenses before fee waivers, reimbursements by the investment advisor, and custody earnings credits, if any). |
| — Net (total expenses net of fee waivers, reimbursements by the investment advisor, and custody earnings credits, if any). |
The accompanying notes are an integral part of these financial statements.
QUANT FUNDS
NOTES TO FINANCIAL STATEMENTS
September 30, 2010 (unaudited)
1. Organization of the Trust
The Quantitative Group of Funds d/b/a “Quant Funds” (the “Trust”) is organized as a Massachusetts business trust and is registered under the Investment Company Act of 1940, as amended, as a non-diversified, open-end management investment company. The Trust currently has five series (each a “Fund” and collectively the “Funds”) each with a distinct investment objective.
Quant Small Cap Fund (“Small Cap”) seeks maximum long-term capital appreciation.
Quant Long/Short Fund (“Long/Short”) seeks long-term growth of capital. Prior to November 1, 2006, Quant Long/Short Fund used a long only investment strategy and its investment objective was long-term growth of capital and income.
Quant Emerging Markets Fund (“Emerging Markets”) seeks long-term growth of capital.
Quant Foreign Value Fund (“Foreign Value”) seeks long-term capital growth and income.
Quant Foreign Value Small Cap Fund (“Foreign Value Small Cap”) seeks long-term capital growth and income.
Each Fund offers two classes of shares designated as Ordinary Shares and Institutional Shares. The classes differ principally in their respective expense structure and minimum investment requirements. Each class of shares represents an interest in the same portfolio of investments of the respective Fund and has equal rights to voting, redemptions, dividends and liquidation, except that each class bears its own transfer agent fees and only Ordinary Shares bear distribution (Rule 12b-1) fees and have exclusive voting rights with respect to the distribution plan that has been adopted by Ordinary Share shareholders. There is no distribution plan for Institutional Shares.
At times, a Fund’s investments may represent industries or industry sectors that are interrelated or have common risks, making it more susceptible to any economic, political, or regulatory developments or other risks affecting those industries and sectors. To the extent that a Fund is permitted to invest in foreign markets, emerging markets or countries with limited or developing markets such investments may subject the Fund to a greater degree of risk than in the U.S. market or a developed market. Risks associated with these foreign and developing markets include political, social or economic factors and may affect the price of a Fund’s investments and income generated by these investments, as well as a Fund’s ability to repatriate such amounts. Information regarding each Fund’s principal risks is contained in the Fund’s prospectus. Please refer to those documents when considering a Fund’s risks.
2. Significant Accounting Policies
Each Fund’s financial statements have been prepared in conformity with U.S. generally accepted accounting principles, that require the management of the Funds to, among other things, make estimates and assumptions that affect the reported amounts of assets and liabilities, the disclosure of contingent assets and liabilities at the date of the financial statements, and the reported amounts of income, expenses and gains and losses on investments during the reporting year. Actual results could differ from those estimates.
The following is a summary of significant accounting policies followed by each Fund in the preparation of its financial statements, which are consistent with those policies generally accepted in the investment company industry.
Security Valuation
Portfolio securities are valued each business day at the last reported sale price on the principal exchange or market on which they are traded. If there is no such reported sale, the securities generally are valued at the mean between the last reported bid and asked prices. For certain securities, where no such sales have been reported, a Fund may value such securities at the last reported bid price. In the event that there is information suggesting that valuation of such securities based upon bid and/or asked prices may not be accurate, a Fund may value such securities in good faith at fair value in accordance with procedures (the “Valuation Procedures”) established by the Funds’ Board of Trustees (the “Trustees”), which may include a determination to value such securities at the last reported sales price. S hort-term investments that mature in 60 days or less are valued at amortized cost. Securities quoted in foreign currencies are translated into U.S. dollars based upon the prevailing exchange rate on each business day. Other assets and securities for which no quotations are readily available are valued at fair value as determined in good faith using the Valuation Procedures. As a result, changes in the value of those currencies in relation to the U.S. dollar may affect a Fund’s NAV. Because foreign markets may be open at different times than the New York Stock Exchange, the value of a Fund’s shares may change on days when shareholders are not able to buy or sell them. If events materially affecting the values of a Fund’s foreign investments occur between the close of foreign markets and the close of regular trading on the New York Stock Exchange, these investments may be valued at their fair value as determined in good faith using the Valuation Procedures.
The Fund has adopted fair valuation accounting standards that establish an authoritative definition of fair value and set out a hierarchy for measuring fair value. These standards require additional disclosures about the various inputs used to develop the measurements of fair value. These inputs are summarized in the three broad levels listed below:
| • | Level 1 — Unadjusted quoted prices in active markets for identical assets or liabilities that the Fund has the ability to access. |
| • | Level 2 — Observable inputs other than quoted prices included in level 1 that are observable for the asset or liability, either directly or indirectly. These inputs may include quoted prices for the identical instrument on an inactive market, prices for similar instruments, interest rates, prepayment speeds, credit risk, yield curves, default rates and similar data. |
| • | Level 3 — Unobservable inputs for the asset or liability, to the extent relevant observable inputs are not available, representing the Fund’s own assumptions about the assumptions a market participant would use in valuing the asset liability, and would be based on the best information available. |
The availability of observable inputs can vary from security to security and is affected by a wide variety of factors, including for example, the type of security, whether the security is new and not yet established in the marketplace, the liquidity of the markets, and other characteristics particular to the security. To the extent that valuation is based on models or inputs that are less observable or unobservable in the market, the determination of fair value requires more judgment. Accordingly, the degree of judgment exercised in determining fair value is greatest for instruments categorized in Level 3.
The inputs used to measure fair value may fall into different levels of fair value hierarchy. In such cases, for disclosure purposes, the level in the fair value hierarchy within which the fair value measurement falls in its entirety, is determined based on the lowest level input that is significant to the fair value measurement in its entirety.
Changes in valuation techniques may result in transfers in changing an investment’s assigned level within the hierarchy.
The inputs or methodology used for valuing securities are not necessarily an indication of the risk associated with investing in these securities. The following is a summary of the inputs used to value the Fund’s net assets as of September 30, 2010:
Quoted Prices In Active Markets | Significant Other Observable Inputs | Carrying Value at September 30, 2010 | Future Contracts Assets or Liabilities* | |||||||||||||
| Level 1 | Level 2 | Total | Level 1 | |||||||||||||
| Small Cap | ||||||||||||||||
Common Stocks** | $ | 81,076,025 | $ | — | $ | 81,076,025 | $ | — | ||||||||
Depository Receipts | 2,500,353 | — | 2,500,353 | — | ||||||||||||
Limited Partnership Units | 28,356 | — | 28,356 | — | ||||||||||||
Real Estate Inv. Trusts | 12,987,559 | — | 12,987,559 | — | ||||||||||||
Shares of Beneficial Interest | 60,959 | — | 60,959 | — | ||||||||||||
Short Term Investments | — | 8,074,707 | — | — | ||||||||||||
| Total | $ | 96,653,252 | $ | 8,074,707 | $ | 104,727,959 | $ | — | ||||||||
| Long/Short | ||||||||||||||||
Common Stock** | $ | 60,577,194 | $ | — | $ | 60,577,194 | $ | — | ||||||||
Real Estate Inv. Trusts | 1,452,123 | — | 1,452,123 | — | ||||||||||||
Short Term Investments | — | 22,479,921 | 22,479,921 | — | ||||||||||||
Futures | — | — | — | 1,890 | ||||||||||||
Total Assets | $ | 62,029,317 | $ | 22,479,921 | $ | 84,509,238 | $ | 1,890 | ||||||||
Liabilities in Securities Sold Short— | ||||||||||||||||
Common Stock** | $ | (14,324,908 | ) | $ | — | $ | (14,324,908 | ) | $ | — | ||||||
Real Estate Inv. Trusts | (163,281 | ) | — | (163,281 | ) | — | ||||||||||
Total Liabilities | $ | (14,488,189 | ) | $ | — | $ | (14,488,189 | ) | $ | — | ||||||
| Emerging Markets | ||||||||||||||||
Common Stocks** | $ | 200,368,756 | $ | — | $ | 200,368,756 | $ | — | ||||||||
Depository Receipts | 29,244,599 | — | 29,244,599 | — | ||||||||||||
Mutual Funds | 5,069,228 | — | 5,069,228 | — | ||||||||||||
Preferred Stock | 17,020,874 | — | 17,020,874 | — | ||||||||||||
Real Estate Inv. Trusts | 375,570 | — | 375,570 | — | ||||||||||||
Short Term Investments | — | 21,625,949 | 21,625,949 | — | ||||||||||||
| Total | $ | 252,079,027 | $ | 21,625,949 | $ | 273,704,976 | $ | — | ||||||||
| Foreign Value | ||||||||||||||||
Common Stock** | $ | 353,097,930 | $ | 11,687,384 | $ | 364,785,314 | $ | — | ||||||||
Depository Receipts | 14,899,193 | — | 14,899,193 | — | ||||||||||||
Short Term Investments | — | 21,652,300 | 21,652,300 | — | ||||||||||||
| Total | $ | 367,997,123 | $ | 33,339,684 | $ | 401,336,807 | $ | — | ||||||||
| Foreign Value Small Cap | ||||||||||||||||
Common Stock** | $ | 81,214,283 | $ | 2,702,814 | $ | 83,917,097 | $ | — | ||||||||
Depository Receipts | 997,651 | — | 997,651 | — | ||||||||||||
Preferred Stock | 1,904,693 | — | 1,904,693 | — | ||||||||||||
Short Term Investments | — | 7,550,693 | 7,550,693 | — | ||||||||||||
Rights | 10,091 | — | 10,091 | — | ||||||||||||
Warrants | — | 8,410,186 | 8,410,186 | — | ||||||||||||
| Total | $ | 84,126,718 | $ | 18,663,693 | $ | 102,790,411 | $ | — | ||||||||
Following is a reconciliation of Level 3 assets for which significant unobservable inputs were used to determine fair value.
| Common Stock | ||||
| Emerging Markets | ||||
| Balance as of 3/31/2010 | $ | 121,408 | ||
Realized gain (loss) | $ | — | ||
Changed in unrealized appreciation (depreciation) | $ | — | ||
Net purchases (sales) | $ | — | ||
Transfer in and/or out of Level 3 | $ | (121,408 | ) | |
| Balances as of 09/30/2010 | $ | — | ||
| * | Represents variation margin on the last day of the reporting period. |
** Refer to Schedule of Investments for breakout by type.
At September 30, 2010, the number of open futures contracts in the Long/Short Fund is nine. Only current day’s variation margin is reported as an asset or liability within the statement of assets and liabilities.
The realized gains or losses and change in unrealized gains or losses on future contracts are reflected in the appropriate financial statements.
The effect of derivative instruments on the Statement of Operations for the six months ended September 30, 2010.
| Derivatives Not Accounted for as Hedging Instruments | Realized Gain (Loss) On Futures Recognized in Income | Changes in Unrealized Appreciation (Depreciation) on Futures Recognized in Income | ||||||
| Long/Short | $ | 62,885 | $ | 9,494 | ||||
Security Transactions and Related Investment Income
Security transactions are accounted for on the trade date (the date the order to buy or sell is executed). Dividend income, less foreign taxes withheld, is recorded on the ex-dividend date, except that certain dividends from foreign securities where the ex-dividend date may have passed are recorded as soon as a Fund becomes aware of the ex-dividend data in the exercise of reasonable diligence. Distributions received on securities that represent a return of capital or a capital gain are recorded as a reduction of cost of investments and/or as a realized gain. Each Fund estimates the components of distributions that may be considered nontaxable distributions or capital gain distributions for tax purposes. Interest income is recorded on the accrual basis and includes accretion of discounts and amortization of premiums. In determining the net gain or loss on securities sold, the cost of securities is determined on the identified cost basis. Each Fund’s investment income and realized and unrealized gains and losses are allocated among classes based upon the daily relative net assets.
Repurchase Agreements
The Funds’ custodian takes possession through the federal book-entry system of securities collateralizing repurchase agreements. Collateral is marked-to-market daily to ensure that the market value of the underlying assets remains sufficient to protect the Funds. The Funds may experience costs and delays in liquidating the collateral if the issuer defaults or enters into bankruptcy.
Foreign Currency Transactions
All monetary items denominated in foreign currencies are translated into U.S. dollars based on the prevailing exchange rate at the close of each business day. Income and expenses denominated in foreign currencies are translated at the prevailing rates of exchange when accrued or incurred.
Reported net realized gains and losses on foreign currency transactions represent net gains and losses from currency gains and losses realized between the trade and settlement dates on investment transactions, and the difference between the amount of net investment income accrued and the U.S. dollar amount actually received. The effects of changes in foreign currency exchange rates on investments in securities are not segregated in the Statement of Operations from the effects of changes in market prices of those securities, but are included with the net realized and unrealized gain or loss on investments.
Forward Foreign Currency Contracts
The Funds may enter into forward foreign currency contracts to manage their exposure to fluctuations in certain foreign currencies. A forward currency contract is a commitment to purchase or sell a foreign currency at a future date at a set price. The forward currency contracts are valued at the forward rate and are marked-to-market daily. The change in market value is recorded by the Fund as an unrealized gain or loss. When the contract is closed, the Fund records a realized gain or loss equal to the difference between the value of the contract at the time it was opened and the value at the time it was closed. In addition to the risks of financial investments mentioned above, risks arise from unanticipated movements in currency values.
Spot Foreign Currency Contracts at 09/30/10:
Emerging Markets Fund
| Currency to deliver | Local Value | In exchange for | Settlement Date | Unrealized appreciation (depreciation) | ||||||||||
| Hong Kong Dollar | 789,415 | USD | 101,735 | 10/04/10 | $ | 13 | ||||||||
| Hungarian Forint | 19,471,025 | USD | 95,519 | 10/01/10 | (157 | ) | ||||||||
| Singapore Dollar | 474,094 | USD | 359,733 | 10/01/10 | (412 | ) | ||||||||
| South African Rand | 569,016 | USD | 81,503 | 10/04/10 | 215 | |||||||||
| United States Dollar | 5,516,860 | BRL | 9,325,700 | 10/01/10 | (22,104 | ) | ||||||||
| United States Dollar | 112,589 | BRL | 190,320 | 10/01/10 | (451 | ) | ||||||||
| United States Dollar | 289,892 | IDR | 2,590,765,755 | 10/01/10 | 390 | |||||||||
| United States Dollar | 411,302 | IDR | 3,675,807,185 | 10/01/10 | 553 | |||||||||
| United States Dollar | 897,826 | MYR | 2,766,651 | 10/01/10 | (1,599 | ) | ||||||||
| United States Dollar | 761,014 | MXN | 9,540,990 | 10/01/10 | (5,508 | ) | ||||||||
| United States Dollar | 988,393 | ZAR | 6,880,940 | 10/05/10 | (5,401 | ) | ||||||||
| United States Dollar | 149,625 | THB | 4,541,107 | 10/01/10 | — | |||||||||
| United States Dollar | 360,002 | THB | 10,926,069 | 10/01/10 | — | |||||||||
| $ | (34,461 | ) | ||||||||||||
Foreign Value Fund
| Currency to deliver | Local Value | In exchange for | Settlement Date | Unrealized appreciation (depreciation) | ||||||||||
| United States Dollar | 272,889 | NOK | 1,599,130 | 10/01/10 | $ | (1,678 | ) | |||||||
| United States Dollar | 380,325 | NOK | 2,224,523 | 10/04/10 | (3,048 | ) | ||||||||
| United States Dollar | 131,961 | NOK | 775,176 | 10/05/10 | (492 | ) | ||||||||
| $ | (5,218 | ) | ||||||||||||
Foreign Value Small Cap Fund
| Currency to deliver | Local Value | In exchange for | Settlement Date | Unrealized appreciation (depreciation) | ||||||||||
| United States Dollar | 851,927 | NOK | 4,992,292 | 10/01/10 | $ | (5,237 | ) | |||||||
| United States Dollar | 1,187,317 | NOK | 6,944,617 | 10/04/10 | (9,515 | ) | ||||||||
| $ | (14,752 | ) | ||||||||||||
Short Sales
Quant Long/Short Fund may engage in short sales (selling securities it does not own) as part of its normal investment activities. Upon selling a security short, Long/Short Fund’s Custodian will segregate cash, cash equivalents or other appropriate liquid securities in an amount no less than the current market value of the securities sold short and will maintain such collateral until Long/Short Fund replaces the borrowed security. Long/Short Fund is required to pay any dividends or interest due on securities sold short. Such dividends and interest are recorded as an expense. Liabilities for securities sold short are valued daily and recorded as unrealized appreciation (depreciation) on investments and securities sold short. Long/Short Fund records realized gain (loss) on a security sold short when a short position is terminated by Lo ng/Short Fund. Long/Short Fund will incur a loss if the price of a security increases between the date of the short sale and the date on which Long/Short Fund replaces the borrowed security. Long/Short will realize a gain if the price of borrowed security declines between the date of a short sale and the date Long/Short Fund replaces the borrowed security.
Securities Lending
To generate additional income, each the Small Cap Fund, Emerging Markets Fund and Foreign Value Fund use Securities Finance Trust Company (“eSecLending”) as lending agent. The Small Cap Fund, Emerging Markets Fund and Foreign Value Fund may each lend up to 30% of its assets pursuant to certain agreements (“Securities Lending Agreements”) requiring that the loan be continuously secured by cash or with the Funds’ approval, other securities. Securities are loaned by eSecLending to certain pre-approved brokers (“the borrowers”). The borrowers are required to provide cash or U.S. Government securities as collateral against loaned securities in the amount of at least 105% of the market value of borrowings for the Emerging Markets and Foreign Value Funds, and at least 102% of the borrowings for the Small Cap Fund. Collateral is marked-to-market daily. Cash collateral received by the Funds is invested in a registered money market fund.
The Quant Long/Short Fund uses State Street Bank and Trust Company (“State Street”) as lending agent for the Quant Long/Short Fund pursuant to a Securities Lending Authorization Agreement. The Long/Short Fund may lend up to 331/3% of its assets. Securities are loaned by State Street to certain pre-approved borrowers. The initial collateral received shall have (depending on the nature of the loaned securities and the collateral received) a value of at least 102% or 105% of the market value of the loaned securities, or such other value, but not less than 102% of the market value of the loaned securities, as may be applicable in the jurisdiction in which such loaned securities are customarily traded. Collateral of cash and/or securities is marked-to-market daily. Cash collateral is invested in a registered money market fu nd that may be managed by State Street or one of its affiliates.
Risks such as delay in recovery of securities may occur should the borrower of the securities fail financially or should the value of the securities loaned increase above the value of the collateral received. eSecLending provides indemnification insurance via highly rated third party insurers to cover these potential risks. State Street provides indemnification against borrower default.
At September 30, 2010, the following Funds had collateral and loans outstanding of:
| Value of Collateral | Value of Loaned Securities | |||||||
| Quant Small Cap Fund | $ | 1,167,707 | $ | 1,140,243 | ||||
| Long/ Short Fund | 22,280,025 | * | 21,671,332 | |||||
| Quant Emerging Markets Fund | 4,259,949 | 4,063,420 | ||||||
| * | Collateral of 102% is received on behalf of the securities loaned by the Long/Short Fund. A portion of the collateral received, ($7,352,939 for the six months ended September 30, 2010), is held in a registered money market fund and a portion, $14,927,086 was used to release cash collateral held by the short sales agent, State Street, to allow the Fund to purchase securities with such short sale proceeds. |
Expenses and Class Allocations
The majority of the expenses of the Funds are attributed to the individual Fund and Class for which they are incurred. Expenses that are not attributed to a specific Fund are allocated in proportion to the respective net assets of the Funds. Expenses allocable to a Fund are borne pro rata by the holders of both classes of shares of such Fund, except that 12b-1 Plan expenses will not be borne by the holders of Institutional Shares.
Distribution fees on Ordinary Shares are calculated based on the average daily net asset value attributable to the Ordinary Shares of the respective Fund. Institutional Shares are not subject to a distribution plan. Shareholders of each class share all expenses and fees paid to the transfer agent, Quantitative Institutional Services, for its services, which are allocated based on the net assets in each class and the ratable allocation of related out-of-pocket expenses. Income, common expenses and realized and unrealized gains and losses are calculated at the Fund level and allocated daily to each class of shares based on their respective percentage of adjusted net assets at the beginning of the day. (See Note 3)
Distributions to Shareholders
Distributions to shareholders are recorded as of the ex-dividend date. Distributions paid by each Fund with respect to each class of shares are calculated in the same manner, at the same time, and in the same amount, except that Ordinary Shares incur 12b-1 distribution fees while Institutional Shares do not. Distributions from net investment income for each Fund, if any, are declared and paid annually. Distributions from net realized gains for each Fund, if any, are generally declared and paid annually.
3. Management Fee, Advisory Contracts and Other Affiliate Transactions
The Funds have entered into a management agreement (the “Management Agreement”) with Quantitative Investment Advisors, Inc. d/b/a Quantitative Advisors (the “Manager”). Compensation of the Manager, for management and administration of the Funds, including selection and monitoring of the portfolio advisors, is paid monthly based on the average daily net asset value of each Fund for the month. The annual rate of such fees is 1.00% of the average daily total net assets of Small Cap, Long/Short, Emerging Markets, Foreign Value, and Foreign Value Small Cap Funds.
Under the Management Agreement, the Manager has agreed to reduce its compensation, and if necessary, assume expenses, with respect to Small Cap to the extent that the total expenses of this Fund individually exceeds 2% of average net assets for any fiscal year. Fund expenses subject to this limitation are exclusive of brokerage, interest, taxes and extraordinary expenses, which include incremental custody costs associated with international securities. Expenses are calculated gross of custody credits, if applicable.
For the six months ended September 30, 2010 aggregate management fees were $4,306,450.
The Manager has entered into advisory contracts with the following subadvisors (collectively the “Advisors”) to provide investment advisory services to the following Funds: Columbia Partners, L.L.C., Investment Management (Small Cap), Analytic Investors, LLC (Long/Short), PanAgora Asset Management, Inc. (Emerging Markets), and Polaris Capital Management, LLC (Foreign Value and Foreign Value Small Cap.)
For services rendered, the Manager pays to the Advisor of a Fund a fee based on a percentage of the average daily total net assets of the Fund. The fee for each Fund is determined separately. Currently, the fees paid by the Manager to the Advisors of the Funds are as follows:
| Small Cap | 0.47% of average daily total net assets |
| Long/Short | 0.45% of the first $100 million and |
| 0.40% of amounts in excess of $100 million of average daily total net assets; | |
| Emerging Markets | 0.40% of average daily total net assets; |
| Foreign Value | 0.35% of the first $35 million, |
| 0.40% of amounts in excess of $35 million but less than $200 million and | |
| 0.50% of assets in excess of $200 million of average daily total net assets | |
| Foreign Value Small Cap | 0.35% of the first $35 million and |
| 0.40% of amounts in excess of $35 million but less than $200 million and | |
| 0.50% of amounts in excess of $200 million of average daily total net assets. |
The Funds have entered into a distribution agreement (the “Distribution Agreement”) with U.S. Boston Capital Corporation (the “Distributor”). For its services under the Distribution Agreement, the Distributor received a monthly fee at the annual rate of (i) 0.25% of the average daily net asset value of the Ordinary Shares of the Funds.
Holders of Institutional Shares pay no portion of the 12b-1 Plan expenses of the Funds and are not entitled to vote on matters involving the 12b-1 Plan. During the six months ended September 30, 2010 the aggregate distribution fees of the Funds were $943,171.
Transfer agent functions are provided to the Funds by Quantitative Institutional Services, a division of the Manager (the “Transfer Agent”) pursuant to a transfer agent agreement (the “Transfer Agent Agreement”). The Transfer Agent Agreement provides for base fees that are payable to the Transfer Agent at an annual rate of 0.16% of the average daily total net asset value of each class of shares of the Funds and for reimbursement of out of pocket expenses. During the six months ended September 30, 2010, the aggregate fees of the Funds were $715,626.
Pursuant to an Administration Agreement, the Manager provides certain administrative services to the Funds. During the six months ended September 30, 2010, fees paid pursuant to this agreement were $135,409.
The Board of Trustees of the Funds has approved reimbursement to the Manager for certain costs associated with providing regulatory and compliance services to the Funds. For the six months ended September 30, 2010, the Trustees have approved reimbursements that amounted to $94,626.
Custody and fund accounting services are provided by State Street and its affiliates. Custody credits generated by interest earned on un-invested cash balances maintained by the Funds are used to offset custodial expenses of the Funds.
For the six months ended September 30, 2010, each Trustee, including the Trustee who is or may be considered to be affiliated with the Manager, the Distributor and the Transfer Agent, received one-half of the annual Trustee’s fee of $21,000, with the exception of the Chairman of the Audit Committee and the Lead Independent Trustee of the Board. Each of the Chairman of the Audit Committee and the Lead Independent Trustee of the Board was paid one-half of the annual amount of $24,000. The affiliated Trustee, who also is an officer of the Funds, did not receive any other compensation from the Funds.
All officers of the Funds are or may be considered to be affiliated with the Manager, the Distributor and the Transfer Agent. No officer of the Funds, other than the affiliated Trustee, received any compensation from the Funds.
4. Purchases and Sales
During the six months ended September 30, 2010, purchases of investment securities other than U.S. Government obligations and short-term investments, for Small Cap, Long/Short, Emerging Markets, Foreign Value, and Foreign Value Small Cap were $28,054,561, $69,452,264, $92,765,613, $15,727,746 and $22,123,041, respectively. Sales of such securities for the Funds were $34,098,515, $73,576,161, $87,402,084, $57,369,825 and $56,972,114, respectively. Securities sold short are excluded from the Long/Short Fund numbers as they are generally held for less than one year.
5. Contingent Liability
The Trust maintains a joint fidelity bond with the Funds’ Transfer Agent through ICI Mutual Insurance Company (“ICI Mutual”). The annual premium is allocated among the Funds and the Transfer Agent. Additionally, the Funds have committed to ICI Mutual up to 300% of the annual premium, one third of which was provided in cash, with each Fund’s pro rata portion recorded as an asset. The remainder is secured with an irrevocable letter of credit.
6. Concentration of Risk
The relatively large investments of Emerging Markets in countries with limited or developing capital markets may involve greater risks than investments in more developed markets and the prices of such investments may be volatile. The consequences of political, social or economic changes in these markets may have disruptive effects on the market prices of the Fund’s investments and the income they generate, as well as the Fund’s ability to repatriate such amounts.
7. Federal Income Taxes
It is the policy of the Funds to distribute all of their taxable income within the prescribed time and otherwise comply with the provisions of the Internal Revenue Code (“IRC”) applicable to regulated investment companies. Therefore no Federal income tax provision is required.
Certain Funds had capital loss carryovers at March 31, 2010. The accumulated capital losses noted in the table may be available to offset future realized capital gains and thereby reduce future taxable gain distributions. Foreign Value acquired capital loss carryovers for federal income tax purposes of $8,053,584 when the net assets of State Street Research International Equity Fund (SSR), a series of State Street Research Financial Trust (“SSR”), were acquired in a merger which occurred on May 2, 2003 pursuant to a Plan of Reorganization approved by the shareholders of SSR on April 25, 2003. Foreign Value is the surviving fund in the merger for purposes of maintaining the financial statements and performance history in the post-reorganization periods and the acquired capital loss carryovers may be subject to limitations on th eir use under the Internal Revenue Code, as amended, and may therefore expire unutilized. As of March 31, 2010 the capital loss carryovers were as follows:
| Portfolio | Capital Loss Expires March 31, 2011 | Capital Loss Expires March 31, 2016 | Capital Loss Expires March 31, 2017 | Capital Loss Expires March 31, 2018 | Total Capital Loss | |||||||||||||||
| Small Cap Fund | $ | — | $ | — | $ | 12,418,995 | $ | 23,795,469 | $ | 36,214,464 | ||||||||||
| Long/Short Fund | — | — | 2,671,166 | 14,909,223 | 17,580,389 | |||||||||||||||
| Emerging Markets Fund | — | — | 44,819,035 | 31,309,051 | 76,128,086 | |||||||||||||||
| Foreign Value Fund | 932,449 | — | 80,608,820 | 131,156,114 | 212,697,383 | |||||||||||||||
Foreign Value Small Cap Fund | — | — | — | — | — | |||||||||||||||
The primary differences between book and tax appreciation or depreciation of investments consist of wash sale loss deferrals, return of capital distributions by real estate investment trusts (“REITs”), mark to market on passive foreign investment companies (“PFICs”) held and foreign capital gains taxes accrued. The net tax appreciation/(depreciation) in the table below includes unrealized tax gain/(loss) on foreign currency and investments.
At September 30, 2010, the Funds’ aggregate security unrealized gains and losses based on cost for U.S. federal income tax purposes was as follows:
| Portfolio | Tax Cost | Gross Unrealized Gain | Gross Unrealized Loss | Net Unrealized Gain (Loss) | ||||||||||||
| Small Cap | $ | 87,189,237 | $ | 22,032,364 | $ | (3,995,081 | ) | $ | 18,037,283 | |||||||
| Long/Short | 63,891,450 | 3,177,618 | (3,782,800 | ) | (605,182 | ) | ||||||||||
| Emerging Markets | 223,251,817 | 52,810,020 | (5,284,696 | ) | 47,525,324 | |||||||||||
| Foreign Value | 434,867,282 | 63,091,012 | (96,619,138 | ) | (33,528,126 | ) | ||||||||||
| Foreign Value Small Cap | 87,394,550 | 20,997,970 | (4,632,075 | ) | 16,365,895 | |||||||||||
8. Transactions in Shares of Beneficial Interest
Transactions in shares of beneficial interest were as follows:
Six Months Ended September 30, 2010 | Year Ended March 31, 2010 | |||||||||||||||
| Shares | Dollars | Shares | Dollars | |||||||||||||
| Small Cap | ||||||||||||||||
| Ordinary Shares | ||||||||||||||||
| Shares sold | 190,605 | $ | 3,044,080 | 616,767 | $ | 8,505,968 | ||||||||||
| Shares issued in reinvestment of distributions | — | — | 10,752 | 156,762 | ||||||||||||
| Shares redeemed | (498,459 | ) | (8,050,519 | ) | (646,575 | ) | (8,834,143 | ) | ||||||||
| Net Change | (307,854 | ) | (5,006,439 | ) | (19,056 | ) | (171,413 | ) | ||||||||
| Institutional Shares | ||||||||||||||||
| Shares sold | 18,060 | 322,126 | 61,117 | 992,998 | ||||||||||||
| Shares issued in reinvestment of distributions | — | — | 1,312 | 21,550 | ||||||||||||
| Shares redeemed | (49,673 | ) | (913,098 | ) | (309,802 | ) | (4,440,988 | ) | ||||||||
| Redemption fees | — | — | ||||||||||||||
| Net Change | (31,613 | ) | (590,972 | ) | (247,373 | ) | (3,426,440 | ) | ||||||||
| Total Net Change For Fund | $ | (5,597,411 | ) | $ | (3,597,853 | ) | ||||||||||
Six Months Ended September 30, 2010 | Year Ended March 31, 2010 | |||||||||||||||
| Shares | Dollars | Shares | Dollars | |||||||||||||
| Long/Short | ||||||||||||||||
| Ordinary Shares | ||||||||||||||||
| Shares sold | 77,996 | $ | 867,001 | 388,733 | $ | 3,869,231 | ||||||||||
| Shares issued in reinvestment of distributions | — | — | 10,130 | 111,739 | ||||||||||||
| Shares redeemed | (372,433 | ) | (4,161,515 | ) | (848,257 | ) | (8,564,514 | ) | ||||||||
| Net Change | (294,437 | ) | (3,294,514 | ) | (449,394 | ) | (4,583,544 | ) | ||||||||
| Institutional Shares | ||||||||||||||||
| Shares sold | 536 | $ | 5,906 | 4,319 | $ | 41,778 | ||||||||||
| Shares issued in reinvestment of distributions | — | — | 218 | 2,489 | ||||||||||||
| Shares redeemed | (21,330 | ) | (242,465 | ) | (22,871 | ) | (243,283 | ) | ||||||||
| Redemption fees | ||||||||||||||||
| Net Change | (20,794 | ) | (236,559 | ) | (18,334 | ) | (199,016 | ) | ||||||||
| Total Net Change For Fund | $ | (3,531,073 | ) | $ | (4,782,560 | ) | ||||||||||
| Emerging Markets | ||||||||||||||||
| Ordinary Shares | ||||||||||||||||
| Shares sold | 2,944,186 | $ | 64,779,968 | 5,756,404 | $ | 104,705,318 | ||||||||||
| Shares issued in reinvestment of distributions | — | — | 38,441 | 786,122 | ||||||||||||
| Shares redeemed | (2,926,107 | ) | (62,579,730 | ) | (9,715,787 | ) | (180,344,576 | ) | ||||||||
| Net Change | 18,079 | 2,200,238 | (3,920,942 | ) | (74,853,136 | ) | ||||||||||
| Institutional Shares | ||||||||||||||||
| Shares sold | 232,186 | 4,834,099 | 683,681 | 11,800,520 | ||||||||||||
| Shares issued in reinvestment of distributions | — | — | 5,392 | 111,454 | ||||||||||||
| Shares redeemed | (154,531 | ) | (3,243,131 | ) | (1,572,205 | ) | (25,937,228 | ) | ||||||||
| Redemption fees | ||||||||||||||||
| Net Change | 77,655 | 1,590,968 | (883,132 | ) | (14,025,254 | ) | ||||||||||
| Total Net Change For Fund | $ | 3,791,206 | $ | (88,878,390 | ) | |||||||||||
| Foreign Value | ||||||||||||||||
| Ordinary Shares | ||||||||||||||||
| Shares sold | 2,093,491 | $ | 25,654,504 | 13,262,594 | $ | 145,162,678 | ||||||||||
| Shares issued in reinvestment of distributions | — | — | 880,784 | 10,331,432 | ||||||||||||
| Shares redeemed | (6,133,664 | ) | (70,652,129 | ) | (12,236,058 | ) | (141,205,485 | ) | ||||||||
| Net Change | (4,040,173 | ) | (44,997,625 | ) | 1,907,320 | 14,288,625 | ||||||||||
| Institutional Shares | ||||||||||||||||
| Shares sold | 253,471 | 2,930,583 | 599,263 | 6,268,518 | ||||||||||||
| Shares issued in reinvestment of distributions | — | — | 164,913 | 1,932,784 | ||||||||||||
| Shares redeemed | (265,582 | ) | (3,155,128 | ) | (2,036,513 | ) | (22,492,350 | ) | ||||||||
| Redemption fees | ||||||||||||||||
| Net Change | (12,111 | ) | (224,545 | ) | (1,272,337 | ) | (14,291,048 | ) | ||||||||
| Total Net Change For Fund | $ | (45,222,170 | ) | $ | (2,423 | ) | ||||||||||
| Foreign Value Small Cap | ||||||||||||||||
| Ordinary Shares | ||||||||||||||||
| Shares sold | 1,589,816 | $ | 16,097,711 | 8,949,723 | $ | 80,886,500 | ||||||||||
| Shares issued in reinvestment of distributions | — | — | 36,249 | 342,912 | ||||||||||||
| Shares redeemed | (5,327,777 | ) | (53,528,285 | ) | (765,876 | ) | (6,799,738 | ) | ||||||||
| Net Change | (3,737,961 | ) | (37,430,574 | ) | 8,220,096 | 74,429,674 | ||||||||||
| Institutional Shares | ||||||||||||||||
| Shares sold | 53,343 | 551,713 | 121,383 | $ | 920,199 | |||||||||||
| Shares issued in reinvestment of distributions | — | — | 3,073 | 29,098 | ||||||||||||
| Shares redeemed | (4,551 | ) | (46,895 | ) | (82,780 | ) | (463,631 | ) | ||||||||
| Net Change | 48,792 | 504,818 | 41,676 | 485,666 | ||||||||||||
| Total Net Change for Fund | $ | (36,925,756 | ) | $ | 74,915,340 | |||||||||||
QUANT FUNDS
INFORMATION FOR SHAREHOLDERS
Quarterly Portfolio Disclosure
Each Fund files its complete schedule of portfolio holdings with the Securities and Exchange Commission (“SEC”) for the first and third quarters of each fiscal year on Form N-Q. The Funds’ Forms N-Q are available on the SEC’s website at www.sec.gov and may be reviewed and copied at the SEC’s Public Reference Room in Washington, D.C. (Call 1-800-SEC-0330 for more information). For a complete list of a fund’s portfolio holdings, you may also view the most recent monthly holdings report, semi-annual report or annual report on the Quant Funds’ web site at www.quantfunds.com.
Portfolio Proxy Voting Policies and Information
Information on the Funds’ proxy voting policies and on how the Quant Funds voted proxies related to portfolio securities for the 12-month period ended June 30, 2010 is available without charge online at www.quantfunds.com and at www.sec.gov. You may also call 1-800-326-2151 to request a free copy of the proxy voting information or the proxy voting policies.
Household Delivery of Fund Documents
With your consent, the Trust may send a single proxy statement, prospectus and shareholder report to your residence for you and any other member of your household who has an account with the Funds. If you wish to revoke your consent to this practice, you may do so by notifying the Fund’s transfer agent, by phone or in writing (see “For Account Information”). The mailing of separate proxy statements, prospectuses and shareholder reports will begin within 30 days after receiving your notice.
QUANT FUNDS
MANAGEMENT CONTRACT AND ADVISORY
CONTRACT APPROVAL
On May 20, 2010, the Board of the Trust approved the Management Agreement with the Manager and the advisory contracts with each Advisor to the Funds. The following describes the Board’s considerations.
Management Contract with Quantitative Investment Advisors, Inc.
Nature and Quality of Manager’s Advisory Services. The Board reviewed the Managers’ senior management and other personnel. Among other factors, the Board considered the size, education and experience of the Managers’ staff and the Managers’ approach to recruiting, training, compensating and retaining personnel. The Board considered the Managers’ supervision of Sub-Advisers. The Board considered the benefit to shareholders of investing in a fund that is part of a small family of funds using a manager-of-managers approach and providing for a selection of shareholder services, including, the ability of shareholders to exchange or transfer investments within the same class of shares among each of the Funds without incurring additional sales charges.
Nature and Quality of Other Services. The Board considered the nature, quality, cost and extent of administrative and shareholder services performed by the Manager and affiliated companies under the existing Management Agreements and under separate agreements covering administrative services, transfer agency functions and other services. The Board, including the Independent Trustees, has also considered the nature and extent of the Manager’s supervision of third party service providers, principally Fund accountants (pricing, recordkeeping), securities lending agents, custodians and subcustodians.
Fees and Expenses. The Board considered each Fund’s advisory fee, subadvisory fee and expense ratio compared with the management fees, subadvisory fees and expense ratios of the Selected Peer Group. Fees and expenses for each Fund are discussed below under each Fund.
Conclusion. Based on its evaluation of all material factors, the Board, including the Independent Trustees, concluded that the existing advisory fee structure is fair and reasonable, and that the existing Management Agreement should be approved.
Quant Small Cap Fund — (Sub-Adviser — Columbia Partners, LLC Investment Management)
Investment Performance. The Board reviewed the Fund’s investment performance as well as the performance of the Selected Peer Group, and the performance of an appropriate index or combination of indices. The Board noted that the Fund underperformed its Selected Peer Group for each of the one, three, five and ten year periods, but that the Fund outperformed the subsection of the Selected Peer Group comprised of funds managed via a similar adviser/sub-adviser structure (the “Sub-Advised Peer Group”) for the one and ten year periods.
Fees and Expenses. The Board considered the Fund’s management fee, subadvisory fee and expense ratio compared with fees and expense ratios of the Selected Peer Group. The Board noted that the Fund’s management fee and expense ratio are above the average and the median of the funds in its Selected Peer Group. Additionally, the Board noted that the Fund’s contractual management fee is competitive with the assets weighted average of the Sub-Advised Peer Group at all asset levels presented.
Conclusion. Based on its evaluation of all material factors, the Board, including the Independent Trustees, concluded that the advisory fees for the Fund are fair and reasonable, and that the existing Sub-Advisory Agreement with this Sub-Adviser should be approved.
Quant Emerging Markets Fund — (Sub-Adviser — PanAgora Asset Management, Inc.)
Investment Performance. The Board reviewed the Fund’s investment performance as well as the performance of a Selected Peer Group of mutual funds, and the performance of an appropriate index or combination of indices. The Board noted that the Fund underperformed its Selected Peer Group for each of the one, three and five year periods, but outperformed the Selected Peer Group for the ten year period.
Fees and Expenses. The Board considered the Fund’s management fee, subadvisory fee and expense ratio compared with the fees and expense ratios of the Selected Peer Group. The Board noted that the Fund’s management fee is below the average and the median of the funds in its Selected Peer Group, and that the Fund’s total expense ratio is below the average and the median of the Fund’s Sub-Advised Peer Group. Additionally, the Board noted that the Fund’s contractual management fee is competitive with the assets weighted average of the Selected Peer Group at all asset levels presented and is lower than the assets weighted average of the Sub-Advised Peer Group at all asset levels presented
Conclusion. Based on its evaluation of all material factors, the Board, including the Independent Trustees, concluded that the advisory fees for the Fund are fair and reasonable, and that the existing Sub-Advisory Agreement with this Sub-Adviser should be approved.
Quant Long/Short Fund — (Sub-Adviser — Analytic Investors, LLC)
Investment Performance. The Board reviewed the Fund’s investment performance as well as the performance of the Selected Peer Group, and the performance of an appropriate index or combination of indices. The Board noted that Fund outperformed its Selected Peer Group for the five year period but underperformed its Selected Peer Group for each of the one, three and ten year periods. The Board also noted that the Fund changed its investment strategy in November of 2006 and that performance prior to that date reflects the prior strategy.
Fees and Expenses. The Board considered the Fund’s management fee, subadvisory fee and expense ratio compared with the fees and expense ratios of the Selected Peer Group. The Board noted that the Fund’s management fee and expense ratio are above the average and the median of the funds in its Selected Peer Group, and the Fund’s total expense ratio is competitive with the median of the Sub-Advised Peer Group. The Board noted that the Fund’s contractual management fee is lower than the asset-weighted average of its Selected Peer Group at all asset levels presented and is competitive with its Subadvised Peer Group at various asset levels.
Conclusion. Based on its evaluation of all material factors, the Board, including the Independent Trustees, concluded that the advisory fees for the Fund are fair and reasonable, and that the existing Sub-Advisory Agreement with this Sub-Advisor should be approved.
Quant Foreign Value Fund — (Sub-Adviser — Polaris Capital Management, LLC)
Investment Performance. The Board reviewed the Fund’s investment performance as well as the performance of the Selected Peer Group, and the performance of an appropriate index or combination of indices. The Board noted that the Fund outperformed its Selected Peer Group for the one and ten year periods, but had underperformed its Selected Peer Group for each of the three and five year period.
Fees and Expenses. The Board considered the Fund’s management fee, subadvisory fee and expense ratio compared with the fees and expense ratios of the Selected Peer Group. It also considered the amount and nature of fees paid by shareholders. The Board noted that Fund’s management fee and expense ratio are above the average and the median for the Selected Peer Group; however, they are competitive with the average and the median of the Sub-Advised Peer Group. Additionally, the Board noted that the contractual management fee is competitive with the assets-weighted average of the Selected Peer Group at various asset levels and the Subadvised Peer Group at all asset levels presented.
Conclusion. Based on its evaluation of all material factors, the Board, including the Independent Trustees, concluded that the advisory fees for the Fund are fair and reasonable, and that the existing Sub-Advisory Agreement with this Sub-Adviser should be approved.
Quant Foreign Value Small Cap Fund — (Sub-Adviser — Polaris Capital Management, Inc.)
Investment Performance. The Board reviewed the Fund’s investment performance since inception in May of 2008, noting that the Fund outperformed the Selected Peer Group for the one year period.
Fees and Expenses. The Board considered the Fund’s management fee, subadvisory fee and expense ratio compared with the fees and expense ratios of the Selected Peer Group. It also considered the amount and nature of fees paid by shareholders. The Board noted that the Fund’s management fee is at the median and slightly above the average of the Fund’s Selected Peer Group. The Board also noted that the expense ratio of the Fund is above the average and the median of the Selected Peer Group but is competitive with the median of the Sub-Advised Peer Group for the most recent period reviewed. Additionally, the Board noted that the contractual management fee is competitive with the assets-weighted average of the Selected Peer Group at all asset levels presented and is signi ficantly lower than the assets weighted average of the Sub-Advised Peer Group at all asset levels presented. The Board also noted that the Fund benefited from the waiver of certain fees for a portion of its initial fiscal year, and that the expense ratio for its initial fiscal year included certain start-up expenses that will not be recurring expenses.
Conclusion. Based on its evaluation of all material factors, the Board, including the Independent Trustees, concluded that the advisory fees for the Fund are fair and reasonable, and that the proposed Sub-Advisory Agreement with this Sub-Adviser be approved.
QUANT FUNDS
NOTES
This page intentionally left blank
QUANT FUNDS
SERVICE PROVIDERS
| Manager | Quantitative Advisors, 55 Old Bedford Road, Lincoln, MA 01772 |
| Advisers | Columbia Partners, L.L.C., Investment Management, 5425 Wisconsin Avenue, Suite 700, Chevy Chase, MD 20815 Analytic Investors, LLC, 555 West Fifth Street, 50th Floor, Los Angeles, CA 90013 PanAgora Asset Management, Inc., 470 Atlantic Avenue, 8th Floor, Boston, MA 02210 Polaris Capital Management, LLC, 125 Summer Street, Boston, MA 02210 |
| Distributor | U.S. Boston Capital Corporation, 55 Old Bedford Road, Lincoln, MA 01773 |
| Custodian | State Street, 801 Pennsylvania Avenue, Kansas City, MO 64105 |
| Fund Accountant | State Street, 801 Pennsylvania Avenue, Kansas City, MO 64105 |
| Transfer Agent | Quantitative Institutional Services, 55 Old Bedford Road, Lincoln, MA 01773 |
Independent Registered Public Accounting Firm | Tait, Weller & Baker LLP, 1818 Market Street, Suite 2400 Philadelphia, PA 19103 |
| Legal Counsel | Goodwin Procter LLP, 901 New York Avenue, NW, Washington, DC 20001 |
| For Account Information | For Quant Funds information, contact your financial adviser or, if you receive account statements directly from Quant Funds, you can also call 1-800-326-2151. Telephone representatives are available from 8:30 a.m. to 4:30 p.m. Eastern Time. Or visit our website, www.quantfunds.com |
ITEM 2. Code of Ethics
Not applicable for report period.
ITEM 3. Audit Committee Financial Expert
Not applicable for report period.
ITEM 4. Principal Accountant Fees and Services
Not applicable for report period.
ITEM 5. Audit Committee of Listed Registrants
Not applicable.
ITEM 6. Schedule of Investments
Not applicable.
ITEM 7. Disclosure of Proxy Voting Policies and Procedures for Closed-End Management Investment Companies
Not applicable.
ITEM 8. Portfolio Managers of Closed-End Management Investment Companies.
Not applicable.
| ITEM 9 | Purchase of Equity Securities by Closed-End Management Investment Company and Affiliated Purchasers |
Not applicable.
ITEM 10 Submission of Matters to a Vote of Security Holders
Not applicable.
ITEM 11. Controls and Procedures
(a) The President and Treasurer of the registrant have concluded, based on their evaluation of the effectiveness of the registrant’s disclosure controls and procedures (as defined in Rule 30a-3(c) under the Act) as of a date within 90 days of the filing date of this report on Form N-CSR, that the design and operation of such procedures provide reasonable assurance that information required to be disclosed by the registrant in this report on Form N-CSR is recorded, processed, summarized, and reported within the time periods specified in the Securities and Exchange Commission’s rules and forms.
(b) There has been no change in the registrant’s internal controls over financial reporting (as defined in Rule 30a-3(d) under the Act) that occurred during the second fiscal quarter of the period covered by this report that has materially affected, or is reasonably likely to materially affect, the registrant’s internal control over financial reporting.
ITEM 12. Exhibits
(a) Certifications pursuant to Rule 30a-2(a) by the chief executive and financial officers.
| (b) | Certification pursuant to Rule 30a-2(b) and Section 906 by the chief executive and financial officers. |
SIGNATURES
Pursuant to the requirements of the Securities Exchange Act of 1934 and the Investment Company Act of 1940, the registrant has duly caused this report to be signed on its behalf by the undersigned, thereunto duly authorized.
Quantitative Group of Funds
By /s/ Willard L. Umphrey
Willard L. Umphrey, President
Date: November 30, 2010
Pursuant to the requirements of the Securities Exchange Act of 1934 and the Investment Company Act of 1940, this report has been signed below by the following persons on behalf of the registrant and in the capacities and on the dates indicated.
By /s/ Willard L. Umphrey
Willard L. Umphrey, President
Date: November 30, 2010
By /s/ Leon Okurowski
Leon Okurowski, Treasurer
Date: November 30, 2010
EXHIBIT LIST
(a) Certifications pursuant to Rule 30a-2(a) by the chief executive and financial officers.
(b) Certification pursuant to Rule 30a-2(b) and Section 906 by the chief executive and
financial officers.