UNITED STATES
SECURITIES AND EXCHANGE COMMISSION
Washington, D.C. 20549
FORM N-CSR
CERTIFIED SHAREHOLDER REPORT OF REGISTERED
MANAGEMENT INVESTMENT COMPANIES
Investment Company Act file number 811-3855
Fidelity Advisor Series VIII
(Exact name of registrant as specified in charter)
245 Summer St., Boston, Massachusetts 02210
(Address of principal executive offices) (Zip code)
Scott C. Goebel, Secretary
245 Summer St.
Boston, Massachusetts 02210
(Name and address of agent for service)
Registrant's telephone number, including area code: 617-563-7000
Date of fiscal year end: | October 31 |
| |
Date of reporting period: | October 31, 2014 |
Item 1. Reports to Stockholders
(Fidelity Investment logo)(registered trademark)
Fidelity Advisor®
Diversified International
Fund - Class A, Class T, Class B
and Class C
Annual Report
October 31, 2014
(Fidelity Cover Art)
Contents
Performance | (Click Here) | How the fund has done over time. |
Management's Discussion of Fund Performance | (Click Here) | The Portfolio Manager's review of fund performance and strategy. |
Shareholder Expense Example | (Click Here) | An example of shareholder expenses. |
Investment Changes | (Click Here) | A summary of major shifts in the fund's investments over the past six months. |
Investments | (Click Here) | A complete list of the fund's investments with their market values. |
Financial Statements | (Click Here) | Statements of assets and liabilities, operations, and changes in net assets, as well as financial highlights. |
Notes | (Click Here) | Notes to the financial statements. |
Report of Independent Registered Public Accounting Firm | (Click Here) | |
Trustees and Officers | (Click Here) | |
Distributions | (Click Here) | |
Board Approval of Investment Advisory Contracts and Management Fees | (Click Here) | |
To view a fund's proxy voting guidelines and proxy voting record for the 12-month period ended June 30, visit http://www.fidelity.com/proxyvotingresults or visit the Securities and Exchange Commission's (SEC) web site at http://www.sec.gov. You may also call 1-877-208-0098 to request a free copy of the proxy voting guidelines.
Standard & Poor's, S&P and S&P 500 are registered service marks of The McGraw-Hill Companies, Inc. and have been licensed for use by Fidelity Distributors Corporation.
Other third-party marks appearing herein are the property of their respective owners.
All other marks appearing herein are registered or unregistered trademarks or service marks of FMR LLC or an affiliated company. © 2014 FMR LLC. All rights reserved.
Annual Report
This report and the financial statements contained herein are submitted for the general information of the shareholders of the fund. This report is not authorized for distribution to prospective investors in the fund unless preceded or accompanied by an effective prospectus.
A fund files its complete schedule of portfolio holdings with the SEC for the first and third quarters of each fiscal year on Form N-Q. Forms N-Q are available on the SEC's web site at http://www.sec.gov. A fund's Forms N-Q may be reviewed and copied at the SEC's Public Reference Room in Washington, DC. Information regarding the operation of the SEC's Public Reference Room may be obtained by calling 1-800-SEC-0330. For a complete list of a fund's portfolio holdings, view the most recent holdings listing, semiannual report, or annual report on Fidelity's web site at http://www.fidelity.com, http://www.advisor.fidelity.com, or http://www.401k.com, as applicable.
NOT FDIC INSURED • MAY LOSE VALUE • NO BANK GUARANTEE
Neither the fund nor Fidelity Distributors Corporation is a bank.
Annual Report
Average annual total return reflects the change in the value of an investment, assuming reinvestment of the class' distributions from dividend income and capital gains (the profits earned upon the sale of securities that have grown in value, if any) and assuming a constant rate of performance each year. The $10,000 table and the fund's returns do not reflect the deduction of taxes that a shareholder would pay on fund distributions or the redemption of fund shares. During periods of reimbursement by Fidelity, a fund's total return will be greater than it would be had the reimbursement not occurred. How a fund did yesterday is no guarantee of how it will do tomorrow. Returns reflect the conversion of Class B shares to Class A shares after a maximum of seven years.
Average Annual Total Returns
Periods ended October 31, 2014 | Past 1
year | Past 5
years | Past 10
years |
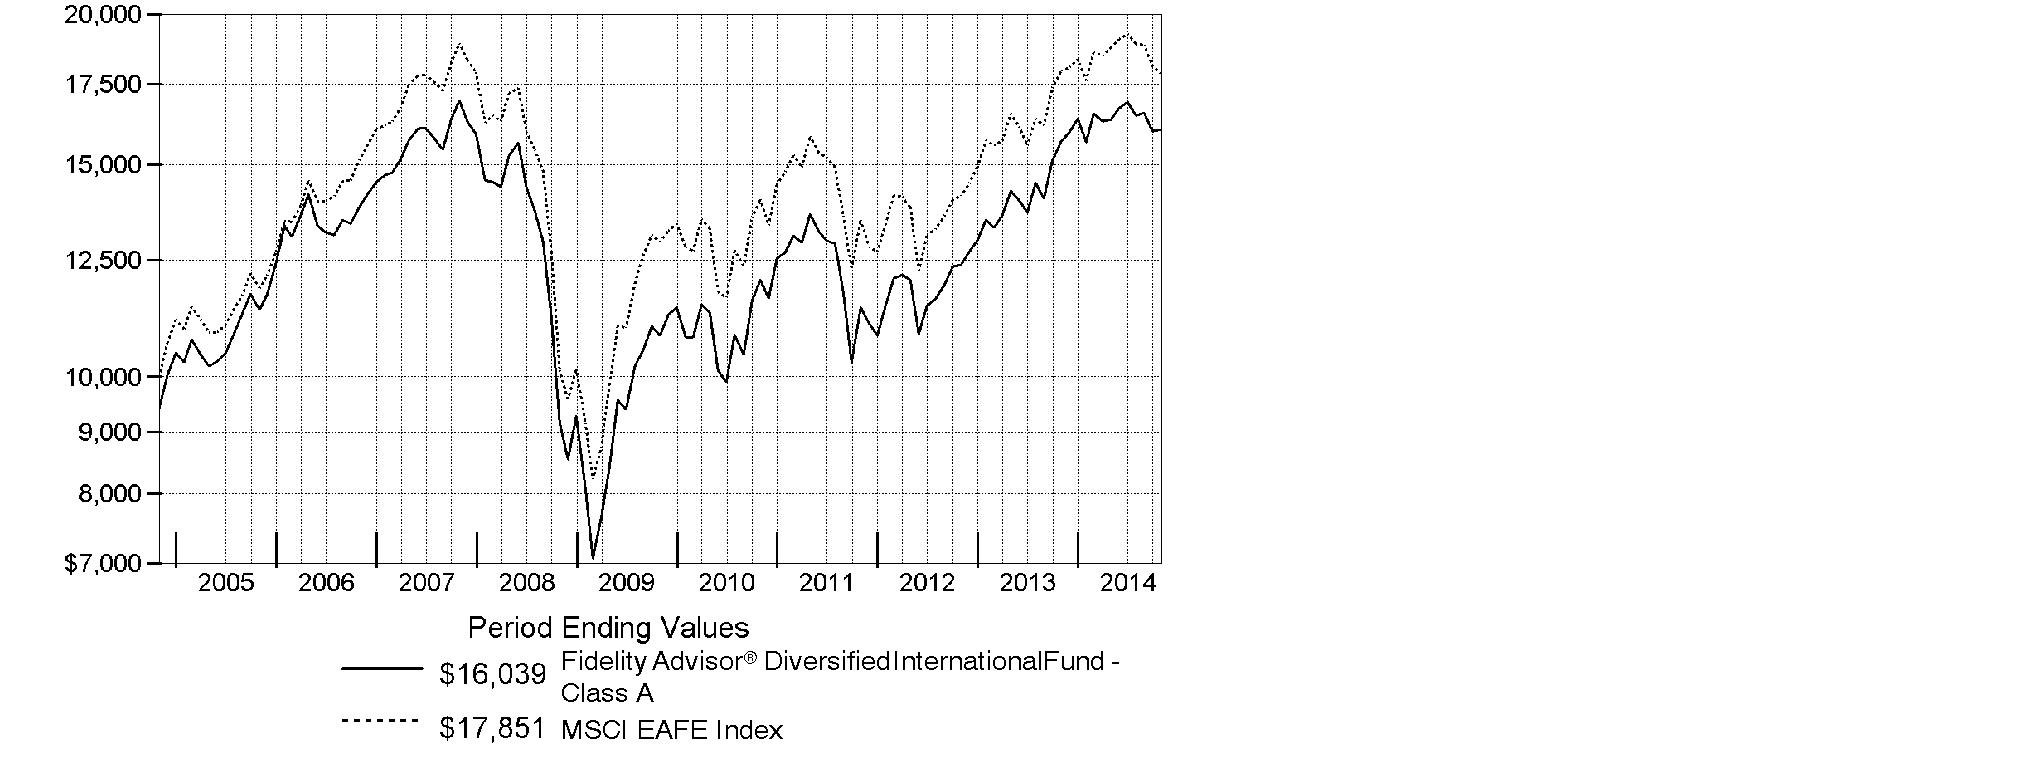
Class A (incl. 5.75% sales charge) | -3.60% | 6.91% | 4.84% |
Class T (incl. 3.50% sales charge) | -1.53% | 7.15% | 4.83% |
Class B (incl. contingent deferred sales charge) A | -3.55% | 7.05% | 4.86% |
Class C (incl. contingent deferred sales charge) B | 0.58% | 7.40% | 4.67% |
A Class B shares' contingent deferred sales charges included in the past one year, past five years, and past ten years total return figures are 5%, 2%, and 0%, respectively.
B Class C shares' contingent deferred sales charges included in the past one year, past five years, and past ten years total return figures are 1%, 0%, and 0%, respectively.
Annual Report
$10,000 Over 10 Years
Let's say hypothetically that $10,000 was invested in Fidelity Advisor® Diversified International Fund - Class A on October 31, 2004, and the current 5.75% sales charge was paid. The chart shows how the value of your investment would have changed, and also shows how the MSCI EAFE Index performed over the same period.
Annual Report
Market Recap: Global equities posted a healthy gain for the 12 months ending October 31, 2014, overcoming an October market decline driven by recessionary pressures in China and tepid growth in Europe. The MSCI ACWI (All Country World Index) Index rose 8.15%, helped by subdued market volatility for much of the period and supported by solid corporate earnings, especially in the United States. Stocks also benefited from easy monetary policies in Japan and the eurozone, as well as increased stimulus efforts in China. All but three of the 24 industry groups that compose the index marked a positive return. The U.S. (+17%) remained a pillar of strength, while a strongly rising dollar in the latter part of the period detracted from investors' returns in most non-U.S. markets. Canada (+5%) notched broad gains outside of its energy and materials sectors, as did Asia-Pacific ex Japan (+4%), led by investor enthusiasm for companies in India. The U.K., Europe and Japan, meanwhile, all underperformed. Among sectors, health care (+24%) led the index, with a strong contribution from the pharmaceuticals, biotechnology & life sciences industry. Information technology (+21%) also outperformed. Conversely, materials (-4%) and energy (-1%) lagged the index due to a higher supply of and lower demand for commodities.
Comments from William Bower, Portfolio Manager of Fidelity Advisor® Diversified International Fund: For the year ending October 31, 2014, the fund's Class A, Class T, Class B and Class C shares gained 2.28%, 2.04%, 1.45% and 1.58%, respectively (excluding sales charges), outpacing the -0.48% result for the MSCI EAFE Index. Stock selection drove relative results, with strong showings in the information technology and health care sectors, with industrials the only notable detractor. Geographically, the fund benefited from out-of-index holdings in emerging markets, the U.S. and Canada. Stock selection helped in six of 10 sectors, and all 10 top relative contributors were overweights or out-of-index positions. Denmark's Novo Nordisk, an insulin producer, was up 38% for the year. Japanese optics maker Hoya also helped. Our holding in Alimentation Couche-Tard was up 51% for the full year. Conversely, picks in industrials hurt most, particularly data purveyor Experian, which was off 25% for the period. In financials, ORIX disappointed. In health care, not owning Switzerland's Novartis or U.K.-based AstraZeneca, two index heavies, weighed on relative results. I reduced its position in Honda Motor and sold out of Toyota Motor and Renault, and established a position in Suzuki Motor.
The views expressed above reflect those of the portfolio manager(s) only through the end of the period as stated on the cover of this report and do not necessarily represent the views of Fidelity or any other person in the Fidelity organization. Any such views are subject to change at any time based upon market or other conditions and Fidelity disclaims any responsibility to update such views. These views may not be relied on as investment advice and, because investment decisions for a Fidelity fund are based on numerous factors, may not be relied on as an indication of trading intent on behalf of any Fidelity fund.
Annual Report
Shareholder Expense Example
As a shareholder of the Fund, you incur two types of costs: (1) transaction costs, including sales charges (loads) on purchase payments or redemption proceeds, redemption fees and (2) ongoing costs, including management fees, distribution and/or service (12b-1) fees and other Fund expenses. This Example is intended to help you understand your ongoing costs (in dollars) of investing in the Fund and to compare these costs with the ongoing costs of investing in other mutual funds.
The Example is based on an investment of $1,000 invested at the beginning of the period and held for the entire period (May 1, 2014 to October 31, 2014).
Actual Expenses
The first line of the accompanying table for each class of the Fund provides information about actual account values and actual expenses. You may use the information in this line, together with the amount you invested, to estimate the expenses that you paid over the period. Simply divide your account value by $1,000.00 (for example, an $8,600 account value divided by $1,000.00 = 8.6), then multiply the result by the number in the first line for a class of the Fund under the heading entitled "Expenses Paid During Period" to estimate the expenses you paid on your account during this period. In addition, the Fund, as a shareholder in the underlying Fidelity Central Funds, will indirectly bear its pro-rata share of the fees and expenses incurred by the underlying Fidelity Central Funds. These fees and expenses are not included in the Fund's annualized expense ratio used to calculate the expense estimate in the table below.
Hypothetical Example for Comparison Purposes
The second line of the accompanying table for each class of the Fund provides information about hypothetical account values and hypothetical expenses based on a Class' actual expense ratio and an assumed rate of return of 5% per year before expenses, which is not the Class' actual return. The hypothetical account values and expenses may not be used to estimate the actual ending account balance or expenses you paid for the period. You may use this information to compare the ongoing costs of investing in the Fund and other funds. To do so, compare this 5% hypothetical example with the 5% hypothetical examples that appear in the shareholder reports of the other funds. In addition, the Fund, as a shareholder in the underlying Fidelity Central Funds, will indirectly bear its pro-rata share of the fees and expenses incurred by the underlying Fidelity Central Funds. These fees and expenses are not included in the Fund's annualized expense ratio used to calculate the expense estimate in the table below.
Please note that the expenses shown in the table are meant to highlight your ongoing costs only and do not reflect any transaction costs. Therefore, the second line of the table is useful in comparing ongoing costs only, and will not help you determine the relative total costs of owning different funds. In addition, if these transactional costs were included, your costs would have been higher.
Annual Report
| Annualized
Expense RatioB | Beginning
Account Value
May 1, 2014 | Ending
Account Value
October 31, 2014 | Expenses Paid
During Period*
May 1, 2014
to October 31, 2014 |
Class A | 1.24% | | | |
Actual | | $ 1,000.00 | $ 981.40 | $ 6.19 |
HypotheticalA | | $ 1,000.00 | $ 1,018.95 | $ 6.31 |
Class T | 1.50% | | | |
Actual | | $ 1,000.00 | $ 980.30 | $ 7.49 |
HypotheticalA | | $ 1,000.00 | $ 1,017.64 | $ 7.63 |
Class B | 2.05% | | | |
Actual | | $ 1,000.00 | $ 977.60 | $ 10.22 |
HypotheticalA | | $ 1,000.00 | $ 1,014.87 | $ 10.41 |
Class C | 1.99% | | | |
Actual | | $ 1,000.00 | $ 978.00 | $ 9.92 |
HypotheticalA | | $ 1,000.00 | $ 1,015.17 | $ 10.11 |
Institutional Class | .96% | | | |
Actual | | $ 1,000.00 | $ 983.20 | $ 4.80 |
HypotheticalA | | $ 1,000.00 | $ 1,020.37 | $ 4.89 |
Class Z | .78% | | | |
Actual | | $ 1,000.00 | $ 984.20 | $ 3.90 |
HypotheticalA | | $ 1,000.00 | $ 1,021.27 | $ 3.97 |
A 5% return per year before expenses
B Annualized expense ratio reflects expenses net of applicable fee waivers.
* Expenses are equal to each Class' annualized expense ratio, multiplied by the average account value over the period, multiplied by 184/365 (to reflect the one-half year period).
Annual Report
Investment Changes (Unaudited)
Top Five Stocks as of October 31, 2014 |
| % of fund's
net assets | % of fund's net assets
6 months ago |
Novo Nordisk A/S Series B (Denmark, Pharmaceuticals) | 1.9 | 1.9 |
ORIX Corp. (Japan, Diversified Financial Services) | 1.8 | 1.6 |
Bayer AG (Germany, Pharmaceuticals) | 1.6 | 1.7 |
Anheuser-Busch InBev SA NV (Belgium, Beverages) | 1.6 | 1.4 |
Roche Holding AG (participation certificate) (Switzerland, Pharmaceuticals) | 1.4 | 0.7 |
| 8.3 | |
Top Five Market Sectors as of October 31, 2014 |
| % of fund's
net assets | % of fund's net assets
6 months ago |
Financials | 21.2 | 21.1 |
Health Care | 16.7 | 16.1 |
Consumer Discretionary | 15.6 | 15.8 |
Information Technology | 13.9 | 9.8 |
Consumer Staples | 12.0 | 11.9 |
Top Five Countries as of October 31, 2014 |
(excluding cash equivalents) | % of fund's
net assets | % of fund's net assets
6 months ago |
Japan | 17.7 | 15.3 |
United Kingdom | 16.8 | 17.4 |
United States of America | 7.9 | 7.1 |
Germany | 6.2 | 8.4 |
Switzerland | 5.2 | 5.4 |
Percentages are adjusted for the effect of open futures contracts, if applicable. |
Asset Allocation (% of fund's net assets) |
As of October 31, 2014 | As of April 30, 2014 |
 | Stocks 98.1% | | | Stocks 97.7% | |
 | Other Investments 0.1% | | | Other Investments 0.1% | |
 | Short-Term
Investments and
Net Other Assets (Liabilities) 1.8% | | | Short-Term
Investments and
Net Other Assets (Liabilities) 2.2% | |

Annual Report
Investments October 31, 2014
Showing Percentage of Net Assets
Common Stocks - 96.7% |
| Shares | | Value (000s) |
Australia - 2.8% |
Ansell Ltd. | 258,534 | | $ 4,535 |
Australia & New Zealand Banking Group Ltd. | 628,447 | | 18,596 |
BHP Billiton Ltd. sponsored ADR (e) | 217,236 | | 12,913 |
CSL Ltd. | 167,531 | | 11,828 |
Woodside Petroleum Ltd. | 172,944 | | 6,143 |
TOTAL AUSTRALIA | | 54,015 |
Austria - 0.1% |
Andritz AG | 52,900 | | 2,554 |
Bailiwick of Guernsey - 0.2% |
Amdocs Ltd. | 72,600 | | 3,451 |
Bailiwick of Jersey - 2.0% |
Experian PLC | 398,000 | | 5,975 |
Shire PLC | 255,300 | | 17,130 |
Wolseley PLC | 124,370 | | 6,599 |
WPP PLC | 445,924 | | 8,710 |
TOTAL BAILIWICK OF JERSEY | | 38,414 |
Belgium - 2.6% |
Anheuser-Busch InBev SA NV | 272,131 | | 30,178 |
Arseus NV | 61,500 | | 2,458 |
KBC Groupe SA (a) | 246,648 | | 13,213 |
UCB SA | 42,200 | | 3,405 |
TOTAL BELGIUM | | 49,254 |
Bermuda - 0.7% |
BW LPG Ltd. | 339,872 | | 3,220 |
Golar LNG Ltd. | 76,000 | | 4,264 |
Noble Group Ltd. | 3,986,000 | | 3,710 |
Travelport Worldwide Ltd. | 158,100 | | 2,285 |
TOTAL BERMUDA | | 13,479 |
Canada - 3.8% |
Alimentation Couche-Tard, Inc. Class B (sub. vtg.) | 460,900 | | 15,642 |
AutoCanada, Inc. | 36,900 | | 2,050 |
Canadian Natural Resources Ltd. | 110,900 | | 3,870 |
CGI Group, Inc. Class A (sub. vtg.) (a) | 397,700 | | 13,652 |
Constellation Software, Inc. | 25,700 | | 7,240 |
First Quantum Minerals Ltd. | 256,600 | | 3,870 |
Imperial Oil Ltd. | 96,200 | | 4,629 |
Keyera Corp. | 28,900 | | 2,299 |
Potash Corp. of Saskatchewan, Inc. | 115,500 | | 3,942 |
Common Stocks - continued |
| Shares | | Value (000s) |
Canada - continued |
PrairieSky Royalty Ltd. | 38,000 | | $ 1,170 |
Suncor Energy, Inc. | 265,200 | | 9,417 |
Tourmaline Oil Corp. (a) | 100,600 | | 3,609 |
TransForce, Inc. | 77,900 | | 1,905 |
TOTAL CANADA | | 73,295 |
Cayman Islands - 3.2% |
58.com, Inc. ADR | 21,000 | | 831 |
Alibaba Group Holding Ltd. sponsored ADR | 240,900 | | 23,753 |
Baidu.com, Inc. sponsored ADR (a) | 18,500 | | 4,417 |
China Modern Dairy Holdings Ltd. (a)(e) | 6,161,000 | | 2,718 |
GCL-Poly Energy Holdings Ltd. (a) | 16,510,000 | | 5,564 |
Melco Crown Entertainment Ltd. sponsored ADR | 267,500 | | 7,260 |
PW Medtech Group Ltd. (a) | 5,938,000 | | 3,749 |
Sands China Ltd. | 1,554,400 | | 9,695 |
Tencent Holdings Ltd. | 196,800 | | 3,163 |
TOTAL CAYMAN ISLANDS | | 61,150 |
Colombia - 0.2% |
Grupo Aval Acciones y Valores SA ADR | 287,696 | | 3,878 |
Curacao - 0.0% |
Schlumberger Ltd. | 5,400 | | 533 |
Denmark - 2.4% |
A.P. Moller - Maersk A/S Series B | 802 | | 1,869 |
Genmab A/S (a) | 132,800 | | 5,789 |
Novo Nordisk A/S Series B | 789,740 | | 35,698 |
Vestas Wind Systems A/S (a) | 94,134 | | 3,151 |
TOTAL DENMARK | | 46,507 |
Finland - 0.6% |
Nokia Corp. | 647,900 | | 5,414 |
Sampo Oyj (A Shares) | 113,300 | | 5,419 |
TOTAL FINLAND | | 10,833 |
France - 3.7% |
Air Liquide SA | 54,260 | | 6,545 |
Atos Origin SA | 49,027 | | 3,385 |
AXA SA | 444,800 | | 10,262 |
BNP Paribas SA | 221,943 | | 13,945 |
Kering SA | 16,100 | | 3,106 |
LVMH Moet Hennessy - Louis Vuitton SA | 16,998 | | 2,883 |
Numericable Group SA (e) | 33,900 | | 1,253 |
Common Stocks - continued |
| Shares | | Value (000s) |
France - continued |
Numericable Group SA rights 11/12/14 (a) | 33,900 | | $ 1,005 |
Publicis Groupe SA (a) | 140,010 | | 9,697 |
Sanofi SA | 186,347 | | 16,909 |
Tarkett SA | 43,874 | | 1,264 |
TOTAL FRANCE | | 70,254 |
Germany - 4.8% |
adidas AG | 20,690 | | 1,505 |
Bayer AG | 219,452 | | 31,199 |
Brenntag AG | 75,600 | | 3,657 |
Continental AG | 34,600 | | 6,792 |
Drillisch AG | 50,000 | | 1,735 |
Fresenius SE & Co. KGaA | 294,300 | | 15,139 |
Gerry Weber International AG (Bearer) | 59,100 | | 2,372 |
Linde AG | 53,347 | | 9,837 |
OSRAM Licht AG (a) | 62,910 | | 2,204 |
ProSiebenSat.1 Media AG | 90,800 | | 3,659 |
SAP AG (e) | 135,216 | | 9,213 |
Symrise AG | 58,000 | | 3,262 |
TOTAL GERMANY | | 90,574 |
Hong Kong - 1.7% |
AIA Group Ltd. | 4,129,000 | | 23,042 |
Galaxy Entertainment Group Ltd. | 1,059,000 | | 7,241 |
Melco International Development Ltd. | 679,000 | | 1,841 |
TOTAL HONG KONG | | 32,124 |
India - 2.4% |
Apollo Hospitals Enterprise Ltd. (a) | 199,507 | | 3,621 |
Axis Bank Ltd. (a) | 444,940 | | 3,279 |
HDFC Bank Ltd. | 835,563 | | 13,549 |
Housing Development Finance Corp. Ltd. | 655,610 | | 11,807 |
ITC Ltd. (a) | 1,141,123 | | 6,598 |
LIC Housing Finance Ltd. | 201,645 | | 1,187 |
Lupin Ltd. | 127,912 | | 2,962 |
Pidilite Industries Ltd. | 524,041 | | 3,531 |
TOTAL INDIA | | 46,534 |
Indonesia - 0.5% |
PT Bank Central Asia Tbk | 5,215,000 | | 5,630 |
PT Bank Rakyat Indonesia Tbk | 4,102,200 | | 3,759 |
TOTAL INDONESIA | | 9,389 |
Common Stocks - continued |
| Shares | | Value (000s) |
Ireland - 2.1% |
Actavis PLC (a) | 50,000 | | $ 12,137 |
DCC PLC (United Kingdom) | 71,500 | | 3,996 |
Greencore Group PLC | 1,069,521 | | 4,489 |
Perrigo Co. PLC | 71,900 | | 11,608 |
Ryanair Holdings PLC sponsored ADR (a) | 147,800 | | 8,209 |
TOTAL IRELAND | | 40,439 |
Israel - 1.3% |
Check Point Software Technologies Ltd. (a) | 120,100 | | 8,917 |
Teva Pharmaceutical Industries Ltd. sponsored ADR | 295,000 | | 16,659 |
TOTAL ISRAEL | | 25,576 |
Italy - 0.9% |
Telecom Italia SpA (a) | 2,528,504 | | 2,866 |
UniCredit SpA | 1,301,916 | | 9,397 |
World Duty Free SpA (a) | 582,140 | | 4,928 |
TOTAL ITALY | | 17,191 |
Japan - 17.7% |
Ain Pharmaciez, Inc. | 77,700 | | 2,105 |
Aozora Bank Ltd. | 867,000 | | 3,047 |
Astellas Pharma, Inc. | 1,338,800 | | 20,779 |
Daiichikosho Co. Ltd. | 74,400 | | 1,878 |
Don Quijote Holdings Co. Ltd. | 182,000 | | 10,905 |
Fast Retailing Co. Ltd. | 18,500 | | 6,878 |
Fuji Heavy Industries Ltd. | 98,700 | | 3,285 |
GMO Internet, Inc. | 357,500 | | 3,002 |
Honda Motor Co. Ltd. sponsored ADR | 152,306 | | 4,892 |
Hoya Corp. | 650,900 | | 23,033 |
Japan Exchange Group, Inc. | 361,800 | | 8,975 |
Japan Tobacco, Inc. | 686,800 | | 23,433 |
KDDI Corp. | 224,600 | | 14,749 |
Keyence Corp. | 46,800 | | 22,678 |
Komatsu Ltd. | 440,400 | | 10,398 |
Medical System Network Co. Ltd. (e) | 752,500 | | 2,298 |
Misumi Group, Inc. | 34,800 | | 1,098 |
Mitsubishi Electric Corp. | 436,000 | | 5,622 |
Mitsubishi UFJ Financial Group, Inc. | 2,952,200 | | 17,209 |
Nagaileben Co. Ltd. | 117,000 | | 2,249 |
NEC Corp. | 3,756,000 | | 13,283 |
NGK Spark Plug Co. Ltd. | 106,000 | | 2,765 |
Nippon Telegraph & Telephone Corp. | 158,500 | | 9,862 |
Nitori Holdings Co. Ltd. | 86,000 | | 5,450 |
Common Stocks - continued |
| Shares | | Value (000s) |
Japan - continued |
Olympus Corp. (a) | 56,700 | | $ 2,036 |
OMRON Corp. | 163,100 | | 7,720 |
ORIX Corp. | 2,432,400 | | 33,762 |
Rakuten, Inc. | 1,186,500 | | 13,380 |
Recruit Holdings Co. Ltd. (a) | 36,900 | | 1,261 |
Seven & i Holdings Co., Ltd. | 156,700 | | 6,120 |
SHIMANO, Inc. | 51,800 | | 6,869 |
Shinsei Bank Ltd. | 1,893,000 | | 4,254 |
Ship Healthcare Holdings, Inc. | 95,400 | | 2,233 |
SoftBank Corp. | 311,400 | | 22,670 |
Suzuki Motor Corp. | 154,500 | | 5,179 |
Toshiba Plant Systems & Services Corp. | 153,200 | | 2,564 |
Tsuruha Holdings, Inc. | 116,000 | | 6,849 |
VT Holdings Co. Ltd. | 606,600 | | 2,396 |
TOTAL JAPAN | | 337,166 |
Korea (South) - 0.9% |
NAVER Corp. | 10,009 | | 7,024 |
Orion Corp. | 6,412 | | 4,923 |
Samsung Electronics Co. Ltd. | 4,431 | | 5,130 |
Samsung SDS Co. Ltd. (a) | 2,071 | | 366 |
TOTAL KOREA (SOUTH) | | 17,443 |
Luxembourg - 1.3% |
Altice SA | 243,177 | | 15,142 |
Eurofins Scientific SA | 38,800 | | 9,805 |
TOTAL LUXEMBOURG | | 24,947 |
Mexico - 0.3% |
America Movil S.A.B. de CV Series L sponsored ADR | 197,100 | | 4,811 |
Netherlands - 3.5% |
AEGON NV | 2,212,100 | | 18,030 |
AerCap Holdings NV (a) | 75,500 | | 3,272 |
IMCD Group BV | 122,800 | | 3,386 |
ING Groep NV (Certificaten Van Aandelen) (a) | 664,900 | | 9,522 |
LyondellBasell Industries NV Class A | 82,200 | | 7,532 |
Reed Elsevier NV | 213,182 | | 4,906 |
Unilever NV (Certificaten Van Aandelen) (Bearer) | 500,200 | | 19,387 |
TOTAL NETHERLANDS | | 66,035 |
Norway - 0.2% |
Telenor ASA | 187,400 | | 4,212 |
Common Stocks - continued |
| Shares | | Value (000s) |
Philippines - 0.4% |
Alliance Global Group, Inc. | 12,852,154 | | $ 7,229 |
Singapore - 0.4% |
Ezion Holdings Ltd. | 1,479,600 | | 1,742 |
United Overseas Bank Ltd. | 329,000 | | 5,894 |
TOTAL SINGAPORE | | 7,636 |
South Africa - 0.9% |
Naspers Ltd. Class N | 142,100 | | 17,684 |
Spain - 1.6% |
Amadeus IT Holding SA Class A | 266,800 | | 9,796 |
Criteria CaixaCorp SA | 554,945 | | 3,026 |
Inditex SA | 656,784 | | 18,449 |
TOTAL SPAIN | | 31,271 |
Sweden - 2.3% |
ASSA ABLOY AB (B Shares) | 100,600 | | 5,328 |
HEXPOL AB (B Shares) | 16,800 | | 1,486 |
Nordea Bank AB | 1,015,800 | | 13,027 |
Svenska Cellulosa AB (SCA) (B Shares) | 644,300 | | 14,406 |
Svenska Handelsbanken AB (A Shares) | 212,000 | | 10,109 |
TOTAL SWEDEN | | 44,356 |
Switzerland - 5.2% |
Actelion Ltd. | 47,876 | | 5,692 |
Compagnie Financiere Richemont SA Series A | 113,494 | | 9,549 |
Credit Suisse Group AG | 354,987 | | 9,458 |
Nestle SA | 162,022 | | 11,882 |
Roche Holding AG (participation certificate) | 91,362 | | 26,961 |
Syngenta AG (Switzerland) | 53,404 | | 16,516 |
UBS AG | 1,072,643 | | 18,651 |
TOTAL SWITZERLAND | | 98,709 |
Taiwan - 1.1% |
Taiwan Semiconductor Manufacturing Co. Ltd. sponsored ADR | 937,900 | | 20,653 |
Thailand - 0.2% |
Kasikornbank PCL (For. Reg.) | 533,300 | | 3,863 |
United Kingdom - 16.8% |
Al Noor Hospitals Group PLC | 266,200 | | 4,339 |
Associated British Foods PLC | 175,100 | | 7,714 |
B&M European Value Retail S.A. | 1,353,586 | | 5,386 |
BG Group PLC | 1,008,869 | | 16,814 |
British American Tobacco PLC sponsored ADR | 167,200 | | 18,987 |
Common Stocks - continued |
| Shares | | Value (000s) |
United Kingdom - continued |
BT Group PLC | 1,879,500 | | $ 11,080 |
Bunzl PLC | 119,000 | | 3,227 |
Capita Group PLC | 100,700 | | 1,767 |
Compass Group PLC | 404,800 | | 6,514 |
Diploma PLC | 350,900 | | 3,904 |
easyJet PLC | 160,900 | | 3,861 |
Exova Group Ltd. PLC (a) | 644,700 | | 1,751 |
Filtrona PLC | 815,100 | | 8,951 |
GlaxoSmithKline PLC | 419,900 | | 9,496 |
Hikma Pharmaceuticals PLC | 238,987 | | 7,245 |
HSBC Holdings PLC sponsored ADR | 490,797 | | 25,040 |
IMI PLC | 189,700 | | 3,708 |
Imperial Tobacco Group PLC | 88,997 | | 3,860 |
ITV PLC | 1,841,700 | | 5,981 |
Johnson Matthey PLC | 121,600 | | 5,785 |
Kingfisher PLC | 1,846,900 | | 8,947 |
Liberty Global PLC: | | | |
Class A (a) | 68,400 | | 3,110 |
Class C | 48,700 | | 2,166 |
Lloyds Banking Group PLC (a) | 17,941,900 | | 22,156 |
Mears Group PLC | 260,100 | | 1,839 |
Meggitt PLC | 539,673 | | 3,894 |
Next PLC | 192,100 | | 19,806 |
Poundland Group PLC (a) | 361,369 | | 1,821 |
Prudential PLC | 1,008,173 | | 23,345 |
Reckitt Benckiser Group PLC | 222,013 | | 18,646 |
Rentokil Initial PLC | 1,109,900 | | 2,187 |
Rolls-Royce Group PLC | 733,500 | | 9,892 |
SABMiller PLC | 169,000 | | 9,530 |
Schroders PLC | 24,900 | | 960 |
Spectris PLC | 138,900 | | 4,004 |
Sports Direct International PLC (a) | 459,400 | | 4,736 |
St. James's Place Capital PLC | 934,800 | | 11,141 |
Standard Chartered PLC (United Kingdom) | 232,764 | | 3,499 |
Travis Perkins PLC | 220,300 | | 5,822 |
Whitbread PLC | 116,872 | | 8,159 |
TOTAL UNITED KINGDOM | | 321,070 |
United States of America - 7.9% |
AbbVie, Inc. | 114,900 | | 7,292 |
Alexion Pharmaceuticals, Inc. (a) | 47,600 | | 9,109 |
Alliance Data Systems Corp. (a) | 20,900 | | 5,922 |
Common Stocks - continued |
| Shares | | Value (000s) |
United States of America - continued |
Amgen, Inc. | 52,700 | | $ 8,547 |
Celldex Therapeutics, Inc. (a) | 41,800 | | 700 |
CF Industries Holdings, Inc. | 14,700 | | 3,822 |
Fidelity National Information Services, Inc. | 96,600 | | 5,640 |
FMC Corp. | 32,700 | | 1,875 |
Freeport-McMoRan, Inc. | 110,100 | | 3,138 |
Gilead Sciences, Inc. (a) | 90,700 | | 10,158 |
Google, Inc.: | | | |
Class A (a) | 13,295 | | 7,550 |
Class C (a) | 19,795 | | 11,067 |
Las Vegas Sands Corp. | 133,000 | | 8,281 |
MasterCard, Inc. Class A | 127,700 | | 10,695 |
McGraw Hill Financial, Inc. | 189,800 | | 17,173 |
Mead Johnson Nutrition Co. Class A | 53,900 | | 5,353 |
Mondelez International, Inc. | 144,300 | | 5,088 |
Noble Energy, Inc. | 148,300 | | 8,547 |
QUALCOMM, Inc. | 75,500 | | 5,928 |
The Blackstone Group LP | 146,100 | | 4,401 |
Visa, Inc. Class A | 44,500 | | 10,744 |
TOTAL UNITED STATES OF AMERICA | | 151,030 |
TOTAL COMMON STOCKS (Cost $1,514,332) |
1,847,559
|
Preferred Stocks - 1.4% |
| | | |
Convertible Preferred Stocks - 0.0% |
United States of America - 0.0% |
NJOY, Inc.: | | | |
Series C (a)(h) | 60,264 | | 486 |
Series D (h) | 18,951 | | 153 |
TOTAL UNITED STATES OF AMERICA | | 639 |
Nonconvertible Preferred Stocks - 1.4% |
Germany - 1.4% |
Henkel AG & Co. KGaA | 132,200 | | 13,051 |
Volkswagen AG | 64,700 | | 13,787 |
TOTAL GERMANY | | 26,838 |
Preferred Stocks - continued |
| Shares | | Value (000s) |
Nonconvertible Preferred Stocks - continued |
United Kingdom - 0.0% |
Rolls-Royce Group PLC | 66,015,000 | | $ 106 |
TOTAL NONCONVERTIBLE PREFERRED STOCKS | | 26,944 |
TOTAL PREFERRED STOCKS (Cost $21,726) |
27,583
|
Preferred Securities - 0.1% |
| Principal Amount (d) (000s) | | |
Ireland - 0.1% |
Baggot Securities Ltd. 10.24% (f)(g)
(Cost $2,488) | EUR | 1,620 | |
2,295
|
Money Market Funds - 2.6% |
| Shares | | |
Fidelity Cash Central Fund, 0.11% (b) | 31,286,373 | | 31,286 |
Fidelity Securities Lending Cash Central Fund, 0.11% (b)(c) | 18,560,972 | | 18,561 |
TOTAL MONEY MARKET FUNDS (Cost $49,847) |
49,847
|
TOTAL INVESTMENT PORTFOLIO - 100.8% (Cost $1,588,393) | | 1,927,284 |
NET OTHER ASSETS (LIABILITIES) - (0.8)% | | (15,807) |
NET ASSETS - 100% | $ 1,911,477 |
Currency Abbreviations |
EUR | - | European Monetary Unit |
Legend |
(a) Non-income producing |
(b) Affiliated fund that is generally available only to investment companies and other accounts managed by Fidelity Investments. The rate quoted is the annualized seven-day yield of the fund at period end. A complete unaudited listing of the fund's holdings as of its most recent quarter end is available upon request. In addition, each Fidelity Central Fund's financial statements, which are not covered by the Fund's Report of Independent Registered Public Accounting Firm, are available on the SEC's website or upon request. |
(c) Investment made with cash collateral received from securities on loan. |
(d) Amount is stated in United States dollars unless otherwise noted. |
(e) Security or a portion of the security is on loan at period end. |
(f) Security exempt from registration under Rule 144A of the Securities Act of 1933. These securities may be resold in transactions exempt from registration, normally to qualified institutional buyers. At the end of the period, the value of these securities amounted to $2,295,000 or 0.1% of net assets. |
(g) Security is perpetual in nature with no stated maturity date. |
(h) Restricted securities - Investment in securities not registered under the Securities Act of 1933 (excluding 144A issues). At the end of the period, the value of restricted securities (excluding 144A issues) amounted to $639,000 or 0.0% of net assets. |
Additional information on each restricted holding is as follows: |
Security | Acquisition
Date | Acquisition
Cost (000s) |
NJOY, Inc. Series C | 6/7/13 | $ 487 |
NJOY, Inc. Series D | 2/14/14 | $ 321 |
Affiliated Central Funds |
Information regarding fiscal year to date income earned by the Fund from investments in Fidelity Central Funds is as follows: |
Fund | Income earned
(Amounts in thousands) |
Fidelity Cash Central Fund | $ 26 |
Fidelity Securities Lending Cash Central Fund | 900 |
Total | $ 926 |
Other Information |
Categorizations in the Schedule of Investments are based on country or territory of incorporation. |
The following is a summary of the inputs used, as of October 31, 2014, involving the Fund's assets and liabilities carried at fair value. The inputs or methodology used for valuing securities may not be an indication of the risk associated with investing in those securities. For more information on valuation inputs, and their aggregation into the levels used in the table below, please refer to the Investment Valuation section in the accompanying Notes to Financial Statements. |
Valuation Inputs at Reporting Date: |
Description
(Amounts in thousands) | Total | Level 1 | Level 2 | Level 3 |
Investments in Securities: | | | | |
Equities: | | | | |
Consumer Discretionary | $ 295,222 | $ 199,164 | $ 95,419 | $ 639 |
Consumer Staples | 233,257 | 121,689 | 111,568 | - |
Energy | 66,257 | 41,558 | 24,699 | - |
Financials | 403,505 | 144,490 | 259,015 | - |
Health Care | 321,467 | 161,281 | 160,186 | - |
Industrials | 123,823 | 91,941 | 31,882 | - |
Information Technology | 263,235 | 170,165 | 93,070 | - |
Materials | 96,391 | 76,344 | 20,047 | - |
Telecommunication Services | 71,985 | 10,758 | 61,227 | - |
Preferred Securities | 2,295 | - | 2,295 | - |
Money Market Funds | 49,847 | 49,847 | - | - |
Total Investments in Securities: | $ 1,927,284 | $ 1,067,237 | $ 859,408 | $ 639 |
The following is a summary of transfers between Level 1 and Level 2 for the period ended October 31, 2014. Transfers are assumed to have occurred at the beginning of the period, and are primarily attributable to the valuation techniques used for foreign equity securities, as discussed in the accompanying Notes to Financial Statements: |
Transfers | Total (000s) |
Level 1 to Level 2 | $ 164,017 |
Level 2 to Level 1 | $ 0 |
See accompanying notes which are an integral part of the financial statements.
Annual Report
Statement of Assets and Liabilities
Amounts in thousands (except per-share amounts) | October 31, 2014 |
| | |
Assets | | |
Investment in securities, at value (including securities loaned of $17,707) - See accompanying schedule: Unaffiliated issuers (cost $1,538,546) | $ 1,877,437 | |
Fidelity Central Funds (cost $49,847) | 49,847 | |
Total Investments (cost $1,588,393) | | $ 1,927,284 |
Foreign currency held at value (cost $62) | | 62 |
Receivable for investments sold | | 7,243 |
Receivable for fund shares sold | | 2,290 |
Dividends receivable | | 4,406 |
Distributions receivable from Fidelity Central Funds | | 14 |
Prepaid expenses | | 5 |
Other receivables | | 196 |
Total assets | | 1,941,500 |
| | |
Liabilities | | |
Payable for investments purchased | $ 3,546 | |
Payable for fund shares redeemed | 3,300 | |
Accrued management fee | 1,039 | |
Distribution and service plan fees payable | 468 | |
Other affiliated payables | 443 | |
Other payables and accrued expenses | 2,666 | |
Collateral on securities loaned, at value | 18,561 | |
Total liabilities | | 30,023 |
| | |
Net Assets | | $ 1,911,477 |
Net Assets consist of: | | |
Paid in capital | | $ 4,218,295 |
Undistributed net investment income | | 18,417 |
Accumulated undistributed net realized gain (loss) on investments and foreign currency transactions | | (2,661,534) |
Net unrealized appreciation (depreciation) on investments and assets and liabilities in foreign currencies | | 336,299 |
Net Assets | | $ 1,911,477 |
See accompanying notes which are an integral part of the financial statements.
Annual Report
Statement of Assets and Liabilities - continued
Amounts in thousands (except per-share amounts) | October 31, 2014 |
| | |
Calculation of Maximum Offering Price Class A:
Net Asset Value and redemption price per share ($693,064 ÷ 35,431 shares) | | $ 19.56 |
| | |
Maximum offering price per share (100/94.25 of $19.56) | | $ 20.75 |
Class T:
Net Asset Value and redemption price per share ($283,584 ÷ 14,630 shares) | | $ 19.38 |
| | |
Maximum offering price per share (100/96.50 of $19.38) | | $ 20.08 |
Class B:
Net Asset Value and offering price per share ($19,140 ÷ 1,021 shares)A | | $ 18.75 |
| | |
Class C:
Net Asset Value and offering price per share ($243,431 ÷ 13,034 shares)A | | $ 18.68 |
| | |
| | |
Institutional Class:
Net Asset Value, offering price and redemption price per share ($648,208 ÷ 32,552 shares) | | $ 19.91 |
| | |
Class Z:
Net Asset Value, offering price and redemption price per share ($24,050 ÷ 1,207 shares) | | $ 19.93 |
A Redemption price per share is equal to net asset value less any applicable contingent deferred sales charge.
See accompanying notes which are an integral part of the financial statements.
Annual Report
Financial Statements - continued
Statement of Operations
Amounts in thousands | Year ended October 31, 2014 |
| | |
Investment Income | | |
Dividends | | $ 45,009 |
Special dividends | | 9,777 |
Income from Fidelity Central Funds | | 926 |
Income before foreign taxes withheld | | 55,712 |
Less foreign taxes withheld | | (3,501) |
Total income | | 52,211 |
| | |
Expenses | | |
Management fee | $ 13,964 | |
Transfer agent fees | 4,638 | |
Distribution and service plan fees | 6,276 | |
Accounting and security lending fees | 896 | |
Custodian fees and expenses | 249 | |
Independent trustees' compensation | 8 | |
Registration fees | 116 | |
Audit | 86 | |
Legal | 8 | |
Miscellaneous | 17 | |
Total expenses before reductions | 26,258 | |
Expense reductions | (27) | 26,231 |
Net investment income (loss) | | 25,980 |
Realized and Unrealized Gain (Loss) Net realized gain (loss) on: | | |
Investment securities: | | |
Unaffiliated issuers | 173,972 | |
Foreign currency transactions | (234) | |
Futures contracts | 550 | |
Total net realized gain (loss) | | 174,288 |
Change in net unrealized appreciation (depreciation) on: Investment securities (net of increase in deferred foreign taxes of $21) | (153,249) | |
Assets and liabilities in foreign currencies | (168) | |
Futures contracts | (491) | |
Total change in net unrealized appreciation (depreciation) | | (153,908) |
Net gain (loss) | | 20,380 |
Net increase (decrease) in net assets resulting from operations | | $ 46,360 |
See accompanying notes which are an integral part of the financial statements.
Annual Report
Statement of Changes in Net Assets
Amounts in thousands | Year ended
October 31,
2014 | Year ended
October 31,
2013 |
Increase (Decrease) in Net Assets | | |
Operations | | |
Net investment income (loss) | $ 25,980 | $ 19,442 |
Net realized gain (loss) | 174,288 | 196,674 |
Change in net unrealized appreciation (depreciation) | (153,908) | 237,976 |
Net increase (decrease) in net assets resulting
from operations | 46,360 | 454,092 |
Distributions to shareholders from net investment income | (17,375) | (23,595) |
Distributions to shareholders from net realized gain | (17,564) | (7,342) |
Total distributions | (34,939) | (30,937) |
Share transactions - net increase (decrease) | (109,770) | (330,363) |
Redemption fees | 19 | 17 |
Total increase (decrease) in net assets | (98,330) | 92,809 |
| | |
Net Assets | | |
Beginning of period | 2,009,807 | 1,916,998 |
End of period (including undistributed net investment income of $18,417 and undistributed net investment income of $17,279, respectively) | $ 1,911,477 | $ 2,009,807 |
See accompanying notes which are an integral part of the financial statements.
Annual Report
Financial Highlights - Class A
Years ended October 31, | 2014 | 2013 | 2012 | 2011 | 2010 |
Selected Per-Share Data | | | | | |
Net asset value, beginning of period | $ 19.47 | $ 15.63 | $ 14.61 | $ 15.63 | $ 14.25 |
Income from Investment Operations | | | | | |
Net investment income (loss) C | .27F | .19 | .18 | .22G | .14 |
Net realized and unrealized gain (loss) | .17 | 3.92 | 1.03 | (1.01) | 1.44 |
Total from investment operations | .44 | 4.11 | 1.21 | (.79) | 1.58 |
Distributions from net investment income | (.18) | (.21) | (.19) | (.20) | (.19) |
Distributions from net realized gain | (.17) | (.06) | - | (.03) | (.01) |
Total distributions | (.35) | (.27) | (.19) | (.23) | (.20) |
Redemption fees added to paid in capital C, I | - | - | - | - | - |
Net asset value, end of period | $ 19.56 | $ 19.47 | $ 15.63 | $ 14.61 | $ 15.63 |
Total ReturnA, B | 2.28% | 26.69% | 8.47% | (5.15)% | 11.17% |
Ratios to Average Net Assets D, H | | | | | |
Expenses before reductions | 1.26% | 1.31% | 1.32% | 1.31% | 1.32% |
Expenses net of fee waivers, if any | 1.26% | 1.30% | 1.32% | 1.31% | 1.32% |
Expenses net of all reductions | 1.26% | 1.28% | 1.31% | 1.29% | 1.30% |
Net investment income (loss) | 1.34% F | 1.08% | 1.20% | 1.38% G | .95% |
Supplemental Data | | | | | |
Net assets, end of period (in millions) | $ 693 | $ 756 | $ 762 | $ 916 | $ 1,302 |
Portfolio turnover rateE | 40% | 50% | 34% | 48% | 59% |
A Total returns would have been lower if certain expenses had not been reduced during the applicable periods shown.
B Total returns do not include the effect of the sales charges.
C Calculated based on average shares outstanding during the period.
D Fees and expenses of any underlying Fidelity Central Funds are not included in the Fund's expense ratio. The Fund indirectly bears its proportionate share of the expenses of any underlying Fidelity Central Funds.
E Amount does not include the portfolio activity of any underlying Fidelity Central Funds.
F Investment income per share reflects a large, non-recurring dividend which amounted to $.10 per share. Excluding this non-recurring dividend, the ratio of net investment income (loss) to average net assets would have been .85%.
G Investment income per share reflects a large, non-recurring dividend which amounted to $.06 per share. Excluding this non-recurring dividend, the ratio of net investment income (loss) to average net assets would have been .98%.
H Expense ratios reflect operating expenses of the class. Expenses before reductions do not reflect amounts reimbursed by the investment adviser or reductions from brokerage service arrangements or reductions from other expense offset arrangements and do not represent the amount paid by the class during periods when reimbursements or reductions occur. Expenses net of fee waivers reflect expenses after reimbursement by the investment adviser but prior to reductions from brokerage service arrangements or other expense offset arrangements. Expenses net of all reductions represent the net expenses paid by the class.
I Amount represents less than $.01 per share.
See accompanying notes which are an integral part of the financial statements.
Annual Report
Financial Highlights - Class T
Years ended October 31, | 2014 | 2013 | 2012 | 2011 | 2010 |
Selected Per-Share Data | | | | | |
Net asset value, beginning of period | $ 19.30 | $ 15.49 | $ 14.46 | $ 15.47 | $ 14.11 |
Income from Investment Operations | | | | | |
Net investment income (loss) C | .21F | .14 | .14 | .18G | .10 |
Net realized and unrealized gain (loss) | .18 | 3.89 | 1.03 | (.99) | 1.43 |
Total from investment operations | .39 | 4.03 | 1.17 | (.81) | 1.53 |
Distributions from net investment income | (.14) | (.16) | (.14) | (.16) | (.16) |
Distributions from net realized gain | (.17) | (.06) | - | (.03) | (.01) |
Total distributions | (.31) | (.22) | (.14) | (.20) J | (.17) |
Redemption fees added to paid in capital C, I | - | - | - | - | - |
Net asset value, end of period | $ 19.38 | $ 19.30 | $ 15.49 | $ 14.46 | $ 15.47 |
Total ReturnA, B | 2.04% | 26.37% | 8.17% | (5.35)% | 10.88% |
Ratios to Average Net Assets D, H | | | | | |
Expenses before reductions | 1.51% | 1.55% | 1.58% | 1.55% | 1.55% |
Expenses net of fee waivers, if any | 1.51% | 1.55% | 1.58% | 1.55% | 1.55% |
Expenses net of all reductions | 1.51% | 1.53% | 1.57% | 1.53% | 1.53% |
Net investment income (loss) | 1.09% F | .83% | .94% | 1.14% G | .71% |
Supplemental Data | | | | | |
Net assets, end of period (in millions) | $ 284 | $ 319 | $ 304 | $ 404 | $ 621 |
Portfolio turnover rateE | 40% | 50% | 34% | 48% | 59% |
A Total returns would have been lower if certain expenses had not been reduced during the applicable periods shown.
B Total returns do not include the effect of the sales charges.
C Calculated based on average shares outstanding during the period.
D Fees and expenses of any underlying Fidelity Central Funds are not included in the Fund's expense ratio. The Fund indirectly bears its proportionate share of the expenses of any underlying Fidelity Central Funds.
E Amount does not include the portfolio activity of any underlying Fidelity Central Funds.
F Investment income per share reflects a large, non-recurring dividend which amounted to $.10 per share. Excluding this non-recurring dividend, the ratio of net investment income (loss) to average net assets would have been .60%.
G Investment income per share reflects a large, non-recurring dividend which amounted to $.06 per share. Excluding this non-recurring dividend, the ratio of net investment income (loss) to average net assets would have been .74%.
H Expense ratios reflect operating expenses of the class. Expenses before reductions do not reflect amounts reimbursed by the investment adviser or reductions from brokerage service arrangements or reductions from other expense offset arrangements and do not represent the amount paid by the class during periods when reimbursements or reductions occur. Expenses net of fee waivers reflect expenses after reimbursement by the investment adviser but prior to reductions from brokerage service arrangements or other expense offset arrangements. Expenses net of all reductions represent the net expenses paid by the class.
I Amount represents less than $.01 per share.
J Total distributions of $.20 per share is comprised of distributions from net investment income of $.164 and distributions from net realized gain of $.034 per share.
See accompanying notes which are an integral part of the financial statements.
Annual Report
Financial Highlights - Class B
Years ended October 31, | 2014 | 2013 | 2012 | 2011 | 2010 |
Selected Per-Share Data | | | | | |
Net asset value, beginning of period | $ 18.65 | $ 14.95 | $ 13.91 | $ 14.91 | $ 13.61 |
Income from Investment Operations | | | | | |
Net investment income (loss) C | .10F | .05 | .06 | .09G | .02 |
Net realized and unrealized gain (loss) | .17 | 3.77 | 1.00 | (.96) | 1.38 |
Total from investment operations | .27 | 3.82 | 1.06 | (.87) | 1.40 |
Distributions from net investment income | - | (.06) | (.02) | (.10) | (.09) |
Distributions from net realized gain | (.17) | (.06) | - | (.03) | (.01) |
Total distributions | (.17) | (.12) | (.02) | (.13) | (.10) |
Redemption fees added to paid in capital C, I | - | - | - | - | - |
Net asset value, end of period | $ 18.75 | $ 18.65 | $ 14.95 | $ 13.91 | $ 14.91 |
Total ReturnA, B | 1.45% | 25.72% | 7.64% | (5.89)% | 10.34% |
Ratios to Average Net Assets D, H | | | | | |
Expenses before reductions | 2.07% | 2.08% | 2.08% | 2.08% | 2.09% |
Expenses net of fee waivers, if any | 2.07% | 2.08% | 2.08% | 2.08% | 2.09% |
Expenses net of all reductions | 2.07% | 2.06% | 2.07% | 2.06% | 2.07% |
Net investment income (loss) | .53%F | .30% | .44% | .61%G | .18% |
Supplemental Data | | | | | |
Net assets, end of period (in millions) | $ 19 | $ 36 | $ 59 | $ 94 | $ 157 |
Portfolio turnover rateE | 40% | 50% | 34% | 48% | 59% |
A Total returns would have been lower if certain expenses had not been reduced during the applicable periods shown.
B Total returns do not include the effect of the contingent deferred sales charge.
C Calculated based on average shares outstanding during the period.
D Fees and expenses of any underlying Fidelity Central Funds are not included in the Fund's expense ratio. The Fund indirectly bears its proportionate share of the expenses of any underlying Fidelity Central Funds.
E Amount does not include the portfolio activity of any underlying Fidelity Central Funds.
F Investment income per share reflects a large, non-recurring dividend which amounted to $.09 per share. Excluding this non-recurring dividend, the ratio of net investment income (loss) to average net assets would have been .04%.
G Investment income per share reflects a large, non-recurring dividend which amounted to $.06 per share. Excluding this non-recurring dividend, the ratio of net investment income (loss) to average net assets would have been .21%.
H Expense ratios reflect operating expenses of the class. Expenses before reductions do not reflect amounts reimbursed by the investment adviser or reductions from brokerage service arrangements or reductions from other expense offset arrangements and do not represent the amount paid by the class during periods when reimbursements or reductions occur. Expenses net of fee waivers reflect expenses after reimbursement by the investment adviser but prior to reductions from brokerage service arrangements or other expense offset arrangements. Expenses net of all reductions represent the net expenses paid by the class.
I Amount represents less than $.01 per share.
See accompanying notes which are an integral part of the financial statements.
Annual Report
Financial Highlights - Class C
Years ended October 31, | 2014 | 2013 | 2012 | 2011 | 2010 |
Selected Per-Share Data | | | | | |
Net asset value, beginning of period | $ 18.63 | $ 14.97 | $ 13.95 | $ 14.95 | $ 13.65 |
Income from Investment Operations | | | | | |
Net investment income (loss) C | .11F | .06 | .06 | .10G | .03 |
Net realized and unrealized gain (loss) | .18 | 3.75 | 1.01 | (.96) | 1.38 |
Total from investment operations | .29 | 3.81 | 1.07 | (.86) | 1.41 |
Distributions from net investment income | (.07) | (.09) | (.05) | (.11) | (.10) |
Distributions from net realized gain | (.17) | (.06) | - | (.03) | (.01) |
Total distributions | (.24) | (.15) | (.05) | (.14) | (.11) |
Redemption fees added to paid in capital C, I | - | - | - | - | - |
Net asset value, end of period | $ 18.68 | $ 18.63 | $ 14.97 | $ 13.95 | $ 14.95 |
Total ReturnA, B | 1.58% | 25.71% | 7.71% | (5.83)% | 10.32% |
Ratios to Average Net Assets D, H | | | | | |
Expenses before reductions | 2.00% | 2.04% | 2.06% | 2.05% | 2.06% |
Expenses net of fee waivers, if any | 2.00% | 2.04% | 2.06% | 2.05% | 2.06% |
Expenses net of all reductions | 2.00% | 2.01% | 2.05% | 2.03% | 2.04% |
Net investment income (loss) | .60%F | .35% | .46% | .64%G | .21% |
Supplemental Data | | | | | |
Net assets, end of period (in millions) | $ 243 | $ 264 | $ 246 | $ 302 | $ 419 |
Portfolio turnover rateE | 40% | 50% | 34% | 48% | 59% |
A Total returns would have been lower if certain expenses had not been reduced during the applicable periods shown.
B Total returns do not include the effect of the contingent deferred sales charge.
C Calculated based on average shares outstanding during the period.
D Fees and expenses of any underlying Fidelity Central Funds are not included in the Fund's expense ratio. The Fund indirectly bears its proportionate share of the expenses of any underlying Fidelity Central Funds.
E Amount does not include the portfolio activity of any underlying Fidelity Central Funds.
F Investment income per share reflects a large, non-recurring dividend which amounted to $.09 per share. Excluding this non-recurring dividend, the ratio of net investment income (loss) to average net assets would have been .11%.
G Investment income per share reflects a large, non-recurring dividend which amounted to $.06 per share. Excluding this non-recurring dividend, the ratio of net investment income (loss) to average net assets would have been .24%.
H Expense ratios reflect operating expenses of the class. Expenses before reductions do not reflect amounts reimbursed by the investment adviser or reductions from brokerage service arrangements or reductions from other expense offset arrangements and do not represent the amount paid by the class during periods when reimbursements or reductions occur. Expenses net of fee waivers reflect expenses after reimbursement by the investment adviser but prior to reductions from brokerage service arrangements or other expense offset arrangements. Expenses net of all reductions represent the net expenses paid by the class.
I Amount represents less than $.01 per share.
See accompanying notes which are an integral part of the financial statements.
Annual Report
Financial Highlights - Institutional Class
Years ended October 31, | 2014 | 2013 | 2012 | 2011 | 2010 |
Selected Per-Share Data | | | | | |
Net asset value, beginning of period | $ 19.80 | $ 15.90 | $ 14.87 | $ 15.90 | $ 14.48 |
Income from Investment Operations | | | | | |
Net investment income (loss) B | .33E | .24 | .23 | .28F | .19 |
Net realized and unrealized gain (loss) | .18 | 3.98 | 1.05 | (1.03) | 1.47 |
Total from investment operations | .51 | 4.22 | 1.28 | (.75) | 1.66 |
Distributions from net investment income | (.23) | (.26) | (.25) | (.25) | (.23) |
Distributions from net realized gain | (.17) | (.06) | - | (.03) | (.01) |
Total distributions | (.40) | (.32) | (.25) | (.28) | (.24) |
Redemption fees added to paid in capital B,H | - | - | - | - | - |
Net asset value, end of period | $ 19.91 | $ 19.80 | $ 15.90 | $ 14.87 | $ 15.90 |
Total ReturnA | 2.60% | 27.03% | 8.83% | (4.85)% | 11.55% |
Ratios to Average Net Assets C, G | | | | | |
Expenses before reductions | .97% | .99% | 1.00% | .99% | .99% |
Expenses net of fee waivers, if any | .97% | .99% | 1.00% | .99% | .99% |
Expenses net of all reductions | .97% | .97% | .99% | .97% | .97% |
Net investment income (loss) | 1.63%E | 1.39% | 1.52% | 1.70%F | 1.28% |
Supplemental Data | | | | | |
Net assets, end of period (in millions) | $ 648 | $ 636 | $ 546 | $ 723 | $ 1,316 |
Portfolio turnover rateD | 40% | 50% | 34% | 48% | 59% |
A Total returns would have been lower if certain expenses had not been reduced during the applicable periods shown.
B Calculated based on average shares outstanding during the period.
C Fees and expenses of any underlying Fidelity Central Funds are not included in the Fund's expense ratio. The Fund indirectly bears its proportionate share of the expenses of any underlying Fidelity Central Funds.
D Amount does not include the portfolio activity of any underlying Fidelity Central Funds.
E Investment income per share reflects a large, non-recurring dividend which amounted to $.10 per share. Excluding this non-recurring dividend, the ratio of net investment income (loss) to average net assets would have been 1.14%.
F Investment income per share reflects a large, non-recurring dividend which amounted to $.06 per share. Excluding this non-recurring dividend, the ratio of net investment income (loss) to average net assets would have been 1.30%.
G Expense ratios reflect operating expenses of the class. Expenses before reductions do not reflect amounts reimbursed by the investment adviser or reductions from brokerage service arrangements or reductions from other expense offset arrangements and do not represent the amount paid by the class during periods when reimbursements or reductions occur. Expenses net of fee waivers reflect expenses after reimbursement by the investment adviser but prior to reductions from brokerage service arrangements or other expense offset arrangements. Expenses net of all reductions represent the net expenses paid by the class.
H Amount represents less than $.01 per share.
See accompanying notes which are an integral part of the financial statements.
Annual Report
Financial Highlights - Class Z
Years ended October 31, | 2014 | 2013H |
Selected Per-Share Data | | |
Net asset value, beginning of period | $ 19.81 | $ 18.54 |
Income from Investment Operations | | |
Net investment income (loss) D | .36G | .03 |
Net realized and unrealized gain (loss) | .19 | 1.24 |
Total from investment operations | .55 | 1.27 |
Distributions from net investment income | (.26) | - |
Distributions from net realized gain | (.17) | - |
Total distributions | (.43) | - |
Redemption fees added to paid in capital D | -J | - |
Net asset value, end of period | $ 19.93 | $ 19.81 |
Total ReturnB, C | 2.81% | 6.85% |
Ratios to Average Net Assets E, I | | |
Expenses before reductions | .81% | .83%A |
Expenses net of fee waivers, if any | .81% | .83%A |
Expenses net of all reductions | .81% | .80%A |
Net investment income (loss) | 1.79%G | .77%A |
Supplemental Data | | |
Net assets, end of period (000 omitted) | $ 24,050 | $ 107 |
Portfolio turnover rateF | 40% | 50% |
A Annualized
B Total returns for periods of less than one year are not annualized.
C Total returns would have been lower if certain expenses had not been reduced during the applicable periods shown.
D Calculated based on average shares outstanding during the period.
E Fees and expenses of any underlying Fidelity Central Funds are not included in the Fund's expense ratio. The Fund indirectly bears its proportionate share of the expenses of any underlying Fidelity Central Funds.
F Amount does not include the portfolio activity of any underlying Fidelity Central Funds.
G Investment income per share reflects a large, non-recurring dividend which amounted to $.10 per share. Excluding this non-recurring dividend, the ratio of net investment income (loss) to average net assets would have been 1.30%.
H For the period August 13, 2013 (commencement of sale of shares) to October 31, 2013.
I Expense ratios reflect operating expenses of the class. Expenses before reductions do not reflect amounts reimbursed by the investment adviser or reductions from brokerage service arrangements or reductions from other expense offset arrangements and do not represent the amount paid by the class during periods when reimbursements or reductions occur. Expenses net of fee waivers reflect expenses after reimbursement by the investment adviser but prior to reductions from brokerage service arrangements or other expense offset arrangements. Expenses net of all reductions represent the net expenses paid by the class.
J Amount represents less than $.01 per share.
See accompanying notes which are an integral part of the financial statements.
Annual Report
Notes to Financial Statements
For the period ended October 31, 2014
(Amounts in thousands except percentages)
1. Organization.
Fidelity Advisor Diversified International Fund (the Fund) is a fund of Fidelity Advisor Series VIII (the Trust) and is authorized to issue an unlimited number of shares. The Trust is registered under the Investment Company Act of 1940, as amended (the 1940 Act), as an open-end management investment company organized as a Massachusetts business trust. The Fund offers Class A, Class T, Class C, Institutional Class and Class Z shares, each of which, along with Class B shares, has equal rights as to assets and voting privileges. Class B shares are closed to new accounts and additional purchases, except for exchanges and reinvestments. Each class has exclusive voting rights with respect to matters that affect that class. Class B shares will automatically convert to Class A shares after a holding period of seven years from the initial date of purchase.
2. Investments in Fidelity Central Funds.
The Fund invests in Fidelity Central Funds, which are open-end investment companies generally available only to other investment companies and accounts managed by the investment adviser and its affiliates. The Fund's Schedule of Investments lists each of the Fidelity Central Funds held as of period end, if any, as an investment of the Fund, but does not include the underlying holdings of each Fidelity Central Fund. As an Investing Fund, the Fund indirectly bears its proportionate share of the expenses of the underlying Fidelity Central Funds.
The Money Market Central Funds seek preservation of capital and current income and are managed by Fidelity Investments Money Management, Inc. (FIMM), an affiliate of the investment adviser. Annualized expenses of the Money Market Central Funds as of their most recent shareholder report date are less than .01%.
A complete unaudited list of holdings for each Fidelity Central Fund is available upon request or at the Securities and Exchange Commission (the SEC) website at www.sec.gov. In addition, the financial statements of the Fidelity Central Funds, which are not covered by the Fund's Report of Independent Registered Public Accounting Firm, are available on the SEC website or upon request.
3. Significant Accounting Policies.
The financial statements have been prepared in conformity with accounting principles generally accepted in the United States of America (GAAP), which require management to make certain estimates and assumptions at the date of the financial statements. Actual results could differ from those estimates. Subsequent events, if any, through the date that the financial statements were issued have been evaluated in the preparation of
Annual Report
Notes to Financial Statements - continued
(Amounts in thousands except percentages)
3. Significant Accounting Policies - continued
the financial statements. The following summarizes the significant accounting policies of the Fund:
Investment Valuation. Investments are valued as of 4:00 p.m. Eastern time on the last calendar day of the period. In accordance with valuation policies and procedures approved by the Board of Trustees (the Board), the Fund attempts to obtain prices from one or more third party pricing vendors or brokers to value its investments. When current market prices, quotations or currency exchange rates are not readily available or reliable, investments will be fair valued in good faith by the Fidelity Management & Research Company (FMR) Fair Value Committee (the Committee), in accordance with procedures adopted by the Board. Factors used in determining fair value vary by investment type and may include market or investment specific events, changes in interest rates and credit quality. The frequency with which these procedures are used cannot be predicted and they may be utilized to a significant extent. The Committee oversees the Fund's valuation policies and procedures and is responsible for approving and reporting to the Board all fair value determinations.
The Fund categorizes the inputs to valuation techniques used to value its investments into a disclosure hierarchy consisting of three levels as shown below:
Level 1 - quoted prices in active markets for identical investments
Level 2 - other significant observable inputs (including quoted prices for similar investments, interest rates, prepayment speeds, etc.)
Level 3 - unobservable inputs (including the Fund's own assumptions based on the best information available)
Valuation techniques used to value the Fund's investments by major category are as follows:
Equity securities, including restricted securities, for which market quotations are readily available, are valued at the last reported sale price or official closing price as reported by a third party pricing vendor on the primary market or exchange on which they are traded and are categorized as Level 1 in the hierarchy. In the event there were no sales during the day or closing prices are not available, securities are valued at the last quoted bid price or may be valued using the last available price and are generally categorized as Level 2 in the hierarchy. For foreign equity securities, when market or security specific events arise, comparisons to the valuation of American Depositary Receipts (ADRs), futures contracts, Exchange-Traded Funds (ETFs) and certain indexes as well as quoted prices for similar securities may be used and would be categorized as Level 2 in the hierarchy. Utilizing these techniques may result in transfers between Level 1 and Level 2. For equity securities, including restricted securities, where observable inputs are limited, assumptions about market activity and risk are used and these securities may be categorized as Level 3 in the hierarchy.
Annual Report
3. Significant Accounting Policies - continued
Investment Valuation - continued
Debt securities, including restricted securities, are valued based on evaluated prices received from third party pricing vendors or from brokers who make markets in such securities. Preferred securities are valued by pricing vendors who utilize matrix pricing which considers yield or price of bonds of comparable quality, coupon, maturity and type or by broker-supplied prices. When independent prices are unavailable or unreliable, debt securities may be valued utilizing pricing methodologies which consider similar factors that would be used by third party pricing vendors. Debt securities are generally categorized as Level 2 in the hierarchy but may be Level 3 depending on the circumstances. ETFs are valued at their last sale price or official closing price as reported by a third party pricing vendor on the primary market or exchange on which they are traded and are categorized as Level 1 in the hierarchy. In the event there were no sales during the day but the exchange reports a closing bid level, ETFs are valued at the closing bid and would be categorized as Level 1 in the hierarchy. In the event there was no closing bid, ETFs may be valued by another method that the Board believes reflects fair value in accordance with the Board's fair value pricing policies and may be categorized as Level 2 in the hierarchy.
Investments in open-end mutual funds, including the Fidelity Central Funds, are valued at their closing net asset value (NAV) each business day and are categorized as Level 1 in the hierarchy.
Changes in valuation techniques may result in transfers in or out of an assigned level within the disclosure hierarchy. The aggregate value of investments by input level, as of October 31, 2014, including information on transfers between Levels 1 and 2, is included at the end of the Fund's Schedule of Investments.
Foreign Currency. The Fund may use foreign currency contracts to facilitate transactions in foreign-denominated securities. Gains and losses from these transactions may arise from changes in the value of the foreign currency or if the counterparties do not perform under the contracts' terms.
Foreign-denominated assets, including investment securities, and liabilities are translated into U.S. dollars at the exchange rates at period end. Purchases and sales of investment securities, income and dividends received and expenses denominated in foreign currencies are translated into U.S. dollars at the exchange rate in effect on the transaction date.
The effects of exchange rate fluctuations on investments are included with the net realized and unrealized gain (loss) on investment securities. Other foreign currency transactions resulting in realized and unrealized gain (loss) are disclosed separately.
Annual Report
Notes to Financial Statements - continued
(Amounts in thousands except percentages)
3. Significant Accounting Policies - continued
Investment Transactions and Income. For financial reporting purposes, the Fund's investment holdings and NAV include trades executed through the end of the last business day of the period. The NAV per share for processing shareholder transactions is calculated as of the close of business of the New York Stock Exchange (NYSE), normally 4:00 p.m. Eastern time and includes trades executed through the end of the prior business day. Gains and losses on securities sold are determined on the basis of identified cost and may include proceeds received from litigation. Dividend income is recorded on the ex-dividend date, except for certain dividends from foreign securities where the ex-dividend date may have passed, which are recorded as soon as the Fund is informed of the ex-dividend date. Non-cash dividends included in dividend income, if any, are recorded at the fair market value of the securities received. Income and capital gain distributions from Fidelity Central Funds, if any, are recorded on the ex-dividend date. Distributions received on securities that represent a return of capital or capital gain are recorded as a reduction of cost of investments and/or as a realized gain. Subsequent to ex-dividend date the Fund determines the components of these distributions, based upon receipt of tax filings or other correspondence relating to the underlying investment. Large, non-recurring dividends recognized by the Fund are presented separately on the Statement of Operations as "Special Dividends" and the impact of these dividends is presented in the Financial Highlights. Interest income is accrued as earned and includes coupon interest and amortization of premium and accretion of discount on debt securities as applicable. Investment income is recorded net of foreign taxes withheld where recovery of such taxes is uncertain.
Class Allocations and Expenses. Investment income, realized and unrealized capital gains and losses, common expenses of the Fund, and certain fund-level expense reductions, if any, are allocated daily on a pro-rata basis to each class based on the relative net assets of each class to the total net assets of the Fund. Each class differs with respect to transfer agent and distribution and service plan fees incurred. Certain expense reductions may also differ by class. For the reporting period, the allocated portion of income and expenses to each class as a percent of its average net assets may vary due to the timing of recording these transactions in relation to fluctuating net assets of the classes. Expenses directly attributable to a fund are charged to that fund. Expenses attributable to more than one fund are allocated among the respective funds on the basis of relative net assets or other appropriate methods. Expense estimates are accrued in the period to which they relate and adjustments are made when actual amounts are known.
Deferred Trustee Compensation. Under a Deferred Compensation Plan (the Plan), independent Trustees may elect to defer receipt of a portion of their annual compensation. Deferred amounts are invested in a cross-section of Fidelity funds, are marked-to-market and remain in the Fund until distributed in accordance with the Plan. The
Annual Report
3. Significant Accounting Policies - continued
Deferred Trustee Compensation - continued
investment of deferred amounts and the offsetting payable to the Trustees are included in the accompanying Statement of Assets and Liabilities.
Income Tax Information and Distributions to Shareholders. Each year, the Fund intends to qualify as a regulated investment company under Subchapter M of the Internal Revenue Code, including distributing substantially all of its taxable income and realized gains. As a result, no provision for U.S. Federal income taxes is required. As of October 31, 2014, the Fund did not have any unrecognized tax benefits in the financial statements; nor is the Fund aware of any tax positions for which it is reasonably possible that the total amounts of unrecognized tax benefits will significantly change in the next twelve months. The Fund files a U.S. federal tax return, in addition to state and local tax returns as required. The Fund's federal income tax returns are subject to examination by the Internal Revenue Service (IRS) for a period of three fiscal years after they are filed. State and local tax returns may be subject to examination for an additional fiscal year depending on the jurisdiction. Foreign taxes are provided for based on the Fund's understanding of the tax rules and rates that exist in the foreign markets in which it invests. The Fund is subject to a tax imposed on capital gains by certain countries in which it invests. An estimated deferred tax liability for net unrealized appreciation on the applicable securities is included in Other payables and accrued expenses on the Statement of Assets & Liabilities.
Distributions are declared and recorded on the ex-dividend date. Income dividends and capital gain distributions are declared separately for each class. Income and capital gain distributions are determined in accordance with income tax regulations, which may differ from GAAP.
Capital accounts within the financial statements are adjusted for permanent book-tax differences. These adjustments have no impact on net assets or the results of operations. Capital accounts are not adjusted for temporary book-tax differences which will reverse in a subsequent period.
Book-tax differences are primarily due to foreign currency transactions, passive foreign investment companies (PFIC), deferred trustees compensation, futures transactions, partnerships, capital loss carryforwards, and losses deferred due to wash sales.
The federal tax cost of investment securities and unrealized appreciation (depreciation) as of period end were as follows:
Gross unrealized appreciation | $ 401,047 |
Gross unrealized depreciation | (78,289) |
Net unrealized appreciation (depreciation) on securities | $ 322,758 |
Tax Cost | $ 1,604,526 |
Annual Report
Notes to Financial Statements - continued
(Amounts in thousands except percentages)
3. Significant Accounting Policies - continued
Income Tax Information and Distributions to Shareholders - continued
The tax-based components of distributable earnings as of period end were as follows:
Undistributed ordinary income | $ 18,554 |
Capital loss carryforward | $ (2,645,401) |
Net unrealized appreciation (depreciation) on securities and other investments | $ 322,566 |
Capital loss carryforwards are only available to offset future capital gains of the Fund to the extent provided by regulations and may be limited. Under the Regulated Investment Company Modernization Act of 2010 (the Act), the Fund is permitted to carry forward capital losses incurred in taxable years beginning after December 22, 2010 for an unlimited period and such capital losses are required to be used prior to any losses that expire. The capital loss carryforward information presented below, including any applicable limitation, is estimated as of fiscal period end and is subject to adjustment.
Fiscal year of expiration | |
2017 | $ (2,645,401) |
The tax character of distributions paid was as follows:
| October 31, 2014 | October 31, 2013 |
Ordinary Income | $ 34,939 | $ 30,937 |
Short-Term Trading (Redemption) Fees. Shares held by investors in the Fund less than 30 days may have been subject to a redemption fee equal to 1.00% of the NAV of shares redeemed. All redemption fees, which reduce the proceeds of the shareholder redemption, are retained by the Fund and accounted for as an addition to paid in capital.
Restricted Securities. The Fund may invest in securities that are subject to legal or contractual restrictions on resale. These securities generally may be resold in transactions exempt from registration or to the public if the securities are registered. Disposal of these securities may involve time-consuming negotiations and expense, and prompt sale at an acceptable price may be difficult. Information regarding restricted securities is included at the end of the Fund's Schedule of Investments.
New Accounting Pronouncement. In June 2014, the Financial Accounting Standards Board issued Accounting Standard Update No. 2014-11, Repurchase-to-Maturity Transactions, Repurchase Financings, and Disclosures. The Update amends the accounting for certain repurchase agreements and expands disclosure requirements for reverse repurchase agreements, securities lending and other similar transactions. The disclosure requirements are effective for annual and interim reporting periods beginning after December 15, 2014. Management is currently evaluating the impact of the Update on the Fund's financial statements and related disclosures.
Annual Report
4. Derivative Instruments.
Risk Exposures and the Use of Derivative Instruments. The Fund's investment objective allows the Fund to enter into various types of derivative contracts, including futures contracts. Derivatives are investments whose value is primarily derived from underlying assets, indices or reference rates and may be transacted on an exchange or over-the-counter (OTC). Derivatives may involve a future commitment to buy or sell a specified asset based on specified terms, to exchange future cash flows at periodic intervals based on a notional principal amount, or for one party to make one or more payments upon the occurrence of specified events in exchange for periodic payments from the other party.
The Fund used derivatives to increase returns and to manage exposure to certain risks as defined below. The success of any strategy involving derivatives depends on analysis of numerous economic factors, and if the strategies for investment do not work as intended, the Fund may not achieve its objectives.
The Fund's use of derivatives increased or decreased its exposure to the following risk:
Equity Risk | Equity risk relates to the fluctuations in the value of financial instruments as a result of changes in market prices (other than those arising from interest rate risk or foreign exchange risk), whether caused by factors specific to an individual investment, its issuer, or all factors affecting all instruments traded in a market or market segment. |
The Fund is also exposed to additional risks from investing in derivatives, such as liquidity risk and counterparty credit risk. Liquidity risk is the risk that the Fund will be unable to close out the derivative in the open market in a timely manner. Counterparty credit risk is the risk that the counterparty will not be able to fulfill its obligation to the Fund. Counterparty credit risk related to exchange-traded futures contracts may be mitigated by the protection provided by the exchange on which they trade.
Investing in derivatives may involve greater risks than investing in the underlying assets directly and, to varying degrees, may involve risk of loss in excess of any initial investment and collateral received and amounts recognized in the Statement of Assets and Liabilities. In addition, there may be the risk that the change in value of the derivative contract does not correspond to the change in value of the underlying instrument.
Futures Contracts. A futures contract is an agreement between two parties to buy or sell a specified underlying instrument for a fixed price at a specified future date. The Fund used futures contracts to manage its exposure to the stock market.
Upon entering into a futures contract, a fund is required to deposit either cash or securities (initial margin) with a clearing broker in an amount equal to a certain percentage of the face value of the contract. Futures contracts are marked-to-market daily and subsequent daily payments (variation margin) are made or received by a fund depending on
Annual Report
Notes to Financial Statements - continued
(Amounts in thousands except percentages)
4. Derivative Instruments - continued
Futures Contracts - continued
the daily fluctuations in the value of the futures contracts and are recorded as unrealized appreciation or (depreciation). This receivable and/or payable, if any, is included in daily variation margin for derivative instruments in the Statement of Assets and Liabilities. Realized gain or (loss) is recorded upon the expiration or closing of a futures contract.
Any open futures contracts at period end are presented in the Schedule of Investments under the caption "Futures Contracts." The underlying face amount at value reflects each contract's exposure to the underlying instrument or index at period end. Securities deposited to meet initial margin requirements are identified in the Schedule of Investments
During the period the Fund recognized net realized gain (loss) of $550 and a change in net unrealized appreciation (depreciation) of $(491) related to its investment in futures contracts. This amount is included in the Statement of Operations.
5. Purchases and Sales of Investments.
Purchases and sales of securities, other than short-term securities, aggregated $792,312 and $925,506, respectively.
6. Fees and Other Transactions with Affiliates.
Management Fee. Fidelity Management & Research Company (the investment adviser) and its affiliates provide the Fund with investment management related services for which the Fund pays a monthly management fee. The management fee is the sum of an individual fund fee rate that is based on an annual rate of .424% of the Fund's average net assets and an annualized group fee rate that averaged .25% during the period. Prior to August 1, 2014 the individual fund fee rate was .45%. The group fee rate is based upon the average net assets of all the mutual funds advised by the investment adviser, including any mutual funds previously advised by the investment adviser that are currently advised by Fidelity SelectCo, LLC, an affiliate of the investment adviser. The group fee rate decreases as assets under management increase and increases as assets under management decrease. For the reporting period, the total annual management fee rate was .69% of the Fund's average net assets.
Distribution and Service Plan Fees. In accordance with Rule 12b-1 of the 1940 Act, the Fund has adopted separate Distribution and Service Plans for each class of shares. Certain classes pay Fidelity Distributors Corporation (FDC), an affiliate of the investment adviser, separate Distribution and Service Fees, each of which is based on an annual percentage of each class' average net assets. In addition, FDC may pay financial intermediaries for selling shares of the Fund and providing shareholder support services.
Annual Report
6. Fees and Other Transactions with Affiliates - continued
Distribution and Service Plan Fees - continued
For the period, the Distribution and Service Fee rates, total fees and amounts retained by FDC were as follows:
| Distribution
Fee | Service
Fee | Total Fees | Retained
by FDC |
Class A | -% | .25% | $ 1,866 | $ 12 |
Class T | .25% | .25% | 1,545 | 1 |
Class B | .75% | .25% | 273 | 206 |
Class C | .75% | .25% | 2,592 | 104 |
| | | $ 6,276 | $ 323 |
Sales Load. FDC may receive a front-end sales charge of up to 5.75% for selling Class A shares and 3.50% for selling Class T shares, some of which is paid to financial intermediaries for selling shares of the Fund. Depending on the holding period, FDC may receive contingent deferred sales charges levied on Class A, Class T, Class B, and Class C redemptions. The deferred sales charges range from 5.00% to 1.00% for Class B shares, 1.00% for Class C shares, 1.00% for certain purchases of Class A shares and .25% for certain purchases of Class T shares.
For the period, sales charge amounts retained by FDC were as follows:
| Retained
by FDC |
Class A | $ 92 |
Class T | 24 |
Class B* | 14 |
Class C* | 5 |
| $ 135 |
* When Class B and Class C shares are initially sold, FDC pays commissions from its own resources to financial intermediaries through which the sales are made.
Transfer Agent Fees. Fidelity Investments Institutional Operations Company, Inc., (FIIOC), an affiliate of the investment adviser FMR, is the transfer, dividend disbursing and shareholder servicing agent for each class of the Fund. FIIOC receives account fees and asset-based fees that vary according to the account size and type of account of the shareholders of the respective classes of the Fund, except for Class Z. FIIOC receives an asset-based fee of Class Z's average net assets. FIIOC pays for typesetting, printing and mailing of shareholder reports, except proxy statements.
Annual Report
Notes to Financial Statements - continued
(Amounts in thousands except percentages)
6. Fees and Other Transactions with Affiliates - continued
Transfer Agent Fees - continued
For the period, transfer agent fees for each class were as follows:
| Amount | % of
Class-Level Average
Net Assets |
Class A | $ 1,823 | .24 |
Class T | 758 | .25 |
Class B | 83 | .30 |
Class C | 613 | .24 |
Institutional Class | 1,357 | .21 |
Class Z | 4 | .05 |
| $ 4,638 | |
Accounting and Security Lending Fees. Fidelity Service Company, Inc. (FSC), an affiliate of the investment adviser, maintains the Fund's accounting records. The accounting fee is based on the level of average net assets for each month. Under a separate contract, FSC administers the security lending program. The security lending fee is based on the number and duration of lending transactions.
Brokerage Commissions. The Fund placed a portion of its portfolio transactions with brokerage firms which are affiliates of the investment adviser. Brokerage commissions are included in net realized gain (loss) and change in net unrealized appreciation (depreciation) in the Statement of Operations. The commissions paid to these affiliated firms were $3 for the period.
7. Committed Line of Credit.
The Fund participates with other funds managed by the investment adviser or an affiliate in a $4.25 billion credit facility (the "line of credit") to be utilized for temporary or emergency purposes to fund shareholder redemptions or for other short-term liquidity purposes. The Fund has agreed to pay commitment fees on its pro-rata portion of the line of credit, which amounted to $3 and is reflected in Miscellaneous expenses on the Statement of Operations. During the period, the Fund did not borrow on this line of credit.
8. Security Lending.
The Fund lends portfolio securities through a lending agent from time to time in order to earn additional income. For equity securities, a lending agent is used and may loan securities to certain qualified borrowers, including Fidelity Capital Markets (FCM), a
Annual Report
8. Security Lending - continued
broker-dealer affiliated with the Fund. On the settlement date of the loan, the Fund receives collateral (in the form of U.S. Treasury obligations, letters of credit and/or cash) against the loaned securities and maintains collateral in an amount not less than 100% of the market value of the loaned securities during the period of the loan. The market value of the loaned securities is determined at the close of business of the Fund and any additional required collateral is delivered to the Fund on the next business day. If the borrower defaults on its obligation to return the securities loaned because of insolvency or other reasons, the Fund may apply collateral received from the borrower against the obligation. The Fund may experience delays and costs in recovering the securities loaned. Any cash collateral received is invested in the Fidelity Securities Lending Cash Central Fund. The value of loaned securities and cash collateral at period end are disclosed on the Fund's Statement of Assets and Liabilities. At period end, there were no security loans outstanding with FCM. Security lending income represents the income earned on investing cash collateral, less rebates paid to borrowers and any lending agent fees associated with the loan, plus any premium payments received for lending certain types of securities. Security lending income is presented in the Statement of Operations as a component of income from Fidelity Central Funds. Total security lending income during the period amounted to $900, including $2 from securities loaned to FCM.
9. Expense Reductions.
Commissions paid to certain brokers with whom the investment adviser, or its affiliates, places trades on behalf of the Fund include an amount in addition to trade execution, which may be rebated back to the Fund to offset certain expenses. This amount totaled $27 for the period.
10. Distributions to Shareholders.
Distributions to shareholders of each class were as follows:
Years ended October 31, | 2014 | 2013 |
From net investment income | | |
Class A | $ 6,853 | $ 9,993 |
Class T | 2,251 | 3,119 |
Class B | - | 218 |
Class C | 979 | 1,491 |
Institutional Class | 7,291 | 8,774 |
Class Z | 1 | - |
Total | $ 17,375 | $ 23,595 |
Annual Report
Notes to Financial Statements - continued
(Amounts in thousands except percentages)
10. Distributions to Shareholders - continued
Years ended October 31, | 2014 | 2013 |
From net realized gain | | |
Class A | $ 6,584 | $ 2,917 |
Class T | 2,789 | 1,167 |
Class B | 307 | 229 |
Class C | 2,390 | 978 |
Institutional Class | 5,493 | 2,051 |
Class Z | 1 | - |
Total | $ 17,564 | $ 7,342 |
11. Share Transactions.
Share transactions for each class were as follows and may contain automatic conversions between classes or exchanges between funds:
| Shares | Shares | Dollars | Dollars |
Years ended October 31, | 2014 | 2013 A | 2014 | 2013 A |
Class A | | | | |
Shares sold | 4,795 | 5,624 | $ 94,751 | $ 97,285 |
Reinvestment of distributions | 646 | 758 | 12,430 | 12,002 |
Shares redeemed | (8,821) | (16,315) | (174,243) | (276,915) |
Net increase (decrease) | (3,380) | (9,933) | $ (67,062) | $ (167,628) |
Class T | | | | |
Shares sold | 1,185 | 1,308 | $ 23,252 | $ 22,307 |
Reinvestment of distributions | 249 | 255 | 4,764 | 4,007 |
Shares redeemed | (3,330) | (4,655) | (65,214) | (78,662) |
Net increase (decrease) | (1,896) | (3,092) | $ (37,198) | $ (52,348) |
Class B | | | | |
Shares sold | 29 | 17 | $ 537 | $ 283 |
Reinvestment of distributions | 15 | 26 | 278 | 396 |
Shares redeemed | (933) | (2,107) | (17,767) | (34,470) |
Net increase (decrease) | (889) | (2,064) | $ (16,952) | $ (33,791) |
Class C | | | | |
Shares sold | 874 | 787 | $ 16,572 | $ 13,034 |
Reinvestment of distributions | 149 | 129 | 2,754 | 1,968 |
Shares redeemed | (2,144) | (3,176) | (40,544) | (51,899) |
Net increase (decrease) | (1,121) | (2,260) | $ (21,218) | $ (36,897) |
Annual Report
11. Share Transactions - continued
| Shares | Shares | Dollars | Dollars |
Years ended October 31, | 2014 | 2013 A | 2014 | 2013 A |
Institutional Class | | | | |
Shares sold | 7,676 | 4,395 | $ 154,759 | $ 77,113 |
Reinvestment of distributions | 582 | 586 | 11,367 | 9,415 |
Shares redeemed | (7,810) | (7,233) | (158,739) | (126,327) |
Net increase (decrease) | 448 | (2,252) | $ 7,387 | $ (39,799) |
Class Z | | | | |
Shares sold | 1,246 | 5 | $ 26,144 | $ 100 |
Reinvestment of distributions | - | - | 2 | - |
Shares redeemed | (44) | - | (873) | - |
Net increase (decrease) | 1,202 | 5 | $ 25,273 | $ 100 |
A Share transactions for Class Z are for the period August 13, 2013 (commencement of sale of shares) to October 31, 2013.
12. Other.
The Fund's organizational documents provide former and current trustees and officers with a limited indemnification against liabilities arising in connection with the performance of their duties to the Fund. In the normal course of business, the Fund may also enter into contracts that provide general indemnifications. The Fund's maximum exposure under these arrangements is unknown as this would be dependent on future claims that may be made against the Fund. The risk of material loss from such claims is considered remote.
Annual Report
To the Trustees of Fidelity Advisor Series VIII and the Shareholders of
Fidelity Advisor Diversified International Fund:
In our opinion, the accompanying statement of assets and liabilities, including the schedule of investments, and the related statements of operations and of changes in net assets and the financial highlights present fairly, in all material respects, the financial position of Fidelity Advisor Diversified International Fund (a fund of Fidelity Advisor Series VIII) at October 31, 2014, the results of its operations for the year then ended, the changes in its net assets for each of the two years in the period then ended and the financial highlights for each of the periods indicated, in conformity with accounting principles generally accepted in the United States of America. These financial statements and financial highlights (hereafter referred to as "financial statements") are the responsibility of the Fidelity Advisor Diversified International Fund's management. Our responsibility is to express an opinion on these financial statements based on our audits. We conducted our audits of these financial statements in accordance with the standards of the Public Company Accounting Oversight Board (United States). Those standards require that we plan and perform the audit to obtain reasonable assurance about whether the financial statements are free of material misstatement. An audit includes examining, on a test basis, evidence supporting the amounts and disclosures in the financial statements, assessing the accounting principles used and significant estimates made by management, and evaluating the overall financial statement presentation. We believe that our audits, which included confirmation of securities at October 31, 2014 by correspondence with the custodian and brokers, provide a reasonable basis for our opinion.
PricewaterhouseCoopers LLP
Boston, Massachusetts
December 17, 2014
Annual Report
The Trustees, Member of the Advisory Board, and officers of the trust and fund, as applicable, are listed below. The Board of Trustees governs the fund and is responsible for protecting the interests of shareholders. The Trustees are experienced executives who meet periodically throughout the year to oversee the fund's activities, review contractual arrangements with companies that provide services to the fund, oversee management of the risks associated with such activities and contractual arrangements, and review the fund's performance. Except for James C. Curvey, each of the Trustees oversees 174 funds. Mr. Curvey oversees 407 funds.
The Trustees hold office without limit in time except that (a) any Trustee may resign; (b) any Trustee may be removed by written instrument, signed by at least two-thirds of the number of Trustees prior to such removal; (c) any Trustee who requests to be retired or who has become incapacitated by illness or injury may be retired by written instrument signed by a majority of the other Trustees; and (d) any Trustee may be removed at any special meeting of shareholders by a two-thirds vote of the outstanding voting securities of the trust. Each Trustee who is not an interested person (as defined in the 1940 Act) of the trust and the fund (Independent Trustee), shall retire not later than the last day of the calendar year in which his or her 75th birthday occurs. The Independent Trustees may waive this mandatory retirement age policy with respect to individual Trustees. The officers and Advisory Board Member hold office without limit in time, except that any officer and Advisory Board Member may resign or may be removed by a vote of a majority of the Trustees at any regular meeting or any special meeting of the Trustees. Except as indicated, each individual has held the office shown or other offices in the same company for the past five years.
Experience, Skills, Attributes, and Qualifications of the Fund's Trustees. The Governance and Nominating Committee has adopted a statement of policy that describes the experience, qualifications, attributes, and skills that are necessary and desirable for potential Independent Trustee candidates (Statement of Policy). The Board believes that each Trustee satisfied at the time he or she was initially elected or appointed a Trustee, and continues to satisfy, the standards contemplated by the Statement of Policy. The Governance and Nominating Committee also engages professional search firms to help identify potential Independent Trustee candidates who have the experience, qualifications, attributes, and skills consistent with the Statement of Policy. From time to time, additional criteria based on the composition and skills of the current Independent Trustees, as well as experience or skills that may be appropriate in light of future changes to board composition, business conditions, and regulatory or other developments, have also been considered by the professional search firms and the Governance and Nominating Committee. In addition, the Board takes into account the Trustees' commitment and participation in Board and committee meetings, as well as their leadership of standing and ad hoc committees throughout their tenure.
In determining that a particular Trustee was and continues to be qualified to serve as a Trustee, the Board has considered a variety of criteria, none of which, in isolation, was controlling. The Board believes that, collectively, the Trustees have balanced and diverse experience, qualifications, attributes, and skills, which allow the Board to operate effectively in governing the fund and protecting the interests of shareholders. Information about the specific experience, skills, attributes, and qualifications of each Trustee, which in each case led to the Board's conclusion that the Trustee should serve (or continue to serve) as a trustee of the fund, is provided below.
Annual Report
Trustees and Officers - continued
Board Structure and Oversight Function. James C. Curvey is an interested person (as defined in the 1940 Act) and currently serves as Chairman. The Trustees have determined that an interested Chairman is appropriate and benefits shareholders because an interested Chairman has a personal and professional stake in the quality and continuity of services provided to the fund. Independent Trustees exercise their informed business judgment to appoint an individual of their choosing to serve as Chairman, regardless of whether the Trustee happens to be independent or a member of management. The Independent Trustees have determined that they can act independently and effectively without having an Independent Trustee serve as Chairman and that a key structural component for assuring that they are in a position to do so is for the Independent Trustees to constitute a substantial majority for the Board. The Independent Trustees also regularly meet in executive session. Ned C. Lautenbach serves as Chairman of the Independent Trustees and as such (i) acts as a liaison between the Independent Trustees and management with respect to matters important to the Independent Trustees and (ii) with management prepares agendas for Board meetings.
Fidelity funds are overseen by different Boards of Trustees. The fund's Board oversees Fidelity's equity and high income funds and another Board oversees Fidelity's investment-grade bond, money market, and asset allocation funds. The asset allocation funds may invest in Fidelity funds overseen by the fund's Board. The use of separate Boards, each with its own committee structure, allows the Trustees of each group of Fidelity funds to focus on the unique issues of the funds they oversee, including common research, investment, and operational issues. On occasion, the separate Boards establish joint committees to address issues of overlapping consequences for the Fidelity funds overseen by each Board.
The Trustees operate using a system of committees to facilitate the timely and efficient consideration of all matters of importance to the Trustees, the fund, and fund shareholders and to facilitate compliance with legal and regulatory requirements and oversight of the fund's activities and associated risks. The Board, acting through its committees, has charged FMR and its affiliates with (i) identifying events or circumstances the occurrence of which could have demonstrably adverse effects on the fund's business and/or reputation; (ii) implementing processes and controls to lessen the possibility that such events or circumstances occur or to mitigate the effects of such events or circumstances if they do occur; and (iii) creating and maintaining a system designed to evaluate continuously business and market conditions in order to facilitate the identification and implementation processes described in (i) and (ii) above. Because the day-to-day operations and activities of the fund are carried out by or through FMR, its affiliates and other service providers, the fund's exposure to risks is mitigated but not eliminated by the processes overseen by the Trustees. While each of the Board's committees has responsibility for overseeing different aspects of the fund's activities, oversight is exercised primarily through the Operations, Audit, and Compliance Committees. In addition, the Independent Trustees have worked with FMR to enhance the Board's oversight of investment and financial risks, legal and regulatory risks, technology risks, and operational risks, including the development of additional risk reporting to the Board. For example, a working group comprised of Independent Trustees and FMR has worked and continues to work to review the Fidelity funds' valuation-related activities, reporting and risk management. Appropriate personnel, including but not limited to the fund's Chief Compliance Officer (CCO), FMR's internal auditor, the independent accountants, the fund's Treasurer and portfolio management personnel, make periodic reports to the Board's committees, as appropriate, including an annual review of FMR's risk management program for the Fidelity funds. The responsibilities of each standing committee, including their oversight responsibilities, are described further under "Standing Committees of the Fund's Trustees."
Annual Report
The fund's Statement of Additional Information (SAI) includes more information about the Trustees. To request a free copy, call Fidelity at 1-877-208-0098.
Interested Trustees*:
Correspondence intended for each Trustee who is an interested person may be sent to Fidelity Investments, 245 Summer Street, Boston, Massachusetts 02210.
Name, Year of Birth; Principal Occupations and Other Relevant Experience+ |
James C. Curvey (1935) |
Year of Election or Appointment: 2007 Trustee Chairman of the Board of Trustees |
| Mr. Curvey also serves as Trustee of other Fidelity funds. Mr. Curvey is a Director of Fidelity Research & Analysis Co. (2009-present), and Vice Chairman (2007-present) and Director of FMR LLC. In addition, Mr. Curvey serves as an Overseer for the Boston Symphony Orchestra and a member of the board of Artis-Naples, Naples, Florida, and as a Trustee for Brewster Academy, Wolfeboro, New Hampshire. Previously, Mr. Curvey served as a Director of Fidelity Investments Money Management, Inc. (2009-2014), a Director of FMR (2007-2014), and a Director of FMR Co., Inc. (2007-2014). |
Charles S. Morrison (1960) |
Year of Election or Appointment: 2014 Trustee |
| Mr. Morrison also serves as Trustee of other funds. He serves as a Director of Fidelity Investments Money Management, Inc. (FIMM) (2014-present), Director of Fidelity SelectCo, LLC (2014-present), President, Asset Management (2014-present), and is an employee of Fidelity Investments. Previously, Mr. Morrison served as Vice President of Fidelity's Fixed Income and Asset Allocation Funds (2012-2014), President, Fixed Income (2011-2014), Vice President of Fidelity's Money Market Funds (2005-2009), President, Money Market Group Leader of FMR (2009), and Senior Vice President, Money Market Group of FMR (2004-2009). Mr. Morrison also served as Vice President of Fidelity's Bond Funds (2002-2005), certain Balanced Funds (2002-2005), and certain Asset Allocation Funds (2002-2007), and as Senior Vice President (2002-2005) of Fidelity's Bond Division. |
* Trustees have been determined to be "Interested Trustees" by virtue of, among other things, their affiliation with the trust or various entities under common control with FMR.
+ The information above includes each Trustee's principal occupation during the last five years and other information relating to the experience, attributes, and skills relevant to each Trustee's qualifications to serve as a Trustee, which led to the conclusion that each Trustee should serve as a Trustee for the fund.
Annual Report
Independent Trustees:
Correspondence intended for each Independent Trustee (that is, the Trustees other than the Interested Trustees) may be sent to Fidelity Investments, P.O. Box 55235, Boston, Massachusetts 02205-5235.
Name, Year of Birth; Principal Occupations and Other Relevant Experience+ |
Dennis J. Dirks (1948) |
Year of Election or Appointment: 2005 Trustee |
| Mr. Dirks also serves as Trustee of other Fidelity funds. Prior to his retirement in May 2003, Mr. Dirks was Chief Operating Officer and a member of the Board of The Depository Trust & Clearing Corporation (DTCC). He also served as President, Chief Operating Officer, and Board member of The Depository Trust Company (DTC) and President and Board member of the National Securities Clearing Corporation (NSCC). In addition, Mr. Dirks served as Chief Executive Officer and Board member of the Government Securities Clearing Corporation, Chief Executive Officer and Board member of the Mortgage-Backed Securities Clearing Corporation, as a Trustee and a member of the Finance Committee of Manhattan College (2005-2008), and as a Trustee and a member of the Finance Committee of AHRC of Nassau County (2006-2008). Mr. Dirks is a member of the Independent Directors Council (IDC) Governing Council (2010-present) and Board of Directors for The Brookville Center for Children's Services, Inc. (2009-present). |
Alan J. Lacy (1953) |
Year of Election or Appointment: 2008 Trustee |
| Mr. Lacy also serves as Trustee of other Fidelity funds. Mr. Lacy serves as Senior Adviser (2007-present) of Oak Hill Capital Partners, L.P. (private equity). Mr. Lacy also served as Chief Executive Officer (2000-2005) and Vice Chairman (2005-2006) of Sears Holdings Corporation and Sears, Roebuck and Co. (retail). In addition, Mr. Lacy serves as a member of the Board of Directors of Dave & Buster's Entertainment, Inc. (restaurant and entertainment complexes, 2010-present), Earth Fare, Inc. (retail grocery, 2012-present), The Hillman Companies, Inc. (hardware wholesalers, 2010-present), and Bristol-Myers Squibb Company (global pharmaceuticals, 2008-present). Mr. Lacy is a member of the Board of Trustees of The National Parks Conservation Association (2006-present). Previously, Mr. Lacy served as Chairman of the Board of Trustees of the National Parks Conservation Association (2008-2011) and as a member of the Board of Directors for the Western Union Company (global money transfer, 2006-2011). |
Ned C. Lautenbach (1944) |
Year of Election or Appointment: 2000 Trustee Chairman of the Independent Trustees |
| Mr. Lautenbach also serves as Trustee of other Fidelity funds. Mr. Lautenbach currently serves as the Lead Director of the Eaton Corporation Board of Directors (diversified industrial, 1997-present). Mr. Lautenbach is Chairman of the Board of Directors of the Philharmonic Center for the Arts in Naples, Florida (2012-present) and a member of the Council on Foreign Relations (1994-present). Previously, Mr. Lautenbach was a Partner/Advisory Partner at Clayton, Dubilier & Rice, LLC (private equity investment, 1998-2010), as well as a Director of Sony Corporation (2006-2007). |
Joseph Mauriello (1944) |
Year of Election or Appointment: 2008 Trustee |
| Mr. Mauriello also serves as Trustee of other Fidelity funds. Prior to his retirement in January 2006, Mr. Mauriello served in numerous senior management positions including Deputy Chairman and Chief Operating Officer (2004-2005), and Vice Chairman of Financial Services (2002-2004) of KPMG LLP US (professional services, 1965-2005). Mr. Mauriello currently serves as a member of the Board of Directors of XL Group plc. (global insurance and re-insurance, 2006-present). Previously, Mr. Mauriello served as a Director of the Hamilton Funds of the Bank of New York (2006-2007) and of Arcadia Resources Inc. (health care services and products, 2007-2012). |
Robert W. Selander (1950) |
Year of Election or Appointment: 2011 Trustee |
| Mr. Selander also serves as Trustee of other Fidelity funds. Previously, Mr. Selander served as a Member of the Advisory Board of other Fidelity funds (2011), and Executive Vice Chairman (2010), Chief Executive Officer (2009-2010), and President and Chief Executive Officer (1997-2009) of Mastercard, Inc. |
Cornelia M. Small (1944) |
Year of Election or Appointment: 2005 Trustee |
| Ms. Small also serves as Trustee of other Fidelity funds. Ms. Small is a member of the Board of Directors (2009-present) and Chair of the Investment Committee (2010-present) of the Teagle Foundation. Ms. Small also serves on the Investment Committee of the Berkshire Taconic Community Foundation (2008-present). Previously, Ms. Small served as Chairperson (2002-2008) and a member of the Investment Committee and Chairperson (2008-2012) and a member of the Board of Trustees of Smith College. In addition, Ms. Small served as Chief Investment Officer, Director of Global Equity Investments, and a member of the Board of Directors of Scudder, Stevens & Clark and Scudder Kemper Investments. |
William S. Stavropoulos (1939) |
Year of Election or Appointment: 2001 Trustee Vice Chairman of the Independent Trustees |
| Mr. Stavropoulos also serves as Trustee of other Fidelity funds. Mr. Stavropoulos serves as President and Founder of the Michigan Baseball Foundation, the Great Lakes Loons (2007-present). Mr. Stavropoulos is Chairman Emeritus of the Board of Directors of The Dow Chemical Company, where he previously served in numerous senior management positions, including President, CEO (1995-2000; 2002-2004), Chairman of the Executive Committee (2000-2006), and as a member of the Board of Directors (1990-2006). Currently, Mr. Stavropoulos is Chairman of the Board of Directors of Univar Inc. (global distributor of commodity and specialty chemicals), a Director of Teradata Corporation (data warehousing and technology solutions), and Maersk Inc. (industrial conglomerate), and a member of the Advisory Board for Metalmark Capital LLC (private equity investment, 2005-present). Mr. Stavropoulos is an operating advisor to Clayton, Dubilier & Rice, LLC (private equity investment). In addition, Mr. Stavropoulos is a member of the University of Notre Dame Advisory Council for the College of Science, a Trustee of the Rollin L. Gerstacker Foundation, and a Director of the Naples Philharmonic Center for the Arts. Previously, Mr. Stavropoulos served as a Director of Chemical Financial Corporation (bank holding company, 1993-2012) and Tyco International, Ltd. (multinational manufacturing and services, 2007-2012). |
David M. Thomas (1949) |
Year of Election or Appointment: 2008 Trustee |
| Mr. Thomas also serves as Trustee of other Fidelity funds. Mr. Thomas serves as Non-Executive Chairman of the Board of Directors of Fortune Brands Home and Security (home and security products, 2011-present), and as a member of the Board of Directors of Interpublic Group of Companies, Inc. (marketing communication, 2004-present). Previously, Mr. Thomas served as Executive Chairman (2005-2006) and Chairman and Chief Executive Officer (2000-2005) of IMS Health, Inc. (pharmaceutical and healthcare information solutions), and a Director of Fortune Brands, Inc. (consumer products, 2000-2011). |
+ The information above includes each Trustee's principal occupation during the last five years and other information relating to the experience, attributes, and skills relevant to each Trustee's qualifications to serve as a Trustee, which led to the conclusion that each Trustee should serve as a Trustee for the fund.
Advisory Board Member and Officers:
Correspondence intended for each officer and Peter S. Lynch may be sent to Fidelity Investments, 245 Summer Street, Boston, Massachusetts 02210. Officers appear below in alphabetical order.
Name, Year of Birth; Principal Occupation |
Peter S. Lynch (1944) |
Year of Election or Appointment: 2003 Member of the Advisory Board |
| Mr. Lynch also serves as Member of the Advisory Board of other Fidelity funds. Mr. Lynch is Vice Chairman and a Director of FMR and FMR Co., Inc. In addition, Mr. Lynch serves as a Trustee of Boston College and as the Chairman of the Inner-City Scholarship Fund. Previously, Mr. Lynch served on the Special Olympics International Board of Directors (1997-2006). |
Elizabeth Paige Baumann (1968) |
Year of Election or Appointment: 2012 Anti-Money Laundering (AML) Officer |
| Ms. Baumann also serves as AML Officer of other funds. She is Chief AML Officer of FMR LLC (2012-present) and is an employee of Fidelity Investments. Previously, Ms. Baumann served as Vice President and Deputy Anti-Money Laundering Officer (2007-2012). |
William C. Coffey (1969) |
Year of Election or Appointment: 2009 Assistant Secretary |
| Mr. Coffey also serves as Assistant Secretary of other funds. He is Senior Vice President and Deputy General Counsel of FMR LLC (2010-present), and is an employee of Fidelity Investments. Previously, Mr. Coffey served as Vice President and Associate General Counsel of FMR LLC (2005-2009). |
Timothy M. Cohen (1969) |
Year of Election or Appointment: 2014 Vice President of certain Equity Funds |
| Mr. Cohen also serves as Vice President of other funds. Mr. Cohen serves as a Director and Chief Compliance Officer of Fidelity Management & Research (U.K.) Inc. (2013-present) and is an employee of Fidelity Investments. |
Jonathan Davis (1968) |
Year of Election or Appointment: 2010 Assistant Treasurer |
| Mr. Davis also serves as Assistant Treasurer of other funds. Mr. Davis is an employee of Fidelity Investments. Previously, Mr. Davis served as Vice President and Associate General Counsel of FMR LLC (2003-2010). |
Adrien E. Deberghes (1967) |
Year of Election or Appointment: 2008 Deputy Treasurer |
| Mr. Deberghes also serves as an officer of other funds. He is an employee of Fidelity Investments (2008-present). Prior to joining Fidelity Investments, Mr. Deberghes was Senior Vice President of Mutual Fund Administration at State Street Corporation (2007-2008), Senior Director of Mutual Fund Administration at Investors Bank & Trust (2005-2007), and Director of Finance for Dunkin' Brands (2000-2005). |
Stephanie J. Dorsey (1969) |
Year of Election or Appointment: 2010 Assistant Treasurer |
| Ms. Dorsey also serves as an officer of other funds. She is an employee of Fidelity Investments (2008-present) and has served in other fund officer roles. Prior to joining Fidelity Investments, Ms. Dorsey served as Treasurer (2004-2008) of the JPMorgan Mutual Funds and Vice President (2004-2008) of JPMorgan Chase Bank. |
Howard J. Galligan III (1966) |
Year of Election or Appointment: 2014 Chief Financial Officer |
| Mr. Galligan also serves as Chief Financial Officer of other funds. Mr. Galligan serves as President of Fidelity Pricing and Cash Management Services (FPCMS) (2014-present) and as a Director of Strategic Advisers, Inc. (2008-present). Previously, Mr. Galligan served as Chief Administrative Officer of Asset Management (2011-2014) and Chief Operating Officer and Senior Vice President of Investment Support for Strategic Advisers, Inc. (2003-2011). |
Scott C. Goebel (1968) |
Year of Election or Appointment: 2008 Secretary and Chief Legal Officer (CLO) |
| Mr. Goebel serves as Secretary and CLO of other funds. Mr. Goebel also serves as Secretary of Fidelity SelectCo, LLC (2013-present), Fidelity Investments Money Management, Inc. (FIMM) (2010-present) and Fidelity Research and Analysis Company (FRAC) (2010-present); General Counsel, Secretary, and Senior Vice President of FMR (2008-present) and FMR Co., Inc. (2008-present); Chief Legal Officer of Fidelity Management & Research (Hong Kong) Limited (2008-present); and Assistant Secretary of Fidelity Management & Research (Japan) Limited (2008-present) and Fidelity Management & Research (U.K.) Inc. (2008-present). Previously, Mr. Goebel served as Secretary and CLO of other Fidelity funds (2008-2013), Assistant Secretary of FIMM (2008-2010), FRAC (2008-2010), and certain funds (2007-2008); and as Vice President and Secretary of Fidelity Distributors Corporation (FDC) (2005-2007). Mr. Goebel has been employed by FMR LLC or an affiliate since 2001. |
Brian B. Hogan (1964) |
Year of Election or Appointment: 2009 Vice President |
| Mr. Hogan also serves as Trustee or Vice President of other funds. Mr. Hogan serves as a Director of Fidelity SelectCo, LLC (2014-present) and President of FMR's Equity Division (2009-present). Previously, Mr. Hogan served as Senior Vice President, Equity Research of FMR (2006-2009) and as a portfolio manager. |
Chris Maher (1972) |
Year of Election or Appointment: 2013 Assistant Treasurer |
| Mr. Maher serves as Assistant Treasurer of other funds. Mr. Maher is Vice President of Valuation Oversight and is an employee of Fidelity Investments. Previously, Mr. Maher served as Vice President of Asset Management Compliance (2013), Vice President of FMR's Program Management Group (2010-2013), and Vice President of Valuation Oversight (2008-2010). |
Kenneth B. Robins (1969) |
Year of Election or Appointment: 2008 President and Treasurer |
| Mr. Robins also serves as an officer of other funds. Mr. Robins serves as Executive Vice President of Fidelity Investments Money Management, Inc. (FIMM) (2013-present) and is an employee of Fidelity Investments (2004-present). Previously, Mr. Robins served in other fund officer roles. |
Stephen Sadoski (1971) |
Year of Election or Appointment: 2012 Deputy Treasurer |
| Mr. Sadoski also serves as Deputy Treasurer of other funds. He is an employee of Fidelity Investments (2012-present) and has served in another fund officer role. Prior to joining Fidelity Investments, Mr. Sadoski served as an assistant chief accountant in the Division of Investment Management of the Securities and Exchange Commission (SEC) (2009-2012) and as a senior manager at Deloitte & Touche LLP (1997-2009). |
Stacie M. Smith (1974) |
Year of Election or Appointment: 2013 Deputy Treasurer |
| Ms. Smith also serves as an officer of other funds. She is an employee of Fidelity Investments (2009-present) and has served in other fund officer roles. Prior to joining Fidelity Investments, Ms. Smith served as Senior Audit Manager of Ernst & Young LLP (1996-2009). |
Renee Stagnone (1975) |
Year of Election or Appointment: 2013 Deputy Treasurer |
| Ms. Stagnone also serves as Deputy Treasurer of other funds. Ms. Stagnone is an employee of Fidelity Investments. |
Linda J. Wondrack (1964) |
Year of Election or Appointment: 2014 Chief Compliance Officer |
| Ms. Wondrack also serves as Chief Compliance Officer of other funds. Ms. Wondrack is Executive Vice President and head of the Ethics Office and Asset Management Compliance for Fidelity Investments (2012-present). Ms. Wondrack also serves as Chief Compliance Officer of Fidelity SelectCo, LLC (2014-present); Chief Compliance Officer of Impresa Management LLC (2013-present); and Chief Compliance Officer of FMR Co., Inc., Fidelity Investments Money Management, Inc., Fidelity Management & Research (Japan) Limited, Fidelity Management & Research (U.K.) Inc., Fidelity Management & Research (Hong Kong), Fidelity Management & Research Company, Pyramis Global Advisors, LLC, and Strategic Advisers, Inc., Ballyrock Investment Advisors LLC, and Northern Neck Investors LLC (2012-present). Previously, Ms. Wondrack served as Senior Vice President and Chief Compliance Officer for Columbia Management Investment Advisers, LLC (2005-2012); Chief Compliance Officer for certain funds within the Columbia Family of Funds (2007-2012); and Senior Vice President of Compliance Risk Management at Bank of America (2005-2010). |
Joseph F. Zambello (1957) |
Year of Election or Appointment: 2011 Deputy Treasurer |
| Mr. Zambello also serves as Deputy Treasurer of other funds. Mr. Zambello is an employee of Fidelity Investments. Previously, Mr. Zambello served as Vice President of FMR's Program Management Group (2009-2011) and Vice President of the Transfer Agent Oversight Group (2005-2009). |
Annual Report
Class A designates 3%, Class T designates 4%, Class B designates 6%, and Class C designates 5% of the dividend distributed during the fiscal year as qualifying for the dividends-received deduction for corporate shareholders.
Class A designates 82%, Class T designates 92%, Class B designates 100%, and Class C designates 100% of the dividend distributed during the fiscal year as amounts which may be taken into account as a dividend for purposes of the maximum rate under section 1(h)(11) of the Internal Revenue Code.
The amounts per share which represent income derived from sources within, and taxes paid to, foreign countries or possessions of the United States are as follows:
| Pay Date | Income | Taxes |
Class A | 12/09/13 | $0.2446 | $0.0163 |
Class T | 12/09/13 | $0.2178 | $0.0163 |
Class B | 12/09/13 | $0.1241 | $0.0163 |
Class C | 12/09/13 | $0.1723 | $0.0163 |
The fund will notify shareholders in January 2015 of amounts for use in preparing 2014 income tax returns.
Annual Report
Board Approval of Investment Advisory Contracts and Management Fees
Fidelity Advisor Diversified International Fund
Each year, the Board of Trustees, including the Independent Trustees (together, the Board), votes on the renewal of the management contract with Fidelity Management & Research Company (FMR) and the sub-advisory agreements (together, the Advisory Contracts) for the fund. The Board, assisted by the advice of fund counsel and Independent Trustees' counsel, requests and considers a broad range of information relevant to the renewal of the Advisory Contracts throughout the year.
The Board meets regularly and, at each of its meetings, covers an extensive agenda of topics and materials and considers factors that are relevant to its annual consideration of the renewal of the fund's Advisory Contracts, including the services and support provided to the fund and its shareholders. The Board has established various standing committees (Committees), each composed of and chaired by Independent Trustees with varying backgrounds, to which the Board has assigned specific subject matter responsibilities in order to enhance effective decision-making by the Board. The Board, acting directly and through its Committees, requests and receives information concerning the annual consideration of the renewal of the fund's Advisory Contracts. The Board also meets as needed to consider matters specifically related to the Board's annual consideration of the renewal of the Advisory Contracts. Members of the Board may also meet with trustees of other Fidelity funds through ad hoc joint committees to discuss certain matters relevant to the Fidelity funds.
At its July 2014 meeting, the Board, including the Independent Trustees, unanimously determined to renew the fund's Advisory Contracts. In reaching its determination, the Board considered all factors it believed relevant, including (i) the nature, extent, and quality of the services to be provided to the fund and its shareholders (including the investment performance of the fund); (ii) the competitiveness of the fund's management fee and total expense ratio relative to peer funds; (iii) the total costs of the services to be provided by and the profits to be realized by Fidelity from its relationship with the fund; (iv) the extent to which economies of scale exist and would be realized as the fund grows; and (v) whether fee levels reflect these economies of scale, if any, for the benefit of fund shareholders. In connection with separate internal corporate reorganizations involving Fidelity Management & Research (U.K.) Inc. (FMR U.K.) and Fidelity Management & Research (Japan) Inc. (FMR Japan), the Board approved certain non-material amendments to the fund's sub-advisory agreements with FMR U.K. and FMR Japan to reflect that, after these reorganizations, FMR Investment Management (UK) Limited and Fidelity Management & Research (Japan) Limited will carry on the business of FMR U.K. and FMR Japan, respectively. The Board noted that no changes to the portfolio managers or to the foreign research or investment advisory services provided to the fund were expected in connection with either reorganization and that the same personnel and resources would continue to be available to the fund at the new entities.
Annual Report
In considering whether to renew the Advisory Contracts for the fund, the Board reached a determination, with the assistance of fund counsel and Independent Trustees' counsel and through the exercise of its business judgment, that the renewal of the Advisory Contracts was in the best interests of the fund and its shareholders and that the compensation payable under the Advisory Contracts was fair and reasonable. The Board's decision to renew the Advisory Contracts was not based on any single factor, but rather was based on a comprehensive consideration of all the information provided to the Board at its meetings throughout the year. The Board, in reaching its determination to renew the Advisory Contracts, was aware that shareholders of the fund have a broad range of investment choices available to them, including a wide choice among funds offered by Fidelity's competitors, and that the fund's shareholders, who have the opportunity to review and weigh the disclosure provided by the fund in its prospectus and other public disclosures, have chosen to invest in this fund, which is part of the Fidelity family of funds.
Nature, Extent, and Quality of Services Provided. The Board considered Fidelity's staffing as it relates to the fund, including the backgrounds of investment personnel of FMR and the sub-advisers (together, the Investment Advisers), and also considered the fund's investment objective, strategies, and related investment philosophy. The Independent Trustees also had discussions with senior management of Fidelity's investment operations and investment groups. The Board considered the structure of the portfolio manager compensation program and whether this structure provides appropriate incentives to act in the best interests of the fund. Additionally, the Board considered the portfolio managers' investments, if any, in the funds that they manage.
Resources Dedicated to Investment Management and Support Services. The Board and the Fund Oversight and Research Committees reviewed the general qualifications and capabilities of Fidelity's investment staff, including its size, education, experience,
and resources, as well as Fidelity's approach to recruiting, training, managing, and compensating investment personnel. The Board noted that Fidelity has continued to increase the resources devoted to non-U.S. offices, including expansion of Fidelity's global investment organization. The Board also noted that Fidelity's analysts have extensive resources, tools and capabilities that allow them to conduct sophisticated quantitative and fundamental analysis, as well as credit analysis of issuers, counterparties and guarantors. Further, the Board believes that Fidelity's investment professionals have sufficient access to global information and data so as to provide competitive investment results over time, and that those professionals also have access to sophisticated tools that permit them to assess portfolio construction and risk and performance attribution characteristics continuously, as well as to transmit new information and research conclusions rapidly around the world. Additionally, in its deliberations, the Board considered Fidelity's trading and risk management capabilities and resources and global compliance infrastructure, which are an integral part of the investment management process.
Annual Report
Board Approval of Investment Advisory Contracts and
Management Fees - continued
Shareholder and Administrative Services. The Board considered (i) the nature, extent, quality, and cost of advisory, administrative, and shareholder services performed by the Investment Advisers and their affiliates under the Advisory Contracts and under separate agreements covering transfer agency, pricing and bookkeeping, and securities lending services for the fund; (ii) the nature and extent of the supervision of third party service providers, principally custodians and subcustodians; and (iii) the resources devoted to, and the record of compliance with, the fund's compliance policies and procedures. The Board also reviewed the allocation of fund brokerage, including allocations to brokers affiliated with the Investment Advisers, the use of brokerage commissions to pay fund expenses, and the use of "soft" commission dollars to pay for research services.
The Board noted that the growth of fund assets over time across the complex allows Fidelity to reinvest in the development of services designed to enhance the value or convenience of the Fidelity funds as investment vehicles. These services include 24-hour access to account information and market information through telephone representatives and over the Internet, investor education materials and asset allocation tools, and the expanded availability of Fidelity Investor Centers.
In 2014, the Board formed an ad hoc Committee on Transfer Agency Fees to review the variety of transfer agency fee structures throughout the industry and Fidelity's competitive positioning with respect to industry participants.
Investment in a Large Fund Family. The Board considered the benefits to shareholders of investing in a Fidelity fund, including the benefits of investing in a fund that is part of a large family of funds offering a variety of investment disciplines and providing a large variety of mutual fund investor services. The Board noted that Fidelity had taken, or had made recommendations that resulted in the Fidelity funds taking, a number of actions over the previous year that benefited particular funds, including (i) continuing to dedicate additional resources to investment research and to the support of the senior management team that oversees asset management; (ii) persisting in efforts to enhance Fidelity's global research capabilities; (iii) launching new funds and making other enhancements to meet client needs for income-oriented solutions; (iv) reducing fund expenses for certain index funds; (v) continuing to launch dedicated lower cost underlying funds to meet portfolio construction needs related to expanding underlying fund options for Fidelity funds of funds, specifically for the Freedom Fund product lines; (vi) rationalizing product lines and gaining increased efficiencies through fund mergers; (vii) launching sector-based exchange-traded funds and establishing a new Fidelity adviser to manage sector-based funds and products; (viii) continuing to develop and implement technology to improve security and increase efficiency; (ix) modifying the eligibility criteria for certain share classes to increase their marketability to a portion of the defined contribution plan market; (x) waiving redemption fees for certain qualified fund-of-fund and wrap programs and certain retirement plan transactions; and (xi) launching new Institutional Class shares of certain money market funds to attract and retain assets and to fill a gap in the money market fund lineup.
Annual Report
Investment Performance. The Board considered whether the fund has operated in accordance with its investment objective, as well as its record of compliance with its investment restrictions and its performance history. The Board noted that there was a portfolio management change for the fund in January 2014.
The Board took into account discussions with the Investment Advisers about fund investment performance that occur at Board meetings throughout the year. In this regard the Board noted that as part of regularly scheduled fund reviews and other reports to the Board on fund performance, the Board periodically considers annualized return information for the fund, for different time periods, measured against a securities market index ("benchmark index") and a peer group of funds with similar objectives ("peer group"). In its evaluation of fund investment performance, the Board gave particular attention to information indicating changes in performance of certain Fidelity funds for specific time periods and the Investment Advisers' explanations for any overperformance or underperformance.
In addition to reviewing absolute and relative fund performance, the Independent Trustees periodically consider the appropriateness of fund performance metrics in evaluating the results achieved. In general, the Independent Trustees believe that fund performance should be evaluated based on net performance (after fees and expenses) of both the highest performing and lowest performing classes, where applicable, compared to appropriate benchmark indices, over appropriate time periods which may include full market cycles, and compared to peer groups, as applicable, over the same periods, taking into account relevant factors including the following: general market conditions; issuer-specific information; tactical opportunities for investment; and fund cash flows and other factors.
The Independent Trustees recognize that shareholders evaluate performance on a net basis over their own holding periods, for which one-, three-, and five-year periods are often used as a proxy. For this reason, the performance information reviewed by the Board also included net cumulative calendar year total return information for the fund and an appropriate benchmark index and peer group for the most recent one-, three-, and five-year periods, as shown below. Returns are shown compared to the 25th percentile (top of box, 75% beaten) and 75th percentile (bottom of box, 25% beaten) of the peer universe. Returns of the benchmark index are "net MA," i.e., adjusted for tax withholding rates applicable to U.S.-based funds organized as Massachusetts business trusts.
Annual Report
Board Approval of Investment Advisory Contracts and
Management Fees - continued
Fidelity Advisor Diversified International Fund

Based on its review, the Board concluded that the nature, extent, and quality of services provided to the fund under the Advisory Contracts should benefit the fund's shareholders.
Competitiveness of Management Fee and Total Expense Ratio. The Board considered the fund's management fee and total expense ratio compared to "mapped groups" of competitive funds and classes. Fidelity creates "mapped groups" by combining similar Lipper investment objective categories that have comparable investment mandates. Combining Lipper investment objective categories aids the Board's management fee and total expense ratio comparisons by broadening the competitive group used for comparison and by reducing the number of universes to which various Fidelity funds are compared.
Management Fee. The Board considered two proprietary management fee comparisons for the 12-month periods shown in the chart below. The group of Lipper funds used by the Board for management fee comparisons is referred to below as the "Total Mapped Group." The Total Mapped Group comparison focuses on a fund's standing in terms of gross management fees before expense reimbursements or caps relative to the total universe of funds with comparable investment mandates, regardless of whether their management fee structures also are comparable. Funds with comparable investment mandates offer exposure to similar types of securities. Funds with comparable management fee structures have similar management fee contractual arrangements (e.g., flat rate charged for advisory services, all-inclusive fee rate, etc.). "TMG %" represents the percentage of funds in the Total Mapped Group that had management fees that were lower than the fund's. For example, a hypothetical TMG % of 20% would mean that 80% of the funds in the Total Mapped Group had higher, and 20% had lower, management fees than the fund. The fund's actual TMG %s are in the chart below. The "Asset-Size Peer Group" (ASPG) comparison focuses on a fund's standing relative to a subset of non-Fidelity funds within the Total Mapped Group that are similar in size and management fee structure. For example, if a fund is in the first quartile of the ASPG, the fund's management fee ranks in the least expensive or lowest 25% of funds in the ASPG. The ASPG represents at least 15% of the funds in the Total Mapped Group with comparable asset size and management fee structures, subject to a minimum of 50 funds (or all funds in the Total Mapped Group if fewer than 50). Additional information, such as the ASPG quartile in which the fund's management fee rate ranked, is also included in the chart and considered by the Board.
Annual Report
Fidelity Advisor Diversified International Fund

The Board noted that the fund's management fee rate ranked below the median of its Total Mapped Group and below the median of its ASPG for 2013.
Furthermore, the Board considered that, on July 16, 2014, after the periods shown in the chart above, it had approved a reduction (effective August 1, 2014) in the individual fund fee rate component of the management fee rate for the fund from 0.450% to 0.424%.
The Board also noted that, in August 2013, the ad hoc Committee on Management Fees was formed to conduct an in-depth review of the management fee rates of Fidelity's active equity mutual funds. The Committee focused on the following areas: (i) standard fee structures; (ii) research consumption and trading evolution; (iii) management fee competitiveness/profitability by category; and (iv) factors that drive institutional pricing.
Annual Report
Board Approval of Investment Advisory Contracts and
Management Fees - continued
Based on its review, the Board concluded that the fund's management fee is fair and reasonable in light of the services that the fund receives and the other factors considered.
Total Expense Ratio. In its review of each class's total expense ratio, the Board considered the fund's management fee as well as other fund or class expenses, as applicable, such as transfer agent fees, pricing and bookkeeping fees, fund-paid 12b-1 fees, and custodial, legal, and audit fees. The Board also noted the effects of any waivers and reimbursements on fees and expenses. As part of its review, the Board also considered the current and historical total expense ratios of each class of the fund compared to competitive fund median expenses. Each class of the fund is compared to those funds and classes in the Total Mapped Group (used by the Board for management fee comparisons) that have a similar sales load structure.
The Board noted that the total expense ratio of each of Class A, Class B, Class C, Institutional Class, and Class Z ranked below its competitive median for 2013 and the total expense ratio of Class T ranked above its competitive median for 2013. The Board considered that, in general, various factors can affect total expense ratios. The Board noted that the total expense ratio of Class T was above the competitive median primarily because of higher 12b-1 fees on Class T as compared to most competitor funds. Class T has a higher 12b-1 fee, but a lower front-end sales charge, than traditionally priced front-end sales charge classes. The Board considered that Class T is primarily sold load-waived in the retirement plan market where its 0.50% 12b-1 fee is comparable to competing no-load, higher 12b-1 fee classes designed specifically for retirement plans. The Board noted that the fund offers multiple classes, each of which has a different sales load and 12b-1 fee structure, and that the multiple structures are intended to offer a range of pricing options for the intermediary market. The Board also noted that the total expense ratios of the classes vary primarily by the level of their 12b-1 fees, although differences in transfer agent fees may also cause expenses to vary from class to class.
Fees Charged to Other Fidelity Clients. The Board also considered Fidelity fee structures and other information with respect to clients of Fidelity, such as other funds advised or subadvised by Fidelity, pension plan clients, and other institutional clients. The Board noted the findings of the 2013 ad hoc joint committee (created with the board of other Fidelity funds), which reviewed and compared Fidelity's institutional investment advisory business with its business of providing services to the Fidelity funds, including the differences in services provided, fees charged, and costs incurred, as well as competition in their respective marketplaces.
Based on its review of total expense ratios and fees charged to other Fidelity clients, the Board concluded that the total expense ratio of each class of the fund was reasonable, although Class T was above the median of the universe presented for comparison, in light of the services that the fund and its shareholders receive and the other factors considered.
Annual Report
Costs of the Services and Profitability. The Board considered the revenues earned and the expenses incurred by Fidelity in conducting the business of developing, marketing, distributing, managing, administering and servicing the fund and servicing the fund's shareholders. The Board also considered the level of Fidelity's profits in respect of all the Fidelity funds.
On an annual basis, Fidelity presents to the Board Fidelity's profitability for the fund. Fidelity calculates the profitability for each fund, as well as aggregate profitability for groups of Fidelity funds and all Fidelity funds, using a series of detailed revenue and cost allocation methodologies which originate with the books and records of Fidelity on which Fidelity's audited financial statements are based. The Audit Committee of the Board reviews any significant changes from the prior year's methodologies.
PricewaterhouseCoopers LLP (PwC), independent registered public accounting firm and auditor to Fidelity and certain Fidelity funds, has been engaged annually by the Board as part of the Board's assessment of Fidelity's profitability analysis. PwC's engagement includes the review and assessment of the methodologies used by Fidelity in determining the revenues and expenses attributable to Fidelity's mutual fund business, and completion of agreed-upon procedures in respect of the mathematical accuracy of fund profitability and its conformity to established allocation methodologies. After considering PwC's reports issued under the engagement and information provided by Fidelity, the Board concluded that while other allocation methods may also be reasonable, Fidelity's profitability methodologies are reasonable in all material respects.
The Board also reviewed Fidelity's non-fund businesses and fall-out benefits related to the mutual fund business as well as cases where Fidelity's affiliates may benefit from or be related to the fund's business.
The Board considered the costs of the services provided by and the profits realized by Fidelity in connection with the operation of the fund and was satisfied that the profitability was not excessive in the circumstances.
Economies of Scale. The Board considered whether there have been economies of scale in respect of the management of the Fidelity funds, whether the Fidelity funds (including the fund) have appropriately benefited from any such economies of scale, and whether there is potential for realization of any further economies of scale. The Board considered the extent to which the fund will benefit from economies of scale through increased services to the fund, through waivers or reimbursements, or through fee or expense ratio reductions. The Board also noted that in 2013, it and the boards of other Fidelity funds created an ad hoc committee (the Economies of Scale Committee) to analyze whether Fidelity attains economies of scale in respect of the management and servicing of the Fidelity funds, whether the Fidelity funds have appropriately benefited from such economies of scale, and whether there is potential for realization of any further economies of scale.
Annual Report
Board Approval of Investment Advisory Contracts and
Management Fees - continued
The Board recognized that the fund's management contract incorporates a "group fee" structure, which provides for lower group fee rates as total group assets increase, and for higher group fee rates as total group assets decrease (with "group assets" defined to include fund assets under FMR's management plus sector fund assets previously under FMR's management and currently managed by Fidelity SelectCo, LLC). FMR calculates the group fee rates based on a tiered asset "breakpoint" schedule that varies based on asset class. The Board considered that the group fee is designed to deliver the benefits of economies of scale to fund shareholders when total Fidelity fund assets increase, even if assets of any particular fund are unchanged or have declined, because some portion of Fidelity's costs are attributable to services provided to all Fidelity funds, and all funds benefit if those costs can be allocated among more assets. The Board concluded that, given the group fee structure, fund shareholders will benefit from lower management fees as group assets increase at the fund complex level, regardless of whether Fidelity achieves any such economies of scale.
The Board concluded, taking into account the analysis of the Economies of Scale Committee, that economies of scale, if any, are being appropriately shared between fund shareholders and Fidelity.
Additional Information Requested by the Board. In order to develop fully the factual basis for consideration of the Fidelity funds' Advisory Contracts, the Board requested and received additional information on certain topics, including: (i) fund performance trends and Fidelity's long-term strategies for certain funds; (ii) Fidelity's strategic marketing and product lineup goals; (iii) the methodology with respect to competitive fund data and peer group classifications; (iv) the arrangements with, and performance of, certain sub-advisers on behalf of the Fidelity funds, as well as certain proposed participating affiliate arrangements; (v) the realization of fall-out benefits in certain Fidelity business units; (vi) Fidelity's group fee structures, including the rationale for the individual fee rates of certain categories of funds and the definition of group assets; (vii) trends regarding industry use of performance fee structures and the performance adjustment methodologies applicable to the Fidelity funds; (viii) additional competitive analysis regarding the total expenses for certain classes; (ix) fund profitability methodology, including Fidelity's cost allocation methodology, and the impact of certain factors on fund profitability results; and (x) the process by which Fidelity determines sub-advisory fees for funds it advises.
Based on its evaluation of all of the conclusions noted above, and after considering all factors it believed relevant, the Board ultimately concluded that the advisory fee structures are fair and reasonable, and that the fund's Advisory Contracts should be renewed.
Annual Report
Investment Adviser
Fidelity Management & Research Company
Boston, MA
Investment Sub-Advisers
FMR Co., Inc.
Fidelity Management & Research
(U.K.) Inc.
FIL Investment Advisors
FIL Investments (Japan) Limited
FIL Investment Advisors (UK) Limited
Fidelity Management & Research
(Hong Kong) Limited
Fidelity Management & Research
(Japan) Limited
General Distributor
Fidelity Distributors Corporation
Smithfield, RI
Transfer and Service Agents
Fidelity Investments Institutional Operations Company, Inc.
Boston, MA
Fidelity Service Company, Inc.
Boston, MA
Custodian
State Street Bank and Trust Company
Quincy, MA
(Fidelity Investment logo)(registered trademark)
ADIF-UANN-1214
1.784735.111
(Fidelity Investment logo)(registered trademark)
Fidelity Advisor®
Diversified International
Fund - Institutional Class
Annual Report
October 31, 2014
(Fidelity Cover Art)
Contents
Performance | (Click Here) | How the fund has done over time. |
Management's Discussion of Fund Performance | (Click Here) | The Portfolio Manager's review of fund performance and strategy. |
Shareholder Expense Example | (Click Here) | An example of shareholder expenses. |
Investment Changes | (Click Here) | A summary of major shifts in the fund's investments over the past six months. |
Investments | (Click Here) | A complete list of the fund's investments with their market values. |
Financial Statements | (Click Here) | Statements of assets and liabilities, operations, and changes in net assets, as well as financial highlights. |
Notes | (Click Here) | Notes to the financial statements. |
Report of Independent Registered Public Accounting Firm | (Click Here) | |
Trustees and Officers | (Click Here) | |
Distributions | (Click Here) | |
Board Approval of Investment Advisory Contracts and Management Fees | (Click Here) | |
To view a fund's proxy voting guidelines and proxy voting record for the 12-month period ended June 30, visit http://www.fidelity.com/proxyvotingresults or visit the Securities and Exchange Commission's (SEC) web site at http://www.sec.gov. You may also call 1-877-208-0098 to request a free copy of the proxy voting guidelines.
Standard & Poor's, S&P and S&P 500 are registered service marks of The McGraw-Hill Companies, Inc. and have been licensed for use by Fidelity Distributors Corporation.
Other third-party marks appearing herein are the property of their respective owners.
All other marks appearing herein are registered or unregistered trademarks or service marks of FMR LLC or an affiliated company. © 2014 FMR LLC. All rights reserved.
Annual Report
This report and the financial statements contained herein are submitted for the general information of the shareholders of the fund. This report is not authorized for distribution to prospective investors in the fund unless preceded or accompanied by an effective prospectus.
A fund files its complete schedule of portfolio holdings with the SEC for the first and third quarters of each fiscal year on Form N-Q. Forms N-Q are available on the SEC's web site at http://www.sec.gov. A fund's Forms N-Q may be reviewed and copied at the SEC's Public Reference Room in Washington, DC. Information regarding the operation of the SEC's Public Reference Room may be obtained by calling 1-800-SEC-0330. For a complete list of a fund's portfolio holdings, view the most recent holdings listing, semiannual report, or annual report on Fidelity's web site at http://www.fidelity.com, http://www.advisor.fidelity.com, or http://www.401k.com, as applicable.
NOT FDIC INSURED • MAY LOSE VALUE • NO BANK GUARANTEE
Neither the fund nor Fidelity Distributors Corporation is a bank.
Annual Report
Average annual total return reflects the change in the value of an investment, assuming reinvestment of the class' distributions from dividend income and capital gains (the profits earned upon the sale of securities that have grown in value, if any) and assuming a constant rate of performance each year. The $10,000 table and the fund's returns do not reflect the deduction of taxes that a shareholder would pay on fund distributions or the redemption of fund shares. During periods of reimbursement by Fidelity, a fund's total return will be greater than it would be had the reimbursement not occurred. How a fund did yesterday is no guarantee of how it will do tomorrow.
Average Annual Total Returns
Periods ended October 31, 2014 | Past 1
year | Past 5
years | Past 10
years |
Institutional Class | 2.60% | 8.53% | 5.77% |
$10,000 Over 10 Years
Let's say hypothetically that $10,000 was invested in Fidelity Advisor® Diversified International Fund - Institutional Class on October 31, 2004. The chart shows how the value of your investment would have changed, and also shows how the MSCI EAFE Index performed over the same period.
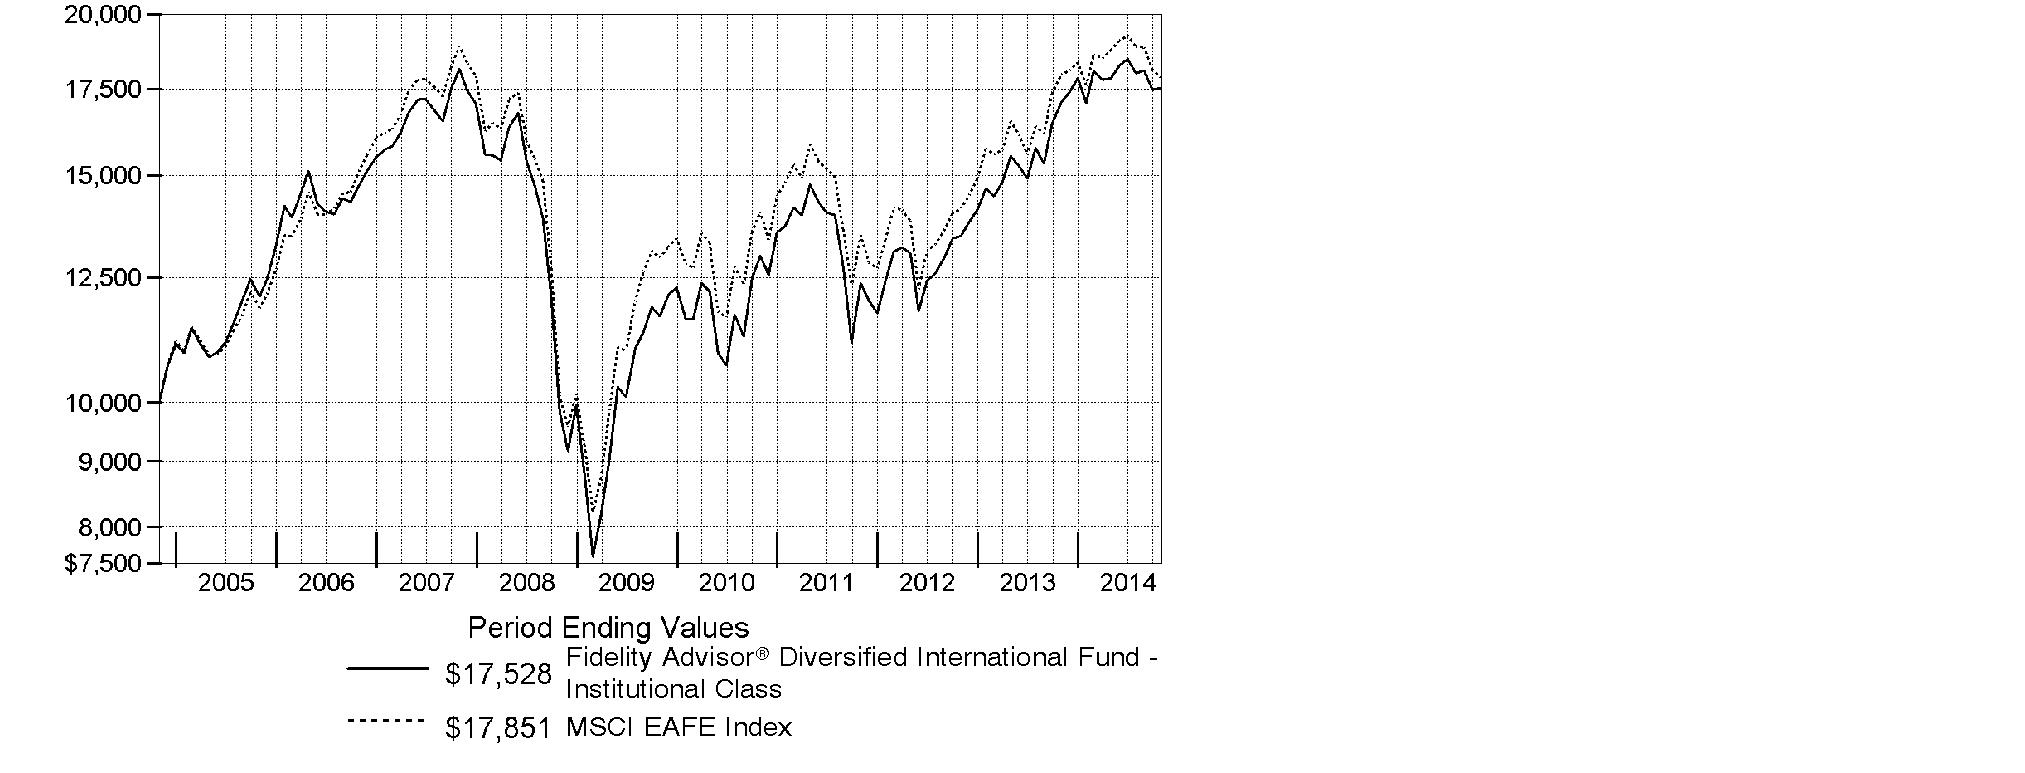
Annual Report
Market Recap: Global equities posted a healthy gain for the 12 months ending October 31, 2014, overcoming an October market decline driven by recessionary pressures in China and tepid growth in Europe. The MSCI ACWI (All Country World Index) Index rose 8.15%, helped by subdued market volatility for much of the period and supported by solid corporate earnings, especially in the United States. Stocks also benefited from easy monetary policies in Japan and the eurozone, as well as increased stimulus efforts in China. All but three of the 24 industry groups that compose the index marked a positive return. The U.S. (+17%) remained a pillar of strength, while a strongly rising dollar in the latter part of the period detracted from investors' returns in most non-U.S. markets. Canada (+5%) notched broad gains outside of its energy and materials sectors, as did Asia-Pacific ex Japan (+4%), led by investor enthusiasm for companies in India. The U.K., Europe and Japan, meanwhile, all underperformed. Among sectors, health care (+24%) led the index, with a strong contribution from the pharmaceuticals, biotechnology & life sciences industry. Information technology (+21%) also outperformed. Conversely, materials (-4%) and energy (-1%) lagged the index due to a higher supply of and lower demand for commodities.
Comments from William Bower, Portfolio Manager of Fidelity Advisor® Diversified International Fund: For the year ending October 31, 2014, the fund's Institutional Class shares gained 2.60%, outpacing the -0.48% result for the MSCI EAFE Index. Stock selection drove relative results, with strong showings in the information technology and health care sectors, with industrials the only notable detractor. On balance, allocations also helped. Geographically, the fund benefited from out-of-index holdings in emerging markets and North America. Stock selection helped in seven of 10 sectors, and all 10 top relative contributors were overweights. Denmark's Novo Nordisk, an insulin producer, was up 38% for the year. Japanese optics maker Hoya also helped. Alimentation Couche-Tard was up 51% for the full year. Conversely, picks in industrials hurt most, particularly Experian, which was off 25% for the period. In financials, Orix disappointed. In health care, not owning Switzerland's Novartis or U.K.-based AstraZeneca, two index heavyweights, weighed on relative results. I reduced its position in Honda Motor and sold out of Toyota Motor and
The views expressed above reflect those of the portfolio manager(s) only through the end of the period as stated on the cover of this report and do not necessarily represent the views of Fidelity or any other person in the Fidelity organization. Any such views are subject to change at any time based upon market or other conditions and Fidelity disclaims any responsibility to update such views. These views may not be relied on as investment advice and, because investment decisions for a Fidelity fund are based on numerous factors, may not be relied on as an indication of trading intent on behalf of any Fidelity fund.
Annual Report
Shareholder Expense Example
As a shareholder of the Fund, you incur two types of costs: (1) transaction costs, including sales charges (loads) on purchase payments or redemption proceeds, redemption fees and (2) ongoing costs, including management fees, distribution and/or service (12b-1) fees and other Fund expenses. This Example is intended to help you understand your ongoing costs (in dollars) of investing in the Fund and to compare these costs with the ongoing costs of investing in other mutual funds.
The Example is based on an investment of $1,000 invested at the beginning of the period and held for the entire period (May 1, 2014 to October 31, 2014).
Actual Expenses
The first line of the accompanying table for each class of the Fund provides information about actual account values and actual expenses. You may use the information in this line, together with the amount you invested, to estimate the expenses that you paid over the period. Simply divide your account value by $1,000.00 (for example, an $8,600 account value divided by $1,000.00 = 8.6), then multiply the result by the number in the first line for a class of the Fund under the heading entitled "Expenses Paid During Period" to estimate the expenses you paid on your account during this period. In addition, the Fund, as a shareholder in the underlying Fidelity Central Funds, will indirectly bear its pro-rata share of the fees and expenses incurred by the underlying Fidelity Central Funds. These fees and expenses are not included in the Fund's annualized expense ratio used to calculate the expense estimate in the table below.
Hypothetical Example for Comparison Purposes
The second line of the accompanying table for each class of the Fund provides information about hypothetical account values and hypothetical expenses based on a Class' actual expense ratio and an assumed rate of return of 5% per year before expenses, which is not the Class' actual return. The hypothetical account values and expenses may not be used to estimate the actual ending account balance or expenses you paid for the period. You may use this information to compare the ongoing costs of investing in the Fund and other funds. To do so, compare this 5% hypothetical example with the 5% hypothetical examples that appear in the shareholder reports of the other funds. In addition, the Fund, as a shareholder in the underlying Fidelity Central Funds, will indirectly bear its pro-rata share of the fees and expenses incurred by the underlying Fidelity Central Funds. These fees and expenses are not included in the Fund's annualized expense ratio used to calculate the expense estimate in the table below.
Please note that the expenses shown in the table are meant to highlight your ongoing costs only and do not reflect any transaction costs. Therefore, the second line of the table is useful in comparing ongoing costs only, and will not help you determine the relative total costs of owning different funds. In addition, if these transactional costs were included, your costs would have been higher.
Annual Report
Shareholder Expense Example - continued
| Annualized
Expense RatioB | Beginning
Account Value
May 1, 2014 | Ending
Account Value
October 31, 2014 | Expenses Paid
During Period*
May 1, 2014
to October 31, 2014 |
Class A | 1.24% | | | |
Actual | | $ 1,000.00 | $ 981.40 | $ 6.19 |
HypotheticalA | | $ 1,000.00 | $ 1,018.95 | $ 6.31 |
Class T | 1.50% | | | |
Actual | | $ 1,000.00 | $ 980.30 | $ 7.49 |
HypotheticalA | | $ 1,000.00 | $ 1,017.64 | $ 7.63 |
Class B | 2.05% | | | |
Actual | | $ 1,000.00 | $ 977.60 | $ 10.22 |
HypotheticalA | | $ 1,000.00 | $ 1,014.87 | $ 10.41 |
Class C | 1.99% | | | |
Actual | | $ 1,000.00 | $ 978.00 | $ 9.92 |
HypotheticalA | | $ 1,000.00 | $ 1,015.17 | $ 10.11 |
Institutional Class | .96% | | | |
Actual | | $ 1,000.00 | $ 983.20 | $ 4.80 |
HypotheticalA | | $ 1,000.00 | $ 1,020.37 | $ 4.89 |
Class Z | .78% | | | |
Actual | | $ 1,000.00 | $ 984.20 | $ 3.90 |
HypotheticalA | | $ 1,000.00 | $ 1,021.27 | $ 3.97 |
A 5% return per year before expenses
B Annualized expense ratio reflects expenses net of applicable fee waivers.
* Expenses are equal to each Class' annualized expense ratio, multiplied by the average account value over the period, multiplied by 184/365 (to reflect the one-half year period).
Annual Report
Investment Changes (Unaudited)
Top Five Stocks as of October 31, 2014 |
| % of fund's
net assets | % of fund's net assets
6 months ago |
Novo Nordisk A/S Series B (Denmark, Pharmaceuticals) | 1.9 | 1.9 |
ORIX Corp. (Japan, Diversified Financial Services) | 1.8 | 1.6 |
Bayer AG (Germany, Pharmaceuticals) | 1.6 | 1.7 |
Anheuser-Busch InBev SA NV (Belgium, Beverages) | 1.6 | 1.4 |
Roche Holding AG (participation certificate) (Switzerland, Pharmaceuticals) | 1.4 | 0.7 |
| 8.3 | |
Top Five Market Sectors as of October 31, 2014 |
| % of fund's
net assets | % of fund's net assets
6 months ago |
Financials | 21.2 | 21.1 |
Health Care | 16.7 | 16.1 |
Consumer Discretionary | 15.6 | 15.8 |
Information Technology | 13.9 | 9.8 |
Consumer Staples | 12.0 | 11.9 |
Top Five Countries as of October 31, 2014 |
(excluding cash equivalents) | % of fund's
net assets | % of fund's net assets
6 months ago |
Japan | 17.7 | 15.3 |
United Kingdom | 16.8 | 17.4 |
United States of America | 7.9 | 7.1 |
Germany | 6.2 | 8.4 |
Switzerland | 5.2 | 5.4 |
Percentages are adjusted for the effect of open futures contracts, if applicable. |
Asset Allocation (% of fund's net assets) |
As of October 31, 2014 | As of April 30, 2014 |
 | Stocks 98.1% | | | Stocks 97.7% | |
 | Other Investments 0.1% | | | Other Investments 0.1% | |
 | Short-Term
Investments and
Net Other Assets (Liabilities) 1.8% | | | Short-Term
Investments and
Net Other Assets (Liabilities) 2.2% | |

Annual Report
Investments October 31, 2014
Showing Percentage of Net Assets
Common Stocks - 96.7% |
| Shares | | Value (000s) |
Australia - 2.8% |
Ansell Ltd. | 258,534 | | $ 4,535 |
Australia & New Zealand Banking Group Ltd. | 628,447 | | 18,596 |
BHP Billiton Ltd. sponsored ADR (e) | 217,236 | | 12,913 |
CSL Ltd. | 167,531 | | 11,828 |
Woodside Petroleum Ltd. | 172,944 | | 6,143 |
TOTAL AUSTRALIA | | 54,015 |
Austria - 0.1% |
Andritz AG | 52,900 | | 2,554 |
Bailiwick of Guernsey - 0.2% |
Amdocs Ltd. | 72,600 | | 3,451 |
Bailiwick of Jersey - 2.0% |
Experian PLC | 398,000 | | 5,975 |
Shire PLC | 255,300 | | 17,130 |
Wolseley PLC | 124,370 | | 6,599 |
WPP PLC | 445,924 | | 8,710 |
TOTAL BAILIWICK OF JERSEY | | 38,414 |
Belgium - 2.6% |
Anheuser-Busch InBev SA NV | 272,131 | | 30,178 |
Arseus NV | 61,500 | | 2,458 |
KBC Groupe SA (a) | 246,648 | | 13,213 |
UCB SA | 42,200 | | 3,405 |
TOTAL BELGIUM | | 49,254 |
Bermuda - 0.7% |
BW LPG Ltd. | 339,872 | | 3,220 |
Golar LNG Ltd. | 76,000 | | 4,264 |
Noble Group Ltd. | 3,986,000 | | 3,710 |
Travelport Worldwide Ltd. | 158,100 | | 2,285 |
TOTAL BERMUDA | | 13,479 |
Canada - 3.8% |
Alimentation Couche-Tard, Inc. Class B (sub. vtg.) | 460,900 | | 15,642 |
AutoCanada, Inc. | 36,900 | | 2,050 |
Canadian Natural Resources Ltd. | 110,900 | | 3,870 |
CGI Group, Inc. Class A (sub. vtg.) (a) | 397,700 | | 13,652 |
Constellation Software, Inc. | 25,700 | | 7,240 |
First Quantum Minerals Ltd. | 256,600 | | 3,870 |
Imperial Oil Ltd. | 96,200 | | 4,629 |
Keyera Corp. | 28,900 | | 2,299 |
Potash Corp. of Saskatchewan, Inc. | 115,500 | | 3,942 |
Common Stocks - continued |
| Shares | | Value (000s) |
Canada - continued |
PrairieSky Royalty Ltd. | 38,000 | | $ 1,170 |
Suncor Energy, Inc. | 265,200 | | 9,417 |
Tourmaline Oil Corp. (a) | 100,600 | | 3,609 |
TransForce, Inc. | 77,900 | | 1,905 |
TOTAL CANADA | | 73,295 |
Cayman Islands - 3.2% |
58.com, Inc. ADR | 21,000 | | 831 |
Alibaba Group Holding Ltd. sponsored ADR | 240,900 | | 23,753 |
Baidu.com, Inc. sponsored ADR (a) | 18,500 | | 4,417 |
China Modern Dairy Holdings Ltd. (a)(e) | 6,161,000 | | 2,718 |
GCL-Poly Energy Holdings Ltd. (a) | 16,510,000 | | 5,564 |
Melco Crown Entertainment Ltd. sponsored ADR | 267,500 | | 7,260 |
PW Medtech Group Ltd. (a) | 5,938,000 | | 3,749 |
Sands China Ltd. | 1,554,400 | | 9,695 |
Tencent Holdings Ltd. | 196,800 | | 3,163 |
TOTAL CAYMAN ISLANDS | | 61,150 |
Colombia - 0.2% |
Grupo Aval Acciones y Valores SA ADR | 287,696 | | 3,878 |
Curacao - 0.0% |
Schlumberger Ltd. | 5,400 | | 533 |
Denmark - 2.4% |
A.P. Moller - Maersk A/S Series B | 802 | | 1,869 |
Genmab A/S (a) | 132,800 | | 5,789 |
Novo Nordisk A/S Series B | 789,740 | | 35,698 |
Vestas Wind Systems A/S (a) | 94,134 | | 3,151 |
TOTAL DENMARK | | 46,507 |
Finland - 0.6% |
Nokia Corp. | 647,900 | | 5,414 |
Sampo Oyj (A Shares) | 113,300 | | 5,419 |
TOTAL FINLAND | | 10,833 |
France - 3.7% |
Air Liquide SA | 54,260 | | 6,545 |
Atos Origin SA | 49,027 | | 3,385 |
AXA SA | 444,800 | | 10,262 |
BNP Paribas SA | 221,943 | | 13,945 |
Kering SA | 16,100 | | 3,106 |
LVMH Moet Hennessy - Louis Vuitton SA | 16,998 | | 2,883 |
Numericable Group SA (e) | 33,900 | | 1,253 |
Common Stocks - continued |
| Shares | | Value (000s) |
France - continued |
Numericable Group SA rights 11/12/14 (a) | 33,900 | | $ 1,005 |
Publicis Groupe SA (a) | 140,010 | | 9,697 |
Sanofi SA | 186,347 | | 16,909 |
Tarkett SA | 43,874 | | 1,264 |
TOTAL FRANCE | | 70,254 |
Germany - 4.8% |
adidas AG | 20,690 | | 1,505 |
Bayer AG | 219,452 | | 31,199 |
Brenntag AG | 75,600 | | 3,657 |
Continental AG | 34,600 | | 6,792 |
Drillisch AG | 50,000 | | 1,735 |
Fresenius SE & Co. KGaA | 294,300 | | 15,139 |
Gerry Weber International AG (Bearer) | 59,100 | | 2,372 |
Linde AG | 53,347 | | 9,837 |
OSRAM Licht AG (a) | 62,910 | | 2,204 |
ProSiebenSat.1 Media AG | 90,800 | | 3,659 |
SAP AG (e) | 135,216 | | 9,213 |
Symrise AG | 58,000 | | 3,262 |
TOTAL GERMANY | | 90,574 |
Hong Kong - 1.7% |
AIA Group Ltd. | 4,129,000 | | 23,042 |
Galaxy Entertainment Group Ltd. | 1,059,000 | | 7,241 |
Melco International Development Ltd. | 679,000 | | 1,841 |
TOTAL HONG KONG | | 32,124 |
India - 2.4% |
Apollo Hospitals Enterprise Ltd. (a) | 199,507 | | 3,621 |
Axis Bank Ltd. (a) | 444,940 | | 3,279 |
HDFC Bank Ltd. | 835,563 | | 13,549 |
Housing Development Finance Corp. Ltd. | 655,610 | | 11,807 |
ITC Ltd. (a) | 1,141,123 | | 6,598 |
LIC Housing Finance Ltd. | 201,645 | | 1,187 |
Lupin Ltd. | 127,912 | | 2,962 |
Pidilite Industries Ltd. | 524,041 | | 3,531 |
TOTAL INDIA | | 46,534 |
Indonesia - 0.5% |
PT Bank Central Asia Tbk | 5,215,000 | | 5,630 |
PT Bank Rakyat Indonesia Tbk | 4,102,200 | | 3,759 |
TOTAL INDONESIA | | 9,389 |
Common Stocks - continued |
| Shares | | Value (000s) |
Ireland - 2.1% |
Actavis PLC (a) | 50,000 | | $ 12,137 |
DCC PLC (United Kingdom) | 71,500 | | 3,996 |
Greencore Group PLC | 1,069,521 | | 4,489 |
Perrigo Co. PLC | 71,900 | | 11,608 |
Ryanair Holdings PLC sponsored ADR (a) | 147,800 | | 8,209 |
TOTAL IRELAND | | 40,439 |
Israel - 1.3% |
Check Point Software Technologies Ltd. (a) | 120,100 | | 8,917 |
Teva Pharmaceutical Industries Ltd. sponsored ADR | 295,000 | | 16,659 |
TOTAL ISRAEL | | 25,576 |
Italy - 0.9% |
Telecom Italia SpA (a) | 2,528,504 | | 2,866 |
UniCredit SpA | 1,301,916 | | 9,397 |
World Duty Free SpA (a) | 582,140 | | 4,928 |
TOTAL ITALY | | 17,191 |
Japan - 17.7% |
Ain Pharmaciez, Inc. | 77,700 | | 2,105 |
Aozora Bank Ltd. | 867,000 | | 3,047 |
Astellas Pharma, Inc. | 1,338,800 | | 20,779 |
Daiichikosho Co. Ltd. | 74,400 | | 1,878 |
Don Quijote Holdings Co. Ltd. | 182,000 | | 10,905 |
Fast Retailing Co. Ltd. | 18,500 | | 6,878 |
Fuji Heavy Industries Ltd. | 98,700 | | 3,285 |
GMO Internet, Inc. | 357,500 | | 3,002 |
Honda Motor Co. Ltd. sponsored ADR | 152,306 | | 4,892 |
Hoya Corp. | 650,900 | | 23,033 |
Japan Exchange Group, Inc. | 361,800 | | 8,975 |
Japan Tobacco, Inc. | 686,800 | | 23,433 |
KDDI Corp. | 224,600 | | 14,749 |
Keyence Corp. | 46,800 | | 22,678 |
Komatsu Ltd. | 440,400 | | 10,398 |
Medical System Network Co. Ltd. (e) | 752,500 | | 2,298 |
Misumi Group, Inc. | 34,800 | | 1,098 |
Mitsubishi Electric Corp. | 436,000 | | 5,622 |
Mitsubishi UFJ Financial Group, Inc. | 2,952,200 | | 17,209 |
Nagaileben Co. Ltd. | 117,000 | | 2,249 |
NEC Corp. | 3,756,000 | | 13,283 |
NGK Spark Plug Co. Ltd. | 106,000 | | 2,765 |
Nippon Telegraph & Telephone Corp. | 158,500 | | 9,862 |
Nitori Holdings Co. Ltd. | 86,000 | | 5,450 |
Common Stocks - continued |
| Shares | | Value (000s) |
Japan - continued |
Olympus Corp. (a) | 56,700 | | $ 2,036 |
OMRON Corp. | 163,100 | | 7,720 |
ORIX Corp. | 2,432,400 | | 33,762 |
Rakuten, Inc. | 1,186,500 | | 13,380 |
Recruit Holdings Co. Ltd. (a) | 36,900 | | 1,261 |
Seven & i Holdings Co., Ltd. | 156,700 | | 6,120 |
SHIMANO, Inc. | 51,800 | | 6,869 |
Shinsei Bank Ltd. | 1,893,000 | | 4,254 |
Ship Healthcare Holdings, Inc. | 95,400 | | 2,233 |
SoftBank Corp. | 311,400 | | 22,670 |
Suzuki Motor Corp. | 154,500 | | 5,179 |
Toshiba Plant Systems & Services Corp. | 153,200 | | 2,564 |
Tsuruha Holdings, Inc. | 116,000 | | 6,849 |
VT Holdings Co. Ltd. | 606,600 | | 2,396 |
TOTAL JAPAN | | 337,166 |
Korea (South) - 0.9% |
NAVER Corp. | 10,009 | | 7,024 |
Orion Corp. | 6,412 | | 4,923 |
Samsung Electronics Co. Ltd. | 4,431 | | 5,130 |
Samsung SDS Co. Ltd. (a) | 2,071 | | 366 |
TOTAL KOREA (SOUTH) | | 17,443 |
Luxembourg - 1.3% |
Altice SA | 243,177 | | 15,142 |
Eurofins Scientific SA | 38,800 | | 9,805 |
TOTAL LUXEMBOURG | | 24,947 |
Mexico - 0.3% |
America Movil S.A.B. de CV Series L sponsored ADR | 197,100 | | 4,811 |
Netherlands - 3.5% |
AEGON NV | 2,212,100 | | 18,030 |
AerCap Holdings NV (a) | 75,500 | | 3,272 |
IMCD Group BV | 122,800 | | 3,386 |
ING Groep NV (Certificaten Van Aandelen) (a) | 664,900 | | 9,522 |
LyondellBasell Industries NV Class A | 82,200 | | 7,532 |
Reed Elsevier NV | 213,182 | | 4,906 |
Unilever NV (Certificaten Van Aandelen) (Bearer) | 500,200 | | 19,387 |
TOTAL NETHERLANDS | | 66,035 |
Norway - 0.2% |
Telenor ASA | 187,400 | | 4,212 |
Common Stocks - continued |
| Shares | | Value (000s) |
Philippines - 0.4% |
Alliance Global Group, Inc. | 12,852,154 | | $ 7,229 |
Singapore - 0.4% |
Ezion Holdings Ltd. | 1,479,600 | | 1,742 |
United Overseas Bank Ltd. | 329,000 | | 5,894 |
TOTAL SINGAPORE | | 7,636 |
South Africa - 0.9% |
Naspers Ltd. Class N | 142,100 | | 17,684 |
Spain - 1.6% |
Amadeus IT Holding SA Class A | 266,800 | | 9,796 |
Criteria CaixaCorp SA | 554,945 | | 3,026 |
Inditex SA | 656,784 | | 18,449 |
TOTAL SPAIN | | 31,271 |
Sweden - 2.3% |
ASSA ABLOY AB (B Shares) | 100,600 | | 5,328 |
HEXPOL AB (B Shares) | 16,800 | | 1,486 |
Nordea Bank AB | 1,015,800 | | 13,027 |
Svenska Cellulosa AB (SCA) (B Shares) | 644,300 | | 14,406 |
Svenska Handelsbanken AB (A Shares) | 212,000 | | 10,109 |
TOTAL SWEDEN | | 44,356 |
Switzerland - 5.2% |
Actelion Ltd. | 47,876 | | 5,692 |
Compagnie Financiere Richemont SA Series A | 113,494 | | 9,549 |
Credit Suisse Group AG | 354,987 | | 9,458 |
Nestle SA | 162,022 | | 11,882 |
Roche Holding AG (participation certificate) | 91,362 | | 26,961 |
Syngenta AG (Switzerland) | 53,404 | | 16,516 |
UBS AG | 1,072,643 | | 18,651 |
TOTAL SWITZERLAND | | 98,709 |
Taiwan - 1.1% |
Taiwan Semiconductor Manufacturing Co. Ltd. sponsored ADR | 937,900 | | 20,653 |
Thailand - 0.2% |
Kasikornbank PCL (For. Reg.) | 533,300 | | 3,863 |
United Kingdom - 16.8% |
Al Noor Hospitals Group PLC | 266,200 | | 4,339 |
Associated British Foods PLC | 175,100 | | 7,714 |
B&M European Value Retail S.A. | 1,353,586 | | 5,386 |
BG Group PLC | 1,008,869 | | 16,814 |
British American Tobacco PLC sponsored ADR | 167,200 | | 18,987 |
Common Stocks - continued |
| Shares | | Value (000s) |
United Kingdom - continued |
BT Group PLC | 1,879,500 | | $ 11,080 |
Bunzl PLC | 119,000 | | 3,227 |
Capita Group PLC | 100,700 | | 1,767 |
Compass Group PLC | 404,800 | | 6,514 |
Diploma PLC | 350,900 | | 3,904 |
easyJet PLC | 160,900 | | 3,861 |
Exova Group Ltd. PLC (a) | 644,700 | | 1,751 |
Filtrona PLC | 815,100 | | 8,951 |
GlaxoSmithKline PLC | 419,900 | | 9,496 |
Hikma Pharmaceuticals PLC | 238,987 | | 7,245 |
HSBC Holdings PLC sponsored ADR | 490,797 | | 25,040 |
IMI PLC | 189,700 | | 3,708 |
Imperial Tobacco Group PLC | 88,997 | | 3,860 |
ITV PLC | 1,841,700 | | 5,981 |
Johnson Matthey PLC | 121,600 | | 5,785 |
Kingfisher PLC | 1,846,900 | | 8,947 |
Liberty Global PLC: | | | |
Class A (a) | 68,400 | | 3,110 |
Class C | 48,700 | | 2,166 |
Lloyds Banking Group PLC (a) | 17,941,900 | | 22,156 |
Mears Group PLC | 260,100 | | 1,839 |
Meggitt PLC | 539,673 | | 3,894 |
Next PLC | 192,100 | | 19,806 |
Poundland Group PLC (a) | 361,369 | | 1,821 |
Prudential PLC | 1,008,173 | | 23,345 |
Reckitt Benckiser Group PLC | 222,013 | | 18,646 |
Rentokil Initial PLC | 1,109,900 | | 2,187 |
Rolls-Royce Group PLC | 733,500 | | 9,892 |
SABMiller PLC | 169,000 | | 9,530 |
Schroders PLC | 24,900 | | 960 |
Spectris PLC | 138,900 | | 4,004 |
Sports Direct International PLC (a) | 459,400 | | 4,736 |
St. James's Place Capital PLC | 934,800 | | 11,141 |
Standard Chartered PLC (United Kingdom) | 232,764 | | 3,499 |
Travis Perkins PLC | 220,300 | | 5,822 |
Whitbread PLC | 116,872 | | 8,159 |
TOTAL UNITED KINGDOM | | 321,070 |
United States of America - 7.9% |
AbbVie, Inc. | 114,900 | | 7,292 |
Alexion Pharmaceuticals, Inc. (a) | 47,600 | | 9,109 |
Alliance Data Systems Corp. (a) | 20,900 | | 5,922 |
Common Stocks - continued |
| Shares | | Value (000s) |
United States of America - continued |
Amgen, Inc. | 52,700 | | $ 8,547 |
Celldex Therapeutics, Inc. (a) | 41,800 | | 700 |
CF Industries Holdings, Inc. | 14,700 | | 3,822 |
Fidelity National Information Services, Inc. | 96,600 | | 5,640 |
FMC Corp. | 32,700 | | 1,875 |
Freeport-McMoRan, Inc. | 110,100 | | 3,138 |
Gilead Sciences, Inc. (a) | 90,700 | | 10,158 |
Google, Inc.: | | | |
Class A (a) | 13,295 | | 7,550 |
Class C (a) | 19,795 | | 11,067 |
Las Vegas Sands Corp. | 133,000 | | 8,281 |
MasterCard, Inc. Class A | 127,700 | | 10,695 |
McGraw Hill Financial, Inc. | 189,800 | | 17,173 |
Mead Johnson Nutrition Co. Class A | 53,900 | | 5,353 |
Mondelez International, Inc. | 144,300 | | 5,088 |
Noble Energy, Inc. | 148,300 | | 8,547 |
QUALCOMM, Inc. | 75,500 | | 5,928 |
The Blackstone Group LP | 146,100 | | 4,401 |
Visa, Inc. Class A | 44,500 | | 10,744 |
TOTAL UNITED STATES OF AMERICA | | 151,030 |
TOTAL COMMON STOCKS (Cost $1,514,332) |
1,847,559
|
Preferred Stocks - 1.4% |
| | | |
Convertible Preferred Stocks - 0.0% |
United States of America - 0.0% |
NJOY, Inc.: | | | |
Series C (a)(h) | 60,264 | | 486 |
Series D (h) | 18,951 | | 153 |
TOTAL UNITED STATES OF AMERICA | | 639 |
Nonconvertible Preferred Stocks - 1.4% |
Germany - 1.4% |
Henkel AG & Co. KGaA | 132,200 | | 13,051 |
Volkswagen AG | 64,700 | | 13,787 |
TOTAL GERMANY | | 26,838 |
Preferred Stocks - continued |
| Shares | | Value (000s) |
Nonconvertible Preferred Stocks - continued |
United Kingdom - 0.0% |
Rolls-Royce Group PLC | 66,015,000 | | $ 106 |
TOTAL NONCONVERTIBLE PREFERRED STOCKS | | 26,944 |
TOTAL PREFERRED STOCKS (Cost $21,726) |
27,583
|
Preferred Securities - 0.1% |
| Principal Amount (d) (000s) | | |
Ireland - 0.1% |
Baggot Securities Ltd. 10.24% (f)(g)
(Cost $2,488) | EUR | 1,620 | |
2,295
|
Money Market Funds - 2.6% |
| Shares | | |
Fidelity Cash Central Fund, 0.11% (b) | 31,286,373 | | 31,286 |
Fidelity Securities Lending Cash Central Fund, 0.11% (b)(c) | 18,560,972 | | 18,561 |
TOTAL MONEY MARKET FUNDS (Cost $49,847) |
49,847
|
TOTAL INVESTMENT PORTFOLIO - 100.8% (Cost $1,588,393) | | 1,927,284 |
NET OTHER ASSETS (LIABILITIES) - (0.8)% | | (15,807) |
NET ASSETS - 100% | $ 1,911,477 |
Currency Abbreviations |
EUR | - | European Monetary Unit |
Legend |
(a) Non-income producing |
(b) Affiliated fund that is generally available only to investment companies and other accounts managed by Fidelity Investments. The rate quoted is the annualized seven-day yield of the fund at period end. A complete unaudited listing of the fund's holdings as of its most recent quarter end is available upon request. In addition, each Fidelity Central Fund's financial statements, which are not covered by the Fund's Report of Independent Registered Public Accounting Firm, are available on the SEC's website or upon request. |
(c) Investment made with cash collateral received from securities on loan. |
(d) Amount is stated in United States dollars unless otherwise noted. |
(e) Security or a portion of the security is on loan at period end. |
(f) Security exempt from registration under Rule 144A of the Securities Act of 1933. These securities may be resold in transactions exempt from registration, normally to qualified institutional buyers. At the end of the period, the value of these securities amounted to $2,295,000 or 0.1% of net assets. |
(g) Security is perpetual in nature with no stated maturity date. |
(h) Restricted securities - Investment in securities not registered under the Securities Act of 1933 (excluding 144A issues). At the end of the period, the value of restricted securities (excluding 144A issues) amounted to $639,000 or 0.0% of net assets. |
Additional information on each restricted holding is as follows: |
Security | Acquisition
Date | Acquisition
Cost (000s) |
NJOY, Inc. Series C | 6/7/13 | $ 487 |
NJOY, Inc. Series D | 2/14/14 | $ 321 |
Affiliated Central Funds |
Information regarding fiscal year to date income earned by the Fund from investments in Fidelity Central Funds is as follows: |
Fund | Income earned
(Amounts in thousands) |
Fidelity Cash Central Fund | $ 26 |
Fidelity Securities Lending Cash Central Fund | 900 |
Total | $ 926 |
Other Information |
Categorizations in the Schedule of Investments are based on country or territory of incorporation. |
The following is a summary of the inputs used, as of October 31, 2014, involving the Fund's assets and liabilities carried at fair value. The inputs or methodology used for valuing securities may not be an indication of the risk associated with investing in those securities. For more information on valuation inputs, and their aggregation into the levels used in the table below, please refer to the Investment Valuation section in the accompanying Notes to Financial Statements. |
Valuation Inputs at Reporting Date: |
Description
(Amounts in thousands) | Total | Level 1 | Level 2 | Level 3 |
Investments in Securities: | | | | |
Equities: | | | | |
Consumer Discretionary | $ 295,222 | $ 199,164 | $ 95,419 | $ 639 |
Consumer Staples | 233,257 | 121,689 | 111,568 | - |
Energy | 66,257 | 41,558 | 24,699 | - |
Financials | 403,505 | 144,490 | 259,015 | - |
Health Care | 321,467 | 161,281 | 160,186 | - |
Industrials | 123,823 | 91,941 | 31,882 | - |
Information Technology | 263,235 | 170,165 | 93,070 | - |
Materials | 96,391 | 76,344 | 20,047 | - |
Telecommunication Services | 71,985 | 10,758 | 61,227 | - |
Preferred Securities | 2,295 | - | 2,295 | - |
Money Market Funds | 49,847 | 49,847 | - | - |
Total Investments in Securities: | $ 1,927,284 | $ 1,067,237 | $ 859,408 | $ 639 |
The following is a summary of transfers between Level 1 and Level 2 for the period ended October 31, 2014. Transfers are assumed to have occurred at the beginning of the period, and are primarily attributable to the valuation techniques used for foreign equity securities, as discussed in the accompanying Notes to Financial Statements: |
Transfers | Total (000s) |
Level 1 to Level 2 | $ 164,017 |
Level 2 to Level 1 | $ 0 |
See accompanying notes which are an integral part of the financial statements.
Annual Report
Statement of Assets and Liabilities
Amounts in thousands (except per-share amounts) | October 31, 2014 |
| | |
Assets | | |
Investment in securities, at value (including securities loaned of $17,707) - See accompanying schedule: Unaffiliated issuers (cost $1,538,546) | $ 1,877,437 | |
Fidelity Central Funds (cost $49,847) | 49,847 | |
Total Investments (cost $1,588,393) | | $ 1,927,284 |
Foreign currency held at value (cost $62) | | 62 |
Receivable for investments sold | | 7,243 |
Receivable for fund shares sold | | 2,290 |
Dividends receivable | | 4,406 |
Distributions receivable from Fidelity Central Funds | | 14 |
Prepaid expenses | | 5 |
Other receivables | | 196 |
Total assets | | 1,941,500 |
| | |
Liabilities | | |
Payable for investments purchased | $ 3,546 | |
Payable for fund shares redeemed | 3,300 | |
Accrued management fee | 1,039 | |
Distribution and service plan fees payable | 468 | |
Other affiliated payables | 443 | |
Other payables and accrued expenses | 2,666 | |
Collateral on securities loaned, at value | 18,561 | |
Total liabilities | | 30,023 |
| | |
Net Assets | | $ 1,911,477 |
Net Assets consist of: | | |
Paid in capital | | $ 4,218,295 |
Undistributed net investment income | | 18,417 |
Accumulated undistributed net realized gain (loss) on investments and foreign currency transactions | | (2,661,534) |
Net unrealized appreciation (depreciation) on investments and assets and liabilities in foreign currencies | | 336,299 |
Net Assets | | $ 1,911,477 |
See accompanying notes which are an integral part of the financial statements.
Annual Report
Statement of Assets and Liabilities - continued
Amounts in thousands (except per-share amounts) | October 31, 2014 |
| | |
Calculation of Maximum Offering Price Class A:
Net Asset Value and redemption price per share ($693,064 ÷ 35,431 shares) | | $ 19.56 |
| | |
Maximum offering price per share (100/94.25 of $19.56) | | $ 20.75 |
Class T:
Net Asset Value and redemption price per share ($283,584 ÷ 14,630 shares) | | $ 19.38 |
| | |
Maximum offering price per share (100/96.50 of $19.38) | | $ 20.08 |
Class B:
Net Asset Value and offering price per share ($19,140 ÷ 1,021 shares)A | | $ 18.75 |
| | |
Class C:
Net Asset Value and offering price per share ($243,431 ÷ 13,034 shares)A | | $ 18.68 |
| | |
| | |
Institutional Class:
Net Asset Value, offering price and redemption price per share ($648,208 ÷ 32,552 shares) | | $ 19.91 |
| | |
Class Z:
Net Asset Value, offering price and redemption price per share ($24,050 ÷ 1,207 shares) | | $ 19.93 |
A Redemption price per share is equal to net asset value less any applicable contingent deferred sales charge.
See accompanying notes which are an integral part of the financial statements.
Annual Report
Financial Statements - continued
Statement of Operations
Amounts in thousands | Year ended October 31, 2014 |
| | |
Investment Income | | |
Dividends | | $ 45,009 |
Special dividends | | 9,777 |
Income from Fidelity Central Funds | | 926 |
Income before foreign taxes withheld | | 55,712 |
Less foreign taxes withheld | | (3,501) |
Total income | | 52,211 |
| | |
Expenses | | |
Management fee | $ 13,964 | |
Transfer agent fees | 4,638 | |
Distribution and service plan fees | 6,276 | |
Accounting and security lending fees | 896 | |
Custodian fees and expenses | 249 | |
Independent trustees' compensation | 8 | |
Registration fees | 116 | |
Audit | 86 | |
Legal | 8 | |
Miscellaneous | 17 | |
Total expenses before reductions | 26,258 | |
Expense reductions | (27) | 26,231 |
Net investment income (loss) | | 25,980 |
Realized and Unrealized Gain (Loss) Net realized gain (loss) on: | | |
Investment securities: | | |
Unaffiliated issuers | 173,972 | |
Foreign currency transactions | (234) | |
Futures contracts | 550 | |
Total net realized gain (loss) | | 174,288 |
Change in net unrealized appreciation (depreciation) on: Investment securities (net of increase in deferred foreign taxes of $21) | (153,249) | |
Assets and liabilities in foreign currencies | (168) | |
Futures contracts | (491) | |
Total change in net unrealized appreciation (depreciation) | | (153,908) |
Net gain (loss) | | 20,380 |
Net increase (decrease) in net assets resulting from operations | | $ 46,360 |
See accompanying notes which are an integral part of the financial statements.
Annual Report
Statement of Changes in Net Assets
Amounts in thousands | Year ended
October 31,
2014 | Year ended
October 31,
2013 |
Increase (Decrease) in Net Assets | | |
Operations | | |
Net investment income (loss) | $ 25,980 | $ 19,442 |
Net realized gain (loss) | 174,288 | 196,674 |
Change in net unrealized appreciation (depreciation) | (153,908) | 237,976 |
Net increase (decrease) in net assets resulting
from operations | 46,360 | 454,092 |
Distributions to shareholders from net investment income | (17,375) | (23,595) |
Distributions to shareholders from net realized gain | (17,564) | (7,342) |
Total distributions | (34,939) | (30,937) |
Share transactions - net increase (decrease) | (109,770) | (330,363) |
Redemption fees | 19 | 17 |
Total increase (decrease) in net assets | (98,330) | 92,809 |
| | |
Net Assets | | |
Beginning of period | 2,009,807 | 1,916,998 |
End of period (including undistributed net investment income of $18,417 and undistributed net investment income of $17,279, respectively) | $ 1,911,477 | $ 2,009,807 |
See accompanying notes which are an integral part of the financial statements.
Annual Report
Financial Highlights - Class A
Years ended October 31, | 2014 | 2013 | 2012 | 2011 | 2010 |
Selected Per-Share Data | | | | | |
Net asset value, beginning of period | $ 19.47 | $ 15.63 | $ 14.61 | $ 15.63 | $ 14.25 |
Income from Investment Operations | | | | | |
Net investment income (loss) C | .27F | .19 | .18 | .22G | .14 |
Net realized and unrealized gain (loss) | .17 | 3.92 | 1.03 | (1.01) | 1.44 |
Total from investment operations | .44 | 4.11 | 1.21 | (.79) | 1.58 |
Distributions from net investment income | (.18) | (.21) | (.19) | (.20) | (.19) |
Distributions from net realized gain | (.17) | (.06) | - | (.03) | (.01) |
Total distributions | (.35) | (.27) | (.19) | (.23) | (.20) |
Redemption fees added to paid in capital C, I | - | - | - | - | - |
Net asset value, end of period | $ 19.56 | $ 19.47 | $ 15.63 | $ 14.61 | $ 15.63 |
Total ReturnA, B | 2.28% | 26.69% | 8.47% | (5.15)% | 11.17% |
Ratios to Average Net Assets D, H | | | | | |
Expenses before reductions | 1.26% | 1.31% | 1.32% | 1.31% | 1.32% |
Expenses net of fee waivers, if any | 1.26% | 1.30% | 1.32% | 1.31% | 1.32% |
Expenses net of all reductions | 1.26% | 1.28% | 1.31% | 1.29% | 1.30% |
Net investment income (loss) | 1.34% F | 1.08% | 1.20% | 1.38% G | .95% |
Supplemental Data | | | | | |
Net assets, end of period (in millions) | $ 693 | $ 756 | $ 762 | $ 916 | $ 1,302 |
Portfolio turnover rateE | 40% | 50% | 34% | 48% | 59% |
A Total returns would have been lower if certain expenses had not been reduced during the applicable periods shown.
B Total returns do not include the effect of the sales charges.
C Calculated based on average shares outstanding during the period.
D Fees and expenses of any underlying Fidelity Central Funds are not included in the Fund's expense ratio. The Fund indirectly bears its proportionate share of the expenses of any underlying Fidelity Central Funds.
E Amount does not include the portfolio activity of any underlying Fidelity Central Funds.
F Investment income per share reflects a large, non-recurring dividend which amounted to $.10 per share. Excluding this non-recurring dividend, the ratio of net investment income (loss) to average net assets would have been .85%.
G Investment income per share reflects a large, non-recurring dividend which amounted to $.06 per share. Excluding this non-recurring dividend, the ratio of net investment income (loss) to average net assets would have been .98%.
H Expense ratios reflect operating expenses of the class. Expenses before reductions do not reflect amounts reimbursed by the investment adviser or reductions from brokerage service arrangements or reductions from other expense offset arrangements and do not represent the amount paid by the class during periods when reimbursements or reductions occur. Expenses net of fee waivers reflect expenses after reimbursement by the investment adviser but prior to reductions from brokerage service arrangements or other expense offset arrangements. Expenses net of all reductions represent the net expenses paid by the class.
I Amount represents less than $.01 per share.
See accompanying notes which are an integral part of the financial statements.
Annual Report
Financial Highlights - Class T
Years ended October 31, | 2014 | 2013 | 2012 | 2011 | 2010 |
Selected Per-Share Data | | | | | |
Net asset value, beginning of period | $ 19.30 | $ 15.49 | $ 14.46 | $ 15.47 | $ 14.11 |
Income from Investment Operations | | | | | |
Net investment income (loss) C | .21F | .14 | .14 | .18G | .10 |
Net realized and unrealized gain (loss) | .18 | 3.89 | 1.03 | (.99) | 1.43 |
Total from investment operations | .39 | 4.03 | 1.17 | (.81) | 1.53 |
Distributions from net investment income | (.14) | (.16) | (.14) | (.16) | (.16) |
Distributions from net realized gain | (.17) | (.06) | - | (.03) | (.01) |
Total distributions | (.31) | (.22) | (.14) | (.20) J | (.17) |
Redemption fees added to paid in capital C, I | - | - | - | �� - | - |
Net asset value, end of period | $ 19.38 | $ 19.30 | $ 15.49 | $ 14.46 | $ 15.47 |
Total ReturnA, B | 2.04% | 26.37% | 8.17% | (5.35)% | 10.88% |
Ratios to Average Net Assets D, H | | | | | |
Expenses before reductions | 1.51% | 1.55% | 1.58% | 1.55% | 1.55% |
Expenses net of fee waivers, if any | 1.51% | 1.55% | 1.58% | 1.55% | 1.55% |
Expenses net of all reductions | 1.51% | 1.53% | 1.57% | 1.53% | 1.53% |
Net investment income (loss) | 1.09% F | .83% | .94% | 1.14% G | .71% |
Supplemental Data | | | | | |
Net assets, end of period (in millions) | $ 284 | $ 319 | $ 304 | $ 404 | $ 621 |
Portfolio turnover rateE | 40% | 50% | 34% | 48% | 59% |
A Total returns would have been lower if certain expenses had not been reduced during the applicable periods shown.
B Total returns do not include the effect of the sales charges.
C Calculated based on average shares outstanding during the period.
D Fees and expenses of any underlying Fidelity Central Funds are not included in the Fund's expense ratio. The Fund indirectly bears its proportionate share of the expenses of any underlying Fidelity Central Funds.
E Amount does not include the portfolio activity of any underlying Fidelity Central Funds.
F Investment income per share reflects a large, non-recurring dividend which amounted to $.10 per share. Excluding this non-recurring dividend, the ratio of net investment income (loss) to average net assets would have been .60%.
G Investment income per share reflects a large, non-recurring dividend which amounted to $.06 per share. Excluding this non-recurring dividend, the ratio of net investment income (loss) to average net assets would have been .74%.
H Expense ratios reflect operating expenses of the class. Expenses before reductions do not reflect amounts reimbursed by the investment adviser or reductions from brokerage service arrangements or reductions from other expense offset arrangements and do not represent the amount paid by the class during periods when reimbursements or reductions occur. Expenses net of fee waivers reflect expenses after reimbursement by the investment adviser but prior to reductions from brokerage service arrangements or other expense offset arrangements. Expenses net of all reductions represent the net expenses paid by the class.
I Amount represents less than $.01 per share.
J Total distributions of $.20 per share is comprised of distributions from net investment income of $.164 and distributions from net realized gain of $.034 per share.
See accompanying notes which are an integral part of the financial statements.
Annual Report
Financial Highlights - Class B
Years ended October 31, | 2014 | 2013 | 2012 | 2011 | 2010 |
Selected Per-Share Data | | | | | |
Net asset value, beginning of period | $ 18.65 | $ 14.95 | $ 13.91 | $ 14.91 | $ 13.61 |
Income from Investment Operations | | | | | |
Net investment income (loss) C | .10F | .05 | .06 | .09G | .02 |
Net realized and unrealized gain (loss) | .17 | 3.77 | 1.00 | (.96) | 1.38 |
Total from investment operations | .27 | 3.82 | 1.06 | (.87) | 1.40 |
Distributions from net investment income | - | (.06) | (.02) | (.10) | (.09) |
Distributions from net realized gain | (.17) | (.06) | - | (.03) | (.01) |
Total distributions | (.17) | (.12) | (.02) | (.13) | (.10) |
Redemption fees added to paid in capital C, I | - | - | - | - | - |
Net asset value, end of period | $ 18.75 | $ 18.65 | $ 14.95 | $ 13.91 | $ 14.91 |
Total ReturnA, B | 1.45% | 25.72% | 7.64% | (5.89)% | 10.34% |
Ratios to Average Net Assets D, H | | | | | |
Expenses before reductions | 2.07% | 2.08% | 2.08% | 2.08% | 2.09% |
Expenses net of fee waivers, if any | 2.07% | 2.08% | 2.08% | 2.08% | 2.09% |
Expenses net of all reductions | 2.07% | 2.06% | 2.07% | 2.06% | 2.07% |
Net investment income (loss) | .53%F | .30% | .44% | .61%G | .18% |
Supplemental Data | | | | | |
Net assets, end of period (in millions) | $ 19 | $ 36 | $ 59 | $ 94 | $ 157 |
Portfolio turnover rateE | 40% | 50% | 34% | 48% | 59% |
A Total returns would have been lower if certain expenses had not been reduced during the applicable periods shown.
B Total returns do not include the effect of the contingent deferred sales charge.
C Calculated based on average shares outstanding during the period.
D Fees and expenses of any underlying Fidelity Central Funds are not included in the Fund's expense ratio. The Fund indirectly bears its proportionate share of the expenses of any underlying Fidelity Central Funds.
E Amount does not include the portfolio activity of any underlying Fidelity Central Funds.
F Investment income per share reflects a large, non-recurring dividend which amounted to $.09 per share. Excluding this non-recurring dividend, the ratio of net investment income (loss) to average net assets would have been .04%.
G Investment income per share reflects a large, non-recurring dividend which amounted to $.06 per share. Excluding this non-recurring dividend, the ratio of net investment income (loss) to average net assets would have been .21%.
H Expense ratios reflect operating expenses of the class. Expenses before reductions do not reflect amounts reimbursed by the investment adviser or reductions from brokerage service arrangements or reductions from other expense offset arrangements and do not represent the amount paid by the class during periods when reimbursements or reductions occur. Expenses net of fee waivers reflect expenses after reimbursement by the investment adviser but prior to reductions from brokerage service arrangements or other expense offset arrangements. Expenses net of all reductions represent the net expenses paid by the class.
I Amount represents less than $.01 per share.
See accompanying notes which are an integral part of the financial statements.
Annual Report
Financial Highlights - Class C
Years ended October 31, | 2014 | 2013 | 2012 | 2011 | 2010 |
Selected Per-Share Data | | | | | |
Net asset value, beginning of period | $ 18.63 | $ 14.97 | $ 13.95 | $ 14.95 | $ 13.65 |
Income from Investment Operations | | | | | |
Net investment income (loss) C | .11F | .06 | .06 | .10G | .03 |
Net realized and unrealized gain (loss) | .18 | 3.75 | 1.01 | (.96) | 1.38 |
Total from investment operations | .29 | 3.81 | 1.07 | (.86) | 1.41 |
Distributions from net investment income | (.07) | (.09) | (.05) | (.11) | (.10) |
Distributions from net realized gain | (.17) | (.06) | - | (.03) | (.01) |
Total distributions | (.24) | (.15) | (.05) | (.14) | (.11) |
Redemption fees added to paid in capital C, I | - | - | - | - | - |
Net asset value, end of period | $ 18.68 | $ 18.63 | $ 14.97 | $ 13.95 | $ 14.95 |
Total ReturnA, B | 1.58% | 25.71% | 7.71% | (5.83)% | 10.32% |
Ratios to Average Net Assets D, H | | | | | |
Expenses before reductions | 2.00% | 2.04% | 2.06% | 2.05% | 2.06% |
Expenses net of fee waivers, if any | 2.00% | 2.04% | 2.06% | 2.05% | 2.06% |
Expenses net of all reductions | 2.00% | 2.01% | 2.05% | 2.03% | 2.04% |
Net investment income (loss) | .60%F | .35% | .46% | .64%G | .21% |
Supplemental Data | | | | | |
Net assets, end of period (in millions) | $ 243 | $ 264 | $ 246 | $ 302 | $ 419 |
Portfolio turnover rateE | 40% | 50% | 34% | 48% | 59% |
A Total returns would have been lower if certain expenses had not been reduced during the applicable periods shown.
B Total returns do not include the effect of the contingent deferred sales charge.
C Calculated based on average shares outstanding during the period.
D Fees and expenses of any underlying Fidelity Central Funds are not included in the Fund's expense ratio. The Fund indirectly bears its proportionate share of the expenses of any underlying Fidelity Central Funds.
E Amount does not include the portfolio activity of any underlying Fidelity Central Funds.
F Investment income per share reflects a large, non-recurring dividend which amounted to $.09 per share. Excluding this non-recurring dividend, the ratio of net investment income (loss) to average net assets would have been .11%.
G Investment income per share reflects a large, non-recurring dividend which amounted to $.06 per share. Excluding this non-recurring dividend, the ratio of net investment income (loss) to average net assets would have been .24%.
H Expense ratios reflect operating expenses of the class. Expenses before reductions do not reflect amounts reimbursed by the investment adviser or reductions from brokerage service arrangements or reductions from other expense offset arrangements and do not represent the amount paid by the class during periods when reimbursements or reductions occur. Expenses net of fee waivers reflect expenses after reimbursement by the investment adviser but prior to reductions from brokerage service arrangements or other expense offset arrangements. Expenses net of all reductions represent the net expenses paid by the class.
I Amount represents less than $.01 per share.
See accompanying notes which are an integral part of the financial statements.
Annual Report
Financial Highlights - Institutional Class
Years ended October 31, | 2014 | 2013 | 2012 | 2011 | 2010 |
Selected Per-Share Data | | | | | |
Net asset value, beginning of period | $ 19.80 | $ 15.90 | $ 14.87 | $ 15.90 | $ 14.48 |
Income from Investment Operations | | | | | |
Net investment income (loss) B | .33E | .24 | .23 | .28F | .19 |
Net realized and unrealized gain (loss) | .18 | 3.98 | 1.05 | (1.03) | 1.47 |
Total from investment operations | .51 | 4.22 | 1.28 | (.75) | 1.66 |
Distributions from net investment income | (.23) | (.26) | (.25) | (.25) | (.23) |
Distributions from net realized gain | (.17) | (.06) | - | (.03) | (.01) |
Total distributions | (.40) | (.32) | (.25) | (.28) | (.24) |
Redemption fees added to paid in capital B,H | - | - | - | - | - |
Net asset value, end of period | $ 19.91 | $ 19.80 | $ 15.90 | $ 14.87 | $ 15.90 |
Total ReturnA | 2.60% | 27.03% | 8.83% | (4.85)% | 11.55% |
Ratios to Average Net Assets C, G | | | | | |
Expenses before reductions | .97% | .99% | 1.00% | .99% | .99% |
Expenses net of fee waivers, if any | .97% | .99% | 1.00% | .99% | .99% |
Expenses net of all reductions | .97% | .97% | .99% | .97% | .97% |
Net investment income (loss) | 1.63%E | 1.39% | 1.52% | 1.70%F | 1.28% |
Supplemental Data | | | | | |
Net assets, end of period (in millions) | $ 648 | $ 636 | $ 546 | $ 723 | $ 1,316 |
Portfolio turnover rateD | 40% | 50% | 34% | 48% | 59% |
A Total returns would have been lower if certain expenses had not been reduced during the applicable periods shown.
B Calculated based on average shares outstanding during the period.
C Fees and expenses of any underlying Fidelity Central Funds are not included in the Fund's expense ratio. The Fund indirectly bears its proportionate share of the expenses of any underlying Fidelity Central Funds.
D Amount does not include the portfolio activity of any underlying Fidelity Central Funds.
E Investment income per share reflects a large, non-recurring dividend which amounted to $.10 per share. Excluding this non-recurring dividend, the ratio of net investment income (loss) to average net assets would have been 1.14%.
F Investment income per share reflects a large, non-recurring dividend which amounted to $.06 per share. Excluding this non-recurring dividend, the ratio of net investment income (loss) to average net assets would have been 1.30%.
G Expense ratios reflect operating expenses of the class. Expenses before reductions do not reflect amounts reimbursed by the investment adviser or reductions from brokerage service arrangements or reductions from other expense offset arrangements and do not represent the amount paid by the class during periods when reimbursements or reductions occur. Expenses net of fee waivers reflect expenses after reimbursement by the investment adviser but prior to reductions from brokerage service arrangements or other expense offset arrangements. Expenses net of all reductions represent the net expenses paid by the class.
H Amount represents less than $.01 per share.
See accompanying notes which are an integral part of the financial statements.
Annual Report
Financial Highlights - Class Z
Years ended October 31, | 2014 | 2013H |
Selected Per-Share Data | | |
Net asset value, beginning of period | $ 19.81 | $ 18.54 |
Income from Investment Operations | | |
Net investment income (loss) D | .36G | .03 |
Net realized and unrealized gain (loss) | .19 | 1.24 |
Total from investment operations | .55 | 1.27 |
Distributions from net investment income | (.26) | - |
Distributions from net realized gain | (.17) | - |
Total distributions | (.43) | - |
Redemption fees added to paid in capital D | -J | - |
Net asset value, end of period | $ 19.93 | $ 19.81 |
Total ReturnB, C | 2.81% | 6.85% |
Ratios to Average Net Assets E, I | | |
Expenses before reductions | .81% | .83%A |
Expenses net of fee waivers, if any | .81% | .83%A |
Expenses net of all reductions | .81% | .80%A |
Net investment income (loss) | 1.79%G | .77%A |
Supplemental Data | | |
Net assets, end of period (000 omitted) | $ 24,050 | $ 107 |
Portfolio turnover rateF | 40% | 50% |
A Annualized
B Total returns for periods of less than one year are not annualized.
C Total returns would have been lower if certain expenses had not been reduced during the applicable periods shown.
D Calculated based on average shares outstanding during the period.
E Fees and expenses of any underlying Fidelity Central Funds are not included in the Fund's expense ratio. The Fund indirectly bears its proportionate share of the expenses of any underlying Fidelity Central Funds.
F Amount does not include the portfolio activity of any underlying Fidelity Central Funds.
G Investment income per share reflects a large, non-recurring dividend which amounted to $.10 per share. Excluding this non-recurring dividend, the ratio of net investment income (loss) to average net assets would have been 1.30%.
H For the period August 13, 2013 (commencement of sale of shares) to October 31, 2013.
I Expense ratios reflect operating expenses of the class. Expenses before reductions do not reflect amounts reimbursed by the investment adviser or reductions from brokerage service arrangements or reductions from other expense offset arrangements and do not represent the amount paid by the class during periods when reimbursements or reductions occur. Expenses net of fee waivers reflect expenses after reimbursement by the investment adviser but prior to reductions from brokerage service arrangements or other expense offset arrangements. Expenses net of all reductions represent the net expenses paid by the class.
J Amount represents less than $.01 per share.
See accompanying notes which are an integral part of the financial statements.
Annual Report
Notes to Financial Statements
For the period ended October 31, 2014
(Amounts in thousands except percentages)
1. Organization.
Fidelity Advisor Diversified International Fund (the Fund) is a fund of Fidelity Advisor Series VIII (the Trust) and is authorized to issue an unlimited number of shares. The Trust is registered under the Investment Company Act of 1940, as amended (the 1940 Act), as an open-end management investment company organized as a Massachusetts business trust. The Fund offers Class A, Class T, Class C, Institutional Class and Class Z shares, each of which, along with Class B shares, has equal rights as to assets and voting privileges. Class B shares are closed to new accounts and additional purchases, except for exchanges and reinvestments. Each class has exclusive voting rights with respect to matters that affect that class. Class B shares will automatically convert to Class A shares after a holding period of seven years from the initial date of purchase.
2. Investments in Fidelity Central Funds.
The Fund invests in Fidelity Central Funds, which are open-end investment companies generally available only to other investment companies and accounts managed by the investment adviser and its affiliates. The Fund's Schedule of Investments lists each of the Fidelity Central Funds held as of period end, if any, as an investment of the Fund, but does not include the underlying holdings of each Fidelity Central Fund. As an Investing Fund, the Fund indirectly bears its proportionate share of the expenses of the underlying Fidelity Central Funds.
The Money Market Central Funds seek preservation of capital and current income and are managed by Fidelity Investments Money Management, Inc. (FIMM), an affiliate of the investment adviser. Annualized expenses of the Money Market Central Funds as of their most recent shareholder report date are less than .01%.
A complete unaudited list of holdings for each Fidelity Central Fund is available upon request or at the Securities and Exchange Commission (the SEC) website at www.sec.gov. In addition, the financial statements of the Fidelity Central Funds, which are not covered by the Fund's Report of Independent Registered Public Accounting Firm, are available on the SEC website or upon request.
3. Significant Accounting Policies.
The financial statements have been prepared in conformity with accounting principles generally accepted in the United States of America (GAAP), which require management to make certain estimates and assumptions at the date of the financial statements. Actual results could differ from those estimates. Subsequent events, if any, through the date that the financial statements were issued have been evaluated in the preparation of
Annual Report
Notes to Financial Statements - continued
(Amounts in thousands except percentages)
3. Significant Accounting Policies - continued
the financial statements. The following summarizes the significant accounting policies of the Fund:
Investment Valuation. Investments are valued as of 4:00 p.m. Eastern time on the last calendar day of the period. In accordance with valuation policies and procedures approved by the Board of Trustees (the Board), the Fund attempts to obtain prices from one or more third party pricing vendors or brokers to value its investments. When current market prices, quotations or currency exchange rates are not readily available or reliable, investments will be fair valued in good faith by the Fidelity Management & Research Company (FMR) Fair Value Committee (the Committee), in accordance with procedures adopted by the Board. Factors used in determining fair value vary by investment type and may include market or investment specific events, changes in interest rates and credit quality. The frequency with which these procedures are used cannot be predicted and they may be utilized to a significant extent. The Committee oversees the Fund's valuation policies and procedures and is responsible for approving and reporting to the Board all fair value determinations.
The Fund categorizes the inputs to valuation techniques used to value its investments into a disclosure hierarchy consisting of three levels as shown below:
Level 1 - quoted prices in active markets for identical investments
Level 2 - other significant observable inputs (including quoted prices for similar investments, interest rates, prepayment speeds, etc.)
Level 3 - unobservable inputs (including the Fund's own assumptions based on the best information available)
Valuation techniques used to value the Fund's investments by major category are as follows:
Equity securities, including restricted securities, for which market quotations are readily available, are valued at the last reported sale price or official closing price as reported by a third party pricing vendor on the primary market or exchange on which they are traded and are categorized as Level 1 in the hierarchy. In the event there were no sales during the day or closing prices are not available, securities are valued at the last quoted bid price or may be valued using the last available price and are generally categorized as Level 2 in the hierarchy. For foreign equity securities, when market or security specific events arise, comparisons to the valuation of American Depositary Receipts (ADRs), futures contracts, Exchange-Traded Funds (ETFs) and certain indexes as well as quoted prices for similar securities may be used and would be categorized as Level 2 in the hierarchy. Utilizing these techniques may result in transfers between Level 1 and Level 2. For equity securities, including restricted securities, where observable inputs are limited, assumptions about market activity and risk are used and these securities may be categorized as Level 3 in the hierarchy.
Annual Report
3. Significant Accounting Policies - continued
Investment Valuation - continued
Debt securities, including restricted securities, are valued based on evaluated prices received from third party pricing vendors or from brokers who make markets in such securities. Preferred securities are valued by pricing vendors who utilize matrix pricing which considers yield or price of bonds of comparable quality, coupon, maturity and type or by broker-supplied prices. When independent prices are unavailable or unreliable, debt securities may be valued utilizing pricing methodologies which consider similar factors that would be used by third party pricing vendors. Debt securities are generally categorized as Level 2 in the hierarchy but may be Level 3 depending on the circumstances. ETFs are valued at their last sale price or official closing price as reported by a third party pricing vendor on the primary market or exchange on which they are traded and are categorized as Level 1 in the hierarchy. In the event there were no sales during the day but the exchange reports a closing bid level, ETFs are valued at the closing bid and would be categorized as Level 1 in the hierarchy. In the event there was no closing bid, ETFs may be valued by another method that the Board believes reflects fair value in accordance with the Board's fair value pricing policies and may be categorized as Level 2 in the hierarchy.
Investments in open-end mutual funds, including the Fidelity Central Funds, are valued at their closing net asset value (NAV) each business day and are categorized as Level 1 in the hierarchy.
Changes in valuation techniques may result in transfers in or out of an assigned level within the disclosure hierarchy. The aggregate value of investments by input level, as of October 31, 2014, including information on transfers between Levels 1 and 2, is included at the end of the Fund's Schedule of Investments.
Foreign Currency. The Fund may use foreign currency contracts to facilitate transactions in foreign-denominated securities. Gains and losses from these transactions may arise from changes in the value of the foreign currency or if the counterparties do not perform under the contracts' terms.
Foreign-denominated assets, including investment securities, and liabilities are translated into U.S. dollars at the exchange rates at period end. Purchases and sales of investment securities, income and dividends received and expenses denominated in foreign currencies are translated into U.S. dollars at the exchange rate in effect on the transaction date.
The effects of exchange rate fluctuations on investments are included with the net realized and unrealized gain (loss) on investment securities. Other foreign currency transactions resulting in realized and unrealized gain (loss) are disclosed separately.
Annual Report
Notes to Financial Statements - continued
(Amounts in thousands except percentages)
3. Significant Accounting Policies - continued
Investment Transactions and Income. For financial reporting purposes, the Fund's investment holdings and NAV include trades executed through the end of the last business day of the period. The NAV per share for processing shareholder transactions is calculated as of the close of business of the New York Stock Exchange (NYSE), normally 4:00 p.m. Eastern time and includes trades executed through the end of the prior business day. Gains and losses on securities sold are determined on the basis of identified cost and may include proceeds received from litigation. Dividend income is recorded on the ex-dividend date, except for certain dividends from foreign securities where the ex-dividend date may have passed, which are recorded as soon as the Fund is informed of the ex-dividend date. Non-cash dividends included in dividend income, if any, are recorded at the fair market value of the securities received. Income and capital gain distributions from Fidelity Central Funds, if any, are recorded on the ex-dividend date. Distributions received on securities that represent a return of capital or capital gain are recorded as a reduction of cost of investments and/or as a realized gain. Subsequent to ex-dividend date the Fund determines the components of these distributions, based upon receipt of tax filings or other correspondence relating to the underlying investment. Large, non-recurring dividends recognized by the Fund are presented separately on the Statement of Operations as "Special Dividends" and the impact of these dividends is presented in the Financial Highlights. Interest income is accrued as earned and includes coupon interest and amortization of premium and accretion of discount on debt securities as applicable. Investment income is recorded net of foreign taxes withheld where recovery of such taxes is uncertain.
Class Allocations and Expenses. Investment income, realized and unrealized capital gains and losses, common expenses of the Fund, and certain fund-level expense reductions, if any, are allocated daily on a pro-rata basis to each class based on the relative net assets of each class to the total net assets of the Fund. Each class differs with respect to transfer agent and distribution and service plan fees incurred. Certain expense reductions may also differ by class. For the reporting period, the allocated portion of income and expenses to each class as a percent of its average net assets may vary due to the timing of recording these transactions in relation to fluctuating net assets of the classes. Expenses directly attributable to a fund are charged to that fund. Expenses attributable to more than one fund are allocated among the respective funds on the basis of relative net assets or other appropriate methods. Expense estimates are accrued in the period to which they relate and adjustments are made when actual amounts are known.
Deferred Trustee Compensation. Under a Deferred Compensation Plan (the Plan), independent Trustees may elect to defer receipt of a portion of their annual compensation. Deferred amounts are invested in a cross-section of Fidelity funds, are marked-to-market and remain in the Fund until distributed in accordance with the Plan. The
Annual Report
3. Significant Accounting Policies - continued
Deferred Trustee Compensation - continued
investment of deferred amounts and the offsetting payable to the Trustees are included in the accompanying Statement of Assets and Liabilities.
Income Tax Information and Distributions to Shareholders. Each year, the Fund intends to qualify as a regulated investment company under Subchapter M of the Internal Revenue Code, including distributing substantially all of its taxable income and realized gains. As a result, no provision for U.S. Federal income taxes is required. As of October 31, 2014, the Fund did not have any unrecognized tax benefits in the financial statements; nor is the Fund aware of any tax positions for which it is reasonably possible that the total amounts of unrecognized tax benefits will significantly change in the next twelve months. The Fund files a U.S. federal tax return, in addition to state and local tax returns as required. The Fund's federal income tax returns are subject to examination by the Internal Revenue Service (IRS) for a period of three fiscal years after they are filed. State and local tax returns may be subject to examination for an additional fiscal year depending on the jurisdiction. Foreign taxes are provided for based on the Fund's understanding of the tax rules and rates that exist in the foreign markets in which it invests. The Fund is subject to a tax imposed on capital gains by certain countries in which it invests. An estimated deferred tax liability for net unrealized appreciation on the applicable securities is included in Other payables and accrued expenses on the Statement of Assets & Liabilities.
Distributions are declared and recorded on the ex-dividend date. Income dividends and capital gain distributions are declared separately for each class. Income and capital gain distributions are determined in accordance with income tax regulations, which may differ from GAAP.
Capital accounts within the financial statements are adjusted for permanent book-tax differences. These adjustments have no impact on net assets or the results of operations. Capital accounts are not adjusted for temporary book-tax differences which will reverse in a subsequent period.
Book-tax differences are primarily due to foreign currency transactions, passive foreign investment companies (PFIC), deferred trustees compensation, futures transactions, partnerships, capital loss carryforwards, and losses deferred due to wash sales.
The federal tax cost of investment securities and unrealized appreciation (depreciation) as of period end were as follows:
Gross unrealized appreciation | $ 401,047 |
Gross unrealized depreciation | (78,289) |
Net unrealized appreciation (depreciation) on securities | $ 322,758 |
Tax Cost | $ 1,604,526 |
Annual Report
Notes to Financial Statements - continued
(Amounts in thousands except percentages)
3. Significant Accounting Policies - continued
Income Tax Information and Distributions to Shareholders - continued
The tax-based components of distributable earnings as of period end were as follows:
Undistributed ordinary income | $ 18,554 |
Capital loss carryforward | $ (2,645,401) |
Net unrealized appreciation (depreciation) on securities and other investments | $ 322,566 |
Capital loss carryforwards are only available to offset future capital gains of the Fund to the extent provided by regulations and may be limited. Under the Regulated Investment Company Modernization Act of 2010 (the Act), the Fund is permitted to carry forward capital losses incurred in taxable years beginning after December 22, 2010 for an unlimited period and such capital losses are required to be used prior to any losses that expire. The capital loss carryforward information presented below, including any applicable limitation, is estimated as of fiscal period end and is subject to adjustment.
Fiscal year of expiration | |
2017 | $ (2,645,401) |
The tax character of distributions paid was as follows:
| October 31, 2014 | October 31, 2013 |
Ordinary Income | $ 34,939 | $ 30,937 |
Short-Term Trading (Redemption) Fees. Shares held by investors in the Fund less than 30 days may have been subject to a redemption fee equal to 1.00% of the NAV of shares redeemed. All redemption fees, which reduce the proceeds of the shareholder redemption, are retained by the Fund and accounted for as an addition to paid in capital.
Restricted Securities. The Fund may invest in securities that are subject to legal or contractual restrictions on resale. These securities generally may be resold in transactions exempt from registration or to the public if the securities are registered. Disposal of these securities may involve time-consuming negotiations and expense, and prompt sale at an acceptable price may be difficult. Information regarding restricted securities is included at the end of the Fund's Schedule of Investments.
New Accounting Pronouncement. In June 2014, the Financial Accounting Standards Board issued Accounting Standard Update No. 2014-11, Repurchase-to-Maturity Transactions, Repurchase Financings, and Disclosures. The Update amends the accounting for certain repurchase agreements and expands disclosure requirements for reverse repurchase agreements, securities lending and other similar transactions. The disclosure requirements are effective for annual and interim reporting periods beginning after December 15, 2014. Management is currently evaluating the impact of the Update on the Fund's financial statements and related disclosures.
Annual Report
4. Derivative Instruments.
Risk Exposures and the Use of Derivative Instruments. The Fund's investment objective allows the Fund to enter into various types of derivative contracts, including futures contracts. Derivatives are investments whose value is primarily derived from underlying assets, indices or reference rates and may be transacted on an exchange or over-the-counter (OTC). Derivatives may involve a future commitment to buy or sell a specified asset based on specified terms, to exchange future cash flows at periodic intervals based on a notional principal amount, or for one party to make one or more payments upon the occurrence of specified events in exchange for periodic payments from the other party.
The Fund used derivatives to increase returns and to manage exposure to certain risks as defined below. The success of any strategy involving derivatives depends on analysis of numerous economic factors, and if the strategies for investment do not work as intended, the Fund may not achieve its objectives.
The Fund's use of derivatives increased or decreased its exposure to the following risk:
Equity Risk | Equity risk relates to the fluctuations in the value of financial instruments as a result of changes in market prices (other than those arising from interest rate risk or foreign exchange risk), whether caused by factors specific to an individual investment, its issuer, or all factors affecting all instruments traded in a market or market segment. |
The Fund is also exposed to additional risks from investing in derivatives, such as liquidity risk and counterparty credit risk. Liquidity risk is the risk that the Fund will be unable to close out the derivative in the open market in a timely manner. Counterparty credit risk is the risk that the counterparty will not be able to fulfill its obligation to the Fund. Counterparty credit risk related to exchange-traded futures contracts may be mitigated by the protection provided by the exchange on which they trade.
Investing in derivatives may involve greater risks than investing in the underlying assets directly and, to varying degrees, may involve risk of loss in excess of any initial investment and collateral received and amounts recognized in the Statement of Assets and Liabilities. In addition, there may be the risk that the change in value of the derivative contract does not correspond to the change in value of the underlying instrument.
Futures Contracts. A futures contract is an agreement between two parties to buy or sell a specified underlying instrument for a fixed price at a specified future date. The Fund used futures contracts to manage its exposure to the stock market.
Upon entering into a futures contract, a fund is required to deposit either cash or securities (initial margin) with a clearing broker in an amount equal to a certain percentage of the face value of the contract. Futures contracts are marked-to-market daily and subsequent daily payments (variation margin) are made or received by a fund depending on
Annual Report
Notes to Financial Statements - continued
(Amounts in thousands except percentages)
4. Derivative Instruments - continued
Futures Contracts - continued
the daily fluctuations in the value of the futures contracts and are recorded as unrealized appreciation or (depreciation). This receivable and/or payable, if any, is included in daily variation margin for derivative instruments in the Statement of Assets and Liabilities. Realized gain or (loss) is recorded upon the expiration or closing of a futures contract.
Any open futures contracts at period end are presented in the Schedule of Investments under the caption "Futures Contracts." The underlying face amount at value reflects each contract's exposure to the underlying instrument or index at period end. Securities deposited to meet initial margin requirements are identified in the Schedule of Investments
During the period the Fund recognized net realized gain (loss) of $550 and a change in net unrealized appreciation (depreciation) of $(491) related to its investment in futures contracts. This amount is included in the Statement of Operations.
5. Purchases and Sales of Investments.
Purchases and sales of securities, other than short-term securities, aggregated $792,312 and $925,506, respectively.
6. Fees and Other Transactions with Affiliates.
Management Fee. Fidelity Management & Research Company (the investment adviser) and its affiliates provide the Fund with investment management related services for which the Fund pays a monthly management fee. The management fee is the sum of an individual fund fee rate that is based on an annual rate of .424% of the Fund's average net assets and an annualized group fee rate that averaged .25% during the period. Prior to August 1, 2014 the individual fund fee rate was .45%. The group fee rate is based upon the average net assets of all the mutual funds advised by the investment adviser, including any mutual funds previously advised by the investment adviser that are currently advised by Fidelity SelectCo, LLC, an affiliate of the investment adviser. The group fee rate decreases as assets under management increase and increases as assets under management decrease. For the reporting period, the total annual management fee rate was .69% of the Fund's average net assets.
Distribution and Service Plan Fees. In accordance with Rule 12b-1 of the 1940 Act, the Fund has adopted separate Distribution and Service Plans for each class of shares. Certain classes pay Fidelity Distributors Corporation (FDC), an affiliate of the investment adviser, separate Distribution and Service Fees, each of which is based on an annual percentage of each class' average net assets. In addition, FDC may pay financial intermediaries for selling shares of the Fund and providing shareholder support services.
Annual Report
6. Fees and Other Transactions with Affiliates - continued
Distribution and Service Plan Fees - continued
For the period, the Distribution and Service Fee rates, total fees and amounts retained by FDC were as follows:
| Distribution
Fee | Service
Fee | Total Fees | Retained
by FDC |
Class A | -% | .25% | $ 1,866 | $ 12 |
Class T | .25% | .25% | 1,545 | 1 |
Class B | .75% | .25% | 273 | 206 |
Class C | .75% | .25% | 2,592 | 104 |
| | | $ 6,276 | $ 323 |
Sales Load. FDC may receive a front-end sales charge of up to 5.75% for selling Class A shares and 3.50% for selling Class T shares, some of which is paid to financial intermediaries for selling shares of the Fund. Depending on the holding period, FDC may receive contingent deferred sales charges levied on Class A, Class T, Class B, and Class C redemptions. The deferred sales charges range from 5.00% to 1.00% for Class B shares, 1.00% for Class C shares, 1.00% for certain purchases of Class A shares and .25% for certain purchases of Class T shares.
For the period, sales charge amounts retained by FDC were as follows:
| Retained
by FDC |
Class A | $ 92 |
Class T | 24 |
Class B* | 14 |
Class C* | 5 |
| $ 135 |
* When Class B and Class C shares are initially sold, FDC pays commissions from its own resources to financial intermediaries through which the sales are made.
Transfer Agent Fees. Fidelity Investments Institutional Operations Company, Inc., (FIIOC), an affiliate of the investment adviser FMR, is the transfer, dividend disbursing and shareholder servicing agent for each class of the Fund. FIIOC receives account fees and asset-based fees that vary according to the account size and type of account of the shareholders of the respective classes of the Fund, except for Class Z. FIIOC receives an asset-based fee of Class Z's average net assets. FIIOC pays for typesetting, printing and mailing of shareholder reports, except proxy statements.
Annual Report
Notes to Financial Statements - continued
(Amounts in thousands except percentages)
6. Fees and Other Transactions with Affiliates - continued
Transfer Agent Fees - continued
For the period, transfer agent fees for each class were as follows:
| Amount | % of
Class-Level Average
Net Assets |
Class A | $ 1,823 | .24 |
Class T | 758 | .25 |
Class B | 83 | .30 |
Class C | 613 | .24 |
Institutional Class | 1,357 | .21 |
Class Z | 4 | .05 |
| $ 4,638 | |
Accounting and Security Lending Fees. Fidelity Service Company, Inc. (FSC), an affiliate of the investment adviser, maintains the Fund's accounting records. The accounting fee is based on the level of average net assets for each month. Under a separate contract, FSC administers the security lending program. The security lending fee is based on the number and duration of lending transactions.
Brokerage Commissions. The Fund placed a portion of its portfolio transactions with brokerage firms which are affiliates of the investment adviser. Brokerage commissions are included in net realized gain (loss) and change in net unrealized appreciation (depreciation) in the Statement of Operations. The commissions paid to these affiliated firms were $3 for the period.
7. Committed Line of Credit.
The Fund participates with other funds managed by the investment adviser or an affiliate in a $4.25 billion credit facility (the "line of credit") to be utilized for temporary or emergency purposes to fund shareholder redemptions or for other short-term liquidity purposes. The Fund has agreed to pay commitment fees on its pro-rata portion of the line of credit, which amounted to $3 and is reflected in Miscellaneous expenses on the Statement of Operations. During the period, the Fund did not borrow on this line of credit.
8. Security Lending.
The Fund lends portfolio securities through a lending agent from time to time in order to earn additional income. For equity securities, a lending agent is used and may loan securities to certain qualified borrowers, including Fidelity Capital Markets (FCM), a
Annual Report
8. Security Lending - continued
broker-dealer affiliated with the Fund. On the settlement date of the loan, the Fund receives collateral (in the form of U.S. Treasury obligations, letters of credit and/or cash) against the loaned securities and maintains collateral in an amount not less than 100% of the market value of the loaned securities during the period of the loan. The market value of the loaned securities is determined at the close of business of the Fund and any additional required collateral is delivered to the Fund on the next business day. If the borrower defaults on its obligation to return the securities loaned because of insolvency or other reasons, the Fund may apply collateral received from the borrower against the obligation. The Fund may experience delays and costs in recovering the securities loaned. Any cash collateral received is invested in the Fidelity Securities Lending Cash Central Fund. The value of loaned securities and cash collateral at period end are disclosed on the Fund's Statement of Assets and Liabilities. At period end, there were no security loans outstanding with FCM. Security lending income represents the income earned on investing cash collateral, less rebates paid to borrowers and any lending agent fees associated with the loan, plus any premium payments received for lending certain types of securities. Security lending income is presented in the Statement of Operations as a component of income from Fidelity Central Funds. Total security lending income during the period amounted to $900, including $2 from securities loaned to FCM.
9. Expense Reductions.
Commissions paid to certain brokers with whom the investment adviser, or its affiliates, places trades on behalf of the Fund include an amount in addition to trade execution, which may be rebated back to the Fund to offset certain expenses. This amount totaled $27 for the period.
10. Distributions to Shareholders.
Distributions to shareholders of each class were as follows:
Years ended October 31, | 2014 | 2013 |
From net investment income | | |
Class A | $ 6,853 | $ 9,993 |
Class T | 2,251 | 3,119 |
Class B | - | 218 |
Class C | 979 | 1,491 |
Institutional Class | 7,291 | 8,774 |
Class Z | 1 | - |
Total | $ 17,375 | $ 23,595 |
Annual Report
Notes to Financial Statements - continued
(Amounts in thousands except percentages)
10. Distributions to Shareholders - continued
Years ended October 31, | 2014 | 2013 |
From net realized gain | | |
Class A | $ 6,584 | $ 2,917 |
Class T | 2,789 | 1,167 |
Class B | 307 | 229 |
Class C | 2,390 | 978 |
Institutional Class | 5,493 | 2,051 |
Class Z | 1 | - |
Total | $ 17,564 | $ 7,342 |
11. Share Transactions.
Share transactions for each class were as follows and may contain automatic conversions between classes or exchanges between funds:
| Shares | Shares | Dollars | Dollars |
Years ended October 31, | 2014 | 2013 A | 2014 | 2013 A |
Class A | | | | |
Shares sold | 4,795 | 5,624 | $ 94,751 | $ 97,285 |
Reinvestment of distributions | 646 | 758 | 12,430 | 12,002 |
Shares redeemed | (8,821) | (16,315) | (174,243) | (276,915) |
Net increase (decrease) | (3,380) | (9,933) | $ (67,062) | $ (167,628) |
Class T | | | | |
Shares sold | 1,185 | 1,308 | $ 23,252 | $ 22,307 |
Reinvestment of distributions | 249 | 255 | 4,764 | 4,007 |
Shares redeemed | (3,330) | (4,655) | (65,214) | (78,662) |
Net increase (decrease) | (1,896) | (3,092) | $ (37,198) | $ (52,348) |
Class B | | | | |
Shares sold | 29 | 17 | $ 537 | $ 283 |
Reinvestment of distributions | 15 | 26 | 278 | 396 |
Shares redeemed | (933) | (2,107) | (17,767) | (34,470) |
Net increase (decrease) | (889) | (2,064) | $ (16,952) | $ (33,791) |
Class C | | | | |
Shares sold | 874 | 787 | $ 16,572 | $ 13,034 |
Reinvestment of distributions | 149 | 129 | 2,754 | 1,968 |
Shares redeemed | (2,144) | (3,176) | (40,544) | (51,899) |
Net increase (decrease) | (1,121) | (2,260) | $ (21,218) | $ (36,897) |
Annual Report
11. Share Transactions - continued
| Shares | Shares | Dollars | Dollars |
Years ended October 31, | 2014 | 2013 A | 2014 | 2013 A |
Institutional Class | | | | |
Shares sold | 7,676 | 4,395 | $ 154,759 | $ 77,113 |
Reinvestment of distributions | 582 | 586 | 11,367 | 9,415 |
Shares redeemed | (7,810) | (7,233) | (158,739) | (126,327) |
Net increase (decrease) | 448 | (2,252) | $ 7,387 | $ (39,799) |
Class Z | | | | |
Shares sold | 1,246 | 5 | $ 26,144 | $ 100 |
Reinvestment of distributions | - | - | 2 | - |
Shares redeemed | (44) | - | (873) | - |
Net increase (decrease) | 1,202 | 5 | $ 25,273 | $ 100 |
A Share transactions for Class Z are for the period August 13, 2013 (commencement of sale of shares) to October 31, 2013.
12. Other.
The Fund's organizational documents provide former and current trustees and officers with a limited indemnification against liabilities arising in connection with the performance of their duties to the Fund. In the normal course of business, the Fund may also enter into contracts that provide general indemnifications. The Fund's maximum exposure under these arrangements is unknown as this would be dependent on future claims that may be made against the Fund. The risk of material loss from such claims is considered remote.
Annual Report
To the Trustees of Fidelity Advisor Series VIII and the Shareholders of
Fidelity Advisor Diversified International Fund:
In our opinion, the accompanying statement of assets and liabilities, including the schedule of investments, and the related statements of operations and of changes in net assets and the financial highlights present fairly, in all material respects, the financial position of Fidelity Advisor Diversified International Fund (a fund of Fidelity Advisor Series VIII) at October 31, 2014, the results of its operations for the year then ended, the changes in its net assets for each of the two years in the period then ended and the financial highlights for each of the periods indicated, in conformity with accounting principles generally accepted in the United States of America. These financial statements and financial highlights (hereafter referred to as "financial statements") are the responsibility of the Fidelity Advisor Diversified International Fund's management. Our responsibility is to express an opinion on these financial statements based on our audits. We conducted our audits of these financial statements in accordance with the standards of the Public Company Accounting Oversight Board (United States). Those standards require that we plan and perform the audit to obtain reasonable assurance about whether the financial statements are free of material misstatement. An audit includes examining, on a test basis, evidence supporting the amounts and disclosures in the financial statements, assessing the accounting principles used and significant estimates made by management, and evaluating the overall financial statement presentation. We believe that our audits, which included confirmation of securities at October 31, 2014 by correspondence with the custodian and brokers, provide a reasonable basis for our opinion.
PricewaterhouseCoopers LLP
Boston, Massachusetts
December 17, 2014
Annual Report
The Trustees, Member of the Advisory Board, and officers of the trust and fund, as applicable, are listed below. The Board of Trustees governs the fund and is responsible for protecting the interests of shareholders. The Trustees are experienced executives who meet periodically throughout the year to oversee the fund's activities, review contractual arrangements with companies that provide services to the fund, oversee management of the risks associated with such activities and contractual arrangements, and review the fund's performance. Except for James C. Curvey, each of the Trustees oversees 174 funds. Mr. Curvey oversees 407 funds.
The Trustees hold office without limit in time except that (a) any Trustee may resign; (b) any Trustee may be removed by written instrument, signed by at least two-thirds of the number of Trustees prior to such removal; (c) any Trustee who requests to be retired or who has become incapacitated by illness or injury may be retired by written instrument signed by a majority of the other Trustees; and (d) any Trustee may be removed at any special meeting of shareholders by a two-thirds vote of the outstanding voting securities of the trust. Each Trustee who is not an interested person (as defined in the 1940 Act) of the trust and the fund (Independent Trustee), shall retire not later than the last day of the calendar year in which his or her 75th birthday occurs. The Independent Trustees may waive this mandatory retirement age policy with respect to individual Trustees. The officers and Advisory Board Member hold office without limit in time, except that any officer and Advisory Board Member may resign or may be removed by a vote of a majority of the Trustees at any regular meeting or any special meeting of the Trustees. Except as indicated, each individual has held the office shown or other offices in the same company for the past five years.
Experience, Skills, Attributes, and Qualifications of the Fund's Trustees. The Governance and Nominating Committee has adopted a statement of policy that describes the experience, qualifications, attributes, and skills that are necessary and desirable for potential Independent Trustee candidates (Statement of Policy). The Board believes that each Trustee satisfied at the time he or she was initially elected or appointed a Trustee, and continues to satisfy, the standards contemplated by the Statement of Policy. The Governance and Nominating Committee also engages professional search firms to help identify potential Independent Trustee candidates who have the experience, qualifications, attributes, and skills consistent with the Statement of Policy. From time to time, additional criteria based on the composition and skills of the current Independent Trustees, as well as experience or skills that may be appropriate in light of future changes to board composition, business conditions, and regulatory or other developments, have also been considered by the professional search firms and the Governance and Nominating Committee. In addition, the Board takes into account the Trustees' commitment and participation in Board and committee meetings, as well as their leadership of standing and ad hoc committees throughout their tenure.
In determining that a particular Trustee was and continues to be qualified to serve as a Trustee, the Board has considered a variety of criteria, none of which, in isolation, was controlling. The Board believes that, collectively, the Trustees have balanced and diverse experience, qualifications, attributes, and skills, which allow the Board to operate effectively in governing the fund and protecting the interests of shareholders. Information about the specific experience, skills, attributes, and qualifications of each Trustee, which in each case led to the Board's conclusion that the Trustee should serve (or continue to serve) as a trustee of the fund, is provided below.
Annual Report
Trustees and Officers - continued
Board Structure and Oversight Function. James C. Curvey is an interested person (as defined in the 1940 Act) and currently serves as Chairman. The Trustees have determined that an interested Chairman is appropriate and benefits shareholders because an interested Chairman has a personal and professional stake in the quality and continuity of services provided to the fund. Independent Trustees exercise their informed business judgment to appoint an individual of their choosing to serve as Chairman, regardless of whether the Trustee happens to be independent or a member of management. The Independent Trustees have determined that they can act independently and effectively without having an Independent Trustee serve as Chairman and that a key structural component for assuring that they are in a position to do so is for the Independent Trustees to constitute a substantial majority for the Board. The Independent Trustees also regularly meet in executive session. Ned C. Lautenbach serves as Chairman of the Independent Trustees and as such (i) acts as a liaison between the Independent Trustees and management with respect to matters important to the Independent Trustees and (ii) with management prepares agendas for Board meetings.
Fidelity funds are overseen by different Boards of Trustees. The fund's Board oversees Fidelity's equity and high income funds and another Board oversees Fidelity's investment-grade bond, money market, and asset allocation funds. The asset allocation funds may invest in Fidelity funds overseen by the fund's Board. The use of separate Boards, each with its own committee structure, allows the Trustees of each group of Fidelity funds to focus on the unique issues of the funds they oversee, including common research, investment, and operational issues. On occasion, the separate Boards establish joint committees to address issues of overlapping consequences for the Fidelity funds overseen by each Board.
The Trustees operate using a system of committees to facilitate the timely and efficient consideration of all matters of importance to the Trustees, the fund, and fund shareholders and to facilitate compliance with legal and regulatory requirements and oversight of the fund's activities and associated risks. The Board, acting through its committees, has charged FMR and its affiliates with (i) identifying events or circumstances the occurrence of which could have demonstrably adverse effects on the fund's business and/or reputation; (ii) implementing processes and controls to lessen the possibility that such events or circumstances occur or to mitigate the effects of such events or circumstances if they do occur; and (iii) creating and maintaining a system designed to evaluate continuously business and market conditions in order to facilitate the identification and implementation processes described in (i) and (ii) above. Because the day-to-day operations and activities of the fund are carried out by or through FMR, its affiliates and other service providers, the fund's exposure to risks is mitigated but not eliminated by the processes overseen by the Trustees. While each of the Board's committees has responsibility for overseeing different aspects of the fund's activities, oversight is exercised primarily through the Operations, Audit, and Compliance Committees. In addition, the Independent Trustees have worked with FMR to enhance the Board's oversight of investment and financial risks, legal and regulatory risks, technology risks, and operational risks, including the development of additional risk reporting to the Board. For example, a working group comprised of Independent Trustees and FMR has worked and continues to work to review the Fidelity funds' valuation-related activities, reporting and risk management. Appropriate personnel, including but not limited to the fund's Chief Compliance Officer (CCO), FMR's internal auditor, the independent accountants, the fund's Treasurer and portfolio management personnel, make periodic reports to the Board's committees, as appropriate, including an annual review of FMR's risk management program for the Fidelity funds. The responsibilities of each standing committee, including their oversight responsibilities, are described further under "Standing Committees of the Fund's Trustees."
Annual Report
The fund's Statement of Additional Information (SAI) includes more information about the Trustees. To request a free copy, call Fidelity at 1-877-208-0098.
Interested Trustees*:
Correspondence intended for each Trustee who is an interested person may be sent to Fidelity Investments, 245 Summer Street, Boston, Massachusetts 02210.
Name, Year of Birth; Principal Occupations and Other Relevant Experience+ |
James C. Curvey (1935) |
Year of Election or Appointment: 2007 Trustee Chairman of the Board of Trustees |
| Mr. Curvey also serves as Trustee of other Fidelity funds. Mr. Curvey is a Director of Fidelity Research & Analysis Co. (2009-present), and Vice Chairman (2007-present) and Director of FMR LLC. In addition, Mr. Curvey serves as an Overseer for the Boston Symphony Orchestra and a member of the board of Artis-Naples, Naples, Florida, and as a Trustee for Brewster Academy, Wolfeboro, New Hampshire. Previously, Mr. Curvey served as a Director of Fidelity Investments Money Management, Inc. (2009-2014), a Director of FMR (2007-2014), and a Director of FMR Co., Inc. (2007-2014). |
Charles S. Morrison (1960) |
Year of Election or Appointment: 2014 Trustee |
| Mr. Morrison also serves as Trustee of other funds. He serves as a Director of Fidelity Investments Money Management, Inc. (FIMM) (2014-present), Director of Fidelity SelectCo, LLC (2014-present), President, Asset Management (2014-present), and is an employee of Fidelity Investments. Previously, Mr. Morrison served as Vice President of Fidelity's Fixed Income and Asset Allocation Funds (2012-2014), President, Fixed Income (2011-2014), Vice President of Fidelity's Money Market Funds (2005-2009), President, Money Market Group Leader of FMR (2009), and Senior Vice President, Money Market Group of FMR (2004-2009). Mr. Morrison also served as Vice President of Fidelity's Bond Funds (2002-2005), certain Balanced Funds (2002-2005), and certain Asset Allocation Funds (2002-2007), and as Senior Vice President (2002-2005) of Fidelity's Bond Division. |
* Trustees have been determined to be "Interested Trustees" by virtue of, among other things, their affiliation with the trust or various entities under common control with FMR.
+ The information above includes each Trustee's principal occupation during the last five years and other information relating to the experience, attributes, and skills relevant to each Trustee's qualifications to serve as a Trustee, which led to the conclusion that each Trustee should serve as a Trustee for the fund.
Annual Report
Independent Trustees:
Correspondence intended for each Independent Trustee (that is, the Trustees other than the Interested Trustees) may be sent to Fidelity Investments, P.O. Box 55235, Boston, Massachusetts 02205-5235.
Name, Year of Birth; Principal Occupations and Other Relevant Experience+ |
Dennis J. Dirks (1948) |
Year of Election or Appointment: 2005 Trustee |
| Mr. Dirks also serves as Trustee of other Fidelity funds. Prior to his retirement in May 2003, Mr. Dirks was Chief Operating Officer and a member of the Board of The Depository Trust & Clearing Corporation (DTCC). He also served as President, Chief Operating Officer, and Board member of The Depository Trust Company (DTC) and President and Board member of the National Securities Clearing Corporation (NSCC). In addition, Mr. Dirks served as Chief Executive Officer and Board member of the Government Securities Clearing Corporation, Chief Executive Officer and Board member of the Mortgage-Backed Securities Clearing Corporation, as a Trustee and a member of the Finance Committee of Manhattan College (2005-2008), and as a Trustee and a member of the Finance Committee of AHRC of Nassau County (2006-2008). Mr. Dirks is a member of the Independent Directors Council (IDC) Governing Council (2010-present) and Board of Directors for The Brookville Center for Children's Services, Inc. (2009-present). |
Alan J. Lacy (1953) |
Year of Election or Appointment: 2008 Trustee |
| Mr. Lacy also serves as Trustee of other Fidelity funds. Mr. Lacy serves as Senior Adviser (2007-present) of Oak Hill Capital Partners, L.P. (private equity). Mr. Lacy also served as Chief Executive Officer (2000-2005) and Vice Chairman (2005-2006) of Sears Holdings Corporation and Sears, Roebuck and Co. (retail). In addition, Mr. Lacy serves as a member of the Board of Directors of Dave & Buster's Entertainment, Inc. (restaurant and entertainment complexes, 2010-present), Earth Fare, Inc. (retail grocery, 2012-present), The Hillman Companies, Inc. (hardware wholesalers, 2010-present), and Bristol-Myers Squibb Company (global pharmaceuticals, 2008-present). Mr. Lacy is a member of the Board of Trustees of The National Parks Conservation Association (2006-present). Previously, Mr. Lacy served as Chairman of the Board of Trustees of the National Parks Conservation Association (2008-2011) and as a member of the Board of Directors for the Western Union Company (global money transfer, 2006-2011). |
Ned C. Lautenbach (1944) |
Year of Election or Appointment: 2000 Trustee Chairman of the Independent Trustees |
| Mr. Lautenbach also serves as Trustee of other Fidelity funds. Mr. Lautenbach currently serves as the Lead Director of the Eaton Corporation Board of Directors (diversified industrial, 1997-present). Mr. Lautenbach is Chairman of the Board of Directors of the Philharmonic Center for the Arts in Naples, Florida (2012-present) and a member of the Council on Foreign Relations (1994-present). Previously, Mr. Lautenbach was a Partner/Advisory Partner at Clayton, Dubilier & Rice, LLC (private equity investment, 1998-2010), as well as a Director of Sony Corporation (2006-2007). |
Joseph Mauriello (1944) |
Year of Election or Appointment: 2008 Trustee |
| Mr. Mauriello also serves as Trustee of other Fidelity funds. Prior to his retirement in January 2006, Mr. Mauriello served in numerous senior management positions including Deputy Chairman and Chief Operating Officer (2004-2005), and Vice Chairman of Financial Services (2002-2004) of KPMG LLP US (professional services, 1965-2005). Mr. Mauriello currently serves as a member of the Board of Directors of XL Group plc. (global insurance and re-insurance, 2006-present). Previously, Mr. Mauriello served as a Director of the Hamilton Funds of the Bank of New York (2006-2007) and of Arcadia Resources Inc. (health care services and products, 2007-2012). |
Robert W. Selander (1950) |
Year of Election or Appointment: 2011 Trustee |
| Mr. Selander also serves as Trustee of other Fidelity funds. Previously, Mr. Selander served as a Member of the Advisory Board of other Fidelity funds (2011), and Executive Vice Chairman (2010), Chief Executive Officer (2009-2010), and President and Chief Executive Officer (1997-2009) of Mastercard, Inc. |
Cornelia M. Small (1944) |
Year of Election or Appointment: 2005 Trustee |
| Ms. Small also serves as Trustee of other Fidelity funds. Ms. Small is a member of the Board of Directors (2009-present) and Chair of the Investment Committee (2010-present) of the Teagle Foundation. Ms. Small also serves on the Investment Committee of the Berkshire Taconic Community Foundation (2008-present). Previously, Ms. Small served as Chairperson (2002-2008) and a member of the Investment Committee and Chairperson (2008-2012) and a member of the Board of Trustees of Smith College. In addition, Ms. Small served as Chief Investment Officer, Director of Global Equity Investments, and a member of the Board of Directors of Scudder, Stevens & Clark and Scudder Kemper Investments. |
William S. Stavropoulos (1939) |
Year of Election or Appointment: 2001 Trustee Vice Chairman of the Independent Trustees |
| Mr. Stavropoulos also serves as Trustee of other Fidelity funds. Mr. Stavropoulos serves as President and Founder of the Michigan Baseball Foundation, the Great Lakes Loons (2007-present). Mr. Stavropoulos is Chairman Emeritus of the Board of Directors of The Dow Chemical Company, where he previously served in numerous senior management positions, including President, CEO (1995-2000; 2002-2004), Chairman of the Executive Committee (2000-2006), and as a member of the Board of Directors (1990-2006). Currently, Mr. Stavropoulos is Chairman of the Board of Directors of Univar Inc. (global distributor of commodity and specialty chemicals), a Director of Teradata Corporation (data warehousing and technology solutions), and Maersk Inc. (industrial conglomerate), and a member of the Advisory Board for Metalmark Capital LLC (private equity investment, 2005-present). Mr. Stavropoulos is an operating advisor to Clayton, Dubilier & Rice, LLC (private equity investment). In addition, Mr. Stavropoulos is a member of the University of Notre Dame Advisory Council for the College of Science, a Trustee of the Rollin L. Gerstacker Foundation, and a Director of the Naples Philharmonic Center for the Arts. Previously, Mr. Stavropoulos served as a Director of Chemical Financial Corporation (bank holding company, 1993-2012) and Tyco International, Ltd. (multinational manufacturing and services, 2007-2012). |
David M. Thomas (1949) |
Year of Election or Appointment: 2008 Trustee |
| Mr. Thomas also serves as Trustee of other Fidelity funds. Mr. Thomas serves as Non-Executive Chairman of the Board of Directors of Fortune Brands Home and Security (home and security products, 2011-present), and as a member of the Board of Directors of Interpublic Group of Companies, Inc. (marketing communication, 2004-present). Previously, Mr. Thomas served as Executive Chairman (2005-2006) and Chairman and Chief Executive Officer (2000-2005) of IMS Health, Inc. (pharmaceutical and healthcare information solutions), and a Director of Fortune Brands, Inc. (consumer products, 2000-2011). |
+ The information above includes each Trustee's principal occupation during the last five years and other information relating to the experience, attributes, and skills relevant to each Trustee's qualifications to serve as a Trustee, which led to the conclusion that each Trustee should serve as a Trustee for the fund.
Advisory Board Member and Officers:
Correspondence intended for each officer and Peter S. Lynch may be sent to Fidelity Investments, 245 Summer Street, Boston, Massachusetts 02210. Officers appear below in alphabetical order.
Name, Year of Birth; Principal Occupation |
Peter S. Lynch (1944) |
Year of Election or Appointment: 2003 Member of the Advisory Board |
| Mr. Lynch also serves as Member of the Advisory Board of other Fidelity funds. Mr. Lynch is Vice Chairman and a Director of FMR and FMR Co., Inc. In addition, Mr. Lynch serves as a Trustee of Boston College and as the Chairman of the Inner-City Scholarship Fund. Previously, Mr. Lynch served on the Special Olympics International Board of Directors (1997-2006). |
Elizabeth Paige Baumann (1968) |
Year of Election or Appointment: 2012 Anti-Money Laundering (AML) Officer |
| Ms. Baumann also serves as AML Officer of other funds. She is Chief AML Officer of FMR LLC (2012-present) and is an employee of Fidelity Investments. Previously, Ms. Baumann served as Vice President and Deputy Anti-Money Laundering Officer (2007-2012). |
William C. Coffey (1969) |
Year of Election or Appointment: 2009 Assistant Secretary |
| Mr. Coffey also serves as Assistant Secretary of other funds. He is Senior Vice President and Deputy General Counsel of FMR LLC (2010-present), and is an employee of Fidelity Investments. Previously, Mr. Coffey served as Vice President and Associate General Counsel of FMR LLC (2005-2009). |
Timothy M. Cohen (1969) |
Year of Election or Appointment: 2014 Vice President of certain Equity Funds |
| Mr. Cohen also serves as Vice President of other funds. Mr. Cohen serves as a Director and Chief Compliance Officer of Fidelity Management & Research (U.K.) Inc. (2013-present) and is an employee of Fidelity Investments. |
Jonathan Davis (1968) |
Year of Election or Appointment: 2010 Assistant Treasurer |
| Mr. Davis also serves as Assistant Treasurer of other funds. Mr. Davis is an employee of Fidelity Investments. Previously, Mr. Davis served as Vice President and Associate General Counsel of FMR LLC (2003-2010). |
Adrien E. Deberghes (1967) |
Year of Election or Appointment: 2008 Deputy Treasurer |
| Mr. Deberghes also serves as an officer of other funds. He is an employee of Fidelity Investments (2008-present). Prior to joining Fidelity Investments, Mr. Deberghes was Senior Vice President of Mutual Fund Administration at State Street Corporation (2007-2008), Senior Director of Mutual Fund Administration at Investors Bank & Trust (2005-2007), and Director of Finance for Dunkin' Brands (2000-2005). |
Stephanie J. Dorsey (1969) |
Year of Election or Appointment: 2010 Assistant Treasurer |
| Ms. Dorsey also serves as an officer of other funds. She is an employee of Fidelity Investments (2008-present) and has served in other fund officer roles. Prior to joining Fidelity Investments, Ms. Dorsey served as Treasurer (2004-2008) of the JPMorgan Mutual Funds and Vice President (2004-2008) of JPMorgan Chase Bank. |
Howard J. Galligan III (1966) |
Year of Election or Appointment: 2014 Chief Financial Officer |
| Mr. Galligan also serves as Chief Financial Officer of other funds. Mr. Galligan serves as President of Fidelity Pricing and Cash Management Services (FPCMS) (2014-present) and as a Director of Strategic Advisers, Inc. (2008-present). Previously, Mr. Galligan served as Chief Administrative Officer of Asset Management (2011-2014) and Chief Operating Officer and Senior Vice President of Investment Support for Strategic Advisers, Inc. (2003-2011). |
Scott C. Goebel (1968) |
Year of Election or Appointment: 2008 Secretary and Chief Legal Officer (CLO) |
| Mr. Goebel serves as Secretary and CLO of other funds. Mr. Goebel also serves as Secretary of Fidelity SelectCo, LLC (2013-present), Fidelity Investments Money Management, Inc. (FIMM) (2010-present) and Fidelity Research and Analysis Company (FRAC) (2010-present); General Counsel, Secretary, and Senior Vice President of FMR (2008-present) and FMR Co., Inc. (2008-present); Chief Legal Officer of Fidelity Management & Research (Hong Kong) Limited (2008-present); and Assistant Secretary of Fidelity Management & Research (Japan) Limited (2008-present) and Fidelity Management & Research (U.K.) Inc. (2008-present). Previously, Mr. Goebel served as Secretary and CLO of other Fidelity funds (2008-2013), Assistant Secretary of FIMM (2008-2010), FRAC (2008-2010), and certain funds (2007-2008); and as Vice President and Secretary of Fidelity Distributors Corporation (FDC) (2005-2007). Mr. Goebel has been employed by FMR LLC or an affiliate since 2001. |
Brian B. Hogan (1964) |
Year of Election or Appointment: 2009 Vice President |
| Mr. Hogan also serves as Trustee or Vice President of other funds. Mr. Hogan serves as a Director of Fidelity SelectCo, LLC (2014-present) and President of FMR's Equity Division (2009-present). Previously, Mr. Hogan served as Senior Vice President, Equity Research of FMR (2006-2009) and as a portfolio manager. |
Chris Maher (1972) |
Year of Election or Appointment: 2013 Assistant Treasurer |
| Mr. Maher serves as Assistant Treasurer of other funds. Mr. Maher is Vice President of Valuation Oversight and is an employee of Fidelity Investments. Previously, Mr. Maher served as Vice President of Asset Management Compliance (2013), Vice President of FMR's Program Management Group (2010-2013), and Vice President of Valuation Oversight (2008-2010). |
Kenneth B. Robins (1969) |
Year of Election or Appointment: 2008 President and Treasurer |
| Mr. Robins also serves as an officer of other funds. Mr. Robins serves as Executive Vice President of Fidelity Investments Money Management, Inc. (FIMM) (2013-present) and is an employee of Fidelity Investments (2004-present). Previously, Mr. Robins served in other fund officer roles. |
Stephen Sadoski (1971) |
Year of Election or Appointment: 2012 Deputy Treasurer |
| Mr. Sadoski also serves as Deputy Treasurer of other funds. He is an employee of Fidelity Investments (2012-present) and has served in another fund officer role. Prior to joining Fidelity Investments, Mr. Sadoski served as an assistant chief accountant in the Division of Investment Management of the Securities and Exchange Commission (SEC) (2009-2012) and as a senior manager at Deloitte & Touche LLP (1997-2009). |
Stacie M. Smith (1974) |
Year of Election or Appointment: 2013 Deputy Treasurer |
| Ms. Smith also serves as an officer of other funds. She is an employee of Fidelity Investments (2009-present) and has served in other fund officer roles. Prior to joining Fidelity Investments, Ms. Smith served as Senior Audit Manager of Ernst & Young LLP (1996-2009). |
Renee Stagnone (1975) |
Year of Election or Appointment: 2013 Deputy Treasurer |
| Ms. Stagnone also serves as Deputy Treasurer of other funds. Ms. Stagnone is an employee of Fidelity Investments. |
Linda J. Wondrack (1964) |
Year of Election or Appointment: 2014 Chief Compliance Officer |
| Ms. Wondrack also serves as Chief Compliance Officer of other funds. Ms. Wondrack is Executive Vice President and head of the Ethics Office and Asset Management Compliance for Fidelity Investments (2012-present). Ms. Wondrack also serves as Chief Compliance Officer of Fidelity SelectCo, LLC (2014-present); Chief Compliance Officer of Impresa Management LLC (2013-present); and Chief Compliance Officer of FMR Co., Inc., Fidelity Investments Money Management, Inc., Fidelity Management & Research (Japan) Limited, Fidelity Management & Research (U.K.) Inc., Fidelity Management & Research (Hong Kong), Fidelity Management & Research Company, Pyramis Global Advisors, LLC, and Strategic Advisers, Inc., Ballyrock Investment Advisors LLC, and Northern Neck Investors LLC (2012-present). Previously, Ms. Wondrack served as Senior Vice President and Chief Compliance Officer for Columbia Management Investment Advisers, LLC (2005-2012); Chief Compliance Officer for certain funds within the Columbia Family of Funds (2007-2012); and Senior Vice President of Compliance Risk Management at Bank of America (2005-2010). |
Joseph F. Zambello (1957) |
Year of Election or Appointment: 2011 Deputy Treasurer |
| Mr. Zambello also serves as Deputy Treasurer of other funds. Mr. Zambello is an employee of Fidelity Investments. Previously, Mr. Zambello served as Vice President of FMR's Program Management Group (2009-2011) and Vice President of the Transfer Agent Oversight Group (2005-2009). |
Annual Report
Class I designates 3% of the dividend distributed during the fiscal year as qualifying for the dividends-received deduction for corporate shareholders.
Class I designates 72% of the dividends distributed during the fiscal year as amounts which may be taken into account as a dividend for purposes of the maximum rate under section 1(h)(11) of the Internal Revenue Code.
The amounts per share which represent income derived from sources within, and taxes paid to, foreign countries or possessions of the United States are as follows:
| Pay Date | Income | Taxes |
Class I | 12/09/13 | $0.2774 | $0.0163 |
The fund will notify shareholders in January 2015 of amounts for use in preparing 2014 income tax returns.
Annual Report
Board Approval of Investment Advisory Contracts and Management Fees
Fidelity Advisor Diversified International Fund
Each year, the Board of Trustees, including the Independent Trustees (together, the Board), votes on the renewal of the management contract with Fidelity Management & Research Company (FMR) and the sub-advisory agreements (together, the Advisory Contracts) for the fund. The Board, assisted by the advice of fund counsel and Independent Trustees' counsel, requests and considers a broad range of information relevant to the renewal of the Advisory Contracts throughout the year.
The Board meets regularly and, at each of its meetings, covers an extensive agenda of topics and materials and considers factors that are relevant to its annual consideration of the renewal of the fund's Advisory Contracts, including the services and support provided to the fund and its shareholders. The Board has established various standing committees (Committees), each composed of and chaired by Independent Trustees with varying backgrounds, to which the Board has assigned specific subject matter responsibilities in order to enhance effective decision-making by the Board. The Board, acting directly and through its Committees, requests and receives information concerning the annual consideration of the renewal of the fund's Advisory Contracts. The Board also meets as needed to consider matters specifically related to the Board's annual consideration of the renewal of the Advisory Contracts. Members of the Board may also meet with trustees of other Fidelity funds through ad hoc joint committees to discuss certain matters relevant to the Fidelity funds.
At its July 2014 meeting, the Board, including the Independent Trustees, unanimously determined to renew the fund's Advisory Contracts. In reaching its determination, the Board considered all factors it believed relevant, including (i) the nature, extent, and quality of the services to be provided to the fund and its shareholders (including the investment performance of the fund); (ii) the competitiveness of the fund's management fee and total expense ratio relative to peer funds; (iii) the total costs of the services to be provided by and the profits to be realized by Fidelity from its relationship with the fund; (iv) the extent to which economies of scale exist and would be realized as the fund grows; and (v) whether fee levels reflect these economies of scale, if any, for the benefit of fund shareholders. In connection with separate internal corporate reorganizations involving Fidelity Management & Research (U.K.) Inc. (FMR U.K.) and Fidelity Management & Research (Japan) Inc. (FMR Japan), the Board approved certain non-material amendments to the fund's sub-advisory agreements with FMR U.K. and FMR Japan to reflect that, after these reorganizations, FMR Investment Management (UK) Limited and Fidelity Management & Research (Japan) Limited will carry on the business of FMR U.K. and FMR Japan, respectively. The Board noted that no changes to the portfolio managers or to the foreign research or investment advisory services provided to the fund were expected in connection with either reorganization and that the same personnel and resources would continue to be available to the fund at the new entities.
Annual Report
In considering whether to renew the Advisory Contracts for the fund, the Board reached a determination, with the assistance of fund counsel and Independent Trustees' counsel and through the exercise of its business judgment, that the renewal of the Advisory Contracts was in the best interests of the fund and its shareholders and that the compensation payable under the Advisory Contracts was fair and reasonable. The Board's decision to renew the Advisory Contracts was not based on any single factor, but rather was based on a comprehensive consideration of all the information provided to the Board at its meetings throughout the year. The Board, in reaching its determination to renew the Advisory Contracts, was aware that shareholders of the fund have a broad range of investment choices available to them, including a wide choice among funds offered by Fidelity's competitors, and that the fund's shareholders, who have the opportunity to review and weigh the disclosure provided by the fund in its prospectus and other public disclosures, have chosen to invest in this fund, which is part of the Fidelity family of funds.
Nature, Extent, and Quality of Services Provided. The Board considered Fidelity's staffing as it relates to the fund, including the backgrounds of investment personnel of FMR and the sub-advisers (together, the Investment Advisers), and also considered the fund's investment objective, strategies, and related investment philosophy. The Independent Trustees also had discussions with senior management of Fidelity's investment operations and investment groups. The Board considered the structure of the portfolio manager compensation program and whether this structure provides appropriate incentives to act in the best interests of the fund. Additionally, the Board considered the portfolio managers' investments, if any, in the funds that they manage.
Resources Dedicated to Investment Management and Support Services. The Board and the Fund Oversight and Research Committees reviewed the general qualifications and capabilities of Fidelity's investment staff, including its size, education, experience,
and resources, as well as Fidelity's approach to recruiting, training, managing, and compensating investment personnel. The Board noted that Fidelity has continued to increase the resources devoted to non-U.S. offices, including expansion of Fidelity's global investment organization. The Board also noted that Fidelity's analysts have extensive resources, tools and capabilities that allow them to conduct sophisticated quantitative and fundamental analysis, as well as credit analysis of issuers, counterparties and guarantors. Further, the Board believes that Fidelity's investment professionals have sufficient access to global information and data so as to provide competitive investment results over time, and that those professionals also have access to sophisticated tools that permit them to assess portfolio construction and risk and performance attribution characteristics continuously, as well as to transmit new information and research conclusions rapidly around the world. Additionally, in its deliberations, the Board considered Fidelity's trading and risk management capabilities and resources and global compliance infrastructure, which are an integral part of the investment management process.
Annual Report
Board Approval of Investment Advisory Contracts and
Management Fees - continued
Shareholder and Administrative Services. The Board considered (i) the nature, extent, quality, and cost of advisory, administrative, and shareholder services performed by the Investment Advisers and their affiliates under the Advisory Contracts and under separate agreements covering transfer agency, pricing and bookkeeping, and securities lending services for the fund; (ii) the nature and extent of the supervision of third party service providers, principally custodians and subcustodians; and (iii) the resources devoted to, and the record of compliance with, the fund's compliance policies and procedures. The Board also reviewed the allocation of fund brokerage, including allocations to brokers affiliated with the Investment Advisers, the use of brokerage commissions to pay fund expenses, and the use of "soft" commission dollars to pay for research services.
The Board noted that the growth of fund assets over time across the complex allows Fidelity to reinvest in the development of services designed to enhance the value or convenience of the Fidelity funds as investment vehicles. These services include 24-hour access to account information and market information through telephone representatives and over the Internet, investor education materials and asset allocation tools, and the expanded availability of Fidelity Investor Centers.
In 2014, the Board formed an ad hoc Committee on Transfer Agency Fees to review the variety of transfer agency fee structures throughout the industry and Fidelity's competitive positioning with respect to industry participants.
Investment in a Large Fund Family. The Board considered the benefits to shareholders of investing in a Fidelity fund, including the benefits of investing in a fund that is part of a large family of funds offering a variety of investment disciplines and providing a large variety of mutual fund investor services. The Board noted that Fidelity had taken, or had made recommendations that resulted in the Fidelity funds taking, a number of actions over the previous year that benefited particular funds, including (i) continuing to dedicate additional resources to investment research and to the support of the senior management team that oversees asset management; (ii) persisting in efforts to enhance Fidelity's global research capabilities; (iii) launching new funds and making other enhancements to meet client needs for income-oriented solutions; (iv) reducing fund expenses for certain index funds; (v) continuing to launch dedicated lower cost underlying funds to meet portfolio construction needs related to expanding underlying fund options for Fidelity funds of funds, specifically for the Freedom Fund product lines; (vi) rationalizing product lines and gaining increased efficiencies through fund mergers; (vii) launching sector-based exchange-traded funds and establishing a new Fidelity adviser to manage sector-based funds and products; (viii) continuing to develop and implement technology to improve security and increase efficiency; (ix) modifying the eligibility criteria for certain share classes to increase their marketability to a portion of the defined contribution plan market; (x) waiving redemption fees for certain qualified fund-of-fund and wrap programs and certain retirement plan transactions; and (xi) launching new Institutional Class shares of certain money market funds to attract and retain assets and to fill a gap in the money market fund lineup.
Annual Report
Investment Performance. The Board considered whether the fund has operated in accordance with its investment objective, as well as its record of compliance with its investment restrictions and its performance history. The Board noted that there was a portfolio management change for the fund in January 2014.
The Board took into account discussions with the Investment Advisers about fund investment performance that occur at Board meetings throughout the year. In this regard the Board noted that as part of regularly scheduled fund reviews and other reports to the Board on fund performance, the Board periodically considers annualized return information for the fund, for different time periods, measured against a securities market index ("benchmark index") and a peer group of funds with similar objectives ("peer group"). In its evaluation of fund investment performance, the Board gave particular attention to information indicating changes in performance of certain Fidelity funds for specific time periods and the Investment Advisers' explanations for any overperformance or underperformance.
In addition to reviewing absolute and relative fund performance, the Independent Trustees periodically consider the appropriateness of fund performance metrics in evaluating the results achieved. In general, the Independent Trustees believe that fund performance should be evaluated based on net performance (after fees and expenses) of both the highest performing and lowest performing classes, where applicable, compared to appropriate benchmark indices, over appropriate time periods which may include full market cycles, and compared to peer groups, as applicable, over the same periods, taking into account relevant factors including the following: general market conditions; issuer-specific information; tactical opportunities for investment; and fund cash flows and other factors.
The Independent Trustees recognize that shareholders evaluate performance on a net basis over their own holding periods, for which one-, three-, and five-year periods are often used as a proxy. For this reason, the performance information reviewed by the Board also included net cumulative calendar year total return information for the fund and an appropriate benchmark index and peer group for the most recent one-, three-, and five-year periods, as shown below. Returns are shown compared to the 25th percentile (top of box, 75% beaten) and 75th percentile (bottom of box, 25% beaten) of the peer universe. Returns of the benchmark index are "net MA," i.e., adjusted for tax withholding rates applicable to U.S.-based funds organized as Massachusetts business trusts.
Annual Report
Board Approval of Investment Advisory Contracts and
Management Fees - continued
Fidelity Advisor Diversified International Fund

Based on its review, the Board concluded that the nature, extent, and quality of services provided to the fund under the Advisory Contracts should benefit the fund's shareholders.
Competitiveness of Management Fee and Total Expense Ratio. The Board considered the fund's management fee and total expense ratio compared to "mapped groups" of competitive funds and classes. Fidelity creates "mapped groups" by combining similar Lipper investment objective categories that have comparable investment mandates. Combining Lipper investment objective categories aids the Board's management fee and total expense ratio comparisons by broadening the competitive group used for comparison and by reducing the number of universes to which various Fidelity funds are compared.
Management Fee. The Board considered two proprietary management fee comparisons for the 12-month periods shown in the chart below. The group of Lipper funds used by the Board for management fee comparisons is referred to below as the "Total Mapped Group." The Total Mapped Group comparison focuses on a fund's standing in terms of gross management fees before expense reimbursements or caps relative to the total universe of funds with comparable investment mandates, regardless of whether their management fee structures also are comparable. Funds with comparable investment mandates offer exposure to similar types of securities. Funds with comparable management fee structures have similar management fee contractual arrangements (e.g., flat rate charged for advisory services, all-inclusive fee rate, etc.). "TMG %" represents the percentage of funds in the Total Mapped Group that had management fees that were lower than the fund's. For example, a hypothetical TMG % of 20% would mean that 80% of the funds in the Total Mapped Group had higher, and 20% had lower, management fees than the fund. The fund's actual TMG %s are in the chart below. The "Asset-Size Peer Group" (ASPG) comparison focuses on a fund's standing relative to a subset of non-Fidelity funds within the Total Mapped Group that are similar in size and management fee structure. For example, if a fund is in the first quartile of the ASPG, the fund's management fee ranks in the least expensive or lowest 25% of funds in the ASPG. The ASPG represents at least 15% of the funds in the Total Mapped Group with comparable asset size and management fee structures, subject to a minimum of 50 funds (or all funds in the Total Mapped Group if fewer than 50). Additional information, such as the ASPG quartile in which the fund's management fee rate ranked, is also included in the chart and considered by the Board.
Annual Report
Fidelity Advisor Diversified International Fund

The Board noted that the fund's management fee rate ranked below the median of its Total Mapped Group and below the median of its ASPG for 2013.
Furthermore, the Board considered that, on July 16, 2014, after the periods shown in the chart above, it had approved a reduction (effective August 1, 2014) in the individual fund fee rate component of the management fee rate for the fund from 0.450% to 0.424%.
The Board also noted that, in August 2013, the ad hoc Committee on Management Fees was formed to conduct an in-depth review of the management fee rates of Fidelity's active equity mutual funds. The Committee focused on the following areas: (i) standard fee structures; (ii) research consumption and trading evolution; (iii) management fee competitiveness/profitability by category; and (iv) factors that drive institutional pricing.
Annual Report
Board Approval of Investment Advisory Contracts and
Management Fees - continued
Based on its review, the Board concluded that the fund's management fee is fair and reasonable in light of the services that the fund receives and the other factors considered.
Total Expense Ratio. In its review of each class's total expense ratio, the Board considered the fund's management fee as well as other fund or class expenses, as applicable, such as transfer agent fees, pricing and bookkeeping fees, fund-paid 12b-1 fees, and custodial, legal, and audit fees. The Board also noted the effects of any waivers and reimbursements on fees and expenses. As part of its review, the Board also considered the current and historical total expense ratios of each class of the fund compared to competitive fund median expenses. Each class of the fund is compared to those funds and classes in the Total Mapped Group (used by the Board for management fee comparisons) that have a similar sales load structure.
The Board noted that the total expense ratio of each of Class A, Class B, Class C, Institutional Class, and Class Z ranked below its competitive median for 2013 and the total expense ratio of Class T ranked above its competitive median for 2013. The Board considered that, in general, various factors can affect total expense ratios. The Board noted that the total expense ratio of Class T was above the competitive median primarily because of higher 12b-1 fees on Class T as compared to most competitor funds. Class T has a higher 12b-1 fee, but a lower front-end sales charge, than traditionally priced front-end sales charge classes. The Board considered that Class T is primarily sold load-waived in the retirement plan market where its 0.50% 12b-1 fee is comparable to competing no-load, higher 12b-1 fee classes designed specifically for retirement plans. The Board noted that the fund offers multiple classes, each of which has a different sales load and 12b-1 fee structure, and that the multiple structures are intended to offer a range of pricing options for the intermediary market. The Board also noted that the total expense ratios of the classes vary primarily by the level of their 12b-1 fees, although differences in transfer agent fees may also cause expenses to vary from class to class.
Fees Charged to Other Fidelity Clients. The Board also considered Fidelity fee structures and other information with respect to clients of Fidelity, such as other funds advised or subadvised by Fidelity, pension plan clients, and other institutional clients. The Board noted the findings of the 2013 ad hoc joint committee (created with the board of other Fidelity funds), which reviewed and compared Fidelity's institutional investment advisory business with its business of providing services to the Fidelity funds, including the differences in services provided, fees charged, and costs incurred, as well as competition in their respective marketplaces.
Based on its review of total expense ratios and fees charged to other Fidelity clients, the Board concluded that the total expense ratio of each class of the fund was reasonable, although Class T was above the median of the universe presented for comparison, in light of the services that the fund and its shareholders receive and the other factors considered.
Annual Report
Costs of the Services and Profitability. The Board considered the revenues earned and the expenses incurred by Fidelity in conducting the business of developing, marketing, distributing, managing, administering and servicing the fund and servicing the fund's shareholders. The Board also considered the level of Fidelity's profits in respect of all the Fidelity funds.
On an annual basis, Fidelity presents to the Board Fidelity's profitability for the fund. Fidelity calculates the profitability for each fund, as well as aggregate profitability for groups of Fidelity funds and all Fidelity funds, using a series of detailed revenue and cost allocation methodologies which originate with the books and records of Fidelity on which Fidelity's audited financial statements are based. The Audit Committee of the Board reviews any significant changes from the prior year's methodologies.
PricewaterhouseCoopers LLP (PwC), independent registered public accounting firm and auditor to Fidelity and certain Fidelity funds, has been engaged annually by the Board as part of the Board's assessment of Fidelity's profitability analysis. PwC's engagement includes the review and assessment of the methodologies used by Fidelity in determining the revenues and expenses attributable to Fidelity's mutual fund business, and completion of agreed-upon procedures in respect of the mathematical accuracy of fund profitability and its conformity to established allocation methodologies. After considering PwC's reports issued under the engagement and information provided by Fidelity, the Board concluded that while other allocation methods may also be reasonable, Fidelity's profitability methodologies are reasonable in all material respects.
The Board also reviewed Fidelity's non-fund businesses and fall-out benefits related to the mutual fund business as well as cases where Fidelity's affiliates may benefit from or be related to the fund's business.
The Board considered the costs of the services provided by and the profits realized by Fidelity in connection with the operation of the fund and was satisfied that the profitability was not excessive in the circumstances.
Economies of Scale. The Board considered whether there have been economies of scale in respect of the management of the Fidelity funds, whether the Fidelity funds (including the fund) have appropriately benefited from any such economies of scale, and whether there is potential for realization of any further economies of scale. The Board considered the extent to which the fund will benefit from economies of scale through increased services to the fund, through waivers or reimbursements, or through fee or expense ratio reductions. The Board also noted that in 2013, it and the boards of other Fidelity funds created an ad hoc committee (the Economies of Scale Committee) to analyze whether Fidelity attains economies of scale in respect of the management and servicing of the Fidelity funds, whether the Fidelity funds have appropriately benefited from such economies of scale, and whether there is potential for realization of any further economies of scale.
Annual Report
Board Approval of Investment Advisory Contracts and
Management Fees - continued
The Board recognized that the fund's management contract incorporates a "group fee" structure, which provides for lower group fee rates as total group assets increase, and for higher group fee rates as total group assets decrease (with "group assets" defined to include fund assets under FMR's management plus sector fund assets previously under FMR's management and currently managed by Fidelity SelectCo, LLC). FMR calculates the group fee rates based on a tiered asset "breakpoint" schedule that varies based on asset class. The Board considered that the group fee is designed to deliver the benefits of economies of scale to fund shareholders when total Fidelity fund assets increase, even if assets of any particular fund are unchanged or have declined, because some portion of Fidelity's costs are attributable to services provided to all Fidelity funds, and all funds benefit if those costs can be allocated among more assets. The Board concluded that, given the group fee structure, fund shareholders will benefit from lower management fees as group assets increase at the fund complex level, regardless of whether Fidelity achieves any such economies of scale.
The Board concluded, taking into account the analysis of the Economies of Scale Committee, that economies of scale, if any, are being appropriately shared between fund shareholders and Fidelity.
Additional Information Requested by the Board. In order to develop fully the factual basis for consideration of the Fidelity funds' Advisory Contracts, the Board requested and received additional information on certain topics, including: (i) fund performance trends and Fidelity's long-term strategies for certain funds; (ii) Fidelity's strategic marketing and product lineup goals; (iii) the methodology with respect to competitive fund data and peer group classifications; (iv) the arrangements with, and performance of, certain sub-advisers on behalf of the Fidelity funds, as well as certain proposed participating affiliate arrangements; (v) the realization of fall-out benefits in certain Fidelity business units; (vi) Fidelity's group fee structures, including the rationale for the individual fee rates of certain categories of funds and the definition of group assets; (vii) trends regarding industry use of performance fee structures and the performance adjustment methodologies applicable to the Fidelity funds; (viii) additional competitive analysis regarding the total expenses for certain classes; (ix) fund profitability methodology, including Fidelity's cost allocation methodology, and the impact of certain factors on fund profitability results; and (x) the process by which Fidelity determines sub-advisory fees for funds it advises.
Based on its evaluation of all of the conclusions noted above, and after considering all factors it believed relevant, the Board ultimately concluded that the advisory fee structures are fair and reasonable, and that the fund's Advisory Contracts should be renewed.
Annual Report
Investment Adviser
Fidelity Management & Research Company
Boston, MA
Investment Sub-Advisers
FMR Co., Inc.
Fidelity Management & Research
(U.K.) Inc.
FIL Investment Advisors
FIL Investments (Japan) Limited
FIL Investment Advisors (UK) Limited
Fidelity Management & Research
(Hong Kong) Limited
Fidelity Management & Research
(Japan) Limited
General Distributor
Fidelity Distributors Corporation
Smithfield, RI
Transfer and Service Agents
Fidelity Investments Institutional Operations Company, Inc.
Boston, MA
Fidelity Service Company, Inc.
Boston, MA
Custodian
State Street Bank and Trust Company
Quincy, MA
(Fidelity Investment logo)(registered trademark)
ADIFI-UANN-1214
1.784736.111
(Fidelity Investment logo)(registered trademark)
Fidelity Advisor®
Diversified International
Fund - Class Z
Annual Report
October 31, 2014
(Fidelity Cover Art)
Contents
Performance | (Click Here) | How the fund has done over time. |
Management's Discussion of Fund Performance | (Click Here) | The Portfolio Manager's review of fund performance and strategy. |
Shareholder Expense Example | (Click Here) | An example of shareholder expenses. |
Investment Changes | (Click Here) | A summary of major shifts in the fund's investments over the past six months. |
Investments | (Click Here) | A complete list of the fund's investments with their market values. |
Financial Statements | (Click Here) | Statements of assets and liabilities, operations, and changes in net assets, as well as financial highlights. |
Notes | (Click Here) | Notes to the financial statements. |
Report of Independent Registered Public Accounting Firm | (Click Here) | |
Trustees and Officers | (Click Here) | |
Distributions | (Click Here) | |
Board Approval of Investment Advisory Contracts and Management Fees | (Click Here) | |
To view a fund's proxy voting guidelines and proxy voting record for the 12-month period ended June 30, visit http://www.fidelity.com/proxyvotingresults or visit the Securities and Exchange Commission's (SEC) web site at http://www.sec.gov. You may also call 1-877-208-0098 to request a free copy of the proxy voting guidelines.
Standard & Poor's, S&P and S&P 500 are registered service marks of The McGraw-Hill Companies, Inc. and have been licensed for use by Fidelity Distributors Corporation.
Other third-party marks appearing herein are the property of their respective owners.
All other marks appearing herein are registered or unregistered trademarks or service marks of FMR LLC or an affiliated company. © 2014 FMR LLC. All rights reserved.
Annual Report
This report and the financial statements contained herein are submitted for the general information of the shareholders of the fund. This report is not authorized for distribution to prospective investors in the fund unless preceded or accompanied by an effective prospectus.
A fund files its complete schedule of portfolio holdings with the SEC for the first and third quarters of each fiscal year on Form N-Q. Forms N-Q are available on the SEC's web site at http://www.sec.gov. A fund's Forms N-Q may be reviewed and copied at the SEC's Public Reference Room in Washington, DC. Information regarding the operation of the SEC's Public Reference Room may be obtained by calling 1-800-SEC-0330. For a complete list of a fund's portfolio holdings, view the most recent holdings listing, semiannual report, or annual report on Fidelity's web site at http://www.fidelity.com, http://www.advisor.fidelity.com, or http://www.401k.com, as applicable.
NOT FDIC INSURED • MAY LOSE VALUE • NO BANK GUARANTEE
Neither the fund nor Fidelity Distributors Corporation is a bank.
Annual Report
Average annual total return reflects the change in the value of an investment, assuming reinvestment of the class' distributions from dividend income and capital gains (the profits earned upon the sale of securities that have grown in value, if any) and assuming a constant rate of performance each year. The $10,000 table and the fund's returns do not reflect the deduction of taxes that a shareholder would pay on fund distributions or the redemption of fund shares. During periods of reimbursement by Fidelity, a fund's total return will be greater than it would be had the reimbursement not occurred. How a fund did yesterday is no guarantee of how it will do tomorrow.
Average Annual Total Returns
Periods ended October 31, 2014 | Past 1
year | Past 5
years | Past 10
years |
Class Z A | 2.81% | 8.58% | 5.80% |
A The initial offering of Class Z shares took place on August 13, 2013. Returns prior to August 13, 2013, are those of Institutional Class.
$10,000 Over 10 Years
Let's say hypothetically that $10,000 was invested in Fidelity Advisor® Diversified International Fund - Class Z on October 31, 2004. The chart shows how the value of your investment would have changed, and also shows how the MSCI EAFE Index performed over the same period. See footnote A above for additional information regarding the performance of Class Z.
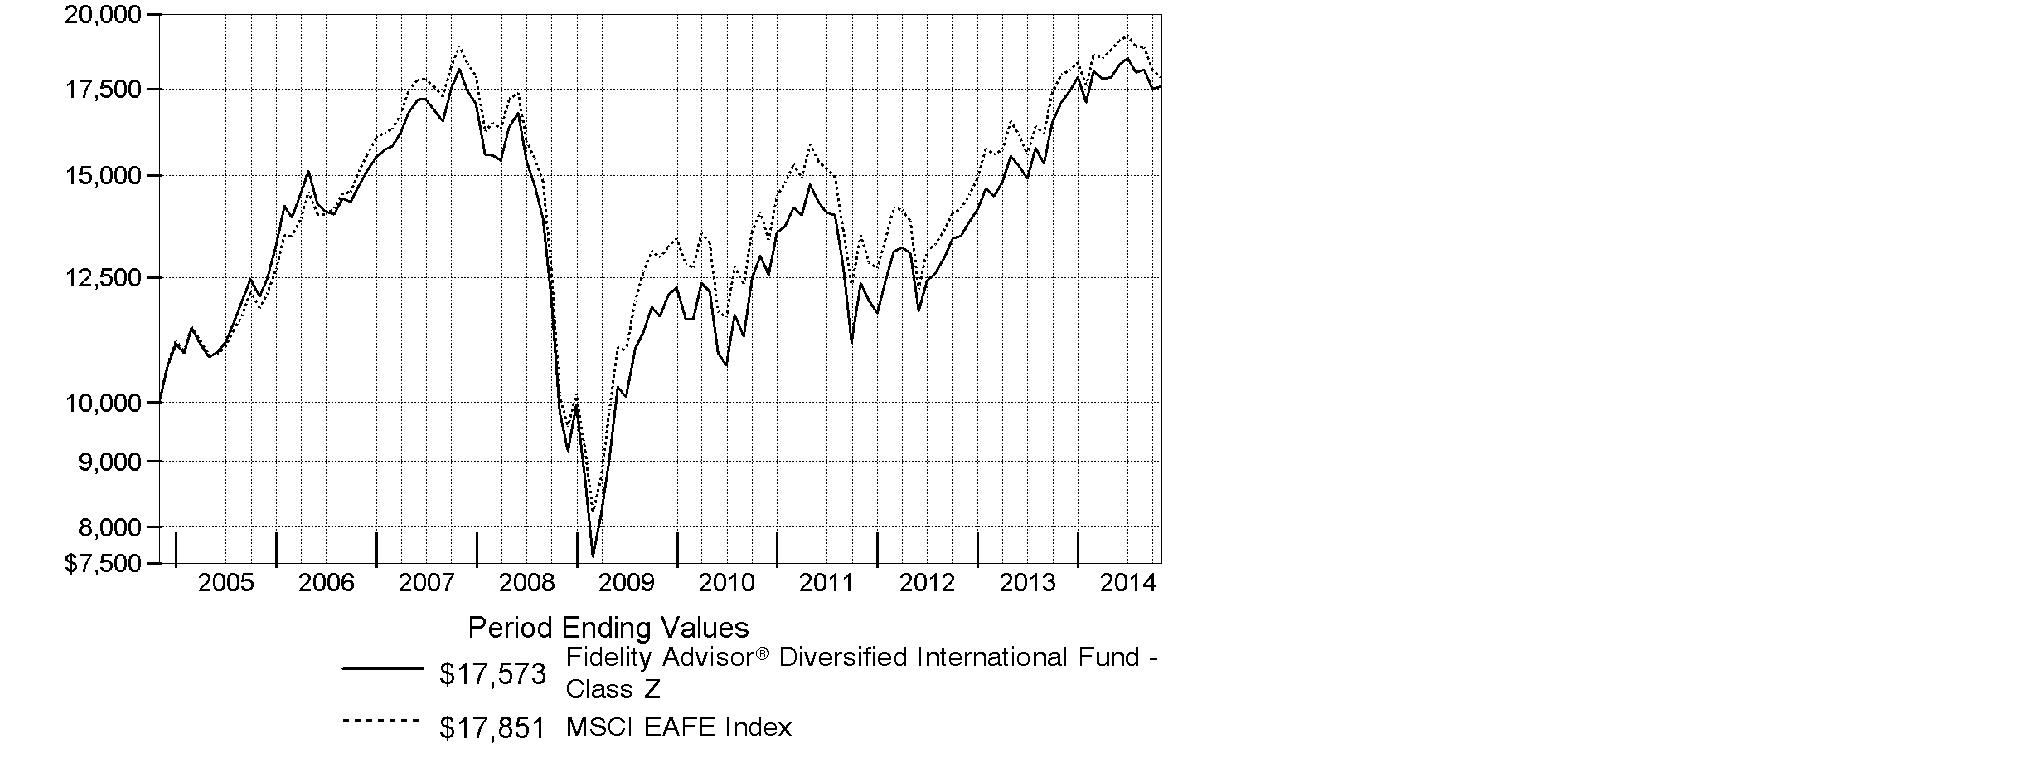
Annual Report
Market Recap: Global equities posted a healthy gain for the 12 months ending October 31, 2014, overcoming an October market decline driven by recessionary pressures in China and tepid growth in Europe. The MSCI ACWI (All Country World Index) Index rose 8.15%, helped by subdued market volatility for much of the period and supported by solid corporate earnings, especially in the United States. Stocks also benefited from easy monetary policies in Japan and the eurozone, as well as increased stimulus efforts in China. All but three of the 24 industry groups that compose the index marked a positive return. The U.S. (+17%) remained a pillar of strength, while a strongly rising dollar in the latter part of the period detracted from investors' returns in most non-U.S. markets. Canada (+5%) notched broad gains outside of its energy and materials sectors, as did Asia-Pacific ex Japan (+4%), led by investor enthusiasm for companies in India. The U.K., Europe and Japan, meanwhile, all underperformed. Among sectors, health care (+24%) led the index, with a strong contribution from the pharmaceuticals, biotechnology & life sciences industry. Information technology (+21%) also outperformed. Conversely, materials (-4%) and energy (-1%) lagged the index due to a higher supply of and lower demand for commodities.
Comments from William Bower, Portfolio Manager of Fidelity Advisor® Diversified International Fund: For the year ending October 31, 2014, the fund's Class Z shares gained 2.81%, outpacing the -0.48% result for the MSCI EAFE Index. Stock selection drove relative results, with strong showings in the information technology and health care sectors, with industrials the only notable detractor. Geographically, the fund benefited from out-of-index holdings in emerging markets, the U.S. and Canada. Stock selection helped in six of 10 sectors, and all 10 top relative contributors were overweights or out-of-index positions. Denmark's Novo Nordisk, an insulin producer, was up 38% for the year. Japanese optics maker Hoya also helped. Our holding in Alimentation Couche-Tard was up 51% for the full year. Conversely, picks in industrials hurt most, particularly data purveyor Experian, which was off 25% for the period. In financials, ORIX disappointed. In health care, not owning Switzerland's Novartis or U.K.-based AstraZeneca, two index heavies, weighed on relative results. I reduced its position in Honda Motor and sold out of Toyota Motor and Renault, and established a position in Suzuki Motor.
The views expressed above reflect those of the portfolio manager(s) only through the end of the period as stated on the cover of this report and do not necessarily represent the views of Fidelity or any other person in the Fidelity organization. Any such views are subject to change at any time based upon market or other conditions and Fidelity disclaims any responsibility to update such views. These views may not be relied on as investment advice and, because investment decisions for a Fidelity fund are based on numerous factors, may not be relied on as an indication of trading intent on behalf of any Fidelity fund.
Annual Report
Shareholder Expense Example
As a shareholder of the Fund, you incur two types of costs: (1) transaction costs, including sales charges (loads) on purchase payments or redemption proceeds, redemption fees and (2) ongoing costs, including management fees, distribution and/or service (12b-1) fees and other Fund expenses. This Example is intended to help you understand your ongoing costs (in dollars) of investing in the Fund and to compare these costs with the ongoing costs of investing in other mutual funds.
The Example is based on an investment of $1,000 invested at the beginning of the period and held for the entire period (May 1, 2014 to October 31, 2014).
Actual Expenses
The first line of the accompanying table for each class of the Fund provides information about actual account values and actual expenses. You may use the information in this line, together with the amount you invested, to estimate the expenses that you paid over the period. Simply divide your account value by $1,000.00 (for example, an $8,600 account value divided by $1,000.00 = 8.6), then multiply the result by the number in the first line for a class of the Fund under the heading entitled "Expenses Paid During Period" to estimate the expenses you paid on your account during this period. In addition, the Fund, as a shareholder in the underlying Fidelity Central Funds, will indirectly bear its pro-rata share of the fees and expenses incurred by the underlying Fidelity Central Funds. These fees and expenses are not included in the Fund's annualized expense ratio used to calculate the expense estimate in the table below.
Hypothetical Example for Comparison Purposes
The second line of the accompanying table for each class of the Fund provides information about hypothetical account values and hypothetical expenses based on a Class' actual expense ratio and an assumed rate of return of 5% per year before expenses, which is not the Class' actual return. The hypothetical account values and expenses may not be used to estimate the actual ending account balance or expenses you paid for the period. You may use this information to compare the ongoing costs of investing in the Fund and other funds. To do so, compare this 5% hypothetical example with the 5% hypothetical examples that appear in the shareholder reports of the other funds. In addition, the Fund, as a shareholder in the underlying Fidelity Central Funds, will indirectly bear its pro-rata share of the fees and expenses incurred by the underlying Fidelity Central Funds. These fees and expenses are not included in the Fund's annualized expense ratio used to calculate the expense estimate in the table below.
Please note that the expenses shown in the table are meant to highlight your ongoing costs only and do not reflect any transaction costs. Therefore, the second line of the table is useful in comparing ongoing costs only, and will not help you determine the relative total costs of owning different funds. In addition, if these transactional costs were included, your costs would have been higher.
Annual Report
| Annualized
Expense RatioB | Beginning
Account Value
May 1, 2014 | Ending
Account Value
October 31, 2014 | Expenses Paid
During Period*
May 1, 2014
to October 31, 2014 |
Class A | 1.24% | | | |
Actual | | $ 1,000.00 | $ 981.40 | $ 6.19 |
HypotheticalA | | $ 1,000.00 | $ 1,018.95 | $ 6.31 |
Class T | 1.50% | | | |
Actual | | $ 1,000.00 | $ 980.30 | $ 7.49 |
HypotheticalA | | $ 1,000.00 | $ 1,017.64 | $ 7.63 |
Class B | 2.05% | | | |
Actual | | $ 1,000.00 | $ 977.60 | $ 10.22 |
HypotheticalA | | $ 1,000.00 | $ 1,014.87 | $ 10.41 |
Class C | 1.99% | | | |
Actual | | $ 1,000.00 | $ 978.00 | $ 9.92 |
HypotheticalA | | $ 1,000.00 | $ 1,015.17 | $ 10.11 |
Institutional Class | .96% | | | |
Actual | | $ 1,000.00 | $ 983.20 | $ 4.80 |
HypotheticalA | | $ 1,000.00 | $ 1,020.37 | $ 4.89 |
Class Z | .78% | | | |
Actual | | $ 1,000.00 | $ 984.20 | $ 3.90 |
HypotheticalA | | $ 1,000.00 | $ 1,021.27 | $ 3.97 |
A 5% return per year before expenses
B Annualized expense ratio reflects expenses net of applicable fee waivers.
* Expenses are equal to each Class' annualized expense ratio, multiplied by the average account value over the period, multiplied by 184/365 (to reflect the one-half year period).
Annual Report
Investment Changes (Unaudited)
Top Five Stocks as of October 31, 2014 |
| % of fund's
net assets | % of fund's net assets
6 months ago |
Novo Nordisk A/S Series B (Denmark, Pharmaceuticals) | 1.9 | 1.9 |
ORIX Corp. (Japan, Diversified Financial Services) | 1.8 | 1.6 |
Bayer AG (Germany, Pharmaceuticals) | 1.6 | 1.7 |
Anheuser-Busch InBev SA NV (Belgium, Beverages) | 1.6 | 1.4 |
Roche Holding AG (participation certificate) (Switzerland, Pharmaceuticals) | 1.4 | 0.7 |
| 8.3 | |
Top Five Market Sectors as of October 31, 2014 |
| % of fund's
net assets | % of fund's net assets
6 months ago |
Financials | 21.2 | 21.1 |
Health Care | 16.7 | 16.1 |
Consumer Discretionary | 15.6 | 15.8 |
Information Technology | 13.9 | 9.8 |
Consumer Staples | 12.0 | 11.9 |
Top Five Countries as of October 31, 2014 |
(excluding cash equivalents) | % of fund's
net assets | % of fund's net assets
6 months ago |
Japan | 17.7 | 15.3 |
United Kingdom | 16.8 | 17.4 |
United States of America | 7.9 | 7.1 |
Germany | 6.2 | 8.4 |
Switzerland | 5.2 | 5.4 |
Percentages are adjusted for the effect of open futures contracts, if applicable. |
Asset Allocation (% of fund's net assets) |
As of October 31, 2014 | As of April 30, 2014 |
 | Stocks 98.1% | | | Stocks 97.7% | |
 | Other Investments 0.1% | | | Other Investments 0.1% | |
 | Short-Term
Investments and
Net Other Assets (Liabilities) 1.8% | | | Short-Term
Investments and
Net Other Assets (Liabilities) 2.2% | |

Annual Report
Investments October 31, 2014
Showing Percentage of Net Assets
Common Stocks - 96.7% |
| Shares | | Value (000s) |
Australia - 2.8% |
Ansell Ltd. | 258,534 | | $ 4,535 |
Australia & New Zealand Banking Group Ltd. | 628,447 | | 18,596 |
BHP Billiton Ltd. sponsored ADR (e) | 217,236 | | 12,913 |
CSL Ltd. | 167,531 | | 11,828 |
Woodside Petroleum Ltd. | 172,944 | | 6,143 |
TOTAL AUSTRALIA | | 54,015 |
Austria - 0.1% |
Andritz AG | 52,900 | | 2,554 |
Bailiwick of Guernsey - 0.2% |
Amdocs Ltd. | 72,600 | | 3,451 |
Bailiwick of Jersey - 2.0% |
Experian PLC | 398,000 | | 5,975 |
Shire PLC | 255,300 | | 17,130 |
Wolseley PLC | 124,370 | | 6,599 |
WPP PLC | 445,924 | | 8,710 |
TOTAL BAILIWICK OF JERSEY | | 38,414 |
Belgium - 2.6% |
Anheuser-Busch InBev SA NV | 272,131 | | 30,178 |
Arseus NV | 61,500 | | 2,458 |
KBC Groupe SA (a) | 246,648 | | 13,213 |
UCB SA | 42,200 | | 3,405 |
TOTAL BELGIUM | | 49,254 |
Bermuda - 0.7% |
BW LPG Ltd. | 339,872 | | 3,220 |
Golar LNG Ltd. | 76,000 | | 4,264 |
Noble Group Ltd. | 3,986,000 | | 3,710 |
Travelport Worldwide Ltd. | 158,100 | | 2,285 |
TOTAL BERMUDA | | 13,479 |
Canada - 3.8% |
Alimentation Couche-Tard, Inc. Class B (sub. vtg.) | 460,900 | | 15,642 |
AutoCanada, Inc. | 36,900 | | 2,050 |
Canadian Natural Resources Ltd. | 110,900 | | 3,870 |
CGI Group, Inc. Class A (sub. vtg.) (a) | 397,700 | | 13,652 |
Constellation Software, Inc. | 25,700 | | 7,240 |
First Quantum Minerals Ltd. | 256,600 | | 3,870 |
Imperial Oil Ltd. | 96,200 | | 4,629 |
Keyera Corp. | 28,900 | | 2,299 |
Potash Corp. of Saskatchewan, Inc. | 115,500 | | 3,942 |
Common Stocks - continued |
| Shares | | Value (000s) |
Canada - continued |
PrairieSky Royalty Ltd. | 38,000 | | $ 1,170 |
Suncor Energy, Inc. | 265,200 | | 9,417 |
Tourmaline Oil Corp. (a) | 100,600 | | 3,609 |
TransForce, Inc. | 77,900 | | 1,905 |
TOTAL CANADA | | 73,295 |
Cayman Islands - 3.2% |
58.com, Inc. ADR | 21,000 | | 831 |
Alibaba Group Holding Ltd. sponsored ADR | 240,900 | | 23,753 |
Baidu.com, Inc. sponsored ADR (a) | 18,500 | | 4,417 |
China Modern Dairy Holdings Ltd. (a)(e) | 6,161,000 | | 2,718 |
GCL-Poly Energy Holdings Ltd. (a) | 16,510,000 | | 5,564 |
Melco Crown Entertainment Ltd. sponsored ADR | 267,500 | | 7,260 |
PW Medtech Group Ltd. (a) | 5,938,000 | | 3,749 |
Sands China Ltd. | 1,554,400 | | 9,695 |
Tencent Holdings Ltd. | 196,800 | | 3,163 |
TOTAL CAYMAN ISLANDS | | 61,150 |
Colombia - 0.2% |
Grupo Aval Acciones y Valores SA ADR | 287,696 | | 3,878 |
Curacao - 0.0% |
Schlumberger Ltd. | 5,400 | | 533 |
Denmark - 2.4% |
A.P. Moller - Maersk A/S Series B | 802 | | 1,869 |
Genmab A/S (a) | 132,800 | | 5,789 |
Novo Nordisk A/S Series B | 789,740 | | 35,698 |
Vestas Wind Systems A/S (a) | 94,134 | | 3,151 |
TOTAL DENMARK | | 46,507 |
Finland - 0.6% |
Nokia Corp. | 647,900 | | 5,414 |
Sampo Oyj (A Shares) | 113,300 | | 5,419 |
TOTAL FINLAND | | 10,833 |
France - 3.7% |
Air Liquide SA | 54,260 | | 6,545 |
Atos Origin SA | 49,027 | | 3,385 |
AXA SA | 444,800 | | 10,262 |
BNP Paribas SA | 221,943 | | 13,945 |
Kering SA | 16,100 | | 3,106 |
LVMH Moet Hennessy - Louis Vuitton SA | 16,998 | | 2,883 |
Numericable Group SA (e) | 33,900 | | 1,253 |
Common Stocks - continued |
| Shares | | Value (000s) |
France - continued |
Numericable Group SA rights 11/12/14 (a) | 33,900 | | $ 1,005 |
Publicis Groupe SA (a) | 140,010 | | 9,697 |
Sanofi SA | 186,347 | | 16,909 |
Tarkett SA | 43,874 | | 1,264 |
TOTAL FRANCE | | 70,254 |
Germany - 4.8% |
adidas AG | 20,690 | | 1,505 |
Bayer AG | 219,452 | | 31,199 |
Brenntag AG | 75,600 | | 3,657 |
Continental AG | 34,600 | | 6,792 |
Drillisch AG | 50,000 | | 1,735 |
Fresenius SE & Co. KGaA | 294,300 | | 15,139 |
Gerry Weber International AG (Bearer) | 59,100 | | 2,372 |
Linde AG | 53,347 | | 9,837 |
OSRAM Licht AG (a) | 62,910 | | 2,204 |
ProSiebenSat.1 Media AG | 90,800 | | 3,659 |
SAP AG (e) | 135,216 | | 9,213 |
Symrise AG | 58,000 | | 3,262 |
TOTAL GERMANY | | 90,574 |
Hong Kong - 1.7% |
AIA Group Ltd. | 4,129,000 | | 23,042 |
Galaxy Entertainment Group Ltd. | 1,059,000 | | 7,241 |
Melco International Development Ltd. | 679,000 | | 1,841 |
TOTAL HONG KONG | | 32,124 |
India - 2.4% |
Apollo Hospitals Enterprise Ltd. (a) | 199,507 | | 3,621 |
Axis Bank Ltd. (a) | 444,940 | | 3,279 |
HDFC Bank Ltd. | 835,563 | | 13,549 |
Housing Development Finance Corp. Ltd. | 655,610 | | 11,807 |
ITC Ltd. (a) | 1,141,123 | | 6,598 |
LIC Housing Finance Ltd. | 201,645 | | 1,187 |
Lupin Ltd. | 127,912 | | 2,962 |
Pidilite Industries Ltd. | 524,041 | | 3,531 |
TOTAL INDIA | | 46,534 |
Indonesia - 0.5% |
PT Bank Central Asia Tbk | 5,215,000 | | 5,630 |
PT Bank Rakyat Indonesia Tbk | 4,102,200 | | 3,759 |
TOTAL INDONESIA | | 9,389 |
Common Stocks - continued |
| Shares | | Value (000s) |
Ireland - 2.1% |
Actavis PLC (a) | 50,000 | | $ 12,137 |
DCC PLC (United Kingdom) | 71,500 | | 3,996 |
Greencore Group PLC | 1,069,521 | | 4,489 |
Perrigo Co. PLC | 71,900 | | 11,608 |
Ryanair Holdings PLC sponsored ADR (a) | 147,800 | | 8,209 |
TOTAL IRELAND | | 40,439 |
Israel - 1.3% |
Check Point Software Technologies Ltd. (a) | 120,100 | | 8,917 |
Teva Pharmaceutical Industries Ltd. sponsored ADR | 295,000 | | 16,659 |
TOTAL ISRAEL | | 25,576 |
Italy - 0.9% |
Telecom Italia SpA (a) | 2,528,504 | | 2,866 |
UniCredit SpA | 1,301,916 | | 9,397 |
World Duty Free SpA (a) | 582,140 | | 4,928 |
TOTAL ITALY | | 17,191 |
Japan - 17.7% |
Ain Pharmaciez, Inc. | 77,700 | | 2,105 |
Aozora Bank Ltd. | 867,000 | | 3,047 |
Astellas Pharma, Inc. | 1,338,800 | | 20,779 |
Daiichikosho Co. Ltd. | 74,400 | | 1,878 |
Don Quijote Holdings Co. Ltd. | 182,000 | | 10,905 |
Fast Retailing Co. Ltd. | 18,500 | | 6,878 |
Fuji Heavy Industries Ltd. | 98,700 | | 3,285 |
GMO Internet, Inc. | 357,500 | | 3,002 |
Honda Motor Co. Ltd. sponsored ADR | 152,306 | | 4,892 |
Hoya Corp. | 650,900 | | 23,033 |
Japan Exchange Group, Inc. | 361,800 | | 8,975 |
Japan Tobacco, Inc. | 686,800 | | 23,433 |
KDDI Corp. | 224,600 | | 14,749 |
Keyence Corp. | 46,800 | | 22,678 |
Komatsu Ltd. | 440,400 | | 10,398 |
Medical System Network Co. Ltd. (e) | 752,500 | | 2,298 |
Misumi Group, Inc. | 34,800 | | 1,098 |
Mitsubishi Electric Corp. | 436,000 | | 5,622 |
Mitsubishi UFJ Financial Group, Inc. | 2,952,200 | | 17,209 |
Nagaileben Co. Ltd. | 117,000 | | 2,249 |
NEC Corp. | 3,756,000 | | 13,283 |
NGK Spark Plug Co. Ltd. | 106,000 | | 2,765 |
Nippon Telegraph & Telephone Corp. | 158,500 | | 9,862 |
Nitori Holdings Co. Ltd. | 86,000 | | 5,450 |
Common Stocks - continued |
| Shares | | Value (000s) |
Japan - continued |
Olympus Corp. (a) | 56,700 | | $ 2,036 |
OMRON Corp. | 163,100 | | 7,720 |
ORIX Corp. | 2,432,400 | | 33,762 |
Rakuten, Inc. | 1,186,500 | | 13,380 |
Recruit Holdings Co. Ltd. (a) | 36,900 | | 1,261 |
Seven & i Holdings Co., Ltd. | 156,700 | | 6,120 |
SHIMANO, Inc. | 51,800 | | 6,869 |
Shinsei Bank Ltd. | 1,893,000 | | 4,254 |
Ship Healthcare Holdings, Inc. | 95,400 | | 2,233 |
SoftBank Corp. | 311,400 | | 22,670 |
Suzuki Motor Corp. | 154,500 | | 5,179 |
Toshiba Plant Systems & Services Corp. | 153,200 | | 2,564 |
Tsuruha Holdings, Inc. | 116,000 | | 6,849 |
VT Holdings Co. Ltd. | 606,600 | | 2,396 |
TOTAL JAPAN | | 337,166 |
Korea (South) - 0.9% |
NAVER Corp. | 10,009 | | 7,024 |
Orion Corp. | 6,412 | | 4,923 |
Samsung Electronics Co. Ltd. | 4,431 | | 5,130 |
Samsung SDS Co. Ltd. (a) | 2,071 | | 366 |
TOTAL KOREA (SOUTH) | | 17,443 |
Luxembourg - 1.3% |
Altice SA | 243,177 | | 15,142 |
Eurofins Scientific SA | 38,800 | | 9,805 |
TOTAL LUXEMBOURG | | 24,947 |
Mexico - 0.3% |
America Movil S.A.B. de CV Series L sponsored ADR | 197,100 | | 4,811 |
Netherlands - 3.5% |
AEGON NV | 2,212,100 | | 18,030 |
AerCap Holdings NV (a) | 75,500 | | 3,272 |
IMCD Group BV | 122,800 | | 3,386 |
ING Groep NV (Certificaten Van Aandelen) (a) | 664,900 | | 9,522 |
LyondellBasell Industries NV Class A | 82,200 | | 7,532 |
Reed Elsevier NV | 213,182 | | 4,906 |
Unilever NV (Certificaten Van Aandelen) (Bearer) | 500,200 | | 19,387 |
TOTAL NETHERLANDS | | 66,035 |
Norway - 0.2% |
Telenor ASA | 187,400 | | 4,212 |
Common Stocks - continued |
| Shares | | Value (000s) |
Philippines - 0.4% |
Alliance Global Group, Inc. | 12,852,154 | | $ 7,229 |
Singapore - 0.4% |
Ezion Holdings Ltd. | 1,479,600 | | 1,742 |
United Overseas Bank Ltd. | 329,000 | | 5,894 |
TOTAL SINGAPORE | | 7,636 |
South Africa - 0.9% |
Naspers Ltd. Class N | 142,100 | | 17,684 |
Spain - 1.6% |
Amadeus IT Holding SA Class A | 266,800 | | 9,796 |
Criteria CaixaCorp SA | 554,945 | | 3,026 |
Inditex SA | 656,784 | | 18,449 |
TOTAL SPAIN | | 31,271 |
Sweden - 2.3% |
ASSA ABLOY AB (B Shares) | 100,600 | | 5,328 |
HEXPOL AB (B Shares) | 16,800 | | 1,486 |
Nordea Bank AB | 1,015,800 | | 13,027 |
Svenska Cellulosa AB (SCA) (B Shares) | 644,300 | | 14,406 |
Svenska Handelsbanken AB (A Shares) | 212,000 | | 10,109 |
TOTAL SWEDEN | | 44,356 |
Switzerland - 5.2% |
Actelion Ltd. | 47,876 | | 5,692 |
Compagnie Financiere Richemont SA Series A | 113,494 | | 9,549 |
Credit Suisse Group AG | 354,987 | | 9,458 |
Nestle SA | 162,022 | | 11,882 |
Roche Holding AG (participation certificate) | 91,362 | | 26,961 |
Syngenta AG (Switzerland) | 53,404 | | 16,516 |
UBS AG | 1,072,643 | | 18,651 |
TOTAL SWITZERLAND | | 98,709 |
Taiwan - 1.1% |
Taiwan Semiconductor Manufacturing Co. Ltd. sponsored ADR | 937,900 | | 20,653 |
Thailand - 0.2% |
Kasikornbank PCL (For. Reg.) | 533,300 | | 3,863 |
United Kingdom - 16.8% |
Al Noor Hospitals Group PLC | 266,200 | | 4,339 |
Associated British Foods PLC | 175,100 | | 7,714 |
B&M European Value Retail S.A. | 1,353,586 | | 5,386 |
BG Group PLC | 1,008,869 | | 16,814 |
British American Tobacco PLC sponsored ADR | 167,200 | | 18,987 |
Common Stocks - continued |
| Shares | | Value (000s) |
United Kingdom - continued |
BT Group PLC | 1,879,500 | | $ 11,080 |
Bunzl PLC | 119,000 | | 3,227 |
Capita Group PLC | 100,700 | | 1,767 |
Compass Group PLC | 404,800 | | 6,514 |
Diploma PLC | 350,900 | | 3,904 |
easyJet PLC | 160,900 | | 3,861 |
Exova Group Ltd. PLC (a) | 644,700 | | 1,751 |
Filtrona PLC | 815,100 | | 8,951 |
GlaxoSmithKline PLC | 419,900 | | 9,496 |
Hikma Pharmaceuticals PLC | 238,987 | | 7,245 |
HSBC Holdings PLC sponsored ADR | 490,797 | | 25,040 |
IMI PLC | 189,700 | | 3,708 |
Imperial Tobacco Group PLC | 88,997 | | 3,860 |
ITV PLC | 1,841,700 | | 5,981 |
Johnson Matthey PLC | 121,600 | | 5,785 |
Kingfisher PLC | 1,846,900 | | 8,947 |
Liberty Global PLC: | | | |
Class A (a) | 68,400 | | 3,110 |
Class C | 48,700 | | 2,166 |
Lloyds Banking Group PLC (a) | 17,941,900 | | 22,156 |
Mears Group PLC | 260,100 | | 1,839 |
Meggitt PLC | 539,673 | | 3,894 |
Next PLC | 192,100 | | 19,806 |
Poundland Group PLC (a) | 361,369 | | 1,821 |
Prudential PLC | 1,008,173 | | 23,345 |
Reckitt Benckiser Group PLC | 222,013 | | 18,646 |
Rentokil Initial PLC | 1,109,900 | | 2,187 |
Rolls-Royce Group PLC | 733,500 | | 9,892 |
SABMiller PLC | 169,000 | | 9,530 |
Schroders PLC | 24,900 | | 960 |
Spectris PLC | 138,900 | | 4,004 |
Sports Direct International PLC (a) | 459,400 | | 4,736 |
St. James's Place Capital PLC | 934,800 | | 11,141 |
Standard Chartered PLC (United Kingdom) | 232,764 | | 3,499 |
Travis Perkins PLC | 220,300 | | 5,822 |
Whitbread PLC | 116,872 | | 8,159 |
TOTAL UNITED KINGDOM | | 321,070 |
United States of America - 7.9% |
AbbVie, Inc. | 114,900 | | 7,292 |
Alexion Pharmaceuticals, Inc. (a) | 47,600 | | 9,109 |
Alliance Data Systems Corp. (a) | 20,900 | | 5,922 |
Common Stocks - continued |
| Shares | | Value (000s) |
United States of America - continued |
Amgen, Inc. | 52,700 | | $ 8,547 |
Celldex Therapeutics, Inc. (a) | 41,800 | | 700 |
CF Industries Holdings, Inc. | 14,700 | | 3,822 |
Fidelity National Information Services, Inc. | 96,600 | | 5,640 |
FMC Corp. | 32,700 | | 1,875 |
Freeport-McMoRan, Inc. | 110,100 | | 3,138 |
Gilead Sciences, Inc. (a) | 90,700 | | 10,158 |
Google, Inc.: | | | |
Class A (a) | 13,295 | | 7,550 |
Class C (a) | 19,795 | | 11,067 |
Las Vegas Sands Corp. | 133,000 | | 8,281 |
MasterCard, Inc. Class A | 127,700 | | 10,695 |
McGraw Hill Financial, Inc. | 189,800 | | 17,173 |
Mead Johnson Nutrition Co. Class A | 53,900 | | 5,353 |
Mondelez International, Inc. | 144,300 | | 5,088 |
Noble Energy, Inc. | 148,300 | | 8,547 |
QUALCOMM, Inc. | 75,500 | | 5,928 |
The Blackstone Group LP | 146,100 | | 4,401 |
Visa, Inc. Class A | 44,500 | | 10,744 |
TOTAL UNITED STATES OF AMERICA | | 151,030 |
TOTAL COMMON STOCKS (Cost $1,514,332) |
1,847,559
|
Preferred Stocks - 1.4% |
| | | |
Convertible Preferred Stocks - 0.0% |
United States of America - 0.0% |
NJOY, Inc.: | | | |
Series C (a)(h) | 60,264 | | 486 |
Series D (h) | 18,951 | | 153 |
TOTAL UNITED STATES OF AMERICA | | 639 |
Nonconvertible Preferred Stocks - 1.4% |
Germany - 1.4% |
Henkel AG & Co. KGaA | 132,200 | | 13,051 |
Volkswagen AG | 64,700 | | 13,787 |
TOTAL GERMANY | | 26,838 |
Preferred Stocks - continued |
| Shares | | Value (000s) |
Nonconvertible Preferred Stocks - continued |
United Kingdom - 0.0% |
Rolls-Royce Group PLC | 66,015,000 | | $ 106 |
TOTAL NONCONVERTIBLE PREFERRED STOCKS | | 26,944 |
TOTAL PREFERRED STOCKS (Cost $21,726) |
27,583
|
Preferred Securities - 0.1% |
| Principal Amount (d) (000s) | | |
Ireland - 0.1% |
Baggot Securities Ltd. 10.24% (f)(g)
(Cost $2,488) | EUR | 1,620 | |
2,295
|
Money Market Funds - 2.6% |
| Shares | | |
Fidelity Cash Central Fund, 0.11% (b) | 31,286,373 | | 31,286 |
Fidelity Securities Lending Cash Central Fund, 0.11% (b)(c) | 18,560,972 | | 18,561 |
TOTAL MONEY MARKET FUNDS (Cost $49,847) |
49,847
|
TOTAL INVESTMENT PORTFOLIO - 100.8% (Cost $1,588,393) | | 1,927,284 |
NET OTHER ASSETS (LIABILITIES) - (0.8)% | | (15,807) |
NET ASSETS - 100% | $ 1,911,477 |
Currency Abbreviations |
EUR | - | European Monetary Unit |
Legend |
(a) Non-income producing |
(b) Affiliated fund that is generally available only to investment companies and other accounts managed by Fidelity Investments. The rate quoted is the annualized seven-day yield of the fund at period end. A complete unaudited listing of the fund's holdings as of its most recent quarter end is available upon request. In addition, each Fidelity Central Fund's financial statements, which are not covered by the Fund's Report of Independent Registered Public Accounting Firm, are available on the SEC's website or upon request. |
(c) Investment made with cash collateral received from securities on loan. |
(d) Amount is stated in United States dollars unless otherwise noted. |
(e) Security or a portion of the security is on loan at period end. |
(f) Security exempt from registration under Rule 144A of the Securities Act of 1933. These securities may be resold in transactions exempt from registration, normally to qualified institutional buyers. At the end of the period, the value of these securities amounted to $2,295,000 or 0.1% of net assets. |
(g) Security is perpetual in nature with no stated maturity date. |
(h) Restricted securities - Investment in securities not registered under the Securities Act of 1933 (excluding 144A issues). At the end of the period, the value of restricted securities (excluding 144A issues) amounted to $639,000 or 0.0% of net assets. |
Additional information on each restricted holding is as follows: |
Security | Acquisition
Date | Acquisition
Cost (000s) |
NJOY, Inc. Series C | 6/7/13 | $ 487 |
NJOY, Inc. Series D | 2/14/14 | $ 321 |
Affiliated Central Funds |
Information regarding fiscal year to date income earned by the Fund from investments in Fidelity Central Funds is as follows: |
Fund | Income earned
(Amounts in thousands) |
Fidelity Cash Central Fund | $ 26 |
Fidelity Securities Lending Cash Central Fund | 900 |
Total | $ 926 |
Other Information |
Categorizations in the Schedule of Investments are based on country or territory of incorporation. |
The following is a summary of the inputs used, as of October 31, 2014, involving the Fund's assets and liabilities carried at fair value. The inputs or methodology used for valuing securities may not be an indication of the risk associated with investing in those securities. For more information on valuation inputs, and their aggregation into the levels used in the table below, please refer to the Investment Valuation section in the accompanying Notes to Financial Statements. |
Valuation Inputs at Reporting Date: |
Description
(Amounts in thousands) | Total | Level 1 | Level 2 | Level 3 |
Investments in Securities: | | | | |
Equities: | | | | |
Consumer Discretionary | $ 295,222 | $ 199,164 | $ 95,419 | $ 639 |
Consumer Staples | 233,257 | 121,689 | 111,568 | - |
Energy | 66,257 | 41,558 | 24,699 | - |
Financials | 403,505 | 144,490 | 259,015 | - |
Health Care | 321,467 | 161,281 | 160,186 | - |
Industrials | 123,823 | 91,941 | 31,882 | - |
Information Technology | 263,235 | 170,165 | 93,070 | - |
Materials | 96,391 | 76,344 | 20,047 | - |
Telecommunication Services | 71,985 | 10,758 | 61,227 | - |
Preferred Securities | 2,295 | - | 2,295 | - |
Money Market Funds | 49,847 | 49,847 | - | - |
Total Investments in Securities: | $ 1,927,284 | $ 1,067,237 | $ 859,408 | $ 639 |
The following is a summary of transfers between Level 1 and Level 2 for the period ended October 31, 2014. Transfers are assumed to have occurred at the beginning of the period, and are primarily attributable to the valuation techniques used for foreign equity securities, as discussed in the accompanying Notes to Financial Statements: |
Transfers | Total (000s) |
Level 1 to Level 2 | $ 164,017 |
Level 2 to Level 1 | $ 0 |
See accompanying notes which are an integral part of the financial statements.
Annual Report
Statement of Assets and Liabilities
Amounts in thousands (except per-share amounts) | October 31, 2014 |
| | |
Assets | | |
Investment in securities, at value (including securities loaned of $17,707) - See accompanying schedule: Unaffiliated issuers (cost $1,538,546) | $ 1,877,437 | |
Fidelity Central Funds (cost $49,847) | 49,847 | |
Total Investments (cost $1,588,393) | | $ 1,927,284 |
Foreign currency held at value (cost $62) | | 62 |
Receivable for investments sold | | 7,243 |
Receivable for fund shares sold | | 2,290 |
Dividends receivable | | 4,406 |
Distributions receivable from Fidelity Central Funds | | 14 |
Prepaid expenses | | 5 |
Other receivables | | 196 |
Total assets | | 1,941,500 |
| | |
Liabilities | | |
Payable for investments purchased | $ 3,546 | |
Payable for fund shares redeemed | 3,300 | |
Accrued management fee | 1,039 | |
Distribution and service plan fees payable | 468 | |
Other affiliated payables | 443 | |
Other payables and accrued expenses | 2,666 | |
Collateral on securities loaned, at value | 18,561 | |
Total liabilities | | 30,023 |
| | |
Net Assets | | $ 1,911,477 |
Net Assets consist of: | | |
Paid in capital | | $ 4,218,295 |
Undistributed net investment income | | 18,417 |
Accumulated undistributed net realized gain (loss) on investments and foreign currency transactions | | (2,661,534) |
Net unrealized appreciation (depreciation) on investments and assets and liabilities in foreign currencies | | 336,299 |
Net Assets | | $ 1,911,477 |
See accompanying notes which are an integral part of the financial statements.
Annual Report
Statement of Assets and Liabilities - continued
Amounts in thousands (except per-share amounts) | October 31, 2014 |
| | |
Calculation of Maximum Offering Price Class A:
Net Asset Value and redemption price per share ($693,064 ÷ 35,431 shares) | | $ 19.56 |
| | |
Maximum offering price per share (100/94.25 of $19.56) | | $ 20.75 |
Class T:
Net Asset Value and redemption price per share ($283,584 ÷ 14,630 shares) | | $ 19.38 |
| | |
Maximum offering price per share (100/96.50 of $19.38) | | $ 20.08 |
Class B:
Net Asset Value and offering price per share ($19,140 ÷ 1,021 shares)A | | $ 18.75 |
| | |
Class C:
Net Asset Value and offering price per share ($243,431 ÷ 13,034 shares)A | | $ 18.68 |
| | |
| | |
Institutional Class:
Net Asset Value, offering price and redemption price per share ($648,208 ÷ 32,552 shares) | | $ 19.91 |
| | |
Class Z:
Net Asset Value, offering price and redemption price per share ($24,050 ÷ 1,207 shares) | | $ 19.93 |
A Redemption price per share is equal to net asset value less any applicable contingent deferred sales charge.
See accompanying notes which are an integral part of the financial statements.
Annual Report
Financial Statements - continued
Statement of Operations
Amounts in thousands | Year ended October 31, 2014 |
| | |
Investment Income | | |
Dividends | | $ 45,009 |
Special dividends | | 9,777 |
Income from Fidelity Central Funds | | 926 |
Income before foreign taxes withheld | | 55,712 |
Less foreign taxes withheld | | (3,501) |
Total income | | 52,211 |
| | |
Expenses | | |
Management fee | $ 13,964 | |
Transfer agent fees | 4,638 | |
Distribution and service plan fees | 6,276 | |
Accounting and security lending fees | 896 | |
Custodian fees and expenses | 249 | |
Independent trustees' compensation | 8 | |
Registration fees | 116 | |
Audit | 86 | |
Legal | 8 | |
Miscellaneous | 17 | |
Total expenses before reductions | 26,258 | |
Expense reductions | (27) | 26,231 |
Net investment income (loss) | | 25,980 |
Realized and Unrealized Gain (Loss) Net realized gain (loss) on: | | |
Investment securities: | | |
Unaffiliated issuers | 173,972 | |
Foreign currency transactions | (234) | |
Futures contracts | 550 | |
Total net realized gain (loss) | | 174,288 |
Change in net unrealized appreciation (depreciation) on: Investment securities (net of increase in deferred foreign taxes of $21) | (153,249) | |
Assets and liabilities in foreign currencies | (168) | |
Futures contracts | (491) | |
Total change in net unrealized appreciation (depreciation) | | (153,908) |
Net gain (loss) | | 20,380 |
Net increase (decrease) in net assets resulting from operations | | $ 46,360 |
See accompanying notes which are an integral part of the financial statements.
Annual Report
Statement of Changes in Net Assets
Amounts in thousands | Year ended
October 31,
2014 | Year ended
October 31,
2013 |
Increase (Decrease) in Net Assets | | |
Operations | | |
Net investment income (loss) | $ 25,980 | $ 19,442 |
Net realized gain (loss) | 174,288 | 196,674 |
Change in net unrealized appreciation (depreciation) | (153,908) | 237,976 |
Net increase (decrease) in net assets resulting
from operations | 46,360 | 454,092 |
Distributions to shareholders from net investment income | (17,375) | (23,595) |
Distributions to shareholders from net realized gain | (17,564) | (7,342) |
Total distributions | (34,939) | (30,937) |
Share transactions - net increase (decrease) | (109,770) | (330,363) |
Redemption fees | 19 | 17 |
Total increase (decrease) in net assets | (98,330) | 92,809 |
| | |
Net Assets | | |
Beginning of period | 2,009,807 | 1,916,998 |
End of period (including undistributed net investment income of $18,417 and undistributed net investment income of $17,279, respectively) | $ 1,911,477 | $ 2,009,807 |
See accompanying notes which are an integral part of the financial statements.
Annual Report
Financial Highlights - Class A
Years ended October 31, | 2014 | 2013 | 2012 | 2011 | 2010 |
Selected Per-Share Data | | | | | |
Net asset value, beginning of period | $ 19.47 | $ 15.63 | $ 14.61 | $ 15.63 | $ 14.25 |
Income from Investment Operations | | | | | |
Net investment income (loss) C | .27F | .19 | .18 | .22G | .14 |
Net realized and unrealized gain (loss) | .17 | 3.92 | 1.03 | (1.01) | 1.44 |
Total from investment operations | .44 | 4.11 | 1.21 | (.79) | 1.58 |
Distributions from net investment income | (.18) | (.21) | (.19) | (.20) | (.19) |
Distributions from net realized gain | (.17) | (.06) | - | (.03) | (.01) |
Total distributions | (.35) | (.27) | (.19) | (.23) | (.20) |
Redemption fees added to paid in capital C, I | - | - | - | - | - |
Net asset value, end of period | $ 19.56 | $ 19.47 | $ 15.63 | $ 14.61 | $ 15.63 |
Total ReturnA, B | 2.28% | 26.69% | 8.47% | (5.15)% | 11.17% |
Ratios to Average Net Assets D, H | | | | | |
Expenses before reductions | 1.26% | 1.31% | 1.32% | 1.31% | 1.32% |
Expenses net of fee waivers, if any | 1.26% | 1.30% | 1.32% | 1.31% | 1.32% |
Expenses net of all reductions | 1.26% | 1.28% | 1.31% | 1.29% | 1.30% |
Net investment income (loss) | 1.34% F | 1.08% | 1.20% | 1.38% G | .95% |
Supplemental Data | | | | | |
Net assets, end of period (in millions) | $ 693 | $ 756 | $ 762 | $ 916 | $ 1,302 |
Portfolio turnover rateE | 40% | 50% | 34% | 48% | 59% |
A Total returns would have been lower if certain expenses had not been reduced during the applicable periods shown.
B Total returns do not include the effect of the sales charges.
C Calculated based on average shares outstanding during the period.
D Fees and expenses of any underlying Fidelity Central Funds are not included in the Fund's expense ratio. The Fund indirectly bears its proportionate share of the expenses of any underlying Fidelity Central Funds.
E Amount does not include the portfolio activity of any underlying Fidelity Central Funds.
F Investment income per share reflects a large, non-recurring dividend which amounted to $.10 per share. Excluding this non-recurring dividend, the ratio of net investment income (loss) to average net assets would have been .85%.
G Investment income per share reflects a large, non-recurring dividend which amounted to $.06 per share. Excluding this non-recurring dividend, the ratio of net investment income (loss) to average net assets would have been .98%.
H Expense ratios reflect operating expenses of the class. Expenses before reductions do not reflect amounts reimbursed by the investment adviser or reductions from brokerage service arrangements or reductions from other expense offset arrangements and do not represent the amount paid by the class during periods when reimbursements or reductions occur. Expenses net of fee waivers reflect expenses after reimbursement by the investment adviser but prior to reductions from brokerage service arrangements or other expense offset arrangements. Expenses net of all reductions represent the net expenses paid by the class.
I Amount represents less than $.01 per share.
See accompanying notes which are an integral part of the financial statements.
Annual Report
Financial Highlights - Class T
Years ended October 31, | 2014 | 2013 | 2012 | 2011 | 2010 |
Selected Per-Share Data | | | | | |
Net asset value, beginning of period | $ 19.30 | $ 15.49 | $ 14.46 | $ 15.47 | $ 14.11 |
Income from Investment Operations | | | | | |
Net investment income (loss) C | .21F | .14 | .14 | .18G | .10 |
Net realized and unrealized gain (loss) | .18 | 3.89 | 1.03 | (.99) | 1.43 |
Total from investment operations | .39 | 4.03 | 1.17 | (.81) | 1.53 |
Distributions from net investment income | (.14) | (.16) | (.14) | (.16) | (.16) |
Distributions from net realized gain | (.17) | (.06) | - | (.03) | (.01) |
Total distributions | (.31) | (.22) | (.14) | (.20) J | (.17) |
Redemption fees added to paid in capital C, I | - | - | - | - | - |
Net asset value, end of period | $ 19.38 | $ 19.30 | $ 15.49 | $ 14.46 | $ 15.47 |
Total ReturnA, B | 2.04% | 26.37% | 8.17% | (5.35)% | 10.88% |
Ratios to Average Net Assets D, H | | | | | |
Expenses before reductions | 1.51% | 1.55% | 1.58% | 1.55% | 1.55% |
Expenses net of fee waivers, if any | 1.51% | 1.55% | 1.58% | 1.55% | 1.55% |
Expenses net of all reductions | 1.51% | 1.53% | 1.57% | 1.53% | 1.53% |
Net investment income (loss) | 1.09% F | .83% | .94% | 1.14% G | .71% |
Supplemental Data | | | | | |
Net assets, end of period (in millions) | $ 284 | $ 319 | $ 304 | $ 404 | $ 621 |
Portfolio turnover rateE | 40% | 50% | 34% | 48% | 59% |
A Total returns would have been lower if certain expenses had not been reduced during the applicable periods shown.
B Total returns do not include the effect of the sales charges.
C Calculated based on average shares outstanding during the period.
D Fees and expenses of any underlying Fidelity Central Funds are not included in the Fund's expense ratio. The Fund indirectly bears its proportionate share of the expenses of any underlying Fidelity Central Funds.
E Amount does not include the portfolio activity of any underlying Fidelity Central Funds.
F Investment income per share reflects a large, non-recurring dividend which amounted to $.10 per share. Excluding this non-recurring dividend, the ratio of net investment income (loss) to average net assets would have been .60%.
G Investment income per share reflects a large, non-recurring dividend which amounted to $.06 per share. Excluding this non-recurring dividend, the ratio of net investment income (loss) to average net assets would have been .74%.
H Expense ratios reflect operating expenses of the class. Expenses before reductions do not reflect amounts reimbursed by the investment adviser or reductions from brokerage service arrangements or reductions from other expense offset arrangements and do not represent the amount paid by the class during periods when reimbursements or reductions occur. Expenses net of fee waivers reflect expenses after reimbursement by the investment adviser but prior to reductions from brokerage service arrangements or other expense offset arrangements. Expenses net of all reductions represent the net expenses paid by the class.
I Amount represents less than $.01 per share.
J Total distributions of $.20 per share is comprised of distributions from net investment income of $.164 and distributions from net realized gain of $.034 per share.
See accompanying notes which are an integral part of the financial statements.
Annual Report
Financial Highlights - Class B
Years ended October 31, | 2014 | 2013 | 2012 | 2011 | 2010 |
Selected Per-Share Data | | | | | |
Net asset value, beginning of period | $ 18.65 | $ 14.95 | $ 13.91 | $ 14.91 | $ 13.61 |
Income from Investment Operations | | | | | |
Net investment income (loss) C | .10F | .05 | .06 | .09G | .02 |
Net realized and unrealized gain (loss) | .17 | 3.77 | 1.00 | (.96) | 1.38 |
Total from investment operations | .27 | 3.82 | 1.06 | (.87) | 1.40 |
Distributions from net investment income | - | (.06) | (.02) | (.10) | (.09) |
Distributions from net realized gain | (.17) | (.06) | - | (.03) | (.01) |
Total distributions | (.17) | (.12) | (.02) | (.13) | (.10) |
Redemption fees added to paid in capital C, I | - | - | - | - | - |
Net asset value, end of period | $ 18.75 | $ 18.65 | $ 14.95 | $ 13.91 | $ 14.91 |
Total ReturnA, B | 1.45% | 25.72% | 7.64% | (5.89)% | 10.34% |
Ratios to Average Net Assets D, H | | | | | |
Expenses before reductions | 2.07% | 2.08% | 2.08% | 2.08% | 2.09% |
Expenses net of fee waivers, if any | 2.07% | 2.08% | 2.08% | 2.08% | 2.09% |
Expenses net of all reductions | 2.07% | 2.06% | 2.07% | 2.06% | 2.07% |
Net investment income (loss) | .53%F | .30% | .44% | .61%G | .18% |
Supplemental Data | | | | | |
Net assets, end of period (in millions) | $ 19 | $ 36 | $ 59 | $ 94 | $ 157 |
Portfolio turnover rateE | 40% | 50% | 34% | 48% | 59% |
A Total returns would have been lower if certain expenses had not been reduced during the applicable periods shown.
B Total returns do not include the effect of the contingent deferred sales charge.
C Calculated based on average shares outstanding during the period.
D Fees and expenses of any underlying Fidelity Central Funds are not included in the Fund's expense ratio. The Fund indirectly bears its proportionate share of the expenses of any underlying Fidelity Central Funds.
E Amount does not include the portfolio activity of any underlying Fidelity Central Funds.
F Investment income per share reflects a large, non-recurring dividend which amounted to $.09 per share. Excluding this non-recurring dividend, the ratio of net investment income (loss) to average net assets would have been .04%.
G Investment income per share reflects a large, non-recurring dividend which amounted to $.06 per share. Excluding this non-recurring dividend, the ratio of net investment income (loss) to average net assets would have been .21%.
H Expense ratios reflect operating expenses of the class. Expenses before reductions do not reflect amounts reimbursed by the investment adviser or reductions from brokerage service arrangements or reductions from other expense offset arrangements and do not represent the amount paid by the class during periods when reimbursements or reductions occur. Expenses net of fee waivers reflect expenses after reimbursement by the investment adviser but prior to reductions from brokerage service arrangements or other expense offset arrangements. Expenses net of all reductions represent the net expenses paid by the class.
I Amount represents less than $.01 per share.
See accompanying notes which are an integral part of the financial statements.
Annual Report
Financial Highlights - Class C
Years ended October 31, | 2014 | 2013 | 2012 | 2011 | 2010 |
Selected Per-Share Data | | | | | |
Net asset value, beginning of period | $ 18.63 | $ 14.97 | $ 13.95 | $ 14.95 | $ 13.65 |
Income from Investment Operations | | | | | |
Net investment income (loss) C | .11F | .06 | .06 | .10G | .03 |
Net realized and unrealized gain (loss) | .18 | 3.75 | 1.01 | (.96) | 1.38 |
Total from investment operations | .29 | 3.81 | 1.07 | (.86) | 1.41 |
Distributions from net investment income | (.07) | (.09) | (.05) | (.11) | (.10) |
Distributions from net realized gain | (.17) | (.06) | - | (.03) | (.01) |
Total distributions | (.24) | (.15) | (.05) | (.14) | (.11) |
Redemption fees added to paid in capital C, I | - | - | - | - | - |
Net asset value, end of period | $ 18.68 | $ 18.63 | $ 14.97 | $ 13.95 | $ 14.95 |
Total ReturnA, B | 1.58% | 25.71% | 7.71% | (5.83)% | 10.32% |
Ratios to Average Net Assets D, H | | | | | |
Expenses before reductions | 2.00% | 2.04% | 2.06% | 2.05% | 2.06% |
Expenses net of fee waivers, if any | 2.00% | 2.04% | 2.06% | 2.05% | 2.06% |
Expenses net of all reductions | 2.00% | 2.01% | 2.05% | 2.03% | 2.04% |
Net investment income (loss) | .60%F | .35% | .46% | .64%G | .21% |
Supplemental Data | | | | | |
Net assets, end of period (in millions) | $ 243 | $ 264 | $ 246 | $ 302 | $ 419 |
Portfolio turnover rateE | 40% | 50% | 34% | 48% | 59% |
A Total returns would have been lower if certain expenses had not been reduced during the applicable periods shown.
B Total returns do not include the effect of the contingent deferred sales charge.
C Calculated based on average shares outstanding during the period.
D Fees and expenses of any underlying Fidelity Central Funds are not included in the Fund's expense ratio. The Fund indirectly bears its proportionate share of the expenses of any underlying Fidelity Central Funds.
E Amount does not include the portfolio activity of any underlying Fidelity Central Funds.
F Investment income per share reflects a large, non-recurring dividend which amounted to $.09 per share. Excluding this non-recurring dividend, the ratio of net investment income (loss) to average net assets would have been .11%.
G Investment income per share reflects a large, non-recurring dividend which amounted to $.06 per share. Excluding this non-recurring dividend, the ratio of net investment income (loss) to average net assets would have been .24%.
H Expense ratios reflect operating expenses of the class. Expenses before reductions do not reflect amounts reimbursed by the investment adviser or reductions from brokerage service arrangements or reductions from other expense offset arrangements and do not represent the amount paid by the class during periods when reimbursements or reductions occur. Expenses net of fee waivers reflect expenses after reimbursement by the investment adviser but prior to reductions from brokerage service arrangements or other expense offset arrangements. Expenses net of all reductions represent the net expenses paid by the class.
I Amount represents less than $.01 per share.
See accompanying notes which are an integral part of the financial statements.
Annual Report
Financial Highlights - Institutional Class
Years ended October 31, | 2014 | 2013 | 2012 | 2011 | 2010 |
Selected Per-Share Data | | | | | |
Net asset value, beginning of period | $ 19.80 | $ 15.90 | $ 14.87 | $ 15.90 | $ 14.48 |
Income from Investment Operations | | | | | |
Net investment income (loss) B | .33E | .24 | .23 | .28F | .19 |
Net realized and unrealized gain (loss) | .18 | 3.98 | 1.05 | (1.03) | 1.47 |
Total from investment operations | .51 | 4.22 | 1.28 | (.75) | 1.66 |
Distributions from net investment income | (.23) | (.26) | (.25) | (.25) | (.23) |
Distributions from net realized gain | (.17) | (.06) | - | (.03) | (.01) |
Total distributions | (.40) | (.32) | (.25) | (.28) | (.24) |
Redemption fees added to paid in capital B,H | - | - | - | - | - |
Net asset value, end of period | $ 19.91 | $ 19.80 | $ 15.90 | $ 14.87 | $ 15.90 |
Total ReturnA | 2.60% | 27.03% | 8.83% | (4.85)% | 11.55% |
Ratios to Average Net Assets C, G | | | | | |
Expenses before reductions | .97% | .99% | 1.00% | .99% | .99% |
Expenses net of fee waivers, if any | .97% | .99% | 1.00% | .99% | .99% |
Expenses net of all reductions | .97% | .97% | .99% | .97% | .97% |
Net investment income (loss) | 1.63%E | 1.39% | 1.52% | 1.70%F | 1.28% |
Supplemental Data | | | | | |
Net assets, end of period (in millions) | $ 648 | $ 636 | $ 546 | $ 723 | $ 1,316 |
Portfolio turnover rateD | 40% | 50% | 34% | 48% | 59% |
A Total returns would have been lower if certain expenses had not been reduced during the applicable periods shown.
B Calculated based on average shares outstanding during the period.
C Fees and expenses of any underlying Fidelity Central Funds are not included in the Fund's expense ratio. The Fund indirectly bears its proportionate share of the expenses of any underlying Fidelity Central Funds.
D Amount does not include the portfolio activity of any underlying Fidelity Central Funds.
E Investment income per share reflects a large, non-recurring dividend which amounted to $.10 per share. Excluding this non-recurring dividend, the ratio of net investment income (loss) to average net assets would have been 1.14%.
F Investment income per share reflects a large, non-recurring dividend which amounted to $.06 per share. Excluding this non-recurring dividend, the ratio of net investment income (loss) to average net assets would have been 1.30%.
G Expense ratios reflect operating expenses of the class. Expenses before reductions do not reflect amounts reimbursed by the investment adviser or reductions from brokerage service arrangements or reductions from other expense offset arrangements and do not represent the amount paid by the class during periods when reimbursements or reductions occur. Expenses net of fee waivers reflect expenses after reimbursement by the investment adviser but prior to reductions from brokerage service arrangements or other expense offset arrangements. Expenses net of all reductions represent the net expenses paid by the class.
H Amount represents less than $.01 per share.
See accompanying notes which are an integral part of the financial statements.
Annual Report
Financial Highlights - Class Z
Years ended October 31, | 2014 | 2013H |
Selected Per-Share Data | | |
Net asset value, beginning of period | $ 19.81 | $ 18.54 |
Income from Investment Operations | | |
Net investment income (loss) D | .36G | .03 |
Net realized and unrealized gain (loss) | .19 | 1.24 |
Total from investment operations | .55 | 1.27 |
Distributions from net investment income | (.26) | - |
Distributions from net realized gain | (.17) | - |
Total distributions | (.43) | - |
Redemption fees added to paid in capital D | -J | - |
Net asset value, end of period | $ 19.93 | $ 19.81 |
Total ReturnB, C | 2.81% | 6.85% |
Ratios to Average Net Assets E, I | | |
Expenses before reductions | .81% | .83%A |
Expenses net of fee waivers, if any | .81% | .83%A |
Expenses net of all reductions | .81% | .80%A |
Net investment income (loss) | 1.79%G | .77%A |
Supplemental Data | | |
Net assets, end of period (000 omitted) | $ 24,050 | $ 107 |
Portfolio turnover rateF | 40% | 50% |
A Annualized
B Total returns for periods of less than one year are not annualized.
C Total returns would have been lower if certain expenses had not been reduced during the applicable periods shown.
D Calculated based on average shares outstanding during the period.
E Fees and expenses of any underlying Fidelity Central Funds are not included in the Fund's expense ratio. The Fund indirectly bears its proportionate share of the expenses of any underlying Fidelity Central Funds.
F Amount does not include the portfolio activity of any underlying Fidelity Central Funds.
G Investment income per share reflects a large, non-recurring dividend which amounted to $.10 per share. Excluding this non-recurring dividend, the ratio of net investment income (loss) to average net assets would have been 1.30%.
H For the period August 13, 2013 (commencement of sale of shares) to October 31, 2013.
I Expense ratios reflect operating expenses of the class. Expenses before reductions do not reflect amounts reimbursed by the investment adviser or reductions from brokerage service arrangements or reductions from other expense offset arrangements and do not represent the amount paid by the class during periods when reimbursements or reductions occur. Expenses net of fee waivers reflect expenses after reimbursement by the investment adviser but prior to reductions from brokerage service arrangements or other expense offset arrangements. Expenses net of all reductions represent the net expenses paid by the class.
J Amount represents less than $.01 per share.
See accompanying notes which are an integral part of the financial statements.
Annual Report
Notes to Financial Statements
For the period ended October 31, 2014
(Amounts in thousands except percentages)
1. Organization.
Fidelity Advisor Diversified International Fund (the Fund) is a fund of Fidelity Advisor Series VIII (the Trust) and is authorized to issue an unlimited number of shares. The Trust is registered under the Investment Company Act of 1940, as amended (the 1940 Act), as an open-end management investment company organized as a Massachusetts business trust. The Fund offers Class A, Class T, Class C, Institutional Class and Class Z shares, each of which, along with Class B shares, has equal rights as to assets and voting privileges. Class B shares are closed to new accounts and additional purchases, except for exchanges and reinvestments. Each class has exclusive voting rights with respect to matters that affect that class. Class B shares will automatically convert to Class A shares after a holding period of seven years from the initial date of purchase.
2. Investments in Fidelity Central Funds.
The Fund invests in Fidelity Central Funds, which are open-end investment companies generally available only to other investment companies and accounts managed by the investment adviser and its affiliates. The Fund's Schedule of Investments lists each of the Fidelity Central Funds held as of period end, if any, as an investment of the Fund, but does not include the underlying holdings of each Fidelity Central Fund. As an Investing Fund, the Fund indirectly bears its proportionate share of the expenses of the underlying Fidelity Central Funds.
The Money Market Central Funds seek preservation of capital and current income and are managed by Fidelity Investments Money Management, Inc. (FIMM), an affiliate of the investment adviser. Annualized expenses of the Money Market Central Funds as of their most recent shareholder report date are less than .01%.
A complete unaudited list of holdings for each Fidelity Central Fund is available upon request or at the Securities and Exchange Commission (the SEC) website at www.sec.gov. In addition, the financial statements of the Fidelity Central Funds, which are not covered by the Fund's Report of Independent Registered Public Accounting Firm, are available on the SEC website or upon request.
3. Significant Accounting Policies.
The financial statements have been prepared in conformity with accounting principles generally accepted in the United States of America (GAAP), which require management to make certain estimates and assumptions at the date of the financial statements. Actual results could differ from those estimates. Subsequent events, if any, through the date that the financial statements were issued have been evaluated in the preparation of
Annual Report
Notes to Financial Statements - continued
(Amounts in thousands except percentages)
3. Significant Accounting Policies - continued
the financial statements. The following summarizes the significant accounting policies of the Fund:
Investment Valuation. Investments are valued as of 4:00 p.m. Eastern time on the last calendar day of the period. In accordance with valuation policies and procedures approved by the Board of Trustees (the Board), the Fund attempts to obtain prices from one or more third party pricing vendors or brokers to value its investments. When current market prices, quotations or currency exchange rates are not readily available or reliable, investments will be fair valued in good faith by the Fidelity Management & Research Company (FMR) Fair Value Committee (the Committee), in accordance with procedures adopted by the Board. Factors used in determining fair value vary by investment type and may include market or investment specific events, changes in interest rates and credit quality. The frequency with which these procedures are used cannot be predicted and they may be utilized to a significant extent. The Committee oversees the Fund's valuation policies and procedures and is responsible for approving and reporting to the Board all fair value determinations.
The Fund categorizes the inputs to valuation techniques used to value its investments into a disclosure hierarchy consisting of three levels as shown below:
Level 1 - quoted prices in active markets for identical investments
Level 2 - other significant observable inputs (including quoted prices for similar investments, interest rates, prepayment speeds, etc.)
Level 3 - unobservable inputs (including the Fund's own assumptions based on the best information available)
Valuation techniques used to value the Fund's investments by major category are as follows:
Equity securities, including restricted securities, for which market quotations are readily available, are valued at the last reported sale price or official closing price as reported by a third party pricing vendor on the primary market or exchange on which they are traded and are categorized as Level 1 in the hierarchy. In the event there were no sales during the day or closing prices are not available, securities are valued at the last quoted bid price or may be valued using the last available price and are generally categorized as Level 2 in the hierarchy. For foreign equity securities, when market or security specific events arise, comparisons to the valuation of American Depositary Receipts (ADRs), futures contracts, Exchange-Traded Funds (ETFs) and certain indexes as well as quoted prices for similar securities may be used and would be categorized as Level 2 in the hierarchy. Utilizing these techniques may result in transfers between Level 1 and Level 2. For equity securities, including restricted securities, where observable inputs are limited, assumptions about market activity and risk are used and these securities may be categorized as Level 3 in the hierarchy.
Annual Report
3. Significant Accounting Policies - continued
Investment Valuation - continued
Debt securities, including restricted securities, are valued based on evaluated prices received from third party pricing vendors or from brokers who make markets in such securities. Preferred securities are valued by pricing vendors who utilize matrix pricing which considers yield or price of bonds of comparable quality, coupon, maturity and type or by broker-supplied prices. When independent prices are unavailable or unreliable, debt securities may be valued utilizing pricing methodologies which consider similar factors that would be used by third party pricing vendors. Debt securities are generally categorized as Level 2 in the hierarchy but may be Level 3 depending on the circumstances. ETFs are valued at their last sale price or official closing price as reported by a third party pricing vendor on the primary market or exchange on which they are traded and are categorized as Level 1 in the hierarchy. In the event there were no sales during the day but the exchange reports a closing bid level, ETFs are valued at the closing bid and would be categorized as Level 1 in the hierarchy. In the event there was no closing bid, ETFs may be valued by another method that the Board believes reflects fair value in accordance with the Board's fair value pricing policies and may be categorized as Level 2 in the hierarchy.
Investments in open-end mutual funds, including the Fidelity Central Funds, are valued at their closing net asset value (NAV) each business day and are categorized as Level 1 in the hierarchy.
Changes in valuation techniques may result in transfers in or out of an assigned level within the disclosure hierarchy. The aggregate value of investments by input level, as of October 31, 2014, including information on transfers between Levels 1 and 2, is included at the end of the Fund's Schedule of Investments.
Foreign Currency. The Fund may use foreign currency contracts to facilitate transactions in foreign-denominated securities. Gains and losses from these transactions may arise from changes in the value of the foreign currency or if the counterparties do not perform under the contracts' terms.
Foreign-denominated assets, including investment securities, and liabilities are translated into U.S. dollars at the exchange rates at period end. Purchases and sales of investment securities, income and dividends received and expenses denominated in foreign currencies are translated into U.S. dollars at the exchange rate in effect on the transaction date.
The effects of exchange rate fluctuations on investments are included with the net realized and unrealized gain (loss) on investment securities. Other foreign currency transactions resulting in realized and unrealized gain (loss) are disclosed separately.
Annual Report
Notes to Financial Statements - continued
(Amounts in thousands except percentages)
3. Significant Accounting Policies - continued
Investment Transactions and Income. For financial reporting purposes, the Fund's investment holdings and NAV include trades executed through the end of the last business day of the period. The NAV per share for processing shareholder transactions is calculated as of the close of business of the New York Stock Exchange (NYSE), normally 4:00 p.m. Eastern time and includes trades executed through the end of the prior business day. Gains and losses on securities sold are determined on the basis of identified cost and may include proceeds received from litigation. Dividend income is recorded on the ex-dividend date, except for certain dividends from foreign securities where the ex-dividend date may have passed, which are recorded as soon as the Fund is informed of the ex-dividend date. Non-cash dividends included in dividend income, if any, are recorded at the fair market value of the securities received. Income and capital gain distributions from Fidelity Central Funds, if any, are recorded on the ex-dividend date. Distributions received on securities that represent a return of capital or capital gain are recorded as a reduction of cost of investments and/or as a realized gain. Subsequent to ex-dividend date the Fund determines the components of these distributions, based upon receipt of tax filings or other correspondence relating to the underlying investment. Large, non-recurring dividends recognized by the Fund are presented separately on the Statement of Operations as "Special Dividends" and the impact of these dividends is presented in the Financial Highlights. Interest income is accrued as earned and includes coupon interest and amortization of premium and accretion of discount on debt securities as applicable. Investment income is recorded net of foreign taxes withheld where recovery of such taxes is uncertain.
Class Allocations and Expenses. Investment income, realized and unrealized capital gains and losses, common expenses of the Fund, and certain fund-level expense reductions, if any, are allocated daily on a pro-rata basis to each class based on the relative net assets of each class to the total net assets of the Fund. Each class differs with respect to transfer agent and distribution and service plan fees incurred. Certain expense reductions may also differ by class. For the reporting period, the allocated portion of income and expenses to each class as a percent of its average net assets may vary due to the timing of recording these transactions in relation to fluctuating net assets of the classes. Expenses directly attributable to a fund are charged to that fund. Expenses attributable to more than one fund are allocated among the respective funds on the basis of relative net assets or other appropriate methods. Expense estimates are accrued in the period to which they relate and adjustments are made when actual amounts are known.
Deferred Trustee Compensation. Under a Deferred Compensation Plan (the Plan), independent Trustees may elect to defer receipt of a portion of their annual compensation. Deferred amounts are invested in a cross-section of Fidelity funds, are marked-to-market and remain in the Fund until distributed in accordance with the Plan. The
Annual Report
3. Significant Accounting Policies - continued
Deferred Trustee Compensation - continued
investment of deferred amounts and the offsetting payable to the Trustees are included in the accompanying Statement of Assets and Liabilities.
Income Tax Information and Distributions to Shareholders. Each year, the Fund intends to qualify as a regulated investment company under Subchapter M of the Internal Revenue Code, including distributing substantially all of its taxable income and realized gains. As a result, no provision for U.S. Federal income taxes is required. As of October 31, 2014, the Fund did not have any unrecognized tax benefits in the financial statements; nor is the Fund aware of any tax positions for which it is reasonably possible that the total amounts of unrecognized tax benefits will significantly change in the next twelve months. The Fund files a U.S. federal tax return, in addition to state and local tax returns as required. The Fund's federal income tax returns are subject to examination by the Internal Revenue Service (IRS) for a period of three fiscal years after they are filed. State and local tax returns may be subject to examination for an additional fiscal year depending on the jurisdiction. Foreign taxes are provided for based on the Fund's understanding of the tax rules and rates that exist in the foreign markets in which it invests. The Fund is subject to a tax imposed on capital gains by certain countries in which it invests. An estimated deferred tax liability for net unrealized appreciation on the applicable securities is included in Other payables and accrued expenses on the Statement of Assets & Liabilities.
Distributions are declared and recorded on the ex-dividend date. Income dividends and capital gain distributions are declared separately for each class. Income and capital gain distributions are determined in accordance with income tax regulations, which may differ from GAAP.
Capital accounts within the financial statements are adjusted for permanent book-tax differences. These adjustments have no impact on net assets or the results of operations. Capital accounts are not adjusted for temporary book-tax differences which will reverse in a subsequent period.
Book-tax differences are primarily due to foreign currency transactions, passive foreign investment companies (PFIC), deferred trustees compensation, futures transactions, partnerships, capital loss carryforwards, and losses deferred due to wash sales.
The federal tax cost of investment securities and unrealized appreciation (depreciation) as of period end were as follows:
Gross unrealized appreciation | $ 401,047 |
Gross unrealized depreciation | (78,289) |
Net unrealized appreciation (depreciation) on securities | $ 322,758 |
Tax Cost | $ 1,604,526 |
Annual Report
Notes to Financial Statements - continued
(Amounts in thousands except percentages)
3. Significant Accounting Policies - continued
Income Tax Information and Distributions to Shareholders - continued
The tax-based components of distributable earnings as of period end were as follows:
Undistributed ordinary income | $ 18,554 |
Capital loss carryforward | $ (2,645,401) |
Net unrealized appreciation (depreciation) on securities and other investments | $ 322,566 |
Capital loss carryforwards are only available to offset future capital gains of the Fund to the extent provided by regulations and may be limited. Under the Regulated Investment Company Modernization Act of 2010 (the Act), the Fund is permitted to carry forward capital losses incurred in taxable years beginning after December 22, 2010 for an unlimited period and such capital losses are required to be used prior to any losses that expire. The capital loss carryforward information presented below, including any applicable limitation, is estimated as of fiscal period end and is subject to adjustment.
Fiscal year of expiration | |
2017 | $ (2,645,401) |
The tax character of distributions paid was as follows:
| October 31, 2014 | October 31, 2013 |
Ordinary Income | $ 34,939 | $ 30,937 |
Short-Term Trading (Redemption) Fees. Shares held by investors in the Fund less than 30 days may have been subject to a redemption fee equal to 1.00% of the NAV of shares redeemed. All redemption fees, which reduce the proceeds of the shareholder redemption, are retained by the Fund and accounted for as an addition to paid in capital.
Restricted Securities. The Fund may invest in securities that are subject to legal or contractual restrictions on resale. These securities generally may be resold in transactions exempt from registration or to the public if the securities are registered. Disposal of these securities may involve time-consuming negotiations and expense, and prompt sale at an acceptable price may be difficult. Information regarding restricted securities is included at the end of the Fund's Schedule of Investments.
New Accounting Pronouncement. In June 2014, the Financial Accounting Standards Board issued Accounting Standard Update No. 2014-11, Repurchase-to-Maturity Transactions, Repurchase Financings, and Disclosures. The Update amends the accounting for certain repurchase agreements and expands disclosure requirements for reverse repurchase agreements, securities lending and other similar transactions. The disclosure requirements are effective for annual and interim reporting periods beginning after December 15, 2014. Management is currently evaluating the impact of the Update on the Fund's financial statements and related disclosures.
Annual Report
4. Derivative Instruments.
Risk Exposures and the Use of Derivative Instruments. The Fund's investment objective allows the Fund to enter into various types of derivative contracts, including futures contracts. Derivatives are investments whose value is primarily derived from underlying assets, indices or reference rates and may be transacted on an exchange or over-the-counter (OTC). Derivatives may involve a future commitment to buy or sell a specified asset based on specified terms, to exchange future cash flows at periodic intervals based on a notional principal amount, or for one party to make one or more payments upon the occurrence of specified events in exchange for periodic payments from the other party.
The Fund used derivatives to increase returns and to manage exposure to certain risks as defined below. The success of any strategy involving derivatives depends on analysis of numerous economic factors, and if the strategies for investment do not work as intended, the Fund may not achieve its objectives.
The Fund's use of derivatives increased or decreased its exposure to the following risk:
Equity Risk | Equity risk relates to the fluctuations in the value of financial instruments as a result of changes in market prices (other than those arising from interest rate risk or foreign exchange risk), whether caused by factors specific to an individual investment, its issuer, or all factors affecting all instruments traded in a market or market segment. |
The Fund is also exposed to additional risks from investing in derivatives, such as liquidity risk and counterparty credit risk. Liquidity risk is the risk that the Fund will be unable to close out the derivative in the open market in a timely manner. Counterparty credit risk is the risk that the counterparty will not be able to fulfill its obligation to the Fund. Counterparty credit risk related to exchange-traded futures contracts may be mitigated by the protection provided by the exchange on which they trade.
Investing in derivatives may involve greater risks than investing in the underlying assets directly and, to varying degrees, may involve risk of loss in excess of any initial investment and collateral received and amounts recognized in the Statement of Assets and Liabilities. In addition, there may be the risk that the change in value of the derivative contract does not correspond to the change in value of the underlying instrument.
Futures Contracts. A futures contract is an agreement between two parties to buy or sell a specified underlying instrument for a fixed price at a specified future date. The Fund used futures contracts to manage its exposure to the stock market.
Upon entering into a futures contract, a fund is required to deposit either cash or securities (initial margin) with a clearing broker in an amount equal to a certain percentage of the face value of the contract. Futures contracts are marked-to-market daily and subsequent daily payments (variation margin) are made or received by a fund depending on
Annual Report
Notes to Financial Statements - continued
(Amounts in thousands except percentages)
4. Derivative Instruments - continued
Futures Contracts - continued
the daily fluctuations in the value of the futures contracts and are recorded as unrealized appreciation or (depreciation). This receivable and/or payable, if any, is included in daily variation margin for derivative instruments in the Statement of Assets and Liabilities. Realized gain or (loss) is recorded upon the expiration or closing of a futures contract.
Any open futures contracts at period end are presented in the Schedule of Investments under the caption "Futures Contracts." The underlying face amount at value reflects each contract's exposure to the underlying instrument or index at period end. Securities deposited to meet initial margin requirements are identified in the Schedule of Investments
During the period the Fund recognized net realized gain (loss) of $550 and a change in net unrealized appreciation (depreciation) of $(491) related to its investment in futures contracts. This amount is included in the Statement of Operations.
5. Purchases and Sales of Investments.
Purchases and sales of securities, other than short-term securities, aggregated $792,312 and $925,506, respectively.
6. Fees and Other Transactions with Affiliates.
Management Fee. Fidelity Management & Research Company (the investment adviser) and its affiliates provide the Fund with investment management related services for which the Fund pays a monthly management fee. The management fee is the sum of an individual fund fee rate that is based on an annual rate of .424% of the Fund's average net assets and an annualized group fee rate that averaged .25% during the period. Prior to August 1, 2014 the individual fund fee rate was .45%. The group fee rate is based upon the average net assets of all the mutual funds advised by the investment adviser, including any mutual funds previously advised by the investment adviser that are currently advised by Fidelity SelectCo, LLC, an affiliate of the investment adviser. The group fee rate decreases as assets under management increase and increases as assets under management decrease. For the reporting period, the total annual management fee rate was .69% of the Fund's average net assets.
Distribution and Service Plan Fees. In accordance with Rule 12b-1 of the 1940 Act, the Fund has adopted separate Distribution and Service Plans for each class of shares. Certain classes pay Fidelity Distributors Corporation (FDC), an affiliate of the investment adviser, separate Distribution and Service Fees, each of which is based on an annual percentage of each class' average net assets. In addition, FDC may pay financial intermediaries for selling shares of the Fund and providing shareholder support services.
Annual Report
6. Fees and Other Transactions with Affiliates - continued
Distribution and Service Plan Fees - continued
For the period, the Distribution and Service Fee rates, total fees and amounts retained by FDC were as follows:
| Distribution
Fee | Service
Fee | Total Fees | Retained
by FDC |
Class A | -% | .25% | $ 1,866 | $ 12 |
Class T | .25% | .25% | 1,545 | 1 |
Class B | .75% | .25% | 273 | 206 |
Class C | .75% | .25% | 2,592 | 104 |
| | | $ 6,276 | $ 323 |
Sales Load. FDC may receive a front-end sales charge of up to 5.75% for selling Class A shares and 3.50% for selling Class T shares, some of which is paid to financial intermediaries for selling shares of the Fund. Depending on the holding period, FDC may receive contingent deferred sales charges levied on Class A, Class T, Class B, and Class C redemptions. The deferred sales charges range from 5.00% to 1.00% for Class B shares, 1.00% for Class C shares, 1.00% for certain purchases of Class A shares and .25% for certain purchases of Class T shares.
For the period, sales charge amounts retained by FDC were as follows:
| Retained
by FDC |
Class A | $ 92 |
Class T | 24 |
Class B* | 14 |
Class C* | 5 |
| $ 135 |
* When Class B and Class C shares are initially sold, FDC pays commissions from its own resources to financial intermediaries through which the sales are made.
Transfer Agent Fees. Fidelity Investments Institutional Operations Company, Inc., (FIIOC), an affiliate of the investment adviser FMR, is the transfer, dividend disbursing and shareholder servicing agent for each class of the Fund. FIIOC receives account fees and asset-based fees that vary according to the account size and type of account of the shareholders of the respective classes of the Fund, except for Class Z. FIIOC receives an asset-based fee of Class Z's average net assets. FIIOC pays for typesetting, printing and mailing of shareholder reports, except proxy statements.
Annual Report
Notes to Financial Statements - continued
(Amounts in thousands except percentages)
6. Fees and Other Transactions with Affiliates - continued
Transfer Agent Fees - continued
For the period, transfer agent fees for each class were as follows:
| Amount | % of
Class-Level Average
Net Assets |
Class A | $ 1,823 | .24 |
Class T | 758 | .25 |
Class B | 83 | .30 |
Class C | 613 | .24 |
Institutional Class | 1,357 | .21 |
Class Z | 4 | .05 |
| $ 4,638 | |
Accounting and Security Lending Fees. Fidelity Service Company, Inc. (FSC), an affiliate of the investment adviser, maintains the Fund's accounting records. The accounting fee is based on the level of average net assets for each month. Under a separate contract, FSC administers the security lending program. The security lending fee is based on the number and duration of lending transactions.
Brokerage Commissions. The Fund placed a portion of its portfolio transactions with brokerage firms which are affiliates of the investment adviser. Brokerage commissions are included in net realized gain (loss) and change in net unrealized appreciation (depreciation) in the Statement of Operations. The commissions paid to these affiliated firms were $3 for the period.
7. Committed Line of Credit.
The Fund participates with other funds managed by the investment adviser or an affiliate in a $4.25 billion credit facility (the "line of credit") to be utilized for temporary or emergency purposes to fund shareholder redemptions or for other short-term liquidity purposes. The Fund has agreed to pay commitment fees on its pro-rata portion of the line of credit, which amounted to $3 and is reflected in Miscellaneous expenses on the Statement of Operations. During the period, the Fund did not borrow on this line of credit.
8. Security Lending.
The Fund lends portfolio securities through a lending agent from time to time in order to earn additional income. For equity securities, a lending agent is used and may loan securities to certain qualified borrowers, including Fidelity Capital Markets (FCM), a
Annual Report
8. Security Lending - continued
broker-dealer affiliated with the Fund. On the settlement date of the loan, the Fund receives collateral (in the form of U.S. Treasury obligations, letters of credit and/or cash) against the loaned securities and maintains collateral in an amount not less than 100% of the market value of the loaned securities during the period of the loan. The market value of the loaned securities is determined at the close of business of the Fund and any additional required collateral is delivered to the Fund on the next business day. If the borrower defaults on its obligation to return the securities loaned because of insolvency or other reasons, the Fund may apply collateral received from the borrower against the obligation. The Fund may experience delays and costs in recovering the securities loaned. Any cash collateral received is invested in the Fidelity Securities Lending Cash Central Fund. The value of loaned securities and cash collateral at period end are disclosed on the Fund's Statement of Assets and Liabilities. At period end, there were no security loans outstanding with FCM. Security lending income represents the income earned on investing cash collateral, less rebates paid to borrowers and any lending agent fees associated with the loan, plus any premium payments received for lending certain types of securities. Security lending income is presented in the Statement of Operations as a component of income from Fidelity Central Funds. Total security lending income during the period amounted to $900, including $2 from securities loaned to FCM.
9. Expense Reductions.
Commissions paid to certain brokers with whom the investment adviser, or its affiliates, places trades on behalf of the Fund include an amount in addition to trade execution, which may be rebated back to the Fund to offset certain expenses. This amount totaled $27 for the period.
10. Distributions to Shareholders.
Distributions to shareholders of each class were as follows:
Years ended October 31, | 2014 | 2013 |
From net investment income | | |
Class A | $ 6,853 | $ 9,993 |
Class T | 2,251 | 3,119 |
Class B | - | 218 |
Class C | 979 | 1,491 |
Institutional Class | 7,291 | 8,774 |
Class Z | 1 | - |
Total | $ 17,375 | $ 23,595 |
Annual Report
Notes to Financial Statements - continued
(Amounts in thousands except percentages)
10. Distributions to Shareholders - continued
Years ended October 31, | 2014 | 2013 |
From net realized gain | | |
Class A | $ 6,584 | $ 2,917 |
Class T | 2,789 | 1,167 |
Class B | 307 | 229 |
Class C | 2,390 | 978 |
Institutional Class | 5,493 | 2,051 |
Class Z | 1 | - |
Total | $ 17,564 | $ 7,342 |
11. Share Transactions.
Share transactions for each class were as follows and may contain automatic conversions between classes or exchanges between funds:
| Shares | Shares | Dollars | Dollars |
Years ended October 31, | 2014 | 2013 A | 2014 | 2013 A |
Class A | | | | |
Shares sold | 4,795 | 5,624 | $ 94,751 | $ 97,285 |
Reinvestment of distributions | 646 | 758 | 12,430 | 12,002 |
Shares redeemed | (8,821) | (16,315) | (174,243) | (276,915) |
Net increase (decrease) | (3,380) | (9,933) | $ (67,062) | $ (167,628) |
Class T | | | | |
Shares sold | 1,185 | 1,308 | $ 23,252 | $ 22,307 |
Reinvestment of distributions | 249 | 255 | 4,764 | 4,007 |
Shares redeemed | (3,330) | (4,655) | (65,214) | (78,662) |
Net increase (decrease) | (1,896) | (3,092) | $ (37,198) | $ (52,348) |
Class B | | | | |
Shares sold | 29 | 17 | $ 537 | $ 283 |
Reinvestment of distributions | 15 | 26 | 278 | 396 |
Shares redeemed | (933) | (2,107) | (17,767) | (34,470) |
Net increase (decrease) | (889) | (2,064) | $ (16,952) | $ (33,791) |
Class C | | | | |
Shares sold | 874 | 787 | $ 16,572 | $ 13,034 |
Reinvestment of distributions | 149 | 129 | 2,754 | 1,968 |
Shares redeemed | (2,144) | (3,176) | (40,544) | (51,899) |
Net increase (decrease) | (1,121) | (2,260) | $ (21,218) | $ (36,897) |
Annual Report
11. Share Transactions - continued
| Shares | Shares | Dollars | Dollars |
Years ended October 31, | 2014 | 2013 A | 2014 | 2013 A |
Institutional Class | | | | |
Shares sold | 7,676 | 4,395 | $ 154,759 | $ 77,113 |
Reinvestment of distributions | 582 | 586 | 11,367 | 9,415 |
Shares redeemed | (7,810) | (7,233) | (158,739) | (126,327) |
Net increase (decrease) | 448 | (2,252) | $ 7,387 | $ (39,799) |
Class Z | | | | |
Shares sold | 1,246 | 5 | $ 26,144 | $ 100 |
Reinvestment of distributions | - | - | 2 | - |
Shares redeemed | (44) | - | (873) | - |
Net increase (decrease) | 1,202 | 5 | $ 25,273 | $ 100 |
A Share transactions for Class Z are for the period August 13, 2013 (commencement of sale of shares) to October 31, 2013.
12. Other.
The Fund's organizational documents provide former and current trustees and officers with a limited indemnification against liabilities arising in connection with the performance of their duties to the Fund. In the normal course of business, the Fund may also enter into contracts that provide general indemnifications. The Fund's maximum exposure under these arrangements is unknown as this would be dependent on future claims that may be made against the Fund. The risk of material loss from such claims is considered remote.
Annual Report
To the Trustees of Fidelity Advisor Series VIII and the Shareholders of
Fidelity Advisor Diversified International Fund:
In our opinion, the accompanying statement of assets and liabilities, including the schedule of investments, and the related statements of operations and of changes in net assets and the financial highlights present fairly, in all material respects, the financial position of Fidelity Advisor Diversified International Fund (a fund of Fidelity Advisor Series VIII) at October 31, 2014, the results of its operations for the year then ended, the changes in its net assets for each of the two years in the period then ended and the financial highlights for each of the periods indicated, in conformity with accounting principles generally accepted in the United States of America. These financial statements and financial highlights (hereafter referred to as "financial statements") are the responsibility of the Fidelity Advisor Diversified International Fund's management. Our responsibility is to express an opinion on these financial statements based on our audits. We conducted our audits of these financial statements in accordance with the standards of the Public Company Accounting Oversight Board (United States). Those standards require that we plan and perform the audit to obtain reasonable assurance about whether the financial statements are free of material misstatement. An audit includes examining, on a test basis, evidence supporting the amounts and disclosures in the financial statements, assessing the accounting principles used and significant estimates made by management, and evaluating the overall financial statement presentation. We believe that our audits, which included confirmation of securities at October 31, 2014 by correspondence with the custodian and brokers, provide a reasonable basis for our opinion.
PricewaterhouseCoopers LLP
Boston, Massachusetts
December 17, 2014
Annual Report
The Trustees, Member of the Advisory Board, and officers of the trust and fund, as applicable, are listed below. The Board of Trustees governs the fund and is responsible for protecting the interests of shareholders. The Trustees are experienced executives who meet periodically throughout the year to oversee the fund's activities, review contractual arrangements with companies that provide services to the fund, oversee management of the risks associated with such activities and contractual arrangements, and review the fund's performance. Except for James C. Curvey, each of the Trustees oversees 174 funds. Mr. Curvey oversees 407 funds.
The Trustees hold office without limit in time except that (a) any Trustee may resign; (b) any Trustee may be removed by written instrument, signed by at least two-thirds of the number of Trustees prior to such removal; (c) any Trustee who requests to be retired or who has become incapacitated by illness or injury may be retired by written instrument signed by a majority of the other Trustees; and (d) any Trustee may be removed at any special meeting of shareholders by a two-thirds vote of the outstanding voting securities of the trust. Each Trustee who is not an interested person (as defined in the 1940 Act) of the trust and the fund (Independent Trustee), shall retire not later than the last day of the calendar year in which his or her 75th birthday occurs. The Independent Trustees may waive this mandatory retirement age policy with respect to individual Trustees. The officers and Advisory Board Member hold office without limit in time, except that any officer and Advisory Board Member may resign or may be removed by a vote of a majority of the Trustees at any regular meeting or any special meeting of the Trustees. Except as indicated, each individual has held the office shown or other offices in the same company for the past five years.
Experience, Skills, Attributes, and Qualifications of the Fund's Trustees. The Governance and Nominating Committee has adopted a statement of policy that describes the experience, qualifications, attributes, and skills that are necessary and desirable for potential Independent Trustee candidates (Statement of Policy). The Board believes that each Trustee satisfied at the time he or she was initially elected or appointed a Trustee, and continues to satisfy, the standards contemplated by the Statement of Policy. The Governance and Nominating Committee also engages professional search firms to help identify potential Independent Trustee candidates who have the experience, qualifications, attributes, and skills consistent with the Statement of Policy. From time to time, additional criteria based on the composition and skills of the current Independent Trustees, as well as experience or skills that may be appropriate in light of future changes to board composition, business conditions, and regulatory or other developments, have also been considered by the professional search firms and the Governance and Nominating Committee. In addition, the Board takes into account the Trustees' commitment and participation in Board and committee meetings, as well as their leadership of standing and ad hoc committees throughout their tenure.
In determining that a particular Trustee was and continues to be qualified to serve as a Trustee, the Board has considered a variety of criteria, none of which, in isolation, was controlling. The Board believes that, collectively, the Trustees have balanced and diverse experience, qualifications, attributes, and skills, which allow the Board to operate effectively in governing the fund and protecting the interests of shareholders. Information about the specific experience, skills, attributes, and qualifications of each Trustee, which in each case led to the Board's conclusion that the Trustee should serve (or continue to serve) as a trustee of the fund, is provided below.
Annual Report
Trustees and Officers - continued
Board Structure and Oversight Function. James C. Curvey is an interested person (as defined in the 1940 Act) and currently serves as Chairman. The Trustees have determined that an interested Chairman is appropriate and benefits shareholders because an interested Chairman has a personal and professional stake in the quality and continuity of services provided to the fund. Independent Trustees exercise their informed business judgment to appoint an individual of their choosing to serve as Chairman, regardless of whether the Trustee happens to be independent or a member of management. The Independent Trustees have determined that they can act independently and effectively without having an Independent Trustee serve as Chairman and that a key structural component for assuring that they are in a position to do so is for the Independent Trustees to constitute a substantial majority for the Board. The Independent Trustees also regularly meet in executive session. Ned C. Lautenbach serves as Chairman of the Independent Trustees and as such (i) acts as a liaison between the Independent Trustees and management with respect to matters important to the Independent Trustees and (ii) with management prepares agendas for Board meetings.
Fidelity funds are overseen by different Boards of Trustees. The fund's Board oversees Fidelity's equity and high income funds and another Board oversees Fidelity's investment-grade bond, money market, and asset allocation funds. The asset allocation funds may invest in Fidelity funds overseen by the fund's Board. The use of separate Boards, each with its own committee structure, allows the Trustees of each group of Fidelity funds to focus on the unique issues of the funds they oversee, including common research, investment, and operational issues. On occasion, the separate Boards establish joint committees to address issues of overlapping consequences for the Fidelity funds overseen by each Board.
The Trustees operate using a system of committees to facilitate the timely and efficient consideration of all matters of importance to the Trustees, the fund, and fund shareholders and to facilitate compliance with legal and regulatory requirements and oversight of the fund's activities and associated risks. The Board, acting through its committees, has charged FMR and its affiliates with (i) identifying events or circumstances the occurrence of which could have demonstrably adverse effects on the fund's business and/or reputation; (ii) implementing processes and controls to lessen the possibility that such events or circumstances occur or to mitigate the effects of such events or circumstances if they do occur; and (iii) creating and maintaining a system designed to evaluate continuously business and market conditions in order to facilitate the identification and implementation processes described in (i) and (ii) above. Because the day-to-day operations and activities of the fund are carried out by or through FMR, its affiliates and other service providers, the fund's exposure to risks is mitigated but not eliminated by the processes overseen by the Trustees. While each of the Board's committees has responsibility for overseeing different aspects of the fund's activities, oversight is exercised primarily through the Operations, Audit, and Compliance Committees. In addition, the Independent Trustees have worked with FMR to enhance the Board's oversight of investment and financial risks, legal and regulatory risks, technology risks, and operational risks, including the development of additional risk reporting to the Board. For example, a working group comprised of Independent Trustees and FMR has worked and continues to work to review the Fidelity funds' valuation-related activities, reporting and risk management. Appropriate personnel, including but not limited to the fund's Chief Compliance Officer (CCO), FMR's internal auditor, the independent accountants, the fund's Treasurer and portfolio management personnel, make periodic reports to the Board's committees, as appropriate, including an annual review of FMR's risk management program for the Fidelity funds. The responsibilities of each standing committee, including their oversight responsibilities, are described further under "Standing Committees of the Fund's Trustees."
Annual Report
The fund's Statement of Additional Information (SAI) includes more information about the Trustees. To request a free copy, call Fidelity at 1-877-208-0098.
Interested Trustees*:
Correspondence intended for each Trustee who is an interested person may be sent to Fidelity Investments, 245 Summer Street, Boston, Massachusetts 02210.
Name, Year of Birth; Principal Occupations and Other Relevant Experience+ |
James C. Curvey (1935) |
Year of Election or Appointment: 2007 Trustee Chairman of the Board of Trustees |
| Mr. Curvey also serves as Trustee of other Fidelity funds. Mr. Curvey is a Director of Fidelity Research & Analysis Co. (2009-present), and Vice Chairman (2007-present) and Director of FMR LLC. In addition, Mr. Curvey serves as an Overseer for the Boston Symphony Orchestra and a member of the board of Artis-Naples, Naples, Florida, and as a Trustee for Brewster Academy, Wolfeboro, New Hampshire. Previously, Mr. Curvey served as a Director of Fidelity Investments Money Management, Inc. (2009-2014), a Director of FMR (2007-2014), and a Director of FMR Co., Inc. (2007-2014). |
Charles S. Morrison (1960) |
Year of Election or Appointment: 2014 Trustee |
| Mr. Morrison also serves as Trustee of other funds. He serves as a Director of Fidelity Investments Money Management, Inc. (FIMM) (2014-present), Director of Fidelity SelectCo, LLC (2014-present), President, Asset Management (2014-present), and is an employee of Fidelity Investments. Previously, Mr. Morrison served as Vice President of Fidelity's Fixed Income and Asset Allocation Funds (2012-2014), President, Fixed Income (2011-2014), Vice President of Fidelity's Money Market Funds (2005-2009), President, Money Market Group Leader of FMR (2009), and Senior Vice President, Money Market Group of FMR (2004-2009). Mr. Morrison also served as Vice President of Fidelity's Bond Funds (2002-2005), certain Balanced Funds (2002-2005), and certain Asset Allocation Funds (2002-2007), and as Senior Vice President (2002-2005) of Fidelity's Bond Division. |
* Trustees have been determined to be "Interested Trustees" by virtue of, among other things, their affiliation with the trust or various entities under common control with FMR.
+ The information above includes each Trustee's principal occupation during the last five years and other information relating to the experience, attributes, and skills relevant to each Trustee's qualifications to serve as a Trustee, which led to the conclusion that each Trustee should serve as a Trustee for the fund.
Annual Report
Independent Trustees:
Correspondence intended for each Independent Trustee (that is, the Trustees other than the Interested Trustees) may be sent to Fidelity Investments, P.O. Box 55235, Boston, Massachusetts 02205-5235.
Name, Year of Birth; Principal Occupations and Other Relevant Experience+ |
Dennis J. Dirks (1948) |
Year of Election or Appointment: 2005 Trustee |
| Mr. Dirks also serves as Trustee of other Fidelity funds. Prior to his retirement in May 2003, Mr. Dirks was Chief Operating Officer and a member of the Board of The Depository Trust & Clearing Corporation (DTCC). He also served as President, Chief Operating Officer, and Board member of The Depository Trust Company (DTC) and President and Board member of the National Securities Clearing Corporation (NSCC). In addition, Mr. Dirks served as Chief Executive Officer and Board member of the Government Securities Clearing Corporation, Chief Executive Officer and Board member of the Mortgage-Backed Securities Clearing Corporation, as a Trustee and a member of the Finance Committee of Manhattan College (2005-2008), and as a Trustee and a member of the Finance Committee of AHRC of Nassau County (2006-2008). Mr. Dirks is a member of the Independent Directors Council (IDC) Governing Council (2010-present) and Board of Directors for The Brookville Center for Children's Services, Inc. (2009-present). |
Alan J. Lacy (1953) |
Year of Election or Appointment: 2008 Trustee |
| Mr. Lacy also serves as Trustee of other Fidelity funds. Mr. Lacy serves as Senior Adviser (2007-present) of Oak Hill Capital Partners, L.P. (private equity). Mr. Lacy also served as Chief Executive Officer (2000-2005) and Vice Chairman (2005-2006) of Sears Holdings Corporation and Sears, Roebuck and Co. (retail). In addition, Mr. Lacy serves as a member of the Board of Directors of Dave & Buster's Entertainment, Inc. (restaurant and entertainment complexes, 2010-present), Earth Fare, Inc. (retail grocery, 2012-present), The Hillman Companies, Inc. (hardware wholesalers, 2010-present), and Bristol-Myers Squibb Company (global pharmaceuticals, 2008-present). Mr. Lacy is a member of the Board of Trustees of The National Parks Conservation Association (2006-present). Previously, Mr. Lacy served as Chairman of the Board of Trustees of the National Parks Conservation Association (2008-2011) and as a member of the Board of Directors for the Western Union Company (global money transfer, 2006-2011). |
Ned C. Lautenbach (1944) |
Year of Election or Appointment: 2000 Trustee Chairman of the Independent Trustees |
| Mr. Lautenbach also serves as Trustee of other Fidelity funds. Mr. Lautenbach currently serves as the Lead Director of the Eaton Corporation Board of Directors (diversified industrial, 1997-present). Mr. Lautenbach is Chairman of the Board of Directors of the Philharmonic Center for the Arts in Naples, Florida (2012-present) and a member of the Council on Foreign Relations (1994-present). Previously, Mr. Lautenbach was a Partner/Advisory Partner at Clayton, Dubilier & Rice, LLC (private equity investment, 1998-2010), as well as a Director of Sony Corporation (2006-2007). |
Joseph Mauriello (1944) |
Year of Election or Appointment: 2008 Trustee |
| Mr. Mauriello also serves as Trustee of other Fidelity funds. Prior to his retirement in January 2006, Mr. Mauriello served in numerous senior management positions including Deputy Chairman and Chief Operating Officer (2004-2005), and Vice Chairman of Financial Services (2002-2004) of KPMG LLP US (professional services, 1965-2005). Mr. Mauriello currently serves as a member of the Board of Directors of XL Group plc. (global insurance and re-insurance, 2006-present). Previously, Mr. Mauriello served as a Director of the Hamilton Funds of the Bank of New York (2006-2007) and of Arcadia Resources Inc. (health care services and products, 2007-2012). |
Robert W. Selander (1950) |
Year of Election or Appointment: 2011 Trustee |
| Mr. Selander also serves as Trustee of other Fidelity funds. Previously, Mr. Selander served as a Member of the Advisory Board of other Fidelity funds (2011), and Executive Vice Chairman (2010), Chief Executive Officer (2009-2010), and President and Chief Executive Officer (1997-2009) of Mastercard, Inc. |
Cornelia M. Small (1944) |
Year of Election or Appointment: 2005 Trustee |
| Ms. Small also serves as Trustee of other Fidelity funds. Ms. Small is a member of the Board of Directors (2009-present) and Chair of the Investment Committee (2010-present) of the Teagle Foundation. Ms. Small also serves on the Investment Committee of the Berkshire Taconic Community Foundation (2008-present). Previously, Ms. Small served as Chairperson (2002-2008) and a member of the Investment Committee and Chairperson (2008-2012) and a member of the Board of Trustees of Smith College. In addition, Ms. Small served as Chief Investment Officer, Director of Global Equity Investments, and a member of the Board of Directors of Scudder, Stevens & Clark and Scudder Kemper Investments. |
William S. Stavropoulos (1939) |
Year of Election or Appointment: 2001 Trustee Vice Chairman of the Independent Trustees |
| Mr. Stavropoulos also serves as Trustee of other Fidelity funds. Mr. Stavropoulos serves as President and Founder of the Michigan Baseball Foundation, the Great Lakes Loons (2007-present). Mr. Stavropoulos is Chairman Emeritus of the Board of Directors of The Dow Chemical Company, where he previously served in numerous senior management positions, including President, CEO (1995-2000; 2002-2004), Chairman of the Executive Committee (2000-2006), and as a member of the Board of Directors (1990-2006). Currently, Mr. Stavropoulos is Chairman of the Board of Directors of Univar Inc. (global distributor of commodity and specialty chemicals), a Director of Teradata Corporation (data warehousing and technology solutions), and Maersk Inc. (industrial conglomerate), and a member of the Advisory Board for Metalmark Capital LLC (private equity investment, 2005-present). Mr. Stavropoulos is an operating advisor to Clayton, Dubilier & Rice, LLC (private equity investment). In addition, Mr. Stavropoulos is a member of the University of Notre Dame Advisory Council for the College of Science, a Trustee of the Rollin L. Gerstacker Foundation, and a Director of the Naples Philharmonic Center for the Arts. Previously, Mr. Stavropoulos served as a Director of Chemical Financial Corporation (bank holding company, 1993-2012) and Tyco International, Ltd. (multinational manufacturing and services, 2007-2012). |
David M. Thomas (1949) |
Year of Election or Appointment: 2008 Trustee |
| Mr. Thomas also serves as Trustee of other Fidelity funds. Mr. Thomas serves as Non-Executive Chairman of the Board of Directors of Fortune Brands Home and Security (home and security products, 2011-present), and as a member of the Board of Directors of Interpublic Group of Companies, Inc. (marketing communication, 2004-present). Previously, Mr. Thomas served as Executive Chairman (2005-2006) and Chairman and Chief Executive Officer (2000-2005) of IMS Health, Inc. (pharmaceutical and healthcare information solutions), and a Director of Fortune Brands, Inc. (consumer products, 2000-2011). |
+ The information above includes each Trustee's principal occupation during the last five years and other information relating to the experience, attributes, and skills relevant to each Trustee's qualifications to serve as a Trustee, which led to the conclusion that each Trustee should serve as a Trustee for the fund.
Advisory Board Member and Officers:
Correspondence intended for each officer and Peter S. Lynch may be sent to Fidelity Investments, 245 Summer Street, Boston, Massachusetts 02210. Officers appear below in alphabetical order.
Name, Year of Birth; Principal Occupation |
Peter S. Lynch (1944) |
Year of Election or Appointment: 2003 Member of the Advisory Board |
| Mr. Lynch also serves as Member of the Advisory Board of other Fidelity funds. Mr. Lynch is Vice Chairman and a Director of FMR and FMR Co., Inc. In addition, Mr. Lynch serves as a Trustee of Boston College and as the Chairman of the Inner-City Scholarship Fund. Previously, Mr. Lynch served on the Special Olympics International Board of Directors (1997-2006). |
Elizabeth Paige Baumann (1968) |
Year of Election or Appointment: 2012 Anti-Money Laundering (AML) Officer |
| Ms. Baumann also serves as AML Officer of other funds. She is Chief AML Officer of FMR LLC (2012-present) and is an employee of Fidelity Investments. Previously, Ms. Baumann served as Vice President and Deputy Anti-Money Laundering Officer (2007-2012). |
William C. Coffey (1969) |
Year of Election or Appointment: 2009 Assistant Secretary |
| Mr. Coffey also serves as Assistant Secretary of other funds. He is Senior Vice President and Deputy General Counsel of FMR LLC (2010-present), and is an employee of Fidelity Investments. Previously, Mr. Coffey served as Vice President and Associate General Counsel of FMR LLC (2005-2009). |
Timothy M. Cohen (1969) |
Year of Election or Appointment: 2014 Vice President of certain Equity Funds |
| Mr. Cohen also serves as Vice President of other funds. Mr. Cohen serves as a Director and Chief Compliance Officer of Fidelity Management & Research (U.K.) Inc. (2013-present) and is an employee of Fidelity Investments. |
Jonathan Davis (1968) |
Year of Election or Appointment: 2010 Assistant Treasurer |
| Mr. Davis also serves as Assistant Treasurer of other funds. Mr. Davis is an employee of Fidelity Investments. Previously, Mr. Davis served as Vice President and Associate General Counsel of FMR LLC (2003-2010). |
Adrien E. Deberghes (1967) |
Year of Election or Appointment: 2008 Deputy Treasurer |
| Mr. Deberghes also serves as an officer of other funds. He is an employee of Fidelity Investments (2008-present). Prior to joining Fidelity Investments, Mr. Deberghes was Senior Vice President of Mutual Fund Administration at State Street Corporation (2007-2008), Senior Director of Mutual Fund Administration at Investors Bank & Trust (2005-2007), and Director of Finance for Dunkin' Brands (2000-2005). |
Stephanie J. Dorsey (1969) |
Year of Election or Appointment: 2010 Assistant Treasurer |
| Ms. Dorsey also serves as an officer of other funds. She is an employee of Fidelity Investments (2008-present) and has served in other fund officer roles. Prior to joining Fidelity Investments, Ms. Dorsey served as Treasurer (2004-2008) of the JPMorgan Mutual Funds and Vice President (2004-2008) of JPMorgan Chase Bank. |
Howard J. Galligan III (1966) |
Year of Election or Appointment: 2014 Chief Financial Officer |
| Mr. Galligan also serves as Chief Financial Officer of other funds. Mr. Galligan serves as President of Fidelity Pricing and Cash Management Services (FPCMS) (2014-present) and as a Director of Strategic Advisers, Inc. (2008-present). Previously, Mr. Galligan served as Chief Administrative Officer of Asset Management (2011-2014) and Chief Operating Officer and Senior Vice President of Investment Support for Strategic Advisers, Inc. (2003-2011). |
Scott C. Goebel (1968) |
Year of Election or Appointment: 2008 Secretary and Chief Legal Officer (CLO) |
| Mr. Goebel serves as Secretary and CLO of other funds. Mr. Goebel also serves as Secretary of Fidelity SelectCo, LLC (2013-present), Fidelity Investments Money Management, Inc. (FIMM) (2010-present) and Fidelity Research and Analysis Company (FRAC) (2010-present); General Counsel, Secretary, and Senior Vice President of FMR (2008-present) and FMR Co., Inc. (2008-present); Chief Legal Officer of Fidelity Management & Research (Hong Kong) Limited (2008-present); and Assistant Secretary of Fidelity Management & Research (Japan) Limited (2008-present) and Fidelity Management & Research (U.K.) Inc. (2008-present). Previously, Mr. Goebel served as Secretary and CLO of other Fidelity funds (2008-2013), Assistant Secretary of FIMM (2008-2010), FRAC (2008-2010), and certain funds (2007-2008); and as Vice President and Secretary of Fidelity Distributors Corporation (FDC) (2005-2007). Mr. Goebel has been employed by FMR LLC or an affiliate since 2001. |
Brian B. Hogan (1964) |
Year of Election or Appointment: 2009 Vice President |
| Mr. Hogan also serves as Trustee or Vice President of other funds. Mr. Hogan serves as a Director of Fidelity SelectCo, LLC (2014-present) and President of FMR's Equity Division (2009-present). Previously, Mr. Hogan served as Senior Vice President, Equity Research of FMR (2006-2009) and as a portfolio manager. |
Chris Maher (1972) |
Year of Election or Appointment: 2013 Assistant Treasurer |
| Mr. Maher serves as Assistant Treasurer of other funds. Mr. Maher is Vice President of Valuation Oversight and is an employee of Fidelity Investments. Previously, Mr. Maher served as Vice President of Asset Management Compliance (2013), Vice President of FMR's Program Management Group (2010-2013), and Vice President of Valuation Oversight (2008-2010). |
Kenneth B. Robins (1969) |
Year of Election or Appointment: 2008 President and Treasurer |
| Mr. Robins also serves as an officer of other funds. Mr. Robins serves as Executive Vice President of Fidelity Investments Money Management, Inc. (FIMM) (2013-present) and is an employee of Fidelity Investments (2004-present). Previously, Mr. Robins served in other fund officer roles. |
Stephen Sadoski (1971) |
Year of Election or Appointment: 2012 Deputy Treasurer |
| Mr. Sadoski also serves as Deputy Treasurer of other funds. He is an employee of Fidelity Investments (2012-present) and has served in another fund officer role. Prior to joining Fidelity Investments, Mr. Sadoski served as an assistant chief accountant in the Division of Investment Management of the Securities and Exchange Commission (SEC) (2009-2012) and as a senior manager at Deloitte & Touche LLP (1997-2009). |
Stacie M. Smith (1974) |
Year of Election or Appointment: 2013 Deputy Treasurer |
| Ms. Smith also serves as an officer of other funds. She is an employee of Fidelity Investments (2009-present) and has served in other fund officer roles. Prior to joining Fidelity Investments, Ms. Smith served as Senior Audit Manager of Ernst & Young LLP (1996-2009). |
Renee Stagnone (1975) |
Year of Election or Appointment: 2013 Deputy Treasurer |
| Ms. Stagnone also serves as Deputy Treasurer of other funds. Ms. Stagnone is an employee of Fidelity Investments. |
Linda J. Wondrack (1964) |
Year of Election or Appointment: 2014 Chief Compliance Officer |
| Ms. Wondrack also serves as Chief Compliance Officer of other funds. Ms. Wondrack is Executive Vice President and head of the Ethics Office and Asset Management Compliance for Fidelity Investments (2012-present). Ms. Wondrack also serves as Chief Compliance Officer of Fidelity SelectCo, LLC (2014-present); Chief Compliance Officer of Impresa Management LLC (2013-present); and Chief Compliance Officer of FMR Co., Inc., Fidelity Investments Money Management, Inc., Fidelity Management & Research (Japan) Limited, Fidelity Management & Research (U.K.) Inc., Fidelity Management & Research (Hong Kong), Fidelity Management & Research Company, Pyramis Global Advisors, LLC, and Strategic Advisers, Inc., Ballyrock Investment Advisors LLC, and Northern Neck Investors LLC (2012-present). Previously, Ms. Wondrack served as Senior Vice President and Chief Compliance Officer for Columbia Management Investment Advisers, LLC (2005-2012); Chief Compliance Officer for certain funds within the Columbia Family of Funds (2007-2012); and Senior Vice President of Compliance Risk Management at Bank of America (2005-2010). |
Joseph F. Zambello (1957) |
Year of Election or Appointment: 2011 Deputy Treasurer |
| Mr. Zambello also serves as Deputy Treasurer of other funds. Mr. Zambello is an employee of Fidelity Investments. Previously, Mr. Zambello served as Vice President of FMR's Program Management Group (2009-2011) and Vice President of the Transfer Agent Oversight Group (2005-2009). |
Annual Report
Class Z designates 3% of the dividend distributed during the fiscal year as qualifying for the dividends-received deduction for corporate shareholders.
Class Z designates 68% of the dividends distributed during the fiscal year as amounts which may be taken into account as a dividend for purposes of the maximum rate under section 1(h)(11) of the Internal Revenue Code.
The amounts per share which represent income derived from sources within, and taxes paid to, foreign countries or possessions of the United States are as follows:
| Pay Date | Income | Taxes |
Class Z | 12/09/13 | $0.2975 | $0.0163 |
The fund will notify shareholders in January 2015 of amounts for use in preparing 2014 income tax returns.
Annual Report
Board Approval of Investment Advisory Contracts and Management Fees
Fidelity Advisor Diversified International Fund
Each year, the Board of Trustees, including the Independent Trustees (together, the Board), votes on the renewal of the management contract with Fidelity Management & Research Company (FMR) and the sub-advisory agreements (together, the Advisory Contracts) for the fund. The Board, assisted by the advice of fund counsel and Independent Trustees' counsel, requests and considers a broad range of information relevant to the renewal of the Advisory Contracts throughout the year.
The Board meets regularly and, at each of its meetings, covers an extensive agenda of topics and materials and considers factors that are relevant to its annual consideration of the renewal of the fund's Advisory Contracts, including the services and support provided to the fund and its shareholders. The Board has established various standing committees (Committees), each composed of and chaired by Independent Trustees with varying backgrounds, to which the Board has assigned specific subject matter responsibilities in order to enhance effective decision-making by the Board. The Board, acting directly and through its Committees, requests and receives information concerning the annual consideration of the renewal of the fund's Advisory Contracts. The Board also meets as needed to consider matters specifically related to the Board's annual consideration of the renewal of the Advisory Contracts. Members of the Board may also meet with trustees of other Fidelity funds through ad hoc joint committees to discuss certain matters relevant to the Fidelity funds.
At its July 2014 meeting, the Board, including the Independent Trustees, unanimously determined to renew the fund's Advisory Contracts. In reaching its determination, the Board considered all factors it believed relevant, including (i) the nature, extent, and quality of the services to be provided to the fund and its shareholders (including the investment performance of the fund); (ii) the competitiveness of the fund's management fee and total expense ratio relative to peer funds; (iii) the total costs of the services to be provided by and the profits to be realized by Fidelity from its relationship with the fund; (iv) the extent to which economies of scale exist and would be realized as the fund grows; and (v) whether fee levels reflect these economies of scale, if any, for the benefit of fund shareholders. In connection with separate internal corporate reorganizations involving Fidelity Management & Research (U.K.) Inc. (FMR U.K.) and Fidelity Management & Research (Japan) Inc. (FMR Japan), the Board approved certain non-material amendments to the fund's sub-advisory agreements with FMR U.K. and FMR Japan to reflect that, after these reorganizations, FMR Investment Management (UK) Limited and Fidelity Management & Research (Japan) Limited will carry on the business of FMR U.K. and FMR Japan, respectively. The Board noted that no changes to the portfolio managers or to the foreign research or investment advisory services provided to the fund were expected in connection with either reorganization and that the same personnel and resources would continue to be available to the fund at the new entities.
Annual Report
In considering whether to renew the Advisory Contracts for the fund, the Board reached a determination, with the assistance of fund counsel and Independent Trustees' counsel and through the exercise of its business judgment, that the renewal of the Advisory Contracts was in the best interests of the fund and its shareholders and that the compensation payable under the Advisory Contracts was fair and reasonable. The Board's decision to renew the Advisory Contracts was not based on any single factor, but rather was based on a comprehensive consideration of all the information provided to the Board at its meetings throughout the year. The Board, in reaching its determination to renew the Advisory Contracts, was aware that shareholders of the fund have a broad range of investment choices available to them, including a wide choice among funds offered by Fidelity's competitors, and that the fund's shareholders, who have the opportunity to review and weigh the disclosure provided by the fund in its prospectus and other public disclosures, have chosen to invest in this fund, which is part of the Fidelity family of funds.
Nature, Extent, and Quality of Services Provided. The Board considered Fidelity's staffing as it relates to the fund, including the backgrounds of investment personnel of FMR and the sub-advisers (together, the Investment Advisers), and also considered the fund's investment objective, strategies, and related investment philosophy. The Independent Trustees also had discussions with senior management of Fidelity's investment operations and investment groups. The Board considered the structure of the portfolio manager compensation program and whether this structure provides appropriate incentives to act in the best interests of the fund. Additionally, the Board considered the portfolio managers' investments, if any, in the funds that they manage.
Resources Dedicated to Investment Management and Support Services. The Board and the Fund Oversight and Research Committees reviewed the general qualifications and capabilities of Fidelity's investment staff, including its size, education, experience,
and resources, as well as Fidelity's approach to recruiting, training, managing, and compensating investment personnel. The Board noted that Fidelity has continued to increase the resources devoted to non-U.S. offices, including expansion of Fidelity's global investment organization. The Board also noted that Fidelity's analysts have extensive resources, tools and capabilities that allow them to conduct sophisticated quantitative and fundamental analysis, as well as credit analysis of issuers, counterparties and guarantors. Further, the Board believes that Fidelity's investment professionals have sufficient access to global information and data so as to provide competitive investment results over time, and that those professionals also have access to sophisticated tools that permit them to assess portfolio construction and risk and performance attribution characteristics continuously, as well as to transmit new information and research conclusions rapidly around the world. Additionally, in its deliberations, the Board considered Fidelity's trading and risk management capabilities and resources and global compliance infrastructure, which are an integral part of the investment management process.
Annual Report
Board Approval of Investment Advisory Contracts and
Management Fees - continued
Shareholder and Administrative Services. The Board considered (i) the nature, extent, quality, and cost of advisory, administrative, and shareholder services performed by the Investment Advisers and their affiliates under the Advisory Contracts and under separate agreements covering transfer agency, pricing and bookkeeping, and securities lending services for the fund; (ii) the nature and extent of the supervision of third party service providers, principally custodians and subcustodians; and (iii) the resources devoted to, and the record of compliance with, the fund's compliance policies and procedures. The Board also reviewed the allocation of fund brokerage, including allocations to brokers affiliated with the Investment Advisers, the use of brokerage commissions to pay fund expenses, and the use of "soft" commission dollars to pay for research services.
The Board noted that the growth of fund assets over time across the complex allows Fidelity to reinvest in the development of services designed to enhance the value or convenience of the Fidelity funds as investment vehicles. These services include 24-hour access to account information and market information through telephone representatives and over the Internet, investor education materials and asset allocation tools, and the expanded availability of Fidelity Investor Centers.
In 2014, the Board formed an ad hoc Committee on Transfer Agency Fees to review the variety of transfer agency fee structures throughout the industry and Fidelity's competitive positioning with respect to industry participants.
Investment in a Large Fund Family. The Board considered the benefits to shareholders of investing in a Fidelity fund, including the benefits of investing in a fund that is part of a large family of funds offering a variety of investment disciplines and providing a large variety of mutual fund investor services. The Board noted that Fidelity had taken, or had made recommendations that resulted in the Fidelity funds taking, a number of actions over the previous year that benefited particular funds, including (i) continuing to dedicate additional resources to investment research and to the support of the senior management team that oversees asset management; (ii) persisting in efforts to enhance Fidelity's global research capabilities; (iii) launching new funds and making other enhancements to meet client needs for income-oriented solutions; (iv) reducing fund expenses for certain index funds; (v) continuing to launch dedicated lower cost underlying funds to meet portfolio construction needs related to expanding underlying fund options for Fidelity funds of funds, specifically for the Freedom Fund product lines; (vi) rationalizing product lines and gaining increased efficiencies through fund mergers; (vii) launching sector-based exchange-traded funds and establishing a new Fidelity adviser to manage sector-based funds and products; (viii) continuing to develop and implement technology to improve security and increase efficiency; (ix) modifying the eligibility criteria for certain share classes to increase their marketability to a portion of the defined contribution plan market; (x) waiving redemption fees for certain qualified fund-of-fund and wrap programs and certain retirement plan transactions; and (xi) launching new Institutional Class shares of certain money market funds to attract and retain assets and to fill a gap in the money market fund lineup.
Annual Report
Investment Performance. The Board considered whether the fund has operated in accordance with its investment objective, as well as its record of compliance with its investment restrictions and its performance history. The Board noted that there was a portfolio management change for the fund in January 2014.
The Board took into account discussions with the Investment Advisers about fund investment performance that occur at Board meetings throughout the year. In this regard the Board noted that as part of regularly scheduled fund reviews and other reports to the Board on fund performance, the Board periodically considers annualized return information for the fund, for different time periods, measured against a securities market index ("benchmark index") and a peer group of funds with similar objectives ("peer group"). In its evaluation of fund investment performance, the Board gave particular attention to information indicating changes in performance of certain Fidelity funds for specific time periods and the Investment Advisers' explanations for any overperformance or underperformance.
In addition to reviewing absolute and relative fund performance, the Independent Trustees periodically consider the appropriateness of fund performance metrics in evaluating the results achieved. In general, the Independent Trustees believe that fund performance should be evaluated based on net performance (after fees and expenses) of both the highest performing and lowest performing classes, where applicable, compared to appropriate benchmark indices, over appropriate time periods which may include full market cycles, and compared to peer groups, as applicable, over the same periods, taking into account relevant factors including the following: general market conditions; issuer-specific information; tactical opportunities for investment; and fund cash flows and other factors.
The Independent Trustees recognize that shareholders evaluate performance on a net basis over their own holding periods, for which one-, three-, and five-year periods are often used as a proxy. For this reason, the performance information reviewed by the Board also included net cumulative calendar year total return information for the fund and an appropriate benchmark index and peer group for the most recent one-, three-, and five-year periods, as shown below. Returns are shown compared to the 25th percentile (top of box, 75% beaten) and 75th percentile (bottom of box, 25% beaten) of the peer universe. Returns of the benchmark index are "net MA," i.e., adjusted for tax withholding rates applicable to U.S.-based funds organized as Massachusetts business trusts.
Annual Report
Board Approval of Investment Advisory Contracts and
Management Fees - continued
Fidelity Advisor Diversified International Fund
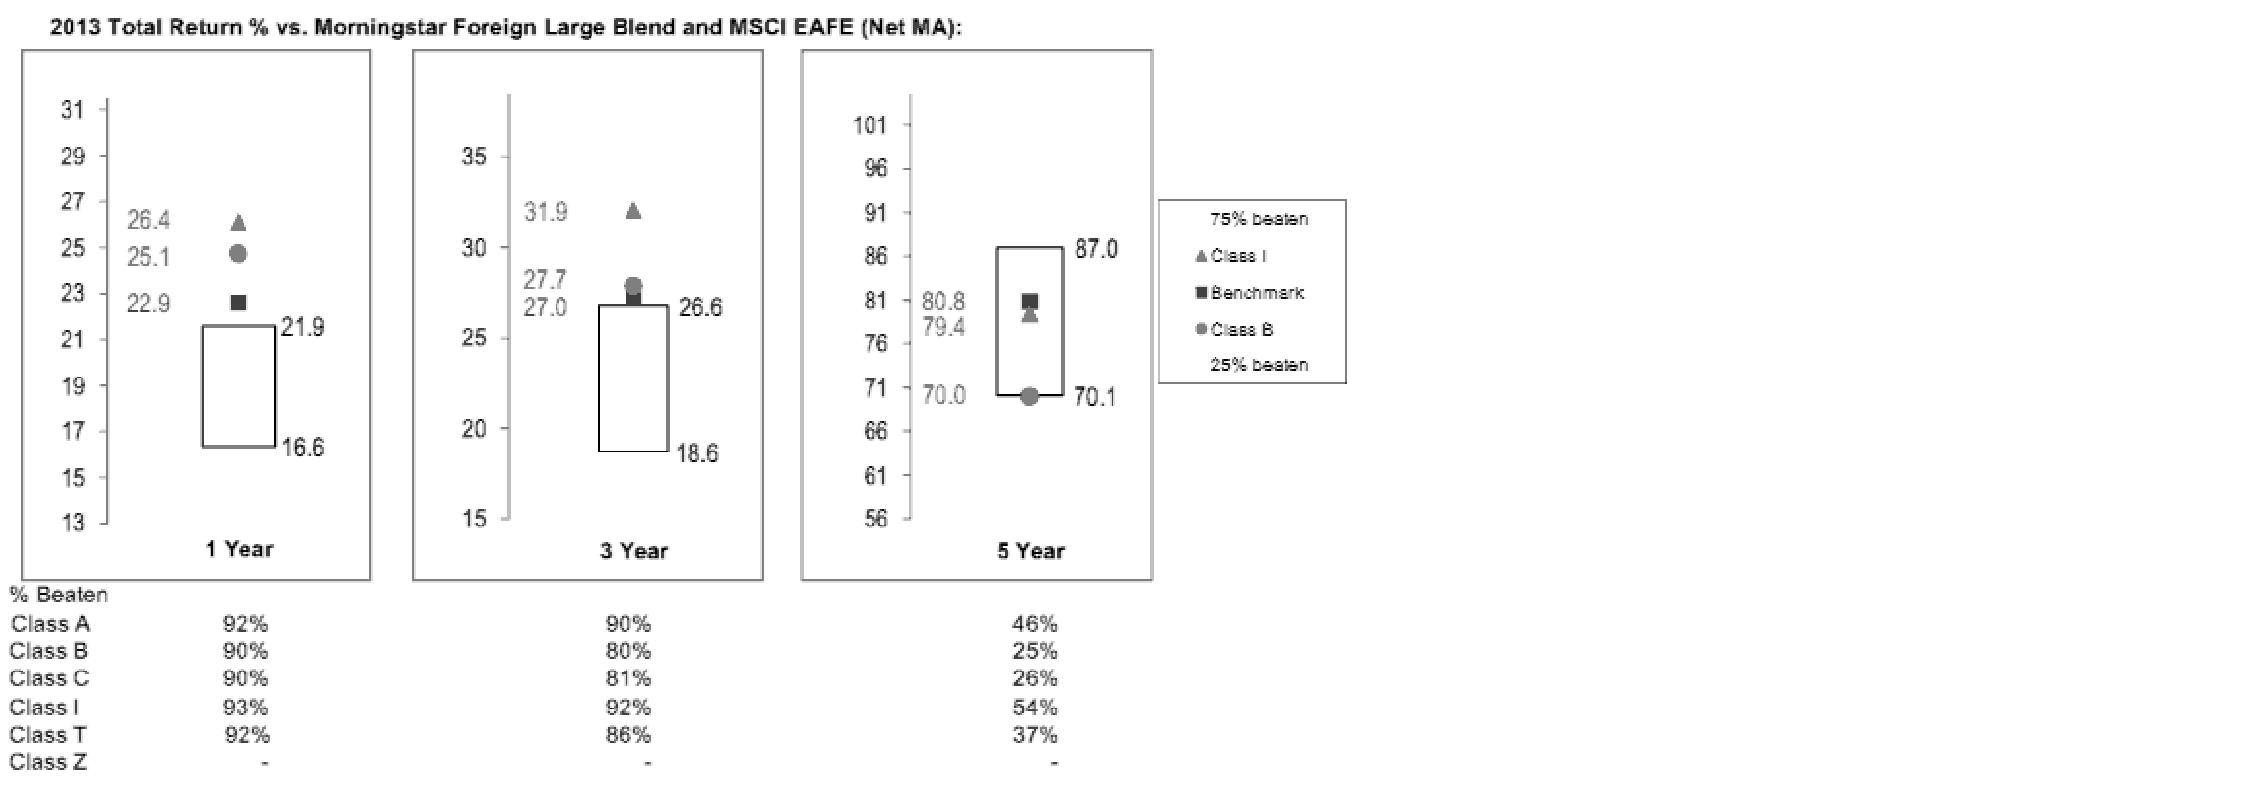
Based on its review, the Board concluded that the nature, extent, and quality of services provided to the fund under the Advisory Contracts should benefit the fund's shareholders.
Competitiveness of Management Fee and Total Expense Ratio. The Board considered the fund's management fee and total expense ratio compared to "mapped groups" of competitive funds and classes. Fidelity creates "mapped groups" by combining similar Lipper investment objective categories that have comparable investment mandates. Combining Lipper investment objective categories aids the Board's management fee and total expense ratio comparisons by broadening the competitive group used for comparison and by reducing the number of universes to which various Fidelity funds are compared.
Management Fee. The Board considered two proprietary management fee comparisons for the 12-month periods shown in the chart below. The group of Lipper funds used by the Board for management fee comparisons is referred to below as the "Total Mapped Group." The Total Mapped Group comparison focuses on a fund's standing in terms of gross management fees before expense reimbursements or caps relative to the total universe of funds with comparable investment mandates, regardless of whether their management fee structures also are comparable. Funds with comparable investment mandates offer exposure to similar types of securities. Funds with comparable management fee structures have similar management fee contractual arrangements (e.g., flat rate charged for advisory services, all-inclusive fee rate, etc.). "TMG %" represents the percentage of funds in the Total Mapped Group that had management fees that were lower than the fund's. For example, a hypothetical TMG % of 20% would mean that 80% of the funds in the Total Mapped Group had higher, and 20% had lower, management fees than the fund. The fund's actual TMG %s are in the chart below. The "Asset-Size Peer Group" (ASPG) comparison focuses on a fund's standing relative to a subset of non-Fidelity funds within the Total Mapped Group that are similar in size and management fee structure. For example, if a fund is in the first quartile of the ASPG, the fund's management fee ranks in the least expensive or lowest 25% of funds in the ASPG. The ASPG represents at least 15% of the funds in the Total Mapped Group with comparable asset size and management fee structures, subject to a minimum of 50 funds (or all funds in the Total Mapped Group if fewer than 50). Additional information, such as the ASPG quartile in which the fund's management fee rate ranked, is also included in the chart and considered by the Board.
Annual Report
Fidelity Advisor Diversified International Fund
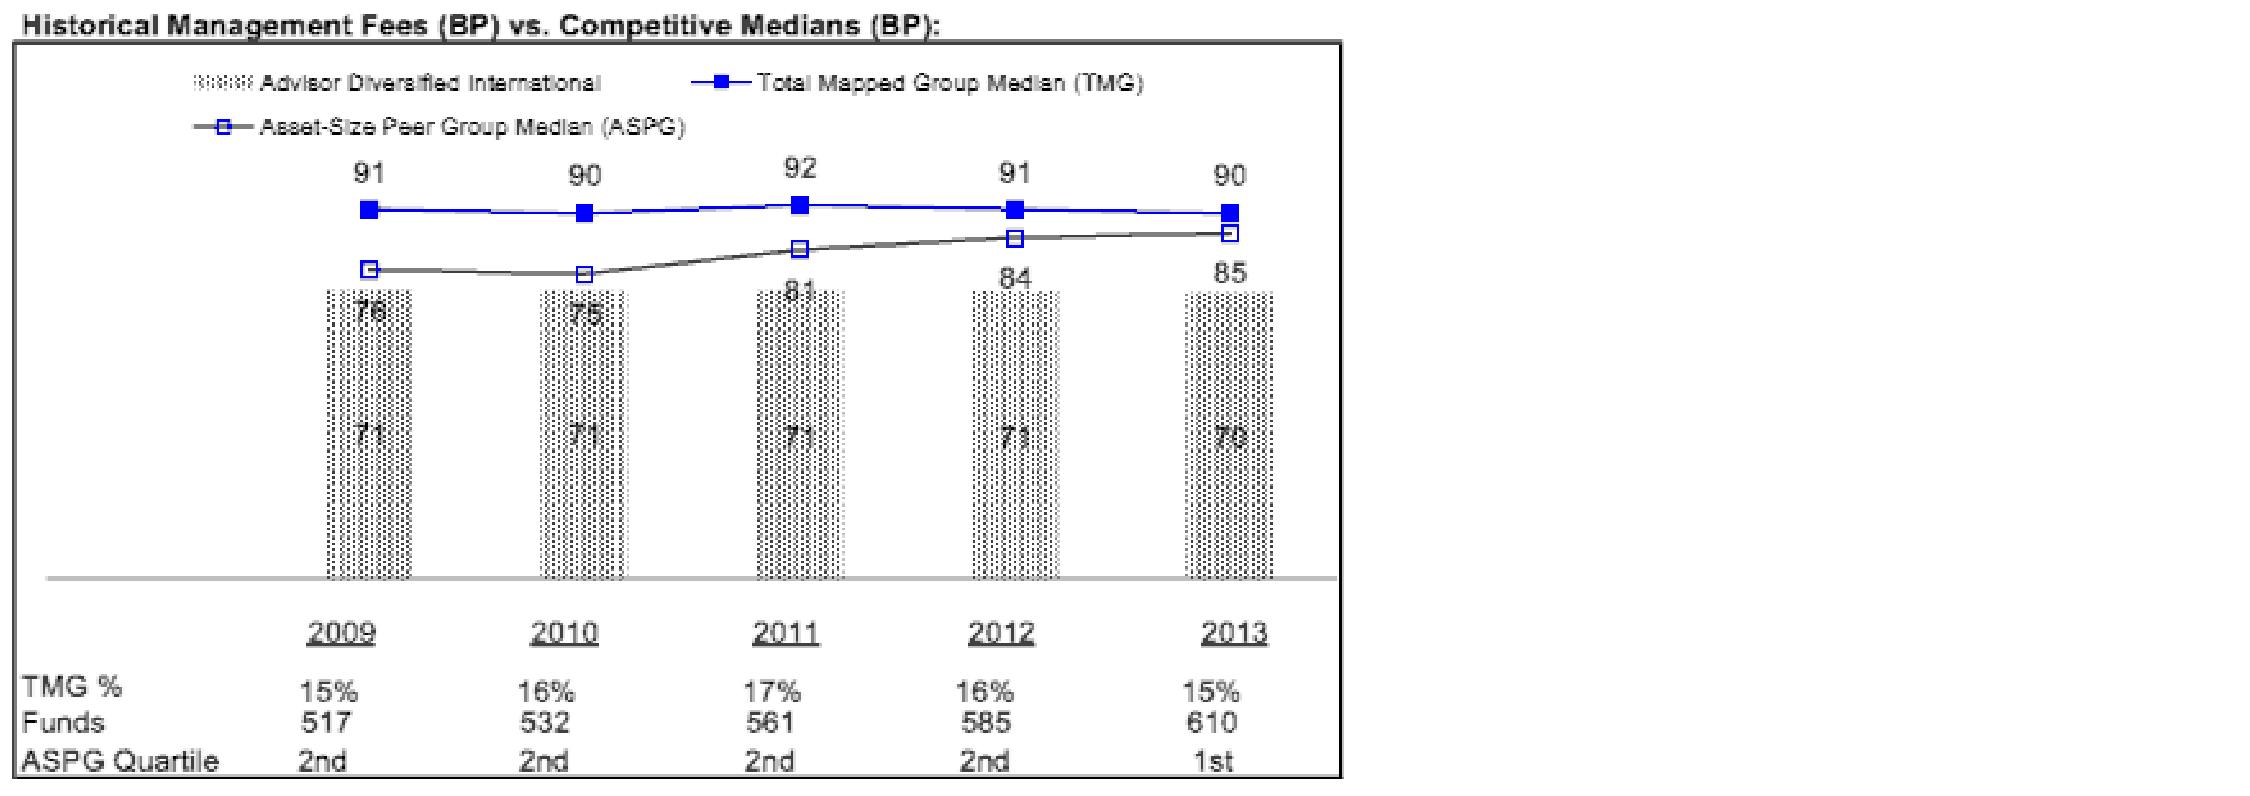
The Board noted that the fund's management fee rate ranked below the median of its Total Mapped Group and below the median of its ASPG for 2013.
Furthermore, the Board considered that, on July 16, 2014, after the periods shown in the chart above, it had approved a reduction (effective August 1, 2014) in the individual fund fee rate component of the management fee rate for the fund from 0.450% to 0.424%.
The Board also noted that, in August 2013, the ad hoc Committee on Management Fees was formed to conduct an in-depth review of the management fee rates of Fidelity's active equity mutual funds. The Committee focused on the following areas: (i) standard fee structures; (ii) research consumption and trading evolution; (iii) management fee competitiveness/profitability by category; and (iv) factors that drive institutional pricing.
Annual Report
Board Approval of Investment Advisory Contracts and
Management Fees - continued
Based on its review, the Board concluded that the fund's management fee is fair and reasonable in light of the services that the fund receives and the other factors considered.
Total Expense Ratio. In its review of each class's total expense ratio, the Board considered the fund's management fee as well as other fund or class expenses, as applicable, such as transfer agent fees, pricing and bookkeeping fees, fund-paid 12b-1 fees, and custodial, legal, and audit fees. The Board also noted the effects of any waivers and reimbursements on fees and expenses. As part of its review, the Board also considered the current and historical total expense ratios of each class of the fund compared to competitive fund median expenses. Each class of the fund is compared to those funds and classes in the Total Mapped Group (used by the Board for management fee comparisons) that have a similar sales load structure.
The Board noted that the total expense ratio of each of Class A, Class B, Class C, Institutional Class, and Class Z ranked below its competitive median for 2013 and the total expense ratio of Class T ranked above its competitive median for 2013. The Board considered that, in general, various factors can affect total expense ratios. The Board noted that the total expense ratio of Class T was above the competitive median primarily because of higher 12b-1 fees on Class T as compared to most competitor funds. Class T has a higher 12b-1 fee, but a lower front-end sales charge, than traditionally priced front-end sales charge classes. The Board considered that Class T is primarily sold load-waived in the retirement plan market where its 0.50% 12b-1 fee is comparable to competing no-load, higher 12b-1 fee classes designed specifically for retirement plans. The Board noted that the fund offers multiple classes, each of which has a different sales load and 12b-1 fee structure, and that the multiple structures are intended to offer a range of pricing options for the intermediary market. The Board also noted that the total expense ratios of the classes vary primarily by the level of their 12b-1 fees, although differences in transfer agent fees may also cause expenses to vary from class to class.
Fees Charged to Other Fidelity Clients. The Board also considered Fidelity fee structures and other information with respect to clients of Fidelity, such as other funds advised or subadvised by Fidelity, pension plan clients, and other institutional clients. The Board noted the findings of the 2013 ad hoc joint committee (created with the board of other Fidelity funds), which reviewed and compared Fidelity's institutional investment advisory business with its business of providing services to the Fidelity funds, including the differences in services provided, fees charged, and costs incurred, as well as competition in their respective marketplaces.
Based on its review of total expense ratios and fees charged to other Fidelity clients, the Board concluded that the total expense ratio of each class of the fund was reasonable, although Class T was above the median of the universe presented for comparison, in light of the services that the fund and its shareholders receive and the other factors considered.
Annual Report
Costs of the Services and Profitability. The Board considered the revenues earned and the expenses incurred by Fidelity in conducting the business of developing, marketing, distributing, managing, administering and servicing the fund and servicing the fund's shareholders. The Board also considered the level of Fidelity's profits in respect of all the Fidelity funds.
On an annual basis, Fidelity presents to the Board Fidelity's profitability for the fund. Fidelity calculates the profitability for each fund, as well as aggregate profitability for groups of Fidelity funds and all Fidelity funds, using a series of detailed revenue and cost allocation methodologies which originate with the books and records of Fidelity on which Fidelity's audited financial statements are based. The Audit Committee of the Board reviews any significant changes from the prior year's methodologies.
PricewaterhouseCoopers LLP (PwC), independent registered public accounting firm and auditor to Fidelity and certain Fidelity funds, has been engaged annually by the Board as part of the Board's assessment of Fidelity's profitability analysis. PwC's engagement includes the review and assessment of the methodologies used by Fidelity in determining the revenues and expenses attributable to Fidelity's mutual fund business, and completion of agreed-upon procedures in respect of the mathematical accuracy of fund profitability and its conformity to established allocation methodologies. After considering PwC's reports issued under the engagement and information provided by Fidelity, the Board concluded that while other allocation methods may also be reasonable, Fidelity's profitability methodologies are reasonable in all material respects.
The Board also reviewed Fidelity's non-fund businesses and fall-out benefits related to the mutual fund business as well as cases where Fidelity's affiliates may benefit from or be related to the fund's business.
The Board considered the costs of the services provided by and the profits realized by Fidelity in connection with the operation of the fund and was satisfied that the profitability was not excessive in the circumstances.
Economies of Scale. The Board considered whether there have been economies of scale in respect of the management of the Fidelity funds, whether the Fidelity funds (including the fund) have appropriately benefited from any such economies of scale, and whether there is potential for realization of any further economies of scale. The Board considered the extent to which the fund will benefit from economies of scale through increased services to the fund, through waivers or reimbursements, or through fee or expense ratio reductions. The Board also noted that in 2013, it and the boards of other Fidelity funds created an ad hoc committee (the Economies of Scale Committee) to analyze whether Fidelity attains economies of scale in respect of the management and servicing of the Fidelity funds, whether the Fidelity funds have appropriately benefited from such economies of scale, and whether there is potential for realization of any further economies of scale.
Annual Report
Board Approval of Investment Advisory Contracts and
Management Fees - continued
The Board recognized that the fund's management contract incorporates a "group fee" structure, which provides for lower group fee rates as total group assets increase, and for higher group fee rates as total group assets decrease (with "group assets" defined to include fund assets under FMR's management plus sector fund assets previously under FMR's management and currently managed by Fidelity SelectCo, LLC). FMR calculates the group fee rates based on a tiered asset "breakpoint" schedule that varies based on asset class. The Board considered that the group fee is designed to deliver the benefits of economies of scale to fund shareholders when total Fidelity fund assets increase, even if assets of any particular fund are unchanged or have declined, because some portion of Fidelity's costs are attributable to services provided to all Fidelity funds, and all funds benefit if those costs can be allocated among more assets. The Board concluded that, given the group fee structure, fund shareholders will benefit from lower management fees as group assets increase at the fund complex level, regardless of whether Fidelity achieves any such economies of scale.
The Board concluded, taking into account the analysis of the Economies of Scale Committee, that economies of scale, if any, are being appropriately shared between fund shareholders and Fidelity.
Additional Information Requested by the Board. In order to develop fully the factual basis for consideration of the Fidelity funds' Advisory Contracts, the Board requested and received additional information on certain topics, including: (i) fund performance trends and Fidelity's long-term strategies for certain funds; (ii) Fidelity's strategic marketing and product lineup goals; (iii) the methodology with respect to competitive fund data and peer group classifications; (iv) the arrangements with, and performance of, certain sub-advisers on behalf of the Fidelity funds, as well as certain proposed participating affiliate arrangements; (v) the realization of fall-out benefits in certain Fidelity business units; (vi) Fidelity's group fee structures, including the rationale for the individual fee rates of certain categories of funds and the definition of group assets; (vii) trends regarding industry use of performance fee structures and the performance adjustment methodologies applicable to the Fidelity funds; (viii) additional competitive analysis regarding the total expenses for certain classes; (ix) fund profitability methodology, including Fidelity's cost allocation methodology, and the impact of certain factors on fund profitability results; and (x) the process by which Fidelity determines sub-advisory fees for funds it advises.
Based on its evaluation of all of the conclusions noted above, and after considering all factors it believed relevant, the Board ultimately concluded that the advisory fee structures are fair and reasonable, and that the fund's Advisory Contracts should be renewed.
Annual Report
Investment Adviser
Fidelity Management & Research Company
Boston, MA
Investment Sub-Advisers
FMR Co., Inc.
Fidelity Management & Research
(U.K.) Inc.
FIL Investment Advisors
FIL Investments (Japan) Limited
FIL Investment Advisors (UK) Limited
Fidelity Management & Research
(Hong Kong) Limited
Fidelity Management & Research
(Japan) Limited
General Distributor
Fidelity Distributors Corporation
Smithfield, RI
Transfer and Service Agents
Fidelity Investments Institutional Operations Company, Inc.
Boston, MA
Fidelity Service Company, Inc.
Boston, MA
Custodian
State Street Bank and Trust Company
Quincy, MA
(Fidelity Investment logo)(registered trademark)
ADIFZ-UANN-1214
1.9585026.101
(Fidelity Investment logo)(registered trademark)
Fidelity Advisor®
Emerging Asia
Fund - Class A, Class T, Class B
and Class C
Annual Report
October 31, 2014
(Fidelity Cover Art)
Contents
Performance | (Click Here) | How the fund has done over time. |
Management's Discussion of Fund Performance | (Click Here) | The Portfolio Manager's review of fund performance and strategy. |
Shareholder Expense Example | (Click Here) | An example of shareholder expenses. |
Investment Changes | (Click Here) | A summary of major shifts in the fund's investments over the past six months. |
Investments | (Click Here) | A complete list of the fund's investments with their market values. |
Financial Statements | (Click Here) | Statements of assets and liabilities, operations, and changes in net assets, as well as financial highlights. |
Notes | (Click Here) | Notes to financial statements. |
Report of Independent Registered Public Accounting Firm | (Click Here) | |
Trustees and Officers | (Click Here) | |
Distributions | (Click Here) | |
Board Approval of Investment Advisory Contracts and Management Fees | (Click Here) | |
To view a fund's proxy voting guidelines and proxy voting record for the 12-month period ended June 30, visit http://www.fidelity.com/proxyvotingresults or visit the Securities and Exchange Commission's (SEC) web site at http://www.sec.gov. You may also call 1-877-208-0098 to request a free copy of the proxy voting guidelines.
Standard & Poor's, S&P and S&P 500 are registered service marks of The McGraw-Hill Companies, Inc. and have been licensed for use by Fidelity Distributors Corporation.
Other third-party marks appearing herein are the property of their respective owners.
All other marks appearing herein are registered or unregistered trademarks or service marks of FMR LLC or an affiliated company. © 2014 FMR LLC. All rights reserved.
Annual Report
This report and the financial statements contained herein are submitted for the general information of the shareholders of the fund. This report is not authorized for distribution to prospective investors in the fund unless preceded or accompanied by an effective prospectus.
A fund files its complete schedule of portfolio holdings with the SEC for the first and third quarters of each fiscal year on Form N-Q. Forms N-Q are available on the SEC's web site at http://www.sec.gov. A fund's Forms N-Q may be reviewed and copied at the SEC's Public Reference Room in Washington, DC. Information regarding the operation of the SEC's Public Reference Room may be obtained by calling 1-800-SEC-0330. For a complete list of a fund's portfolio holdings, view the most recent holdings listing, semiannual report, or annual report on Fidelity's web site at http://www.fidelity.com, http://www.advisor.fidelity.com, or http://www.401k.com, as applicable.
NOT FDIC INSURED • MAY LOSE VALUE • NO BANK GUARANTEE
Neither the fund nor Fidelity Distributors Corporation is a bank.
Annual Report
Average annual total return reflects the change in the value of an investment, assuming reinvestment of the class' distributions from dividend income and capital gains (the profits earned upon the sale of securities that have grown in value, if any) and assuming a constant rate of performance each year. The $10,000 table and the fund's returns do not reflect the deduction of taxes that a shareholder would pay on fund distributions or the redemption of fund shares. During periods of reimbursement by Fidelity, a fund's total return will be greater than it would be had the reimbursement not occurred. How a fund did yesterday is no guarantee of how it will do tomorrow. Returns reflect the conversion of Class B shares to Class A shares after a maximum of seven years.
Average Annual Total Returns
Periods ended October 31, 2014 | Past 1
year | Past 5
years | Past 10 years |
Class A (incl. 5.75% sales charge) | 1.50% | 7.18% | 13.13% |
Class T (incl. 3.50% sales charge) | 3.58% | 7.36% | 13.09% |
Class B (incl. contingent deferred sales charge) A | 1.84% | 7.30% | 13.20% |
Class C (incl. contingent deferred sales charge) B | 5.85% | 7.65% | 12.96% |
A Class B shares' contingent deferred sales charges included in the past one year, past five years, and past ten years total return figures are 5%, 2%, and 0%, respectively.
B Class C shares' contingent deferred sales charges included in the past one year, past five years, and past ten years total return figures are 1%, 0%, and 0%, respectively.
Annual Report
$10,000 Over 10 Years
Let's say hypothetically that $10,000 was invested in Fidelity Advisor® Emerging Asia Fund - Class A on October 31, 2004, and the current 5.75% sales charge was paid. The chart shows how the value of your investment would have changed, and also shows how the MSCI AC (All Country) Asia ex Japan Index performed over the same period.
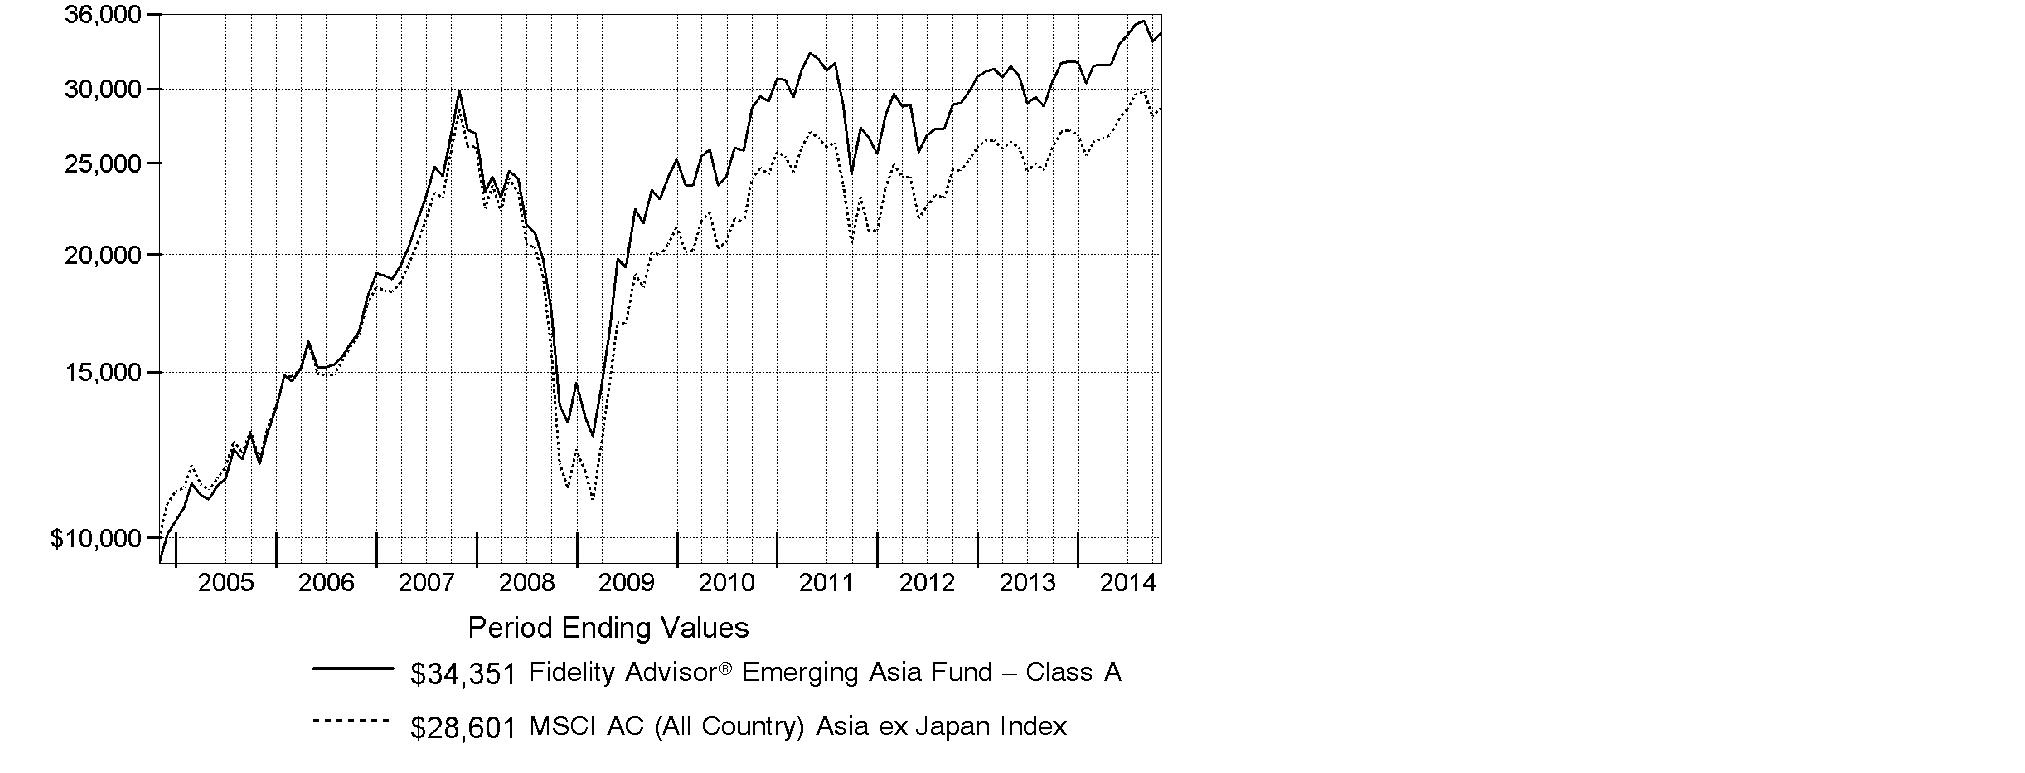
Annual Report
Market Recap: Global equities posted a healthy gain for the 12 months ending October 31, 2014, overcoming an October market decline driven by recessionary pressures in China and tepid growth in Europe. The MSCI ACWI (All Country World Index) Index rose 8.15%, helped by subdued market volatility for much of the period and supported by solid corporate earnings, especially in the United States. Stocks also benefited from easy monetary policies in Japan and the eurozone, as well as increased stimulus efforts in China. All but three of the 24 industry groups that compose the index marked a positive return. The U.S. (+17%) remained a pillar of strength, while a strongly rising dollar in the latter part of the period detracted from investors' returns in most non-U.S. markets. Canada (+5%) notched broad gains outside of its energy and materials sectors, as did Asia-Pacific ex Japan (+4%), led by investor enthusiasm for companies in India. The U.K., Europe and Japan, meanwhile, all underperformed. Among sectors, health care (+24%) led the index, with a strong contribution from the pharmaceuticals, biotechnology & life sciences industry. Information technology (+21%) also outperformed. Conversely, materials (-4%) and energy (-1%) lagged the index due to a higher supply of and lower demand for commodities.
Comments from Colin Chickles, Portfolio Manager of Fidelity Advisor® Emerging Asia Fund: For the year, the fund's Class A, Class T, Class B and Class C shares returned 7.70%, 7.34%, 6.84% and 6.85%, respectively (excluding sales charges), outpacing the 5.75% gain of the MSCI AC (All Country) Asia ex Japan Index. Versus the index, the fund's positioning in India meaningfully contributed to performance. The top contributor was Bharat Heavy Electricals, a manufacturer of power-generation equipment and related products. This stock got a big boost from the May 2014 election of Prime Minister Narendra Modi. Other India-based contributors included high-quality tire maker Apollo Tyres, oil refinery Hindustan Petro, fertilizer supplier UPL and two banks: Axis Bank and Yes Bank. I'll also mention one Chinese stock, logistics provider Sinotrans. Conversely, stock picking in Hong Kong was a weak point for the fund. Disappointments here included casino operator Sands China, the fund's largest relative detractor, which I bought during the period and sold at a significant loss. Underweighting wireless-services provider and index component China Mobile - another Hong Kong-listed stock - also hampered our results, as did overweighted exposure to South Korean electronics giant Samsung Electronics. Many stocks I've mentioned were not in the benchmark, and many of these positions were sold or reduced during the period.
The views expressed above reflect those of the portfolio manager(s) only through the end of the period as stated on the cover of this report and do not necessarily represent the views of Fidelity or any other person in the Fidelity organization. Any such views are subject to change at any time based upon market or other conditions and Fidelity disclaims any responsibility to update such views. These views may not be relied on as investment advice and, because investment decisions for a Fidelity fund are based on numerous factors, may not be relied on as an indication of trading intent on behalf of any Fidelity fund.
Annual Report
Shareholder Expense Example
As a shareholder of the Fund, you incur two types of costs: (1) transaction costs, including sales charges (loads) on purchase payments or redemption proceeds, redemption fees and (2) ongoing costs, including management fees, distribution and/or service (12b-1) fees and other Fund expenses. This Example is intended to help you understand your ongoing costs (in dollars) of investing in the Fund and to compare these costs with the ongoing costs of investing in other mutual funds.
The Example is based on an investment of $1,000 invested at the beginning of the period and held for the entire period (May 1, 2014 to October 31, 2014).
Actual Expenses
The first line of the accompanying table for each class of the Fund provides information about actual account values and actual expenses. You may use the information in this line, together with the amount you invested, to estimate the expenses that you paid over the period. Simply divide your account value by $1,000.00 (for example, an $8,600 account value divided by $1,000.00 = 8.6), then multiply the result by the number in the first line for a class of the Fund under the heading entitled "Expenses Paid During Period" to estimate the expenses you paid on your account during this period. In addition, the Fund, as a shareholder in the underlying Fidelity Central Funds, will indirectly bear its pro-rata share of the fees and expenses incurred by the underlying Fidelity Central Funds. These fees and expenses are not included in the Fund's annualized expense ratio used to calculate the expense estimate in the table below.
Hypothetical Example for Comparison Purposes
The second line of the accompanying table for each class of the Fund provides information about hypothetical account values and hypothetical expenses based on a Class' actual expense ratio and an assumed rate of return of 5% per year before expenses, which is not the Class' actual return. The hypothetical account values and expenses may not be used to estimate the actual ending account balance or expenses you paid for the period. You may use this information to compare the ongoing costs of investing in the Fund and other funds. To do so, compare this 5% hypothetical example with the 5% hypothetical examples that appear in the shareholder reports of the other funds. In addition, the Fund, as a shareholder in the underlying Fidelity Central Funds, will indirectly bear its pro-rata share of the fees and expenses incurred by the underlying Fidelity Central Funds. These fees and expenses are not included in the Fund's annualized expense ratio used to calculate the expense estimate in the table below.
Please note that the expenses shown in the table are meant to highlight your ongoing costs only and do not reflect any transaction costs. Therefore, the second line of the table is useful in comparing ongoing costs only, and will not help you determine the relative total costs of owning different funds. In addition, if these transactional costs were included, your costs would have been higher.
Annual Report
| Annualized Expense RatioB | Beginning
Account Value
May 1, 2014 | Ending
Account Value
October 31, 2014 | Expenses Paid
During Period*
May 1, 2014
to October 31, 2014 |
Class A | 1.37% | | | |
Actual | | $ 1,000.00 | $ 1,081.70 | $ 7.19 |
HypotheticalA | | $ 1,000.00 | $ 1,018.30 | $ 6.97 |
Class T | 1.68% | | | |
Actual | | $ 1,000.00 | $ 1,079.70 | $ 8.81 |
HypotheticalA | | $ 1,000.00 | $ 1,016.74 | $ 8.54 |
Class B | 2.16% | | | |
Actual | | $ 1,000.00 | $ 1,077.50 | $ 11.31 |
HypotheticalA | | $ 1,000.00 | $ 1,014.32 | $ 10.97 |
Class C | 2.12% | | | |
Actual | | $ 1,000.00 | $ 1,077.60 | $ 11.10 |
HypotheticalA | | $ 1,000.00 | $ 1,014.52 | $ 10.76 |
Institutional Class | 1.08% | | | |
Actual | | $ 1,000.00 | $ 1,083.00 | $ 5.67 |
HypotheticalA | | $ 1,000.00 | $ 1,019.76 | $ 5.50 |
A 5% return per year before expenses
B Annualized expense ratio reflects expenses net of applicable fee waivers.
* Expenses are equal to each Class' annualized expense ratio, multiplied by the average account value over the period, multiplied by 184/365 (to reflect the one-half year period).
Annual Report
Investment Changes (Unaudited)
Top Ten Stocks as of October 31, 2014 |
| % of fund's
net assets | % of fund's net assets
6 months ago |
Samsung Electronics Co. Ltd. | 5.4 | 6.2 |
Taiwan Semiconductor Manufacturing Co. Ltd. | 4.1 | 3.9 |
Tencent Holdings Ltd. | 3.0 | 2.4 |
China Construction Bank Corp. (H Shares) | 2.4 | 2.1 |
Hon Hai Precision Industry Co. Ltd. (Foxconn) | 2.0 | 1.8 |
Bank of China Ltd. (H Shares) | 1.8 | 1.5 |
PetroChina Co. Ltd. (H Shares) | 1.6 | 0.0 |
AIA Group Ltd. | 1.4 | 2.6 |
Ping An Insurance (Group) Co. of China Ltd. (H Shares) | 1.4 | 1.0 |
Hyundai Motor Co. | 1.3 | 1.7 |
| 24.4 | |
Top Five Market Sectors as of October 31, 2014 |
| % of fund's
net assets | % of fund's net assets
6 months ago |
Financials | 31.7 | 30.2 |
Information Technology | 23.0 | 24.0 |
Consumer Discretionary | 11.4 | 13.6 |
Industrials | 7.7 | 8.1 |
Telecommunication Services | 6.4 | 4.2 |
Asset Allocation (% of fund's net assets) |
As of October 31, 2014 | As of April 30, 2014 |
 | Stocks 99.9% | | | Stocks 98.9% | |
 | Short-Term
Investments and
Net Other Assets (Liabilities) 0.1% | | | Short-Term
Investments and
Net Other Assets (Liabilities) 1.1% | |

Annual Report
Investments October 31, 2014
Showing Percentage of Net Assets
Common Stocks - 99.9% |
| Shares | | Value |
Bermuda - 3.4% |
BW Offshore Ltd. | 156,500 | | $ 191,885 |
China Resources Gas Group Ltd. | 96,000 | | 274,415 |
CSI Properties Ltd. | 14,830,000 | | 641,247 |
Great Eagle Holdings Ltd. | 614,000 | | 2,066,782 |
Hongkong Land Holdings Ltd. | 223,000 | | 1,555,184 |
Huabao International Holdings Ltd. | 567,000 | | 405,436 |
Kerry Logistics Network Ltd. | 193,500 | | 314,982 |
Luk Fook Holdings International Ltd. | 254,000 | | 757,349 |
Noble Group Ltd. | 1,222,000 | | 1,137,509 |
Oriental Watch Holdings Ltd. | 1,280,000 | | 285,921 |
PAX Global Technology Ltd. (a) | 761,000 | | 817,354 |
Shangri-La Asia Ltd. | 284,000 | | 412,369 |
Yue Yuen Industrial (Holdings) Ltd. | 392,500 | | 1,317,617 |
TOTAL BERMUDA | | 10,178,050 |
British Virgin Islands - 0.2% |
Michael Kors Holdings Ltd. (a) | 6,200 | | 487,258 |
Cayman Islands - 10.1% |
Alibaba Group Holding Ltd. sponsored ADR | 19,300 | | 1,902,980 |
Baidu.com, Inc. sponsored ADR (a) | 5,000 | | 1,193,850 |
Best Pacific International Holdings Ltd. | 1,044,000 | | 519,004 |
China Cord Blood Corp. (a) | 6,844 | | 34,836 |
China Lilang Ltd. | 358,000 | | 256,227 |
China Lodging Group Ltd. ADR (a) | 44,972 | | 1,236,280 |
China Modern Dairy Holdings Ltd. (a) | 1,218,000 | | 537,380 |
China Resources Cement Holdings Ltd. | 2,613,972 | | 1,777,499 |
China Sanjiang Fine Chemicals Ltd. | 1,344,000 | | 666,264 |
China State Construction International Holdings Ltd. | 584,000 | | 902,808 |
Ctrip.com International Ltd. sponsored ADR (a) | 12,400 | | 722,920 |
eLong, Inc. sponsored ADR (a) | 3,300 | | 64,020 |
GCL-Poly Energy Holdings Ltd. (a) | 2,586,000 | | 871,540 |
Goodbaby International Holdings Ltd. | 984,000 | | 396,705 |
Greatview Aseptic Pack Co. Ltd. | 1,065,000 | | 701,115 |
Home Inns & Hotels Management, Inc. sponsored ADR (a) | 6,100 | | 184,281 |
Hosa International Ltd. | 1,196,000 | | 475,331 |
iKang Healthcare Group, Inc. sponsored ADR (d) | 9,800 | | 178,948 |
International Housewares Retail Co. Ltd. | 1,909,000 | | 524,389 |
KWG Property Holding Ltd. | 2,444,011 | | 1,697,101 |
Lifestyle International Holdings Ltd. | 345,000 | | 655,434 |
Lifetech Scientific Corp. (a) | 40,000 | | 58,783 |
Pico Far East Holdings Ltd. | 272,000 | | 67,360 |
Silergy Corp. | 19,000 | | 131,566 |
Common Stocks - continued |
| Shares | | Value |
Cayman Islands - continued |
Sitoy Group Holdings Ltd. | 303,000 | | $ 249,544 |
SOHO China Ltd. | 1,391,000 | | 1,020,728 |
SouFun Holdings Ltd. ADR | 127,700 | | 1,245,075 |
Sunny Optical Technology Group Co. Ltd. | 222,000 | | 359,245 |
Tencent Holdings Ltd. | 569,200 | | 9,148,338 |
Value Partners Group Ltd. | 921,000 | | 694,108 |
WuXi PharmaTech Cayman, Inc. sponsored ADR (a) | 25,000 | | 942,500 |
Xinyi Glass Holdings Ltd. | 436,000 | | 257,609 |
Xinyi Solar Holdings Ltd. | 452,000 | | 152,972 |
Zhen Ding Technology Holding Ltd. | 259,400 | | 711,591 |
TOTAL CAYMAN ISLANDS | | 30,538,331 |
China - 20.7% |
Agricultural Bank of China Ltd. (H Shares) | 4,501,000 | | 2,091,584 |
Aluminum Corp. of China Ltd. (H Shares) (a) | 2,878,000 | | 1,281,119 |
Anhui Conch Cement Co. Ltd. (H Shares) | 323,000 | | 1,057,781 |
Bank of China Ltd. (H Shares) | 11,530,000 | | 5,518,850 |
Beijing Jingneng Clean Energy Co. Ltd. (H Shares) | 132,000 | | 59,286 |
China Communications Construction Co. Ltd. (H Shares) | 2,662,000 | | 2,043,574 |
China Construction Bank Corp. (H Shares) | 9,721,000 | | 7,252,832 |
China Merchants Bank Co. Ltd. (H Shares) | 1,240,000 | | 2,297,999 |
China Pacific Insurance Group Co. Ltd. (H Shares) | 832,000 | | 3,113,477 |
China Railway Construction Corp. Ltd. (H Shares) | 1,242,000 | | 1,304,840 |
China Railway Group Ltd. (H Shares) | 4,465,000 | | 2,754,472 |
China Shenhua Energy Co. Ltd. (H Shares) | 938,500 | | 2,645,197 |
China Telecom Corp. Ltd. (H Shares) | 4,862,000 | | 3,099,308 |
Chongqing Changan Automobile Co. Ltd. (B Shares) | 163,513 | | 361,362 |
Chongqing Rural Commercial Bank Co. Ltd. (H Shares) | 740,000 | | 356,134 |
CSR Corp. Ltd. (H Shares) | 2,298,000 | | 2,337,959 |
Dongfeng Motor Group Co. Ltd. (H Shares) | 904,000 | | 1,397,998 |
Guangdong Kelon Electrical Holdings Ltd. Series H (a) | 390,000 | | 350,078 |
Huadian Fuxin Energy Corp. Ltd. (H Shares) | 2,040,000 | | 1,173,699 |
Huadian Power International Corp. Ltd. (H Shares) | 2,114,000 | | 1,614,781 |
Industrial & Commercial Bank of China Ltd. (H Shares) | 3,921,000 | | 2,603,387 |
People's Insurance Co. of China Group (H Shares) | 5,817,000 | | 2,514,361 |
PetroChina Co. Ltd. (H Shares) | 3,786,000 | | 4,739,861 |
PICC Property & Casualty Co. Ltd. (H Shares) | 1,034,000 | | 1,896,809 |
Ping An Insurance (Group) Co. of China Ltd. (H Shares) | 505,000 | | 4,128,241 |
Shanghai Fosun Pharmaceutical (Group) Co. Ltd. Class H | 46,500 | | 167,414 |
Sinotrans Ltd. (H Shares) | 2,178,000 | | 1,728,254 |
Tong Ren Tang Technologies Co. Ltd. (H Shares) | 218,000 | | 292,952 |
Weichai Power Co. Ltd. (H Shares) | 377,000 | | 1,447,180 |
Common Stocks - continued |
| Shares | | Value |
China - continued |
Weifu High-Technology Co. Ltd. (B Shares) | 17,800 | | $ 67,499 |
Yantai Changyu Pioneer Wine Co. Ltd. (B Shares) | 140,000 | | 439,955 |
Zhuzhou CSR Times Electric Co. Ltd. (H Shares) | 134,500 | | 578,400 |
TOTAL CHINA | | 62,716,643 |
Hong Kong - 8.7% |
AIA Group Ltd. | 763,800 | | 4,262,328 |
BYD Electronic International Co. Ltd. | 446,000 | | 530,595 |
China Mobile Ltd. | 219,500 | | 2,731,133 |
China Power International Development Ltd. | 2,044,000 | | 923,320 |
Dah Chong Hong Holdings Ltd. | 2,100,000 | | 1,238,456 |
Dah Sing Banking Group Ltd. | 184,000 | | 334,315 |
Dah Sing Financial Holdings Ltd. | 111,200 | | 692,411 |
Far East Horizon Ltd. | 1,760,000 | | 1,636,902 |
Fosun International Ltd. | 543,500 | | 644,677 |
Franshion Properties China Ltd. | 1,200,000 | | 283,274 |
HKT Trust/HKT Ltd. unit | 1,520,500 | | 1,852,325 |
Hysan Development Co. Ltd. | 341,000 | | 1,555,933 |
Lenovo Group Ltd. | 1,528,000 | | 2,252,280 |
Magnificent Estates Ltd. (a) | 1,896,000 | | 90,443 |
PCCW Ltd. | 3,775,000 | | 2,399,831 |
Power Assets Holdings Ltd. | 204,500 | | 1,974,521 |
Techtronic Industries Co. Ltd. | 399,000 | | 1,249,110 |
Wheelock and Co. Ltd. | 335,000 | | 1,614,740 |
TOTAL HONG KONG | | 26,266,594 |
India - 10.8% |
Alembic Pharmaceuticals Ltd. (a) | 21,585 | | 143,634 |
Amara Raja Batteries Ltd. (a) | 29,327 | | 312,907 |
Apollo Tyres Ltd. | 155,277 | | 553,220 |
Axis Bank Ltd. (a) | 254,160 | | 1,873,218 |
Bajaj Finserv Ltd. (a) | 37,348 | | 649,485 |
Balkrishna Industries Ltd. | 7,278 | | 91,333 |
Bharat Petroleum Corp. Ltd. | 60,203 | | 704,803 |
Bharti Infratel Ltd. | 241,029 | | 1,155,117 |
Cadila Healthcare Ltd. (a) | 21,957 | | 509,193 |
Cox & Kings India Ltd. | 187,175 | | 872,255 |
Engineers India Ltd. | 45,524 | | 201,724 |
Exide Industries Ltd. | 218,175 | | 559,363 |
Future Retail Ltd. (a) | 76,771 | | 144,283 |
HCL Technologies Ltd. | 75,409 | | 1,977,690 |
Hexaware Technologies Ltd. | 173,363 | | 557,844 |
Common Stocks - continued |
| Shares | | Value |
India - continued |
IL&FS Transportation Networks Ltd. (a) | 57,416 | | $ 184,322 |
JK Tyre & Industries Ltd. (a) | 37,379 | | 298,666 |
Lupin Ltd. | 67,233 | | 1,556,672 |
Mahindra & Mahindra Ltd. (a) | 74,046 | | 1,574,351 |
Maruti Suzuki India Ltd. (a) | 30,721 | | 1,682,745 |
McLeod Russel India Ltd. | 66,079 | | 279,802 |
MindTree Consulting Ltd. | 71,166 | | 1,267,172 |
MRF Ltd. | 1,022 | | 520,966 |
NIIT Technologies Ltd. (a) | 55,090 | | 346,744 |
NTPC Ltd. | 545,018 | | 1,330,981 |
Petronet LNG Ltd. (a) | 420,274 | | 1,364,494 |
Punjab National Bank (a) | 53,917 | | 824,269 |
Redington India Ltd. (a) | 143,788 | | 241,709 |
Reliance Infrastructure Ltd. (a) | 66,954 | | 694,310 |
Sesa Sterlite Ltd. | 343,938 | | 1,435,002 |
Shriram City Union Finance Ltd. | 17,404 | | 492,807 |
Sintex Industries Ltd. | 204,486 | | 322,670 |
Sun Pharmaceutical Industries Ltd. | 121,366 | | 1,670,219 |
Tata Motors Ltd. (a) | 297,671 | | 2,600,641 |
The Jammu & Kashmir Bank Ltd. | 411,289 | | 931,755 |
Union Bank of India | 172,589 | | 633,476 |
UPL Ltd. | 128,087 | | 725,050 |
VST Industries Ltd. (a) | 11,582 | | 342,801 |
Yes Bank Ltd. | 90,553 | | 1,025,394 |
TOTAL INDIA | | 32,653,087 |
Indonesia - 1.7% |
PT ACE Hardware Indonesia Tbk | 1,931,600 | | 129,645 |
PT Bank Mandiri (Persero) Tbk | 2,465,400 | | 2,117,418 |
PT Bank Rakyat Indonesia Tbk | 2,780,200 | | 2,547,765 |
PT Malindo Feedmill Tbk | 549,400 | | 142,073 |
PT Media Nusantara Citra Tbk | 1,041,400 | | 241,428 |
TOTAL INDONESIA | | 5,178,329 |
Israel - 0.1% |
Sarine Technologies Ltd. | 79,000 | | 183,209 |
Japan - 1.2% |
Fuji Media Holdings, Inc. | 63,000 | | 869,261 |
KDDI Corp. | 21,500 | | 1,411,893 |
SoftBank Corp. | 6,200 | | 451,356 |
Suzuki Motor Corp. | 27,800 | | 931,815 |
TOTAL JAPAN | | 3,664,325 |
Common Stocks - continued |
| Shares | | Value |
Korea (South) - 17.3% |
AMOREPACIFIC Corp. | 619 | | $ 1,325,056 |
AMOREPACIFIC Group, Inc. | 1,177 | | 1,295,917 |
Bgf Retail (a) | 14,648 | | 927,050 |
Daesang Corp. | 25,797 | | 997,599 |
Daewoo International Corp. | 16,723 | | 526,852 |
DGB Financial Group Co. Ltd. | 91,915 | | 1,304,584 |
Dongbu Insurance Co. Ltd. | 34,097 | | 1,900,898 |
Dongwon Industries Co. | 681 | | 207,892 |
E1 Corp. | 2,880 | | 192,189 |
Fila Korea Ltd. | 4,707 | | 488,467 |
GS Retail Co. Ltd. | 36,915 | | 855,496 |
Hana Financial Group, Inc. | 55,651 | | 1,919,009 |
Hyundai Hysco Co. Ltd. | 27,314 | | 1,769,336 |
Hyundai Motor Co. | 25,859 | | 4,091,443 |
Hyundai Steel Co. | 23,815 | | 1,509,432 |
Hyundai Wia Corp. | 5,760 | | 989,087 |
InterPark INT Corp. | 18,829 | | 438,110 |
JB Financial Group Co. Ltd. | 63,176 | | 385,720 |
KB Financial Group, Inc. | 82,284 | | 3,208,356 |
Korea Express Co. Ltd. (a) | 991 | | 178,011 |
Korea Zinc Co. Ltd. | 3,345 | | 1,253,077 |
Korean Reinsurance Co. | 17,404 | | 184,659 |
LG Household & Health Care Ltd. | 4,336 | | 2,514,161 |
Medy-Tox, Inc. | 743 | | 172,603 |
Samsung Electronics Co. Ltd. | 13,998 | | 16,206,980 |
Samsung Heavy Industries Co. Ltd. | 60,327 | | 1,462,633 |
Samsung SDI Co. Ltd. | 9,724 | | 1,140,332 |
Shinhan Financial Group Co. Ltd. | 81,664 | | 3,823,089 |
SK Telecom Co. Ltd. | 4,243 | | 1,057,636 |
TOTAL KOREA (SOUTH) | | 52,325,674 |
Malaysia - 3.0% |
Genting Malaysia Bhd | 627,500 | | 820,304 |
Glomac Bhd | 439,300 | | 148,143 |
Kossan Rubber Industries Bhd | 318,700 | | 445,620 |
Media Prima Bhd | 676,700 | | 403,101 |
Sunway Bhd | 412,700 | | 432,864 |
Tenaga Nasional Bhd | 958,900 | | 3,894,303 |
YTL Corp. Bhd | 3,740,600 | | 1,887,469 |
YTL Power International Bhd | 1,854,700 | | 896,283 |
TOTAL MALAYSIA | | 8,928,087 |
Common Stocks - continued |
| Shares | | Value |
Mauritius - 0.2% |
MakeMyTrip Ltd. (a) | 16,600 | | $ 500,241 |
Papua New Guinea - 0.1% |
Oil Search Ltd. ADR | 37,627 | | 288,513 |
Philippines - 1.6% |
ABS CBN Broadcasting Corp. (depositary receipt) | 97,800 | | 99,604 |
Alliance Global Group, Inc. | 2,624,400 | | 1,476,119 |
Ayala Land, Inc. | 922,700 | | 688,083 |
D&L Industries, Inc. | 510,300 | | 155,365 |
Jollibee Food Corp. | 111,610 | | 486,438 |
Metropolitan Bank & Trust Co. | 549,880 | | 1,008,936 |
Security Bank Corp. | 241,366 | | 771,406 |
Vista Land & Lifescapes, Inc. | 1,801,000 | | 246,347 |
TOTAL PHILIPPINES | | 4,932,298 |
Singapore - 4.7% |
Amtek Engineering Ltd. | 193,000 | | 90,850 |
Boustead Singapore Ltd. | 67,000 | | 95,853 |
Cordlife Group Ltd. | 278,000 | | 218,596 |
CWT Ltd. | 115,000 | | 144,649 |
Ezion Holdings Ltd. | 1,051,800 | | 1,238,591 |
Keppel Corp. Ltd. | 346,000 | | 2,537,294 |
Mapletree Industrial (REIT) | 1,502,850 | | 1,726,072 |
Singapore Telecommunications Ltd. | 1,225,000 | | 3,605,515 |
United Overseas Bank Ltd. | 218,000 | | 3,905,620 |
Wing Tai Holdings Ltd. | 546,000 | | 760,763 |
TOTAL SINGAPORE | | 14,323,803 |
Taiwan - 11.4% |
Catcher Technology Co. Ltd. | 240,000 | | 2,022,859 |
Cleanaway Co. Ltd. | 36,000 | | 159,790 |
FLEXium Interconnect, Inc. | 114,000 | | 240,955 |
Fubon Financial Holding Co. Ltd. | 1,718,000 | | 2,903,906 |
Giant Manufacturing Co. Ltd. | 86,000 | | 695,254 |
Hon Hai Precision Industry Co. Ltd. (Foxconn) | 1,900,600 | | 6,006,019 |
King Slide Works Co. Ltd. | 26,000 | | 340,847 |
Merida Industry Co. Ltd. | 58,050 | | 400,363 |
NAK Sealing Technologies Corp. | 40,000 | | 138,032 |
Nan Ya Plastics Corp. | 822,000 | | 1,698,534 |
Novatek Microelectronics Corp. | 333,000 | | 1,720,940 |
Pegatron Corp. | 395,000 | | 718,763 |
Pou Chen Corp. | 633,000 | | 696,914 |
Realtek Semiconductor Corp. | 128,000 | | 423,621 |
Common Stocks - continued |
| Shares | | Value |
Taiwan - continued |
Sinopac Holdings Co. | 17,028 | | $ 7,382 |
Taishin Financial Holdings Co. Ltd. | 4,196,392 | | 1,998,698 |
Taiwan Semiconductor Manufacturing Co. Ltd. | 2,851,393 | | 12,341,152 |
Tongtai Machine & Tool Co. Ltd. | 183,000 | | 162,202 |
Tongtai Machine & Tool Co. Ltd. rights 12/17/14 (a) | 12,739 | | 188 |
Vanguard International Semiconductor Corp. | 380,000 | | 570,014 |
Wistron Corp. | 1,311,000 | | 1,375,210 |
TOTAL TAIWAN | | 34,621,643 |
Thailand - 3.8% |
Bangkok Expressway PCL (For.Reg.) | 269,500 | | 314,337 |
Delta Electronics PCL (For. Reg.) | 160,200 | | 317,965 |
Intouch Holdings PCL: | | | |
(For. Reg.) | 773,700 | | 1,756,536 |
NVDR | 12,400 | | 28,152 |
Kasikornbank PCL (For. Reg.) | 363,300 | | 2,631,294 |
Preuksa Real Estate PCL (For. Reg.) | 2,308,900 | | 2,374,808 |
Quality Houses PCL | 6,083,700 | | 803,759 |
Thai Beverage PCL | 3,546,000 | | 2,111,536 |
Thai Tap Water Supply PCL (For. Reg.) | 615,500 | | 228,541 |
Thanachart Capital PCL (For. Reg.) | 580,200 | | 623,341 |
TISCO Financial Group PCL | 153,200 | | 209,382 |
TOTAL THAILAND | | 11,399,651 |
United Kingdom - 0.3% |
Standard Chartered PLC (United Kingdom) | 61,783 | | 928,647 |
United States of America - 0.6% |
Cognizant Technology Solutions Corp. Class A (a) | 38,900 | | 1,900,265 |
TOTAL COMMON STOCKS (Cost $256,071,530) |
302,014,648
|
Money Market Funds - 0.4% |
| Shares | | Value |
Fidelity Cash Central Fund, 0.11% (b) | 1,073,477 | | $ 1,073,477 |
Fidelity Securities Lending Cash Central Fund, 0.11% (b)(c) | 150,606 | | 150,606 |
TOTAL MONEY MARKET FUNDS (Cost $1,224,083) |
1,224,083
|
TOTAL INVESTMENT PORTFOLIO - 100.3% (Cost $257,295,613) | | 303,238,731 |
NET OTHER ASSETS (LIABILITIES) - (0.3)% | | (912,012) |
NET ASSETS - 100% | $ 302,326,719 |
Legend |
(a) Non-income producing |
(b) Affiliated fund that is generally available only to investment companies and other accounts managed by Fidelity Investments. The rate quoted is the annualized seven-day yield of the fund at period end. A complete unaudited listing of the fund's holdings as of its most recent quarter end is available upon request. In addition, each Fidelity Central Fund's financial statements, which are not covered by the Fund's Report of Independent Registered Public Accounting Firm, are available on the SEC's website or upon request. |
(c) Investment made with cash collateral received from securities on loan. |
(d) Security or a portion of the security is on loan at period end. |
Affiliated Central Funds |
Information regarding fiscal year to date income earned by the Fund from investments in Fidelity Central Funds is as follows: |
Fund | Income earned |
Fidelity Cash Central Fund | $ 6,143 |
Fidelity Securities Lending Cash Central Fund | 6,519 |
Total | $ 12,662 |
Other Information |
Categorizations in the Schedule of Investments are based on country or territory of incorporation. |
The following is a summary of the inputs used, as of October 31, 2014, involving the Fund's assets and liabilities carried at fair value. The inputs or methodology used for valuing securities may not be an indication of the risk associated with investing in those securities. For more information on valuation inputs, and their aggregation into the levels used in the tables below, please refer to the Investment Valuation section in the accompanying Notes to Financial Statements. |
Valuation Inputs at Reporting Date: |
Description | Total | Level 1 | Level 2 | Level 3 |
Investments in Securities: | | | | |
Equities: | | | | |
Consumer Discretionary | $ 34,803,862 | $ 9,202,107 | $ 25,601,755 | $ - |
Consumer Staples | 11,976,718 | 8,123,171 | 3,853,547 | - |
Energy | 11,269,197 | 191,885 | 11,077,312 | - |
Financials | 95,820,080 | 10,446,606 | 85,373,474 | - |
Health Care | 6,391,970 | 1,328,887 | 5,063,083 | - |
Industrials | 23,286,614 | 2,167,496 | 18,202,759 | 2,916,359 |
Information Technology | 68,693,620 | 23,589,482 | 45,104,138 | - |
Materials | 15,079,687 | 4,531,845 | 10,547,842 | - |
Telecommunication Services | 19,548,802 | - | 19,548,802 | - |
Utilities | 15,144,098 | 192,189 | 14,951,909 | - |
Money Market Funds | 1,224,083 | 1,224,083 | - | - |
Total Investments in Securities: | $ 303,238,731 | $ 60,997,751 | $ 239,324,621 | $ 2,916,359 |
The following is a summary of transfers between Level 1 and Level 2 for the period ended October 31, 2014. Transfers are assumed to have occurred at the beginning of the period, and are primarily attributable to the valuation techniques used for foreign equity securities, as discussed in the accompanying Notes to Financial Statements: |
Transfers | Total |
Level 1 to Level 2 | $ 118,630,407 |
Level 2 to Level 1 | $ 3,581,992 |
See accompanying notes which are an integral part of the financial statements.
Annual Report
Statement of Assets and Liabilities
| October 31, 2014 |
| | |
Assets | | |
Investment in securities, at value (including securities loaned of $152,781) - See accompanying schedule: Unaffiliated issuers (cost $256,071,530) | $ 302,014,648 | |
Fidelity Central Funds (cost $1,224,083) | 1,224,083 | |
Total Investments (cost $257,295,613) | | $ 303,238,731 |
Foreign currency held at value (cost $2,564) | | 2,564 |
Receivable for fund shares sold | | 1,215,063 |
Dividends receivable | | 226,189 |
Distributions receivable from Fidelity Central Funds | | 276 |
Prepaid expenses | | 649 |
Other receivables | | 138,155 |
Total assets | | 304,821,627 |
| | |
Liabilities | | |
Payable for fund shares redeemed | $ 914,485 | |
Accrued management fee | 172,544 | |
Distribution and service plan fees payable | 99,904 | |
Other affiliated payables | 77,910 | |
Other payables and accrued expenses | 1,079,459 | |
Collateral on securities loaned, at value | 150,606 | |
Total liabilities | | 2,494,908 |
| | |
Net Assets | | $ 302,326,719 |
Net Assets consist of: | | |
Paid in capital | | $ 240,725,477 |
Undistributed net investment income | | 1,321,181 |
Accumulated undistributed net realized gain (loss) on investments and foreign currency transactions | | 15,322,444 |
Net unrealized appreciation (depreciation) on investments and assets and liabilities in foreign currencies | | 44,957,617 |
Net Assets | | $ 302,326,719 |
See accompanying notes which are an integral part of the financial statements.
Annual Report
Financial Statements - continued
Statement of Assets and Liabilities - continued
| October 31, 2014 |
| | |
Calculation of Maximum Offering Price Class A:
Net Asset Value and redemption price per share ($145,183,525 ÷ 4,530,316 shares) | | $ 32.05 |
| | |
Maximum offering price per share (100/94.25 of $32.05) | | $ 34.01 |
Class T:
Net Asset Value and redemption price per share ($44,563,242 ÷ 1,429,570 shares) | | $ 31.17 |
| | |
Maximum offering price per share (100/96.50 of $31.17) | | $ 32.30 |
Class B:
Net Asset Value and offering price per share ($6,660,785 ÷ 224,786 shares)A | | $ 29.63 |
| | |
Class C:
Net Asset Value and offering price per share ($57,225,913 ÷ 1,953,037 shares)A | | $ 29.30 |
| | |
| | |
Institutional Class:
Net Asset Value, offering price and redemption price per share ($48,693,254 ÷ 1,475,608 shares) | | $ 33.00 |
A Redemption price per share is equal to net asset value less any applicable contingent deferred sales charge.
See accompanying notes which are an integral part of the financial statements.
Annual Report
Statement of Operations
| Year ended October 31, 2014 |
| | |
Investment Income | | |
Dividends | | $ 7,785,977 |
Income from Fidelity Central Funds | | 12,662 |
Income before foreign taxes withheld | | 7,798,639 |
Less foreign taxes withheld | | (660,335) |
Total income | | 7,138,304 |
| | |
Expenses | | |
Management fee | $ 2,095,686 | |
Transfer agent fees | 775,288 | |
Distribution and service plan fees | 1,245,694 | |
Accounting and security lending fees | 155,308 | |
Custodian fees and expenses | 280,652 | |
Independent trustees' compensation | 1,231 | |
Registration fees | 71,315 | |
Audit | 107,106 | |
Legal | 1,110 | |
Interest | 184 | |
Miscellaneous | 27,533 | |
Total expenses | | 4,761,107 |
Net investment income (loss) | | 2,377,197 |
Realized and Unrealized Gain (Loss) Net realized gain (loss) on: | | |
Investment securities: | | |
Unaffiliated issuers (net of foreign taxes of $821,883) | 17,039,591 | |
Foreign currency transactions | (194,377) | |
Total net realized gain (loss) | | 16,845,214 |
Change in net unrealized appreciation (depreciation) on: Investment securities (net of increase in deferred foreign taxes of $935,158) | 736,657 | |
Assets and liabilities in foreign currencies | (908) | |
Total change in net unrealized appreciation (depreciation) | | 735,749 |
Net gain (loss) | | 17,580,963 |
Net increase (decrease) in net assets resulting from operations | | $ 19,958,160 |
See accompanying notes which are an integral part of the financial statements.
Annual Report
Financial Statements - continued
Statement of Changes in Net Assets
| Year ended
October 31,
2014 | Year ended
October 31,
2013 |
Increase (Decrease) in Net Assets | | |
Operations | | |
Net investment income (loss) | $ 2,377,197 | $ 2,621,540 |
Net realized gain (loss) | 16,845,214 | 28,149,471 |
Change in net unrealized appreciation (depreciation) | 735,749 | (972,592) |
Net increase (decrease) in net assets resulting
from operations | 19,958,160 | 29,798,419 |
Distributions to shareholders from net investment income | (2,011,362) | (3,137,656) |
Distributions to shareholders from net realized gain | (13,483,906) | (1,067,553) |
Total distributions | (15,495,268) | (4,205,209) |
Share transactions - net increase (decrease) | (13,223,545) | (47,287,205) |
Redemption fees | 35,731 | 37,169 |
Total increase (decrease) in net assets | (8,724,922) | (21,656,826) |
| | |
Net Assets | | |
Beginning of period | 311,051,641 | 332,708,467 |
End of period (including undistributed net investment income of $1,321,181 and undistributed net investment income of $1,990,012, respectively) | $ 302,326,719 | $ 311,051,641 |
See accompanying notes which are an integral part of the financial statements.
Annual Report
Financial Highlights - Class A
Years ended October 31, | 2014 | 2013 | 2012 | 2011 | 2010 |
Selected Per-Share Data | | | | | |
Net asset value, beginning of period | $ 31.34 | $ 28.87 | $ 28.70 | $ 32.97 | $ 25.96 |
Income from Investment Operations | | | | | |
Net investment income (loss) C | .30 | .30 | .34 | .35 | .25 |
Net realized and unrealized gain (loss) | 2.00 H | 2.59 | 1.37 | (2.62) | 7.09 |
Total from investment operations | 2.30 | 2.89 | 1.71 | (2.27) | 7.34 |
Distributions from net investment income | (.26) | (.33) | (.31) | (.20) | (.12) |
Distributions from net realized gain | (1.33) | (.09) | (1.23) | (1.81) | (.22) |
Total distributions | (1.59) | (.42) | (1.54) | (2.01) | (.34) |
Redemption fees added to paid in capital C | - G | - G | - G | .01 | .01 |
Net asset value, end of period | $ 32.05 | $ 31.34 | $ 28.87 | $ 28.70 | $ 32.97 |
Total ReturnA, B | 7.70% H | 10.10% | 6.36% | (7.44)% | 28.53% |
Ratios to Average Net Assets D, F | | | | | |
Expenses before reductions | 1.42% | 1.41% | 1.42% | 1.39% | 1.44% |
Expenses net of fee waivers, if any | 1.42% | 1.41% | 1.42% | 1.39% | 1.44% |
Expenses net of all reductions | 1.42% | 1.38% | 1.38% | 1.35% | 1.40% |
Net investment income (loss) | .96% | .99% | 1.24% | 1.12% | .86% |
Supplemental Data | | | | | |
Net assets, end of period (000 omitted) | $ 145,184 | $ 155,104 | $ 160,427 | $ 179,346 | $ 189,255 |
Portfolio turnover rateE | 91% | 95% | 95% | 119% | 138% |
A Total returns would have been lower if certain expenses had not been reduced during the applicable periods shown.
B Total returns do not include the effect of the sales charges.
C Calculated based on average shares outstanding during the period.
D Fees and expenses of any underlying Fidelity Central Funds are not included in the Fund's expense ratio. The Fund indirectly bears its proportionate share of the expenses of any underlying Fidelity Central Funds.
E Amount does not include the portfolio activity of any underlying Fidelity Central Funds.
F Expense ratios reflect operating expenses of the class. Expenses before reductions do not reflect amounts reimbursed by the investment adviser or reductions from brokerage service arrangements or reductions from other expense offset arrangements and do not represent the amount paid by the class during periods when reimbursements or reductions occur. Expenses net of fee waivers reflect expenses after reimbursement by the investment adviser but prior to reductions from brokerage service arrangements or other expense offset arrangements. Expenses net of all reductions represent the net expenses paid by the class.
G Amount represents less than $.01 per share.
H In 2014, a change to the Indian tax rules invalidated a prior ruling that had exempted the Fund from taxes on realized gains. As a result, the Fund recorded a tax liability which resulted in a decrease to realized and unrealized gain (loss) per share of $.18 at period end. Excluding this amount, the total return would have been 8.29%.
See accompanying notes which are an integral part of the financial statements.
Annual Report
Financial Highlights - Class T
Years ended October 31, | 2014 | 2013 | 2012 | 2011 | 2010 |
Selected Per-Share Data | | | | | |
Net asset value, beginning of period | $ 30.53 | $ 28.13 | $ 27.98 | $ 32.20 | $ 25.40 |
Income from Investment Operations | | | | | |
Net investment income (loss) C | .20 | .20 | .25 | .25 | .15 |
Net realized and unrealized gain (loss) | 1.94 H | 2.54 | 1.33 | (2.55) | 6.94 |
Total from investment operations | 2.14 | 2.74 | 1.58 | (2.30) | 7.09 |
Distributions from net investment income | (.17) | (.25) | (.20) | (.12) | (.08) |
Distributions from net realized gain | (1.33) | (.09) | (1.23) | (1.81) | (.22) |
Total distributions | (1.50) | (.34) | (1.43) | (1.93) | (.30) |
Redemption fees added to paid in capital C | - G | - G | - G | .01 | .01 |
Net asset value, end of period | $ 31.17 | $ 30.53 | $ 28.13 | $ 27.98 | $ 32.20 |
Total ReturnA, B | 7.34% H | 9.80% | 6.04% | (7.70)% | 28.13% |
Ratios to Average Net Assets D, F | | | | | |
Expenses before reductions | 1.73% | 1.70% | 1.70% | 1.70% | 1.74% |
Expenses net of fee waivers, if any | 1.73% | 1.70% | 1.70% | 1.69% | 1.74% |
Expenses net of all reductions | 1.73% | 1.67% | 1.67% | 1.65% | 1.70% |
Net investment income (loss) | .66% | .70% | .95% | .82% | .55% |
Supplemental Data | | | | | |
Net assets, end of period (000 omitted) | $ 44,563 | $ 47,620 | $ 49,359 | $ 55,452 | $ 61,620 |
Portfolio turnover rateE | 91% | 95% | 95% | 119% | 138% |
A Total returns would have been lower if certain expenses had not been reduced during the applicable periods shown.
B Total returns do not include the effect of the sales charges.
C Calculated based on average shares outstanding during the period.
D Fees and expenses of any underlying Fidelity Central Funds are not included in the Fund's expense ratio. The Fund indirectly bears its proportionate share of the expenses of any underlying Fidelity Central Funds.
E Amount does not include the portfolio activity of any underlying Fidelity Central Funds.
F Expense ratios reflect operating expenses of the class. Expenses before reductions do not reflect amounts reimbursed by the investment adviser or reductions from brokerage service arrangements or reductions from other expense offset arrangements and do not represent the amount paid by the class during periods when reimbursements or reductions occur. Expenses net of fee waivers reflect expenses after reimbursement by the investment adviser but prior to reductions from brokerage service arrangements or other expense offset arrangements. Expenses net of all reductions represent the net expenses paid by the class.
G Amount represents less than $.01 per share.
H In 2014, a change to the Indian tax rules invalidated a prior ruling that had exempted the Fund from taxes on realized gains. As a result, the Fund recorded a tax liability which resulted in a decrease to realized and unrealized gain (loss) per share of $.18 at period end. Excluding this amount, the total return would have been 7.93%.
See accompanying notes which are an integral part of the financial statements.
Annual Report
Financial Highlights - Class B
Years ended October 31, | 2014 | 2013 | 2012 | 2011 | 2010 |
Selected Per-Share Data | | | | | |
Net asset value, beginning of period | $ 29.06 | $ 26.77 | $ 26.62 | $ 30.72 | $ 24.29 |
Income from Investment Operations | | | | | |
Net investment income (loss) C | .05 | .06 | .12 | .10 | .02 |
Net realized and unrealized gain (loss) | 1.85 H | 2.41 | 1.26 | (2.44) | 6.61 |
Total from investment operations | 1.90 | 2.47 | 1.38 | (2.34) | 6.63 |
Distributions from net investment income | - | (.09) | - | - | - |
Distributions from net realized gain | (1.33) | (.09) | (1.23) | (1.77) | (.21) |
Total distributions | (1.33) | (.18) | (1.23) | (1.77) | (.21) |
Redemption fees added to paid in capital C | - G | - G | - G | .01 | .01 |
Net asset value, end of period | $ 29.63 | $ 29.06 | $ 26.77 | $ 26.62 | $ 30.72 |
Total ReturnA, B | 6.84% H | 9.27% | 5.51% | (8.16)% | 27.48% |
Ratios to Average Net Assets D, F | | | | | |
Expenses before reductions | 2.22% | 2.20% | 2.19% | 2.19% | 2.24% |
Expenses net of fee waivers, if any | 2.22% | 2.20% | 2.19% | 2.18% | 2.24% |
Expenses net of all reductions | 2.22% | 2.17% | 2.16% | 2.15% | 2.20% |
Net investment income (loss) | .16% | .20% | .46% | .32% | .06% |
Supplemental Data | | | | | |
Net assets, end of period (000 omitted) | $ 6,661 | $ 10,194 | $ 15,823 | $ 20,831 | $ 29,611 |
Portfolio turnover rateE | 91% | 95% | 95% | 119% | 138% |
A Total returns would have been lower if certain expenses had not been reduced during the applicable periods shown.
B Total returns do not include the effect of the contingent deferred sales charge.
C Calculated based on average shares outstanding during the period.
D Fees and expenses of any underlying Fidelity Central Funds are not included in the Fund's expense ratio. The Fund indirectly bears its proportionate share of the expenses of any underlying Fidelity Central Funds.
E Amount does not include the portfolio activity of any underlying Fidelity Central Funds.
F Expense ratios reflect operating expenses of the class. Expenses before reductions do not reflect amounts reimbursed by the investment adviser or reductions from brokerage service arrangements or reductions from other expense offset arrangements and do not represent the amount paid by the class during periods when reimbursements or reductions occur. Expenses net of fee waivers reflect expenses after reimbursement by the investment adviser but prior to reductions from brokerage service arrangements or other expense offset arrangements. Expenses net of all reductions represent the net expenses paid by the class.
G Amount represents less than $.01 per share.
H In 2014, a change to the Indian tax rules invalidated a prior ruling that had exempted the Fund from taxes on realized gains. As a result, the Fund recorded a tax liability which resulted in a decrease to realized and unrealized gain (loss) per share of $.17 at period end. Excluding this amount, the total return would have been 7.43%.
See accompanying notes which are an integral part of the financial statements.
Annual Report
Financial Highlights - Class C
Years ended October 31, | 2014 | 2013 | 2012 | 2011 | 2010 |
Selected Per-Share Data | | | | | |
Net asset value, beginning of period | $ 28.78 | $ 26.53 | $ 26.44 | $ 30.58 | $ 24.19 |
Income from Investment Operations | | | | | |
Net investment income (loss) C | .06 | .07 | .13 | .11 | .03 |
Net realized and unrealized gain (loss) | 1.82 H | 2.39 | 1.25 | (2.41) | 6.59 |
Total from investment operations | 1.88 | 2.46 | 1.38 | (2.30) | 6.62 |
Distributions from net investment income | (.03) | (.12) | (.06) | (.04) | (.02) |
Distributions from net realized gain | (1.33) | (.09) | (1.23) | (1.81) | (.22) |
Total distributions | (1.36) | (.21) | (1.29) | (1.85) | (.24) |
Redemption fees added to paid in capital C | - G | - G | - G | .01 | .01 |
Net asset value, end of period | $ 29.30 | $ 28.78 | $ 26.53 | $ 26.44 | $ 30.58 |
Total ReturnA, B | 6.85% H | 9.33% | 5.57% | (8.10)% | 27.58% |
Ratios to Average Net Assets D, F | | | | | |
Expenses before reductions | 2.17% | 2.16% | 2.16% | 2.13% | 2.17% |
Expenses net of fee waivers, if any | 2.17% | 2.16% | 2.16% | 2.13% | 2.17% |
Expenses net of all reductions | 2.17% | 2.12% | 2.13% | 2.10% | 2.13% |
Net investment income (loss) | .22% | .24% | .49% | .37% | .12% |
Supplemental Data | | | | | |
Net assets, end of period (000 omitted) | $ 57,226 | $ 61,824 | $ 67,074 | $ 78,939 | $ 87,089 |
Portfolio turnover rateE | 91% | 95% | 95% | 119% | 138% |
A Total returns would have been lower if certain expenses had not been reduced during the applicable periods shown.
B Total returns do not include the effect of the contingent deferred sales charge.
C Calculated based on average shares outstanding during the period.
D Fees and expenses of any underlying Fidelity Central Funds are not included in the Fund's expense ratio. The Fund indirectly bears its proportionate share of the expenses of any underlying Fidelity Central Funds.
E Amount does not include the portfolio activity of any underlying Fidelity Central Funds.
F Expense ratios reflect operating expenses of the class. Expenses before reductions do not reflect amounts reimbursed by the investment adviser or reductions from brokerage service arrangements or reductions from other expense offset arrangements and do not represent the amount paid by the class during periods when reimbursements or reductions occur. Expenses net of fee waivers reflect expenses after reimbursement by the investment adviser but prior to reductions from brokerage service arrangements or other expense offset arrangements. Expenses net of all reductions represent the net expenses paid by the class.
G Amount represents less than $.01 per share.
H In 2014, a change to the Indian tax rules invalidated a prior ruling that had exempted the Fund from taxes on realized gains. As a result, the Fund recorded a tax liability which resulted in a decrease to realized and unrealized gain (loss) per share of $.17 at period end. Excluding this amount, the total return would have been 7.44%.
See accompanying notes which are an integral part of the financial statements.
Annual Report
Financial Highlights - Institutional Class
Years ended October 31, | 2014 | 2013 | 2012 | 2011 | 2010 |
Selected Per-Share Data | | | | | |
Net asset value, beginning of period | $ 32.24 | $ 29.67 | $ 29.49 | $ 33.80 | $ 26.58 |
Income from Investment Operations | | | | | |
Net investment income (loss) B | .40 | .40 | .44 | .46 | .34 |
Net realized and unrealized gain (loss) | 2.04 I | 2.68 | 1.39 | (2.69) | 7.26 |
Total from investment operations | 2.44 | 3.08 | 1.83 | (2.23) | 7.60 |
Distributions from net investment income | (.35) | (.41) | (.42) | (.29) | (.17) |
Distributions from net realized gain | (1.33) | (.09) | (1.23) | (1.81) | (.22) |
Total distributions | (1.68) | (.51) G | (1.65) | (2.09) H | (.39) |
Redemption fees added to paid in capital B | - F | - F | - F | .01 | .01 |
Net asset value, end of period | $ 33.00 | $ 32.24 | $ 29.67 | $ 29.49 | $ 33.80 |
Total ReturnA | 7.98% I | 10.47% | 6.64% | (7.13)% | 28.87% |
Ratios to Average Net Assets C, E | | | | | |
Expenses before reductions | 1.12% | 1.11% | 1.11% | 1.10% | 1.14% |
Expenses net of fee waivers, if any | 1.12% | 1.11% | 1.11% | 1.10% | 1.14% |
Expenses net of all reductions | 1.12% | 1.08% | 1.08% | 1.06% | 1.10% |
Net investment income (loss) | 1.26% | 1.29% | 1.54% | 1.41% | 1.16% |
Supplemental Data | | | | | |
Net assets, end of period (000 omitted) | $ 48,693 | $ 36,310 | $ 40,026 | $ 49,888 | $ 45,042 |
Portfolio turnover rateD | 91% | 95% | 95% | 119% | 138% |
A Total returns would have been lower if certain expenses had not been reduced during the applicable periods shown.
B Calculated based on average shares outstanding during the period.
C Fees and expenses of any underlying Fidelity Central Funds are not included in the Fund's expense ratio. The Fund indirectly bears its proportionate share of the expenses of any underlying Fidelity Central Funds.
D Amount does not include the portfolio activity of any underlying Fidelity Central Funds.
E Expense ratios reflect operating expenses of the class. Expenses before reductions do not reflect amounts reimbursed by the investment adviser or reductions from brokerage service arrangements or reductions from other expense offset arrangements and do not represent the amount paid by the class during periods when reimbursements or reductions occur. Expenses net of fee waivers reflect expenses after reimbursement by the investment adviser but prior to reductions from brokerage service arrangements or other expense offset arrangements. Expenses net of all reductions represent the net expenses paid by the class.
F Amount represents less than $.01 per share.
G Total distributions of $.51 per share is comprised of distributions from net investment income of $.413 and distributions from net realized gain of $.092 per share.
H Total distributions of $2.09 per share is comprised of distributions from net investment income of $.288 and distributions from net realized gain of $1.805 per share.
I In 2014, a change to the Indian tax rules invalidated a prior ruling that had exempted the Fund from taxes on realized gains. As a result, the Fund recorded a tax liability which resulted in a decrease to realized and unrealized gain (loss) per share of $.19 at period end. Excluding this amount, the total return would have been 8.57%.
See accompanying notes which are an integral part of the financial statements.
Annual Report
Notes to Financial Statements
For the period ended October 31, 2014
1. Organization.
Fidelity Advisor Emerging Asia Fund (the Fund) is a fund of Fidelity Advisor Series VIII (the Trust) and is authorized to issue an unlimited number of shares. The Trust is registered under the Investment Company Act of 1940, as amended (the 1940 Act), as an open-end management investment company organized as a Massachusetts business trust. The Fund offers Class A, Class T, Class C and Institutional Class shares, each of which, along with Class B shares, has equal rights as to assets and voting privileges. Class B shares are closed to new accounts and additional purchases, except for exchanges and reinvestments. Each class has exclusive voting rights with respect to matters that affect that class. Class B shares will automatically convert to Class A shares after a holding period of seven years from the initial date of purchase. The Fund's investments in emerging markets can be subject to social, economic, regulatory, and political uncertainties and can be extremely volatile.
2. Investments in Fidelity Central Funds.
The Fund invests in Fidelity Central Funds, which are open-end investment companies generally available only to other investment companies and accounts managed by the investment adviser and its affiliates. The Fund's Schedule of Investments lists each of the Fidelity Central Funds held as of period end, if any, as an investment of the Fund, but does not include the underlying holdings of each Fidelity Central Fund. As an Investing Fund, the Fund indirectly bears its proportionate share of the expenses of the underlying Fidelity Central Funds.
The Money Market Central Funds seek preservation of capital and current income and are managed by Fidelity Investments Money Management, Inc. (FIMM), an affiliate of the investment adviser. Annualized expenses of the Money Market Central Funds as of their most recent shareholder report date are less than .01%.
A complete unaudited list of holdings for each Fidelity Central Fund is available upon request or at the Securities and Exchange Commission (the SEC) website at www.sec.gov. In addition, the financial statements of the Fidelity Central Funds, which are not covered by the Fund's Report of Independent Registered Public Accounting Firm, are available on the SEC website or upon request.
3. Significant Accounting Policies.
The financial statements have been prepared in conformity with accounting principles generally accepted in the United States of America (GAAP), which require management to make certain estimates and assumptions at the date of the financial statements. Actual results could differ from those estimates. Subsequent events, if any, through the date that the financial statements were issued have been evaluated in the preparation of
Annual Report
Notes to Financial Statements - continued
3. Significant Accounting Policies - continued
the financial statements. The following summarizes the significant accounting policies of the Fund:
Investment Valuation. Investments are valued as of 4:00 p.m. Eastern time on the last calendar day of the period. In accordance with valuation policies and procedures approved by the Board of Trustees (the Board), the Fund attempts to obtain prices from one or more third party pricing vendors or brokers to value its investments. When current market prices, quotations or currency exchange rates are not readily available or reliable, investments will be fair valued in good faith by the Fidelity Management & Research Company (FMR) Fair Value Committee (the Committee), in accordance with procedures adopted by the Board. Factors used in determining fair value vary by investment type and may include market or investment specific events. The frequency with which these procedures are used cannot be predicted and they may be utilized to a significant extent. The Committee oversees the Fund's valuation policies and procedures and is responsible for approving and reporting to the Board all fair value determinations.
The Fund categorizes the inputs to valuation techniques used to value its investments into a disclosure hierarchy consisting of three levels as shown below:
Level 1 - quoted prices in active markets for identical investments
Level 2 - other significant observable inputs (including quoted prices for similar investments, interest rates, prepayment speeds, etc.)
Level 3 - unobservable inputs (including the Fund's own assumptions based on the best information available)
Valuation techniques used to value the Fund's investments by major category are as follows:
Equity securities, including restricted securities, for which market quotations are readily available, are valued at the last reported sale price or official closing price as reported by a third party pricing vendor on the primary market or exchange on which they are traded and are categorized as Level 1 in the hierarchy. In the event there were no sales during the day or closing prices are not available, securities are valued at the last quoted bid price or may be valued using the last available price and are generally categorized as Level 2 in the hierarchy. For foreign equity securities, when market or security specific events arise, comparisons to the valuation of American Depositary Receipts (ADRs), futures contracts, Exchange-Traded Funds (ETFs) and certain indexes as well as quoted prices for similar securities may be used and would be categorized as Level 2 in the hierarchy. Utilizing these techniques may result in transfers between Level 1 and Level 2. For equity securities, including restricted securities, where observable inputs are limited, assumptions about market activity and risk are used and these securities may be categorized as Level 3 in the hierarchy.
Annual Report
3. Significant Accounting Policies - continued
Investment Valuation - continued
Investments in open-end mutual funds, including the Fidelity Central Funds, are valued at their closing net asset value (NAV) each business day and are categorized as Level 1 in the hierarchy.
Changes in valuation techniques may result in transfers in or out of an assigned level within the disclosure hierarchy. The aggregate value of investments by input level, as of October 31, 2014, including information on transfers between Levels 1 and 2 is included at the end of the Fund's Schedule of Investments.
Foreign Currency. The Fund may use foreign currency contracts to facilitate transactions in foreign-denominated securities. Gains and losses from these transactions may arise from changes in the value of the foreign currency or if the counterparties do not perform under the contracts' terms.
Foreign-denominated assets, including investment securities, and liabilities are translated into U.S. dollars at the exchange rates at period end. Purchases and sales of investment securities, income and dividends received and expenses denominated in foreign currencies are translated into U.S. dollars at the exchange rate in effect on the transaction date.
The effects of exchange rate fluctuations on investments are included with the net realized and unrealized gain (loss) on investment securities. Other foreign currency transactions resulting in realized and unrealized gain (loss) are disclosed separately.
Investment Transactions and Income. For financial reporting purposes, the Fund's investment holdings and NAV include trades executed through the end of the last business day of the period. The NAV per share for processing shareholder transactions is calculated as of the close of business of the New York Stock Exchange (NYSE), normally 4:00 p.m. Eastern time and includes trades executed through the end of the prior business day. Gains and losses on securities sold are determined on the basis of identified cost and may include proceeds received from litigation. Dividend income is recorded on the ex-dividend date, except for certain dividends from foreign securities where the ex-dividend date may have passed, which are recorded as soon as the Fund is informed of the ex-dividend date. Non-cash dividends included in dividend income, if any, are recorded at the fair market value of the securities received. Income and capital gain distributions from Fidelity Central Funds, if any, are recorded on the ex-dividend date. Distributions received on securities that represent a return of capital or capital gain are recorded as a reduction of cost of investments and/or as a realized gain. Subsequent to ex-dividend date the Fund determines the components of these distributions, based upon receipt of tax filings or other correspondence relating to the underlying investment. Investment income is recorded net of foreign taxes withheld where recovery of such taxes is uncertain.
Annual Report
Notes to Financial Statements - continued
3. Significant Accounting Policies - continued
Class Allocations and Expenses. Investment income, realized and unrealized capital gains and losses, common expenses of the Fund, and certain fund-level expense reductions, if any, are allocated daily on a pro-rata basis to each class based on the relative net assets of each class to the total net assets of the Fund. Each class differs with respect to transfer agent and distribution and service plan fees incurred. Certain expense reductions may also differ by class. For the reporting period, the allocated portion of income and expenses to each class as a percent of its average net assets may vary due to the timing of recording these transactions in relation to fluctuating net assets of the classes. Expenses directly attributable to a fund are charged to that fund. Expenses attributable to more than one fund are allocated among the respective funds on the basis of relative net assets or other appropriate methods. Expense estimates are accrued in the period to which they relate and adjustments are made when actual amounts are known.
Income Tax Information and Distributions to Shareholders. Each year, the Fund intends to qualify as a regulated investment company under Subchapter M of the Internal Revenue Code, including distributing substantially all of its taxable income and realized gains. As a result, no provision for U.S. Federal income taxes is required. As of October 31, 2014, the Fund did not have any unrecognized tax benefits in the financial statements; nor is the Fund aware of any tax positions for which it is reasonably possible that the total amounts of unrecognized tax benefits will significantly change in the next twelve months. The Fund files a U.S. federal tax return, in addition to state and local tax returns as required. The Fund's federal income tax returns are subject to examination by the Internal Revenue Service (IRS) for a period of three fiscal years after they are filed. State and local tax returns may be subject to examination for an additional fiscal year depending on the jurisdiction. Foreign taxes are provided for based on the Fund's understanding of the tax rules and rates that exist in the foreign markets in which it invests. The Fund is subject to a tax imposed on capital gains by certain countries in which it invests. An estimated deferred tax liability for net unrealized appreciation on the applicable securities is included in Other payables and accrued expenses on the Statement of Assets & Liabilities. In 2004, the Fund received a ruling from the Authority for Advance Ruling in India regarding the applicability of taxes imposed by the country on short term realized capital gains under the US/India tax treaty. The ruling entitled the Fund to a refund of capital gains taxes paid in prior years and exempted the Fund from taxes on future short term realized gains. A 2014 change to the Indian tax laws, published on August 12, 2014 and effective retroactive to April 1, 2014, invalidated this 2004 ruling and mandates that all short term gains realized by any Foreign Institutional Investor be treated and taxed as capital gains. As a result, the Fund recorded a tax liability of $1,757,881 on August 12, 2014. This amount includes taxes due on short term gains realized during the period April 1 through August 12 and an estimated accrual for deferred taxes on net unrealized appreciation on applicable securities. The new law does not impact the favorable tax treatment that the Fund received prior to April 1, 2014.
Annual Report
3. Significant Accounting Policies - continued
Income Tax Information and Distributions to Shareholders - continued
Distributions are declared and recorded on the ex-dividend date. Income dividends and capital gain distributions are declared separately for each class. Income and capital gain distributions are determined in accordance with income tax regulations, which may differ from GAAP. In addition, the Fund claimed a portion of the payment made to redeeming shareholders as a distribution for income tax purposes.
Capital accounts within the financial statements are adjusted for permanent book-tax differences. These adjustments have no impact on net assets or the results of operations. Capital accounts are not adjusted for temporary book-tax differences which will reverse in a subsequent period.
Book-tax differences are primarily due to foreign currency transactions, certain foreign taxes, passive foreign investment companies (PFIC) and losses deferred due to wash sales.
The federal tax cost of investment securities and unrealized appreciation (depreciation) as of period end were as follows:
Gross unrealized appreciation | $ 56,044,425 |
Gross unrealized depreciation | (10,601,449) |
Net unrealized appreciation (depreciation) on securities | $ 45,442,976 |
| |
Tax Cost | $ 257,795,755 |
The tax-based components of distributable earnings as of period end were as follows:
Undistributed ordinary income | $ 2,615,256 |
Undistributed long-term capital gain | $ 14,528,510 |
Net unrealized appreciation (depreciation) on securities and other investments | $ 45,392,633 |
The tax character of distributions paid was as follows:
| October 31, 2014 | October 31, 2013 |
Ordinary Income | $ 2,011,362 | $ 4,205,209 |
Long-term Capital Gains | 13,483,906 | - |
Total | $ 15,495,268 | $ 4,205,209 |
Short-Term Trading (Redemption) Fees. Shares held by investors in the Fund less than 90 days may have been subject to a redemption fee equal to 1.50% of the NAV of shares redeemed. All redemption fees, which reduce the proceeds of the shareholder redemption, are retained by the Fund and accounted for as an addition to paid in capital.
New Accounting Pronouncement. In June 2014, the Financial Accounting Standards Board issued Accounting Standard Update No. 2014-11, Repurchase-to-Maturity
Annual Report
Notes to Financial Statements - continued
3. Significant Accounting Policies - continued
New Accounting Pronouncement - continued
Transactions, Repurchase Financings, and Disclosures. The Update amends the accounting for certain repurchase agreements and expands disclosure requirements for reverse repurchase agreements, securities lending and other similar transactions. The disclosure requirements are effective for annual and interim reporting periods beginning after December 15, 2014. Management is currently evaluating the impact of the Update on the Fund's financial statements and related disclosures.
4. Purchases and Sales of Investments.
Purchases and sales of securities, other than short-term securities, aggregated $267,759,629 and $289,903,487, respectively.
5. Fees and Other Transactions with Affiliates.
Management Fee. Fidelity Management & Research Company (the investment adviser) and its affiliates provide the Fund with investment management related services for which the Fund pays a monthly management fee. The management fee is the sum of an individual fund fee rate that is based on an annual rate of .45% of the Fund's average net assets and an annualized group fee rate that averaged .25% during the period. The group fee rate is based upon the average net assets of all the mutual funds advised by the investment adviser, including any mutual funds previously advised by the investment adviser that are currently advised by Fidelity SelectCo, LLC, an affiliate of the investment adviser. The group fee rate decreases as assets under management increase and increases as assets under management decrease. For the reporting period, the total annual management fee rate was .70% of the Fund's average net assets.
Distribution and Service Plan Fees. In accordance with Rule 12b-1 of the 1940 Act, the Fund has adopted separate Distribution and Service Plans for each class of shares. Certain classes pay Fidelity Distributors Corporation (FDC), an affiliate of the investment adviser, separate Distribution and Service Fees, each of which is based on an annual percentage of each class' average net assets. In addition, FDC may pay financial intermediaries for selling shares of the Fund and providing shareholder support services. For the period, the Distribution and Service Fee rates, total fees and amounts retained by FDC were as follows:
| Distribution
Fee | Service
Fee | Total Fees | Retained
by FDC |
Class A | -% | .25% | $ 370,136 | $ 3,699 |
Class T | .25% | .25% | 223,942 | 2,149 |
Class B | .75% | .25% | 79,813 | 59,963 |
Class C | .75% | .25% | 571,803 | 37,838 |
| | | $ 1,245,694 | $ 103,649 |
Annual Report
5. Fees and Other Transactions with Affiliates - continued
Sales Load. FDC may receive a front-end sales charge of up to 5.75% for selling Class A shares and 3.50% for selling Class T shares, some of which is paid to financial intermediaries for selling shares of the Fund. Depending on the holding period, FDC may receive contingent deferred sales charges levied on Class A, Class T, Class B, and Class C redemptions. The deferred sales charges range from 5.00% to 1.00% for Class B shares, 1.00% for Class C shares, 1.00% for certain purchases of Class A shares and .25% for certain purchases of Class T shares.
For the period, sales charge amounts retained by FDC were as follows:
| Retained
by FDC |
Class A | $ 34,572 |
Class T | 7,281 |
Class B* | 10,030 |
Class C* | 1,697 |
| $ 53,580 |
* When Class B and Class C shares are initially sold, FDC pays commissions from its own resources to financial intermediaries through which the sales are made.
Transfer Agent Fees. Fidelity Investments Institutional Operations Company, Inc., (FIIOC), an affiliate of the investment adviser, is the transfer, dividend disbursing and shareholder servicing agent for each class of the Fund. FIIOC receives account fees and asset-based fees that vary according to the account size and type of account of the shareholders of the respective classes of the Fund. FIIOC pays for typesetting, printing and mailing of shareholder reports, except proxy statements.
For the period, transfer agent fees for each class were as follows:
| Amount | % of
Class-Level
Average
Net Assets |
Class A | $ 382,080 | .26 |
Class T | 138,983 | .31 |
Class B | 24,128 | .30 |
Class C | 143,764 | .25 |
Institutional Class | 86,333 | .21 |
| $ 775,288 | |
Accounting and Security Lending Fees. Fidelity Service Company, Inc. (FSC), an affiliate of the investment adviser, maintains the Fund's accounting records. The accounting fee is based on the level of average net assets for each month. Under a separate contract, FSC administers the security lending program. The security lending fee is based on the number and duration of lending transactions.
Annual Report
Notes to Financial Statements - continued
5. Fees and Other Transactions with Affiliates - continued
Brokerage Commissions. The Fund placed a portion of its portfolio transactions with brokerage firms which are affiliates of the investment adviser. Brokerage commissions are included in net realized gain (loss) and change in net unrealized appreciation (depreciation) in the Statement of Operations. The commissions paid to these affiliated firms were $674 for the period.
Interfund Lending Program. Pursuant to an Exemptive Order issued by the SEC, the Fund, along with other registered investment companies having management contracts with FMR or other affiliated entities of FMR, may participate in an interfund lending program. This program provides an alternative credit facility allowing the funds to borrow from, or lend money to, other participating affiliated funds. At period end, there were no interfund loans outstanding. The Fund's activity in this program during the period for which loans were outstanding was as follows:
Borrower or Lender | Average Loan Balance | Weighted Average Interest Rate | Interest Expense |
Borrower | $ 3,034,143 | .31% | $ 184 |
6. Committed Line of Credit.
The Fund participates with other funds managed by the investment adviser or an affiliate in a $4.25 billion credit facility (the "line of credit") to be utilized for temporary or emergency purposes to fund shareholder redemptions or for other short-term liquidity purposes. The Fund has agreed to pay commitment fees on its pro-rata portion of the line of credit, which amounted to $487 and is reflected in Miscellaneous expenses on the Statement of Operations. During the period, the Fund did not borrow on this line of credit.
7. Security Lending.
The Fund lends portfolio securities through a lending agent from time to time in order to earn additional income. For equity securities, a lending agent is used and may loan securities to certain qualified borrowers, including Fidelity Capital Markets (FCM), a broker-dealer affiliated with the Fund. On the settlement date of the loan, the Fund receives collateral (in the form of U.S. Treasury obligations, letters of credit and/or cash) against the loaned securities and maintains collateral in an amount not less than 100% of the market value of the loaned securities during the period of the loan. The market value of the loaned securities is determined at the close of business of the Fund and any additional required collateral is delivered to the Fund on the next business day. If the borrower defaults on its obligation to return the securities loaned because of insolvency or other reasons, the Fund may apply collateral received from the borrower against the
Annual Report
7. Security Lending - continued
obligation. The Fund may experience delays and costs in recovering the securities loaned. Any cash collateral received is invested in the Fidelity Securities Lending Cash Central Fund. The value of loaned securities and cash collateral at period end are disclosed on the Fund's Statement of Assets and Liabilities. Security lending income represents the income earned on investing cash collateral, less rebates paid to borrowers and any lending agent fees associated with the loan, plus any premium payments received for lending certain types of securities. Security lending income is presented in the Statement of Operations as a component of income from Fidelity Central Funds. Total security lending income during the period amounted to $6,519. During the period, there were no securities loaned to FCM.
8. Distributions to Shareholders.
Distributions to shareholders of each class were as follows:
Years ended October 31, | 2014 | 2013 |
From net investment income | | |
Class A | $ 1,258,600 | $ 1,813,789 |
Class T | 253,592 | 420,491 |
Class B | - | 51,393 |
Class C | 67,365 | 298,953 |
Institutional Class | 431,805 | 553,030 |
Total | $ 2,011,362 | $ 3,137,656 |
From net realized gain | | |
Class A | $ 6,564,461 | $ 507,200 |
Class T | 2,044,109 | 157,899 |
Class B | 453,142 | 51,958 |
Class C | 2,799,874 | 227,303 |
Institutional Class | 1,622,320 | 123,193 |
Total | $ 13,483,906 | $ 1,067,553 |
9. Share Transactions.
Share transactions for each class were as follows and may contain automatic conversions between classes or exchanges between funds:
| Shares | Shares | Dollars | Dollars |
Years ended October 31, | 2014 | 2013 | 2014 | 2013 |
Class A | | | | |
Shares sold | 573,747 | 824,496 | $ 17,697,836 | $ 24,773,595 |
Reinvestment of distributions | 228,279 | 67,510 | 6,811,859 | 1,994,909 |
Shares redeemed | (1,220,608) | (1,500,614) | (37,276,981) | (44,694,536) |
Net increase (decrease) | (418,582) | (608,608) | $ (12,767,286) | $ (17,926,032) |
Annual Report
Notes to Financial Statements - continued
9. Share Transactions - continued
| Shares | Shares | Dollars | Dollars |
Years ended October 31, | 2014 | 2013 | 2014 | 2013 |
Class T | | | | |
Shares sold | 138,080 | 210,810 | $ 4,191,092 | $ 6,182,895 |
Reinvestment of distributions | 77,360 | 19,545 | 2,251,960 | 564,060 |
Shares redeemed | (345,644) | (425,275) | (10,192,417) | (12,356,062) |
Net increase (decrease) | (130,204) | (194,920) | $ (3,749,365) | $ (5,609,107) |
Class B | | | | |
Shares sold | 8,605 | 10,130 | $ 250,322 | $ 286,596 |
Reinvestment of distributions | 13,707 | 3,105 | 380,925 | 85,708 |
Shares redeemed | (148,296) | (253,486) | (4,170,831) | (7,070,284) |
Net increase (decrease) | (125,984) | (240,251) | $ (3,539,584) | $ (6,697,980) |
Class C | | | | |
Shares sold | 212,902 | 303,601 | $ 6,070,821 | $ 8,446,000 |
Reinvestment of distributions | 89,602 | 15,990 | 2,461,356 | 436,858 |
Shares redeemed | (497,988) | (699,221) | (13,805,000) | (19,141,307) |
Net increase (decrease) | (195,484) | (379,630) | $ (5,272,823) | $ (10,258,449) |
Institutional Class | | | | |
Shares sold | 1,068,125 | 392,380 | $ 34,572,790 | $ 12,135,351 |
Reinvestment of distributions | 52,027 | 17,860 | 1,594,630 | 541,525 |
Shares redeemed | (770,899) | (632,861) | (24,061,907) | (19,472,513) |
Net increase (decrease) | 349,253 | (222,621) | $ 12,105,513 | $ (6,795,637) |
10. Other.
The Fund's organizational documents provide former and current trustees and officers with a limited indemnification against liabilities arising in connection with the performance of their duties to the Fund. In the normal course of business, the Fund may also enter into contracts that provide general indemnifications. The Fund's maximum exposure under these arrangements is unknown as this would be dependent on future claims that may be made against the Fund. The risk of material loss from such claims is considered remote.
Annual Report
To the Trustees of Fidelity Advisor Series VIII and the Shareholders of Fidelity Advisor Emerging Asia Fund:
In our opinion, the accompanying statement of assets and liabilities, including the schedule of investments, and the related statements of operations and of changes in net assets and the financial highlights present fairly, in all material respects, the financial position of Fidelity Advisor Emerging Asia Fund (a fund of Fidelity Advisor Series VIII) at October 31, 2014, the results of its operations for the year then ended, the changes in its net assets for each of the two years in the period then ended and the financial highlights for each of the five years in the period then ended, in conformity with accounting principles generally accepted in the United States of America. These financial statements and financial highlights (hereafter referred to as "financial statements") are the responsibility of the Fidelity Advisor Emerging Asia Fund's management. Our responsibility is to express an opinion on these financial statements based on our audits. We conducted our audits of these financial statements in accordance with the standards of the Public Company Accounting Oversight Board (United States). Those standards require that we plan and perform the audit to obtain reasonable assurance about whether the financial statements are free of material misstatement. An audit includes examining, on a test basis, evidence supporting the amounts and disclosures in the financial statements, assessing the accounting principles used and significant estimates made by management, and evaluating the overall financial statement presentation. We believe that our audits, which included confirmation of securities at October 31, 2014 by correspondence with the custodian and brokers, provide a reasonable basis for our opinion.
PricewaterhouseCoopers LLP
Boston, Massachusetts
December 23, 2014
Annual Report
The Trustees, Member of the Advisory Board, and officers of the trust and fund, as applicable, are listed below. The Board of Trustees governs the fund and is responsible for protecting the interests of shareholders. The Trustees are experienced executives who meet periodically throughout the year to oversee the fund's activities, review contractual arrangements with companies that provide services to the fund, oversee management of the risks associated with such activities and contractual arrangements, and review the fund's performance. Except for James C. Curvey, each of the Trustees oversees 174 funds. Mr. Curvey oversees 407 funds.
The Trustees hold office without limit in time except that (a) any Trustee may resign; (b) any Trustee may be removed by written instrument, signed by at least two-thirds of the number of Trustees prior to such removal; (c) any Trustee who requests to be retired or who has become incapacitated by illness or injury may be retired by written instrument signed by a majority of the other Trustees; and (d) any Trustee may be removed at any special meeting of shareholders by a two-thirds vote of the outstanding voting securities of the trust. Each Trustee who is not an interested person (as defined in the 1940 Act) of the trust and the fund (Independent Trustee), shall retire not later than the last day of the calendar year in which his or her 75th birthday occurs. The Independent Trustees may waive this mandatory retirement age policy with respect to individual Trustees. The officers and Advisory Board Member hold office without limit in time, except that any officer and Advisory Board Member may resign or may be removed by a vote of a majority of the Trustees at any regular meeting or any special meeting of the Trustees. Except as indicated, each individual has held the office shown or other offices in the same company for the past five years.
Experience, Skills, Attributes, and Qualifications of the Fund's Trustees. The Governance and Nominating Committee has adopted a statement of policy that describes the experience, qualifications, attributes, and skills that are necessary and desirable for potential Independent Trustee candidates (Statement of Policy). The Board believes that each Trustee satisfied at the time he or she was initially elected or appointed a Trustee, and continues to satisfy, the standards contemplated by the Statement of Policy. The Governance and Nominating Committee also engages professional search firms to help identify potential Independent Trustee candidates who have the experience, qualifications, attributes, and skills consistent with the Statement of Policy. From time to time, additional criteria based on the composition and skills of the current Independent Trustees, as well as experience or skills that may be appropriate in light of future changes to board composition, business conditions, and regulatory or other developments, have also been considered by the professional search firms and the Governance and Nominating Committee. In addition, the Board takes into account the Trustees' commitment and participation in Board and committee meetings, as well as their leadership of standing and ad hoc committees throughout their tenure.
In determining that a particular Trustee was and continues to be qualified to serve as a Trustee, the Board has considered a variety of criteria, none of which, in isolation, was controlling. The Board believes that, collectively, the Trustees have balanced and diverse experience, qualifications, attributes, and skills, which allow the Board to operate effectively in governing the fund and protecting the interests of shareholders. Information about the specific experience, skills, attributes, and qualifications of each Trustee, which in each case led to the Board's conclusion that the Trustee should serve (or continue to serve) as a trustee of the fund, is provided below.
Annual Report
Board Structure and Oversight Function. James C. Curvey is an interested person (as defined in the 1940 Act) and currently serves as Chairman. The Trustees have determined that an interested Chairman is appropriate and benefits shareholders because an interested Chairman has a personal and professional stake in the quality and continuity of services provided to the fund. Independent Trustees exercise their informed business judgment to appoint an individual of their choosing to serve as Chairman, regardless of whether the Trustee happens to be independent or a member of management. The Independent Trustees have determined that they can act independently and effectively without having an Independent Trustee serve as Chairman and that a key structural component for assuring that they are in a position to do so is for the Independent Trustees to constitute a substantial majority for the Board. The Independent Trustees also regularly meet in executive session. Ned C. Lautenbach serves as Chairman of the Independent Trustees and as such (i) acts as a liaison between the Independent Trustees and management with respect to matters important to the Independent Trustees and (ii) with management prepares agendas for Board meetings.
Fidelity funds are overseen by different Boards of Trustees. The fund's Board oversees Fidelity's equity and high income funds and another Board oversees Fidelity's investment-grade bond, money market, and asset allocation funds. The asset allocation funds may invest in Fidelity funds overseen by the fund's Board. The use of separate Boards, each with its own committee structure, allows the Trustees of each group of Fidelity funds to focus on the unique issues of the funds they oversee, including common research, investment, and operational issues. On occasion, the separate Boards establish joint committees to address issues of overlapping consequences for the Fidelity funds overseen by each Board.
The Trustees operate using a system of committees to facilitate the timely and efficient consideration of all matters of importance to the Trustees, the fund, and fund shareholders and to facilitate compliance with legal and regulatory requirements and oversight of the fund's activities and associated risks. The Board, acting through its committees, has charged FMR and its affiliates with (i) identifying events or circumstances the occurrence of which could have demonstrably adverse effects on the fund's business and/or reputation; (ii) implementing processes and controls to lessen the possibility that such events or circumstances occur or to mitigate the effects of such events or circumstances if they do occur; and (iii) creating and maintaining a system designed to evaluate continuously business and market conditions in order to facilitate the identification and implementation processes described in (i) and (ii) above. Because the day-to-day operations and activities of the fund are carried out by or through FMR, its affiliates and other service providers, the fund's exposure to risks is mitigated but not eliminated by the processes overseen by the Trustees. While each of the Board's committees has responsibility for overseeing different aspects of the fund's activities, oversight is exercised primarily through the Operations, Audit, and Compliance Committees. In addition, the Independent Trustees have worked with FMR to enhance the Board's oversight of investment and financial risks, legal and regulatory risks, technology risks, and operational risks, including the development of additional risk reporting to the Board. For example, a working group comprised of Independent Trustees and FMR has worked and continues to work to review the Fidelity funds' valuation-related activities, reporting and risk management. Appropriate personnel, including but not limited to the fund's Chief Compliance Officer (CCO), FMR's internal auditor, the independent accountants, the fund's Treasurer and portfolio management personnel, make periodic reports to the Board's committees, as appropriate, including an annual review of FMR's risk management program for the Fidelity funds. The responsibilities of each standing committee, including their oversight responsibilities, are described further under "Standing Committees of the Fund's Trustees."
Annual Report
Trustees and Officers - continued
The fund's Statement of Additional Information (SAI) includes more information about the Trustees. To request a free copy, call Fidelity at 1-877-208-0098.
Interested Trustees*:
Correspondence intended for each Trustee who is an interested person may be sent to Fidelity Investments, 245 Summer Street, Boston, Massachusetts 02210.
Name, Year of Birth; Principal Occupations and Other Relevant Experience+ |
James C. Curvey (1935) |
Year of Election or Appointment: 2007 Trustee Chairman of the Board of Trustees |
| Mr. Curvey also serves as Trustee of other Fidelity funds. Mr. Curvey is a Director of Fidelity Research & Analysis Co. (2009-present), and Vice Chairman (2007-present) and Director of FMR LLC. In addition, Mr. Curvey serves as an Overseer for the Boston Symphony Orchestra and a member of the board of Artis-Naples, Naples, Florida, and as a Trustee for Brewster Academy, Wolfeboro, New Hampshire. Previously, Mr. Curvey served as a Director of Fidelity Investments Money Management, Inc. (2009-2014), a Director of FMR (2007-2014), and a Director of FMR Co., Inc. (2007-2014). |
Charles S. Morrison (1960) |
Year of Election or Appointment: 2014 Trustee |
| Mr. Morrison also serves as Trustee of other funds. He serves as a Director of Fidelity Investments Money Management, Inc. (FIMM) (2014-present), Director of Fidelity SelectCo, LLC (2014-present), President, Asset Management (2014-present), and is an employee of Fidelity Investments. Previously, Mr. Morrison served as Vice President of Fidelity's Fixed Income and Asset Allocation Funds (2012-2014), President, Fixed Income (2011-2014), Vice President of Fidelity's Money Market Funds (2005-2009), President, Money Market Group Leader of FMR (2009), and Senior Vice President, Money Market Group of FMR (2004-2009). Mr. Morrison also served as Vice President of Fidelity's Bond Funds (2002-2005), certain Balanced Funds (2002-2005), and certain Asset Allocation Funds (2002-2007), and as Senior Vice President (2002-2005) of Fidelity's Bond Division. |
* Trustees have been determined to be "Interested Trustees" by virtue of, among other things, their affiliation with the trust or various entities under common control with FMR.
+ The information above includes each Trustee's principal occupation during the last five years and other information relating to the experience, attributes, and skills relevant to each Trustee's qualifications to serve as a Trustee, which led to the conclusion that each Trustee should serve as a Trustee for the fund.
Annual Report
Trustees and Officers - continued
Independent Trustees:
Correspondence intended for each Independent Trustee (that is, the Trustees other than the Interested Trustees) may be sent to Fidelity Investments, P.O. Box 55235, Boston, Massachusetts 02205-5235.
Name, Year of Birth; Principal Occupations and Other Relevant Experience+ |
Dennis J. Dirks (1948) |
Year of Election or Appointment: 2005 Trustee |
| Mr. Dirks also serves as Trustee of other Fidelity funds. Prior to his retirement in May 2003, Mr. Dirks was Chief Operating Officer and a member of the Board of The Depository Trust & Clearing Corporation (DTCC). He also served as President, Chief Operating Officer, and Board member of The Depository Trust Company (DTC) and President and Board member of the National Securities Clearing Corporation (NSCC). In addition, Mr. Dirks served as Chief Executive Officer and Board member of the Government Securities Clearing Corporation, Chief Executive Officer and Board member of the Mortgage-Backed Securities Clearing Corporation, as a Trustee and a member of the Finance Committee of Manhattan College (2005-2008), and as a Trustee and a member of the Finance Committee of AHRC of Nassau County (2006-2008). Mr. Dirks is a member of the Independent Directors Council (IDC) Governing Council (2010-present) and Board of Directors for The Brookville Center for Children's Services, Inc. (2009-present). |
Alan J. Lacy (1953) |
Year of Election or Appointment: 2008 Trustee |
| Mr. Lacy also serves as Trustee of other Fidelity funds. Mr. Lacy serves as Senior Adviser (2007-present) of Oak Hill Capital Partners, L.P. (private equity). Mr. Lacy also served as Chief Executive Officer (2000-2005) and Vice Chairman (2005-2006) of Sears Holdings Corporation and Sears, Roebuck and Co. (retail). In addition, Mr. Lacy serves as a member of the Board of Directors of Dave & Buster's Entertainment, Inc. (restaurant and entertainment complexes, 2010-present), Earth Fare, Inc. (retail grocery, 2012-present), The Hillman Companies, Inc. (hardware wholesalers, 2010-present), and Bristol-Myers Squibb Company (global pharmaceuticals, 2008-present). Mr. Lacy is a member of the Board of Trustees of The National Parks Conservation Association (2006-present). Previously, Mr. Lacy served as Chairman of the Board of Trustees of the National Parks Conservation Association (2008-2011) and as a member of the Board of Directors for the Western Union Company (global money transfer, 2006-2011). |
Ned C. Lautenbach (1944) |
Year of Election or Appointment: 2000 Trustee Chairman of the Independent Trustees |
| Mr. Lautenbach also serves as Trustee of other Fidelity funds. Mr. Lautenbach currently serves as the Lead Director of the Eaton Corporation Board of Directors (diversified industrial, 1997-present). Mr. Lautenbach is Chairman of the Board of Directors of the Philharmonic Center for the Arts in Naples, Florida (2012-present) and a member of the Council on Foreign Relations (1994-present). Previously, Mr. Lautenbach was a Partner/Advisory Partner at Clayton, Dubilier & Rice, LLC (private equity investment, 1998-2010), as well as a Director of Sony Corporation (2006-2007). |
Joseph Mauriello (1944) |
Year of Election or Appointment: 2008 Trustee |
| Mr. Mauriello also serves as Trustee of other Fidelity funds. Prior to his retirement in January 2006, Mr. Mauriello served in numerous senior management positions including Deputy Chairman and Chief Operating Officer (2004-2005), and Vice Chairman of Financial Services (2002-2004) of KPMG LLP US (professional services, 1965-2005). Mr. Mauriello currently serves as a member of the Board of Directors of XL Group plc. (global insurance and re-insurance, 2006-present). Previously, Mr. Mauriello served as a Director of the Hamilton Funds of the Bank of New York (2006-2007) and of Arcadia Resources Inc. (health care services and products, 2007-2012). |
Robert W. Selander (1950) |
Year of Election or Appointment: 2011 Trustee |
| Mr. Selander also serves as Trustee of other Fidelity funds. Previously, Mr. Selander served as a Member of the Advisory Board of other Fidelity funds (2011), and Executive Vice Chairman (2010), Chief Executive Officer (2009-2010), and President and Chief Executive Officer (1997-2009) of Mastercard, Inc. |
Cornelia M. Small (1944) |
Year of Election or Appointment: 2005 Trustee |
| Ms. Small also serves as Trustee of other Fidelity funds. Ms. Small is a member of the Board of Directors (2009-present) and Chair of the Investment Committee (2010-present) of the Teagle Foundation. Ms. Small also serves on the Investment Committee of the Berkshire Taconic Community Foundation (2008-present). Previously, Ms. Small served as Chairperson (2002-2008) and a member of the Investment Committee and Chairperson (2008-2012) and a member of the Board of Trustees of Smith College. In addition, Ms. Small served as Chief Investment Officer, Director of Global Equity Investments, and a member of the Board of Directors of Scudder, Stevens & Clark and Scudder Kemper Investments. |
William S. Stavropoulos (1939) |
Year of Election or Appointment: 2001 Trustee Vice Chairman of the Independent Trustees |
| Mr. Stavropoulos also serves as Trustee of other Fidelity funds. Mr. Stavropoulos serves as President and Founder of the Michigan Baseball Foundation, the Great Lakes Loons (2007-present). Mr. Stavropoulos is Chairman Emeritus of the Board of Directors of The Dow Chemical Company, where he previously served in numerous senior management positions, including President, CEO (1995-2000; 2002-2004), Chairman of the Executive Committee (2000-2006), and as a member of the Board of Directors (1990-2006). Currently, Mr. Stavropoulos is Chairman of the Board of Directors of Univar Inc. (global distributor of commodity and specialty chemicals), a Director of Teradata Corporation (data warehousing and technology solutions), and Maersk Inc. (industrial conglomerate), and a member of the Advisory Board for Metalmark Capital LLC (private equity investment, 2005-present). Mr. Stavropoulos is an operating advisor to Clayton, Dubilier & Rice, LLC (private equity investment). In addition, Mr. Stavropoulos is a member of the University of Notre Dame Advisory Council for the College of Science, a Trustee of the Rollin L. Gerstacker Foundation, and a Director of the Naples Philharmonic Center for the Arts. Previously, Mr. Stavropoulos served as a Director of Chemical Financial Corporation (bank holding company, 1993-2012) and Tyco International, Ltd. (multinational manufacturing and services, 2007-2012). |
David M. Thomas (1949) |
Year of Election or Appointment: 2008 Trustee |
| Mr. Thomas also serves as Trustee of other Fidelity funds. Mr. Thomas serves as Non-Executive Chairman of the Board of Directors of Fortune Brands Home and Security (home and security products, 2011-present), and as a member of the Board of Directors of Interpublic Group of Companies, Inc. (marketing communication, 2004-present). Previously, Mr. Thomas served as Executive Chairman (2005-2006) and Chairman and Chief Executive Officer (2000-2005) of IMS Health, Inc. (pharmaceutical and healthcare information solutions), and a Director of Fortune Brands, Inc. (consumer products, 2000-2011). |
+ The information above includes each Trustee's principal occupation during the last five years and other information relating to the experience, attributes, and skills relevant to each Trustee's qualifications to serve as a Trustee, which led to the conclusion that each Trustee should serve as a Trustee for the fund.
Advisory Board Member and Officers:
Correspondence intended for each officer and Peter S. Lynch may be sent to Fidelity Investments, 245 Summer Street, Boston, Massachusetts 02210. Officers appear below in alphabetical order.
Name, Year of Birth; Principal Occupation |
Peter S. Lynch (1944) |
Year of Election or Appointment: 2003 Member of the Advisory Board |
| Mr. Lynch also serves as Member of the Advisory Board of other Fidelity funds. Mr. Lynch is Vice Chairman and a Director of FMR and FMR Co., Inc. In addition, Mr. Lynch serves as a Trustee of Boston College and as the Chairman of the Inner-City Scholarship Fund. Previously, Mr. Lynch served on the Special Olympics International Board of Directors (1997-2006). |
Elizabeth Paige Baumann (1968) |
Year of Election or Appointment: 2012 Anti-Money Laundering (AML) Officer |
| Ms. Baumann also serves as AML Officer of other funds. She is Chief AML Officer of FMR LLC (2012-present) and is an employee of Fidelity Investments. Previously, Ms. Baumann served as Vice President and Deputy Anti-Money Laundering Officer (2007-2012). |
William C. Coffey (1969) |
Year of Election or Appointment: 2009 Assistant Secretary |
| Mr. Coffey also serves as Assistant Secretary of other funds. He is Senior Vice President and Deputy General Counsel of FMR LLC (2010-present), and is an employee of Fidelity Investments. Previously, Mr. Coffey served as Vice President and Associate General Counsel of FMR LLC (2005-2009). |
Timothy M. Cohen (1969) |
Year of Election or Appointment: 2014 Vice President of certain Equity Funds |
| Mr. Cohen also serves as Vice President of other funds. Mr. Cohen serves as a Director and Chief Compliance Officer of Fidelity Management & Research (U.K.) Inc. (2013-present) and is an employee of Fidelity Investments. |
Jonathan Davis (1968) |
Year of Election or Appointment: 2010 Assistant Treasurer |
| Mr. Davis also serves as Assistant Treasurer of other funds. Mr. Davis is an employee of Fidelity Investments. Previously, Mr. Davis served as Vice President and Associate General Counsel of FMR LLC (2003-2010). |
Adrien E. Deberghes (1967) |
Year of Election or Appointment: 2008 Deputy Treasurer |
| Mr. Deberghes also serves as an officer of other funds. He is an employee of Fidelity Investments (2008-present). Prior to joining Fidelity Investments, Mr. Deberghes was Senior Vice President of Mutual Fund Administration at State Street Corporation (2007-2008), Senior Director of Mutual Fund Administration at Investors Bank & Trust (2005-2007), and Director of Finance for Dunkin' Brands (2000-2005). |
Stephanie J. Dorsey (1969) |
Year of Election or Appointment: 2010 Assistant Treasurer |
| Ms. Dorsey also serves as an officer of other funds. She is an employee of Fidelity Investments (2008-present) and has served in other fund officer roles. Prior to joining Fidelity Investments, Ms. Dorsey served as Treasurer (2004-2008) of the JPMorgan Mutual Funds and Vice President (2004-2008) of JPMorgan Chase Bank. |
Howard J. Galligan III (1966) |
Year of Election or Appointment: 2014 Chief Financial Officer |
| Mr. Galligan also serves as Chief Financial Officer of other funds. Mr. Galligan serves as President of Fidelity Pricing and Cash Management Services (FPCMS) (2014-present) and as a Director of Strategic Advisers, Inc. (2008-present). Previously, Mr. Galligan served as Chief Administrative Officer of Asset Management (2011-2014) and Chief Operating Officer and Senior Vice President of Investment Support for Strategic Advisers, Inc. (2003-2011). |
Scott C. Goebel (1968) |
Year of Election or Appointment: 2008 Secretary and Chief Legal Officer (CLO) |
| Mr. Goebel serves as Secretary and CLO of other funds. Mr. Goebel also serves as Secretary of Fidelity SelectCo, LLC (2013-present), Fidelity Investments Money Management, Inc. (FIMM) (2010-present) and Fidelity Research and Analysis Company (FRAC) (2010-present); General Counsel, Secretary, and Senior Vice President of FMR (2008-present) and FMR Co., Inc. (2008-present); Chief Legal Officer of Fidelity Management & Research (Hong Kong) Limited (2008-present); and Assistant Secretary of Fidelity Management & Research (Japan) Limited (2008-present) and Fidelity Management & Research (U.K.) Inc. (2008-present). Previously, Mr. Goebel served as Secretary and CLO of other Fidelity funds (2008-2013), Assistant Secretary of FIMM (2008-2010), FRAC (2008-2010), and certain funds (2007-2008); and as Vice President and Secretary of Fidelity Distributors Corporation (FDC) (2005-2007). Mr. Goebel has been employed by FMR LLC or an affiliate since 2001. |
Brian B. Hogan (1964) |
Year of Election or Appointment: 2009 Vice President |
| Mr. Hogan also serves as Trustee or Vice President of other funds. Mr. Hogan serves as a Director of Fidelity SelectCo, LLC (2014-present) and President of FMR's Equity Division (2009-present). Previously, Mr. Hogan served as Senior Vice President, Equity Research of FMR (2006-2009) and as a portfolio manager. |
Chris Maher (1972) |
Year of Election or Appointment: 2013 Assistant Treasurer |
| Mr. Maher serves as Assistant Treasurer of other funds. Mr. Maher is Vice President of Valuation Oversight and is an employee of Fidelity Investments. Previously, Mr. Maher served as Vice President of Asset Management Compliance (2013), Vice President of FMR's Program Management Group (2010-2013), and Vice President of Valuation Oversight (2008-2010). |
Kenneth B. Robins (1969) |
Year of Election or Appointment: 2008 President and Treasurer |
| Mr. Robins also serves as an officer of other funds. Mr. Robins serves as Executive Vice President of Fidelity Investments Money Management, Inc. (FIMM) (2013-present) and is an employee of Fidelity Investments (2004-present). Previously, Mr. Robins served in other fund officer roles. |
Stephen Sadoski (1971) |
Year of Election or Appointment: 2012 Deputy Treasurer |
| Mr. Sadoski also serves as Deputy Treasurer of other funds. He is an employee of Fidelity Investments (2012-present) and has served in another fund officer role. Prior to joining Fidelity Investments, Mr. Sadoski served as an assistant chief accountant in the Division of Investment Management of the Securities and Exchange Commission (SEC) (2009-2012) and as a senior manager at Deloitte & Touche LLP (1997-2009). |
Stacie M. Smith (1974) |
Year of Election or Appointment: 2013 Deputy Treasurer |
| Ms. Smith also serves as an officer of other funds. She is an employee of Fidelity Investments (2009-present) and has served in other fund officer roles. Prior to joining Fidelity Investments, Ms. Smith served as Senior Audit Manager of Ernst & Young LLP (1996-2009). |
Renee Stagnone (1975) |
Year of Election or Appointment: 2013 Deputy Treasurer |
| Ms. Stagnone also serves as Deputy Treasurer of other funds. Ms. Stagnone is an employee of Fidelity Investments. |
Linda J. Wondrack (1964) |
Year of Election or Appointment: 2014 Chief Compliance Officer |
| Ms. Wondrack also serves as Chief Compliance Officer of other funds. Ms. Wondrack is Executive Vice President and head of the Ethics Office and Asset Management Compliance for Fidelity Investments (2012- present). Ms. Wondrack also serves as Chief Compliance Officer of Fidelity SelectCo, LLC (2014-present); Chief Compliance Officer of Impresa Management LLC (2013-present); and Chief Compliance Officer of FMR Co., Inc., Fidelity Investments Money Management, Inc., Fidelity Management & Research (Japan) Limited, Fidelity Management & Research (U.K.) Inc., Fidelity Management & Research (Hong Kong), Fidelity Management & Research Company, Pyramis Global Advisors, LLC, and Strategic Advisers, Inc., Ballyrock Investment Advisors LLC, and Northern Neck Investors LLC (2012-present). Previously, Ms. Wondrack served as Senior Vice President and Chief Compliance Officer for Columbia Management Investment Advisers, LLC (2005-2012); Chief Compliance Officer for certain funds within the Columbia Family of Funds (2007-2012); and Senior Vice President of Compliance Risk Management at Bank of America (2005-2010). |
Joseph F. Zambello (1957) |
Year of Election or Appointment: 2011 Deputy Treasurer |
| Mr. Zambello also serves as Deputy Treasurer of other funds. Mr. Zambello is an employee of Fidelity Investments. Previously, Mr. Zambello served as Vice President of FMR's Program Management Group (2009-2011) and Vice President of the Transfer Agent Oversight Group (2005-2009). |
Annual Report
The Board of Trustees of Advisor Emerging Asia Fund voted to pay to shareholders of record at the opening of business on record date, the following distributions per share derived from capital gains realized from sales of portfolio securities, and dividends derived from net investment income:
| Pay Date | Record Date | Dividends | Capital Gains |
Class A | 12/08/14 | 12/05/14 | $0.183 | $1.674 |
| | | | |
Class T | 12/08/14 | 12/05/14 | $0.078 | $1.674 |
| | | | |
Class B | 12/08/14 | 12/05/14 | $__ | $1.520 |
| | | | |
Class C | 12/08/14 | 12/05/14 | $__ | $1.617 |
The fund hereby designates as a capital gain dividend with respect to the taxable year ended October 31, 2014, $14,546,568 or, if subsequently determined to be different, the net capital gain of such year.
Class A designates 1%, Class T designates 2%, and Class C designates 4% of the dividends distributed during the fiscal year as qualifying for the dividends-received deduction for corporate shareholders.
Class A designates 100%, Class T designates 100%, and Class C designates 100% of the dividends distributed during the fiscal year as amounts which may be taken into account as a dividend for purposes of the maximum rate under section 1(h)(11) of the Internal Revenue Code.
The amounts per share which represent income derived from sources within, and taxes paid to, foreign countries or possessions of the United States are as follows:
| Pay Date | Income | Taxes |
Class A | 12/09/13 | $0.3224 | $0.0674 |
| | | |
Class T | 12/09/13 | $0.2324 | $0.0674 |
| | | |
Class C | 12/09/13 | $0.0994 | $0.0674 |
The fund will notify shareholders in January 2015 of amounts for use in preparing 2014 income tax returns.
Annual Report
Board Approval of Investment Advisory Contracts and Management Fees
Fidelity Advisor Emerging Asia Fund
Each year, the Board of Trustees, including the Independent Trustees (together, the Board), votes on the renewal of the management contract with Fidelity Management & Research Company (FMR) and the sub-advisory agreements (together, the Advisory Contracts) for the fund. The Board, assisted by the advice of fund counsel and Independent Trustees' counsel, requests and considers a broad range of information relevant to the renewal of the Advisory Contracts throughout the year.
The Board meets regularly and, at each of its meetings, covers an extensive agenda of topics and materials and considers factors that are relevant to its annual consideration of the renewal of the fund's Advisory Contracts, including the services and support provided to the fund and its shareholders. The Board has established various standing committees (Committees), each composed of and chaired by Independent Trustees with varying backgrounds, to which the Board has assigned specific subject matter responsibilities in order to enhance effective decision-making by the Board. The Board, acting directly and through its Committees, requests and receives information concerning the annual consideration of the renewal of the fund's Advisory Contracts. The Board also meets as needed to consider matters specifically related to the Board's annual consideration of the renewal of the Advisory Contracts. Members of the Board may also meet with trustees of other Fidelity funds through ad hoc joint committees to discuss certain matters relevant to the Fidelity funds.
At its July 2014 meeting, the Board, including the Independent Trustees, unanimously determined to renew the fund's Advisory Contracts. In reaching its determination, the Board considered all factors it believed relevant, including (i) the nature, extent, and quality of the services to be provided to the fund and its shareholders (including the investment performance of the fund); (ii) the competitiveness of the fund's management fee and total expense ratio relative to peer funds; (iii) the total costs of the services to be provided by and the profits to be realized by Fidelity from its relationship with the fund; (iv) the extent to which economies of scale exist and would be realized as the fund grows; and (v) whether fee levels reflect these economies of scale, if any, for the benefit of fund shareholders. In connection with separate internal corporate reorganizations involving Fidelity Management & Research (U.K.) Inc. (FMR U.K.) and Fidelity Management & Research (Japan) Inc. (FMR Japan), the Board approved certain non-material amendments to the fund's sub-advisory agreements with FMR U.K. and FMR Japan to reflect that, after these reorganizations, FMR Investment Management (UK) Limited and Fidelity Management & Research (Japan) Limited will carry on the business of FMR U.K. and FMR Japan, respectively. The Board noted that no changes to the portfolio managers or to the foreign research or investment advisory services provided to the fund were expected in connection with either reorganization and that the same personnel and resources would continue to be available to the fund at the new entities.
Annual Report
Board Approval of Investment Advisory Contracts and
Management Fees - continued
In considering whether to renew the Advisory Contracts for the fund, the Board reached a determination, with the assistance of fund counsel and Independent Trustees' counsel and through the exercise of its business judgment, that the renewal of the Advisory Contracts was in the best interests of the fund and its shareholders and that the compensation payable under the Advisory Contracts was fair and reasonable. The Board's decision to renew the Advisory Contracts was not based on any single factor, but rather was based on a comprehensive consideration of all the information provided to the Board at its meetings throughout the year. The Board, in reaching its determination to renew the Advisory Contracts, was aware that shareholders of the fund have a broad range of investment choices available to them, including a wide choice among funds offered by Fidelity's competitors, and that the fund's shareholders, who have the opportunity to review and weigh the disclosure provided by the fund in its prospectus and other public disclosures, have chosen to invest in this fund, which is part of the Fidelity family of funds.
Nature, Extent, and Quality of Services Provided. The Board considered Fidelity's staffing as it relates to the fund, including the backgrounds of investment personnel of FMR and the sub-advisers (together, the Investment Advisers), and also considered the fund's investment objective, strategies, and related investment philosophy. The Independent Trustees also had discussions with senior management of Fidelity's investment operations and investment groups. The Board considered the structure of the portfolio manager compensation program and whether this structure provides appropriate incentives to act in the best interests of the fund. Additionally, the Board considered the portfolio managers' investments, if any, in the funds that they manage.
Resources Dedicated to Investment Management and Support Services. The Board and the Fund Oversight and Research Committees reviewed the general qualifications and capabilities of Fidelity's investment staff, including its size, education, experience,and resources, as well as Fidelity's approach to recruiting, training, managing, and compensating investment personnel. The Board noted that Fidelity has continued to increase the resources devoted to non-U.S. offices, including expansion of Fidelity's global investment organization. The Board also noted that Fidelity's analysts have extensive resources, tools and capabilities that allow them to conduct sophisticated quantitative and fundamental analysis, as well as credit analysis of issuers, counterparties and guarantors. Further, the Board believes that Fidelity's investment professionals have sufficient access to global information and data so as to provide competitive investment results over time, and that those professionals also have access to sophisticated tools that permit them to assess portfolio construction and risk and performance attribution characteristics continuously, as well as to transmit new information and research conclusions rapidly around the world. Additionally, in its deliberations, the Board considered Fidelity's trading and risk management capabilities and resources and global compliance infrastructure, which are an integral part of the investment management process.
Annual Report
Shareholder and Administrative Services. The Board considered (i) the nature, extent, quality, and cost of advisory, administrative, and shareholder services performed by the Investment Advisers and their affiliates under the Advisory Contracts and under separate agreements covering transfer agency, pricing and bookkeeping, and securities lending services for the fund; (ii) the nature and extent of the supervision of third party service providers, principally custodians and subcustodians; and (iii) the resources devoted to, and the record of compliance with, the fund's compliance policies and procedures. The Board also reviewed the allocation of fund brokerage, including allocations to brokers affiliated with the Investment Advisers, the use of brokerage commissions to pay fund expenses, and the use of "soft" commission dollars to pay for research services.
The Board noted that the growth of fund assets over time across the complex allows Fidelity to reinvest in the development of services designed to enhance the value or convenience of the Fidelity funds as investment vehicles. These services include 24-hour access to account information and market information through telephone representatives and over the Internet, investor education materials and asset allocation tools, and the expanded availability of Fidelity Investor Centers.
In 2014, the Board formed an ad hoc Committee on Transfer Agency Fees to review the variety of transfer agency fee structures throughout the industry and Fidelity's competitive positioning with respect to industry participants.
Investment in a Large Fund Family. The Board considered the benefits to shareholders of investing in a Fidelity fund, including the benefits of investing in a fund that is part of a large family of funds offering a variety of investment disciplines and providing a large variety of mutual fund investor services. The Board noted that Fidelity had taken, or had made recommendations that resulted in the Fidelity funds taking, a number of actions over the previous year that benefited particular funds, including (i) continuing to dedicate additional resources to investment research and to the support of the senior management team that oversees asset management; (ii) persisting in efforts to enhance Fidelity's global research capabilities; (iii) launching new funds and making other enhancements to meet client needs for income-oriented solutions; (iv) reducing fund expenses for certain index funds; (v) continuing to launch dedicated lower cost underlying funds to meet portfolio construction needs related to expanding underlying fund options for Fidelity funds of funds, specifically for the Freedom Fund product lines; (vi) rationalizing product lines and gaining increased efficiencies through fund mergers; (vii) launching sector-based exchange-traded funds and establishing a new Fidelity adviser to manage sector-based funds and products; (viii) continuing to develop and implement technology to improve security and increase efficiency; (ix) modifying the eligibility criteria for certain share classes to increase their marketability to a portion of the defined contribution plan market; (x) waiving redemption fees for certain qualified fund-of-fund and wrap programs and certain retirement plan transactions; and (xi) launching new Institutional Class shares of certain money market funds to attract and retain assets and to fill a gap in the money market fund lineup.
Annual Report
Board Approval of Investment Advisory Contracts and
Management Fees - continued
Investment Performance. The Board considered whether the fund has operated in accordance with its investment objective, as well as its record of compliance with its investment restrictions and its performance history.
The Board took into account discussions with the Investment Advisers about fund investment performance that occur at Board meetings throughout the year. In this regard the Board noted that as part of regularly scheduled fund reviews and other reports to the Board on fund performance, the Board periodically considers annualized return information for the fund, for different time periods, measured against a securities market index ("benchmark index") and a peer group of funds with similar objectives ("peer group"). In its evaluation of fund investment performance, the Board gave particular attention to information indicating changes in performance of certain Fidelity funds for specific time periods and the Investment Advisers' explanations for any overperformance or underperformance.
In addition to reviewing absolute and relative fund performance, the Independent Trustees periodically consider the appropriateness of fund performance metrics in evaluating the results achieved. In general, the Independent Trustees believe that fund performance should be evaluated based on net performance (after fees and expenses) of both the highest performing and lowest performing classes, where applicable, compared to appropriate benchmark indices, over appropriate time periods which may include full market cycles, and compared to peer groups, as applicable, over the same periods, taking into account relevant factors including the following: general market conditions; issuer-specific information; tactical opportunities for investment; and fund cash flows and other factors.
The Independent Trustees recognize that shareholders evaluate performance on a net basis over their own holding periods, for which one-, three-, and five-year periods are often used as a proxy. For this reason, the performance information reviewed by the Board also included net cumulative calendar year total return information for the fund and an appropriate benchmark index for the most recent one-, three-, and five-year periods, as shown below. A peer group comparison is not shown below. Returns of the benchmark index are "net MA," i.e., adjusted for tax withholding rates applicable to U.S.-based funds organized as Massachusetts business trusts.
Annual Report
Fidelity Advisor Emerging Asia Fund

Based on its review, the Board concluded that the nature, extent, and quality of services provided to the fund under the Advisory Contracts should benefit the fund's shareholders.
Competitiveness of Management Fee and Total Expense Ratio. The Board considered the fund's management fee and total expense ratio compared to "mapped groups" of competitive funds and classes. Fidelity creates "mapped groups" by combining similar Lipper investment objective categories that have comparable investment mandates. Combining Lipper investment objective categories aids the Board's management fee and total expense ratio comparisons by broadening the competitive group used for comparison and by reducing the number of universes to which various Fidelity funds are compared.
Management Fee. The Board considered two proprietary management fee comparisons for the 12-month periods shown in the chart below. The group of Lipper funds used by the Board for management fee comparisons is referred to below as the "Total Mapped Group." The Total Mapped Group comparison focuses on a fund's standing in terms of gross management fees before expense reimbursements or caps relative to the total universe of funds with comparable investment mandates, regardless of whether their management fee structures also are comparable. Funds with comparable investment mandates offer exposure to similar types of securities. Funds with comparable management fee structures have similar management fee contractual arrangements (e.g., flat rate charged for advisory services, all-inclusive fee rate, etc.). "TMG %" represents the percentage of funds in the Total Mapped Group that had management fees that were lower than the fund's. For example, a hypothetical TMG % of 20% would mean that 80% of the funds in the Total Mapped Group had higher, and 20% had lower, management fees than the fund. The fund's actual TMG %s are in the chart below. The "Asset-Size Peer Group" (ASPG) comparison focuses on a fund's standing relative to a subset of non-Fidelity funds within the Total Mapped Group that are similar in size and management fee structure. For example, if a fund is in the first quartile of the ASPG, the fund's management fee ranks in the least expensive or lowest 25% of funds in the ASPG. The ASPG represents at least 15% of the funds in the Total Mapped Group with comparable asset size and management fee structures, subject to a minimum of 50 funds (or all funds in the Total Mapped Group if fewer than 50).Additional information, such as the ASPG quartile in which the fund's management fee rate ranked, is also included in the chart and considered by the Board.
Annual Report
Board Approval of Investment Advisory Contracts and
Management Fees - continued
Fidelity Advisor Emerging Asia Fund

The Board noted that the fund's management fee rate ranked below the median of its Total Mapped Group and below the median of its ASPG for 2013.
The Board also noted that, in August 2013, the ad hoc Committee on Management Fees was formed to conduct an in-depth review of the management fee rates of Fidelity's active equity mutual funds. The Committee focused on the following areas: (i) standard fee structures; (ii) research consumption and trading evolution; (iii) management fee competitiveness/profitability by category; and (iv) factors that drive institutional pricing.
Based on its review, the Board concluded that the fund's management fee is fair and reasonable in light of the services that the fund receives and the other factors considered.
Annual Report
Total Expense Ratio. In its review of each class's total expense ratio, the Board considered the fund's management fee as well as other fund or class expenses, as applicable, such as transfer agent fees, pricing and bookkeeping fees, fund-paid 12b-1 fees, and custodial, legal, and audit fees. The Board also noted the effects of any waivers and reimbursements on fees and expenses. As part of its review, the Board also considered the current and historical total expense ratios of each class of the fund compared to competitive fund median expenses. Each class of the fund is compared to those funds and classes in the Total Mapped Group (used by the Board for management fee comparisons) that have a similar sales load structure.
The Board noted that the total expense ratio of each of Class A, Class B, Class C, and Institutional Class ranked below its competitive median for 2013 and the total expense ratio of Class T ranked above its competitive median for 2013. The Board considered that, in general, various factors can affect total expense ratios. The Board noted that the total expense ratio of Class T was above the competitive median primarily because of higher 12b-1 fees on Class T as compared to most competitor funds. Class T has a higher 12b-1 fee, but a lower front-end sales charge, than traditionally priced front-end sales charge classes. The Board considered that Class T is primarily sold load-waived in the retirement plan market where its 0.50% 12b-1 fee is comparable to competing no-load, higher 12b-1 fee classes designed specifically for retirement plans. The Board noted that the fund offers multiple classes, each of which has a different sales load and 12b-1 fee structure, and that the multiple structures are intended to offer a range of pricing options for the intermediary market. The Board also noted that the total expense ratios of the classes vary primarily by the level of their 12b-1 fees, although differences in transfer agent fees may also cause expenses to vary from class to class.
Fees Charged to Other Fidelity Clients. The Board also considered Fidelity fee structures and other information with respect to clients of Fidelity, such as other funds advised or subadvised by Fidelity, pension plan clients, and other institutional clients. The Board noted the findings of the 2013 ad hoc joint committee (created with the board of other Fidelity funds), which reviewed and compared Fidelity's institutional investment advisory business with its business of providing services to the Fidelity funds, including the differences in services provided, fees charged, and costs incurred, as well as competition in their respective marketplaces.
Based on its review of total expense ratios and fees charged to other Fidelity clients, the Board concluded that the total expense ratio of each class of the fund was reasonable, although Class T was above the median of the universe presented for comparison, in light of the services that the fund and its shareholders receive and the other factors considered.
Costs of the Services and Profitability. The Board considered the revenues earned and the expenses incurred by Fidelity in conducting the business of developing, marketing, distributing, managing, administering and servicing the fund and servicing the fund's shareholders. The Board also considered the level of Fidelity's profits in respect of all the Fidelity funds.
Annual Report
Board Approval of Investment Advisory Contracts and
Management Fees - continued
On an annual basis, Fidelity presents to the Board Fidelity's profitability for the fund. Fidelity calculates the profitability for each fund, as well as aggregate profitability for groups of Fidelity funds and all Fidelity funds, using a series of detailed revenue and cost allocation methodologies which originate with the books and records of Fidelity on which Fidelity's audited financial statements are based. The Audit Committee of the Board reviews any significant changes from the prior year's methodologies.
PricewaterhouseCoopers LLP (PwC), independent registered public accounting firm and auditor to Fidelity and certain Fidelity funds, has been engaged annually by the Board as part of the Board's assessment of Fidelity's profitability analysis. PwC's engagement includes the review and assessment of the methodologies used by Fidelity in determining the revenues and expenses attributable to Fidelity's mutual fund business, and completion of agreed-upon procedures in respect of the mathematical accuracy of fund profitability and its conformity to established allocation methodologies. After considering PwC's reports issued under the engagement and information provided by Fidelity, the Board concluded that while other allocation methods may also be reasonable, Fidelity's profitability methodologies are reasonable in all material respects.
The Board also reviewed Fidelity's non-fund businesses and fall-out benefits related to the mutual fund business as well as cases where Fidelity's affiliates may benefit from or be related to the fund's business.
The Board considered the costs of the services provided by and the profits realized by Fidelity in connection with the operation of the fund and was satisfied that the profitability was not excessive in the circumstances.
Economies of Scale. The Board considered whether there have been economies of scale in respect of the management of the Fidelity funds, whether the Fidelity funds (including the fund) have appropriately benefited from any such economies of scale, and whether there is potential for realization of any further economies of scale. The Board considered the extent to which the fund will benefit from economies of scale through increased services to the fund, through waivers or reimbursements, or through fee or expense ratio reductions. The Board also noted that in 2013, it and the boards of other Fidelity funds created an ad hoc committee (the Economies of Scale Committee) to analyze whether Fidelity attains economies of scale in respect of the management and servicing of the Fidelity funds, whether the Fidelity funds have appropriately benefited from such economies of scale, and whether there is potential for realization of any further economies of scale.
The Board recognized that the fund's management contract incorporates a "group fee" structure, which provides for lower group fee rates as total group assets increase, and for higher group fee rates as total group assets decrease (with "group assets" defined to include fund assets under FMR's management plus sector fund assets previously under FMR's management and currently managed by Fidelity SelectCo, LLC). FMR calculates the group fee rates based on a tiered asset "breakpoint" schedule that varies based on asset class. The Board considered that the group fee is designed to deliver the benefits of economies of scale to fund shareholders when total Fidelity fund assets increase, even if assets of any particular fund are unchanged or have declined, because some portion of Fidelity's costs are attributable to services provided to all Fidelity funds, and all funds benefit if those costs can be allocated among more assets. The Board concluded that, given the group fee structure, fund shareholders will benefit from lower management fees as group assets increase at the fund complex level, regardless of whether Fidelity achieves any such economies of scale.
Annual Report
The Board concluded, taking into account the analysis of the Economies of Scale Committee, that economies of scale, if any, are being appropriately shared between fund shareholders and Fidelity.
Additional Information Requested by the Board. In order to develop fully the factual basis for consideration of the Fidelity funds' Advisory Contracts, the Board requested and received additional information on certain topics, including: (i) fund performance trends and Fidelity's long-term strategies for certain funds; (ii) Fidelity's strategic marketing and product lineup goals; (iii) the methodology with respect to competitive fund data and peer group classifications; (iv) the arrangements with, and performance of, certain sub-advisers on behalf of the Fidelity funds, as well as certain proposed participating affiliate arrangements; (v) the realization of fall-out benefits in certain Fidelity business units; (vi) Fidelity's group fee structures, including the rationale for the individual fee rates of certain categories of funds and the definition of group assets; (vii) trends regarding industry use of performance fee structures and the performance adjustment methodologies applicable to the Fidelity funds; (viii) additional competitive analysis regarding the total expenses for certain classes; (ix) fund profitability methodology, including Fidelity's cost allocation methodology, and the impact of certain factors on fund profitability results; and (x) the process by which Fidelity determines sub-advisory fees for funds it advises.
Based on its evaluation of all of the conclusions noted above, and after considering all factors it believed relevant, the Board ultimately concluded that the advisory fee structures are fair and reasonable, and that the fund's Advisory Contracts should be renewed.
Annual Report
Investment Adviser
Fidelity Management & Research Company
Boston, MA
Investment Sub-Advisers
FMR Co., Inc.
Fidelity Management & Research
(U.K.) Inc.
Fidelity Management & Research (Hong Kong) Limited
Fidelity Management & Research (Japan) Limited
FIL Investment Advisors
FIL Investment Advisors (UK) Limited
FIL Investments (Japan) Limited
General Distributor
Fidelity Distributors Corporation
Smithfield, RI
Transfer and Service Agents
Fidelity Investments Institutional Operations Company, Inc.
Boston, MA
Fidelity Service Company, Inc.
Boston, MA
Custodian
Brown Brothers Harriman & Co.
Boston, MA
(Fidelity Investment logo)(registered trademark)
AEA-UANN-1214
1.784737.111
(Fidelity Investment logo)(registered trademark)
Fidelity Advisor®
Emerging Asia
Fund - Institutional Class
Annual Report
October 31, 2014
(Fidelity Cover Art)
Contents
Performance | (Click Here) | How the fund has done over time. |
Management's Discussion of Fund Performance | (Click Here) | The Portfolio Manager's review of fund performance and strategy. |
Shareholder Expense Example | (Click Here) | An example of shareholder expenses. |
Investment Changes | (Click Here) | A summary of major shifts in the fund's investments over the past six months. |
Investments | (Click Here) | A complete list of the fund's investments with their market values. |
Financial Statements | (Click Here) | Statements of assets and liabilities, operations, and changes in net assets, as well as financial highlights. |
Notes | (Click Here) | Notes to financial statements. |
Report of Independent Registered Public Accounting Firm | (Click Here) | |
Trustees and Officers | (Click Here) | |
Distributions | (Click Here) | |
Board Approval of Investment Advisory Contracts and Management Fees | (Click Here) | |
To view a fund's proxy voting guidelines and proxy voting record for the 12-month period ended June 30, visit http://www.fidelity.com/proxyvotingresults or visit the Securities and Exchange Commission's (SEC) web site at http://www.sec.gov. You may also call 1-877-208-0098 to request a free copy of the proxy voting guidelines.
Standard & Poor's, S&P and S&P 500 are registered service marks of The McGraw-Hill Companies, Inc. and have been licensed for use by Fidelity Distributors Corporation.
Other third-party marks appearing herein are the property of their respective owners.
All other marks appearing herein are registered or unregistered trademarks or service marks of FMR LLC or an affiliated company. © 2014 FMR LLC. All rights reserved.
Annual Report
This report and the financial statements contained herein are submitted for the general information of the shareholders of the fund. This report is not authorized for distribution to prospective investors in the fund unless preceded or accompanied by an effective prospectus.
A fund files its complete schedule of portfolio holdings with the SEC for the first and third quarters of each fiscal year on Form N-Q. Forms N-Q are available on the SEC's web site at http://www.sec.gov. A fund's Forms N-Q may be reviewed and copied at the SEC's Public Reference Room in Washington, DC. Information regarding the operation of the SEC's Public Reference Room may be obtained by calling 1-800-SEC-0330. For a complete list of a fund's portfolio holdings, view the most recent holdings listing, semiannual report, or annual report on Fidelity's web site at http://www.fidelity.com, http://www.advisor.fidelity.com, or http://www.401k.com, as applicable.
NOT FDIC INSURED • MAY LOSE VALUE • NO BANK GUARANTEE
Neither the fund nor Fidelity Distributors Corporation is a bank.
Annual Report
Average annual total return reflects the change in the value of an investment, assuming reinvestment of the class' distributions from dividend income and capital gains (the profits earned upon the sale of securities that have grown in value, if any) and assuming a constant rate of performance each year. The $10,000 table and the fund's returns do not reflect the deduction of taxes that a shareholder would pay on fund distributions or the redemption of fund shares. During periods of reimbursement by Fidelity, a fund's total return will be greater than it would be had the reimbursement not occurred. How a fund did yesterday is no guarantee of how it will do tomorrow.
Average Annual Total Returns
Periods ended October 31, 2014 | Past 1
year | Past 5
years | Past 10
years |
Institutional Class | 7.98% | 8.77% | 14.13% |
$10,000 Over 10 Years
Let's say hypothetically that $10,000 was invested in Fidelity Advisor® Emerging Asia Fund - Institutional Class on October 31, 2004. The chart shows how the value of your investment would have changed, and also shows how the MSCI AC (All Country) Asia ex Japan Index performed over the same period.
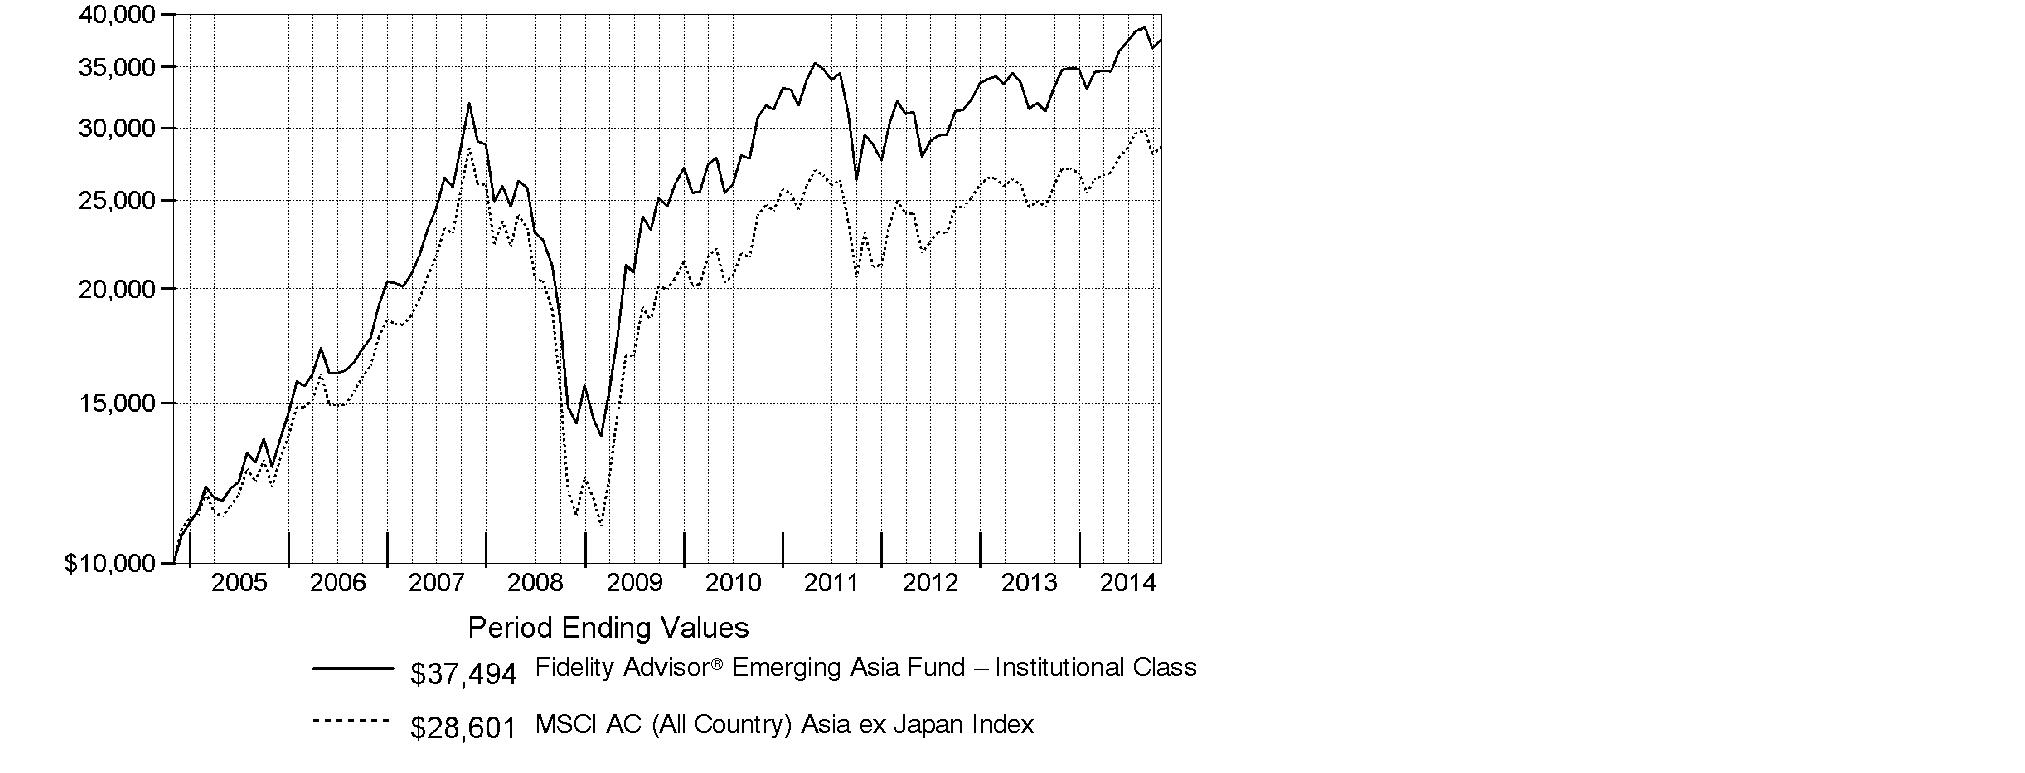
Annual Report
Market Recap: Global equities posted a healthy gain for the 12 months ending October 31, 2014, overcoming an October market decline driven by recessionary pressures in China and tepid growth in Europe. The MSCI ACWI (All Country World Index) Index rose 8.15%, helped by subdued market volatility for much of the period and supported by solid corporate earnings, especially in the United States. Stocks also benefited from easy monetary policies in Japan and the eurozone, as well as increased stimulus efforts in China. All but three of the 24 industry groups that compose the index marked a positive return. The U.S. (+17%) remained a pillar of strength, while a strongly rising dollar in the latter part of the period detracted from investors' returns in most non-U.S. markets. Canada (+5%) notched broad gains outside of its energy and materials sectors, as did Asia-Pacific ex Japan (+4%), led by investor enthusiasm for companies in India. The U.K., Europe and Japan, meanwhile, all underperformed. Among sectors, health care (+24%) led the index, with a strong contribution from the pharmaceuticals, biotechnology & life sciences industry. Information technology (+21%) also outperformed. Conversely, materials (-4%) and energy (-1%) lagged the index due to a higher supply of and lower demand for commodities.
Comments from Colin Chickles, Portfolio Manager of Fidelity Advisor® Emerging Asia Fund: For the year, the fund's Institutional Class shares returned 7.98%, outpacing the 5.75% gain of the MSCI AC (All Country) Asia ex Japan Index. Versus the index, the fund's positioning in India meaningfully contributed to performance. The top contributor was Bharat Heavy Electricals, a manufacturer of power-generation equipment and related products. This stock got a big boost from the May 2014 election of Prime Minister Narendra Modi. Other India-based contributors included high-quality tire maker Apollo Tyres, oil refinery Hindustan Petro, fertilizer supplier UPL and two banks: Axis Bank and Yes Bank. I'll also mention one Chinese stock, logistics provider Sinotrans. Conversely, stock picking in Hong Kong was a weak point for the fund. Disappointments here included casino operator Sands China, the fund's largest relative detractor, which I bought during the period and sold at a significant loss. Underweighting wireless-services provider and index component China Mobile - another Hong Kong-listed stock - also hampered our results, as did overweighted exposure to South Korean electronics giant Samsung Electronics. Many stocks I've mentioned were not in the benchmark, and many of these positions were sold or reduced during the period.
The views expressed above reflect those of the portfolio manager(s) only through the end of the period as stated on the cover of this report and do not necessarily represent the views of Fidelity or any other person in the Fidelity organization. Any such views are subject to change at any time based upon market or other conditions and Fidelity disclaims any responsibility to update such views. These views may not be relied on as investment advice and, because investment decisions for a Fidelity fund are based on numerous factors, may not be relied on as an indication of trading intent on behalf of any Fidelity fund.
Annual Report
Shareholder Expense Example
As a shareholder of the Fund, you incur two types of costs: (1) transaction costs, including sales charges (loads) on purchase payments or redemption proceeds, redemption fees and (2) ongoing costs, including management fees, distribution and/or service (12b-1) fees and other Fund expenses. This Example is intended to help you understand your ongoing costs (in dollars) of investing in the Fund and to compare these costs with the ongoing costs of investing in other mutual funds.
The Example is based on an investment of $1,000 invested at the beginning of the period and held for the entire period (May 1, 2014 to October 31, 2014).
Actual Expenses
The first line of the accompanying table for each class of the Fund provides information about actual account values and actual expenses. You may use the information in this line, together with the amount you invested, to estimate the expenses that you paid over the period. Simply divide your account value by $1,000.00 (for example, an $8,600 account value divided by $1,000.00 = 8.6), then multiply the result by the number in the first line for a class of the Fund under the heading entitled "Expenses Paid During Period" to estimate the expenses you paid on your account during this period. In addition, the Fund, as a shareholder in the underlying Fidelity Central Funds, will indirectly bear its pro-rata share of the fees and expenses incurred by the underlying Fidelity Central Funds. These fees and expenses are not included in the Fund's annualized expense ratio used to calculate the expense estimate in the table below.
Hypothetical Example for Comparison Purposes
The second line of the accompanying table for each class of the Fund provides information about hypothetical account values and hypothetical expenses based on a Class' actual expense ratio and an assumed rate of return of 5% per year before expenses, which is not the Class' actual return. The hypothetical account values and expenses may not be used to estimate the actual ending account balance or expenses you paid for the period. You may use this information to compare the ongoing costs of investing in the Fund and other funds. To do so, compare this 5% hypothetical example with the 5% hypothetical examples that appear in the shareholder reports of the other funds. In addition, the Fund, as a shareholder in the underlying Fidelity Central Funds, will indirectly bear its pro-rata share of the fees and expenses incurred by the underlying Fidelity Central Funds. These fees and expenses are not included in the Fund's annualized expense ratio used to calculate the expense estimate in the table below.
Please note that the expenses shown in the table are meant to highlight your ongoing costs only and do not reflect any transaction costs. Therefore, the second line of the table is useful in comparing ongoing costs only, and will not help you determine the relative total costs of owning different funds. In addition, if these transactional costs were included, your costs would have been higher.
Annual Report
Shareholder Expense Example - continued
| Annualized Expense RatioB | Beginning
Account Value
May 1, 2014 | Ending
Account Value
October 31, 2014 | Expenses Paid
During Period*
May 1, 2014
to October 31, 2014 |
Class A | 1.37% | | | |
Actual | | $ 1,000.00 | $ 1,081.70 | $ 7.19 |
HypotheticalA | | $ 1,000.00 | $ 1,018.30 | $ 6.97 |
Class T | 1.68% | | | |
Actual | | $ 1,000.00 | $ 1,079.70 | $ 8.81 |
HypotheticalA | | $ 1,000.00 | $ 1,016.74 | $ 8.54 |
Class B | 2.16% | | | |
Actual | | $ 1,000.00 | $ 1,077.50 | $ 11.31 |
HypotheticalA | | $ 1,000.00 | $ 1,014.32 | $ 10.97 |
Class C | 2.12% | | | |
Actual | | $ 1,000.00 | $ 1,077.60 | $ 11.10 |
HypotheticalA | | $ 1,000.00 | $ 1,014.52 | $ 10.76 |
Institutional Class | 1.08% | | | |
Actual | | $ 1,000.00 | $ 1,083.00 | $ 5.67 |
HypotheticalA | | $ 1,000.00 | $ 1,019.76 | $ 5.50 |
A 5% return per year before expenses
B Annualized expense ratio reflects expenses net of applicable fee waivers.
* Expenses are equal to each Class' annualized expense ratio, multiplied by the average account value over the period, multiplied by 184/365 (to reflect the one-half year period).
Annual Report
Investment Changes (Unaudited)
Top Ten Stocks as of October 31, 2014 |
| % of fund's
net assets | % of fund's net assets
6 months ago |
Samsung Electronics Co. Ltd. | 5.4 | 6.2 |
Taiwan Semiconductor Manufacturing Co. Ltd. | 4.1 | 3.9 |
Tencent Holdings Ltd. | 3.0 | 2.4 |
China Construction Bank Corp. (H Shares) | 2.4 | 2.1 |
Hon Hai Precision Industry Co. Ltd. (Foxconn) | 2.0 | 1.8 |
Bank of China Ltd. (H Shares) | 1.8 | 1.5 |
PetroChina Co. Ltd. (H Shares) | 1.6 | 0.0 |
AIA Group Ltd. | 1.4 | 2.6 |
Ping An Insurance (Group) Co. of China Ltd. (H Shares) | 1.4 | 1.0 |
Hyundai Motor Co. | 1.3 | 1.7 |
| 24.4 | |
Top Five Market Sectors as of October 31, 2014 |
| % of fund's
net assets | % of fund's net assets
6 months ago |
Financials | 31.7 | 30.2 |
Information Technology | 23.0 | 24.0 |
Consumer Discretionary | 11.4 | 13.6 |
Industrials | 7.7 | 8.1 |
Telecommunication Services | 6.4 | 4.2 |
Asset Allocation (% of fund's net assets) |
As of October 31, 2014 | As of April 30, 2014 |
 | Stocks 99.9% | | | Stocks 98.9% | |
 | Short-Term
Investments and
Net Other Assets (Liabilities) 0.1% | | | Short-Term
Investments and
Net Other Assets (Liabilities) 1.1% | |

Annual Report
Investments October 31, 2014
Showing Percentage of Net Assets
Common Stocks - 99.9% |
| Shares | | Value |
Bermuda - 3.4% |
BW Offshore Ltd. | 156,500 | | $ 191,885 |
China Resources Gas Group Ltd. | 96,000 | | 274,415 |
CSI Properties Ltd. | 14,830,000 | | 641,247 |
Great Eagle Holdings Ltd. | 614,000 | | 2,066,782 |
Hongkong Land Holdings Ltd. | 223,000 | | 1,555,184 |
Huabao International Holdings Ltd. | 567,000 | | 405,436 |
Kerry Logistics Network Ltd. | 193,500 | | 314,982 |
Luk Fook Holdings International Ltd. | 254,000 | | 757,349 |
Noble Group Ltd. | 1,222,000 | | 1,137,509 |
Oriental Watch Holdings Ltd. | 1,280,000 | | 285,921 |
PAX Global Technology Ltd. (a) | 761,000 | | 817,354 |
Shangri-La Asia Ltd. | 284,000 | | 412,369 |
Yue Yuen Industrial (Holdings) Ltd. | 392,500 | | 1,317,617 |
TOTAL BERMUDA | | 10,178,050 |
British Virgin Islands - 0.2% |
Michael Kors Holdings Ltd. (a) | 6,200 | | 487,258 |
Cayman Islands - 10.1% |
Alibaba Group Holding Ltd. sponsored ADR | 19,300 | | 1,902,980 |
Baidu.com, Inc. sponsored ADR (a) | 5,000 | | 1,193,850 |
Best Pacific International Holdings Ltd. | 1,044,000 | | 519,004 |
China Cord Blood Corp. (a) | 6,844 | | 34,836 |
China Lilang Ltd. | 358,000 | | 256,227 |
China Lodging Group Ltd. ADR (a) | 44,972 | | 1,236,280 |
China Modern Dairy Holdings Ltd. (a) | 1,218,000 | | 537,380 |
China Resources Cement Holdings Ltd. | 2,613,972 | | 1,777,499 |
China Sanjiang Fine Chemicals Ltd. | 1,344,000 | | 666,264 |
China State Construction International Holdings Ltd. | 584,000 | | 902,808 |
Ctrip.com International Ltd. sponsored ADR (a) | 12,400 | | 722,920 |
eLong, Inc. sponsored ADR (a) | 3,300 | | 64,020 |
GCL-Poly Energy Holdings Ltd. (a) | 2,586,000 | | 871,540 |
Goodbaby International Holdings Ltd. | 984,000 | | 396,705 |
Greatview Aseptic Pack Co. Ltd. | 1,065,000 | | 701,115 |
Home Inns & Hotels Management, Inc. sponsored ADR (a) | 6,100 | | 184,281 |
Hosa International Ltd. | 1,196,000 | | 475,331 |
iKang Healthcare Group, Inc. sponsored ADR (d) | 9,800 | | 178,948 |
International Housewares Retail Co. Ltd. | 1,909,000 | | 524,389 |
KWG Property Holding Ltd. | 2,444,011 | | 1,697,101 |
Lifestyle International Holdings Ltd. | 345,000 | | 655,434 |
Lifetech Scientific Corp. (a) | 40,000 | | 58,783 |
Pico Far East Holdings Ltd. | 272,000 | | 67,360 |
Silergy Corp. | 19,000 | | 131,566 |
Common Stocks - continued |
| Shares | | Value |
Cayman Islands - continued |
Sitoy Group Holdings Ltd. | 303,000 | | $ 249,544 |
SOHO China Ltd. | 1,391,000 | | 1,020,728 |
SouFun Holdings Ltd. ADR | 127,700 | | 1,245,075 |
Sunny Optical Technology Group Co. Ltd. | 222,000 | | 359,245 |
Tencent Holdings Ltd. | 569,200 | | 9,148,338 |
Value Partners Group Ltd. | 921,000 | | 694,108 |
WuXi PharmaTech Cayman, Inc. sponsored ADR (a) | 25,000 | | 942,500 |
Xinyi Glass Holdings Ltd. | 436,000 | | 257,609 |
Xinyi Solar Holdings Ltd. | 452,000 | | 152,972 |
Zhen Ding Technology Holding Ltd. | 259,400 | | 711,591 |
TOTAL CAYMAN ISLANDS | | 30,538,331 |
China - 20.7% |
Agricultural Bank of China Ltd. (H Shares) | 4,501,000 | | 2,091,584 |
Aluminum Corp. of China Ltd. (H Shares) (a) | 2,878,000 | | 1,281,119 |
Anhui Conch Cement Co. Ltd. (H Shares) | 323,000 | | 1,057,781 |
Bank of China Ltd. (H Shares) | 11,530,000 | | 5,518,850 |
Beijing Jingneng Clean Energy Co. Ltd. (H Shares) | 132,000 | | 59,286 |
China Communications Construction Co. Ltd. (H Shares) | 2,662,000 | | 2,043,574 |
China Construction Bank Corp. (H Shares) | 9,721,000 | | 7,252,832 |
China Merchants Bank Co. Ltd. (H Shares) | 1,240,000 | | 2,297,999 |
China Pacific Insurance Group Co. Ltd. (H Shares) | 832,000 | | 3,113,477 |
China Railway Construction Corp. Ltd. (H Shares) | 1,242,000 | | 1,304,840 |
China Railway Group Ltd. (H Shares) | 4,465,000 | | 2,754,472 |
China Shenhua Energy Co. Ltd. (H Shares) | 938,500 | | 2,645,197 |
China Telecom Corp. Ltd. (H Shares) | 4,862,000 | | 3,099,308 |
Chongqing Changan Automobile Co. Ltd. (B Shares) | 163,513 | | 361,362 |
Chongqing Rural Commercial Bank Co. Ltd. (H Shares) | 740,000 | | 356,134 |
CSR Corp. Ltd. (H Shares) | 2,298,000 | | 2,337,959 |
Dongfeng Motor Group Co. Ltd. (H Shares) | 904,000 | | 1,397,998 |
Guangdong Kelon Electrical Holdings Ltd. Series H (a) | 390,000 | | 350,078 |
Huadian Fuxin Energy Corp. Ltd. (H Shares) | 2,040,000 | | 1,173,699 |
Huadian Power International Corp. Ltd. (H Shares) | 2,114,000 | | 1,614,781 |
Industrial & Commercial Bank of China Ltd. (H Shares) | 3,921,000 | | 2,603,387 |
People's Insurance Co. of China Group (H Shares) | 5,817,000 | | 2,514,361 |
PetroChina Co. Ltd. (H Shares) | 3,786,000 | | 4,739,861 |
PICC Property & Casualty Co. Ltd. (H Shares) | 1,034,000 | | 1,896,809 |
Ping An Insurance (Group) Co. of China Ltd. (H Shares) | 505,000 | | 4,128,241 |
Shanghai Fosun Pharmaceutical (Group) Co. Ltd. Class H | 46,500 | | 167,414 |
Sinotrans Ltd. (H Shares) | 2,178,000 | | 1,728,254 |
Tong Ren Tang Technologies Co. Ltd. (H Shares) | 218,000 | | 292,952 |
Weichai Power Co. Ltd. (H Shares) | 377,000 | | 1,447,180 |
Common Stocks - continued |
| Shares | | Value |
China - continued |
Weifu High-Technology Co. Ltd. (B Shares) | 17,800 | | $ 67,499 |
Yantai Changyu Pioneer Wine Co. Ltd. (B Shares) | 140,000 | | 439,955 |
Zhuzhou CSR Times Electric Co. Ltd. (H Shares) | 134,500 | | 578,400 |
TOTAL CHINA | | 62,716,643 |
Hong Kong - 8.7% |
AIA Group Ltd. | 763,800 | | 4,262,328 |
BYD Electronic International Co. Ltd. | 446,000 | | 530,595 |
China Mobile Ltd. | 219,500 | | 2,731,133 |
China Power International Development Ltd. | 2,044,000 | | 923,320 |
Dah Chong Hong Holdings Ltd. | 2,100,000 | | 1,238,456 |
Dah Sing Banking Group Ltd. | 184,000 | | 334,315 |
Dah Sing Financial Holdings Ltd. | 111,200 | | 692,411 |
Far East Horizon Ltd. | 1,760,000 | | 1,636,902 |
Fosun International Ltd. | 543,500 | | 644,677 |
Franshion Properties China Ltd. | 1,200,000 | | 283,274 |
HKT Trust/HKT Ltd. unit | 1,520,500 | | 1,852,325 |
Hysan Development Co. Ltd. | 341,000 | | 1,555,933 |
Lenovo Group Ltd. | 1,528,000 | | 2,252,280 |
Magnificent Estates Ltd. (a) | 1,896,000 | | 90,443 |
PCCW Ltd. | 3,775,000 | | 2,399,831 |
Power Assets Holdings Ltd. | 204,500 | | 1,974,521 |
Techtronic Industries Co. Ltd. | 399,000 | | 1,249,110 |
Wheelock and Co. Ltd. | 335,000 | | 1,614,740 |
TOTAL HONG KONG | | 26,266,594 |
India - 10.8% |
Alembic Pharmaceuticals Ltd. (a) | 21,585 | | 143,634 |
Amara Raja Batteries Ltd. (a) | 29,327 | | 312,907 |
Apollo Tyres Ltd. | 155,277 | | 553,220 |
Axis Bank Ltd. (a) | 254,160 | | 1,873,218 |
Bajaj Finserv Ltd. (a) | 37,348 | | 649,485 |
Balkrishna Industries Ltd. | 7,278 | | 91,333 |
Bharat Petroleum Corp. Ltd. | 60,203 | | 704,803 |
Bharti Infratel Ltd. | 241,029 | | 1,155,117 |
Cadila Healthcare Ltd. (a) | 21,957 | | 509,193 |
Cox & Kings India Ltd. | 187,175 | | 872,255 |
Engineers India Ltd. | 45,524 | | 201,724 |
Exide Industries Ltd. | 218,175 | | 559,363 |
Future Retail Ltd. (a) | 76,771 | | 144,283 |
HCL Technologies Ltd. | 75,409 | | 1,977,690 |
Hexaware Technologies Ltd. | 173,363 | | 557,844 |
Common Stocks - continued |
| Shares | | Value |
India - continued |
IL&FS Transportation Networks Ltd. (a) | 57,416 | | $ 184,322 |
JK Tyre & Industries Ltd. (a) | 37,379 | | 298,666 |
Lupin Ltd. | 67,233 | | 1,556,672 |
Mahindra & Mahindra Ltd. (a) | 74,046 | | 1,574,351 |
Maruti Suzuki India Ltd. (a) | 30,721 | | 1,682,745 |
McLeod Russel India Ltd. | 66,079 | | 279,802 |
MindTree Consulting Ltd. | 71,166 | | 1,267,172 |
MRF Ltd. | 1,022 | | 520,966 |
NIIT Technologies Ltd. (a) | 55,090 | | 346,744 |
NTPC Ltd. | 545,018 | | 1,330,981 |
Petronet LNG Ltd. (a) | 420,274 | | 1,364,494 |
Punjab National Bank (a) | 53,917 | | 824,269 |
Redington India Ltd. (a) | 143,788 | | 241,709 |
Reliance Infrastructure Ltd. (a) | 66,954 | | 694,310 |
Sesa Sterlite Ltd. | 343,938 | | 1,435,002 |
Shriram City Union Finance Ltd. | 17,404 | | 492,807 |
Sintex Industries Ltd. | 204,486 | | 322,670 |
Sun Pharmaceutical Industries Ltd. | 121,366 | | 1,670,219 |
Tata Motors Ltd. (a) | 297,671 | | 2,600,641 |
The Jammu & Kashmir Bank Ltd. | 411,289 | | 931,755 |
Union Bank of India | 172,589 | | 633,476 |
UPL Ltd. | 128,087 | | 725,050 |
VST Industries Ltd. (a) | 11,582 | | 342,801 |
Yes Bank Ltd. | 90,553 | | 1,025,394 |
TOTAL INDIA | | 32,653,087 |
Indonesia - 1.7% |
PT ACE Hardware Indonesia Tbk | 1,931,600 | | 129,645 |
PT Bank Mandiri (Persero) Tbk | 2,465,400 | | 2,117,418 |
PT Bank Rakyat Indonesia Tbk | 2,780,200 | | 2,547,765 |
PT Malindo Feedmill Tbk | 549,400 | | 142,073 |
PT Media Nusantara Citra Tbk | 1,041,400 | | 241,428 |
TOTAL INDONESIA | | 5,178,329 |
Israel - 0.1% |
Sarine Technologies Ltd. | 79,000 | | 183,209 |
Japan - 1.2% |
Fuji Media Holdings, Inc. | 63,000 | | 869,261 |
KDDI Corp. | 21,500 | | 1,411,893 |
SoftBank Corp. | 6,200 | | 451,356 |
Suzuki Motor Corp. | 27,800 | | 931,815 |
TOTAL JAPAN | | 3,664,325 |
Common Stocks - continued |
| Shares | | Value |
Korea (South) - 17.3% |
AMOREPACIFIC Corp. | 619 | | $ 1,325,056 |
AMOREPACIFIC Group, Inc. | 1,177 | | 1,295,917 |
Bgf Retail (a) | 14,648 | | 927,050 |
Daesang Corp. | 25,797 | | 997,599 |
Daewoo International Corp. | 16,723 | | 526,852 |
DGB Financial Group Co. Ltd. | 91,915 | | 1,304,584 |
Dongbu Insurance Co. Ltd. | 34,097 | | 1,900,898 |
Dongwon Industries Co. | 681 | | 207,892 |
E1 Corp. | 2,880 | | 192,189 |
Fila Korea Ltd. | 4,707 | | 488,467 |
GS Retail Co. Ltd. | 36,915 | | 855,496 |
Hana Financial Group, Inc. | 55,651 | | 1,919,009 |
Hyundai Hysco Co. Ltd. | 27,314 | | 1,769,336 |
Hyundai Motor Co. | 25,859 | | 4,091,443 |
Hyundai Steel Co. | 23,815 | | 1,509,432 |
Hyundai Wia Corp. | 5,760 | | 989,087 |
InterPark INT Corp. | 18,829 | | 438,110 |
JB Financial Group Co. Ltd. | 63,176 | | 385,720 |
KB Financial Group, Inc. | 82,284 | | 3,208,356 |
Korea Express Co. Ltd. (a) | 991 | | 178,011 |
Korea Zinc Co. Ltd. | 3,345 | | 1,253,077 |
Korean Reinsurance Co. | 17,404 | | 184,659 |
LG Household & Health Care Ltd. | 4,336 | | 2,514,161 |
Medy-Tox, Inc. | 743 | | 172,603 |
Samsung Electronics Co. Ltd. | 13,998 | | 16,206,980 |
Samsung Heavy Industries Co. Ltd. | 60,327 | | 1,462,633 |
Samsung SDI Co. Ltd. | 9,724 | | 1,140,332 |
Shinhan Financial Group Co. Ltd. | 81,664 | | 3,823,089 |
SK Telecom Co. Ltd. | 4,243 | | 1,057,636 |
TOTAL KOREA (SOUTH) | | 52,325,674 |
Malaysia - 3.0% |
Genting Malaysia Bhd | 627,500 | | 820,304 |
Glomac Bhd | 439,300 | | 148,143 |
Kossan Rubber Industries Bhd | 318,700 | | 445,620 |
Media Prima Bhd | 676,700 | | 403,101 |
Sunway Bhd | 412,700 | | 432,864 |
Tenaga Nasional Bhd | 958,900 | | 3,894,303 |
YTL Corp. Bhd | 3,740,600 | | 1,887,469 |
YTL Power International Bhd | 1,854,700 | | 896,283 |
TOTAL MALAYSIA | | 8,928,087 |
Common Stocks - continued |
| Shares | | Value |
Mauritius - 0.2% |
MakeMyTrip Ltd. (a) | 16,600 | | $ 500,241 |
Papua New Guinea - 0.1% |
Oil Search Ltd. ADR | 37,627 | | 288,513 |
Philippines - 1.6% |
ABS CBN Broadcasting Corp. (depositary receipt) | 97,800 | | 99,604 |
Alliance Global Group, Inc. | 2,624,400 | | 1,476,119 |
Ayala Land, Inc. | 922,700 | | 688,083 |
D&L Industries, Inc. | 510,300 | | 155,365 |
Jollibee Food Corp. | 111,610 | | 486,438 |
Metropolitan Bank & Trust Co. | 549,880 | | 1,008,936 |
Security Bank Corp. | 241,366 | | 771,406 |
Vista Land & Lifescapes, Inc. | 1,801,000 | | 246,347 |
TOTAL PHILIPPINES | | 4,932,298 |
Singapore - 4.7% |
Amtek Engineering Ltd. | 193,000 | | 90,850 |
Boustead Singapore Ltd. | 67,000 | | 95,853 |
Cordlife Group Ltd. | 278,000 | | 218,596 |
CWT Ltd. | 115,000 | | 144,649 |
Ezion Holdings Ltd. | 1,051,800 | | 1,238,591 |
Keppel Corp. Ltd. | 346,000 | | 2,537,294 |
Mapletree Industrial (REIT) | 1,502,850 | | 1,726,072 |
Singapore Telecommunications Ltd. | 1,225,000 | | 3,605,515 |
United Overseas Bank Ltd. | 218,000 | | 3,905,620 |
Wing Tai Holdings Ltd. | 546,000 | | 760,763 |
TOTAL SINGAPORE | | 14,323,803 |
Taiwan - 11.4% |
Catcher Technology Co. Ltd. | 240,000 | | 2,022,859 |
Cleanaway Co. Ltd. | 36,000 | | 159,790 |
FLEXium Interconnect, Inc. | 114,000 | | 240,955 |
Fubon Financial Holding Co. Ltd. | 1,718,000 | | 2,903,906 |
Giant Manufacturing Co. Ltd. | 86,000 | | 695,254 |
Hon Hai Precision Industry Co. Ltd. (Foxconn) | 1,900,600 | | 6,006,019 |
King Slide Works Co. Ltd. | 26,000 | | 340,847 |
Merida Industry Co. Ltd. | 58,050 | | 400,363 |
NAK Sealing Technologies Corp. | 40,000 | | 138,032 |
Nan Ya Plastics Corp. | 822,000 | | 1,698,534 |
Novatek Microelectronics Corp. | 333,000 | | 1,720,940 |
Pegatron Corp. | 395,000 | | 718,763 |
Pou Chen Corp. | 633,000 | | 696,914 |
Realtek Semiconductor Corp. | 128,000 | | 423,621 |
Common Stocks - continued |
| Shares | | Value |
Taiwan - continued |
Sinopac Holdings Co. | 17,028 | | $ 7,382 |
Taishin Financial Holdings Co. Ltd. | 4,196,392 | | 1,998,698 |
Taiwan Semiconductor Manufacturing Co. Ltd. | 2,851,393 | | 12,341,152 |
Tongtai Machine & Tool Co. Ltd. | 183,000 | | 162,202 |
Tongtai Machine & Tool Co. Ltd. rights 12/17/14 (a) | 12,739 | | 188 |
Vanguard International Semiconductor Corp. | 380,000 | | 570,014 |
Wistron Corp. | 1,311,000 | | 1,375,210 |
TOTAL TAIWAN | | 34,621,643 |
Thailand - 3.8% |
Bangkok Expressway PCL (For.Reg.) | 269,500 | | 314,337 |
Delta Electronics PCL (For. Reg.) | 160,200 | | 317,965 |
Intouch Holdings PCL: | | | |
(For. Reg.) | 773,700 | | 1,756,536 |
NVDR | 12,400 | | 28,152 |
Kasikornbank PCL (For. Reg.) | 363,300 | | 2,631,294 |
Preuksa Real Estate PCL (For. Reg.) | 2,308,900 | | 2,374,808 |
Quality Houses PCL | 6,083,700 | | 803,759 |
Thai Beverage PCL | 3,546,000 | | 2,111,536 |
Thai Tap Water Supply PCL (For. Reg.) | 615,500 | | 228,541 |
Thanachart Capital PCL (For. Reg.) | 580,200 | | 623,341 |
TISCO Financial Group PCL | 153,200 | | 209,382 |
TOTAL THAILAND | | 11,399,651 |
United Kingdom - 0.3% |
Standard Chartered PLC (United Kingdom) | 61,783 | | 928,647 |
United States of America - 0.6% |
Cognizant Technology Solutions Corp. Class A (a) | 38,900 | | 1,900,265 |
TOTAL COMMON STOCKS (Cost $256,071,530) |
302,014,648
|
Money Market Funds - 0.4% |
| Shares | | Value |
Fidelity Cash Central Fund, 0.11% (b) | 1,073,477 | | $ 1,073,477 |
Fidelity Securities Lending Cash Central Fund, 0.11% (b)(c) | 150,606 | | 150,606 |
TOTAL MONEY MARKET FUNDS (Cost $1,224,083) |
1,224,083
|
TOTAL INVESTMENT PORTFOLIO - 100.3% (Cost $257,295,613) | | 303,238,731 |
NET OTHER ASSETS (LIABILITIES) - (0.3)% | | (912,012) |
NET ASSETS - 100% | $ 302,326,719 |
Legend |
(a) Non-income producing |
(b) Affiliated fund that is generally available only to investment companies and other accounts managed by Fidelity Investments. The rate quoted is the annualized seven-day yield of the fund at period end. A complete unaudited listing of the fund's holdings as of its most recent quarter end is available upon request. In addition, each Fidelity Central Fund's financial statements, which are not covered by the Fund's Report of Independent Registered Public Accounting Firm, are available on the SEC's website or upon request. |
(c) Investment made with cash collateral received from securities on loan. |
(d) Security or a portion of the security is on loan at period end. |
Affiliated Central Funds |
Information regarding fiscal year to date income earned by the Fund from investments in Fidelity Central Funds is as follows: |
Fund | Income earned |
Fidelity Cash Central Fund | $ 6,143 |
Fidelity Securities Lending Cash Central Fund | 6,519 |
Total | $ 12,662 |
Other Information |
Categorizations in the Schedule of Investments are based on country or territory of incorporation. |
The following is a summary of the inputs used, as of October 31, 2014, involving the Fund's assets and liabilities carried at fair value. The inputs or methodology used for valuing securities may not be an indication of the risk associated with investing in those securities. For more information on valuation inputs, and their aggregation into the levels used in the tables below, please refer to the Investment Valuation section in the accompanying Notes to Financial Statements. |
Valuation Inputs at Reporting Date: |
Description | Total | Level 1 | Level 2 | Level 3 |
Investments in Securities: | | | | |
Equities: | | | | |
Consumer Discretionary | $ 34,803,862 | $ 9,202,107 | $ 25,601,755 | $ - |
Consumer Staples | 11,976,718 | 8,123,171 | 3,853,547 | - |
Energy | 11,269,197 | 191,885 | 11,077,312 | - |
Financials | 95,820,080 | 10,446,606 | 85,373,474 | - |
Health Care | 6,391,970 | 1,328,887 | 5,063,083 | - |
Industrials | 23,286,614 | 2,167,496 | 18,202,759 | 2,916,359 |
Information Technology | 68,693,620 | 23,589,482 | 45,104,138 | - |
Materials | 15,079,687 | 4,531,845 | 10,547,842 | - |
Telecommunication Services | 19,548,802 | - | 19,548,802 | - |
Utilities | 15,144,098 | 192,189 | 14,951,909 | - |
Money Market Funds | 1,224,083 | 1,224,083 | - | - |
Total Investments in Securities: | $ 303,238,731 | $ 60,997,751 | $ 239,324,621 | $ 2,916,359 |
The following is a summary of transfers between Level 1 and Level 2 for the period ended October 31, 2014. Transfers are assumed to have occurred at the beginning of the period, and are primarily attributable to the valuation techniques used for foreign equity securities, as discussed in the accompanying Notes to Financial Statements: |
Transfers | Total |
Level 1 to Level 2 | $ 118,630,407 |
Level 2 to Level 1 | $ 3,581,992 |
See accompanying notes which are an integral part of the financial statements.
Annual Report
Statement of Assets and Liabilities
| October 31, 2014 |
| | |
Assets | | |
Investment in securities, at value (including securities loaned of $152,781) - See accompanying schedule: Unaffiliated issuers (cost $256,071,530) | $ 302,014,648 | |
Fidelity Central Funds (cost $1,224,083) | 1,224,083 | |
Total Investments (cost $257,295,613) | | $ 303,238,731 |
Foreign currency held at value (cost $2,564) | | 2,564 |
Receivable for fund shares sold | | 1,215,063 |
Dividends receivable | | 226,189 |
Distributions receivable from Fidelity Central Funds | | 276 |
Prepaid expenses | | 649 |
Other receivables | | 138,155 |
Total assets | | 304,821,627 |
| | |
Liabilities | | |
Payable for fund shares redeemed | $ 914,485 | |
Accrued management fee | 172,544 | |
Distribution and service plan fees payable | 99,904 | |
Other affiliated payables | 77,910 | |
Other payables and accrued expenses | 1,079,459 | |
Collateral on securities loaned, at value | 150,606 | |
Total liabilities | | 2,494,908 |
| | |
Net Assets | | $ 302,326,719 |
Net Assets consist of: | | |
Paid in capital | | $ 240,725,477 |
Undistributed net investment income | | 1,321,181 |
Accumulated undistributed net realized gain (loss) on investments and foreign currency transactions | | 15,322,444 |
Net unrealized appreciation (depreciation) on investments and assets and liabilities in foreign currencies | | 44,957,617 |
Net Assets | | $ 302,326,719 |
See accompanying notes which are an integral part of the financial statements.
Annual Report
Statement of Assets and Liabilities - continued
| October 31, 2014 |
| | |
Calculation of Maximum Offering Price Class A:
Net Asset Value and redemption price per share ($145,183,525 ÷ 4,530,316 shares) | | $ 32.05 |
| | |
Maximum offering price per share (100/94.25 of $32.05) | | $ 34.01 |
Class T:
Net Asset Value and redemption price per share ($44,563,242 ÷ 1,429,570 shares) | | $ 31.17 |
| | |
Maximum offering price per share (100/96.50 of $31.17) | | $ 32.30 |
Class B:
Net Asset Value and offering price per share ($6,660,785 ÷ 224,786 shares)A | | $ 29.63 |
| | |
Class C:
Net Asset Value and offering price per share ($57,225,913 ÷ 1,953,037 shares)A | | $ 29.30 |
| | |
| | |
Institutional Class:
Net Asset Value, offering price and redemption price per share ($48,693,254 ÷ 1,475,608 shares) | | $ 33.00 |
A Redemption price per share is equal to net asset value less any applicable contingent deferred sales charge.
See accompanying notes which are an integral part of the financial statements.
Annual Report
Financial Statements - continued
Statement of Operations
| Year ended October 31, 2014 |
| | |
Investment Income | | |
Dividends | | $ 7,785,977 |
Income from Fidelity Central Funds | | 12,662 |
Income before foreign taxes withheld | | 7,798,639 |
Less foreign taxes withheld | | (660,335) |
Total income | | 7,138,304 |
| | |
Expenses | | |
Management fee | $ 2,095,686 | |
Transfer agent fees | 775,288 | |
Distribution and service plan fees | 1,245,694 | |
Accounting and security lending fees | 155,308 | |
Custodian fees and expenses | 280,652 | |
Independent trustees' compensation | 1,231 | |
Registration fees | 71,315 | |
Audit | 107,106 | |
Legal | 1,110 | |
Interest | 184 | |
Miscellaneous | 27,533 | |
Total expenses | | 4,761,107 |
Net investment income (loss) | | 2,377,197 |
Realized and Unrealized Gain (Loss) Net realized gain (loss) on: | | |
Investment securities: | | |
Unaffiliated issuers (net of foreign taxes of $821,883) | 17,039,591 | |
Foreign currency transactions | (194,377) | |
Total net realized gain (loss) | | 16,845,214 |
Change in net unrealized appreciation (depreciation) on: Investment securities (net of increase in deferred foreign taxes of $935,158) | 736,657 | |
Assets and liabilities in foreign currencies | (908) | |
Total change in net unrealized appreciation (depreciation) | | 735,749 |
Net gain (loss) | | 17,580,963 |
Net increase (decrease) in net assets resulting from operations | | $ 19,958,160 |
See accompanying notes which are an integral part of the financial statements.
Annual Report
Statement of Changes in Net Assets
| Year ended
October 31,
2014 | Year ended
October 31,
2013 |
Increase (Decrease) in Net Assets | | |
Operations | | |
Net investment income (loss) | $ 2,377,197 | $ 2,621,540 |
Net realized gain (loss) | 16,845,214 | 28,149,471 |
Change in net unrealized appreciation (depreciation) | 735,749 | (972,592) |
Net increase (decrease) in net assets resulting
from operations | 19,958,160 | 29,798,419 |
Distributions to shareholders from net investment income | (2,011,362) | (3,137,656) |
Distributions to shareholders from net realized gain | (13,483,906) | (1,067,553) |
Total distributions | (15,495,268) | (4,205,209) |
Share transactions - net increase (decrease) | (13,223,545) | (47,287,205) |
Redemption fees | 35,731 | 37,169 |
Total increase (decrease) in net assets | (8,724,922) | (21,656,826) |
| | |
Net Assets | | |
Beginning of period | 311,051,641 | 332,708,467 |
End of period (including undistributed net investment income of $1,321,181 and undistributed net investment income of $1,990,012, respectively) | $ 302,326,719 | $ 311,051,641 |
See accompanying notes which are an integral part of the financial statements.
Annual Report
Financial Highlights - Class A
Years ended October 31, | 2014 | 2013 | 2012 | 2011 | 2010 |
Selected Per-Share Data | | | | | |
Net asset value, beginning of period | $ 31.34 | $ 28.87 | $ 28.70 | $ 32.97 | $ 25.96 |
Income from Investment Operations | | | | | |
Net investment income (loss) C | .30 | .30 | .34 | .35 | .25 |
Net realized and unrealized gain (loss) | 2.00 H | 2.59 | 1.37 | (2.62) | 7.09 |
Total from investment operations | 2.30 | 2.89 | 1.71 | (2.27) | 7.34 |
Distributions from net investment income | (.26) | (.33) | (.31) | (.20) | (.12) |
Distributions from net realized gain | (1.33) | (.09) | (1.23) | (1.81) | (.22) |
Total distributions | (1.59) | (.42) | (1.54) | (2.01) | (.34) |
Redemption fees added to paid in capital C | - G | - G | - G | .01 | .01 |
Net asset value, end of period | $ 32.05 | $ 31.34 | $ 28.87 | $ 28.70 | $ 32.97 |
Total ReturnA, B | 7.70% H | 10.10% | 6.36% | (7.44)% | 28.53% |
Ratios to Average Net Assets D, F | | | | | |
Expenses before reductions | 1.42% | 1.41% | 1.42% | 1.39% | 1.44% |
Expenses net of fee waivers, if any | 1.42% | 1.41% | 1.42% | 1.39% | 1.44% |
Expenses net of all reductions | 1.42% | 1.38% | 1.38% | 1.35% | 1.40% |
Net investment income (loss) | .96% | .99% | 1.24% | 1.12% | .86% |
Supplemental Data | | | | | |
Net assets, end of period (000 omitted) | $ 145,184 | $ 155,104 | $ 160,427 | $ 179,346 | $ 189,255 |
Portfolio turnover rateE | 91% | 95% | 95% | 119% | 138% |
A Total returns would have been lower if certain expenses had not been reduced during the applicable periods shown.
B Total returns do not include the effect of the sales charges.
C Calculated based on average shares outstanding during the period.
D Fees and expenses of any underlying Fidelity Central Funds are not included in the Fund's expense ratio. The Fund indirectly bears its proportionate share of the expenses of any underlying Fidelity Central Funds.
E Amount does not include the portfolio activity of any underlying Fidelity Central Funds.
F Expense ratios reflect operating expenses of the class. Expenses before reductions do not reflect amounts reimbursed by the investment adviser or reductions from brokerage service arrangements or reductions from other expense offset arrangements and do not represent the amount paid by the class during periods when reimbursements or reductions occur. Expenses net of fee waivers reflect expenses after reimbursement by the investment adviser but prior to reductions from brokerage service arrangements or other expense offset arrangements. Expenses net of all reductions represent the net expenses paid by the class.
G Amount represents less than $.01 per share.
H In 2014, a change to the Indian tax rules invalidated a prior ruling that had exempted the Fund from taxes on realized gains. As a result, the Fund recorded a tax liability which resulted in a decrease to realized and unrealized gain (loss) per share of $.18 at period end. Excluding this amount, the total return would have been 8.29%.
See accompanying notes which are an integral part of the financial statements.
Annual Report
Financial Highlights - Class T
Years ended October 31, | 2014 | 2013 | 2012 | 2011 | 2010 |
Selected Per-Share Data | | | | | |
Net asset value, beginning of period | $ 30.53 | $ 28.13 | $ 27.98 | $ 32.20 | $ 25.40 |
Income from Investment Operations | | | | | |
Net investment income (loss) C | .20 | .20 | .25 | .25 | .15 |
Net realized and unrealized gain (loss) | 1.94 H | 2.54 | 1.33 | (2.55) | 6.94 |
Total from investment operations | 2.14 | 2.74 | 1.58 | (2.30) | 7.09 |
Distributions from net investment income | (.17) | (.25) | (.20) | (.12) | (.08) |
Distributions from net realized gain | (1.33) | (.09) | (1.23) | (1.81) | (.22) |
Total distributions | (1.50) | (.34) | (1.43) | (1.93) | (.30) |
Redemption fees added to paid in capital C | - G | - G | - G | .01 | .01 |
Net asset value, end of period | $ 31.17 | $ 30.53 | $ 28.13 | $ 27.98 | $ 32.20 |
Total ReturnA, B | 7.34% H | 9.80% | 6.04% | (7.70)% | 28.13% |
Ratios to Average Net Assets D, F | | | | | |
Expenses before reductions | 1.73% | 1.70% | 1.70% | 1.70% | 1.74% |
Expenses net of fee waivers, if any | 1.73% | 1.70% | 1.70% | 1.69% | 1.74% |
Expenses net of all reductions | 1.73% | 1.67% | 1.67% | 1.65% | 1.70% |
Net investment income (loss) | .66% | .70% | .95% | .82% | .55% |
Supplemental Data | | | | | |
Net assets, end of period (000 omitted) | $ 44,563 | $ 47,620 | $ 49,359 | $ 55,452 | $ 61,620 |
Portfolio turnover rateE | 91% | 95% | 95% | 119% | 138% |
A Total returns would have been lower if certain expenses had not been reduced during the applicable periods shown.
B Total returns do not include the effect of the sales charges.
C Calculated based on average shares outstanding during the period.
D Fees and expenses of any underlying Fidelity Central Funds are not included in the Fund's expense ratio. The Fund indirectly bears its proportionate share of the expenses of any underlying Fidelity Central Funds.
E Amount does not include the portfolio activity of any underlying Fidelity Central Funds.
F Expense ratios reflect operating expenses of the class. Expenses before reductions do not reflect amounts reimbursed by the investment adviser or reductions from brokerage service arrangements or reductions from other expense offset arrangements and do not represent the amount paid by the class during periods when reimbursements or reductions occur. Expenses net of fee waivers reflect expenses after reimbursement by the investment adviser but prior to reductions from brokerage service arrangements or other expense offset arrangements. Expenses net of all reductions represent the net expenses paid by the class.
G Amount represents less than $.01 per share.
H In 2014, a change to the Indian tax rules invalidated a prior ruling that had exempted the Fund from taxes on realized gains. As a result, the Fund recorded a tax liability which resulted in a decrease to realized and unrealized gain (loss) per share of $.18 at period end. Excluding this amount, the total return would have been 7.93%.
See accompanying notes which are an integral part of the financial statements.
Annual Report
Financial Highlights - Class B
Years ended October 31, | 2014 | 2013 | 2012 | 2011 | 2010 |
Selected Per-Share Data | | | | | |
Net asset value, beginning of period | $ 29.06 | $ 26.77 | $ 26.62 | $ 30.72 | $ 24.29 |
Income from Investment Operations | | | | | |
Net investment income (loss) C | .05 | .06 | .12 | .10 | .02 |
Net realized and unrealized gain (loss) | 1.85 H | 2.41 | 1.26 | (2.44) | 6.61 |
Total from investment operations | 1.90 | 2.47 | 1.38 | (2.34) | 6.63 |
Distributions from net investment income | - | (.09) | - | - | - |
Distributions from net realized gain | (1.33) | (.09) | (1.23) | (1.77) | (.21) |
Total distributions | (1.33) | (.18) | (1.23) | (1.77) | (.21) |
Redemption fees added to paid in capital C | - G | - G | - G | .01 | .01 |
Net asset value, end of period | $ 29.63 | $ 29.06 | $ 26.77 | $ 26.62 | $ 30.72 |
Total ReturnA, B | 6.84% H | 9.27% | 5.51% | (8.16)% | 27.48% |
Ratios to Average Net Assets D, F | | | | | |
Expenses before reductions | 2.22% | 2.20% | 2.19% | 2.19% | 2.24% |
Expenses net of fee waivers, if any | 2.22% | 2.20% | 2.19% | 2.18% | 2.24% |
Expenses net of all reductions | 2.22% | 2.17% | 2.16% | 2.15% | 2.20% |
Net investment income (loss) | .16% | .20% | .46% | .32% | .06% |
Supplemental Data | | | | | |
Net assets, end of period (000 omitted) | $ 6,661 | $ 10,194 | $ 15,823 | $ 20,831 | $ 29,611 |
Portfolio turnover rateE | 91% | 95% | 95% | 119% | 138% |
A Total returns would have been lower if certain expenses had not been reduced during the applicable periods shown.
B Total returns do not include the effect of the contingent deferred sales charge.
C Calculated based on average shares outstanding during the period.
D Fees and expenses of any underlying Fidelity Central Funds are not included in the Fund's expense ratio. The Fund indirectly bears its proportionate share of the expenses of any underlying Fidelity Central Funds.
E Amount does not include the portfolio activity of any underlying Fidelity Central Funds.
F Expense ratios reflect operating expenses of the class. Expenses before reductions do not reflect amounts reimbursed by the investment adviser or reductions from brokerage service arrangements or reductions from other expense offset arrangements and do not represent the amount paid by the class during periods when reimbursements or reductions occur. Expenses net of fee waivers reflect expenses after reimbursement by the investment adviser but prior to reductions from brokerage service arrangements or other expense offset arrangements. Expenses net of all reductions represent the net expenses paid by the class.
G Amount represents less than $.01 per share.
H In 2014, a change to the Indian tax rules invalidated a prior ruling that had exempted the Fund from taxes on realized gains. As a result, the Fund recorded a tax liability which resulted in a decrease to realized and unrealized gain (loss) per share of $.17 at period end. Excluding this amount, the total return would have been 7.43%.
See accompanying notes which are an integral part of the financial statements.
Annual Report
Financial Highlights - Class C
Years ended October 31, | 2014 | 2013 | 2012 | 2011 | 2010 |
Selected Per-Share Data | | | | | |
Net asset value, beginning of period | $ 28.78 | $ 26.53 | $ 26.44 | $ 30.58 | $ 24.19 |
Income from Investment Operations | | | | | |
Net investment income (loss) C | .06 | .07 | .13 | .11 | .03 |
Net realized and unrealized gain (loss) | 1.82 H | 2.39 | 1.25 | (2.41) | 6.59 |
Total from investment operations | 1.88 | 2.46 | 1.38 | (2.30) | 6.62 |
Distributions from net investment income | (.03) | (.12) | (.06) | (.04) | (.02) |
Distributions from net realized gain | (1.33) | (.09) | (1.23) | (1.81) | (.22) |
Total distributions | (1.36) | (.21) | (1.29) | (1.85) | (.24) |
Redemption fees added to paid in capital C | - G | - G | - G | .01 | .01 |
Net asset value, end of period | $ 29.30 | $ 28.78 | $ 26.53 | $ 26.44 | $ 30.58 |
Total ReturnA, B | 6.85% H | 9.33% | 5.57% | (8.10)% | 27.58% |
Ratios to Average Net Assets D, F | | | | | |
Expenses before reductions | 2.17% | 2.16% | 2.16% | 2.13% | 2.17% |
Expenses net of fee waivers, if any | 2.17% | 2.16% | 2.16% | 2.13% | 2.17% |
Expenses net of all reductions | 2.17% | 2.12% | 2.13% | 2.10% | 2.13% |
Net investment income (loss) | .22% | .24% | .49% | .37% | .12% |
Supplemental Data | | | | | |
Net assets, end of period (000 omitted) | $ 57,226 | $ 61,824 | $ 67,074 | $ 78,939 | $ 87,089 |
Portfolio turnover rateE | 91% | 95% | 95% | 119% | 138% |
A Total returns would have been lower if certain expenses had not been reduced during the applicable periods shown.
B Total returns do not include the effect of the contingent deferred sales charge.
C Calculated based on average shares outstanding during the period.
D Fees and expenses of any underlying Fidelity Central Funds are not included in the Fund's expense ratio. The Fund indirectly bears its proportionate share of the expenses of any underlying Fidelity Central Funds.
E Amount does not include the portfolio activity of any underlying Fidelity Central Funds.
F Expense ratios reflect operating expenses of the class. Expenses before reductions do not reflect amounts reimbursed by the investment adviser or reductions from brokerage service arrangements or reductions from other expense offset arrangements and do not represent the amount paid by the class during periods when reimbursements or reductions occur. Expenses net of fee waivers reflect expenses after reimbursement by the investment adviser but prior to reductions from brokerage service arrangements or other expense offset arrangements. Expenses net of all reductions represent the net expenses paid by the class.
G Amount represents less than $.01 per share.
H In 2014, a change to the Indian tax rules invalidated a prior ruling that had exempted the Fund from taxes on realized gains. As a result, the Fund recorded a tax liability which resulted in a decrease to realized and unrealized gain (loss) per share of $.17 at period end. Excluding this amount, the total return would have been 7.44%.
See accompanying notes which are an integral part of the financial statements.
Annual Report
Financial Highlights - Institutional Class
Years ended October 31, | 2014 | 2013 | 2012 | 2011 | 2010 |
Selected Per-Share Data | | | | | |
Net asset value, beginning of period | $ 32.24 | $ 29.67 | $ 29.49 | $ 33.80 | $ 26.58 |
Income from Investment Operations | | | | | |
Net investment income (loss) B | .40 | .40 | .44 | .46 | .34 |
Net realized and unrealized gain (loss) | 2.04 I | 2.68 | 1.39 | (2.69) | 7.26 |
Total from investment operations | 2.44 | 3.08 | 1.83 | (2.23) | 7.60 |
Distributions from net investment income | (.35) | (.41) | (.42) | (.29) | (.17) |
Distributions from net realized gain | (1.33) | (.09) | (1.23) | (1.81) | (.22) |
Total distributions | (1.68) | (.51) G | (1.65) | (2.09) H | (.39) |
Redemption fees added to paid in capital B | - F | - F | - F | .01 | .01 |
Net asset value, end of period | $ 33.00 | $ 32.24 | $ 29.67 | $ 29.49 | $ 33.80 |
Total ReturnA | 7.98% I | 10.47% | 6.64% | (7.13)% | 28.87% |
Ratios to Average Net Assets C, E | | | | | |
Expenses before reductions | 1.12% | 1.11% | 1.11% | 1.10% | 1.14% |
Expenses net of fee waivers, if any | 1.12% | 1.11% | 1.11% | 1.10% | 1.14% |
Expenses net of all reductions | 1.12% | 1.08% | 1.08% | 1.06% | 1.10% |
Net investment income (loss) | 1.26% | 1.29% | 1.54% | 1.41% | 1.16% |
Supplemental Data | | | | | |
Net assets, end of period (000 omitted) | $ 48,693 | $ 36,310 | $ 40,026 | $ 49,888 | $ 45,042 |
Portfolio turnover rateD | 91% | 95% | 95% | 119% | 138% |
A Total returns would have been lower if certain expenses had not been reduced during the applicable periods shown.
B Calculated based on average shares outstanding during the period.
C Fees and expenses of any underlying Fidelity Central Funds are not included in the Fund's expense ratio. The Fund indirectly bears its proportionate share of the expenses of any underlying Fidelity Central Funds.
D Amount does not include the portfolio activity of any underlying Fidelity Central Funds.
E Expense ratios reflect operating expenses of the class. Expenses before reductions do not reflect amounts reimbursed by the investment adviser or reductions from brokerage service arrangements or reductions from other expense offset arrangements and do not represent the amount paid by the class during periods when reimbursements or reductions occur. Expenses net of fee waivers reflect expenses after reimbursement by the investment adviser but prior to reductions from brokerage service arrangements or other expense offset arrangements. Expenses net of all reductions represent the net expenses paid by the class.
F Amount represents less than $.01 per share.
G Total distributions of $.51 per share is comprised of distributions from net investment income of $.413 and distributions from net realized gain of $.092 per share.
H Total distributions of $2.09 per share is comprised of distributions from net investment income of $.288 and distributions from net realized gain of $1.805 per share.
I In 2014, a change to the Indian tax rules invalidated a prior ruling that had exempted the Fund from taxes on realized gains. As a result, the Fund recorded a tax liability which resulted in a decrease to realized and unrealized gain (loss) per share of $.19 at period end. Excluding this amount, the total return would have been 8.57%.
See accompanying notes which are an integral part of the financial statements.
Annual Report
Notes to Financial Statements
For the period ended October 31, 2014
1. Organization.
Fidelity Advisor Emerging Asia Fund (the Fund) is a fund of Fidelity Advisor Series VIII (the Trust) and is authorized to issue an unlimited number of shares. The Trust is registered under the Investment Company Act of 1940, as amended (the 1940 Act), as an open-end management investment company organized as a Massachusetts business trust. The Fund offers Class A, Class T, Class C and Institutional Class shares, each of which, along with Class B shares, has equal rights as to assets and voting privileges. Class B shares are closed to new accounts and additional purchases, except for exchanges and reinvestments. Each class has exclusive voting rights with respect to matters that affect that class. Class B shares will automatically convert to Class A shares after a holding period of seven years from the initial date of purchase. The Fund's investments in emerging markets can be subject to social, economic, regulatory, and political uncertainties and can be extremely volatile.
2. Investments in Fidelity Central Funds.
The Fund invests in Fidelity Central Funds, which are open-end investment companies generally available only to other investment companies and accounts managed by the investment adviser and its affiliates. The Fund's Schedule of Investments lists each of the Fidelity Central Funds held as of period end, if any, as an investment of the Fund, but does not include the underlying holdings of each Fidelity Central Fund. As an Investing Fund, the Fund indirectly bears its proportionate share of the expenses of the underlying Fidelity Central Funds.
The Money Market Central Funds seek preservation of capital and current income and are managed by Fidelity Investments Money Management, Inc. (FIMM), an affiliate of the investment adviser. Annualized expenses of the Money Market Central Funds as of their most recent shareholder report date are less than .01%.
A complete unaudited list of holdings for each Fidelity Central Fund is available upon request or at the Securities and Exchange Commission (the SEC) website at www.sec.gov. In addition, the financial statements of the Fidelity Central Funds, which are not covered by the Fund's Report of Independent Registered Public Accounting Firm, are available on the SEC website or upon request.
3. Significant Accounting Policies.
The financial statements have been prepared in conformity with accounting principles generally accepted in the United States of America (GAAP), which require management to make certain estimates and assumptions at the date of the financial statements. Actual results could differ from those estimates. Subsequent events, if any, through the date that the financial statements were issued have been evaluated in the preparation of
Annual Report
Notes to Financial Statements - continued
3. Significant Accounting Policies - continued
the financial statements. The following summarizes the significant accounting policies of the Fund:
Investment Valuation. Investments are valued as of 4:00 p.m. Eastern time on the last calendar day of the period. In accordance with valuation policies and procedures approved by the Board of Trustees (the Board), the Fund attempts to obtain prices from one or more third party pricing vendors or brokers to value its investments. When current market prices, quotations or currency exchange rates are not readily available or reliable, investments will be fair valued in good faith by the Fidelity Management & Research Company (FMR) Fair Value Committee (the Committee), in accordance with procedures adopted by the Board. Factors used in determining fair value vary by investment type and may include market or investment specific events. The frequency with which these procedures are used cannot be predicted and they may be utilized to a significant extent. The Committee oversees the Fund's valuation policies and procedures and is responsible for approving and reporting to the Board all fair value determinations.
The Fund categorizes the inputs to valuation techniques used to value its investments into a disclosure hierarchy consisting of three levels as shown below:
Level 1 - quoted prices in active markets for identical investments
Level 2 - other significant observable inputs (including quoted prices for similar investments, interest rates, prepayment speeds, etc.)
Level 3 - unobservable inputs (including the Fund's own assumptions based on the best information available)
Valuation techniques used to value the Fund's investments by major category are as follows:
Equity securities, including restricted securities, for which market quotations are readily available, are valued at the last reported sale price or official closing price as reported by a third party pricing vendor on the primary market or exchange on which they are traded and are categorized as Level 1 in the hierarchy. In the event there were no sales during the day or closing prices are not available, securities are valued at the last quoted bid price or may be valued using the last available price and are generally categorized as Level 2 in the hierarchy. For foreign equity securities, when market or security specific events arise, comparisons to the valuation of American Depositary Receipts (ADRs), futures contracts, Exchange-Traded Funds (ETFs) and certain indexes as well as quoted prices for similar securities may be used and would be categorized as Level 2 in the hierarchy. Utilizing these techniques may result in transfers between Level 1 and Level 2. For equity securities, including restricted securities, where observable inputs are limited, assumptions about market activity and risk are used and these securities may be categorized as Level 3 in the hierarchy.
Annual Report
3. Significant Accounting Policies - continued
Investment Valuation - continued
Investments in open-end mutual funds, including the Fidelity Central Funds, are valued at their closing net asset value (NAV) each business day and are categorized as Level 1 in the hierarchy.
Changes in valuation techniques may result in transfers in or out of an assigned level within the disclosure hierarchy. The aggregate value of investments by input level, as of October 31, 2014, including information on transfers between Levels 1 and 2 is included at the end of the Fund's Schedule of Investments.
Foreign Currency. The Fund may use foreign currency contracts to facilitate transactions in foreign-denominated securities. Gains and losses from these transactions may arise from changes in the value of the foreign currency or if the counterparties do not perform under the contracts' terms.
Foreign-denominated assets, including investment securities, and liabilities are translated into U.S. dollars at the exchange rates at period end. Purchases and sales of investment securities, income and dividends received and expenses denominated in foreign currencies are translated into U.S. dollars at the exchange rate in effect on the transaction date.
The effects of exchange rate fluctuations on investments are included with the net realized and unrealized gain (loss) on investment securities. Other foreign currency transactions resulting in realized and unrealized gain (loss) are disclosed separately.
Investment Transactions and Income. For financial reporting purposes, the Fund's investment holdings and NAV include trades executed through the end of the last business day of the period. The NAV per share for processing shareholder transactions is calculated as of the close of business of the New York Stock Exchange (NYSE), normally 4:00 p.m. Eastern time and includes trades executed through the end of the prior business day. Gains and losses on securities sold are determined on the basis of identified cost and may include proceeds received from litigation. Dividend income is recorded on the ex-dividend date, except for certain dividends from foreign securities where the ex-dividend date may have passed, which are recorded as soon as the Fund is informed of the ex-dividend date. Non-cash dividends included in dividend income, if any, are recorded at the fair market value of the securities received. Income and capital gain distributions from Fidelity Central Funds, if any, are recorded on the ex-dividend date. Distributions received on securities that represent a return of capital or capital gain are recorded as a reduction of cost of investments and/or as a realized gain. Subsequent to ex-dividend date the Fund determines the components of these distributions, based upon receipt of tax filings or other correspondence relating to the underlying investment. Investment income is recorded net of foreign taxes withheld where recovery of such taxes is uncertain.
Annual Report
Notes to Financial Statements - continued
3. Significant Accounting Policies - continued
Class Allocations and Expenses. Investment income, realized and unrealized capital gains and losses, common expenses of the Fund, and certain fund-level expense reductions, if any, are allocated daily on a pro-rata basis to each class based on the relative net assets of each class to the total net assets of the Fund. Each class differs with respect to transfer agent and distribution and service plan fees incurred. Certain expense reductions may also differ by class. For the reporting period, the allocated portion of income and expenses to each class as a percent of its average net assets may vary due to the timing of recording these transactions in relation to fluctuating net assets of the classes. Expenses directly attributable to a fund are charged to that fund. Expenses attributable to more than one fund are allocated among the respective funds on the basis of relative net assets or other appropriate methods. Expense estimates are accrued in the period to which they relate and adjustments are made when actual amounts are known.
Income Tax Information and Distributions to Shareholders. Each year, the Fund intends to qualify as a regulated investment company under Subchapter M of the Internal Revenue Code, including distributing substantially all of its taxable income and realized gains. As a result, no provision for U.S. Federal income taxes is required. As of October 31, 2014, the Fund did not have any unrecognized tax benefits in the financial statements; nor is the Fund aware of any tax positions for which it is reasonably possible that the total amounts of unrecognized tax benefits will significantly change in the next twelve months. The Fund files a U.S. federal tax return, in addition to state and local tax returns as required. The Fund's federal income tax returns are subject to examination by the Internal Revenue Service (IRS) for a period of three fiscal years after they are filed. State and local tax returns may be subject to examination for an additional fiscal year depending on the jurisdiction. Foreign taxes are provided for based on the Fund's understanding of the tax rules and rates that exist in the foreign markets in which it invests. The Fund is subject to a tax imposed on capital gains by certain countries in which it invests. An estimated deferred tax liability for net unrealized appreciation on the applicable securities is included in Other payables and accrued expenses on the Statement of Assets & Liabilities. In 2004, the Fund received a ruling from the Authority for Advance Ruling in India regarding the applicability of taxes imposed by the country on short term realized capital gains under the US/India tax treaty. The ruling entitled the Fund to a refund of capital gains taxes paid in prior years and exempted the Fund from taxes on future short term realized gains. A 2014 change to the Indian tax laws, published on August 12, 2014 and effective retroactive to April 1, 2014, invalidated this 2004 ruling and mandates that all short term gains realized by any Foreign Institutional Investor be treated and taxed as capital gains. As a result, the Fund recorded a tax liability of $1,757,881 on August 12, 2014. This amount includes taxes due on short term gains realized during the period April 1 through August 12 and an estimated accrual for deferred taxes on net unrealized appreciation on applicable securities. The new law does not impact the favorable tax treatment that the Fund received prior to April 1, 2014.
Annual Report
3. Significant Accounting Policies - continued
Income Tax Information and Distributions to Shareholders - continued
Distributions are declared and recorded on the ex-dividend date. Income dividends and capital gain distributions are declared separately for each class. Income and capital gain distributions are determined in accordance with income tax regulations, which may differ from GAAP. In addition, the Fund claimed a portion of the payment made to redeeming shareholders as a distribution for income tax purposes.
Capital accounts within the financial statements are adjusted for permanent book-tax differences. These adjustments have no impact on net assets or the results of operations. Capital accounts are not adjusted for temporary book-tax differences which will reverse in a subsequent period.
Book-tax differences are primarily due to foreign currency transactions, certain foreign taxes, passive foreign investment companies (PFIC) and losses deferred due to wash sales.
The federal tax cost of investment securities and unrealized appreciation (depreciation) as of period end were as follows:
Gross unrealized appreciation | $ 56,044,425 |
Gross unrealized depreciation | (10,601,449) |
Net unrealized appreciation (depreciation) on securities | $ 45,442,976 |
| |
Tax Cost | $ 257,795,755 |
The tax-based components of distributable earnings as of period end were as follows:
Undistributed ordinary income | $ 2,615,256 |
Undistributed long-term capital gain | $ 14,528,510 |
Net unrealized appreciation (depreciation) on securities and other investments | $ 45,392,633 |
The tax character of distributions paid was as follows:
| October 31, 2014 | October 31, 2013 |
Ordinary Income | $ 2,011,362 | $ 4,205,209 |
Long-term Capital Gains | 13,483,906 | - |
Total | $ 15,495,268 | $ 4,205,209 |
Short-Term Trading (Redemption) Fees. Shares held by investors in the Fund less than 90 days may have been subject to a redemption fee equal to 1.50% of the NAV of shares redeemed. All redemption fees, which reduce the proceeds of the shareholder redemption, are retained by the Fund and accounted for as an addition to paid in capital.
New Accounting Pronouncement. In June 2014, the Financial Accounting Standards Board issued Accounting Standard Update No. 2014-11, Repurchase-to-Maturity
Annual Report
Notes to Financial Statements - continued
3. Significant Accounting Policies - continued
New Accounting Pronouncement - continued
Transactions, Repurchase Financings, and Disclosures. The Update amends the accounting for certain repurchase agreements and expands disclosure requirements for reverse repurchase agreements, securities lending and other similar transactions. The disclosure requirements are effective for annual and interim reporting periods beginning after December 15, 2014. Management is currently evaluating the impact of the Update on the Fund's financial statements and related disclosures.
4. Purchases and Sales of Investments.
Purchases and sales of securities, other than short-term securities, aggregated $267,759,629 and $289,903,487, respectively.
5. Fees and Other Transactions with Affiliates.
Management Fee. Fidelity Management & Research Company (the investment adviser) and its affiliates provide the Fund with investment management related services for which the Fund pays a monthly management fee. The management fee is the sum of an individual fund fee rate that is based on an annual rate of .45% of the Fund's average net assets and an annualized group fee rate that averaged .25% during the period. The group fee rate is based upon the average net assets of all the mutual funds advised by the investment adviser, including any mutual funds previously advised by the investment adviser that are currently advised by Fidelity SelectCo, LLC, an affiliate of the investment adviser. The group fee rate decreases as assets under management increase and increases as assets under management decrease. For the reporting period, the total annual management fee rate was .70% of the Fund's average net assets.
Distribution and Service Plan Fees. In accordance with Rule 12b-1 of the 1940 Act, the Fund has adopted separate Distribution and Service Plans for each class of shares. Certain classes pay Fidelity Distributors Corporation (FDC), an affiliate of the investment adviser, separate Distribution and Service Fees, each of which is based on an annual percentage of each class' average net assets. In addition, FDC may pay financial intermediaries for selling shares of the Fund and providing shareholder support services. For the period, the Distribution and Service Fee rates, total fees and amounts retained by FDC were as follows:
| Distribution
Fee | Service
Fee | Total Fees | Retained
by FDC |
Class A | -% | .25% | $ 370,136 | $ 3,699 |
Class T | .25% | .25% | 223,942 | 2,149 |
Class B | .75% | .25% | 79,813 | 59,963 |
Class C | .75% | .25% | 571,803 | 37,838 |
| | | $ 1,245,694 | $ 103,649 |
Annual Report
5. Fees and Other Transactions with Affiliates - continued
Sales Load. FDC may receive a front-end sales charge of up to 5.75% for selling Class A shares and 3.50% for selling Class T shares, some of which is paid to financial intermediaries for selling shares of the Fund. Depending on the holding period, FDC may receive contingent deferred sales charges levied on Class A, Class T, Class B, and Class C redemptions. The deferred sales charges range from 5.00% to 1.00% for Class B shares, 1.00% for Class C shares, 1.00% for certain purchases of Class A shares and .25% for certain purchases of Class T shares.
For the period, sales charge amounts retained by FDC were as follows:
| Retained
by FDC |
Class A | $ 34,572 |
Class T | 7,281 |
Class B* | 10,030 |
Class C* | 1,697 |
| $ 53,580 |
* When Class B and Class C shares are initially sold, FDC pays commissions from its own resources to financial intermediaries through which the sales are made.
Transfer Agent Fees. Fidelity Investments Institutional Operations Company, Inc., (FIIOC), an affiliate of the investment adviser, is the transfer, dividend disbursing and shareholder servicing agent for each class of the Fund. FIIOC receives account fees and asset-based fees that vary according to the account size and type of account of the shareholders of the respective classes of the Fund. FIIOC pays for typesetting, printing and mailing of shareholder reports, except proxy statements.
For the period, transfer agent fees for each class were as follows:
| Amount | % of
Class-Level
Average
Net Assets |
Class A | $ 382,080 | .26 |
Class T | 138,983 | .31 |
Class B | 24,128 | .30 |
Class C | 143,764 | .25 |
Institutional Class | 86,333 | .21 |
| $ 775,288 | |
Accounting and Security Lending Fees. Fidelity Service Company, Inc. (FSC), an affiliate of the investment adviser, maintains the Fund's accounting records. The accounting fee is based on the level of average net assets for each month. Under a separate contract, FSC administers the security lending program. The security lending fee is based on the number and duration of lending transactions.
Annual Report
Notes to Financial Statements - continued
5. Fees and Other Transactions with Affiliates - continued
Brokerage Commissions. The Fund placed a portion of its portfolio transactions with brokerage firms which are affiliates of the investment adviser. Brokerage commissions are included in net realized gain (loss) and change in net unrealized appreciation (depreciation) in the Statement of Operations. The commissions paid to these affiliated firms were $674 for the period.
Interfund Lending Program. Pursuant to an Exemptive Order issued by the SEC, the Fund, along with other registered investment companies having management contracts with FMR or other affiliated entities of FMR, may participate in an interfund lending program. This program provides an alternative credit facility allowing the funds to borrow from, or lend money to, other participating affiliated funds. At period end, there were no interfund loans outstanding. The Fund's activity in this program during the period for which loans were outstanding was as follows:
Borrower or Lender | Average Loan Balance | Weighted Average Interest Rate | Interest Expense |
Borrower | $ 3,034,143 | .31% | $ 184 |
6. Committed Line of Credit.
The Fund participates with other funds managed by the investment adviser or an affiliate in a $4.25 billion credit facility (the "line of credit") to be utilized for temporary or emergency purposes to fund shareholder redemptions or for other short-term liquidity purposes. The Fund has agreed to pay commitment fees on its pro-rata portion of the line of credit, which amounted to $487 and is reflected in Miscellaneous expenses on the Statement of Operations. During the period, the Fund did not borrow on this line of credit.
7. Security Lending.
The Fund lends portfolio securities through a lending agent from time to time in order to earn additional income. For equity securities, a lending agent is used and may loan securities to certain qualified borrowers, including Fidelity Capital Markets (FCM), a broker-dealer affiliated with the Fund. On the settlement date of the loan, the Fund receives collateral (in the form of U.S. Treasury obligations, letters of credit and/or cash) against the loaned securities and maintains collateral in an amount not less than 100% of the market value of the loaned securities during the period of the loan. The market value of the loaned securities is determined at the close of business of the Fund and any additional required collateral is delivered to the Fund on the next business day. If the borrower defaults on its obligation to return the securities loaned because of insolvency or other reasons, the Fund may apply collateral received from the borrower against the
Annual Report
7. Security Lending - continued
obligation. The Fund may experience delays and costs in recovering the securities loaned. Any cash collateral received is invested in the Fidelity Securities Lending Cash Central Fund. The value of loaned securities and cash collateral at period end are disclosed on the Fund's Statement of Assets and Liabilities. Security lending income represents the income earned on investing cash collateral, less rebates paid to borrowers and any lending agent fees associated with the loan, plus any premium payments received for lending certain types of securities. Security lending income is presented in the Statement of Operations as a component of income from Fidelity Central Funds. Total security lending income during the period amounted to $6,519. During the period, there were no securities loaned to FCM.
8. Distributions to Shareholders.
Distributions to shareholders of each class were as follows:
Years ended October 31, | 2014 | 2013 |
From net investment income | | |
Class A | $ 1,258,600 | $ 1,813,789 |
Class T | 253,592 | 420,491 |
Class B | - | 51,393 |
Class C | 67,365 | 298,953 |
Institutional Class | 431,805 | 553,030 |
Total | $ 2,011,362 | $ 3,137,656 |
From net realized gain | | |
Class A | $ 6,564,461 | $ 507,200 |
Class T | 2,044,109 | 157,899 |
Class B | 453,142 | 51,958 |
Class C | 2,799,874 | 227,303 |
Institutional Class | 1,622,320 | 123,193 |
Total | $ 13,483,906 | $ 1,067,553 |
9. Share Transactions.
Share transactions for each class were as follows and may contain automatic conversions between classes or exchanges between funds:
| Shares | Shares | Dollars | Dollars |
Years ended October 31, | 2014 | 2013 | 2014 | 2013 |
Class A | | | | |
Shares sold | 573,747 | 824,496 | $ 17,697,836 | $ 24,773,595 |
Reinvestment of distributions | 228,279 | 67,510 | 6,811,859 | 1,994,909 |
Shares redeemed | (1,220,608) | (1,500,614) | (37,276,981) | (44,694,536) |
Net increase (decrease) | (418,582) | (608,608) | $ (12,767,286) | $ (17,926,032) |
Annual Report
Notes to Financial Statements - continued
9. Share Transactions - continued
| Shares | Shares | Dollars | Dollars |
Years ended October 31, | 2014 | 2013 | 2014 | 2013 |
Class T | | | | |
Shares sold | 138,080 | 210,810 | $ 4,191,092 | $ 6,182,895 |
Reinvestment of distributions | 77,360 | 19,545 | 2,251,960 | 564,060 |
Shares redeemed | (345,644) | (425,275) | (10,192,417) | (12,356,062) |
Net increase (decrease) | (130,204) | (194,920) | $ (3,749,365) | $ (5,609,107) |
Class B | | | | |
Shares sold | 8,605 | 10,130 | $ 250,322 | $ 286,596 |
Reinvestment of distributions | 13,707 | 3,105 | 380,925 | 85,708 |
Shares redeemed | (148,296) | (253,486) | (4,170,831) | (7,070,284) |
Net increase (decrease) | (125,984) | (240,251) | $ (3,539,584) | $ (6,697,980) |
Class C | | | | |
Shares sold | 212,902 | 303,601 | $ 6,070,821 | $ 8,446,000 |
Reinvestment of distributions | 89,602 | 15,990 | 2,461,356 | 436,858 |
Shares redeemed | (497,988) | (699,221) | (13,805,000) | (19,141,307) |
Net increase (decrease) | (195,484) | (379,630) | $ (5,272,823) | $ (10,258,449) |
Institutional Class | | | | |
Shares sold | 1,068,125 | 392,380 | $ 34,572,790 | $ 12,135,351 |
Reinvestment of distributions | 52,027 | 17,860 | 1,594,630 | 541,525 |
Shares redeemed | (770,899) | (632,861) | (24,061,907) | (19,472,513) |
Net increase (decrease) | 349,253 | (222,621) | $ 12,105,513 | $ (6,795,637) |
10. Other.
The Fund's organizational documents provide former and current trustees and officers with a limited indemnification against liabilities arising in connection with the performance of their duties to the Fund. In the normal course of business, the Fund may also enter into contracts that provide general indemnifications. The Fund's maximum exposure under these arrangements is unknown as this would be dependent on future claims that may be made against the Fund. The risk of material loss from such claims is considered remote.
Annual Report
To the Trustees of Fidelity Advisor Series VIII and the Shareholders of Fidelity Advisor Emerging Asia Fund:
In our opinion, the accompanying statement of assets and liabilities, including the schedule of investments, and the related statements of operations and of changes in net assets and the financial highlights present fairly, in all material respects, the financial position of Fidelity Advisor Emerging Asia Fund (a fund of Fidelity Advisor Series VIII) at October 31, 2014, the results of its operations for the year then ended, the changes in its net assets for each of the two years in the period then ended and the financial highlights for each of the five years in the period then ended, in conformity with accounting principles generally accepted in the United States of America. These financial statements and financial highlights (hereafter referred to as "financial statements") are the responsibility of the Fidelity Advisor Emerging Asia Fund's management. Our responsibility is to express an opinion on these financial statements based on our audits. We conducted our audits of these financial statements in accordance with the standards of the Public Company Accounting Oversight Board (United States). Those standards require that we plan and perform the audit to obtain reasonable assurance about whether the financial statements are free of material misstatement. An audit includes examining, on a test basis, evidence supporting the amounts and disclosures in the financial statements, assessing the accounting principles used and significant estimates made by management, and evaluating the overall financial statement presentation. We believe that our audits, which included confirmation of securities at October 31, 2014 by correspondence with the custodian and brokers, provide a reasonable basis for our opinion.
PricewaterhouseCoopers LLP
Boston, Massachusetts
December 23, 2014
Annual Report
The Trustees, Member of the Advisory Board, and officers of the trust and fund, as applicable, are listed below. The Board of Trustees governs the fund and is responsible for protecting the interests of shareholders. The Trustees are experienced executives who meet periodically throughout the year to oversee the fund's activities, review contractual arrangements with companies that provide services to the fund, oversee management of the risks associated with such activities and contractual arrangements, and review the fund's performance. Except for James C. Curvey, each of the Trustees oversees 174 funds. Mr. Curvey oversees 407 funds.
The Trustees hold office without limit in time except that (a) any Trustee may resign; (b) any Trustee may be removed by written instrument, signed by at least two-thirds of the number of Trustees prior to such removal; (c) any Trustee who requests to be retired or who has become incapacitated by illness or injury may be retired by written instrument signed by a majority of the other Trustees; and (d) any Trustee may be removed at any special meeting of shareholders by a two-thirds vote of the outstanding voting securities of the trust. Each Trustee who is not an interested person (as defined in the 1940 Act) of the trust and the fund (Independent Trustee), shall retire not later than the last day of the calendar year in which his or her 75th birthday occurs. The Independent Trustees may waive this mandatory retirement age policy with respect to individual Trustees. The officers and Advisory Board Member hold office without limit in time, except that any officer and Advisory Board Member may resign or may be removed by a vote of a majority of the Trustees at any regular meeting or any special meeting of the Trustees. Except as indicated, each individual has held the office shown or other offices in the same company for the past five years.
Experience, Skills, Attributes, and Qualifications of the Fund's Trustees. The Governance and Nominating Committee has adopted a statement of policy that describes the experience, qualifications, attributes, and skills that are necessary and desirable for potential Independent Trustee candidates (Statement of Policy). The Board believes that each Trustee satisfied at the time he or she was initially elected or appointed a Trustee, and continues to satisfy, the standards contemplated by the Statement of Policy. The Governance and Nominating Committee also engages professional search firms to help identify potential Independent Trustee candidates who have the experience, qualifications, attributes, and skills consistent with the Statement of Policy. From time to time, additional criteria based on the composition and skills of the current Independent Trustees, as well as experience or skills that may be appropriate in light of future changes to board composition, business conditions, and regulatory or other developments, have also been considered by the professional search firms and the Governance and Nominating Committee. In addition, the Board takes into account the Trustees' commitment and participation in Board and committee meetings, as well as their leadership of standing and ad hoc committees throughout their tenure.
In determining that a particular Trustee was and continues to be qualified to serve as a Trustee, the Board has considered a variety of criteria, none of which, in isolation, was controlling. The Board believes that, collectively, the Trustees have balanced and diverse experience, qualifications, attributes, and skills, which allow the Board to operate effectively in governing the fund and protecting the interests of shareholders. Information about the specific experience, skills, attributes, and qualifications of each Trustee, which in each case led to the Board's conclusion that the Trustee should serve (or continue to serve) as a trustee of the fund, is provided below.
Annual Report
Board Structure and Oversight Function. James C. Curvey is an interested person (as defined in the 1940 Act) and currently serves as Chairman. The Trustees have determined that an interested Chairman is appropriate and benefits shareholders because an interested Chairman has a personal and professional stake in the quality and continuity of services provided to the fund. Independent Trustees exercise their informed business judgment to appoint an individual of their choosing to serve as Chairman, regardless of whether the Trustee happens to be independent or a member of management. The Independent Trustees have determined that they can act independently and effectively without having an Independent Trustee serve as Chairman and that a key structural component for assuring that they are in a position to do so is for the Independent Trustees to constitute a substantial majority for the Board. The Independent Trustees also regularly meet in executive session. Ned C. Lautenbach serves as Chairman of the Independent Trustees and as such (i) acts as a liaison between the Independent Trustees and management with respect to matters important to the Independent Trustees and (ii) with management prepares agendas for Board meetings.
Fidelity funds are overseen by different Boards of Trustees. The fund's Board oversees Fidelity's equity and high income funds and another Board oversees Fidelity's investment-grade bond, money market, and asset allocation funds. The asset allocation funds may invest in Fidelity funds overseen by the fund's Board. The use of separate Boards, each with its own committee structure, allows the Trustees of each group of Fidelity funds to focus on the unique issues of the funds they oversee, including common research, investment, and operational issues. On occasion, the separate Boards establish joint committees to address issues of overlapping consequences for the Fidelity funds overseen by each Board.
The Trustees operate using a system of committees to facilitate the timely and efficient consideration of all matters of importance to the Trustees, the fund, and fund shareholders and to facilitate compliance with legal and regulatory requirements and oversight of the fund's activities and associated risks. The Board, acting through its committees, has charged FMR and its affiliates with (i) identifying events or circumstances the occurrence of which could have demonstrably adverse effects on the fund's business and/or reputation; (ii) implementing processes and controls to lessen the possibility that such events or circumstances occur or to mitigate the effects of such events or circumstances if they do occur; and (iii) creating and maintaining a system designed to evaluate continuously business and market conditions in order to facilitate the identification and implementation processes described in (i) and (ii) above. Because the day-to-day operations and activities of the fund are carried out by or through FMR, its affiliates and other service providers, the fund's exposure to risks is mitigated but not eliminated by the processes overseen by the Trustees. While each of the Board's committees has responsibility for overseeing different aspects of the fund's activities, oversight is exercised primarily through the Operations, Audit, and Compliance Committees. In addition, the Independent Trustees have worked with FMR to enhance the Board's oversight of investment and financial risks, legal and regulatory risks, technology risks, and operational risks, including the development of additional risk reporting to the Board. For example, a working group comprised of Independent Trustees and FMR has worked and continues to work to review the Fidelity funds' valuation-related activities, reporting and risk management. Appropriate personnel, including but not limited to the fund's Chief Compliance Officer (CCO), FMR's internal auditor, the independent accountants, the fund's Treasurer and portfolio management personnel, make periodic reports to the Board's committees, as appropriate, including an annual review of FMR's risk management program for the Fidelity funds. The responsibilities of each standing committee, including their oversight responsibilities, are described further under "Standing Committees of the Fund's Trustees."
Annual Report
Trustees and Officers - continued
The fund's Statement of Additional Information (SAI) includes more information about the Trustees. To request a free copy, call Fidelity at 1-877-208-0098.
Interested Trustees*:
Correspondence intended for each Trustee who is an interested person may be sent to Fidelity Investments, 245 Summer Street, Boston, Massachusetts 02210.
Name, Year of Birth; Principal Occupations and Other Relevant Experience+ |
James C. Curvey (1935) |
Year of Election or Appointment: 2007 Trustee Chairman of the Board of Trustees |
| Mr. Curvey also serves as Trustee of other Fidelity funds. Mr. Curvey is a Director of Fidelity Research & Analysis Co. (2009-present), and Vice Chairman (2007-present) and Director of FMR LLC. In addition, Mr. Curvey serves as an Overseer for the Boston Symphony Orchestra and a member of the board of Artis-Naples, Naples, Florida, and as a Trustee for Brewster Academy, Wolfeboro, New Hampshire. Previously, Mr. Curvey served as a Director of Fidelity Investments Money Management, Inc. (2009-2014), a Director of FMR (2007-2014), and a Director of FMR Co., Inc. (2007-2014). |
Charles S. Morrison (1960) |
Year of Election or Appointment: 2014 Trustee |
| Mr. Morrison also serves as Trustee of other funds. He serves as a Director of Fidelity Investments Money Management, Inc. (FIMM) (2014-present), Director of Fidelity SelectCo, LLC (2014-present), President, Asset Management (2014-present), and is an employee of Fidelity Investments. Previously, Mr. Morrison served as Vice President of Fidelity's Fixed Income and Asset Allocation Funds (2012-2014), President, Fixed Income (2011-2014), Vice President of Fidelity's Money Market Funds (2005-2009), President, Money Market Group Leader of FMR (2009), and Senior Vice President, Money Market Group of FMR (2004-2009). Mr. Morrison also served as Vice President of Fidelity's Bond Funds (2002-2005), certain Balanced Funds (2002-2005), and certain Asset Allocation Funds (2002-2007), and as Senior Vice President (2002-2005) of Fidelity's Bond Division. |
* Trustees have been determined to be "Interested Trustees" by virtue of, among other things, their affiliation with the trust or various entities under common control with FMR.
+ The information above includes each Trustee's principal occupation during the last five years and other information relating to the experience, attributes, and skills relevant to each Trustee's qualifications to serve as a Trustee, which led to the conclusion that each Trustee should serve as a Trustee for the fund.
Annual Report
Trustees and Officers - continued
Independent Trustees:
Correspondence intended for each Independent Trustee (that is, the Trustees other than the Interested Trustees) may be sent to Fidelity Investments, P.O. Box 55235, Boston, Massachusetts 02205-5235.
Name, Year of Birth; Principal Occupations and Other Relevant Experience+ |
Dennis J. Dirks (1948) |
Year of Election or Appointment: 2005 Trustee |
| Mr. Dirks also serves as Trustee of other Fidelity funds. Prior to his retirement in May 2003, Mr. Dirks was Chief Operating Officer and a member of the Board of The Depository Trust & Clearing Corporation (DTCC). He also served as President, Chief Operating Officer, and Board member of The Depository Trust Company (DTC) and President and Board member of the National Securities Clearing Corporation (NSCC). In addition, Mr. Dirks served as Chief Executive Officer and Board member of the Government Securities Clearing Corporation, Chief Executive Officer and Board member of the Mortgage-Backed Securities Clearing Corporation, as a Trustee and a member of the Finance Committee of Manhattan College (2005-2008), and as a Trustee and a member of the Finance Committee of AHRC of Nassau County (2006-2008). Mr. Dirks is a member of the Independent Directors Council (IDC) Governing Council (2010-present) and Board of Directors for The Brookville Center for Children's Services, Inc. (2009-present). |
Alan J. Lacy (1953) |
Year of Election or Appointment: 2008 Trustee |
| Mr. Lacy also serves as Trustee of other Fidelity funds. Mr. Lacy serves as Senior Adviser (2007-present) of Oak Hill Capital Partners, L.P. (private equity). Mr. Lacy also served as Chief Executive Officer (2000-2005) and Vice Chairman (2005-2006) of Sears Holdings Corporation and Sears, Roebuck and Co. (retail). In addition, Mr. Lacy serves as a member of the Board of Directors of Dave & Buster's Entertainment, Inc. (restaurant and entertainment complexes, 2010-present), Earth Fare, Inc. (retail grocery, 2012-present), The Hillman Companies, Inc. (hardware wholesalers, 2010-present), and Bristol-Myers Squibb Company (global pharmaceuticals, 2008-present). Mr. Lacy is a member of the Board of Trustees of The National Parks Conservation Association (2006-present). Previously, Mr. Lacy served as Chairman of the Board of Trustees of the National Parks Conservation Association (2008-2011) and as a member of the Board of Directors for the Western Union Company (global money transfer, 2006-2011). |
Ned C. Lautenbach (1944) |
Year of Election or Appointment: 2000 Trustee Chairman of the Independent Trustees |
| Mr. Lautenbach also serves as Trustee of other Fidelity funds. Mr. Lautenbach currently serves as the Lead Director of the Eaton Corporation Board of Directors (diversified industrial, 1997-present). Mr. Lautenbach is Chairman of the Board of Directors of the Philharmonic Center for the Arts in Naples, Florida (2012-present) and a member of the Council on Foreign Relations (1994-present). Previously, Mr. Lautenbach was a Partner/Advisory Partner at Clayton, Dubilier & Rice, LLC (private equity investment, 1998-2010), as well as a Director of Sony Corporation (2006-2007). |
Joseph Mauriello (1944) |
Year of Election or Appointment: 2008 Trustee |
| Mr. Mauriello also serves as Trustee of other Fidelity funds. Prior to his retirement in January 2006, Mr. Mauriello served in numerous senior management positions including Deputy Chairman and Chief Operating Officer (2004-2005), and Vice Chairman of Financial Services (2002-2004) of KPMG LLP US (professional services, 1965-2005). Mr. Mauriello currently serves as a member of the Board of Directors of XL Group plc. (global insurance and re-insurance, 2006-present). Previously, Mr. Mauriello served as a Director of the Hamilton Funds of the Bank of New York (2006-2007) and of Arcadia Resources Inc. (health care services and products, 2007-2012). |
Robert W. Selander (1950) |
Year of Election or Appointment: 2011 Trustee |
| Mr. Selander also serves as Trustee of other Fidelity funds. Previously, Mr. Selander served as a Member of the Advisory Board of other Fidelity funds (2011), and Executive Vice Chairman (2010), Chief Executive Officer (2009-2010), and President and Chief Executive Officer (1997-2009) of Mastercard, Inc. |
Cornelia M. Small (1944) |
Year of Election or Appointment: 2005 Trustee |
| Ms. Small also serves as Trustee of other Fidelity funds. Ms. Small is a member of the Board of Directors (2009-present) and Chair of the Investment Committee (2010-present) of the Teagle Foundation. Ms. Small also serves on the Investment Committee of the Berkshire Taconic Community Foundation (2008-present). Previously, Ms. Small served as Chairperson (2002-2008) and a member of the Investment Committee and Chairperson (2008-2012) and a member of the Board of Trustees of Smith College. In addition, Ms. Small served as Chief Investment Officer, Director of Global Equity Investments, and a member of the Board of Directors of Scudder, Stevens & Clark and Scudder Kemper Investments. |
William S. Stavropoulos (1939) |
Year of Election or Appointment: 2001 Trustee Vice Chairman of the Independent Trustees |
| Mr. Stavropoulos also serves as Trustee of other Fidelity funds. Mr. Stavropoulos serves as President and Founder of the Michigan Baseball Foundation, the Great Lakes Loons (2007-present). Mr. Stavropoulos is Chairman Emeritus of the Board of Directors of The Dow Chemical Company, where he previously served in numerous senior management positions, including President, CEO (1995-2000; 2002-2004), Chairman of the Executive Committee (2000-2006), and as a member of the Board of Directors (1990-2006). Currently, Mr. Stavropoulos is Chairman of the Board of Directors of Univar Inc. (global distributor of commodity and specialty chemicals), a Director of Teradata Corporation (data warehousing and technology solutions), and Maersk Inc. (industrial conglomerate), and a member of the Advisory Board for Metalmark Capital LLC (private equity investment, 2005-present). Mr. Stavropoulos is an operating advisor to Clayton, Dubilier & Rice, LLC (private equity investment). In addition, Mr. Stavropoulos is a member of the University of Notre Dame Advisory Council for the College of Science, a Trustee of the Rollin L. Gerstacker Foundation, and a Director of the Naples Philharmonic Center for the Arts. Previously, Mr. Stavropoulos served as a Director of Chemical Financial Corporation (bank holding company, 1993-2012) and Tyco International, Ltd. (multinational manufacturing and services, 2007-2012). |
David M. Thomas (1949) |
Year of Election or Appointment: 2008 Trustee |
| Mr. Thomas also serves as Trustee of other Fidelity funds. Mr. Thomas serves as Non-Executive Chairman of the Board of Directors of Fortune Brands Home and Security (home and security products, 2011-present), and as a member of the Board of Directors of Interpublic Group of Companies, Inc. (marketing communication, 2004-present). Previously, Mr. Thomas served as Executive Chairman (2005-2006) and Chairman and Chief Executive Officer (2000-2005) of IMS Health, Inc. (pharmaceutical and healthcare information solutions), and a Director of Fortune Brands, Inc. (consumer products, 2000-2011). |
+ The information above includes each Trustee's principal occupation during the last five years and other information relating to the experience, attributes, and skills relevant to each Trustee's qualifications to serve as a Trustee, which led to the conclusion that each Trustee should serve as a Trustee for the fund.
Advisory Board Member and Officers:
Correspondence intended for each officer and Peter S. Lynch may be sent to Fidelity Investments, 245 Summer Street, Boston, Massachusetts 02210. Officers appear below in alphabetical order.
Name, Year of Birth; Principal Occupation |
Peter S. Lynch (1944) |
Year of Election or Appointment: 2003 Member of the Advisory Board |
| Mr. Lynch also serves as Member of the Advisory Board of other Fidelity funds. Mr. Lynch is Vice Chairman and a Director of FMR and FMR Co., Inc. In addition, Mr. Lynch serves as a Trustee of Boston College and as the Chairman of the Inner-City Scholarship Fund. Previously, Mr. Lynch served on the Special Olympics International Board of Directors (1997-2006). |
Elizabeth Paige Baumann (1968) |
Year of Election or Appointment: 2012 Anti-Money Laundering (AML) Officer |
| Ms. Baumann also serves as AML Officer of other funds. She is Chief AML Officer of FMR LLC (2012-present) and is an employee of Fidelity Investments. Previously, Ms. Baumann served as Vice President and Deputy Anti-Money Laundering Officer (2007-2012). |
William C. Coffey (1969) |
Year of Election or Appointment: 2009 Assistant Secretary |
| Mr. Coffey also serves as Assistant Secretary of other funds. He is Senior Vice President and Deputy General Counsel of FMR LLC (2010-present), and is an employee of Fidelity Investments. Previously, Mr. Coffey served as Vice President and Associate General Counsel of FMR LLC (2005-2009). |
Timothy M. Cohen (1969) |
Year of Election or Appointment: 2014 Vice President of certain Equity Funds |
| Mr. Cohen also serves as Vice President of other funds. Mr. Cohen serves as a Director and Chief Compliance Officer of Fidelity Management & Research (U.K.) Inc. (2013-present) and is an employee of Fidelity Investments. |
Jonathan Davis (1968) |
Year of Election or Appointment: 2010 Assistant Treasurer |
| Mr. Davis also serves as Assistant Treasurer of other funds. Mr. Davis is an employee of Fidelity Investments. Previously, Mr. Davis served as Vice President and Associate General Counsel of FMR LLC (2003-2010). |
Adrien E. Deberghes (1967) |
Year of Election or Appointment: 2008 Deputy Treasurer |
| Mr. Deberghes also serves as an officer of other funds. He is an employee of Fidelity Investments (2008-present). Prior to joining Fidelity Investments, Mr. Deberghes was Senior Vice President of Mutual Fund Administration at State Street Corporation (2007-2008), Senior Director of Mutual Fund Administration at Investors Bank & Trust (2005-2007), and Director of Finance for Dunkin' Brands (2000-2005). |
Stephanie J. Dorsey (1969) |
Year of Election or Appointment: 2010 Assistant Treasurer |
| Ms. Dorsey also serves as an officer of other funds. She is an employee of Fidelity Investments (2008-present) and has served in other fund officer roles. Prior to joining Fidelity Investments, Ms. Dorsey served as Treasurer (2004-2008) of the JPMorgan Mutual Funds and Vice President (2004-2008) of JPMorgan Chase Bank. |
Howard J. Galligan III (1966) |
Year of Election or Appointment: 2014 Chief Financial Officer |
| Mr. Galligan also serves as Chief Financial Officer of other funds. Mr. Galligan serves as President of Fidelity Pricing and Cash Management Services (FPCMS) (2014-present) and as a Director of Strategic Advisers, Inc. (2008-present). Previously, Mr. Galligan served as Chief Administrative Officer of Asset Management (2011-2014) and Chief Operating Officer and Senior Vice President of Investment Support for Strategic Advisers, Inc. (2003-2011). |
Scott C. Goebel (1968) |
Year of Election or Appointment: 2008 Secretary and Chief Legal Officer (CLO) |
| Mr. Goebel serves as Secretary and CLO of other funds. Mr. Goebel also serves as Secretary of Fidelity SelectCo, LLC (2013-present), Fidelity Investments Money Management, Inc. (FIMM) (2010-present) and Fidelity Research and Analysis Company (FRAC) (2010-present); General Counsel, Secretary, and Senior Vice President of FMR (2008-present) and FMR Co., Inc. (2008-present); Chief Legal Officer of Fidelity Management & Research (Hong Kong) Limited (2008-present); and Assistant Secretary of Fidelity Management & Research (Japan) Limited (2008-present) and Fidelity Management & Research (U.K.) Inc. (2008-present). Previously, Mr. Goebel served as Secretary and CLO of other Fidelity funds (2008-2013), Assistant Secretary of FIMM (2008-2010), FRAC (2008-2010), and certain funds (2007-2008); and as Vice President and Secretary of Fidelity Distributors Corporation (FDC) (2005-2007). Mr. Goebel has been employed by FMR LLC or an affiliate since 2001. |
Brian B. Hogan (1964) |
Year of Election or Appointment: 2009 Vice President |
| Mr. Hogan also serves as Trustee or Vice President of other funds. Mr. Hogan serves as a Director of Fidelity SelectCo, LLC (2014-present) and President of FMR's Equity Division (2009-present). Previously, Mr. Hogan served as Senior Vice President, Equity Research of FMR (2006-2009) and as a portfolio manager. |
Chris Maher (1972) |
Year of Election or Appointment: 2013 Assistant Treasurer |
| Mr. Maher serves as Assistant Treasurer of other funds. Mr. Maher is Vice President of Valuation Oversight and is an employee of Fidelity Investments. Previously, Mr. Maher served as Vice President of Asset Management Compliance (2013), Vice President of FMR's Program Management Group (2010-2013), and Vice President of Valuation Oversight (2008-2010). |
Kenneth B. Robins (1969) |
Year of Election or Appointment: 2008 President and Treasurer |
| Mr. Robins also serves as an officer of other funds. Mr. Robins serves as Executive Vice President of Fidelity Investments Money Management, Inc. (FIMM) (2013-present) and is an employee of Fidelity Investments (2004-present). Previously, Mr. Robins served in other fund officer roles. |
Stephen Sadoski (1971) |
Year of Election or Appointment: 2012 Deputy Treasurer |
| Mr. Sadoski also serves as Deputy Treasurer of other funds. He is an employee of Fidelity Investments (2012-present) and has served in another fund officer role. Prior to joining Fidelity Investments, Mr. Sadoski served as an assistant chief accountant in the Division of Investment Management of the Securities and Exchange Commission (SEC) (2009-2012) and as a senior manager at Deloitte & Touche LLP (1997-2009). |
Stacie M. Smith (1974) |
Year of Election or Appointment: 2013 Deputy Treasurer |
| Ms. Smith also serves as an officer of other funds. She is an employee of Fidelity Investments (2009-present) and has served in other fund officer roles. Prior to joining Fidelity Investments, Ms. Smith served as Senior Audit Manager of Ernst & Young LLP (1996-2009). |
Renee Stagnone (1975) |
Year of Election or Appointment: 2013 Deputy Treasurer |
| Ms. Stagnone also serves as Deputy Treasurer of other funds. Ms. Stagnone is an employee of Fidelity Investments. |
Linda J. Wondrack (1964) |
Year of Election or Appointment: 2014 Chief Compliance Officer |
| Ms. Wondrack also serves as Chief Compliance Officer of other funds. Ms. Wondrack is Executive Vice President and head of the Ethics Office and Asset Management Compliance for Fidelity Investments (2012- present). Ms. Wondrack also serves as Chief Compliance Officer of Fidelity SelectCo, LLC (2014-present); Chief Compliance Officer of Impresa Management LLC (2013-present); and Chief Compliance Officer of FMR Co., Inc., Fidelity Investments Money Management, Inc., Fidelity Management & Research (Japan) Limited, Fidelity Management & Research (U.K.) Inc., Fidelity Management & Research (Hong Kong), Fidelity Management & Research Company, Pyramis Global Advisors, LLC, and Strategic Advisers, Inc., Ballyrock Investment Advisors LLC, and Northern Neck Investors LLC (2012-present). Previously, Ms. Wondrack served as Senior Vice President and Chief Compliance Officer for Columbia Management Investment Advisers, LLC (2005-2012); Chief Compliance Officer for certain funds within the Columbia Family of Funds (2007-2012); and Senior Vice President of Compliance Risk Management at Bank of America (2005-2010). |
Joseph F. Zambello (1957) |
Year of Election or Appointment: 2011 Deputy Treasurer |
| Mr. Zambello also serves as Deputy Treasurer of other funds. Mr. Zambello is an employee of Fidelity Investments. Previously, Mr. Zambello served as Vice President of FMR's Program Management Group (2009-2011) and Vice President of the Transfer Agent Oversight Group (2005-2009). |
Annual Report
The Board of Trustees of Advisor Emerging Asia Fund voted to pay to shareholders of record at the opening of business on record date, the following distributions per share derived from capital gains realized from sales of portfolio securities, and dividends derived from net investment income:
| Pay Date | Record Date | Dividends | Capital Gains |
Institutional Class | 12/08/14 | 12/05/14 | $0.309 | $1.674 |
The fund hereby designates as a capital gain dividend with respect to the taxable year ended October 31, 2014, $14,546,568, or, if subsequently determined to be different, the net capital gain of such year.
Institutional Class designates 1% of the dividends distributed during the fiscal year as qualifying for the dividends-received deduction for corporate shareholders.
Institutional Class designates 100% of the dividends distributed during the fiscal year as amounts which may be taken into account as a dividend for purposes of the maximum rate under section 1(h)(11) of the Internal Revenue Code.
The amounts per share which represent income derived from sources within, and taxes paid to, foreign countries or possessions of the United States are $0.4214 and $0.0674 for the dividend paid 12/09/13.
The fund will notify shareholders in January 2015 of amounts for use in preparing 2014 income tax returns.
Annual Report
Board Approval of Investment Advisory Contracts and Management Fees
Fidelity Advisor Emerging Asia Fund
Each year, the Board of Trustees, including the Independent Trustees (together, the Board), votes on the renewal of the management contract with Fidelity Management & Research Company (FMR) and the sub-advisory agreements (together, the Advisory Contracts) for the fund. The Board, assisted by the advice of fund counsel and Independent Trustees' counsel, requests and considers a broad range of information relevant to the renewal of the Advisory Contracts throughout the year.
The Board meets regularly and, at each of its meetings, covers an extensive agenda of topics and materials and considers factors that are relevant to its annual consideration of the renewal of the fund's Advisory Contracts, including the services and support provided to the fund and its shareholders. The Board has established various standing committees (Committees), each composed of and chaired by Independent Trustees with varying backgrounds, to which the Board has assigned specific subject matter responsibilities in order to enhance effective decision-making by the Board. The Board, acting directly and through its Committees, requests and receives information concerning the annual consideration of the renewal of the fund's Advisory Contracts. The Board also meets as needed to consider matters specifically related to the Board's annual consideration of the renewal of the Advisory Contracts. Members of the Board may also meet with trustees of other Fidelity funds through ad hoc joint committees to discuss certain matters relevant to the Fidelity funds.
At its July 2014 meeting, the Board, including the Independent Trustees, unanimously determined to renew the fund's Advisory Contracts. In reaching its determination, the Board considered all factors it believed relevant, including (i) the nature, extent, and quality of the services to be provided to the fund and its shareholders (including the investment performance of the fund); (ii) the competitiveness of the fund's management fee and total expense ratio relative to peer funds; (iii) the total costs of the services to be provided by and the profits to be realized by Fidelity from its relationship with the fund; (iv) the extent to which economies of scale exist and would be realized as the fund grows; and (v) whether fee levels reflect these economies of scale, if any, for the benefit of fund shareholders. In connection with separate internal corporate reorganizations involving Fidelity Management & Research (U.K.) Inc. (FMR U.K.) and Fidelity Management & Research (Japan) Inc. (FMR Japan), the Board approved certain non-material amendments to the fund's sub-advisory agreements with FMR U.K. and FMR Japan to reflect that, after these reorganizations, FMR Investment Management (UK) Limited and Fidelity Management & Research (Japan) Limited will carry on the business of FMR U.K. and FMR Japan, respectively. The Board noted that no changes to the portfolio managers or to the foreign research or investment advisory services provided to the fund were expected in connection with either reorganization and that the same personnel and resources would continue to be available to the fund at the new entities.
Annual Report
Board Approval of Investment Advisory Contracts and
Management Fees - continued
In considering whether to renew the Advisory Contracts for the fund, the Board reached a determination, with the assistance of fund counsel and Independent Trustees' counsel and through the exercise of its business judgment, that the renewal of the Advisory Contracts was in the best interests of the fund and its shareholders and that the compensation payable under the Advisory Contracts was fair and reasonable. The Board's decision to renew the Advisory Contracts was not based on any single factor, but rather was based on a comprehensive consideration of all the information provided to the Board at its meetings throughout the year. The Board, in reaching its determination to renew the Advisory Contracts, was aware that shareholders of the fund have a broad range of investment choices available to them, including a wide choice among funds offered by Fidelity's competitors, and that the fund's shareholders, who have the opportunity to review and weigh the disclosure provided by the fund in its prospectus and other public disclosures, have chosen to invest in this fund, which is part of the Fidelity family of funds.
Nature, Extent, and Quality of Services Provided. The Board considered Fidelity's staffing as it relates to the fund, including the backgrounds of investment personnel of FMR and the sub-advisers (together, the Investment Advisers), and also considered the fund's investment objective, strategies, and related investment philosophy. The Independent Trustees also had discussions with senior management of Fidelity's investment operations and investment groups. The Board considered the structure of the portfolio manager compensation program and whether this structure provides appropriate incentives to act in the best interests of the fund. Additionally, the Board considered the portfolio managers' investments, if any, in the funds that they manage.
Resources Dedicated to Investment Management and Support Services. The Board and the Fund Oversight and Research Committees reviewed the general qualifications and capabilities of Fidelity's investment staff, including its size, education, experience,and resources, as well as Fidelity's approach to recruiting, training, managing, and compensating investment personnel. The Board noted that Fidelity has continued to increase the resources devoted to non-U.S. offices, including expansion of Fidelity's global investment organization. The Board also noted that Fidelity's analysts have extensive resources, tools and capabilities that allow them to conduct sophisticated quantitative and fundamental analysis, as well as credit analysis of issuers, counterparties and guarantors. Further, the Board believes that Fidelity's investment professionals have sufficient access to global information and data so as to provide competitive investment results over time, and that those professionals also have access to sophisticated tools that permit them to assess portfolio construction and risk and performance attribution characteristics continuously, as well as to transmit new information and research conclusions rapidly around the world. Additionally, in its deliberations, the Board considered Fidelity's trading and risk management capabilities and resources and global compliance infrastructure, which are an integral part of the investment management process.
Annual Report
Shareholder and Administrative Services. The Board considered (i) the nature, extent, quality, and cost of advisory, administrative, and shareholder services performed by the Investment Advisers and their affiliates under the Advisory Contracts and under separate agreements covering transfer agency, pricing and bookkeeping, and securities lending services for the fund; (ii) the nature and extent of the supervision of third party service providers, principally custodians and subcustodians; and (iii) the resources devoted to, and the record of compliance with, the fund's compliance policies and procedures. The Board also reviewed the allocation of fund brokerage, including allocations to brokers affiliated with the Investment Advisers, the use of brokerage commissions to pay fund expenses, and the use of "soft" commission dollars to pay for research services.
The Board noted that the growth of fund assets over time across the complex allows Fidelity to reinvest in the development of services designed to enhance the value or convenience of the Fidelity funds as investment vehicles. These services include 24-hour access to account information and market information through telephone representatives and over the Internet, investor education materials and asset allocation tools, and the expanded availability of Fidelity Investor Centers.
In 2014, the Board formed an ad hoc Committee on Transfer Agency Fees to review the variety of transfer agency fee structures throughout the industry and Fidelity's competitive positioning with respect to industry participants.
Investment in a Large Fund Family. The Board considered the benefits to shareholders of investing in a Fidelity fund, including the benefits of investing in a fund that is part of a large family of funds offering a variety of investment disciplines and providing a large variety of mutual fund investor services. The Board noted that Fidelity had taken, or had made recommendations that resulted in the Fidelity funds taking, a number of actions over the previous year that benefited particular funds, including (i) continuing to dedicate additional resources to investment research and to the support of the senior management team that oversees asset management; (ii) persisting in efforts to enhance Fidelity's global research capabilities; (iii) launching new funds and making other enhancements to meet client needs for income-oriented solutions; (iv) reducing fund expenses for certain index funds; (v) continuing to launch dedicated lower cost underlying funds to meet portfolio construction needs related to expanding underlying fund options for Fidelity funds of funds, specifically for the Freedom Fund product lines; (vi) rationalizing product lines and gaining increased efficiencies through fund mergers; (vii) launching sector-based exchange-traded funds and establishing a new Fidelity adviser to manage sector-based funds and products; (viii) continuing to develop and implement technology to improve security and increase efficiency; (ix) modifying the eligibility criteria for certain share classes to increase their marketability to a portion of the defined contribution plan market; (x) waiving redemption fees for certain qualified fund-of-fund and wrap programs and certain retirement plan transactions; and (xi) launching new Institutional Class shares of certain money market funds to attract and retain assets and to fill a gap in the money market fund lineup.
Annual Report
Board Approval of Investment Advisory Contracts and
Management Fees - continued
Investment Performance. The Board considered whether the fund has operated in accordance with its investment objective, as well as its record of compliance with its investment restrictions and its performance history.
The Board took into account discussions with the Investment Advisers about fund investment performance that occur at Board meetings throughout the year. In this regard the Board noted that as part of regularly scheduled fund reviews and other reports to the Board on fund performance, the Board periodically considers annualized return information for the fund, for different time periods, measured against a securities market index ("benchmark index") and a peer group of funds with similar objectives ("peer group"). In its evaluation of fund investment performance, the Board gave particular attention to information indicating changes in performance of certain Fidelity funds for specific time periods and the Investment Advisers' explanations for any overperformance or underperformance.
In addition to reviewing absolute and relative fund performance, the Independent Trustees periodically consider the appropriateness of fund performance metrics in evaluating the results achieved. In general, the Independent Trustees believe that fund performance should be evaluated based on net performance (after fees and expenses) of both the highest performing and lowest performing classes, where applicable, compared to appropriate benchmark indices, over appropriate time periods which may include full market cycles, and compared to peer groups, as applicable, over the same periods, taking into account relevant factors including the following: general market conditions; issuer-specific information; tactical opportunities for investment; and fund cash flows and other factors.
The Independent Trustees recognize that shareholders evaluate performance on a net basis over their own holding periods, for which one-, three-, and five-year periods are often used as a proxy. For this reason, the performance information reviewed by the Board also included net cumulative calendar year total return information for the fund and an appropriate benchmark index for the most recent one-, three-, and five-year periods, as shown below. A peer group comparison is not shown below. Returns of the benchmark index are "net MA," i.e., adjusted for tax withholding rates applicable to U.S.-based funds organized as Massachusetts business trusts.
Annual Report
Fidelity Advisor Emerging Asia Fund
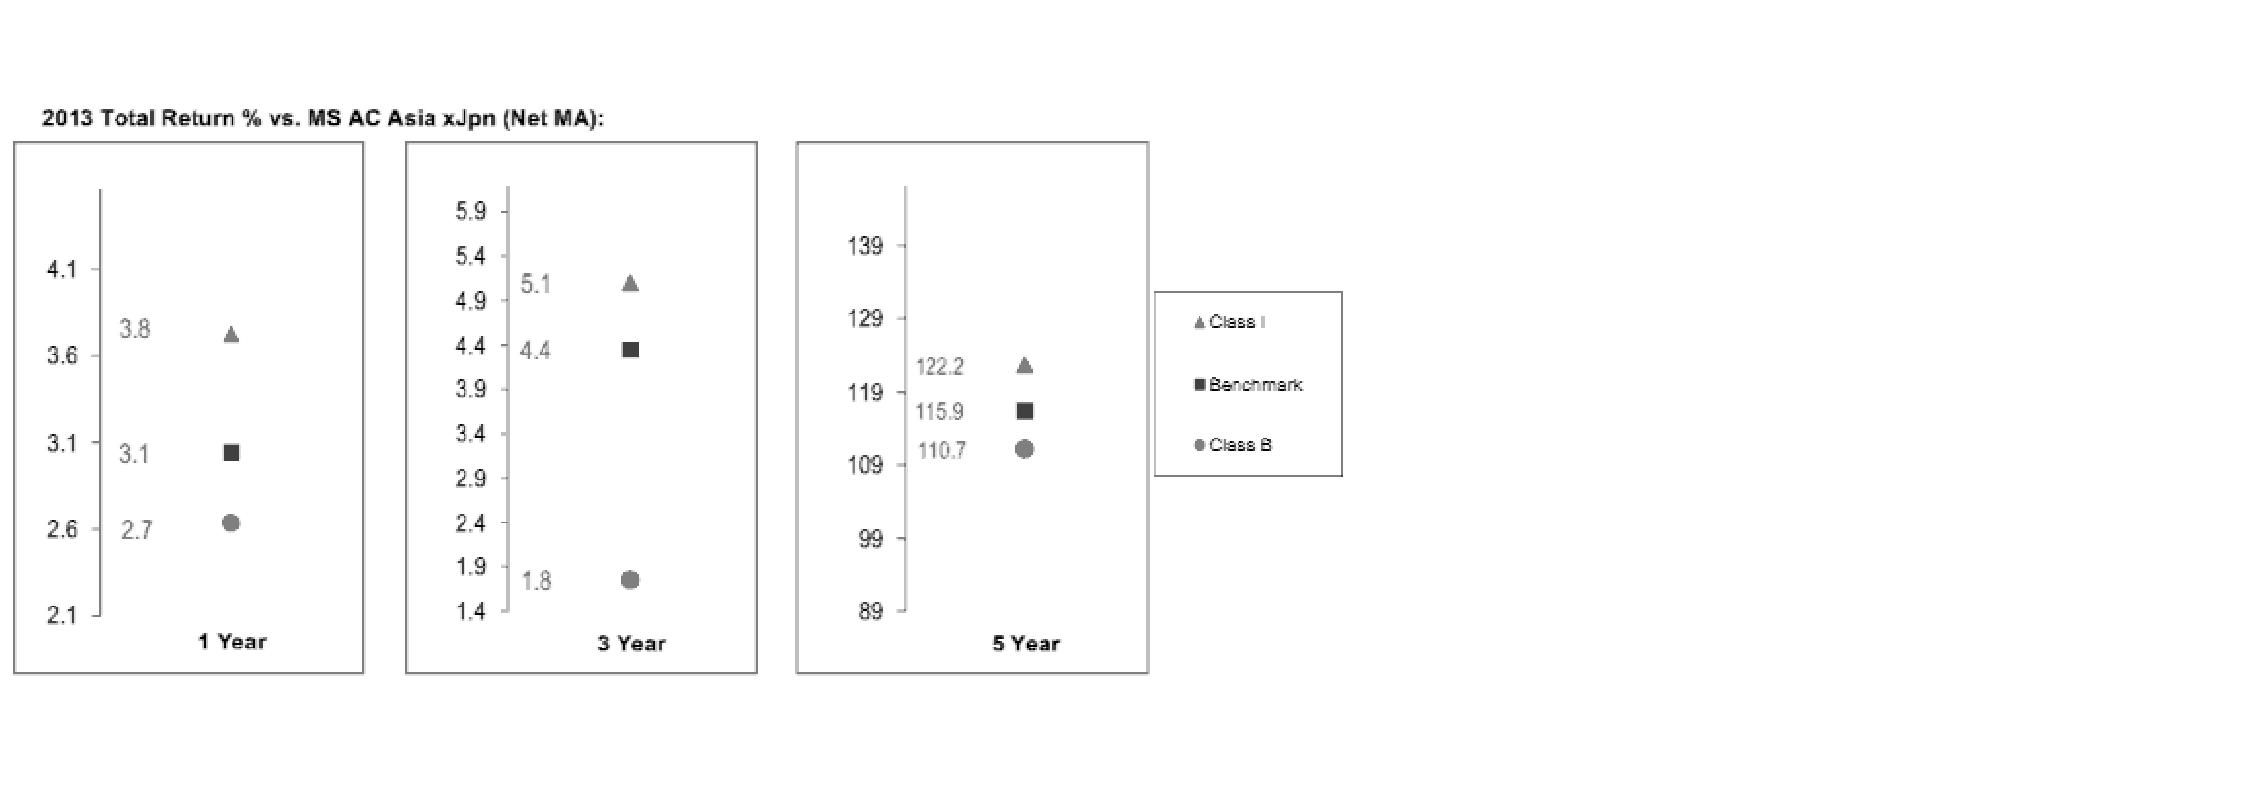
Based on its review, the Board concluded that the nature, extent, and quality of services provided to the fund under the Advisory Contracts should benefit the fund's shareholders.
Competitiveness of Management Fee and Total Expense Ratio. The Board considered the fund's management fee and total expense ratio compared to "mapped groups" of competitive funds and classes. Fidelity creates "mapped groups" by combining similar Lipper investment objective categories that have comparable investment mandates. Combining Lipper investment objective categories aids the Board's management fee and total expense ratio comparisons by broadening the competitive group used for comparison and by reducing the number of universes to which various Fidelity funds are compared.
Management Fee. The Board considered two proprietary management fee comparisons for the 12-month periods shown in the chart below. The group of Lipper funds used by the Board for management fee comparisons is referred to below as the "Total Mapped Group." The Total Mapped Group comparison focuses on a fund's standing in terms of gross management fees before expense reimbursements or caps relative to the total universe of funds with comparable investment mandates, regardless of whether their management fee structures also are comparable. Funds with comparable investment mandates offer exposure to similar types of securities. Funds with comparable management fee structures have similar management fee contractual arrangements (e.g., flat rate charged for advisory services, all-inclusive fee rate, etc.). "TMG %" represents the percentage of funds in the Total Mapped Group that had management fees that were lower than the fund's. For example, a hypothetical TMG % of 20% would mean that 80% of the funds in the Total Mapped Group had higher, and 20% had lower, management fees than the fund. The fund's actual TMG %s are in the chart below. The "Asset-Size Peer Group" (ASPG) comparison focuses on a fund's standing relative to a subset of non-Fidelity funds within the Total Mapped Group that are similar in size and management fee structure. For example, if a fund is in the first quartile of the ASPG, the fund's management fee ranks in the least expensive or lowest 25% of funds in the ASPG. The ASPG represents at least 15% of the funds in the Total Mapped Group with comparable asset size and management fee structures, subject to a minimum of 50 funds (or all funds in the Total Mapped Group if fewer than 50).Additional information, such as the ASPG quartile in which the fund's management fee rate ranked, is also included in the chart and considered by the Board.
Annual Report
Board Approval of Investment Advisory Contracts and
Management Fees - continued
Fidelity Advisor Emerging Asia Fund
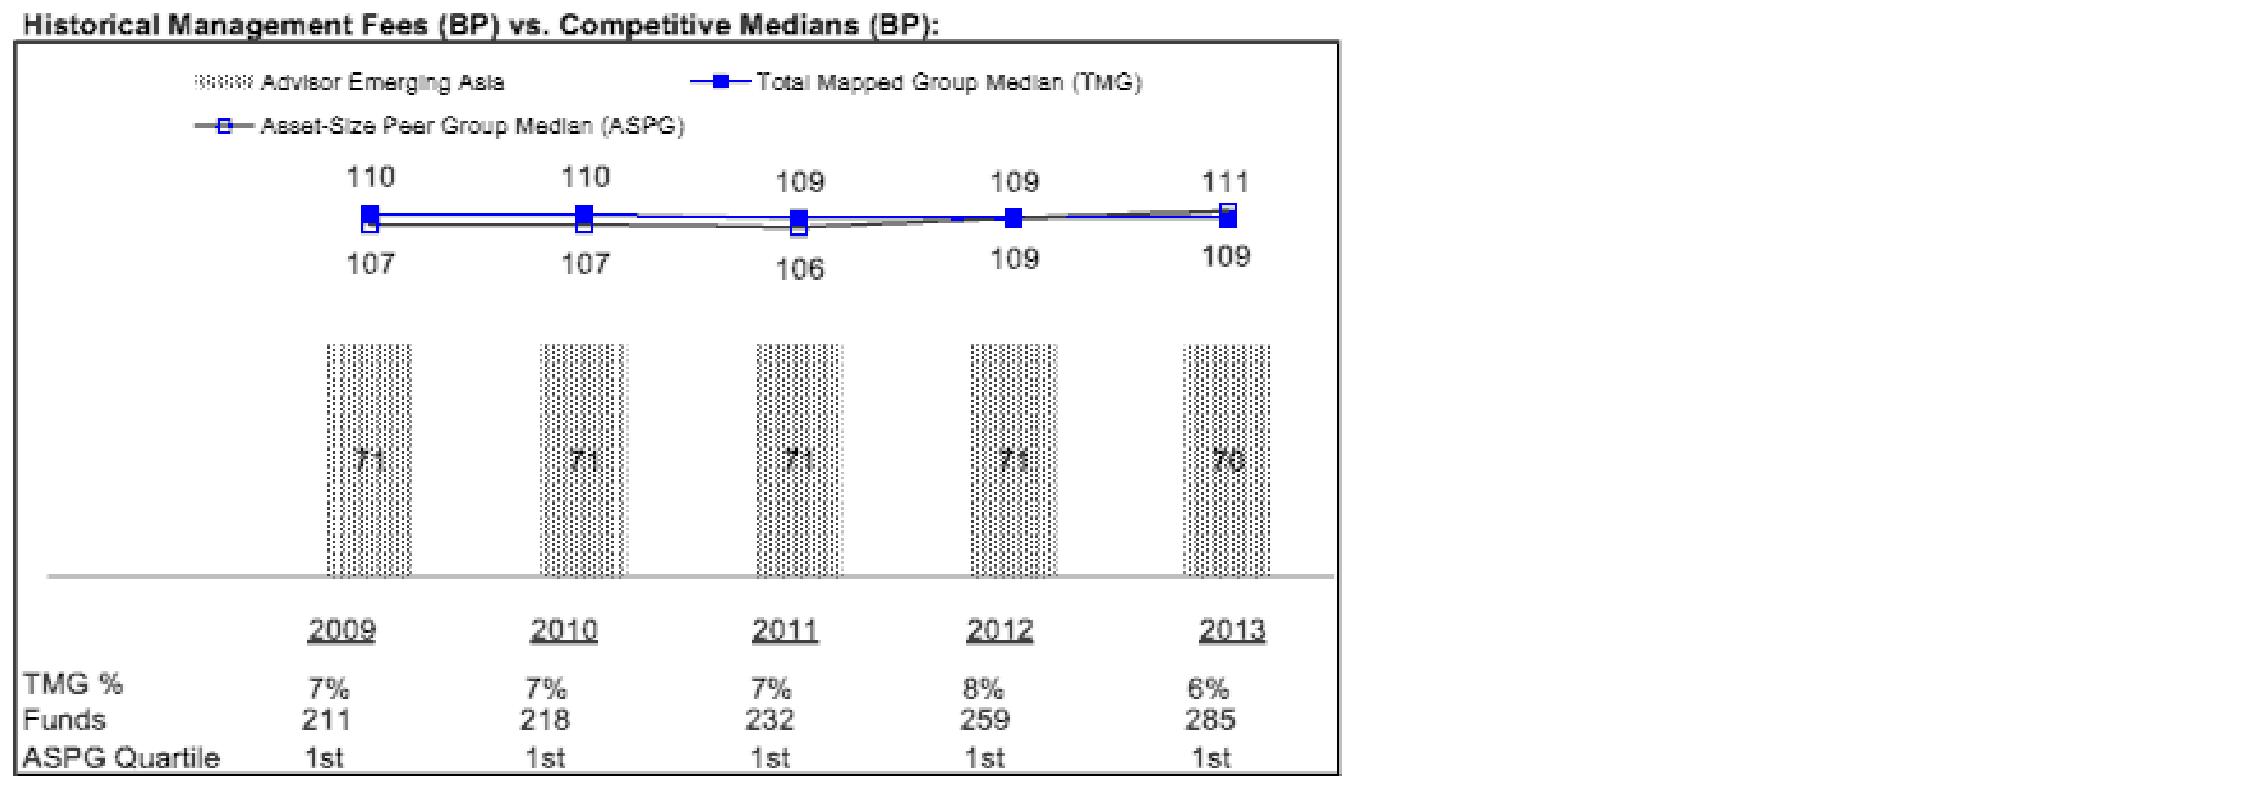
The Board noted that the fund's management fee rate ranked below the median of its Total Mapped Group and below the median of its ASPG for 2013.
The Board also noted that, in August 2013, the ad hoc Committee on Management Fees was formed to conduct an in-depth review of the management fee rates of Fidelity's active equity mutual funds. The Committee focused on the following areas: (i) standard fee structures; (ii) research consumption and trading evolution; (iii) management fee competitiveness/profitability by category; and (iv) factors that drive institutional pricing.
Based on its review, the Board concluded that the fund's management fee is fair and reasonable in light of the services that the fund receives and the other factors considered.
Annual Report
Total Expense Ratio. In its review of each class's total expense ratio, the Board considered the fund's management fee as well as other fund or class expenses, as applicable, such as transfer agent fees, pricing and bookkeeping fees, fund-paid 12b-1 fees, and custodial, legal, and audit fees. The Board also noted the effects of any waivers and reimbursements on fees and expenses. As part of its review, the Board also considered the current and historical total expense ratios of each class of the fund compared to competitive fund median expenses. Each class of the fund is compared to those funds and classes in the Total Mapped Group (used by the Board for management fee comparisons) that have a similar sales load structure.
The Board noted that the total expense ratio of each of Class A, Class B, Class C, and Institutional Class ranked below its competitive median for 2013 and the total expense ratio of Class T ranked above its competitive median for 2013. The Board considered that, in general, various factors can affect total expense ratios. The Board noted that the total expense ratio of Class T was above the competitive median primarily because of higher 12b-1 fees on Class T as compared to most competitor funds. Class T has a higher 12b-1 fee, but a lower front-end sales charge, than traditionally priced front-end sales charge classes. The Board considered that Class T is primarily sold load-waived in the retirement plan market where its 0.50% 12b-1 fee is comparable to competing no-load, higher 12b-1 fee classes designed specifically for retirement plans. The Board noted that the fund offers multiple classes, each of which has a different sales load and 12b-1 fee structure, and that the multiple structures are intended to offer a range of pricing options for the intermediary market. The Board also noted that the total expense ratios of the classes vary primarily by the level of their 12b-1 fees, although differences in transfer agent fees may also cause expenses to vary from class to class.
Fees Charged to Other Fidelity Clients. The Board also considered Fidelity fee structures and other information with respect to clients of Fidelity, such as other funds advised or subadvised by Fidelity, pension plan clients, and other institutional clients. The Board noted the findings of the 2013 ad hoc joint committee (created with the board of other Fidelity funds), which reviewed and compared Fidelity's institutional investment advisory business with its business of providing services to the Fidelity funds, including the differences in services provided, fees charged, and costs incurred, as well as competition in their respective marketplaces.
Based on its review of total expense ratios and fees charged to other Fidelity clients, the Board concluded that the total expense ratio of each class of the fund was reasonable, although Class T was above the median of the universe presented for comparison, in light of the services that the fund and its shareholders receive and the other factors considered.
Costs of the Services and Profitability. The Board considered the revenues earned and the expenses incurred by Fidelity in conducting the business of developing, marketing, distributing, managing, administering and servicing the fund and servicing the fund's shareholders. The Board also considered the level of Fidelity's profits in respect of all the Fidelity funds.
Annual Report
Board Approval of Investment Advisory Contracts and
Management Fees - continued
On an annual basis, Fidelity presents to the Board Fidelity's profitability for the fund. Fidelity calculates the profitability for each fund, as well as aggregate profitability for groups of Fidelity funds and all Fidelity funds, using a series of detailed revenue and cost allocation methodologies which originate with the books and records of Fidelity on which Fidelity's audited financial statements are based. The Audit Committee of the Board reviews any significant changes from the prior year's methodologies.
PricewaterhouseCoopers LLP (PwC), independent registered public accounting firm and auditor to Fidelity and certain Fidelity funds, has been engaged annually by the Board as part of the Board's assessment of Fidelity's profitability analysis. PwC's engagement includes the review and assessment of the methodologies used by Fidelity in determining the revenues and expenses attributable to Fidelity's mutual fund business, and completion of agreed-upon procedures in respect of the mathematical accuracy of fund profitability and its conformity to established allocation methodologies. After considering PwC's reports issued under the engagement and information provided by Fidelity, the Board concluded that while other allocation methods may also be reasonable, Fidelity's profitability methodologies are reasonable in all material respects.
The Board also reviewed Fidelity's non-fund businesses and fall-out benefits related to the mutual fund business as well as cases where Fidelity's affiliates may benefit from or be related to the fund's business.
The Board considered the costs of the services provided by and the profits realized by Fidelity in connection with the operation of the fund and was satisfied that the profitability was not excessive in the circumstances.
Economies of Scale. The Board considered whether there have been economies of scale in respect of the management of the Fidelity funds, whether the Fidelity funds (including the fund) have appropriately benefited from any such economies of scale, and whether there is potential for realization of any further economies of scale. The Board considered the extent to which the fund will benefit from economies of scale through increased services to the fund, through waivers or reimbursements, or through fee or expense ratio reductions. The Board also noted that in 2013, it and the boards of other Fidelity funds created an ad hoc committee (the Economies of Scale Committee) to analyze whether Fidelity attains economies of scale in respect of the management and servicing of the Fidelity funds, whether the Fidelity funds have appropriately benefited from such economies of scale, and whether there is potential for realization of any further economies of scale.
The Board recognized that the fund's management contract incorporates a "group fee" structure, which provides for lower group fee rates as total group assets increase, and for higher group fee rates as total group assets decrease (with "group assets" defined to include fund assets under FMR's management plus sector fund assets previously under FMR's management and currently managed by Fidelity SelectCo, LLC). FMR calculates the group fee rates based on a tiered asset "breakpoint" schedule that varies based on asset class. The Board considered that the group fee is designed to deliver the benefits of economies of scale to fund shareholders when total Fidelity fund assets increase, even if assets of any particular fund are unchanged or have declined, because some portion of Fidelity's costs are attributable to services provided to all Fidelity funds, and all funds benefit if those costs can be allocated among more assets. The Board concluded that, given the group fee structure, fund shareholders will benefit from lower management fees as group assets increase at the fund complex level, regardless of whether Fidelity achieves any such economies of scale.
Annual Report
The Board concluded, taking into account the analysis of the Economies of Scale Committee, that economies of scale, if any, are being appropriately shared between fund shareholders and Fidelity.
Additional Information Requested by the Board. In order to develop fully the factual basis for consideration of the Fidelity funds' Advisory Contracts, the Board requested and received additional information on certain topics, including: (i) fund performance trends and Fidelity's long-term strategies for certain funds; (ii) Fidelity's strategic marketing and product lineup goals; (iii) the methodology with respect to competitive fund data and peer group classifications; (iv) the arrangements with, and performance of, certain sub-advisers on behalf of the Fidelity funds, as well as certain proposed participating affiliate arrangements; (v) the realization of fall-out benefits in certain Fidelity business units; (vi) Fidelity's group fee structures, including the rationale for the individual fee rates of certain categories of funds and the definition of group assets; (vii) trends regarding industry use of performance fee structures and the performance adjustment methodologies applicable to the Fidelity funds; (viii) additional competitive analysis regarding the total expenses for certain classes; (ix) fund profitability methodology, including Fidelity's cost allocation methodology, and the impact of certain factors on fund profitability results; and (x) the process by which Fidelity determines sub-advisory fees for funds it advises.
Based on its evaluation of all of the conclusions noted above, and after considering all factors it believed relevant, the Board ultimately concluded that the advisory fee structures are fair and reasonable, and that the fund's Advisory Contracts should be renewed.
Annual Report
Investment Adviser
Fidelity Management & Research Company
Boston, MA
Investment Sub-Advisers
FMR Co., Inc.
Fidelity Management & Research
(U.K.) Inc.
Fidelity Management & Research (Hong Kong) Limited
Fidelity Management & Research (Japan) Limited
FIL Investment Advisors
FIL Investment Advisors (UK) Limited
FIL Investments (Japan) Limited
General Distributor
Fidelity Distributors Corporation
Smithfield, RI
Transfer and Service Agents
Fidelity Investments Institutional Operations Company, Inc.
Boston, MA
Fidelity Service Company, Inc.
Boston, MA
Custodian
Brown Brothers Harriman & Co.
Boston, MA
(Fidelity Investment logo)(registered trademark)
AEAI-UANN-1214
1.784738.111
(Fidelity Investment logo)(registered trademark)
Fidelity Advisor®
Emerging Markets
Fund - Class A, Class T, Class B
and Class C
Annual Report
October 31, 2014
(Fidelity Cover Art)
Contents
Performance | (Click Here) | How the fund has done over time. |
Management's Discussion of Fund Performance | (Click Here) | The Portfolio Manager's review of fund performance and strategy. |
Shareholder Expense Example | (Click Here) | An example of shareholder expenses. |
Investment Changes | (Click Here) | A summary of major shifts in the fund's investments over the past six months. |
Investments | (Click Here) | A complete list of the fund's investments with their market values. |
Financial Statements | (Click Here) | Statements of assets and liabilities, operations, and changes in net assets, as well as financial highlights. |
Notes | (Click Here) | Notes to the financial statements. |
Report of Independent Registered Public Accounting Firm | (Click Here) | |
Trustees and Officers | (Click Here) | |
Distributions | (Click Here) | |
Board Approval of Investment Advisory Contracts and Management Fees | (Click Here) | |
To view a fund's proxy voting guidelines and proxy voting record for the 12-month period ended June 30, visit http://www.fidelity.com/proxyvotingresults or visit the Securities and Exchange Commission's (SEC) web site at http://www.sec.gov. You may also call 1-877-208-0098 to request a free copy of the proxy voting guidelines.
Standard & Poor's, S&P and S&P 500 are registered service marks of The McGraw-Hill Companies, Inc. and have been licensed for use by Fidelity Distributors Corporation.
Other third-party marks appearing herein are the property of their respective owners.
All other marks appearing herein are registered or unregistered trademarks or service marks of FMR LLC or an affiliated company. © 2014 FMR LLC. All rights reserved.
Annual Report
This report and the financial statements contained herein are submitted for the general information of the shareholders of the fund. This report is not authorized for distribution to prospective investors in the fund unless preceded or accompanied by an effective prospectus.
A fund files its complete schedule of portfolio holdings with the SEC for the first and third quarters of each fiscal year on Form N-Q. Forms N-Q are available on the SEC's web site at http://www.sec.gov. A fund's Forms N-Q may be reviewed and copied at the SEC's Public Reference Room in Washington, DC. Information regarding the operation of the SEC's Public Reference Room may be obtained by calling 1-800-SEC-0330. For a complete list of a fund's portfolio holdings, view the most recent holdings listing, semiannual report, or annual report on Fidelity's web site at http://www.fidelity.com, http://advisor.fidelity.com, or http://www.401k.com, as applicable.
NOT FDIC INSURED • MAY LOSE VALUE • NO BANK GUARANTEE
Neither the fund nor Fidelity Distributors Corporation is a bank.
Annual Report
Average annual total return reflects the change in the value of an investment, assuming reinvestment of the class' distributions from dividend income and capital gains (the profits earned upon the sale of securities that have grown in value, if any) and assuming a constant rate of performance each year. The $10,000 table and the fund's returns do not reflect the deduction of taxes that a shareholder would pay on fund distributions or the redemption of fund shares. During periods of reimbursement by Fidelity, a fund's total return will be greater than it would be had the reimbursement not occurred. How a fund did yesterday is no guarantee of how it will do tomorrow. Returns reflect the conversion of Class B shares into Class A shares after a maximum of seven years.
Average Annual Total Returns
Periods ended October 31, 2014 | Past 1
year | Past 5
years | Past 10
years |
Class A (incl. 5.75% sales charge) | -2.31% | 3.60% | 9.31% |
Class T (incl. 3.50% sales charge) | -0.23% | 3.83% | 9.27% |
Class B (incl. contingent deferred sales charge) A | -2.11% | 3.71% | 9.37% |
Class C (incl. contingent deferred sales charge) B | 1.90% | 4.06% | 9.13% |
A Class B shares' contingent deferred sales charges included in the past one year, past five years, and past ten years total return figures are 5%, 2%, and 0%, respectively.
B Class C shares' contingent deferred sales charges included in the past one year, past five years, and past ten years total return figures are 1%, 0%, and 0%, respectively.
Annual Report
$10,000 Over 10 Years
Let's say hypothetically that $10,000 was invested in Fidelity Advisor® Emerging Markets Fund - Class A on October 31, 2004, and the current 5.75% sales charge was paid. The chart shows how the value of your investment would have changed, and also shows how the MSCI Emerging Markets Index performed over the same period.
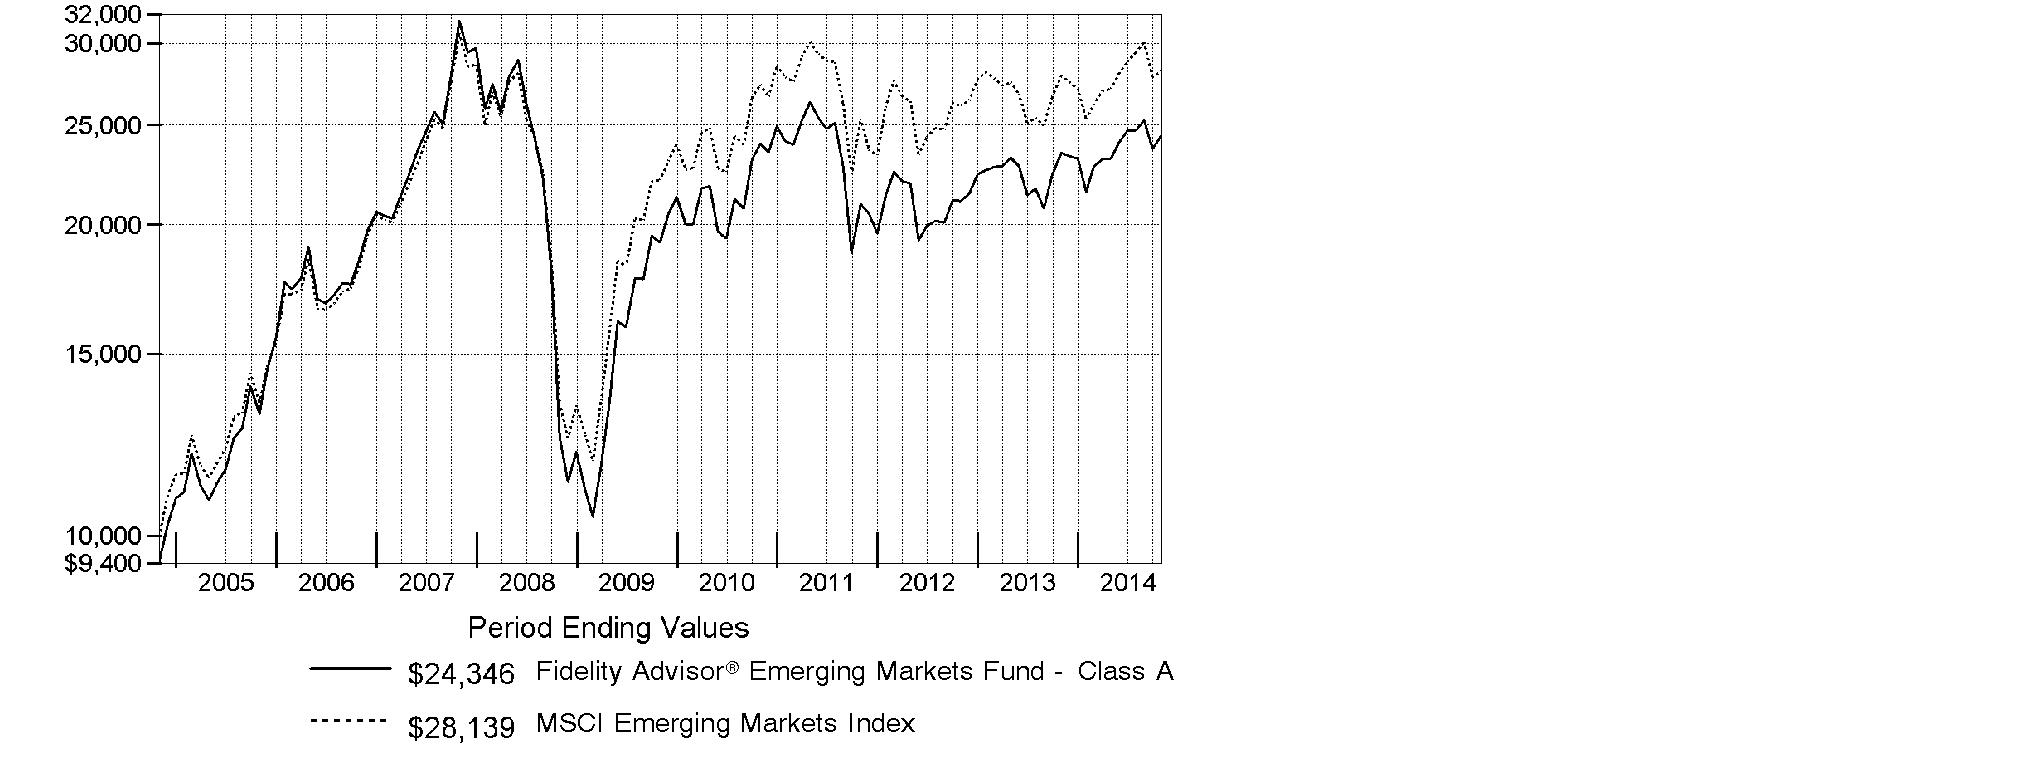
Annual Report
Market Recap: Global equities posted a healthy gain for the 12 months ending October 31, 2014, overcoming an October market decline driven by recessionary pressures in China and tepid growth in Europe. The MSCI ACWI (All Country World Index) Index rose 8.15%, helped by subdued market volatility for much of the period and supported by solid corporate earnings, especially in the United States. Stocks also benefited from easy monetary policies in Japan and the eurozone, as well as increased stimulus efforts in China. All but three of the 24 industry groups that compose the index marked a positive return. The U.S. (+17%) remained a pillar of strength, while a strongly rising dollar in the latter part of the period detracted from investors' returns in most non-U.S. markets. Canada (+5%) notched broad gains outside of its energy and materials sectors, as did Asia-Pacific ex Japan (+4%), led by investor enthusiasm for companies in India. The U.K., Europe and Japan, meanwhile, all underperformed. Among sectors, health care (+24%) led the index, with a strong contribution from the pharmaceuticals, biotechnology & life sciences industry. Information technology (+21%) also outperformed. Conversely, materials (-4%) and energy (-1%) lagged the index due to a higher supply of and lower demand for commodities.
Comments from Sammy Simnegar, Portfolio Manager of Fidelity Advisor® Emerging Markets Fund: For the year, the fund's Class A, Class T, Class B and Class C shares returned 3.65%, 3.39%, 2.89% and 2.90%, respectively (excluding sales charges), topping the 0.98% gain of the MSCI Emerging Markets Index. Versus the index, the fund's performance was lifted by its positioning in India, which accounted for eight of the fund's 20 largest relative contributors. A non-index position in Axis Bank was the fund's best relative contributor from India and fifth-largest overall. The top relative contributor was Bitauto Holdings, a Chinese automotive website and also a non-index name. Performance was further lifted by not owning several weak-performing index stocks in the energy and materials sectors, including those of two Brazil-based companies - energy producer Petroleo Brasileiro, better known as Petrobras, and industrial metals miner Vale - as well as Russian gas distributor Gazprom. Conversely, Banco Bradesco, a Brazil-based bank, was the fund's largest relative detractor. This stock performed poorly early in 2014, and I sold it - prematurely, as it turned out. Not owning two strong-performing index stocks, China Mobile and Hon Hai Precision Industry, a Taiwan-based manufacturer of electronic products, also detracted.
The views expressed above reflect those of the portfolio manager(s) only through the end of the period as stated on the cover of this report and do not necessarily represent the views of Fidelity or any other person in the Fidelity organization. Any such views are subject to change at any time based upon market or other conditions and Fidelity disclaims any responsibility to update such views. These views may not be relied on as investment advice and, because investment decisions for a Fidelity fund are based on numerous factors, may not be relied on as an indication of trading intent on behalf of any Fidelity fund.
Annual Report
Shareholder Expense Example
As a shareholder of the Fund, you incur two types of costs: (1) transaction costs, including sales charges (loads) on purchase payments or redemption proceeds, redemption fees and (2) ongoing costs, including management fees, distribution and/or service (12b-1) fees and other Fund expenses. This Example is intended to help you understand your ongoing costs (in dollars) of investing in the Fund and to compare these costs with the ongoing costs of investing in other mutual funds.
The Example is based on an investment of $1,000 invested at the beginning of the period and held for the entire period (May 1, 2014 to October 31, 2014).
Actual Expenses
The first line of the accompanying table for each class of the Fund provides information about actual account values and actual expenses. You may use the information in this line, together with the amount you invested, to estimate the expenses that you paid over the period. Simply divide your account value by $1,000.00 (for example, an $8,600 account value divided by $1,000.00 = 8.6), then multiply the result by the number in the first line for a class of the Fund under the heading entitled "Expenses Paid During Period" to estimate the expenses you paid on your account during this period. In addition, the Fund, as a shareholder in the underlying Fidelity Central Funds, will indirectly bear its pro-rata share of the fees and expenses incurred by the underlying Fidelity Central Funds. These fees and expenses are not included in the Fund's annualized expense ratio used to calculate the expense estimate in the table below.
Hypothetical Example for Comparison Purposes
The second line of the accompanying table for each class of the Fund provides information about hypothetical account values and hypothetical expenses based on a Class' actual expense ratio and an assumed rate of return of 5% per year before expenses, which is not the Class' actual return. The hypothetical account values and expenses may not be used to estimate the actual ending account balance or expenses you paid for the period. You may use this information to compare the ongoing costs of investing in the Fund and other funds. To do so, compare this 5% hypothetical example with the 5% hypothetical examples that appear in the shareholder reports of the other funds. In addition, the Fund, as a shareholder in the underlying Fidelity Central Funds, will indirectly bear its pro-rata share of the fees and expenses incurred by the underlying Fidelity Central Funds. These fees and expenses are not included in the Fund's annualized expense ratio used to calculate the expense estimate in the table below.
Please note that the expenses shown in the table are meant to highlight your ongoing costs only and do not reflect any transaction costs. Therefore, the second line of the table is useful in comparing ongoing costs only, and will not help you determine the relative total costs of owning different funds. In addition, if these transactional costs were included, your costs would have been higher.
Annual Report
| Annualized
Expense RatioB | Beginning
Account Value
May 1, 2014 | Ending
Account Value
October 31, 2014 | Expenses Paid
During Period*
May 1, 2014
to October 31, 2014 |
Class A | 1.50% | | | |
Actual | | $ 1,000.00 | $ 1,051.70 | $ 7.76 |
HypotheticalA | | $ 1,000.00 | $ 1,017.64 | $ 7.63 |
Class T | 1.76% | | | |
Actual | | $ 1,000.00 | $ 1,050.00 | $ 9.09 |
HypotheticalA | | $ 1,000.00 | $ 1,016.33 | $ 8.94 |
Class B | 2.24% | | | |
Actual | | $ 1,000.00 | $ 1,047.40 | $ 11.56 |
HypotheticalA | | $ 1,000.00 | $ 1,013.91 | $ 11.37 |
Class C | 2.25% | | | |
Actual | | $ 1,000.00 | $ 1,047.50 | $ 11.61 |
HypotheticalA | | $ 1,000.00 | $ 1,013.86 | $ 11.42 |
Institutional Class | 1.16% | | | |
Actual | | $ 1,000.00 | $ 1,053.30 | $ 6.00 |
HypotheticalA | | $ 1,000.00 | $ 1,019.36 | $ 5.90 |
Class Z | .99% | | | |
Actual | | $ 1,000.00 | $ 1,054.30 | $ 5.13 |
HypotheticalA | | $ 1,000.00 | $ 1,020.21 | $ 5.04 |
A 5% return per year before expenses
B Annualized expense ratio reflects expenses net of applicable fee waivers.
* Expenses are equal to each Class' annualized expense ratio, multiplied by the average account value over the period, multiplied by 184/365 (to reflect the one-half year period).
Annual Report
Investment Changes (Unaudited)
Top Five Stocks as of October 31, 2014 |
| % of fund's
net assets | % of fund's net assets
6 months ago |
Samsung Electronics Co. Ltd. (Korea (South), Technology Hardware, Storage & Peripherals) | 4.0 | 4.7 |
Taiwan Semiconductor Manufacturing Co. Ltd. (Taiwan, Semiconductors & Semiconductor Equipment) | 3.1 | 3.0 |
Tencent Holdings Ltd. (Cayman Islands, Internet Software & Services) | 2.4 | 2.1 |
Naspers Ltd. Class N (South Africa, Media) | 1.7 | 1.5 |
Itau Unibanco Holding SA sponsored ADR (Brazil, Banks) | 1.4 | 1.5 |
| 12.6 | |
Top Five Market Sectors as of October 31, 2014 |
| % of fund's
net assets | % of fund's net assets
6 months ago |
Financials | 23.5 | 20.9 |
Information Technology | 19.2 | 18.2 |
Consumer Discretionary | 18.8 | 21.2 |
Industrials | 13.4 | 15.0 |
Consumer Staples | 7.8 | 10.3 |
Top Five Countries as of October 31, 2014 |
(excluding cash equivalents) | % of fund's
net assets | % of fund's net assets
6 months ago |
India | 12.0 | 10.0 |
Brazil | 11.2 | 9.5 |
South Africa | 9.0 | 7.6 |
Cayman Islands | 6.4 | 8.7 |
Indonesia | 6.3 | 5.9 |
Percentages are adjusted for the effect of open futures contracts, if applicable. |
Asset Allocation (% of fund's net assets) |
As of October 31, 2014 | As of April 30, 2014 |
 | Stocks 97.7% | | | Stocks 99.5% | |
 | Short-Term
Investments and
Net Other Assets (Liabilities) 2.3% | | | Short-Term
Investments and
Net Other Assets (Liabilities) 0.5% | |

Annual Report
Investments October 31, 2014
Showing Percentage of Net Assets
Common Stocks - 92.3% |
| Shares | | Value |
Australia - 1.2% |
Carsales.com Ltd. (d) | 222,870 | | $ 2,103,084 |
SEEK Ltd. | 129,202 | | 1,896,025 |
Sydney Airport unit | 480,461 | | 1,867,905 |
TOTAL AUSTRALIA | | 5,867,014 |
Bailiwick of Jersey - 0.4% |
WPP PLC | 84,800 | | 1,656,369 |
Bermuda - 2.2% |
Brilliance China Automotive Holdings Ltd. | 1,352,000 | | 2,337,967 |
China Gas Holdings Ltd. | 1,335,000 | | 2,386,820 |
China Resources Gas Group Ltd. | 728,000 | | 2,080,977 |
Credicorp Ltd. (United States) | 22,214 | | 3,576,454 |
TOTAL BERMUDA | | 10,382,218 |
Brazil - 6.7% |
BB Seguridade Participacoes SA | 245,700 | | 3,278,115 |
CCR SA | 417,300 | | 3,107,141 |
Cetip SA - Mercados Organizado | 151,600 | | 1,921,078 |
Cielo SA | 230,560 | | 3,786,063 |
Estacio Participacoes SA | 258,400 | | 2,992,889 |
Iguatemi Empresa de Shopping Centers SA | 175,500 | | 1,777,735 |
Kroton Educacional SA | 502,600 | | 3,582,032 |
Linx SA | 72,000 | | 1,495,847 |
Qualicorp SA (a) | 232,900 | | 2,368,570 |
Smiles SA | 112,900 | | 1,950,087 |
Ultrapar Participacoes SA | 140,300 | | 3,060,339 |
Weg SA | 202,415 | | 2,387,744 |
TOTAL BRAZIL | | 31,707,640 |
British Virgin Islands - 0.4% |
Mail.Ru Group Ltd. GDR (a)(e) | 85,900 | | 2,082,216 |
Cayman Islands - 6.4% |
51job, Inc. sponsored ADR (a)(d) | 7,049 | | 216,404 |
Alibaba Group Holding Ltd. sponsored ADR | 30,100 | | 2,967,860 |
Autohome, Inc. ADR Class A | 34,100 | | 1,803,549 |
Baidu.com, Inc. sponsored ADR (a) | 12,313 | | 2,939,975 |
Bitauto Holdings Ltd. ADR (a) | 22,855 | | 1,913,421 |
Haitian International Holdings Ltd. | 893,000 | | 1,915,555 |
Melco Crown Entertainment Ltd. sponsored ADR | 86,200 | | 2,339,468 |
Sands China Ltd. | 421,400 | | 2,628,319 |
Common Stocks - continued |
| Shares | | Value |
Cayman Islands - continued |
SouFun Holdings Ltd. ADR (d) | 211,800 | | $ 2,065,050 |
Tencent Holdings Ltd. | 714,800 | | 11,488,461 |
TOTAL CAYMAN ISLANDS | | 30,278,062 |
China - 1.2% |
China Pacific Insurance Group Co. Ltd. (H Shares) | 877,400 | | 3,283,371 |
PICC Property & Casualty Co. Ltd. (H Shares) | 1,392,500 | | 2,554,455 |
TOTAL CHINA | | 5,837,826 |
Colombia - 0.5% |
Grupo de Inversiones Suramerica SA | 123,456 | | 2,566,925 |
Denmark - 0.4% |
Novo Nordisk A/S Series B sponsored ADR | 42,501 | | 1,920,195 |
Egypt - 0.5% |
Commercial International Bank SAE sponsored GDR | 358,300 | | 2,436,440 |
Finland - 0.4% |
Kone Oyj (B Shares) (d) | 46,500 | | 1,998,712 |
France - 2.8% |
Bureau Veritas SA | 79,700 | | 1,970,555 |
Ingenico SA | 18,451 | | 1,837,495 |
LVMH Moet Hennessy - Louis Vuitton SA | 13,522 | | 2,293,519 |
Pernod Ricard SA | 14,700 | | 1,673,207 |
Publicis Groupe SA (a) | 27,500 | | 1,904,694 |
Safran SA | 28,900 | | 1,828,910 |
Zodiac Aerospace | 60,100 | | 1,832,774 |
TOTAL FRANCE | | 13,341,154 |
Greece - 1.0% |
Folli Follie SA | 72,500 | | 2,371,273 |
Greek Organization of Football Prognostics SA | 182,500 | | 2,211,528 |
TOTAL GREECE | | 4,582,801 |
Hong Kong - 1.0% |
AIA Group Ltd. | 367,800 | | 2,052,480 |
Galaxy Entertainment Group Ltd. | 377,000 | | 2,577,888 |
TOTAL HONG KONG | | 4,630,368 |
India - 12.0% |
Apollo Hospitals Enterprise Ltd. (a) | 95,367 | | 1,730,678 |
Asian Paints India Ltd. | 187,223 | | 2,000,226 |
Axis Bank Ltd. (a) | 318,541 | | 2,347,721 |
Exide Industries Ltd. | 656,457 | | 1,683,042 |
Common Stocks - continued |
| Shares | | Value |
India - continued |
Grasim Industries Ltd. | 31,862 | | $ 1,911,983 |
Havells India Ltd. | 464,910 | | 2,162,206 |
HCL Technologies Ltd. | 103,727 | | 2,720,363 |
HDFC Bank Ltd. | 199,223 | | 3,230,472 |
Housing Development Finance Corp. Ltd. | 286,978 | | 5,168,255 |
ICICI Bank Ltd. (a) | 104,204 | | 2,767,346 |
ITC Ltd. (a) | 649,502 | | 3,755,361 |
Larsen & Toubro Ltd. (a) | 131,867 | | 3,553,714 |
LIC Housing Finance Ltd. | 356,022 | | 2,096,521 |
Lupin Ltd. | 97,479 | | 2,256,969 |
Mahindra & Mahindra Ltd. (a) | 124,483 | | 2,646,732 |
Motherson Sumi Systems Ltd. | 245,550 | | 1,681,244 |
Sun Pharmaceutical Industries Ltd. | 241,337 | | 3,321,241 |
Sun TV Ltd. | 406,377 | | 2,161,232 |
Tata Consultancy Services Ltd. | 101,831 | | 4,332,656 |
Tata Motors Ltd. (a) | 338,789 | | 2,959,874 |
Titan Co. Ltd. (a) | 362,283 | | 2,379,826 |
TOTAL INDIA | | 56,867,662 |
Indonesia - 6.3% |
PT ACE Hardware Indonesia Tbk | 27,477,500 | | 1,844,228 |
PT Astra International Tbk | 6,331,700 | | 3,550,256 |
PT Bank Central Asia Tbk | 3,853,700 | | 4,160,227 |
PT Bank Rakyat Indonesia Tbk | 3,931,900 | | 3,603,178 |
PT Global Mediacom Tbk | 16,706,500 | | 2,711,474 |
PT Indocement Tunggal Prakarsa Tbk | 1,295,600 | | 2,567,860 |
PT Jasa Marga Tbk | 4,237,000 | | 2,227,625 |
PT Media Nusantara Citra Tbk | 8,899,500 | | 2,063,171 |
PT Semen Gresik (Persero) Tbk | 2,051,600 | | 2,694,885 |
PT Surya Citra Media Tbk | 6,616,200 | | 1,852,002 |
PT Tower Bersama Infrastructure Tbk | 3,062,900 | | 2,256,117 |
TOTAL INDONESIA | | 29,531,023 |
Kenya - 1.2% |
East African Breweries Ltd. | 590,262 | | 1,880,656 |
Kenya Commercial Bank Ltd. | 2,996,500 | | 1,842,454 |
Safaricom Ltd. | 15,087,300 | | 2,057,742 |
TOTAL KENYA | | 5,780,852 |
Korea (South) - 5.9% |
Coway Co. Ltd. | 31,572 | | 2,397,773 |
KEPCO Plant Service & Engineering Co. Ltd. | 24,103 | | 1,967,372 |
Common Stocks - continued |
| Shares | | Value |
Korea (South) - continued |
NAVER Corp. | 6,755 | | $ 4,740,373 |
Samsung Electronics Co. Ltd. | 16,003 | | 18,528,384 |
TOTAL KOREA (SOUTH) | | 27,633,902 |
Luxembourg - 0.3% |
Samsonite International SA | 487,200 | | 1,618,832 |
Malaysia - 1.5% |
Astro Malaysia Holdings Bhd | 2,061,800 | | 2,068,491 |
Public Bank Bhd | 572,100 | | 3,224,097 |
Tune Insurance Holdings Bhd | 2,572,100 | | 1,696,878 |
TOTAL MALAYSIA | | 6,989,466 |
Malta - 0.5% |
Brait SA | 314,452 | | 2,362,862 |
Mexico - 6.0% |
Banregio Grupo Financiero S.A.B. de CV | 351,266 | | 2,031,493 |
Fomento Economico Mexicano S.A.B. de CV unit | 412,600 | | 3,968,436 |
Grupo Aeroportuario del Pacifico SA de CV Series B | 322,721 | | 2,195,689 |
Grupo Aeroportuario del Sureste SA de CV Series B | 196,200 | | 2,622,848 |
Grupo Aeroportuario Norte S.A.B. de CV | 403,100 | | 2,008,278 |
Grupo Financiero Banorte S.A.B. de CV Series O | 635,800 | | 4,078,846 |
Grupo Mexico SA de CV Series B | 359,900 | | 1,236,615 |
Grupo Televisa SA de CV | 605,900 | | 4,378,813 |
Megacable Holdings S.A.B. de CV unit | 433,184 | | 1,984,452 |
Promotora y Operadora de Infraestructura S.A.B. de CV (a) | 169,500 | | 2,153,262 |
Qualitas Controladora S.A.B. de CV | 595,600 | | 1,540,499 |
TOTAL MEXICO | | 28,199,231 |
Nigeria - 1.2% |
Dangote Cement PLC | 1,596,095 | | 2,071,599 |
Guaranty Trust Bank PLC GDR (Reg. S) | 234,654 | | 1,806,836 |
Nigerian Breweries PLC | 1,712,655 | | 1,674,918 |
TOTAL NIGERIA | | 5,553,353 |
Philippines - 2.9% |
Alliance Global Group, Inc. | 4,420,600 | | 2,486,409 |
GT Capital Holdings, Inc. | 102,075 | | 2,293,568 |
Metropolitan Bank & Trust Co. | 978,753 | | 1,795,844 |
Robinsons Retail Holdings, Inc. | 1,244,990 | | 1,771,838 |
SM Investments Corp. | 140,386 | | 2,446,316 |
SM Prime Holdings, Inc. | 7,009,000 | | 2,724,589 |
TOTAL PHILIPPINES | | 13,518,564 |
Common Stocks - continued |
| Shares | | Value |
Russia - 1.6% |
Magnit OJSC GDR (Reg. S) | 62,466 | | $ 4,185,222 |
NOVATEK OAO GDR (Reg. S) | 29,786 | | 3,199,016 |
TOTAL RUSSIA | | 7,384,238 |
South Africa - 9.0% |
Alexander Forbes Group Holding (a) | 2,350,892 | | 1,833,013 |
Aspen Pharmacare Holdings Ltd. | 112,493 | | 4,012,715 |
Bidvest Group Ltd. | 123,815 | | 3,405,495 |
Coronation Fund Managers Ltd. | 215,500 | | 1,865,885 |
FirstRand Ltd. | 792,700 | | 3,392,229 |
Life Healthcare Group Holdings Ltd. | 567,893 | | 2,147,024 |
Mr Price Group Ltd. | 134,900 | | 2,790,402 |
MTN Group Ltd. | 286,100 | | 6,329,101 |
Nampak Ltd. | 649,343 | | 2,647,472 |
Naspers Ltd. Class N | 63,200 | | 7,865,169 |
Remgro Ltd. | 128,900 | | 2,956,470 |
Sanlam Ltd. | 477,600 | | 3,015,920 |
TOTAL SOUTH AFRICA | | 42,260,895 |
Spain - 0.5% |
Amadeus IT Holding SA Class A | 65,600 | | 2,408,655 |
Sweden - 0.3% |
Atlas Copco AB (A Shares) | 54,300 | | 1,567,050 |
Switzerland - 1.3% |
Compagnie Financiere Richemont SA Series A | 27,200 | | 2,288,458 |
Nestle SA | 25,522 | | 1,871,634 |
SGS SA (Reg.) | 900 | | 1,975,576 |
TOTAL SWITZERLAND | | 6,135,668 |
Taiwan - 4.7% |
Delta Electronics, Inc. | 586,000 | | 3,510,048 |
Giant Manufacturing Co. Ltd. | 250,000 | | 2,021,088 |
Merida Industry Co. Ltd. | 307,650 | | 2,121,820 |
Taiwan Semiconductor Manufacturing Co. Ltd. | 3,332,000 | | 14,421,273 |
TOTAL TAIWAN | | 22,074,229 |
Thailand - 2.2% |
Airports of Thailand PCL (For. Reg.) | 357,100 | | 2,652,649 |
Bangkok Dusit Medical Services PCL (For. Reg.) | 3,688,200 | | 2,093,773 |
Bumrungrad Hospital PCL (For. Reg.) | 512,300 | | 2,091,609 |
Kasikornbank PCL (For. Reg.) | 521,900 | | 3,779,995 |
TOTAL THAILAND | | 10,618,026 |
Common Stocks - continued |
| Shares | | Value |
Turkey - 1.7% |
Coca-Cola Icecek Sanayi A/S | 103,050 | | $ 2,350,633 |
TAV Havalimanlari Holding A/S | 315,000 | | 2,643,129 |
Tofas Turk Otomobil Fabrikasi A/S | 53,264 | | 334,300 |
Tupras Turkiye Petrol Rafinelleri A/S | 115,000 | | 2,496,457 |
TOTAL TURKEY | | 7,824,519 |
United Arab Emirates - 0.9% |
DP World Ltd. | 101,794 | | 1,950,373 |
First Gulf Bank PJSC | 488,529 | | 2,414,049 |
TOTAL UNITED ARAB EMIRATES | | 4,364,422 |
United Kingdom - 2.9% |
Al Noor Hospitals Group PLC | 134,084 | | 2,185,696 |
Bank of Georgia Holdings PLC | 43,200 | | 1,769,140 |
British American Tobacco PLC (United Kingdom) | 30,700 | | 1,740,002 |
Burberry Group PLC | 88,668 | | 2,171,604 |
Diageo PLC | 65,047 | | 1,918,392 |
Intertek Group PLC | 43,100 | | 1,876,739 |
Prudential PLC | 82,684 | | 1,914,633 |
TOTAL UNITED KINGDOM | | 13,576,206 |
United States of America - 4.3% |
A.O. Smith Corp. | 39,500 | | 2,107,325 |
Google, Inc. Class C (a) | 3,250 | | 1,817,010 |
International Flavors & Fragrances, Inc. | 20,200 | | 2,002,830 |
Kansas City Southern | 16,020 | | 1,967,096 |
Las Vegas Sands Corp. | 33,900 | | 2,110,614 |
MasterCard, Inc. Class A | 25,200 | | 2,110,500 |
PPG Industries, Inc. | 10,900 | | 2,220,221 |
Praxair, Inc. | 13,100 | | 1,650,469 |
Visa, Inc. Class A | 8,900 | | 2,148,727 |
W.R. Grace & Co. (a) | 21,400 | | 2,024,440 |
TOTAL UNITED STATES OF AMERICA | | 20,159,232 |
TOTAL COMMON STOCKS (Cost $380,302,536) |
435,716,827
|
Nonconvertible Preferred Stocks - 5.4% |
| | | |
Brazil - 4.5% |
Ambev SA sponsored ADR | 838,480 | | 5,601,046 |
Banco Bradesco SA (PN) sponsored ADR | 432,300 | | 6,475,854 |
Nonconvertible Preferred Stocks - continued |
| Shares | | Value |
Brazil - continued |
Companhia Brasileira de Distribuicao Grupo Pao de Acucar sponsored ADR | 62,000 | | $ 2,591,600 |
Itau Unibanco Holding SA sponsored ADR | 455,380 | | 6,721,409 |
TOTAL BRAZIL | | 21,389,909 |
Colombia - 0.5% |
Grupo Aval Acciones y Valores SA | 3,213,624 | | 2,178,861 |
Germany - 0.4% |
Henkel AG & Co. KGaA | 18,700 | | 1,846,123 |
TOTAL NONCONVERTIBLE PREFERRED STOCKS (Cost $27,663,433) |
25,414,893
|
Money Market Funds - 3.3% |
| | | |
Fidelity Cash Central Fund, 0.11% (b) | 9,664,030 | | 9,664,030 |
Fidelity Securities Lending Cash Central Fund, 0.11% (b)(c) | 6,178,349 | | 6,178,349 |
TOTAL MONEY MARKET FUNDS (Cost $15,842,379) |
15,842,379
|
TOTAL INVESTMENT PORTFOLIO - 101.0% (Cost $423,808,348) | | 476,974,099 |
NET OTHER ASSETS (LIABILITIES) - (1.0)% | | (4,818,377) |
NET ASSETS - 100% | $ 472,155,722 |
Legend |
(a) Non-income producing |
(b) Affiliated fund that is generally available only to investment companies and other accounts managed by Fidelity Investments. The rate quoted is the annualized seven-day yield of the fund at period end. A complete unaudited listing of the fund's holdings as of its most recent quarter end is available upon request. In addition, each Fidelity Central Fund's financial statements, which are not covered by the Fund's Report of Independent Registered Public Accounting Firm, are available on the SEC's website or upon request. |
(c) Investment made with cash collateral received from securities on loan. |
(d) Security or a portion of the security is on loan at period end. |
(e) Security exempt from registration under Rule 144A of the Securities Act of 1933. These securities may be resold in transactions exempt from registration, normally to qualified institutional buyers. At the end of the period, the value of these securities amounted to $2,082,216 or 0.4% of net assets. |
Affiliated Central Funds |
Information regarding fiscal year to date income earned by the Fund from investments in Fidelity Central Funds is as follows: |
Fund | Income earned |
Fidelity Cash Central Fund | $ 4,725 |
Fidelity Securities Lending Cash Central Fund | 60,169 |
Total | $ 64,894 |
Other Information |
Categorizations in the Schedule of Investments are based on country or territory of incorporation. |
The following is a summary of the inputs used, as of October 31, 2014, involving the Fund's assets and liabilities carried at fair value. The inputs or methodology used for valuing securities may not be an indication of the risk associated with investing in those securities. For more information on valuation inputs, and their aggregation into the levels used in the tables below, please refer to the Investment Valuation section in the accompanying Notes to Financial Statements. |
Valuation Inputs at Reporting Date: |
Description | Total | Level 1 | Level 2 | Level 3 |
Investments in Securities: | | | | |
Equities: | | | | |
Consumer Discretionary | $ 88,530,930 | $ 45,967,075 | $ 42,563,855 | $ - |
Consumer Staples | 36,829,068 | 25,771,841 | 11,057,227 | - |
Energy | 8,755,812 | 8,755,812 | - | - |
Financials | 110,536,197 | 61,842,567 | 48,693,630 | - |
Health Care | 24,128,470 | 12,634,200 | 11,494,270 | - |
Industrials | 62,990,876 | 41,782,472 | 21,208,404 | - |
Valuation Inputs at Reporting Date: |
Description | Total | Level 1 | Level 2 | Level 3 |
Investments in Securities: | | | | |
Equities: | | | | |
Information Technology | $ 91,221,010 | $ 52,645,125 | $ 38,575,885 | $ - |
Materials | 23,028,600 | 13,853,646 | 9,174,954 | - |
Telecommunication Services | 10,642,960 | 8,386,843 | 2,256,117 | - |
Utilities | 4,467,797 | - | 4,467,797 | - |
Money Market Funds | 15,842,379 | 15,842,379 | - | - |
Total Investments in Securities: | $ 476,974,099 | $ 287,481,960 | $ 189,492,139 | $ - |
The following is a summary of transfers between Level 1 and Level 2 for the period ended October 31, 2014. Transfers are assumed to have occurred at the beginning of the period, and are primarily attributable to the valuation techniques used for foreign equity securities, as discussed in the accompanying Notes to Financial Statements: |
Transfers | Total |
Level 1 to Level 2 | $ 84,213,412 |
Level 2 to Level 1 | $ 0 |
See accompanying notes which are an integral part of the financial statements.
Annual Report
Statement of Assets and Liabilities
| October 31, 2014 |
| | |
Assets | | |
Investment in securities, at value (including securities loaned of $6,007,153) - See accompanying schedule: Unaffiliated issuers (cost $407,965,969) | $ 461,131,720 | |
Fidelity Central Funds (cost $15,842,379) | 15,842,379 | |
Total Investments (cost $423,808,348) | | $ 476,974,099 |
Foreign currency held at value (cost $269) | | 269 |
Receivable for investments sold | | 3,743,122 |
Receivable for fund shares sold | | 343,036 |
Dividends receivable | | 608,964 |
Distributions receivable from Fidelity Central Funds | | 3,396 |
Prepaid expenses | | 1,137 |
Other receivables | | 27,328 |
Total assets | | 481,701,351 |
| | |
Liabilities | | |
Payable for investments purchased | $ 1,618,764 | |
Payable for fund shares redeemed | 475,480 | |
Accrued management fee | 303,024 | |
Distribution and service plan fees payable | 108,098 | |
Other affiliated payables | 122,013 | |
Other payables and accrued expenses | 739,901 | |
Collateral on securities loaned, at value | 6,178,349 | |
Total liabilities | | 9,545,629 |
| | |
Net Assets | | $ 472,155,722 |
Net Assets consist of: | | |
Paid in capital | | $ 467,770,539 |
Undistributed net investment income | | 1,039,628 |
Accumulated undistributed net realized gain (loss) on investments and foreign currency transactions | | (49,234,244) |
Net unrealized appreciation (depreciation) on investments and assets and liabilities in foreign currencies | | 52,579,799 |
Net Assets | | $ 472,155,722 |
See accompanying notes which are an integral part of the financial statements.
Annual Report
Statement of Assets and Liabilities - continued
| October 31, 2014 |
| | |
Calculation of Maximum Offering Price Class A:
Net Asset Value and redemption price per share ($141,600,522 ÷ 6,055,753 shares) | | $ 23.38 |
| | |
Maximum offering price per share (100/94.25 of $23.38) | | $ 24.81 |
Class T:
Net Asset Value and redemption price per share ($54,340,913 ÷ 2,331,969 shares) | | $ 23.30 |
| | |
Maximum offering price per share (100/96.50 of $23.30) | | $ 24.15 |
Class B:
Net Asset Value and offering price per share ($7,545,548 ÷ 331,613 shares)A | | $ 22.75 |
| | |
Class C:
Net Asset Value and offering price per share ($64,025,961 ÷ 2,820,184 shares)A | | $ 22.70 |
| | |
Institutional Class:
Net Asset Value, offering price and redemption price per share ($199,098,363 ÷ 8,471,387 shares) | | $ 23.50 |
| | |
Class Z:
Net Asset Value, offering price and redemption price per share ($5,544,415 ÷ 235,887 shares) | | $ 23.50 |
A Redemption price per share is equal to net asset value less any applicable contingent deferred sales charge.
See accompanying notes which are an integral part of the financial statements.
Annual Report
Financial Statements - continued
Statement of Operations
| Year ended October 31, 2014 |
| | |
Investment Income | | |
Dividends | | $ 8,409,738 |
Interest | | 6 |
Income from Fidelity Central Funds | | 64,894 |
Income before foreign taxes withheld | | 8,474,638 |
Less foreign taxes withheld | | (755,643) |
Total income | | 7,718,995 |
| | |
Expenses | | |
Management fee | $ 3,460,066 | |
Transfer agent fees | 1,152,533 | |
Distribution and service plan fees | 1,315,927 | |
Accounting and security lending fees | 225,213 | |
Custodian fees and expenses | 327,370 | |
Independent trustees' compensation | 1,759 | |
Registration fees | 86,388 | |
Audit | 85,066 | |
Legal | 1,522 | |
Miscellaneous | 15,825 | |
Total expenses | | 6,671,669 |
Net investment income (loss) | | 1,047,326 |
Realized and Unrealized Gain (Loss) Net realized gain (loss) on: | | |
Investment securities: | | |
Unaffiliated issuers (net of foreign taxes of $45,790) | 3,803,938 | |
Foreign currency transactions | (306,431) | |
Total net realized gain (loss) | | 3,497,507 |
Change in net unrealized appreciation (depreciation) on: Investment securities (net of increase in deferred foreign taxes of $351,602) | 9,165,948 | |
Assets and liabilities in foreign currencies | 24,766 | |
Total change in net unrealized appreciation (depreciation) | | 9,190,714 |
Net gain (loss) | | 12,688,221 |
Net increase (decrease) in net assets resulting from operations | | $ 13,735,547 |
See accompanying notes which are an integral part of the financial statements.
Annual Report
Statement of Changes in Net Assets
| Year ended
October 31,
2014 | Year ended
October 31,
2013 |
Increase (Decrease) in Net Assets | | |
Operations | | |
Net investment income (loss) | $ 1,047,326 | $ 1,405,290 |
Net realized gain (loss) | 3,497,507 | 41,473,017 |
Change in net unrealized appreciation (depreciation) | 9,190,714 | 2,826,987 |
Net increase (decrease) in net assets resulting
from operations | 13,735,547 | 45,705,294 |
Distributions to shareholders from net investment income | (1,113,231) | (3,939,467) |
Distributions to shareholders from net realized gain | (185,956) | - |
Total distributions | (1,299,187) | (3,939,467) |
Share transactions - net increase (decrease) | 32,907,367 | (61,785,803) |
Redemption fees | 31,634 | 43,406 |
Total increase (decrease) in net assets | 45,375,361 | (19,976,570) |
| | |
Net Assets | | |
Beginning of period | 426,780,361 | 446,756,931 |
End of period (including undistributed net investment income of $1,039,628 and undistributed net investment income of $1,116,713, respectively) | $ 472,155,722 | $ 426,780,361 |
See accompanying notes which are an integral part of the financial statements.
Annual Report
Financial Highlights - Class A
Years ended October 31, | 2014 | 2013 | 2012 | 2011 | 2010 |
Selected Per-Share Data | | | | | |
Net asset value, beginning of period | $ 22.62 | $ 20.51 | $ 20.50 | $ 23.71 | $ 19.20 |
Income from Investment Operations | | | | | |
Net investment income (loss) C | .06 | .08 | .22 | .21 | .12 |
Net realized and unrealized gain (loss) | .76 | 2.23 | (.06) | (3.19) | 4.59 |
Total from investment operations | .82 | 2.31 | .16 | (2.98) | 4.71 |
Distributions from net investment income | (.05) | (.20) | (.15) | (.11) | (.07) |
Distributions from net realized gain | (.01) | - | - | (.13) | (.13) |
Total distributions | (.06) | (.20) | (.15) | (.24) | (.20) |
Redemption fees added to paid in capital C | - G | - G | - G | .01 | - G |
Net asset value, end of period | $ 23.38 | $ 22.62 | $ 20.51 | $ 20.50 | $ 23.71 |
Total ReturnA, B | 3.65% | 11.34% | .80% | (12.69)% | 24.69% |
Ratios to Average Net Assets D, F | | | | | |
Expenses before reductions | 1.52% | 1.56% | 1.54% | 1.54% | 1.56% |
Expenses net of fee waivers, if any | 1.52% | 1.55% | 1.54% | 1.54% | 1.56% |
Expenses net of all reductions | 1.52% | 1.50% | 1.48% | 1.47% | 1.50% |
Net investment income (loss) | .26% | .38% | 1.07% | .92% | .59% |
Supplemental Data | | | | | |
Net assets, end of period (000 omitted) | $ 141,601 | $ 146,378 | $ 160,464 | $ 202,477 | $ 286,970 |
Portfolio turnover rateE | 97% | 121% | 177% | 122% | 86% |
A Total returns would have been lower if certain expenses had not been reduced during the applicable periods shown.
B Total returns do not include the effect of the sales charges.
C Calculated based on average shares outstanding during the period.
D Fees and expenses of any underlying Fidelity Central Funds are not included in the Fund's expense ratio. The Fund indirectly bears its proportionate share of the expenses of any underlying Fidelity Central Funds.
E Amount does not include the portfolio activity of any underlying Fidelity Central Funds.
F Expense ratios reflect operating expenses of the class. Expenses before reductions do not reflect amounts reimbursed by the investment adviser or reductions from brokerage service arrangements or reductions from other expense offset arrangements and do not represent the amount paid by the class during periods when reimbursements or reductions occur. Expenses net of fee waivers reflect expenses after reimbursement by the investment adviser but prior to reductions from brokerage service arrangements or other expense offset arrangements. Expenses net of all reductions represent the net expenses paid by the class.
G Amount represents less than $.01 per share.
See accompanying notes which are an integral part of the financial statements.
Annual Report
Financial Highlights - Class T
Years ended October 31, | 2014 | 2013 | 2012 | 2011 | 2010 |
Selected Per-Share Data | | | | | |
Net asset value, beginning of period | $ 22.55 | $ 20.44 | $ 20.43 | $ 23.61 | $ 19.14 |
Income from Investment Operations | | | | | |
Net investment income (loss) C | - | .03 | .16 | .15 | .07 |
Net realized and unrealized gain (loss) | .76 | 2.22 | (.06) | (3.18) | 4.57 |
Total from investment operations | .76 | 2.25 | .10 | (3.03) | 4.64 |
Distributions from net investment income | - G | (.14) | (.09) | (.04) | (.04) |
Distributions from net realized gain | (.01) | - | - | (.13) | (.13) |
Total distributions | (.01) | (.14) | (.09) | (.16) H | (.17) |
Redemption fees added to paid in capital C | - G | - G | - G | .01 | - G |
Net asset value, end of period | $ 23.30 | $ 22.55 | $ 20.44 | $ 20.43 | $ 23.61 |
Total ReturnA, B | 3.39% | 11.06% | .49% | (12.89)% | 24.38% |
Ratios to Average Net Assets D, F | | | | | |
Expenses before reductions | 1.78% | 1.81% | 1.80% | 1.79% | 1.81% |
Expenses net of fee waivers, if any | 1.78% | 1.81% | 1.80% | 1.79% | 1.81% |
Expenses net of all reductions | 1.78% | 1.76% | 1.73% | 1.73% | 1.76% |
Net investment income (loss) | -% I | .13% | .81% | .66% | .33% |
Supplemental Data | | | | | |
Net assets, end of period (000 omitted) | $ 54,341 | $ 55,797 | $ 58,919 | $ 73,146 | $ 104,417 |
Portfolio turnover rateE | 97% | 121% | 177% | 122% | 86% |
A Total returns would have been lower if certain expenses had not been reduced during the applicable periods shown.
B Total returns do not include the effect of the sales charges.
C Calculated based on average shares outstanding during the period.
D Fees and expenses of any underlying Fidelity Central Funds are not included in the Fund's expense ratio. The Fund indirectly bears its proportionate share of the expenses of any underlying Fidelity Central Funds.
E Amount does not include the portfolio activity of any underlying Fidelity Central Funds.
F Expense ratios reflect operating expenses of the class. Expenses before reductions do not reflect amounts reimbursed by the investment adviser or reductions from brokerage service arrangements or reductions from other expense offset arrangements and do not represent the amount paid by the class during periods when reimbursements or reductions occur. Expenses net of fee waivers reflect expenses after reimbursement by the investment adviser but prior to reductions from brokerage service arrangements or other expense offset arrangements. Expenses net of all reductions represent the net expenses paid by the class.
G Amount represents less than $.01 per share.
H Total distributions of $.16 per share is comprised of distributions from net investment income of $.037 and distributions from net realized gain of $.125 per share.
I Amount represents less than .01%.
See accompanying notes which are an integral part of the financial statements.
Annual Report
Financial Highlights - Class B
Years ended October 31, | 2014 | 2013 | 2012 | 2011 | 2010 |
Selected Per-Share Data | | | | | |
Net asset value, beginning of period | $ 22.11 | $ 20.03 | $ 20.03 | $ 23.14 | $ 18.80 |
Income from Investment Operations | | | | | |
Net investment income (loss) C | (.11) | (.08) | .06 | .04 | (.03) |
Net realized and unrealized gain (loss) | .75 | 2.18 | (.06) | (3.13) | 4.49 |
Total from investment operations | .64 | 2.10 | - | (3.09) | 4.46 |
Distributions from net investment income | - | (.02) | - | (.01) | - |
Distributions from net realized gain | - | - | - | (.03) | (.12) |
Total distributions | - | (.02) | - | (.03) H | (.12) |
Redemption fees added to paid in capital C | - G | - G | - G | .01 | - G |
Net asset value, end of period | $ 22.75 | $ 22.11 | $ 20.03 | $ 20.03 | $ 23.14 |
Total ReturnA, B | 2.89% | 10.50% | -% | (13.33)% | 23.77% |
Ratios to Average Net Assets D, F | | | | | |
Expenses before reductions | 2.28% | 2.31% | 2.29% | 2.29% | 2.32% |
Expenses net of fee waivers, if any | 2.28% | 2.31% | 2.29% | 2.29% | 2.32% |
Expenses net of all reductions | 2.28% | 2.26% | 2.23% | 2.22% | 2.26% |
Net investment income (loss) | (.49)% | (.37)% | .32% | .16% | (.17)% |
Supplemental Data | | | | | |
Net assets, end of period (000 omitted) | $ 7,546 | $ 11,391 | $ 15,994 | $ 21,304 | $ 31,159 |
Portfolio turnover rateE | 97% | 121% | 177% | 122% | 86% |
A Total returns would have been lower if certain expenses had not been reduced during the applicable periods shown.
B Total returns do not include the effect of the contingent deferred sales charge.
C Calculated based on average shares outstanding during the period.
D Fees and expenses of any underlying Fidelity Central Funds are not included in the Fund's expense ratio. The Fund indirectly bears its proportionate share of the expenses of any underlying Fidelity Central Funds.
E Amount does not include the portfolio activity of any underlying Fidelity Central Funds.
F Expense ratios reflect operating expenses of the class. Expenses before reductions do not reflect amounts reimbursed by the investment adviser or reductions from brokerage service arrangements or reductions from other expense offset arrangements and do not represent the amount paid by the class during periods when reimbursements or reductions occur. Expenses net of fee waivers reflect expenses after reimbursement by the investment adviser but prior to reductions from brokerage service arrangements or other expense offset arrangements. Expenses net of all reductions represent the net expenses paid by the class.
G Amount represents less than $.01 per share.
H Total distributions of $.03 per share is comprised of distributions from net investment income of $.005 and distributions from net realized gain of $.025 per share.
See accompanying notes which are an integral part of the financial statements.
Annual Report
Financial Highlights - Class C
Years ended October 31, | 2014 | 2013 | 2012 | 2011 | 2010 |
Selected Per-Share Data | | | | | |
Net asset value, beginning of period | $ 22.06 | $ 20.00 | $ 20.00 | $ 23.13 | $ 18.80 |
Income from Investment Operations | | | | | |
Net investment income (loss) C | (.11) | (.08) | .06 | .04 | (.03) |
Net realized and unrealized gain (loss) | .75 | 2.18 | (.06) | (3.12) | 4.49 |
Total from investment operations | .64 | 2.10 | - | (3.08) | 4.46 |
Distributions from net investment income | - | (.04) | - | (.01) | - |
Distributions from net realized gain | - | - | - | (.05) | (.13) |
Total distributions | - | (.04) | - | (.06) | (.13) |
Redemption fees added to paid in capital C | - G | - G | - G | .01 | - G |
Net asset value, end of period | $ 22.70 | $ 22.06 | $ 20.00 | $ 20.00 | $ 23.13 |
Total ReturnA, B | 2.90% | 10.49% | -% | (13.33)% | 23.80% |
Ratios to Average Net Assets D, F | | | | | |
Expenses before reductions | 2.27% | 2.31% | 2.29% | 2.28% | 2.30% |
Expenses net of fee waivers, if any | 2.27% | 2.30% | 2.29% | 2.28% | 2.30% |
Expenses net of all reductions | 2.27% | 2.25% | 2.23% | 2.22% | 2.24% |
Net investment income (loss) | (.49)% | (.37)% | .32% | .17% | (.15)% |
Supplemental Data | | | | | |
Net assets, end of period (000 omitted) | $ 64,026 | $ 62,532 | $ 65,598 | $ 80,855 | $ 106,711 |
Portfolio turnover rateE | 97% | 121% | 177% | 122% | 86% |
A Total returns would have been lower if certain expenses had not been reduced during the applicable periods shown.
B Total returns do not include the effect of the contingent deferred sales charge.
C Calculated based on average shares outstanding during the period.
D Fees and expenses of any underlying Fidelity Central Funds are not included in the Fund's expense ratio. The Fund indirectly bears its proportionate share of the expenses of any underlying Fidelity Central Funds.
E Amount does not include the portfolio activity of any underlying Fidelity Central Funds.
F Expense ratios reflect operating expenses of the class. Expenses before reductions do not reflect amounts reimbursed by the investment adviser or reductions from brokerage service arrangements or reductions from other expense offset arrangements and do not represent the amount paid by the class during periods when reimbursements or reductions occur. Expenses net of fee waivers reflect expenses after reimbursement by the investment adviser but prior to reductions from brokerage service arrangements or other expense offset arrangements. Expenses net of all reductions represent the net expenses paid by the class.
G Amount represents less than $.01 per share.
See accompanying notes which are an integral part of the financial statements.
Annual Report
Financial Highlights - Institutional Class
Years ended October 31, | 2014 | 2013 | 2012 | 2011 | 2010 |
Selected Per-Share Data | | | | | |
Net asset value, beginning of period | $ 22.73 | $ 20.61 | $ 20.63 | $ 23.87 | $ 19.29 |
Income from Investment Operations | | | | | |
Net investment income (loss) B | .14 | .15 | .28 | .29 | .20 |
Net realized and unrealized gain (loss) | .76 | 2.25 | (.06) | (3.21) | 4.62 |
Total from investment operations | .90 | 2.40 | .22 | (2.92) | 4.82 |
Distributions from net investment income | (.12) | (.28) | (.24) | (.20) | (.11) |
Distributions from net realized gain | (.01) | - | - | (.13) | (.13) |
Total distributions | (.13) | (.28) | (.24) | (.33) | (.24) |
Redemption fees added to paid in capital B | - F | - F | - F | .01 | - F |
Net asset value, end of period | $ 23.50 | $ 22.73 | $ 20.61 | $ 20.63 | $ 23.87 |
Total ReturnA | 4.00% | 11.73% | 1.08% | (12.41)% | 25.15% |
Ratios to Average Net Assets C, E | | | | | |
Expenses before reductions | 1.18% | 1.23% | 1.22% | 1.21% | 1.22% |
Expenses net of fee waivers, if any | 1.18% | 1.22% | 1.22% | 1.21% | 1.22% |
Expenses net of all reductions | 1.18% | 1.18% | 1.16% | 1.14% | 1.17% |
Net investment income (loss) | .60% | .71% | 1.39% | 1.25% | .93% |
Supplemental Data | | | | | |
Net assets, end of period (000 omitted) | $ 199,098 | $ 150,576 | $ 145,782 | $ 138,312 | $ 184,789 |
Portfolio turnover rateD | 97% | 121% | 177% | 122% | 86% |
A Total returns would have been lower if certain expenses had not been reduced during the applicable periods shown.
B Calculated based on average shares outstanding during the period.
C Fees and expenses of any underlying Fidelity Central Funds are not included in the Fund's expense ratio. The Fund indirectly bears its proportionate share of the expenses of any underlying Fidelity Central Funds.
D Amount does not include the portfolio activity of any underlying Fidelity Central Funds.
E Expense ratios reflect operating expenses of the class. Expenses before reductions do not reflect amounts reimbursed by the investment adviser or reductions from brokerage service arrangements or reductions from other expense offset arrangements and do not represent the amount paid by the class during periods when reimbursements or reductions occur. Expenses net of fee waivers reflect expenses after reimbursement by the investment adviser but prior to reductions from brokerage service arrangements or other expense offset arrangements. Expenses net of all reductions represent the net expenses paid by the class.
F Amount represents less than $.01 per share.
See accompanying notes which are an integral part of the financial statements.
Annual Report
Financial Highlights - Class Z
Years ended October 31, | 2014 | 2013 G |
Selected Per-Share Data | | |
Net asset value, beginning of period | $ 22.73 | $ 21.33 |
Income from Investment Operations | | |
Net investment income (loss) D | .18 | .03 |
Net realized and unrealized gain (loss) | .76 | 1.37 |
Total from investment operations | .94 | 1.40 |
Distributions from net investment income | (.16) | - |
Distributions from net realized gain | (.01) | - |
Total distributions | (.17) | - |
Redemption fees added to paid in capital D, I | - | - |
Net asset value, end of period | $ 23.50 | $ 22.73 |
Total ReturnB, C | 4.19% | 6.56% |
Ratios to Average Net Assets E, H | | |
Expenses before reductions | 1.02% | 1.05%A |
Expenses net of fee waivers, if any | 1.02% | 1.05%A |
Expenses net of all reductions | 1.02% | 1.00%A |
Net investment income (loss) | .77% | .62%A |
Supplemental Data | | |
Net assets, end of period (000 omitted) | $ 5,544 | $ 107 |
Portfolio turnover rateF | 97% | 121% |
A Annualized
B Total returns for periods of less than one year are not annualized.
C Total returns would have been lower if certain expenses had not been reduced during the applicable periods shown.
D Calculated based on average shares outstanding during the period.
E Fees and expenses of any underlying Fidelity Central Funds are not included in the Fund's expense ratio. The Fund indirectly bears its proportionate share of the expenses of any underlying Fidelity Central Funds.
F Amount does not include the portfolio activity of any underlying Fidelity Central Funds.
G For the period August 13, 2013 (commencement of sale of shares) to October 31, 2013.
H Expense ratios reflect operating expenses of the class. Expenses before reductions do not reflect amounts reimbursed by the investment adviser or reductions from brokerage service arrangements or reductions from other expense offset arrangements and do not represent the amount paid by the class during periods when reimbursements or reductions occur. Expense ratios before reductions for start-up periods may not be representative of longer-term operating periods. Expenses net of fee waivers reflect expenses after reimbursement by the investment adviser but prior to reductions from brokerage service arrangements or other expense offset arrangements. Expenses net of all reductions represent the net expenses paid by the class.
I Amount represents less than $.01 per share.
See accompanying notes which are an integral part of the financial statements.
Annual Report
Notes to Financial Statements
For the period ended October 31, 2014
1. Organization.
Fidelity Advisor Emerging Markets Fund (the Fund) is a fund of Fidelity Advisor Series VIII (the Trust) and is authorized to issue an unlimited number of shares. The Trust is registered under the Investment Company Act of 1940, as amended (the 1940 Act), as an open-end management investment company organized as a Massachusetts business trust. The Fund offers Class A, Class T, Class C, Institutional Class and Class Z shares, each of which, along with Class B shares, has equal rights as to assets and voting privileges. Class B shares are closed to new accounts and additional purchases, except for exchanges and reinvestments. Each class has exclusive voting rights with respect to matters that affect that class. Class B shares will automatically convert to Class A shares after a holding period of seven years from the initial date of purchase. The Fund's investments in emerging markets can be subject to social, economic, regulatory, and political uncertainties and can be extremely volatile.
2. Investments in Fidelity Central Funds.
The Fund invests in Fidelity Central Funds, which are open-end investment companies generally available only to other investment companies and accounts managed by the investment adviser and its affiliates. The Fund's Schedule of Investments lists each of the Fidelity Central Funds held as of period end, if any, as an investment of the Fund, but does not include the underlying holdings of each Fidelity Central Fund. As an Investing Fund, the Fund indirectly bears its proportionate share of the expenses of the underlying Fidelity Central Funds.
The Money Market Central Funds seek preservation of capital and current income and are managed by Fidelity Investments Money Management, Inc. (FIMM), an affiliate of the investment adviser. Annualized expenses of the Money Market Central Funds as of their most recent shareholder report date are less than .01%.
A complete unaudited list of holdings for each Fidelity Central Fund is available upon request or at the Securities and Exchange Commission (the SEC) website at www.sec.gov. In addition, the financial statements of the Fidelity Central Funds, which are not covered by the Fund's Report of Independent Registered Public Accounting Firm, are available on the SEC website or upon request.
3. Significant Accounting Policies.
The financial statements have been prepared in conformity with accounting principles generally accepted in the United States of America (GAAP), which require management to make certain estimates and assumptions at the date of the financial statements. Actual results could differ from those estimates. Subsequent events, if any, through the date that the financial statements were issued have been evaluated in the preparation of
Annual Report
3. Significant Accounting Policies - continued
the financial statements. The following summarizes the significant accounting policies of the Fund:
Investment Valuation. Investments are valued as of 4:00 p.m. Eastern time on the last calendar day of the period. In accordance with valuation policies and procedures approved by the Board of Trustees (the Board), the Fund attempts to obtain prices from one or more third party pricing vendors or brokers to value its investments. When current market prices, quotations or currency exchange rates are not readily available or reliable, investments will be fair valued in good faith by the Fidelity Management & Research Company (FMR)Fair Value Committee (the Committee), in accordance with procedures adopted by the Board. Factors used in determining fair value vary by investment type and may include market or investment specific events. The frequency with which these procedures are used cannot be predicted and they may be utilized to a significant extent. The Committee oversees the Fund's valuation policies and procedures and is responsible for approving and reporting to the Board all fair value determinations.
The Fund categorizes the inputs to valuation techniques used to value its investments into a disclosure hierarchy consisting of three levels as shown below:
Level 1 - quoted prices in active markets for identical investments
Level 2 - other significant observable inputs (including quoted prices for similar investments, interest rates, prepayment speeds, etc.)
Level 3 - unobservable inputs (including the Fund's own assumptions based on the best information available)
Valuation techniques used to value the Fund's investments by major category are as follows:
Equity securities, including restricted securities, for which market quotations are readily available, are valued at the last reported sale price or official closing price as reported by a third party pricing vendor on the primary market or exchange on which they are traded and are categorized as Level 1 in the hierarchy. In the event there were no sales during the day or closing prices are not available, securities are valued at the last quoted bid price or may be valued using the last available price and are generally categorized as Level 2 in the hierarchy. For foreign equity securities, when market or security specific events arise, comparisons to the valuation of American Depositary Receipts (ADRs), futures contracts, Exchange-Traded Funds (ETFs) and certain indexes as well as quoted prices for similar securities may be used and would be categorized as Level 2 in the hierarchy. Utilizing these techniques may result in transfers between Level 1 and Level 2. For equity securities, including restricted securities, where observable inputs are
Annual Report
Notes to Financial Statements - continued
3. Significant Accounting Policies - continued
Investment Valuation - continued
limited, assumptions about market activity and risk are used and these securities may be categorized as Level 3 in the hierarchy.
Investments in open-end mutual funds, including the Fidelity Central Funds, are valued at their closing net asset value (NAV) each business day and are categorized as Level 1 in the hierarchy.
Changes in valuation techniques may result in transfers in or out of an assigned level within the disclosure hierarchy. The aggregate value of investments by input level, as of October 31, 2014, including information on transfers between Levels 1 and 2, is included at the end of the Fund's Schedule of Investments.
Foreign Currency. The Fund may use foreign currency contracts to facilitate transactions in foreign-denominated securities. Gains and losses from these transactions may arise from changes in the value of the foreign currency or if the counterparties do not perform under the contracts' terms.
Foreign-denominated assets, including investment securities, and liabilities are translated into U.S. dollars at the exchange rates at period end. Purchases and sales of investment securities, income and dividends received and expenses denominated in foreign currencies are translated into U.S. dollars at the exchange rate in effect on the transaction date.
The effects of exchange rate fluctuations on investments are included with the net realized and unrealized gain (loss) on investment securities. Other foreign currency transactions resulting in realized and unrealized gain (loss) are disclosed separately.
Investment Transactions and Income. For financial reporting purposes, the Fund's investment holdings and NAV include trades executed through the end of the last business day of the period. The NAV per share for processing shareholder transactions is calculated as of the close of business of the New York Stock Exchange (NYSE), normally 4:00 p.m. Eastern time and includes trades executed through the end of the prior business day. Gains and losses on securities sold are determined on the basis of identified cost and may include proceeds received from litigation. Dividend income is recorded on the ex-dividend date, except for certain dividends from foreign securities where the ex-dividend date may have passed, which are recorded as soon as the Fund is informed of the ex-dividend date. Non-cash dividends included in dividend income, if any, are recorded at the fair market value of the securities received. Income and capital gain distributions from Fidelity Central Funds, if any, are recorded on the ex-dividend date. Interest income is accrued as earned and includes coupon interest and amortization of
Annual Report
3. Significant Accounting Policies - continued
Investment Transactions and Income - continued
premium and accretion of discount on debt securities as applicable. Investment income is recorded net of foreign taxes withheld where recovery of such taxes is uncertain.
Class Allocations and Expenses. Investment income, realized and unrealized capital gains and losses, common expenses of the Fund, and certain fund-level expense reductions, if any, are allocated daily on a pro-rata basis to each class based on the relative net assets of each class to the total net assets of the Fund. Each class differs with respect to transfer agent and distribution and service plan fees incurred. Certain expense reductions may also differ by class. For the reporting period, the allocated portion of income and expenses to each class as a percent of its average net assets may vary due to the timing of recording these transactions in relation to fluctuating net assets of the classes. Expenses directly attributable to a fund are charged to that fund. Expenses attributable to more than one fund are allocated among the respective funds on the basis of relative net assets or other appropriate methods. Expense estimates are accrued in the period to which they relate and adjustments are made when actual amounts are known.
Income Tax Information and Distributions to Shareholders. Each year, the Fund intends to qualify as a regulated investment company under Subchapter M of the Internal Revenue Code, including distributing substantially all of its taxable income and realized gains. As a result, no provision for U.S. Federal income taxes is required. As of October 31, 2014, the Fund did not have any unrecognized tax benefits in the financial statements; nor is the Fund aware of any tax positions for which it is reasonably possible that the total amounts of unrecognized tax benefits will significantly change in the next twelve months. The Fund files a U.S. federal tax return, in addition to state and local tax returns as required. The Fund's federal income tax returns are subject to examination by the Internal Revenue Service (IRS) for a period of three fiscal years after they are filed. State and local tax returns may be subject to examination for an additional fiscal year depending on the jurisdiction. Foreign taxes are provided for based on the Fund's understanding of the tax rules and rates that exist in the foreign markets in which it invests. The Fund is subject to a tax imposed on capital gains by certain countries in which it invests. An estimated deferred tax liability for net unrealized appreciation on the applicable securities is included in Other payables and accrued expenses on the Statement of Assets & Liabilities.
Distributions are declared and recorded on the ex-dividend date. Income dividends and capital gain distributions are declared separately for each class. Income and capital gain distributions are determined in accordance with income tax regulations, which may differ from GAAP.
Annual Report
Notes to Financial Statements - continued
3. Significant Accounting Policies - continued
Income Tax Information and Distributions to Shareholders - continued
Capital accounts within the financial statements are adjusted for permanent book-tax differences. These adjustments have no impact on net assets or the results of operations. Capital accounts are not adjusted for temporary book-tax differences which will reverse in a subsequent period.
Book-tax differences are primarily due to foreign currency transactions, certain foreign taxes, passive foreign investment companies (PFIC), capital loss carryforwards and losses deferred due to wash sales.
The federal tax cost of investment securities and unrealized appreciation (depreciation) as of period end were as follows:
Gross unrealized appreciation | $ 66,685,836 |
Gross unrealized depreciation | (15,307,195) |
Net unrealized appreciation (depreciation) on securities | $ 51,378,641 |
| |
Tax Cost | $ 425,595,458 |
The tax-based components of distributable earnings as of period end were as follows:
Undistributed ordinary income | $ 1,512,034 |
Capital loss carryforward | $ (47,911,843) |
Net unrealized appreciation (depreciation) on securities and other investments | $ 51,375,725 |
Capital loss carryforwards are only available to offset future capital gains of the Fund to the extent provided by regulations and may be limited. Under the Regulated Investment Company Modernization Act of 2010 (the Act), the Fund is permitted to carry forward capital losses incurred in taxable years beginning after December 22, 2010 for an unlimited period and such capital losses are required to be used prior to any losses that expire. The capital loss carryforward information presented below, including any applicable limitation, is estimated as of fiscal period end and is subject to adjustment.
Fiscal year of expiration | |
2017 | (47,911,843) |
The tax character of distributions paid was as follows:
| October 31, 2014 | October 31, 2014 |
Ordinary Income | $ 1,299,187 | $ 3,939,467 |
Annual Report
3. Significant Accounting Policies - continued
Short-Term Trading (Redemption) Fees. Shares held by investors in the Fund less than 90 days may have been subject to a redemption fee equal to 1.50% of the NAV of shares redeemed. All redemption fees, which reduce the proceeds of the shareholder redemption, are retained by the Fund and accounted for as an addition to paid in capital.
Restricted Securities. The Fund may invest in securities that are subject to legal or contractual restrictions on resale. These securities generally may be resold in transactions exempt from registration or to the public if the securities are registered. Disposal of these securities may involve time-consuming negotiations and expense, and prompt sale at an acceptable price may be difficult. Information regarding restricted securities is included at the end of the Fund's Schedule of Investments.
New Accounting Pronouncement. In June 2014, the Financial Accounting Standards Board issued Accounting Standard Update No. 2014-11, Repurchase-to-Maturity Transactions, Repurchase Financings, and Disclosures. The Update amends the accounting for certain repurchase agreements and expands disclosure requirements for reverse repurchase agreements, securities lending and other similar transactions. The disclosure requirements are effective for annual and interim reporting periods beginning after December 15, 2014. Management is currently evaluating the impact of the Update on the Fund's financial statements and related disclosures.
4. Purchases and Sales of Investments.
Purchases and sales of securities, other than short-term securities, aggregated $437,142,621 and $415,557,893, respectively.
5. Fees and Other Transactions with Affiliates.
Management Fee. Fidelity Management & Research Company (the investment adviser) and its affiliates provide the Fund with investment management related services for which the Fund pays a monthly management fee. The management fee is the sum of an individual fund fee rate that is based on an annual rate of .55% of the Fund's average net assets and an annualized group fee rate that averaged .25% during the period. The group fee rate is based upon the average net assets of all the mutual funds advised by the investment adviser, including any mutual funds previously advised by the investment adviser that are currently advised by Fidelity SelectCo, LLC, an affiliate of the investment adviser. The group fee rate decreases as assets under management increase and increases as assets under management decrease. For the reporting period, the total annual management fee rate was .80% of the Fund's average net assets.
Distribution and Service Plan Fees. In accordance with Rule 12b-1 of the 1940 Act, the Fund has adopted separate Distribution and Service Plans for each class of shares,
Annual Report
Notes to Financial Statements - continued
5. Fees and Other Transactions with Affiliates - continued
Distribution and Service Plan Fees - continued
except for the and Institutional Class. Certain classes pay Fidelity Distributors Corporation (FDC), an affiliate of the investment adviser, separate Distribution and Service Fees, each of which is based on an annual percentage of each class' average net assets. In addition, FDC may pay financial intermediaries for selling shares of the Fund and providing shareholder support services. For the period, the Distribution and Service Fee rates, total fees and amounts retained by FDC were as follows:
| Distribution
Fee | Service
Fee | Total Fees | Retained
by FDC |
Class A | -% | .25% | $ 350,341 | $ 5,200 |
Class T | .25% | .25% | 265,578 | 626 |
Class B | .75% | .25% | 92,016 | 69,179 |
Class C | .75% | .25% | 607,992 | 61,955 |
| | | $ 1,315,927 | $ 136,960 |
Sales Load. FDC may receive a front-end sales charge of up to 5.75% for selling Class A shares and 3.50% for selling Class T shares, some of which is paid to financial intermediaries for selling shares of the Fund. Depending on the holding period, FDC may receive contingent deferred sales charges levied on Class A, Class T, Class B, and Class C redemptions. The deferred sales charges range from 5.00% to 1.00% for Class B shares, 1.00% for Class C shares, 1.00% for certain purchases of Class A shares and .25% for certain purchases of Class T shares.
For the period, sales charge amounts retained by FDC were as follows:
| Retained
by FDC |
Class A | $ 64,103 |
Class T | 10,819 |
Class B* | 9,745 |
Class C* | 5,005 |
| $ 89,672 |
* When Class B and Class C shares are initially sold, FDC pays commissions from its own resources to financial intermediaries through which the sales are made.
Transfer Agent Fees. Fidelity Investments Institutional Operations Company, Inc., (FIIOC), an affiliate of the investment adviser, is the transfer, dividend disbursing and shareholder servicing agent for each class of the Fund. FIIOC receives account fees and asset-based fees that vary according to the account size and type of account of the shareholders of the respective classes of the Fund, except for Class Z. FIIOC receives an asset-based fee of Class Z's average net assets. FIIOC pays for typesetting, printing and mailing of shareholder reports, except proxy statements.
Annual Report
5. Fees and Other Transactions with Affiliates - continued
Transfer Agent Fees - continued
For the period, transfer agent fees for each class were as follows:
| Amount | % of
Class-Level Average
Net Assets |
Class A | $ 425,849 | .30 |
Class T | 164,544 | .31 |
Class B | 27,883 | .30 |
Class C | 184,802 | .30 |
Institutional Class | 348,372 | .21 |
Class Z | 1,083 | .05 |
| $ 1,152,533 | |
Accounting and Security Lending Fees. Fidelity Service Company, Inc. (FSC), an affiliate of the investment adviser, maintains the Fund's accounting records. The accounting fee is based on the level of average net assets for each month. Under a separate contract, FSC administers the security lending program. The security lending fee is based on the number and duration of lending transactions.
Brokerage Commissions. The Fund placed a portion of its portfolio transactions with brokerage firms which are affiliates of the investment adviser. Brokerage commissions are included in net realized gain (loss) and change in net unrealized appreciation (depreciation) in the Statement of Operations. The commissions paid to these affiliated firms were $1,690 for the period.
6. Committed Line of Credit.
The Fund participates with other funds managed by the investment adviser or an affiliate in a $4.25 billion credit facility (the "line of credit") to be utilized for temporary or emergency purposes to fund shareholder redemptions or for other short-term liquidity purposes. The Fund has agreed to pay commitment fees on its pro-rata portion of the line of credit, which amounted to $690 and is reflected in Miscellaneous expenses on the Statement of Operations. During the period, the Fund did not borrow on this line of credit.
7. Security Lending.
The Fund lends portfolio securities through a lending agent from time to time in order to earn additional income. For equity securities, a lending agent is used and may loan securities to certain qualified borrowers, including Fidelity Capital Markets (FCM), a
Annual Report
Notes to Financial Statements - continued
7. Security Lending - continued
broker-dealer affiliated with the Fund. On the settlement date of the loan, the Fund receives collateral (in the form of U.S. Treasury obligations, letters of credit and/or cash) against the loaned securities and maintains collateral in an amount not less than 100% of the market value of the loaned securities during the period of the loan. The market value of the loaned securities is determined at the close of business of the Fund and any additional required collateral is delivered to the Fund on the next business day. If the borrower defaults on its obligation to return the securities loaned because of insolvency or other reasons, the Fund may apply collateral received from the borrower against the obligation. The Fund may experience delays and costs in recovering the securities loaned. Any cash collateral received is invested in the Fidelity Securities Lending Cash Central Fund. The value of loaned securities and cash collateral at period end are disclosed on the Fund's Statement of Assets and Liabilities. Security lending income represents the income earned on investing cash collateral, less rebates paid to borrowers and any lending agent fees associated with the loan, plus any premium payments received for lending certain types of securities. Security lending income is presented in the Statement of Operations as a component of income from Fidelity Central Funds. Total security lending income during the period amounted to $60,169. During the period, there were no securities loaned to FCM.
8. Distributions to Shareholders.
Distributions to shareholders of each class were as follows:
Years ended October 31, | 2014 | 2013 |
From net investment income | | |
Class A | $ 314,541 | $ 1,535,570 |
Class T | 2,453 | 390,398 |
Class B | - | 16,014 |
Class C | - | 114,064 |
Institutional Class | 791,098 | 1,883,421 |
Class Z | 5,139 | - |
Total | $ 1,113,231 | $ 3,939,467 |
From net realized gain | | |
Class A | $ 77,030 | $ - |
Class T | 29,431 | - |
Institutional Class | 79,110 | - |
Class Z | 385 | - |
Total | $ 185,956 | $ - |
Annual Report
9. Share Transactions.
Share transactions for each class were as follows and may contain automatic conversions between classes or exchanges between funds:
| Shares | Dollars |
Years ended October 31, | 2014 | 2013A | 2014 | 2013A |
Class A | | | | |
Shares sold | 1,306,708 | 1,531,175 | $ 29,667,252 | $ 33,017,349 |
Reinvestment of distributions | 16,164 | 66,573 | 356,894 | 1,392,653 |
Shares redeemed | (1,739,459) | (2,949,139) | (38,968,004) | (63,054,707) |
Net increase (decrease) | (416,587) | (1,351,391) | $ (8,943,858) | $ (28,644,705) |
Class T | | | | |
Shares sold | 414,394 | 561,309 | $ 9,392,831 | $ 12,048,127 |
Reinvestment of distributions | 1,397 | 17,796 | 30,813 | 372,006 |
Shares redeemed | (558,505) | (986,849) | (12,438,338) | (20,912,996) |
Net increase (decrease) | (142,714) | (407,744) | $ (3,014,694) | $ (8,492,863) |
Class B | | | | |
Shares sold | 16,905 | 34,695 | $ 374,479 | $ 732,488 |
Reinvestment of distributions | - | 627 | - | 12,965 |
Shares redeemed | (200,427) | (318,597) | (4,400,967) | (6,698,614) |
Net increase (decrease) | (183,522) | (283,275) | $ (4,026,488) | $ (5,953,161) |
Class C | | | | |
Shares sold | 651,900 | 507,210 | $ 14,559,904 | $ 10,683,514 |
Reinvestment of distributions | - | 4,797 | - | 98,768 |
Shares redeemed | (666,053) | (957,148) | (14,339,508) | (19,925,235) |
Net increase (decrease) | (14,153) | (445,141) | $ 220,396 | $ (9,142,953) |
Institutional Class | | | | |
Shares sold | 2,772,401 | 1,298,034 | $ 64,467,777 | $ 27,937,972 |
Reinvestment of distributions | 36,756 | 84,781 | 813,035 | 1,776,730 |
Shares redeemed | (963,648) | (1,828,795) | (22,091,792) | (39,366,823) |
Net increase (decrease) | 1,845,509 | (445,980) | $ 43,189,020 | $ (9,652,121) |
Class Z | | | | |
Shares sold | 251,250 | 4,688 | $ 5,945,448 | $ 100,000 |
Reinvestment of distributions | 250 | - | 5,524 | - |
Shares redeemed | (20,301) | - | (467,981) | - |
Net increase (decrease) | 231,199 | 4,688 | $ 5,482,991 | $ 100,000 |
A Share transactions for Class Z are for the period August 31, 2013 (commencement of sale of shares) to October 31, 2013.
Annual Report
Notes to Financial Statements - continued
10. Other.
The Fund's organizational documents provide former and current trustees and officers with a limited indemnification against liabilities arising in connection with the performance of their duties to the Fund. In the normal course of business, the Fund may also enter into contracts that provide general indemnifications. The Fund's maximum exposure under these arrangements is unknown as this would be dependent on future claims that may be made against the Fund. The risk of material loss from such claims is considered remote.
Annual Report
To the Trustees of Fidelity Advisor Series VIII and Shareholders of Fidelity Advisor Emerging Markets Fund:
We have audited the accompanying statement of assets and liabilities of Fidelity Advisor Emerging Markets Fund (the Fund), a fund of Fidelity Advisor Series VIII, including the schedule of investments, as of October 31, 2014, and the related statement of operations for the year then ended, the statement of changes in net assets for each of the two years in the period then ended, and the financial highlights for each of the five years in the period then ended. These financial statements and financial highlights are the responsibility of the Fund's management. Our responsibility is to express an opinion on these financial statements and financial highlights based on our audits.
We conducted our audits in accordance with the standards of the Public Company Accounting Oversight Board (United States). Those standards require that we plan and perform the audit to obtain reasonable assurance about whether the financial statements and financial highlights are free of material misstatement. The Fund is not required to have, nor were we engaged to perform, an audit of its internal control over financial reporting. Our audits included consideration of internal control over financial reporting as a basis for designing audit procedures that are appropriate in the circumstances, but not for the purpose of expressing an opinion on the effectiveness of the Fund's internal control over financial reporting. Accordingly, we express no such opinion. An audit also includes examining, on a test basis, evidence supporting the amounts and disclosures in the financial statements, assessing the accounting principles used and significant estimates made by management, as well as evaluating the overall financial statement presentation. Our procedures included confirmation of securities owned as of October 31, 2014, by correspondence with the custodians and brokers; where replies were not received from brokers, we performed other auditing procedures. We believe that our audits provide a reasonable basis for our opinion.
In our opinion, the financial statements and financial highlights referred to above present fairly, in all material respects, the financial position of Fidelity Advisor Emerging Markets Fund as of October 31, 2014, the results of its operations for the year then ended, the changes in its net assets for each of the two years in the period then ended, and the financial highlights for each of the five years in the period then ended, in conformity with accounting principles generally accepted in the United States of America.
DELOITTE & TOUCHE LLP
Boston, Massachusetts
December 16, 2014
Annual Report
The Trustees, Member of the Advisory Board, and officers of the trust and fund, as applicable, are listed below. The Board of Trustees governs the fund and is responsible for protecting the interests of shareholders. The Trustees are experienced executives who meet periodically throughout the year to oversee the fund's activities, review contractual arrangements with companies that provide services to the fund, oversee management of the risks associated with such activities and contractual arrangements, and review the fund's performance. Except for James C. Curvey, each of the Trustees oversees 174 funds. Mr. Curvey oversees 407 funds.
The Trustees hold office without limit in time except that (a) any Trustee may resign; (b) any Trustee may be removed by written instrument, signed by at least two-thirds of the number of Trustees prior to such removal; (c) any Trustee who requests to be retired or who has become incapacitated by illness or injury may be retired by written instrument signed by a majority of the other Trustees; and (d) any Trustee may be removed at any special meeting of shareholders by a two-thirds vote of the outstanding voting securities of the trust. Each Trustee who is not an interested person (as defined in the 1940 Act) of the trust and the fund (Independent Trustee), shall retire not later than the last day of the calendar year in which his or her 75th birthday occurs. The Independent Trustees may waive this mandatory retirement age policy with respect to individual Trustees. The officers and Advisory Board Member hold office without limit in time, except that any officer and Advisory Board Member may resign or may be removed by a vote of a majority of the Trustees at any regular meeting or any special meeting of the Trustees. Except as indicated, each individual has held the office shown or other offices in the same company for the past five years.
Experience, Skills, Attributes, and Qualifications of the Fund's Trustees. The Governance and Nominating Committee has adopted a statement of policy that describes the experience, qualifications, attributes, and skills that are necessary and desirable for potential Independent Trustee candidates (Statement of Policy). The Board believes that each Trustee satisfied at the time he or she was initially elected or appointed a Trustee, and continues to satisfy, the standards contemplated by the Statement of Policy. The Governance and Nominating Committee also engages professional search firms to help identify potential Independent Trustee candidates who have the experience, qualifications, attributes, and skills consistent with the Statement of Policy. From time to time, additional criteria based on the composition and skills of the current Independent Trustees, as well as experience or skills that may be appropriate in light of future changes to board composition, business conditions, and regulatory or other developments, have also been considered by the professional search firms and the Governance and Nominating Committee. In addition, the Board takes into account the Trustees' commitment and participation in Board and committee meetings, as well as their leadership of standing and ad hoc committees throughout their tenure.
In determining that a particular Trustee was and continues to be qualified to serve as a Trustee, the Board has considered a variety of criteria, none of which, in isolation, was controlling. The Board believes that, collectively, the Trustees have balanced and diverse experience, qualifications, attributes, and skills, which allow the Board to operate effectively in governing the fund and protecting the interests of shareholders. Information about the specific experience, skills, attributes, and qualifications of each Trustee, which in each case led to the Board's conclusion that the Trustee should serve (or continue to serve) as a trustee of the fund, is provided below.
Annual Report
Trustees and Officers - continued
Board Structure and Oversight Function. James C. Curvey is an interested person (as defined in the 1940 Act) and currently serves as Chairman. The Trustees have determined that an interested Chairman is appropriate and benefits shareholders because an interested Chairman has a personal and professional stake in the quality and continuity of services provided to the fund. Independent Trustees exercise their informed business judgment to appoint an individual of their choosing to serve as Chairman, regardless of whether the Trustee happens to be independent or a member of management. The Independent Trustees have determined that they can act independently and effectively without having an Independent Trustee serve as Chairman and that a key structural component for assuring that they are in a position to do so is for the Independent Trustees to constitute a substantial majority for the Board. The Independent Trustees also regularly meet in executive session. Ned C. Lautenbach serves as Chairman of the Independent Trustees and as such (i) acts as a liaison between the Independent Trustees and management with respect to matters important to the Independent Trustees and (ii) with management prepares agendas for Board meetings.
Fidelity funds are overseen by different Boards of Trustees. The fund's Board oversees Fidelity's equity and high income funds and another Board oversees Fidelity's investment-grade bond, money market, and asset allocation funds. The asset allocation funds may invest in Fidelity funds overseen by the fund's Board. The use of separate Boards, each with its own committee structure, allows the Trustees of each group of Fidelity funds to focus on the unique issues of the funds they oversee, including common research, investment, and operational issues. On occasion, the separate Boards establish joint committees to address issues of overlapping consequences for the Fidelity funds overseen by each Board.
The Trustees operate using a system of committees to facilitate the timely and efficient consideration of all matters of importance to the Trustees, the fund, and fund shareholders and to facilitate compliance with legal and regulatory requirements and oversight of the fund's activities and associated risks. The Board, acting through its committees, has charged FMR and its affiliates with (i) identifying events or circumstances the occurrence of which could have demonstrably adverse effects on the fund's business and/or reputation; (ii) implementing processes and controls to lessen the possibility that such events or circumstances occur or to mitigate the effects of such events or circumstances if they do occur; and (iii) creating and maintaining a system designed to evaluate continuously business and market conditions in order to facilitate the identification and implementation processes described in (i) and (ii) above. Because the day-to-day operations and activities of the fund are carried out by or through FMR, its affiliates and other service providers, the fund's exposure to risks is mitigated but not eliminated by the processes overseen by the Trustees. While each of the Board's committees has responsibility for overseeing different aspects of the fund's activities, oversight is exercised primarily through the Operations, Audit, and Compliance Committees. In addition, the Independent Trustees have worked with FMR to enhance the Board's oversight of investment and financial risks, legal and regulatory risks, technology risks, and operational risks, including the development of additional risk reporting to the Board. For example, a working group comprised of Independent Trustees and FMR has worked and continues to work to review the Fidelity funds' valuation-related activities, reporting and risk management. Appropriate personnel, including but not limited to the fund's Chief Compliance Officer (CCO), FMR's internal auditor, the independent accountants, the fund's Treasurer and portfolio management personnel, make periodic reports to the Board's committees, as appropriate, including an annual review of FMR's risk management program for the Fidelity funds. The responsibilities of each standing committee, including their oversight responsibilities, are described further under "Standing Committees of the Fund's Trustees."
Annual Report
The fund's Statement of Additional Information (SAI) includes more information about the Trustees. To request a free copy, call Fidelity at 1-877-208-0098.
Interested Trustees*:
Correspondence intended for each Trustee who is an interested person may be sent to Fidelity Investments, 245 Summer Street, Boston, Massachusetts 02210.
Name, Year of Birth; Principal Occupations and Other Relevant Experience+ |
James C. Curvey (1935) |
Year of Election or Appointment: 2007 Trustee Chairman of the Board of Trustees |
| Mr. Curvey also serves as Trustee of other Fidelity funds. Mr. Curvey is a Director of Fidelity Research & Analysis Co. (2009-present), and Vice Chairman (2007-present) and Director of FMR LLC. In addition, Mr. Curvey serves as an Overseer for the Boston Symphony Orchestra and a member of the board of Artis-Naples, Naples, Florida, and as a Trustee for Brewster Academy, Wolfeboro, New Hampshire. Previously, Mr. Curvey served as a Director of Fidelity Investments Money Management, Inc. (2009-2014), a Director of FMR (2007-2014), and a Director of FMR Co., Inc. (2007-2014). |
Charles S. Morrison (1960) |
Year of Election or Appointment: 2014 Trustee |
| Mr. Morrison also serves as Trustee of other funds. He serves as a Director of Fidelity Investments Money Management, Inc. (FIMM) (2014-present), Director of Fidelity SelectCo, LLC (2014-present), President, Asset Management (2014-present), and is an employee of Fidelity Investments. Previously, Mr. Morrison served as Vice President of Fidelity's Fixed Income and Asset Allocation Funds (2012-2014), President, Fixed Income (2011-2014), Vice President of Fidelity's Money Market Funds (2005-2009), President, Money Market Group Leader of FMR (2009), and Senior Vice President, Money Market Group of FMR (2004-2009). Mr. Morrison also served as Vice President of Fidelity's Bond Funds (2002-2005), certain Balanced Funds (2002-2005), and certain Asset Allocation Funds (2002-2007), and as Senior Vice President (2002-2005) of Fidelity's Bond Division. |
* Trustees have been determined to be "Interested Trustees" by virtue of, among other things, their affiliation with the trust or various entities under common control with FMR.
+ The information above includes each Trustee's principal occupation during the last five years and other information relating to the experience, attributes, and skills relevant to each Trustee's qualifications to serve as a Trustee, which led to the conclusion that each Trustee should serve as a Trustee for the fund.
Annual Report
Independent Trustees:
Correspondence intended for each Independent Trustee (that is, the Trustees other than the Interested Trustees) may be sent to Fidelity Investments, P.O. Box 55235, Boston, Massachusetts 02205-5235.
Name, Year of Birth; Principal Occupations and Other Relevant Experience+ |
Dennis J. Dirks (1948) |
Year of Election or Appointment: 2005 Trustee |
| Mr. Dirks also serves as Trustee of other Fidelity funds. Prior to his retirement in May 2003, Mr. Dirks was Chief Operating Officer and a member of the Board of The Depository Trust & Clearing Corporation (DTCC). He also served as President, Chief Operating Officer, and Board member of The Depository Trust Company (DTC) and President and Board member of the National Securities Clearing Corporation (NSCC). In addition, Mr. Dirks served as Chief Executive Officer and Board member of the Government Securities Clearing Corporation, Chief Executive Officer and Board member of the Mortgage-Backed Securities Clearing Corporation, as a Trustee and a member of the Finance Committee of Manhattan College (2005-2008), and as a Trustee and a member of the Finance Committee of AHRC of Nassau County (2006-2008). Mr. Dirks is a member of the Independent Directors Council (IDC) Governing Council (2010-present) and Board of Directors for The Brookville Center for Children's Services, Inc. (2009-present). |
Alan J. Lacy (1953) |
Year of Election or Appointment: 2008 Trustee |
| Mr. Lacy also serves as Trustee of other Fidelity funds. Mr. Lacy serves as Senior Adviser (2007-present) of Oak Hill Capital Partners, L.P. (private equity). Mr. Lacy also served as Chief Executive Officer (2000-2005) and Vice Chairman (2005-2006) of Sears Holdings Corporation and Sears, Roebuck and Co. (retail). In addition, Mr. Lacy serves as a member of the Board of Directors of Dave & Buster's Entertainment, Inc. (restaurant and entertainment complexes, 2010-present), Earth Fare, Inc. (retail grocery, 2012-present), The Hillman Companies, Inc. (hardware wholesalers, 2010-present), and Bristol-Myers Squibb Company (global pharmaceuticals, 2008-present). Mr. Lacy is a member of the Board of Trustees of The National Parks Conservation Association (2006-present). Previously, Mr. Lacy served as Chairman of the Board of Trustees of the National Parks Conservation Association (2008-2011) and as a member of the Board of Directors for the Western Union Company (global money transfer, 2006-2011). |
Ned C. Lautenbach (1944) |
Year of Election or Appointment: 2000 Trustee Chairman of the Independent Trustees |
| Mr. Lautenbach also serves as Trustee of other Fidelity funds. Mr. Lautenbach currently serves as the Lead Director of the Eaton Corporation Board of Directors (diversified industrial, 1997-present). Mr. Lautenbach is Chairman of the Board of Directors of the Philharmonic Center for the Arts in Naples, Florida (2012-present) and a member of the Council on Foreign Relations (1994-present). Previously, Mr. Lautenbach was a Partner/Advisory Partner at Clayton, Dubilier & Rice, LLC (private equity investment, 1998-2010), as well as a Director of Sony Corporation (2006-2007). |
Joseph Mauriello (1944) |
Year of Election or Appointment: 2008 Trustee |
| Mr. Mauriello also serves as Trustee of other Fidelity funds. Prior to his retirement in January 2006, Mr. Mauriello served in numerous senior management positions including Deputy Chairman and Chief Operating Officer (2004-2005), and Vice Chairman of Financial Services (2002-2004) of KPMG LLP US (professional services, 1965-2005). Mr. Mauriello currently serves as a member of the Board of Directors of XL Group plc. (global insurance and re-insurance, 2006-present). Previously, Mr. Mauriello served as a Director of the Hamilton Funds of the Bank of New York (2006-2007) and of Arcadia Resources Inc. (health care services and products, 2007-2012). |
Robert W. Selander (1950) |
Year of Election or Appointment: 2011 Trustee |
| Mr. Selander also serves as Trustee of other Fidelity funds. Previously, Mr. Selander served as a Member of the Advisory Board of other Fidelity funds (2011), and Executive Vice Chairman (2010), Chief Executive Officer (2009-2010), and President and Chief Executive Officer (1997-2009) of Mastercard, Inc. |
Cornelia M. Small (1944) |
Year of Election or Appointment: 2005 Trustee |
| Ms. Small also serves as Trustee of other Fidelity funds. Ms. Small is a member of the Board of Directors (2009-present) and Chair of the Investment Committee (2010-present) of the Teagle Foundation. Ms. Small also serves on the Investment Committee of the Berkshire Taconic Community Foundation (2008-present). Previously, Ms. Small served as Chairperson (2002-2008) and a member of the Investment Committee and Chairperson (2008-2012) and a member of the Board of Trustees of Smith College. In addition, Ms. Small served as Chief Investment Officer, Director of Global Equity Investments, and a member of the Board of Directors of Scudder, Stevens & Clark and Scudder Kemper Investments. |
William S. Stavropoulos (1939) |
Year of Election or Appointment: 2001 Trustee Vice Chairman of the Independent Trustees |
| Mr. Stavropoulos also serves as Trustee of other Fidelity funds. Mr. Stavropoulos serves as President and Founder of the Michigan Baseball Foundation, the Great Lakes Loons (2007-present). Mr. Stavropoulos is Chairman Emeritus of the Board of Directors of The Dow Chemical Company, where he previously served in numerous senior management positions, including President, CEO (1995-2000; 2002-2004), Chairman of the Executive Committee (2000-2006), and as a member of the Board of Directors (1990-2006). Currently, Mr. Stavropoulos is Chairman of the Board of Directors of Univar Inc. (global distributor of commodity and specialty chemicals), a Director of Teradata Corporation (data warehousing and technology solutions), and Maersk Inc. (industrial conglomerate), and a member of the Advisory Board for Metalmark Capital LLC (private equity investment, 2005-present). Mr. Stavropoulos is an operating advisor to Clayton, Dubilier & Rice, LLC (private equity investment). In addition, Mr. Stavropoulos is a member of the University of Notre Dame Advisory Council for the College of Science, a Trustee of the Rollin L. Gerstacker Foundation, and a Director of the Naples Philharmonic Center for the Arts. Previously, Mr. Stavropoulos served as a Director of Chemical Financial Corporation (bank holding company, 1993-2012) and Tyco International, Ltd. (multinational manufacturing and services, 2007-2012). |
David M. Thomas (1949) |
Year of Election or Appointment: 2008 Trustee |
| Mr. Thomas also serves as Trustee of other Fidelity funds. Mr. Thomas serves as Non-Executive Chairman of the Board of Directors of Fortune Brands Home and Security (home and security products, 2011-present), and as a member of the Board of Directors of Interpublic Group of Companies, Inc. (marketing communication, 2004-present). Previously, Mr. Thomas served as Executive Chairman (2005-2006) and Chairman and Chief Executive Officer (2000-2005) of IMS Health, Inc. (pharmaceutical and healthcare information solutions), and a Director of Fortune Brands, Inc. (consumer products, 2000-2011). |
+ The information above includes each Trustee's principal occupation during the last five years and other information relating to the experience, attributes, and skills relevant to each Trustee's qualifications to serve as a Trustee, which led to the conclusion that each Trustee should serve as a Trustee for the fund.
Advisory Board Member and Officers:
Correspondence intended for each officer and Peter S. Lynch may be sent to Fidelity Investments, 245 Summer Street, Boston, Massachusetts 02210. Officers appear below in alphabetical order.
Name, Year of Birth; Principal Occupation |
Peter S. Lynch (1944) |
Year of Election or Appointment: 2003 Member of the Advisory Board |
| Mr. Lynch also serves as Member of the Advisory Board of other Fidelity funds. Mr. Lynch is Vice Chairman and a Director of FMR and FMR Co., Inc. In addition, Mr. Lynch serves as a Trustee of Boston College and as the Chairman of the Inner-City Scholarship Fund. Previously, Mr. Lynch served on the Special Olympics International Board of Directors (1997-2006). |
Elizabeth Paige Baumann (1968) |
Year of Election or Appointment: 2012 Anti-Money Laundering (AML) Officer |
| Ms. Baumann also serves as AML Officer of other funds. She is Chief AML Officer of FMR LLC (2012-present) and is an employee of Fidelity Investments. Previously, Ms. Baumann served as Vice President and Deputy Anti-Money Laundering Officer (2007-2012). |
William C. Coffey (1969) |
Year of Election or Appointment: 2009 Assistant Secretary |
| Mr. Coffey also serves as Assistant Secretary of other funds. He is Senior Vice President and Deputy General Counsel of FMR LLC (2010-present), and is an employee of Fidelity Investments. Previously, Mr. Coffey served as Vice President and Associate General Counsel of FMR LLC (2005-2009). |
Timothy M. Cohen (1969) |
Year of Election or Appointment: 2014 Vice President of certain Equity Funds |
| Mr. Cohen also serves as Vice President of other funds. Mr. Cohen serves as a Director and Chief Compliance Officer of Fidelity Management & Research (U.K.) Inc. (2013-present) and is an employee of Fidelity Investments. |
Jonathan Davis (1968) |
Year of Election or Appointment: 2010 Assistant Treasurer |
| Mr. Davis also serves as Assistant Treasurer of other funds. Mr. Davis is an employee of Fidelity Investments. Previously, Mr. Davis served as Vice President and Associate General Counsel of FMR LLC (2003-2010). |
Adrien E. Deberghes (1967) |
Year of Election or Appointment: 2008 Deputy Treasurer |
| Mr. Deberghes also serves as an officer of other funds. He is an employee of Fidelity Investments (2008-present). Prior to joining Fidelity Investments, Mr. Deberghes was Senior Vice President of Mutual Fund Administration at State Street Corporation (2007-2008), Senior Director of Mutual Fund Administration at Investors Bank & Trust (2005-2007), and Director of Finance for Dunkin' Brands (2000-2005). |
Stephanie J. Dorsey (1969) |
Year of Election or Appointment: 2010 Assistant Treasurer |
| Ms. Dorsey also serves as an officer of other funds. She is an employee of Fidelity Investments (2008-present) and has served in other fund officer roles. Prior to joining Fidelity Investments, Ms. Dorsey served as Treasurer (2004-2008) of the JPMorgan Mutual Funds and Vice President (2004-2008) of JPMorgan Chase Bank. |
Howard J. Galligan III (1966) |
Year of Election or Appointment: 2014 Chief Financial Officer |
| Mr. Galligan also serves as Chief Financial Officer of other funds. Mr. Galligan serves as President of Fidelity Pricing and Cash Management Services (FPCMS) (2014-present) and as a Director of Strategic Advisers, Inc. (2008-present). Previously, Mr. Galligan served as Chief Administrative Officer of Asset Management (2011-2014) and Chief Operating Officer and Senior Vice President of Investment Support for Strategic Advisers, Inc. (2003-2011). |
Scott C. Goebel (1968) |
Year of Election or Appointment: 2008 Secretary and Chief Legal Officer (CLO) |
| Mr. Goebel serves as Secretary and CLO of other funds. Mr. Goebel also serves as Secretary of Fidelity SelectCo, LLC (2013-present), Fidelity Investments Money Management, Inc. (FIMM) (2010-present) and Fidelity Research and Analysis Company (FRAC) (2010-present); General Counsel, Secretary, and Senior Vice President of FMR (2008-present) and FMR Co., Inc. (2008-present); Chief Legal Officer of Fidelity Management & Research (Hong Kong) Limited (2008-present); and Assistant Secretary of Fidelity Management & Research (Japan) Limited (2008-present) and Fidelity Management & Research (U.K.) Inc. (2008-present). Previously, Mr. Goebel served as Secretary and CLO of other Fidelity funds (2008-2013), Assistant Secretary of FIMM (2008-2010), FRAC (2008-2010), and certain funds (2007-2008); and as Vice President and Secretary of Fidelity Distributors Corporation (FDC) (2005-2007). Mr. Goebel has been employed by FMR LLC or an affiliate since 2001. |
Brian B. Hogan (1964) |
Year of Election or Appointment: 2009 Vice President |
| Mr. Hogan also serves as Trustee or Vice President of other funds. Mr. Hogan serves as a Director of Fidelity SelectCo, LLC (2014-present) and President of FMR's Equity Division (2009-present). Previously, Mr. Hogan served as Senior Vice President, Equity Research of FMR (2006-2009) and as a portfolio manager. |
Chris Maher (1972) |
Year of Election or Appointment: 2013 Assistant Treasurer |
| Mr. Maher serves as Assistant Treasurer of other funds. Mr. Maher is Vice President of Valuation Oversight and is an employee of Fidelity Investments. Previously, Mr. Maher served as Vice President of Asset Management Compliance (2013), Vice President of FMR's Program Management Group (2010-2013), and Vice President of Valuation Oversight (2008-2010). |
Kenneth B. Robins (1969) |
Year of Election or Appointment: 2008 President and Treasurer |
| Mr. Robins also serves as an officer of other funds. Mr. Robins serves as Executive Vice President of Fidelity Investments Money Management, Inc. (FIMM) (2013-present) and is an employee of Fidelity Investments (2004-present). Previously, Mr. Robins served in other fund officer roles. |
Stephen Sadoski (1971) |
Year of Election or Appointment: 2012 Deputy Treasurer |
| Mr. Sadoski also serves as Deputy Treasurer of other funds. He is an employee of Fidelity Investments (2012-present) and has served in another fund officer role. Prior to joining Fidelity Investments, Mr. Sadoski served as an assistant chief accountant in the Division of Investment Management of the Securities and Exchange Commission (SEC) (2009-2012) and as a senior manager at Deloitte & Touche LLP (1997-2009). |
Stacie M. Smith (1974) |
Year of Election or Appointment: 2013 Deputy Treasurer |
| Ms. Smith also serves as an officer of other funds. She is an employee of Fidelity Investments (2009-present) and has served in other fund officer roles. Prior to joining Fidelity Investments, Ms. Smith served as Senior Audit Manager of Ernst & Young LLP (1996-2009). |
Renee Stagnone (1975) |
Year of Election or Appointment: 2013 Deputy Treasurer |
| Ms. Stagnone also serves as Deputy Treasurer of other funds. Ms. Stagnone is an employee of Fidelity Investments. |
Linda J. Wondrack (1964) |
Year of Election or Appointment: 2014 Chief Compliance Officer |
| Ms. Wondrack also serves as Chief Compliance Officer of other funds. Ms. Wondrack is Executive Vice President and head of the Ethics Office and Asset Management Compliance for Fidelity Investments (2012-present). Ms. Wondrack also serves as Chief Compliance Officer of Fidelity SelectCo, LLC (2014-present); Chief Compliance Officer of Impresa Management LLC (2013-present); and Chief Compliance Officer of FMR Co., Inc., Fidelity Investments Money Management, Inc., Fidelity Management & Research (Japan) Limited, Fidelity Management & Research (U.K.) Inc., Fidelity Management & Research (Hong Kong), Fidelity Management & Research Company, Pyramis Global Advisors, LLC, and Strategic Advisers, Inc., Ballyrock Investment Advisors LLC, and Northern Neck Investors LLC (2012-present). Previously, Ms. Wondrack served as Senior Vice President and Chief Compliance Officer for Columbia Management Investment Advisers, LLC (2005-2012); Chief Compliance Officer for certain funds within the Columbia Family of Funds (2007-2012); and Senior Vice President of Compliance Risk Management at Bank of America (2005-2010). |
Joseph F. Zambello (1957) |
Year of Election or Appointment: 2011 Deputy Treasurer |
| Mr. Zambello also serves as Deputy Treasurer of other funds. Mr. Zambello is an employee of Fidelity Investments. Previously, Mr. Zambello served as Vice President of FMR's Program Management Group (2009-2011) and Vice President of the Transfer Agent Oversight Group (2005-2009). |
Annual Report
The Board of Trustees of Advisor Emerging Markets Fund voted to pay to shareholders of record at the opening of business on record date, the following distributions per share derived from capital gains realized from sales of portfolio securities, and dividends derived from net investment income:
| Pay Date | Record Date | Dividends | Capital Gains |
Class A | 12/08/14 | 12/05/14 | $ 0.019 | $ 0.033 |
Class T | 12/08/14 | 12/05/14 | 0.0000 | 0.0000 |
Class B | 12/08/14 | 12/05/14 | 0.0000 | 0.0000 |
Class C | 12/08/14 | 12/05/14 | 0.0000 | 0.0000 |
Class A and Class T designates 100% of the dividends distributed during the fiscal year as amounts which may be taken into account as a dividend for purposes of the maximum rate under section 1(h)(11) of the Internal Revenue Code.
Class A and Class T designates 19% and 35%, respectively, of the dividends distributed during the fiscal year as qualifying for the dividends-received deduction for corporate shareholders.
The amounts per share which represent income derived from sources within, and taxes paid to, foreign countries or possessions of the United States are as follows:
| Pay Date | Income | Taxes |
Class A | 12/09/2013 | $ 0.1023 | $ 0.0413 |
Class T | 12/09/2013 | $ 0.0543 | $ 0.0413 |
Class B | 12/09/2013 | 0.0000 | 0.0000 |
Class C | 12/09/2013 | 0.0000 | 0.0000 |
The fund will notify shareholders in January 2015 of amounts for use in preparing 2014 income tax returns.
Annual Report
Board Approval of Investment Advisory Contracts and Management Fees
Fidelity Advisor Emerging Markets Fund
Each year, the Board of Trustees, including the Independent Trustees (together, the Board), votes on the renewal of the management contract with Fidelity Management & Research Company (FMR) and the sub-advisory agreements (together, the Advisory Contracts) for the fund. The Board, assisted by the advice of fund counsel and Independent Trustees' counsel, requests and considers a broad range of information relevant to the renewal of the Advisory Contracts throughout the year.
The Board meets regularly and, at each of its meetings, covers an extensive agenda of topics and materials and considers factors that are relevant to its annual consideration of the renewal of the fund's Advisory Contracts, including the services and support provided to the fund and its shareholders. The Board has established various standing committees (Committees), each composed of and chaired by Independent Trustees with varying backgrounds, to which the Board has assigned specific subject matter responsibilities in order to enhance effective decision-making by the Board. The Board, acting directly and through its Committees, requests and receives information concerning the annual consideration of the renewal of the fund's Advisory Contracts. The Board also meets as needed to consider matters specifically related to the Board's annual consideration of the renewal of the Advisory Contracts. Members of the Board may also meet with trustees of other Fidelity funds through ad hoc joint committees to discuss certain matters relevant to the Fidelity funds.
At its July 2014 meeting, the Board, including the Independent Trustees, unanimously determined to renew the fund's Advisory Contracts. In reaching its determination, the Board considered all factors it believed relevant, including (i) the nature, extent, and quality of the services to be provided to the fund and its shareholders (including the investment performance of the fund); (ii) the competitiveness of the fund's management fee and total expense ratio relative to peer funds; (iii) the total costs of the services to be provided by and the profits to be realized by Fidelity from its relationship with the fund; (iv) the extent to which economies of scale exist and would be realized as the fund grows; and (v) whether fee levels reflect these economies of scale, if any, for the benefit of fund shareholders. In connection with separate internal corporate reorganizations involving Fidelity Management & Research (U.K.) Inc. (FMR U.K.) and Fidelity Management & Research (Japan) Inc. (FMR Japan), the Board approved certain non-material amendments to the fund's sub-advisory agreements with FMR U.K. and FMR Japan to reflect that, after these reorganizations, FMR Investment Management (UK) Limited and Fidelity Management & Research (Japan) Limited will carry on the business of FMR U.K. and FMR Japan, respectively. The Board noted that no changes to the portfolio managers or to the foreign research or investment advisory services provided to the fund were expected in connection with either reorganization and that the same personnel and resources would continue to be available to the fund at the new entities.
Annual Report
In considering whether to renew the Advisory Contracts for the fund, the Board reached a determination, with the assistance of fund counsel and Independent Trustees' counsel and through the exercise of its business judgment, that the renewal of the Advisory Contracts was in the best interests of the fund and its shareholders and that the compensation payable under the Advisory Contracts was fair and reasonable. The Board's decision to renew the Advisory Contracts was not based on any single factor, but rather was based on a comprehensive consideration of all the information provided to the Board at its meetings throughout the year. The Board, in reaching its determination to renew the Advisory Contracts, was aware that shareholders of the fund have a broad range of investment choices available to them, including a wide choice among funds offered by Fidelity's competitors, and that the fund's shareholders, who have the opportunity to review and weigh the disclosure provided by the fund in its prospectus and other public disclosures, have chosen to invest in this fund, which is part of the Fidelity family of funds.
Nature, Extent, and Quality of Services Provided. The Board considered Fidelity's staffing as it relates to the fund, including the backgrounds of investment personnel of FMR and the sub-advisers (together, the Investment Advisers), and also considered the fund's investment objective, strategies, and related investment philosophy. The Independent Trustees also had discussions with senior management of Fidelity's investment operations and investment groups. The Board considered the structure of the portfolio manager compensation program and whether this structure provides appropriate incentives to act in the best interests of the fund. Additionally, the Board considered the portfolio managers' investments, if any, in the funds that they manage.
Resources Dedicated to Investment Management and Support Services. The Board and the Fund Oversight and Research Committees reviewed the general qualifications and capabilities of Fidelity's investment staff, including its size, education, experience, and resources, as well as Fidelity's approach to recruiting, training, managing, and compensating investment personnel. The Board noted that Fidelity has continued to increase the resources devoted to non-U.S. offices, including expansion of Fidelity's global investment organization. The Board also noted that Fidelity's analysts have extensive resources, tools and capabilities that allow them to conduct sophisticated quantitative and fundamental analysis, as well as credit analysis of issuers, counterparties and guarantors. Further, the Board believes that Fidelity's investment professionals have sufficient access to global information and data so as to provide competitive investment results over time, and that those professionals also have access to sophisticated tools that permit them to assess portfolio construction and risk and performance attribution characteristics continuously, as well as to transmit new information and research conclusions rapidly around the world. Additionally, in its deliberations, the Board considered Fidelity's trading and risk management capabilities and resources and global compliance infrastructure, which are an integral part of the investment management process.
Annual Report
Board Approval of Investment Advisory Contracts and
Management Fees - continued
Shareholder and Administrative Services. The Board considered (i) the nature, extent, quality, and cost of advisory, administrative, and shareholder services performed by the Investment Advisers and their affiliates under the Advisory Contracts and under separate agreements covering transfer agency, pricing and bookkeeping, and securities lending services for the fund; (ii) the nature and extent of the supervision of third party service providers, principally custodians and subcustodians; and (iii) the resources devoted to, and the record of compliance with, the fund's compliance policies and procedures. The Board also reviewed the allocation of fund brokerage, including allocations to brokers affiliated with the Investment Advisers, the use of brokerage commissions to pay fund expenses, and the use of "soft" commission dollars to pay for research services.
The Board noted that the growth of fund assets over time across the complex allows Fidelity to reinvest in the development of services designed to enhance the value or convenience of the Fidelity funds as investment vehicles. These services include 24-hour access to account information and market information through telephone representatives and over the Internet, investor education materials and asset allocation tools, and the expanded availability of Fidelity Investor Centers.
In 2014, the Board formed an ad hoc Committee on Transfer Agency Fees to review the variety of transfer agency fee structures throughout the industry and Fidelity's competitive positioning with respect to industry participants.
Investment in a Large Fund Family. The Board considered the benefits to shareholders of investing in a Fidelity fund, including the benefits of investing in a fund that is part of a large family of funds offering a variety of investment disciplines and providing a large variety of mutual fund investor services. The Board noted that Fidelity had taken, or had made recommendations that resulted in the Fidelity funds taking, a number of actions over the previous year that benefited particular funds, including (i) continuing to dedicate additional resources to investment research and to the support of the senior management team that oversees asset management; (ii) persisting in efforts to enhance Fidelity's global research capabilities; (iii) launching new funds and making other enhancements to meet client needs for income-oriented solutions; (iv) reducing fund expenses for certain index funds; (v) continuing to launch dedicated lower cost underlying funds to meet portfolio construction needs related to expanding underlying fund options for Fidelity funds of funds, specifically for the Freedom Fund product lines; (vi) rationalizing product lines and gaining increased efficiencies through fund mergers; (vii) launching sector-based exchange-traded funds and establishing a new Fidelity adviser to manage sector-based funds and products; (viii) continuing to develop and implement technology to improve security and increase efficiency; (ix) modifying the eligibility criteria for certain share classes to increase their marketability to a portion of the defined contribution plan market; (x) waiving redemption fees for certain qualified fund-of-fund and wrap programs and certain retirement plan transactions; and (xi) launching new Institutional Class shares of certain money market funds to attract and retain assets and to fill a gap in the money market fund lineup.
Annual Report
Investment Performance. The Board considered whether the fund has operated in accordance with its investment objective, as well as its record of compliance with its investment restrictions and its performance history. The Board noted that there was a portfolio management change for the fund in October 2012.
The Board took into account discussions with the Investment Advisers about fund investment performance that occur at Board meetings throughout the year. In this regard the Board noted that as part of regularly scheduled fund reviews and other reports to the Board on fund performance, the Board periodically considers annualized return information for the fund, for different time periods, measured against a securities market index ("benchmark index") and a peer group of funds with similar objectives ("peer group"). In its evaluation of fund investment performance, the Board gave particular attention to information indicating changes in performance of certain Fidelity funds for specific time periods and the Investment Advisers' explanations for any overperformance or underperformance.
In addition to reviewing absolute and relative fund performance, the Independent Trustees periodically consider the appropriateness of fund performance metrics in evaluating the results achieved. In general, the Independent Trustees believe that fund performance should be evaluated based on net performance (after fees and expenses) of both the highest performing and lowest performing classes, where applicable, compared to appropriate benchmark indices, over appropriate time periods which may include full market cycles, and compared to peer groups, as applicable, over the same periods, taking into account relevant factors including the following: general market conditions; issuer-specific information; tactical opportunities for investment; and fund cash flows and other factors.
The Independent Trustees recognize that shareholders evaluate performance on a net basis over their own holding periods, for which one-, three-, and five-year periods are often used as a proxy. For this reason, the performance information reviewed by the Board also included net cumulative calendar year total return information for the fund and an appropriate benchmark index and peer group for the most recent one-, three-, and five-year periods, as shown below. Returns are shown compared to the 25th percentile (top of box, 75% beaten) and 75th percentile (bottom of box, 25% beaten) of the peer universe.
Annual Report
Board Approval of Investment Advisory Contracts and
Management Fees - continued
Fidelity Advisor Emerging Markets Fund
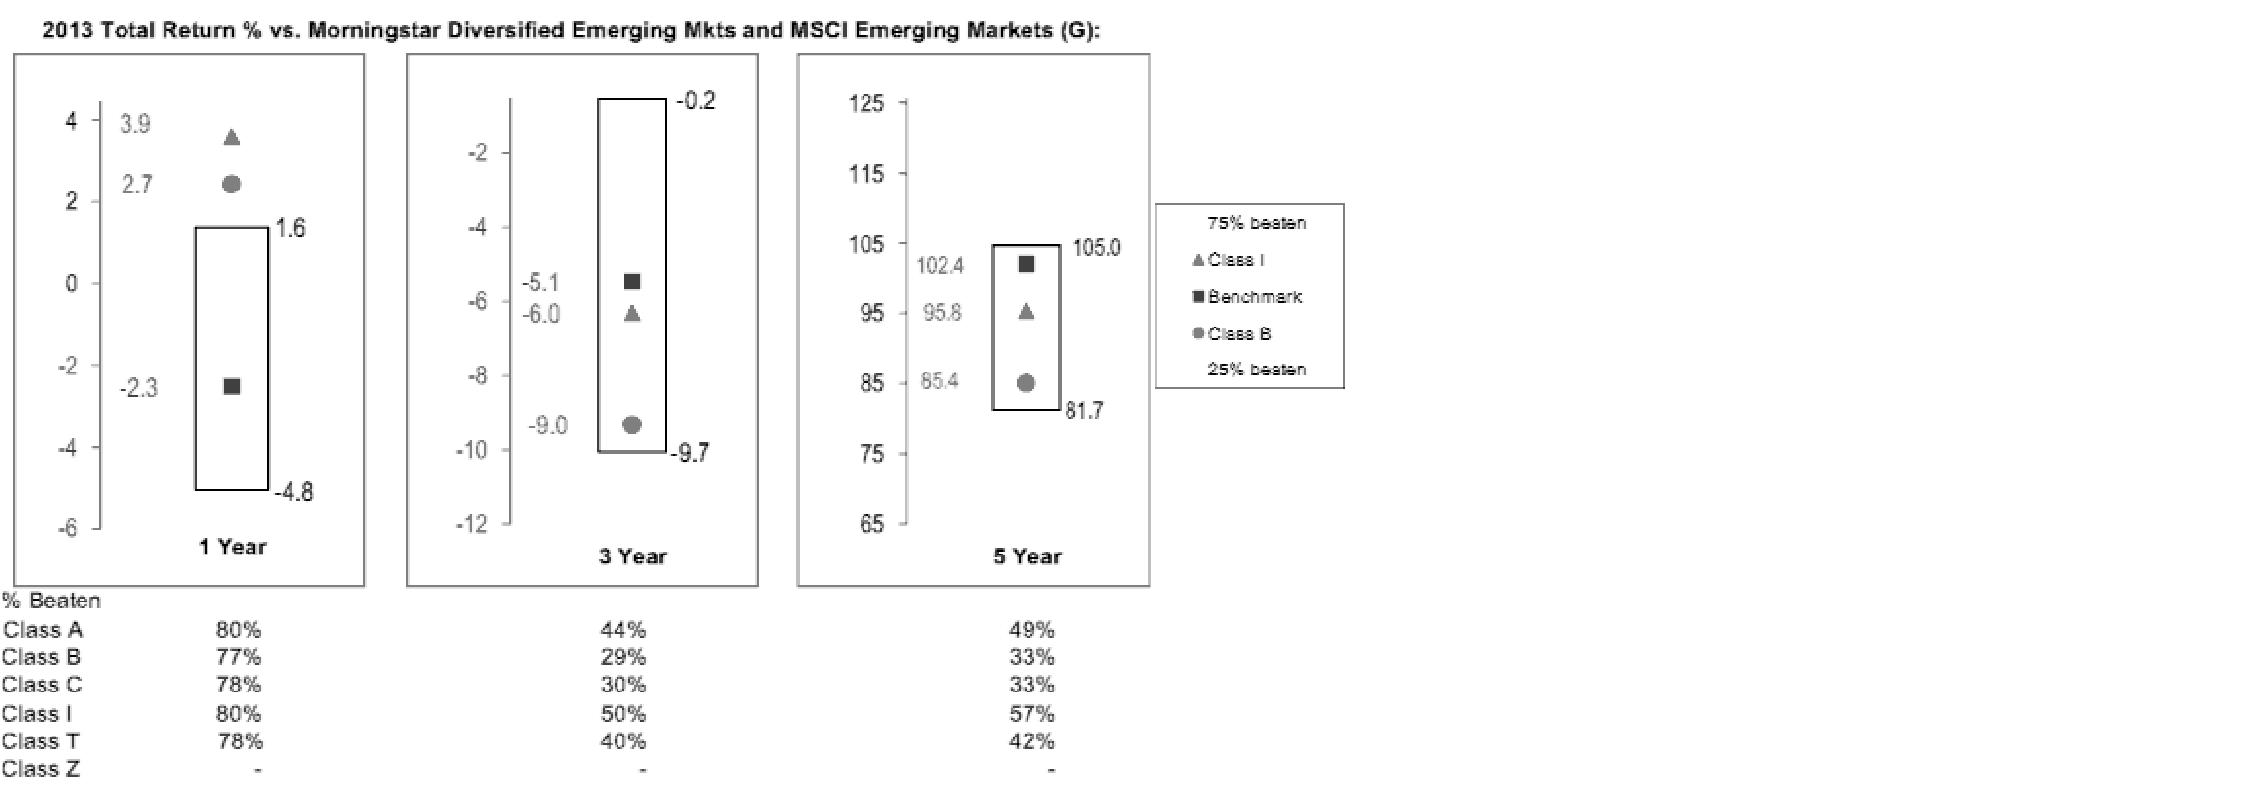
Based on its review, the Board concluded that the nature, extent, and quality of services provided to the fund under the Advisory Contracts should benefit the fund's shareholders.
Competitiveness of Management Fee and Total Expense Ratio. The Board considered the fund's management fee and total expense ratio compared to "mapped groups" of competitive funds and classes. Fidelity creates "mapped groups" by combining similar Lipper investment objective categories that have comparable investment mandates. Combining Lipper investment objective categories aids the Board's management fee and total expense ratio comparisons by broadening the competitive group used for comparison and by reducing the number of universes to which various Fidelity funds are compared.
Management Fee. The Board considered two proprietary management fee comparisons for the 12-month periods shown in the chart below. The group of Lipper funds used by the Board for management fee comparisons is referred to below as the "Total Mapped Group." The Total Mapped Group comparison focuses on a fund's standing in terms of gross management fees before expense reimbursements or caps relative to the total universe of funds with comparable investment mandates, regardless of whether their management fee structures also are comparable. Funds with comparable investment mandates offer exposure to similar types of securities. Funds with comparable management fee structures have similar management fee contractual arrangements (e.g., flat rate charged for advisory services, all-inclusive fee rate, etc.). "TMG %" represents the percentage of funds in the Total Mapped Group that had management fees that were lower than the fund's. For example, a hypothetical TMG % of 20% would mean that 80% of the funds in the Total Mapped Group had higher, and 20% had lower, management fees than the fund. The fund's actual TMG %s are in the chart below. The "Asset-Size Peer Group" (ASPG) comparison focuses on a fund's standing relative to a subset of non-Fidelity funds within the Total Mapped Group that are similar in size and management fee structure. For example, if a fund is in the first quartile of the ASPG, the fund's management fee ranks in the least expensive or lowest 25% of funds in the ASPG. The ASPG represents at least 15% of the funds in the Total Mapped Group with comparable asset size and management fee structures, subject to a minimum of 50 funds (or all funds in the Total Mapped Group if fewer than 50). Additional information, such as the ASPG quartile in which the fund's management fee rate ranked, is also included in the chart and considered by the Board.
Annual Report
Fidelity Advisor Emerging Markets Fund

The Board noted that the fund's management fee rate ranked below the median of its Total Mapped Group and below the median of its ASPG for 2013.
The Board also noted that, in August 2013, the ad hoc Committee on Management Fees was formed to conduct an in-depth review of the management fee rates of Fidelity's active equity mutual funds. The Committee focused on the following areas: (i) standard fee structures; (ii) research consumption and trading evolution; (iii) management fee competitiveness/profitability by category; and (iv) factors that drive institutional pricing.
Based on its review, the Board concluded that the fund's management fee is fair and reasonable in light of the services that the fund receives and the other factors considered.
Annual Report
Board Approval of Investment Advisory Contracts and
Management Fees - continued
Total Expense Ratio. In its review of each class's total expense ratio, the Board considered the fund's management fee as well as other fund or class expenses, as applicable, such as transfer agent fees, pricing and bookkeeping fees, fund-paid 12b-1 fees, and custodial, legal, and audit fees. The Board also noted the effects of any waivers and reimbursements on fees and expenses. As part of its review, the Board also considered the current and historical total expense ratios of each class of the fund compared to competitive fund median expenses. Each class of the fund is compared to those funds and classes in the Total Mapped Group (used by the Board for management fee comparisons) that have a similar sales load structure.
The Board noted that the total expense ratio of each of Class A, Class B, Class C, Institutional Class, and Class Z ranked below its competitive median for 2013 and the total expense ratio of Class T ranked above its competitive median for 2013. The Board considered that, in general, various factors can affect total expense ratios. The Board noted that the total expense ratio of Class T was above the competitive median primarily because of higher 12b-1 fees on Class T as compared to most competitor funds. Class T has a higher 12b-1 fee, but a lower front-end sales charge, than traditionally priced front-end sales charge classes. The Board considered that Class T is primarily sold load-waived in the retirement plan market where its 0.50% 12b-1 fee is comparable to competing no-load, higher 12b-1 fee classes designed specifically for retirement plans. The Board noted that the fund offers multiple classes, each of which has a different sales load and 12b-1 fee structure, and that the multiple structures are intended to offer a range of pricing options for the intermediary market. The Board also noted that the total expense ratios of the classes vary primarily by the level of their 12b-1 fees, although differences in transfer agent fees may also cause expenses to vary from class to class.
Fees Charged to Other Fidelity Clients. The Board also considered Fidelity fee structures and other information with respect to clients of Fidelity, such as other funds advised or subadvised by Fidelity, pension plan clients, and other institutional clients. The Board noted the findings of the 2013 ad hoc joint committee (created with the board of other Fidelity funds), which reviewed and compared Fidelity's institutional investment advisory business with its business of providing services to the Fidelity funds, including the differences in services provided, fees charged, and costs incurred, as well as competition in their respective marketplaces.
Based on its review of total expense ratios and fees charged to other Fidelity clients, the Board concluded that the total expense ratio of each class of the fund was reasonable, although Class T was above the median of the universe presented for comparison, in light of the services that the fund and its shareholders receive and the other factors considered.
Costs of the Services and Profitability. The Board considered the revenues earned and the expenses incurred by Fidelity in conducting the business of developing, marketing, distributing, managing, administering and servicing the fund and servicing the fund's shareholders. The Board also considered the level of Fidelity's profits in respect of all the Fidelity funds.
Annual Report
On an annual basis, Fidelity presents to the Board Fidelity's profitability for the fund. Fidelity calculates the profitability for each fund, as well as aggregate profitability for groups of Fidelity funds and all Fidelity funds, using a series of detailed revenue and cost allocation methodologies which originate with the books and records of Fidelity on which Fidelity's audited financial statements are based. The Audit Committee of the Board reviews any significant changes from the prior year's methodologies.
PricewaterhouseCoopers LLP (PwC), independent registered public accounting firm and auditor to Fidelity and certain Fidelity funds, has been engaged annually by the Board as part of the Board's assessment of Fidelity's profitability analysis. PwC's engagement includes the review and assessment of the methodologies used by Fidelity in determining the revenues and expenses attributable to Fidelity's mutual fund business, and completion of agreed-upon procedures in respect of the mathematical accuracy of fund profitability and its conformity to established allocation methodologies. After considering PwC's reports issued under the engagement and information provided by Fidelity, the Board concluded that while other allocation methods may also be reasonable, Fidelity's profitability methodologies are reasonable in all material respects.
The Board also reviewed Fidelity's non-fund businesses and fall-out benefits related to the mutual fund business as well as cases where Fidelity's affiliates may benefit from or be related to the fund's business.
The Board considered the costs of the services provided by and the profits realized by Fidelity in connection with the operation of the fund and was satisfied that the profitability was not excessive in the circumstances.
Economies of Scale. The Board considered whether there have been economies of scale in respect of the management of the Fidelity funds, whether the Fidelity funds (including the fund) have appropriately benefited from any such economies of scale, and whether there is potential for realization of any further economies of scale. The Board considered the extent to which the fund will benefit from economies of scale through increased services to the fund, through waivers or reimbursements, or through fee or expense ratio reductions. The Board also noted that in 2013, it and the boards of other Fidelity funds created an ad hoc committee (the Economies of Scale Committee) to analyze whether Fidelity attains economies of scale in respect of the management and servicing of the Fidelity funds, whether the Fidelity funds have appropriately benefited from such economies of scale, and whether there is potential for realization of any further economies of scale.
Annual Report
Board Approval of Investment Advisory Contracts and
Management Fees - continued
The Board recognized that the fund's management contract incorporates a "group fee" structure, which provides for lower group fee rates as total group assets increase, and for higher group fee rates as total group assets decrease (with "group assets" defined to include fund assets under FMR's management plus sector fund assets previously under FMR's management and currently managed by Fidelity SelectCo, LLC). FMR calculates the group fee rates based on a tiered asset "breakpoint" schedule that varies based on asset class. The Board considered that the group fee is designed to deliver the benefits of economies of scale to fund shareholders when total Fidelity fund assets increase, even if assets of any particular fund are unchanged or have declined, because some portion of Fidelity's costs are attributable to services provided to all Fidelity funds, and all funds benefit if those costs can be allocated among more assets. The Board concluded that, given the group fee structure, fund shareholders will benefit from lower management fees as group assets increase at the fund complex level, regardless of whether Fidelity achieves any such economies of scale.
The Board concluded, taking into account the analysis of the Economies of Scale Committee, that economies of scale, if any, are being appropriately shared between fund shareholders and Fidelity.
Additional Information Requested by the Board. In order to develop fully the factual basis for consideration of the Fidelity funds' Advisory Contracts, the Board requested and received additional information on certain topics, including: (i) fund performance trends and Fidelity's long-term strategies for certain funds; (ii) Fidelity's strategic marketing and product lineup goals; (iii) the methodology with respect to competitive fund data and peer group classifications; (iv) the arrangements with, and performance of, certain sub-advisers on behalf of the Fidelity funds, as well as certain proposed participating affiliate arrangements; (v) the realization of fall-out benefits in certain Fidelity business units; (vi) Fidelity's group fee structures, including the rationale for the individual fee rates of certain categories of funds and the definition of group assets; (vii) trends regarding industry use of performance fee structures and the performance adjustment methodologies applicable to the Fidelity funds; (viii) additional competitive analysis regarding the total expenses for certain classes; (ix) fund profitability methodology, including Fidelity's cost allocation methodology, and the impact of certain factors on fund profitability results; and (x) the process by which Fidelity determines sub-advisory fees for funds it advises.
Based on its evaluation of all of the conclusions noted above, and after considering all factors it believed relevant, the Board ultimately concluded that the advisory fee structures are fair and reasonable, and that the fund's Advisory Contracts should be renewed.
Annual Report
Investment Adviser
Fidelity Management & Research Company
Boston, MA
Investment Sub-Advisers
FMR Co., Inc.
Fidelity Management & Research
(U.K.) Inc.
Fidelity Management & Research
(Hong Kong) Limited
Fidelity Management & Research
(Japan) Limited
FIL Investments (Japan) Limited
FIL Investment Advisors (UK) Limited
FIL Investment Advisors
General Distributor
Fidelity Distributors Corporation
Smithfield, RI
Transfer and Service Agents
Fidelity Investments Institutional Operations Company, Inc.
Boston, MA
Fidelity Service Company, Inc.
Boston, MA
Custodian
JPMorgan Chase Bank
New York, NY
(Fidelity Investment logo)(registered trademark)
FAEM-UANN-1214
1.809005.110
(Fidelity Investment logo)(registered trademark)
Fidelity Advisor®
Emerging Markets
Fund - Institutional Class
Annual Report
October 31, 2014
(Fidelity Cover Art)
Contents
Performance | (Click Here) | How the fund has done over time. |
Management's Discussion of Fund Performance | (Click Here) | The Portfolio Manager's review of fund performance and strategy. |
Shareholder Expense Example | (Click Here) | An example of shareholder expenses. |
Investment Changes | (Click Here) | A summary of major shifts in the fund's investments over the past six months. |
Investments | (Click Here) | A complete list of the fund's investments with their market values. |
Financial Statements | (Click Here) | Statements of assets and liabilities, operations, and changes in net assets, as well as financial highlights. |
Notes | (Click Here) | Notes to the financial statements. |
Report of Independent Registered Public Accounting Firm | (Click Here) | |
Trustees and Officers | (Click Here) | |
Distributions | (Click Here) | |
Board Approval of Investment Advisory Contracts and Management Fees | (Click Here) | |
To view a fund's proxy voting guidelines and proxy voting record for the 12-month period ended June 30, visit http://www.fidelity.com/proxyvotingresults or visit the Securities and Exchange Commission's (SEC) web site at http://www.sec.gov. You may also call 1-877-208-0098 to request a free copy of the proxy voting guidelines.
Standard & Poor's, S&P and S&P 500 are registered service marks of The McGraw-Hill Companies, Inc. and have been licensed for use by Fidelity Distributors Corporation.
Other third-party marks appearing herein are the property of their respective owners.
All other marks appearing herein are registered or unregistered trademarks or service marks of FMR LLC or an affiliated company. © 2014 FMR LLC. All rights reserved.
Annual Report
This report and the financial statements contained herein are submitted for the general information of the shareholders of the fund. This report is not authorized for distribution to prospective investors in the fund unless preceded or accompanied by an effective prospectus.
A fund files its complete schedule of portfolio holdings with the SEC for the first and third quarters of each fiscal year on Form N-Q. Forms N-Q are available on the SEC's web site at http://www.sec.gov. A fund's Forms N-Q may be reviewed and copied at the SEC's Public Reference Room in Washington, DC. Information regarding the operation of the SEC's Public Reference Room may be obtained by calling 1-800-SEC-0330. For a complete list of a fund's portfolio holdings, view the most recent holdings listing, semiannual report, or annual report on Fidelity's web site at http://www.fidelity.com, http://www.advisor.fidelity.com, or http://www.401k.com, as applicable.
NOT FDIC INSURED • MAY LOSE VALUE • NO BANK GUARANTEE
Neither the fund nor Fidelity Distributors Corporation is a bank.
Annual Report
Average annual total return reflects the change in the value of an investment, assuming reinvestment of the class' distributions from dividend income and capital gains (the profits earned upon the sale of securities that have grown in value, if any) and assuming a constant rate of performance each year. The $10,000 table and the fund's returns do not reflect the deduction of taxes that a shareholder would pay on fund distributions or the redemption of fund shares. During periods of reimbursement by Fidelity, a fund's total return will be greater than it would be had the reimbursement not occurred. How a fund did yesterday is no guarantee of how it will do tomorrow.
Average Annual Total Returns
Periods ended October 31, 2014 | Past 1
year | Past 5
years | Past 10
years |
Institutional Class | 4.00% | 5.19% | 10.29% |
$10,000 Over 10 Years
Let's say hypothetically that $10,000 was invested in Fidelity Advisor® Emerging Markets Fund - Institutional Class on October 31, 2004. The chart shows how the value of your investment would have changed, and also shows how the MSCI Emerging Markets Index performed over the same period.
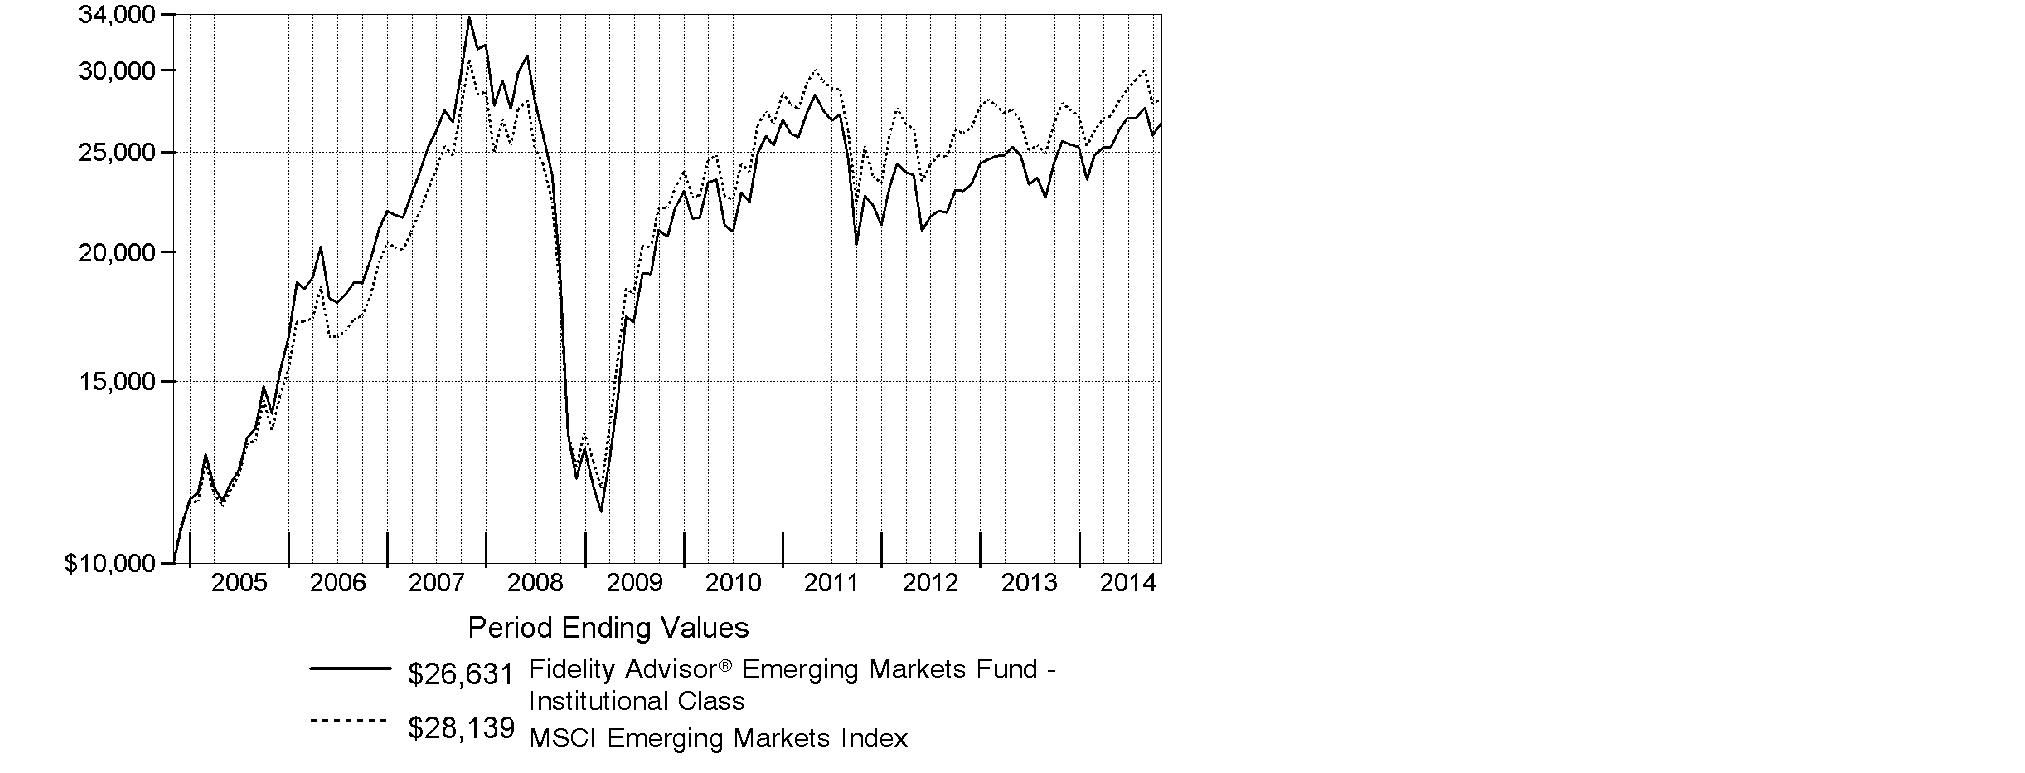
Annual Report
Market Recap: Global equities posted a healthy gain for the 12 months ending October 31, 2014, overcoming an October market decline driven by recessionary pressures in China and tepid growth in Europe. The MSCI ACWI (All Country World Index) Index rose 8.15%, helped by subdued market volatility for much of the period and supported by solid corporate earnings, especially in the United States. Stocks also benefited from easy monetary policies in Japan and the eurozone, as well as increased stimulus efforts in China. All but three of the 24 industry groups that compose the index marked a positive return. The U.S. (+17%) remained a pillar of strength, while a strongly rising dollar in the latter part of the period detracted from investors' returns in most non-U.S. markets. Canada (+5%) notched broad gains outside of its energy and materials sectors, as did Asia-Pacific ex Japan (+4%), led by investor enthusiasm for companies in India. The U.K., Europe and Japan, meanwhile, all underperformed. Among sectors, health care (+24%) led the index, with a strong contribution from the pharmaceuticals, biotechnology & life sciences industry. Information technology (+21%) also outperformed. Conversely, materials (-4%) and energy (-1%) lagged the index due to a higher supply of and lower demand for commodities.
Comments from Sammy Simnegar, Portfolio Manager of Fidelity Advisor® Emerging Markets Fund: For the year, the fund's Institutional Class shares returned 4.00%, topping the 0.98% gain of the MSCI Emerging Markets Index. Versus the index, the fund's performance was lifted by its positioning in India, which accounted for eight of the fund's 20 largest relative contributors. A non-index position in Axis Bank was the fund's best relative contributor from India and fifth-largest overall. The top relative contributor was Bitauto Holdings, a Chinese automotive website and also a non-index name. Performance was further lifted by not owning several weak-performing index stocks in the energy and materials sectors, including those of two Brazil-based companies - energy producer Petroleo Brasileiro, better known as Petrobras, and industrial metals miner Vale - as well as Russian gas distributor Gazprom. Conversely, Banco Bradesco, a Brazil-based bank, was the fund's largest relative detractor. This stock performed poorly early in 2014, and I sold it - prematurely, as it turned out. Not owning two strong-performing index stocks, China Mobile and Hon Hai Precision Industry, a Taiwan-based manufacturer of electronic products, also detracted.
The views expressed above reflect those of the portfolio manager(s) only through the end of the period as stated on the cover of this report and do not necessarily represent the views of Fidelity or any other person in the Fidelity organization. Any such views are subject to change at any time based upon market or other conditions and Fidelity disclaims any responsibility to update such views. These views may not be relied on as investment advice and, because investment decisions for a Fidelity fund are based on numerous factors, may not be relied on as an indication of trading intent on behalf of any Fidelity fund.
Annual Report
Shareholder Expense Example
As a shareholder of the Fund, you incur two types of costs: (1) transaction costs, including sales charges (loads) on purchase payments or redemption proceeds, redemption fees and (2) ongoing costs, including management fees, distribution and/or service (12b-1) fees and other Fund expenses. This Example is intended to help you understand your ongoing costs (in dollars) of investing in the Fund and to compare these costs with the ongoing costs of investing in other mutual funds.
The Example is based on an investment of $1,000 invested at the beginning of the period and held for the entire period (May 1, 2014 to October 31, 2014).
Actual Expenses
The first line of the accompanying table for each class of the Fund provides information about actual account values and actual expenses. You may use the information in this line, together with the amount you invested, to estimate the expenses that you paid over the period. Simply divide your account value by $1,000.00 (for example, an $8,600 account value divided by $1,000.00 = 8.6), then multiply the result by the number in the first line for a class of the Fund under the heading entitled "Expenses Paid During Period" to estimate the expenses you paid on your account during this period. In addition, the Fund, as a shareholder in the underlying Fidelity Central Funds, will indirectly bear its pro-rata share of the fees and expenses incurred by the underlying Fidelity Central Funds. These fees and expenses are not included in the Fund's annualized expense ratio used to calculate the expense estimate in the table below.
Hypothetical Example for Comparison Purposes
The second line of the accompanying table for each class of the Fund provides information about hypothetical account values and hypothetical expenses based on a Class' actual expense ratio and an assumed rate of return of 5% per year before expenses, which is not the Class' actual return. The hypothetical account values and expenses may not be used to estimate the actual ending account balance or expenses you paid for the period. You may use this information to compare the ongoing costs of investing in the Fund and other funds. To do so, compare this 5% hypothetical example with the 5% hypothetical examples that appear in the shareholder reports of the other funds. In addition, the Fund, as a shareholder in the underlying Fidelity Central Funds, will indirectly bear its pro-rata share of the fees and expenses incurred by the underlying Fidelity Central Funds. These fees and expenses are not included in the Fund's annualized expense ratio used to calculate the expense estimate in the table below.
Please note that the expenses shown in the table are meant to highlight your ongoing costs only and do not reflect any transaction costs. Therefore, the second line of the table is useful in comparing ongoing costs only, and will not help you determine the relative total costs of owning different funds. In addition, if these transactional costs were included, your costs would have been higher.
Annual Report
| Annualized
Expense RatioB | Beginning
Account Value
May 1, 2014 | Ending
Account Value
October 31, 2014 | Expenses Paid
During Period*
May 1, 2014
to October 31, 2014 |
Class A | 1.50% | | | |
Actual | | $ 1,000.00 | $ 1,051.70 | $ 7.76 |
HypotheticalA | | $ 1,000.00 | $ 1,017.64 | $ 7.63 |
Class T | 1.76% | | | |
Actual | | $ 1,000.00 | $ 1,050.00 | $ 9.09 |
HypotheticalA | | $ 1,000.00 | $ 1,016.33 | $ 8.94 |
Class B | 2.24% | | | |
Actual | | $ 1,000.00 | $ 1,047.40 | $ 11.56 |
HypotheticalA | | $ 1,000.00 | $ 1,013.91 | $ 11.37 |
Class C | 2.25% | | | |
Actual | | $ 1,000.00 | $ 1,047.50 | $ 11.61 |
HypotheticalA | | $ 1,000.00 | $ 1,013.86 | $ 11.42 |
Institutional Class | 1.16% | | | |
Actual | | $ 1,000.00 | $ 1,053.30 | $ 6.00 |
HypotheticalA | | $ 1,000.00 | $ 1,019.36 | $ 5.90 |
Class Z | .99% | | | |
Actual | | $ 1,000.00 | $ 1,054.30 | $ 5.13 |
HypotheticalA | | $ 1,000.00 | $ 1,020.21 | $ 5.04 |
A 5% return per year before expenses
B Annualized expense ratio reflects expenses net of applicable fee waivers.
* Expenses are equal to each Class' annualized expense ratio, multiplied by the average account value over the period, multiplied by 184/365 (to reflect the one-half year period).
Annual Report
Investment Changes (Unaudited)
Top Five Stocks as of October 31, 2014 |
| % of fund's
net assets | % of fund's net assets
6 months ago |
Samsung Electronics Co. Ltd. (Korea (South), Technology Hardware, Storage & Peripherals) | 4.0 | 4.7 |
Taiwan Semiconductor Manufacturing Co. Ltd. (Taiwan, Semiconductors & Semiconductor Equipment) | 3.1 | 3.0 |
Tencent Holdings Ltd. (Cayman Islands, Internet Software & Services) | 2.4 | 2.1 |
Naspers Ltd. Class N (South Africa, Media) | 1.7 | 1.5 |
Itau Unibanco Holding SA sponsored ADR (Brazil, Banks) | 1.4 | 1.5 |
| 12.6 | |
Top Five Market Sectors as of October 31, 2014 |
| % of fund's
net assets | % of fund's net assets
6 months ago |
Financials | 23.5 | 20.9 |
Information Technology | 19.2 | 18.2 |
Consumer Discretionary | 18.8 | 21.2 |
Industrials | 13.4 | 15.0 |
Consumer Staples | 7.8 | 10.3 |
Top Five Countries as of October 31, 2014 |
(excluding cash equivalents) | % of fund's
net assets | % of fund's net assets
6 months ago |
India | 12.0 | 10.0 |
Brazil | 11.2 | 9.5 |
South Africa | 9.0 | 7.6 |
Cayman Islands | 6.4 | 8.7 |
Indonesia | 6.3 | 5.9 |
Percentages are adjusted for the effect of open futures contracts, if applicable. |
Asset Allocation (% of fund's net assets) |
As of October 31, 2014 | As of April 30, 2014 |
 | Stocks 97.7% | | | Stocks 99.5% | |
 | Short-Term
Investments and
Net Other Assets (Liabilities) 2.3% | | | Short-Term
Investments and
Net Other Assets (Liabilities) 0.5% | |

Annual Report
Investments October 31, 2014
Showing Percentage of Net Assets
Common Stocks - 92.3% |
| Shares | | Value |
Australia - 1.2% |
Carsales.com Ltd. (d) | 222,870 | | $ 2,103,084 |
SEEK Ltd. | 129,202 | | 1,896,025 |
Sydney Airport unit | 480,461 | | 1,867,905 |
TOTAL AUSTRALIA | | 5,867,014 |
Bailiwick of Jersey - 0.4% |
WPP PLC | 84,800 | | 1,656,369 |
Bermuda - 2.2% |
Brilliance China Automotive Holdings Ltd. | 1,352,000 | | 2,337,967 |
China Gas Holdings Ltd. | 1,335,000 | | 2,386,820 |
China Resources Gas Group Ltd. | 728,000 | | 2,080,977 |
Credicorp Ltd. (United States) | 22,214 | | 3,576,454 |
TOTAL BERMUDA | | 10,382,218 |
Brazil - 6.7% |
BB Seguridade Participacoes SA | 245,700 | | 3,278,115 |
CCR SA | 417,300 | | 3,107,141 |
Cetip SA - Mercados Organizado | 151,600 | | 1,921,078 |
Cielo SA | 230,560 | | 3,786,063 |
Estacio Participacoes SA | 258,400 | | 2,992,889 |
Iguatemi Empresa de Shopping Centers SA | 175,500 | | 1,777,735 |
Kroton Educacional SA | 502,600 | | 3,582,032 |
Linx SA | 72,000 | | 1,495,847 |
Qualicorp SA (a) | 232,900 | | 2,368,570 |
Smiles SA | 112,900 | | 1,950,087 |
Ultrapar Participacoes SA | 140,300 | | 3,060,339 |
Weg SA | 202,415 | | 2,387,744 |
TOTAL BRAZIL | | 31,707,640 |
British Virgin Islands - 0.4% |
Mail.Ru Group Ltd. GDR (a)(e) | 85,900 | | 2,082,216 |
Cayman Islands - 6.4% |
51job, Inc. sponsored ADR (a)(d) | 7,049 | | 216,404 |
Alibaba Group Holding Ltd. sponsored ADR | 30,100 | | 2,967,860 |
Autohome, Inc. ADR Class A | 34,100 | | 1,803,549 |
Baidu.com, Inc. sponsored ADR (a) | 12,313 | | 2,939,975 |
Bitauto Holdings Ltd. ADR (a) | 22,855 | | 1,913,421 |
Haitian International Holdings Ltd. | 893,000 | | 1,915,555 |
Melco Crown Entertainment Ltd. sponsored ADR | 86,200 | | 2,339,468 |
Sands China Ltd. | 421,400 | | 2,628,319 |
Common Stocks - continued |
| Shares | | Value |
Cayman Islands - continued |
SouFun Holdings Ltd. ADR (d) | 211,800 | | $ 2,065,050 |
Tencent Holdings Ltd. | 714,800 | | 11,488,461 |
TOTAL CAYMAN ISLANDS | | 30,278,062 |
China - 1.2% |
China Pacific Insurance Group Co. Ltd. (H Shares) | 877,400 | | 3,283,371 |
PICC Property & Casualty Co. Ltd. (H Shares) | 1,392,500 | | 2,554,455 |
TOTAL CHINA | | 5,837,826 |
Colombia - 0.5% |
Grupo de Inversiones Suramerica SA | 123,456 | | 2,566,925 |
Denmark - 0.4% |
Novo Nordisk A/S Series B sponsored ADR | 42,501 | | 1,920,195 |
Egypt - 0.5% |
Commercial International Bank SAE sponsored GDR | 358,300 | | 2,436,440 |
Finland - 0.4% |
Kone Oyj (B Shares) (d) | 46,500 | | 1,998,712 |
France - 2.8% |
Bureau Veritas SA | 79,700 | | 1,970,555 |
Ingenico SA | 18,451 | | 1,837,495 |
LVMH Moet Hennessy - Louis Vuitton SA | 13,522 | | 2,293,519 |
Pernod Ricard SA | 14,700 | | 1,673,207 |
Publicis Groupe SA (a) | 27,500 | | 1,904,694 |
Safran SA | 28,900 | | 1,828,910 |
Zodiac Aerospace | 60,100 | | 1,832,774 |
TOTAL FRANCE | | 13,341,154 |
Greece - 1.0% |
Folli Follie SA | 72,500 | | 2,371,273 |
Greek Organization of Football Prognostics SA | 182,500 | | 2,211,528 |
TOTAL GREECE | | 4,582,801 |
Hong Kong - 1.0% |
AIA Group Ltd. | 367,800 | | 2,052,480 |
Galaxy Entertainment Group Ltd. | 377,000 | | 2,577,888 |
TOTAL HONG KONG | | 4,630,368 |
India - 12.0% |
Apollo Hospitals Enterprise Ltd. (a) | 95,367 | | 1,730,678 |
Asian Paints India Ltd. | 187,223 | | 2,000,226 |
Axis Bank Ltd. (a) | 318,541 | | 2,347,721 |
Exide Industries Ltd. | 656,457 | | 1,683,042 |
Common Stocks - continued |
| Shares | | Value |
India - continued |
Grasim Industries Ltd. | 31,862 | | $ 1,911,983 |
Havells India Ltd. | 464,910 | | 2,162,206 |
HCL Technologies Ltd. | 103,727 | | 2,720,363 |
HDFC Bank Ltd. | 199,223 | | 3,230,472 |
Housing Development Finance Corp. Ltd. | 286,978 | | 5,168,255 |
ICICI Bank Ltd. (a) | 104,204 | | 2,767,346 |
ITC Ltd. (a) | 649,502 | | 3,755,361 |
Larsen & Toubro Ltd. (a) | 131,867 | | 3,553,714 |
LIC Housing Finance Ltd. | 356,022 | | 2,096,521 |
Lupin Ltd. | 97,479 | | 2,256,969 |
Mahindra & Mahindra Ltd. (a) | 124,483 | | 2,646,732 |
Motherson Sumi Systems Ltd. | 245,550 | | 1,681,244 |
Sun Pharmaceutical Industries Ltd. | 241,337 | | 3,321,241 |
Sun TV Ltd. | 406,377 | | 2,161,232 |
Tata Consultancy Services Ltd. | 101,831 | | 4,332,656 |
Tata Motors Ltd. (a) | 338,789 | | 2,959,874 |
Titan Co. Ltd. (a) | 362,283 | | 2,379,826 |
TOTAL INDIA | | 56,867,662 |
Indonesia - 6.3% |
PT ACE Hardware Indonesia Tbk | 27,477,500 | | 1,844,228 |
PT Astra International Tbk | 6,331,700 | | 3,550,256 |
PT Bank Central Asia Tbk | 3,853,700 | | 4,160,227 |
PT Bank Rakyat Indonesia Tbk | 3,931,900 | | 3,603,178 |
PT Global Mediacom Tbk | 16,706,500 | | 2,711,474 |
PT Indocement Tunggal Prakarsa Tbk | 1,295,600 | | 2,567,860 |
PT Jasa Marga Tbk | 4,237,000 | | 2,227,625 |
PT Media Nusantara Citra Tbk | 8,899,500 | | 2,063,171 |
PT Semen Gresik (Persero) Tbk | 2,051,600 | | 2,694,885 |
PT Surya Citra Media Tbk | 6,616,200 | | 1,852,002 |
PT Tower Bersama Infrastructure Tbk | 3,062,900 | | 2,256,117 |
TOTAL INDONESIA | | 29,531,023 |
Kenya - 1.2% |
East African Breweries Ltd. | 590,262 | | 1,880,656 |
Kenya Commercial Bank Ltd. | 2,996,500 | | 1,842,454 |
Safaricom Ltd. | 15,087,300 | | 2,057,742 |
TOTAL KENYA | | 5,780,852 |
Korea (South) - 5.9% |
Coway Co. Ltd. | 31,572 | | 2,397,773 |
KEPCO Plant Service & Engineering Co. Ltd. | 24,103 | | 1,967,372 |
Common Stocks - continued |
| Shares | | Value |
Korea (South) - continued |
NAVER Corp. | 6,755 | | $ 4,740,373 |
Samsung Electronics Co. Ltd. | 16,003 | | 18,528,384 |
TOTAL KOREA (SOUTH) | | 27,633,902 |
Luxembourg - 0.3% |
Samsonite International SA | 487,200 | | 1,618,832 |
Malaysia - 1.5% |
Astro Malaysia Holdings Bhd | 2,061,800 | | 2,068,491 |
Public Bank Bhd | 572,100 | | 3,224,097 |
Tune Insurance Holdings Bhd | 2,572,100 | | 1,696,878 |
TOTAL MALAYSIA | | 6,989,466 |
Malta - 0.5% |
Brait SA | 314,452 | | 2,362,862 |
Mexico - 6.0% |
Banregio Grupo Financiero S.A.B. de CV | 351,266 | | 2,031,493 |
Fomento Economico Mexicano S.A.B. de CV unit | 412,600 | | 3,968,436 |
Grupo Aeroportuario del Pacifico SA de CV Series B | 322,721 | | 2,195,689 |
Grupo Aeroportuario del Sureste SA de CV Series B | 196,200 | | 2,622,848 |
Grupo Aeroportuario Norte S.A.B. de CV | 403,100 | | 2,008,278 |
Grupo Financiero Banorte S.A.B. de CV Series O | 635,800 | | 4,078,846 |
Grupo Mexico SA de CV Series B | 359,900 | | 1,236,615 |
Grupo Televisa SA de CV | 605,900 | | 4,378,813 |
Megacable Holdings S.A.B. de CV unit | 433,184 | | 1,984,452 |
Promotora y Operadora de Infraestructura S.A.B. de CV (a) | 169,500 | | 2,153,262 |
Qualitas Controladora S.A.B. de CV | 595,600 | | 1,540,499 |
TOTAL MEXICO | | 28,199,231 |
Nigeria - 1.2% |
Dangote Cement PLC | 1,596,095 | | 2,071,599 |
Guaranty Trust Bank PLC GDR (Reg. S) | 234,654 | | 1,806,836 |
Nigerian Breweries PLC | 1,712,655 | | 1,674,918 |
TOTAL NIGERIA | | 5,553,353 |
Philippines - 2.9% |
Alliance Global Group, Inc. | 4,420,600 | | 2,486,409 |
GT Capital Holdings, Inc. | 102,075 | | 2,293,568 |
Metropolitan Bank & Trust Co. | 978,753 | | 1,795,844 |
Robinsons Retail Holdings, Inc. | 1,244,990 | | 1,771,838 |
SM Investments Corp. | 140,386 | | 2,446,316 |
SM Prime Holdings, Inc. | 7,009,000 | | 2,724,589 |
TOTAL PHILIPPINES | | 13,518,564 |
Common Stocks - continued |
| Shares | | Value |
Russia - 1.6% |
Magnit OJSC GDR (Reg. S) | 62,466 | | $ 4,185,222 |
NOVATEK OAO GDR (Reg. S) | 29,786 | | 3,199,016 |
TOTAL RUSSIA | | 7,384,238 |
South Africa - 9.0% |
Alexander Forbes Group Holding (a) | 2,350,892 | | 1,833,013 |
Aspen Pharmacare Holdings Ltd. | 112,493 | | 4,012,715 |
Bidvest Group Ltd. | 123,815 | | 3,405,495 |
Coronation Fund Managers Ltd. | 215,500 | | 1,865,885 |
FirstRand Ltd. | 792,700 | | 3,392,229 |
Life Healthcare Group Holdings Ltd. | 567,893 | | 2,147,024 |
Mr Price Group Ltd. | 134,900 | | 2,790,402 |
MTN Group Ltd. | 286,100 | | 6,329,101 |
Nampak Ltd. | 649,343 | | 2,647,472 |
Naspers Ltd. Class N | 63,200 | | 7,865,169 |
Remgro Ltd. | 128,900 | | 2,956,470 |
Sanlam Ltd. | 477,600 | | 3,015,920 |
TOTAL SOUTH AFRICA | | 42,260,895 |
Spain - 0.5% |
Amadeus IT Holding SA Class A | 65,600 | | 2,408,655 |
Sweden - 0.3% |
Atlas Copco AB (A Shares) | 54,300 | | 1,567,050 |
Switzerland - 1.3% |
Compagnie Financiere Richemont SA Series A | 27,200 | | 2,288,458 |
Nestle SA | 25,522 | | 1,871,634 |
SGS SA (Reg.) | 900 | | 1,975,576 |
TOTAL SWITZERLAND | | 6,135,668 |
Taiwan - 4.7% |
Delta Electronics, Inc. | 586,000 | | 3,510,048 |
Giant Manufacturing Co. Ltd. | 250,000 | | 2,021,088 |
Merida Industry Co. Ltd. | 307,650 | | 2,121,820 |
Taiwan Semiconductor Manufacturing Co. Ltd. | 3,332,000 | | 14,421,273 |
TOTAL TAIWAN | | 22,074,229 |
Thailand - 2.2% |
Airports of Thailand PCL (For. Reg.) | 357,100 | | 2,652,649 |
Bangkok Dusit Medical Services PCL (For. Reg.) | 3,688,200 | | 2,093,773 |
Bumrungrad Hospital PCL (For. Reg.) | 512,300 | | 2,091,609 |
Kasikornbank PCL (For. Reg.) | 521,900 | | 3,779,995 |
TOTAL THAILAND | | 10,618,026 |
Common Stocks - continued |
| Shares | | Value |
Turkey - 1.7% |
Coca-Cola Icecek Sanayi A/S | 103,050 | | $ 2,350,633 |
TAV Havalimanlari Holding A/S | 315,000 | | 2,643,129 |
Tofas Turk Otomobil Fabrikasi A/S | 53,264 | | 334,300 |
Tupras Turkiye Petrol Rafinelleri A/S | 115,000 | | 2,496,457 |
TOTAL TURKEY | | 7,824,519 |
United Arab Emirates - 0.9% |
DP World Ltd. | 101,794 | | 1,950,373 |
First Gulf Bank PJSC | 488,529 | | 2,414,049 |
TOTAL UNITED ARAB EMIRATES | | 4,364,422 |
United Kingdom - 2.9% |
Al Noor Hospitals Group PLC | 134,084 | | 2,185,696 |
Bank of Georgia Holdings PLC | 43,200 | | 1,769,140 |
British American Tobacco PLC (United Kingdom) | 30,700 | | 1,740,002 |
Burberry Group PLC | 88,668 | | 2,171,604 |
Diageo PLC | 65,047 | | 1,918,392 |
Intertek Group PLC | 43,100 | | 1,876,739 |
Prudential PLC | 82,684 | | 1,914,633 |
TOTAL UNITED KINGDOM | | 13,576,206 |
United States of America - 4.3% |
A.O. Smith Corp. | 39,500 | | 2,107,325 |
Google, Inc. Class C (a) | 3,250 | | 1,817,010 |
International Flavors & Fragrances, Inc. | 20,200 | | 2,002,830 |
Kansas City Southern | 16,020 | | 1,967,096 |
Las Vegas Sands Corp. | 33,900 | | 2,110,614 |
MasterCard, Inc. Class A | 25,200 | | 2,110,500 |
PPG Industries, Inc. | 10,900 | | 2,220,221 |
Praxair, Inc. | 13,100 | | 1,650,469 |
Visa, Inc. Class A | 8,900 | | 2,148,727 |
W.R. Grace & Co. (a) | 21,400 | | 2,024,440 |
TOTAL UNITED STATES OF AMERICA | | 20,159,232 |
TOTAL COMMON STOCKS (Cost $380,302,536) |
435,716,827
|
Nonconvertible Preferred Stocks - 5.4% |
| | | |
Brazil - 4.5% |
Ambev SA sponsored ADR | 838,480 | | 5,601,046 |
Banco Bradesco SA (PN) sponsored ADR | 432,300 | | 6,475,854 |
Nonconvertible Preferred Stocks - continued |
| Shares | | Value |
Brazil - continued |
Companhia Brasileira de Distribuicao Grupo Pao de Acucar sponsored ADR | 62,000 | | $ 2,591,600 |
Itau Unibanco Holding SA sponsored ADR | 455,380 | | 6,721,409 |
TOTAL BRAZIL | | 21,389,909 |
Colombia - 0.5% |
Grupo Aval Acciones y Valores SA | 3,213,624 | | 2,178,861 |
Germany - 0.4% |
Henkel AG & Co. KGaA | 18,700 | | 1,846,123 |
TOTAL NONCONVERTIBLE PREFERRED STOCKS (Cost $27,663,433) |
25,414,893
|
Money Market Funds - 3.3% |
| | | |
Fidelity Cash Central Fund, 0.11% (b) | 9,664,030 | | 9,664,030 |
Fidelity Securities Lending Cash Central Fund, 0.11% (b)(c) | 6,178,349 | | 6,178,349 |
TOTAL MONEY MARKET FUNDS (Cost $15,842,379) |
15,842,379
|
TOTAL INVESTMENT PORTFOLIO - 101.0% (Cost $423,808,348) | | 476,974,099 |
NET OTHER ASSETS (LIABILITIES) - (1.0)% | | (4,818,377) |
NET ASSETS - 100% | $ 472,155,722 |
Legend |
(a) Non-income producing |
(b) Affiliated fund that is generally available only to investment companies and other accounts managed by Fidelity Investments. The rate quoted is the annualized seven-day yield of the fund at period end. A complete unaudited listing of the fund's holdings as of its most recent quarter end is available upon request. In addition, each Fidelity Central Fund's financial statements, which are not covered by the Fund's Report of Independent Registered Public Accounting Firm, are available on the SEC's website or upon request. |
(c) Investment made with cash collateral received from securities on loan. |
(d) Security or a portion of the security is on loan at period end. |
(e) Security exempt from registration under Rule 144A of the Securities Act of 1933. These securities may be resold in transactions exempt from registration, normally to qualified institutional buyers. At the end of the period, the value of these securities amounted to $2,082,216 or 0.4% of net assets. |
Affiliated Central Funds |
Information regarding fiscal year to date income earned by the Fund from investments in Fidelity Central Funds is as follows: |
Fund | Income earned |
Fidelity Cash Central Fund | $ 4,725 |
Fidelity Securities Lending Cash Central Fund | 60,169 |
Total | $ 64,894 |
Other Information |
Categorizations in the Schedule of Investments are based on country or territory of incorporation. |
The following is a summary of the inputs used, as of October 31, 2014, involving the Fund's assets and liabilities carried at fair value. The inputs or methodology used for valuing securities may not be an indication of the risk associated with investing in those securities. For more information on valuation inputs, and their aggregation into the levels used in the tables below, please refer to the Investment Valuation section in the accompanying Notes to Financial Statements. |
Valuation Inputs at Reporting Date: |
Description | Total | Level 1 | Level 2 | Level 3 |
Investments in Securities: | | | | |
Equities: | | | | |
Consumer Discretionary | $ 88,530,930 | $ 45,967,075 | $ 42,563,855 | $ - |
Consumer Staples | 36,829,068 | 25,771,841 | 11,057,227 | - |
Energy | 8,755,812 | 8,755,812 | - | - |
Financials | 110,536,197 | 61,842,567 | 48,693,630 | - |
Health Care | 24,128,470 | 12,634,200 | 11,494,270 | - |
Industrials | 62,990,876 | 41,782,472 | 21,208,404 | - |
Valuation Inputs at Reporting Date: |
Description | Total | Level 1 | Level 2 | Level 3 |
Investments in Securities: | | | | |
Equities: | | | | |
Information Technology | $ 91,221,010 | $ 52,645,125 | $ 38,575,885 | $ - |
Materials | 23,028,600 | 13,853,646 | 9,174,954 | - |
Telecommunication Services | 10,642,960 | 8,386,843 | 2,256,117 | - |
Utilities | 4,467,797 | - | 4,467,797 | - |
Money Market Funds | 15,842,379 | 15,842,379 | - | - |
Total Investments in Securities: | $ 476,974,099 | $ 287,481,960 | $ 189,492,139 | $ - |
The following is a summary of transfers between Level 1 and Level 2 for the period ended October 31, 2014. Transfers are assumed to have occurred at the beginning of the period, and are primarily attributable to the valuation techniques used for foreign equity securities, as discussed in the accompanying Notes to Financial Statements: |
Transfers | Total |
Level 1 to Level 2 | $ 84,213,412 |
Level 2 to Level 1 | $ 0 |
See accompanying notes which are an integral part of the financial statements.
Annual Report
Statement of Assets and Liabilities
| October 31, 2014 |
| | |
Assets | | |
Investment in securities, at value (including securities loaned of $6,007,153) - See accompanying schedule: Unaffiliated issuers (cost $407,965,969) | $ 461,131,720 | |
Fidelity Central Funds (cost $15,842,379) | 15,842,379 | |
Total Investments (cost $423,808,348) | | $ 476,974,099 |
Foreign currency held at value (cost $269) | | 269 |
Receivable for investments sold | | 3,743,122 |
Receivable for fund shares sold | | 343,036 |
Dividends receivable | | 608,964 |
Distributions receivable from Fidelity Central Funds | | 3,396 |
Prepaid expenses | | 1,137 |
Other receivables | | 27,328 |
Total assets | | 481,701,351 |
| | |
Liabilities | | |
Payable for investments purchased | $ 1,618,764 | |
Payable for fund shares redeemed | 475,480 | |
Accrued management fee | 303,024 | |
Distribution and service plan fees payable | 108,098 | |
Other affiliated payables | 122,013 | |
Other payables and accrued expenses | 739,901 | |
Collateral on securities loaned, at value | 6,178,349 | |
Total liabilities | | 9,545,629 |
| | |
Net Assets | | $ 472,155,722 |
Net Assets consist of: | | |
Paid in capital | | $ 467,770,539 |
Undistributed net investment income | | 1,039,628 |
Accumulated undistributed net realized gain (loss) on investments and foreign currency transactions | | (49,234,244) |
Net unrealized appreciation (depreciation) on investments and assets and liabilities in foreign currencies | | 52,579,799 |
Net Assets | | $ 472,155,722 |
See accompanying notes which are an integral part of the financial statements.
Annual Report
Statement of Assets and Liabilities - continued
| October 31, 2014 |
| | |
Calculation of Maximum Offering Price Class A:
Net Asset Value and redemption price per share ($141,600,522 ÷ 6,055,753 shares) | | $ 23.38 |
| | |
Maximum offering price per share (100/94.25 of $23.38) | | $ 24.81 |
Class T:
Net Asset Value and redemption price per share ($54,340,913 ÷ 2,331,969 shares) | | $ 23.30 |
| | |
Maximum offering price per share (100/96.50 of $23.30) | | $ 24.15 |
Class B:
Net Asset Value and offering price per share ($7,545,548 ÷ 331,613 shares)A | | $ 22.75 |
| | |
Class C:
Net Asset Value and offering price per share ($64,025,961 ÷ 2,820,184 shares)A | | $ 22.70 |
| | |
Institutional Class:
Net Asset Value, offering price and redemption price per share ($199,098,363 ÷ 8,471,387 shares) | | $ 23.50 |
| | |
Class Z:
Net Asset Value, offering price and redemption price per share ($5,544,415 ÷ 235,887 shares) | | $ 23.50 |
A Redemption price per share is equal to net asset value less any applicable contingent deferred sales charge.
See accompanying notes which are an integral part of the financial statements.
Annual Report
Financial Statements - continued
Statement of Operations
| Year ended October 31, 2014 |
| | |
Investment Income | | |
Dividends | | $ 8,409,738 |
Interest | | 6 |
Income from Fidelity Central Funds | | 64,894 |
Income before foreign taxes withheld | | 8,474,638 |
Less foreign taxes withheld | | (755,643) |
Total income | | 7,718,995 |
| | |
Expenses | | |
Management fee | $ 3,460,066 | |
Transfer agent fees | 1,152,533 | |
Distribution and service plan fees | 1,315,927 | |
Accounting and security lending fees | 225,213 | |
Custodian fees and expenses | 327,370 | |
Independent trustees' compensation | 1,759 | |
Registration fees | 86,388 | |
Audit | 85,066 | |
Legal | 1,522 | |
Miscellaneous | 15,825 | |
Total expenses | | 6,671,669 |
Net investment income (loss) | | 1,047,326 |
Realized and Unrealized Gain (Loss) Net realized gain (loss) on: | | |
Investment securities: | | |
Unaffiliated issuers (net of foreign taxes of $45,790) | 3,803,938 | |
Foreign currency transactions | (306,431) | |
Total net realized gain (loss) | | 3,497,507 |
Change in net unrealized appreciation (depreciation) on: Investment securities (net of increase in deferred foreign taxes of $351,602) | 9,165,948 | |
Assets and liabilities in foreign currencies | 24,766 | |
Total change in net unrealized appreciation (depreciation) | | 9,190,714 |
Net gain (loss) | | 12,688,221 |
Net increase (decrease) in net assets resulting from operations | | $ 13,735,547 |
See accompanying notes which are an integral part of the financial statements.
Annual Report
Statement of Changes in Net Assets
| Year ended
October 31,
2014 | Year ended
October 31,
2013 |
Increase (Decrease) in Net Assets | | |
Operations | | |
Net investment income (loss) | $ 1,047,326 | $ 1,405,290 |
Net realized gain (loss) | 3,497,507 | 41,473,017 |
Change in net unrealized appreciation (depreciation) | 9,190,714 | 2,826,987 |
Net increase (decrease) in net assets resulting
from operations | 13,735,547 | 45,705,294 |
Distributions to shareholders from net investment income | (1,113,231) | (3,939,467) |
Distributions to shareholders from net realized gain | (185,956) | - |
Total distributions | (1,299,187) | (3,939,467) |
Share transactions - net increase (decrease) | 32,907,367 | (61,785,803) |
Redemption fees | 31,634 | 43,406 |
Total increase (decrease) in net assets | 45,375,361 | (19,976,570) |
| | |
Net Assets | | |
Beginning of period | 426,780,361 | 446,756,931 |
End of period (including undistributed net investment income of $1,039,628 and undistributed net investment income of $1,116,713, respectively) | $ 472,155,722 | $ 426,780,361 |
See accompanying notes which are an integral part of the financial statements.
Annual Report
Financial Highlights - Class A
Years ended October 31, | 2014 | 2013 | 2012 | 2011 | 2010 |
Selected Per-Share Data | | | | | |
Net asset value, beginning of period | $ 22.62 | $ 20.51 | $ 20.50 | $ 23.71 | $ 19.20 |
Income from Investment Operations | | | | | |
Net investment income (loss) C | .06 | .08 | .22 | .21 | .12 |
Net realized and unrealized gain (loss) | .76 | 2.23 | (.06) | (3.19) | 4.59 |
Total from investment operations | .82 | 2.31 | .16 | (2.98) | 4.71 |
Distributions from net investment income | (.05) | (.20) | (.15) | (.11) | (.07) |
Distributions from net realized gain | (.01) | - | - | (.13) | (.13) |
Total distributions | (.06) | (.20) | (.15) | (.24) | (.20) |
Redemption fees added to paid in capital C | - G | - G | - G | .01 | - G |
Net asset value, end of period | $ 23.38 | $ 22.62 | $ 20.51 | $ 20.50 | $ 23.71 |
Total ReturnA, B | 3.65% | 11.34% | .80% | (12.69)% | 24.69% |
Ratios to Average Net Assets D, F | | | | | |
Expenses before reductions | 1.52% | 1.56% | 1.54% | 1.54% | 1.56% |
Expenses net of fee waivers, if any | 1.52% | 1.55% | 1.54% | 1.54% | 1.56% |
Expenses net of all reductions | 1.52% | 1.50% | 1.48% | 1.47% | 1.50% |
Net investment income (loss) | .26% | .38% | 1.07% | .92% | .59% |
Supplemental Data | | | | | |
Net assets, end of period (000 omitted) | $ 141,601 | $ 146,378 | $ 160,464 | $ 202,477 | $ 286,970 |
Portfolio turnover rateE | 97% | 121% | 177% | 122% | 86% |
A Total returns would have been lower if certain expenses had not been reduced during the applicable periods shown.
B Total returns do not include the effect of the sales charges.
C Calculated based on average shares outstanding during the period.
D Fees and expenses of any underlying Fidelity Central Funds are not included in the Fund's expense ratio. The Fund indirectly bears its proportionate share of the expenses of any underlying Fidelity Central Funds.
E Amount does not include the portfolio activity of any underlying Fidelity Central Funds.
F Expense ratios reflect operating expenses of the class. Expenses before reductions do not reflect amounts reimbursed by the investment adviser or reductions from brokerage service arrangements or reductions from other expense offset arrangements and do not represent the amount paid by the class during periods when reimbursements or reductions occur. Expenses net of fee waivers reflect expenses after reimbursement by the investment adviser but prior to reductions from brokerage service arrangements or other expense offset arrangements. Expenses net of all reductions represent the net expenses paid by the class.
G Amount represents less than $.01 per share.
See accompanying notes which are an integral part of the financial statements.
Annual Report
Financial Highlights - Class T
Years ended October 31, | 2014 | 2013 | 2012 | 2011 | 2010 |
Selected Per-Share Data | | | | | |
Net asset value, beginning of period | $ 22.55 | $ 20.44 | $ 20.43 | $ 23.61 | $ 19.14 |
Income from Investment Operations | | | | | |
Net investment income (loss) C | - | .03 | .16 | .15 | .07 |
Net realized and unrealized gain (loss) | .76 | 2.22 | (.06) | (3.18) | 4.57 |
Total from investment operations | .76 | 2.25 | .10 | (3.03) | 4.64 |
Distributions from net investment income | - G | (.14) | (.09) | (.04) | (.04) |
Distributions from net realized gain | (.01) | - | - | (.13) | (.13) |
Total distributions | (.01) | (.14) | (.09) | (.16) H | (.17) |
Redemption fees added to paid in capital C | - G | - G | - G | .01 | - G |
Net asset value, end of period | $ 23.30 | $ 22.55 | $ 20.44 | $ 20.43 | $ 23.61 |
Total ReturnA, B | 3.39% | 11.06% | .49% | (12.89)% | 24.38% |
Ratios to Average Net Assets D, F | | | | | |
Expenses before reductions | 1.78% | 1.81% | 1.80% | 1.79% | 1.81% |
Expenses net of fee waivers, if any | 1.78% | 1.81% | 1.80% | 1.79% | 1.81% |
Expenses net of all reductions | 1.78% | 1.76% | 1.73% | 1.73% | 1.76% |
Net investment income (loss) | -% I | .13% | .81% | .66% | .33% |
Supplemental Data | | | | | |
Net assets, end of period (000 omitted) | $ 54,341 | $ 55,797 | $ 58,919 | $ 73,146 | $ 104,417 |
Portfolio turnover rateE | 97% | 121% | 177% | 122% | 86% |
A Total returns would have been lower if certain expenses had not been reduced during the applicable periods shown.
B Total returns do not include the effect of the sales charges.
C Calculated based on average shares outstanding during the period.
D Fees and expenses of any underlying Fidelity Central Funds are not included in the Fund's expense ratio. The Fund indirectly bears its proportionate share of the expenses of any underlying Fidelity Central Funds.
E Amount does not include the portfolio activity of any underlying Fidelity Central Funds.
F Expense ratios reflect operating expenses of the class. Expenses before reductions do not reflect amounts reimbursed by the investment adviser or reductions from brokerage service arrangements or reductions from other expense offset arrangements and do not represent the amount paid by the class during periods when reimbursements or reductions occur. Expenses net of fee waivers reflect expenses after reimbursement by the investment adviser but prior to reductions from brokerage service arrangements or other expense offset arrangements. Expenses net of all reductions represent the net expenses paid by the class.
G Amount represents less than $.01 per share.
H Total distributions of $.16 per share is comprised of distributions from net investment income of $.037 and distributions from net realized gain of $.125 per share.
I Amount represents less than .01%.
See accompanying notes which are an integral part of the financial statements.
Annual Report
Financial Highlights - Class B
Years ended October 31, | 2014 | 2013 | 2012 | 2011 | 2010 |
Selected Per-Share Data | | | | | |
Net asset value, beginning of period | $ 22.11 | $ 20.03 | $ 20.03 | $ 23.14 | $ 18.80 |
Income from Investment Operations | | | | | |
Net investment income (loss) C | (.11) | (.08) | .06 | .04 | (.03) |
Net realized and unrealized gain (loss) | .75 | 2.18 | (.06) | (3.13) | 4.49 |
Total from investment operations | .64 | 2.10 | - | (3.09) | 4.46 |
Distributions from net investment income | - | (.02) | - | (.01) | - |
Distributions from net realized gain | - | - | - | (.03) | (.12) |
Total distributions | - | (.02) | - | (.03) H | (.12) |
Redemption fees added to paid in capital C | - G | - G | - G | .01 | - G |
Net asset value, end of period | $ 22.75 | $ 22.11 | $ 20.03 | $ 20.03 | $ 23.14 |
Total ReturnA, B | 2.89% | 10.50% | -% | (13.33)% | 23.77% |
Ratios to Average Net Assets D, F | | | | | |
Expenses before reductions | 2.28% | 2.31% | 2.29% | 2.29% | 2.32% |
Expenses net of fee waivers, if any | 2.28% | 2.31% | 2.29% | 2.29% | 2.32% |
Expenses net of all reductions | 2.28% | 2.26% | 2.23% | 2.22% | 2.26% |
Net investment income (loss) | (.49)% | (.37)% | .32% | .16% | (.17)% |
Supplemental Data | | | | | |
Net assets, end of period (000 omitted) | $ 7,546 | $ 11,391 | $ 15,994 | $ 21,304 | $ 31,159 |
Portfolio turnover rateE | 97% | 121% | 177% | 122% | 86% |
A Total returns would have been lower if certain expenses had not been reduced during the applicable periods shown.
B Total returns do not include the effect of the contingent deferred sales charge.
C Calculated based on average shares outstanding during the period.
D Fees and expenses of any underlying Fidelity Central Funds are not included in the Fund's expense ratio. The Fund indirectly bears its proportionate share of the expenses of any underlying Fidelity Central Funds.
E Amount does not include the portfolio activity of any underlying Fidelity Central Funds.
F Expense ratios reflect operating expenses of the class. Expenses before reductions do not reflect amounts reimbursed by the investment adviser or reductions from brokerage service arrangements or reductions from other expense offset arrangements and do not represent the amount paid by the class during periods when reimbursements or reductions occur. Expenses net of fee waivers reflect expenses after reimbursement by the investment adviser but prior to reductions from brokerage service arrangements or other expense offset arrangements. Expenses net of all reductions represent the net expenses paid by the class.
G Amount represents less than $.01 per share.
H Total distributions of $.03 per share is comprised of distributions from net investment income of $.005 and distributions from net realized gain of $.025 per share.
See accompanying notes which are an integral part of the financial statements.
Annual Report
Financial Highlights - Class C
Years ended October 31, | 2014 | 2013 | 2012 | 2011 | 2010 |
Selected Per-Share Data | | | | | |
Net asset value, beginning of period | $ 22.06 | $ 20.00 | $ 20.00 | $ 23.13 | $ 18.80 |
Income from Investment Operations | | | | | |
Net investment income (loss) C | (.11) | (.08) | .06 | .04 | (.03) |
Net realized and unrealized gain (loss) | .75 | 2.18 | (.06) | (3.12) | 4.49 |
Total from investment operations | .64 | 2.10 | - | (3.08) | 4.46 |
Distributions from net investment income | - | (.04) | - | (.01) | - |
Distributions from net realized gain | - | - | - | (.05) | (.13) |
Total distributions | - | (.04) | - | (.06) | (.13) |
Redemption fees added to paid in capital C | - G | - G | - G | .01 | - G |
Net asset value, end of period | $ 22.70 | $ 22.06 | $ 20.00 | $ 20.00 | $ 23.13 |
Total ReturnA, B | 2.90% | 10.49% | -% | (13.33)% | 23.80% |
Ratios to Average Net Assets D, F | | | | | |
Expenses before reductions | 2.27% | 2.31% | 2.29% | 2.28% | 2.30% |
Expenses net of fee waivers, if any | 2.27% | 2.30% | 2.29% | 2.28% | 2.30% |
Expenses net of all reductions | 2.27% | 2.25% | 2.23% | 2.22% | 2.24% |
Net investment income (loss) | (.49)% | (.37)% | .32% | .17% | (.15)% |
Supplemental Data | | | | | |
Net assets, end of period (000 omitted) | $ 64,026 | $ 62,532 | $ 65,598 | $ 80,855 | $ 106,711 |
Portfolio turnover rateE | 97% | 121% | 177% | 122% | 86% |
A Total returns would have been lower if certain expenses had not been reduced during the applicable periods shown.
B Total returns do not include the effect of the contingent deferred sales charge.
C Calculated based on average shares outstanding during the period.
D Fees and expenses of any underlying Fidelity Central Funds are not included in the Fund's expense ratio. The Fund indirectly bears its proportionate share of the expenses of any underlying Fidelity Central Funds.
E Amount does not include the portfolio activity of any underlying Fidelity Central Funds.
F Expense ratios reflect operating expenses of the class. Expenses before reductions do not reflect amounts reimbursed by the investment adviser or reductions from brokerage service arrangements or reductions from other expense offset arrangements and do not represent the amount paid by the class during periods when reimbursements or reductions occur. Expenses net of fee waivers reflect expenses after reimbursement by the investment adviser but prior to reductions from brokerage service arrangements or other expense offset arrangements. Expenses net of all reductions represent the net expenses paid by the class.
G Amount represents less than $.01 per share.
See accompanying notes which are an integral part of the financial statements.
Annual Report
Financial Highlights - Institutional Class
Years ended October 31, | 2014 | 2013 | 2012 | 2011 | 2010 |
Selected Per-Share Data | | | | | |
Net asset value, beginning of period | $ 22.73 | $ 20.61 | $ 20.63 | $ 23.87 | $ 19.29 |
Income from Investment Operations | | | | | |
Net investment income (loss) B | .14 | .15 | .28 | .29 | .20 |
Net realized and unrealized gain (loss) | .76 | 2.25 | (.06) | (3.21) | 4.62 |
Total from investment operations | .90 | 2.40 | .22 | (2.92) | 4.82 |
Distributions from net investment income | (.12) | (.28) | (.24) | (.20) | (.11) |
Distributions from net realized gain | (.01) | - | - | (.13) | (.13) |
Total distributions | (.13) | (.28) | (.24) | (.33) | (.24) |
Redemption fees added to paid in capital B | - F | - F | - F | .01 | - F |
Net asset value, end of period | $ 23.50 | $ 22.73 | $ 20.61 | $ 20.63 | $ 23.87 |
Total ReturnA | 4.00% | 11.73% | 1.08% | (12.41)% | 25.15% |
Ratios to Average Net Assets C, E | | | | | |
Expenses before reductions | 1.18% | 1.23% | 1.22% | 1.21% | 1.22% |
Expenses net of fee waivers, if any | 1.18% | 1.22% | 1.22% | 1.21% | 1.22% |
Expenses net of all reductions | 1.18% | 1.18% | 1.16% | 1.14% | 1.17% |
Net investment income (loss) | .60% | .71% | 1.39% | 1.25% | .93% |
Supplemental Data | | | | | |
Net assets, end of period (000 omitted) | $ 199,098 | $ 150,576 | $ 145,782 | $ 138,312 | $ 184,789 |
Portfolio turnover rateD | 97% | 121% | 177% | 122% | 86% |
A Total returns would have been lower if certain expenses had not been reduced during the applicable periods shown.
B Calculated based on average shares outstanding during the period.
C Fees and expenses of any underlying Fidelity Central Funds are not included in the Fund's expense ratio. The Fund indirectly bears its proportionate share of the expenses of any underlying Fidelity Central Funds.
D Amount does not include the portfolio activity of any underlying Fidelity Central Funds.
E Expense ratios reflect operating expenses of the class. Expenses before reductions do not reflect amounts reimbursed by the investment adviser or reductions from brokerage service arrangements or reductions from other expense offset arrangements and do not represent the amount paid by the class during periods when reimbursements or reductions occur. Expenses net of fee waivers reflect expenses after reimbursement by the investment adviser but prior to reductions from brokerage service arrangements or other expense offset arrangements. Expenses net of all reductions represent the net expenses paid by the class.
F Amount represents less than $.01 per share.
See accompanying notes which are an integral part of the financial statements.
Annual Report
Financial Highlights - Class Z
Years ended October 31, | 2014 | 2013 G |
Selected Per-Share Data | | |
Net asset value, beginning of period | $ 22.73 | $ 21.33 |
Income from Investment Operations | | |
Net investment income (loss) D | .18 | .03 |
Net realized and unrealized gain (loss) | .76 | 1.37 |
Total from investment operations | .94 | 1.40 |
Distributions from net investment income | (.16) | - |
Distributions from net realized gain | (.01) | - |
Total distributions | (.17) | - |
Redemption fees added to paid in capital D, I | - | - |
Net asset value, end of period | $ 23.50 | $ 22.73 |
Total ReturnB, C | 4.19% | 6.56% |
Ratios to Average Net Assets E, H | | |
Expenses before reductions | 1.02% | 1.05%A |
Expenses net of fee waivers, if any | 1.02% | 1.05%A |
Expenses net of all reductions | 1.02% | 1.00%A |
Net investment income (loss) | .77% | .62%A |
Supplemental Data | | |
Net assets, end of period (000 omitted) | $ 5,544 | $ 107 |
Portfolio turnover rateF | 97% | 121% |
A Annualized
B Total returns for periods of less than one year are not annualized.
C Total returns would have been lower if certain expenses had not been reduced during the applicable periods shown.
D Calculated based on average shares outstanding during the period.
E Fees and expenses of any underlying Fidelity Central Funds are not included in the Fund's expense ratio. The Fund indirectly bears its proportionate share of the expenses of any underlying Fidelity Central Funds.
F Amount does not include the portfolio activity of any underlying Fidelity Central Funds.
G For the period August 13, 2013 (commencement of sale of shares) to October 31, 2013.
H Expense ratios reflect operating expenses of the class. Expenses before reductions do not reflect amounts reimbursed by the investment adviser or reductions from brokerage service arrangements or reductions from other expense offset arrangements and do not represent the amount paid by the class during periods when reimbursements or reductions occur. Expense ratios before reductions for start-up periods may not be representative of longer-term operating periods. Expenses net of fee waivers reflect expenses after reimbursement by the investment adviser but prior to reductions from brokerage service arrangements or other expense offset arrangements. Expenses net of all reductions represent the net expenses paid by the class.
I Amount represents less than $.01 per share.
See accompanying notes which are an integral part of the financial statements.
Annual Report
Notes to Financial Statements
For the period ended October 31, 2014
1. Organization.
Fidelity Advisor Emerging Markets Fund (the Fund) is a fund of Fidelity Advisor Series VIII (the Trust) and is authorized to issue an unlimited number of shares. The Trust is registered under the Investment Company Act of 1940, as amended (the 1940 Act), as an open-end management investment company organized as a Massachusetts business trust. The Fund offers Class A, Class T, Class C, Institutional Class and Class Z shares, each of which, along with Class B shares, has equal rights as to assets and voting privileges. Class B shares are closed to new accounts and additional purchases, except for exchanges and reinvestments. Each class has exclusive voting rights with respect to matters that affect that class. Class B shares will automatically convert to Class A shares after a holding period of seven years from the initial date of purchase. The Fund's investments in emerging markets can be subject to social, economic, regulatory, and political uncertainties and can be extremely volatile.
2. Investments in Fidelity Central Funds.
The Fund invests in Fidelity Central Funds, which are open-end investment companies generally available only to other investment companies and accounts managed by the investment adviser and its affiliates. The Fund's Schedule of Investments lists each of the Fidelity Central Funds held as of period end, if any, as an investment of the Fund, but does not include the underlying holdings of each Fidelity Central Fund. As an Investing Fund, the Fund indirectly bears its proportionate share of the expenses of the underlying Fidelity Central Funds.
The Money Market Central Funds seek preservation of capital and current income and are managed by Fidelity Investments Money Management, Inc. (FIMM), an affiliate of the investment adviser. Annualized expenses of the Money Market Central Funds as of their most recent shareholder report date are less than .01%.
A complete unaudited list of holdings for each Fidelity Central Fund is available upon request or at the Securities and Exchange Commission (the SEC) website at www.sec.gov. In addition, the financial statements of the Fidelity Central Funds, which are not covered by the Fund's Report of Independent Registered Public Accounting Firm, are available on the SEC website or upon request.
3. Significant Accounting Policies.
The financial statements have been prepared in conformity with accounting principles generally accepted in the United States of America (GAAP), which require management to make certain estimates and assumptions at the date of the financial statements. Actual results could differ from those estimates. Subsequent events, if any, through the date that the financial statements were issued have been evaluated in the preparation of
Annual Report
3. Significant Accounting Policies - continued
the financial statements. The following summarizes the significant accounting policies of the Fund:
Investment Valuation. Investments are valued as of 4:00 p.m. Eastern time on the last calendar day of the period. In accordance with valuation policies and procedures approved by the Board of Trustees (the Board), the Fund attempts to obtain prices from one or more third party pricing vendors or brokers to value its investments. When current market prices, quotations or currency exchange rates are not readily available or reliable, investments will be fair valued in good faith by the Fidelity Management & Research Company (FMR)Fair Value Committee (the Committee), in accordance with procedures adopted by the Board. Factors used in determining fair value vary by investment type and may include market or investment specific events. The frequency with which these procedures are used cannot be predicted and they may be utilized to a significant extent. The Committee oversees the Fund's valuation policies and procedures and is responsible for approving and reporting to the Board all fair value determinations.
The Fund categorizes the inputs to valuation techniques used to value its investments into a disclosure hierarchy consisting of three levels as shown below:
Level 1 - quoted prices in active markets for identical investments
Level 2 - other significant observable inputs (including quoted prices for similar investments, interest rates, prepayment speeds, etc.)
Level 3 - unobservable inputs (including the Fund's own assumptions based on the best information available)
Valuation techniques used to value the Fund's investments by major category are as follows:
Equity securities, including restricted securities, for which market quotations are readily available, are valued at the last reported sale price or official closing price as reported by a third party pricing vendor on the primary market or exchange on which they are traded and are categorized as Level 1 in the hierarchy. In the event there were no sales during the day or closing prices are not available, securities are valued at the last quoted bid price or may be valued using the last available price and are generally categorized as Level 2 in the hierarchy. For foreign equity securities, when market or security specific events arise, comparisons to the valuation of American Depositary Receipts (ADRs), futures contracts, Exchange-Traded Funds (ETFs) and certain indexes as well as quoted prices for similar securities may be used and would be categorized as Level 2 in the hierarchy. Utilizing these techniques may result in transfers between Level 1 and Level 2. For equity securities, including restricted securities, where observable inputs are
Annual Report
Notes to Financial Statements - continued
3. Significant Accounting Policies - continued
Investment Valuation - continued
limited, assumptions about market activity and risk are used and these securities may be categorized as Level 3 in the hierarchy.
Investments in open-end mutual funds, including the Fidelity Central Funds, are valued at their closing net asset value (NAV) each business day and are categorized as Level 1 in the hierarchy.
Changes in valuation techniques may result in transfers in or out of an assigned level within the disclosure hierarchy. The aggregate value of investments by input level, as of October 31, 2014, including information on transfers between Levels 1 and 2, is included at the end of the Fund's Schedule of Investments.
Foreign Currency. The Fund may use foreign currency contracts to facilitate transactions in foreign-denominated securities. Gains and losses from these transactions may arise from changes in the value of the foreign currency or if the counterparties do not perform under the contracts' terms.
Foreign-denominated assets, including investment securities, and liabilities are translated into U.S. dollars at the exchange rates at period end. Purchases and sales of investment securities, income and dividends received and expenses denominated in foreign currencies are translated into U.S. dollars at the exchange rate in effect on the transaction date.
The effects of exchange rate fluctuations on investments are included with the net realized and unrealized gain (loss) on investment securities. Other foreign currency transactions resulting in realized and unrealized gain (loss) are disclosed separately.
Investment Transactions and Income. For financial reporting purposes, the Fund's investment holdings and NAV include trades executed through the end of the last business day of the period. The NAV per share for processing shareholder transactions is calculated as of the close of business of the New York Stock Exchange (NYSE), normally 4:00 p.m. Eastern time and includes trades executed through the end of the prior business day. Gains and losses on securities sold are determined on the basis of identified cost and may include proceeds received from litigation. Dividend income is recorded on the ex-dividend date, except for certain dividends from foreign securities where the ex-dividend date may have passed, which are recorded as soon as the Fund is informed of the ex-dividend date. Non-cash dividends included in dividend income, if any, are recorded at the fair market value of the securities received. Income and capital gain distributions from Fidelity Central Funds, if any, are recorded on the ex-dividend date. Interest income is accrued as earned and includes coupon interest and amortization of
Annual Report
3. Significant Accounting Policies - continued
Investment Transactions and Income - continued
premium and accretion of discount on debt securities as applicable. Investment income is recorded net of foreign taxes withheld where recovery of such taxes is uncertain.
Class Allocations and Expenses. Investment income, realized and unrealized capital gains and losses, common expenses of the Fund, and certain fund-level expense reductions, if any, are allocated daily on a pro-rata basis to each class based on the relative net assets of each class to the total net assets of the Fund. Each class differs with respect to transfer agent and distribution and service plan fees incurred. Certain expense reductions may also differ by class. For the reporting period, the allocated portion of income and expenses to each class as a percent of its average net assets may vary due to the timing of recording these transactions in relation to fluctuating net assets of the classes. Expenses directly attributable to a fund are charged to that fund. Expenses attributable to more than one fund are allocated among the respective funds on the basis of relative net assets or other appropriate methods. Expense estimates are accrued in the period to which they relate and adjustments are made when actual amounts are known.
Income Tax Information and Distributions to Shareholders. Each year, the Fund intends to qualify as a regulated investment company under Subchapter M of the Internal Revenue Code, including distributing substantially all of its taxable income and realized gains. As a result, no provision for U.S. Federal income taxes is required. As of October 31, 2014, the Fund did not have any unrecognized tax benefits in the financial statements; nor is the Fund aware of any tax positions for which it is reasonably possible that the total amounts of unrecognized tax benefits will significantly change in the next twelve months. The Fund files a U.S. federal tax return, in addition to state and local tax returns as required. The Fund's federal income tax returns are subject to examination by the Internal Revenue Service (IRS) for a period of three fiscal years after they are filed. State and local tax returns may be subject to examination for an additional fiscal year depending on the jurisdiction. Foreign taxes are provided for based on the Fund's understanding of the tax rules and rates that exist in the foreign markets in which it invests. The Fund is subject to a tax imposed on capital gains by certain countries in which it invests. An estimated deferred tax liability for net unrealized appreciation on the applicable securities is included in Other payables and accrued expenses on the Statement of Assets & Liabilities.
Distributions are declared and recorded on the ex-dividend date. Income dividends and capital gain distributions are declared separately for each class. Income and capital gain distributions are determined in accordance with income tax regulations, which may differ from GAAP.
Annual Report
Notes to Financial Statements - continued
3. Significant Accounting Policies - continued
Income Tax Information and Distributions to Shareholders - continued
Capital accounts within the financial statements are adjusted for permanent book-tax differences. These adjustments have no impact on net assets or the results of operations. Capital accounts are not adjusted for temporary book-tax differences which will reverse in a subsequent period.
Book-tax differences are primarily due to foreign currency transactions, certain foreign taxes, passive foreign investment companies (PFIC), capital loss carryforwards and losses deferred due to wash sales.
The federal tax cost of investment securities and unrealized appreciation (depreciation) as of period end were as follows:
Gross unrealized appreciation | $ 66,685,836 |
Gross unrealized depreciation | (15,307,195) |
Net unrealized appreciation (depreciation) on securities | $ 51,378,641 |
| |
Tax Cost | $ 425,595,458 |
The tax-based components of distributable earnings as of period end were as follows:
Undistributed ordinary income | $ 1,512,034 |
Capital loss carryforward | $ (47,911,843) |
Net unrealized appreciation (depreciation) on securities and other investments | $ 51,375,725 |
Capital loss carryforwards are only available to offset future capital gains of the Fund to the extent provided by regulations and may be limited. Under the Regulated Investment Company Modernization Act of 2010 (the Act), the Fund is permitted to carry forward capital losses incurred in taxable years beginning after December 22, 2010 for an unlimited period and such capital losses are required to be used prior to any losses that expire. The capital loss carryforward information presented below, including any applicable limitation, is estimated as of fiscal period end and is subject to adjustment.
Fiscal year of expiration | |
2017 | (47,911,843) |
The tax character of distributions paid was as follows:
| October 31, 2014 | October 31, 2014 |
Ordinary Income | $ 1,299,187 | $ 3,939,467 |
Annual Report
3. Significant Accounting Policies - continued
Short-Term Trading (Redemption) Fees. Shares held by investors in the Fund less than 90 days may have been subject to a redemption fee equal to 1.50% of the NAV of shares redeemed. All redemption fees, which reduce the proceeds of the shareholder redemption, are retained by the Fund and accounted for as an addition to paid in capital.
Restricted Securities. The Fund may invest in securities that are subject to legal or contractual restrictions on resale. These securities generally may be resold in transactions exempt from registration or to the public if the securities are registered. Disposal of these securities may involve time-consuming negotiations and expense, and prompt sale at an acceptable price may be difficult. Information regarding restricted securities is included at the end of the Fund's Schedule of Investments.
New Accounting Pronouncement. In June 2014, the Financial Accounting Standards Board issued Accounting Standard Update No. 2014-11, Repurchase-to-Maturity Transactions, Repurchase Financings, and Disclosures. The Update amends the accounting for certain repurchase agreements and expands disclosure requirements for reverse repurchase agreements, securities lending and other similar transactions. The disclosure requirements are effective for annual and interim reporting periods beginning after December 15, 2014. Management is currently evaluating the impact of the Update on the Fund's financial statements and related disclosures.
4. Purchases and Sales of Investments.
Purchases and sales of securities, other than short-term securities, aggregated $437,142,621 and $415,557,893, respectively.
5. Fees and Other Transactions with Affiliates.
Management Fee. Fidelity Management & Research Company (the investment adviser) and its affiliates provide the Fund with investment management related services for which the Fund pays a monthly management fee. The management fee is the sum of an individual fund fee rate that is based on an annual rate of .55% of the Fund's average net assets and an annualized group fee rate that averaged .25% during the period. The group fee rate is based upon the average net assets of all the mutual funds advised by the investment adviser, including any mutual funds previously advised by the investment adviser that are currently advised by Fidelity SelectCo, LLC, an affiliate of the investment adviser. The group fee rate decreases as assets under management increase and increases as assets under management decrease. For the reporting period, the total annual management fee rate was .80% of the Fund's average net assets.
Distribution and Service Plan Fees. In accordance with Rule 12b-1 of the 1940 Act, the Fund has adopted separate Distribution and Service Plans for each class of shares,
Annual Report
Notes to Financial Statements - continued
5. Fees and Other Transactions with Affiliates - continued
Distribution and Service Plan Fees - continued
except for the and Institutional Class. Certain classes pay Fidelity Distributors Corporation (FDC), an affiliate of the investment adviser, separate Distribution and Service Fees, each of which is based on an annual percentage of each class' average net assets. In addition, FDC may pay financial intermediaries for selling shares of the Fund and providing shareholder support services. For the period, the Distribution and Service Fee rates, total fees and amounts retained by FDC were as follows:
| Distribution
Fee | Service
Fee | Total Fees | Retained
by FDC |
Class A | -% | .25% | $ 350,341 | $ 5,200 |
Class T | .25% | .25% | 265,578 | 626 |
Class B | .75% | .25% | 92,016 | 69,179 |
Class C | .75% | .25% | 607,992 | 61,955 |
| | | $ 1,315,927 | $ 136,960 |
Sales Load. FDC may receive a front-end sales charge of up to 5.75% for selling Class A shares and 3.50% for selling Class T shares, some of which is paid to financial intermediaries for selling shares of the Fund. Depending on the holding period, FDC may receive contingent deferred sales charges levied on Class A, Class T, Class B, and Class C redemptions. The deferred sales charges range from 5.00% to 1.00% for Class B shares, 1.00% for Class C shares, 1.00% for certain purchases of Class A shares and .25% for certain purchases of Class T shares.
For the period, sales charge amounts retained by FDC were as follows:
| Retained
by FDC |
Class A | $ 64,103 |
Class T | 10,819 |
Class B* | 9,745 |
Class C* | 5,005 |
| $ 89,672 |
* When Class B and Class C shares are initially sold, FDC pays commissions from its own resources to financial intermediaries through which the sales are made.
Transfer Agent Fees. Fidelity Investments Institutional Operations Company, Inc., (FIIOC), an affiliate of the investment adviser, is the transfer, dividend disbursing and shareholder servicing agent for each class of the Fund. FIIOC receives account fees and asset-based fees that vary according to the account size and type of account of the shareholders of the respective classes of the Fund, except for Class Z. FIIOC receives an asset-based fee of Class Z's average net assets. FIIOC pays for typesetting, printing and mailing of shareholder reports, except proxy statements.
Annual Report
5. Fees and Other Transactions with Affiliates - continued
Transfer Agent Fees - continued
For the period, transfer agent fees for each class were as follows:
| Amount | % of
Class-Level Average
Net Assets |
Class A | $ 425,849 | .30 |
Class T | 164,544 | .31 |
Class B | 27,883 | .30 |
Class C | 184,802 | .30 |
Institutional Class | 348,372 | .21 |
Class Z | 1,083 | .05 |
| $ 1,152,533 | |
Accounting and Security Lending Fees. Fidelity Service Company, Inc. (FSC), an affiliate of the investment adviser, maintains the Fund's accounting records. The accounting fee is based on the level of average net assets for each month. Under a separate contract, FSC administers the security lending program. The security lending fee is based on the number and duration of lending transactions.
Brokerage Commissions. The Fund placed a portion of its portfolio transactions with brokerage firms which are affiliates of the investment adviser. Brokerage commissions are included in net realized gain (loss) and change in net unrealized appreciation (depreciation) in the Statement of Operations. The commissions paid to these affiliated firms were $1,690 for the period.
6. Committed Line of Credit.
The Fund participates with other funds managed by the investment adviser or an affiliate in a $4.25 billion credit facility (the "line of credit") to be utilized for temporary or emergency purposes to fund shareholder redemptions or for other short-term liquidity purposes. The Fund has agreed to pay commitment fees on its pro-rata portion of the line of credit, which amounted to $690 and is reflected in Miscellaneous expenses on the Statement of Operations. During the period, the Fund did not borrow on this line of credit.
7. Security Lending.
The Fund lends portfolio securities through a lending agent from time to time in order to earn additional income. For equity securities, a lending agent is used and may loan securities to certain qualified borrowers, including Fidelity Capital Markets (FCM), a
Annual Report
Notes to Financial Statements - continued
7. Security Lending - continued
broker-dealer affiliated with the Fund. On the settlement date of the loan, the Fund receives collateral (in the form of U.S. Treasury obligations, letters of credit and/or cash) against the loaned securities and maintains collateral in an amount not less than 100% of the market value of the loaned securities during the period of the loan. The market value of the loaned securities is determined at the close of business of the Fund and any additional required collateral is delivered to the Fund on the next business day. If the borrower defaults on its obligation to return the securities loaned because of insolvency or other reasons, the Fund may apply collateral received from the borrower against the obligation. The Fund may experience delays and costs in recovering the securities loaned. Any cash collateral received is invested in the Fidelity Securities Lending Cash Central Fund. The value of loaned securities and cash collateral at period end are disclosed on the Fund's Statement of Assets and Liabilities. Security lending income represents the income earned on investing cash collateral, less rebates paid to borrowers and any lending agent fees associated with the loan, plus any premium payments received for lending certain types of securities. Security lending income is presented in the Statement of Operations as a component of income from Fidelity Central Funds. Total security lending income during the period amounted to $60,169. During the period, there were no securities loaned to FCM.
8. Distributions to Shareholders.
Distributions to shareholders of each class were as follows:
Years ended October 31, | 2014 | 2013 |
From net investment income | | |
Class A | $ 314,541 | $ 1,535,570 |
Class T | 2,453 | 390,398 |
Class B | - | 16,014 |
Class C | - | 114,064 |
Institutional Class | 791,098 | 1,883,421 |
Class Z | 5,139 | - |
Total | $ 1,113,231 | $ 3,939,467 |
From net realized gain | | |
Class A | $ 77,030 | $ - |
Class T | 29,431 | - |
Institutional Class | 79,110 | - |
Class Z | 385 | - |
Total | $ 185,956 | $ - |
Annual Report
9. Share Transactions.
Share transactions for each class were as follows and may contain automatic conversions between classes or exchanges between funds:
| Shares | Dollars |
Years ended October 31, | 2014 | 2013A | 2014 | 2013A |
Class A | | | | |
Shares sold | 1,306,708 | 1,531,175 | $ 29,667,252 | $ 33,017,349 |
Reinvestment of distributions | 16,164 | 66,573 | 356,894 | 1,392,653 |
Shares redeemed | (1,739,459) | (2,949,139) | (38,968,004) | (63,054,707) |
Net increase (decrease) | (416,587) | (1,351,391) | $ (8,943,858) | $ (28,644,705) |
Class T | | | | |
Shares sold | 414,394 | 561,309 | $ 9,392,831 | $ 12,048,127 |
Reinvestment of distributions | 1,397 | 17,796 | 30,813 | 372,006 |
Shares redeemed | (558,505) | (986,849) | (12,438,338) | (20,912,996) |
Net increase (decrease) | (142,714) | (407,744) | $ (3,014,694) | $ (8,492,863) |
Class B | | | | |
Shares sold | 16,905 | 34,695 | $ 374,479 | $ 732,488 |
Reinvestment of distributions | - | 627 | - | 12,965 |
Shares redeemed | (200,427) | (318,597) | (4,400,967) | (6,698,614) |
Net increase (decrease) | (183,522) | (283,275) | $ (4,026,488) | $ (5,953,161) |
Class C | | | | |
Shares sold | 651,900 | 507,210 | $ 14,559,904 | $ 10,683,514 |
Reinvestment of distributions | - | 4,797 | - | 98,768 |
Shares redeemed | (666,053) | (957,148) | (14,339,508) | (19,925,235) |
Net increase (decrease) | (14,153) | (445,141) | $ 220,396 | $ (9,142,953) |
Institutional Class | | | | |
Shares sold | 2,772,401 | 1,298,034 | $ 64,467,777 | $ 27,937,972 |
Reinvestment of distributions | 36,756 | 84,781 | 813,035 | 1,776,730 |
Shares redeemed | (963,648) | (1,828,795) | (22,091,792) | (39,366,823) |
Net increase (decrease) | 1,845,509 | (445,980) | $ 43,189,020 | $ (9,652,121) |
Class Z | | | | |
Shares sold | 251,250 | 4,688 | $ 5,945,448 | $ 100,000 |
Reinvestment of distributions | 250 | - | 5,524 | - |
Shares redeemed | (20,301) | - | (467,981) | - |
Net increase (decrease) | 231,199 | 4,688 | $ 5,482,991 | $ 100,000 |
A Share transactions for Class Z are for the period August 31, 2013 (commencement of sale of shares) to October 31, 2013.
Annual Report
Notes to Financial Statements - continued
10. Other.
The Fund's organizational documents provide former and current trustees and officers with a limited indemnification against liabilities arising in connection with the performance of their duties to the Fund. In the normal course of business, the Fund may also enter into contracts that provide general indemnifications. The Fund's maximum exposure under these arrangements is unknown as this would be dependent on future claims that may be made against the Fund. The risk of material loss from such claims is considered remote.
Annual Report
To the Trustees of Fidelity Advisor Series VIII and Shareholders of Fidelity Advisor Emerging Markets Fund:
We have audited the accompanying statement of assets and liabilities of Fidelity Advisor Emerging Markets Fund (the Fund), a fund of Fidelity Advisor Series VIII, including the schedule of investments, as of October 31, 2014, and the related statement of operations for the year then ended, the statement of changes in net assets for each of the two years in the period then ended, and the financial highlights for each of the five years in the period then ended. These financial statements and financial highlights are the responsibility of the Fund's management. Our responsibility is to express an opinion on these financial statements and financial highlights based on our audits.
We conducted our audits in accordance with the standards of the Public Company Accounting Oversight Board (United States). Those standards require that we plan and perform the audit to obtain reasonable assurance about whether the financial statements and financial highlights are free of material misstatement. The Fund is not required to have, nor were we engaged to perform, an audit of its internal control over financial reporting. Our audits included consideration of internal control over financial reporting as a basis for designing audit procedures that are appropriate in the circumstances, but not for the purpose of expressing an opinion on the effectiveness of the Fund's internal control over financial reporting. Accordingly, we express no such opinion. An audit also includes examining, on a test basis, evidence supporting the amounts and disclosures in the financial statements, assessing the accounting principles used and significant estimates made by management, as well as evaluating the overall financial statement presentation. Our procedures included confirmation of securities owned as of October 31, 2014, by correspondence with the custodians and brokers; where replies were not received from brokers, we performed other auditing procedures. We believe that our audits provide a reasonable basis for our opinion.
In our opinion, the financial statements and financial highlights referred to above present fairly, in all material respects, the financial position of Fidelity Advisor Emerging Markets Fund as of October 31, 2014, the results of its operations for the year then ended, the changes in its net assets for each of the two years in the period then ended, and the financial highlights for each of the five years in the period then ended, in conformity with accounting principles generally accepted in the United States of America.
DELOITTE & TOUCHE LLP
Boston, Massachusetts
December 16, 2014
Annual Report
The Trustees, Member of the Advisory Board, and officers of the trust and fund, as applicable, are listed below. The Board of Trustees governs the fund and is responsible for protecting the interests of shareholders. The Trustees are experienced executives who meet periodically throughout the year to oversee the fund's activities, review contractual arrangements with companies that provide services to the fund, oversee management of the risks associated with such activities and contractual arrangements, and review the fund's performance. Except for James C. Curvey, each of the Trustees oversees 174 funds. Mr. Curvey oversees 407 funds.
The Trustees hold office without limit in time except that (a) any Trustee may resign; (b) any Trustee may be removed by written instrument, signed by at least two-thirds of the number of Trustees prior to such removal; (c) any Trustee who requests to be retired or who has become incapacitated by illness or injury may be retired by written instrument signed by a majority of the other Trustees; and (d) any Trustee may be removed at any special meeting of shareholders by a two-thirds vote of the outstanding voting securities of the trust. Each Trustee who is not an interested person (as defined in the 1940 Act) of the trust and the fund (Independent Trustee), shall retire not later than the last day of the calendar year in which his or her 75th birthday occurs. The Independent Trustees may waive this mandatory retirement age policy with respect to individual Trustees. The officers and Advisory Board Member hold office without limit in time, except that any officer and Advisory Board Member may resign or may be removed by a vote of a majority of the Trustees at any regular meeting or any special meeting of the Trustees. Except as indicated, each individual has held the office shown or other offices in the same company for the past five years.
Experience, Skills, Attributes, and Qualifications of the Fund's Trustees. The Governance and Nominating Committee has adopted a statement of policy that describes the experience, qualifications, attributes, and skills that are necessary and desirable for potential Independent Trustee candidates (Statement of Policy). The Board believes that each Trustee satisfied at the time he or she was initially elected or appointed a Trustee, and continues to satisfy, the standards contemplated by the Statement of Policy. The Governance and Nominating Committee also engages professional search firms to help identify potential Independent Trustee candidates who have the experience, qualifications, attributes, and skills consistent with the Statement of Policy. From time to time, additional criteria based on the composition and skills of the current Independent Trustees, as well as experience or skills that may be appropriate in light of future changes to board composition, business conditions, and regulatory or other developments, have also been considered by the professional search firms and the Governance and Nominating Committee. In addition, the Board takes into account the Trustees' commitment and participation in Board and committee meetings, as well as their leadership of standing and ad hoc committees throughout their tenure.
In determining that a particular Trustee was and continues to be qualified to serve as a Trustee, the Board has considered a variety of criteria, none of which, in isolation, was controlling. The Board believes that, collectively, the Trustees have balanced and diverse experience, qualifications, attributes, and skills, which allow the Board to operate effectively in governing the fund and protecting the interests of shareholders. Information about the specific experience, skills, attributes, and qualifications of each Trustee, which in each case led to the Board's conclusion that the Trustee should serve (or continue to serve) as a trustee of the fund, is provided below.
Annual Report
Trustees and Officers - continued
Board Structure and Oversight Function. James C. Curvey is an interested person (as defined in the 1940 Act) and currently serves as Chairman. The Trustees have determined that an interested Chairman is appropriate and benefits shareholders because an interested Chairman has a personal and professional stake in the quality and continuity of services provided to the fund. Independent Trustees exercise their informed business judgment to appoint an individual of their choosing to serve as Chairman, regardless of whether the Trustee happens to be independent or a member of management. The Independent Trustees have determined that they can act independently and effectively without having an Independent Trustee serve as Chairman and that a key structural component for assuring that they are in a position to do so is for the Independent Trustees to constitute a substantial majority for the Board. The Independent Trustees also regularly meet in executive session. Ned C. Lautenbach serves as Chairman of the Independent Trustees and as such (i) acts as a liaison between the Independent Trustees and management with respect to matters important to the Independent Trustees and (ii) with management prepares agendas for Board meetings.
Fidelity funds are overseen by different Boards of Trustees. The fund's Board oversees Fidelity's equity and high income funds and another Board oversees Fidelity's investment-grade bond, money market, and asset allocation funds. The asset allocation funds may invest in Fidelity funds overseen by the fund's Board. The use of separate Boards, each with its own committee structure, allows the Trustees of each group of Fidelity funds to focus on the unique issues of the funds they oversee, including common research, investment, and operational issues. On occasion, the separate Boards establish joint committees to address issues of overlapping consequences for the Fidelity funds overseen by each Board.
The Trustees operate using a system of committees to facilitate the timely and efficient consideration of all matters of importance to the Trustees, the fund, and fund shareholders and to facilitate compliance with legal and regulatory requirements and oversight of the fund's activities and associated risks. The Board, acting through its committees, has charged FMR and its affiliates with (i) identifying events or circumstances the occurrence of which could have demonstrably adverse effects on the fund's business and/or reputation; (ii) implementing processes and controls to lessen the possibility that such events or circumstances occur or to mitigate the effects of such events or circumstances if they do occur; and (iii) creating and maintaining a system designed to evaluate continuously business and market conditions in order to facilitate the identification and implementation processes described in (i) and (ii) above. Because the day-to-day operations and activities of the fund are carried out by or through FMR, its affiliates and other service providers, the fund's exposure to risks is mitigated but not eliminated by the processes overseen by the Trustees. While each of the Board's committees has responsibility for overseeing different aspects of the fund's activities, oversight is exercised primarily through the Operations, Audit, and Compliance Committees. In addition, the Independent Trustees have worked with FMR to enhance the Board's oversight of investment and financial risks, legal and regulatory risks, technology risks, and operational risks, including the development of additional risk reporting to the Board. For example, a working group comprised of Independent Trustees and FMR has worked and continues to work to review the Fidelity funds' valuation-related activities, reporting and risk management. Appropriate personnel, including but not limited to the fund's Chief Compliance Officer (CCO), FMR's internal auditor, the independent accountants, the fund's Treasurer and portfolio management personnel, make periodic reports to the Board's committees, as appropriate, including an annual review of FMR's risk management program for the Fidelity funds. The responsibilities of each standing committee, including their oversight responsibilities, are described further under "Standing Committees of the Fund's Trustees."
Annual Report
The fund's Statement of Additional Information (SAI) includes more information about the Trustees. To request a free copy, call Fidelity at 1-877-208-0098.
Interested Trustees*:
Correspondence intended for each Trustee who is an interested person may be sent to Fidelity Investments, 245 Summer Street, Boston, Massachusetts 02210.
Name, Year of Birth; Principal Occupations and Other Relevant Experience+ |
James C. Curvey (1935) |
Year of Election or Appointment: 2007 Trustee Chairman of the Board of Trustees |
| Mr. Curvey also serves as Trustee of other Fidelity funds. Mr. Curvey is a Director of Fidelity Research & Analysis Co. (2009-present), and Vice Chairman (2007-present) and Director of FMR LLC. In addition, Mr. Curvey serves as an Overseer for the Boston Symphony Orchestra and a member of the board of Artis-Naples, Naples, Florida, and as a Trustee for Brewster Academy, Wolfeboro, New Hampshire. Previously, Mr. Curvey served as a Director of Fidelity Investments Money Management, Inc. (2009-2014), a Director of FMR (2007-2014), and a Director of FMR Co., Inc. (2007-2014). |
Charles S. Morrison (1960) |
Year of Election or Appointment: 2014 Trustee |
| Mr. Morrison also serves as Trustee of other funds. He serves as a Director of Fidelity Investments Money Management, Inc. (FIMM) (2014-present), Director of Fidelity SelectCo, LLC (2014-present), President, Asset Management (2014-present), and is an employee of Fidelity Investments. Previously, Mr. Morrison served as Vice President of Fidelity's Fixed Income and Asset Allocation Funds (2012-2014), President, Fixed Income (2011-2014), Vice President of Fidelity's Money Market Funds (2005-2009), President, Money Market Group Leader of FMR (2009), and Senior Vice President, Money Market Group of FMR (2004-2009). Mr. Morrison also served as Vice President of Fidelity's Bond Funds (2002-2005), certain Balanced Funds (2002-2005), and certain Asset Allocation Funds (2002-2007), and as Senior Vice President (2002-2005) of Fidelity's Bond Division. |
* Trustees have been determined to be "Interested Trustees" by virtue of, among other things, their affiliation with the trust or various entities under common control with FMR.
+ The information above includes each Trustee's principal occupation during the last five years and other information relating to the experience, attributes, and skills relevant to each Trustee's qualifications to serve as a Trustee, which led to the conclusion that each Trustee should serve as a Trustee for the fund.
Annual Report
Independent Trustees:
Correspondence intended for each Independent Trustee (that is, the Trustees other than the Interested Trustees) may be sent to Fidelity Investments, P.O. Box 55235, Boston, Massachusetts 02205-5235.
Name, Year of Birth; Principal Occupations and Other Relevant Experience+ |
Dennis J. Dirks (1948) |
Year of Election or Appointment: 2005 Trustee |
| Mr. Dirks also serves as Trustee of other Fidelity funds. Prior to his retirement in May 2003, Mr. Dirks was Chief Operating Officer and a member of the Board of The Depository Trust & Clearing Corporation (DTCC). He also served as President, Chief Operating Officer, and Board member of The Depository Trust Company (DTC) and President and Board member of the National Securities Clearing Corporation (NSCC). In addition, Mr. Dirks served as Chief Executive Officer and Board member of the Government Securities Clearing Corporation, Chief Executive Officer and Board member of the Mortgage-Backed Securities Clearing Corporation, as a Trustee and a member of the Finance Committee of Manhattan College (2005-2008), and as a Trustee and a member of the Finance Committee of AHRC of Nassau County (2006-2008). Mr. Dirks is a member of the Independent Directors Council (IDC) Governing Council (2010-present) and Board of Directors for The Brookville Center for Children's Services, Inc. (2009-present). |
Alan J. Lacy (1953) |
Year of Election or Appointment: 2008 Trustee |
| Mr. Lacy also serves as Trustee of other Fidelity funds. Mr. Lacy serves as Senior Adviser (2007-present) of Oak Hill Capital Partners, L.P. (private equity). Mr. Lacy also served as Chief Executive Officer (2000-2005) and Vice Chairman (2005-2006) of Sears Holdings Corporation and Sears, Roebuck and Co. (retail). In addition, Mr. Lacy serves as a member of the Board of Directors of Dave & Buster's Entertainment, Inc. (restaurant and entertainment complexes, 2010-present), Earth Fare, Inc. (retail grocery, 2012-present), The Hillman Companies, Inc. (hardware wholesalers, 2010-present), and Bristol-Myers Squibb Company (global pharmaceuticals, 2008-present). Mr. Lacy is a member of the Board of Trustees of The National Parks Conservation Association (2006-present). Previously, Mr. Lacy served as Chairman of the Board of Trustees of the National Parks Conservation Association (2008-2011) and as a member of the Board of Directors for the Western Union Company (global money transfer, 2006-2011). |
Ned C. Lautenbach (1944) |
Year of Election or Appointment: 2000 Trustee Chairman of the Independent Trustees |
| Mr. Lautenbach also serves as Trustee of other Fidelity funds. Mr. Lautenbach currently serves as the Lead Director of the Eaton Corporation Board of Directors (diversified industrial, 1997-present). Mr. Lautenbach is Chairman of the Board of Directors of the Philharmonic Center for the Arts in Naples, Florida (2012-present) and a member of the Council on Foreign Relations (1994-present). Previously, Mr. Lautenbach was a Partner/Advisory Partner at Clayton, Dubilier & Rice, LLC (private equity investment, 1998-2010), as well as a Director of Sony Corporation (2006-2007). |
Joseph Mauriello (1944) |
Year of Election or Appointment: 2008 Trustee |
| Mr. Mauriello also serves as Trustee of other Fidelity funds. Prior to his retirement in January 2006, Mr. Mauriello served in numerous senior management positions including Deputy Chairman and Chief Operating Officer (2004-2005), and Vice Chairman of Financial Services (2002-2004) of KPMG LLP US (professional services, 1965-2005). Mr. Mauriello currently serves as a member of the Board of Directors of XL Group plc. (global insurance and re-insurance, 2006-present). Previously, Mr. Mauriello served as a Director of the Hamilton Funds of the Bank of New York (2006-2007) and of Arcadia Resources Inc. (health care services and products, 2007-2012). |
Robert W. Selander (1950) |
Year of Election or Appointment: 2011 Trustee |
| Mr. Selander also serves as Trustee of other Fidelity funds. Previously, Mr. Selander served as a Member of the Advisory Board of other Fidelity funds (2011), and Executive Vice Chairman (2010), Chief Executive Officer (2009-2010), and President and Chief Executive Officer (1997-2009) of Mastercard, Inc. |
Cornelia M. Small (1944) |
Year of Election or Appointment: 2005 Trustee |
| Ms. Small also serves as Trustee of other Fidelity funds. Ms. Small is a member of the Board of Directors (2009-present) and Chair of the Investment Committee (2010-present) of the Teagle Foundation. Ms. Small also serves on the Investment Committee of the Berkshire Taconic Community Foundation (2008-present). Previously, Ms. Small served as Chairperson (2002-2008) and a member of the Investment Committee and Chairperson (2008-2012) and a member of the Board of Trustees of Smith College. In addition, Ms. Small served as Chief Investment Officer, Director of Global Equity Investments, and a member of the Board of Directors of Scudder, Stevens & Clark and Scudder Kemper Investments. |
William S. Stavropoulos (1939) |
Year of Election or Appointment: 2001 Trustee Vice Chairman of the Independent Trustees |
| Mr. Stavropoulos also serves as Trustee of other Fidelity funds. Mr. Stavropoulos serves as President and Founder of the Michigan Baseball Foundation, the Great Lakes Loons (2007-present). Mr. Stavropoulos is Chairman Emeritus of the Board of Directors of The Dow Chemical Company, where he previously served in numerous senior management positions, including President, CEO (1995-2000; 2002-2004), Chairman of the Executive Committee (2000-2006), and as a member of the Board of Directors (1990-2006). Currently, Mr. Stavropoulos is Chairman of the Board of Directors of Univar Inc. (global distributor of commodity and specialty chemicals), a Director of Teradata Corporation (data warehousing and technology solutions), and Maersk Inc. (industrial conglomerate), and a member of the Advisory Board for Metalmark Capital LLC (private equity investment, 2005-present). Mr. Stavropoulos is an operating advisor to Clayton, Dubilier & Rice, LLC (private equity investment). In addition, Mr. Stavropoulos is a member of the University of Notre Dame Advisory Council for the College of Science, a Trustee of the Rollin L. Gerstacker Foundation, and a Director of the Naples Philharmonic Center for the Arts. Previously, Mr. Stavropoulos served as a Director of Chemical Financial Corporation (bank holding company, 1993-2012) and Tyco International, Ltd. (multinational manufacturing and services, 2007-2012). |
David M. Thomas (1949) |
Year of Election or Appointment: 2008 Trustee |
| Mr. Thomas also serves as Trustee of other Fidelity funds. Mr. Thomas serves as Non-Executive Chairman of the Board of Directors of Fortune Brands Home and Security (home and security products, 2011-present), and as a member of the Board of Directors of Interpublic Group of Companies, Inc. (marketing communication, 2004-present). Previously, Mr. Thomas served as Executive Chairman (2005-2006) and Chairman and Chief Executive Officer (2000-2005) of IMS Health, Inc. (pharmaceutical and healthcare information solutions), and a Director of Fortune Brands, Inc. (consumer products, 2000-2011). |
+ The information above includes each Trustee's principal occupation during the last five years and other information relating to the experience, attributes, and skills relevant to each Trustee's qualifications to serve as a Trustee, which led to the conclusion that each Trustee should serve as a Trustee for the fund.
Advisory Board Member and Officers:
Correspondence intended for each officer and Peter S. Lynch may be sent to Fidelity Investments, 245 Summer Street, Boston, Massachusetts 02210. Officers appear below in alphabetical order.
Name, Year of Birth; Principal Occupation |
Peter S. Lynch (1944) |
Year of Election or Appointment: 2003 Member of the Advisory Board |
| Mr. Lynch also serves as Member of the Advisory Board of other Fidelity funds. Mr. Lynch is Vice Chairman and a Director of FMR and FMR Co., Inc. In addition, Mr. Lynch serves as a Trustee of Boston College and as the Chairman of the Inner-City Scholarship Fund. Previously, Mr. Lynch served on the Special Olympics International Board of Directors (1997-2006). |
Elizabeth Paige Baumann (1968) |
Year of Election or Appointment: 2012 Anti-Money Laundering (AML) Officer |
| Ms. Baumann also serves as AML Officer of other funds. She is Chief AML Officer of FMR LLC (2012-present) and is an employee of Fidelity Investments. Previously, Ms. Baumann served as Vice President and Deputy Anti-Money Laundering Officer (2007-2012). |
William C. Coffey (1969) |
Year of Election or Appointment: 2009 Assistant Secretary |
| Mr. Coffey also serves as Assistant Secretary of other funds. He is Senior Vice President and Deputy General Counsel of FMR LLC (2010-present), and is an employee of Fidelity Investments. Previously, Mr. Coffey served as Vice President and Associate General Counsel of FMR LLC (2005-2009). |
Timothy M. Cohen (1969) |
Year of Election or Appointment: 2014 Vice President of certain Equity Funds |
| Mr. Cohen also serves as Vice President of other funds. Mr. Cohen serves as a Director and Chief Compliance Officer of Fidelity Management & Research (U.K.) Inc. (2013-present) and is an employee of Fidelity Investments. |
Jonathan Davis (1968) |
Year of Election or Appointment: 2010 Assistant Treasurer |
| Mr. Davis also serves as Assistant Treasurer of other funds. Mr. Davis is an employee of Fidelity Investments. Previously, Mr. Davis served as Vice President and Associate General Counsel of FMR LLC (2003-2010). |
Adrien E. Deberghes (1967) |
Year of Election or Appointment: 2008 Deputy Treasurer |
| Mr. Deberghes also serves as an officer of other funds. He is an employee of Fidelity Investments (2008-present). Prior to joining Fidelity Investments, Mr. Deberghes was Senior Vice President of Mutual Fund Administration at State Street Corporation (2007-2008), Senior Director of Mutual Fund Administration at Investors Bank & Trust (2005-2007), and Director of Finance for Dunkin' Brands (2000-2005). |
Stephanie J. Dorsey (1969) |
Year of Election or Appointment: 2010 Assistant Treasurer |
| Ms. Dorsey also serves as an officer of other funds. She is an employee of Fidelity Investments (2008-present) and has served in other fund officer roles. Prior to joining Fidelity Investments, Ms. Dorsey served as Treasurer (2004-2008) of the JPMorgan Mutual Funds and Vice President (2004-2008) of JPMorgan Chase Bank. |
Howard J. Galligan III (1966) |
Year of Election or Appointment: 2014 Chief Financial Officer |
| Mr. Galligan also serves as Chief Financial Officer of other funds. Mr. Galligan serves as President of Fidelity Pricing and Cash Management Services (FPCMS) (2014-present) and as a Director of Strategic Advisers, Inc. (2008-present). Previously, Mr. Galligan served as Chief Administrative Officer of Asset Management (2011-2014) and Chief Operating Officer and Senior Vice President of Investment Support for Strategic Advisers, Inc. (2003-2011). |
Scott C. Goebel (1968) |
Year of Election or Appointment: 2008 Secretary and Chief Legal Officer (CLO) |
| Mr. Goebel serves as Secretary and CLO of other funds. Mr. Goebel also serves as Secretary of Fidelity SelectCo, LLC (2013-present), Fidelity Investments Money Management, Inc. (FIMM) (2010-present) and Fidelity Research and Analysis Company (FRAC) (2010-present); General Counsel, Secretary, and Senior Vice President of FMR (2008-present) and FMR Co., Inc. (2008-present); Chief Legal Officer of Fidelity Management & Research (Hong Kong) Limited (2008-present); and Assistant Secretary of Fidelity Management & Research (Japan) Limited (2008-present) and Fidelity Management & Research (U.K.) Inc. (2008-present). Previously, Mr. Goebel served as Secretary and CLO of other Fidelity funds (2008-2013), Assistant Secretary of FIMM (2008-2010), FRAC (2008-2010), and certain funds (2007-2008); and as Vice President and Secretary of Fidelity Distributors Corporation (FDC) (2005-2007). Mr. Goebel has been employed by FMR LLC or an affiliate since 2001. |
Brian B. Hogan (1964) |
Year of Election or Appointment: 2009 Vice President |
| Mr. Hogan also serves as Trustee or Vice President of other funds. Mr. Hogan serves as a Director of Fidelity SelectCo, LLC (2014-present) and President of FMR's Equity Division (2009-present). Previously, Mr. Hogan served as Senior Vice President, Equity Research of FMR (2006-2009) and as a portfolio manager. |
Chris Maher (1972) |
Year of Election or Appointment: 2013 Assistant Treasurer |
| Mr. Maher serves as Assistant Treasurer of other funds. Mr. Maher is Vice President of Valuation Oversight and is an employee of Fidelity Investments. Previously, Mr. Maher served as Vice President of Asset Management Compliance (2013), Vice President of FMR's Program Management Group (2010-2013), and Vice President of Valuation Oversight (2008-2010). |
Kenneth B. Robins (1969) |
Year of Election or Appointment: 2008 President and Treasurer |
| Mr. Robins also serves as an officer of other funds. Mr. Robins serves as Executive Vice President of Fidelity Investments Money Management, Inc. (FIMM) (2013-present) and is an employee of Fidelity Investments (2004-present). Previously, Mr. Robins served in other fund officer roles. |
Stephen Sadoski (1971) |
Year of Election or Appointment: 2012 Deputy Treasurer |
| Mr. Sadoski also serves as Deputy Treasurer of other funds. He is an employee of Fidelity Investments (2012-present) and has served in another fund officer role. Prior to joining Fidelity Investments, Mr. Sadoski served as an assistant chief accountant in the Division of Investment Management of the Securities and Exchange Commission (SEC) (2009-2012) and as a senior manager at Deloitte & Touche LLP (1997-2009). |
Stacie M. Smith (1974) |
Year of Election or Appointment: 2013 Deputy Treasurer |
| Ms. Smith also serves as an officer of other funds. She is an employee of Fidelity Investments (2009-present) and has served in other fund officer roles. Prior to joining Fidelity Investments, Ms. Smith served as Senior Audit Manager of Ernst & Young LLP (1996-2009). |
Renee Stagnone (1975) |
Year of Election or Appointment: 2013 Deputy Treasurer |
| Ms. Stagnone also serves as Deputy Treasurer of other funds. Ms. Stagnone is an employee of Fidelity Investments. |
Linda J. Wondrack (1964) |
Year of Election or Appointment: 2014 Chief Compliance Officer |
| Ms. Wondrack also serves as Chief Compliance Officer of other funds. Ms. Wondrack is Executive Vice President and head of the Ethics Office and Asset Management Compliance for Fidelity Investments (2012-present). Ms. Wondrack also serves as Chief Compliance Officer of Fidelity SelectCo, LLC (2014-present); Chief Compliance Officer of Impresa Management LLC (2013-present); and Chief Compliance Officer of FMR Co., Inc., Fidelity Investments Money Management, Inc., Fidelity Management & Research (Japan) Limited, Fidelity Management & Research (U.K.) Inc., Fidelity Management & Research (Hong Kong), Fidelity Management & Research Company, Pyramis Global Advisors, LLC, and Strategic Advisers, Inc., Ballyrock Investment Advisors LLC, and Northern Neck Investors LLC (2012-present). Previously, Ms. Wondrack served as Senior Vice President and Chief Compliance Officer for Columbia Management Investment Advisers, LLC (2005-2012); Chief Compliance Officer for certain funds within the Columbia Family of Funds (2007-2012); and Senior Vice President of Compliance Risk Management at Bank of America (2005-2010). |
Joseph F. Zambello (1957) |
Year of Election or Appointment: 2011 Deputy Treasurer |
| Mr. Zambello also serves as Deputy Treasurer of other funds. Mr. Zambello is an employee of Fidelity Investments. Previously, Mr. Zambello served as Vice President of FMR's Program Management Group (2009-2011) and Vice President of the Transfer Agent Oversight Group (2005-2009). |
Annual Report
The Board of Trustees of Advisor Emerging Markets voted to pay to shareholders of record at the opening of business on record date, the following distributions per share derived from capital gains realized from sales of portfolio securities, and dividends derived from net investment income:
| Pay Date | Record Date | Dividends | Capital Gains |
Institutional Class | 12/08/14 | 12/05/14 | $0.106 | $0.033 |
Institutional Class designates 100% of the dividends distributed during the fiscal year as amounts which may be taken into account as a dividend for purposes of the maximum rate under section 1(h)(11) of the Internal Revenue Code.
Institutional Class designates 11% of the dividends distributed during the fiscal year as qualifying for the dividends-received deduction for corporate shareholders.
The amounts per share which represent income derived from sources within, and taxes paid to, foreign countries or possessions of the United States are as Follows
| Pay Date | Income | Taxes |
Institutional Class | 12/09/2013 | $0.1733 | $0.0413 |
The fund will notify shareholders in January 2015 of amounts for use in preparing 2014 income tax returns.
Annual Report
Board Approval of Investment Advisory Contracts and Management Fees
Fidelity Advisor Emerging Markets Fund
Each year, the Board of Trustees, including the Independent Trustees (together, the Board), votes on the renewal of the management contract with Fidelity Management & Research Company (FMR) and the sub-advisory agreements (together, the Advisory Contracts) for the fund. The Board, assisted by the advice of fund counsel and Independent Trustees' counsel, requests and considers a broad range of information relevant to the renewal of the Advisory Contracts throughout the year.
The Board meets regularly and, at each of its meetings, covers an extensive agenda of topics and materials and considers factors that are relevant to its annual consideration of the renewal of the fund's Advisory Contracts, including the services and support provided to the fund and its shareholders. The Board has established various standing committees (Committees), each composed of and chaired by Independent Trustees with varying backgrounds, to which the Board has assigned specific subject matter responsibilities in order to enhance effective decision-making by the Board. The Board, acting directly and through its Committees, requests and receives information concerning the annual consideration of the renewal of the fund's Advisory Contracts. The Board also meets as needed to consider matters specifically related to the Board's annual consideration of the renewal of the Advisory Contracts. Members of the Board may also meet with trustees of other Fidelity funds through ad hoc joint committees to discuss certain matters relevant to the Fidelity funds.
At its July 2014 meeting, the Board, including the Independent Trustees, unanimously determined to renew the fund's Advisory Contracts. In reaching its determination, the Board considered all factors it believed relevant, including (i) the nature, extent, and quality of the services to be provided to the fund and its shareholders (including the investment performance of the fund); (ii) the competitiveness of the fund's management fee and total expense ratio relative to peer funds; (iii) the total costs of the services to be provided by and the profits to be realized by Fidelity from its relationship with the fund; (iv) the extent to which economies of scale exist and would be realized as the fund grows; and (v) whether fee levels reflect these economies of scale, if any, for the benefit of fund shareholders. In connection with separate internal corporate reorganizations involving Fidelity Management & Research (U.K.) Inc. (FMR U.K.) and Fidelity Management & Research (Japan) Inc. (FMR Japan), the Board approved certain non-material amendments to the fund's sub-advisory agreements with FMR U.K. and FMR Japan to reflect that, after these reorganizations, FMR Investment Management (UK) Limited and Fidelity Management & Research (Japan) Limited will carry on the business of FMR U.K. and FMR Japan, respectively. The Board noted that no changes to the portfolio managers or to the foreign research or investment advisory services provided to the fund were expected in connection with either reorganization and that the same personnel and resources would continue to be available to the fund at the new entities.
Annual Report
In considering whether to renew the Advisory Contracts for the fund, the Board reached a determination, with the assistance of fund counsel and Independent Trustees' counsel and through the exercise of its business judgment, that the renewal of the Advisory Contracts was in the best interests of the fund and its shareholders and that the compensation payable under the Advisory Contracts was fair and reasonable. The Board's decision to renew the Advisory Contracts was not based on any single factor, but rather was based on a comprehensive consideration of all the information provided to the Board at its meetings throughout the year. The Board, in reaching its determination to renew the Advisory Contracts, was aware that shareholders of the fund have a broad range of investment choices available to them, including a wide choice among funds offered by Fidelity's competitors, and that the fund's shareholders, who have the opportunity to review and weigh the disclosure provided by the fund in its prospectus and other public disclosures, have chosen to invest in this fund, which is part of the Fidelity family of funds.
Nature, Extent, and Quality of Services Provided. The Board considered Fidelity's staffing as it relates to the fund, including the backgrounds of investment personnel of FMR and the sub-advisers (together, the Investment Advisers), and also considered the fund's investment objective, strategies, and related investment philosophy. The Independent Trustees also had discussions with senior management of Fidelity's investment operations and investment groups. The Board considered the structure of the portfolio manager compensation program and whether this structure provides appropriate incentives to act in the best interests of the fund. Additionally, the Board considered the portfolio managers' investments, if any, in the funds that they manage.
Resources Dedicated to Investment Management and Support Services. The Board and the Fund Oversight and Research Committees reviewed the general qualifications and capabilities of Fidelity's investment staff, including its size, education, experience, and resources, as well as Fidelity's approach to recruiting, training, managing, and compensating investment personnel. The Board noted that Fidelity has continued to increase the resources devoted to non-U.S. offices, including expansion of Fidelity's global investment organization. The Board also noted that Fidelity's analysts have extensive resources, tools and capabilities that allow them to conduct sophisticated quantitative and fundamental analysis, as well as credit analysis of issuers, counterparties and guarantors. Further, the Board believes that Fidelity's investment professionals have sufficient access to global information and data so as to provide competitive investment results over time, and that those professionals also have access to sophisticated tools that permit them to assess portfolio construction and risk and performance attribution characteristics continuously, as well as to transmit new information and research conclusions rapidly around the world. Additionally, in its deliberations, the Board considered Fidelity's trading and risk management capabilities and resources and global compliance infrastructure, which are an integral part of the investment management process.
Annual Report
Board Approval of Investment Advisory Contracts and
Management Fees - continued
Shareholder and Administrative Services. The Board considered (i) the nature, extent, quality, and cost of advisory, administrative, and shareholder services performed by the Investment Advisers and their affiliates under the Advisory Contracts and under separate agreements covering transfer agency, pricing and bookkeeping, and securities lending services for the fund; (ii) the nature and extent of the supervision of third party service providers, principally custodians and subcustodians; and (iii) the resources devoted to, and the record of compliance with, the fund's compliance policies and procedures. The Board also reviewed the allocation of fund brokerage, including allocations to brokers affiliated with the Investment Advisers, the use of brokerage commissions to pay fund expenses, and the use of "soft" commission dollars to pay for research services.
The Board noted that the growth of fund assets over time across the complex allows Fidelity to reinvest in the development of services designed to enhance the value or convenience of the Fidelity funds as investment vehicles. These services include 24-hour access to account information and market information through telephone representatives and over the Internet, investor education materials and asset allocation tools, and the expanded availability of Fidelity Investor Centers.
In 2014, the Board formed an ad hoc Committee on Transfer Agency Fees to review the variety of transfer agency fee structures throughout the industry and Fidelity's competitive positioning with respect to industry participants.
Investment in a Large Fund Family. The Board considered the benefits to shareholders of investing in a Fidelity fund, including the benefits of investing in a fund that is part of a large family of funds offering a variety of investment disciplines and providing a large variety of mutual fund investor services. The Board noted that Fidelity had taken, or had made recommendations that resulted in the Fidelity funds taking, a number of actions over the previous year that benefited particular funds, including (i) continuing to dedicate additional resources to investment research and to the support of the senior management team that oversees asset management; (ii) persisting in efforts to enhance Fidelity's global research capabilities; (iii) launching new funds and making other enhancements to meet client needs for income-oriented solutions; (iv) reducing fund expenses for certain index funds; (v) continuing to launch dedicated lower cost underlying funds to meet portfolio construction needs related to expanding underlying fund options for Fidelity funds of funds, specifically for the Freedom Fund product lines; (vi) rationalizing product lines and gaining increased efficiencies through fund mergers; (vii) launching sector-based exchange-traded funds and establishing a new Fidelity adviser to manage sector-based funds and products; (viii) continuing to develop and implement technology to improve security and increase efficiency; (ix) modifying the eligibility criteria for certain share classes to increase their marketability to a portion of the defined contribution plan market; (x) waiving redemption fees for certain qualified fund-of-fund and wrap programs and certain retirement plan transactions; and (xi) launching new Institutional Class shares of certain money market funds to attract and retain assets and to fill a gap in the money market fund lineup.
Annual Report
Investment Performance. The Board considered whether the fund has operated in accordance with its investment objective, as well as its record of compliance with its investment restrictions and its performance history. The Board noted that there was a portfolio management change for the fund in October 2012.
The Board took into account discussions with the Investment Advisers about fund investment performance that occur at Board meetings throughout the year. In this regard the Board noted that as part of regularly scheduled fund reviews and other reports to the Board on fund performance, the Board periodically considers annualized return information for the fund, for different time periods, measured against a securities market index ("benchmark index") and a peer group of funds with similar objectives ("peer group"). In its evaluation of fund investment performance, the Board gave particular attention to information indicating changes in performance of certain Fidelity funds for specific time periods and the Investment Advisers' explanations for any overperformance or underperformance.
In addition to reviewing absolute and relative fund performance, the Independent Trustees periodically consider the appropriateness of fund performance metrics in evaluating the results achieved. In general, the Independent Trustees believe that fund performance should be evaluated based on net performance (after fees and expenses) of both the highest performing and lowest performing classes, where applicable, compared to appropriate benchmark indices, over appropriate time periods which may include full market cycles, and compared to peer groups, as applicable, over the same periods, taking into account relevant factors including the following: general market conditions; issuer-specific information; tactical opportunities for investment; and fund cash flows and other factors.
The Independent Trustees recognize that shareholders evaluate performance on a net basis over their own holding periods, for which one-, three-, and five-year periods are often used as a proxy. For this reason, the performance information reviewed by the Board also included net cumulative calendar year total return information for the fund and an appropriate benchmark index and peer group for the most recent one-, three-, and five-year periods, as shown below. Returns are shown compared to the 25th percentile (top of box, 75% beaten) and 75th percentile (bottom of box, 25% beaten) of the peer universe.
Annual Report
Board Approval of Investment Advisory Contracts and
Management Fees - continued
Fidelity Advisor Emerging Markets Fund

Based on its review, the Board concluded that the nature, extent, and quality of services provided to the fund under the Advisory Contracts should benefit the fund's shareholders.
Competitiveness of Management Fee and Total Expense Ratio. The Board considered the fund's management fee and total expense ratio compared to "mapped groups" of competitive funds and classes. Fidelity creates "mapped groups" by combining similar Lipper investment objective categories that have comparable investment mandates. Combining Lipper investment objective categories aids the Board's management fee and total expense ratio comparisons by broadening the competitive group used for comparison and by reducing the number of universes to which various Fidelity funds are compared.
Management Fee. The Board considered two proprietary management fee comparisons for the 12-month periods shown in the chart below. The group of Lipper funds used by the Board for management fee comparisons is referred to below as the "Total Mapped Group." The Total Mapped Group comparison focuses on a fund's standing in terms of gross management fees before expense reimbursements or caps relative to the total universe of funds with comparable investment mandates, regardless of whether their management fee structures also are comparable. Funds with comparable investment mandates offer exposure to similar types of securities. Funds with comparable management fee structures have similar management fee contractual arrangements (e.g., flat rate charged for advisory services, all-inclusive fee rate, etc.). "TMG %" represents the percentage of funds in the Total Mapped Group that had management fees that were lower than the fund's. For example, a hypothetical TMG % of 20% would mean that 80% of the funds in the Total Mapped Group had higher, and 20% had lower, management fees than the fund. The fund's actual TMG %s are in the chart below. The "Asset-Size Peer Group" (ASPG) comparison focuses on a fund's standing relative to a subset of non-Fidelity funds within the Total Mapped Group that are similar in size and management fee structure. For example, if a fund is in the first quartile of the ASPG, the fund's management fee ranks in the least expensive or lowest 25% of funds in the ASPG. The ASPG represents at least 15% of the funds in the Total Mapped Group with comparable asset size and management fee structures, subject to a minimum of 50 funds (or all funds in the Total Mapped Group if fewer than 50). Additional information, such as the ASPG quartile in which the fund's management fee rate ranked, is also included in the chart and considered by the Board.
Annual Report
Fidelity Advisor Emerging Markets Fund
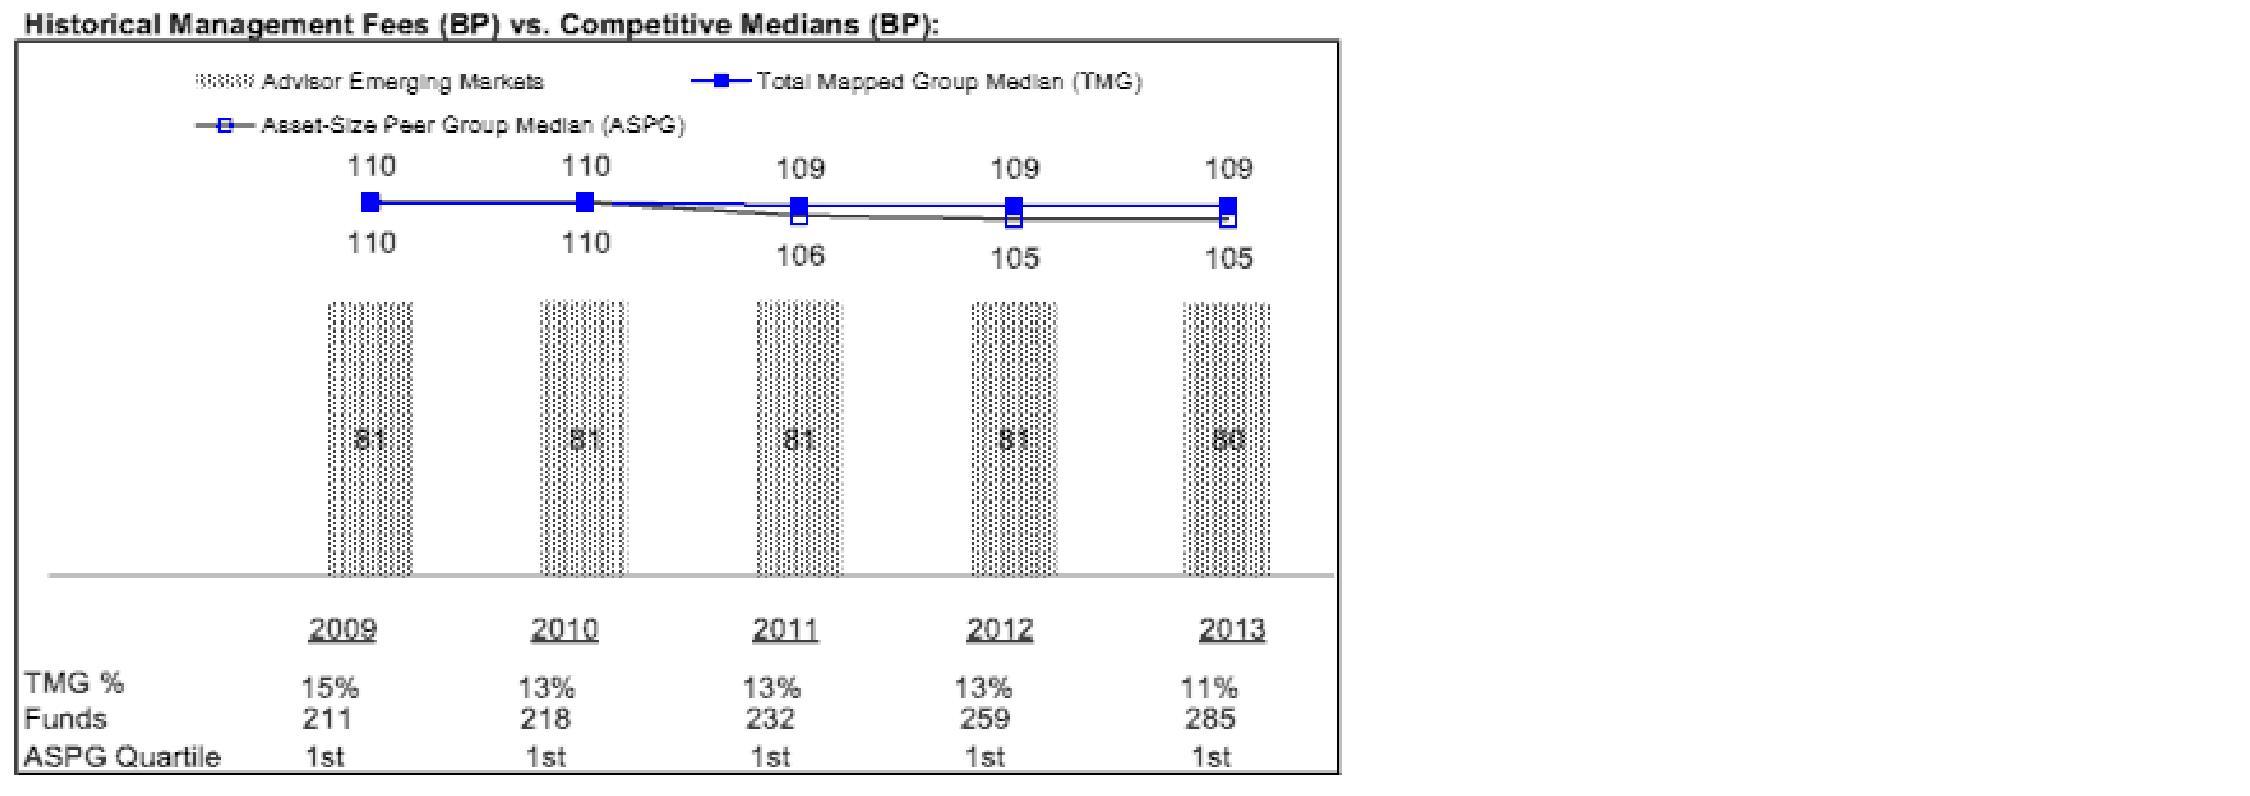
The Board noted that the fund's management fee rate ranked below the median of its Total Mapped Group and below the median of its ASPG for 2013.
The Board also noted that, in August 2013, the ad hoc Committee on Management Fees was formed to conduct an in-depth review of the management fee rates of Fidelity's active equity mutual funds. The Committee focused on the following areas: (i) standard fee structures; (ii) research consumption and trading evolution; (iii) management fee competitiveness/profitability by category; and (iv) factors that drive institutional pricing.
Based on its review, the Board concluded that the fund's management fee is fair and reasonable in light of the services that the fund receives and the other factors considered.
Annual Report
Board Approval of Investment Advisory Contracts and
Management Fees - continued
Total Expense Ratio. In its review of each class's total expense ratio, the Board considered the fund's management fee as well as other fund or class expenses, as applicable, such as transfer agent fees, pricing and bookkeeping fees, fund-paid 12b-1 fees, and custodial, legal, and audit fees. The Board also noted the effects of any waivers and reimbursements on fees and expenses. As part of its review, the Board also considered the current and historical total expense ratios of each class of the fund compared to competitive fund median expenses. Each class of the fund is compared to those funds and classes in the Total Mapped Group (used by the Board for management fee comparisons) that have a similar sales load structure.
The Board noted that the total expense ratio of each of Class A, Class B, Class C, Institutional Class, and Class Z ranked below its competitive median for 2013 and the total expense ratio of Class T ranked above its competitive median for 2013. The Board considered that, in general, various factors can affect total expense ratios. The Board noted that the total expense ratio of Class T was above the competitive median primarily because of higher 12b-1 fees on Class T as compared to most competitor funds. Class T has a higher 12b-1 fee, but a lower front-end sales charge, than traditionally priced front-end sales charge classes. The Board considered that Class T is primarily sold load-waived in the retirement plan market where its 0.50% 12b-1 fee is comparable to competing no-load, higher 12b-1 fee classes designed specifically for retirement plans. The Board noted that the fund offers multiple classes, each of which has a different sales load and 12b-1 fee structure, and that the multiple structures are intended to offer a range of pricing options for the intermediary market. The Board also noted that the total expense ratios of the classes vary primarily by the level of their 12b-1 fees, although differences in transfer agent fees may also cause expenses to vary from class to class.
Fees Charged to Other Fidelity Clients. The Board also considered Fidelity fee structures and other information with respect to clients of Fidelity, such as other funds advised or subadvised by Fidelity, pension plan clients, and other institutional clients. The Board noted the findings of the 2013 ad hoc joint committee (created with the board of other Fidelity funds), which reviewed and compared Fidelity's institutional investment advisory business with its business of providing services to the Fidelity funds, including the differences in services provided, fees charged, and costs incurred, as well as competition in their respective marketplaces.
Based on its review of total expense ratios and fees charged to other Fidelity clients, the Board concluded that the total expense ratio of each class of the fund was reasonable, although Class T was above the median of the universe presented for comparison, in light of the services that the fund and its shareholders receive and the other factors considered.
Costs of the Services and Profitability. The Board considered the revenues earned and the expenses incurred by Fidelity in conducting the business of developing, marketing, distributing, managing, administering and servicing the fund and servicing the fund's shareholders. The Board also considered the level of Fidelity's profits in respect of all the Fidelity funds.
Annual Report
On an annual basis, Fidelity presents to the Board Fidelity's profitability for the fund. Fidelity calculates the profitability for each fund, as well as aggregate profitability for groups of Fidelity funds and all Fidelity funds, using a series of detailed revenue and cost allocation methodologies which originate with the books and records of Fidelity on which Fidelity's audited financial statements are based. The Audit Committee of the Board reviews any significant changes from the prior year's methodologies.
PricewaterhouseCoopers LLP (PwC), independent registered public accounting firm and auditor to Fidelity and certain Fidelity funds, has been engaged annually by the Board as part of the Board's assessment of Fidelity's profitability analysis. PwC's engagement includes the review and assessment of the methodologies used by Fidelity in determining the revenues and expenses attributable to Fidelity's mutual fund business, and completion of agreed-upon procedures in respect of the mathematical accuracy of fund profitability and its conformity to established allocation methodologies. After considering PwC's reports issued under the engagement and information provided by Fidelity, the Board concluded that while other allocation methods may also be reasonable, Fidelity's profitability methodologies are reasonable in all material respects.
The Board also reviewed Fidelity's non-fund businesses and fall-out benefits related to the mutual fund business as well as cases where Fidelity's affiliates may benefit from or be related to the fund's business.
The Board considered the costs of the services provided by and the profits realized by Fidelity in connection with the operation of the fund and was satisfied that the profitability was not excessive in the circumstances.
Economies of Scale. The Board considered whether there have been economies of scale in respect of the management of the Fidelity funds, whether the Fidelity funds (including the fund) have appropriately benefited from any such economies of scale, and whether there is potential for realization of any further economies of scale. The Board considered the extent to which the fund will benefit from economies of scale through increased services to the fund, through waivers or reimbursements, or through fee or expense ratio reductions. The Board also noted that in 2013, it and the boards of other Fidelity funds created an ad hoc committee (the Economies of Scale Committee) to analyze whether Fidelity attains economies of scale in respect of the management and servicing of the Fidelity funds, whether the Fidelity funds have appropriately benefited from such economies of scale, and whether there is potential for realization of any further economies of scale.
Annual Report
Board Approval of Investment Advisory Contracts and
Management Fees - continued
The Board recognized that the fund's management contract incorporates a "group fee" structure, which provides for lower group fee rates as total group assets increase, and for higher group fee rates as total group assets decrease (with "group assets" defined to include fund assets under FMR's management plus sector fund assets previously under FMR's management and currently managed by Fidelity SelectCo, LLC). FMR calculates the group fee rates based on a tiered asset "breakpoint" schedule that varies based on asset class. The Board considered that the group fee is designed to deliver the benefits of economies of scale to fund shareholders when total Fidelity fund assets increase, even if assets of any particular fund are unchanged or have declined, because some portion of Fidelity's costs are attributable to services provided to all Fidelity funds, and all funds benefit if those costs can be allocated among more assets. The Board concluded that, given the group fee structure, fund shareholders will benefit from lower management fees as group assets increase at the fund complex level, regardless of whether Fidelity achieves any such economies of scale.
The Board concluded, taking into account the analysis of the Economies of Scale Committee, that economies of scale, if any, are being appropriately shared between fund shareholders and Fidelity.
Additional Information Requested by the Board. In order to develop fully the factual basis for consideration of the Fidelity funds' Advisory Contracts, the Board requested and received additional information on certain topics, including: (i) fund performance trends and Fidelity's long-term strategies for certain funds; (ii) Fidelity's strategic marketing and product lineup goals; (iii) the methodology with respect to competitive fund data and peer group classifications; (iv) the arrangements with, and performance of, certain sub-advisers on behalf of the Fidelity funds, as well as certain proposed participating affiliate arrangements; (v) the realization of fall-out benefits in certain Fidelity business units; (vi) Fidelity's group fee structures, including the rationale for the individual fee rates of certain categories of funds and the definition of group assets; (vii) trends regarding industry use of performance fee structures and the performance adjustment methodologies applicable to the Fidelity funds; (viii) additional competitive analysis regarding the total expenses for certain classes; (ix) fund profitability methodology, including Fidelity's cost allocation methodology, and the impact of certain factors on fund profitability results; and (x) the process by which Fidelity determines sub-advisory fees for funds it advises.
Based on its evaluation of all of the conclusions noted above, and after considering all factors it believed relevant, the Board ultimately concluded that the advisory fee structures are fair and reasonable, and that the fund's Advisory Contracts should be renewed.
Annual Report
Investment Adviser
Fidelity Management & Research Company
Boston, MA
Investment Sub-Advisers
FMR Co., Inc.
Fidelity Management & Research
(U.K.) Inc.
Fidelity Management & Research
(Hong Kong) Limited
Fidelity Management & Research
(Japan) Limited
FIL Investments (Japan) Limited
FIL Investment Advisors (UK) Limited
FIL Investment Advisors
General Distributor
Fidelity Distributors Corporation
Smithfield, RI
Transfer and Service Agents
Fidelity Investments Institutional Operations Company, Inc.
Boston, MA
Fidelity Service Company, Inc.
Boston, MA
Custodian
JPMorgan Chase Bank
New York, NY
(Fidelity Investment logo)(registered trademark)
FAEMI-UANN-1214
1.809006.110
(Fidelity Investment logo)(registered trademark)
Fidelity Advisor®
Emerging Markets
Fund - Class Z
Annual Report
October 31, 2014
(Fidelity Cover Art)
Contents
Performance | (Click Here) | How the fund has done over time. |
Management's Discussion of Fund Performance | (Click Here) | The Portfolio Manager's review of fund performance and strategy. |
Shareholder Expense Example | (Click Here) | An example of shareholder expenses. |
Investment Changes | (Click Here) | A summary of major shifts in the fund's investments over the past six months. |
Investments | (Click Here) | A complete list of the fund's investments with their market values. |
Financial Statements | (Click Here) | Statements of assets and liabilities, operations, and changes in net assets, as well as financial highlights. |
Notes | (Click Here) | Notes to the financial statements. |
Report of Independent Registered Public Accounting Firm | (Click Here) | |
Trustees and Officers | (Click Here) | |
Distributions | (Click Here) | |
Board Approval of Investment Advisory Contracts and Management Fees | (Click Here) | |
To view a fund's proxy voting guidelines and proxy voting record for the 12-month period ended June 30, visit http://www.fidelity.com/proxyvotingresults or visit the Securities and Exchange Commission's (SEC) web site at http://www.sec.gov. You may also call 1-877-208-0098 to request a free copy of the proxy voting guidelines.
Standard & Poor's, S&P and S&P 500 are registered service marks of The McGraw-Hill Companies, Inc. and have been licensed for use by Fidelity Distributors Corporation.
Other third-party marks appearing herein are the property of their respective owners.
All other marks appearing herein are registered or unregistered trademarks or service marks of FMR LLC or an affiliated company. © 2014 FMR LLC. All rights reserved.
Annual Report
This report and the financial statements contained herein are submitted for the general information of the shareholders of the fund. This report is not authorized for distribution to prospective investors in the fund unless preceded or accompanied by an effective prospectus.
A fund files its complete schedule of portfolio holdings with the SEC for the first and third quarters of each fiscal year on Form N-Q. Forms N-Q are available on the SEC's web site at http://www.sec.gov. A fund's Forms N-Q may be reviewed and copied at the SEC's Public Reference Room in Washington, DC. Information regarding the operation of the SEC's Public Reference Room may be obtained by calling 1-800-SEC-0330. For a complete list of a fund's portfolio holdings, view the most recent holdings listing, semiannual report, or annual report on Fidelity's web site at http://www.fidelity.com, http://www.advisor.fidelity.com, or http://www.401k.com, as applicable.
NOT FDIC INSURED • MAY LOSE VALUE • NO BANK GUARANTEE
Neither the fund nor Fidelity Distributors Corporation is a bank.
Annual Report
Average annual total return reflects the change in the value of an investment, assuming reinvestment of the class' distributions from dividend income and capital gains (the profits earned upon the sale of securities that have grown in value, if any) and assuming a constant rate of performance each year. The $10,000 table and the fund's returns do not reflect the deduction of taxes that a shareholder would pay on fund distributions or the redemption of fund shares. During periods of reimbursement by Fidelity, a fund's total return will be greater than it would be had the reimbursement not occurred. How a fund did yesterday is no guarantee of how it will do tomorrow.
Average Annual Total Returns
Periods ended October 31, 2014 | Past 1
year | Past 5
years | Past 10
years |
Class Z A | 4.19% | 5.22% | 10.31% |
A The initial offering of Class Z shares took place on August 13, 2013. Returns prior to August 13, 2013, are those of Institutional Class.
$10,000 Over 10 Years
Let's say hypothetically that $10,000 was invested in Fidelity Advisor® Emerging Markets Fund - Class Z on October 31, 2004. The chart shows how the value of your investment would have changed, and also shows how the MSCI Emerging Markets Index performed over the same period. See footnote A above for additional information regarding the performance of Class Z.
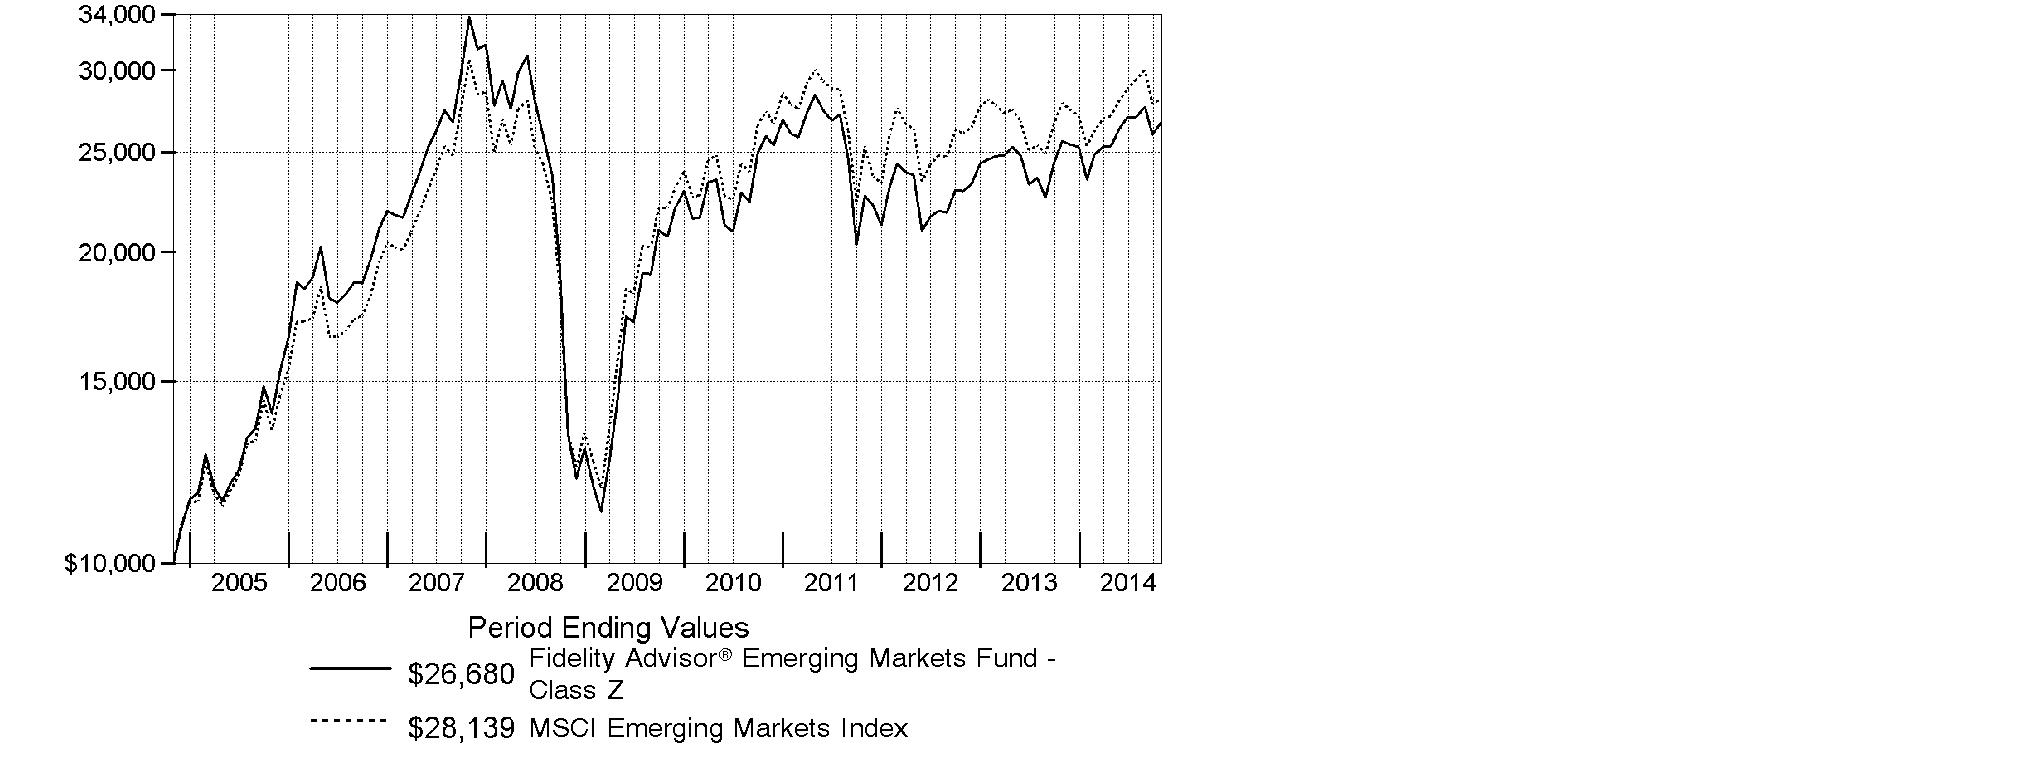
Annual Report
Market Recap: Global equities posted a healthy gain for the 12 months ending October 31, 2014, overcoming an October market decline driven by recessionary pressures in China and tepid growth in Europe. The MSCI ACWI (All Country World Index) Index rose 8.15%, helped by subdued market volatility for much of the period and supported by solid corporate earnings, especially in the United States. Stocks also benefited from easy monetary policies in Japan and the eurozone, as well as increased stimulus efforts in China. All but three of the 24 industry groups that compose the index marked a positive return. The U.S. (+17%) remained a pillar of strength, while a strongly rising dollar in the latter part of the period detracted from investors' returns in most non-U.S. markets. Canada (+5%) notched broad gains outside of its energy and materials sectors, as did Asia-Pacific ex Japan (+4%), led by investor enthusiasm for companies in India. The U.K., Europe and Japan, meanwhile, all underperformed. Among sectors, health care (+24%) led the index, with a strong contribution from the pharmaceuticals, biotechnology & life sciences industry. Information technology (+21%) also outperformed. Conversely, materials (-4%) and energy (-1%) lagged the index due to a higher supply of and lower demand for commodities.
Comments from Sammy Simnegar, Portfolio Manager of Fidelity Advisor® Emerging Markets Fund: For the year, the fund's Class Z shares returned 4.19%, topping the 0.98% gain of the MSCI Emerging Markets Index. Versus the index, the fund's performance was lifted by its positioning in India, which accounted for eight of the fund's 20 largest relative contributors. A non-index position in Axis Bank was the fund's best relative contributor from India and fifth-largest overall. The top relative contributor was Bitauto Holdings, a Chinese automotive website and also a non-index name. Performance was further lifted by not owning several weak-performing index stocks in the energy and materials sectors, including those of two Brazil-based companies - energy producer Petroleo Brasileiro, better known as Petrobras, and industrial metals miner Vale - as well as Russian gas distributor Gazprom. Conversely, Banco Bradesco, a Brazil-based bank, was the fund's largest relative detractor. This stock performed poorly early in 2014, and I sold it - prematurely, as it turned out. Not owning two strong-performing index stocks, China Mobile and Hon Hai Precision Industry, a Taiwan-based manufacturer of electronic products, also detracted.
The views expressed above reflect those of the portfolio manager(s) only through the end of the period as stated on the cover of this report and do not necessarily represent the views of Fidelity or any other person in the Fidelity organization. Any such views are subject to change at any time based upon market or other conditions and Fidelity disclaims any responsibility to update such views. These views may not be relied on as investment advice and, because investment decisions for a Fidelity fund are based on numerous factors, may not be relied on as an indication of trading intent on behalf of any Fidelity fund.
Annual Report
Shareholder Expense Example
As a shareholder of the Fund, you incur two types of costs: (1) transaction costs, including sales charges (loads) on purchase payments or redemption proceeds, redemption fees and (2) ongoing costs, including management fees, distribution and/or service (12b-1) fees and other Fund expenses. This Example is intended to help you understand your ongoing costs (in dollars) of investing in the Fund and to compare these costs with the ongoing costs of investing in other mutual funds.
The Example is based on an investment of $1,000 invested at the beginning of the period and held for the entire period (May 1, 2014 to October 31, 2014).
Actual Expenses
The first line of the accompanying table for each class of the Fund provides information about actual account values and actual expenses. You may use the information in this line, together with the amount you invested, to estimate the expenses that you paid over the period. Simply divide your account value by $1,000.00 (for example, an $8,600 account value divided by $1,000.00 = 8.6), then multiply the result by the number in the first line for a class of the Fund under the heading entitled "Expenses Paid During Period" to estimate the expenses you paid on your account during this period. In addition, the Fund, as a shareholder in the underlying Fidelity Central Funds, will indirectly bear its pro-rata share of the fees and expenses incurred by the underlying Fidelity Central Funds. These fees and expenses are not included in the Fund's annualized expense ratio used to calculate the expense estimate in the table below.
Hypothetical Example for Comparison Purposes
The second line of the accompanying table for each class of the Fund provides information about hypothetical account values and hypothetical expenses based on a Class' actual expense ratio and an assumed rate of return of 5% per year before expenses, which is not the Class' actual return. The hypothetical account values and expenses may not be used to estimate the actual ending account balance or expenses you paid for the period. You may use this information to compare the ongoing costs of investing in the Fund and other funds. To do so, compare this 5% hypothetical example with the 5% hypothetical examples that appear in the shareholder reports of the other funds. In addition, the Fund, as a shareholder in the underlying Fidelity Central Funds, will indirectly bear its pro-rata share of the fees and expenses incurred by the underlying Fidelity Central Funds. These fees and expenses are not included in the Fund's annualized expense ratio used to calculate the expense estimate in the table below.
Please note that the expenses shown in the table are meant to highlight your ongoing costs only and do not reflect any transaction costs. Therefore, the second line of the table is useful in comparing ongoing costs only, and will not help you determine the relative total costs of owning different funds. In addition, if these transactional costs were included, your costs would have been higher.
Annual Report
| Annualized
Expense RatioB | Beginning
Account Value
May 1, 2014 | Ending
Account Value
October 31, 2014 | Expenses Paid
During Period*
May 1, 2014
to October 31, 2014 |
Class A | 1.50% | | | |
Actual | | $ 1,000.00 | $ 1,051.70 | $ 7.76 |
HypotheticalA | | $ 1,000.00 | $ 1,017.64 | $ 7.63 |
Class T | 1.76% | | | |
Actual | | $ 1,000.00 | $ 1,050.00 | $ 9.09 |
HypotheticalA | | $ 1,000.00 | $ 1,016.33 | $ 8.94 |
Class B | 2.24% | | | |
Actual | | $ 1,000.00 | $ 1,047.40 | $ 11.56 |
HypotheticalA | | $ 1,000.00 | $ 1,013.91 | $ 11.37 |
Class C | 2.25% | | | |
Actual | | $ 1,000.00 | $ 1,047.50 | $ 11.61 |
HypotheticalA | | $ 1,000.00 | $ 1,013.86 | $ 11.42 |
Institutional Class | 1.16% | | | |
Actual | | $ 1,000.00 | $ 1,053.30 | $ 6.00 |
HypotheticalA | | $ 1,000.00 | $ 1,019.36 | $ 5.90 |
Class Z | .99% | | | |
Actual | | $ 1,000.00 | $ 1,054.30 | $ 5.13 |
HypotheticalA | | $ 1,000.00 | $ 1,020.21 | $ 5.04 |
A 5% return per year before expenses
B Annualized expense ratio reflects expenses net of applicable fee waivers.
* Expenses are equal to each Class' annualized expense ratio, multiplied by the average account value over the period, multiplied by 184/365 (to reflect the one-half year period).
Annual Report
Investment Changes (Unaudited)
Top Five Stocks as of October 31, 2014 |
| % of fund's
net assets | % of fund's net assets
6 months ago |
Samsung Electronics Co. Ltd. (Korea (South), Technology Hardware, Storage & Peripherals) | 4.0 | 4.7 |
Taiwan Semiconductor Manufacturing Co. Ltd. (Taiwan, Semiconductors & Semiconductor Equipment) | 3.1 | 3.0 |
Tencent Holdings Ltd. (Cayman Islands, Internet Software & Services) | 2.4 | 2.1 |
Naspers Ltd. Class N (South Africa, Media) | 1.7 | 1.5 |
Itau Unibanco Holding SA sponsored ADR (Brazil, Banks) | 1.4 | 1.5 |
| 12.6 | |
Top Five Market Sectors as of October 31, 2014 |
| % of fund's
net assets | % of fund's net assets
6 months ago |
Financials | 23.5 | 20.9 |
Information Technology | 19.2 | 18.2 |
Consumer Discretionary | 18.8 | 21.2 |
Industrials | 13.4 | 15.0 |
Consumer Staples | 7.8 | 10.3 |
Top Five Countries as of October 31, 2014 |
(excluding cash equivalents) | % of fund's
net assets | % of fund's net assets
6 months ago |
India | 12.0 | 10.0 |
Brazil | 11.2 | 9.5 |
South Africa | 9.0 | 7.6 |
Cayman Islands | 6.4 | 8.7 |
Indonesia | 6.3 | 5.9 |
Percentages are adjusted for the effect of open futures contracts, if applicable. |
Asset Allocation (% of fund's net assets) |
As of October 31, 2014 | As of April 30, 2014 |
 | Stocks 97.7% | | | Stocks 99.5% | |
 | Short-Term
Investments and
Net Other Assets (Liabilities) 2.3% | | | Short-Term
Investments and
Net Other Assets (Liabilities) 0.5% | |

Annual Report
Investments October 31, 2014
Showing Percentage of Net Assets
Common Stocks - 92.3% |
| Shares | | Value |
Australia - 1.2% |
Carsales.com Ltd. (d) | 222,870 | | $ 2,103,084 |
SEEK Ltd. | 129,202 | | 1,896,025 |
Sydney Airport unit | 480,461 | | 1,867,905 |
TOTAL AUSTRALIA | | 5,867,014 |
Bailiwick of Jersey - 0.4% |
WPP PLC | 84,800 | | 1,656,369 |
Bermuda - 2.2% |
Brilliance China Automotive Holdings Ltd. | 1,352,000 | | 2,337,967 |
China Gas Holdings Ltd. | 1,335,000 | | 2,386,820 |
China Resources Gas Group Ltd. | 728,000 | | 2,080,977 |
Credicorp Ltd. (United States) | 22,214 | | 3,576,454 |
TOTAL BERMUDA | | 10,382,218 |
Brazil - 6.7% |
BB Seguridade Participacoes SA | 245,700 | | 3,278,115 |
CCR SA | 417,300 | | 3,107,141 |
Cetip SA - Mercados Organizado | 151,600 | | 1,921,078 |
Cielo SA | 230,560 | | 3,786,063 |
Estacio Participacoes SA | 258,400 | | 2,992,889 |
Iguatemi Empresa de Shopping Centers SA | 175,500 | | 1,777,735 |
Kroton Educacional SA | 502,600 | | 3,582,032 |
Linx SA | 72,000 | | 1,495,847 |
Qualicorp SA (a) | 232,900 | | 2,368,570 |
Smiles SA | 112,900 | | 1,950,087 |
Ultrapar Participacoes SA | 140,300 | | 3,060,339 |
Weg SA | 202,415 | | 2,387,744 |
TOTAL BRAZIL | | 31,707,640 |
British Virgin Islands - 0.4% |
Mail.Ru Group Ltd. GDR (a)(e) | 85,900 | | 2,082,216 |
Cayman Islands - 6.4% |
51job, Inc. sponsored ADR (a)(d) | 7,049 | | 216,404 |
Alibaba Group Holding Ltd. sponsored ADR | 30,100 | | 2,967,860 |
Autohome, Inc. ADR Class A | 34,100 | | 1,803,549 |
Baidu.com, Inc. sponsored ADR (a) | 12,313 | | 2,939,975 |
Bitauto Holdings Ltd. ADR (a) | 22,855 | | 1,913,421 |
Haitian International Holdings Ltd. | 893,000 | | 1,915,555 |
Melco Crown Entertainment Ltd. sponsored ADR | 86,200 | | 2,339,468 |
Sands China Ltd. | 421,400 | | 2,628,319 |
Common Stocks - continued |
| Shares | | Value |
Cayman Islands - continued |
SouFun Holdings Ltd. ADR (d) | 211,800 | | $ 2,065,050 |
Tencent Holdings Ltd. | 714,800 | | 11,488,461 |
TOTAL CAYMAN ISLANDS | | 30,278,062 |
China - 1.2% |
China Pacific Insurance Group Co. Ltd. (H Shares) | 877,400 | | 3,283,371 |
PICC Property & Casualty Co. Ltd. (H Shares) | 1,392,500 | | 2,554,455 |
TOTAL CHINA | | 5,837,826 |
Colombia - 0.5% |
Grupo de Inversiones Suramerica SA | 123,456 | | 2,566,925 |
Denmark - 0.4% |
Novo Nordisk A/S Series B sponsored ADR | 42,501 | | 1,920,195 |
Egypt - 0.5% |
Commercial International Bank SAE sponsored GDR | 358,300 | | 2,436,440 |
Finland - 0.4% |
Kone Oyj (B Shares) (d) | 46,500 | | 1,998,712 |
France - 2.8% |
Bureau Veritas SA | 79,700 | | 1,970,555 |
Ingenico SA | 18,451 | | 1,837,495 |
LVMH Moet Hennessy - Louis Vuitton SA | 13,522 | | 2,293,519 |
Pernod Ricard SA | 14,700 | | 1,673,207 |
Publicis Groupe SA (a) | 27,500 | | 1,904,694 |
Safran SA | 28,900 | | 1,828,910 |
Zodiac Aerospace | 60,100 | | 1,832,774 |
TOTAL FRANCE | | 13,341,154 |
Greece - 1.0% |
Folli Follie SA | 72,500 | | 2,371,273 |
Greek Organization of Football Prognostics SA | 182,500 | | 2,211,528 |
TOTAL GREECE | | 4,582,801 |
Hong Kong - 1.0% |
AIA Group Ltd. | 367,800 | | 2,052,480 |
Galaxy Entertainment Group Ltd. | 377,000 | | 2,577,888 |
TOTAL HONG KONG | | 4,630,368 |
India - 12.0% |
Apollo Hospitals Enterprise Ltd. (a) | 95,367 | | 1,730,678 |
Asian Paints India Ltd. | 187,223 | | 2,000,226 |
Axis Bank Ltd. (a) | 318,541 | | 2,347,721 |
Exide Industries Ltd. | 656,457 | | 1,683,042 |
Common Stocks - continued |
| Shares | | Value |
India - continued |
Grasim Industries Ltd. | 31,862 | | $ 1,911,983 |
Havells India Ltd. | 464,910 | | 2,162,206 |
HCL Technologies Ltd. | 103,727 | | 2,720,363 |
HDFC Bank Ltd. | 199,223 | | 3,230,472 |
Housing Development Finance Corp. Ltd. | 286,978 | | 5,168,255 |
ICICI Bank Ltd. (a) | 104,204 | | 2,767,346 |
ITC Ltd. (a) | 649,502 | | 3,755,361 |
Larsen & Toubro Ltd. (a) | 131,867 | | 3,553,714 |
LIC Housing Finance Ltd. | 356,022 | | 2,096,521 |
Lupin Ltd. | 97,479 | | 2,256,969 |
Mahindra & Mahindra Ltd. (a) | 124,483 | | 2,646,732 |
Motherson Sumi Systems Ltd. | 245,550 | | 1,681,244 |
Sun Pharmaceutical Industries Ltd. | 241,337 | | 3,321,241 |
Sun TV Ltd. | 406,377 | | 2,161,232 |
Tata Consultancy Services Ltd. | 101,831 | | 4,332,656 |
Tata Motors Ltd. (a) | 338,789 | | 2,959,874 |
Titan Co. Ltd. (a) | 362,283 | | 2,379,826 |
TOTAL INDIA | | 56,867,662 |
Indonesia - 6.3% |
PT ACE Hardware Indonesia Tbk | 27,477,500 | | 1,844,228 |
PT Astra International Tbk | 6,331,700 | | 3,550,256 |
PT Bank Central Asia Tbk | 3,853,700 | | 4,160,227 |
PT Bank Rakyat Indonesia Tbk | 3,931,900 | | 3,603,178 |
PT Global Mediacom Tbk | 16,706,500 | | 2,711,474 |
PT Indocement Tunggal Prakarsa Tbk | 1,295,600 | | 2,567,860 |
PT Jasa Marga Tbk | 4,237,000 | | 2,227,625 |
PT Media Nusantara Citra Tbk | 8,899,500 | | 2,063,171 |
PT Semen Gresik (Persero) Tbk | 2,051,600 | | 2,694,885 |
PT Surya Citra Media Tbk | 6,616,200 | | 1,852,002 |
PT Tower Bersama Infrastructure Tbk | 3,062,900 | | 2,256,117 |
TOTAL INDONESIA | | 29,531,023 |
Kenya - 1.2% |
East African Breweries Ltd. | 590,262 | | 1,880,656 |
Kenya Commercial Bank Ltd. | 2,996,500 | | 1,842,454 |
Safaricom Ltd. | 15,087,300 | | 2,057,742 |
TOTAL KENYA | | 5,780,852 |
Korea (South) - 5.9% |
Coway Co. Ltd. | 31,572 | | 2,397,773 |
KEPCO Plant Service & Engineering Co. Ltd. | 24,103 | | 1,967,372 |
Common Stocks - continued |
| Shares | | Value |
Korea (South) - continued |
NAVER Corp. | 6,755 | | $ 4,740,373 |
Samsung Electronics Co. Ltd. | 16,003 | | 18,528,384 |
TOTAL KOREA (SOUTH) | | 27,633,902 |
Luxembourg - 0.3% |
Samsonite International SA | 487,200 | | 1,618,832 |
Malaysia - 1.5% |
Astro Malaysia Holdings Bhd | 2,061,800 | | 2,068,491 |
Public Bank Bhd | 572,100 | | 3,224,097 |
Tune Insurance Holdings Bhd | 2,572,100 | | 1,696,878 |
TOTAL MALAYSIA | | 6,989,466 |
Malta - 0.5% |
Brait SA | 314,452 | | 2,362,862 |
Mexico - 6.0% |
Banregio Grupo Financiero S.A.B. de CV | 351,266 | | 2,031,493 |
Fomento Economico Mexicano S.A.B. de CV unit | 412,600 | | 3,968,436 |
Grupo Aeroportuario del Pacifico SA de CV Series B | 322,721 | | 2,195,689 |
Grupo Aeroportuario del Sureste SA de CV Series B | 196,200 | | 2,622,848 |
Grupo Aeroportuario Norte S.A.B. de CV | 403,100 | | 2,008,278 |
Grupo Financiero Banorte S.A.B. de CV Series O | 635,800 | | 4,078,846 |
Grupo Mexico SA de CV Series B | 359,900 | | 1,236,615 |
Grupo Televisa SA de CV | 605,900 | | 4,378,813 |
Megacable Holdings S.A.B. de CV unit | 433,184 | | 1,984,452 |
Promotora y Operadora de Infraestructura S.A.B. de CV (a) | 169,500 | | 2,153,262 |
Qualitas Controladora S.A.B. de CV | 595,600 | | 1,540,499 |
TOTAL MEXICO | | 28,199,231 |
Nigeria - 1.2% |
Dangote Cement PLC | 1,596,095 | | 2,071,599 |
Guaranty Trust Bank PLC GDR (Reg. S) | 234,654 | | 1,806,836 |
Nigerian Breweries PLC | 1,712,655 | | 1,674,918 |
TOTAL NIGERIA | | 5,553,353 |
Philippines - 2.9% |
Alliance Global Group, Inc. | 4,420,600 | | 2,486,409 |
GT Capital Holdings, Inc. | 102,075 | | 2,293,568 |
Metropolitan Bank & Trust Co. | 978,753 | | 1,795,844 |
Robinsons Retail Holdings, Inc. | 1,244,990 | | 1,771,838 |
SM Investments Corp. | 140,386 | | 2,446,316 |
SM Prime Holdings, Inc. | 7,009,000 | | 2,724,589 |
TOTAL PHILIPPINES | | 13,518,564 |
Common Stocks - continued |
| Shares | | Value |
Russia - 1.6% |
Magnit OJSC GDR (Reg. S) | 62,466 | | $ 4,185,222 |
NOVATEK OAO GDR (Reg. S) | 29,786 | | 3,199,016 |
TOTAL RUSSIA | | 7,384,238 |
South Africa - 9.0% |
Alexander Forbes Group Holding (a) | 2,350,892 | | 1,833,013 |
Aspen Pharmacare Holdings Ltd. | 112,493 | | 4,012,715 |
Bidvest Group Ltd. | 123,815 | | 3,405,495 |
Coronation Fund Managers Ltd. | 215,500 | | 1,865,885 |
FirstRand Ltd. | 792,700 | | 3,392,229 |
Life Healthcare Group Holdings Ltd. | 567,893 | | 2,147,024 |
Mr Price Group Ltd. | 134,900 | | 2,790,402 |
MTN Group Ltd. | 286,100 | | 6,329,101 |
Nampak Ltd. | 649,343 | | 2,647,472 |
Naspers Ltd. Class N | 63,200 | | 7,865,169 |
Remgro Ltd. | 128,900 | | 2,956,470 |
Sanlam Ltd. | 477,600 | | 3,015,920 |
TOTAL SOUTH AFRICA | | 42,260,895 |
Spain - 0.5% |
Amadeus IT Holding SA Class A | 65,600 | | 2,408,655 |
Sweden - 0.3% |
Atlas Copco AB (A Shares) | 54,300 | | 1,567,050 |
Switzerland - 1.3% |
Compagnie Financiere Richemont SA Series A | 27,200 | | 2,288,458 |
Nestle SA | 25,522 | | 1,871,634 |
SGS SA (Reg.) | 900 | | 1,975,576 |
TOTAL SWITZERLAND | | 6,135,668 |
Taiwan - 4.7% |
Delta Electronics, Inc. | 586,000 | | 3,510,048 |
Giant Manufacturing Co. Ltd. | 250,000 | | 2,021,088 |
Merida Industry Co. Ltd. | 307,650 | | 2,121,820 |
Taiwan Semiconductor Manufacturing Co. Ltd. | 3,332,000 | | 14,421,273 |
TOTAL TAIWAN | | 22,074,229 |
Thailand - 2.2% |
Airports of Thailand PCL (For. Reg.) | 357,100 | | 2,652,649 |
Bangkok Dusit Medical Services PCL (For. Reg.) | 3,688,200 | | 2,093,773 |
Bumrungrad Hospital PCL (For. Reg.) | 512,300 | | 2,091,609 |
Kasikornbank PCL (For. Reg.) | 521,900 | | 3,779,995 |
TOTAL THAILAND | | 10,618,026 |
Common Stocks - continued |
| Shares | | Value |
Turkey - 1.7% |
Coca-Cola Icecek Sanayi A/S | 103,050 | | $ 2,350,633 |
TAV Havalimanlari Holding A/S | 315,000 | | 2,643,129 |
Tofas Turk Otomobil Fabrikasi A/S | 53,264 | | 334,300 |
Tupras Turkiye Petrol Rafinelleri A/S | 115,000 | | 2,496,457 |
TOTAL TURKEY | | 7,824,519 |
United Arab Emirates - 0.9% |
DP World Ltd. | 101,794 | | 1,950,373 |
First Gulf Bank PJSC | 488,529 | | 2,414,049 |
TOTAL UNITED ARAB EMIRATES | | 4,364,422 |
United Kingdom - 2.9% |
Al Noor Hospitals Group PLC | 134,084 | | 2,185,696 |
Bank of Georgia Holdings PLC | 43,200 | | 1,769,140 |
British American Tobacco PLC (United Kingdom) | 30,700 | | 1,740,002 |
Burberry Group PLC | 88,668 | | 2,171,604 |
Diageo PLC | 65,047 | | 1,918,392 |
Intertek Group PLC | 43,100 | | 1,876,739 |
Prudential PLC | 82,684 | | 1,914,633 |
TOTAL UNITED KINGDOM | | 13,576,206 |
United States of America - 4.3% |
A.O. Smith Corp. | 39,500 | | 2,107,325 |
Google, Inc. Class C (a) | 3,250 | | 1,817,010 |
International Flavors & Fragrances, Inc. | 20,200 | | 2,002,830 |
Kansas City Southern | 16,020 | | 1,967,096 |
Las Vegas Sands Corp. | 33,900 | | 2,110,614 |
MasterCard, Inc. Class A | 25,200 | | 2,110,500 |
PPG Industries, Inc. | 10,900 | | 2,220,221 |
Praxair, Inc. | 13,100 | | 1,650,469 |
Visa, Inc. Class A | 8,900 | | 2,148,727 |
W.R. Grace & Co. (a) | 21,400 | | 2,024,440 |
TOTAL UNITED STATES OF AMERICA | | 20,159,232 |
TOTAL COMMON STOCKS (Cost $380,302,536) |
435,716,827
|
Nonconvertible Preferred Stocks - 5.4% |
| | | |
Brazil - 4.5% |
Ambev SA sponsored ADR | 838,480 | | 5,601,046 |
Banco Bradesco SA (PN) sponsored ADR | 432,300 | | 6,475,854 |
Nonconvertible Preferred Stocks - continued |
| Shares | | Value |
Brazil - continued |
Companhia Brasileira de Distribuicao Grupo Pao de Acucar sponsored ADR | 62,000 | | $ 2,591,600 |
Itau Unibanco Holding SA sponsored ADR | 455,380 | | 6,721,409 |
TOTAL BRAZIL | | 21,389,909 |
Colombia - 0.5% |
Grupo Aval Acciones y Valores SA | 3,213,624 | | 2,178,861 |
Germany - 0.4% |
Henkel AG & Co. KGaA | 18,700 | | 1,846,123 |
TOTAL NONCONVERTIBLE PREFERRED STOCKS (Cost $27,663,433) |
25,414,893
|
Money Market Funds - 3.3% |
| | | |
Fidelity Cash Central Fund, 0.11% (b) | 9,664,030 | | 9,664,030 |
Fidelity Securities Lending Cash Central Fund, 0.11% (b)(c) | 6,178,349 | | 6,178,349 |
TOTAL MONEY MARKET FUNDS (Cost $15,842,379) |
15,842,379
|
TOTAL INVESTMENT PORTFOLIO - 101.0% (Cost $423,808,348) | | 476,974,099 |
NET OTHER ASSETS (LIABILITIES) - (1.0)% | | (4,818,377) |
NET ASSETS - 100% | $ 472,155,722 |
Legend |
(a) Non-income producing |
(b) Affiliated fund that is generally available only to investment companies and other accounts managed by Fidelity Investments. The rate quoted is the annualized seven-day yield of the fund at period end. A complete unaudited listing of the fund's holdings as of its most recent quarter end is available upon request. In addition, each Fidelity Central Fund's financial statements, which are not covered by the Fund's Report of Independent Registered Public Accounting Firm, are available on the SEC's website or upon request. |
(c) Investment made with cash collateral received from securities on loan. |
(d) Security or a portion of the security is on loan at period end. |
(e) Security exempt from registration under Rule 144A of the Securities Act of 1933. These securities may be resold in transactions exempt from registration, normally to qualified institutional buyers. At the end of the period, the value of these securities amounted to $2,082,216 or 0.4% of net assets. |
Affiliated Central Funds |
Information regarding fiscal year to date income earned by the Fund from investments in Fidelity Central Funds is as follows: |
Fund | Income earned |
Fidelity Cash Central Fund | $ 4,725 |
Fidelity Securities Lending Cash Central Fund | 60,169 |
Total | $ 64,894 |
Other Information |
Categorizations in the Schedule of Investments are based on country or territory of incorporation. |
The following is a summary of the inputs used, as of October 31, 2014, involving the Fund's assets and liabilities carried at fair value. The inputs or methodology used for valuing securities may not be an indication of the risk associated with investing in those securities. For more information on valuation inputs, and their aggregation into the levels used in the tables below, please refer to the Investment Valuation section in the accompanying Notes to Financial Statements. |
Valuation Inputs at Reporting Date: |
Description | Total | Level 1 | Level 2 | Level 3 |
Investments in Securities: | | | | |
Equities: | | | | |
Consumer Discretionary | $ 88,530,930 | $ 45,967,075 | $ 42,563,855 | $ - |
Consumer Staples | 36,829,068 | 25,771,841 | 11,057,227 | - |
Energy | 8,755,812 | 8,755,812 | - | - |
Financials | 110,536,197 | 61,842,567 | 48,693,630 | - |
Health Care | 24,128,470 | 12,634,200 | 11,494,270 | - |
Industrials | 62,990,876 | 41,782,472 | 21,208,404 | - |
Valuation Inputs at Reporting Date: |
Description | Total | Level 1 | Level 2 | Level 3 |
Investments in Securities: | | | | |
Equities: | | | | |
Information Technology | $ 91,221,010 | $ 52,645,125 | $ 38,575,885 | $ - |
Materials | 23,028,600 | 13,853,646 | 9,174,954 | - |
Telecommunication Services | 10,642,960 | 8,386,843 | 2,256,117 | - |
Utilities | 4,467,797 | - | 4,467,797 | - |
Money Market Funds | 15,842,379 | 15,842,379 | - | - |
Total Investments in Securities: | $ 476,974,099 | $ 287,481,960 | $ 189,492,139 | $ - |
The following is a summary of transfers between Level 1 and Level 2 for the period ended October 31, 2014. Transfers are assumed to have occurred at the beginning of the period, and are primarily attributable to the valuation techniques used for foreign equity securities, as discussed in the accompanying Notes to Financial Statements: |
Transfers | Total |
Level 1 to Level 2 | $ 84,213,412 |
Level 2 to Level 1 | $ 0 |
See accompanying notes which are an integral part of the financial statements.
Annual Report
Statement of Assets and Liabilities
| October 31, 2014 |
| | |
Assets | | |
Investment in securities, at value (including securities loaned of $6,007,153) - See accompanying schedule: Unaffiliated issuers (cost $407,965,969) | $ 461,131,720 | |
Fidelity Central Funds (cost $15,842,379) | 15,842,379 | |
Total Investments (cost $423,808,348) | | $ 476,974,099 |
Foreign currency held at value (cost $269) | | 269 |
Receivable for investments sold | | 3,743,122 |
Receivable for fund shares sold | | 343,036 |
Dividends receivable | | 608,964 |
Distributions receivable from Fidelity Central Funds | | 3,396 |
Prepaid expenses | | 1,137 |
Other receivables | | 27,328 |
Total assets | | 481,701,351 |
| | |
Liabilities | | |
Payable for investments purchased | $ 1,618,764 | |
Payable for fund shares redeemed | 475,480 | |
Accrued management fee | 303,024 | |
Distribution and service plan fees payable | 108,098 | |
Other affiliated payables | 122,013 | |
Other payables and accrued expenses | 739,901 | |
Collateral on securities loaned, at value | 6,178,349 | |
Total liabilities | | 9,545,629 |
| | |
Net Assets | | $ 472,155,722 |
Net Assets consist of: | | |
Paid in capital | | $ 467,770,539 |
Undistributed net investment income | | 1,039,628 |
Accumulated undistributed net realized gain (loss) on investments and foreign currency transactions | | (49,234,244) |
Net unrealized appreciation (depreciation) on investments and assets and liabilities in foreign currencies | | 52,579,799 |
Net Assets | | $ 472,155,722 |
See accompanying notes which are an integral part of the financial statements.
Annual Report
Statement of Assets and Liabilities - continued
| October 31, 2014 |
| | |
Calculation of Maximum Offering Price Class A:
Net Asset Value and redemption price per share ($141,600,522 ÷ 6,055,753 shares) | | $ 23.38 |
| | |
Maximum offering price per share (100/94.25 of $23.38) | | $ 24.81 |
Class T:
Net Asset Value and redemption price per share ($54,340,913 ÷ 2,331,969 shares) | | $ 23.30 |
| | |
Maximum offering price per share (100/96.50 of $23.30) | | $ 24.15 |
Class B:
Net Asset Value and offering price per share ($7,545,548 ÷ 331,613 shares)A | | $ 22.75 |
| | |
Class C:
Net Asset Value and offering price per share ($64,025,961 ÷ 2,820,184 shares)A | | $ 22.70 |
| | |
Institutional Class:
Net Asset Value, offering price and redemption price per share ($199,098,363 ÷ 8,471,387 shares) | | $ 23.50 |
| | |
Class Z:
Net Asset Value, offering price and redemption price per share ($5,544,415 ÷ 235,887 shares) | | $ 23.50 |
A Redemption price per share is equal to net asset value less any applicable contingent deferred sales charge.
See accompanying notes which are an integral part of the financial statements.
Annual Report
Financial Statements - continued
Statement of Operations
| Year ended October 31, 2014 |
| | |
Investment Income | | |
Dividends | | $ 8,409,738 |
Interest | | 6 |
Income from Fidelity Central Funds | | 64,894 |
Income before foreign taxes withheld | | 8,474,638 |
Less foreign taxes withheld | | (755,643) |
Total income | | 7,718,995 |
| | |
Expenses | | |
Management fee | $ 3,460,066 | |
Transfer agent fees | 1,152,533 | |
Distribution and service plan fees | 1,315,927 | |
Accounting and security lending fees | 225,213 | |
Custodian fees and expenses | 327,370 | |
Independent trustees' compensation | 1,759 | |
Registration fees | 86,388 | |
Audit | 85,066 | |
Legal | 1,522 | |
Miscellaneous | 15,825 | |
Total expenses | | 6,671,669 |
Net investment income (loss) | | 1,047,326 |
Realized and Unrealized Gain (Loss) Net realized gain (loss) on: | | |
Investment securities: | | |
Unaffiliated issuers (net of foreign taxes of $45,790) | 3,803,938 | |
Foreign currency transactions | (306,431) | |
Total net realized gain (loss) | | 3,497,507 |
Change in net unrealized appreciation (depreciation) on: Investment securities (net of increase in deferred foreign taxes of $351,602) | 9,165,948 | |
Assets and liabilities in foreign currencies | 24,766 | |
Total change in net unrealized appreciation (depreciation) | | 9,190,714 |
Net gain (loss) | | 12,688,221 |
Net increase (decrease) in net assets resulting from operations | | $ 13,735,547 |
See accompanying notes which are an integral part of the financial statements.
Annual Report
Statement of Changes in Net Assets
| Year ended
October 31,
2014 | Year ended
October 31,
2013 |
Increase (Decrease) in Net Assets | | |
Operations | | |
Net investment income (loss) | $ 1,047,326 | $ 1,405,290 |
Net realized gain (loss) | 3,497,507 | 41,473,017 |
Change in net unrealized appreciation (depreciation) | 9,190,714 | 2,826,987 |
Net increase (decrease) in net assets resulting
from operations | 13,735,547 | 45,705,294 |
Distributions to shareholders from net investment income | (1,113,231) | (3,939,467) |
Distributions to shareholders from net realized gain | (185,956) | - |
Total distributions | (1,299,187) | (3,939,467) |
Share transactions - net increase (decrease) | 32,907,367 | (61,785,803) |
Redemption fees | 31,634 | 43,406 |
Total increase (decrease) in net assets | 45,375,361 | (19,976,570) |
| | |
Net Assets | | |
Beginning of period | 426,780,361 | 446,756,931 |
End of period (including undistributed net investment income of $1,039,628 and undistributed net investment income of $1,116,713, respectively) | $ 472,155,722 | $ 426,780,361 |
See accompanying notes which are an integral part of the financial statements.
Annual Report
Financial Highlights - Class A
Years ended October 31, | 2014 | 2013 | 2012 | 2011 | 2010 |
Selected Per-Share Data | | | | | |
Net asset value, beginning of period | $ 22.62 | $ 20.51 | $ 20.50 | $ 23.71 | $ 19.20 |
Income from Investment Operations | | | | | |
Net investment income (loss) C | .06 | .08 | .22 | .21 | .12 |
Net realized and unrealized gain (loss) | .76 | 2.23 | (.06) | (3.19) | 4.59 |
Total from investment operations | .82 | 2.31 | .16 | (2.98) | 4.71 |
Distributions from net investment income | (.05) | (.20) | (.15) | (.11) | (.07) |
Distributions from net realized gain | (.01) | - | - | (.13) | (.13) |
Total distributions | (.06) | (.20) | (.15) | (.24) | (.20) |
Redemption fees added to paid in capital C | - G | - G | - G | .01 | - G |
Net asset value, end of period | $ 23.38 | $ 22.62 | $ 20.51 | $ 20.50 | $ 23.71 |
Total ReturnA, B | 3.65% | 11.34% | .80% | (12.69)% | 24.69% |
Ratios to Average Net Assets D, F | | | | | |
Expenses before reductions | 1.52% | 1.56% | 1.54% | 1.54% | 1.56% |
Expenses net of fee waivers, if any | 1.52% | 1.55% | 1.54% | 1.54% | 1.56% |
Expenses net of all reductions | 1.52% | 1.50% | 1.48% | 1.47% | 1.50% |
Net investment income (loss) | .26% | .38% | 1.07% | .92% | .59% |
Supplemental Data | | | | | |
Net assets, end of period (000 omitted) | $ 141,601 | $ 146,378 | $ 160,464 | $ 202,477 | $ 286,970 |
Portfolio turnover rateE | 97% | 121% | 177% | 122% | 86% |
A Total returns would have been lower if certain expenses had not been reduced during the applicable periods shown.
B Total returns do not include the effect of the sales charges.
C Calculated based on average shares outstanding during the period.
D Fees and expenses of any underlying Fidelity Central Funds are not included in the Fund's expense ratio. The Fund indirectly bears its proportionate share of the expenses of any underlying Fidelity Central Funds.
E Amount does not include the portfolio activity of any underlying Fidelity Central Funds.
F Expense ratios reflect operating expenses of the class. Expenses before reductions do not reflect amounts reimbursed by the investment adviser or reductions from brokerage service arrangements or reductions from other expense offset arrangements and do not represent the amount paid by the class during periods when reimbursements or reductions occur. Expenses net of fee waivers reflect expenses after reimbursement by the investment adviser but prior to reductions from brokerage service arrangements or other expense offset arrangements. Expenses net of all reductions represent the net expenses paid by the class.
G Amount represents less than $.01 per share.
See accompanying notes which are an integral part of the financial statements.
Annual Report
Financial Highlights - Class T
Years ended October 31, | 2014 | 2013 | 2012 | 2011 | 2010 |
Selected Per-Share Data | | | | | |
Net asset value, beginning of period | $ 22.55 | $ 20.44 | $ 20.43 | $ 23.61 | $ 19.14 |
Income from Investment Operations | | | | | |
Net investment income (loss) C | - | .03 | .16 | .15 | .07 |
Net realized and unrealized gain (loss) | .76 | 2.22 | (.06) | (3.18) | 4.57 |
Total from investment operations | .76 | 2.25 | .10 | (3.03) | 4.64 |
Distributions from net investment income | - G | (.14) | (.09) | (.04) | (.04) |
Distributions from net realized gain | (.01) | - | - | (.13) | (.13) |
Total distributions | (.01) | (.14) | (.09) | (.16) H | (.17) |
Redemption fees added to paid in capital C | - G | - G | - G | .01 | - G |
Net asset value, end of period | $ 23.30 | $ 22.55 | $ 20.44 | $ 20.43 | $ 23.61 |
Total ReturnA, B | 3.39% | 11.06% | .49% | (12.89)% | 24.38% |
Ratios to Average Net Assets D, F | | | | | |
Expenses before reductions | 1.78% | 1.81% | 1.80% | 1.79% | 1.81% |
Expenses net of fee waivers, if any | 1.78% | 1.81% | 1.80% | 1.79% | 1.81% |
Expenses net of all reductions | 1.78% | 1.76% | 1.73% | 1.73% | 1.76% |
Net investment income (loss) | -% I | .13% | .81% | .66% | .33% |
Supplemental Data | | | | | |
Net assets, end of period (000 omitted) | $ 54,341 | $ 55,797 | $ 58,919 | $ 73,146 | $ 104,417 |
Portfolio turnover rateE | 97% | 121% | 177% | 122% | 86% |
A Total returns would have been lower if certain expenses had not been reduced during the applicable periods shown.
B Total returns do not include the effect of the sales charges.
C Calculated based on average shares outstanding during the period.
D Fees and expenses of any underlying Fidelity Central Funds are not included in the Fund's expense ratio. The Fund indirectly bears its proportionate share of the expenses of any underlying Fidelity Central Funds.
E Amount does not include the portfolio activity of any underlying Fidelity Central Funds.
F Expense ratios reflect operating expenses of the class. Expenses before reductions do not reflect amounts reimbursed by the investment adviser or reductions from brokerage service arrangements or reductions from other expense offset arrangements and do not represent the amount paid by the class during periods when reimbursements or reductions occur. Expenses net of fee waivers reflect expenses after reimbursement by the investment adviser but prior to reductions from brokerage service arrangements or other expense offset arrangements. Expenses net of all reductions represent the net expenses paid by the class.
G Amount represents less than $.01 per share.
H Total distributions of $.16 per share is comprised of distributions from net investment income of $.037 and distributions from net realized gain of $.125 per share.
I Amount represents less than .01%.
See accompanying notes which are an integral part of the financial statements.
Annual Report
Financial Highlights - Class B
Years ended October 31, | 2014 | 2013 | 2012 | 2011 | 2010 |
Selected Per-Share Data | | | | | |
Net asset value, beginning of period | $ 22.11 | $ 20.03 | $ 20.03 | $ 23.14 | $ 18.80 |
Income from Investment Operations | | | | | |
Net investment income (loss) C | (.11) | (.08) | .06 | .04 | (.03) |
Net realized and unrealized gain (loss) | .75 | 2.18 | (.06) | (3.13) | 4.49 |
Total from investment operations | .64 | 2.10 | - | (3.09) | 4.46 |
Distributions from net investment income | - | (.02) | - | (.01) | - |
Distributions from net realized gain | - | - | - | (.03) | (.12) |
Total distributions | - | (.02) | - | (.03) H | (.12) |
Redemption fees added to paid in capital C | - G | - G | - G | .01 | - G |
Net asset value, end of period | $ 22.75 | $ 22.11 | $ 20.03 | $ 20.03 | $ 23.14 |
Total ReturnA, B | 2.89% | 10.50% | -% | (13.33)% | 23.77% |
Ratios to Average Net Assets D, F | | | | | |
Expenses before reductions | 2.28% | 2.31% | 2.29% | 2.29% | 2.32% |
Expenses net of fee waivers, if any | 2.28% | 2.31% | 2.29% | 2.29% | 2.32% |
Expenses net of all reductions | 2.28% | 2.26% | 2.23% | 2.22% | 2.26% |
Net investment income (loss) | (.49)% | (.37)% | .32% | .16% | (.17)% |
Supplemental Data | | | | | |
Net assets, end of period (000 omitted) | $ 7,546 | $ 11,391 | $ 15,994 | $ 21,304 | $ 31,159 |
Portfolio turnover rateE | 97% | 121% | 177% | 122% | 86% |
A Total returns would have been lower if certain expenses had not been reduced during the applicable periods shown.
B Total returns do not include the effect of the contingent deferred sales charge.
C Calculated based on average shares outstanding during the period.
D Fees and expenses of any underlying Fidelity Central Funds are not included in the Fund's expense ratio. The Fund indirectly bears its proportionate share of the expenses of any underlying Fidelity Central Funds.
E Amount does not include the portfolio activity of any underlying Fidelity Central Funds.
F Expense ratios reflect operating expenses of the class. Expenses before reductions do not reflect amounts reimbursed by the investment adviser or reductions from brokerage service arrangements or reductions from other expense offset arrangements and do not represent the amount paid by the class during periods when reimbursements or reductions occur. Expenses net of fee waivers reflect expenses after reimbursement by the investment adviser but prior to reductions from brokerage service arrangements or other expense offset arrangements. Expenses net of all reductions represent the net expenses paid by the class.
G Amount represents less than $.01 per share.
H Total distributions of $.03 per share is comprised of distributions from net investment income of $.005 and distributions from net realized gain of $.025 per share.
See accompanying notes which are an integral part of the financial statements.
Annual Report
Financial Highlights - Class C
Years ended October 31, | 2014 | 2013 | 2012 | 2011 | 2010 |
Selected Per-Share Data | | | | | |
Net asset value, beginning of period | $ 22.06 | $ 20.00 | $ 20.00 | $ 23.13 | $ 18.80 |
Income from Investment Operations | | | | | |
Net investment income (loss) C | (.11) | (.08) | .06 | .04 | (.03) |
Net realized and unrealized gain (loss) | .75 | 2.18 | (.06) | (3.12) | 4.49 |
Total from investment operations | .64 | 2.10 | - | (3.08) | 4.46 |
Distributions from net investment income | - | (.04) | - | (.01) | - |
Distributions from net realized gain | - | - | - | (.05) | (.13) |
Total distributions | - | (.04) | - | (.06) | (.13) |
Redemption fees added to paid in capital C | - G | - G | - G | .01 | - G |
Net asset value, end of period | $ 22.70 | $ 22.06 | $ 20.00 | $ 20.00 | $ 23.13 |
Total ReturnA, B | 2.90% | 10.49% | -% | (13.33)% | 23.80% |
Ratios to Average Net Assets D, F | | | | | |
Expenses before reductions | 2.27% | 2.31% | 2.29% | 2.28% | 2.30% |
Expenses net of fee waivers, if any | 2.27% | 2.30% | 2.29% | 2.28% | 2.30% |
Expenses net of all reductions | 2.27% | 2.25% | 2.23% | 2.22% | 2.24% |
Net investment income (loss) | (.49)% | (.37)% | .32% | .17% | (.15)% |
Supplemental Data | | | | | |
Net assets, end of period (000 omitted) | $ 64,026 | $ 62,532 | $ 65,598 | $ 80,855 | $ 106,711 |
Portfolio turnover rateE | 97% | 121% | 177% | 122% | 86% |
A Total returns would have been lower if certain expenses had not been reduced during the applicable periods shown.
B Total returns do not include the effect of the contingent deferred sales charge.
C Calculated based on average shares outstanding during the period.
D Fees and expenses of any underlying Fidelity Central Funds are not included in the Fund's expense ratio. The Fund indirectly bears its proportionate share of the expenses of any underlying Fidelity Central Funds.
E Amount does not include the portfolio activity of any underlying Fidelity Central Funds.
F Expense ratios reflect operating expenses of the class. Expenses before reductions do not reflect amounts reimbursed by the investment adviser or reductions from brokerage service arrangements or reductions from other expense offset arrangements and do not represent the amount paid by the class during periods when reimbursements or reductions occur. Expenses net of fee waivers reflect expenses after reimbursement by the investment adviser but prior to reductions from brokerage service arrangements or other expense offset arrangements. Expenses net of all reductions represent the net expenses paid by the class.
G Amount represents less than $.01 per share.
See accompanying notes which are an integral part of the financial statements.
Annual Report
Financial Highlights - Institutional Class
Years ended October 31, | 2014 | 2013 | 2012 | 2011 | 2010 |
Selected Per-Share Data | | | | | |
Net asset value, beginning of period | $ 22.73 | $ 20.61 | $ 20.63 | $ 23.87 | $ 19.29 |
Income from Investment Operations | | | | | |
Net investment income (loss) B | .14 | .15 | .28 | .29 | .20 |
Net realized and unrealized gain (loss) | .76 | 2.25 | (.06) | (3.21) | 4.62 |
Total from investment operations | .90 | 2.40 | .22 | (2.92) | 4.82 |
Distributions from net investment income | (.12) | (.28) | (.24) | (.20) | (.11) |
Distributions from net realized gain | (.01) | - | - | (.13) | (.13) |
Total distributions | (.13) | (.28) | (.24) | (.33) | (.24) |
Redemption fees added to paid in capital B | - F | - F | - F | .01 | - F |
Net asset value, end of period | $ 23.50 | $ 22.73 | $ 20.61 | $ 20.63 | $ 23.87 |
Total ReturnA | 4.00% | 11.73% | 1.08% | (12.41)% | 25.15% |
Ratios to Average Net Assets C, E | | | | | |
Expenses before reductions | 1.18% | 1.23% | 1.22% | 1.21% | 1.22% |
Expenses net of fee waivers, if any | 1.18% | 1.22% | 1.22% | 1.21% | 1.22% |
Expenses net of all reductions | 1.18% | 1.18% | 1.16% | 1.14% | 1.17% |
Net investment income (loss) | .60% | .71% | 1.39% | 1.25% | .93% |
Supplemental Data | | | | | |
Net assets, end of period (000 omitted) | $ 199,098 | $ 150,576 | $ 145,782 | $ 138,312 | $ 184,789 |
Portfolio turnover rateD | 97% | 121% | 177% | 122% | 86% |
A Total returns would have been lower if certain expenses had not been reduced during the applicable periods shown.
B Calculated based on average shares outstanding during the period.
C Fees and expenses of any underlying Fidelity Central Funds are not included in the Fund's expense ratio. The Fund indirectly bears its proportionate share of the expenses of any underlying Fidelity Central Funds.
D Amount does not include the portfolio activity of any underlying Fidelity Central Funds.
E Expense ratios reflect operating expenses of the class. Expenses before reductions do not reflect amounts reimbursed by the investment adviser or reductions from brokerage service arrangements or reductions from other expense offset arrangements and do not represent the amount paid by the class during periods when reimbursements or reductions occur. Expenses net of fee waivers reflect expenses after reimbursement by the investment adviser but prior to reductions from brokerage service arrangements or other expense offset arrangements. Expenses net of all reductions represent the net expenses paid by the class.
F Amount represents less than $.01 per share.
See accompanying notes which are an integral part of the financial statements.
Annual Report
Financial Highlights - Class Z
Years ended October 31, | 2014 | 2013 G |
Selected Per-Share Data | | |
Net asset value, beginning of period | $ 22.73 | $ 21.33 |
Income from Investment Operations | | |
Net investment income (loss) D | .18 | .03 |
Net realized and unrealized gain (loss) | .76 | 1.37 |
Total from investment operations | .94 | 1.40 |
Distributions from net investment income | (.16) | - |
Distributions from net realized gain | (.01) | - |
Total distributions | (.17) | - |
Redemption fees added to paid in capital D, I | - | - |
Net asset value, end of period | $ 23.50 | $ 22.73 |
Total ReturnB, C | 4.19% | 6.56% |
Ratios to Average Net Assets E, H | | |
Expenses before reductions | 1.02% | 1.05%A |
Expenses net of fee waivers, if any | 1.02% | 1.05%A |
Expenses net of all reductions | 1.02% | 1.00%A |
Net investment income (loss) | .77% | .62%A |
Supplemental Data | | |
Net assets, end of period (000 omitted) | $ 5,544 | $ 107 |
Portfolio turnover rateF | 97% | 121% |
A Annualized
B Total returns for periods of less than one year are not annualized.
C Total returns would have been lower if certain expenses had not been reduced during the applicable periods shown.
D Calculated based on average shares outstanding during the period.
E Fees and expenses of any underlying Fidelity Central Funds are not included in the Fund's expense ratio. The Fund indirectly bears its proportionate share of the expenses of any underlying Fidelity Central Funds.
F Amount does not include the portfolio activity of any underlying Fidelity Central Funds.
G For the period August 13, 2013 (commencement of sale of shares) to October 31, 2013.
H Expense ratios reflect operating expenses of the class. Expenses before reductions do not reflect amounts reimbursed by the investment adviser or reductions from brokerage service arrangements or reductions from other expense offset arrangements and do not represent the amount paid by the class during periods when reimbursements or reductions occur. Expense ratios before reductions for start-up periods may not be representative of longer-term operating periods. Expenses net of fee waivers reflect expenses after reimbursement by the investment adviser but prior to reductions from brokerage service arrangements or other expense offset arrangements. Expenses net of all reductions represent the net expenses paid by the class.
I Amount represents less than $.01 per share.
See accompanying notes which are an integral part of the financial statements.
Annual Report
Notes to Financial Statements
For the period ended October 31, 2014
1. Organization.
Fidelity Advisor Emerging Markets Fund (the Fund) is a fund of Fidelity Advisor Series VIII (the Trust) and is authorized to issue an unlimited number of shares. The Trust is registered under the Investment Company Act of 1940, as amended (the 1940 Act), as an open-end management investment company organized as a Massachusetts business trust. The Fund offers Class A, Class T, Class C, Institutional Class and Class Z shares, each of which, along with Class B shares, has equal rights as to assets and voting privileges. Class B shares are closed to new accounts and additional purchases, except for exchanges and reinvestments. Each class has exclusive voting rights with respect to matters that affect that class. Class B shares will automatically convert to Class A shares after a holding period of seven years from the initial date of purchase. The Fund's investments in emerging markets can be subject to social, economic, regulatory, and political uncertainties and can be extremely volatile.
2. Investments in Fidelity Central Funds.
The Fund invests in Fidelity Central Funds, which are open-end investment companies generally available only to other investment companies and accounts managed by the investment adviser and its affiliates. The Fund's Schedule of Investments lists each of the Fidelity Central Funds held as of period end, if any, as an investment of the Fund, but does not include the underlying holdings of each Fidelity Central Fund. As an Investing Fund, the Fund indirectly bears its proportionate share of the expenses of the underlying Fidelity Central Funds.
The Money Market Central Funds seek preservation of capital and current income and are managed by Fidelity Investments Money Management, Inc. (FIMM), an affiliate of the investment adviser. Annualized expenses of the Money Market Central Funds as of their most recent shareholder report date are less than .01%.
A complete unaudited list of holdings for each Fidelity Central Fund is available upon request or at the Securities and Exchange Commission (the SEC) website at www.sec.gov. In addition, the financial statements of the Fidelity Central Funds, which are not covered by the Fund's Report of Independent Registered Public Accounting Firm, are available on the SEC website or upon request.
3. Significant Accounting Policies.
The financial statements have been prepared in conformity with accounting principles generally accepted in the United States of America (GAAP), which require management to make certain estimates and assumptions at the date of the financial statements. Actual results could differ from those estimates. Subsequent events, if any, through the date that the financial statements were issued have been evaluated in the preparation of
Annual Report
3. Significant Accounting Policies - continued
the financial statements. The following summarizes the significant accounting policies of the Fund:
Investment Valuation. Investments are valued as of 4:00 p.m. Eastern time on the last calendar day of the period. In accordance with valuation policies and procedures approved by the Board of Trustees (the Board), the Fund attempts to obtain prices from one or more third party pricing vendors or brokers to value its investments. When current market prices, quotations or currency exchange rates are not readily available or reliable, investments will be fair valued in good faith by the Fidelity Management & Research Company (FMR)Fair Value Committee (the Committee), in accordance with procedures adopted by the Board. Factors used in determining fair value vary by investment type and may include market or investment specific events. The frequency with which these procedures are used cannot be predicted and they may be utilized to a significant extent. The Committee oversees the Fund's valuation policies and procedures and is responsible for approving and reporting to the Board all fair value determinations.
The Fund categorizes the inputs to valuation techniques used to value its investments into a disclosure hierarchy consisting of three levels as shown below:
Level 1 - quoted prices in active markets for identical investments
Level 2 - other significant observable inputs (including quoted prices for similar investments, interest rates, prepayment speeds, etc.)
Level 3 - unobservable inputs (including the Fund's own assumptions based on the best information available)
Valuation techniques used to value the Fund's investments by major category are as follows:
Equity securities, including restricted securities, for which market quotations are readily available, are valued at the last reported sale price or official closing price as reported by a third party pricing vendor on the primary market or exchange on which they are traded and are categorized as Level 1 in the hierarchy. In the event there were no sales during the day or closing prices are not available, securities are valued at the last quoted bid price or may be valued using the last available price and are generally categorized as Level 2 in the hierarchy. For foreign equity securities, when market or security specific events arise, comparisons to the valuation of American Depositary Receipts (ADRs), futures contracts, Exchange-Traded Funds (ETFs) and certain indexes as well as quoted prices for similar securities may be used and would be categorized as Level 2 in the hierarchy. Utilizing these techniques may result in transfers between Level 1 and Level 2. For equity securities, including restricted securities, where observable inputs are
Annual Report
Notes to Financial Statements - continued
3. Significant Accounting Policies - continued
Investment Valuation - continued
limited, assumptions about market activity and risk are used and these securities may be categorized as Level 3 in the hierarchy.
Investments in open-end mutual funds, including the Fidelity Central Funds, are valued at their closing net asset value (NAV) each business day and are categorized as Level 1 in the hierarchy.
Changes in valuation techniques may result in transfers in or out of an assigned level within the disclosure hierarchy. The aggregate value of investments by input level, as of October 31, 2014, including information on transfers between Levels 1 and 2, is included at the end of the Fund's Schedule of Investments.
Foreign Currency. The Fund may use foreign currency contracts to facilitate transactions in foreign-denominated securities. Gains and losses from these transactions may arise from changes in the value of the foreign currency or if the counterparties do not perform under the contracts' terms.
Foreign-denominated assets, including investment securities, and liabilities are translated into U.S. dollars at the exchange rates at period end. Purchases and sales of investment securities, income and dividends received and expenses denominated in foreign currencies are translated into U.S. dollars at the exchange rate in effect on the transaction date.
The effects of exchange rate fluctuations on investments are included with the net realized and unrealized gain (loss) on investment securities. Other foreign currency transactions resulting in realized and unrealized gain (loss) are disclosed separately.
Investment Transactions and Income. For financial reporting purposes, the Fund's investment holdings and NAV include trades executed through the end of the last business day of the period. The NAV per share for processing shareholder transactions is calculated as of the close of business of the New York Stock Exchange (NYSE), normally 4:00 p.m. Eastern time and includes trades executed through the end of the prior business day. Gains and losses on securities sold are determined on the basis of identified cost and may include proceeds received from litigation. Dividend income is recorded on the ex-dividend date, except for certain dividends from foreign securities where the ex-dividend date may have passed, which are recorded as soon as the Fund is informed of the ex-dividend date. Non-cash dividends included in dividend income, if any, are recorded at the fair market value of the securities received. Income and capital gain distributions from Fidelity Central Funds, if any, are recorded on the ex-dividend date. Interest income is accrued as earned and includes coupon interest and amortization of
Annual Report
3. Significant Accounting Policies - continued
Investment Transactions and Income - continued
premium and accretion of discount on debt securities as applicable. Investment income is recorded net of foreign taxes withheld where recovery of such taxes is uncertain.
Class Allocations and Expenses. Investment income, realized and unrealized capital gains and losses, common expenses of the Fund, and certain fund-level expense reductions, if any, are allocated daily on a pro-rata basis to each class based on the relative net assets of each class to the total net assets of the Fund. Each class differs with respect to transfer agent and distribution and service plan fees incurred. Certain expense reductions may also differ by class. For the reporting period, the allocated portion of income and expenses to each class as a percent of its average net assets may vary due to the timing of recording these transactions in relation to fluctuating net assets of the classes. Expenses directly attributable to a fund are charged to that fund. Expenses attributable to more than one fund are allocated among the respective funds on the basis of relative net assets or other appropriate methods. Expense estimates are accrued in the period to which they relate and adjustments are made when actual amounts are known.
Income Tax Information and Distributions to Shareholders. Each year, the Fund intends to qualify as a regulated investment company under Subchapter M of the Internal Revenue Code, including distributing substantially all of its taxable income and realized gains. As a result, no provision for U.S. Federal income taxes is required. As of October 31, 2014, the Fund did not have any unrecognized tax benefits in the financial statements; nor is the Fund aware of any tax positions for which it is reasonably possible that the total amounts of unrecognized tax benefits will significantly change in the next twelve months. The Fund files a U.S. federal tax return, in addition to state and local tax returns as required. The Fund's federal income tax returns are subject to examination by the Internal Revenue Service (IRS) for a period of three fiscal years after they are filed. State and local tax returns may be subject to examination for an additional fiscal year depending on the jurisdiction. Foreign taxes are provided for based on the Fund's understanding of the tax rules and rates that exist in the foreign markets in which it invests. The Fund is subject to a tax imposed on capital gains by certain countries in which it invests. An estimated deferred tax liability for net unrealized appreciation on the applicable securities is included in Other payables and accrued expenses on the Statement of Assets & Liabilities.
Distributions are declared and recorded on the ex-dividend date. Income dividends and capital gain distributions are declared separately for each class. Income and capital gain distributions are determined in accordance with income tax regulations, which may differ from GAAP.
Annual Report
Notes to Financial Statements - continued
3. Significant Accounting Policies - continued
Income Tax Information and Distributions to Shareholders - continued
Capital accounts within the financial statements are adjusted for permanent book-tax differences. These adjustments have no impact on net assets or the results of operations. Capital accounts are not adjusted for temporary book-tax differences which will reverse in a subsequent period.
Book-tax differences are primarily due to foreign currency transactions, certain foreign taxes, passive foreign investment companies (PFIC), capital loss carryforwards and losses deferred due to wash sales.
The federal tax cost of investment securities and unrealized appreciation (depreciation) as of period end were as follows:
Gross unrealized appreciation | $ 66,685,836 |
Gross unrealized depreciation | (15,307,195) |
Net unrealized appreciation (depreciation) on securities | $ 51,378,641 |
| |
Tax Cost | $ 425,595,458 |
The tax-based components of distributable earnings as of period end were as follows:
Undistributed ordinary income | $ 1,512,034 |
Capital loss carryforward | $ (47,911,843) |
Net unrealized appreciation (depreciation) on securities and other investments | $ 51,375,725 |
Capital loss carryforwards are only available to offset future capital gains of the Fund to the extent provided by regulations and may be limited. Under the Regulated Investment Company Modernization Act of 2010 (the Act), the Fund is permitted to carry forward capital losses incurred in taxable years beginning after December 22, 2010 for an unlimited period and such capital losses are required to be used prior to any losses that expire. The capital loss carryforward information presented below, including any applicable limitation, is estimated as of fiscal period end and is subject to adjustment.
Fiscal year of expiration | |
2017 | (47,911,843) |
The tax character of distributions paid was as follows:
| October 31, 2014 | October 31, 2014 |
Ordinary Income | $ 1,299,187 | $ 3,939,467 |
Annual Report
3. Significant Accounting Policies - continued
Short-Term Trading (Redemption) Fees. Shares held by investors in the Fund less than 90 days may have been subject to a redemption fee equal to 1.50% of the NAV of shares redeemed. All redemption fees, which reduce the proceeds of the shareholder redemption, are retained by the Fund and accounted for as an addition to paid in capital.
Restricted Securities. The Fund may invest in securities that are subject to legal or contractual restrictions on resale. These securities generally may be resold in transactions exempt from registration or to the public if the securities are registered. Disposal of these securities may involve time-consuming negotiations and expense, and prompt sale at an acceptable price may be difficult. Information regarding restricted securities is included at the end of the Fund's Schedule of Investments.
New Accounting Pronouncement. In June 2014, the Financial Accounting Standards Board issued Accounting Standard Update No. 2014-11, Repurchase-to-Maturity Transactions, Repurchase Financings, and Disclosures. The Update amends the accounting for certain repurchase agreements and expands disclosure requirements for reverse repurchase agreements, securities lending and other similar transactions. The disclosure requirements are effective for annual and interim reporting periods beginning after December 15, 2014. Management is currently evaluating the impact of the Update on the Fund's financial statements and related disclosures.
4. Purchases and Sales of Investments.
Purchases and sales of securities, other than short-term securities, aggregated $437,142,621 and $415,557,893, respectively.
5. Fees and Other Transactions with Affiliates.
Management Fee. Fidelity Management & Research Company (the investment adviser) and its affiliates provide the Fund with investment management related services for which the Fund pays a monthly management fee. The management fee is the sum of an individual fund fee rate that is based on an annual rate of .55% of the Fund's average net assets and an annualized group fee rate that averaged .25% during the period. The group fee rate is based upon the average net assets of all the mutual funds advised by the investment adviser, including any mutual funds previously advised by the investment adviser that are currently advised by Fidelity SelectCo, LLC, an affiliate of the investment adviser. The group fee rate decreases as assets under management increase and increases as assets under management decrease. For the reporting period, the total annual management fee rate was .80% of the Fund's average net assets.
Distribution and Service Plan Fees. In accordance with Rule 12b-1 of the 1940 Act, the Fund has adopted separate Distribution and Service Plans for each class of shares,
Annual Report
Notes to Financial Statements - continued
5. Fees and Other Transactions with Affiliates - continued
Distribution and Service Plan Fees - continued
except for the and Institutional Class. Certain classes pay Fidelity Distributors Corporation (FDC), an affiliate of the investment adviser, separate Distribution and Service Fees, each of which is based on an annual percentage of each class' average net assets. In addition, FDC may pay financial intermediaries for selling shares of the Fund and providing shareholder support services. For the period, the Distribution and Service Fee rates, total fees and amounts retained by FDC were as follows:
| Distribution
Fee | Service
Fee | Total Fees | Retained
by FDC |
Class A | -% | .25% | $ 350,341 | $ 5,200 |
Class T | .25% | .25% | 265,578 | 626 |
Class B | .75% | .25% | 92,016 | 69,179 |
Class C | .75% | .25% | 607,992 | 61,955 |
| | | $ 1,315,927 | $ 136,960 |
Sales Load. FDC may receive a front-end sales charge of up to 5.75% for selling Class A shares and 3.50% for selling Class T shares, some of which is paid to financial intermediaries for selling shares of the Fund. Depending on the holding period, FDC may receive contingent deferred sales charges levied on Class A, Class T, Class B, and Class C redemptions. The deferred sales charges range from 5.00% to 1.00% for Class B shares, 1.00% for Class C shares, 1.00% for certain purchases of Class A shares and .25% for certain purchases of Class T shares.
For the period, sales charge amounts retained by FDC were as follows:
| Retained
by FDC |
Class A | $ 64,103 |
Class T | 10,819 |
Class B* | 9,745 |
Class C* | 5,005 |
| $ 89,672 |
* When Class B and Class C shares are initially sold, FDC pays commissions from its own resources to financial intermediaries through which the sales are made.
Transfer Agent Fees. Fidelity Investments Institutional Operations Company, Inc., (FIIOC), an affiliate of the investment adviser, is the transfer, dividend disbursing and shareholder servicing agent for each class of the Fund. FIIOC receives account fees and asset-based fees that vary according to the account size and type of account of the shareholders of the respective classes of the Fund, except for Class Z. FIIOC receives an asset-based fee of Class Z's average net assets. FIIOC pays for typesetting, printing and mailing of shareholder reports, except proxy statements.
Annual Report
5. Fees and Other Transactions with Affiliates - continued
Transfer Agent Fees - continued
For the period, transfer agent fees for each class were as follows:
| Amount | % of
Class-Level Average
Net Assets |
Class A | $ 425,849 | .30 |
Class T | 164,544 | .31 |
Class B | 27,883 | .30 |
Class C | 184,802 | .30 |
Institutional Class | 348,372 | .21 |
Class Z | 1,083 | .05 |
| $ 1,152,533 | |
Accounting and Security Lending Fees. Fidelity Service Company, Inc. (FSC), an affiliate of the investment adviser, maintains the Fund's accounting records. The accounting fee is based on the level of average net assets for each month. Under a separate contract, FSC administers the security lending program. The security lending fee is based on the number and duration of lending transactions.
Brokerage Commissions. The Fund placed a portion of its portfolio transactions with brokerage firms which are affiliates of the investment adviser. Brokerage commissions are included in net realized gain (loss) and change in net unrealized appreciation (depreciation) in the Statement of Operations. The commissions paid to these affiliated firms were $1,690 for the period.
6. Committed Line of Credit.
The Fund participates with other funds managed by the investment adviser or an affiliate in a $4.25 billion credit facility (the "line of credit") to be utilized for temporary or emergency purposes to fund shareholder redemptions or for other short-term liquidity purposes. The Fund has agreed to pay commitment fees on its pro-rata portion of the line of credit, which amounted to $690 and is reflected in Miscellaneous expenses on the Statement of Operations. During the period, the Fund did not borrow on this line of credit.
7. Security Lending.
The Fund lends portfolio securities through a lending agent from time to time in order to earn additional income. For equity securities, a lending agent is used and may loan securities to certain qualified borrowers, including Fidelity Capital Markets (FCM), a
Annual Report
Notes to Financial Statements - continued
7. Security Lending - continued
broker-dealer affiliated with the Fund. On the settlement date of the loan, the Fund receives collateral (in the form of U.S. Treasury obligations, letters of credit and/or cash) against the loaned securities and maintains collateral in an amount not less than 100% of the market value of the loaned securities during the period of the loan. The market value of the loaned securities is determined at the close of business of the Fund and any additional required collateral is delivered to the Fund on the next business day. If the borrower defaults on its obligation to return the securities loaned because of insolvency or other reasons, the Fund may apply collateral received from the borrower against the obligation. The Fund may experience delays and costs in recovering the securities loaned. Any cash collateral received is invested in the Fidelity Securities Lending Cash Central Fund. The value of loaned securities and cash collateral at period end are disclosed on the Fund's Statement of Assets and Liabilities. Security lending income represents the income earned on investing cash collateral, less rebates paid to borrowers and any lending agent fees associated with the loan, plus any premium payments received for lending certain types of securities. Security lending income is presented in the Statement of Operations as a component of income from Fidelity Central Funds. Total security lending income during the period amounted to $60,169. During the period, there were no securities loaned to FCM.
8. Distributions to Shareholders.
Distributions to shareholders of each class were as follows:
Years ended October 31, | 2014 | 2013 |
From net investment income | | |
Class A | $ 314,541 | $ 1,535,570 |
Class T | 2,453 | 390,398 |
Class B | - | 16,014 |
Class C | - | 114,064 |
Institutional Class | 791,098 | 1,883,421 |
Class Z | 5,139 | - |
Total | $ 1,113,231 | $ 3,939,467 |
From net realized gain | | |
Class A | $ 77,030 | $ - |
Class T | 29,431 | - |
Institutional Class | 79,110 | - |
Class Z | 385 | - |
Total | $ 185,956 | $ - |
Annual Report
9. Share Transactions.
Share transactions for each class were as follows and may contain automatic conversions between classes or exchanges between funds:
| Shares | Dollars |
Years ended October 31, | 2014 | 2013A | 2014 | 2013A |
Class A | | | | |
Shares sold | 1,306,708 | 1,531,175 | $ 29,667,252 | $ 33,017,349 |
Reinvestment of distributions | 16,164 | 66,573 | 356,894 | 1,392,653 |
Shares redeemed | (1,739,459) | (2,949,139) | (38,968,004) | (63,054,707) |
Net increase (decrease) | (416,587) | (1,351,391) | $ (8,943,858) | $ (28,644,705) |
Class T | | | | |
Shares sold | 414,394 | 561,309 | $ 9,392,831 | $ 12,048,127 |
Reinvestment of distributions | 1,397 | 17,796 | 30,813 | 372,006 |
Shares redeemed | (558,505) | (986,849) | (12,438,338) | (20,912,996) |
Net increase (decrease) | (142,714) | (407,744) | $ (3,014,694) | $ (8,492,863) |
Class B | | | | |
Shares sold | 16,905 | 34,695 | $ 374,479 | $ 732,488 |
Reinvestment of distributions | - | 627 | - | 12,965 |
Shares redeemed | (200,427) | (318,597) | (4,400,967) | (6,698,614) |
Net increase (decrease) | (183,522) | (283,275) | $ (4,026,488) | $ (5,953,161) |
Class C | | | | |
Shares sold | 651,900 | 507,210 | $ 14,559,904 | $ 10,683,514 |
Reinvestment of distributions | - | 4,797 | - | 98,768 |
Shares redeemed | (666,053) | (957,148) | (14,339,508) | (19,925,235) |
Net increase (decrease) | (14,153) | (445,141) | $ 220,396 | $ (9,142,953) |
Institutional Class | | | | |
Shares sold | 2,772,401 | 1,298,034 | $ 64,467,777 | $ 27,937,972 |
Reinvestment of distributions | 36,756 | 84,781 | 813,035 | 1,776,730 |
Shares redeemed | (963,648) | (1,828,795) | (22,091,792) | (39,366,823) |
Net increase (decrease) | 1,845,509 | (445,980) | $ 43,189,020 | $ (9,652,121) |
Class Z | | | | |
Shares sold | 251,250 | 4,688 | $ 5,945,448 | $ 100,000 |
Reinvestment of distributions | 250 | - | 5,524 | - |
Shares redeemed | (20,301) | - | (467,981) | - |
Net increase (decrease) | 231,199 | 4,688 | $ 5,482,991 | $ 100,000 |
A Share transactions for Class Z are for the period August 31, 2013 (commencement of sale of shares) to October 31, 2013.
Annual Report
Notes to Financial Statements - continued
10. Other.
The Fund's organizational documents provide former and current trustees and officers with a limited indemnification against liabilities arising in connection with the performance of their duties to the Fund. In the normal course of business, the Fund may also enter into contracts that provide general indemnifications. The Fund's maximum exposure under these arrangements is unknown as this would be dependent on future claims that may be made against the Fund. The risk of material loss from such claims is considered remote.
Annual Report
To the Trustees of Fidelity Advisor Series VIII and Shareholders of Fidelity Advisor Emerging Markets Fund:
We have audited the accompanying statement of assets and liabilities of Fidelity Advisor Emerging Markets Fund (the Fund), a fund of Fidelity Advisor Series VIII, including the schedule of investments, as of October 31, 2014, and the related statement of operations for the year then ended, the statement of changes in net assets for each of the two years in the period then ended, and the financial highlights for each of the five years in the period then ended. These financial statements and financial highlights are the responsibility of the Fund's management. Our responsibility is to express an opinion on these financial statements and financial highlights based on our audits.
We conducted our audits in accordance with the standards of the Public Company Accounting Oversight Board (United States). Those standards require that we plan and perform the audit to obtain reasonable assurance about whether the financial statements and financial highlights are free of material misstatement. The Fund is not required to have, nor were we engaged to perform, an audit of its internal control over financial reporting. Our audits included consideration of internal control over financial reporting as a basis for designing audit procedures that are appropriate in the circumstances, but not for the purpose of expressing an opinion on the effectiveness of the Fund's internal control over financial reporting. Accordingly, we express no such opinion. An audit also includes examining, on a test basis, evidence supporting the amounts and disclosures in the financial statements, assessing the accounting principles used and significant estimates made by management, as well as evaluating the overall financial statement presentation. Our procedures included confirmation of securities owned as of October 31, 2014, by correspondence with the custodians and brokers; where replies were not received from brokers, we performed other auditing procedures. We believe that our audits provide a reasonable basis for our opinion.
In our opinion, the financial statements and financial highlights referred to above present fairly, in all material respects, the financial position of Fidelity Advisor Emerging Markets Fund as of October 31, 2014, the results of its operations for the year then ended, the changes in its net assets for each of the two years in the period then ended, and the financial highlights for each of the five years in the period then ended, in conformity with accounting principles generally accepted in the United States of America.
DELOITTE & TOUCHE LLP
Boston, Massachusetts
December 16, 2014
Annual Report
The Trustees, Member of the Advisory Board, and officers of the trust and fund, as applicable, are listed below. The Board of Trustees governs the fund and is responsible for protecting the interests of shareholders. The Trustees are experienced executives who meet periodically throughout the year to oversee the fund's activities, review contractual arrangements with companies that provide services to the fund, oversee management of the risks associated with such activities and contractual arrangements, and review the fund's performance. Except for James C. Curvey, each of the Trustees oversees 174 funds. Mr. Curvey oversees 407 funds.
The Trustees hold office without limit in time except that (a) any Trustee may resign; (b) any Trustee may be removed by written instrument, signed by at least two-thirds of the number of Trustees prior to such removal; (c) any Trustee who requests to be retired or who has become incapacitated by illness or injury may be retired by written instrument signed by a majority of the other Trustees; and (d) any Trustee may be removed at any special meeting of shareholders by a two-thirds vote of the outstanding voting securities of the trust. Each Trustee who is not an interested person (as defined in the 1940 Act) of the trust and the fund (Independent Trustee), shall retire not later than the last day of the calendar year in which his or her 75th birthday occurs. The Independent Trustees may waive this mandatory retirement age policy with respect to individual Trustees. The officers and Advisory Board Member hold office without limit in time, except that any officer and Advisory Board Member may resign or may be removed by a vote of a majority of the Trustees at any regular meeting or any special meeting of the Trustees. Except as indicated, each individual has held the office shown or other offices in the same company for the past five years.
Experience, Skills, Attributes, and Qualifications of the Fund's Trustees. The Governance and Nominating Committee has adopted a statement of policy that describes the experience, qualifications, attributes, and skills that are necessary and desirable for potential Independent Trustee candidates (Statement of Policy). The Board believes that each Trustee satisfied at the time he or she was initially elected or appointed a Trustee, and continues to satisfy, the standards contemplated by the Statement of Policy. The Governance and Nominating Committee also engages professional search firms to help identify potential Independent Trustee candidates who have the experience, qualifications, attributes, and skills consistent with the Statement of Policy. From time to time, additional criteria based on the composition and skills of the current Independent Trustees, as well as experience or skills that may be appropriate in light of future changes to board composition, business conditions, and regulatory or other developments, have also been considered by the professional search firms and the Governance and Nominating Committee. In addition, the Board takes into account the Trustees' commitment and participation in Board and committee meetings, as well as their leadership of standing and ad hoc committees throughout their tenure.
In determining that a particular Trustee was and continues to be qualified to serve as a Trustee, the Board has considered a variety of criteria, none of which, in isolation, was controlling. The Board believes that, collectively, the Trustees have balanced and diverse experience, qualifications, attributes, and skills, which allow the Board to operate effectively in governing the fund and protecting the interests of shareholders. Information about the specific experience, skills, attributes, and qualifications of each Trustee, which in each case led to the Board's conclusion that the Trustee should serve (or continue to serve) as a trustee of the fund, is provided below.
Annual Report
Trustees and Officers - continued
Board Structure and Oversight Function. James C. Curvey is an interested person (as defined in the 1940 Act) and currently serves as Chairman. The Trustees have determined that an interested Chairman is appropriate and benefits shareholders because an interested Chairman has a personal and professional stake in the quality and continuity of services provided to the fund. Independent Trustees exercise their informed business judgment to appoint an individual of their choosing to serve as Chairman, regardless of whether the Trustee happens to be independent or a member of management. The Independent Trustees have determined that they can act independently and effectively without having an Independent Trustee serve as Chairman and that a key structural component for assuring that they are in a position to do so is for the Independent Trustees to constitute a substantial majority for the Board. The Independent Trustees also regularly meet in executive session. Ned C. Lautenbach serves as Chairman of the Independent Trustees and as such (i) acts as a liaison between the Independent Trustees and management with respect to matters important to the Independent Trustees and (ii) with management prepares agendas for Board meetings.
Fidelity funds are overseen by different Boards of Trustees. The fund's Board oversees Fidelity's equity and high income funds and another Board oversees Fidelity's investment-grade bond, money market, and asset allocation funds. The asset allocation funds may invest in Fidelity funds overseen by the fund's Board. The use of separate Boards, each with its own committee structure, allows the Trustees of each group of Fidelity funds to focus on the unique issues of the funds they oversee, including common research, investment, and operational issues. On occasion, the separate Boards establish joint committees to address issues of overlapping consequences for the Fidelity funds overseen by each Board.
The Trustees operate using a system of committees to facilitate the timely and efficient consideration of all matters of importance to the Trustees, the fund, and fund shareholders and to facilitate compliance with legal and regulatory requirements and oversight of the fund's activities and associated risks. The Board, acting through its committees, has charged FMR and its affiliates with (i) identifying events or circumstances the occurrence of which could have demonstrably adverse effects on the fund's business and/or reputation; (ii) implementing processes and controls to lessen the possibility that such events or circumstances occur or to mitigate the effects of such events or circumstances if they do occur; and (iii) creating and maintaining a system designed to evaluate continuously business and market conditions in order to facilitate the identification and implementation processes described in (i) and (ii) above. Because the day-to-day operations and activities of the fund are carried out by or through FMR, its affiliates and other service providers, the fund's exposure to risks is mitigated but not eliminated by the processes overseen by the Trustees. While each of the Board's committees has responsibility for overseeing different aspects of the fund's activities, oversight is exercised primarily through the Operations, Audit, and Compliance Committees. In addition, the Independent Trustees have worked with FMR to enhance the Board's oversight of investment and financial risks, legal and regulatory risks, technology risks, and operational risks, including the development of additional risk reporting to the Board. For example, a working group comprised of Independent Trustees and FMR has worked and continues to work to review the Fidelity funds' valuation-related activities, reporting and risk management. Appropriate personnel, including but not limited to the fund's Chief Compliance Officer (CCO), FMR's internal auditor, the independent accountants, the fund's Treasurer and portfolio management personnel, make periodic reports to the Board's committees, as appropriate, including an annual review of FMR's risk management program for the Fidelity funds. The responsibilities of each standing committee, including their oversight responsibilities, are described further under "Standing Committees of the Fund's Trustees."
Annual Report
The fund's Statement of Additional Information (SAI) includes more information about the Trustees. To request a free copy, call Fidelity at 1-877-208-0098.
Interested Trustees*:
Correspondence intended for each Trustee who is an interested person may be sent to Fidelity Investments, 245 Summer Street, Boston, Massachusetts 02210.
Name, Year of Birth; Principal Occupations and Other Relevant Experience+ |
James C. Curvey (1935) |
Year of Election or Appointment: 2007 Trustee Chairman of the Board of Trustees |
| Mr. Curvey also serves as Trustee of other Fidelity funds. Mr. Curvey is a Director of Fidelity Research & Analysis Co. (2009-present), and Vice Chairman (2007-present) and Director of FMR LLC. In addition, Mr. Curvey serves as an Overseer for the Boston Symphony Orchestra and a member of the board of Artis-Naples, Naples, Florida, and as a Trustee for Brewster Academy, Wolfeboro, New Hampshire. Previously, Mr. Curvey served as a Director of Fidelity Investments Money Management, Inc. (2009-2014), a Director of FMR (2007-2014), and a Director of FMR Co., Inc. (2007-2014). |
Charles S. Morrison (1960) |
Year of Election or Appointment: 2014 Trustee |
| Mr. Morrison also serves as Trustee of other funds. He serves as a Director of Fidelity Investments Money Management, Inc. (FIMM) (2014-present), Director of Fidelity SelectCo, LLC (2014-present), President, Asset Management (2014-present), and is an employee of Fidelity Investments. Previously, Mr. Morrison served as Vice President of Fidelity's Fixed Income and Asset Allocation Funds (2012-2014), President, Fixed Income (2011-2014), Vice President of Fidelity's Money Market Funds (2005-2009), President, Money Market Group Leader of FMR (2009), and Senior Vice President, Money Market Group of FMR (2004-2009). Mr. Morrison also served as Vice President of Fidelity's Bond Funds (2002-2005), certain Balanced Funds (2002-2005), and certain Asset Allocation Funds (2002-2007), and as Senior Vice President (2002-2005) of Fidelity's Bond Division. |
* Trustees have been determined to be "Interested Trustees" by virtue of, among other things, their affiliation with the trust or various entities under common control with FMR.
+ The information above includes each Trustee's principal occupation during the last five years and other information relating to the experience, attributes, and skills relevant to each Trustee's qualifications to serve as a Trustee, which led to the conclusion that each Trustee should serve as a Trustee for the fund.
Annual Report
Independent Trustees:
Correspondence intended for each Independent Trustee (that is, the Trustees other than the Interested Trustees) may be sent to Fidelity Investments, P.O. Box 55235, Boston, Massachusetts 02205-5235.
Name, Year of Birth; Principal Occupations and Other Relevant Experience+ |
Dennis J. Dirks (1948) |
Year of Election or Appointment: 2005 Trustee |
| Mr. Dirks also serves as Trustee of other Fidelity funds. Prior to his retirement in May 2003, Mr. Dirks was Chief Operating Officer and a member of the Board of The Depository Trust & Clearing Corporation (DTCC). He also served as President, Chief Operating Officer, and Board member of The Depository Trust Company (DTC) and President and Board member of the National Securities Clearing Corporation (NSCC). In addition, Mr. Dirks served as Chief Executive Officer and Board member of the Government Securities Clearing Corporation, Chief Executive Officer and Board member of the Mortgage-Backed Securities Clearing Corporation, as a Trustee and a member of the Finance Committee of Manhattan College (2005-2008), and as a Trustee and a member of the Finance Committee of AHRC of Nassau County (2006-2008). Mr. Dirks is a member of the Independent Directors Council (IDC) Governing Council (2010-present) and Board of Directors for The Brookville Center for Children's Services, Inc. (2009-present). |
Alan J. Lacy (1953) |
Year of Election or Appointment: 2008 Trustee |
| Mr. Lacy also serves as Trustee of other Fidelity funds. Mr. Lacy serves as Senior Adviser (2007-present) of Oak Hill Capital Partners, L.P. (private equity). Mr. Lacy also served as Chief Executive Officer (2000-2005) and Vice Chairman (2005-2006) of Sears Holdings Corporation and Sears, Roebuck and Co. (retail). In addition, Mr. Lacy serves as a member of the Board of Directors of Dave & Buster's Entertainment, Inc. (restaurant and entertainment complexes, 2010-present), Earth Fare, Inc. (retail grocery, 2012-present), The Hillman Companies, Inc. (hardware wholesalers, 2010-present), and Bristol-Myers Squibb Company (global pharmaceuticals, 2008-present). Mr. Lacy is a member of the Board of Trustees of The National Parks Conservation Association (2006-present). Previously, Mr. Lacy served as Chairman of the Board of Trustees of the National Parks Conservation Association (2008-2011) and as a member of the Board of Directors for the Western Union Company (global money transfer, 2006-2011). |
Ned C. Lautenbach (1944) |
Year of Election or Appointment: 2000 Trustee Chairman of the Independent Trustees |
| Mr. Lautenbach also serves as Trustee of other Fidelity funds. Mr. Lautenbach currently serves as the Lead Director of the Eaton Corporation Board of Directors (diversified industrial, 1997-present). Mr. Lautenbach is Chairman of the Board of Directors of the Philharmonic Center for the Arts in Naples, Florida (2012-present) and a member of the Council on Foreign Relations (1994-present). Previously, Mr. Lautenbach was a Partner/Advisory Partner at Clayton, Dubilier & Rice, LLC (private equity investment, 1998-2010), as well as a Director of Sony Corporation (2006-2007). |
Joseph Mauriello (1944) |
Year of Election or Appointment: 2008 Trustee |
| Mr. Mauriello also serves as Trustee of other Fidelity funds. Prior to his retirement in January 2006, Mr. Mauriello served in numerous senior management positions including Deputy Chairman and Chief Operating Officer (2004-2005), and Vice Chairman of Financial Services (2002-2004) of KPMG LLP US (professional services, 1965-2005). Mr. Mauriello currently serves as a member of the Board of Directors of XL Group plc. (global insurance and re-insurance, 2006-present). Previously, Mr. Mauriello served as a Director of the Hamilton Funds of the Bank of New York (2006-2007) and of Arcadia Resources Inc. (health care services and products, 2007-2012). |
Robert W. Selander (1950) |
Year of Election or Appointment: 2011 Trustee |
| Mr. Selander also serves as Trustee of other Fidelity funds. Previously, Mr. Selander served as a Member of the Advisory Board of other Fidelity funds (2011), and Executive Vice Chairman (2010), Chief Executive Officer (2009-2010), and President and Chief Executive Officer (1997-2009) of Mastercard, Inc. |
Cornelia M. Small (1944) |
Year of Election or Appointment: 2005 Trustee |
| Ms. Small also serves as Trustee of other Fidelity funds. Ms. Small is a member of the Board of Directors (2009-present) and Chair of the Investment Committee (2010-present) of the Teagle Foundation. Ms. Small also serves on the Investment Committee of the Berkshire Taconic Community Foundation (2008-present). Previously, Ms. Small served as Chairperson (2002-2008) and a member of the Investment Committee and Chairperson (2008-2012) and a member of the Board of Trustees of Smith College. In addition, Ms. Small served as Chief Investment Officer, Director of Global Equity Investments, and a member of the Board of Directors of Scudder, Stevens & Clark and Scudder Kemper Investments. |
William S. Stavropoulos (1939) |
Year of Election or Appointment: 2001 Trustee Vice Chairman of the Independent Trustees |
| Mr. Stavropoulos also serves as Trustee of other Fidelity funds. Mr. Stavropoulos serves as President and Founder of the Michigan Baseball Foundation, the Great Lakes Loons (2007-present). Mr. Stavropoulos is Chairman Emeritus of the Board of Directors of The Dow Chemical Company, where he previously served in numerous senior management positions, including President, CEO (1995-2000; 2002-2004), Chairman of the Executive Committee (2000-2006), and as a member of the Board of Directors (1990-2006). Currently, Mr. Stavropoulos is Chairman of the Board of Directors of Univar Inc. (global distributor of commodity and specialty chemicals), a Director of Teradata Corporation (data warehousing and technology solutions), and Maersk Inc. (industrial conglomerate), and a member of the Advisory Board for Metalmark Capital LLC (private equity investment, 2005-present). Mr. Stavropoulos is an operating advisor to Clayton, Dubilier & Rice, LLC (private equity investment). In addition, Mr. Stavropoulos is a member of the University of Notre Dame Advisory Council for the College of Science, a Trustee of the Rollin L. Gerstacker Foundation, and a Director of the Naples Philharmonic Center for the Arts. Previously, Mr. Stavropoulos served as a Director of Chemical Financial Corporation (bank holding company, 1993-2012) and Tyco International, Ltd. (multinational manufacturing and services, 2007-2012). |
David M. Thomas (1949) |
Year of Election or Appointment: 2008 Trustee |
| Mr. Thomas also serves as Trustee of other Fidelity funds. Mr. Thomas serves as Non-Executive Chairman of the Board of Directors of Fortune Brands Home and Security (home and security products, 2011-present), and as a member of the Board of Directors of Interpublic Group of Companies, Inc. (marketing communication, 2004-present). Previously, Mr. Thomas served as Executive Chairman (2005-2006) and Chairman and Chief Executive Officer (2000-2005) of IMS Health, Inc. (pharmaceutical and healthcare information solutions), and a Director of Fortune Brands, Inc. (consumer products, 2000-2011). |
+ The information above includes each Trustee's principal occupation during the last five years and other information relating to the experience, attributes, and skills relevant to each Trustee's qualifications to serve as a Trustee, which led to the conclusion that each Trustee should serve as a Trustee for the fund.
Advisory Board Member and Officers:
Correspondence intended for each officer and Peter S. Lynch may be sent to Fidelity Investments, 245 Summer Street, Boston, Massachusetts 02210. Officers appear below in alphabetical order.
Name, Year of Birth; Principal Occupation |
Peter S. Lynch (1944) |
Year of Election or Appointment: 2003 Member of the Advisory Board |
| Mr. Lynch also serves as Member of the Advisory Board of other Fidelity funds. Mr. Lynch is Vice Chairman and a Director of FMR and FMR Co., Inc. In addition, Mr. Lynch serves as a Trustee of Boston College and as the Chairman of the Inner-City Scholarship Fund. Previously, Mr. Lynch served on the Special Olympics International Board of Directors (1997-2006). |
Elizabeth Paige Baumann (1968) |
Year of Election or Appointment: 2012 Anti-Money Laundering (AML) Officer |
| Ms. Baumann also serves as AML Officer of other funds. She is Chief AML Officer of FMR LLC (2012-present) and is an employee of Fidelity Investments. Previously, Ms. Baumann served as Vice President and Deputy Anti-Money Laundering Officer (2007-2012). |
William C. Coffey (1969) |
Year of Election or Appointment: 2009 Assistant Secretary |
| Mr. Coffey also serves as Assistant Secretary of other funds. He is Senior Vice President and Deputy General Counsel of FMR LLC (2010-present), and is an employee of Fidelity Investments. Previously, Mr. Coffey served as Vice President and Associate General Counsel of FMR LLC (2005-2009). |
Timothy M. Cohen (1969) |
Year of Election or Appointment: 2014 Vice President of certain Equity Funds |
| Mr. Cohen also serves as Vice President of other funds. Mr. Cohen serves as a Director and Chief Compliance Officer of Fidelity Management & Research (U.K.) Inc. (2013-present) and is an employee of Fidelity Investments. |
Jonathan Davis (1968) |
Year of Election or Appointment: 2010 Assistant Treasurer |
| Mr. Davis also serves as Assistant Treasurer of other funds. Mr. Davis is an employee of Fidelity Investments. Previously, Mr. Davis served as Vice President and Associate General Counsel of FMR LLC (2003-2010). |
Adrien E. Deberghes (1967) |
Year of Election or Appointment: 2008 Deputy Treasurer |
| Mr. Deberghes also serves as an officer of other funds. He is an employee of Fidelity Investments (2008-present). Prior to joining Fidelity Investments, Mr. Deberghes was Senior Vice President of Mutual Fund Administration at State Street Corporation (2007-2008), Senior Director of Mutual Fund Administration at Investors Bank & Trust (2005-2007), and Director of Finance for Dunkin' Brands (2000-2005). |
Stephanie J. Dorsey (1969) |
Year of Election or Appointment: 2010 Assistant Treasurer |
| Ms. Dorsey also serves as an officer of other funds. She is an employee of Fidelity Investments (2008-present) and has served in other fund officer roles. Prior to joining Fidelity Investments, Ms. Dorsey served as Treasurer (2004-2008) of the JPMorgan Mutual Funds and Vice President (2004-2008) of JPMorgan Chase Bank. |
Howard J. Galligan III (1966) |
Year of Election or Appointment: 2014 Chief Financial Officer |
| Mr. Galligan also serves as Chief Financial Officer of other funds. Mr. Galligan serves as President of Fidelity Pricing and Cash Management Services (FPCMS) (2014-present) and as a Director of Strategic Advisers, Inc. (2008-present). Previously, Mr. Galligan served as Chief Administrative Officer of Asset Management (2011-2014) and Chief Operating Officer and Senior Vice President of Investment Support for Strategic Advisers, Inc. (2003-2011). |
Scott C. Goebel (1968) |
Year of Election or Appointment: 2008 Secretary and Chief Legal Officer (CLO) |
| Mr. Goebel serves as Secretary and CLO of other funds. Mr. Goebel also serves as Secretary of Fidelity SelectCo, LLC (2013-present), Fidelity Investments Money Management, Inc. (FIMM) (2010-present) and Fidelity Research and Analysis Company (FRAC) (2010-present); General Counsel, Secretary, and Senior Vice President of FMR (2008-present) and FMR Co., Inc. (2008-present); Chief Legal Officer of Fidelity Management & Research (Hong Kong) Limited (2008-present); and Assistant Secretary of Fidelity Management & Research (Japan) Limited (2008-present) and Fidelity Management & Research (U.K.) Inc. (2008-present). Previously, Mr. Goebel served as Secretary and CLO of other Fidelity funds (2008-2013), Assistant Secretary of FIMM (2008-2010), FRAC (2008-2010), and certain funds (2007-2008); and as Vice President and Secretary of Fidelity Distributors Corporation (FDC) (2005-2007). Mr. Goebel has been employed by FMR LLC or an affiliate since 2001. |
Brian B. Hogan (1964) |
Year of Election or Appointment: 2009 Vice President |
| Mr. Hogan also serves as Trustee or Vice President of other funds. Mr. Hogan serves as a Director of Fidelity SelectCo, LLC (2014-present) and President of FMR's Equity Division (2009-present). Previously, Mr. Hogan served as Senior Vice President, Equity Research of FMR (2006-2009) and as a portfolio manager. |
Chris Maher (1972) |
Year of Election or Appointment: 2013 Assistant Treasurer |
| Mr. Maher serves as Assistant Treasurer of other funds. Mr. Maher is Vice President of Valuation Oversight and is an employee of Fidelity Investments. Previously, Mr. Maher served as Vice President of Asset Management Compliance (2013), Vice President of FMR's Program Management Group (2010-2013), and Vice President of Valuation Oversight (2008-2010). |
Kenneth B. Robins (1969) |
Year of Election or Appointment: 2008 President and Treasurer |
| Mr. Robins also serves as an officer of other funds. Mr. Robins serves as Executive Vice President of Fidelity Investments Money Management, Inc. (FIMM) (2013-present) and is an employee of Fidelity Investments (2004-present). Previously, Mr. Robins served in other fund officer roles. |
Stephen Sadoski (1971) |
Year of Election or Appointment: 2012 Deputy Treasurer |
| Mr. Sadoski also serves as Deputy Treasurer of other funds. He is an employee of Fidelity Investments (2012-present) and has served in another fund officer role. Prior to joining Fidelity Investments, Mr. Sadoski served as an assistant chief accountant in the Division of Investment Management of the Securities and Exchange Commission (SEC) (2009-2012) and as a senior manager at Deloitte & Touche LLP (1997-2009). |
Stacie M. Smith (1974) |
Year of Election or Appointment: 2013 Deputy Treasurer |
| Ms. Smith also serves as an officer of other funds. She is an employee of Fidelity Investments (2009-present) and has served in other fund officer roles. Prior to joining Fidelity Investments, Ms. Smith served as Senior Audit Manager of Ernst & Young LLP (1996-2009). |
Renee Stagnone (1975) |
Year of Election or Appointment: 2013 Deputy Treasurer |
| Ms. Stagnone also serves as Deputy Treasurer of other funds. Ms. Stagnone is an employee of Fidelity Investments. |
Linda J. Wondrack (1964) |
Year of Election or Appointment: 2014 Chief Compliance Officer |
| Ms. Wondrack also serves as Chief Compliance Officer of other funds. Ms. Wondrack is Executive Vice President and head of the Ethics Office and Asset Management Compliance for Fidelity Investments (2012-present). Ms. Wondrack also serves as Chief Compliance Officer of Fidelity SelectCo, LLC (2014-present); Chief Compliance Officer of Impresa Management LLC (2013-present); and Chief Compliance Officer of FMR Co., Inc., Fidelity Investments Money Management, Inc., Fidelity Management & Research (Japan) Limited, Fidelity Management & Research (U.K.) Inc., Fidelity Management & Research (Hong Kong), Fidelity Management & Research Company, Pyramis Global Advisors, LLC, and Strategic Advisers, Inc., Ballyrock Investment Advisors LLC, and Northern Neck Investors LLC (2012-present). Previously, Ms. Wondrack served as Senior Vice President and Chief Compliance Officer for Columbia Management Investment Advisers, LLC (2005-2012); Chief Compliance Officer for certain funds within the Columbia Family of Funds (2007-2012); and Senior Vice President of Compliance Risk Management at Bank of America (2005-2010). |
Joseph F. Zambello (1957) |
Year of Election or Appointment: 2011 Deputy Treasurer |
| Mr. Zambello also serves as Deputy Treasurer of other funds. Mr. Zambello is an employee of Fidelity Investments. Previously, Mr. Zambello served as Vice President of FMR's Program Management Group (2009-2011) and Vice President of the Transfer Agent Oversight Group (2005-2009). |
Annual Report
The Board of Trustees of Advisor Emerging Markets Fund voted to pay to shareholders of record at the opening of business on record date, the following distributions per share derived from capital gains realized from sales of portfolio securities, and dividends derived from net investment income:
| Pay Date | Record Date | Dividends | Capital Gains |
Class Z | 12/08/14 | 12/05/14 | $0.143 | $0.033 |
Class Z designates 100% of the dividend during the fiscal year as amounts which may be taken into account as a dividend for the purposes of the maximum rate under section 1(h)(11) of the Internal Revenue Code.
Class Z designates 9% of the dividends distributed during the fiscal year as qualifying for the dividends-received deduction for corporate shareholders.
The amounts per share which represent income derived from sources within, and taxes paid to, foreign countries or possessions of the United States are as follows:
| Pay Date | Income | Taxes |
Class Z | 12/09/2013 | $0.2133 | $0.0413 |
The fund will notify shareholders in January 2015 of amounts for use in preparing 2014 income tax returns.
Annual Report
Board Approval of Investment Advisory Contracts and Management Fees
Fidelity Advisor Emerging Markets Fund
Each year, the Board of Trustees, including the Independent Trustees (together, the Board), votes on the renewal of the management contract with Fidelity Management & Research Company (FMR) and the sub-advisory agreements (together, the Advisory Contracts) for the fund. The Board, assisted by the advice of fund counsel and Independent Trustees' counsel, requests and considers a broad range of information relevant to the renewal of the Advisory Contracts throughout the year.
The Board meets regularly and, at each of its meetings, covers an extensive agenda of topics and materials and considers factors that are relevant to its annual consideration of the renewal of the fund's Advisory Contracts, including the services and support provided to the fund and its shareholders. The Board has established various standing committees (Committees), each composed of and chaired by Independent Trustees with varying backgrounds, to which the Board has assigned specific subject matter responsibilities in order to enhance effective decision-making by the Board. The Board, acting directly and through its Committees, requests and receives information concerning the annual consideration of the renewal of the fund's Advisory Contracts. The Board also meets as needed to consider matters specifically related to the Board's annual consideration of the renewal of the Advisory Contracts. Members of the Board may also meet with trustees of other Fidelity funds through ad hoc joint committees to discuss certain matters relevant to the Fidelity funds.
At its July 2014 meeting, the Board, including the Independent Trustees, unanimously determined to renew the fund's Advisory Contracts. In reaching its determination, the Board considered all factors it believed relevant, including (i) the nature, extent, and quality of the services to be provided to the fund and its shareholders (including the investment performance of the fund); (ii) the competitiveness of the fund's management fee and total expense ratio relative to peer funds; (iii) the total costs of the services to be provided by and the profits to be realized by Fidelity from its relationship with the fund; (iv) the extent to which economies of scale exist and would be realized as the fund grows; and (v) whether fee levels reflect these economies of scale, if any, for the benefit of fund shareholders. In connection with separate internal corporate reorganizations involving Fidelity Management & Research (U.K.) Inc. (FMR U.K.) and Fidelity Management & Research (Japan) Inc. (FMR Japan), the Board approved certain non-material amendments to the fund's sub-advisory agreements with FMR U.K. and FMR Japan to reflect that, after these reorganizations, FMR Investment Management (UK) Limited and Fidelity Management & Research (Japan) Limited will carry on the business of FMR U.K. and FMR Japan, respectively. The Board noted that no changes to the portfolio managers or to the foreign research or investment advisory services provided to the fund were expected in connection with either reorganization and that the same personnel and resources would continue to be available to the fund at the new entities.
Annual Report
In considering whether to renew the Advisory Contracts for the fund, the Board reached a determination, with the assistance of fund counsel and Independent Trustees' counsel and through the exercise of its business judgment, that the renewal of the Advisory Contracts was in the best interests of the fund and its shareholders and that the compensation payable under the Advisory Contracts was fair and reasonable. The Board's decision to renew the Advisory Contracts was not based on any single factor, but rather was based on a comprehensive consideration of all the information provided to the Board at its meetings throughout the year. The Board, in reaching its determination to renew the Advisory Contracts, was aware that shareholders of the fund have a broad range of investment choices available to them, including a wide choice among funds offered by Fidelity's competitors, and that the fund's shareholders, who have the opportunity to review and weigh the disclosure provided by the fund in its prospectus and other public disclosures, have chosen to invest in this fund, which is part of the Fidelity family of funds.
Nature, Extent, and Quality of Services Provided. The Board considered Fidelity's staffing as it relates to the fund, including the backgrounds of investment personnel of FMR and the sub-advisers (together, the Investment Advisers), and also considered the fund's investment objective, strategies, and related investment philosophy. The Independent Trustees also had discussions with senior management of Fidelity's investment operations and investment groups. The Board considered the structure of the portfolio manager compensation program and whether this structure provides appropriate incentives to act in the best interests of the fund. Additionally, the Board considered the portfolio managers' investments, if any, in the funds that they manage.
Resources Dedicated to Investment Management and Support Services. The Board and the Fund Oversight and Research Committees reviewed the general qualifications and capabilities of Fidelity's investment staff, including its size, education, experience, and resources, as well as Fidelity's approach to recruiting, training, managing, and compensating investment personnel. The Board noted that Fidelity has continued to increase the resources devoted to non-U.S. offices, including expansion of Fidelity's global investment organization. The Board also noted that Fidelity's analysts have extensive resources, tools and capabilities that allow them to conduct sophisticated quantitative and fundamental analysis, as well as credit analysis of issuers, counterparties and guarantors. Further, the Board believes that Fidelity's investment professionals have sufficient access to global information and data so as to provide competitive investment results over time, and that those professionals also have access to sophisticated tools that permit them to assess portfolio construction and risk and performance attribution characteristics continuously, as well as to transmit new information and research conclusions rapidly around the world. Additionally, in its deliberations, the Board considered Fidelity's trading and risk management capabilities and resources and global compliance infrastructure, which are an integral part of the investment management process.
Annual Report
Board Approval of Investment Advisory Contracts and
Management Fees - continued
Shareholder and Administrative Services. The Board considered (i) the nature, extent, quality, and cost of advisory, administrative, and shareholder services performed by the Investment Advisers and their affiliates under the Advisory Contracts and under separate agreements covering transfer agency, pricing and bookkeeping, and securities lending services for the fund; (ii) the nature and extent of the supervision of third party service providers, principally custodians and subcustodians; and (iii) the resources devoted to, and the record of compliance with, the fund's compliance policies and procedures. The Board also reviewed the allocation of fund brokerage, including allocations to brokers affiliated with the Investment Advisers, the use of brokerage commissions to pay fund expenses, and the use of "soft" commission dollars to pay for research services.
The Board noted that the growth of fund assets over time across the complex allows Fidelity to reinvest in the development of services designed to enhance the value or convenience of the Fidelity funds as investment vehicles. These services include 24-hour access to account information and market information through telephone representatives and over the Internet, investor education materials and asset allocation tools, and the expanded availability of Fidelity Investor Centers.
In 2014, the Board formed an ad hoc Committee on Transfer Agency Fees to review the variety of transfer agency fee structures throughout the industry and Fidelity's competitive positioning with respect to industry participants.
Investment in a Large Fund Family. The Board considered the benefits to shareholders of investing in a Fidelity fund, including the benefits of investing in a fund that is part of a large family of funds offering a variety of investment disciplines and providing a large variety of mutual fund investor services. The Board noted that Fidelity had taken, or had made recommendations that resulted in the Fidelity funds taking, a number of actions over the previous year that benefited particular funds, including (i) continuing to dedicate additional resources to investment research and to the support of the senior management team that oversees asset management; (ii) persisting in efforts to enhance Fidelity's global research capabilities; (iii) launching new funds and making other enhancements to meet client needs for income-oriented solutions; (iv) reducing fund expenses for certain index funds; (v) continuing to launch dedicated lower cost underlying funds to meet portfolio construction needs related to expanding underlying fund options for Fidelity funds of funds, specifically for the Freedom Fund product lines; (vi) rationalizing product lines and gaining increased efficiencies through fund mergers; (vii) launching sector-based exchange-traded funds and establishing a new Fidelity adviser to manage sector-based funds and products; (viii) continuing to develop and implement technology to improve security and increase efficiency; (ix) modifying the eligibility criteria for certain share classes to increase their marketability to a portion of the defined contribution plan market; (x) waiving redemption fees for certain qualified fund-of-fund and wrap programs and certain retirement plan transactions; and (xi) launching new Institutional Class shares of certain money market funds to attract and retain assets and to fill a gap in the money market fund lineup.
Annual Report
Investment Performance. The Board considered whether the fund has operated in accordance with its investment objective, as well as its record of compliance with its investment restrictions and its performance history. The Board noted that there was a portfolio management change for the fund in October 2012.
The Board took into account discussions with the Investment Advisers about fund investment performance that occur at Board meetings throughout the year. In this regard the Board noted that as part of regularly scheduled fund reviews and other reports to the Board on fund performance, the Board periodically considers annualized return information for the fund, for different time periods, measured against a securities market index ("benchmark index") and a peer group of funds with similar objectives ("peer group"). In its evaluation of fund investment performance, the Board gave particular attention to information indicating changes in performance of certain Fidelity funds for specific time periods and the Investment Advisers' explanations for any overperformance or underperformance.
In addition to reviewing absolute and relative fund performance, the Independent Trustees periodically consider the appropriateness of fund performance metrics in evaluating the results achieved. In general, the Independent Trustees believe that fund performance should be evaluated based on net performance (after fees and expenses) of both the highest performing and lowest performing classes, where applicable, compared to appropriate benchmark indices, over appropriate time periods which may include full market cycles, and compared to peer groups, as applicable, over the same periods, taking into account relevant factors including the following: general market conditions; issuer-specific information; tactical opportunities for investment; and fund cash flows and other factors.
The Independent Trustees recognize that shareholders evaluate performance on a net basis over their own holding periods, for which one-, three-, and five-year periods are often used as a proxy. For this reason, the performance information reviewed by the Board also included net cumulative calendar year total return information for the fund and an appropriate benchmark index and peer group for the most recent one-, three-, and five-year periods, as shown below. Returns are shown compared to the 25th percentile (top of box, 75% beaten) and 75th percentile (bottom of box, 25% beaten) of the peer universe.
Annual Report
Board Approval of Investment Advisory Contracts and
Management Fees - continued
Fidelity Advisor Emerging Markets Fund

Based on its review, the Board concluded that the nature, extent, and quality of services provided to the fund under the Advisory Contracts should benefit the fund's shareholders.
Competitiveness of Management Fee and Total Expense Ratio. The Board considered the fund's management fee and total expense ratio compared to "mapped groups" of competitive funds and classes. Fidelity creates "mapped groups" by combining similar Lipper investment objective categories that have comparable investment mandates. Combining Lipper investment objective categories aids the Board's management fee and total expense ratio comparisons by broadening the competitive group used for comparison and by reducing the number of universes to which various Fidelity funds are compared.
Management Fee. The Board considered two proprietary management fee comparisons for the 12-month periods shown in the chart below. The group of Lipper funds used by the Board for management fee comparisons is referred to below as the "Total Mapped Group." The Total Mapped Group comparison focuses on a fund's standing in terms of gross management fees before expense reimbursements or caps relative to the total universe of funds with comparable investment mandates, regardless of whether their management fee structures also are comparable. Funds with comparable investment mandates offer exposure to similar types of securities. Funds with comparable management fee structures have similar management fee contractual arrangements (e.g., flat rate charged for advisory services, all-inclusive fee rate, etc.). "TMG %" represents the percentage of funds in the Total Mapped Group that had management fees that were lower than the fund's. For example, a hypothetical TMG % of 20% would mean that 80% of the funds in the Total Mapped Group had higher, and 20% had lower, management fees than the fund. The fund's actual TMG %s are in the chart below. The "Asset-Size Peer Group" (ASPG) comparison focuses on a fund's standing relative to a subset of non-Fidelity funds within the Total Mapped Group that are similar in size and management fee structure. For example, if a fund is in the first quartile of the ASPG, the fund's management fee ranks in the least expensive or lowest 25% of funds in the ASPG. The ASPG represents at least 15% of the funds in the Total Mapped Group with comparable asset size and management fee structures, subject to a minimum of 50 funds (or all funds in the Total Mapped Group if fewer than 50). Additional information, such as the ASPG quartile in which the fund's management fee rate ranked, is also included in the chart and considered by the Board.
Annual Report
Fidelity Advisor Emerging Markets Fund

The Board noted that the fund's management fee rate ranked below the median of its Total Mapped Group and below the median of its ASPG for 2013.
The Board also noted that, in August 2013, the ad hoc Committee on Management Fees was formed to conduct an in-depth review of the management fee rates of Fidelity's active equity mutual funds. The Committee focused on the following areas: (i) standard fee structures; (ii) research consumption and trading evolution; (iii) management fee competitiveness/profitability by category; and (iv) factors that drive institutional pricing.
Based on its review, the Board concluded that the fund's management fee is fair and reasonable in light of the services that the fund receives and the other factors considered.
Annual Report
Board Approval of Investment Advisory Contracts and
Management Fees - continued
Total Expense Ratio. In its review of each class's total expense ratio, the Board considered the fund's management fee as well as other fund or class expenses, as applicable, such as transfer agent fees, pricing and bookkeeping fees, fund-paid 12b-1 fees, and custodial, legal, and audit fees. The Board also noted the effects of any waivers and reimbursements on fees and expenses. As part of its review, the Board also considered the current and historical total expense ratios of each class of the fund compared to competitive fund median expenses. Each class of the fund is compared to those funds and classes in the Total Mapped Group (used by the Board for management fee comparisons) that have a similar sales load structure.
The Board noted that the total expense ratio of each of Class A, Class B, Class C, Institutional Class, and Class Z ranked below its competitive median for 2013 and the total expense ratio of Class T ranked above its competitive median for 2013. The Board considered that, in general, various factors can affect total expense ratios. The Board noted that the total expense ratio of Class T was above the competitive median primarily because of higher 12b-1 fees on Class T as compared to most competitor funds. Class T has a higher 12b-1 fee, but a lower front-end sales charge, than traditionally priced front-end sales charge classes. The Board considered that Class T is primarily sold load-waived in the retirement plan market where its 0.50% 12b-1 fee is comparable to competing no-load, higher 12b-1 fee classes designed specifically for retirement plans. The Board noted that the fund offers multiple classes, each of which has a different sales load and 12b-1 fee structure, and that the multiple structures are intended to offer a range of pricing options for the intermediary market. The Board also noted that the total expense ratios of the classes vary primarily by the level of their 12b-1 fees, although differences in transfer agent fees may also cause expenses to vary from class to class.
Fees Charged to Other Fidelity Clients. The Board also considered Fidelity fee structures and other information with respect to clients of Fidelity, such as other funds advised or subadvised by Fidelity, pension plan clients, and other institutional clients. The Board noted the findings of the 2013 ad hoc joint committee (created with the board of other Fidelity funds), which reviewed and compared Fidelity's institutional investment advisory business with its business of providing services to the Fidelity funds, including the differences in services provided, fees charged, and costs incurred, as well as competition in their respective marketplaces.
Based on its review of total expense ratios and fees charged to other Fidelity clients, the Board concluded that the total expense ratio of each class of the fund was reasonable, although Class T was above the median of the universe presented for comparison, in light of the services that the fund and its shareholders receive and the other factors considered.
Costs of the Services and Profitability. The Board considered the revenues earned and the expenses incurred by Fidelity in conducting the business of developing, marketing, distributing, managing, administering and servicing the fund and servicing the fund's shareholders. The Board also considered the level of Fidelity's profits in respect of all the Fidelity funds.
Annual Report
On an annual basis, Fidelity presents to the Board Fidelity's profitability for the fund. Fidelity calculates the profitability for each fund, as well as aggregate profitability for groups of Fidelity funds and all Fidelity funds, using a series of detailed revenue and cost allocation methodologies which originate with the books and records of Fidelity on which Fidelity's audited financial statements are based. The Audit Committee of the Board reviews any significant changes from the prior year's methodologies.
PricewaterhouseCoopers LLP (PwC), independent registered public accounting firm and auditor to Fidelity and certain Fidelity funds, has been engaged annually by the Board as part of the Board's assessment of Fidelity's profitability analysis. PwC's engagement includes the review and assessment of the methodologies used by Fidelity in determining the revenues and expenses attributable to Fidelity's mutual fund business, and completion of agreed-upon procedures in respect of the mathematical accuracy of fund profitability and its conformity to established allocation methodologies. After considering PwC's reports issued under the engagement and information provided by Fidelity, the Board concluded that while other allocation methods may also be reasonable, Fidelity's profitability methodologies are reasonable in all material respects.
The Board also reviewed Fidelity's non-fund businesses and fall-out benefits related to the mutual fund business as well as cases where Fidelity's affiliates may benefit from or be related to the fund's business.
The Board considered the costs of the services provided by and the profits realized by Fidelity in connection with the operation of the fund and was satisfied that the profitability was not excessive in the circumstances.
Economies of Scale. The Board considered whether there have been economies of scale in respect of the management of the Fidelity funds, whether the Fidelity funds (including the fund) have appropriately benefited from any such economies of scale, and whether there is potential for realization of any further economies of scale. The Board considered the extent to which the fund will benefit from economies of scale through increased services to the fund, through waivers or reimbursements, or through fee or expense ratio reductions. The Board also noted that in 2013, it and the boards of other Fidelity funds created an ad hoc committee (the Economies of Scale Committee) to analyze whether Fidelity attains economies of scale in respect of the management and servicing of the Fidelity funds, whether the Fidelity funds have appropriately benefited from such economies of scale, and whether there is potential for realization of any further economies of scale.
Annual Report
Board Approval of Investment Advisory Contracts and
Management Fees - continued
The Board recognized that the fund's management contract incorporates a "group fee" structure, which provides for lower group fee rates as total group assets increase, and for higher group fee rates as total group assets decrease (with "group assets" defined to include fund assets under FMR's management plus sector fund assets previously under FMR's management and currently managed by Fidelity SelectCo, LLC). FMR calculates the group fee rates based on a tiered asset "breakpoint" schedule that varies based on asset class. The Board considered that the group fee is designed to deliver the benefits of economies of scale to fund shareholders when total Fidelity fund assets increase, even if assets of any particular fund are unchanged or have declined, because some portion of Fidelity's costs are attributable to services provided to all Fidelity funds, and all funds benefit if those costs can be allocated among more assets. The Board concluded that, given the group fee structure, fund shareholders will benefit from lower management fees as group assets increase at the fund complex level, regardless of whether Fidelity achieves any such economies of scale.
The Board concluded, taking into account the analysis of the Economies of Scale Committee, that economies of scale, if any, are being appropriately shared between fund shareholders and Fidelity.
Additional Information Requested by the Board. In order to develop fully the factual basis for consideration of the Fidelity funds' Advisory Contracts, the Board requested and received additional information on certain topics, including: (i) fund performance trends and Fidelity's long-term strategies for certain funds; (ii) Fidelity's strategic marketing and product lineup goals; (iii) the methodology with respect to competitive fund data and peer group classifications; (iv) the arrangements with, and performance of, certain sub-advisers on behalf of the Fidelity funds, as well as certain proposed participating affiliate arrangements; (v) the realization of fall-out benefits in certain Fidelity business units; (vi) Fidelity's group fee structures, including the rationale for the individual fee rates of certain categories of funds and the definition of group assets; (vii) trends regarding industry use of performance fee structures and the performance adjustment methodologies applicable to the Fidelity funds; (viii) additional competitive analysis regarding the total expenses for certain classes; (ix) fund profitability methodology, including Fidelity's cost allocation methodology, and the impact of certain factors on fund profitability results; and (x) the process by which Fidelity determines sub-advisory fees for funds it advises.
Based on its evaluation of all of the conclusions noted above, and after considering all factors it believed relevant, the Board ultimately concluded that the advisory fee structures are fair and reasonable, and that the fund's Advisory Contracts should be renewed.
Annual Report
Investment Adviser
Fidelity Management & Research Company
Boston, MA
Investment Sub-Advisers
FMR Co., Inc.
Fidelity Management & Research
(U.K.) Inc.
Fidelity Management & Research
(Hong Kong) Limited
Fidelity Management & Research
(Japan) Limited
FIL Investments (Japan) Limited
FIL Investment Advisors (UK) Limited
FIL Investment Advisors
General Distributor
Fidelity Distributors Corporation
Smithfield, RI
Transfer and Service Agents
Fidelity Investments Institutional Operations Company, Inc.
Boston, MA
Fidelity Service Company, Inc.
Boston, MA
Custodian
JPMorgan Chase Bank
New York, NY
(Fidelity Investment logo)(registered trademark)
FAEMZ-UANN-1214
1.9585021.101
(Fidelity Investment logo)(registered trademark)
Fidelity Advisor®
Global Capital Appreciation
Fund - Class A, Class T, Class B
and Class C
Annual Report
October 31, 2014
(Fidelity Cover Art)
Contents
Performance | (Click Here) | How the fund has done over time. |
Management's Discussion of Fund Performance | (Click Here) | The Portfolio Manager's review of fund performance and strategy. |
Shareholder Expense Example | (Click Here) | An example of shareholder expenses. |
Investment Changes | (Click Here) | A summary of major shifts in the fund's investments over the past six months. |
Investments | (Click Here) | A complete list of the fund's investments with their market values. |
Financial Statements | (Click Here) | Statements of assets and liabilities, operations, and changes in net assets, as well as financial highlights. |
Notes | (Click Here) | Notes to financial statements. |
Report of Independent Registered Public Accounting Firm | (Click Here) | |
Trustees and Officers | (Click Here) | |
Distributions | (Click Here) | |
Board Approval of Investment Advisory Contracts and Management Fees | (Click Here) | |
To view a fund's proxy voting guidelines and proxy voting record for the 12-month period ended June 30, visit http://www.fidelity.com/proxyvotingresults or visit the Securities and Exchange Commission's (SEC) web site at http://www.sec.gov. You may also call 1-877-208-0098 to request a free copy of the proxy voting guidelines.
Standard & Poor's, S&P and S&P 500 are registered service marks of The McGraw-Hill Companies, Inc. and have been licensed for use by Fidelity Distributors Corporation.
Other third-party marks appearing herein are the property of their respective owners.
All other marks appearing herein are registered or unregistered trademarks or service marks of FMR LLC or an affiliated company. © 2014 FMR LLC. All rights reserved.
Annual Report
This report and the financial statements contained herein are submitted for the general information of the shareholders of the fund. This report is not authorized for distribution to prospective investors in the fund unless preceded or accompanied by an effective prospectus.
A fund files its complete schedule of portfolio holdings with the SEC for the first and third quarters of each fiscal year on Form N-Q. Forms N-Q are available on the SEC's web site at http://www.sec.gov. A fund's Forms N-Q may be reviewed and copied at the SEC's Public Reference Room in Washington, DC. Information regarding the operation of the SEC's Public Reference Room may be obtained by calling 1-800-SEC-0330. For a complete list of a fund's portfolio holdings, view the most recent holdings listing, semiannual report, or annual report on Fidelity's web site at http://www.fidelity.com, http://www.advisor.fidelity.com, or http://www.401k.com, as applicable.
NOT FDIC INSURED • MAY LOSE VALUE • NO BANK GUARANTEE
Neither the fund nor Fidelity Distributors Corporation is a bank.
Annual Report
Average annual total return reflects the change in the value of an investment, assuming reinvestment of the class' distributions from dividend income and capital gains (the profits earned upon the sale of securities that have grown in value, if any) and assuming a constant rate of performance each year. The $10,000 table and the fund's returns do not reflect the deduction of taxes that a shareholder would pay on fund distributions or the redemption of fund shares. During periods of reimbursement by Fidelity, a fund's total return will be greater than it would be had the reimbursement not occurred. How a fund did yesterday is no guarantee of how it will do tomorrow. Returns reflect the conversion of Class B shares to Class A shares after a maximum of seven years.
Average Annual Total Returns
Periods ended October 31, 2014 | Past 1
year | Past 5
years | Past 10
years |
Class A (incl. 5.75% sales charge) | 6.53% | 10.29% | 5.18% |
Class T (incl. 3.50% sales charge) | 8.83% | 10.51% | 5.17% |
Class B (incl. contingent deferred sales charge)A | 7.11% | 10.48% | 5.25% |
Class C (incl. contingent deferred sales charge)B | 11.13% | 10.78% | 5.02% |
A Class B shares' contingent deferred sales charges included in the past one year, past five years, and past ten years total return figures are 5%, 2%, and 0%, respectively.
B Class C shares' contingent deferred sales charges included in the past one year, past five years, and past ten years total return figures are 1%, 0%, and 0%, respectively.
Annual Report
$10,000 Over 10 Years
Let's say hypothetically that $10,000 was invested in Fidelity Advisor® Global Capital Appreciation Fund - Class A on October 31, 2004, and the current 5.75% sales charge was paid. The chart shows how the value of your investment would have changed, and also shows how the MSCI ACWI (All Country World Index) Index performed over the same period.
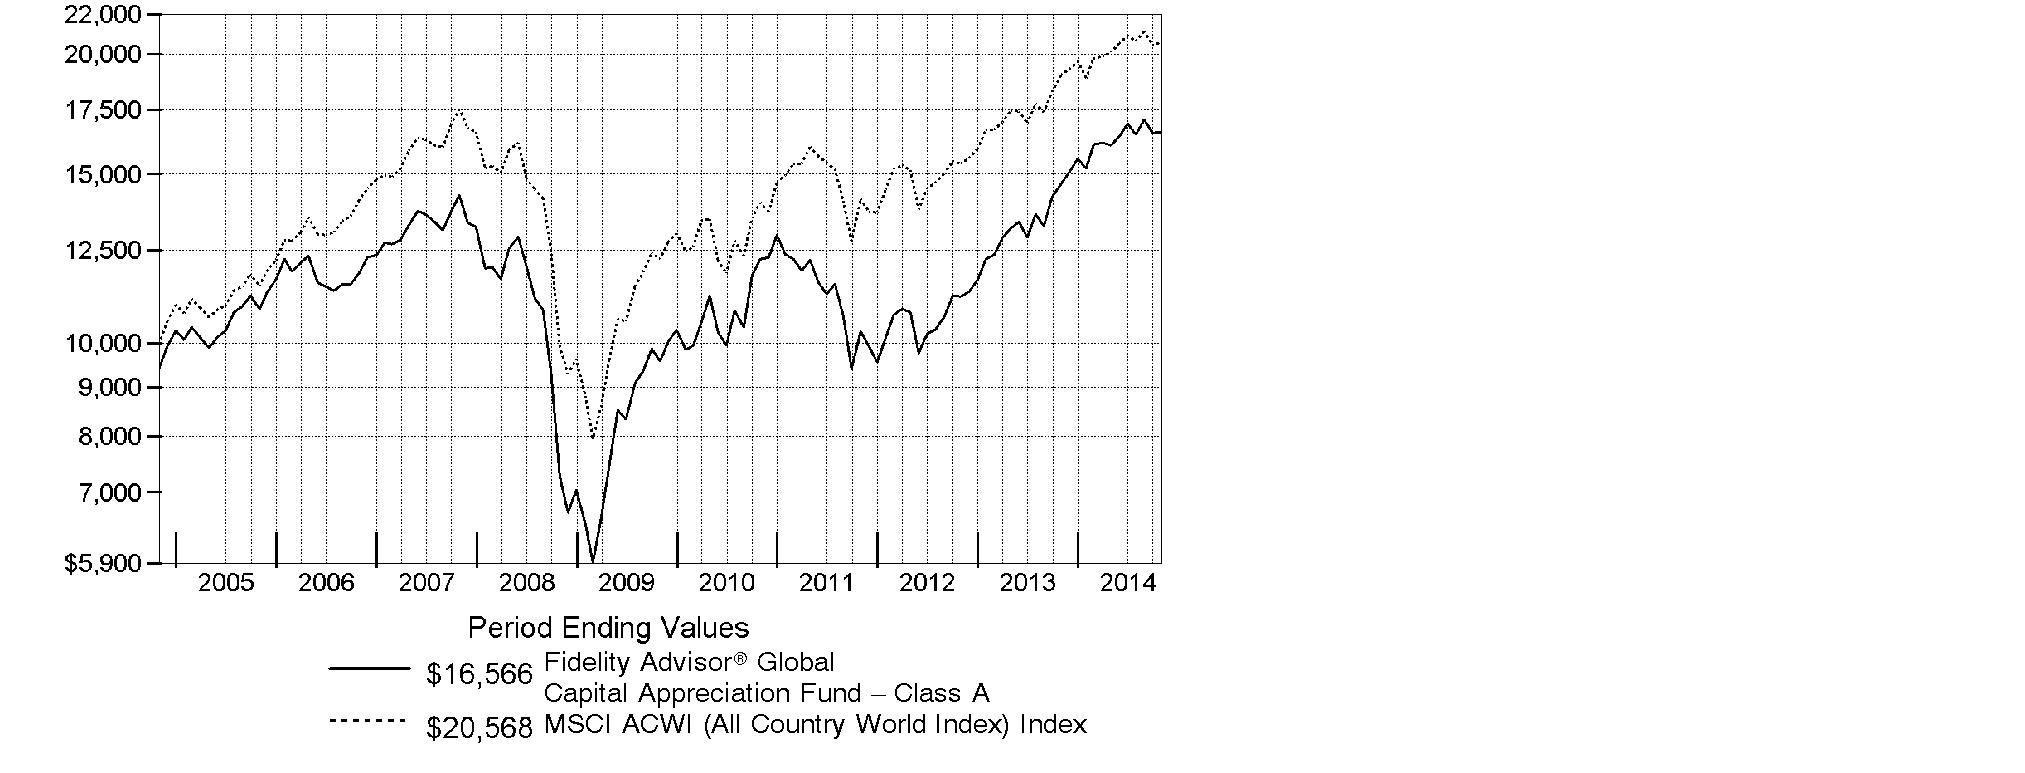
Annual Report
Market Recap: Global equities posted a healthy gain for the 12 months ending October 31, 2014, overcoming an October market decline driven by recessionary pressures in China and tepid growth in Europe. The MSCI ACWI (All Country World Index) Index rose 8.15%, helped by subdued market volatility for much of the period and supported by solid corporate earnings, especially in the United States. Stocks also benefited from easy monetary policies in Japan and the eurozone, as well as increased stimulus efforts in China. All but three of the 24 industry groups that compose the index marked a positive return. The U.S. (+17%) remained a pillar of strength, while a strongly rising dollar in the latter part of the period detracted from investors' returns in most non-U.S. markets. Canada (+5%) notched broad gains outside of its energy and materials sectors, as did Asia-Pacific ex Japan (+4%), led by investor enthusiasm for companies in India. The U.K., Europe and Japan, meanwhile, all underperformed. Among sectors, health care (+24%) led the index, with a strong contribution from the pharmaceuticals, biotechnology & life sciences industry. Information technology (+21%) also outperformed. Conversely, materials (-4%) and energy (-1%) lagged the index due to a higher supply of and lower demand for commodities.
Comments from Thomas Allen, Portfolio Manager of Fidelity Advisor® Global Capital Appreciation Fund: For the year, the fund's Class A, Class T, Class B and Class C shares returned 13.03%, 12.77%, 12.11% and 12.13%, respectively (excluding sales charges), well ahead of the MSCI index. Versus the index, my picks in consumer discretionary, health care and consumer staples were particularly fruitful. Geographically, stock picking in emerging markets worked well, with India and South Korea adding significant value. At the stock level, U.K.-based Quindell, a fast-growing provider of insurance claims outsourcing, was our largest relative contributor. I sold this position for valuation and other reasons. Other key contributors were Super Micro Computer, a supplier of non-branded, customized servers, and India-based Aurobindo Pharma. The first two contributors I mentioned were not part of the index. Conversely, stock selection and a relatively light exposure to the United States, which performed well and represented almost half of the index, hampered relative performance. At the stock level, negligible exposure to strong-performing index component Apple detracted the most versus the index. Not owning software giant Microsoft, another solid performer in the index, also hurt.
The views expressed above reflect those of the portfolio manager(s) only through the end of the period as stated on the cover of this report and do not necessarily represent the views of Fidelity or any other person in the Fidelity organization. Any such views are subject to change at any time based upon market or other conditions and Fidelity disclaims any responsibility to update such views. These views may not be relied on as investment advice and, because investment decisions for a Fidelity fund are based on numerous factors, may not be relied on as an indication of trading intent on behalf of any Fidelity fund.
Annual Report
Shareholder Expense Example
As a shareholder of the Fund, you incur two types of costs: (1) transaction costs, including sales charges (loads) on purchase payments or redemption proceeds, redemption fees and (2) ongoing costs, including management fees, distribution and/or service (12b-1) fees and other Fund expenses. This Example is intended to help you understand your ongoing costs (in dollars) of investing in the Fund and to compare these costs with the ongoing costs of investing in other mutual funds.
The Example is based on an investment of $1,000 invested at the beginning of the period and held for the entire period (May 1, 2014 to October 31, 2014).
Actual Expenses
The first line of the accompanying table for each class of the Fund provides information about actual account values and actual expenses. You may use the information in this line, together with the amount you invested, to estimate the expenses that you paid over the period. Simply divide your account value by $1,000.00 (for example, an $8,600 account value divided by $1,000.00 = 8.6), then multiply the result by the number in the first line for a class of the Fund under the heading entitled "Expenses Paid During Period" to estimate the expenses you paid on your account during this period. In addition, the Fund, as a shareholder in the underlying Fidelity Central Funds, will indirectly bear its pro-rata share of the fees and expenses incurred by the underlying Fidelity Central Funds. These fees and expenses are not included in the Fund's annualized expense ratio used to calculate the expense estimate in the table below.
Hypothetical Example for Comparison Purposes
The second line of the accompanying table for each class of the Fund provides information about hypothetical account values and hypothetical expenses based on a Class' actual expense ratio and an assumed rate of return of 5% per year before expenses, which is not the Class' actual return. The hypothetical account values and expenses may not be used to estimate the actual ending account balance or expenses you paid for the period. You may use this information to compare the ongoing costs of investing in the Fund and other funds. To do so, compare this 5% hypothetical example with the 5% hypothetical examples that appear in the shareholder reports of the other funds. In addition, the Fund, as a shareholder in the underlying Fidelity Central Funds, will indirectly bear its pro-rata share of the fees and expenses incurred by the underlying Fidelity Central Funds. These fees and expenses are not included in the Fund's annualized expense ratio used to calculate the expense estimate in the table below.
Please note that the expenses shown in the table are meant to highlight your ongoing costs only and do not reflect any transaction costs. Therefore, the second line of the table is useful in comparing ongoing costs only, and will not help you determine the relative total costs of owning different funds. In addition, if these transactional costs were included, your costs would have been higher.
Annual Report
| Annualized
Expense Ratio B | Beginning
Account Value
May 1, 2014 | Ending
Account Value
October 31, 2014 | Expenses Paid
During Period*
May 1, 2014
to October 31, 2014 |
Class A | 1.45% | | | |
Actual | | $ 1,000.00 | $ 1,032.30 | $ 7.43 |
HypotheticalA | | $ 1,000.00 | $ 1,017.90 | $ 7.38 |
Class T | 1.70% | | | |
Actual | | $ 1,000.00 | $ 1,030.60 | $ 8.70 |
HypotheticalA | | $ 1,000.00 | $ 1,016.64 | $ 8.64 |
Class B | 2.20% | | | |
Actual | | $ 1,000.00 | $ 1,027.70 | $ 11.24 |
HypotheticalA | | $ 1,000.00 | $ 1,014.12 | $ 11.17 |
Class C | 2.20% | | | |
Actual | | $ 1,000.00 | $ 1,028.50 | $ 11.25 |
HypotheticalA | | $ 1,000.00 | $ 1,014.12 | $ 11.17 |
Institutional Class | 1.20% | | | |
Actual | | $ 1,000.00 | $ 1,033.80 | $ 6.15 |
HypotheticalA | | $ 1,000.00 | $ 1,019.16 | $ 6.11 |
A 5% return per year before expenses
B Annualized expense ratio reflects expenses net of applicable fee waivers.
* Expenses are equal to each Class' annualized expense ratio, multiplied by the average account value over the period, multiplied by 184/365 (to reflect the one-half year period).
Annual Report
Investment Changes (Unaudited)
Top Five Stocks as of October 31, 2014 |
| % of fund's
net assets | % of fund's net assets
6 months ago |
Apple, Inc. (United States of America, Technology Hardware, Storage & Peripherals) | 1.2 | 0.0 |
McKesson Corp. (United States of America, Health Care Providers & Services) | 1.2 | 0.5 |
Global Payments, Inc. (United States of America, IT Services) | 1.2 | 0.2 |
Cardinal Health, Inc. (United States of America, Health Care Providers & Services) | 1.1 | 0.0 |
Procter & Gamble Co. (United States of America, Household Products) | 1.1 | 0.0 |
| 5.8 | |
Top Five Market Sectors as of October 31, 2014 |
| % of fund's
net assets | % of fund's net assets
6 months ago |
Information Technology | 17.6 | 20.1 |
Health Care | 17.6 | 8.2 |
Industrials | 16.4 | 16.9 |
Consumer Discretionary | 15.6 | 20.4 |
Financials | 13.4 | 10.0 |
Top Five Countries as of October 31, 2014 |
(excluding cash equivalents) | % of fund's
net assets | % of fund's net assets
6 months ago |
United States of America | 50.4 | 39.3 |
Japan | 6.5 | 1.9 |
Cayman Islands | 4.7 | 1.2 |
India | 4.1 | 3.2 |
Canada | 3.6 | 8.9 |
Percentages are adjusted for the effect of open futures contracts, if applicable. |
Asset Allocation (% of fund's net assets) |
As of October 31, 2014 | As of April 30, 2014 |
 | Stocks 98.1% | | | Stocks 96.7% | |
 | Short-Term
Investments and
Net Other Assets
(Liabilities) 1.9% | | | Short-Term
Investments and
Net Other Assets
(Liabilities) 3.3% | |

Annual Report
Investments October 31, 2014
Showing Percentage of Net Assets
Common Stocks - 98.1% |
| Shares | | Value |
Australia - 1.2% |
Altium Ltd. | 101,603 | | $ 275,427 |
Ardent Leisure Group unit | 73,155 | | 200,382 |
Ausdrill Ltd. | 246,041 | | 133,068 |
CSL Ltd. | 4,115 | | 290,531 |
Imdex Ltd. (a) | 192,909 | | 102,147 |
Qube Holdings Ltd. | 85,261 | | 184,436 |
Vocus Communications Ltd. (d) | 41,427 | | 216,124 |
TOTAL AUSTRALIA | | 1,402,115 |
Belgium - 0.3% |
Ion Beam Applications SA (a) | 17,700 | | 308,978 |
Bermuda - 1.5% |
BW LPG Ltd. | 5,394 | | 51,101 |
Cheung Kong Infrastructure Holdings Ltd. | 16,000 | | 116,869 |
China Animal Healthcare Ltd. | 85,000 | | 70,168 |
Luye Pharma Group Ltd. | 193,500 | | 279,284 |
PAX Global Technology Ltd. (a) | 628,000 | | 674,505 |
Sihuan Pharmaceutical Holdings Group Ltd. | 308,000 | | 245,938 |
Silverlake Axis Ltd. Class A | 198,000 | | 209,628 |
TOTAL BERMUDA | | 1,647,493 |
Brazil - 1.4% |
BB Seguridade Participacoes SA | 8,000 | | 106,736 |
Cetip SA - Mercados Organizado | 8,009 | | 101,490 |
Direcional Engenharia SA | 28,800 | | 118,552 |
Embraer SA | 15,500 | | 150,065 |
JBS SA | 50,400 | | 224,755 |
Kepler Weber SA | 6,000 | | 112,595 |
Kroton Educacional SA | 17,400 | | 124,010 |
Minerva SA (a) | 30,200 | | 155,394 |
Natura Cosmeticos SA | 4,800 | | 69,736 |
Qualicorp SA (a) | 9,500 | | 96,614 |
Smiles SA | 13,300 | | 229,727 |
Weg SA | 10,180 | | 120,086 |
TOTAL BRAZIL | | 1,609,760 |
British Virgin Islands - 0.1% |
Epic Gas Ltd. (a) | 15,100 | | 82,832 |
Canada - 3.6% |
AGT Food & Ingredients, Inc. | 8,900 | | 218,660 |
Algonquin Power & Utilities Corp. | 15,300 | | 124,892 |
B2Gold Corp. (a) | 75,500 | | 125,939 |
Common Stocks - continued |
| Shares | | Value |
Canada - continued |
Canadian Natural Resources Ltd. | 6,300 | | $ 219,847 |
Canadian Pacific Railway Ltd. | 1,010 | | 210,083 |
CCL Industries, Inc. Class B | 1,300 | | 131,425 |
Clearwater Seafoods, Inc. | 52,600 | | 523,176 |
Constellation Software, Inc. | 1,100 | | 309,880 |
EnerCare, Inc. | 14,000 | | 184,215 |
Enghouse Systems Ltd. | 5,408 | | 181,666 |
FirstService Corp. (sub. vtg.) | 2,700 | | 142,684 |
Gildan Activewear, Inc. | 4,900 | | 291,900 |
Imperial Oil Ltd. | 2,700 | | 129,915 |
New Gold, Inc. (a) | 13,900 | | 50,442 |
Stantec, Inc. | 2,400 | | 152,064 |
Stella-Jones, Inc. | 9,300 | | 270,076 |
Suncor Energy, Inc. | 12,600 | | 447,409 |
SunOpta, Inc. (a) | 12,200 | | 172,752 |
TransForce, Inc. | 7,700 | | 188,290 |
TOTAL CANADA | | 4,075,315 |
Cayman Islands - 4.7% |
Anta Sports Products Ltd. | 109,000 | | 213,944 |
Chailease Holding Co. Ltd. | 78,000 | | 192,327 |
China Aircraft Leasing Group Holdings Ltd. (a) | 343,500 | | 313,747 |
China Cord Blood Corp. (a) | 20,800 | | 105,872 |
China Pioneer Pharma Hld Ltd. | 343,000 | | 326,170 |
China Shengmu Organic Milk Ltd. (a)(e) | 884,000 | | 276,658 |
Chlitina Holding Ltd. | 13,000 | | 67,777 |
Comba Telecom Systems Holdings Ltd. | 696,850 | | 319,721 |
Consun Pharmaceutical Group Ltd. | 321,000 | | 278,233 |
CT Environmental Group Ltd. | 286,000 | | 305,431 |
EVA Precision Industrial Holdings Ltd. | 1,116,000 | | 298,302 |
Greatview Aseptic Pack Co. Ltd. | 278,000 | | 183,014 |
Nexteer Auto Group Ltd. | 336,000 | | 299,345 |
PW Medtech Group Ltd. (a) | 454,000 | | 286,653 |
Shenzhou International Group Holdings Ltd. | 79,000 | | 272,743 |
Sino Biopharmaceutical Ltd. | 312,000 | | 314,118 |
Sitoy Group Holdings Ltd. | 223,000 | | 183,658 |
Sunny Optical Technology Group Co. Ltd. | 182,000 | | 294,516 |
Tencent Holdings Ltd. | 10,150 | | 163,134 |
The United Laboratories International Holdings Ltd. (a) | 302,000 | | 231,676 |
Want Want China Holdings Ltd. | 105,000 | | 143,385 |
Xinyi Solar Holdings Ltd. | 842,000 | | 284,961 |
TOTAL CAYMAN ISLANDS | | 5,355,385 |
Common Stocks - continued |
| Shares | | Value |
China - 1.0% |
China CITIC Bank Corp. Ltd. (H Shares) | 229,000 | | $ 149,182 |
CSR Corp. Ltd. (H Shares) | 273,000 | | 277,747 |
Harbin Electric Machinery Co. Ltd.(H Shares) | 104,000 | | 62,765 |
PICC Property & Casualty Co. Ltd. (H Shares) | 108,000 | | 198,119 |
Xinjiang Goldwind Science & Technology Co. Ltd. (H Shares) | 103,800 | | 186,292 |
Yantai Changyu Pioneer Wine Co. Ltd. (B Shares) | 4,900 | | 15,398 |
Zhuzhou CSR Times Electric Co. Ltd. (H Shares) | 68,000 | | 292,425 |
TOTAL CHINA | | 1,181,928 |
Denmark - 1.3% |
Ambu A/S Series B | 1,300 | | 91,927 |
Genmab A/S (a) | 7,000 | | 305,127 |
Pandora A/S | 9,500 | | 799,731 |
Royal Unibrew A/S (a) | 1,400 | | 228,639 |
TOTAL DENMARK | | 1,425,424 |
Finland - 0.5% |
Nokia Corp. | 47,200 | | 394,398 |
Valmet Corp. | 18,300 | | 193,322 |
TOTAL FINLAND | | 587,720 |
France - 0.4% |
Korian-Medica | 9,524 | | 343,685 |
Schneider Electric SA | 1,900 | | 149,716 |
Solocal Group SA (a) | 13 | | 8 |
TOTAL FRANCE | | 493,409 |
Germany - 1.0% |
Deutsche Annington Immobilien SE | 4,400 | | 127,205 |
Fresenius SE & Co. KGaA | 2,800 | | 144,037 |
GFT Technologies AG | 20,200 | | 278,830 |
MLP AG | 12,800 | | 64,963 |
Nemetschek AG | 1,500 | | 149,213 |
OSRAM Licht AG (a) | 3,136 | | 109,879 |
Patrizia Immobilien AG | 14,590 | | 196,913 |
Rocket Internet AG (a) | 1,037 | | 55,229 |
TOTAL GERMANY | | 1,126,269 |
Hong Kong - 1.0% |
AIA Group Ltd. | 36,600 | | 204,244 |
BYD Electronic International Co. Ltd. | 279,500 | | 332,514 |
Guangdong Investment Ltd. | 112,000 | | 147,327 |
Guotai Junan International Holdings Ltd. | 284,000 | | 198,380 |
Common Stocks - continued |
| Shares | | Value |
Hong Kong - continued |
Lenovo Group Ltd. | 166,000 | | $ 244,685 |
MTR Corp. Ltd. | 6 | | 24 |
TOTAL HONG KONG | | 1,127,174 |
India - 4.1% |
Adani Ports & Special Economic Zone | 11,880 | | 55,220 |
AIA Engineering Ltd. (a) | 11,454 | | 175,034 |
Alstom India Ltd. (a) | 33,456 | | 288,744 |
Arvind Mills Ltd. | 22,673 | | 109,937 |
Ashok Leyland Ltd. (a) | 151,723 | | 114,551 |
Aurobindo Pharma Ltd. | 4,624 | | 72,923 |
Balkrishna Industries Ltd. | 4,477 | | 56,183 |
Bharat Heavy Electricals Ltd. | 34,189 | | 142,834 |
Britannia Industries Ltd. (a) | 5,013 | | 124,908 |
Cadila Healthcare Ltd. (a) | 5,877 | | 136,290 |
Cyient Ltd. | 23,108 | | 180,970 |
Dalmia Bharat Ltd. (a) | 18,789 | | 129,210 |
Divi's Laboratories Ltd. (a) | 2,762 | | 84,239 |
Godrej Properties Ltd. (a) | 32,434 | | 128,759 |
HDFC Bank Ltd. | 13,874 | | 224,972 |
Hero Motocorp Ltd. | 3,024 | | 151,001 |
Housing Development Finance Corp. Ltd. | 19,966 | | 359,572 |
ICICI Bank Ltd. (a) | 1,252 | | 33,249 |
IndusInd Bank Ltd. (a) | 3,167 | | 38,384 |
Kaveri Seed Co. Ltd. | 5,457 | | 81,993 |
Lupin Ltd. | 5,320 | | 123,176 |
Motherson Sumi Systems Ltd. | 23,324 | | 159,696 |
Pc Jeweller Ltd. (a) | 84,539 | | 332,468 |
Persistent Systems Ltd. | 6,362 | | 134,503 |
Prestige Estates Projects Ltd. | 36,979 | | 135,217 |
Rallis India Ltd. | 29,662 | | 110,720 |
Sun Pharmaceutical Industries Ltd. | 8,197 | | 112,806 |
Supreme Industries Ltd. (a) | 10,222 | | 101,246 |
Tata Motors Ltd. (a) | 26,686 | | 233,146 |
Tech Mahindra Ltd. | 2,949 | | 120,885 |
Torrent Pharmaceuticals Ltd. | 3,496 | | 50,211 |
UPL Ltd. | 21,571 | | 122,105 |
Voltas Ltd. (a) | 51,574 | | 210,898 |
TOTAL INDIA | | 4,636,050 |
Indonesia - 0.8% |
Kimia Farma Tbk PT | 1,419,400 | | 135,920 |
Common Stocks - continued |
| Shares | | Value |
Indonesia - continued |
PT Bank Central Asia Tbk | 148,300 | | $ 160,096 |
PT Bank Rakyat Indonesia Tbk | 136,400 | | 124,996 |
PT Kalbe Farma Tbk | 63,100 | | 8,909 |
PT Pakuwon Jati Tbk | 4,700,400 | | 175,041 |
PT Pembangunan Perumahan Persero Tbk | 751,200 | | 163,505 |
Wijaya Karya Beton Tbk PT | 1,558,600 | | 148,873 |
TOTAL INDONESIA | | 917,340 |
Ireland - 1.0% |
Accenture PLC Class A | 1,600 | | 129,792 |
C&C Group PLC | 65,100 | | 289,936 |
Jazz Pharmaceuticals PLC (a) | 4,400 | | 742,896 |
TOTAL IRELAND | | 1,162,624 |
Israel - 0.6% |
Sarine Technologies Ltd. | 83,000 | | 192,485 |
Teva Pharmaceutical Industries Ltd. sponsored ADR | 8,900 | | 502,583 |
TOTAL ISRAEL | | 695,068 |
Japan - 6.5% |
Alps Electric Co. Ltd. | 14,400 | | 245,105 |
Asahi Co. Ltd. | 24,700 | | 274,635 |
ASAHI INTECC Co. Ltd. | 5,400 | | 247,477 |
Asics Corp. | 12,600 | | 295,053 |
Astellas Pharma, Inc. | 14,000 | | 217,287 |
Broadleaf Co. Ltd. | 17,200 | | 271,849 |
Hitachi Metals Ltd. | 14,000 | | 236,359 |
Jamco Corp. | 15,300 | | 338,068 |
Japan Aviation Electronics Industry Ltd. | 12,000 | | 237,754 |
KDDI Corp. | 2,200 | | 144,473 |
Keyence Corp. | 600 | | 290,750 |
Kinugawa Rubber Industrial Co. Ltd. | 37,000 | | 156,832 |
Koito Manufacturing Co. Ltd. | 9,700 | | 292,283 |
Koshidaka Holdings Co. Ltd. | 11,600 | | 198,081 |
Minebea Ltd. | 12,000 | | 164,429 |
Misumi Group, Inc. | 28,700 | | 905,596 |
Mitsubishi Electric Corp. | 49,000 | | 631,796 |
NEC Corp. | 253,000 | | 894,704 |
Pigeon Corp. | 3,100 | | 193,246 |
San-Ai Oil Co. Ltd. | 20,000 | | 138,442 |
Common Stocks - continued |
| Shares | | Value |
Japan - continued |
SMS Co., Ltd. | 9,300 | | $ 261,696 |
Tsuruha Holdings, Inc. | 11,300 | | 667,161 |
TOTAL JAPAN | | 7,303,076 |
Kenya - 0.5% |
Co. Operative Bank of Kenya Ltd. | 745,000 | | 176,984 |
Equity Bank Ltd. (a) | 357,800 | | 204,000 |
Safaricom Ltd. | 1,000,500 | | 136,457 |
TOTAL KENYA | | 517,441 |
Korea (South) - 2.0% |
AfreecaTV Co. Ltd. | 4,794 | | 130,732 |
AMOREPACIFIC Corp. | 24 | | 51,375 |
Chong Kun Dang Pharmaceutical Corp. | 1,396 | | 92,378 |
Cosmax Bti, Inc. | 2,610 | | 123,887 |
Coway Co. Ltd. | 1,535 | | 116,577 |
EO Technics Co. Ltd. | 1,000 | | 102,751 |
Hansae Co. Ltd. | 2,914 | | 99,263 |
Hanssem Co. Ltd. | 1,175 | | 139,432 |
Huons Co. Ltd. | 2,102 | | 126,185 |
JVM Co. Ltd. (a) | 2,299 | | 124,531 |
Koh Young Technology, Inc. | 5,026 | | 154,366 |
Medy-Tox, Inc. | 1,216 | | 282,484 |
PSK, Inc. | 7,475 | | 102,965 |
Suheung Capsule Co. Ltd. | 1,599 | | 88,400 |
SundayToz Corp. | 13,570 | | 253,859 |
Vieworks Co. Ltd. | 4,687 | | 157,914 |
Youngone Corp. | 2,487 | | 147,908 |
TOTAL KOREA (SOUTH) | | 2,295,007 |
Liberia - 0.2% |
Royal Caribbean Cruises Ltd. | 4,000 | | 271,880 |
Malaysia - 1.2% |
Berjaya Auto Bhd | 136,200 | | 145,412 |
Cahya Mata Sarawak Bhd | 81,500 | | 107,365 |
IJM Corp. Bhd | 59,800 | | 125,681 |
IJM Land Bhd | 123,300 | | 128,823 |
Matrix Concepts Holdings Bhd | 128,850 | | 117,555 |
Multi-Purpose Holdings Bhd (a) | 130,000 | | 95,245 |
My E.G.Services Bhd | 219,900 | | 272,911 |
Common Stocks - continued |
| Shares | | Value |
Malaysia - continued |
Scientex Bhd | 94,600 | | $ 205,597 |
TIME dotCom Bhd (a) | 73,400 | | 115,541 |
TOTAL MALAYSIA | | 1,314,130 |
Marshall Islands - 0.3% |
StealthGas, Inc. (a) | 35,900 | | 301,560 |
Mexico - 0.6% |
Corporacion Inmobiliaria Vesta S.A.B. de CV | 64,000 | | 140,488 |
Fibra Uno Administracion SA de CV | 34,700 | | 120,595 |
Grupo Aeroportuario del Pacifico SA de CV Series B | 14,000 | | 95,251 |
Grupo Financiero Interacciones SA de CV | 14,000 | | 114,058 |
Infraestructura Energetica Nova S.A.B. de CV | 17,500 | | 107,109 |
Megacable Holdings S.A.B. de CV unit | 27,200 | | 124,605 |
TOTAL MEXICO | | 702,106 |
Netherlands - 0.3% |
AerCap Holdings NV (a) | 2,600 | | 112,684 |
Unilever NV (Certificaten Van Aandelen) (Bearer) | 6,921 | | 268,247 |
TOTAL NETHERLANDS | | 380,931 |
New Zealand - 0.2% |
Fisher & Paykel Healthcare Corp. | 44,943 | | 195,835 |
Norway - 0.3% |
Marine Harvest ASA | 20,300 | | 287,499 |
Philippines - 0.4% |
Ayala Corp. | 11,890 | | 182,381 |
Megaworld Corp. | 2,544,000 | | 280,576 |
TOTAL PHILIPPINES | | 462,957 |
Poland - 0.5% |
Grupa Kety SA | 2,800 | | 231,692 |
ING Bank Slaski SA | 2,400 | | 99,368 |
Kruk SA (a) | 8,600 | | 275,027 |
TOTAL POLAND | | 606,087 |
Russia - 0.1% |
Magnit OJSC (a) | 536 | | 148,300 |
Singapore - 0.3% |
Religare Health Trust | 368,000 | | 286,102 |
South Africa - 3.2% |
Astral Foods Ltd. | 19,500 | | 267,968 |
AVI Ltd. | 46,900 | | 305,729 |
Common Stocks - continued |
| Shares | | Value |
South Africa - continued |
Capitec Bank Holdings Ltd. | 9,300 | | $ 245,322 |
Clicks Group Ltd. | 16,695 | | 113,674 |
Consolidated Infra Group Ltd. (a) | 64,700 | | 187,241 |
Discovery Holdings Ltd. | 11,500 | | 104,608 |
FirstRand Ltd. | 18,600 | | 79,596 |
Grand Parade Investments Ltd. (a) | 274,300 | | 176,819 |
MMI Holdings Ltd. | 42,400 | | 108,367 |
Mpact Ltd. | 49,651 | | 160,255 |
Mr Price Group Ltd. | 4,700 | | 97,219 |
Netcare Ltd. | 44,000 | | 133,040 |
Peregrine Holdings Ltd. | 129,600 | | 270,133 |
Pioneer Foods Ltd. | 13,000 | | 140,257 |
Quantum Foods Holdings (a) | 13,000 | | 3,595 |
Rand Merchant Insurance Holdings Ltd. | 33,800 | | 120,494 |
Sanlam Ltd. | 40,500 | | 255,747 |
Super Group Ltd. (a) | 35,400 | | 101,324 |
Tiger Brands Ltd. | 9,300 | | 279,605 |
Transaction Capital Ltd. | 212,400 | | 140,576 |
Woolworths Holdings Ltd. | 17,900 | | 127,218 |
Zeder Investments Ltd. | 388,604 | | 204,348 |
TOTAL SOUTH AFRICA | | 3,623,135 |
Sweden - 0.4% |
Betsson AB (B Shares) | 6,000 | | 211,670 |
Fagerhult AB | 10,548 | | 194,271 |
TOTAL SWEDEN | | 405,941 |
Switzerland - 0.9% |
Comet Holding AG | 486 | | 323,781 |
Lonza Group AG | 3,922 | | 431,679 |
Nestle SA | 3,743 | | 274,490 |
TOTAL SWITZERLAND | | 1,029,950 |
Taiwan - 0.6% |
Advanced Semiconductor Engineering, Inc. | 24,000 | | 28,907 |
Aerospace Industries Development Corp. (a) | 65,000 | | 71,656 |
Hota Industrial Manufacturing Co. Ltd. | 42,000 | | 75,138 |
Makalot Industrial Co. Ltd. | 16,000 | | 83,581 |
Novatek Microelectronics Corp. | 22,000 | | 113,696 |
San Shing Fastech Corp. | 40,600 | | 105,439 |
Common Stocks - continued |
| Shares | | Value |
Taiwan - continued |
Topoint Technology Co. Ltd. | 89,903 | | $ 85,354 |
Vanguard International Semiconductor Corp. | 74,000 | | 111,003 |
TOTAL TAIWAN | | 674,774 |
Thailand - 1.3% |
Charoen Pokphand Foods PCL (For. Reg.) | 295,600 | | 283,645 |
Demco Public Co. Ltd. | 507,500 | | 258,700 |
KCE Electronics PCL | 300 | | 368 |
Major Cineplex Group PCL (For. Reg.) | 121,700 | | 88,909 |
MC Group PCL | 136,400 | | 69,067 |
Samart Telecoms PCL | 417,100 | | 281,693 |
Supalai PCL (For. Reg.) | 169,300 | | 133,967 |
SVI PCL | 1,844,700 | | 300,467 |
TOTAL THAILAND | | 1,416,816 |
Turkey - 0.9% |
Akcansa Cimento A/S | 9,000 | | 57,904 |
Aselsan A/S | 59,000 | | 268,103 |
Soda Sanayii AS | 68,354 | | 126,704 |
Trakya Cam Sanayii A/S | 108,000 | | 141,885 |
Turk Sise ve Cam Fabrikalari A/S | 89,000 | | 135,343 |
Turk Traktor ve Ziraat Makinalari A/S | 8,000 | | 252,311 |
TOTAL TURKEY | | 982,250 |
United Kingdom - 2.5% |
Al Noor Hospitals Group PLC | 4,600 | | 74,984 |
BG Group PLC | 10,000 | | 166,660 |
Cairn Energy PLC (a) | 147,717 | | 342,875 |
Dialog Semiconductor PLC (a) | 9,200 | | 316,125 |
Direct Line Insurance Group PLC | 62,382 | | 275,427 |
Domino's Pizza UK & IRL PLC | 28,500 | | 289,734 |
Hikma Pharmaceuticals PLC | 6,168 | | 186,979 |
National Grid PLC | 12,502 | | 185,529 |
Persimmon PLC | 12,200 | | 285,524 |
Prudential PLC | 8,725 | | 202,036 |
SABMiller PLC | 2,800 | | 157,890 |
SkyePharma PLC (a) | 62,600 | | 350,995 |
Tullow Oil PLC | 31 | | 241 |
TOTAL UNITED KINGDOM | | 2,834,999 |
United States of America - 50.4% |
3M Co. | 1,500 | | 230,655 |
AbbVie, Inc. | 8,100 | | 514,026 |
Common Stocks - continued |
| Shares | | Value |
United States of America - continued |
Abraxas Petroleum Corp. (a) | 110,200 | | $ 455,126 |
Activision Blizzard, Inc. | 7,000 | | 139,650 |
AFLAC, Inc. | 9,400 | | 561,462 |
Agilent Technologies, Inc. | 4,400 | | 243,232 |
Alliance Data Systems Corp. (a) | 2,100 | | 595,035 |
AMN Healthcare Services, Inc. (a) | 56,100 | | 962,115 |
Apogee Enterprises, Inc. | 6,600 | | 289,740 |
Apple, Inc. | 12,700 | | 1,371,602 |
Argan, Inc. | 8,600 | | 299,366 |
Ashford Hospitality Prime, Inc. | 6,300 | | 109,179 |
AutoZone, Inc. (a) | 500 | | 276,760 |
BlackRock, Inc. Class A | 2,600 | | 886,886 |
Boston Scientific Corp. (a) | 40,300 | | 535,184 |
Brocade Communications Systems, Inc. | 22,500 | | 241,425 |
Cadence Design Systems, Inc. (a) | 23,400 | | 420,030 |
Capital One Financial Corp. | 7,200 | | 595,944 |
Cardinal Health, Inc. | 15,700 | | 1,232,136 |
Caterpillar, Inc. | 7,100 | | 720,011 |
CBRE Group, Inc. (a) | 14,200 | | 454,400 |
CDW Corp. | 24,600 | | 758,664 |
Church & Dwight Co., Inc. | 1,900 | | 137,579 |
Citigroup, Inc. | 15,700 | | 840,421 |
City National Corp. | 1,800 | | 141,678 |
Comcast Corp. Class A | 11,200 | | 619,920 |
CRA International, Inc. (a) | 5,000 | | 150,000 |
Cummins, Inc. | 6,000 | | 877,080 |
CVS Health Corp. | 9,400 | | 806,614 |
DaVita HealthCare Partners, Inc. (a) | 7,300 | | 569,911 |
Deere & Co. | 3,300 | | 282,282 |
Dermira, Inc. | 3,500 | | 53,795 |
DineEquity, Inc. | 3,600 | | 320,256 |
DIRECTV (a) | 6,400 | | 555,456 |
DTE Energy Co. | 3,400 | | 279,344 |
E.I. du Pont de Nemours & Co. | 6,900 | | 477,135 |
Electronic Arts, Inc. (a) | 15,000 | | 614,550 |
Enanta Pharmaceuticals, Inc. (a) | 3,200 | | 137,600 |
Enservco Corp. (a)(d) | 37,400 | | 107,712 |
Esterline Technologies Corp. (a) | 3,900 | | 456,729 |
Ethan Allen Interiors, Inc. | 7,400 | | 209,420 |
Facebook, Inc. Class A (a) | 6,200 | | 464,938 |
Farmer Brothers Co. (a) | 22,900 | | 667,764 |
FedEx Corp. | 6,360 | | 1,064,664 |
Common Stocks - continued |
| Shares | | Value |
United States of America - continued |
FelCor Lodging Trust, Inc. | 29,300 | | $ 314,389 |
Ferro Corp. (a) | 42,900 | | 562,848 |
Fidelity National Information Services, Inc. | 15,800 | | 922,562 |
FleetCor Technologies, Inc. (a) | 450 | | 67,752 |
Foot Locker, Inc. | 8,000 | | 448,080 |
G-III Apparel Group Ltd. (a) | 8,100 | | 642,735 |
Generac Holdings, Inc. (a) | 6,400 | | 290,176 |
Gilead Sciences, Inc. (a) | 8,300 | | 929,600 |
Global Payments, Inc. | 16,200 | | 1,304,100 |
Google, Inc. Class C (a) | 1,555 | | 869,369 |
Halliburton Co. | 8,100 | | 446,634 |
Hanesbrands, Inc. | 7,400 | | 781,514 |
Hologic, Inc. (a) | 15,700 | | 411,183 |
Hooker Furniture Corp. | 19,000 | | 290,510 |
Houston Wire & Cable Co. | 15,923 | | 215,916 |
Howard Hughes Corp. (a) | 530 | | 78,111 |
Illinois Tool Works, Inc. | 5,600 | | 509,880 |
Jones Lang LaSalle, Inc. | 5,900 | | 797,739 |
Juniper Networks, Inc. | 5,100 | | 107,457 |
Kroger Co. | 10,100 | | 562,671 |
Ladder Capital Corp. Class A | 14,800 | | 281,052 |
Lakeland Financial Corp. | 7,000 | | 290,080 |
Lennar Corp. Class A | 6,100 | | 262,788 |
Liberty Tax, Inc. (a) | 15,800 | | 598,662 |
Malibu Boats, Inc. Class A (a) | 7,200 | | 134,352 |
Marsh & McLennan Companies, Inc. | 2,700 | | 146,799 |
McGraw Hill Financial, Inc. | 8,400 | | 760,032 |
McKesson Corp. | 6,500 | | 1,322,165 |
MedAssets, Inc. (a) | 19,700 | | 426,702 |
Medtronic, Inc. | 9,800 | | 667,968 |
MRC Global, Inc. (a) | 7,200 | | 151,416 |
Multi-Color Corp. | 7,000 | | 345,100 |
Murphy U.S.A., Inc. (a) | 5,775 | | 330,908 |
NVIDIA Corp. | 11,800 | | 230,572 |
NVR, Inc. (a) | 200 | | 245,516 |
Old Dominion Freight Lines, Inc. (a) | 2,000 | | 145,740 |
Omega Flex, Inc. | 21,700 | | 577,654 |
Omnicare, Inc. | 8,337 | | 555,161 |
Opus Bank | 2,700 | | 71,010 |
PetSmart, Inc. | 4,500 | | 325,575 |
Phillips 66 Co. | 6,800 | | 533,800 |
Polaris Industries, Inc. | 3,100 | | 467,666 |
Common Stocks - continued |
| Shares | | Value |
United States of America - continued |
Praxair, Inc. | 4,300 | | $ 541,757 |
Primerica, Inc. | 10,900 | | 557,535 |
Procter & Gamble Co. | 13,800 | | 1,204,326 |
Providence Service Corp. (a) | 13,400 | | 592,012 |
PulteGroup, Inc. | 18,100 | | 347,339 |
QUALCOMM, Inc. | 2,000 | | 157,020 |
Reinsurance Group of America, Inc. | 3,600 | | 303,300 |
Riverbed Technology, Inc. (a) | 23,000 | | 436,770 |
Ruth's Hospitality Group, Inc. | 53,300 | | 648,661 |
Saia, Inc. (a) | 11,400 | | 558,828 |
SLM Corp. | 47,800 | | 456,490 |
SM Energy Co. | 5,400 | | 304,020 |
Snap-On, Inc. | 4,500 | | 594,630 |
SS&C Technologies Holdings, Inc. (a) | 5,200 | | 251,264 |
Steris Corp. | 14,000 | | 865,200 |
Super Micro Computer, Inc. (a) | 15,800 | | 504,968 |
Sysco Corp. | 7,200 | | 277,488 |
Textron, Inc. | 19,500 | | 809,835 |
TFS Financial Corp. | 18,800 | | 280,872 |
Thermo Fisher Scientific, Inc. | 6,900 | | 811,233 |
Time Warner Cable, Inc. | 1,400 | | 206,094 |
TiVo, Inc. (a) | 3,100 | | 40,455 |
TJX Companies, Inc. | 7,500 | | 474,900 |
Total System Services, Inc. | 16,700 | | 564,293 |
U.S. Bancorp | 4,100 | | 174,660 |
U.S. Physical Therapy, Inc. | 6,500 | | 280,475 |
UMB Financial Corp. | 3,392 | | 202,095 |
Union Pacific Corp. | 6,400 | | 745,280 |
Universal Electronics, Inc. (a) | 2,700 | | 153,603 |
Verizon Communications, Inc. | 8,700 | | 437,175 |
Visa, Inc. Class A | 3,100 | | 748,433 |
Wyndham Worldwide Corp. | 11,500 | | 893,205 |
Yum! Brands, Inc. | 6,400 | | 459,712 |
TOTAL UNITED STATES OF AMERICA | | 57,035,348 |
TOTAL COMMON STOCKS (Cost $101,397,468) |
110,911,008
|
Nonconvertible Preferred Stocks - 0.0% |
| Shares | | Value |
India - 0.0% |
Zee Entertainment Enterprises Ltd.
(Cost $2,240) | 302,169 | | $ 4,241 |
Money Market Funds - 4.6% |
| | | |
Fidelity Cash Central Fund, 0.11% (b) | 5,029,367 | | 5,029,367 |
Fidelity Securities Lending Cash Central Fund, 0.11% (b)(c) | 240,164 | | 240,164 |
TOTAL MONEY MARKET FUNDS (Cost $5,269,531) |
5,269,531
|
TOTAL INVESTMENT PORTFOLIO - 102.7% (Cost $106,669,239) | 116,184,780 |
NET OTHER ASSETS (LIABILITIES) - (2.7)% | | (3,094,159) |
NET ASSETS - 100% | $ 113,090,621 |
Legend |
(a) Non-income producing |
(b) Affiliated fund that is generally available only to investment companies and other accounts managed by Fidelity Investments. The rate quoted is the annualized seven-day yield of the fund at period end. A complete unaudited listing of the fund's holdings as of its most recent quarter end is available upon request. In addition, each Fidelity Central Fund's financial statements, which are not covered by the Fund's Report of Independent Registered Public Accounting Firm, are available on the SEC's website or upon request. |
(c) Investment made with cash collateral received from securities on loan. |
(d) Security or a portion of the security is on loan at period end. |
(e) Security exempt from registration under Rule 144A of the Securities Act of 1933. These securities may be resold in transactions exempt from registration, normally to qualified institutional buyers. At the end of the period, the value of these securities amounted to $276,658 or 0.2% of net assets. |
Affiliated Central Funds |
Information regarding fiscal year to date income earned by the Fund from investments in Fidelity Central Funds is as follows: |
Fund | Income earned |
Fidelity Cash Central Fund | $ 1,274 |
Fidelity Securities Lending Cash Central Fund | 17,377 |
Total | $ 18,651 |
Other Information |
Categorizations in the Schedule of Investments are based on country or territory of incorporation. |
The following is a summary of the inputs used, as of October 31, 2014, involving the Fund's assets and liabilities carried at fair value. The inputs or methodology used for valuing securities may not be an indication of the risk associated with investing in those securities. For more information on valuation inputs, and their aggregation into the levels used in the tables below, please refer to the Investment Valuation section in the accompanying Notes to Financial Statements. |
Valuation Inputs at Reporting Date: |
Description | Total | Level 1 | Level 2 | Level 3 |
Investments in Securities: | | | | |
Equities: | | | | |
Consumer Discretionary | $ 17,526,683 | $ 13,630,948 | $ 3,895,735 | $ - |
Consumer Staples | 9,816,177 | 7,131,770 | 2,684,407 | - |
Energy | 3,728,174 | 3,340,240 | 305,102 | 82,832 |
Financials | 15,167,357 | 11,704,236 | 3,463,121 | - |
Health Care | 19,670,401 | 15,872,290 | 3,798,111 | - |
Industrials | 18,288,536 | 12,487,729 | 5,230,635 | 570,172 |
Information Technology | 20,044,509 | 13,300,098 | 6,744,411 | - |
Materials | 4,075,448 | 2,736,177 | 1,339,271 | - |
Telecommunication Services | 1,331,463 | 573,632 | 757,831 | - |
Utilities | 1,266,501 | 511,345 | 755,156 | - |
Money Market Funds | 5,269,531 | 5,269,531 | - | - |
Total Investments in Securities: | $ 116,184,780 | $ 86,557,996 | $ 28,973,780 | $ 653,004 |
The following is a summary of transfers between Level 1 and Level 2 for the period ended October 31, 2014. Transfers are assumed to have occurred at the beginning of the period, and are primarily attributable to the valuation techniques used for foreign equity securities, as discussed in the accompanying Notes to Financial Statements: |
Transfers | Total |
Level 1 to Level 2 | $ 2,651,414 |
Level 2 to Level 1 | $ 0 |
See accompanying notes which are an integral part of the financial statements.
Annual Report
Statement of Assets and Liabilities
| October 31, 2014 |
| | |
Assets | | |
Investment in securities, at value (including securities loaned of $229,218) - See accompanying schedule: Unaffiliated issuers (cost $101,399,708) | $ 110,915,249 | |
Fidelity Central Funds (cost $5,269,531) | 5,269,531 | |
Total Investments (cost $106,669,239) | | $ 116,184,780 |
Foreign currency held at value (cost $608) | | 649 |
Receivable for investments sold | | 813,423 |
Receivable for fund shares sold | | 116,580 |
Dividends receivable | | 81,509 |
Distributions receivable from Fidelity Central Funds | | 1,292 |
Prepaid expenses | | 342 |
Receivable from investment adviser for expense reductions | | 43,201 |
Other receivables | | 54,910 |
Total assets | | 117,296,686 |
| | |
Liabilities | | |
Payable for investments purchased | $ 3,610,860 | |
Payable for fund shares redeemed | 71,920 | |
Accrued management fee | 79,116 | |
Distribution and service plan fees payable | 29,438 | |
Other affiliated payables | 23,258 | |
Other payables and accrued expenses | 151,309 | |
Collateral on securities loaned, at value | 240,164 | |
Total liabilities | | 4,206,065 |
| | |
Net Assets | | $ 113,090,621 |
Net Assets consist of: | | |
Paid in capital | | $ 104,218,739 |
Undistributed net investment income | | 23,087 |
Accumulated undistributed net realized gain (loss) on investments and foreign currency transactions | | (644,811) |
Net unrealized appreciation (depreciation) on investments and assets and liabilities in foreign currencies | | 9,493,606 |
Net Assets | | $ 113,090,621 |
See accompanying notes which are an integral part of the financial statements.
Annual Report
Financial Statements - continued
Statement of Assets and Liabilities - continued
| October 31, 2014 |
| | |
Calculation of Maximum Offering Price Class A:
Net Asset Value and redemption price per share ($35,986,520 ÷ 2,348,872 shares) | | $ 15.32 |
| | |
Maximum offering price per share (100/94.25 of $15.32) | | $ 16.25 |
Class T:
Net Asset Value and redemption price per share ($20,974,544 ÷ 1,416,376 shares) | | $ 14.81 |
| | |
Maximum offering price per share (100/96.50 of $14.81) | | $ 15.35 |
Class B:
Net Asset Value and offering price per share ($1,223,094 ÷ 88,925 shares)A | | $ 13.75 |
| | |
Class C:
Net Asset Value and offering price per share ($15,747,088 ÷ 1,147,855 shares)A | | $ 13.72 |
| | |
Institutional Class:
Net Asset Value, offering price and redemption price per share ($39,159,375 ÷ 2,459,878 shares) | | $ 15.92 |
A Redemption price per share is equal to net asset value less any applicable contingent deferred sales charge.
See accompanying notes which are an integral part of the financial statements.
Annual Report
Statement of Operations
| Year ended October 31, 2014 |
| | |
Investment Income | | |
Dividends | | $ 1,756,816 |
Income from Fidelity Central Funds | | 18,651 |
Income before foreign taxes withheld | | 1,775,467 |
Less foreign taxes withheld | | (136,598) |
Total income | | 1,638,869 |
| | |
Expenses | | |
Management fee
Basic fee | $ 751,963 | |
Performance adjustment | 83,404 | |
Transfer agent fees | 232,454 | |
Distribution and service plan fees | 351,315 | |
Accounting and security lending fees | 45,327 | |
Custodian fees and expenses | 196,651 | |
Independent trustees' compensation | 435 | |
Registration fees | 64,479 | |
Audit | 84,142 | |
Legal | 373 | |
Miscellaneous | 969 | |
Total expenses before reductions | 1,811,512 | |
Expense reductions | (170,593) | 1,640,919 |
Net investment income (loss) | | (2,050) |
Realized and Unrealized Gain (Loss) Net realized gain (loss) on: | | |
Investment securities: | | |
Unaffiliated issuers | 16,716,357 | |
Foreign currency transactions | (66,575) | |
Total net realized gain (loss) | | 16,649,782 |
Change in net unrealized appreciation (depreciation) on: Investment securities | (4,084,197) | |
Assets and liabilities in foreign currencies | (1,245) | |
Total change in net unrealized appreciation (depreciation) | | (4,085,442) |
Net gain (loss) | | 12,564,340 |
Net increase (decrease) in net assets resulting from operations | | $ 12,562,290 |
See accompanying notes which are an integral part of the financial statements.
Annual Report
Financial Statements - continued
Statement of Changes in Net Assets
| Year ended
October 31,
2014 | Year ended
October 31,
2013 |
Increase (Decrease) in Net Assets | | |
Operations | | |
Net investment income (loss) | $ (2,050) | $ 230,594 |
Net realized gain (loss) | 16,649,782 | 16,749,024 |
Change in net unrealized appreciation (depreciation) | (4,085,442) | 6,178,412 |
Net increase (decrease) in net assets resulting
from operations | 12,562,290 | 23,158,030 |
Distributions to shareholders from net investment income | (195,453) | (34,747) |
Distributions to shareholders from net realized gain | (407,917) | - |
Total distributions | (603,370) | (34,747) |
Share transactions - net increase (decrease) | 3,705,620 | (1,761,053) |
Redemption fees | 573 | 649 |
Total increase (decrease) in net assets | 15,665,113 | 21,362,879 |
| | |
Net Assets | | |
Beginning of period | 97,425,508 | 76,062,629 |
End of period (including undistributed net investment income of $23,087 and undistributed net investment income of $195,519, respectively) | $ 113,090,621 | $ 97,425,508 |
See accompanying notes which are an integral part of the financial statements.
Annual Report
Financial Highlights - Class A
Years ended October 31, | 2014 | 2013 | 2012 | 2011 | 2010 |
Selected Per-Share Data | | | | | |
Net asset value, beginning of period | $ 13.64 | $ 10.40 | $ 9.57 | $ 11.41 | $ 9.04 |
Income from Investment Operations | | | | | |
Net investment income (loss) C | .01 | .04 | .02 | (.03) | .01 |
Net realized and unrealized gain (loss) | 1.76 | 3.20 | .81 | (1.76) | 2.47 |
Total from investment operations | 1.77 | 3.24 | .83 | (1.79) | 2.48 |
Distributions from net investment income | (.02) | - | - | - | (.03) |
Distributions from net realized gain | (.06) | - | - | (.05) | (.08) |
Total distributions | (.09) H | - | - | (.05) | (.11) |
Redemption fees added to paid in capital C, G | - | - | - | - | - |
Net asset value, end of period | $ 15.32 | $ 13.64 | $ 10.40 | $ 9.57 | $ 11.41 |
Total Return A, B | 13.03% | 31.15% | 8.67% | (15.81)% | 27.68% |
Ratios to Average Net Assets D, F | | | | | |
Expenses before reductions | 1.62% | 1.38% | 1.43% | 1.51% | 1.89% |
Expenses net of fee waivers, if any | 1.45% | 1.38% | 1.43% | 1.45% | 1.50% |
Expenses net of all reductions | 1.45% | 1.35% | 1.40% | 1.43% | 1.44% |
Net investment income (loss) | .07% | .33% | .22% | (.24)% | .13% |
Supplemental Data | | | | | |
Net assets, end of period (000 omitted) | $ 35,987 | $ 33,694 | $ 26,961 | $ 36,367 | $ 30,383 |
Portfolio turnover rate E | 249% | 211% | 155% | 140% | 179% |
A Total returns would have been lower if certain expenses had not been reduced during the applicable periods shown.
B Total returns do not include the effect of the sales charges.
C Calculated based on average shares outstanding during the period.
D Fees and expenses of any underlying Fidelity Central Funds are not included in the Fund's expense ratio. The Fund indirectly bears its proportionate share of the expenses of any underlying Fidelity Central Funds.
E Amount does not include the portfolio activity of any underlying Fidelity Central Funds.
F Expense ratios reflect operating expenses of the class. Expenses before reductions do not reflect amounts reimbursed by the investment adviser or reductions from brokerage service arrangements or reductions from other expense offset arrangements and do not represent the amount paid by the class during periods when reimbursements or reductions occur. Expenses net of fee waivers reflect expenses after reimbursement by the investment adviser but prior to reductions from brokerage service arrangements or other expense offset arrangements. Expenses net of all reductions represent the net expenses paid by the class.
G Amount represents less than $.01 per share.
H Total distributions of $.09 per share is comprised of distributions from net investment income of $.024 and distributions from net realized gain of $.064 per share.
See accompanying notes which are an integral part of the financial statements.
Annual Report
Financial Highlights - Class T
Years ended October 31, | 2014 | 2013 | 2012 | 2011 | 2010 |
Selected Per-Share Data | | | | | |
Net asset value, beginning of period | $ 13.19 | $ 10.09 | $ 9.31 | $ 11.11 | $ 8.82 |
Income from Investment Operations | | | | | |
Net investment income (loss) C | (.03) | - G | - G | (.05) | (.01) |
Net realized and unrealized gain (loss) | 1.71 | 3.10 | .78 | (1.72) | 2.39 |
Total from investment operations | 1.68 | 3.10 | .78 | (1.77) | 2.38 |
Distributions from net investment income | - | - | - | - | (.01) |
Distributions from net realized gain | (.06) | - | - | (.03) | (.08) |
Total distributions | (.06) | - | - | (.03) | (.09) |
Redemption fees added to paid in capital C, G | - | - | - | - | - |
Net asset value, end of period | $ 14.81 | $ 13.19 | $ 10.09 | $ 9.31 | $ 11.11 |
Total Return A, B | 12.77% | 30.72% | 8.38% | (15.97)% | 27.20% |
Ratios to Average Net Assets D, F | | | | | |
Expenses before reductions | 1.93% | 1.68% | 1.71% | 1.80% | 2.32% |
Expenses net of fee waivers, if any | 1.70% | 1.68% | 1.70% | 1.70% | 1.75% |
Expenses net of all reductions | 1.70% | 1.64% | 1.68% | 1.68% | 1.70% |
Net investment income (loss) | (.17)% | .04% | (.05)% | (.49)% | (.13)% |
Supplemental Data | | | | | |
Net assets, end of period (000 omitted) | $ 20,975 | $ 19,193 | $ 15,731 | $ 24,180 | $ 23,237 |
Portfolio turnover rate E | 249% | 211% | 155% | 140% | 179% |
A Total returns would have been lower if certain expenses had not been reduced during the applicable periods shown.
B Total returns do not include the effect of the sales charges.
C Calculated based on average shares outstanding during the period.
D Fees and expenses of any underlying Fidelity Central Funds are not included in the Fund's expense ratio. The Fund indirectly bears its proportionate share of the expenses of any underlying Fidelity Central Funds.
E Amount does not include the portfolio activity of any underlying Fidelity Central Funds.
F Expense ratios reflect operating expenses of the class. Expenses before reductions do not reflect amounts reimbursed by the investment adviser or reductions from brokerage service arrangements or reductions from other expense offset arrangements and do not represent the amount paid by the class during periods when reimbursements or reductions occur. Expenses net of fee waivers reflect expenses after reimbursement by the investment adviser but prior to reductions from brokerage service arrangements or other expense offset arrangements. Expenses net of all reductions represent the net expenses paid by the class.
G Amount represents less than $.01 per share.
See accompanying notes which are an integral part of the financial statements.
Annual Report
Financial Highlights - Class B
Years ended October 31, | 2014 | 2013 | 2012 | 2011 | 2010 |
Selected Per-Share Data | | | | | |
Net asset value, beginning of period | $ 12.27 | $ 9.43 | $ 8.74 | $ 10.46 | $ 8.31 |
Income from Investment Operations | | | | | |
Net investment income (loss) C | (.09) | (.05) | (.05) | (.10) | (.06) |
Net realized and unrealized gain (loss) | 1.58 | 2.89 | .74 | (1.62) | 2.26 |
Total from investment operations | 1.49 | 2.84 | .69 | (1.72) | 2.20 |
Distributions from net realized gain | (.01) | - | - | - G | (.05) |
Redemption fees added to paid in capital C, G | - | - | - | - | - |
Net asset value, end of period | $ 13.75 | $ 12.27 | $ 9.43 | $ 8.74 | $ 10.46 |
Total Return A, B | 12.11% | 30.12% | 7.89% | (16.42)% | 26.64% |
Ratios to Average Net Assets D, F | | | | | |
Expenses before reductions | 2.44% | 2.17% | 2.19% | 2.32% | 2.82% |
Expenses net of fee waivers, if any | 2.20% | 2.17% | 2.19% | 2.20% | 2.25% |
Expenses net of all reductions | 2.20% | 2.13% | 2.17% | 2.18% | 2.19% |
Net investment income (loss) | (.68)% | (.45)% | (.54)% | (.99)% | (.62)% |
Supplemental Data | | | | | |
Net assets, end of period (000 omitted) | $ 1,223 | $ 1,331 | $ 1,401 | $ 1,926 | $ 2,731 |
Portfolio turnover rate E | 249% | 211% | 155% | 140% | 179% |
A Total returns would have been lower if certain expenses had not been reduced during the applicable periods shown.
B Total returns do not include the effect of the contingent deferred sales charge.
C Calculated based on average shares outstanding during the period.
D Fees and expenses of any underlying Fidelity Central Funds are not included in the Fund's expense ratio. The Fund indirectly bears its proportionate share of the expenses of any underlying Fidelity Central Funds.
E Amount does not include the portfolio activity of any underlying Fidelity Central Funds.
F Expense ratios reflect operating expenses of the class. Expenses before reductions do not reflect amounts reimbursed by the investment adviser or reductions from brokerage service arrangements or reductions from other expense offset arrangements and do not represent the amount paid by the class during periods when reimbursements or reductions occur. Expenses net of fee waivers reflect expenses after reimbursement by the investment adviser but prior to reductions from brokerage service arrangements or other expense offset arrangements. Expenses net of all reductions represent the net expenses paid by the class.
G Amount represents less than $.01 per share.
See accompanying notes which are an integral part of the financial statements.
Annual Report
Financial Highlights - Class C
Years ended October 31, | 2014 | 2013 | 2012 | 2011 | 2010 |
Selected Per-Share Data | | | | | |
Net asset value, beginning of period | $ 12.26 | $ 9.41 | $ 8.73 | $ 10.46 | $ 8.31 |
Income from Investment Operations | | | | | |
Net investment income (loss) C | (.09) | (.05) | (.05) | (.10) | (.06) |
Net realized and unrealized gain (loss) | 1.58 | 2.90 | .73 | (1.61) | 2.27 |
Total from investment operations | 1.49 | 2.85 | .68 | (1.71) | 2.21 |
Distributions from net realized gain | (.03) | - | - | (.02) | (.06) |
Redemption fees added to paid in capital C, G | - | - | - | - | - |
Net asset value, end of period | $ 13.72 | $ 12.26 | $ 9.41 | $ 8.73 | $ 10.46 |
Total Return A, B | 12.13% | 30.29% | 7.79% | (16.38)% | 26.68% |
Ratios to Average Net Assets D, F | | | | | |
Expenses before reductions | 2.40% | 2.16% | 2.18% | 2.28% | 2.77% |
Expenses net of fee waivers, if any | 2.20% | 2.16% | 2.18% | 2.20% | 2.25% |
Expenses net of all reductions | 2.20% | 2.13% | 2.16% | 2.18% | 2.20% |
Net investment income (loss) | (.67)% | (.45)% | (.53)% | (.99)% | (.63)% |
Supplemental Data | | | | | |
Net assets, end of period (000 omitted) | $ 15,747 | $ 13,055 | $ 9,421 | $ 11,632 | $ 7,986 |
Portfolio turnover rate E | 249% | 211% | 155% | 140% | 179% |
A Total returns would have been lower if certain expenses had not been reduced during the applicable periods shown.
B Total returns do not include the effect of the contingent deferred sales charge.
C Calculated based on average shares outstanding during the period.
D Fees and expenses of any underlying Fidelity Central Funds are not included in the Fund's expense ratio. The Fund indirectly bears its proportionate share of the expenses of any underlying Fidelity Central Funds.
E Amount does not include the portfolio activity of any underlying Fidelity Central Funds.
F Expense ratios reflect operating expenses of the class. Expenses before reductions do not reflect amounts reimbursed by the investment adviser or reductions from brokerage service arrangements or reductions from other expense offset arrangements and do not represent the amount paid by the class during periods when reimbursements or reductions occur. Expenses net of fee waivers reflect expenses after reimbursement by the investment adviser but prior to reductions from brokerage service arrangements or other expense offset arrangements. Expenses net of all reductions represent the net expenses paid by the class.
G Amount represents less than $.01 per share.
See accompanying notes which are an integral part of the financial statements.
Annual Report
Financial Highlights - Institutional Class
Years ended October 31, | 2014 | 2013 | 2012 | 2011 | 2010 |
Selected Per-Share Data | | | | | |
Net asset value, beginning of period | $ 14.18 | $ 10.78 | $ 9.88 | $ 11.76 | $ 9.31 |
Income from Investment Operations | | | | | |
Net investment income (loss) B | .05 | .09 | .06 | - F | .04 |
Net realized and unrealized gain (loss) | 1.82 | 3.33 | .84 | (1.82) | 2.54 |
Total from investment operations | 1.87 | 3.42 | .90 | (1.82) | 2.58 |
Distributions from net investment income | (.06) | (.02) | - | - | (.05) |
Distributions from net realized gain | (.06) | - | - | (.06) | (.08) |
Total distributions | (.13) G | (.02) | - | (.06) | (.13) |
Redemption fees added to paid in capital B, F | - | - | - | - | - |
Net asset value, end of period | $ 15.92 | $ 14.18 | $ 10.78 | $ 9.88 | $ 11.76 |
Total Return A | 13.27% | 31.74% | 9.11% | (15.60)% | 28.00% |
Ratios to Average Net Assets C, E | | | | | |
Expenses before reductions | 1.29% | 1.02% | 1.06% | 1.18% | 1.43% |
Expenses net of fee waivers, if any | 1.20% | 1.02% | 1.06% | 1.17% | 1.25% |
Expenses net of all reductions | 1.20% | .99% | 1.03% | 1.15% | 1.19% |
Net investment income (loss) | .33% | .69% | .59% | .04% | .38% |
Supplemental Data | | | | | |
Net assets, end of period (000 omitted) | $ 39,159 | $ 30,153 | $ 22,548 | $ 28,725 | $ 12,936 |
Portfolio turnover rate D | 249% | 211% | 155% | 140% | 179% |
A Total returns would have been lower if certain expenses had not been reduced during the applicable periods shown.
B Calculated based on average shares outstanding during the period.
C Fees and expenses of any underlying Fidelity Central Funds are not included in the Fund's expense ratio. The Fund indirectly bears its proportionate share of the expenses of any underlying Fidelity Central Funds.
D Amount does not include the portfolio activity of any underlying Fidelity Central Funds.
E Expense ratios reflect operating expenses of the class. Expenses before reductions do not reflect amounts reimbursed by the investment adviser or reductions from brokerage service arrangements or reductions from other expense offset arrangements and do not represent the amount paid by the class during periods when reimbursements or reductions occur. Expenses net of fee waivers reflect expenses after reimbursement by the investment adviser but prior to reductions from brokerage service arrangements or other expense offset arrangements. Expenses net of all reductions represent the net expenses paid by the class.
F Amount represents less than $.01 per share.
G Total distributions of $.13 per share is comprised of distributions from net investment income of $.064 and distributions from net realized gain of $.064 per share.
See accompanying notes which are an integral part of the financial statements.
Annual Report
Notes to Financial Statements
For the period ended October 31, 2014
1. Organization.
Fidelity Advisor Global Capital Appreciation Fund (the Fund) is a fund of Fidelity Advisor Series VIII (the Trust) and is authorized to issue an unlimited number of shares. The Trust is registered under the Investment Company Act of 1940, as amended (the 1940 Act), as an open-end management investment company organized as a Massachusetts business trust. The Fund offers Class A, Class T, Class C and Institutional Class shares, each of which, along with Class B shares, has equal rights as to assets and voting privileges. Class B shares are closed to new accounts and additional purchases, except for exchanges and reinvestments. Each class has exclusive voting rights with respect to matters that affect that class. Class B shares will automatically convert to Class A shares after a holding period of seven years from the initial date of purchase. The Fund's investments in emerging markets can be subject to social, economic, regulatory, and political uncertainties and can be extremely volatile.
2. Investments in Fidelity Central Funds.
The Fund invests in Fidelity Central Funds, which are open-end investment companies generally available only to other investment companies and accounts managed by the investment adviser and its affiliates. The Fund's Schedule of Investments lists each of the Fidelity Central Funds held as of period end, if any, as an investment of the Fund, but does not include the underlying holdings of each Fidelity Central Fund. As an Investing Fund, the Fund indirectly bears its proportionate share of the expenses of the underlying Fidelity Central Funds.
The Money Market Central Funds seek preservation of capital and current income and are managed by Fidelity Investments Money Management, Inc. (FIMM), an affiliate of the investment adviser. Annualized expenses of the Money Market Central Funds as of their most recent shareholder report date are less than .01%.
A complete unaudited list of holdings for each Fidelity Central Fund is available upon request or at the Securities and Exchange Commission (the SEC) website at www.sec.gov. In addition, the financial statements of the Fidelity Central Funds, which are not covered by the Fund's Report of Independent Registered Public Accounting Firm, are available on the SEC website or upon request.
3. Significant Accounting Policies.
The financial statements have been prepared in conformity with accounting principles generally accepted in the United States of America (GAAP), which require management to make certain estimates and assumptions at the date of the financial statements. Actual results could differ from those estimates. Subsequent events, if any, through the date that the financial statements were issued have been evaluated in the preparation of
Annual Report
Notes to Financial Statements - continued
3. Significant Accounting Policies - continued
the financial statements. The following summarizes the significant accounting policies of the Fund:
Investment Valuation. Investments are valued as of 4:00 p.m. Eastern time on the last calendar day of the period. In accordance with valuation policies and procedures approved by the Board of Trustees (the Board), the Fund attempts to obtain prices from one or more third party pricing vendors or brokers to value its investments. When current market prices, quotations or currency exchange rates are not readily available or reliable, investments will be fair valued in good faith by the Fidelity Management & Research Company (FMR) Fair Value Committee (the Committee), in accordance with procedures adopted by the Board. Factors used in determining fair value vary by investment type and may include market or investment specific events. The frequency with which these procedures are used cannot be predicted and they may be utilized to a significant extent. The Committee oversees the Fund's valuation policies and procedures and is responsible for approving and reporting to the Board all fair value determinations.
The Fund categorizes the inputs to valuation techniques used to value its investments into a disclosure hierarchy consisting of three levels as shown below:
Level 1 - quoted prices in active markets for identical investments
Level 2 - other significant observable inputs (including quoted prices for similar investments, interest rates, prepayment speeds, etc.)
Level 3 - unobservable inputs (including the Fund's own assumptions based on the best information available)
Valuation techniques used to value the Fund's investments by major category are as follows:
Equity securities, including restricted securities, for which market quotations are readily available, are valued at the last reported sale price or official closing price as reported by a third party pricing vendor on the primary market or exchange on which they are traded and are categorized as Level 1 in the hierarchy. In the event there were no sales during the day or closing prices are not available, securities are valued at the last quoted bid price or may be valued using the last available price and are generally categorized as Level 2 in the hierarchy. For foreign equity securities, when market or security specific events arise, comparisons to the valuation of American Depositary Receipts (ADRs), futures contracts, Exchange-Traded Funds (ETFs) and certain indexes as well as quoted prices for similar securities may be used and would be categorized as Level 2 in the hierarchy. Utilizing these techniques may result in transfers between Level 1 and Level 2. For equity securities, including restricted securities, where observable inputs are
Annual Report
3. Significant Accounting Policies - continued
Investment Valuation - continued
limited, assumptions about market activity and risk are used and these securities may be categorized as Level 3 in the hierarchy.
Investments in open-end mutual funds, including the Fidelity Central Funds, are valued at their closing net asset value (NAV) each business day and are categorized as Level 1 in the hierarchy.
Changes in valuation techniques may result in transfers in or out of an assigned level within the disclosure hierarchy. The aggregate value of investments by input level, as of October 31, 2014, including information on transfers between Levels 1 and 2, is included at the end of the Fund's Schedule of Investments.
Foreign Currency. The Fund may use foreign currency contracts to facilitate transactions in foreign-denominated securities. Gains and losses from these transactions may arise from changes in the value of the foreign currency or if the counterparties do not perform under the contracts' terms.
Foreign-denominated assets, including investment securities, and liabilities are translated into U.S. dollars at the exchange rates at period end. Purchases and sales of investment securities, income and dividends received and expenses denominated in foreign currencies are translated into U.S. dollars at the exchange rate in effect on the transaction date.
The effects of exchange rate fluctuations on investments are included with the net realized and unrealized gain (loss) on investment securities. Other foreign currency transactions resulting in realized and unrealized gain (loss) are disclosed separately.
Investment Transactions and Income. For financial reporting purposes, the Fund's investment holdings and NAV include trades executed through the end of the last business day of the period. The NAV per share for processing shareholder transactions is calculated as of the close of business of the New York Stock Exchange (NYSE), normally 4:00 p.m. Eastern time and includes trades executed through the end of the prior business day. Gains and losses on securities sold are determined on the basis of identified cost and may include proceeds received from litigation. Dividend income is recorded on the ex-dividend date, except for certain dividends from foreign securities where the ex-dividend date may have passed, which are recorded as soon as the Fund is informed of the ex-dividend date. Non-cash dividends included in dividend income, if any, are recorded at the fair market value of the securities received. Income and capital gain distributions from Fidelity Central Funds, if any, are recorded on the ex-dividend date. Distributions received on securities that represent a return of capital or capital gain are recorded as a reduction of cost of investments and/or as a realized gain. Subsequent to
Annual Report
Notes to Financial Statements - continued
3. Significant Accounting Policies - continued
Investment Transactions and Income - continued
ex-dividend date the Fund determines the components of these distributions, based upon receipt of tax filings or other correspondence relating to the underlying investment. Investment income is recorded net of foreign taxes withheld where recovery of such taxes is uncertain.
Class Allocations and Expenses. Investment income, realized and unrealized capital gains and losses, common expenses of the Fund, and certain fund-level expense reductions, if any, are allocated daily on a pro-rata basis to each class based on the relative net assets of each class to the total net assets of the Fund. Each class differs with respect to transfer agent and distribution and service plan fees incurred. Certain expense reductions may also differ by class. For the reporting period, the allocated portion of income and expenses to each class as a percent of its average net assets may vary due to the timing of recording these transactions in relation to fluctuating net assets of the classes. Expenses directly attributable to a fund are charged to that fund. Expenses attributable to more than one fund are allocated among the respective funds on the basis of relative net assets or other appropriate methods. Expense estimates are accrued in the period to which they relate and adjustments are made when actual amounts are known.
Income Tax Information and Distributions to Shareholders. Each year, the Fund intends to qualify as a regulated investment company under Subchapter M of the Internal Revenue Code, including distributing substantially all of its taxable income and realized gains. As a result, no provision for U.S. Federal income taxes is required. As of October 31, 2014, the Fund did not have any unrecognized tax benefits in the financial statements; nor is the Fund aware of any tax positions for which it is reasonably possible that the total amounts of unrecognized tax benefits will significantly change in the next twelve months. The Fund files a U.S. federal tax return, in addition to state and local tax returns as required. The Fund's federal income tax returns are subject to examination by the Internal Revenue Service (IRS) for a period of three fiscal years after they are filed. State and local tax returns may be subject to examination for an additional fiscal year depending on the jurisdiction. Foreign taxes are provided for based on the Fund's understanding of the tax rules and rates that exist in the foreign markets in which it invests.
Distributions are declared and recorded on the ex-dividend date. Income dividends and capital gain distributions are declared separately for each class. Income and capital gain distributions are determined in accordance with income tax regulations, which may differ from GAAP. In addition, the Fund claimed a portion of the payment made to redeeming shareholders as a distribution for income tax purposes.
Capital accounts within the financial statements are adjusted for permanent book-tax differences. These adjustments have no impact on net assets or the results of operations.
Annual Report
3. Significant Accounting Policies - continued
Income Tax Information and Distributions to Shareholders - continued
Capital accounts are not adjusted for temporary book-tax differences which will reverse in a subsequent period.
Book-tax differences are primarily due to foreign currency transactions, passive foreign investment companies (PFIC), partnerships, capital loss carryforwards and losses deferred due to wash sales.
The federal tax cost of investment securities and unrealized appreciation (depreciation) as of period end were as follows:
Gross unrealized appreciation | $ 11,061,915 |
Gross unrealized depreciation | (2,085,278) |
Net unrealized appreciation (depreciation) on securities | $ 8,976,637 |
Tax Cost | $ 107,208,143 |
The tax-based components of distributable earnings as of period end were as follows:
Capital loss carryforward | $ (105,904) |
Net unrealized appreciation (depreciation) on securities and other investments | $ 8,977,790 |
Capital loss carryforwards are only available to offset future capital gains of the Fund to the extent provided by regulations and may be limited. Under the Regulated Investment Company Modernization Act of 2010 (the Act), the Fund is permitted to carry forward capital losses incurred in taxable years beginning after December 22, 2010 for an unlimited period and such capital losses are required to be used prior to any losses that expire. The capital loss carryforward information presented below, including any applicable limitation, is estimated as of fiscal period end and is subject to adjustment.
Fiscal year of expiration | |
2019 | $ (105,904) |
The tax character of distributions paid was as follows:
| October 31, 2014 | October 31, 2013 |
Ordinary Income | $ 603,370 | $ 34,747 |
Short-Term Trading (Redemption) Fees. Shares held by investors in the Fund less than 30 days may have been subject to a redemption fee equal to 1.00% of the NAV of shares redeemed. All redemption fees, which reduce the proceeds of the shareholder redemption, are retained by the Fund and accounted for as an addition to paid in capital.
Annual Report
Notes to Financial Statements - continued
3. Significant Accounting Policies - continued
Restricted Securities. The Fund may invest in securities that are subject to legal or contractual restrictions on resale. These securities generally may be resold in transactions exempt from registration or to the public if the securities are registered. Disposal of these securities may involve time-consuming negotiations and expense, and prompt sale at an acceptable price may be difficult. Information regarding restricted securities is included at the end of the Fund's Schedule of Investments.
New Accounting Pronouncement. In June 2014, the Financial Accounting Standards Board issued Accounting Standard Update No. 2014-11, Repurchase-to-Maturity Transactions, Repurchase Financings, and Disclosures. The Update amends the accounting for certain repurchase agreements and expands disclosure requirements for reverse repurchase agreements, securities lending and other similar transactions. The disclosure requirements are effective for annual and interim reporting periods beginning after December 15, 2014. Management is currently evaluating the impact of the Update on the Fund's financial statements and related disclosures.
4. Purchases and Sales of Investments.
Purchases and sales of securities, other than short-term securities, aggregated $266,922,919 and $265,637,336, respectively.
5. Fees and Other Transactions with Affiliates.
Management Fee. Fidelity Management & Research Company (the investment adviser) and its affiliates provide the Fund with investment management related services for which the Fund pays a monthly management fee. The management fee is the sum of an individual fund fee rate that is based on an annual rate of .45% of the Fund's average net assets and an annualized group fee rate that averaged .25% during the period. The group fee rate is based upon the average net assets of all the mutual funds advised by the investment adviser, including any mutual funds previously advised by the investment adviser that are currently advised by Fidelity SelectCo, LLC, an affiliate of the investment adviser. The group fee rate decreases as assets under management increase and increases as assets under management decrease. In addition, the management fee is subject to a performance adjustment (up to a maximum of ± .20% of the Fund's average net assets over a 36 month performance period). The upward or downward adjustment to the management fee is based on the relative investment performance of the Institutional Class of the Fund as compared to its benchmark index, the MSCI All Country World Index, over the same 36 month performance period. For the reporting period, the total annual management fee rate, including the performance adjustment, was .78% of the Fund's average net assets. The performance adjustment included in the management fee rate may be higher or lower than the maximum performance adjustment rate due to the difference between the average net assets for the reporting and performance periods.
Annual Report
5. Fees and Other Transactions with Affiliates - continued
Distribution and Service Plan Fees. In accordance with Rule 12b-1 of the 1940 Act, the Fund has adopted separate Distribution and Service Plans for each class of shares, except for the Institutional Class. Certain classes pay Fidelity Distributors Corporation (FDC), an affiliate of the investment adviser, separate Distribution and Service Fees, each of which is based on an annual percentage of each class' average net assets. In addition, FDC may pay financial intermediaries for selling shares of the Fund and providing shareholder support services. For the period, the Distribution and Service Fee rates, total fees and amounts retained by FDC were as follows:
| Distribution
Fee | Service
Fee | Total Fees | Retained
by FDC |
Class A | -% | .25% | $ 89,172 | $ 1,095 |
Class T | .25% | .25% | 102,445 | 257 |
Class B | .75% | .25% | 13,323 | 10,012 |
Class C | .75% | .25% | 146,375 | 17,024 |
| | | $ 351,315 | $ 28,388 |
Sales Load. FDC may receive a front-end sales charge of up to 5.75% for selling Class A shares and 3.50% for selling Class T shares, some of which is paid to financial intermediaries for selling shares of the Fund. Depending on the holding period, FDC may receive contingent deferred sales charges levied on Class A, Class T, Class B, and Class C redemptions. The deferred sales charges range from 5.00% to 1.00% for Class B shares, 1.00% for Class C shares, 1.00% for certain purchases of Class A shares and .25% for certain purchases of Class T shares.
For the period, sales charge amounts retained by FDC were as follows:
| Retained
by FDC |
Class A | $ 13,309 |
Class T | 4,742 |
Class B* | 255 |
Class C* | 538 |
| $ 18,844 |
* When Class B and Class C shares are initially sold, FDC pays commissions from its own resources to financial intermediaries through which the sales are made.
Transfer Agent Fees. Fidelity Investments Institutional Operations Company, Inc., (FIIOC), an affiliate of the investment adviser is the transfer, dividend disbursing and shareholder servicing agent for each class of the Fund. FIIOC receives account fees and asset-based fees that vary according to the account size and type of account of the shareholders of the respective classes of the Fund. FIIOC pays for typesetting, printing and mailing of shareholder reports, except proxy statements.
Annual Report
Notes to Financial Statements - continued
5. Fees and Other Transactions with Affiliates - continued
Transfer Agent Fees - continued
For the period, transfer agent fees for each applicable class were as follows:
| Amount | % of
Class-Level Average
Net Assets |
Class A | $ 81,726 | .23 |
Class T | 59,556 | .29 |
Class B | 4,050 | .30 |
Class C | 37,505 | .26 |
Institutional Class | 49,617 | .14 |
| $ 232,454 | |
Accounting and Security Lending Fees. Fidelity Service Company, Inc. (FSC), an affiliate of the investment adviser, maintains the Fund's accounting records. The accounting fee is based on the level of average net assets for each month. Under a separate contract, FSC administers the security lending program. The security lending fee is based on the number and duration of lending transactions.
Brokerage Commissions. The Fund placed a portion of its portfolio transactions with brokerage firms which are affiliates of the investment adviser. Brokerage commissions are included in net realized gain (loss) and change in net unrealized appreciation (depreciation) in the Statement of Operations. The commissions paid to these affiliated firms were $5,300 for the period.
6. Committed Line of Credit.
The Fund participates with other funds managed by the investment adviser or an affiliate in a $4.25 billion credit facility (the "line of credit") to be utilized for temporary or emergency purposes to fund shareholder redemptions or for other short-term liquidity purposes. The Fund has agreed to pay commitment fees on its pro-rata portion of the line of credit, which amounted to $171 and is reflected in Miscellaneous expenses on the Statement of Operations. During the period, the Fund did not borrow on this line of credit.
7. Security Lending.
The Fund lends portfolio securities through a lending agent from time to time in order to earn additional income. For equity securities, a lending agent is used and may loan securities to certain qualified borrowers, including Fidelity Capital Markets (FCM), a broker-dealer affiliated with the Fund. On the settlement date of the loan, the Fund receives collateral (in the form of U.S. Treasury obligations, letters of credit and/or cash) against the loaned securities and maintains collateral in an amount not less than 100% of
Annual Report
7. Security Lending - continued
the market value of the loaned securities during the period of the loan. The market value of the loaned securities is determined at the close of business of the Fund and any additional required collateral is delivered to the Fund on the next business day. If the borrower defaults on its obligation to return the securities loaned because of insolvency or other reasons, the Fund may apply collateral received from the borrower against the obligation. The Fund may experience delays and costs in recovering the securities loaned. Any cash collateral received is invested in the Fidelity Securities Lending Cash Central Fund. The value of loaned securities and cash collateral at period end are disclosed on the Fund's Statement of Assets and Liabilities. Security lending income represents the income earned on investing cash collateral, less rebates paid to borrowers and any lending agent fees associated with the loan, plus any premium payments received for lending certain types of securities. Security lending income is presented in the Statement of Operations as a component of income from Fidelity Central Funds. Total security lending income during the period amounted to $17,377. During the period, there were no securities loaned to FCM.
8. Expense Reductions.
The investment adviser contractually agreed to reimburse each class to the extent annual operating expenses exceeded certain levels of average net assets as noted in the table below. This reimbursement will remain in place through December 31, 2015. Some expenses, for example interest expense, including commitment fees, are excluded from this reimbursement.
The following classes were in reimbursement during the period:
| Expense
Limitations | Reimbursement |
| | |
Class A | 1.45% | $ 59,949 |
Class T | 1.70% | 47,486 |
Class B | 2.20% | 3,223 |
Class C | 2.20% | 29,027 |
Institutional Class | 1.20% | 30,638 |
| | $ 170,323 |
Commissions paid to certain brokers with whom the investment adviser, or its affiliates, places trades on behalf of the Fund include an amount in addition to trade execution, which may be rebated back to the Fund to offset certain expenses. This amount totaled $270 for the period.
Annual Report
Notes to Financial Statements - continued
9. Distributions to Shareholders.
Distributions to shareholders of each class were as follows:
Years ended October 31, | 2014 | 2013 |
From net investment income | | |
Class A | $ 59,620 | $ - |
Institutional Class | 135,833 | 34,747 |
Total | $ 195,453 | $ 34,747 |
From net realized gain | | |
Class A | $ 158,986 | $ - |
Class T | 85,532 | - |
Class B | 537 | - |
Class C | 27,029 | - |
Institutional Class | 135,833 | - |
Total | $ 407,917 | $ - |
10. Share Transactions.
Share transactions for each class were as follows and may contain automatic conversions between classes or exchanges between funds:
| Shares | Dollars |
Years ended October 31, | 2014 | 2013 | 2014 | 2013 |
Class A | | | | |
Shares sold | 591,626 | 373,063 | $ 8,791,852 | $ 4,494,237 |
Reinvestment of distributions | 14,554 | - | 202,003 | - |
Shares redeemed | (726,930) | (496,412) | (10,858,770) | (5,849,205) |
Net increase (decrease) | (120,750) | (123,349) | $ (1,864,915) | $ (1,354,968) |
Class T | | | | |
Shares sold | 191,912 | 216,464 | $ 2,773,971 | $ 2,510,696 |
Reinvestment of distributions | 6,209 | - | 83,505 | - |
Shares redeemed | (236,313) | (321,703) | (3,370,930) | (3,651,942) |
Net increase (decrease) | (38,192) | (105,239) | $ (513,454) | $ (1,141,246) |
Class B | | | | |
Shares sold | 7,695 | 5,625 | $ 100,901 | $ 60,358 |
Reinvestment of distributions | 41 | - | 513 | - |
Shares redeemed | (27,284) | (45,845) | (363,912) | (485,095) |
Net increase (decrease) | (19,548) | (40,220) | $ (262,498) | $ (424,737) |
Class C | | | | |
Shares sold | 308,334 | 323,235 | $ 4,159,482 | $ 3,465,927 |
Reinvestment of distributions | 2,025 | - | 25,331 | - |
Shares redeemed | (227,752) | (258,872) | (3,054,673) | (2,771,491) |
Net increase (decrease) | 82,607 | 64,363 | $ 1,130,140 | $ 694,436 |
Annual Report
10. Share Transactions - continued
| Shares | Dollars |
Years ended October 31, | 2014 | 2013 | 2014 | 2013 |
Institutional Class | | | | |
Shares sold | 494,369 | 283,059 | $ 7,721,563 | $ 3,455,485 |
Reinvestment of distributions | 17,076 | 2,789 | 245,727 | 30,990 |
Shares redeemed | (178,721) | (250,158) | (2,750,943) | (3,021,013) |
Net increase (decrease) | 332,724 | 35,690 | $ 5,216,347 | $ 465,462 |
11. Other.
The Fund's organizational documents provide former and current trustees and officers with a limited indemnification against liabilities arising in connection with the performance of their duties to the Fund. In the normal course of business, the Fund may also enter into contracts that provide general indemnifications. The Fund's maximum exposure under these arrangements is unknown as this would be dependent on future claims that may be made against the Fund. The risk of material loss from such claims is considered remote.
At the end of the period, Strategic Advisers International II Fund was the owner of record of approximately 13% of the total outstanding shares of the Fund.
Annual Report
To the Trustees of Fidelity Advisor Series VIII and the Shareholders of Fidelity Advisor Global Capital Appreciation Fund:
In our opinion, the accompanying statement of assets and liabilities, including the schedule of investments, and the related statements of operations and of changes in net assets and the financial highlights present fairly, in all material respects, the financial position of Fidelity Advisor Global Capital Appreciation Fund (a fund of Fidelity Advisor Series VIII) at October 31, 2014, the results of its operations for the year then ended, the changes in its net assets for each of the two years in the period then ended and the financial highlights for each of the five years in the period then ended in conformity with accounting principles generally accepted in the United States of America. These financial statements and financial highlights (hereafter referred to as "financial statements") are the responsibility of the Fidelity Advisor Global Capital Appreciation Fund's management. Our responsibility is to express an opinion on these financial statements based on our audits. We conducted our audits of these financial statements in accordance with the standards of the Public Company Accounting Oversight Board (United States). Those standards require that we plan and perform the audit to obtain reasonable assurance about whether the financial statements are free of material misstatement. An audit includes examining, on a test basis, evidence supporting the amounts and disclosures in the financial statements, assessing the accounting principles used and significant estimates made by management, and evaluating the overall financial statement presentation. We believe that our audits, which included confirmation of securities at October 31, 2014 by correspondence with the custodian and brokers, provide a reasonable basis for our opinion.
PricewaterhouseCoopers LLP
Boston, Massachusetts
December 22, 2014
Annual Report
The Trustees, Member of the Advisory Board, and officers of the trust and fund, as applicable, are listed below. The Board of Trustees governs the fund and is responsible for protecting the interests of shareholders. The Trustees are experienced executives who meet periodically throughout the year to oversee the fund's activities, review contractual arrangements with companies that provide services to the fund, oversee management of the risks associated with such activities and contractual arrangements, and review the fund's performance. Except for James C. Curvey, each of the Trustees oversees 174 funds. Mr. Curvey oversees 407 funds.
The Trustees hold office without limit in time except that (a) any Trustee may resign; (b) any Trustee may be removed by written instrument, signed by at least two-thirds of the number of Trustees prior to such removal; (c) any Trustee who requests to be retired or who has become incapacitated by illness or injury may be retired by written instrument signed by a majority of the other Trustees; and (d) any Trustee may be removed at any special meeting of shareholders by a two-thirds vote of the outstanding voting securities of the trust. Each Trustee who is not an interested person (as defined in the 1940 Act) of the trust and the fund (Independent Trustee), shall retire not later than the last day of the calendar year in which his or her 75th birthday occurs. The Independent Trustees may waive this mandatory retirement age policy with respect to individual Trustees. The officers and Advisory Board Member hold office without limit in time, except that any officer and Advisory Board Member may resign or may be removed by a vote of a majority of the Trustees at any regular meeting or any special meeting of the Trustees. Except as indicated, each individual has held the office shown or other offices in the same company for the past five years.
Experience, Skills, Attributes, and Qualifications of the Fund's Trustees. The Governance and Nominating Committee has adopted a statement of policy that describes the experience, qualifications, attributes, and skills that are necessary and desirable for potential Independent Trustee candidates (Statement of Policy). The Board believes that each Trustee satisfied at the time he or she was initially elected or appointed a Trustee, and continues to satisfy, the standards contemplated by the Statement of Policy. The Governance and Nominating Committee also engages professional search firms to help identify potential Independent Trustee candidates who have the experience, qualifications, attributes, and skills consistent with the Statement of Policy. From time to time, additional criteria based on the composition and skills of the current Independent Trustees, as well as experience or skills that may be appropriate in light of future changes to board composition, business conditions, and regulatory or other developments, have also been considered by the professional search firms and the Governance and Nominating Committee. In addition, the Board takes into account the Trustees' commitment and participation in Board and committee meetings, as well as their leadership of standing and ad hoc committees throughout their tenure.
In determining that a particular Trustee was and continues to be qualified to serve as a Trustee, the Board has considered a variety of criteria, none of which, in isolation, was controlling. The Board believes that, collectively, the Trustees have balanced and diverse experience, qualifications, attributes, and skills, which allow the Board to operate effectively in governing the fund and protecting the interests of shareholders. Information about the specific experience, skills, attributes, and qualifications of each Trustee, which in each case led to the Board's conclusion that the Trustee should serve (or continue to serve) as a trustee of the fund, is provided below.
Annual Report
Trustees and Officers - continued
Board Structure and Oversight Function. James C. Curvey is an interested person (as defined in the 1940 Act) and currently serves as Chairman. The Trustees have determined that an interested Chairman is appropriate and benefits shareholders because an interested Chairman has a personal and professional stake in the quality and continuity of services provided to the fund. Independent Trustees exercise their informed business judgment to appoint an individual of their choosing to serve as Chairman, regardless of whether the Trustee happens to be independent or a member of management. The Independent Trustees have determined that they can act independently and effectively without having an Independent Trustee serve as Chairman and that a key structural component for assuring that they are in a position to do so is for the Independent Trustees to constitute a substantial majority for the Board. The Independent Trustees also regularly meet in executive session. Ned C. Lautenbach serves as Chairman of the Independent Trustees and as such (i) acts as a liaison between the Independent Trustees and management with respect to matters important to the Independent Trustees and (ii) with management prepares agendas for Board meetings.
Fidelity funds are overseen by different Boards of Trustees. The fund's Board oversees Fidelity's equity and high income funds and another Board oversees Fidelity's investment-grade bond, money market, and asset allocation funds. The asset allocation funds may invest in Fidelity funds overseen by the fund's Board. The use of separate Boards, each with its own committee structure, allows the Trustees of each group of Fidelity funds to focus on the unique issues of the funds they oversee, including common research, investment, and operational issues. On occasion, the separate Boards establish joint committees to address issues of overlapping consequences for the Fidelity funds overseen by each Board.
The Trustees operate using a system of committees to facilitate the timely and efficient consideration of all matters of importance to the Trustees, the fund, and fund shareholders and to facilitate compliance with legal and regulatory requirements and oversight of the fund's activities and associated risks. The Board, acting through its committees, has charged FMR and its affiliates with (i) identifying events or circumstances the occurrence of which could have demonstrably adverse effects on the fund's business and/or reputation; (ii) implementing processes and controls to lessen the possibility that such events or circumstances occur or to mitigate the effects of such events or circumstances if they do occur; and (iii) creating and maintaining a system designed to evaluate continuously business and market conditions in order to facilitate the identification and implementation processes described in (i) and (ii) above. Because the day-to-day operations and activities of the fund are carried out by or through FMR, its affiliates and other service providers, the fund's exposure to risks is mitigated but not eliminated by the processes overseen by the Trustees. While each of the Board's committees has responsibility for overseeing different aspects of the fund's activities, oversight is exercised primarily through the Operations, Audit, and Compliance Committees. In addition, the Independent Trustees have worked with FMR to enhance the Board's oversight of investment and financial risks, legal and regulatory risks, technology risks, and operational risks, including the development of additional risk reporting to the Board. For example, a working group comprised of Independent Trustees and FMR has worked and continues to work to review the Fidelity funds' valuation-related activities, reporting and risk management. Appropriate personnel, including but not limited to the fund's Chief Compliance Officer (CCO), FMR's internal auditor, the independent accountants, the fund's Treasurer and portfolio management personnel, make periodic reports to the Board's committees, as appropriate, including an annual review of FMR's risk management program for the Fidelity funds. The responsibilities of each standing committee, including their oversight responsibilities, are described further under "Standing Committees of the Fund's Trustees."
Annual Report
The fund's Statement of Additional Information (SAI) includes more information about the Trustees. To request a free copy, call Fidelity at 1-877-208-0098.
Interested Trustees*:
Correspondence intended for each Trustee who is an interested person may be sent to Fidelity Investments, 245 Summer Street, Boston, Massachusetts 02210.
Name, Year of Birth; Principal Occupations and Other Relevant Experience+ |
James C. Curvey (1935) |
Year of Election or Appointment: 2007 Trustee Chairman of the Board of Trustees |
| Mr. Curvey also serves as Trustee of other Fidelity funds. Mr. Curvey is a Director of Fidelity Research & Analysis Co. (2009-present), and Vice Chairman (2007-present) and Director of FMR LLC. In addition, Mr. Curvey serves as an Overseer for the Boston Symphony Orchestra and a member of the board of Artis-Naples, Naples, Florida, and as a Trustee for Brewster Academy, Wolfeboro, New Hampshire. Previously, Mr. Curvey served as a Director of Fidelity Investments Money Management, Inc. (2009-2014), a Director of FMR (2007-2014), and a Director of FMR Co., Inc. (2007-2014). |
Charles S. Morrison (1960) |
Year of Election or Appointment: 2014 Trustee |
| Mr. Morrison also serves as Trustee of other funds. He serves as a Director of Fidelity Investments Money Management, Inc. (FIMM) (2014-present), Director of Fidelity SelectCo, LLC (2014-present), President, Asset Management (2014-present), and is an employee of Fidelity Investments. Previously, Mr. Morrison served as Vice President of Fidelity's Fixed Income and Asset Allocation Funds (2012-2014), President, Fixed Income (2011-2014), Vice President of Fidelity's Money Market Funds (2005-2009), President, Money Market Group Leader of FMR (2009), and Senior Vice President, Money Market Group of FMR (2004-2009). Mr. Morrison also served as Vice President of Fidelity's Bond Funds (2002-2005), certain Balanced Funds (2002-2005), and certain Asset Allocation Funds (2002-2007), and as Senior Vice President (2002-2005) of Fidelity's Bond Division. |
* Trustees have been determined to be "Interested Trustees" by virtue of, among other things, their affiliation with the trust or various entities under common control with FMR.
+ The information above includes each Trustee's principal occupation during the last five years and other information relating to the experience, attributes, and skills relevant to each Trustee's qualifications to serve as a Trustee, which led to the conclusion that each Trustee should serve as a Trustee for the fund.
Annual Report
Independent Trustees:
Correspondence intended for each Independent Trustee (that is, the Trustees other than the Interested Trustees) may be sent to Fidelity Investments, P.O. Box 55235, Boston, Massachusetts 02205-5235.
Name, Year of Birth; Principal Occupations and Other Relevant Experience+ |
Dennis J. Dirks (1948) |
Year of Election or Appointment: 2005 Trustee |
| Mr. Dirks also serves as Trustee of other Fidelity funds. Prior to his retirement in May 2003, Mr. Dirks was Chief Operating Officer and a member of the Board of The Depository Trust & Clearing Corporation (DTCC). He also served as President, Chief Operating Officer, and Board member of The Depository Trust Company (DTC) and President and Board member of the National Securities Clearing Corporation (NSCC). In addition, Mr. Dirks served as Chief Executive Officer and Board member of the Government Securities Clearing Corporation, Chief Executive Officer and Board member of the Mortgage-Backed Securities Clearing Corporation, as a Trustee and a member of the Finance Committee of Manhattan College (2005-2008), and as a Trustee and a member of the Finance Committee of AHRC of Nassau County (2006-2008). Mr. Dirks is a member of the Independent Directors Council (IDC) Governing Council (2010-present) and Board of Directors for The Brookville Center for Children's Services, Inc. (2009-present). |
Alan J. Lacy (1953) |
Year of Election or Appointment: 2008 Trustee |
| Mr. Lacy also serves as Trustee of other Fidelity funds. Mr. Lacy serves as Senior Adviser (2007-present) of Oak Hill Capital Partners, L.P. (private equity). Mr. Lacy also served as Chief Executive Officer (2000-2005) and Vice Chairman (2005-2006) of Sears Holdings Corporation and Sears, Roebuck and Co. (retail). In addition, Mr. Lacy serves as a member of the Board of Directors of Dave & Buster's Entertainment, Inc. (restaurant and entertainment complexes, 2010-present), Earth Fare, Inc. (retail grocery, 2012-present), The Hillman Companies, Inc. (hardware wholesalers, 2010-present), and Bristol-Myers Squibb Company (global pharmaceuticals, 2008-present). Mr. Lacy is a member of the Board of Trustees of The National Parks Conservation Association (2006-present). Previously, Mr. Lacy served as Chairman of the Board of Trustees of the National Parks Conservation Association (2008-2011) and as a member of the Board of Directors for the Western Union Company (global money transfer, 2006-2011). |
Ned C. Lautenbach (1944) |
Year of Election or Appointment: 2000 Trustee Chairman of the Independent Trustees |
| Mr. Lautenbach also serves as Trustee of other Fidelity funds. Mr. Lautenbach currently serves as the Lead Director of the Eaton Corporation Board of Directors (diversified industrial, 1997-present). Mr. Lautenbach is Chairman of the Board of Directors of the Philharmonic Center for the Arts in Naples, Florida (2012-present) and a member of the Council on Foreign Relations (1994-present). Previously, Mr. Lautenbach was a Partner/Advisory Partner at Clayton, Dubilier & Rice, LLC (private equity investment, 1998-2010), as well as a Director of Sony Corporation (2006-2007). |
Joseph Mauriello (1944) |
Year of Election or Appointment: 2008 Trustee |
| Mr. Mauriello also serves as Trustee of other Fidelity funds. Prior to his retirement in January 2006, Mr. Mauriello served in numerous senior management positions including Deputy Chairman and Chief Operating Officer (2004-2005), and Vice Chairman of Financial Services (2002-2004) of KPMG LLP US (professional services, 1965-2005). Mr. Mauriello currently serves as a member of the Board of Directors of XL Group plc. (global insurance and re-insurance, 2006-present). Previously, Mr. Mauriello served as a Director of the Hamilton Funds of the Bank of New York (2006-2007) and of Arcadia Resources Inc. (health care services and products, 2007-2012). |
Robert W. Selander (1950) |
Year of Election or Appointment: 2011 Trustee |
| Mr. Selander also serves as Trustee of other Fidelity funds. Previously, Mr. Selander served as a Member of the Advisory Board of other Fidelity funds (2011), and Executive Vice Chairman (2010), Chief Executive Officer (2009-2010), and President and Chief Executive Officer (1997-2009) of Mastercard, Inc. |
Cornelia M. Small (1944) |
Year of Election or Appointment: 2005 Trustee |
| Ms. Small also serves as Trustee of other Fidelity funds. Ms. Small is a member of the Board of Directors (2009-present) and Chair of the Investment Committee (2010-present) of the Teagle Foundation. Ms. Small also serves on the Investment Committee of the Berkshire Taconic Community Foundation (2008-present). Previously, Ms. Small served as Chairperson (2002-2008) and a member of the Investment Committee and Chairperson (2008-2012) and a member of the Board of Trustees of Smith College. In addition, Ms. Small served as Chief Investment Officer, Director of Global Equity Investments, and a member of the Board of Directors of Scudder, Stevens & Clark and Scudder Kemper Investments. |
William S. Stavropoulos (1939) |
Year of Election or Appointment: 2001 Trustee Vice Chairman of the Independent Trustees |
| Mr. Stavropoulos also serves as Trustee of other Fidelity funds. Mr. Stavropoulos serves as President and Founder of the Michigan Baseball Foundation, the Great Lakes Loons (2007-present). Mr. Stavropoulos is Chairman Emeritus of the Board of Directors of The Dow Chemical Company, where he previously served in numerous senior management positions, including President, CEO (1995-2000; 2002-2004), Chairman of the Executive Committee (2000-2006), and as a member of the Board of Directors (1990-2006). Currently, Mr. Stavropoulos is Chairman of the Board of Directors of Univar Inc. (global distributor of commodity and specialty chemicals), a Director of Teradata Corporation (data warehousing and technology solutions), and Maersk Inc. (industrial conglomerate), and a member of the Advisory Board for Metalmark Capital LLC (private equity investment, 2005-present). Mr. Stavropoulos is an operating advisor to Clayton, Dubilier & Rice, LLC (private equity investment). In addition, Mr. Stavropoulos is a member of the University of Notre Dame Advisory Council for the College of Science, a Trustee of the Rollin L. Gerstacker Foundation, and a Director of the Naples Philharmonic Center for the Arts. Previously, Mr. Stavropoulos served as a Director of Chemical Financial Corporation (bank holding company, 1993-2012) and Tyco International, Ltd. (multinational manufacturing and services, 2007-2012). |
David M. Thomas (1949) |
Year of Election or Appointment: 2008 Trustee |
| Mr. Thomas also serves as Trustee of other Fidelity funds. Mr. Thomas serves as Non-Executive Chairman of the Board of Directors of Fortune Brands Home and Security (home and security products, 2011-present), and as a member of the Board of Directors of Interpublic Group of Companies, Inc. (marketing communication, 2004-present). Previously, Mr. Thomas served as Executive Chairman (2005-2006) and Chairman and Chief Executive Officer (2000-2005) of IMS Health, Inc. (pharmaceutical and healthcare information solutions), and a Director of Fortune Brands, Inc. (consumer products, 2000-2011). |
+ The information above includes each Trustee's principal occupation during the last five years and other information relating to the experience, attributes, and skills relevant to each Trustee's qualifications to serve as a Trustee, which led to the conclusion that each Trustee should serve as a Trustee for the fund.
Advisory Board Member and Officers:
Correspondence intended for each officer and Peter S. Lynch may be sent to Fidelity Investments, 245 Summer Street, Boston, Massachusetts 02210. Officers appear below in alphabetical order.
Name, Year of Birth; Principal Occupation |
Peter S. Lynch (1944) |
Year of Election or Appointment: 2003 Member of the Advisory Board |
| Mr. Lynch also serves as Member of the Advisory Board of other Fidelity funds. Mr. Lynch is Vice Chairman and a Director of FMR and FMR Co., Inc. In addition, Mr. Lynch serves as a Trustee of Boston College and as the Chairman of the Inner-City Scholarship Fund. Previously, Mr. Lynch served on the Special Olympics International Board of Directors (1997-2006). |
Elizabeth Paige Baumann (1968) |
Year of Election or Appointment: 2012 Anti-Money Laundering (AML) Officer |
| Ms. Baumann also serves as AML Officer of other funds. She is Chief AML Officer of FMR LLC (2012-present) and is an employee of Fidelity Investments. Previously, Ms. Baumann served as Vice President and Deputy Anti-Money Laundering Officer (2007-2012). |
William C. Coffey (1969) |
Year of Election or Appointment: 2009 Assistant Secretary |
| Mr. Coffey also serves as Assistant Secretary of other funds. He is Senior Vice President and Deputy General Counsel of FMR LLC (2010-present), and is an employee of Fidelity Investments. Previously, Mr. Coffey served as Vice President and Associate General Counsel of FMR LLC (2005-2009). |
Timothy M. Cohen (1969) |
Year of Election or Appointment: 2014 Vice President of certain Equity Funds |
| Mr. Cohen also serves as Vice President of other funds. Mr. Cohen serves as a Director and Chief Compliance Officer of Fidelity Management & Research (U.K.) Inc. (2013-present) and is an employee of Fidelity Investments. |
Jonathan Davis (1968) |
Year of Election or Appointment: 2010 Assistant Treasurer |
| Mr. Davis also serves as Assistant Treasurer of other funds. Mr. Davis is an employee of Fidelity Investments. Previously, Mr. Davis served as Vice President and Associate General Counsel of FMR LLC (2003-2010). |
Adrien E. Deberghes (1967) |
Year of Election or Appointment: 2008 Deputy Treasurer |
| Mr. Deberghes also serves as an officer of other funds. He is an employee of Fidelity Investments (2008-present). Prior to joining Fidelity Investments, Mr. Deberghes was Senior Vice President of Mutual Fund Administration at State Street Corporation (2007-2008), Senior Director of Mutual Fund Administration at Investors Bank & Trust (2005-2007), and Director of Finance for Dunkin' Brands (2000-2005). |
Stephanie J. Dorsey (1969) |
Year of Election or Appointment: 2010 Assistant Treasurer |
| Ms. Dorsey also serves as an officer of other funds. She is an employee of Fidelity Investments (2008-present) and has served in other fund officer roles. Prior to joining Fidelity Investments, Ms. Dorsey served as Treasurer (2004-2008) of the JPMorgan Mutual Funds and Vice President (2004-2008) of JPMorgan Chase Bank. |
Howard J. Galligan III (1966) |
Year of Election or Appointment: 2014 Chief Financial Officer |
| Mr. Galligan also serves as Chief Financial Officer of other funds. Mr. Galligan serves as President of Fidelity Pricing and Cash Management Services (FPCMS) (2014-present) and as a Director of Strategic Advisers, Inc. (2008-present). Previously, Mr. Galligan served as Chief Administrative Officer of Asset Management (2011-2014) and Chief Operating Officer and Senior Vice President of Investment Support for Strategic Advisers, Inc. (2003-2011). |
Scott C. Goebel (1968) |
Year of Election or Appointment: 2008 Secretary and Chief Legal Officer (CLO) |
| Mr. Goebel serves as Secretary and CLO of other funds. Mr. Goebel also serves as Secretary of Fidelity SelectCo, LLC (2013-present), Fidelity Investments Money Management, Inc. (FIMM) (2010-present) and Fidelity Research and Analysis Company (FRAC) (2010-present); General Counsel, Secretary, and Senior Vice President of FMR (2008-present) and FMR Co., Inc. (2008-present); Chief Legal Officer of Fidelity Management & Research (Hong Kong) Limited (2008-present); and Assistant Secretary of Fidelity Management & Research (Japan) Limited (2008-present) and Fidelity Management & Research (U.K.) Inc. (2008-present). Previously, Mr. Goebel served as Secretary and CLO of other Fidelity funds (2008-2013), Assistant Secretary of FIMM (2008-2010), FRAC (2008-2010), and certain funds (2007-2008); and as Vice President and Secretary of Fidelity Distributors Corporation (FDC) (2005-2007). Mr. Goebel has been employed by FMR LLC or an affiliate since 2001. |
Brian B. Hogan (1964) |
Year of Election or Appointment: 2009 Vice President |
| Mr. Hogan also serves as Trustee or Vice President of other funds. Mr. Hogan serves as a Director of Fidelity SelectCo, LLC (2014-present) and President of FMR's Equity Division (2009-present). Previously, Mr. Hogan served as Senior Vice President, Equity Research of FMR (2006-2009) and as a portfolio manager. |
Chris Maher (1972) |
Year of Election or Appointment: 2013 Assistant Treasurer |
| Mr. Maher serves as Assistant Treasurer of other funds. Mr. Maher is Vice President of Valuation Oversight and is an employee of Fidelity Investments. Previously, Mr. Maher served as Vice President of Asset Management Compliance (2013), Vice President of FMR's Program Management Group (2010-2013), and Vice President of Valuation Oversight (2008-2010). |
Kenneth B. Robins (1969) |
Year of Election or Appointment: 2008 President and Treasurer |
| Mr. Robins also serves as an officer of other funds. Mr. Robins serves as Executive Vice President of Fidelity Investments Money Management, Inc. (FIMM) (2013-present) and is an employee of Fidelity Investments (2004-present). Previously, Mr. Robins served in other fund officer roles. |
Stephen Sadoski (1971) |
Year of Election or Appointment: 2012 Deputy Treasurer |
| Mr. Sadoski also serves as Deputy Treasurer of other funds. He is an employee of Fidelity Investments (2012-present) and has served in another fund officer role. Prior to joining Fidelity Investments, Mr. Sadoski served as an assistant chief accountant in the Division of Investment Management of the Securities and Exchange Commission (SEC) (2009-2012) and as a senior manager at Deloitte & Touche LLP (1997-2009). |
Stacie M. Smith (1974) |
Year of Election or Appointment: 2013 Deputy Treasurer |
| Ms. Smith also serves as an officer of other funds. She is an employee of Fidelity Investments (2009-present) and has served in other fund officer roles. Prior to joining Fidelity Investments, Ms. Smith served as Senior Audit Manager of Ernst & Young LLP (1996-2009). |
Renee Stagnone (1975) |
Year of Election or Appointment: 2013 Deputy Treasurer |
| Ms. Stagnone also serves as Deputy Treasurer of other funds. Ms. Stagnone is an employee of Fidelity Investments. |
Linda J. Wondrack (1964) |
Year of Election or Appointment: 2014 Chief Compliance Officer |
| Ms. Wondrack also serves as Chief Compliance Officer of other funds. Ms. Wondrack is Executive Vice President and head of the Ethics Office and Asset Management Compliance for Fidelity Investments (2012-present). Ms. Wondrack also serves as Chief Compliance Officer of Fidelity SelectCo, LLC (2014-present); Chief Compliance Officer of Impresa Management LLC (2013-present); and Chief Compliance Officer of FMR Co., Inc., Fidelity Investments Money Management, Inc., Fidelity Management & Research (Japan) Limited, Fidelity Management & Research (U.K.) Inc., Fidelity Management & Research (Hong Kong), Fidelity Management & Research Company, Pyramis Global Advisors, LLC, and Strategic Advisers, Inc., Ballyrock Investment Advisors LLC, and Northern Neck Investors LLC (2012-present). Previously, Ms. Wondrack served as Senior Vice President and Chief Compliance Officer for Columbia Management Investment Advisers, LLC (2005-2012); Chief Compliance Officer for certain funds within the Columbia Family of Funds (2007-2012); and Senior Vice President of Compliance Risk Management at Bank of America (2005-2010). |
Joseph F. Zambello (1957) |
Year of Election or Appointment: 2011 Deputy Treasurer |
| Mr. Zambello also serves as Deputy Treasurer of other funds. Mr. Zambello is an employee of Fidelity Investments. Previously, Mr. Zambello served as Vice President of FMR's Program Management Group (2009-2011) and Vice President of the Transfer Agent Oversight Group (2005-2009). |
Annual Report
Class A designates 47%; Class T designates 67%; Class B designates 100%; and Class C designates 100% of the dividends distributed during the fiscal year as qualifying for the dividends-received deduction for corporate shareholders.
Class A, Class T, Class B, and Class C designate 100% of the dividends distributed during the fiscal year as amounts which may be taken into account as a dividend for purposes of the maximum rate under section 1(h)(11) of the Internal Revenue Code.
The amounts per share which represent income derived from sources within, and taxes paid to, foreign countries or possessions of the United States are as follows:
| Pay Date | Income | Taxes |
Class A | 12/09/13 | $0.0976 | $0.0096 |
| | | |
Class T | 12/09/13 | $0.0686 | $0.0096 |
| | | |
Class B | 12/09/13 | $0.0146 | $0.0096 |
| | | |
Class C | 12/09/13 | $0.0346 | $0.0096 |
The fund will notify shareholders in January 2015 of amounts for use in preparing 2014 income tax returns.
Annual Report
Board Approval of Investment Advisory Contracts and Management Fees
Fidelity Advisor Global Capital Appreciation Fund
Each year, the Board of Trustees, including the Independent Trustees (together, the Board), votes on the renewal of the management contract with Fidelity Management & Research Company (FMR) and the sub-advisory agreements (together, the Advisory Contracts) for the fund. The Board, assisted by the advice of fund counsel and Independent Trustees' counsel, requests and considers a broad range of information relevant to the renewal of the Advisory Contracts throughout the year.
The Board meets regularly and, at each of its meetings, covers an extensive agenda of topics and materials and considers factors that are relevant to its annual consideration of the renewal of the fund's Advisory Contracts, including the services and support provided to the fund and its shareholders. The Board has established various standing committees (Committees), each composed of and chaired by Independent Trustees with varying backgrounds, to which the Board has assigned specific subject matter responsibilities in order to enhance effective decision-making by the Board. The Board, acting directly and through its Committees, requests and receives information concerning the annual consideration of the renewal of the fund's Advisory Contracts. The Board also meets as needed to consider matters specifically related to the Board's annual consideration of the renewal of the Advisory Contracts. Members of the Board may also meet with trustees of other Fidelity funds through ad hoc joint committees to discuss certain matters relevant to the Fidelity funds.
At its July 2014 meeting, the Board, including the Independent Trustees, unanimously determined to renew the fund's Advisory Contracts. In reaching its determination, the Board considered all factors it believed relevant, including (i) the nature, extent, and quality of the services to be provided to the fund and its shareholders (including the investment performance of the fund); (ii) the competitiveness of the fund's management fee and total expense ratio relative to peer funds; (iii) the total costs of the services to be provided by and the profits to be realized by Fidelity from its relationship with the fund; (iv) the extent to which economies of scale exist and would be realized as the fund grows; and (v) whether fee levels reflect these economies of scale, if any, for the benefit of fund shareholders. In connection with separate internal corporate reorganizations involving Fidelity Management & Research (U.K.) Inc. (FMR U.K.) and Fidelity Management & Research (Japan) Inc. (FMR Japan), the Board approved certain non-material amendments to the fund's sub-advisory agreements with FMR U.K. and FMR Japan to reflect that, after these reorganizations, FMR Investment Management (UK) Limited and Fidelity Management & Research (Japan) Limited will carry on the business of FMR U.K. and FMR Japan, respectively. The Board noted that no changes to the portfolio managers or to the foreign research or investment advisory services provided to the fund were expected in connection with either reorganization and that the same personnel and resources would continue to be available to the fund at the new entities.
Annual Report
In considering whether to renew the Advisory Contracts for the fund, the Board reached a determination, with the assistance of fund counsel and Independent Trustees' counsel and through the exercise of its business judgment, that the renewal of the Advisory Contracts was in the best interests of the fund and its shareholders and that the compensation payable under the Advisory Contracts was fair and reasonable. The Board's decision to renew the Advisory Contracts was not based on any single factor, but rather was based on a comprehensive consideration of all the information provided to the Board at its meetings throughout the year. The Board, in reaching its determination to renew the Advisory Contracts, was aware that shareholders of the fund have a broad range of investment choices available to them, including a wide choice among funds offered by Fidelity's competitors, and that the fund's shareholders, who have the opportunity to review and weigh the disclosure provided by the fund in its prospectus and other public disclosures, have chosen to invest in this fund, which is part of the Fidelity family of funds.
Nature, Extent, and Quality of Services Provided. The Board considered Fidelity's staffing as it relates to the fund, including the backgrounds of investment personnel of FMR and the sub-advisers (together, the Investment Advisers), and also considered the fund's investment objective, strategies, and related investment philosophy. The Independent Trustees also had discussions with senior management of Fidelity's investment operations and investment groups. The Board considered the structure of the portfolio manager compensation program and whether this structure provides appropriate incentives to act in the best interests of the fund. Additionally, the Board considered the portfolio managers' investments, if any, in the funds that they manage.
Resources Dedicated to Investment Management and Support Services. The Board and the Fund Oversight and Research Committees reviewed the general qualifications and capabilities of Fidelity's investment staff, including its size, education, experience, and resources, as well as Fidelity's approach to recruiting, training, managing, and compensating investment personnel. The Board noted that Fidelity has continued to increase the resources devoted to non-U.S. offices, including expansion of Fidelity's global investment organization. The Board also noted that Fidelity's analysts have extensive resources, tools and capabilities that allow them to conduct sophisticated quantitative and fundamental analysis, as well as credit analysis of issuers, counterparties and guarantors. Further, the Board believes that Fidelity's investment professionals have sufficient access to global information and data so as to provide competitive investment results over time, and that those professionals also have access to sophisticated tools that permit them to assess portfolio construction and risk and performance attribution characteristics continuously, as well as to transmit new information and research conclusions rapidly around the world. Additionally, in its deliberations, the Board considered Fidelity's trading and risk management capabilities and resources and global compliance infrastructure, which are an integral part of the investment management process.
Annual Report
Board Approval of Investment Advisory Contracts and
Management Fees - continued
Shareholder and Administrative Services. The Board considered (i) the nature, extent, quality, and cost of advisory, administrative, and shareholder services performed by the Investment Advisers and their affiliates under the Advisory Contracts and under separate agreements covering transfer agency, pricing and bookkeeping, and securities lending services for the fund; (ii) the nature and extent of the supervision of third party service providers, principally custodians and subcustodians; and (iii) the resources devoted to, and the record of compliance with, the fund's compliance policies and procedures. The Board also reviewed the allocation of fund brokerage, including allocations to brokers affiliated with the Investment Advisers, the use of brokerage commissions to pay fund expenses, and the use of "soft" commission dollars to pay for research services.
The Board noted that the growth of fund assets over time across the complex allows Fidelity to reinvest in the development of services designed to enhance the value or convenience of the Fidelity funds as investment vehicles. These services include 24-hour access to account information and market information through telephone representatives and over the Internet, investor education materials and asset allocation tools, and the expanded availability of Fidelity Investor Centers.
In 2014, the Board formed an ad hoc Committee on Transfer Agency Fees to review the variety of transfer agency fee structures throughout the industry and Fidelity's competitive positioning with respect to industry participants.
Investment in a Large Fund Family. The Board considered the benefits to shareholders of investing in a Fidelity fund, including the benefits of investing in a fund that is part of a large family of funds offering a variety of investment disciplines and providing a large variety of mutual fund investor services. The Board noted that Fidelity had taken, or had made recommendations that resulted in the Fidelity funds taking, a number of actions over the previous year that benefited particular funds, including (i) continuing to dedicate additional resources to investment research and to the support of the senior management team that oversees asset management; (ii) persisting in efforts to enhance Fidelity's global research capabilities; (iii) launching new funds and making other enhancements to meet client needs for income-oriented solutions; (iv) reducing fund expenses for certain index funds; (v) continuing to launch dedicated lower cost underlying funds to meet portfolio construction needs related to expanding underlying fund options for Fidelity funds of funds, specifically for the Freedom Fund product lines; (vi) rationalizing product lines and gaining increased efficiencies through fund mergers; (vii) launching sector-based exchange-traded funds and establishing a new Fidelity adviser to manage sector-based funds and products; (viii) continuing to develop and implement technology to improve security and increase efficiency; (ix) modifying the eligibility criteria for certain share classes to increase their marketability to a portion of the defined contribution plan market; (x) waiving redemption fees for certain qualified fund-of-fund and wrap programs and certain retirement plan transactions; and (xi) launching new Institutional Class shares of certain money market funds to attract and retain assets and to fill a gap in the money market fund lineup.
Annual Report
Investment Performance. The Board considered whether the fund has operated in accordance with its investment objective, as well as its record of compliance with its investment restrictions and its performance history.
The Board took into account discussions with the Investment Advisers about fund investment performance that occur at Board meetings throughout the year. In this regard the Board noted that as part of regularly scheduled fund reviews and other reports to the Board on fund performance, the Board periodically considers annualized return information for the fund, for different time periods, measured against a securities market index ("benchmark index") and a peer group of funds with similar objectives ("peer group"). In its evaluation of fund investment performance, the Board gave particular attention to information indicating changes in performance of certain Fidelity funds for specific time periods and the Investment Advisers' explanations for any overperformance or underperformance.
In addition to reviewing absolute and relative fund performance, the Independent Trustees periodically consider the appropriateness of fund performance metrics in evaluating the results achieved. In general, the Independent Trustees believe that fund performance should be evaluated based on net performance (after fees and expenses) of both the highest performing and lowest performing classes, where applicable, compared to appropriate benchmark indices, over appropriate time periods which may include full market cycles, and compared to peer groups, as applicable, over the same periods, taking into account relevant factors including the following: general market conditions; issuer-specific information; tactical opportunities for investment; and fund cash flows and other factors.
The Independent Trustees recognize that shareholders evaluate performance on a net basis over their own holding periods, for which one-, three-, and five-year periods are often used as a proxy. For this reason, the performance information reviewed by the Board also included net cumulative calendar year total return information for the fund and an appropriate benchmark index and peer group for the most recent one-, three-, and five-year periods, as shown below. Returns are shown compared to the 25th percentile (top of box, 75% beaten) and 75th percentile (bottom of box, 25% beaten) of the peer universe. Returns of the benchmark index are "net MA," i.e., adjusted for tax withholding rates applicable to U.S.-based funds organized as Massachusetts business trusts.
Annual Report
Board Approval of Investment Advisory Contracts and
Management Fees - continued
Fidelity Advisor Global Capital Appreciation Fund

The Board also considered that the fund's management fee is subject to upward or downward adjustment depending upon whether, and to what extent, the fund's investment performance for the performance period exceeds, or is exceeded by, a securities index, thus leading to a performance adjustment for the same period. The Board noted that the performance adjustment provides FMR with a strong economic incentive to seek to achieve superior performance for the fund's shareholders and helps to more closely align the interests of FMR and the fund's shareholders.
Based on its review, the Board concluded that the nature, extent, and quality of services provided to the fund under the Advisory Contracts should benefit the fund's shareholders.
Competitiveness of Management Fee and Total Expense Ratio. The Board considered the fund's management fee and total expense ratio compared to "mapped groups" of competitive funds and classes. Fidelity creates "mapped groups" by combining similar Lipper investment objective categories that have comparable investment mandates. Combining Lipper investment objective categories aids the Board's management fee and total expense ratio comparisons by broadening the competitive group used for comparison and by reducing the number of universes to which various Fidelity funds are compared.
Management Fee. The Board considered two proprietary management fee comparisons for the 12-month periods shown in the chart below. The group of Lipper funds used by the Board for management fee comparisons is referred to below as the "Total Mapped Group." The Total Mapped Group comparison focuses on a fund's standing in terms of gross management fees before expense reimbursements or caps, and without giving effect to the fund's performance adjustment, relative to the total universe of funds with comparable investment mandates, regardless of whether their management fee structures also are comparable. Funds with comparable investment mandates offer exposure to similar types of securities. Funds with comparable management fee structures have similar management fee contractual arrangements (e.g., flat rate charged for advisory services, all-inclusive fee rate, etc.). "TMG %" represents the percentage of funds in the Total Mapped Group that had management fees that were lower than the fund's. For example, a hypothetical TMG % of 20% would mean that 80% of the funds in the Total Mapped Group had higher, and 20% had lower, management fees than the fund. The fund's actual TMG %s are in the chart below. The "Asset-Size Peer Group" (ASPG) comparison focuses on a fund's standing relative to a subset of non-Fidelity funds within the Total Mapped Group that are similar in size and management fee structure. For example, if a fund is in the first quartile of the ASPG, the fund's management fee ranks in the least expensive or lowest 25% of funds in the ASPG. The ASPG represents at least 15% of the funds in the Total Mapped Group with comparable asset size and management fee structures, subject to a minimum of 50 funds (or all funds in the Total Mapped Group if fewer than 50). Additional information, such as the ASPG quartile in which the fund's management fee rate ranked and the impact of the fund's performance adjustment, is also included in the chart and considered by the Board.
Annual Report
Fidelity Advisor Global Capital Appreciation Fund

The Board noted that the fund's management fee rate ranked below the median of its Total Mapped Group and below the median of its ASPG for 2013. The Board also noted the effect of the fund's negative performance adjustment on the fund's management fee ranking.
Annual Report
Board Approval of Investment Advisory Contracts and
Management Fees - continued
The Board also noted that, in August 2013, the ad hoc Committee on Management Fees was formed to conduct an in-depth review of the management fee rates of Fidelity's active equity mutual funds. The Committee focused on the following areas: (i) standard fee structures; (ii) research consumption and trading evolution; (iii) management fee competitiveness/profitability by category; and (iv) factors that drive institutional pricing.
Based on its review, the Board concluded that the fund's management fee is fair and reasonable in light of the services that the fund receives and the other factors considered.
Total Expense Ratio. In its review of each class's total expense ratio, the Board considered the fund's management fee as well as other fund or class expenses, as applicable, such as transfer agent fees, pricing and bookkeeping fees, fund-paid 12b-1 fees, and custodial, legal, and audit fees. The Board also noted the effects of any waivers and reimbursements on fees and expenses, as well as the impact of the fund's performance adjustment. As part of its review, the Board also considered the current and historical total expense ratios of each class of the fund compared to competitive fund median expenses. Each class of the fund is compared to those funds and classes in the Total Mapped Group (used by the Board for management fee comparisons) that have a similar sales load structure.
The Board noted that the total expense ratio of each of Class A and Institutional Class ranked below its competitive median for 2013 and the total expense ratio of each of Class T, Class B, and Class C ranked above its competitive median for 2013. The Board considered that, in general, various factors can affect total expense ratios. The Board noted that the total expense ratio of Class T was above the competitive median primarily because of higher 12b-1 fees on Class T as compared to most competitor funds. Class T has a higher 12b-1 fee, but a lower front-end sales charge, than traditionally priced front-end sales charge classes. The Board considered that Class T is primarily sold load-waived in the retirement plan market where its 0.50% 12b-1 fee is comparable to competing no-load, higher 12b-1 fee classes designed specifically for retirement plans. The Board noted that the fund offers multiple classes, each of which has a different sales load and 12b-1 fee structure, and that the multiple structures are intended to offer a range of pricing options for the intermediary market. The Board also noted that the total expense ratios of the classes vary primarily by the level of their 12b-1 fees, although differences in transfer agent fees may also cause expenses to vary from class to class.
The Board further considered that FMR contractually agreed to reimburse Class A, Class T, Class B, Class C, and Institutional Class of the fund to the extent that total operating expenses (excluding interest, certain taxes, certain securities lending costs, brokerage commissions, extraordinary expenses, and acquired fund fees and expenses, if any), as a percentage of their respective average net assets, exceed 1.45%, 1.70%, 2.20%, 2.20%, and 1.20% through December 31, 2014.
Annual Report
Fees Charged to Other Fidelity Clients. The Board also considered Fidelity fee structures and other information with respect to clients of Fidelity, such as other funds advised or subadvised by Fidelity, pension plan clients, and other institutional clients. The Board noted the findings of the 2013 ad hoc joint committee (created with the board of other Fidelity funds), which reviewed and compared Fidelity's institutional investment advisory business with its business of providing services to the Fidelity funds, including the differences in services provided, fees charged, and costs incurred, as well as competition in their respective marketplaces.
Based on its review of total expense ratios and fees charged to other Fidelity clients, the Board concluded that the total expense ratio of each class of the fund was reasonable, although in some cases above the median of the universe presented for comparison, in light of the services that the fund and its shareholders receive and the other factors considered.
Costs of the Services and Profitability. The Board considered the revenues earned and the expenses incurred by Fidelity in conducting the business of developing, marketing, distributing, managing, administering and servicing the fund and servicing the fund's shareholders. The Board also considered the level of Fidelity's profits in respect of all the Fidelity funds.
On an annual basis, Fidelity presents to the Board Fidelity's profitability for the fund. Fidelity calculates the profitability for each fund, as well as aggregate profitability for groups of Fidelity funds and all Fidelity funds, using a series of detailed revenue and cost allocation methodologies which originate with the books and records of Fidelity on which Fidelity's audited financial statements are based. The Audit Committee of the Board reviews any significant changes from the prior year's methodologies.
PricewaterhouseCoopers LLP (PwC), independent registered public accounting firm and auditor to Fidelity and certain Fidelity funds, has been engaged annually by the Board as part of the Board's assessment of Fidelity's profitability analysis. PwC's engagement includes the review and assessment of the methodologies used by Fidelity in determining the revenues and expenses attributable to Fidelity's mutual fund business, and completion of agreed-upon procedures in respect of the mathematical accuracy of fund profitability and its conformity to established allocation methodologies. After considering PwC's reports issued under the engagement and information provided by Fidelity, the Board concluded that while other allocation methods may also be reasonable, Fidelity's profitability methodologies are reasonable in all material respects.
Annual Report
Board Approval of Investment Advisory Contracts and
Management Fees - continued
The Board also reviewed Fidelity's non-fund businesses and fall-out benefits related to the mutual fund business as well as cases where Fidelity's affiliates may benefit from or be related to the fund's business.
The Board considered the costs of the services provided by and the profits realized by Fidelity in connection with the operation of the fund and was satisfied that the profitability was not excessive in the circumstances.
Economies of Scale. The Board considered whether there have been economies of scale in respect of the management of the Fidelity funds, whether the Fidelity funds (including the fund) have appropriately benefited from any such economies of scale, and whether there is potential for realization of any further economies of scale. The Board considered the extent to which the fund will benefit from economies of scale through increased services to the fund, through waivers or reimbursements, or through fee or expense ratio reductions. The Board also noted that in 2013, it and the boards of other Fidelity funds created an ad hoc committee (the Economies of Scale Committee) to analyze whether Fidelity attains economies of scale in respect of the management and servicing of the Fidelity funds, whether the Fidelity funds have appropriately benefited from such economies of scale, and whether there is potential for realization of any further economies of scale.
The Board recognized that the fund's management contract incorporates a "group fee" structure, which provides for lower group fee rates as total group assets increase, and for higher group fee rates as total group assets decrease (with "group assets" defined to include fund assets under FMR's management plus sector fund assets previously under FMR's management and currently managed by Fidelity SelectCo, LLC). FMR calculates the group fee rates based on a tiered asset "breakpoint" schedule that varies based on asset class. The Board considered that the group fee is designed to deliver the benefits of economies of scale to fund shareholders when total Fidelity fund assets increase, even if assets of any particular fund are unchanged or have declined, because some portion of Fidelity's costs are attributable to services provided to all Fidelity funds, and all funds benefit if those costs can be allocated among more assets. The Board concluded that, given the group fee structure, fund shareholders will benefit from lower management fees as group assets increase at the fund complex level, regardless of whether Fidelity achieves any such economies of scale.
The Board concluded, taking into account the analysis of the Economies of Scale Committee, that economies of scale, if any, are being appropriately shared between fund shareholders and Fidelity.
Additional Information Requested by the Board. In order to develop fully the factual basis for consideration of the Fidelity funds' Advisory Contracts, the Board requested and received additional information on certain topics, including: (i) fund performance trends and Fidelity's long-term strategies for certain funds; (ii) Fidelity's strategic marketing and product lineup goals; (iii) the methodology with respect to competitive fund data and peer group classifications; (iv) the arrangements with, and performance of, certain sub-advisers on behalf of the Fidelity funds, as well as certain proposed participating affiliate arrangements; (v) the realization of fall-out benefits in certain Fidelity business units; (vi) Fidelity's group fee structures, including the rationale for the individual fee rates of certain categories of funds and the definition of group assets; (vii) trends regarding industry use of performance fee structures and the performance adjustment methodologies applicable to the Fidelity funds; (viii) additional competitive analysis regarding the total expenses for certain classes; (ix) fund profitability methodology, including Fidelity's cost allocation methodology, and the impact of certain factors on fund profitability results; and (x) the process by which Fidelity determines sub-advisory fees for funds it advises.
Annual Report
Based on its evaluation of all of the conclusions noted above, and after considering all factors it believed relevant, the Board ultimately concluded that the advisory fee structures are fair and reasonable, and that the fund's Advisory Contracts should be renewed.
Annual Report
Investment Adviser
Fidelity Management & Research Company
Boston, MA
Investment Sub-Advisers
FMR Co., Inc.
Fidelity Management & Research
(U.K.) Inc.
Fidelity Management & Research
(Hong Kong) Limited
Fidelity Management & Research
(Japan) Limited
FIL Investment Advisors
FIL Investment Advisors (UK) Limited
FIL Investments (Japan) Limited
General Distributor
Fidelity Distributors Corporation
Smithfield, RI
Transfer and Service Agents
Fidelity Investments Institutional Operations Company, Inc.
Boston, MA
Fidelity Service Company, Inc.
Boston, MA
Custodian
State Street Bank and Trust Company
Quincy, MA
(Fidelity Investment logo)(registered trademark)
AGLO-UANN-1214
1.784744.111
(Fidelity Investment logo)(registered trademark)
Fidelity Advisor®
Global Capital Appreciation
Fund - Institutional Class
Annual Report
October 31, 2014
(Fidelity Cover Art)
Contents
Performance | (Click Here) | How the fund has done over time. |
Management's Discussion of Fund Performance | (Click Here) | The Portfolio Manager's review of fund performance and strategy. |
Shareholder Expense Example | (Click Here) | An example of shareholder expenses. |
Investment Changes | (Click Here) | A summary of major shifts in the fund's investments over the past six months. |
Investments | (Click Here) | A complete list of the fund's investments with their market values. |
Financial Statements | (Click Here) | Statements of assets and liabilities, operations, and changes in net assets, as well as financial highlights. |
Notes | (Click Here) | Notes to financial statements. |
Report of Independent Registered Public Accounting Firm | (Click Here) | |
Trustees and Officers | (Click Here) | |
Distributions | (Click Here) | |
Board Approval of Investment Advisory Contracts and Management Fees | (Click Here) | |
To view a fund's proxy voting guidelines and proxy voting record for the 12-month period ended June 30, visit http://www.fidelity.com/proxyvotingresults or visit the Securities and Exchange Commission's (SEC) web site at http://www.sec.gov. You may also call 1-877-208-0098 to request a free copy of the proxy voting guidelines.
Standard & Poor's, S&P and S&P 500 are registered service marks of The McGraw-Hill Companies, Inc. and have been licensed for use by Fidelity Distributors Corporation.
Other third-party marks appearing herein are the property of their respective owners.
All other marks appearing herein are registered or unregistered trademarks or service marks of FMR LLC or an affiliated company. © 2014 FMR LLC. All rights reserved.
Annual Report
This report and the financial statements contained herein are submitted for the general information of the shareholders of the fund. This report is not authorized for distribution to prospective investors in the fund unless preceded or accompanied by an effective prospectus.
A fund files its complete schedule of portfolio holdings with the SEC for the first and third quarters of each fiscal year on Form N-Q. Forms N-Q are available on the SEC's web site at http://www.sec.gov. A fund's Forms N-Q may be reviewed and copied at the SEC's Public Reference Room in Washington, DC. Information regarding the operation of the SEC's Public Reference Room may be obtained by calling 1-800-SEC-0330. For a complete list of a fund's portfolio holdings, view the most recent holdings listing, semiannual report, or annual report on Fidelity's web site at http://www.fidelity.com, http://www.advisor.fidelity.com, or http://www.401k.com, as applicable.
NOT FDIC INSURED • MAY LOSE VALUE • NO BANK GUARANTEE
Neither the fund nor Fidelity Distributors Corporation is a bank.
Annual Report
Average annual total return reflects the change in the value of an investment, assuming reinvestment of the class' distributions from dividend income and capital gains (the profits earned upon the sale of securities that have grown in value, if any) and assuming a constant rate of performance each year. The $10,000 table and the fund's returns do not reflect the deduction of taxes that a shareholder would pay on fund distributions or the redemption of fund shares. During periods of reimbursement by Fidelity, a fund's total return will be greater than it would be had the reimbursement not occurred. How a fund did yesterday is no guarantee of how it will do tomorrow.
Average Annual Total Returns
Periods ended October 31, 2014 | Past 1
year | Past 5
years | Past 10
years |
Institutional Class | 13.27% | 11.96% | 6.11% |
$10,000 Over 10 Years
Let's say hypothetically that $10,000 was invested in Fidelity Advisor® Global Capital Appreciation Fund - Institutional Class on October 31, 2004. The chart shows how the value of your investment would have changed, and also shows how the MSCI ACWI (All Country World Index) Index performed over the same period.
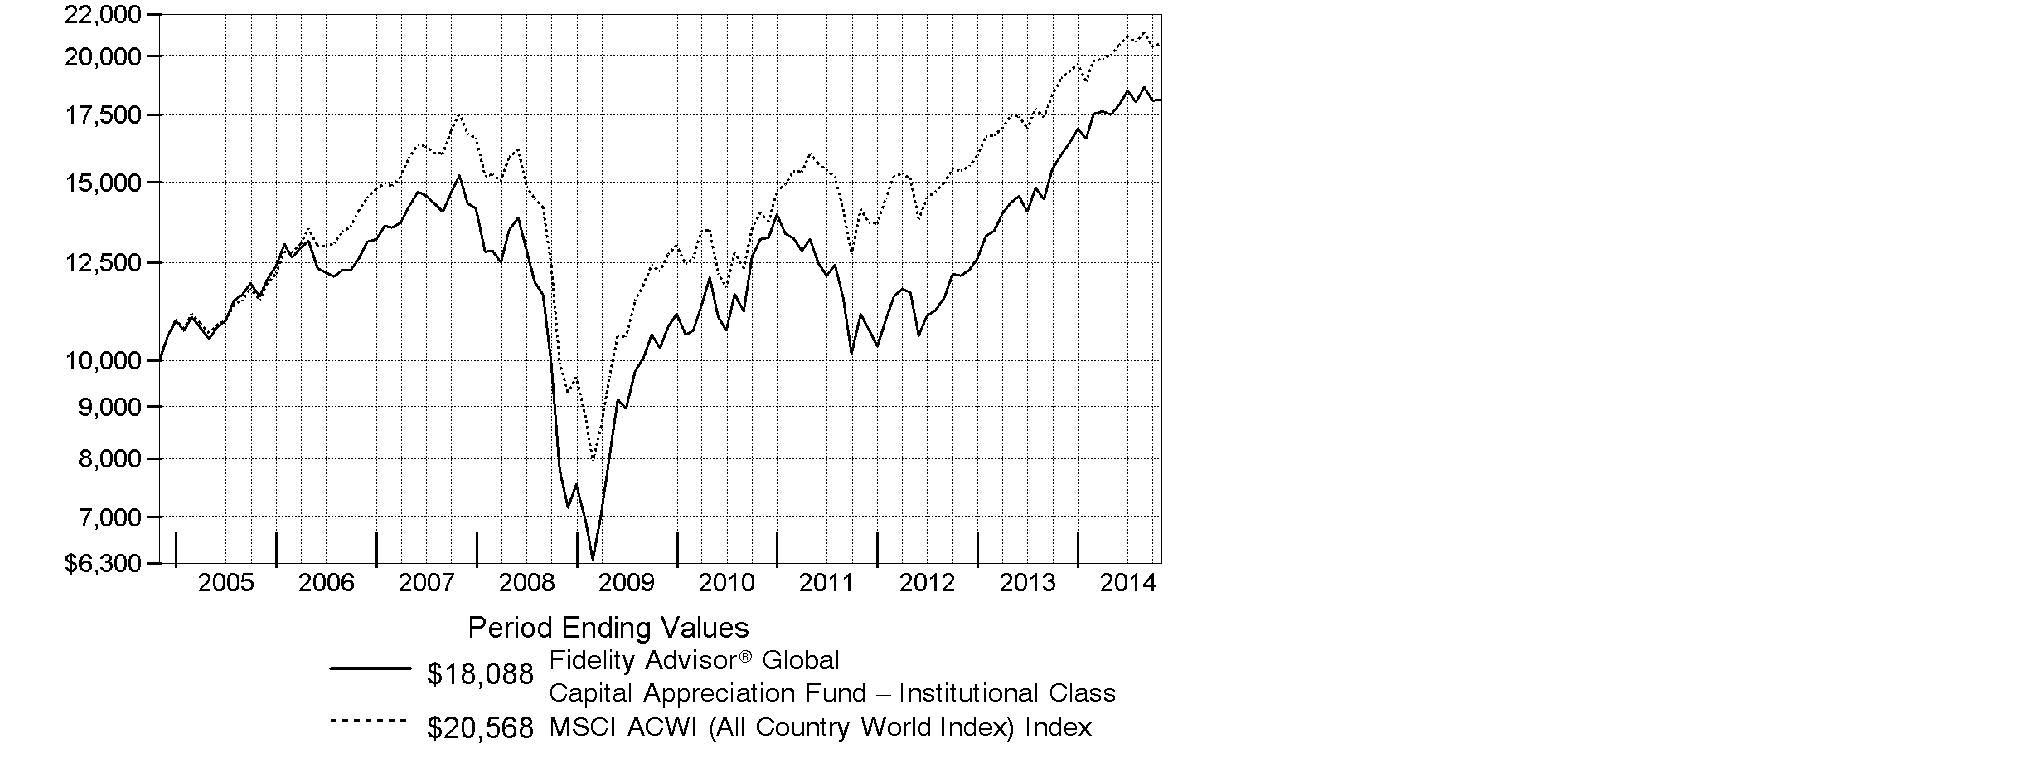
Annual Report
Market Recap: Global equities posted a healthy gain for the 12 months ending October 31, 2014, overcoming an October market decline driven by recessionary pressures in China and tepid growth in Europe. The MSCI ACWI (All Country World Index) Index rose 8.15%, helped by subdued market volatility for much of the period and supported by solid corporate earnings, especially in the United States. Stocks also benefited from easy monetary policies in Japan and the eurozone, as well as increased stimulus efforts in China. All but three of the 24 industry groups that compose the index marked a positive return. The U.S. (+17%) remained a pillar of strength, while a strongly rising dollar in the latter part of the period detracted from investors' returns in most non-U.S. markets. Canada (+5%) notched broad gains outside of its energy and materials sectors, as did Asia-Pacific ex Japan (+4%), led by investor enthusiasm for companies in India. The U.K., Europe and Japan, meanwhile, all underperformed. Among sectors, health care (+24%) led the index, with a strong contribution from the pharmaceuticals, biotechnology & life sciences industry. Information technology (+21%) also outperformed. Conversely, materials (-4%) and energy (-1%) lagged the index due to a higher supply of and lower demand for commodities.
Comments from Thomas Allen, Portfolio Manager of Fidelity Advisor® Global Capital Appreciation Fund: For the year, the fund's Institutional Class shares returned 13.27%, well ahead of the MSCI index. Versus the index, my picks in consumer discretionary, health care and consumer staples were particularly fruitful. Geographically, stock picking in emerging markets worked well, with India and South Korea adding significant value. At the stock level, U.K.-based Quindell, a fast-growing provider of insurance claims outsourcing, was our largest relative contributor. I sold this position for valuation and other reasons. Other key contributors were Super Micro Computer, a supplier of non-branded, customized servers, and India-based Aurobindo Pharma. The first two contributors I mentioned were not part of the index. Conversely, stock selection and a relatively light exposure to the United States, which represented almost half of the index, hampered relative performance. At the stock level, negligible exposure to strong-performing index component Apple detracted the most versus the index. Not owning software giant Microsoft, another solid performer in the index, also hurt.
The views expressed above reflect those of the portfolio manager(s) only through the end of the period as stated on the cover of this report and do not necessarily represent the views of Fidelity or any other person in the Fidelity organization. Any such views are subject to change at any time based upon market or other conditions and Fidelity disclaims any responsibility to update such views. These views may not be relied on as investment advice and, because investment decisions for a Fidelity fund are based on numerous factors, may not be relied on as an indication of trading intent on behalf of any Fidelity fund.
Annual Report
Shareholder Expense Example
As a shareholder of the Fund, you incur two types of costs: (1) transaction costs, including sales charges (loads) on purchase payments or redemption proceeds, redemption fees and (2) ongoing costs, including management fees, distribution and/or service (12b-1) fees and other Fund expenses. This Example is intended to help you understand your ongoing costs (in dollars) of investing in the Fund and to compare these costs with the ongoing costs of investing in other mutual funds.
The Example is based on an investment of $1,000 invested at the beginning of the period and held for the entire period (May 1, 2014 to October 31, 2014).
Actual Expenses
The first line of the accompanying table for each class of the Fund provides information about actual account values and actual expenses. You may use the information in this line, together with the amount you invested, to estimate the expenses that you paid over the period. Simply divide your account value by $1,000.00 (for example, an $8,600 account value divided by $1,000.00 = 8.6), then multiply the result by the number in the first line for a class of the Fund under the heading entitled "Expenses Paid During Period" to estimate the expenses you paid on your account during this period. In addition, the Fund, as a shareholder in the underlying Fidelity Central Funds, will indirectly bear its pro-rata share of the fees and expenses incurred by the underlying Fidelity Central Funds. These fees and expenses are not included in the Fund's annualized expense ratio used to calculate the expense estimate in the table below.
Hypothetical Example for Comparison Purposes
The second line of the accompanying table for each class of the Fund provides information about hypothetical account values and hypothetical expenses based on a Class' actual expense ratio and an assumed rate of return of 5% per year before expenses, which is not the Class' actual return. The hypothetical account values and expenses may not be used to estimate the actual ending account balance or expenses you paid for the period. You may use this information to compare the ongoing costs of investing in the Fund and other funds. To do so, compare this 5% hypothetical example with the 5% hypothetical examples that appear in the shareholder reports of the other funds. In addition, the Fund, as a shareholder in the underlying Fidelity Central Funds, will indirectly bear its pro-rata share of the fees and expenses incurred by the underlying Fidelity Central Funds. These fees and expenses are not included in the Fund's annualized expense ratio used to calculate the expense estimate in the table below.
Please note that the expenses shown in the table are meant to highlight your ongoing costs only and do not reflect any transaction costs. Therefore, the second line of the table is useful in comparing ongoing costs only, and will not help you determine the relative total costs of owning different funds. In addition, if these transactional costs were included, your costs would have been higher.
Annual Report
Shareholder Expense Example - continued
| Annualized
Expense Ratio B | Beginning
Account Value
May 1, 2014 | Ending
Account Value
October 31, 2014 | Expenses Paid
During Period*
May 1, 2014
to October 31, 2014 |
Class A | 1.45% | | | |
Actual | | $ 1,000.00 | $ 1,032.30 | $ 7.43 |
HypotheticalA | | $ 1,000.00 | $ 1,017.90 | $ 7.38 |
Class T | 1.70% | | | |
Actual | | $ 1,000.00 | $ 1,030.60 | $ 8.70 |
HypotheticalA | | $ 1,000.00 | $ 1,016.64 | $ 8.64 |
Class B | 2.20% | | | |
Actual | | $ 1,000.00 | $ 1,027.70 | $ 11.24 |
HypotheticalA | | $ 1,000.00 | $ 1,014.12 | $ 11.17 |
Class C | 2.20% | | | |
Actual | | $ 1,000.00 | $ 1,028.50 | $ 11.25 |
HypotheticalA | | $ 1,000.00 | $ 1,014.12 | $ 11.17 |
Institutional Class | 1.20% | | | |
Actual | | $ 1,000.00 | $ 1,033.80 | $ 6.15 |
HypotheticalA | | $ 1,000.00 | $ 1,019.16 | $ 6.11 |
A 5% return per year before expenses
B Annualized expense ratio reflects expenses net of applicable fee waivers.
* Expenses are equal to each Class' annualized expense ratio, multiplied by the average account value over the period, multiplied by 184/365 (to reflect the one-half year period).
Annual Report
Investment Changes (Unaudited)
Top Five Stocks as of October 31, 2014 |
| % of fund's
net assets | % of fund's net assets
6 months ago |
Apple, Inc. (United States of America, Technology Hardware, Storage & Peripherals) | 1.2 | 0.0 |
McKesson Corp. (United States of America, Health Care Providers & Services) | 1.2 | 0.5 |
Global Payments, Inc. (United States of America, IT Services) | 1.2 | 0.2 |
Cardinal Health, Inc. (United States of America, Health Care Providers & Services) | 1.1 | 0.0 |
Procter & Gamble Co. (United States of America, Household Products) | 1.1 | 0.0 |
| 5.8 | |
Top Five Market Sectors as of October 31, 2014 |
| % of fund's
net assets | % of fund's net assets
6 months ago |
Information Technology | 17.6 | 20.1 |
Health Care | 17.6 | 8.2 |
Industrials | 16.4 | 16.9 |
Consumer Discretionary | 15.6 | 20.4 |
Financials | 13.4 | 10.0 |
Top Five Countries as of October 31, 2014 |
(excluding cash equivalents) | % of fund's
net assets | % of fund's net assets
6 months ago |
United States of America | 50.4 | 39.3 |
Japan | 6.5 | 1.9 |
Cayman Islands | 4.7 | 1.2 |
India | 4.1 | 3.2 |
Canada | 3.6 | 8.9 |
Percentages are adjusted for the effect of open futures contracts, if applicable. |
Asset Allocation (% of fund's net assets) |
As of October 31, 2014 | As of April 30, 2014 |
 | Stocks 98.1% | | | Stocks 96.7% | |
 | Short-Term
Investments and
Net Other Assets
(Liabilities) 1.9% | | | Short-Term
Investments and
Net Other Assets
(Liabilities) 3.3% | |

Annual Report
Investments October 31, 2014
Showing Percentage of Net Assets
Common Stocks - 98.1% |
| Shares | | Value |
Australia - 1.2% |
Altium Ltd. | 101,603 | | $ 275,427 |
Ardent Leisure Group unit | 73,155 | | 200,382 |
Ausdrill Ltd. | 246,041 | | 133,068 |
CSL Ltd. | 4,115 | | 290,531 |
Imdex Ltd. (a) | 192,909 | | 102,147 |
Qube Holdings Ltd. | 85,261 | | 184,436 |
Vocus Communications Ltd. (d) | 41,427 | | 216,124 |
TOTAL AUSTRALIA | | 1,402,115 |
Belgium - 0.3% |
Ion Beam Applications SA (a) | 17,700 | | 308,978 |
Bermuda - 1.5% |
BW LPG Ltd. | 5,394 | | 51,101 |
Cheung Kong Infrastructure Holdings Ltd. | 16,000 | | 116,869 |
China Animal Healthcare Ltd. | 85,000 | | 70,168 |
Luye Pharma Group Ltd. | 193,500 | | 279,284 |
PAX Global Technology Ltd. (a) | 628,000 | | 674,505 |
Sihuan Pharmaceutical Holdings Group Ltd. | 308,000 | | 245,938 |
Silverlake Axis Ltd. Class A | 198,000 | | 209,628 |
TOTAL BERMUDA | | 1,647,493 |
Brazil - 1.4% |
BB Seguridade Participacoes SA | 8,000 | | 106,736 |
Cetip SA - Mercados Organizado | 8,009 | | 101,490 |
Direcional Engenharia SA | 28,800 | | 118,552 |
Embraer SA | 15,500 | | 150,065 |
JBS SA | 50,400 | | 224,755 |
Kepler Weber SA | 6,000 | | 112,595 |
Kroton Educacional SA | 17,400 | | 124,010 |
Minerva SA (a) | 30,200 | | 155,394 |
Natura Cosmeticos SA | 4,800 | | 69,736 |
Qualicorp SA (a) | 9,500 | | 96,614 |
Smiles SA | 13,300 | | 229,727 |
Weg SA | 10,180 | | 120,086 |
TOTAL BRAZIL | | 1,609,760 |
British Virgin Islands - 0.1% |
Epic Gas Ltd. (a) | 15,100 | | 82,832 |
Canada - 3.6% |
AGT Food & Ingredients, Inc. | 8,900 | | 218,660 |
Algonquin Power & Utilities Corp. | 15,300 | | 124,892 |
B2Gold Corp. (a) | 75,500 | | 125,939 |
Common Stocks - continued |
| Shares | | Value |
Canada - continued |
Canadian Natural Resources Ltd. | 6,300 | | $ 219,847 |
Canadian Pacific Railway Ltd. | 1,010 | | 210,083 |
CCL Industries, Inc. Class B | 1,300 | | 131,425 |
Clearwater Seafoods, Inc. | 52,600 | | 523,176 |
Constellation Software, Inc. | 1,100 | | 309,880 |
EnerCare, Inc. | 14,000 | | 184,215 |
Enghouse Systems Ltd. | 5,408 | | 181,666 |
FirstService Corp. (sub. vtg.) | 2,700 | | 142,684 |
Gildan Activewear, Inc. | 4,900 | | 291,900 |
Imperial Oil Ltd. | 2,700 | | 129,915 |
New Gold, Inc. (a) | 13,900 | | 50,442 |
Stantec, Inc. | 2,400 | | 152,064 |
Stella-Jones, Inc. | 9,300 | | 270,076 |
Suncor Energy, Inc. | 12,600 | | 447,409 |
SunOpta, Inc. (a) | 12,200 | | 172,752 |
TransForce, Inc. | 7,700 | | 188,290 |
TOTAL CANADA | | 4,075,315 |
Cayman Islands - 4.7% |
Anta Sports Products Ltd. | 109,000 | | 213,944 |
Chailease Holding Co. Ltd. | 78,000 | | 192,327 |
China Aircraft Leasing Group Holdings Ltd. (a) | 343,500 | | 313,747 |
China Cord Blood Corp. (a) | 20,800 | | 105,872 |
China Pioneer Pharma Hld Ltd. | 343,000 | | 326,170 |
China Shengmu Organic Milk Ltd. (a)(e) | 884,000 | | 276,658 |
Chlitina Holding Ltd. | 13,000 | | 67,777 |
Comba Telecom Systems Holdings Ltd. | 696,850 | | 319,721 |
Consun Pharmaceutical Group Ltd. | 321,000 | | 278,233 |
CT Environmental Group Ltd. | 286,000 | | 305,431 |
EVA Precision Industrial Holdings Ltd. | 1,116,000 | | 298,302 |
Greatview Aseptic Pack Co. Ltd. | 278,000 | | 183,014 |
Nexteer Auto Group Ltd. | 336,000 | | 299,345 |
PW Medtech Group Ltd. (a) | 454,000 | | 286,653 |
Shenzhou International Group Holdings Ltd. | 79,000 | | 272,743 |
Sino Biopharmaceutical Ltd. | 312,000 | | 314,118 |
Sitoy Group Holdings Ltd. | 223,000 | | 183,658 |
Sunny Optical Technology Group Co. Ltd. | 182,000 | | 294,516 |
Tencent Holdings Ltd. | 10,150 | | 163,134 |
The United Laboratories International Holdings Ltd. (a) | 302,000 | | 231,676 |
Want Want China Holdings Ltd. | 105,000 | | 143,385 |
Xinyi Solar Holdings Ltd. | 842,000 | | 284,961 |
TOTAL CAYMAN ISLANDS | | 5,355,385 |
Common Stocks - continued |
| Shares | | Value |
China - 1.0% |
China CITIC Bank Corp. Ltd. (H Shares) | 229,000 | | $ 149,182 |
CSR Corp. Ltd. (H Shares) | 273,000 | | 277,747 |
Harbin Electric Machinery Co. Ltd.(H Shares) | 104,000 | | 62,765 |
PICC Property & Casualty Co. Ltd. (H Shares) | 108,000 | | 198,119 |
Xinjiang Goldwind Science & Technology Co. Ltd. (H Shares) | 103,800 | | 186,292 |
Yantai Changyu Pioneer Wine Co. Ltd. (B Shares) | 4,900 | | 15,398 |
Zhuzhou CSR Times Electric Co. Ltd. (H Shares) | 68,000 | | 292,425 |
TOTAL CHINA | | 1,181,928 |
Denmark - 1.3% |
Ambu A/S Series B | 1,300 | | 91,927 |
Genmab A/S (a) | 7,000 | | 305,127 |
Pandora A/S | 9,500 | | 799,731 |
Royal Unibrew A/S (a) | 1,400 | | 228,639 |
TOTAL DENMARK | | 1,425,424 |
Finland - 0.5% |
Nokia Corp. | 47,200 | | 394,398 |
Valmet Corp. | 18,300 | | 193,322 |
TOTAL FINLAND | | 587,720 |
France - 0.4% |
Korian-Medica | 9,524 | | 343,685 |
Schneider Electric SA | 1,900 | | 149,716 |
Solocal Group SA (a) | 13 | | 8 |
TOTAL FRANCE | | 493,409 |
Germany - 1.0% |
Deutsche Annington Immobilien SE | 4,400 | | 127,205 |
Fresenius SE & Co. KGaA | 2,800 | | 144,037 |
GFT Technologies AG | 20,200 | | 278,830 |
MLP AG | 12,800 | | 64,963 |
Nemetschek AG | 1,500 | | 149,213 |
OSRAM Licht AG (a) | 3,136 | | 109,879 |
Patrizia Immobilien AG | 14,590 | | 196,913 |
Rocket Internet AG (a) | 1,037 | | 55,229 |
TOTAL GERMANY | | 1,126,269 |
Hong Kong - 1.0% |
AIA Group Ltd. | 36,600 | | 204,244 |
BYD Electronic International Co. Ltd. | 279,500 | | 332,514 |
Guangdong Investment Ltd. | 112,000 | | 147,327 |
Guotai Junan International Holdings Ltd. | 284,000 | | 198,380 |
Common Stocks - continued |
| Shares | | Value |
Hong Kong - continued |
Lenovo Group Ltd. | 166,000 | | $ 244,685 |
MTR Corp. Ltd. | 6 | | 24 |
TOTAL HONG KONG | | 1,127,174 |
India - 4.1% |
Adani Ports & Special Economic Zone | 11,880 | | 55,220 |
AIA Engineering Ltd. (a) | 11,454 | | 175,034 |
Alstom India Ltd. (a) | 33,456 | | 288,744 |
Arvind Mills Ltd. | 22,673 | | 109,937 |
Ashok Leyland Ltd. (a) | 151,723 | | 114,551 |
Aurobindo Pharma Ltd. | 4,624 | | 72,923 |
Balkrishna Industries Ltd. | 4,477 | | 56,183 |
Bharat Heavy Electricals Ltd. | 34,189 | | 142,834 |
Britannia Industries Ltd. (a) | 5,013 | | 124,908 |
Cadila Healthcare Ltd. (a) | 5,877 | | 136,290 |
Cyient Ltd. | 23,108 | | 180,970 |
Dalmia Bharat Ltd. (a) | 18,789 | | 129,210 |
Divi's Laboratories Ltd. (a) | 2,762 | | 84,239 |
Godrej Properties Ltd. (a) | 32,434 | | 128,759 |
HDFC Bank Ltd. | 13,874 | | 224,972 |
Hero Motocorp Ltd. | 3,024 | | 151,001 |
Housing Development Finance Corp. Ltd. | 19,966 | | 359,572 |
ICICI Bank Ltd. (a) | 1,252 | | 33,249 |
IndusInd Bank Ltd. (a) | 3,167 | | 38,384 |
Kaveri Seed Co. Ltd. | 5,457 | | 81,993 |
Lupin Ltd. | 5,320 | | 123,176 |
Motherson Sumi Systems Ltd. | 23,324 | | 159,696 |
Pc Jeweller Ltd. (a) | 84,539 | | 332,468 |
Persistent Systems Ltd. | 6,362 | | 134,503 |
Prestige Estates Projects Ltd. | 36,979 | | 135,217 |
Rallis India Ltd. | 29,662 | | 110,720 |
Sun Pharmaceutical Industries Ltd. | 8,197 | | 112,806 |
Supreme Industries Ltd. (a) | 10,222 | | 101,246 |
Tata Motors Ltd. (a) | 26,686 | | 233,146 |
Tech Mahindra Ltd. | 2,949 | | 120,885 |
Torrent Pharmaceuticals Ltd. | 3,496 | | 50,211 |
UPL Ltd. | 21,571 | | 122,105 |
Voltas Ltd. (a) | 51,574 | | 210,898 |
TOTAL INDIA | | 4,636,050 |
Indonesia - 0.8% |
Kimia Farma Tbk PT | 1,419,400 | | 135,920 |
Common Stocks - continued |
| Shares | | Value |
Indonesia - continued |
PT Bank Central Asia Tbk | 148,300 | | $ 160,096 |
PT Bank Rakyat Indonesia Tbk | 136,400 | | 124,996 |
PT Kalbe Farma Tbk | 63,100 | | 8,909 |
PT Pakuwon Jati Tbk | 4,700,400 | | 175,041 |
PT Pembangunan Perumahan Persero Tbk | 751,200 | | 163,505 |
Wijaya Karya Beton Tbk PT | 1,558,600 | | 148,873 |
TOTAL INDONESIA | | 917,340 |
Ireland - 1.0% |
Accenture PLC Class A | 1,600 | | 129,792 |
C&C Group PLC | 65,100 | | 289,936 |
Jazz Pharmaceuticals PLC (a) | 4,400 | | 742,896 |
TOTAL IRELAND | | 1,162,624 |
Israel - 0.6% |
Sarine Technologies Ltd. | 83,000 | | 192,485 |
Teva Pharmaceutical Industries Ltd. sponsored ADR | 8,900 | | 502,583 |
TOTAL ISRAEL | | 695,068 |
Japan - 6.5% |
Alps Electric Co. Ltd. | 14,400 | | 245,105 |
Asahi Co. Ltd. | 24,700 | | 274,635 |
ASAHI INTECC Co. Ltd. | 5,400 | | 247,477 |
Asics Corp. | 12,600 | | 295,053 |
Astellas Pharma, Inc. | 14,000 | | 217,287 |
Broadleaf Co. Ltd. | 17,200 | | 271,849 |
Hitachi Metals Ltd. | 14,000 | | 236,359 |
Jamco Corp. | 15,300 | | 338,068 |
Japan Aviation Electronics Industry Ltd. | 12,000 | | 237,754 |
KDDI Corp. | 2,200 | | 144,473 |
Keyence Corp. | 600 | | 290,750 |
Kinugawa Rubber Industrial Co. Ltd. | 37,000 | | 156,832 |
Koito Manufacturing Co. Ltd. | 9,700 | | 292,283 |
Koshidaka Holdings Co. Ltd. | 11,600 | | 198,081 |
Minebea Ltd. | 12,000 | | 164,429 |
Misumi Group, Inc. | 28,700 | | 905,596 |
Mitsubishi Electric Corp. | 49,000 | | 631,796 |
NEC Corp. | 253,000 | | 894,704 |
Pigeon Corp. | 3,100 | | 193,246 |
San-Ai Oil Co. Ltd. | 20,000 | | 138,442 |
Common Stocks - continued |
| Shares | | Value |
Japan - continued |
SMS Co., Ltd. | 9,300 | | $ 261,696 |
Tsuruha Holdings, Inc. | 11,300 | | 667,161 |
TOTAL JAPAN | | 7,303,076 |
Kenya - 0.5% |
Co. Operative Bank of Kenya Ltd. | 745,000 | | 176,984 |
Equity Bank Ltd. (a) | 357,800 | | 204,000 |
Safaricom Ltd. | 1,000,500 | | 136,457 |
TOTAL KENYA | | 517,441 |
Korea (South) - 2.0% |
AfreecaTV Co. Ltd. | 4,794 | | 130,732 |
AMOREPACIFIC Corp. | 24 | | 51,375 |
Chong Kun Dang Pharmaceutical Corp. | 1,396 | | 92,378 |
Cosmax Bti, Inc. | 2,610 | | 123,887 |
Coway Co. Ltd. | 1,535 | | 116,577 |
EO Technics Co. Ltd. | 1,000 | | 102,751 |
Hansae Co. Ltd. | 2,914 | | 99,263 |
Hanssem Co. Ltd. | 1,175 | | 139,432 |
Huons Co. Ltd. | 2,102 | | 126,185 |
JVM Co. Ltd. (a) | 2,299 | | 124,531 |
Koh Young Technology, Inc. | 5,026 | | 154,366 |
Medy-Tox, Inc. | 1,216 | | 282,484 |
PSK, Inc. | 7,475 | | 102,965 |
Suheung Capsule Co. Ltd. | 1,599 | | 88,400 |
SundayToz Corp. | 13,570 | | 253,859 |
Vieworks Co. Ltd. | 4,687 | | 157,914 |
Youngone Corp. | 2,487 | | 147,908 |
TOTAL KOREA (SOUTH) | | 2,295,007 |
Liberia - 0.2% |
Royal Caribbean Cruises Ltd. | 4,000 | | 271,880 |
Malaysia - 1.2% |
Berjaya Auto Bhd | 136,200 | | 145,412 |
Cahya Mata Sarawak Bhd | 81,500 | | 107,365 |
IJM Corp. Bhd | 59,800 | | 125,681 |
IJM Land Bhd | 123,300 | | 128,823 |
Matrix Concepts Holdings Bhd | 128,850 | | 117,555 |
Multi-Purpose Holdings Bhd (a) | 130,000 | | 95,245 |
My E.G.Services Bhd | 219,900 | | 272,911 |
Common Stocks - continued |
| Shares | | Value |
Malaysia - continued |
Scientex Bhd | 94,600 | | $ 205,597 |
TIME dotCom Bhd (a) | 73,400 | | 115,541 |
TOTAL MALAYSIA | | 1,314,130 |
Marshall Islands - 0.3% |
StealthGas, Inc. (a) | 35,900 | | 301,560 |
Mexico - 0.6% |
Corporacion Inmobiliaria Vesta S.A.B. de CV | 64,000 | | 140,488 |
Fibra Uno Administracion SA de CV | 34,700 | | 120,595 |
Grupo Aeroportuario del Pacifico SA de CV Series B | 14,000 | | 95,251 |
Grupo Financiero Interacciones SA de CV | 14,000 | | 114,058 |
Infraestructura Energetica Nova S.A.B. de CV | 17,500 | | 107,109 |
Megacable Holdings S.A.B. de CV unit | 27,200 | | 124,605 |
TOTAL MEXICO | | 702,106 |
Netherlands - 0.3% |
AerCap Holdings NV (a) | 2,600 | | 112,684 |
Unilever NV (Certificaten Van Aandelen) (Bearer) | 6,921 | | 268,247 |
TOTAL NETHERLANDS | | 380,931 |
New Zealand - 0.2% |
Fisher & Paykel Healthcare Corp. | 44,943 | | 195,835 |
Norway - 0.3% |
Marine Harvest ASA | 20,300 | | 287,499 |
Philippines - 0.4% |
Ayala Corp. | 11,890 | | 182,381 |
Megaworld Corp. | 2,544,000 | | 280,576 |
TOTAL PHILIPPINES | | 462,957 |
Poland - 0.5% |
Grupa Kety SA | 2,800 | | 231,692 |
ING Bank Slaski SA | 2,400 | | 99,368 |
Kruk SA (a) | 8,600 | | 275,027 |
TOTAL POLAND | | 606,087 |
Russia - 0.1% |
Magnit OJSC (a) | 536 | | 148,300 |
Singapore - 0.3% |
Religare Health Trust | 368,000 | | 286,102 |
South Africa - 3.2% |
Astral Foods Ltd. | 19,500 | | 267,968 |
AVI Ltd. | 46,900 | | 305,729 |
Common Stocks - continued |
| Shares | | Value |
South Africa - continued |
Capitec Bank Holdings Ltd. | 9,300 | | $ 245,322 |
Clicks Group Ltd. | 16,695 | | 113,674 |
Consolidated Infra Group Ltd. (a) | 64,700 | | 187,241 |
Discovery Holdings Ltd. | 11,500 | | 104,608 |
FirstRand Ltd. | 18,600 | | 79,596 |
Grand Parade Investments Ltd. (a) | 274,300 | | 176,819 |
MMI Holdings Ltd. | 42,400 | | 108,367 |
Mpact Ltd. | 49,651 | | 160,255 |
Mr Price Group Ltd. | 4,700 | | 97,219 |
Netcare Ltd. | 44,000 | | 133,040 |
Peregrine Holdings Ltd. | 129,600 | | 270,133 |
Pioneer Foods Ltd. | 13,000 | | 140,257 |
Quantum Foods Holdings (a) | 13,000 | | 3,595 |
Rand Merchant Insurance Holdings Ltd. | 33,800 | | 120,494 |
Sanlam Ltd. | 40,500 | | 255,747 |
Super Group Ltd. (a) | 35,400 | | 101,324 |
Tiger Brands Ltd. | 9,300 | | 279,605 |
Transaction Capital Ltd. | 212,400 | | 140,576 |
Woolworths Holdings Ltd. | 17,900 | | 127,218 |
Zeder Investments Ltd. | 388,604 | | 204,348 |
TOTAL SOUTH AFRICA | | 3,623,135 |
Sweden - 0.4% |
Betsson AB (B Shares) | 6,000 | | 211,670 |
Fagerhult AB | 10,548 | | 194,271 |
TOTAL SWEDEN | | 405,941 |
Switzerland - 0.9% |
Comet Holding AG | 486 | | 323,781 |
Lonza Group AG | 3,922 | | 431,679 |
Nestle SA | 3,743 | | 274,490 |
TOTAL SWITZERLAND | | 1,029,950 |
Taiwan - 0.6% |
Advanced Semiconductor Engineering, Inc. | 24,000 | | 28,907 |
Aerospace Industries Development Corp. (a) | 65,000 | | 71,656 |
Hota Industrial Manufacturing Co. Ltd. | 42,000 | | 75,138 |
Makalot Industrial Co. Ltd. | 16,000 | | 83,581 |
Novatek Microelectronics Corp. | 22,000 | | 113,696 |
San Shing Fastech Corp. | 40,600 | | 105,439 |
Common Stocks - continued |
| Shares | | Value |
Taiwan - continued |
Topoint Technology Co. Ltd. | 89,903 | | $ 85,354 |
Vanguard International Semiconductor Corp. | 74,000 | | 111,003 |
TOTAL TAIWAN | | 674,774 |
Thailand - 1.3% |
Charoen Pokphand Foods PCL (For. Reg.) | 295,600 | | 283,645 |
Demco Public Co. Ltd. | 507,500 | | 258,700 |
KCE Electronics PCL | 300 | | 368 |
Major Cineplex Group PCL (For. Reg.) | 121,700 | | 88,909 |
MC Group PCL | 136,400 | | 69,067 |
Samart Telecoms PCL | 417,100 | | 281,693 |
Supalai PCL (For. Reg.) | 169,300 | | 133,967 |
SVI PCL | 1,844,700 | | 300,467 |
TOTAL THAILAND | | 1,416,816 |
Turkey - 0.9% |
Akcansa Cimento A/S | 9,000 | | 57,904 |
Aselsan A/S | 59,000 | | 268,103 |
Soda Sanayii AS | 68,354 | | 126,704 |
Trakya Cam Sanayii A/S | 108,000 | | 141,885 |
Turk Sise ve Cam Fabrikalari A/S | 89,000 | | 135,343 |
Turk Traktor ve Ziraat Makinalari A/S | 8,000 | | 252,311 |
TOTAL TURKEY | | 982,250 |
United Kingdom - 2.5% |
Al Noor Hospitals Group PLC | 4,600 | | 74,984 |
BG Group PLC | 10,000 | | 166,660 |
Cairn Energy PLC (a) | 147,717 | | 342,875 |
Dialog Semiconductor PLC (a) | 9,200 | | 316,125 |
Direct Line Insurance Group PLC | 62,382 | | 275,427 |
Domino's Pizza UK & IRL PLC | 28,500 | | 289,734 |
Hikma Pharmaceuticals PLC | 6,168 | | 186,979 |
National Grid PLC | 12,502 | | 185,529 |
Persimmon PLC | 12,200 | | 285,524 |
Prudential PLC | 8,725 | | 202,036 |
SABMiller PLC | 2,800 | | 157,890 |
SkyePharma PLC (a) | 62,600 | | 350,995 |
Tullow Oil PLC | 31 | | 241 |
TOTAL UNITED KINGDOM | | 2,834,999 |
United States of America - 50.4% |
3M Co. | 1,500 | | 230,655 |
AbbVie, Inc. | 8,100 | | 514,026 |
Common Stocks - continued |
| Shares | | Value |
United States of America - continued |
Abraxas Petroleum Corp. (a) | 110,200 | | $ 455,126 |
Activision Blizzard, Inc. | 7,000 | | 139,650 |
AFLAC, Inc. | 9,400 | | 561,462 |
Agilent Technologies, Inc. | 4,400 | | 243,232 |
Alliance Data Systems Corp. (a) | 2,100 | | 595,035 |
AMN Healthcare Services, Inc. (a) | 56,100 | | 962,115 |
Apogee Enterprises, Inc. | 6,600 | | 289,740 |
Apple, Inc. | 12,700 | | 1,371,602 |
Argan, Inc. | 8,600 | | 299,366 |
Ashford Hospitality Prime, Inc. | 6,300 | | 109,179 |
AutoZone, Inc. (a) | 500 | | 276,760 |
BlackRock, Inc. Class A | 2,600 | | 886,886 |
Boston Scientific Corp. (a) | 40,300 | | 535,184 |
Brocade Communications Systems, Inc. | 22,500 | | 241,425 |
Cadence Design Systems, Inc. (a) | 23,400 | | 420,030 |
Capital One Financial Corp. | 7,200 | | 595,944 |
Cardinal Health, Inc. | 15,700 | | 1,232,136 |
Caterpillar, Inc. | 7,100 | | 720,011 |
CBRE Group, Inc. (a) | 14,200 | | 454,400 |
CDW Corp. | 24,600 | | 758,664 |
Church & Dwight Co., Inc. | 1,900 | | 137,579 |
Citigroup, Inc. | 15,700 | | 840,421 |
City National Corp. | 1,800 | | 141,678 |
Comcast Corp. Class A | 11,200 | | 619,920 |
CRA International, Inc. (a) | 5,000 | | 150,000 |
Cummins, Inc. | 6,000 | | 877,080 |
CVS Health Corp. | 9,400 | | 806,614 |
DaVita HealthCare Partners, Inc. (a) | 7,300 | | 569,911 |
Deere & Co. | 3,300 | | 282,282 |
Dermira, Inc. | 3,500 | | 53,795 |
DineEquity, Inc. | 3,600 | | 320,256 |
DIRECTV (a) | 6,400 | | 555,456 |
DTE Energy Co. | 3,400 | | 279,344 |
E.I. du Pont de Nemours & Co. | 6,900 | | 477,135 |
Electronic Arts, Inc. (a) | 15,000 | | 614,550 |
Enanta Pharmaceuticals, Inc. (a) | 3,200 | | 137,600 |
Enservco Corp. (a)(d) | 37,400 | | 107,712 |
Esterline Technologies Corp. (a) | 3,900 | | 456,729 |
Ethan Allen Interiors, Inc. | 7,400 | | 209,420 |
Facebook, Inc. Class A (a) | 6,200 | | 464,938 |
Farmer Brothers Co. (a) | 22,900 | | 667,764 |
FedEx Corp. | 6,360 | | 1,064,664 |
Common Stocks - continued |
| Shares | | Value |
United States of America - continued |
FelCor Lodging Trust, Inc. | 29,300 | | $ 314,389 |
Ferro Corp. (a) | 42,900 | | 562,848 |
Fidelity National Information Services, Inc. | 15,800 | | 922,562 |
FleetCor Technologies, Inc. (a) | 450 | | 67,752 |
Foot Locker, Inc. | 8,000 | | 448,080 |
G-III Apparel Group Ltd. (a) | 8,100 | | 642,735 |
Generac Holdings, Inc. (a) | 6,400 | | 290,176 |
Gilead Sciences, Inc. (a) | 8,300 | | 929,600 |
Global Payments, Inc. | 16,200 | | 1,304,100 |
Google, Inc. Class C (a) | 1,555 | | 869,369 |
Halliburton Co. | 8,100 | | 446,634 |
Hanesbrands, Inc. | 7,400 | | 781,514 |
Hologic, Inc. (a) | 15,700 | | 411,183 |
Hooker Furniture Corp. | 19,000 | | 290,510 |
Houston Wire & Cable Co. | 15,923 | | 215,916 |
Howard Hughes Corp. (a) | 530 | | 78,111 |
Illinois Tool Works, Inc. | 5,600 | | 509,880 |
Jones Lang LaSalle, Inc. | 5,900 | | 797,739 |
Juniper Networks, Inc. | 5,100 | | 107,457 |
Kroger Co. | 10,100 | | 562,671 |
Ladder Capital Corp. Class A | 14,800 | | 281,052 |
Lakeland Financial Corp. | 7,000 | | 290,080 |
Lennar Corp. Class A | 6,100 | | 262,788 |
Liberty Tax, Inc. (a) | 15,800 | | 598,662 |
Malibu Boats, Inc. Class A (a) | 7,200 | | 134,352 |
Marsh & McLennan Companies, Inc. | 2,700 | | 146,799 |
McGraw Hill Financial, Inc. | 8,400 | | 760,032 |
McKesson Corp. | 6,500 | | 1,322,165 |
MedAssets, Inc. (a) | 19,700 | | 426,702 |
Medtronic, Inc. | 9,800 | | 667,968 |
MRC Global, Inc. (a) | 7,200 | | 151,416 |
Multi-Color Corp. | 7,000 | | 345,100 |
Murphy U.S.A., Inc. (a) | 5,775 | | 330,908 |
NVIDIA Corp. | 11,800 | | 230,572 |
NVR, Inc. (a) | 200 | | 245,516 |
Old Dominion Freight Lines, Inc. (a) | 2,000 | | 145,740 |
Omega Flex, Inc. | 21,700 | | 577,654 |
Omnicare, Inc. | 8,337 | | 555,161 |
Opus Bank | 2,700 | | 71,010 |
PetSmart, Inc. | 4,500 | | 325,575 |
Phillips 66 Co. | 6,800 | | 533,800 |
Polaris Industries, Inc. | 3,100 | | 467,666 |
Common Stocks - continued |
| Shares | | Value |
United States of America - continued |
Praxair, Inc. | 4,300 | | $ 541,757 |
Primerica, Inc. | 10,900 | | 557,535 |
Procter & Gamble Co. | 13,800 | | 1,204,326 |
Providence Service Corp. (a) | 13,400 | | 592,012 |
PulteGroup, Inc. | 18,100 | | 347,339 |
QUALCOMM, Inc. | 2,000 | | 157,020 |
Reinsurance Group of America, Inc. | 3,600 | | 303,300 |
Riverbed Technology, Inc. (a) | 23,000 | | 436,770 |
Ruth's Hospitality Group, Inc. | 53,300 | | 648,661 |
Saia, Inc. (a) | 11,400 | | 558,828 |
SLM Corp. | 47,800 | | 456,490 |
SM Energy Co. | 5,400 | | 304,020 |
Snap-On, Inc. | 4,500 | | 594,630 |
SS&C Technologies Holdings, Inc. (a) | 5,200 | | 251,264 |
Steris Corp. | 14,000 | | 865,200 |
Super Micro Computer, Inc. (a) | 15,800 | | 504,968 |
Sysco Corp. | 7,200 | | 277,488 |
Textron, Inc. | 19,500 | | 809,835 |
TFS Financial Corp. | 18,800 | | 280,872 |
Thermo Fisher Scientific, Inc. | 6,900 | | 811,233 |
Time Warner Cable, Inc. | 1,400 | | 206,094 |
TiVo, Inc. (a) | 3,100 | | 40,455 |
TJX Companies, Inc. | 7,500 | | 474,900 |
Total System Services, Inc. | 16,700 | | 564,293 |
U.S. Bancorp | 4,100 | | 174,660 |
U.S. Physical Therapy, Inc. | 6,500 | | 280,475 |
UMB Financial Corp. | 3,392 | | 202,095 |
Union Pacific Corp. | 6,400 | | 745,280 |
Universal Electronics, Inc. (a) | 2,700 | | 153,603 |
Verizon Communications, Inc. | 8,700 | | 437,175 |
Visa, Inc. Class A | 3,100 | | 748,433 |
Wyndham Worldwide Corp. | 11,500 | | 893,205 |
Yum! Brands, Inc. | 6,400 | | 459,712 |
TOTAL UNITED STATES OF AMERICA | | 57,035,348 |
TOTAL COMMON STOCKS (Cost $101,397,468) |
110,911,008
|
Nonconvertible Preferred Stocks - 0.0% |
| Shares | | Value |
India - 0.0% |
Zee Entertainment Enterprises Ltd.
(Cost $2,240) | 302,169 | | $ 4,241 |
Money Market Funds - 4.6% |
| | | |
Fidelity Cash Central Fund, 0.11% (b) | 5,029,367 | | 5,029,367 |
Fidelity Securities Lending Cash Central Fund, 0.11% (b)(c) | 240,164 | | 240,164 |
TOTAL MONEY MARKET FUNDS (Cost $5,269,531) |
5,269,531
|
TOTAL INVESTMENT PORTFOLIO - 102.7% (Cost $106,669,239) | 116,184,780 |
NET OTHER ASSETS (LIABILITIES) - (2.7)% | | (3,094,159) |
NET ASSETS - 100% | $ 113,090,621 |
Legend |
(a) Non-income producing |
(b) Affiliated fund that is generally available only to investment companies and other accounts managed by Fidelity Investments. The rate quoted is the annualized seven-day yield of the fund at period end. A complete unaudited listing of the fund's holdings as of its most recent quarter end is available upon request. In addition, each Fidelity Central Fund's financial statements, which are not covered by the Fund's Report of Independent Registered Public Accounting Firm, are available on the SEC's website or upon request. |
(c) Investment made with cash collateral received from securities on loan. |
(d) Security or a portion of the security is on loan at period end. |
(e) Security exempt from registration under Rule 144A of the Securities Act of 1933. These securities may be resold in transactions exempt from registration, normally to qualified institutional buyers. At the end of the period, the value of these securities amounted to $276,658 or 0.2% of net assets. |
Affiliated Central Funds |
Information regarding fiscal year to date income earned by the Fund from investments in Fidelity Central Funds is as follows: |
Fund | Income earned |
Fidelity Cash Central Fund | $ 1,274 |
Fidelity Securities Lending Cash Central Fund | 17,377 |
Total | $ 18,651 |
Other Information |
Categorizations in the Schedule of Investments are based on country or territory of incorporation. |
The following is a summary of the inputs used, as of October 31, 2014, involving the Fund's assets and liabilities carried at fair value. The inputs or methodology used for valuing securities may not be an indication of the risk associated with investing in those securities. For more information on valuation inputs, and their aggregation into the levels used in the tables below, please refer to the Investment Valuation section in the accompanying Notes to Financial Statements. |
Valuation Inputs at Reporting Date: |
Description | Total | Level 1 | Level 2 | Level 3 |
Investments in Securities: | | | | |
Equities: | | | | |
Consumer Discretionary | $ 17,526,683 | $ 13,630,948 | $ 3,895,735 | $ - |
Consumer Staples | 9,816,177 | 7,131,770 | 2,684,407 | - |
Energy | 3,728,174 | 3,340,240 | 305,102 | 82,832 |
Financials | 15,167,357 | 11,704,236 | 3,463,121 | - |
Health Care | 19,670,401 | 15,872,290 | 3,798,111 | - |
Industrials | 18,288,536 | 12,487,729 | 5,230,635 | 570,172 |
Information Technology | 20,044,509 | 13,300,098 | 6,744,411 | - |
Materials | 4,075,448 | 2,736,177 | 1,339,271 | - |
Telecommunication Services | 1,331,463 | 573,632 | 757,831 | - |
Utilities | 1,266,501 | 511,345 | 755,156 | - |
Money Market Funds | 5,269,531 | 5,269,531 | - | - |
Total Investments in Securities: | $ 116,184,780 | $ 86,557,996 | $ 28,973,780 | $ 653,004 |
The following is a summary of transfers between Level 1 and Level 2 for the period ended October 31, 2014. Transfers are assumed to have occurred at the beginning of the period, and are primarily attributable to the valuation techniques used for foreign equity securities, as discussed in the accompanying Notes to Financial Statements: |
Transfers | Total |
Level 1 to Level 2 | $ 2,651,414 |
Level 2 to Level 1 | $ 0 |
See accompanying notes which are an integral part of the financial statements.
Annual Report
Statement of Assets and Liabilities
| October 31, 2014 |
| | |
Assets | | |
Investment in securities, at value (including securities loaned of $229,218) - See accompanying schedule: Unaffiliated issuers (cost $101,399,708) | $ 110,915,249 | |
Fidelity Central Funds (cost $5,269,531) | 5,269,531 | |
Total Investments (cost $106,669,239) | | $ 116,184,780 |
Foreign currency held at value (cost $608) | | 649 |
Receivable for investments sold | | 813,423 |
Receivable for fund shares sold | | 116,580 |
Dividends receivable | | 81,509 |
Distributions receivable from Fidelity Central Funds | | 1,292 |
Prepaid expenses | | 342 |
Receivable from investment adviser for expense reductions | | 43,201 |
Other receivables | | 54,910 |
Total assets | | 117,296,686 |
| | |
Liabilities | | |
Payable for investments purchased | $ 3,610,860 | |
Payable for fund shares redeemed | 71,920 | |
Accrued management fee | 79,116 | |
Distribution and service plan fees payable | 29,438 | |
Other affiliated payables | 23,258 | |
Other payables and accrued expenses | 151,309 | |
Collateral on securities loaned, at value | 240,164 | |
Total liabilities | | 4,206,065 |
| | |
Net Assets | | $ 113,090,621 |
Net Assets consist of: | | |
Paid in capital | | $ 104,218,739 |
Undistributed net investment income | | 23,087 |
Accumulated undistributed net realized gain (loss) on investments and foreign currency transactions | | (644,811) |
Net unrealized appreciation (depreciation) on investments and assets and liabilities in foreign currencies | | 9,493,606 |
Net Assets | | $ 113,090,621 |
See accompanying notes which are an integral part of the financial statements.
Annual Report
Statement of Assets and Liabilities - continued
| October 31, 2014 |
| | |
Calculation of Maximum Offering Price Class A:
Net Asset Value and redemption price per share ($35,986,520 ÷ 2,348,872 shares) | | $ 15.32 |
| | |
Maximum offering price per share (100/94.25 of $15.32) | | $ 16.25 |
Class T:
Net Asset Value and redemption price per share ($20,974,544 ÷ 1,416,376 shares) | | $ 14.81 |
| | |
Maximum offering price per share (100/96.50 of $14.81) | | $ 15.35 |
Class B:
Net Asset Value and offering price per share ($1,223,094 ÷ 88,925 shares)A | | $ 13.75 |
| | |
Class C:
Net Asset Value and offering price per share ($15,747,088 ÷ 1,147,855 shares)A | | $ 13.72 |
| | |
Institutional Class:
Net Asset Value, offering price and redemption price per share ($39,159,375 ÷ 2,459,878 shares) | | $ 15.92 |
A Redemption price per share is equal to net asset value less any applicable contingent deferred sales charge.
See accompanying notes which are an integral part of the financial statements.
Annual Report
Financial Statements - continued
Statement of Operations
| Year ended October 31, 2014 |
| | |
Investment Income | | |
Dividends | | $ 1,756,816 |
Income from Fidelity Central Funds | | 18,651 |
Income before foreign taxes withheld | | 1,775,467 |
Less foreign taxes withheld | | (136,598) |
Total income | | 1,638,869 |
| | |
Expenses | | |
Management fee
Basic fee | $ 751,963 | |
Performance adjustment | 83,404 | |
Transfer agent fees | 232,454 | |
Distribution and service plan fees | 351,315 | |
Accounting and security lending fees | 45,327 | |
Custodian fees and expenses | 196,651 | |
Independent trustees' compensation | 435 | |
Registration fees | 64,479 | |
Audit | 84,142 | |
Legal | 373 | |
Miscellaneous | 969 | |
Total expenses before reductions | 1,811,512 | |
Expense reductions | (170,593) | 1,640,919 |
Net investment income (loss) | | (2,050) |
Realized and Unrealized Gain (Loss) Net realized gain (loss) on: | | |
Investment securities: | | |
Unaffiliated issuers | 16,716,357 | |
Foreign currency transactions | (66,575) | |
Total net realized gain (loss) | | 16,649,782 |
Change in net unrealized appreciation (depreciation) on: Investment securities | (4,084,197) | |
Assets and liabilities in foreign currencies | (1,245) | |
Total change in net unrealized appreciation (depreciation) | | (4,085,442) |
Net gain (loss) | | 12,564,340 |
Net increase (decrease) in net assets resulting from operations | | $ 12,562,290 |
See accompanying notes which are an integral part of the financial statements.
Annual Report
Statement of Changes in Net Assets
| Year ended
October 31,
2014 | Year ended
October 31,
2013 |
Increase (Decrease) in Net Assets | | |
Operations | | |
Net investment income (loss) | $ (2,050) | $ 230,594 |
Net realized gain (loss) | 16,649,782 | 16,749,024 |
Change in net unrealized appreciation (depreciation) | (4,085,442) | 6,178,412 |
Net increase (decrease) in net assets resulting
from operations | 12,562,290 | 23,158,030 |
Distributions to shareholders from net investment income | (195,453) | (34,747) |
Distributions to shareholders from net realized gain | (407,917) | - |
Total distributions | (603,370) | (34,747) |
Share transactions - net increase (decrease) | 3,705,620 | (1,761,053) |
Redemption fees | 573 | 649 |
Total increase (decrease) in net assets | 15,665,113 | 21,362,879 |
| | |
Net Assets | | |
Beginning of period | 97,425,508 | 76,062,629 |
End of period (including undistributed net investment income of $23,087 and undistributed net investment income of $195,519, respectively) | $ 113,090,621 | $ 97,425,508 |
See accompanying notes which are an integral part of the financial statements.
Annual Report
Financial Highlights - Class A
Years ended October 31, | 2014 | 2013 | 2012 | 2011 | 2010 |
Selected Per-Share Data | | | | | |
Net asset value, beginning of period | $ 13.64 | $ 10.40 | $ 9.57 | $ 11.41 | $ 9.04 |
Income from Investment Operations | | | | | |
Net investment income (loss) C | .01 | .04 | .02 | (.03) | .01 |
Net realized and unrealized gain (loss) | 1.76 | 3.20 | .81 | (1.76) | 2.47 |
Total from investment operations | 1.77 | 3.24 | .83 | (1.79) | 2.48 |
Distributions from net investment income | (.02) | - | - | - | (.03) |
Distributions from net realized gain | (.06) | - | - | (.05) | (.08) |
Total distributions | (.09) H | - | - | (.05) | (.11) |
Redemption fees added to paid in capital C, G | - | - | - | - | - |
Net asset value, end of period | $ 15.32 | $ 13.64 | $ 10.40 | $ 9.57 | $ 11.41 |
Total Return A, B | 13.03% | 31.15% | 8.67% | (15.81)% | 27.68% |
Ratios to Average Net Assets D, F | | | | | |
Expenses before reductions | 1.62% | 1.38% | 1.43% | 1.51% | 1.89% |
Expenses net of fee waivers, if any | 1.45% | 1.38% | 1.43% | 1.45% | 1.50% |
Expenses net of all reductions | 1.45% | 1.35% | 1.40% | 1.43% | 1.44% |
Net investment income (loss) | .07% | .33% | .22% | (.24)% | .13% |
Supplemental Data | | | | | |
Net assets, end of period (000 omitted) | $ 35,987 | $ 33,694 | $ 26,961 | $ 36,367 | $ 30,383 |
Portfolio turnover rate E | 249% | 211% | 155% | 140% | 179% |
A Total returns would have been lower if certain expenses had not been reduced during the applicable periods shown.
B Total returns do not include the effect of the sales charges.
C Calculated based on average shares outstanding during the period.
D Fees and expenses of any underlying Fidelity Central Funds are not included in the Fund's expense ratio. The Fund indirectly bears its proportionate share of the expenses of any underlying Fidelity Central Funds.
E Amount does not include the portfolio activity of any underlying Fidelity Central Funds.
F Expense ratios reflect operating expenses of the class. Expenses before reductions do not reflect amounts reimbursed by the investment adviser or reductions from brokerage service arrangements or reductions from other expense offset arrangements and do not represent the amount paid by the class during periods when reimbursements or reductions occur. Expenses net of fee waivers reflect expenses after reimbursement by the investment adviser but prior to reductions from brokerage service arrangements or other expense offset arrangements. Expenses net of all reductions represent the net expenses paid by the class.
G Amount represents less than $.01 per share.
H Total distributions of $.09 per share is comprised of distributions from net investment income of $.024 and distributions from net realized gain of $.064 per share.
See accompanying notes which are an integral part of the financial statements.
Annual Report
Financial Highlights - Class T
Years ended October 31, | 2014 | 2013 | 2012 | 2011 | 2010 |
Selected Per-Share Data | | | | | |
Net asset value, beginning of period | $ 13.19 | $ 10.09 | $ 9.31 | $ 11.11 | $ 8.82 |
Income from Investment Operations | | | | | |
Net investment income (loss) C | (.03) | - G | - G | (.05) | (.01) |
Net realized and unrealized gain (loss) | 1.71 | 3.10 | .78 | (1.72) | 2.39 |
Total from investment operations | 1.68 | 3.10 | .78 | (1.77) | 2.38 |
Distributions from net investment income | - | - | - | - | (.01) |
Distributions from net realized gain | (.06) | - | - | (.03) | (.08) |
Total distributions | (.06) | - | - | (.03) | (.09) |
Redemption fees added to paid in capital C, G | - | - | - | - | - |
Net asset value, end of period | $ 14.81 | $ 13.19 | $ 10.09 | $ 9.31 | $ 11.11 |
Total Return A, B | 12.77% | 30.72% | 8.38% | (15.97)% | 27.20% |
Ratios to Average Net Assets D, F | | | | | |
Expenses before reductions | 1.93% | 1.68% | 1.71% | 1.80% | 2.32% |
Expenses net of fee waivers, if any | 1.70% | 1.68% | 1.70% | 1.70% | 1.75% |
Expenses net of all reductions | 1.70% | 1.64% | 1.68% | 1.68% | 1.70% |
Net investment income (loss) | (.17)% | .04% | (.05)% | (.49)% | (.13)% |
Supplemental Data | | | | | |
Net assets, end of period (000 omitted) | $ 20,975 | $ 19,193 | $ 15,731 | $ 24,180 | $ 23,237 |
Portfolio turnover rate E | 249% | 211% | 155% | 140% | 179% |
A Total returns would have been lower if certain expenses had not been reduced during the applicable periods shown.
B Total returns do not include the effect of the sales charges.
C Calculated based on average shares outstanding during the period.
D Fees and expenses of any underlying Fidelity Central Funds are not included in the Fund's expense ratio. The Fund indirectly bears its proportionate share of the expenses of any underlying Fidelity Central Funds.
E Amount does not include the portfolio activity of any underlying Fidelity Central Funds.
F Expense ratios reflect operating expenses of the class. Expenses before reductions do not reflect amounts reimbursed by the investment adviser or reductions from brokerage service arrangements or reductions from other expense offset arrangements and do not represent the amount paid by the class during periods when reimbursements or reductions occur. Expenses net of fee waivers reflect expenses after reimbursement by the investment adviser but prior to reductions from brokerage service arrangements or other expense offset arrangements. Expenses net of all reductions represent the net expenses paid by the class.
G Amount represents less than $.01 per share.
See accompanying notes which are an integral part of the financial statements.
Annual Report
Financial Highlights - Class B
Years ended October 31, | 2014 | 2013 | 2012 | 2011 | 2010 |
Selected Per-Share Data | | | | | |
Net asset value, beginning of period | $ 12.27 | $ 9.43 | $ 8.74 | $ 10.46 | $ 8.31 |
Income from Investment Operations | | | | | |
Net investment income (loss) C | (.09) | (.05) | (.05) | (.10) | (.06) |
Net realized and unrealized gain (loss) | 1.58 | 2.89 | .74 | (1.62) | 2.26 |
Total from investment operations | 1.49 | 2.84 | .69 | (1.72) | 2.20 |
Distributions from net realized gain | (.01) | - | - | - G | (.05) |
Redemption fees added to paid in capital C, G | - | - | - | - | - |
Net asset value, end of period | $ 13.75 | $ 12.27 | $ 9.43 | $ 8.74 | $ 10.46 |
Total Return A, B | 12.11% | 30.12% | 7.89% | (16.42)% | 26.64% |
Ratios to Average Net Assets D, F | | | | | |
Expenses before reductions | 2.44% | 2.17% | 2.19% | 2.32% | 2.82% |
Expenses net of fee waivers, if any | 2.20% | 2.17% | 2.19% | 2.20% | 2.25% |
Expenses net of all reductions | 2.20% | 2.13% | 2.17% | 2.18% | 2.19% |
Net investment income (loss) | (.68)% | (.45)% | (.54)% | (.99)% | (.62)% |
Supplemental Data | | | | | |
Net assets, end of period (000 omitted) | $ 1,223 | $ 1,331 | $ 1,401 | $ 1,926 | $ 2,731 |
Portfolio turnover rate E | 249% | 211% | 155% | 140% | 179% |
A Total returns would have been lower if certain expenses had not been reduced during the applicable periods shown.
B Total returns do not include the effect of the contingent deferred sales charge.
C Calculated based on average shares outstanding during the period.
D Fees and expenses of any underlying Fidelity Central Funds are not included in the Fund's expense ratio. The Fund indirectly bears its proportionate share of the expenses of any underlying Fidelity Central Funds.
E Amount does not include the portfolio activity of any underlying Fidelity Central Funds.
F Expense ratios reflect operating expenses of the class. Expenses before reductions do not reflect amounts reimbursed by the investment adviser or reductions from brokerage service arrangements or reductions from other expense offset arrangements and do not represent the amount paid by the class during periods when reimbursements or reductions occur. Expenses net of fee waivers reflect expenses after reimbursement by the investment adviser but prior to reductions from brokerage service arrangements or other expense offset arrangements. Expenses net of all reductions represent the net expenses paid by the class.
G Amount represents less than $.01 per share.
See accompanying notes which are an integral part of the financial statements.
Annual Report
Financial Highlights - Class C
Years ended October 31, | 2014 | 2013 | 2012 | 2011 | 2010 |
Selected Per-Share Data | | | | | |
Net asset value, beginning of period | $ 12.26 | $ 9.41 | $ 8.73 | $ 10.46 | $ 8.31 |
Income from Investment Operations | | | | | |
Net investment income (loss) C | (.09) | (.05) | (.05) | (.10) | (.06) |
Net realized and unrealized gain (loss) | 1.58 | 2.90 | .73 | (1.61) | 2.27 |
Total from investment operations | 1.49 | 2.85 | .68 | (1.71) | 2.21 |
Distributions from net realized gain | (.03) | - | - | (.02) | (.06) |
Redemption fees added to paid in capital C, G | - | - | - | - | - |
Net asset value, end of period | $ 13.72 | $ 12.26 | $ 9.41 | $ 8.73 | $ 10.46 |
Total Return A, B | 12.13% | 30.29% | 7.79% | (16.38)% | 26.68% |
Ratios to Average Net Assets D, F | | | | | |
Expenses before reductions | 2.40% | 2.16% | 2.18% | 2.28% | 2.77% |
Expenses net of fee waivers, if any | 2.20% | 2.16% | 2.18% | 2.20% | 2.25% |
Expenses net of all reductions | 2.20% | 2.13% | 2.16% | 2.18% | 2.20% |
Net investment income (loss) | (.67)% | (.45)% | (.53)% | (.99)% | (.63)% |
Supplemental Data | | | | | |
Net assets, end of period (000 omitted) | $ 15,747 | $ 13,055 | $ 9,421 | $ 11,632 | $ 7,986 |
Portfolio turnover rate E | 249% | 211% | 155% | 140% | 179% |
A Total returns would have been lower if certain expenses had not been reduced during the applicable periods shown.
B Total returns do not include the effect of the contingent deferred sales charge.
C Calculated based on average shares outstanding during the period.
D Fees and expenses of any underlying Fidelity Central Funds are not included in the Fund's expense ratio. The Fund indirectly bears its proportionate share of the expenses of any underlying Fidelity Central Funds.
E Amount does not include the portfolio activity of any underlying Fidelity Central Funds.
F Expense ratios reflect operating expenses of the class. Expenses before reductions do not reflect amounts reimbursed by the investment adviser or reductions from brokerage service arrangements or reductions from other expense offset arrangements and do not represent the amount paid by the class during periods when reimbursements or reductions occur. Expenses net of fee waivers reflect expenses after reimbursement by the investment adviser but prior to reductions from brokerage service arrangements or other expense offset arrangements. Expenses net of all reductions represent the net expenses paid by the class.
G Amount represents less than $.01 per share.
See accompanying notes which are an integral part of the financial statements.
Annual Report
Financial Highlights - Institutional Class
Years ended October 31, | 2014 | 2013 | 2012 | 2011 | 2010 |
Selected Per-Share Data | | | | | |
Net asset value, beginning of period | $ 14.18 | $ 10.78 | $ 9.88 | $ 11.76 | $ 9.31 |
Income from Investment Operations | | | | | |
Net investment income (loss) B | .05 | .09 | .06 | - F | .04 |
Net realized and unrealized gain (loss) | 1.82 | 3.33 | .84 | (1.82) | 2.54 |
Total from investment operations | 1.87 | 3.42 | .90 | (1.82) | 2.58 |
Distributions from net investment income | (.06) | (.02) | - | - | (.05) |
Distributions from net realized gain | (.06) | - | - | (.06) | (.08) |
Total distributions | (.13) G | (.02) | - | (.06) | (.13) |
Redemption fees added to paid in capital B, F | - | - | - | - | - |
Net asset value, end of period | $ 15.92 | $ 14.18 | $ 10.78 | $ 9.88 | $ 11.76 |
Total Return A | 13.27% | 31.74% | 9.11% | (15.60)% | 28.00% |
Ratios to Average Net Assets C, E | | | | | |
Expenses before reductions | 1.29% | 1.02% | 1.06% | 1.18% | 1.43% |
Expenses net of fee waivers, if any | 1.20% | 1.02% | 1.06% | 1.17% | 1.25% |
Expenses net of all reductions | 1.20% | .99% | 1.03% | 1.15% | 1.19% |
Net investment income (loss) | .33% | .69% | .59% | .04% | .38% |
Supplemental Data | | | | | |
Net assets, end of period (000 omitted) | $ 39,159 | $ 30,153 | $ 22,548 | $ 28,725 | $ 12,936 |
Portfolio turnover rate D | 249% | 211% | 155% | 140% | 179% |
A Total returns would have been lower if certain expenses had not been reduced during the applicable periods shown.
B Calculated based on average shares outstanding during the period.
C Fees and expenses of any underlying Fidelity Central Funds are not included in the Fund's expense ratio. The Fund indirectly bears its proportionate share of the expenses of any underlying Fidelity Central Funds.
D Amount does not include the portfolio activity of any underlying Fidelity Central Funds.
E Expense ratios reflect operating expenses of the class. Expenses before reductions do not reflect amounts reimbursed by the investment adviser or reductions from brokerage service arrangements or reductions from other expense offset arrangements and do not represent the amount paid by the class during periods when reimbursements or reductions occur. Expenses net of fee waivers reflect expenses after reimbursement by the investment adviser but prior to reductions from brokerage service arrangements or other expense offset arrangements. Expenses net of all reductions represent the net expenses paid by the class.
F Amount represents less than $.01 per share.
G Total distributions of $.13 per share is comprised of distributions from net investment income of $.064 and distributions from net realized gain of $.064 per share.
See accompanying notes which are an integral part of the financial statements.
Annual Report
Notes to Financial Statements
For the period ended October 31, 2014
1. Organization.
Fidelity Advisor Global Capital Appreciation Fund (the Fund) is a fund of Fidelity Advisor Series VIII (the Trust) and is authorized to issue an unlimited number of shares. The Trust is registered under the Investment Company Act of 1940, as amended (the 1940 Act), as an open-end management investment company organized as a Massachusetts business trust. The Fund offers Class A, Class T, Class C and Institutional Class shares, each of which, along with Class B shares, has equal rights as to assets and voting privileges. Class B shares are closed to new accounts and additional purchases, except for exchanges and reinvestments. Each class has exclusive voting rights with respect to matters that affect that class. Class B shares will automatically convert to Class A shares after a holding period of seven years from the initial date of purchase. The Fund's investments in emerging markets can be subject to social, economic, regulatory, and political uncertainties and can be extremely volatile.
2. Investments in Fidelity Central Funds.
The Fund invests in Fidelity Central Funds, which are open-end investment companies generally available only to other investment companies and accounts managed by the investment adviser and its affiliates. The Fund's Schedule of Investments lists each of the Fidelity Central Funds held as of period end, if any, as an investment of the Fund, but does not include the underlying holdings of each Fidelity Central Fund. As an Investing Fund, the Fund indirectly bears its proportionate share of the expenses of the underlying Fidelity Central Funds.
The Money Market Central Funds seek preservation of capital and current income and are managed by Fidelity Investments Money Management, Inc. (FIMM), an affiliate of the investment adviser. Annualized expenses of the Money Market Central Funds as of their most recent shareholder report date are less than .01%.
A complete unaudited list of holdings for each Fidelity Central Fund is available upon request or at the Securities and Exchange Commission (the SEC) website at www.sec.gov. In addition, the financial statements of the Fidelity Central Funds, which are not covered by the Fund's Report of Independent Registered Public Accounting Firm, are available on the SEC website or upon request.
3. Significant Accounting Policies.
The financial statements have been prepared in conformity with accounting principles generally accepted in the United States of America (GAAP), which require management to make certain estimates and assumptions at the date of the financial statements. Actual results could differ from those estimates. Subsequent events, if any, through the date that the financial statements were issued have been evaluated in the preparation of
Annual Report
3. Significant Accounting Policies - continued
the financial statements. The following summarizes the significant accounting policies of the Fund:
Investment Valuation. Investments are valued as of 4:00 p.m. Eastern time on the last calendar day of the period. In accordance with valuation policies and procedures approved by the Board of Trustees (the Board), the Fund attempts to obtain prices from one or more third party pricing vendors or brokers to value its investments. When current market prices, quotations or currency exchange rates are not readily available or reliable, investments will be fair valued in good faith by the Fidelity Management & Research Company (FMR) Fair Value Committee (the Committee), in accordance with procedures adopted by the Board. Factors used in determining fair value vary by investment type and may include market or investment specific events. The frequency with which these procedures are used cannot be predicted and they may be utilized to a significant extent. The Committee oversees the Fund's valuation policies and procedures and is responsible for approving and reporting to the Board all fair value determinations.
The Fund categorizes the inputs to valuation techniques used to value its investments into a disclosure hierarchy consisting of three levels as shown below:
Level 1 - quoted prices in active markets for identical investments
Level 2 - other significant observable inputs (including quoted prices for similar investments, interest rates, prepayment speeds, etc.)
Level 3 - unobservable inputs (including the Fund's own assumptions based on the best information available)
Valuation techniques used to value the Fund's investments by major category are as follows:
Equity securities, including restricted securities, for which market quotations are readily available, are valued at the last reported sale price or official closing price as reported by a third party pricing vendor on the primary market or exchange on which they are traded and are categorized as Level 1 in the hierarchy. In the event there were no sales during the day or closing prices are not available, securities are valued at the last quoted bid price or may be valued using the last available price and are generally categorized as Level 2 in the hierarchy. For foreign equity securities, when market or security specific events arise, comparisons to the valuation of American Depositary Receipts (ADRs), futures contracts, Exchange-Traded Funds (ETFs) and certain indexes as well as quoted prices for similar securities may be used and would be categorized as Level 2 in the hierarchy. Utilizing these techniques may result in transfers between Level 1 and Level 2. For equity securities, including restricted securities, where observable inputs are
Annual Report
Notes to Financial Statements - continued
3. Significant Accounting Policies - continued
Investment Valuation - continued
limited, assumptions about market activity and risk are used and these securities may be categorized as Level 3 in the hierarchy.
Investments in open-end mutual funds, including the Fidelity Central Funds, are valued at their closing net asset value (NAV) each business day and are categorized as Level 1 in the hierarchy.
Changes in valuation techniques may result in transfers in or out of an assigned level within the disclosure hierarchy. The aggregate value of investments by input level, as of October 31, 2014, including information on transfers between Levels 1 and 2, is included at the end of the Fund's Schedule of Investments.
Foreign Currency. The Fund may use foreign currency contracts to facilitate transactions in foreign-denominated securities. Gains and losses from these transactions may arise from changes in the value of the foreign currency or if the counterparties do not perform under the contracts' terms.
Foreign-denominated assets, including investment securities, and liabilities are translated into U.S. dollars at the exchange rates at period end. Purchases and sales of investment securities, income and dividends received and expenses denominated in foreign currencies are translated into U.S. dollars at the exchange rate in effect on the transaction date.
The effects of exchange rate fluctuations on investments are included with the net realized and unrealized gain (loss) on investment securities. Other foreign currency transactions resulting in realized and unrealized gain (loss) are disclosed separately.
Investment Transactions and Income. For financial reporting purposes, the Fund's investment holdings and NAV include trades executed through the end of the last business day of the period. The NAV per share for processing shareholder transactions is calculated as of the close of business of the New York Stock Exchange (NYSE), normally 4:00 p.m. Eastern time and includes trades executed through the end of the prior business day. Gains and losses on securities sold are determined on the basis of identified cost and may include proceeds received from litigation. Dividend income is recorded on the ex-dividend date, except for certain dividends from foreign securities where the ex-dividend date may have passed, which are recorded as soon as the Fund is informed of the ex-dividend date. Non-cash dividends included in dividend income, if any, are recorded at the fair market value of the securities received. Income and capital gain distributions from Fidelity Central Funds, if any, are recorded on the ex-dividend date. Distributions received on securities that represent a return of capital or capital gain are recorded as a reduction of cost of investments and/or as a realized gain. Subsequent to
Annual Report
3. Significant Accounting Policies - continued
Investment Transactions and Income - continued
ex-dividend date the Fund determines the components of these distributions, based upon receipt of tax filings or other correspondence relating to the underlying investment. Investment income is recorded net of foreign taxes withheld where recovery of such taxes is uncertain.
Class Allocations and Expenses. Investment income, realized and unrealized capital gains and losses, common expenses of the Fund, and certain fund-level expense reductions, if any, are allocated daily on a pro-rata basis to each class based on the relative net assets of each class to the total net assets of the Fund. Each class differs with respect to transfer agent and distribution and service plan fees incurred. Certain expense reductions may also differ by class. For the reporting period, the allocated portion of income and expenses to each class as a percent of its average net assets may vary due to the timing of recording these transactions in relation to fluctuating net assets of the classes. Expenses directly attributable to a fund are charged to that fund. Expenses attributable to more than one fund are allocated among the respective funds on the basis of relative net assets or other appropriate methods. Expense estimates are accrued in the period to which they relate and adjustments are made when actual amounts are known.
Income Tax Information and Distributions to Shareholders. Each year, the Fund intends to qualify as a regulated investment company under Subchapter M of the Internal Revenue Code, including distributing substantially all of its taxable income and realized gains. As a result, no provision for U.S. Federal income taxes is required. As of October 31, 2014, the Fund did not have any unrecognized tax benefits in the financial statements; nor is the Fund aware of any tax positions for which it is reasonably possible that the total amounts of unrecognized tax benefits will significantly change in the next twelve months. The Fund files a U.S. federal tax return, in addition to state and local tax returns as required. The Fund's federal income tax returns are subject to examination by the Internal Revenue Service (IRS) for a period of three fiscal years after they are filed. State and local tax returns may be subject to examination for an additional fiscal year depending on the jurisdiction. Foreign taxes are provided for based on the Fund's understanding of the tax rules and rates that exist in the foreign markets in which it invests.
Distributions are declared and recorded on the ex-dividend date. Income dividends and capital gain distributions are declared separately for each class. Income and capital gain distributions are determined in accordance with income tax regulations, which may differ from GAAP. In addition, the Fund claimed a portion of the payment made to redeeming shareholders as a distribution for income tax purposes.
Capital accounts within the financial statements are adjusted for permanent book-tax differences. These adjustments have no impact on net assets or the results of operations.
Annual Report
Notes to Financial Statements - continued
3. Significant Accounting Policies - continued
Income Tax Information and Distributions to Shareholders - continued
Capital accounts are not adjusted for temporary book-tax differences which will reverse in a subsequent period.
Book-tax differences are primarily due to foreign currency transactions, passive foreign investment companies (PFIC), partnerships, capital loss carryforwards and losses deferred due to wash sales.
The federal tax cost of investment securities and unrealized appreciation (depreciation) as of period end were as follows:
Gross unrealized appreciation | $ 11,061,915 |
Gross unrealized depreciation | (2,085,278) |
Net unrealized appreciation (depreciation) on securities | $ 8,976,637 |
Tax Cost | $ 107,208,143 |
The tax-based components of distributable earnings as of period end were as follows:
Capital loss carryforward | $ (105,904) |
Net unrealized appreciation (depreciation) on securities and other investments | $ 8,977,790 |
Capital loss carryforwards are only available to offset future capital gains of the Fund to the extent provided by regulations and may be limited. Under the Regulated Investment Company Modernization Act of 2010 (the Act), the Fund is permitted to carry forward capital losses incurred in taxable years beginning after December 22, 2010 for an unlimited period and such capital losses are required to be used prior to any losses that expire. The capital loss carryforward information presented below, including any applicable limitation, is estimated as of fiscal period end and is subject to adjustment.
Fiscal year of expiration | |
2019 | $ (105,904) |
The tax character of distributions paid was as follows:
| October 31, 2014 | October 31, 2013 |
Ordinary Income | $ 603,370 | $ 34,747 |
Short-Term Trading (Redemption) Fees. Shares held by investors in the Fund less than 30 days may have been subject to a redemption fee equal to 1.00% of the NAV of shares redeemed. All redemption fees, which reduce the proceeds of the shareholder redemption, are retained by the Fund and accounted for as an addition to paid in capital.
Annual Report
3. Significant Accounting Policies - continued
Restricted Securities. The Fund may invest in securities that are subject to legal or contractual restrictions on resale. These securities generally may be resold in transactions exempt from registration or to the public if the securities are registered. Disposal of these securities may involve time-consuming negotiations and expense, and prompt sale at an acceptable price may be difficult. Information regarding restricted securities is included at the end of the Fund's Schedule of Investments.
New Accounting Pronouncement. In June 2014, the Financial Accounting Standards Board issued Accounting Standard Update No. 2014-11, Repurchase-to-Maturity Transactions, Repurchase Financings, and Disclosures. The Update amends the accounting for certain repurchase agreements and expands disclosure requirements for reverse repurchase agreements, securities lending and other similar transactions. The disclosure requirements are effective for annual and interim reporting periods beginning after December 15, 2014. Management is currently evaluating the impact of the Update on the Fund's financial statements and related disclosures.
4. Purchases and Sales of Investments.
Purchases and sales of securities, other than short-term securities, aggregated $266,922,919 and $265,637,336, respectively.
5. Fees and Other Transactions with Affiliates.
Management Fee. Fidelity Management & Research Company (the investment adviser) and its affiliates provide the Fund with investment management related services for which the Fund pays a monthly management fee. The management fee is the sum of an individual fund fee rate that is based on an annual rate of .45% of the Fund's average net assets and an annualized group fee rate that averaged .25% during the period. The group fee rate is based upon the average net assets of all the mutual funds advised by the investment adviser, including any mutual funds previously advised by the investment adviser that are currently advised by Fidelity SelectCo, LLC, an affiliate of the investment adviser. The group fee rate decreases as assets under management increase and increases as assets under management decrease. In addition, the management fee is subject to a performance adjustment (up to a maximum of ± .20% of the Fund's average net assets over a 36 month performance period). The upward or downward adjustment to the management fee is based on the relative investment performance of the Institutional Class of the Fund as compared to its benchmark index, the MSCI All Country World Index, over the same 36 month performance period. For the reporting period, the total annual management fee rate, including the performance adjustment, was .78% of the Fund's average net assets. The performance adjustment included in the management fee rate may be higher or lower than the maximum performance adjustment rate due to the difference between the average net assets for the reporting and performance periods.
Annual Report
Notes to Financial Statements - continued
5. Fees and Other Transactions with Affiliates - continued
Distribution and Service Plan Fees. In accordance with Rule 12b-1 of the 1940 Act, the Fund has adopted separate Distribution and Service Plans for each class of shares, except for the Institutional Class. Certain classes pay Fidelity Distributors Corporation (FDC), an affiliate of the investment adviser, separate Distribution and Service Fees, each of which is based on an annual percentage of each class' average net assets. In addition, FDC may pay financial intermediaries for selling shares of the Fund and providing shareholder support services. For the period, the Distribution and Service Fee rates, total fees and amounts retained by FDC were as follows:
| Distribution
Fee | Service
Fee | Total Fees | Retained
by FDC |
Class A | -% | .25% | $ 89,172 | $ 1,095 |
Class T | .25% | .25% | 102,445 | 257 |
Class B | .75% | .25% | 13,323 | 10,012 |
Class C | .75% | .25% | 146,375 | 17,024 |
| | | $ 351,315 | $ 28,388 |
Sales Load. FDC may receive a front-end sales charge of up to 5.75% for selling Class A shares and 3.50% for selling Class T shares, some of which is paid to financial intermediaries for selling shares of the Fund. Depending on the holding period, FDC may receive contingent deferred sales charges levied on Class A, Class T, Class B, and Class C redemptions. The deferred sales charges range from 5.00% to 1.00% for Class B shares, 1.00% for Class C shares, 1.00% for certain purchases of Class A shares and .25% for certain purchases of Class T shares.
For the period, sales charge amounts retained by FDC were as follows:
| Retained
by FDC |
Class A | $ 13,309 |
Class T | 4,742 |
Class B* | 255 |
Class C* | 538 |
| $ 18,844 |
* When Class B and Class C shares are initially sold, FDC pays commissions from its own resources to financial intermediaries through which the sales are made.
Transfer Agent Fees. Fidelity Investments Institutional Operations Company, Inc., (FIIOC), an affiliate of the investment adviser is the transfer, dividend disbursing and shareholder servicing agent for each class of the Fund. FIIOC receives account fees and asset-based fees that vary according to the account size and type of account of the shareholders of the respective classes of the Fund. FIIOC pays for typesetting, printing and mailing of shareholder reports, except proxy statements.
Annual Report
5. Fees and Other Transactions with Affiliates - continued
Transfer Agent Fees - continued
For the period, transfer agent fees for each applicable class were as follows:
| Amount | % of
Class-Level Average
Net Assets |
Class A | $ 81,726 | .23 |
Class T | 59,556 | .29 |
Class B | 4,050 | .30 |
Class C | 37,505 | .26 |
Institutional Class | 49,617 | .14 |
| $ 232,454 | |
Accounting and Security Lending Fees. Fidelity Service Company, Inc. (FSC), an affiliate of the investment adviser, maintains the Fund's accounting records. The accounting fee is based on the level of average net assets for each month. Under a separate contract, FSC administers the security lending program. The security lending fee is based on the number and duration of lending transactions.
Brokerage Commissions. The Fund placed a portion of its portfolio transactions with brokerage firms which are affiliates of the investment adviser. Brokerage commissions are included in net realized gain (loss) and change in net unrealized appreciation (depreciation) in the Statement of Operations. The commissions paid to these affiliated firms were $5,300 for the period.
6. Committed Line of Credit.
The Fund participates with other funds managed by the investment adviser or an affiliate in a $4.25 billion credit facility (the "line of credit") to be utilized for temporary or emergency purposes to fund shareholder redemptions or for other short-term liquidity purposes. The Fund has agreed to pay commitment fees on its pro-rata portion of the line of credit, which amounted to $171 and is reflected in Miscellaneous expenses on the Statement of Operations. During the period, the Fund did not borrow on this line of credit.
7. Security Lending.
The Fund lends portfolio securities through a lending agent from time to time in order to earn additional income. For equity securities, a lending agent is used and may loan securities to certain qualified borrowers, including Fidelity Capital Markets (FCM), a broker-dealer affiliated with the Fund. On the settlement date of the loan, the Fund receives collateral (in the form of U.S. Treasury obligations, letters of credit and/or cash) against the loaned securities and maintains collateral in an amount not less than 100% of
Annual Report
Notes to Financial Statements - continued
7. Security Lending - continued
the market value of the loaned securities during the period of the loan. The market value of the loaned securities is determined at the close of business of the Fund and any additional required collateral is delivered to the Fund on the next business day. If the borrower defaults on its obligation to return the securities loaned because of insolvency or other reasons, the Fund may apply collateral received from the borrower against the obligation. The Fund may experience delays and costs in recovering the securities loaned. Any cash collateral received is invested in the Fidelity Securities Lending Cash Central Fund. The value of loaned securities and cash collateral at period end are disclosed on the Fund's Statement of Assets and Liabilities. Security lending income represents the income earned on investing cash collateral, less rebates paid to borrowers and any lending agent fees associated with the loan, plus any premium payments received for lending certain types of securities. Security lending income is presented in the Statement of Operations as a component of income from Fidelity Central Funds. Total security lending income during the period amounted to $17,377. During the period, there were no securities loaned to FCM.
8. Expense Reductions.
The investment adviser contractually agreed to reimburse each class to the extent annual operating expenses exceeded certain levels of average net assets as noted in the table below. This reimbursement will remain in place through December 31, 2015. Some expenses, for example interest expense, including commitment fees, are excluded from this reimbursement.
The following classes were in reimbursement during the period:
| Expense
Limitations | Reimbursement |
| | |
Class A | 1.45% | $ 59,949 |
Class T | 1.70% | 47,486 |
Class B | 2.20% | 3,223 |
Class C | 2.20% | 29,027 |
Institutional Class | 1.20% | 30,638 |
| | $ 170,323 |
Commissions paid to certain brokers with whom the investment adviser, or its affiliates, places trades on behalf of the Fund include an amount in addition to trade execution, which may be rebated back to the Fund to offset certain expenses. This amount totaled $270 for the period.
Annual Report
9. Distributions to Shareholders.
Distributions to shareholders of each class were as follows:
Years ended October 31, | 2014 | 2013 |
From net investment income | | |
Class A | $ 59,620 | $ - |
Institutional Class | 135,833 | 34,747 |
Total | $ 195,453 | $ 34,747 |
From net realized gain | | |
Class A | $ 158,986 | $ - |
Class T | 85,532 | - |
Class B | 537 | - |
Class C | 27,029 | - |
Institutional Class | 135,833 | - |
Total | $ 407,917 | $ - |
10. Share Transactions.
Share transactions for each class were as follows and may contain automatic conversions between classes or exchanges between funds:
| Shares | Dollars |
Years ended October 31, | 2014 | 2013 | 2014 | 2013 |
Class A | | | | |
Shares sold | 591,626 | 373,063 | $ 8,791,852 | $ 4,494,237 |
Reinvestment of distributions | 14,554 | - | 202,003 | - |
Shares redeemed | (726,930) | (496,412) | (10,858,770) | (5,849,205) |
Net increase (decrease) | (120,750) | (123,349) | $ (1,864,915) | $ (1,354,968) |
Class T | | | | |
Shares sold | 191,912 | 216,464 | $ 2,773,971 | $ 2,510,696 |
Reinvestment of distributions | 6,209 | - | 83,505 | - |
Shares redeemed | (236,313) | (321,703) | (3,370,930) | (3,651,942) |
Net increase (decrease) | (38,192) | (105,239) | $ (513,454) | $ (1,141,246) |
Class B | | | | |
Shares sold | 7,695 | 5,625 | $ 100,901 | $ 60,358 |
Reinvestment of distributions | 41 | - | 513 | - |
Shares redeemed | (27,284) | (45,845) | (363,912) | (485,095) |
Net increase (decrease) | (19,548) | (40,220) | $ (262,498) | $ (424,737) |
Class C | | | | |
Shares sold | 308,334 | 323,235 | $ 4,159,482 | $ 3,465,927 |
Reinvestment of distributions | 2,025 | - | 25,331 | - |
Shares redeemed | (227,752) | (258,872) | (3,054,673) | (2,771,491) |
Net increase (decrease) | 82,607 | 64,363 | $ 1,130,140 | $ 694,436 |
Annual Report
Notes to Financial Statements - continued
10. Share Transactions - continued
| Shares | Dollars |
Years ended October 31, | 2014 | 2013 | 2014 | 2013 |
Institutional Class | | | | |
Shares sold | 494,369 | 283,059 | $ 7,721,563 | $ 3,455,485 |
Reinvestment of distributions | 17,076 | 2,789 | 245,727 | 30,990 |
Shares redeemed | (178,721) | (250,158) | (2,750,943) | (3,021,013) |
Net increase (decrease) | 332,724 | 35,690 | $ 5,216,347 | $ 465,462 |
11. Other.
The Fund's organizational documents provide former and current trustees and officers with a limited indemnification against liabilities arising in connection with the performance of their duties to the Fund. In the normal course of business, the Fund may also enter into contracts that provide general indemnifications. The Fund's maximum exposure under these arrangements is unknown as this would be dependent on future claims that may be made against the Fund. The risk of material loss from such claims is considered remote.
At the end of the period, Strategic Advisers International II Fund was the owner of record of approximately 13% of the total outstanding shares of the Fund.
Annual Report
To the Trustees of Fidelity Advisor Series VIII and the Shareholders of Fidelity Advisor Global Capital Appreciation Fund:
In our opinion, the accompanying statement of assets and liabilities, including the schedule of investments, and the related statements of operations and of changes in net assets and the financial highlights present fairly, in all material respects, the financial position of Fidelity Advisor Global Capital Appreciation Fund (a fund of Fidelity Advisor Series VIII) at October 31, 2014, the results of its operations for the year then ended, the changes in its net assets for each of the two years in the period then ended and the financial highlights for each of the five years in the period then ended in conformity with accounting principles generally accepted in the United States of America. These financial statements and financial highlights (hereafter referred to as "financial statements") are the responsibility of the Fidelity Advisor Global Capital Appreciation Fund's management. Our responsibility is to express an opinion on these financial statements based on our audits. We conducted our audits of these financial statements in accordance with the standards of the Public Company Accounting Oversight Board (United States). Those standards require that we plan and perform the audit to obtain reasonable assurance about whether the financial statements are free of material misstatement. An audit includes examining, on a test basis, evidence supporting the amounts and disclosures in the financial statements, assessing the accounting principles used and significant estimates made by management, and evaluating the overall financial statement presentation. We believe that our audits, which included confirmation of securities at October 31, 2014 by correspondence with the custodian and brokers, provide a reasonable basis for our opinion.
PricewaterhouseCoopers LLP
Boston, Massachusetts
December 22, 2014
Annual Report
The Trustees, Member of the Advisory Board, and officers of the trust and fund, as applicable, are listed below. The Board of Trustees governs the fund and is responsible for protecting the interests of shareholders. The Trustees are experienced executives who meet periodically throughout the year to oversee the fund's activities, review contractual arrangements with companies that provide services to the fund, oversee management of the risks associated with such activities and contractual arrangements, and review the fund's performance. Except for James C. Curvey, each of the Trustees oversees 174 funds. Mr. Curvey oversees 407 funds.
The Trustees hold office without limit in time except that (a) any Trustee may resign; (b) any Trustee may be removed by written instrument, signed by at least two-thirds of the number of Trustees prior to such removal; (c) any Trustee who requests to be retired or who has become incapacitated by illness or injury may be retired by written instrument signed by a majority of the other Trustees; and (d) any Trustee may be removed at any special meeting of shareholders by a two-thirds vote of the outstanding voting securities of the trust. Each Trustee who is not an interested person (as defined in the 1940 Act) of the trust and the fund (Independent Trustee), shall retire not later than the last day of the calendar year in which his or her 75th birthday occurs. The Independent Trustees may waive this mandatory retirement age policy with respect to individual Trustees. The officers and Advisory Board Member hold office without limit in time, except that any officer and Advisory Board Member may resign or may be removed by a vote of a majority of the Trustees at any regular meeting or any special meeting of the Trustees. Except as indicated, each individual has held the office shown or other offices in the same company for the past five years.
Experience, Skills, Attributes, and Qualifications of the Fund's Trustees. The Governance and Nominating Committee has adopted a statement of policy that describes the experience, qualifications, attributes, and skills that are necessary and desirable for potential Independent Trustee candidates (Statement of Policy). The Board believes that each Trustee satisfied at the time he or she was initially elected or appointed a Trustee, and continues to satisfy, the standards contemplated by the Statement of Policy. The Governance and Nominating Committee also engages professional search firms to help identify potential Independent Trustee candidates who have the experience, qualifications, attributes, and skills consistent with the Statement of Policy. From time to time, additional criteria based on the composition and skills of the current Independent Trustees, as well as experience or skills that may be appropriate in light of future changes to board composition, business conditions, and regulatory or other developments, have also been considered by the professional search firms and the Governance and Nominating Committee. In addition, the Board takes into account the Trustees' commitment and participation in Board and committee meetings, as well as their leadership of standing and ad hoc committees throughout their tenure.
In determining that a particular Trustee was and continues to be qualified to serve as a Trustee, the Board has considered a variety of criteria, none of which, in isolation, was controlling. The Board believes that, collectively, the Trustees have balanced and diverse experience, qualifications, attributes, and skills, which allow the Board to operate effectively in governing the fund and protecting the interests of shareholders. Information about the specific experience, skills, attributes, and qualifications of each Trustee, which in each case led to the Board's conclusion that the Trustee should serve (or continue to serve) as a trustee of the fund, is provided below.
Annual Report
Board Structure and Oversight Function. James C. Curvey is an interested person (as defined in the 1940 Act) and currently serves as Chairman. The Trustees have determined that an interested Chairman is appropriate and benefits shareholders because an interested Chairman has a personal and professional stake in the quality and continuity of services provided to the fund. Independent Trustees exercise their informed business judgment to appoint an individual of their choosing to serve as Chairman, regardless of whether the Trustee happens to be independent or a member of management. The Independent Trustees have determined that they can act independently and effectively without having an Independent Trustee serve as Chairman and that a key structural component for assuring that they are in a position to do so is for the Independent Trustees to constitute a substantial majority for the Board. The Independent Trustees also regularly meet in executive session. Ned C. Lautenbach serves as Chairman of the Independent Trustees and as such (i) acts as a liaison between the Independent Trustees and management with respect to matters important to the Independent Trustees and (ii) with management prepares agendas for Board meetings.
Fidelity funds are overseen by different Boards of Trustees. The fund's Board oversees Fidelity's equity and high income funds and another Board oversees Fidelity's investment-grade bond, money market, and asset allocation funds. The asset allocation funds may invest in Fidelity funds overseen by the fund's Board. The use of separate Boards, each with its own committee structure, allows the Trustees of each group of Fidelity funds to focus on the unique issues of the funds they oversee, including common research, investment, and operational issues. On occasion, the separate Boards establish joint committees to address issues of overlapping consequences for the Fidelity funds overseen by each Board.
The Trustees operate using a system of committees to facilitate the timely and efficient consideration of all matters of importance to the Trustees, the fund, and fund shareholders and to facilitate compliance with legal and regulatory requirements and oversight of the fund's activities and associated risks. The Board, acting through its committees, has charged FMR and its affiliates with (i) identifying events or circumstances the occurrence of which could have demonstrably adverse effects on the fund's business and/or reputation; (ii) implementing processes and controls to lessen the possibility that such events or circumstances occur or to mitigate the effects of such events or circumstances if they do occur; and (iii) creating and maintaining a system designed to evaluate continuously business and market conditions in order to facilitate the identification and implementation processes described in (i) and (ii) above. Because the day-to-day operations and activities of the fund are carried out by or through FMR, its affiliates and other service providers, the fund's exposure to risks is mitigated but not eliminated by the processes overseen by the Trustees. While each of the Board's committees has responsibility for overseeing different aspects of the fund's activities, oversight is exercised primarily through the Operations, Audit, and Compliance Committees. In addition, the Independent Trustees have worked with FMR to enhance the Board's oversight of investment and financial risks, legal and regulatory risks, technology risks, and operational risks, including the development of additional risk reporting to the Board. For example, a working group comprised of Independent Trustees and FMR has worked and continues to work to review the Fidelity funds' valuation-related activities, reporting and risk management. Appropriate personnel, including but not limited to the fund's Chief Compliance Officer (CCO), FMR's internal auditor, the independent accountants, the fund's Treasurer and portfolio management personnel, make periodic reports to the Board's committees, as appropriate, including an annual review of FMR's risk management program for the Fidelity funds. The responsibilities of each standing committee, including their oversight responsibilities, are described further under "Standing Committees of the Fund's Trustees."
Annual Report
Trustees and Officers - continued
The fund's Statement of Additional Information (SAI) includes more information about the Trustees. To request a free copy, call Fidelity at 1-877-208-0098.
Interested Trustees*:
Correspondence intended for each Trustee who is an interested person may be sent to Fidelity Investments, 245 Summer Street, Boston, Massachusetts 02210.
Name, Year of Birth; Principal Occupations and Other Relevant Experience+ |
James C. Curvey (1935) |
Year of Election or Appointment: 2007 Trustee Chairman of the Board of Trustees |
| Mr. Curvey also serves as Trustee of other Fidelity funds. Mr. Curvey is a Director of Fidelity Research & Analysis Co. (2009-present), and Vice Chairman (2007-present) and Director of FMR LLC. In addition, Mr. Curvey serves as an Overseer for the Boston Symphony Orchestra and a member of the board of Artis-Naples, Naples, Florida, and as a Trustee for Brewster Academy, Wolfeboro, New Hampshire. Previously, Mr. Curvey served as a Director of Fidelity Investments Money Management, Inc. (2009-2014), a Director of FMR (2007-2014), and a Director of FMR Co., Inc. (2007-2014). |
Charles S. Morrison (1960) |
Year of Election or Appointment: 2014 Trustee |
| Mr. Morrison also serves as Trustee of other funds. He serves as a Director of Fidelity Investments Money Management, Inc. (FIMM) (2014-present), Director of Fidelity SelectCo, LLC (2014-present), President, Asset Management (2014-present), and is an employee of Fidelity Investments. Previously, Mr. Morrison served as Vice President of Fidelity's Fixed Income and Asset Allocation Funds (2012-2014), President, Fixed Income (2011-2014), Vice President of Fidelity's Money Market Funds (2005-2009), President, Money Market Group Leader of FMR (2009), and Senior Vice President, Money Market Group of FMR (2004-2009). Mr. Morrison also served as Vice President of Fidelity's Bond Funds (2002-2005), certain Balanced Funds (2002-2005), and certain Asset Allocation Funds (2002-2007), and as Senior Vice President (2002-2005) of Fidelity's Bond Division. |
* Trustees have been determined to be "Interested Trustees" by virtue of, among other things, their affiliation with the trust or various entities under common control with FMR.
+ The information above includes each Trustee's principal occupation during the last five years and other information relating to the experience, attributes, and skills relevant to each Trustee's qualifications to serve as a Trustee, which led to the conclusion that each Trustee should serve as a Trustee for the fund.
Annual Report
Trustees and Officers - continued
Independent Trustees:
Correspondence intended for each Independent Trustee (that is, the Trustees other than the Interested Trustees) may be sent to Fidelity Investments, P.O. Box 55235, Boston, Massachusetts 02205-5235.
Name, Year of Birth; Principal Occupations and Other Relevant Experience+ |
Dennis J. Dirks (1948) |
Year of Election or Appointment: 2005 Trustee |
| Mr. Dirks also serves as Trustee of other Fidelity funds. Prior to his retirement in May 2003, Mr. Dirks was Chief Operating Officer and a member of the Board of The Depository Trust & Clearing Corporation (DTCC). He also served as President, Chief Operating Officer, and Board member of The Depository Trust Company (DTC) and President and Board member of the National Securities Clearing Corporation (NSCC). In addition, Mr. Dirks served as Chief Executive Officer and Board member of the Government Securities Clearing Corporation, Chief Executive Officer and Board member of the Mortgage-Backed Securities Clearing Corporation, as a Trustee and a member of the Finance Committee of Manhattan College (2005-2008), and as a Trustee and a member of the Finance Committee of AHRC of Nassau County (2006-2008). Mr. Dirks is a member of the Independent Directors Council (IDC) Governing Council (2010-present) and Board of Directors for The Brookville Center for Children's Services, Inc. (2009-present). |
Alan J. Lacy (1953) |
Year of Election or Appointment: 2008 Trustee |
| Mr. Lacy also serves as Trustee of other Fidelity funds. Mr. Lacy serves as Senior Adviser (2007-present) of Oak Hill Capital Partners, L.P. (private equity). Mr. Lacy also served as Chief Executive Officer (2000-2005) and Vice Chairman (2005-2006) of Sears Holdings Corporation and Sears, Roebuck and Co. (retail). In addition, Mr. Lacy serves as a member of the Board of Directors of Dave & Buster's Entertainment, Inc. (restaurant and entertainment complexes, 2010-present), Earth Fare, Inc. (retail grocery, 2012-present), The Hillman Companies, Inc. (hardware wholesalers, 2010-present), and Bristol-Myers Squibb Company (global pharmaceuticals, 2008-present). Mr. Lacy is a member of the Board of Trustees of The National Parks Conservation Association (2006-present). Previously, Mr. Lacy served as Chairman of the Board of Trustees of the National Parks Conservation Association (2008-2011) and as a member of the Board of Directors for the Western Union Company (global money transfer, 2006-2011). |
Ned C. Lautenbach (1944) |
Year of Election or Appointment: 2000 Trustee Chairman of the Independent Trustees |
| Mr. Lautenbach also serves as Trustee of other Fidelity funds. Mr. Lautenbach currently serves as the Lead Director of the Eaton Corporation Board of Directors (diversified industrial, 1997-present). Mr. Lautenbach is Chairman of the Board of Directors of the Philharmonic Center for the Arts in Naples, Florida (2012-present) and a member of the Council on Foreign Relations (1994-present). Previously, Mr. Lautenbach was a Partner/Advisory Partner at Clayton, Dubilier & Rice, LLC (private equity investment, 1998-2010), as well as a Director of Sony Corporation (2006-2007). |
Joseph Mauriello (1944) |
Year of Election or Appointment: 2008 Trustee |
| Mr. Mauriello also serves as Trustee of other Fidelity funds. Prior to his retirement in January 2006, Mr. Mauriello served in numerous senior management positions including Deputy Chairman and Chief Operating Officer (2004-2005), and Vice Chairman of Financial Services (2002-2004) of KPMG LLP US (professional services, 1965-2005). Mr. Mauriello currently serves as a member of the Board of Directors of XL Group plc. (global insurance and re-insurance, 2006-present). Previously, Mr. Mauriello served as a Director of the Hamilton Funds of the Bank of New York (2006-2007) and of Arcadia Resources Inc. (health care services and products, 2007-2012). |
Robert W. Selander (1950) |
Year of Election or Appointment: 2011 Trustee |
| Mr. Selander also serves as Trustee of other Fidelity funds. Previously, Mr. Selander served as a Member of the Advisory Board of other Fidelity funds (2011), and Executive Vice Chairman (2010), Chief Executive Officer (2009-2010), and President and Chief Executive Officer (1997-2009) of Mastercard, Inc. |
Cornelia M. Small (1944) |
Year of Election or Appointment: 2005 Trustee |
| Ms. Small also serves as Trustee of other Fidelity funds. Ms. Small is a member of the Board of Directors (2009-present) and Chair of the Investment Committee (2010-present) of the Teagle Foundation. Ms. Small also serves on the Investment Committee of the Berkshire Taconic Community Foundation (2008-present). Previously, Ms. Small served as Chairperson (2002-2008) and a member of the Investment Committee and Chairperson (2008-2012) and a member of the Board of Trustees of Smith College. In addition, Ms. Small served as Chief Investment Officer, Director of Global Equity Investments, and a member of the Board of Directors of Scudder, Stevens & Clark and Scudder Kemper Investments. |
William S. Stavropoulos (1939) |
Year of Election or Appointment: 2001 Trustee Vice Chairman of the Independent Trustees |
| Mr. Stavropoulos also serves as Trustee of other Fidelity funds. Mr. Stavropoulos serves as President and Founder of the Michigan Baseball Foundation, the Great Lakes Loons (2007-present). Mr. Stavropoulos is Chairman Emeritus of the Board of Directors of The Dow Chemical Company, where he previously served in numerous senior management positions, including President, CEO (1995-2000; 2002-2004), Chairman of the Executive Committee (2000-2006), and as a member of the Board of Directors (1990-2006). Currently, Mr. Stavropoulos is Chairman of the Board of Directors of Univar Inc. (global distributor of commodity and specialty chemicals), a Director of Teradata Corporation (data warehousing and technology solutions), and Maersk Inc. (industrial conglomerate), and a member of the Advisory Board for Metalmark Capital LLC (private equity investment, 2005-present). Mr. Stavropoulos is an operating advisor to Clayton, Dubilier & Rice, LLC (private equity investment). In addition, Mr. Stavropoulos is a member of the University of Notre Dame Advisory Council for the College of Science, a Trustee of the Rollin L. Gerstacker Foundation, and a Director of the Naples Philharmonic Center for the Arts. Previously, Mr. Stavropoulos served as a Director of Chemical Financial Corporation (bank holding company, 1993-2012) and Tyco International, Ltd. (multinational manufacturing and services, 2007-2012). |
David M. Thomas (1949) |
Year of Election or Appointment: 2008 Trustee |
| Mr. Thomas also serves as Trustee of other Fidelity funds. Mr. Thomas serves as Non-Executive Chairman of the Board of Directors of Fortune Brands Home and Security (home and security products, 2011-present), and as a member of the Board of Directors of Interpublic Group of Companies, Inc. (marketing communication, 2004-present). Previously, Mr. Thomas served as Executive Chairman (2005-2006) and Chairman and Chief Executive Officer (2000-2005) of IMS Health, Inc. (pharmaceutical and healthcare information solutions), and a Director of Fortune Brands, Inc. (consumer products, 2000-2011). |
+ The information above includes each Trustee's principal occupation during the last five years and other information relating to the experience, attributes, and skills relevant to each Trustee's qualifications to serve as a Trustee, which led to the conclusion that each Trustee should serve as a Trustee for the fund.
Advisory Board Member and Officers:
Correspondence intended for each officer and Peter S. Lynch may be sent to Fidelity Investments, 245 Summer Street, Boston, Massachusetts 02210. Officers appear below in alphabetical order.
Name, Year of Birth; Principal Occupation |
Peter S. Lynch (1944) |
Year of Election or Appointment: 2003 Member of the Advisory Board |
| Mr. Lynch also serves as Member of the Advisory Board of other Fidelity funds. Mr. Lynch is Vice Chairman and a Director of FMR and FMR Co., Inc. In addition, Mr. Lynch serves as a Trustee of Boston College and as the Chairman of the Inner-City Scholarship Fund. Previously, Mr. Lynch served on the Special Olympics International Board of Directors (1997-2006). |
Elizabeth Paige Baumann (1968) |
Year of Election or Appointment: 2012 Anti-Money Laundering (AML) Officer |
| Ms. Baumann also serves as AML Officer of other funds. She is Chief AML Officer of FMR LLC (2012-present) and is an employee of Fidelity Investments. Previously, Ms. Baumann served as Vice President and Deputy Anti-Money Laundering Officer (2007-2012). |
William C. Coffey (1969) |
Year of Election or Appointment: 2009 Assistant Secretary |
| Mr. Coffey also serves as Assistant Secretary of other funds. He is Senior Vice President and Deputy General Counsel of FMR LLC (2010-present), and is an employee of Fidelity Investments. Previously, Mr. Coffey served as Vice President and Associate General Counsel of FMR LLC (2005-2009). |
Timothy M. Cohen (1969) |
Year of Election or Appointment: 2014 Vice President of certain Equity Funds |
| Mr. Cohen also serves as Vice President of other funds. Mr. Cohen serves as a Director and Chief Compliance Officer of Fidelity Management & Research (U.K.) Inc. (2013-present) and is an employee of Fidelity Investments. |
Jonathan Davis (1968) |
Year of Election or Appointment: 2010 Assistant Treasurer |
| Mr. Davis also serves as Assistant Treasurer of other funds. Mr. Davis is an employee of Fidelity Investments. Previously, Mr. Davis served as Vice President and Associate General Counsel of FMR LLC (2003-2010). |
Adrien E. Deberghes (1967) |
Year of Election or Appointment: 2008 Deputy Treasurer |
| Mr. Deberghes also serves as an officer of other funds. He is an employee of Fidelity Investments (2008-present). Prior to joining Fidelity Investments, Mr. Deberghes was Senior Vice President of Mutual Fund Administration at State Street Corporation (2007-2008), Senior Director of Mutual Fund Administration at Investors Bank & Trust (2005-2007), and Director of Finance for Dunkin' Brands (2000-2005). |
Stephanie J. Dorsey (1969) |
Year of Election or Appointment: 2010 Assistant Treasurer |
| Ms. Dorsey also serves as an officer of other funds. She is an employee of Fidelity Investments (2008-present) and has served in other fund officer roles. Prior to joining Fidelity Investments, Ms. Dorsey served as Treasurer (2004-2008) of the JPMorgan Mutual Funds and Vice President (2004-2008) of JPMorgan Chase Bank. |
Howard J. Galligan III (1966) |
Year of Election or Appointment: 2014 Chief Financial Officer |
| Mr. Galligan also serves as Chief Financial Officer of other funds. Mr. Galligan serves as President of Fidelity Pricing and Cash Management Services (FPCMS) (2014-present) and as a Director of Strategic Advisers, Inc. (2008-present). Previously, Mr. Galligan served as Chief Administrative Officer of Asset Management (2011-2014) and Chief Operating Officer and Senior Vice President of Investment Support for Strategic Advisers, Inc. (2003-2011). |
Scott C. Goebel (1968) |
Year of Election or Appointment: 2008 Secretary and Chief Legal Officer (CLO) |
| Mr. Goebel serves as Secretary and CLO of other funds. Mr. Goebel also serves as Secretary of Fidelity SelectCo, LLC (2013-present), Fidelity Investments Money Management, Inc. (FIMM) (2010-present) and Fidelity Research and Analysis Company (FRAC) (2010-present); General Counsel, Secretary, and Senior Vice President of FMR (2008-present) and FMR Co., Inc. (2008-present); Chief Legal Officer of Fidelity Management & Research (Hong Kong) Limited (2008-present); and Assistant Secretary of Fidelity Management & Research (Japan) Limited (2008-present) and Fidelity Management & Research (U.K.) Inc. (2008-present). Previously, Mr. Goebel served as Secretary and CLO of other Fidelity funds (2008-2013), Assistant Secretary of FIMM (2008-2010), FRAC (2008-2010), and certain funds (2007-2008); and as Vice President and Secretary of Fidelity Distributors Corporation (FDC) (2005-2007). Mr. Goebel has been employed by FMR LLC or an affiliate since 2001. |
Brian B. Hogan (1964) |
Year of Election or Appointment: 2009 Vice President |
| Mr. Hogan also serves as Trustee or Vice President of other funds. Mr. Hogan serves as a Director of Fidelity SelectCo, LLC (2014-present) and President of FMR's Equity Division (2009-present). Previously, Mr. Hogan served as Senior Vice President, Equity Research of FMR (2006-2009) and as a portfolio manager. |
Chris Maher (1972) |
Year of Election or Appointment: 2013 Assistant Treasurer |
| Mr. Maher serves as Assistant Treasurer of other funds. Mr. Maher is Vice President of Valuation Oversight and is an employee of Fidelity Investments. Previously, Mr. Maher served as Vice President of Asset Management Compliance (2013), Vice President of FMR's Program Management Group (2010-2013), and Vice President of Valuation Oversight (2008-2010). |
Kenneth B. Robins (1969) |
Year of Election or Appointment: 2008 President and Treasurer |
| Mr. Robins also serves as an officer of other funds. Mr. Robins serves as Executive Vice President of Fidelity Investments Money Management, Inc. (FIMM) (2013-present) and is an employee of Fidelity Investments (2004-present). Previously, Mr. Robins served in other fund officer roles. |
Stephen Sadoski (1971) |
Year of Election or Appointment: 2012 Deputy Treasurer |
| Mr. Sadoski also serves as Deputy Treasurer of other funds. He is an employee of Fidelity Investments (2012-present) and has served in another fund officer role. Prior to joining Fidelity Investments, Mr. Sadoski served as an assistant chief accountant in the Division of Investment Management of the Securities and Exchange Commission (SEC) (2009-2012) and as a senior manager at Deloitte & Touche LLP (1997-2009). |
Stacie M. Smith (1974) |
Year of Election or Appointment: 2013 Deputy Treasurer |
| Ms. Smith also serves as an officer of other funds. She is an employee of Fidelity Investments (2009-present) and has served in other fund officer roles. Prior to joining Fidelity Investments, Ms. Smith served as Senior Audit Manager of Ernst & Young LLP (1996-2009). |
Renee Stagnone (1975) |
Year of Election or Appointment: 2013 Deputy Treasurer |
| Ms. Stagnone also serves as Deputy Treasurer of other funds. Ms. Stagnone is an employee of Fidelity Investments. |
Linda J. Wondrack (1964) |
Year of Election or Appointment: 2014 Chief Compliance Officer |
| Ms. Wondrack also serves as Chief Compliance Officer of other funds. Ms. Wondrack is Executive Vice President and head of the Ethics Office and Asset Management Compliance for Fidelity Investments (2012-present). Ms. Wondrack also serves as Chief Compliance Officer of Fidelity SelectCo, LLC (2014-present); Chief Compliance Officer of Impresa Management LLC (2013-present); and Chief Compliance Officer of FMR Co., Inc., Fidelity Investments Money Management, Inc., Fidelity Management & Research (Japan) Limited, Fidelity Management & Research (U.K.) Inc., Fidelity Management & Research (Hong Kong), Fidelity Management & Research Company, Pyramis Global Advisors, LLC, and Strategic Advisers, Inc., Ballyrock Investment Advisors LLC, and Northern Neck Investors LLC (2012-present). Previously, Ms. Wondrack served as Senior Vice President and Chief Compliance Officer for Columbia Management Investment Advisers, LLC (2005-2012); Chief Compliance Officer for certain funds within the Columbia Family of Funds (2007-2012); and Senior Vice President of Compliance Risk Management at Bank of America (2005-2010). |
Joseph F. Zambello (1957) |
Year of Election or Appointment: 2011 Deputy Treasurer |
| Mr. Zambello also serves as Deputy Treasurer of other funds. Mr. Zambello is an employee of Fidelity Investments. Previously, Mr. Zambello served as Vice President of FMR's Program Management Group (2009-2011) and Vice President of the Transfer Agent Oversight Group (2005-2009). |
Annual Report
Institutional Class designates 34% of the dividends distributed during the fiscal year as qualifying for the dividends-received deduction for corporate shareholders.
Institutional Class designates 100% of the dividends distributed during the fiscal year as amounts which may be taken into account as a dividend for purposes of the maximum rate under section 1(h)(11) of the Internal Revenue Code.
The amounts per share which represent income derived from sources within, and taxes paid to, foreign countries or possessions of the United States are as follows:
| Pay Date | Income | Taxes |
Institutional Class | 12/09/13 | $0.1376 | $0.0096 |
The fund will notify shareholders in January 2015 of amounts for use in preparing 2014 income tax returns.
Annual Report
Board Approval of Investment Advisory Contracts and Management Fees
Fidelity Advisor Global Capital Appreciation Fund
Each year, the Board of Trustees, including the Independent Trustees (together, the Board), votes on the renewal of the management contract with Fidelity Management & Research Company (FMR) and the sub-advisory agreements (together, the Advisory Contracts) for the fund. The Board, assisted by the advice of fund counsel and Independent Trustees' counsel, requests and considers a broad range of information relevant to the renewal of the Advisory Contracts throughout the year.
The Board meets regularly and, at each of its meetings, covers an extensive agenda of topics and materials and considers factors that are relevant to its annual consideration of the renewal of the fund's Advisory Contracts, including the services and support provided to the fund and its shareholders. The Board has established various standing committees (Committees), each composed of and chaired by Independent Trustees with varying backgrounds, to which the Board has assigned specific subject matter responsibilities in order to enhance effective decision-making by the Board. The Board, acting directly and through its Committees, requests and receives information concerning the annual consideration of the renewal of the fund's Advisory Contracts. The Board also meets as needed to consider matters specifically related to the Board's annual consideration of the renewal of the Advisory Contracts. Members of the Board may also meet with trustees of other Fidelity funds through ad hoc joint committees to discuss certain matters relevant to the Fidelity funds.
At its July 2014 meeting, the Board, including the Independent Trustees, unanimously determined to renew the fund's Advisory Contracts. In reaching its determination, the Board considered all factors it believed relevant, including (i) the nature, extent, and quality of the services to be provided to the fund and its shareholders (including the investment performance of the fund); (ii) the competitiveness of the fund's management fee and total expense ratio relative to peer funds; (iii) the total costs of the services to be provided by and the profits to be realized by Fidelity from its relationship with the fund; (iv) the extent to which economies of scale exist and would be realized as the fund grows; and (v) whether fee levels reflect these economies of scale, if any, for the benefit of fund shareholders. In connection with separate internal corporate reorganizations involving Fidelity Management & Research (U.K.) Inc. (FMR U.K.) and Fidelity Management & Research (Japan) Inc. (FMR Japan), the Board approved certain non-material amendments to the fund's sub-advisory agreements with FMR U.K. and FMR Japan to reflect that, after these reorganizations, FMR Investment Management (UK) Limited and Fidelity Management & Research (Japan) Limited will carry on the business of FMR U.K. and FMR Japan, respectively. The Board noted that no changes to the portfolio managers or to the foreign research or investment advisory services provided to the fund were expected in connection with either reorganization and that the same personnel and resources would continue to be available to the fund at the new entities.
Annual Report
Board Approval of Investment Advisory Contracts and
Management Fees - continued
In considering whether to renew the Advisory Contracts for the fund, the Board reached a determination, with the assistance of fund counsel and Independent Trustees' counsel and through the exercise of its business judgment, that the renewal of the Advisory Contracts was in the best interests of the fund and its shareholders and that the compensation payable under the Advisory Contracts was fair and reasonable. The Board's decision to renew the Advisory Contracts was not based on any single factor, but rather was based on a comprehensive consideration of all the information provided to the Board at its meetings throughout the year. The Board, in reaching its determination to renew the Advisory Contracts, was aware that shareholders of the fund have a broad range of investment choices available to them, including a wide choice among funds offered by Fidelity's competitors, and that the fund's shareholders, who have the opportunity to review and weigh the disclosure provided by the fund in its prospectus and other public disclosures, have chosen to invest in this fund, which is part of the Fidelity family of funds.
Nature, Extent, and Quality of Services Provided. The Board considered Fidelity's staffing as it relates to the fund, including the backgrounds of investment personnel of FMR and the sub-advisers (together, the Investment Advisers), and also considered the fund's investment objective, strategies, and related investment philosophy. The Independent Trustees also had discussions with senior management of Fidelity's investment operations and investment groups. The Board considered the structure of the portfolio manager compensation program and whether this structure provides appropriate incentives to act in the best interests of the fund. Additionally, the Board considered the portfolio managers' investments, if any, in the funds that they manage.
Resources Dedicated to Investment Management and Support Services. The Board and the Fund Oversight and Research Committees reviewed the general qualifications and capabilities of Fidelity's investment staff, including its size, education, experience, and resources, as well as Fidelity's approach to recruiting, training, managing, and compensating investment personnel. The Board noted that Fidelity has continued to increase the resources devoted to non-U.S. offices, including expansion of Fidelity's global investment organization. The Board also noted that Fidelity's analysts have extensive resources, tools and capabilities that allow them to conduct sophisticated quantitative and fundamental analysis, as well as credit analysis of issuers, counterparties and guarantors. Further, the Board believes that Fidelity's investment professionals have sufficient access to global information and data so as to provide competitive investment results over time, and that those professionals also have access to sophisticated tools that permit them to assess portfolio construction and risk and performance attribution characteristics continuously, as well as to transmit new information and research conclusions rapidly around the world. Additionally, in its deliberations, the Board considered Fidelity's trading and risk management capabilities and resources and global compliance infrastructure, which are an integral part of the investment management process.
Annual Report
Shareholder and Administrative Services. The Board considered (i) the nature, extent, quality, and cost of advisory, administrative, and shareholder services performed by the Investment Advisers and their affiliates under the Advisory Contracts and under separate agreements covering transfer agency, pricing and bookkeeping, and securities lending services for the fund; (ii) the nature and extent of the supervision of third party service providers, principally custodians and subcustodians; and (iii) the resources devoted to, and the record of compliance with, the fund's compliance policies and procedures. The Board also reviewed the allocation of fund brokerage, including allocations to brokers affiliated with the Investment Advisers, the use of brokerage commissions to pay fund expenses, and the use of "soft" commission dollars to pay for research services.
The Board noted that the growth of fund assets over time across the complex allows Fidelity to reinvest in the development of services designed to enhance the value or convenience of the Fidelity funds as investment vehicles. These services include 24-hour access to account information and market information through telephone representatives and over the Internet, investor education materials and asset allocation tools, and the expanded availability of Fidelity Investor Centers.
In 2014, the Board formed an ad hoc Committee on Transfer Agency Fees to review the variety of transfer agency fee structures throughout the industry and Fidelity's competitive positioning with respect to industry participants.
Investment in a Large Fund Family. The Board considered the benefits to shareholders of investing in a Fidelity fund, including the benefits of investing in a fund that is part of a large family of funds offering a variety of investment disciplines and providing a large variety of mutual fund investor services. The Board noted that Fidelity had taken, or had made recommendations that resulted in the Fidelity funds taking, a number of actions over the previous year that benefited particular funds, including (i) continuing to dedicate additional resources to investment research and to the support of the senior management team that oversees asset management; (ii) persisting in efforts to enhance Fidelity's global research capabilities; (iii) launching new funds and making other enhancements to meet client needs for income-oriented solutions; (iv) reducing fund expenses for certain index funds; (v) continuing to launch dedicated lower cost underlying funds to meet portfolio construction needs related to expanding underlying fund options for Fidelity funds of funds, specifically for the Freedom Fund product lines; (vi) rationalizing product lines and gaining increased efficiencies through fund mergers; (vii) launching sector-based exchange-traded funds and establishing a new Fidelity adviser to manage sector-based funds and products; (viii) continuing to develop and implement technology to improve security and increase efficiency; (ix) modifying the eligibility criteria for certain share classes to increase their marketability to a portion of the defined contribution plan market; (x) waiving redemption fees for certain qualified fund-of-fund and wrap programs and certain retirement plan transactions; and (xi) launching new Institutional Class shares of certain money market funds to attract and retain assets and to fill a gap in the money market fund lineup.
Annual Report
Board Approval of Investment Advisory Contracts and
Management Fees - continued
Investment Performance. The Board considered whether the fund has operated in accordance with its investment objective, as well as its record of compliance with its investment restrictions and its performance history.
The Board took into account discussions with the Investment Advisers about fund investment performance that occur at Board meetings throughout the year. In this regard the Board noted that as part of regularly scheduled fund reviews and other reports to the Board on fund performance, the Board periodically considers annualized return information for the fund, for different time periods, measured against a securities market index ("benchmark index") and a peer group of funds with similar objectives ("peer group"). In its evaluation of fund investment performance, the Board gave particular attention to information indicating changes in performance of certain Fidelity funds for specific time periods and the Investment Advisers' explanations for any overperformance or underperformance.
In addition to reviewing absolute and relative fund performance, the Independent Trustees periodically consider the appropriateness of fund performance metrics in evaluating the results achieved. In general, the Independent Trustees believe that fund performance should be evaluated based on net performance (after fees and expenses) of both the highest performing and lowest performing classes, where applicable, compared to appropriate benchmark indices, over appropriate time periods which may include full market cycles, and compared to peer groups, as applicable, over the same periods, taking into account relevant factors including the following: general market conditions; issuer-specific information; tactical opportunities for investment; and fund cash flows and other factors.
The Independent Trustees recognize that shareholders evaluate performance on a net basis over their own holding periods, for which one-, three-, and five-year periods are often used as a proxy. For this reason, the performance information reviewed by the Board also included net cumulative calendar year total return information for the fund and an appropriate benchmark index and peer group for the most recent one-, three-, and five-year periods, as shown below. Returns are shown compared to the 25th percentile (top of box, 75% beaten) and 75th percentile (bottom of box, 25% beaten) of the peer universe. Returns of the benchmark index are "net MA," i.e., adjusted for tax withholding rates applicable to U.S.-based funds organized as Massachusetts business trusts.
Annual Report
Fidelity Advisor Global Capital Appreciation Fund
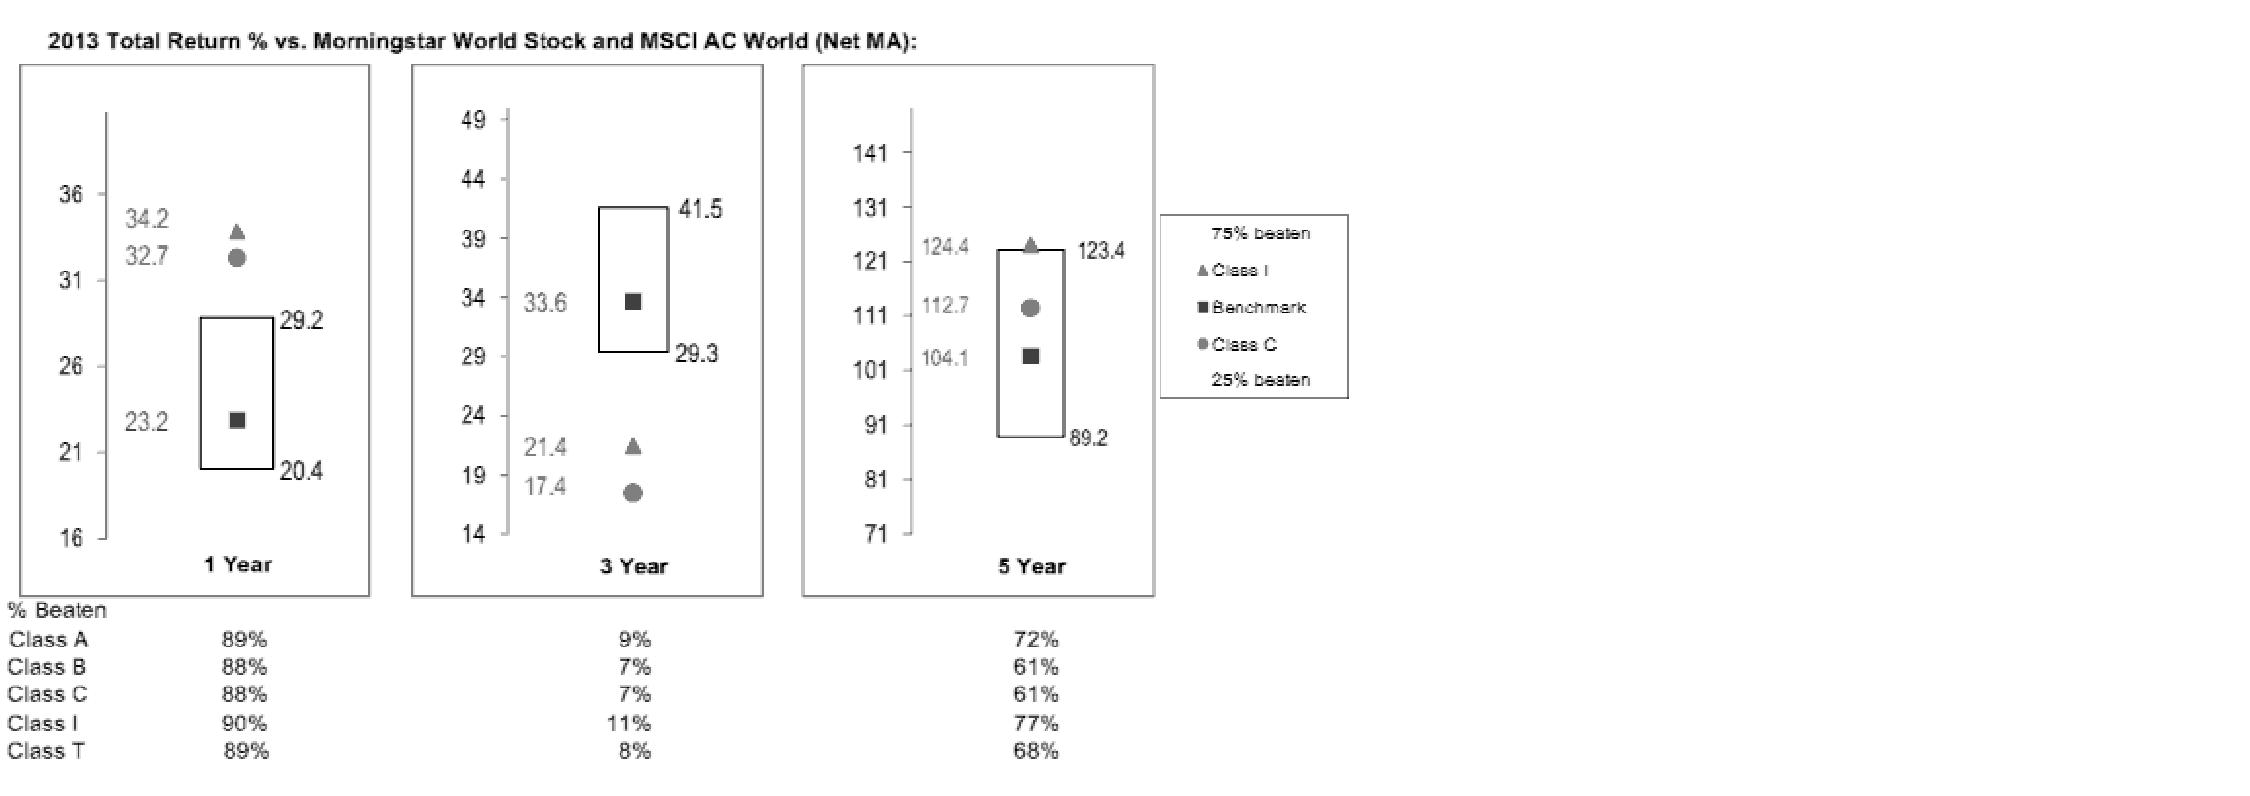
The Board also considered that the fund's management fee is subject to upward or downward adjustment depending upon whether, and to what extent, the fund's investment performance for the performance period exceeds, or is exceeded by, a securities index, thus leading to a performance adjustment for the same period. The Board noted that the performance adjustment provides FMR with a strong economic incentive to seek to achieve superior performance for the fund's shareholders and helps to more closely align the interests of FMR and the fund's shareholders.
Based on its review, the Board concluded that the nature, extent, and quality of services provided to the fund under the Advisory Contracts should benefit the fund's shareholders.
Competitiveness of Management Fee and Total Expense Ratio. The Board considered the fund's management fee and total expense ratio compared to "mapped groups" of competitive funds and classes. Fidelity creates "mapped groups" by combining similar Lipper investment objective categories that have comparable investment mandates. Combining Lipper investment objective categories aids the Board's management fee and total expense ratio comparisons by broadening the competitive group used for comparison and by reducing the number of universes to which various Fidelity funds are compared.
Management Fee. The Board considered two proprietary management fee comparisons for the 12-month periods shown in the chart below. The group of Lipper funds used by the Board for management fee comparisons is referred to below as the "Total Mapped Group." The Total Mapped Group comparison focuses on a fund's standing in terms of gross management fees before expense reimbursements or caps, and without giving effect to the fund's performance adjustment, relative to the total universe of funds with comparable investment mandates, regardless of whether their management fee structures also are comparable. Funds with comparable investment mandates offer exposure to similar types of securities. Funds with comparable management fee structures have similar management fee contractual arrangements (e.g., flat rate charged for advisory services, all-inclusive fee rate, etc.). "TMG %" represents the percentage of funds in the Total Mapped Group that had management fees that were lower than the fund's. For example, a hypothetical TMG % of 20% would mean that 80% of the funds in the Total Mapped Group had higher, and 20% had lower, management fees than the fund. The fund's actual TMG %s are in the chart below. The "Asset-Size Peer Group" (ASPG) comparison focuses on a fund's standing relative to a subset of non-Fidelity funds within the Total Mapped Group that are similar in size and management fee structure. For example, if a fund is in the first quartile of the ASPG, the fund's management fee ranks in the least expensive or lowest 25% of funds in the ASPG. The ASPG represents at least 15% of the funds in the Total Mapped Group with comparable asset size and management fee structures, subject to a minimum of 50 funds (or all funds in the Total Mapped Group if fewer than 50). Additional information, such as the ASPG quartile in which the fund's management fee rate ranked and the impact of the fund's performance adjustment, is also included in the chart and considered by the Board.
Annual Report
Board Approval of Investment Advisory Contracts and
Management Fees - continued
Fidelity Advisor Global Capital Appreciation Fund
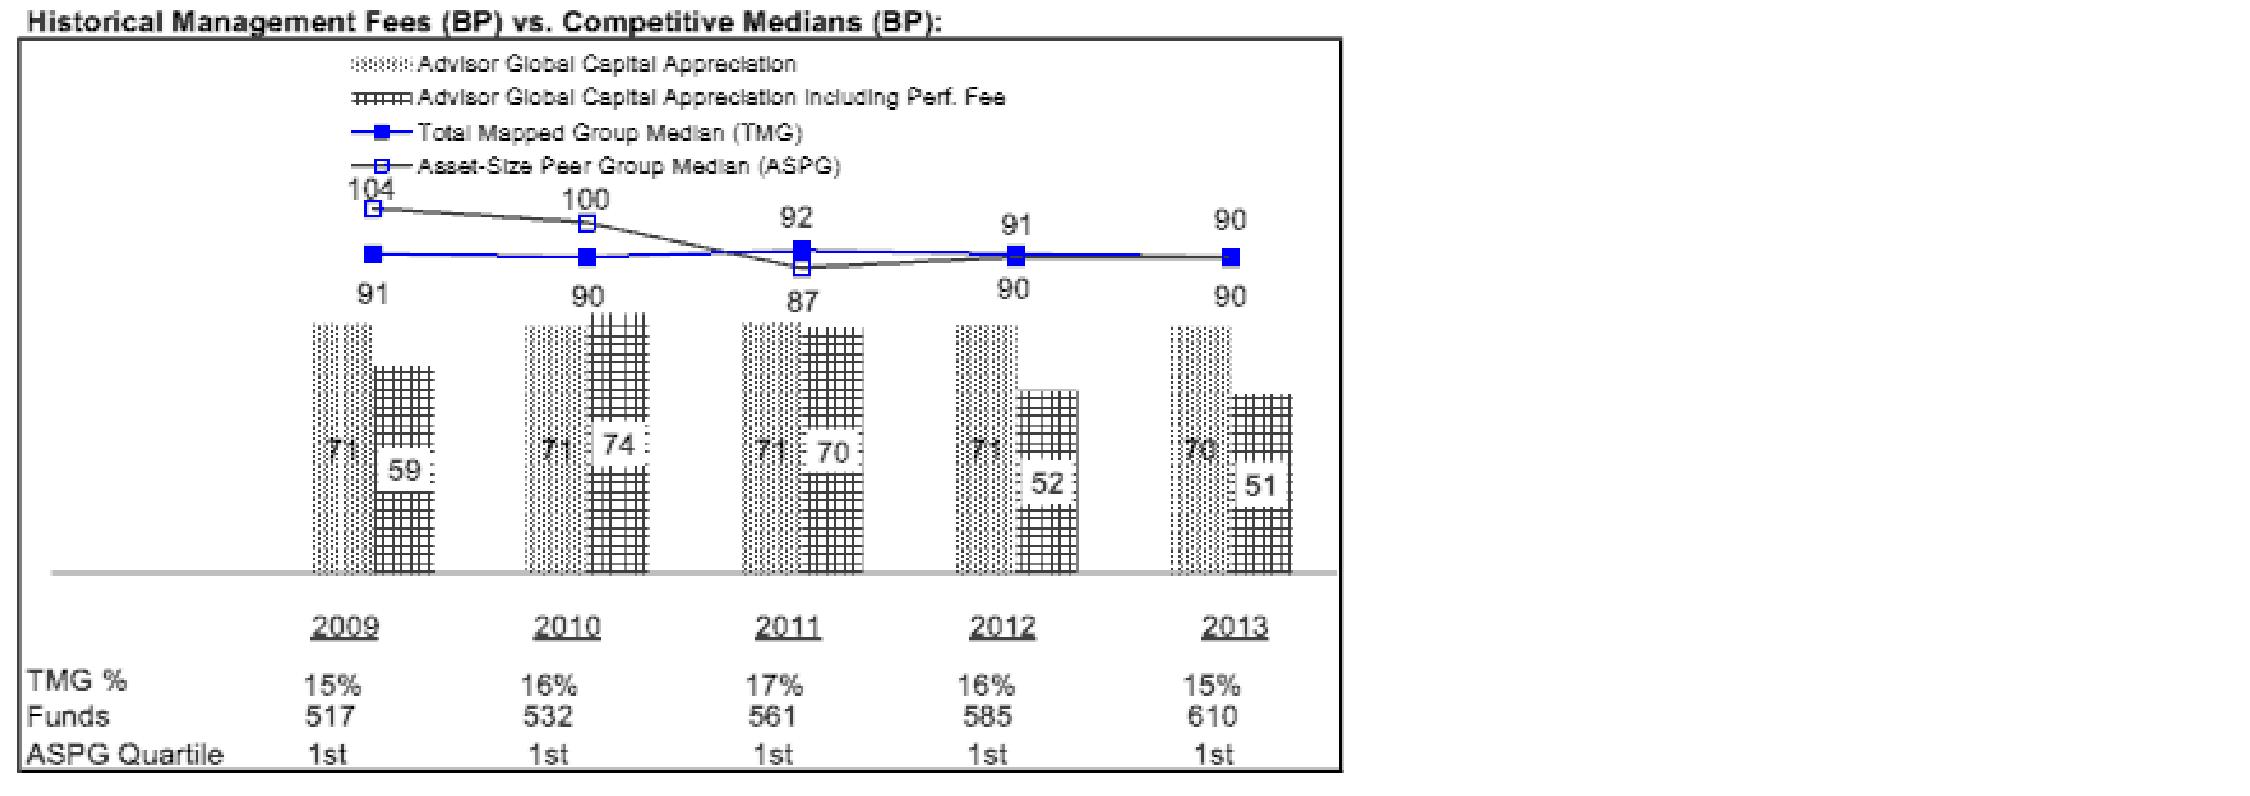
The Board noted that the fund's management fee rate ranked below the median of its Total Mapped Group and below the median of its ASPG for 2013. The Board also noted the effect of the fund's negative performance adjustment on the fund's management fee ranking.
Annual Report
The Board also noted that, in August 2013, the ad hoc Committee on Management Fees was formed to conduct an in-depth review of the management fee rates of Fidelity's active equity mutual funds. The Committee focused on the following areas: (i) standard fee structures; (ii) research consumption and trading evolution; (iii) management fee competitiveness/profitability by category; and (iv) factors that drive institutional pricing.
Based on its review, the Board concluded that the fund's management fee is fair and reasonable in light of the services that the fund receives and the other factors considered.
Total Expense Ratio. In its review of each class's total expense ratio, the Board considered the fund's management fee as well as other fund or class expenses, as applicable, such as transfer agent fees, pricing and bookkeeping fees, fund-paid 12b-1 fees, and custodial, legal, and audit fees. The Board also noted the effects of any waivers and reimbursements on fees and expenses, as well as the impact of the fund's performance adjustment. As part of its review, the Board also considered the current and historical total expense ratios of each class of the fund compared to competitive fund median expenses. Each class of the fund is compared to those funds and classes in the Total Mapped Group (used by the Board for management fee comparisons) that have a similar sales load structure.
The Board noted that the total expense ratio of each of Class A and Institutional Class ranked below its competitive median for 2013 and the total expense ratio of each of Class T, Class B, and Class C ranked above its competitive median for 2013. The Board considered that, in general, various factors can affect total expense ratios. The Board noted that the total expense ratio of Class T was above the competitive median primarily because of higher 12b-1 fees on Class T as compared to most competitor funds. Class T has a higher 12b-1 fee, but a lower front-end sales charge, than traditionally priced front-end sales charge classes. The Board considered that Class T is primarily sold load-waived in the retirement plan market where its 0.50% 12b-1 fee is comparable to competing no-load, higher 12b-1 fee classes designed specifically for retirement plans. The Board noted that the fund offers multiple classes, each of which has a different sales load and 12b-1 fee structure, and that the multiple structures are intended to offer a range of pricing options for the intermediary market. The Board also noted that the total expense ratios of the classes vary primarily by the level of their 12b-1 fees, although differences in transfer agent fees may also cause expenses to vary from class to class.
The Board further considered that FMR contractually agreed to reimburse Class A, Class T, Class B, Class C, and Institutional Class of the fund to the extent that total operating expenses (excluding interest, certain taxes, certain securities lending costs, brokerage commissions, extraordinary expenses, and acquired fund fees and expenses, if any), as a percentage of their respective average net assets, exceed 1.45%, 1.70%, 2.20%, 2.20%, and 1.20% through December 31, 2014.
Annual Report
Board Approval of Investment Advisory Contracts and
Management Fees - continued
Fees Charged to Other Fidelity Clients. The Board also considered Fidelity fee structures and other information with respect to clients of Fidelity, such as other funds advised or subadvised by Fidelity, pension plan clients, and other institutional clients. The Board noted the findings of the 2013 ad hoc joint committee (created with the board of other Fidelity funds), which reviewed and compared Fidelity's institutional investment advisory business with its business of providing services to the Fidelity funds, including the differences in services provided, fees charged, and costs incurred, as well as competition in their respective marketplaces.
Based on its review of total expense ratios and fees charged to other Fidelity clients, the Board concluded that the total expense ratio of each class of the fund was reasonable, although in some cases above the median of the universe presented for comparison, in light of the services that the fund and its shareholders receive and the other factors considered.
Costs of the Services and Profitability. The Board considered the revenues earned and the expenses incurred by Fidelity in conducting the business of developing, marketing, distributing, managing, administering and servicing the fund and servicing the fund's shareholders. The Board also considered the level of Fidelity's profits in respect of all the Fidelity funds.
On an annual basis, Fidelity presents to the Board Fidelity's profitability for the fund. Fidelity calculates the profitability for each fund, as well as aggregate profitability for groups of Fidelity funds and all Fidelity funds, using a series of detailed revenue and cost allocation methodologies which originate with the books and records of Fidelity on which Fidelity's audited financial statements are based. The Audit Committee of the Board reviews any significant changes from the prior year's methodologies.
PricewaterhouseCoopers LLP (PwC), independent registered public accounting firm and auditor to Fidelity and certain Fidelity funds, has been engaged annually by the Board as part of the Board's assessment of Fidelity's profitability analysis. PwC's engagement includes the review and assessment of the methodologies used by Fidelity in determining the revenues and expenses attributable to Fidelity's mutual fund business, and completion of agreed-upon procedures in respect of the mathematical accuracy of fund profitability and its conformity to established allocation methodologies. After considering PwC's reports issued under the engagement and information provided by Fidelity, the Board concluded that while other allocation methods may also be reasonable, Fidelity's profitability methodologies are reasonable in all material respects.
Annual Report
The Board also reviewed Fidelity's non-fund businesses and fall-out benefits related to the mutual fund business as well as cases where Fidelity's affiliates may benefit from or be related to the fund's business.
The Board considered the costs of the services provided by and the profits realized by Fidelity in connection with the operation of the fund and was satisfied that the profitability was not excessive in the circumstances.
Economies of Scale. The Board considered whether there have been economies of scale in respect of the management of the Fidelity funds, whether the Fidelity funds (including the fund) have appropriately benefited from any such economies of scale, and whether there is potential for realization of any further economies of scale. The Board considered the extent to which the fund will benefit from economies of scale through increased services to the fund, through waivers or reimbursements, or through fee or expense ratio reductions. The Board also noted that in 2013, it and the boards of other Fidelity funds created an ad hoc committee (the Economies of Scale Committee) to analyze whether Fidelity attains economies of scale in respect of the management and servicing of the Fidelity funds, whether the Fidelity funds have appropriately benefited from such economies of scale, and whether there is potential for realization of any further economies of scale.
The Board recognized that the fund's management contract incorporates a "group fee" structure, which provides for lower group fee rates as total group assets increase, and for higher group fee rates as total group assets decrease (with "group assets" defined to include fund assets under FMR's management plus sector fund assets previously under FMR's management and currently managed by Fidelity SelectCo, LLC). FMR calculates the group fee rates based on a tiered asset "breakpoint" schedule that varies based on asset class. The Board considered that the group fee is designed to deliver the benefits of economies of scale to fund shareholders when total Fidelity fund assets increase, even if assets of any particular fund are unchanged or have declined, because some portion of Fidelity's costs are attributable to services provided to all Fidelity funds, and all funds benefit if those costs can be allocated among more assets. The Board concluded that, given the group fee structure, fund shareholders will benefit from lower management fees as group assets increase at the fund complex level, regardless of whether Fidelity achieves any such economies of scale.
The Board concluded, taking into account the analysis of the Economies of Scale Committee, that economies of scale, if any, are being appropriately shared between fund shareholders and Fidelity.
Additional Information Requested by the Board. In order to develop fully the factual basis for consideration of the Fidelity funds' Advisory Contracts, the Board requested and received additional information on certain topics, including: (i) fund performance trends and Fidelity's long-term strategies for certain funds; (ii) Fidelity's strategic marketing and product lineup goals; (iii) the methodology with respect to competitive fund data and peer group classifications; (iv) the arrangements with, and performance of, certain sub-advisers on behalf of the Fidelity funds, as well as certain proposed participating affiliate arrangements; (v) the realization of fall-out benefits in certain Fidelity business units; (vi) Fidelity's group fee structures, including the rationale for the individual fee rates of certain categories of funds and the definition of group assets; (vii) trends regarding industry use of performance fee structures and the performance adjustment methodologies applicable to the Fidelity funds; (viii) additional competitive analysis regarding the total expenses for certain classes; (ix) fund profitability methodology, including Fidelity's cost allocation methodology, and the impact of certain factors on fund profitability results; and (x) the process by which Fidelity determines sub-advisory fees for funds it advises.
Annual Report
Board Approval of Investment Advisory Contracts and
Management Fees - continued
Based on its evaluation of all of the conclusions noted above, and after considering all factors it believed relevant, the Board ultimately concluded that the advisory fee structures are fair and reasonable, and that the fund's Advisory Contracts should be renewed.
Annual Report
Investment Adviser
Fidelity Management & Research Company
Boston, MA
Investment Sub-Advisers
FMR Co., Inc.
Fidelity Management & Research
(U.K.) Inc.
Fidelity Management & Research
(Hong Kong) Limited
Fidelity Management & Research
(Japan) Limited
FIL Investment Advisors
FIL Investment Advisors (UK) Limited
FIL Investments (Japan) Limited
General Distributor
Fidelity Distributors Corporation
Smithfield, RI
Transfer and Service Agents
Fidelity Investments Institutional Operations Company, Inc.
Boston, MA
Fidelity Service Company, Inc.
Boston, MA
Custodian
State Street Bank and Trust Company
Quincy, MA
(Fidelity Investment logo)(registered trademark)
AGLOI-UANN-1214
1.784745.111
(Fidelity Investment logo)(registered trademark)
Fidelity Advisor®
Global Equity Income
Fund - Class A, Class T, and Class C
Annual Report
October 31, 2014
(Fidelity Cover Art)
Contents
Performance | (Click Here) | How the fund has done over time. |
Management's Discussion of Fund Performance | (Click Here) | The Portfolio Manager's review of fund performance and strategy. |
Shareholder Expense Example | (Click Here) | An example of shareholder expenses. |
Investment Changes | (Click Here) | A summary of major shifts in the fund's investments over the past six months. |
Investments | (Click Here) | A complete list of the fund's investments with their market values. |
Financial Statements | (Click Here) | Statements of assets and liabilities, operations, and changes in net assets, as well as financial highlights. |
Notes | (Click Here) | Notes to the financial statements. |
Report of Independent Registered Public Accounting Firm | (Click Here) | |
Trustees and Officers | (Click Here) | |
Distributions | (Click Here) | |
Board Approval of Investment Advisory Contracts and Management Fees | (Click Here) | |
To view a fund's proxy voting guidelines and proxy voting record for the 12-month period ended June 30, visit http://www.fidelity.com/proxyvotingresults or visit the Securities and Exchange Commission's (SEC) web site at http://www.sec.gov. You may also call 1-877-208-0098 to request a free copy of the proxy voting guidelines.
Standard & Poor's, S&P and S&P 500 are registered service marks of The McGraw-Hill Companies, Inc. and have been licensed for use by Fidelity Distributors Corporation.
Other third-party marks appearing herein are the property of their respective owners.
All other marks appearing herein are registered or unregistered trademarks or service marks of FMR LLC or an affiliated company. © 2014 FMR LLC. All rights reserved.
Annual Report
This report and the financial statements contained herein are submitted for the general information of the shareholders of the fund. This report is not authorized for distribution to prospective investors in the fund unless preceded or accompanied by an effective prospectus.
A fund files its complete schedule of portfolio holdings with the SEC for the first and third quarters of each fiscal year on Form N-Q. Forms N-Q are available on the SEC's web site at http://www.sec.gov. A fund's Forms N-Q may be reviewed and copied at the SEC's Public Reference Room in Washington, DC. Information regarding the operation of the SEC's Public Reference Room may be obtained by calling 1-800-SEC-0330. For a complete list of a fund's portfolio holdings, view the most recent holdings listing, semiannual report, or annual report on Fidelity's web site at http://www.fidelity.com, http://www.advisor.fidelity.com, or http://www.401k.com, as applicable.
NOT FDIC INSURED • MAY LOSE VALUE • NO BANK GUARANTEE
Neither the fund nor Fidelity Distributors Corporation is a bank.
Annual Report
Average annual total return reflects the change in the value of an investment, assuming reinvestment of the class' distributions from dividend income and capital gains (the profits earned upon the sale of securities that have grown in value, if any) and assuming a constant rate of performance each year. The $10,000 table and the fund's returns do not reflect the deduction of taxes that a shareholder would pay on fund distributions or the redemption of fund shares. During periods of reimbursement by Fidelity, a fund's total return will be greater than it would be had the reimbursement not occurred. How a fund did yesterday is no guarantee of how it will do tomorrow.
Average Annual Total Returns
Periods ended October 31, 2014 | Past 1
year | Life of fund A |
Class A (incl. 5.75% sales charge) | 3.39% | 10.93% |
Class T (incl. 3.50% sales charge) | 5.52% | 11.69% |
Class C (incl. contingent deferred sales charge) B | 7.83% | 12.73% |
A From May 2, 2012.
B Class C shares' contingent deferred sales charges included in the past one year and life of fund total return figures are 1% and 0%, respectively.
Annual Report
$10,000 Over Life of Fund
Let's say hypothetically that $10,000 was invested in Fidelity Advisor® Global Equity Income Fund - Class A on May 2, 2012, when the fund started, and the current 5.75% sales charge was paid. The chart shows how the value of your investment would have changed, and also shows how the MSCI ACWI (All Country World Index) Index performed over the same period.
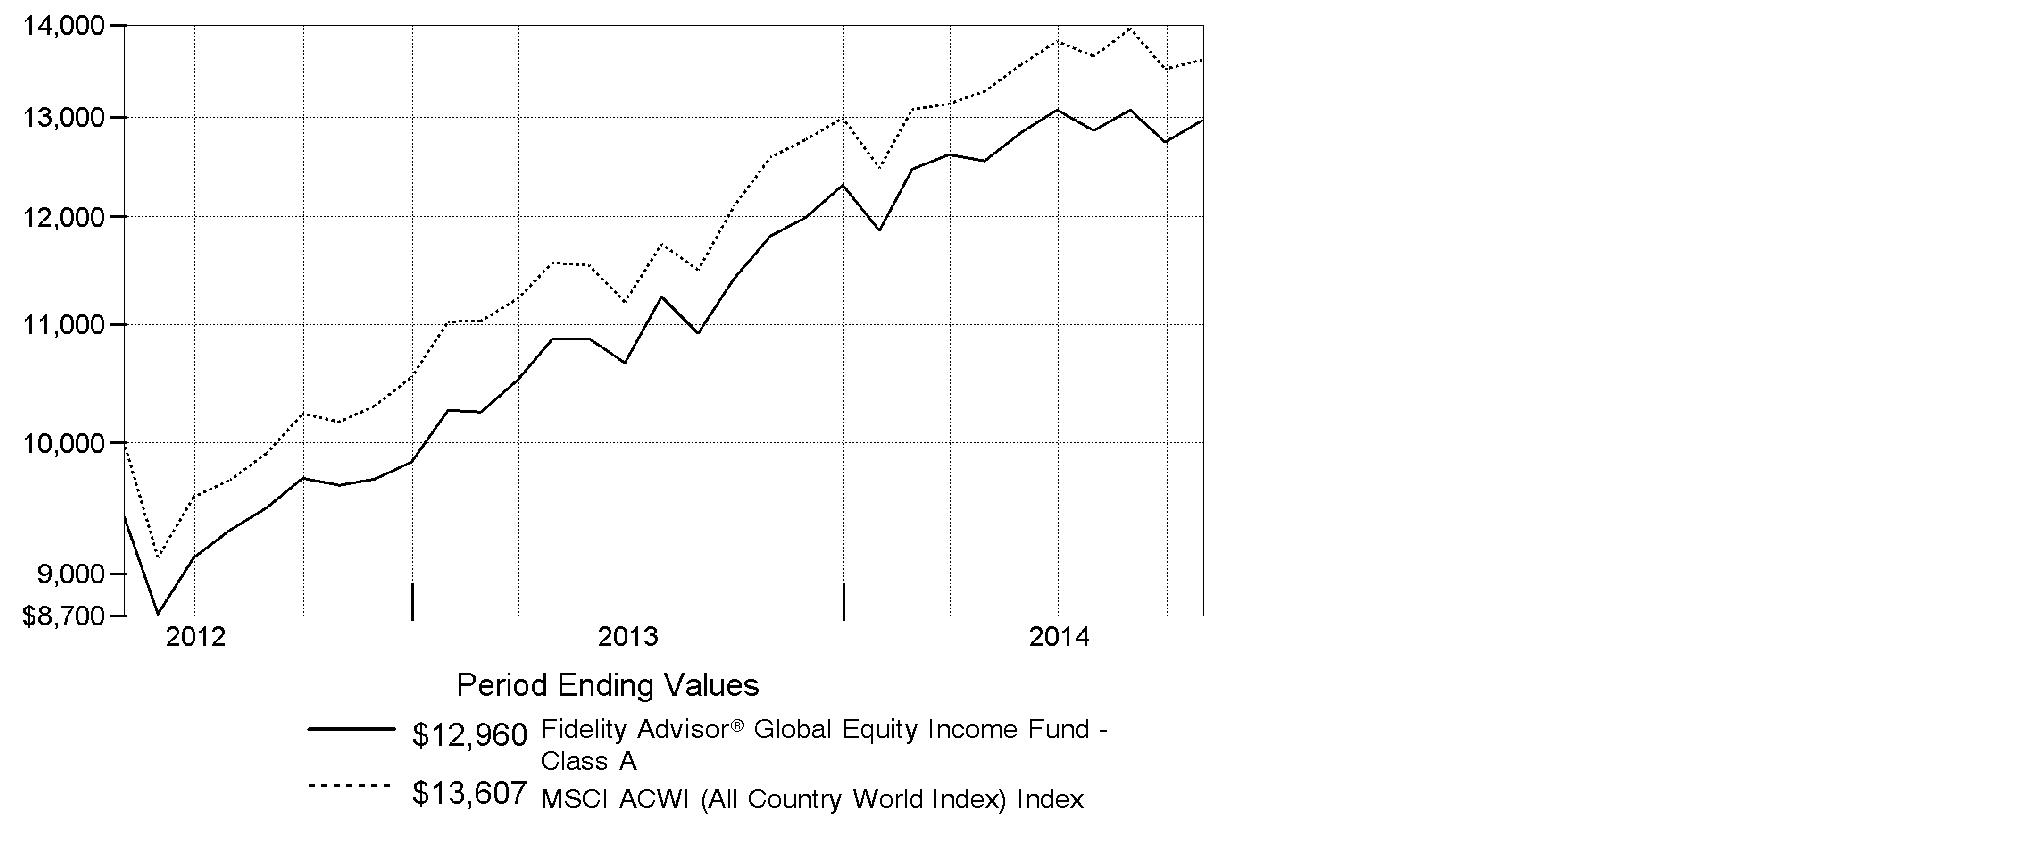
Annual Report
Market Recap: Global equities posted a healthy gain for the 12 months ending October 31, 2014, overcoming an October market decline driven by recessionary pressures in China and tepid growth in Europe. The MSCI ACWI (All Country World Index) Index rose 8.15%, helped by subdued market volatility for much of the period and supported by solid corporate earnings, especially in the United States. Stocks also benefited from easy monetary policies in Japan and the eurozone, as well as increased stimulus efforts in China. All but three of the 24 industry groups that compose the index marked a positive return. The U.S. (+17%) remained a pillar of strength, while a strongly rising dollar in the latter part of the period detracted from investors' returns in most non-U.S. markets. Canada (+5%) notched broad gains outside of its energy and materials sectors, as did Asia-Pacific ex Japan (+4%), led by investor enthusiasm for companies in India. The U.K., Europe and Japan, meanwhile, all underperformed. Among sectors, health care (+24%) led the index, with a strong contribution from the pharmaceuticals, biotechnology & life sciences industry. Information technology (+21%) also outperformed. Conversely, materials (-4%) and energy (-1%) lagged the index due to a higher supply of and lower demand for commodities.
Comments from Ramona Persaud, Portfolio Manager of Fidelity Advisor® Global Equity Income Fund: For the year, the fund's Class A, Class T and Class C shares gained 9.70%, 9.34% and 8.83%, respectively (excluding sales charges), outperforming the MSCI ACWI index. Versus the index, stock selection in several areas drove the fund's outperformance, especially in consumer staples where Dr Pepper Snapple Group added value and was the fund's most overweighted position at period end. Shares of the beverage maker gained on stable pricing in its markets, as well as very strong capital allocation policies including an attractive dividend and generous share buybacks. Other interesting contributors from the sector included Greencore Group, a Dublin-based prepared-foods producer, and South Africa's Astral Foods, a poultry producer. Neither was in the index. In order to lock in profits, I sold the fund's position in Astral by period end. Elsewhere, biotechnology firm Amgen also helped. The biggest individual detractor was a non-index stake in Reunert, a South African industrial conglomerate that struggled with sluggish end markets the past year. It also hurt to avoid index component Gilead Sciences, a biotech firm that did well on its ground-breaking treatment for hepatitis C. Gilead, however, does not pay a dividend, which means it's not a name likely to be held in this portfolio or other equity-income funds.
The views expressed above reflect those of the portfolio manager(s) only through the end of the period as stated on the cover of this report and do not necessarily represent the views of Fidelity or any other person in the Fidelity organization. Any such views are subject to change at any time based upon market or other conditions and Fidelity disclaims any responsibility to update such views. These views may not be relied on as investment advice and, because investment decisions for a Fidelity fund are based on numerous factors, may not be relied on as an indication of trading intent on behalf of any Fidelity fund.
Annual Report
Shareholder Expense Example
As a shareholder of the Fund, you incur two types of costs: (1) transaction costs, including sales charges (loads) on purchase payments or redemption proceeds, and (2) ongoing costs, including management fees, distribution and/or service (12b-1) fees and other Fund expenses. This Example is intended to help you understand your ongoing costs (in dollars) of investing in the Fund and to compare these costs with the ongoing costs of investing in other mutual funds.
The Example is based on an investment of $1,000 invested at the beginning of the period and held for the entire period (May 1, 2014 to October 31, 2014).
Actual Expenses
The first line of the accompanying table for each class of the Fund provides information about actual account values and actual expenses. You may use the information in this line, together with the amount you invested, to estimate the expenses that you paid over the period. Simply divide your account value by $1,000.00 (for example, an $8,600 account value divided by $1,000.00 = 8.6), then multiply the result by the number in the first line for a class of the Fund under the heading entitled "Expenses Paid During Period" to estimate the expenses you paid on your account during this period. In addition, the Fund, as a shareholder in the underlying Fidelity Central Funds, will indirectly bear its pro-rata share of the fees and expenses incurred by the underlying Fidelity Central Funds. These fees and expenses are not included in the Fund's annualized expense ratio used to calculate the expense estimate in the table below.
Hypothetical Example for Comparison Purposes
The second line of the accompanying table for each class of the Fund provides information about hypothetical account values and hypothetical expenses based on a Class' actual expense ratio and an assumed rate of return of 5% per year before expenses, which is not the Class' actual return. The hypothetical account values and expenses may not be used to estimate the actual ending account balance or expenses you paid for the period. You may use this information to compare the ongoing costs of investing in the Fund and other funds. To do so, compare this 5% hypothetical example with the 5% hypothetical examples that appear in the shareholder reports of the other funds. In addition, the Fund, as a shareholder in the underlying Fidelity Central Funds, will indirectly bear its pro-rata share of the fees and expenses incurred by the underlying Fidelity Central Funds. These fees and expenses are not included in the Fund's annualized expense ratio used to calculate the expense estimate in the table below.
Please note that the expenses shown in the table are meant to highlight your ongoing costs only and do not reflect any transaction costs. Therefore, the second line of the table is useful in comparing ongoing costs only, and will not help you determine the relative total costs of owning different funds. In addition, if these transactional costs were included, your costs would have been higher.
Annual Report
| Annualized
Expense RatioB | Beginning
Account Value
May 1, 2014 | Ending
Account Value
October 31, 2014 | Expenses Paid
During Period*
May 1, 2014 to
October 31, 2014 |
Class A | 1.45% | | | |
Actual | | $ 1,000.00 | $ 1,032.50 | $ 7.43 |
HypotheticalA | | $ 1,000.00 | $ 1,017.90 | $ 7.38 |
Class T | 1.70% | | | |
Actual | | $ 1,000.00 | $ 1,031.30 | $ 8.70 |
HypotheticalA | | $ 1,000.00 | $ 1,016.64 | $ 8.64 |
Class C | 2.20% | | | |
Actual | | $ 1,000.00 | $ 1,028.90 | $ 11.25 |
HypotheticalA | | $ 1,000.00 | $ 1,014.12 | $ 11.17 |
Institutional Class | 1.20% | | | |
Actual | | $ 1,000.00 | $ 1,033.80 | $ 6.15 |
HypotheticalA | | $ 1,000.00 | $ 1,019.16 | $ 6.11 |
A 5% return per year before expenses
B Annualized expense ratio reflects expenses net of applicable fee waivers.
* Expenses are equal to each Class' annualized expense ratio, multiplied by the average account value over the period, multiplied by 184/365 (to reflect the one-half year period).
Annual Report
Investment Changes (Unaudited)
Top Five Stocks as of October 31, 2014 |
| % of fund's
net assets | % of fund's net assets
6 months ago |
Apple, Inc. (United States of America, Technology Hardware, Storage & Peripherals) | 2.5 | 0.0 |
Johnson & Johnson (United States of America, Pharmaceuticals) | 2.4 | 1.4 |
JPMorgan Chase & Co. (United States of America, Banks) | 2.3 | 2.1 |
Amgen, Inc. (United States of America, Biotechnology) | 2.1 | 1.5 |
Roche Holding AG (participation certificate) (Switzerland, Pharmaceuticals) | 2.0 | 2.1 |
| 11.3 | |
Top Five Market Sectors as of October 31, 2014 |
| % of fund's
net assets | % of fund's net assets
6 months ago |
Financials | 20.5 | 22.7 |
Consumer Discretionary | 14.1 | 12.4 |
Health Care | 13.5 | 9.7 |
Information Technology | 11.9 | 11.3 |
Consumer Staples | 10.3 | 11.2 |
Top Five Countries as of October 31, 2014 |
(excluding cash equivalents) | % of fund's
net assets | % of fund's net assets
6 months ago |
United States of America | 48.2 | 41.3 |
Japan | 9.8 | 6.7 |
United Kingdom | 6.0 | 9.8 |
Switzerland | 4.3 | 3.9 |
Canada | 4.2 | 3.9 |
Percentages are adjusted for the effect of open futures contracts, if applicable. |
Asset Allocation (% of fund's net assets) |
As of October 31, 2014 | As of April 30, 2014 |
 | Stocks 95.8% | | | Stocks 96.5% | |
 | Short-Term
Investments and
Net Other Assets (Liabilities) 4.2% | | | Short-Term
Investments and
Net Other Assets (Liabilities) 3.5% | |

Annual Report
Investments October 31, 2014
Showing Percentage of Net Assets
Common Stocks - 95.8% |
| Shares | | Value |
Australia - 0.6% |
Woodside Petroleum Ltd. | 1,710 | | $ 60,740 |
Bailiwick of Jersey - 0.6% |
Shire PLC | 1,000 | | 67,097 |
Canada - 4.2% |
Constellation Software, Inc. | 100 | | 28,171 |
Corus Entertainment, Inc. Class B (non-vtg.) | 3,860 | | 71,032 |
Fairfax Financial Holdings Ltd. (sub. vtg.) | 130 | | 59,395 |
Potash Corp. of Saskatchewan, Inc. | 3,340 | | 114,005 |
PrairieSky Royalty Ltd. | 1,100 | | 33,867 |
Suncor Energy, Inc. | 3,930 | | 139,549 |
TOTAL CANADA | | 446,019 |
Cayman Islands - 0.3% |
SITC International Holdings Co. Ltd. | 55,000 | | 29,298 |
Chile - 0.4% |
Quinenco SA | 18,315 | | 38,036 |
Denmark - 0.7% |
Spar Nord Bank A/S | 2,800 | | 28,285 |
Vestas Wind Systems A/S (a) | 1,400 | | 46,859 |
TOTAL DENMARK | | 75,144 |
France - 2.7% |
Bureau Veritas SA | 3,096 | | 76,548 |
Renault SA | 917 | | 68,063 |
Total SA | 2,261 | | 134,989 |
TOTAL FRANCE | | 279,600 |
Germany - 2.1% |
AURELIUS AG | 1,299 | | 45,124 |
Gerry Weber International AG (Bearer) | 1,340 | | 53,785 |
OSRAM Licht AG (a) | 1,449 | | 50,770 |
Siemens AG | 664 | | 74,895 |
TOTAL GERMANY | | 224,574 |
Greece - 0.3% |
Greek Organization of Football Prognostics SA | 2,700 | | 32,718 |
Hong Kong - 1.3% |
HKT Trust/HKT Ltd. unit | 44,280 | | 53,943 |
Techtronic Industries Co. Ltd. | 26,500 | | 82,961 |
TOTAL HONG KONG | | 136,904 |
Common Stocks - continued |
| Shares | | Value |
Ireland - 1.5% |
Accenture PLC Class A | 1,190 | | $ 96,533 |
Greencore Group PLC | 15,815 | | 66,385 |
TOTAL IRELAND | | 162,918 |
Israel - 2.5% |
Bezeq The Israel Telecommunication Corp. Ltd. | 31,500 | | 53,254 |
Rami Levi Chain Stores Hashikma Marketing 2006 Ltd. | 900 | | 40,069 |
Teva Pharmaceutical Industries Ltd. sponsored ADR | 2,984 | | 168,506 |
TOTAL ISRAEL | | 261,829 |
Japan - 9.8% |
Astellas Pharma, Inc. | 11,400 | | 176,934 |
Broadleaf Co. Ltd. | 2,900 | | 45,835 |
Daiichikosho Co. Ltd. | 2,100 | | 52,997 |
Fukuda Denshi Co. Ltd. | 500 | | 25,591 |
Hoya Corp. | 3,700 | | 130,931 |
Japan Tobacco, Inc. | 2,400 | | 81,886 |
KDDI Corp. | 1,500 | | 98,504 |
Leopalace21 Corp. (a) | 7,000 | | 43,844 |
Mitsubishi Electric Corp. | 4,000 | | 51,575 |
Monex Group, Inc. | 19,500 | | 49,770 |
NEC Corp. | 22,000 | | 77,800 |
Nippon Telegraph & Telephone Corp. | 1,200 | | 74,663 |
Tsuruha Holdings, Inc. | 1,300 | | 76,753 |
VT Holdings Co. Ltd. | 6,200 | | 24,485 |
Workman Co. Ltd. | 500 | | 26,133 |
TOTAL JAPAN | | 1,037,701 |
Korea (South) - 0.8% |
Coway Co. Ltd. | 310 | | 23,543 |
Samsung Electronics Co. Ltd. | 52 | | 60,206 |
TOTAL KOREA (SOUTH) | | 83,749 |
Luxembourg - 0.3% |
Altice SA | 500 | | 31,135 |
Netherlands - 1.1% |
LyondellBasell Industries NV Class A | 1,222 | | 111,972 |
Norway - 0.2% |
Gjensidige Forsikring ASA | 1,400 | | 25,426 |
Singapore - 1.2% |
United Overseas Bank Ltd. | 7,179 | | 128,617 |
Common Stocks - continued |
| Shares | | Value |
South Africa - 1.8% |
Lewis Group Ltd. | 19,200 | | $ 115,673 |
Reunert Ltd. | 14,300 | | 75,469 |
TOTAL SOUTH AFRICA | | 191,142 |
Spain - 0.5% |
Atresmedia Corporacion de Medios de Comunicacion SA | 3,600 | | 52,738 |
Sweden - 4.1% |
Intrum Justitia AB | 3,240 | | 96,268 |
Meda AB (A Shares) | 3,890 | | 51,100 |
Nordea Bank AB | 13,280 | | 170,313 |
Svenska Handelsbanken AB (A Shares) | 2,360 | | 112,532 |
TOTAL SWEDEN | | 430,213 |
Switzerland - 4.3% |
Banque Cantonale Vaudoise (Bearer) | 120 | | 64,231 |
Roche Holding AG (participation certificate) | 706 | | 208,342 |
TE Connectivity Ltd. | 1,426 | | 87,171 |
UBS AG | 5,168 | | 89,862 |
TOTAL SWITZERLAND | | 449,606 |
Taiwan - 0.3% |
Vanguard International Semiconductor Corp. | 24,000 | | 36,001 |
United Kingdom - 6.0% |
Ashmore Group PLC | 5,400 | | 27,522 |
British American Tobacco PLC (United Kingdom) | 2,078 | | 117,776 |
Exova Group Ltd. PLC (a) | 1,800 | | 4,888 |
GlaxoSmithKline PLC | 6,925 | | 156,602 |
Hilton Food Group PLC | 11,081 | | 66,474 |
ITV PLC | 24,707 | | 80,233 |
Reckitt Benckiser Group PLC | 507 | | 42,580 |
Taylor Wimpey PLC | 358 | | 678 |
Tesco PLC | 11,000 | | 30,536 |
WH Smith PLC | 5,877 | | 105,766 |
TOTAL UNITED KINGDOM | | 633,055 |
United States of America - 48.2% |
AbbVie, Inc. | 1,371 | | 87,004 |
American Tower Corp. | 1,010 | | 98,475 |
Amgen, Inc. | 1,348 | | 218,619 |
Apple, Inc. | 2,434 | | 262,868 |
ARAMARK Holdings Corp. | 1,897 | | 52,945 |
Bank of America Corp. | 10,547 | | 180,987 |
Common Stocks - continued |
| Shares | | Value |
United States of America - continued |
Capital One Financial Corp. | 1,737 | | $ 143,771 |
Chevron Corp. | 1,520 | | 182,324 |
CMS Energy Corp. | 1,609 | | 52,566 |
Comcast Corp. Class A | 1,548 | | 85,682 |
Community Trust Bancorp, Inc. | 1,624 | | 58,383 |
CVB Financial Corp. | 4,544 | | 71,704 |
Danaher Corp. | 1,100 | | 88,440 |
Darden Restaurants, Inc. | 1,401 | | 72,544 |
Dr. Pepper Snapple Group, Inc. | 2,758 | | 190,992 |
Dun & Bradstreet Corp. | 703 | | 86,335 |
E.I. du Pont de Nemours & Co. | 600 | | 41,490 |
Exxon Mobil Corp. | 1,778 | | 171,950 |
FedEx Corp. | 750 | | 125,550 |
Freeport-McMoRan, Inc. | 1,915 | | 54,578 |
General Electric Co. | 5,479 | | 141,413 |
H&R Block, Inc. | 2,185 | | 70,597 |
IBM Corp. | 829 | | 136,288 |
Johnson & Johnson | 2,302 | | 248,110 |
Johnson Controls, Inc. | 1,664 | | 78,624 |
JPMorgan Chase & Co. | 4,059 | | 245,488 |
Lakeland Financial Corp. | 1,613 | | 66,843 |
Lorillard, Inc. | 914 | | 56,211 |
McDonald's Corp. | 550 | | 51,552 |
McGraw Hill Financial, Inc. | 884 | | 79,984 |
Microsoft Corp. | 2,844 | | 133,526 |
MPLX LP | 1,179 | | 78,616 |
Oracle Corp. | 4,303 | | 168,032 |
PepsiCo, Inc. | 1,018 | | 97,901 |
Procter & Gamble Co. | 1,365 | | 119,124 |
SunTrust Banks, Inc. | 2,000 | | 78,280 |
Target Corp. | 998 | | 61,696 |
The Coca-Cola Co. | 2,872 | | 120,279 |
Time Warner Cable, Inc. | 627 | | 92,301 |
U.S. Bancorp | 2,420 | | 103,092 |
United Technologies Corp. | 900 | | 96,300 |
Verizon Communications, Inc. | 2,270 | | 114,068 |
VF Corp. | 1,145 | | 77,494 |
Common Stocks - continued |
| Shares | | Value |
United States of America - continued |
W.R. Grace & Co. (a) | 563 | | $ 53,260 |
Wells Fargo & Co. | 3,495 | | 185,550 |
TOTAL UNITED STATES OF AMERICA | | 5,081,836 |
TOTAL COMMON STOCKS (Cost $9,263,688) |
10,108,068
|
Nonconvertible Bonds - 0.0% |
| Principal Amount | | |
Canada - 0.0% |
Constellation Software, Inc. 7.4% 3/31/40
(Cost $429) | CAD | 500 | |
421
|
Money Market Funds - 4.9% |
| Shares | | |
Fidelity Cash Central Fund, 0.11% (b)
(Cost $515,264) | 515,264 | |
515,264
|
TOTAL INVESTMENT PORTFOLIO - 100.7% (Cost $9,779,381) | 10,623,753 |
NET OTHER ASSETS (LIABILITIES) - (0.7)% | (77,572) |
NET ASSETS - 100% | $ 10,546,181 |
Currency Abbreviations |
CAD | - | Canadian dollar |
Legend |
(a) Non-income producing |
(b) Affiliated fund that is generally available only to investment companies and other accounts managed by Fidelity Investments. The rate quoted is the annualized seven-day yield of the fund at period end. A complete unaudited listing of the fund's holdings as of its most recent quarter end is available upon request. In addition, each Fidelity Central Fund's financial statements, which are not covered by the Fund's Report of Independent Registered Public Accounting Firm, are available on the SEC's website or upon request. |
Affiliated Central Funds |
Information regarding fiscal year to date income earned by the Fund from investments in Fidelity Central Funds is as follows: |
Fund | Income earned |
Fidelity Cash Central Fund | $ 428 |
Other Information |
Categorizations in the Schedule of Investments are based on country or territory of incorporation. |
The following is a summary of the inputs used, as of October 31, 2014, involving the Fund's assets and liabilities carried at fair value. The inputs or methodology used for valuing securities may not be an indication of the risk associated with investing in those securities. For more information on valuation inputs, and their aggregation into the levels used in the tables below, please refer to the Investment Valuation section in the accompanying Notes to Financial Statements. |
Valuation Inputs at Reporting Date: |
Description | Total | Level 1 | Level 2 | Level 3 |
Investments in Securities: | | | | |
Equities: | | | | |
Consumer Discretionary | $ 1,465,375 | $ 1,278,799 | $ 186,576 | $ - |
Consumer Staples | 1,106,966 | 800,015 | 306,951 | - |
Energy | 802,035 | 606,306 | 195,729 | - |
Financials | 2,157,478 | 1,845,385 | 312,093 | - |
Health Care | 1,407,905 | 773,339 | 634,566 | - |
Industrials | 1,082,644 | 926,876 | 155,768 | - |
Information Technology | 1,263,362 | 972,795 | 290,567 | - |
Materials | 375,305 | 375,305 | - | - |
Telecommunication Services | 394,432 | 167,322 | 227,110 | - |
Utilities | 52,566 | 52,566 | - | - |
Corporate Bonds | 421 | - | - | 421 |
Money Market Funds | 515,264 | 515,264 | - | - |
Total Investments in Securities: | $ 10,623,753 | $ 8,313,972 | $ 2,309,360 | $ 421 |
The following is a summary of transfers between Level 1 and Level 2 for the period ended October 31, 2014. Transfers are assumed to have occurred at the beginning of the period, and are primarily attributable to the valuation techniques used for foreign equity securities, as discussed in the accompanying Notes to Financial Statements: |
Transfers | Total |
Level 1 to Level 2 | $ 179,077 |
Level 2 to Level 1 | $ 0 |
See accompanying notes which are an integral part of the financial statements.
Annual Report
Statement of Assets and Liabilities
| October 31, 2014 |
| | |
Assets | | |
Investment in securities, at value - See accompanying schedule: Unaffiliated issuers (cost $9,264,117) | $ 10,108,489 | |
Fidelity Central Funds (cost $515,264) | 515,264 | |
Total Investments (cost $9,779,381) | | $ 10,623,753 |
Cash | | 22,803 |
Foreign currency held at value (cost $502) | | 502 |
Receivable for investments sold | | 470,762 |
Receivable for fund shares sold | | 3,868 |
Dividends receivable | | 21,376 |
Distributions receivable from Fidelity Central Funds | | 44 |
Prepaid expenses | | 39 |
Receivable from investment adviser for expense reductions | | 3,280 |
Other receivables | | 147 |
Total assets | | 11,146,574 |
| | |
Liabilities | | |
Payable for investments purchased | $ 7,158 | |
Payable for fund shares redeemed | 533,314 | |
Accrued management fee | 6,157 | |
Distribution and service plan fees payable | 4,311 | |
Other affiliated payables | 2,556 | |
Other payables and accrued expenses | 46,897 | |
Total liabilities | | 600,393 |
| | |
Net Assets | | $ 10,546,181 |
Net Assets consist of: | | |
Paid in capital | | $ 9,170,304 |
Undistributed net investment income | | 4,288 |
Accumulated undistributed net realized gain (loss) on investments and foreign currency transactions | | 527,008 |
Net unrealized appreciation (depreciation) on investments and assets and liabilities in foreign currencies | | 844,581 |
Net Assets | | $ 10,546,181 |
See accompanying notes which are an integral part of the financial statements.
Annual Report
Financial Statements - continued
Statement of Assets and Liabilities - continued
| October 31, 2014 |
| | |
Calculation of Maximum Offering Price
Class A:
Net Asset Value and redemption price per share
($4,024,998 ÷ 310,680 shares) | | $ 12.96 |
| | |
Maximum offering price per share (100/94.25 of $12.96) | | $ 13.75 |
Class T:
Net Asset Value and redemption price per share ($2,013,746 ÷ 155,504 shares) | | $ 12.95 |
| | |
Maximum offering price per share (100/96.50 of $12.95) | | $ 13.42 |
Class C:
Net Asset Value and offering price per share ($3,173,363 ÷ 245,471 shares)A | | $ 12.93 |
| | |
Institutional Class:
Net Asset Value, offering price and redemption price per share ($1,334,074 ÷ 102,856 shares) | | $ 12.97 |
A Redemption price per share is equal to net asset value less any applicable contingent deferred sales charge.
See accompanying notes which are an integral part of the financial statements.
Annual Report
Statement of Operations
| Year ended October 31, 2014 |
| | |
Investment Income | | |
Dividends | | $ 268,504 |
Special dividends | | 64,920 |
Income from Fidelity Central Funds | | 428 |
Income before foreign taxes withheld | | 333,852 |
Less foreign taxes withheld | | (17,634) |
Total income | | 316,218 |
| | |
Expenses | | |
Management fee | $ 64,919 | |
Transfer agent fees | 21,693 | |
Distribution and service plan fees | 44,612 | |
Accounting fees and expenses | 4,802 | |
Custodian fees and expenses | 19,846 | |
Independent trustees' compensation | 36 | |
Registration fees | 49,634 | |
Audit | 62,616 | |
Legal | 25 | |
Miscellaneous | 241 | |
Total expenses before reductions | 268,424 | |
Expense reductions | (112,043) | 156,381 |
Net investment income (loss) | | 159,837 |
Realized and Unrealized Gain (Loss) Net realized gain (loss) on: | | |
Investment securities: | | |
Unaffiliated issuers | 568,015 | |
Foreign currency transactions | (2,270) | |
Total net realized gain (loss) | | 565,745 |
Change in net unrealized appreciation (depreciation) on: Investment securities | 67,045 | |
Assets and liabilities in foreign currencies | 53 | |
Total change in net unrealized appreciation (depreciation) | | 67,098 |
Net gain (loss) | | 632,843 |
Net increase (decrease) in net assets resulting from operations | | $ 792,680 |
See accompanying notes which are an integral part of the financial statements.
Annual Report
Financial Statements - continued
Statement of Changes in Net Assets
| Year ended
October 31,
2014 | Year ended
October 31,
2013 |
Increase (Decrease) in Net Assets | | |
Operations | | |
Net investment income (loss) | $ 159,837 | $ 65,903 |
Net realized gain (loss) | 565,745 | 110,778 |
Change in net unrealized appreciation (depreciation) | 67,098 | 700,327 |
Net increase (decrease) in net assets resulting
from operations | 792,680 | 877,008 |
Distributions to shareholders from net investment income | (143,546) | (63,596) |
Distributions to shareholders from net realized gain | (97,735) | (3,859) |
Total distributions | (241,281) | (67,455) |
Share transactions - net increase (decrease) | 3,932,940 | 2,177,438 |
Total increase (decrease) in net assets | 4,484,339 | 2,986,991 |
| | |
Net Assets | | |
Beginning of period | 6,061,842 | 3,074,851 |
End of period (including undistributed net investment income of $4,288 and $0, respectively) | $ 10,546,181 | $ 6,061,842 |
See accompanying notes which are an integral part of the financial statements.
Annual Report
Financial Highlights - Class A
Years ended October 31, | 2014 | 2013 | 2012I |
Selected Per-Share Data | | | |
Net asset value, beginning of period | $ 12.20 | $ 10.15 | $ 10.00 |
Income from Investment Operations | | | |
Net investment income (loss) E | .25H | .19 | .09 |
Net realized and unrealized gain (loss) | .91 | 2.05 | .16 |
Total from investment operations | 1.16 | 2.24 | .25 |
Distributions from net investment income | (.22) | (.18) | (.10) |
Distributions from net realized gain | (.18) | (.01) | - |
Total distributions | (.40) | (.19) | (.10) |
Net asset value, end of period | $ 12.96 | $ 12.20 | $ 10.15 |
Total ReturnB, C, D | 9.70% | 22.28% | 2.51% |
Ratios to Average Net Assets F, J | | | |
Expenses before reductions | 2.63% | 4.37% | 7.41%A |
Expenses net of fee waivers, if any | 1.45% | 1.45% | 1.45%A |
Expenses net of all reductions | 1.45% | 1.43% | 1.44%A |
Net investment income (loss) | 1.95%H | 1.66% | 1.89%A |
Supplemental Data | | | |
Net assets, end of period (000 omitted) | $ 4,025 | $ 2,115 | $ 756 |
Portfolio turnover rateG | 112% | 78% | 36% K |
A Annualized
B Total returns for periods of less than one year are not annualized.
C Total returns would have been lower if certain expenses had not been reduced during the applicable periods shown.
D Total returns do not include the effect of the sales charges.
E Calculated based on average shares outstanding during the period.
F Fees and expenses of any underlying Fidelity Central Funds are not included in the Fund's expense ratio. The Fund indirectly bears its proportionate share of the expenses of any underlying Fidelity Central Funds.
G Amount does not include the portfolio activity of any underlying Fidelity Central Funds.
H Investment income per share reflects a large, non-recurring dividend which amounted to $.09 per share. Excluding this non-recurring dividend, the ratio of net investment income (loss) to average net assets would have been 1.25%.
I For the period May 2, 2012 (commencement of operations) to October 31, 2012.
J Expense ratios reflect operating expenses of the class. Expenses before reductions do not reflect amounts reimbursed by the investment adviser or reductions from brokerage service arrangements or reductions from other expense offset arrangements and do not represent the amount paid by the class during periods when reimbursements or reductions occur. Expense ratios before reductions for start-up periods may not be representative of longer-term operating periods. Expenses net of fee waivers reflect expenses after reimbursement by the investment adviser but prior to reductions from brokerage service arrangements or other expense offset arrangements. Expenses net of all reductions represent the net expenses paid by the class.
K Amount not annualized.
See accompanying notes which are an integral part of the financial statements.
Annual Report
Financial Highlights - Class T
Years ended October 31, | 2014 | 2013 | 2012I |
Selected Per-Share Data | | | |
Net asset value, beginning of period | $ 12.20 | $ 10.14 | $ 10.00 |
Income from Investment Operations | | | |
Net investment income (loss) E | .21H | .16 | .08 |
Net realized and unrealized gain (loss) | .91 | 2.06 | .15 |
Total from investment operations | 1.12 | 2.22 | .23 |
Distributions from net investment income | (.19) | (.15) | (.09) |
Distributions from net realized gain | (.18) | (.01) | - |
Total distributions | (.37) | (.16) | (.09) |
Net asset value, end of period | $ 12.95 | $ 12.20 | $ 10.14 |
Total ReturnB, C, D | 9.34% | 22.11% | 2.31% |
Ratios to Average Net Assets F, J | | | |
Expenses before reductions | 2.96% | 4.80% | 7.68%A |
Expenses net of fee waivers, if any | 1.70% | 1.70% | 1.70%A |
Expenses net of all reductions | 1.70% | 1.68% | 1.69%A |
Net investment income (loss) | 1.70%H | 1.41% | 1.64%A |
Supplemental Data | | | |
Net assets, end of period (000 omitted) | $ 2,014 | $ 1,270 | $ 714 |
Portfolio turnover rateG | 112% | 78% | 36% K |
A Annualized
B Total returns for periods of less than one year are not annualized.
C Total returns would have been lower if certain expenses had not been reduced during the applicable periods shown.
D Total returns do not include the effect of the sales charges.
E Calculated based on average shares outstanding during the period.
F Fees and expenses of any underlying Fidelity Central Funds are not included in the Fund's expense ratio. The Fund indirectly bears its proportionate share of the expenses of any underlying Fidelity Central Funds.
G Amount does not include the portfolio activity of any underlying Fidelity Central Funds.
H Investment income per share reflects a large, non-recurring dividend which amounted to $.09 per share. Excluding this non-recurring dividend, the ratio of net investment income (loss) to average net assets would have been 1.00%.
I For the period May 2, 2012 (commencement of operations) to October 31, 2012.
J Expense ratios reflect operating expenses of the class. Expenses before reductions do not reflect amounts reimbursed by the investment adviser or reductions from brokerage service arrangements or reductions from other expense offset arrangements and do not represent the amount paid by the class during periods when reimbursements or reductions occur. Expense ratios before reductions for start-up periods may not be representative of longer-term operating periods. Expenses net of fee waivers reflect expenses after reimbursement by the investment adviser but prior to reductions from brokerage service arrangements or other expense offset arrangements. Expenses net of all reductions represent the net expenses paid by the class.
K Amount not annualized.
See accompanying notes which are an integral part of the financial statements.
Annual Report
Financial Highlights - Class C
Years ended October 31, | 2014 | 2013 | 2012I |
Selected Per-Share Data | | | |
Net asset value, beginning of period | $ 12.18 | $ 10.14 | $ 10.00 |
Income from Investment Operations | | | |
Net investment income (loss) E | .15H | .10 | .06 |
Net realized and unrealized gain (loss) | .91 | 2.06 | .15 |
Total from investment operations | 1.06 | 2.16 | .21 |
Distributions from net investment income | (.14) | (.11) | (.07) |
Distributions from net realized gain | (.17) | (.01) | - |
Total distributions | (.31) | (.12) | (.07) |
Net asset value, end of period | $ 12.93 | $ 12.18 | $ 10.14 |
Total ReturnB, C, D | 8.83% | 21.40% | 2.12% |
Ratios to Average Net Assets F, J | | | |
Expenses before reductions | 3.43% | 5.26% | 8.19%A |
Expenses net of fee waivers, if any | 2.20% | 2.20% | 2.20%A |
Expenses net of all reductions | 2.20% | 2.18% | 2.19%A |
Net investment income (loss) | 1.20%H | .91% | 1.14%A |
Supplemental Data | | | |
Net assets, end of period (000 omitted) | $ 3,173 | $ 1,445 | $ 666 |
Portfolio turnover rateG | 112% | 78% | 36% K |
A Annualized
B Total returns for periods of less than one year are not annualized.
C Total returns would have been lower if certain expenses had not been reduced during the applicable periods shown.
D Total returns do not include the effect of the contingent deferred sales charge.
E Calculated based on average shares outstanding during the period.
F Fees and expenses of any underlying Fidelity Central Funds are not included in the Fund's expense ratio. The Fund indirectly bears its proportionate share of the expenses of any underlying Fidelity Central Funds.
G Amount does not include the portfolio activity of any underlying Fidelity Central Funds.
H Investment income per share reflects a large, non-recurring dividend which amounted to $.09 per share. Excluding this non-recurring dividend, the ratio of net investment income (loss) to average net assets would have been .50%.
I For the period May 2, 2012 (commencement of operations) to October 31, 2012.
J Expense ratios reflect operating expenses of the class. Expenses before reductions do not reflect amounts reimbursed by the investment adviser or reductions from brokerage service arrangements or reductions from other expense offset arrangements and do not represent the amount paid by the class during periods when reimbursements or reductions occur. Expense ratios before reductions for start-up periods may not be representative of longer-term operating periods. Expenses net of fee waivers reflect expenses after reimbursement by the investment adviser but prior to reductions from brokerage service arrangements or other expense offset arrangements. Expenses net of all reductions represent the net expenses paid by the class.
K Amount not annualized.
See accompanying notes which are an integral part of the financial statements.
Annual Report
Financial Highlights - Institutional Class
Years ended October 31, | 2014 | 2013 | 2012H |
Selected Per-Share Data | | | |
Net asset value, beginning of period | $ 12.22 | $ 10.15 | $ 10.00 |
Income from Investment Operations | | | |
Net investment income (loss) D | .28G | .21 | .10 |
Net realized and unrealized gain (loss) | .90 | 2.07 | .16 |
Total from investment operations | 1.18 | 2.28 | .26 |
Distributions from net investment income | (.25) | (.20) | (.11) |
Distributions from net realized gain | (.18) | (.01) | - |
Total distributions | (.43) | (.21) | (.11) |
Net asset value, end of period | $ 12.97 | $ 12.22 | $ 10.15 |
Total ReturnB, C | 9.86% | 22.71% | 2.61% |
Ratios to Average Net Assets E, I | | | |
Expenses before reductions | 2.35% | 4.46% | 7.23%A |
Expenses net of fee waivers, if any | 1.20% | 1.20% | 1.20%A |
Expenses net of all reductions | 1.20% | 1.18% | 1.19%A |
Net investment income (loss) | 2.20%G | 1.91% | 2.14%A |
Supplemental Data | | | |
Net assets, end of period (000 omitted) | $ 1,334 | $ 1,231 | $ 939 |
Portfolio turnover rateF | 112% | 78% | 36% J |
A Annualized
B Total returns for periods of less than one year are not annualized.
C Total returns would have been lower if certain expenses had not been reduced during the applicable periods shown.
D Calculated based on average shares outstanding during the period.
E Fees and expenses of any underlying Fidelity Central Funds are not included in the Fund's expense ratio. The Fund indirectly bears its proportionate share of the expenses of any underlying Fidelity Central Funds.
F Amount does not include the portfolio activity of any underlying Fidelity Central Funds.
G Investment income per share reflects a large, non-recurring dividend which amounted to $.09 per share. Excluding this non-recurring dividend, the ratio of net investment income (loss) to average net assets would have been 1.50%.
H For the period May 2, 2012 (commencement of operations) to October 31, 2012.
I Expense ratios reflect operating expenses of the class. Expenses before reductions do not reflect amounts reimbursed by the investment adviser or reductions from brokerage service arrangements or reductions from other expense offset arrangements and do not represent the amount paid by the class during periods when reimbursements or reductions occur. Expense ratios before reductions for start-up periods may not be representative of longer-term operating periods. Expenses net of fee waivers reflect expenses after reimbursement by the investment adviser but prior to reductions from brokerage service arrangements or other expense offset arrangements. Expenses net of all reductions represent the net expenses paid by the class.
J Amount not annualized.
See accompanying notes which are an integral part of the financial statements.
Annual Report
Notes to Financial Statements
For the period ended October 31, 2014
1. Organization.
Fidelity Advisor Global Equity Income Fund (the Fund) is a fund of Fidelity Advisor Series VIII (the Trust) and is authorized to issue an unlimited number of shares. The Trust is registered under the Investment Company Act of 1940, as amended (the 1940 Act), as an open-end management investment company organized as a Massachusetts business trust. The Fund offers Class A, Class T, Class C and Institutional Class shares, each of which has equal rights as to assets and voting privileges. Each class has exclusive voting rights with respect to matters that affect that class.
2. Investments in Fidelity Central Funds.
The Fund invests in Fidelity Central Funds, which are open-end investment companies generally available only to other investment companies and accounts managed by the investment adviser and its affiliates. The Fund's Schedule of Investments lists each of the Fidelity Central Funds held as of period end, if any, as an investment of the Fund, but does not include the underlying holdings of each Fidelity Central Fund. As an Investing Fund, the Fund indirectly bears its proportionate share of the expenses of the underlying Fidelity Central Funds.
The Money Market Central Funds seek preservation of capital and current income and are managed by Fidelity Investments Money Management, Inc. (FIMM), an affiliate of the investment adviser. Annualized expenses of the Money Market Central Funds as of their most recent shareholder report date are less than .01%.
A complete unaudited list of holdings for each Fidelity Central Fund is available upon request or at the Securities and Exchange Commission (the SEC) website at www.sec.gov. In addition, the financial statements of the Fidelity Central Funds, which are not covered by the Fund's Report of Independent Registered Public Accounting Firm, are available on the SEC website or upon request.
3. Significant Accounting Policies.
The financial statements have been prepared in conformity with accounting principles generally accepted in the United States of America (GAAP), which require management to make certain estimates and assumptions at the date of the financial statements. Actual results could differ from those estimates. Subsequent events, if any, through the date that the financial statements were issued have been evaluated in the preparation of the financial statements. The following summarizes the significant accounting policies of the Fund:
Investment Valuation. Investments are valued as of 4:00 p.m. Eastern time on the last calendar day of the period. In accordance with valuation policies and procedures approved by the Board of Trustees (the Board), the Fund attempts to obtain prices from
Annual Report
Notes to Financial Statements - continued
3. Significant Accounting Policies - continued
Investment Valuation - continued
one or more third party pricing vendors or brokers to value its investments. When current market prices, quotations or currency exchange rates are not readily available or reliable, investments will be fair valued in good faith by the Fidelity Management & Research Company (FMR) Fair Value Committee (the Committee), in accordance with procedures adopted by the Board. Factors used in determining fair value vary by investment type and may include market or investment specific events, changes in interest rates and credit quality. The frequency with which these procedures are used cannot be predicted and they may be utilized to a significant extent. The Committee oversees the Fund's valuation policies and procedures and is responsible for approving and reporting to the Board all fair value determinations.
The Fund categorizes the inputs to valuation techniques used to value its investments into a disclosure hierarchy consisting of three levels as shown below:
Level 1 - quoted prices in active markets for identical investments
Level 2 - other significant observable inputs (including quoted prices for similar investments, interest rates, prepayment speeds, etc.)
Level 3 - unobservable inputs (including the Fund's own assumptions based on the best information available)
Valuation techniques used to value the Fund's investments by major category are as follows:
Equity securities, including restricted securities, for which market quotations are readily available, are valued at the last reported sale price or official closing price as reported by a third party pricing vendor on the primary market or exchange on which they are traded and are categorized as Level 1 in the hierarchy. In the event there were no sales during the day or closing prices are not available, securities are valued at the last quoted bid price or may be valued using the last available price and are generally categorized as Level 2 in the hierarchy. For foreign equity securities, when market or security specific events arise, comparisons to the valuation of American Depositary Receipts (ADRs), futures contracts, Exchange-Traded Funds (ETFs) and certain indexes as well as quoted prices for similar securities may be used and would be categorized as Level 2 in the hierarchy. Utilizing these techniques may result in transfers between Level 1 and Level 2. For equity securities, including restricted securities, where observable inputs are limited, assumptions about market activity and risk are used and these securities may be categorized as Level 3 in the hierarchy.
Annual Report
3. Significant Accounting Policies - continued
Investment Valuation - continued
Debt securities, including restricted securities, are valued based on evaluated prices received from third party pricing vendors or from brokers who make markets in such securities. Corporate bonds are valued by pricing vendors who utilize matrix pricing which considers yield or price of bonds of comparable quality, coupon, maturity and type or by broker-supplied prices. When independent prices are unavailable or unreliable, debt securities may be valued utilizing pricing methodologies which consider similar factors that would be used by third party pricing vendors. Debt securities are generally categorized as Level 2 in the hierarchy but may be Level 3 depending on the circumstances.
Investments in open-end mutual funds, including the Fidelity Central Funds, are valued at their closing net asset value (NAV) each business day and are categorized as Level 1 in the hierarchy.
Changes in valuation techniques may result in transfers in or out of an assigned level within the disclosure hierarchy. The aggregate value of investments by input level, as of October 31, 2014, including information on transfers between Levels 1 and 2, is included at the end of the Fund's Schedule of Investments.
Foreign Currency. The Fund may use foreign currency contracts to facilitate transactions in foreign-denominated securities. Gains and losses from these transactions may arise from changes in the value of the foreign currency or if the counterparties do not perform under the contracts' terms.
Foreign-denominated assets, including investment securities, and liabilities are translated into U.S. dollars at the exchange rates at period end. Purchases and sales of investment securities, income and dividends received and expenses denominated in foreign currencies are translated into U.S. dollars at the exchange rate in effect on the transaction date.
The effects of exchange rate fluctuations on investments are included with the net realized and unrealized gain (loss) on investment securities. Other foreign currency transactions resulting in realized and unrealized gain (loss) are disclosed separately.
Investment Transactions and Income. For financial reporting purposes, the Fund's investment holdings and NAV include trades executed through the end of the last business day of the period. The NAV per share for processing shareholder transactions is calculated as of the close of business of the New York Stock Exchange (NYSE), normally 4:00 p.m. Eastern time and includes trades executed through the end of the prior business day. Gains and losses on securities sold are determined on the basis of identified cost. Dividend income is recorded on the ex-dividend date, except for certain dividends
Annual Report
Notes to Financial Statements - continued
3. Significant Accounting Policies - continued
Investment Transactions and Income - continued
from foreign securities where the ex-dividend date may have passed, which are recorded as soon as the Fund is informed of the ex-dividend date. Non-cash dividends included in dividend income, if any, are recorded at the fair market value of the securities received. Income and capital gain distributions from Fidelity Central Funds, if any, are recorded on the ex-dividend date. Distributions received on securities that represent a return of capital or capital gain are recorded as a reduction of cost of investments and/or as a realized gain. Subsequent to ex-dividend date the Fund determines the components of these distributions, based upon receipt of tax filings or other correspondence relating to the underlying investment. Large, non-recurring dividends recognized by the Fund are presented separately on the Statement of Operations as "Special Dividends" and the impact of these dividends is presented in the Financial Highlights. Investment income is recorded net of foreign taxes withheld where recovery of such taxes is uncertain.
Class Allocations and Expenses. Investment income, realized and unrealized capital gains and losses, common expenses of the Fund, and certain fund-level expense reductions, if any, are allocated daily on a pro-rata basis to each class based on the relative net assets of each class to the total net assets of the Fund. Each class differs with respect to transfer agent and distribution and service plan fees incurred. Certain expense reductions may also differ by class. For the reporting period, the allocated portion of income and expenses to each class as a percent of its average net assets may vary due to the timing of recording these transactions in relation to fluctuating net assets of the classes. Expenses directly attributable to a fund are charged to that fund. Expenses attributable to more than one fund are allocated among the respective funds on the basis of relative net assets or other appropriate methods. Expense estimates are accrued in the period to which they relate and adjustments are made when actual amounts are known.
Income Tax Information and Distributions to Shareholders. Each year, the Fund intends to qualify as a regulated investment company under Subchapter M of the Internal Revenue Code, including distributing substantially all of its taxable income and realized gains. As a result, no provision for U.S. Federal income taxes is required. As of October 31, 2014, the Fund did not have any unrecognized tax benefits in the financial statements; nor is the Fund aware of any tax positions for which it is reasonably possible that the total amounts of unrecognized tax benefits will significantly change in the next twelve months. The Fund files a U.S. federal tax return, in addition to state and local tax returns as required. The Fund's federal income tax returns are subject to examination by the Internal Revenue Service (IRS) for a period of three fiscal years after they are filed. State and local tax returns may be subject to examination for an additional fiscal year depending on the jurisdiction. Foreign taxes are provided for based on the Fund's understanding of the tax rules and rates that exist in the foreign markets in which it invests.
Annual Report
3. Significant Accounting Policies - continued
Income Tax Information and Distributions to Shareholders - continued
Distributions are declared and recorded on the ex-dividend date. Income dividends and capital gain distributions are declared separately for each class. Income and capital gain distributions are determined in accordance with income tax regulations, which may differ from GAAP. In addition, the Fund claimed a portion of the payment made to redeeming shareholders as a distribution for income tax purposes.
Capital accounts within the financial statements are adjusted for permanent book-tax differences. These adjustments have no impact on net assets or the results of operations. Capital accounts are not adjusted for temporary book-tax differences which will reverse in a subsequent period.
Book-tax differences are primarily due to foreign currency transactions, passive foreign investment companies (PFIC), partnerships, and losses deferred due to wash sales.
The federal tax cost of investment securities and unrealized appreciation (depreciation) as of period end were as follows:
Gross unrealized appreciation | $ 1,102,511 |
Gross unrealized depreciation | (300,994) |
Net unrealized appreciation (depreciation) on securities | $ 801,517 |
| |
Tax Cost | $ 9,822,236 |
The tax-based components of distributable earnings as of period end were as follows:
Undistributed ordinary income | $ 164,846 |
Undistributed long-term capital gain | $ 409,769 |
Net unrealized appreciation (depreciation) on securities and other investments | $ 801,262 |
The tax character of distributions paid was as follows:
| October 31, 2014 | October 31, 2013 |
Ordinary Income | $ 169,657 | $ 67,455 |
Long-term Capital Gains | 71,624 | - |
Total | $ 241,281 | $ 67,455 |
New Accounting Pronouncement. In June 2014, the Financial Accounting Standards Board issued Accounting Standard Update No. 2014-11, Repurchase-to-Maturity Transactions, Repurchase Financings, and Disclosures. The update amends the accounting for certain repurchase agreements and expands disclosure requirements for reverse
Annual Report
Notes to Financial Statements - continued
3. Significant Accounting Policies - continued
New Accounting Pronouncement - continued
repurchase agreements, securities lending and other similar transactions. The disclosure requirements are effective for annual and interim reporting periods beginning after December 15, 2014. Management is currently evaluating the impact of the Update on the Fund's financial statements and related disclosures.
4. Purchases and Sales of Investments.
Purchases and sales of securities, other than short-term securities, aggregated $13,519,087 and $9,863,508, respectively.
5. Fees and Other Transactions with Affiliates.
Management Fee. Fidelity Management & Research Company (the investment adviser) and its affiliates provide the Fund with investment management related services for which the Fund pays a monthly management fee. The management fee is the sum of an individual fund fee rate that is based on an annual rate of .45% of the Fund's average net assets and an annualized group fee rate that averaged .25% during the period. The group fee rate is based upon the average net assets of all the mutual funds advised by the investment adviser, including any mutual funds previously advised by the investment adviser that are currently advised by Fidelity SelectCo, LLC, an affiliate of the investment adviser. The group fee rate decreases as assets under management increase and increases as assets under management decrease. For the reporting period, the total annual management fee rate was .70% of the Fund's average net assets.
Distribution and Service Plan Fees. In accordance with Rule 12b-1 of the 1940 Act, the Fund has adopted separate Distribution and Service Plans for each class of shares. Certain classes pay Fidelity Distributors Corporation (FDC), an affiliate of the investment adviser, separate Distribution and Service Fees, each of which is based on an annual percentage of each class' average net assets. In addition, FDC may pay financial intermediaries for selling shares of the Fund and providing shareholder support services. For the period, the Distribution and Service Fee rates, total fees and amounts retained by FDC were as follows:
| Distribution
Fee | Service
Fee | Total Fees | Retained
by FDC |
Class A | -% | .25% | $ 8,565 | $ 3,932 |
Class T | .25% | .25% | 9,224 | 3,788 |
Class C | .75% | .25% | 26,823 | 26,823 |
| | | $ 44,612 | $ 34,543 |
Annual Report
5. Fees and Other Transactions with Affiliates - continued
Sales Load. FDC may receive a front-end sales charge of up to 5.75% for selling Class A shares and 3.50% for selling Class T shares, some of which is paid to financial intermediaries for selling shares of the Fund. Depending on the holding period, FDC may receive contingent deferred sales charges levied on Class A, Class T and Class C redemptions. The deferred sales charges range from 1.00% for Class C shares, 1.00% for certain purchases of Class A shares and .25% for certain purchases of Class T shares.
For the period, sales charge amounts retained by FDC were as follows:
| Retained
by FDC |
Class A | $ 4,442 |
Class T | 1,676 |
Class C* | 672 |
| $ 6,790 |
* When Class C shares are initially sold, FDC pays commissions from its own resources to financial intermediaries through which the sales are made.
Transfer Agent Fees. Fidelity Investments Institutional Operations Company, Inc., (FIIOC), an affiliate of the investment adviser, is the transfer, dividend disbursing and shareholder servicing agent for each class of the Fund. FIIOC receives account fees and asset-based fees that vary according to the account size and type of account of the shareholders of the respective classes of the Fund. FIIOC pays for typesetting, printing and mailing of shareholder reports, except proxy statements.
For the period, transfer agent fees for each class were as follows:
| Amount | % of
Class-Level Average
Net Assets |
Class A | $ 8,123 | .24 |
Class T | 4,738 | .26 |
Class C | 7,225 | .27 |
Institutional Class | 1,607 | .12 |
| $ 21,693 | |
Accounting Fees. Fidelity Service Company, Inc. (FSC), an affiliate of the investment adviser, maintains the Fund's accounting records. The fee is based on the level of average net assets for each month.
Brokerage Commissions. The Fund placed a portion of its portfolio transactions with brokerage firms which are affiliates of the investment adviser. Brokerage commissions are included in net realized gain (loss) and change in net unrealized appreciation (depreciation) in the Statement of Operations. The commissions paid to these affiliated firms were $108 for the period.
Annual Report
Notes to Financial Statements - continued
6. Committed Line of Credit.
The Fund participates with other funds managed by the investment adviser or an affiliate in a $4.25 billion credit facility (the "line of credit") to be utilized for temporary or emergency purposes to fund shareholder redemptions or for other short-term liquidity purposes. The Fund has agreed to pay commitment fees on its pro-rata portion of the line of credit, which amounted to $14 and is reflected in Miscellaneous expenses on the Statement of Operations. During the period, the Fund did not borrow on this line of credit.
7. Expense Reductions.
The investment adviser contractually agreed to reimburse each class to the extent annual operating expenses exceeded certain levels of average net assets as noted in the table below. This reimbursement will remain in place through December 31, 2015. Some expenses, for example interest expense, including commitment fees, are excluded from this reimbursement.
The following classes were in reimbursement during the period:
| Expense
Limitations | Reimbursement |
Class A | 1.45% | $ 40,521 |
Class T | 1.70% | 23,254 |
Class C | 2.20% | 33,024 |
Institutional Class | 1.20% | 15,174 |
| | $ 111,973 |
Commissions paid to certain brokers with whom the investment adviser, or its affiliates, places trades on behalf of the Fund include an amount in addition to trade execution, which may be rebated back to the Fund to offset certain expenses. This amount totaled $62 for the period. In addition, through arrangements with the Fund's custodian, credits realized as a result of uninvested cash balances were used to reduce the Fund's expenses. During the period, these credits reduced the Fund's custody expenses by $8.
8. Distributions to Shareholders.
Distributions to shareholders of each class were as follows:
Years ended October 31, | 2014 | 2013 |
From net investment income | | |
Class A | $ 59,134 | $ 21,341 |
Class T | 28,554 | 12,502 |
Class C | 29,949 | 10,500 |
Institutional Class | 25,909 | 19,253 |
Total | $ 143,546 | $ 63,596 |
Annual Report
8. Distributions to Shareholders - continued
Years ended October 31, | 2014 | 2013 |
From net realized gain | | |
Class A | $ 37,020 | $ 1,245 |
Class T | 20,549 | 822 |
Class C | 22,043 | 950 |
Institutional Class | 18,123 | 842 |
Total | $ 97,735 | $ 3,859 |
9. Share Transactions.
Share transactions for each class were as follows and may contain automatic conversions between classes or exchanges between funds:
| Shares | Dollars |
Years ended October 31, | 2014 | 2013 | 2014 | 2013 |
Class A | | | | |
Shares sold | 196,535 | 119,194 | $ 2,476,199 | $ 1,351,801 |
Reinvestment of distributions | 7,392 | 1,927 | 92,391 | 21,243 |
Shares redeemed | (66,552) | (22,370) | (854,492) | (259,766) |
Net increase (decrease) | 137,375 | 98,751 | $ 1,714,098 | $ 1,113,278 |
Class T | | | | |
Shares sold | 95,686 | 33,371 | $ 1,188,546 | $ 382,233 |
Reinvestment of distributions | 3,827 | 1,184 | 47,754 | 12,976 |
Shares redeemed | (48,139) | (804) | (610,330) | (9,101) |
Net increase (decrease) | 51,374 | 33,751 | $ 625,970 | $ 386,108 |
Class C | | | | |
Shares sold | 179,385 | 88,544 | $ 2,234,467 | $ 997,819 |
Reinvestment of distributions | 3,965 | 1,023 | 49,411 | 11,159 |
Shares redeemed | (56,526) | (36,610) | (715,924) | (423,633) |
Net increase (decrease) | 126,824 | 52,957 | $ 1,567,954 | $ 585,345 |
Institutional Class | | | | |
Shares sold | 9,677 | 6,507 | $ 123,415 | $ 73,274 |
Reinvestment of distributions | 3,513 | 1,821 | 43,809 | 19,977 |
Shares redeemed | (11,104) | (56) | (142,306) | (544) |
Net increase (decrease) | 2,086 | 8,272 | $ 24,918 | $ 92,707 |
10. Other.
The Fund's organizational documents provide former and current trustees and officers with a limited indemnification against liabilities arising in connection with the performance of their duties to the Fund. In the normal course of business, the Fund may also enter into contracts that provide general indemnifications. The Fund's maximum exposure under these arrangements is unknown as this would be dependent on future
Annual Report
Notes to Financial Statements - continued
10. Other - continued
claims that may be made against the Fund. The risk of material loss from such claims is considered remote.
At the end of the period, the investment adviser or its affiliates were the owners of record of 23% of the total outstanding shares of the Fund.
Annual Report
To the Trustees of Fidelity Advisor Series VIII and the Shareholders of Fidelity Advisor Global Equity Income Fund:
In our opinion, the accompanying statement of assets and liabilities, including the schedule of investments, and the related statements of operations and of changes in net assets and the financial highlights present fairly, in all material respects, the financial position of Fidelity Advisor Global Equity Income Fund (a fund of Fidelity Advisor Series VIII) at October 31, 2014, the results of its operations for the year then ended, the changes in its net assets for each of the two years in the period then ended and the financial highlights for each of the periods indicated, in conformity with accounting principles generally accepted in the United States of America. These financial statements and financial highlights (hereafter referred to as "financial statements") are the responsibility of the Fidelity Advisor Global Equity Income Fund's management. Our responsibility is to express an opinion on these financial statements based on our audits. We conducted our audits of these financial statements in accordance with the standards of the Public Company Accounting Oversight Board (United States). Those standards require that we plan and perform the audit to obtain reasonable assurance about whether the financial statements are free of material misstatement. An audit includes examining, on a test basis, evidence supporting the amounts and disclosures in the financial statements, assessing the accounting principles used and significant estimates made by management, and evaluating the overall financial statement presentation. We believe that our audits, which included confirmation of securities at October 31, 2014 by correspondence with the custodian and brokers, provide a reasonable basis for our opinion.
PricewaterhouseCoopers LLP
Boston, Massachusetts
December 19, 2014
Annual Report
The Trustees, Member of the Advisory Board, and officers of the trust and fund, as applicable, are listed below. The Board of Trustees governs the fund and is responsible for protecting the interests of shareholders. The Trustees are experienced executives who meet periodically throughout the year to oversee the fund's activities, review contractual arrangements with companies that provide services to the fund, oversee management of the risks associated with such activities and contractual arrangements, and review the fund's performance. Except for James C. Curvey, each of the Trustees oversees 174 funds. Mr. Curvey oversees 407 funds.
The Trustees hold office without limit in time except that (a) any Trustee may resign; (b) any Trustee may be removed by written instrument, signed by at least two-thirds of the number of Trustees prior to such removal; (c) any Trustee who requests to be retired or who has become incapacitated by illness or injury may be retired by written instrument signed by a majority of the other Trustees; and (d) any Trustee may be removed at any special meeting of shareholders by a two-thirds vote of the outstanding voting securities of the trust. Each Trustee who is not an interested person (as defined in the 1940 Act) of the trust and the fund (Independent Trustee), shall retire not later than the last day of the calendar year in which his or her 75th birthday occurs. The Independent Trustees may waive this mandatory retirement age policy with respect to individual Trustees. The officers and Advisory Board Member hold office without limit in time, except that any officer and Advisory Board Member may resign or may be removed by a vote of a majority of the Trustees at any regular meeting or any special meeting of the Trustees. Except as indicated, each individual has held the office shown or other offices in the same company for the past five years.
Experience, Skills, Attributes, and Qualifications of the Fund's Trustees. The Governance and Nominating Committee has adopted a statement of policy that describes the experience, qualifications, attributes, and skills that are necessary and desirable for potential Independent Trustee candidates (Statement of Policy). The Board believes that each Trustee satisfied at the time he or she was initially elected or appointed a Trustee, and continues to satisfy, the standards contemplated by the Statement of Policy. The Governance and Nominating Committee also engages professional search firms to help identify potential Independent Trustee candidates who have the experience, qualifications, attributes, and skills consistent with the Statement of Policy. From time to time, additional criteria based on the composition and skills of the current Independent Trustees, as well as experience or skills that may be appropriate in light of future changes to board composition, business conditions, and regulatory or other developments, have also been considered by the professional search firms and the Governance and Nominating Committee. In addition, the Board takes into account the Trustees' commitment and participation in Board and committee meetings, as well as their leadership of standing and ad hoc committees throughout their tenure.
In determining that a particular Trustee was and continues to be qualified to serve as a Trustee, the Board has considered a variety of criteria, none of which, in isolation, was controlling. The Board believes that, collectively, the Trustees have balanced and diverse experience, qualifications, attributes, and skills, which allow the Board to operate effectively in governing the fund and protecting the interests of shareholders. Information about the specific experience, skills, attributes, and qualifications of each Trustee, which in each case led to the Board's conclusion that the Trustee should serve (or continue to serve) as a trustee of the fund, is provided below.
Annual Report
Board Structure and Oversight Function. James C. Curvey is an interested person (as defined in the 1940 Act) and currently serves as Chairman. The Trustees have determined that an interested Chairman is appropriate and benefits shareholders because an interested Chairman has a personal and professional stake in the quality and continuity of services provided to the fund. Independent Trustees exercise their informed business judgment to appoint an individual of their choosing to serve as Chairman, regardless of whether the Trustee happens to be independent or a member of management. The Independent Trustees have determined that they can act independently and effectively without having an Independent Trustee serve as Chairman and that a key structural component for assuring that they are in a position to do so is for the Independent Trustees to constitute a substantial majority for the Board. The Independent Trustees also regularly meet in executive session. Ned C. Lautenbach serves as Chairman of the Independent Trustees and as such (i) acts as a liaison between the Independent Trustees and management with respect to matters important to the Independent Trustees and (ii) with management prepares agendas for Board meetings.
Fidelity funds are overseen by different Boards of Trustees. The fund's Board oversees Fidelity's equity and high income funds and another Board oversees Fidelity's investment-grade bond, money market, and asset allocation funds. The asset allocation funds may invest in Fidelity funds overseen by the fund's Board. The use of separate Boards, each with its own committee structure, allows the Trustees of each group of Fidelity funds to focus on the unique issues of the funds they oversee, including common research, investment, and operational issues. On occasion, the separate Boards establish joint committees to address issues of overlapping consequences for the Fidelity funds overseen by each Board.
The Trustees operate using a system of committees to facilitate the timely and efficient consideration of all matters of importance to the Trustees, the fund, and fund shareholders and to facilitate compliance with legal and regulatory requirements and oversight of the fund's activities and associated risks. The Board, acting through its committees, has charged FMR and its affiliates with (i) identifying events or circumstances the occurrence of which could have demonstrably adverse effects on the fund's business and/or reputation; (ii) implementing processes and controls to lessen the possibility that such events or circumstances occur or to mitigate the effects of such events or circumstances if they do occur; and (iii) creating and maintaining a system designed to evaluate continuously business and market conditions in order to facilitate the identification and implementation processes described in (i) and (ii) above. Because the day-to-day operations and activities of the fund are carried out by or through FMR, its affiliates and other service providers, the fund's exposure to risks is mitigated but not eliminated by the processes overseen by the Trustees. While each of the Board's committees has responsibility for overseeing different aspects of the fund's activities, oversight is exercised primarily through the Operations, Audit, and Compliance Committees. In addition, the Independent Trustees have worked with FMR to enhance the Board's oversight of investment and financial risks, legal and regulatory risks, technology risks, and operational risks, including the development of additional risk reporting to the Board. For example, a working group comprised of Independent Trustees and FMR has worked and continues to work to review the Fidelity funds' valuation-related activities, reporting and risk management. Appropriate personnel, including but not limited to the fund's Chief Compliance Officer (CCO), FMR's internal auditor, the independent accountants, the fund's Treasurer and portfolio management personnel, make periodic reports to the Board's committees, as appropriate, including an annual review of FMR's risk management program for the Fidelity funds. The responsibilities of each standing committee, including their oversight responsibilities, are described further under "Standing Committees of the Fund's Trustees."
Annual Report
Trustees and Officers - continued
The fund's Statement of Additional Information (SAI) includes more information about the Trustees. To request a free copy, call Fidelity at 1-877-208-0098.
Interested Trustees*:
Correspondence intended for each Trustee who is an interested person may be sent to Fidelity Investments, 245 Summer Street, Boston, Massachusetts 02210.
Name, Year of Birth; Principal Occupations and Other Relevant Experience+ |
James C. Curvey (1935) |
Year of Election or Appointment: 2007 Trustee Chairman of the Board of Trustees |
| Mr. Curvey also serves as Trustee of other Fidelity funds. Mr. Curvey is a Director of Fidelity Research & Analysis Co. (2009-present), and Vice Chairman (2007-present) and Director of FMR LLC. In addition, Mr. Curvey serves as an Overseer for the Boston Symphony Orchestra and a member of the board of Artis-Naples, Naples, Florida, and as a Trustee for Brewster Academy, Wolfeboro, New Hampshire. Previously, Mr. Curvey served as a Director of Fidelity Investments Money Management, Inc. (2009-2014), a Director of FMR (2007-2014), and a Director of FMR Co., Inc. (2007-2014). |
Charles S. Morrison (1960) |
Year of Election or Appointment: 2014 Trustee |
| Mr. Morrison also serves as Trustee of other funds. He serves as a Director of Fidelity Investments Money Management, Inc. (FIMM) (2014-present), Director of Fidelity SelectCo, LLC (2014-present), President, Asset Management (2014-present), and is an employee of Fidelity Investments. Previously, Mr. Morrison served as Vice President of Fidelity's Fixed Income and Asset Allocation Funds (2012-2014), President, Fixed Income (2011-2014), Vice President of Fidelity's Money Market Funds (2005-2009), President, Money Market Group Leader of FMR (2009), and Senior Vice President, Money Market Group of FMR (2004-2009). Mr. Morrison also served as Vice President of Fidelity's Bond Funds (2002-2005), certain Balanced Funds (2002-2005), and certain Asset Allocation Funds (2002-2007), and as Senior Vice President (2002-2005) of Fidelity's Bond Division. |
* Trustees have been determined to be "Interested Trustees" by virtue of, among other things, their affiliation with the trust or various entities under common control with FMR.
+ The information above includes each Trustee's principal occupation during the last five years and other information relating to the experience, attributes, and skills relevant to each Trustee's qualifications to serve as a Trustee, which led to the conclusion that each Trustee should serve as a Trustee for the fund.
Annual Report
Trustees and Officers - continued
Independent Trustees:
Correspondence intended for each Independent Trustee (that is, the Trustees other than the Interested Trustees) may be sent to Fidelity Investments, P.O. Box 55235, Boston, Massachusetts 02205-5235.
Name, Year of Birth; Principal Occupations and Other Relevant Experience+ |
Dennis J. Dirks (1948) |
Year of Election or Appointment: 2005 Trustee |
| Mr. Dirks also serves as Trustee of other Fidelity funds. Prior to his retirement in May 2003, Mr. Dirks was Chief Operating Officer and a member of the Board of The Depository Trust & Clearing Corporation (DTCC). He also served as President, Chief Operating Officer, and Board member of The Depository Trust Company (DTC) and President and Board member of the National Securities Clearing Corporation (NSCC). In addition, Mr. Dirks served as Chief Executive Officer and Board member of the Government Securities Clearing Corporation, Chief Executive Officer and Board member of the Mortgage-Backed Securities Clearing Corporation, as a Trustee and a member of the Finance Committee of Manhattan College (2005-2008), and as a Trustee and a member of the Finance Committee of AHRC of Nassau County (2006-2008). Mr. Dirks is a member of the Independent Directors Council (IDC) Governing Council (2010-present) and Board of Directors for The Brookville Center for Children's Services, Inc. (2009-present). |
Alan J. Lacy (1953) |
Year of Election or Appointment: 2008 Trustee |
| Mr. Lacy also serves as Trustee of other Fidelity funds. Mr. Lacy serves as Senior Adviser (2007-present) of Oak Hill Capital Partners, L.P. (private equity). Mr. Lacy also served as Chief Executive Officer (2000-2005) and Vice Chairman (2005-2006) of Sears Holdings Corporation and Sears, Roebuck and Co. (retail). In addition, Mr. Lacy serves as a member of the Board of Directors of Dave & Buster's Entertainment, Inc. (restaurant and entertainment complexes, 2010-present), Earth Fare, Inc. (retail grocery, 2012-present), The Hillman Companies, Inc. (hardware wholesalers, 2010-present), and Bristol-Myers Squibb Company (global pharmaceuticals, 2008-present). Mr. Lacy is a member of the Board of Trustees of The National Parks Conservation Association (2006-present). Previously, Mr. Lacy served as Chairman of the Board of Trustees of the National Parks Conservation Association (2008-2011) and as a member of the Board of Directors for the Western Union Company (global money transfer, 2006-2011). |
Ned C. Lautenbach (1944) |
Year of Election or Appointment: 2000 Trustee Chairman of the Independent Trustees |
| Mr. Lautenbach also serves as Trustee of other Fidelity funds. Mr. Lautenbach currently serves as the Lead Director of the Eaton Corporation Board of Directors (diversified industrial, 1997-present). Mr. Lautenbach is Chairman of the Board of Directors of the Philharmonic Center for the Arts in Naples, Florida (2012-present) and a member of the Council on Foreign Relations (1994-present). Previously, Mr. Lautenbach was a Partner/Advisory Partner at Clayton, Dubilier & Rice, LLC (private equity investment, 1998-2010), as well as a Director of Sony Corporation (2006-2007). |
Joseph Mauriello (1944) |
Year of Election or Appointment: 2008 Trustee |
| Mr. Mauriello also serves as Trustee of other Fidelity funds. Prior to his retirement in January 2006, Mr. Mauriello served in numerous senior management positions including Deputy Chairman and Chief Operating Officer (2004-2005), and Vice Chairman of Financial Services (2002-2004) of KPMG LLP US (professional services, 1965-2005). Mr. Mauriello currently serves as a member of the Board of Directors of XL Group plc. (global insurance and re-insurance, 2006-present). Previously, Mr. Mauriello served as a Director of the Hamilton Funds of the Bank of New York (2006-2007) and of Arcadia Resources Inc. (health care services and products, 2007-2012). |
Robert W. Selander (1950) |
Year of Election or Appointment: 2011 Trustee |
| Mr. Selander also serves as Trustee of other Fidelity funds. Previously, Mr. Selander served as a Member of the Advisory Board of other Fidelity funds (2011), and Executive Vice Chairman (2010), Chief Executive Officer (2009-2010), and President and Chief Executive Officer (1997-2009) of Mastercard, Inc. |
Cornelia M. Small (1944) |
Year of Election or Appointment: 2005 Trustee |
| Ms. Small also serves as Trustee of other Fidelity funds. Ms. Small is a member of the Board of Directors (2009-present) and Chair of the Investment Committee (2010-present) of the Teagle Foundation. Ms. Small also serves on the Investment Committee of the Berkshire Taconic Community Foundation (2008-present). Previously, Ms. Small served as Chairperson (2002-2008) and a member of the Investment Committee and Chairperson (2008-2012) and a member of the Board of Trustees of Smith College. In addition, Ms. Small served as Chief Investment Officer, Director of Global Equity Investments, and a member of the Board of Directors of Scudder, Stevens & Clark and Scudder Kemper Investments. |
William S. Stavropoulos (1939) |
Year of Election or Appointment: 2001 Trustee Vice Chairman of the Independent Trustees |
| Mr. Stavropoulos also serves as Trustee of other Fidelity funds. Mr. Stavropoulos serves as President and Founder of the Michigan Baseball Foundation, the Great Lakes Loons (2007-present). Mr. Stavropoulos is Chairman Emeritus of the Board of Directors of The Dow Chemical Company, where he previously served in numerous senior management positions, including President, CEO (1995-2000; 2002-2004), Chairman of the Executive Committee (2000-2006), and as a member of the Board of Directors (1990-2006). Currently, Mr. Stavropoulos is Chairman of the Board of Directors of Univar Inc. (global distributor of commodity and specialty chemicals), a Director of Teradata Corporation (data warehousing and technology solutions), and Maersk Inc. (industrial conglomerate), and a member of the Advisory Board for Metalmark Capital LLC (private equity investment, 2005-present). Mr. Stavropoulos is an operating advisor to Clayton, Dubilier & Rice, LLC (private equity investment). In addition, Mr. Stavropoulos is a member of the University of Notre Dame Advisory Council for the College of Science, a Trustee of the Rollin L. Gerstacker Foundation, and a Director of the Naples Philharmonic Center for the Arts. Previously, Mr. Stavropoulos served as a Director of Chemical Financial Corporation (bank holding company, 1993-2012) and Tyco International, Ltd. (multinational manufacturing and services, 2007-2012). |
David M. Thomas (1949) |
Year of Election or Appointment: 2008 Trustee |
| Mr. Thomas also serves as Trustee of other Fidelity funds. Mr. Thomas serves as Non-Executive Chairman of the Board of Directors of Fortune Brands Home and Security (home and security products, 2011-present), and as a member of the Board of Directors of Interpublic Group of Companies, Inc. (marketing communication, 2004-present). Previously, Mr. Thomas served as Executive Chairman (2005-2006) and Chairman and Chief Executive Officer (2000-2005) of IMS Health, Inc. (pharmaceutical and healthcare information solutions), and a Director of Fortune Brands, Inc. (consumer products, 2000-2011). |
+ The information above includes each Trustee's principal occupation during the last five years and other information relating to the experience, attributes, and skills relevant to each Trustee's qualifications to serve as a Trustee, which led to the conclusion that each Trustee should serve as a Trustee for the fund.
Advisory Board Member and Officers:
Correspondence intended for each officer and Peter S. Lynch may be sent to Fidelity Investments, 245 Summer Street, Boston, Massachusetts 02210. Officers appear below in alphabetical order.
Name, Year of Birth; Principal Occupation |
Peter S. Lynch (1944) |
Year of Election or Appointment: 2003 Member of the Advisory Board |
| Mr. Lynch also serves as Member of the Advisory Board of other Fidelity funds. Mr. Lynch is Vice Chairman and a Director of FMR and FMR Co., Inc. In addition, Mr. Lynch serves as a Trustee of Boston College and as the Chairman of the Inner-City Scholarship Fund. Previously, Mr. Lynch served on the Special Olympics International Board of Directors (1997-2006). |
Elizabeth Paige Baumann (1968) |
Year of Election or Appointment: 2012 Anti-Money Laundering (AML) Officer |
| Ms. Baumann also serves as AML Officer of other funds. She is Chief AML Officer of FMR LLC (2012-present) and is an employee of Fidelity Investments. Previously, Ms. Baumann served as Vice President and Deputy Anti-Money Laundering Officer (2007-2012). |
William C. Coffey (1969) |
Year of Election or Appointment: 2009 Assistant Secretary |
| Mr. Coffey also serves as Assistant Secretary of other funds. He is Senior Vice President and Deputy General Counsel of FMR LLC (2010-present), and is an employee of Fidelity Investments. Previously, Mr. Coffey served as Vice President and Associate General Counsel of FMR LLC (2005-2009). |
Timothy M. Cohen (1969) |
Year of Election or Appointment: 2014 Vice President of certain Equity Funds |
| Mr. Cohen also serves as Vice President of other funds. Mr. Cohen serves as a Director and Chief Compliance Officer of Fidelity Management & Research (U.K.) Inc. (2013-present) and is an employee of Fidelity Investments. |
Jonathan Davis (1968) |
Year of Election or Appointment: 2010 Assistant Treasurer |
| Mr. Davis also serves as Assistant Treasurer of other funds. Mr. Davis is an employee of Fidelity Investments. Previously, Mr. Davis served as Vice President and Associate General Counsel of FMR LLC (2003-2010). |
Adrien E. Deberghes (1967) |
Year of Election or Appointment: 2008 Deputy Treasurer |
| Mr. Deberghes also serves as an officer of other funds. He is an employee of Fidelity Investments (2008-present). Prior to joining Fidelity Investments, Mr. Deberghes was Senior Vice President of Mutual Fund Administration at State Street Corporation (2007-2008), Senior Director of Mutual Fund Administration at Investors Bank & Trust (2005-2007), and Director of Finance for Dunkin' Brands (2000-2005). |
Stephanie J. Dorsey (1969) |
Year of Election or Appointment: 2010 Assistant Treasurer |
| Ms. Dorsey also serves as an officer of other funds. She is an employee of Fidelity Investments (2008-present) and has served in other fund officer roles. Prior to joining Fidelity Investments, Ms. Dorsey served as Treasurer (2004-2008) of the JPMorgan Mutual Funds and Vice President (2004-2008) of JPMorgan Chase Bank. |
Howard J. Galligan III (1966) |
Year of Election or Appointment: 2014 Chief Financial Officer |
| Mr. Galligan also serves as Chief Financial Officer of other funds. Mr. Galligan serves as President of Fidelity Pricing and Cash Management Services (FPCMS) (2014-present) and as a Director of Strategic Advisers, Inc. (2008-present). Previously, Mr. Galligan served as Chief Administrative Officer of Asset Management (2011-2014) and Chief Operating Officer and Senior Vice President of Investment Support for Strategic Advisers, Inc. (2003-2011). |
Scott C. Goebel (1968) |
Year of Election or Appointment: 2008 Secretary and Chief Legal Officer (CLO) |
| Mr. Goebel serves as Secretary and CLO of other funds. Mr. Goebel also serves as Secretary of Fidelity SelectCo, LLC (2013-present), Fidelity Investments Money Management, Inc. (FIMM) (2010-present) and Fidelity Research and Analysis Company (FRAC) (2010-present); General Counsel, Secretary, and Senior Vice President of FMR (2008-present) and FMR Co., Inc. (2008-present); Chief Legal Officer of Fidelity Management & Research (Hong Kong) Limited (2008-present); and Assistant Secretary of Fidelity Management & Research (Japan) Limited (2008-present) and Fidelity Management & Research (U.K.) Inc. (2008-present). Previously, Mr. Goebel served as Secretary and CLO of other Fidelity funds (2008-2013), Assistant Secretary of FIMM (2008-2010), FRAC (2008-2010), and certain funds (2007-2008); and as Vice President and Secretary of Fidelity Distributors Corporation (FDC) (2005-2007). Mr. Goebel has been employed by FMR LLC or an affiliate since 2001. |
Brian B. Hogan (1964) |
Year of Election or Appointment: 2012 Vice President |
| Mr. Hogan also serves as Trustee or Vice President of other funds. Mr. Hogan serves as a Director of Fidelity SelectCo, LLC (2014-present) and President of FMR's Equity Division (2009-present). Previously, Mr. Hogan served as Senior Vice President, Equity Research of FMR (2006-2009) and as a portfolio manager. |
Chris Maher (1972) |
Year of Election or Appointment: 2013 Assistant Treasurer |
| Mr. Maher serves as Assistant Treasurer of other funds. Mr. Maher is Vice President of Valuation Oversight and is an employee of Fidelity Investments. Previously, Mr. Maher served as Vice President of Asset Management Compliance (2013), Vice President of FMR's Program Management Group (2010-2013), and Vice President of Valuation Oversight (2008-2010). |
Kenneth B. Robins (1969) |
Year of Election or Appointment: 2008 President and Treasurer |
| Mr. Robins also serves as an officer of other funds. Mr. Robins serves as Executive Vice President of Fidelity Investments Money Management, Inc. (FIMM) (2013-present) and is an employee of Fidelity Investments (2004-present). Previously, Mr. Robins served in other fund officer roles. |
Stephen Sadoski (1971) |
Year of Election or Appointment: 2012 Deputy Treasurer |
| Mr. Sadoski also serves as Deputy Treasurer of other funds. He is an employee of Fidelity Investments (2012-present) and has served in another fund officer role. Prior to joining Fidelity Investments, Mr. Sadoski served as an assistant chief accountant in the Division of Investment Management of the Securities and Exchange Commission (SEC) (2009-2012) and as a senior manager at Deloitte & Touche LLP (1997-2009). |
Stacie M. Smith (1974) |
Year of Election or Appointment: 2013 Deputy Treasurer |
| Ms. Smith also serves as an officer of other funds. She is an employee of Fidelity Investments (2009-present) and has served in other fund officer roles. Prior to joining Fidelity Investments, Ms. Smith served as Senior Audit Manager of Ernst & Young LLP (1996-2009). |
Renee Stagnone (1975) |
Year of Election or Appointment: 2013 Deputy Treasurer |
| Ms. Stagnone also serves as Deputy Treasurer of other funds. Ms. Stagnone is an employee of Fidelity Investments. |
Linda J. Wondrack (1964) |
Year of Election or Appointment: 2014 Chief Compliance Officer |
| Ms. Wondrack also serves as Chief Compliance Officer of other funds. Ms. Wondrack is Executive Vice President and head of the Ethics Office and Asset Management Compliance for Fidelity Investments (2012- present). Ms. Wondrack also serves as Chief Compliance Officer of Fidelity SelectCo, LLC (2014-present); Chief Compliance Officer of Impresa Management LLC (2013-present); and Chief Compliance Officer of FMR Co., Inc., Fidelity Investments Money Management, Inc., Fidelity Management & Research (Japan) Limited, Fidelity Management & Research (U.K.) Inc., Fidelity Management & Research (Hong Kong), Fidelity Management & Research Company, Pyramis Global Advisors, LLC, and Strategic Advisers, Inc., Ballyrock Investment Advisors LLC, and Northern Neck Investors LLC (2012-present). Previously, Ms. Wondrack served as Senior Vice President and Chief Compliance Officer for Columbia Management Investment Advisers, LLC (2005-2012); Chief Compliance Officer for certain funds within the Columbia Family of Funds (2007-2012); and Senior Vice President of Compliance Risk Management at Bank of America (2005-2010). |
Joseph F. Zambello (1957) |
Year of Election or Appointment: 2011 Deputy Treasurer |
| Mr. Zambello also serves as Deputy Treasurer of other funds. Mr. Zambello is an employee of Fidelity Investments. Previously, Mr. Zambello served as Vice President of FMR's Program Management Group (2009-2011) and Vice President of the Transfer Agent Oversight Group (2005-2009). |
Annual Report
The Board of Trustees of Fidelity Advisor Global Equity Income Fund voted to pay to shareholders of record at the opening of business on record date, the following distributions per share derived from capital gains realized from sales of portfolio securities, and dividends derived from net investment income:
| Pay Date | Record Date | Dividends | Capital Gains |
Class A | 12/08/2014 | 12/05/2014 | $0.013 | $0.709 |
Class T | 12/08/2014 | 12/05/2014 | $0.004 | $0.709 |
Class C | 12/08/2014 | 12/05/2014 | $0.000 | $0.695 |
The fund hereby designates as a capital gain dividend with respect to the taxable year ended October 31, 2014, $412,376 or, if subsequently determined to be different, the net capital gain of such year.
Class A, Class T and Class C designates 100% of dividends distributed during the fiscal year as amounts which may be taken into account as a dividend for purposes of the maximum rate under section 1(h)(11) of the Internal Revenue Code.
Class A designates 12%, 53%, 49%, and 51%; Class name T designates 14%, 56%, 56%, and 70%; Class C designates 19%, 63%, 81%, and 100% of the dividends distributed in December 2013, April 2014, July 2014 and October 2014 respectively during the fiscal year as qualifying for the dividends-received deduction for corporate shareholders.
A total of 0.05% of the dividends distributed during the fiscal year was derived from interest on U.S. Government securities which is generally exempt from state income tax.
The amounts per share which represent income derived from sources within, and taxes paid to, foreign countries or possessions of the United States are as follows:
| Pay Date | Income | Taxes |
Class A | 12/09/2013 | $0.0214 | $0.0045 |
| 04/07/2014 | $0.0311 | $0.0070 |
| 07/06/2014 | $0.0128 | $0.0027 |
| 10/06/2014 | $0.0067 | $0.0012 |
Class T | 12/09/2013 | $0.0189 | $0.0045 |
| 04/07/2014 | $0.0293 | $0.0070 |
| 07/06/2014 | $0.0112 | $0.0027 |
| 10/06/2014 | $0.0049 | $0.0012 |
Class C | 12/09/2013 | $0.0138 | $0.0045 |
| 04/07/2014 | $0.0258 | $0.0070 |
| 07/06/2014 | $0.0078 | $0.0027 |
| 10/06/2014 | $0.0012 | $0.0012 |
The fund will notify shareholders in January 2015 of amounts for use in preparing 2014 income tax returns.
Annual Report
Board Approval of Investment Advisory Contracts and Management Fees
Fidelity Advisor Global Equity Income Fund
Each year, the Board of Trustees, including the Independent Trustees (together, the Board), votes on the renewal of the management contract with Fidelity Management & Research Company (FMR) and the sub-advisory agreements (together, the Advisory Contracts) for the fund. The Board, assisted by the advice of fund counsel and Independent Trustees' counsel, requests and considers a broad range of information relevant to the renewal of the Advisory Contracts throughout the year.
The Board meets regularly and, at each of its meetings, covers an extensive agenda of topics and materials and considers factors that are relevant to its annual consideration of the renewal of the fund's Advisory Contracts, including the services and support provided to the fund and its shareholders. The Board has established various standing committees (Committees), each composed of and chaired by Independent Trustees with varying backgrounds, to which the Board has assigned specific subject matter responsibilities in order to enhance effective decision-making by the Board. The Board, acting directly and through its Committees, requests and receives information concerning the annual consideration of the renewal of the fund's Advisory Contracts. The Board also meets as needed to consider matters specifically related to the Board's annual consideration of the renewal of the Advisory Contracts. Members of the Board may also meet with trustees of other Fidelity funds through ad hoc joint committees to discuss certain matters relevant to the Fidelity funds.
At its July 2014 meeting, the Board, including the Independent Trustees, unanimously determined to renew the fund's Advisory Contracts. In reaching its determination, the Board considered all factors it believed relevant, including (i) the nature, extent, and quality of the services to be provided to the fund and its shareholders (including the investment performance of the fund); (ii) the competitiveness of the fund's management fee and total expense ratio relative to peer funds; (iii) the total costs of the services to be provided by and the profits to be realized by Fidelity from its relationship with the fund; (iv) the extent to which economies of scale exist and would be realized as the fund grows; and (v) whether fee levels reflect these economies of scale, if any, for the benefit of fund shareholders. In connection with separate internal corporate reorganizations involving Fidelity Management & Research (U.K.) Inc. (FMR U.K.) and Fidelity Management & Research (Japan) Inc. (FMR Japan), the Board approved certain non-material amendments to the fund's sub-advisory agreements with FMR U.K. and FMR Japan to reflect that, after these reorganizations, FMR Investment Management (UK) Limited and Fidelity Management & Research (Japan) Limited will carry on the business of FMR U.K. and FMR Japan, respectively. The Board noted that no changes to the portfolio managers or to the foreign research or investment advisory services provided to the fund were expected in connection with either reorganization and that the same personnel and resources would continue to be available to the fund at the new entities.
Annual Report
In considering whether to renew the Advisory Contracts for the fund, the Board reached a determination, with the assistance of fund counsel and Independent Trustees' counsel and through the exercise of its business judgment, that the renewal of the Advisory Contracts was in the best interests of the fund and its shareholders and that the compensation payable under the Advisory Contracts was fair and reasonable. The Board's decision to renew the Advisory Contracts was not based on any single factor, but rather was based on a comprehensive consideration of all the information provided to the Board at its meetings throughout the year. The Board, in reaching its determination to renew the Advisory Contracts, was aware that shareholders of the fund have a broad range of investment choices available to them, including a wide choice among funds offered by Fidelity's competitors, and that the fund's shareholders, who have the opportunity to review and weigh the disclosure provided by the fund in its prospectus and other public disclosures, have chosen to invest in this fund, which is part of the Fidelity family of funds.
Nature, Extent, and Quality of Services Provided. The Board considered Fidelity's staffing as it relates to the fund, including the backgrounds of investment personnel of FMR and the sub-advisers (together, the Investment Advisers), and also considered the fund's investment objective, strategies, and related investment philosophy. The Independent Trustees also had discussions with senior management of Fidelity's investment operations and investment groups. The Board considered the structure of the portfolio manager compensation program and whether this structure provides appropriate incentives to act in the best interests of the fund. Additionally, the Board considered the portfolio managers' investments, if any, in the funds that they manage.
Resources Dedicated to Investment Management and Support Services. The Board and the Fund Oversight and Research Committees reviewed the general qualifications and capabilities of Fidelity's investment staff, including its size, education, experience, and resources, as well as Fidelity's approach to recruiting, training, managing, and compensating investment personnel. The Board noted that Fidelity has continued to increase the resources devoted to non-U.S. offices, including expansion of Fidelity's global investment organization. The Board also noted that Fidelity's analysts have extensive resources, tools and capabilities that allow them to conduct sophisticated quantitative and fundamental analysis, as well as credit analysis of issuers, counterparties and guarantors. Further, the Board believes that Fidelity's investment professionals have sufficient access to global information and data so as to provide competitive investment results over time, and that those professionals also have access to sophisticated tools that permit them to assess portfolio construction and risk and performance attribution characteristics continuously, as well as to transmit new information and research conclusions rapidly around the world. Additionally, in its deliberations, the Board considered Fidelity's trading and risk management capabilities and resources and global compliance infrastructure, which are an integral part of the investment management process.
Annual Report
Board Approval of Investment Advisory Contracts and
Management Fees - continued
Shareholder and Administrative Services. The Board considered (i) the nature, extent, quality, and cost of advisory, administrative, and shareholder services performed by the Investment Advisers and their affiliates under the Advisory Contracts and under separate agreements covering transfer agency, pricing and bookkeeping, and securities lending services for the fund; (ii) the nature and extent of the supervision of third party service providers, principally custodians and subcustodians; and (iii) the resources devoted to, and the record of compliance with, the fund's compliance policies and procedures. The Board also reviewed the allocation of fund brokerage, including allocations to brokers affiliated with the Investment Advisers, the use of brokerage commissions to pay fund expenses, and the use of "soft" commission dollars to pay for research services.
The Board noted that the growth of fund assets over time across the complex allows Fidelity to reinvest in the development of services designed to enhance the value or convenience of the Fidelity funds as investment vehicles. These services include 24-hour access to account information and market information through telephone representatives and over the Internet, investor education materials and asset allocation tools, and the expanded availability of Fidelity Investor Centers.
In 2014, the Board formed an ad hoc Committee on Transfer Agency Fees to review the variety of transfer agency fee structures throughout the industry and Fidelity's competitive positioning with respect to industry participants.
Investment in a Large Fund Family. The Board considered the benefits to shareholders of investing in a Fidelity fund, including the benefits of investing in a fund that is part of a large family of funds offering a variety of investment disciplines and providing a large variety of mutual fund investor services. The Board noted that Fidelity had taken, or had made recommendations that resulted in the Fidelity funds taking, a number of actions over the previous year that benefited particular funds, including (i) continuing to dedicate additional resources to investment research and to the support of the senior management team that oversees asset management; (ii) persisting in efforts to enhance Fidelity's global research capabilities; (iii) launching new funds and making other enhancements to meet client needs for income-oriented solutions; (iv) reducing fund expenses for certain index funds; (v) continuing to launch dedicated lower cost underlying funds to meet portfolio construction needs related to expanding underlying fund options for Fidelity funds of funds, specifically for the Freedom Fund product lines; (vi) rationalizing product lines and gaining increased efficiencies through fund mergers; (vii) launching sector-based exchange-traded funds and establishing a new Fidelity adviser to manage sector-based funds and products; (viii) continuing to develop and implement technology to improve security and increase efficiency; (ix) modifying the eligibility criteria for certain share classes to increase their marketability to a portion of the defined contribution plan market; (x) waiving redemption fees for certain qualified fund-of-fund and wrap programs and certain retirement plan transactions; and (xi) launching new Institutional Class shares of certain money market funds to attract and retain assets and to fill a gap in the money market fund lineup.
Annual Report
Investment Performance. The Board considered whether the fund has operated in accordance with its investment objective, as well as its record of compliance with its investment restrictions and its performance history.
The Board took into account discussions with the Investment Advisers about fund investment performance that occur at Board meetings throughout the year. In this regard the Board noted that as part of regularly scheduled fund reviews and other reports to the Board on fund performance, the Board periodically considers annualized return information for the fund, for different time periods, measured against a securities market index ("benchmark index") and a peer group of funds with similar objectives ("peer group"). In its evaluation of fund investment performance, the Board gave particular attention to information indicating changes in performance of certain Fidelity funds for specific time periods and the Investment Advisers' explanations for any overperformance or underperformance.
In addition to reviewing absolute and relative fund performance, the Independent Trustees periodically consider the appropriateness of fund performance metrics in evaluating the results achieved. In general, the Independent Trustees believe that fund performance should be evaluated based on net performance (after fees and expenses) of both the highest performing and lowest performing classes, where applicable, compared to appropriate benchmark indices, over appropriate time periods which may include full market cycles, and compared to peer groups, as applicable, over the same periods, taking into account relevant factors including the following: general market conditions; issuer-specific information; tactical opportunities for investment; and fund cash flows and other factors.
The Independent Trustees recognize that shareholders evaluate performance on a net basis over their own holding periods, for which one-, three-, and five-year periods are often used as a proxy. For this reason, the performance information reviewed by the Board also included net cumulative calendar year total return information for the fund and an appropriate benchmark index and peer group for the most recent one-year period, as shown below. Returns are shown compared to the 25th percentile (top of box, 75% beaten) and 75th percentile (bottom of box, 25% beaten) of the peer universe. Returns of the benchmark index are "net MA," i.e., adjusted for tax withholding rates applicable to U.S.-based funds organized as Massachusetts business trusts.
Annual Report
Board Approval of Investment Advisory Contracts and
Management Fees - continued
Fidelity Advisor Global Equity Income Fund

Based on its review, the Board concluded that the nature, extent, and quality of services provided to the fund under the Advisory Contracts should benefit the fund's shareholders.
Competitiveness of Management Fee and Total Expense Ratio. The Board considered the fund's management fee and total expense ratio compared to "mapped groups" of competitive funds and classes. Fidelity creates "mapped groups" by combining similar Lipper investment objective categories that have comparable investment mandates. Combining Lipper investment objective categories aids the Board's management fee and total expense ratio comparisons by broadening the competitive group used for comparison and by reducing the number of universes to which various Fidelity funds are compared.
Management Fee. The Board considered two proprietary management fee comparisons for the 12-month (or shorter) periods shown in the chart below. The group of Lipper funds used by the Board for management fee comparisons is referred to below as the "Total Mapped Group." The Total Mapped Group is broader than the Lipper peer group used by the Board for performance comparisons because the Total Mapped Group combines several Lipper investment objective categories while the Lipper peer group does not. The Total Mapped Group comparison focuses on a fund's standing in terms of gross management fees before expense reimbursements or caps relative to the total universe of funds with comparable investment mandates, regardless of whether their management fee structures also are comparable. Funds with comparable investment mandates offer exposure to similar types of securities. Funds with comparable management fee structures have similar management fee contractual arrangements (e.g., flat rate charged for advisory services, all-inclusive fee rate, etc.). "TMG %" represents the percentage of funds in the Total Mapped Group that had management fees that were lower than the fund's. For example, a hypothetical TMG % of 20% would mean that 80% of the funds in the Total Mapped Group had higher, and 20% had lower, management fees than the fund. The fund's actual TMG %s are in the chart below. The "Asset-Size Peer Group" (ASPG) comparison focuses on a fund's standing relative to a subset of non-Fidelity funds within the Total Mapped Group that are similar in size and management fee structure. For example, if a fund is in the first quartile of the ASPG, the fund's management fee ranks in the least expensive or lowest 25% of funds in the ASPG. The ASPG represents at least 15% of the funds in the Total Mapped Group with comparable asset size and management fee structures, subject to a minimum of 50 funds (or all funds in the Total Mapped Group if fewer than 50). Additional information, such as the ASPG quartile in which the fund's management fee rate ranked, is also included in the chart and considered by the Board.
Annual Report
Fidelity Advisor Global Equity Income Fund
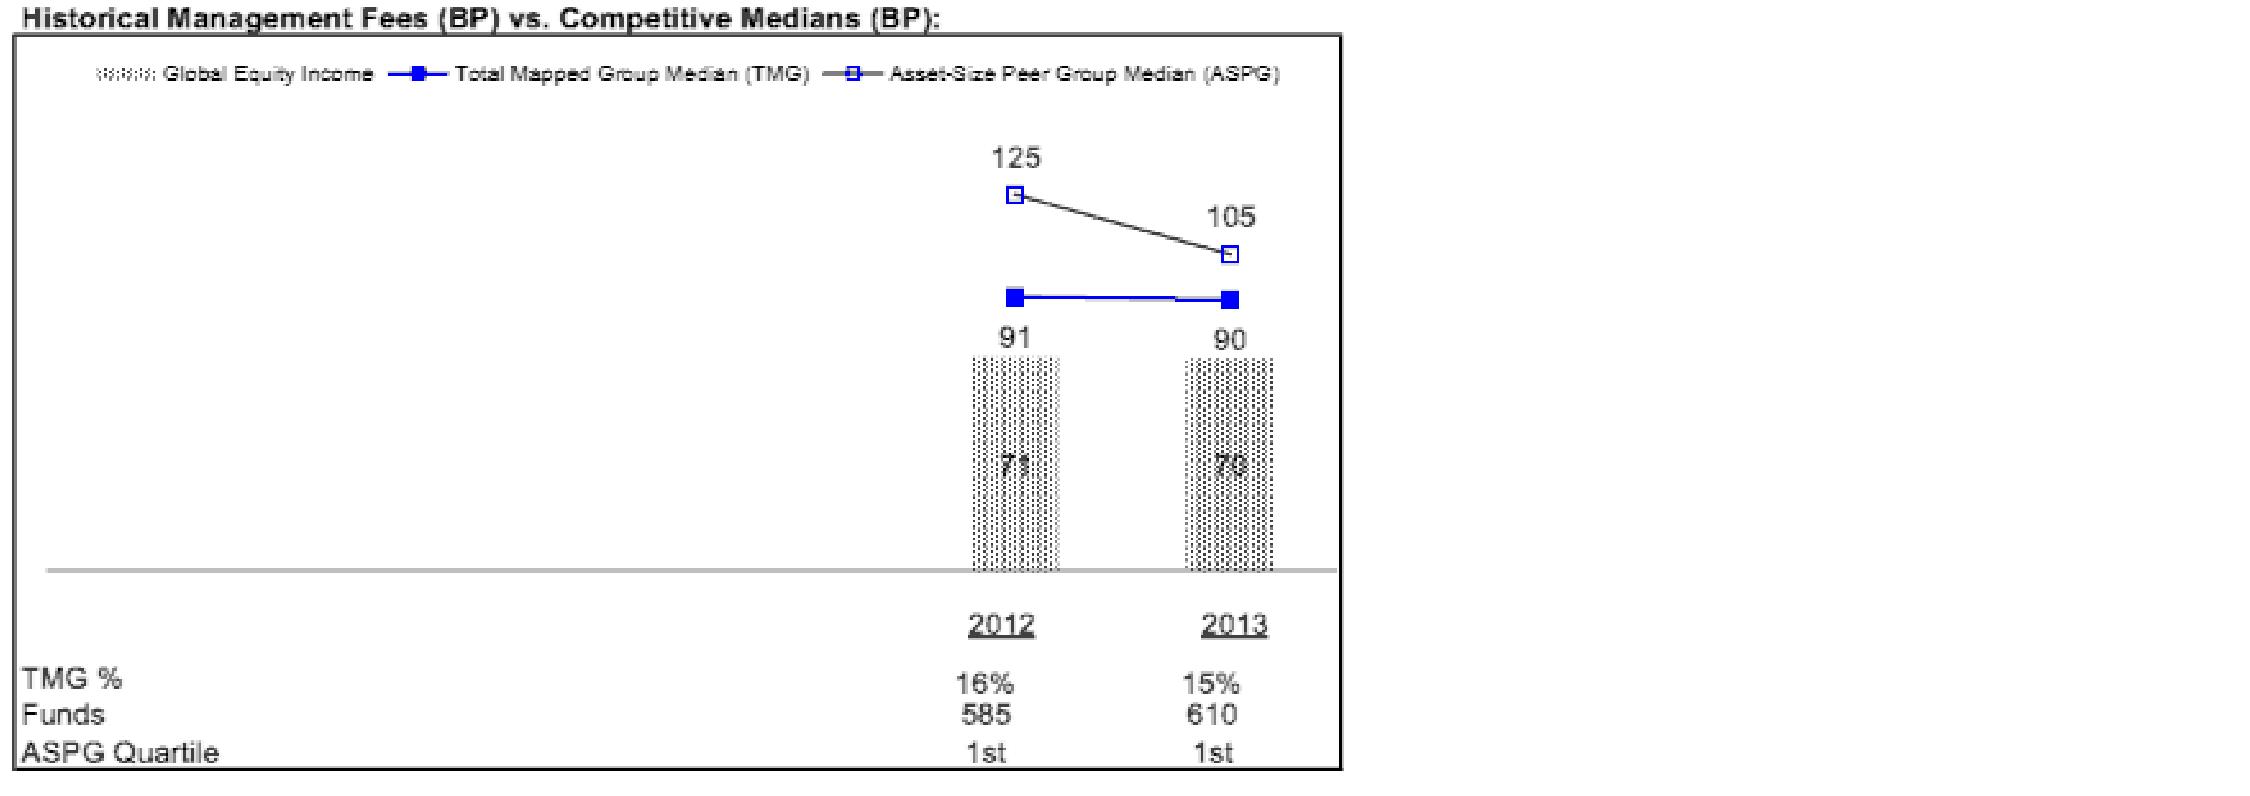
The Board noted that the fund's management fee rate ranked below the median of its Total Mapped Group and below the median of its ASPG for 2013.
The Board also noted that, in August 2013, the ad hoc Committee on Management Fees was formed to conduct an in-depth review of the management fee rates of Fidelity's active equity mutual funds. The Committee focused on the following areas: (i) standard fee structures; (ii) research consumption and trading evolution; (iii) management fee competitiveness/profitability by category; and (iv) factors that drive institutional pricing.
Annual Report
Board Approval of Investment Advisory Contracts and
Management Fees - continued
Based on its review, the Board concluded that the fund's management fee is fair and reasonable in light of the services that the fund receives and the other factors considered.
Total Expense Ratio. In its review of each class's total expense ratio, the Board considered the fund's management fee as well as other fund or class expenses, as applicable, such as transfer agent fees, pricing and bookkeeping fees, fund-paid 12b-1 fees, and custodial, legal, and audit fees. The Board also noted the effects of any waivers and reimbursements on fees and expenses. As part of its review, the Board also considered the current and historical total expense ratios of each class of the fund compared to competitive fund median expenses. Each class of the fund is compared to those funds and classes in the Total Mapped Group (used by the Board for management fee comparisons) that have a similar sales load structure.
The Board noted that the total expense ratio of each class ranked above its competitive median for 2013. The Board considered that, in general, various factors can affect total expense ratios. The Board noted that the total expense ratio of Class T was above the competitive median primarily because of higher 12b-1 fees on Class T as compared to most competitor funds. Class T has a higher 12b-1 fee, but a lower front-end sales charge, than traditionally priced front-end sales charge classes. The Board considered that Class T is primarily sold load-waived in the retirement plan market where its 0.50% 12b-1 fee is comparable to competing no-load, higher 12b-1 fee classes designed specifically for retirement plans. The Board noted that the fund offers multiple classes, each of which has a different sales load and 12b-1 fee structure, and that the multiple structures are intended to offer a range of pricing options for the intermediary market. The Board also noted that the total expense ratios of the classes vary primarily by the level of their 12b-1 fees, although differences in transfer agent fees may also cause expenses to vary from class to class.
The Board further considered that FMR contractually agreed to reimburse Class A, Class T, Class C, and Institutional Class of the fund to the extent that total expenses (excluding interest, certain taxes, certain securities lending costs, brokerage commissions, extraordinary expenses, and acquired fund fees and expenses, if any), as a percentage of their respective average net assets, exceed 1.45%, 1.70%, 2.20%, and 1.20% through December 31, 2014.
Fees Charged to Other Fidelity Clients. The Board also considered Fidelity fee structures and other information with respect to clients of Fidelity, such as other funds advised or subadvised by Fidelity, pension plan clients, and other institutional clients. The Board noted the findings of the 2013 ad hoc joint committee (created with the board of other Fidelity funds), which reviewed and compared Fidelity's institutional investment advisory business with its business of providing services to the Fidelity funds, including the differences in services provided, fees charged, and costs incurred, as well as competition in their respective marketplaces.
Annual Report
Based on its review of total expense ratios and fees charged to other Fidelity clients, the Board concluded that the total expense ratio of each class of the fund was reasonable, although in all cases above the median of the universe presented for comparison, in light of the services that the fund and its shareholders receive and the other factors considered.
Costs of the Services and Profitability. The Board considered the revenues earned and the expenses incurred by Fidelity in conducting the business of developing, marketing, distributing, managing, administering and servicing the fund and servicing the fund's shareholders. The Board also considered the level of Fidelity's profits in respect of all the Fidelity funds.
On an annual basis, Fidelity presents to the Board Fidelity's profitability for the fund. Fidelity calculates the profitability for each fund, as well as aggregate profitability for groups of Fidelity funds and all Fidelity funds, using a series of detailed revenue and cost allocation methodologies which originate with the books and records of Fidelity on which Fidelity's audited financial statements are based. The Audit Committee of the Board reviews any significant changes from the prior year's methodologies.
PricewaterhouseCoopers LLP (PwC), independent registered public accounting firm and auditor to Fidelity and certain Fidelity funds, has been engaged annually by the Board as part of the Board's assessment of Fidelity's profitability analysis. PwC's engagement includes the review and assessment of the methodologies used by Fidelity in determining the revenues and expenses attributable to Fidelity's mutual fund business, and completion of agreed-upon procedures in respect of the mathematical accuracy of fund profitability and its conformity to established allocation methodologies. After considering PwC's reports issued under the engagement and information provided by Fidelity, the Board concluded that while other allocation methods may also be reasonable, Fidelity's profitability methodologies are reasonable in all material respects.
The Board also reviewed Fidelity's non-fund businesses and fall-out benefits related to the mutual fund business as well as cases where Fidelity's affiliates may benefit from or be related to the fund's business.
The Board considered the costs of the services provided by and the profits realized by Fidelity in connection with the operation of the fund and was satisfied that the profitability was not excessive in the circumstances.
Economies of Scale. The Board considered whether there have been economies of scale in respect of the management of the Fidelity funds, whether the Fidelity funds (including the fund) have appropriately benefited from any such economies of scale, and whether there is potential for realization of any further economies of scale. The Board considered the extent to which the fund will benefit from economies of scale through increased services to the fund, through waivers or reimbursements, or through fee or expense ratio reductions. The Board also noted that in 2013, it and the boards of other Fidelity funds created an ad hoc committee (the Economies of Scale Committee) to analyze whether Fidelity attains economies of scale in respect of the management and servicing of the Fidelity funds, whether the Fidelity funds have appropriately benefited from such economies of scale, and whether there is potential for realization of any further economies of scale.
Annual Report
Board Approval of Investment Advisory Contracts and
Management Fees - continued
The Board recognized that the fund's management contract incorporates a "group fee" structure, which provides for lower group fee rates as total group assets increase, and for higher group fee rates as total group assets decrease (with "group assets" defined to include fund assets under FMR's management plus sector fund assets previously under FMR's management and currently managed by Fidelity SelectCo, LLC). FMR calculates the group fee rates based on a tiered asset "breakpoint" schedule that varies based on asset class. The Board considered that the group fee is designed to deliver the benefits of economies of scale to fund shareholders when total Fidelity fund assets increase, even if assets of any particular fund are unchanged or have declined, because some portion of Fidelity's costs are attributable to services provided to all Fidelity funds, and all funds benefit if those costs can be allocated among more assets. The Board concluded that, given the group fee structure, fund shareholders will benefit from lower management fees as group assets increase at the fund complex level, regardless of whether Fidelity achieves any such economies of scale.
The Board concluded, taking into account the analysis of the Economies of Scale Committee, that economies of scale, if any, are being appropriately shared between fund shareholders and Fidelity.
Additional Information Requested by the Board. In order to develop fully the factual basis for consideration of the Fidelity funds' Advisory Contracts, the Board requested and received additional information on certain topics, including: (i) fund performance trends and Fidelity's long-term strategies for certain funds; (ii) Fidelity's strategic marketing and product lineup goals; (iii) the methodology with respect to competitive fund data and peer group classifications; (iv) the arrangements with, and performance of, certain sub-advisers on behalf of the Fidelity funds, as well as certain proposed participating affiliate arrangements; (v) the realization of fall-out benefits in certain Fidelity business units; (vi) Fidelity's group fee structures, including the rationale for the individual fee rates of certain categories of funds and the definition of group assets; (vii) trends regarding industry use of performance fee structures and the performance adjustment methodologies applicable to the Fidelity funds; (viii) additional competitive analysis regarding the total expenses for certain classes; (ix) fund profitability methodology, including Fidelity's cost allocation methodology, and the impact of certain factors on fund profitability results; and (x) the process by which Fidelity determines sub-advisory fees for funds it advises.
Annual Report
Based on its evaluation of all of the conclusions noted above, and after considering all factors it believed relevant, the Board ultimately concluded that the advisory fee structures are fair and reasonable, and that the fund's Advisory Contracts should be renewed.
Annual Report
Investment Adviser
Fidelity Management & Research Company
Boston, MA
Investment Sub-Advisers
FMR Co., Inc.
Fidelity Management & Research
(U.K.) Inc.
Fidelity Management & Research
(Hong Kong) Limited
Fidelity Management & Research
(Japan) Limited
FIL Investments (Japan) Limited
FIL Investment Advisors
FIL Investment Advisors (UK) Limited
General Distributor
Fidelity Distributors Corporation
Smithfield, RI
Transfer and Service Agents
Fidelity Investments Institutional
Operations Company, Inc.
Boston, MA
Fidelity Service Company, Inc.
Boston, MA
Custodian
Citibank, N.A.
New York, NY
(Fidelity Investment logo)(registered trademark)
AGED-UANN-1214
1.938150.102
(Fidelity Investment logo)(registered trademark)
Fidelity Advisor®
Global Equity Income
Fund - Institutional Class
Annual Report
October 31, 2014
(Fidelity Cover Art)
Contents
Performance | (Click Here) | How the fund has done over time. |
Management's Discussion of Fund Performance | (Click Here) | The Portfolio Manager's review of fund performance and strategy. |
Shareholder Expense Example | (Click Here) | An example of shareholder expenses. |
Investment Changes | (Click Here) | A summary of major shifts in the fund's investments over the past six months. |
Investments | (Click Here) | A complete list of the fund's investments with their market values. |
Financial Statements | (Click Here) | Statements of assets and liabilities, operations, and changes in net assets, as well as financial highlights. |
Notes | (Click Here) | Notes to the financial statements. |
Report of Independent Registered Public Accounting Firm | (Click Here) | |
Trustees and Officers | (Click Here) | |
Distributions | (Click Here) | |
Board Approval of Investment Advisory Contracts and Management Fees | (Click Here) | |
To view a fund's proxy voting guidelines and proxy voting record for the 12-month period ended June 30, visit http://www.fidelity.com/proxyvotingresults or visit the Securities and Exchange Commission's (SEC) web site at http://www.sec.gov. You may also call 1-877-208-0098 to request a free copy of the proxy voting guidelines.
Standard & Poor's, S&P and S&P 500 are registered service marks of The McGraw-Hill Companies, Inc. and have been licensed for use by Fidelity Distributors Corporation.
Other third-party marks appearing herein are the property of their respective owners.
All other marks appearing herein are registered or unregistered trademarks or service marks of FMR LLC or an affiliated company. © 2014 FMR LLC. All rights reserved.
Annual Report
This report and the financial statements contained herein are submitted for the general information of the shareholders of the fund. This report is not authorized for distribution to prospective investors in the fund unless preceded or accompanied by an effective prospectus.
A fund files its complete schedule of portfolio holdings with the SEC for the first and third quarters of each fiscal year on Form N-Q. Forms N-Q are available on the SEC's web site at http://www.sec.gov. A fund's Forms N-Q may be reviewed and copied at the SEC's Public Reference Room in Washington, DC. Information regarding the operation of the SEC's Public Reference Room may be obtained by calling 1-800-SEC-0330. For a complete list of a fund's portfolio holdings, view the most recent holdings listing, semiannual report, or annual report on Fidelity's web site at http://www.fidelity.com, http://www.advisor.fidelity.com, or http://www.401k.com, as applicable.
NOT FDIC INSURED • MAY LOSE VALUE • NO BANK GUARANTEE
Neither the fund nor Fidelity Distributors Corporation is a bank.
Annual Report
Average annual total return reflects the change in the value of an investment, assuming reinvestment of the class' distributions from dividend income and capital gains (the profits earned upon the sale of securities that have grown in value, if any) and assuming a constant rate of performance each year. The $10,000 table and the fund's returns do not reflect the deduction of taxes that a shareholder would pay on fund distributions or the redemption of fund shares. During periods of reimbursement by Fidelity, a fund's total return will be greater than it would be had the reimbursement not occurred. How a fund did yesterday is no guarantee of how it will do tomorrow.
Average Annual Total Returns
Periods ended October 31, 2014 | | Past 1
year | Life of fund A |
Institutional Class | | 9.86% | 13.86% |
A From May 2, 2012.
$10,000 Over Life of Fund
Let's say hypothetically that $10,000 was invested in Fidelity Advisor® Global Equity Income Fund - Institutional Class on May 2, 2012, when the fund started. The chart shows how the value of your investment would have changed, and also shows how the MSCI ACWI (All Country World Index) Index performed over the same period.
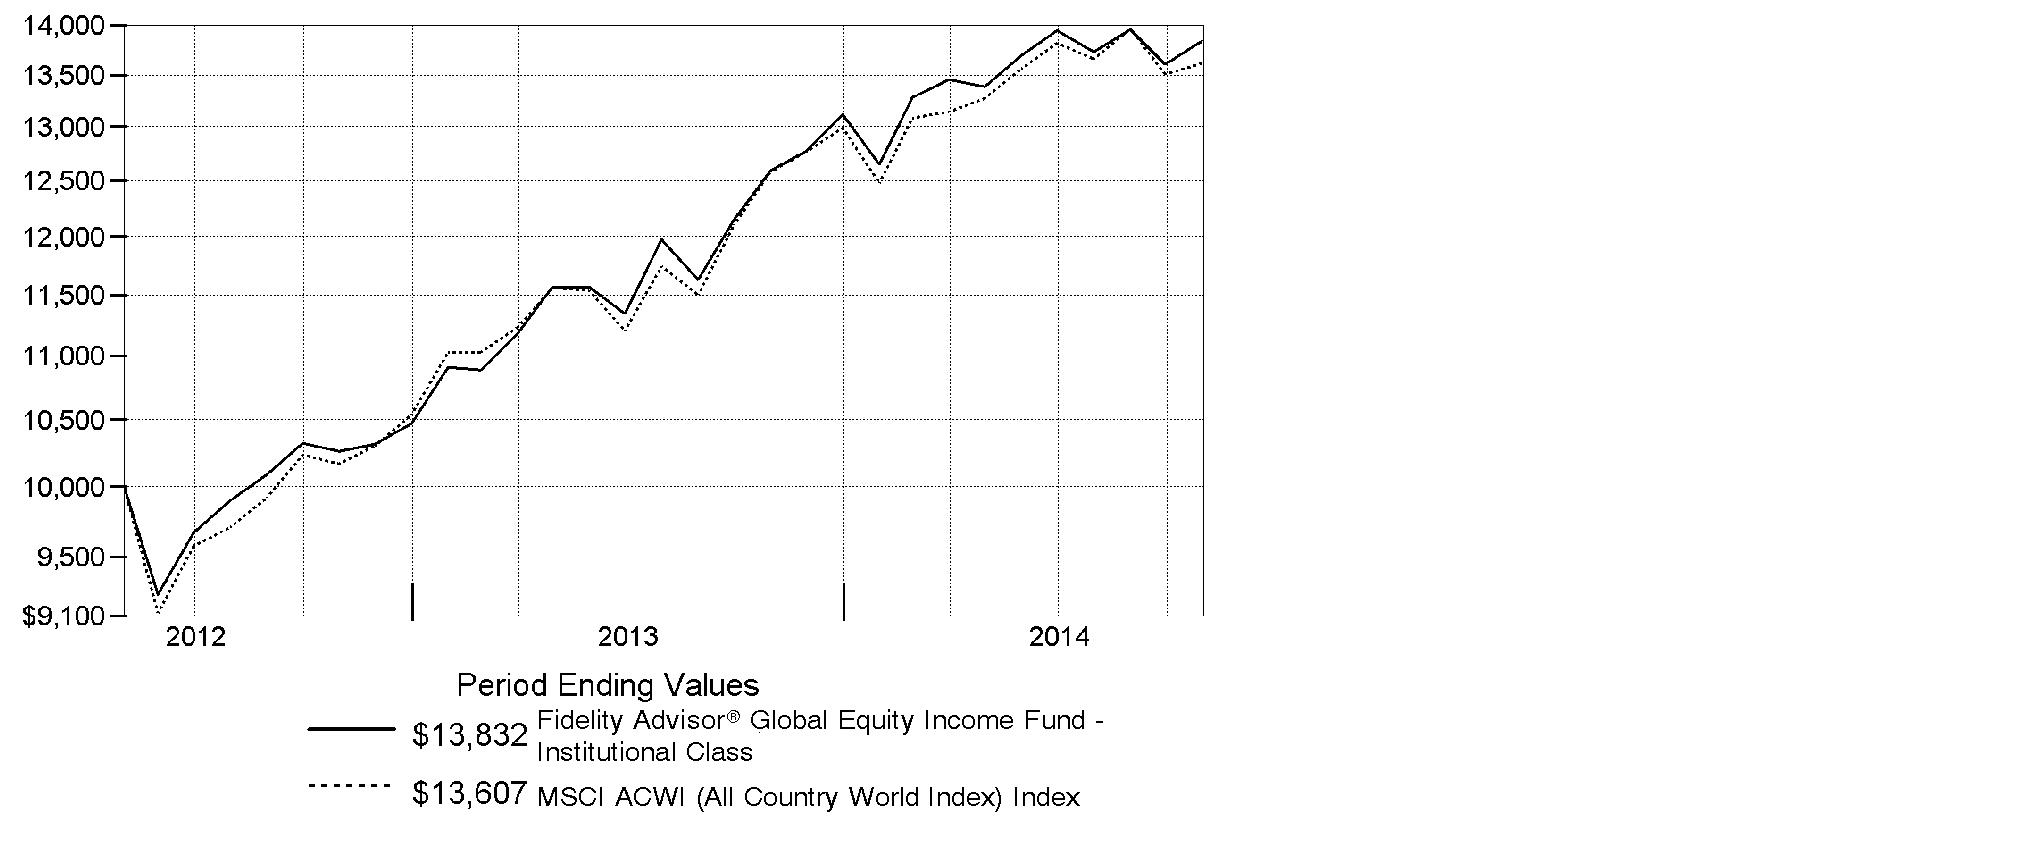
Annual Report
Market Recap: Global equities posted a healthy gain for the 12 months ending October 31, 2014, overcoming an October market decline driven by recessionary pressures in China and tepid growth in Europe. The MSCI ACWI (All Country World Index) Index rose 8.15%, helped by subdued market volatility for much of the period and supported by solid corporate earnings, especially in the United States. Stocks also benefited from easy monetary policies in Japan and the eurozone, as well as increased stimulus efforts in China. All but three of the 24 industry groups that compose the index marked a positive return. The U.S. (+17%) remained a pillar of strength, while a strongly rising dollar in the latter part of the period detracted from investors' returns in most non-U.S. markets. Canada (+5%) notched broad gains outside of its energy and materials sectors, as did Asia-Pacific ex Japan (+4%), led by investor enthusiasm for companies in India. The U.K., Europe and Japan, meanwhile, all underperformed. Among sectors, health care (+24%) led the index, with a strong contribution from the pharmaceuticals, biotechnology & life sciences industry. Information technology (+21%) also outperformed. Conversely, materials (-4%) and energy (-1%) lagged the index due to a higher supply of and lower demand for commodities.
Comments from Ramona Persaud, Portfolio Manager of Fidelity Advisor® Global Equity Income Fund: For the year, the fund's Institutional Class shares gained 9.86%, outperforming the MSCI ACWI index. Versus the index, stock selection in several areas drove the fund's outperformance, especially in consumer staples where Dr Pepper Snapple Group added value and was the fund's most overweighted position at period end. Shares of the beverage maker gained on stable pricing in its markets, as well as very strong capital allocation policies including an attractive dividend and generous share buybacks. Other interesting contributors from the sector included Greencore Group, a Dublin-based prepared-foods producer, and South Africa's Astral Foods, a poultry producer. Neither was in the index. In order to lock in profits, I sold the fund's position in Astral by period end. Elsewhere, biotechnology firm Amgen also helped. The biggest individual detractor was a non-index stake in Reunert, a South African industrial conglomerate that struggled with sluggish end markets the past year. It also hurt to avoid index component Gilead Sciences, a biotech firm that did well on its ground-breaking treatment for hepatitis C. Gilead, however, does not pay a dividend, which means it's not a name likely to be held in this portfolio or other equity-income funds.
The views expressed above reflect those of the portfolio manager(s) only through the end of the period as stated on the cover of this report and do not necessarily represent the views of Fidelity or any other person in the Fidelity organization. Any such views are subject to change at any time based upon market or other conditions and Fidelity disclaims any responsibility to update such views. These views may not be relied on as investment advice and, because investment decisions for a Fidelity fund are based on numerous factors, may not be relied on as an indication of trading intent on behalf of any Fidelity fund.
Annual Report
Shareholder Expense Example
As a shareholder of the Fund, you incur two types of costs: (1) transaction costs, including sales charges (loads) on purchase payments or redemption proceeds, and (2) ongoing costs, including management fees, distribution and/or service (12b-1) fees and other Fund expenses. This Example is intended to help you understand your ongoing costs (in dollars) of investing in the Fund and to compare these costs with the ongoing costs of investing in other mutual funds.
The Example is based on an investment of $1,000 invested at the beginning of the period and held for the entire period (May 1, 2014 to October 31, 2014).
Actual Expenses
The first line of the accompanying table for each class of the Fund provides information about actual account values and actual expenses. You may use the information in this line, together with the amount you invested, to estimate the expenses that you paid over the period. Simply divide your account value by $1,000.00 (for example, an $8,600 account value divided by $1,000.00 = 8.6), then multiply the result by the number in the first line for a class of the Fund under the heading entitled "Expenses Paid During Period" to estimate the expenses you paid on your account during this period. In addition, the Fund, as a shareholder in the underlying Fidelity Central Funds, will indirectly bear its pro-rata share of the fees and expenses incurred by the underlying Fidelity Central Funds. These fees and expenses are not included in the Fund's annualized expense ratio used to calculate the expense estimate in the table below.
Hypothetical Example for Comparison Purposes
The second line of the accompanying table for each class of the Fund provides information about hypothetical account values and hypothetical expenses based on a Class' actual expense ratio and an assumed rate of return of 5% per year before expenses, which is not the Class' actual return. The hypothetical account values and expenses may not be used to estimate the actual ending account balance or expenses you paid for the period. You may use this information to compare the ongoing costs of investing in the Fund and other funds. To do so, compare this 5% hypothetical example with the 5% hypothetical examples that appear in the shareholder reports of the other funds. In addition, the Fund, as a shareholder in the underlying Fidelity Central Funds, will indirectly bear its pro-rata share of the fees and expenses incurred by the underlying Fidelity Central Funds. These fees and expenses are not included in the Fund's annualized expense ratio used to calculate the expense estimate in the table below.
Please note that the expenses shown in the table are meant to highlight your ongoing costs only and do not reflect any transaction costs. Therefore, the second line of the table is useful in comparing ongoing costs only, and will not help you determine the relative total costs of owning different funds. In addition, if these transactional costs were included, your costs would have been higher.
Annual Report
| Annualized
Expense RatioB | Beginning
Account Value
May 1, 2014 | Ending
Account Value
October 31, 2014 | Expenses Paid
During Period*
May 1, 2014 to
October 31, 2014 |
Class A | 1.45% | | | |
Actual | | $ 1,000.00 | $ 1,032.50 | $ 7.43 |
HypotheticalA | | $ 1,000.00 | $ 1,017.90 | $ 7.38 |
Class T | 1.70% | | | |
Actual | | $ 1,000.00 | $ 1,031.30 | $ 8.70 |
HypotheticalA | | $ 1,000.00 | $ 1,016.64 | $ 8.64 |
Class C | 2.20% | | | |
Actual | | $ 1,000.00 | $ 1,028.90 | $ 11.25 |
HypotheticalA | | $ 1,000.00 | $ 1,014.12 | $ 11.17 |
Institutional Class | 1.20% | | | |
Actual | | $ 1,000.00 | $ 1,033.80 | $ 6.15 |
HypotheticalA | | $ 1,000.00 | $ 1,019.16 | $ 6.11 |
A 5% return per year before expenses
B Annualized expense ratio reflects expenses net of applicable fee waivers.
* Expenses are equal to each Class' annualized expense ratio, multiplied by the average account value over the period, multiplied by 184/365 (to reflect the one-half year period).
Annual Report
Investment Changes (Unaudited)
Top Five Stocks as of October 31, 2014 |
| % of fund's
net assets | % of fund's net assets
6 months ago |
Apple, Inc. (United States of America, Technology Hardware, Storage & Peripherals) | 2.5 | 0.0 |
Johnson & Johnson (United States of America, Pharmaceuticals) | 2.4 | 1.4 |
JPMorgan Chase & Co. (United States of America, Banks) | 2.3 | 2.1 |
Amgen, Inc. (United States of America, Biotechnology) | 2.1 | 1.5 |
Roche Holding AG (participation certificate) (Switzerland, Pharmaceuticals) | 2.0 | 2.1 |
| 11.3 | |
Top Five Market Sectors as of October 31, 2014 |
| % of fund's
net assets | % of fund's net assets
6 months ago |
Financials | 20.5 | 22.7 |
Consumer Discretionary | 14.1 | 12.4 |
Health Care | 13.5 | 9.7 |
Information Technology | 11.9 | 11.3 |
Consumer Staples | 10.3 | 11.2 |
Top Five Countries as of October 31, 2014 |
(excluding cash equivalents) | % of fund's
net assets | % of fund's net assets
6 months ago |
United States of America | 48.2 | 41.3 |
Japan | 9.8 | 6.7 |
United Kingdom | 6.0 | 9.8 |
Switzerland | 4.3 | 3.9 |
Canada | 4.2 | 3.9 |
Percentages are adjusted for the effect of open futures contracts, if applicable. |
Asset Allocation (% of fund's net assets) |
As of October 31, 2014 | As of April 30, 2014 |
 | Stocks 95.8% | | | Stocks 96.5% | |
 | Short-Term
Investments and
Net Other Assets (Liabilities) 4.2% | | | Short-Term
Investments and
Net Other Assets (Liabilities) 3.5% | |

Annual Report
Investments October 31, 2014
Showing Percentage of Net Assets
Common Stocks - 95.8% |
| Shares | | Value |
Australia - 0.6% |
Woodside Petroleum Ltd. | 1,710 | | $ 60,740 |
Bailiwick of Jersey - 0.6% |
Shire PLC | 1,000 | | 67,097 |
Canada - 4.2% |
Constellation Software, Inc. | 100 | | 28,171 |
Corus Entertainment, Inc. Class B (non-vtg.) | 3,860 | | 71,032 |
Fairfax Financial Holdings Ltd. (sub. vtg.) | 130 | | 59,395 |
Potash Corp. of Saskatchewan, Inc. | 3,340 | | 114,005 |
PrairieSky Royalty Ltd. | 1,100 | | 33,867 |
Suncor Energy, Inc. | 3,930 | | 139,549 |
TOTAL CANADA | | 446,019 |
Cayman Islands - 0.3% |
SITC International Holdings Co. Ltd. | 55,000 | | 29,298 |
Chile - 0.4% |
Quinenco SA | 18,315 | | 38,036 |
Denmark - 0.7% |
Spar Nord Bank A/S | 2,800 | | 28,285 |
Vestas Wind Systems A/S (a) | 1,400 | | 46,859 |
TOTAL DENMARK | | 75,144 |
France - 2.7% |
Bureau Veritas SA | 3,096 | | 76,548 |
Renault SA | 917 | | 68,063 |
Total SA | 2,261 | | 134,989 |
TOTAL FRANCE | | 279,600 |
Germany - 2.1% |
AURELIUS AG | 1,299 | | 45,124 |
Gerry Weber International AG (Bearer) | 1,340 | | 53,785 |
OSRAM Licht AG (a) | 1,449 | | 50,770 |
Siemens AG | 664 | | 74,895 |
TOTAL GERMANY | | 224,574 |
Greece - 0.3% |
Greek Organization of Football Prognostics SA | 2,700 | | 32,718 |
Hong Kong - 1.3% |
HKT Trust/HKT Ltd. unit | 44,280 | | 53,943 |
Techtronic Industries Co. Ltd. | 26,500 | | 82,961 |
TOTAL HONG KONG | | 136,904 |
Common Stocks - continued |
| Shares | | Value |
Ireland - 1.5% |
Accenture PLC Class A | 1,190 | | $ 96,533 |
Greencore Group PLC | 15,815 | | 66,385 |
TOTAL IRELAND | | 162,918 |
Israel - 2.5% |
Bezeq The Israel Telecommunication Corp. Ltd. | 31,500 | | 53,254 |
Rami Levi Chain Stores Hashikma Marketing 2006 Ltd. | 900 | | 40,069 |
Teva Pharmaceutical Industries Ltd. sponsored ADR | 2,984 | | 168,506 |
TOTAL ISRAEL | | 261,829 |
Japan - 9.8% |
Astellas Pharma, Inc. | 11,400 | | 176,934 |
Broadleaf Co. Ltd. | 2,900 | | 45,835 |
Daiichikosho Co. Ltd. | 2,100 | | 52,997 |
Fukuda Denshi Co. Ltd. | 500 | | 25,591 |
Hoya Corp. | 3,700 | | 130,931 |
Japan Tobacco, Inc. | 2,400 | | 81,886 |
KDDI Corp. | 1,500 | | 98,504 |
Leopalace21 Corp. (a) | 7,000 | | 43,844 |
Mitsubishi Electric Corp. | 4,000 | | 51,575 |
Monex Group, Inc. | 19,500 | | 49,770 |
NEC Corp. | 22,000 | | 77,800 |
Nippon Telegraph & Telephone Corp. | 1,200 | | 74,663 |
Tsuruha Holdings, Inc. | 1,300 | | 76,753 |
VT Holdings Co. Ltd. | 6,200 | | 24,485 |
Workman Co. Ltd. | 500 | | 26,133 |
TOTAL JAPAN | | 1,037,701 |
Korea (South) - 0.8% |
Coway Co. Ltd. | 310 | | 23,543 |
Samsung Electronics Co. Ltd. | 52 | | 60,206 |
TOTAL KOREA (SOUTH) | | 83,749 |
Luxembourg - 0.3% |
Altice SA | 500 | | 31,135 |
Netherlands - 1.1% |
LyondellBasell Industries NV Class A | 1,222 | | 111,972 |
Norway - 0.2% |
Gjensidige Forsikring ASA | 1,400 | | 25,426 |
Singapore - 1.2% |
United Overseas Bank Ltd. | 7,179 | | 128,617 |
Common Stocks - continued |
| Shares | | Value |
South Africa - 1.8% |
Lewis Group Ltd. | 19,200 | | $ 115,673 |
Reunert Ltd. | 14,300 | | 75,469 |
TOTAL SOUTH AFRICA | | 191,142 |
Spain - 0.5% |
Atresmedia Corporacion de Medios de Comunicacion SA | 3,600 | | 52,738 |
Sweden - 4.1% |
Intrum Justitia AB | 3,240 | | 96,268 |
Meda AB (A Shares) | 3,890 | | 51,100 |
Nordea Bank AB | 13,280 | | 170,313 |
Svenska Handelsbanken AB (A Shares) | 2,360 | | 112,532 |
TOTAL SWEDEN | | 430,213 |
Switzerland - 4.3% |
Banque Cantonale Vaudoise (Bearer) | 120 | | 64,231 |
Roche Holding AG (participation certificate) | 706 | | 208,342 |
TE Connectivity Ltd. | 1,426 | | 87,171 |
UBS AG | 5,168 | | 89,862 |
TOTAL SWITZERLAND | | 449,606 |
Taiwan - 0.3% |
Vanguard International Semiconductor Corp. | 24,000 | | 36,001 |
United Kingdom - 6.0% |
Ashmore Group PLC | 5,400 | | 27,522 |
British American Tobacco PLC (United Kingdom) | 2,078 | | 117,776 |
Exova Group Ltd. PLC (a) | 1,800 | | 4,888 |
GlaxoSmithKline PLC | 6,925 | | 156,602 |
Hilton Food Group PLC | 11,081 | | 66,474 |
ITV PLC | 24,707 | | 80,233 |
Reckitt Benckiser Group PLC | 507 | | 42,580 |
Taylor Wimpey PLC | 358 | | 678 |
Tesco PLC | 11,000 | | 30,536 |
WH Smith PLC | 5,877 | | 105,766 |
TOTAL UNITED KINGDOM | | 633,055 |
United States of America - 48.2% |
AbbVie, Inc. | 1,371 | | 87,004 |
American Tower Corp. | 1,010 | | 98,475 |
Amgen, Inc. | 1,348 | | 218,619 |
Apple, Inc. | 2,434 | | 262,868 |
ARAMARK Holdings Corp. | 1,897 | | 52,945 |
Bank of America Corp. | 10,547 | | 180,987 |
Common Stocks - continued |
| Shares | | Value |
United States of America - continued |
Capital One Financial Corp. | 1,737 | | $ 143,771 |
Chevron Corp. | 1,520 | | 182,324 |
CMS Energy Corp. | 1,609 | | 52,566 |
Comcast Corp. Class A | 1,548 | | 85,682 |
Community Trust Bancorp, Inc. | 1,624 | | 58,383 |
CVB Financial Corp. | 4,544 | | 71,704 |
Danaher Corp. | 1,100 | | 88,440 |
Darden Restaurants, Inc. | 1,401 | | 72,544 |
Dr. Pepper Snapple Group, Inc. | 2,758 | | 190,992 |
Dun & Bradstreet Corp. | 703 | | 86,335 |
E.I. du Pont de Nemours & Co. | 600 | | 41,490 |
Exxon Mobil Corp. | 1,778 | | 171,950 |
FedEx Corp. | 750 | | 125,550 |
Freeport-McMoRan, Inc. | 1,915 | | 54,578 |
General Electric Co. | 5,479 | | 141,413 |
H&R Block, Inc. | 2,185 | | 70,597 |
IBM Corp. | 829 | | 136,288 |
Johnson & Johnson | 2,302 | | 248,110 |
Johnson Controls, Inc. | 1,664 | | 78,624 |
JPMorgan Chase & Co. | 4,059 | | 245,488 |
Lakeland Financial Corp. | 1,613 | | 66,843 |
Lorillard, Inc. | 914 | | 56,211 |
McDonald's Corp. | 550 | | 51,552 |
McGraw Hill Financial, Inc. | 884 | | 79,984 |
Microsoft Corp. | 2,844 | | 133,526 |
MPLX LP | 1,179 | | 78,616 |
Oracle Corp. | 4,303 | | 168,032 |
PepsiCo, Inc. | 1,018 | | 97,901 |
Procter & Gamble Co. | 1,365 | | 119,124 |
SunTrust Banks, Inc. | 2,000 | | 78,280 |
Target Corp. | 998 | | 61,696 |
The Coca-Cola Co. | 2,872 | | 120,279 |
Time Warner Cable, Inc. | 627 | | 92,301 |
U.S. Bancorp | 2,420 | | 103,092 |
United Technologies Corp. | 900 | | 96,300 |
Verizon Communications, Inc. | 2,270 | | 114,068 |
VF Corp. | 1,145 | | 77,494 |
Common Stocks - continued |
| Shares | | Value |
United States of America - continued |
W.R. Grace & Co. (a) | 563 | | $ 53,260 |
Wells Fargo & Co. | 3,495 | | 185,550 |
TOTAL UNITED STATES OF AMERICA | | 5,081,836 |
TOTAL COMMON STOCKS (Cost $9,263,688) |
10,108,068
|
Nonconvertible Bonds - 0.0% |
| Principal Amount | | |
Canada - 0.0% |
Constellation Software, Inc. 7.4% 3/31/40
(Cost $429) | CAD | 500 | |
421
|
Money Market Funds - 4.9% |
| Shares | | |
Fidelity Cash Central Fund, 0.11% (b)
(Cost $515,264) | 515,264 | |
515,264
|
TOTAL INVESTMENT PORTFOLIO - 100.7% (Cost $9,779,381) | 10,623,753 |
NET OTHER ASSETS (LIABILITIES) - (0.7)% | (77,572) |
NET ASSETS - 100% | $ 10,546,181 |
Currency Abbreviations |
CAD | - | Canadian dollar |
Legend |
(a) Non-income producing |
(b) Affiliated fund that is generally available only to investment companies and other accounts managed by Fidelity Investments. The rate quoted is the annualized seven-day yield of the fund at period end. A complete unaudited listing of the fund's holdings as of its most recent quarter end is available upon request. In addition, each Fidelity Central Fund's financial statements, which are not covered by the Fund's Report of Independent Registered Public Accounting Firm, are available on the SEC's website or upon request. |
Affiliated Central Funds |
Information regarding fiscal year to date income earned by the Fund from investments in Fidelity Central Funds is as follows: |
Fund | Income earned |
Fidelity Cash Central Fund | $ 428 |
Other Information |
Categorizations in the Schedule of Investments are based on country or territory of incorporation. |
The following is a summary of the inputs used, as of October 31, 2014, involving the Fund's assets and liabilities carried at fair value. The inputs or methodology used for valuing securities may not be an indication of the risk associated with investing in those securities. For more information on valuation inputs, and their aggregation into the levels used in the tables below, please refer to the Investment Valuation section in the accompanying Notes to Financial Statements. |
Valuation Inputs at Reporting Date: |
Description | Total | Level 1 | Level 2 | Level 3 |
Investments in Securities: | | | | |
Equities: | | | | |
Consumer Discretionary | $ 1,465,375 | $ 1,278,799 | $ 186,576 | $ - |
Consumer Staples | 1,106,966 | 800,015 | 306,951 | - |
Energy | 802,035 | 606,306 | 195,729 | - |
Financials | 2,157,478 | 1,845,385 | 312,093 | - |
Health Care | 1,407,905 | 773,339 | 634,566 | - |
Industrials | 1,082,644 | 926,876 | 155,768 | - |
Information Technology | 1,263,362 | 972,795 | 290,567 | - |
Materials | 375,305 | 375,305 | - | - |
Telecommunication Services | 394,432 | 167,322 | 227,110 | - |
Utilities | 52,566 | 52,566 | - | - |
Corporate Bonds | 421 | - | - | 421 |
Money Market Funds | 515,264 | 515,264 | - | - |
Total Investments in Securities: | $ 10,623,753 | $ 8,313,972 | $ 2,309,360 | $ 421 |
The following is a summary of transfers between Level 1 and Level 2 for the period ended October 31, 2014. Transfers are assumed to have occurred at the beginning of the period, and are primarily attributable to the valuation techniques used for foreign equity securities, as discussed in the accompanying Notes to Financial Statements: |
Transfers | Total |
Level 1 to Level 2 | $ 179,077 |
Level 2 to Level 1 | $ 0 |
See accompanying notes which are an integral part of the financial statements.
Annual Report
Statement of Assets and Liabilities
| October 31, 2014 |
| | |
Assets | | |
Investment in securities, at value - See accompanying schedule: Unaffiliated issuers (cost $9,264,117) | $ 10,108,489 | |
Fidelity Central Funds (cost $515,264) | 515,264 | |
Total Investments (cost $9,779,381) | | $ 10,623,753 |
Cash | | 22,803 |
Foreign currency held at value (cost $502) | | 502 |
Receivable for investments sold | | 470,762 |
Receivable for fund shares sold | | 3,868 |
Dividends receivable | | 21,376 |
Distributions receivable from Fidelity Central Funds | | 44 |
Prepaid expenses | | 39 |
Receivable from investment adviser for expense reductions | | 3,280 |
Other receivables | | 147 |
Total assets | | 11,146,574 |
| | |
Liabilities | | |
Payable for investments purchased | $ 7,158 | |
Payable for fund shares redeemed | 533,314 | |
Accrued management fee | 6,157 | |
Distribution and service plan fees payable | 4,311 | |
Other affiliated payables | 2,556 | |
Other payables and accrued expenses | 46,897 | |
Total liabilities | | 600,393 |
| | |
Net Assets | | $ 10,546,181 |
Net Assets consist of: | | |
Paid in capital | | $ 9,170,304 |
Undistributed net investment income | | 4,288 |
Accumulated undistributed net realized gain (loss) on investments and foreign currency transactions | | 527,008 |
Net unrealized appreciation (depreciation) on investments and assets and liabilities in foreign currencies | | 844,581 |
Net Assets | | $ 10,546,181 |
See accompanying notes which are an integral part of the financial statements.
Annual Report
Financial Statements - continued
Statement of Assets and Liabilities - continued
| October 31, 2014 |
| | |
Calculation of Maximum Offering Price
Class A:
Net Asset Value and redemption price per share
($4,024,998 ÷ 310,680 shares) | | $ 12.96 |
| | |
Maximum offering price per share (100/94.25 of $12.96) | | $ 13.75 |
Class T:
Net Asset Value and redemption price per share ($2,013,746 ÷ 155,504 shares) | | $ 12.95 |
| | |
Maximum offering price per share (100/96.50 of $12.95) | | $ 13.42 |
Class C:
Net Asset Value and offering price per share ($3,173,363 ÷ 245,471 shares)A | | $ 12.93 |
| | |
Institutional Class:
Net Asset Value, offering price and redemption price per share ($1,334,074 ÷ 102,856 shares) | | $ 12.97 |
A Redemption price per share is equal to net asset value less any applicable contingent deferred sales charge.
See accompanying notes which are an integral part of the financial statements.
Annual Report
Statement of Operations
| Year ended October 31, 2014 |
| | |
Investment Income | | |
Dividends | | $ 268,504 |
Special dividends | | 64,920 |
Income from Fidelity Central Funds | | 428 |
Income before foreign taxes withheld | | 333,852 |
Less foreign taxes withheld | | (17,634) |
Total income | | 316,218 |
| | |
Expenses | | |
Management fee | $ 64,919 | |
Transfer agent fees | 21,693 | |
Distribution and service plan fees | 44,612 | |
Accounting fees and expenses | 4,802 | |
Custodian fees and expenses | 19,846 | |
Independent trustees' compensation | 36 | |
Registration fees | 49,634 | |
Audit | 62,616 | |
Legal | 25 | |
Miscellaneous | 241 | |
Total expenses before reductions | 268,424 | |
Expense reductions | (112,043) | 156,381 |
Net investment income (loss) | | 159,837 |
Realized and Unrealized Gain (Loss) Net realized gain (loss) on: | | |
Investment securities: | | |
Unaffiliated issuers | 568,015 | |
Foreign currency transactions | (2,270) | |
Total net realized gain (loss) | | 565,745 |
Change in net unrealized appreciation (depreciation) on: Investment securities | 67,045 | |
Assets and liabilities in foreign currencies | 53 | |
Total change in net unrealized appreciation (depreciation) | | 67,098 |
Net gain (loss) | | 632,843 |
Net increase (decrease) in net assets resulting from operations | | $ 792,680 |
See accompanying notes which are an integral part of the financial statements.
Annual Report
Financial Statements - continued
Statement of Changes in Net Assets
| Year ended
October 31,
2014 | Year ended
October 31,
2013 |
Increase (Decrease) in Net Assets | | |
Operations | | |
Net investment income (loss) | $ 159,837 | $ 65,903 |
Net realized gain (loss) | 565,745 | 110,778 |
Change in net unrealized appreciation (depreciation) | 67,098 | 700,327 |
Net increase (decrease) in net assets resulting
from operations | 792,680 | 877,008 |
Distributions to shareholders from net investment income | (143,546) | (63,596) |
Distributions to shareholders from net realized gain | (97,735) | (3,859) |
Total distributions | (241,281) | (67,455) |
Share transactions - net increase (decrease) | 3,932,940 | 2,177,438 |
Total increase (decrease) in net assets | 4,484,339 | 2,986,991 |
| | |
Net Assets | | |
Beginning of period | 6,061,842 | 3,074,851 |
End of period (including undistributed net investment income of $4,288 and $0, respectively) | $ 10,546,181 | $ 6,061,842 |
See accompanying notes which are an integral part of the financial statements.
Annual Report
Financial Highlights - Class A
Years ended October 31, | 2014 | 2013 | 2012I |
Selected Per-Share Data | | | |
Net asset value, beginning of period | $ 12.20 | $ 10.15 | $ 10.00 |
Income from Investment Operations | | | |
Net investment income (loss) E | .25H | .19 | .09 |
Net realized and unrealized gain (loss) | .91 | 2.05 | .16 |
Total from investment operations | 1.16 | 2.24 | .25 |
Distributions from net investment income | (.22) | (.18) | (.10) |
Distributions from net realized gain | (.18) | (.01) | - |
Total distributions | (.40) | (.19) | (.10) |
Net asset value, end of period | $ 12.96 | $ 12.20 | $ 10.15 |
Total ReturnB, C, D | 9.70% | 22.28% | 2.51% |
Ratios to Average Net Assets F, J | | | |
Expenses before reductions | 2.63% | 4.37% | 7.41%A |
Expenses net of fee waivers, if any | 1.45% | 1.45% | 1.45%A |
Expenses net of all reductions | 1.45% | 1.43% | 1.44%A |
Net investment income (loss) | 1.95%H | 1.66% | 1.89%A |
Supplemental Data | | | |
Net assets, end of period (000 omitted) | $ 4,025 | $ 2,115 | $ 756 |
Portfolio turnover rateG | 112% | 78% | 36% K |
A Annualized
B Total returns for periods of less than one year are not annualized.
C Total returns would have been lower if certain expenses had not been reduced during the applicable periods shown.
D Total returns do not include the effect of the sales charges.
E Calculated based on average shares outstanding during the period.
F Fees and expenses of any underlying Fidelity Central Funds are not included in the Fund's expense ratio. The Fund indirectly bears its proportionate share of the expenses of any underlying Fidelity Central Funds.
G Amount does not include the portfolio activity of any underlying Fidelity Central Funds.
H Investment income per share reflects a large, non-recurring dividend which amounted to $.09 per share. Excluding this non-recurring dividend, the ratio of net investment income (loss) to average net assets would have been 1.25%.
I For the period May 2, 2012 (commencement of operations) to October 31, 2012.
J Expense ratios reflect operating expenses of the class. Expenses before reductions do not reflect amounts reimbursed by the investment adviser or reductions from brokerage service arrangements or reductions from other expense offset arrangements and do not represent the amount paid by the class during periods when reimbursements or reductions occur. Expense ratios before reductions for start-up periods may not be representative of longer-term operating periods. Expenses net of fee waivers reflect expenses after reimbursement by the investment adviser but prior to reductions from brokerage service arrangements or other expense offset arrangements. Expenses net of all reductions represent the net expenses paid by the class.
K Amount not annualized.
See accompanying notes which are an integral part of the financial statements.
Annual Report
Financial Highlights - Class T
Years ended October 31, | 2014 | 2013 | 2012I |
Selected Per-Share Data | | | |
Net asset value, beginning of period | $ 12.20 | $ 10.14 | $ 10.00 |
Income from Investment Operations | | | |
Net investment income (loss) E | .21H | .16 | .08 |
Net realized and unrealized gain (loss) | .91 | 2.06 | .15 |
Total from investment operations | 1.12 | 2.22 | .23 |
Distributions from net investment income | (.19) | (.15) | (.09) |
Distributions from net realized gain | (.18) | (.01) | - |
Total distributions | (.37) | (.16) | (.09) |
Net asset value, end of period | $ 12.95 | $ 12.20 | $ 10.14 |
Total ReturnB, C, D | 9.34% | 22.11% | 2.31% |
Ratios to Average Net Assets F, J | | | |
Expenses before reductions | 2.96% | 4.80% | 7.68%A |
Expenses net of fee waivers, if any | 1.70% | 1.70% | 1.70%A |
Expenses net of all reductions | 1.70% | 1.68% | 1.69%A |
Net investment income (loss) | 1.70%H | 1.41% | 1.64%A |
Supplemental Data | | | |
Net assets, end of period (000 omitted) | $ 2,014 | $ 1,270 | $ 714 |
Portfolio turnover rateG | 112% | 78% | 36% K |
A Annualized
B Total returns for periods of less than one year are not annualized.
C Total returns would have been lower if certain expenses had not been reduced during the applicable periods shown.
D Total returns do not include the effect of the sales charges.
E Calculated based on average shares outstanding during the period.
F Fees and expenses of any underlying Fidelity Central Funds are not included in the Fund's expense ratio. The Fund indirectly bears its proportionate share of the expenses of any underlying Fidelity Central Funds.
G Amount does not include the portfolio activity of any underlying Fidelity Central Funds.
H Investment income per share reflects a large, non-recurring dividend which amounted to $.09 per share. Excluding this non-recurring dividend, the ratio of net investment income (loss) to average net assets would have been 1.00%.
I For the period May 2, 2012 (commencement of operations) to October 31, 2012.
J Expense ratios reflect operating expenses of the class. Expenses before reductions do not reflect amounts reimbursed by the investment adviser or reductions from brokerage service arrangements or reductions from other expense offset arrangements and do not represent the amount paid by the class during periods when reimbursements or reductions occur. Expense ratios before reductions for start-up periods may not be representative of longer-term operating periods. Expenses net of fee waivers reflect expenses after reimbursement by the investment adviser but prior to reductions from brokerage service arrangements or other expense offset arrangements. Expenses net of all reductions represent the net expenses paid by the class.
K Amount not annualized.
See accompanying notes which are an integral part of the financial statements.
Annual Report
Financial Highlights - Class C
Years ended October 31, | 2014 | 2013 | 2012I |
Selected Per-Share Data | | | |
Net asset value, beginning of period | $ 12.18 | $ 10.14 | $ 10.00 |
Income from Investment Operations | | | |
Net investment income (loss) E | .15H | .10 | .06 |
Net realized and unrealized gain (loss) | .91 | 2.06 | .15 |
Total from investment operations | 1.06 | 2.16 | .21 |
Distributions from net investment income | (.14) | (.11) | (.07) |
Distributions from net realized gain | (.17) | (.01) | - |
Total distributions | (.31) | (.12) | (.07) |
Net asset value, end of period | $ 12.93 | $ 12.18 | $ 10.14 |
Total ReturnB, C, D | 8.83% | 21.40% | 2.12% |
Ratios to Average Net Assets F, J | | | |
Expenses before reductions | 3.43% | 5.26% | 8.19%A |
Expenses net of fee waivers, if any | 2.20% | 2.20% | 2.20%A |
Expenses net of all reductions | 2.20% | 2.18% | 2.19%A |
Net investment income (loss) | 1.20%H | .91% | 1.14%A |
Supplemental Data | | | |
Net assets, end of period (000 omitted) | $ 3,173 | $ 1,445 | $ 666 |
Portfolio turnover rateG | 112% | 78% | 36% K |
A Annualized
B Total returns for periods of less than one year are not annualized.
C Total returns would have been lower if certain expenses had not been reduced during the applicable periods shown.
D Total returns do not include the effect of the contingent deferred sales charge.
E Calculated based on average shares outstanding during the period.
F Fees and expenses of any underlying Fidelity Central Funds are not included in the Fund's expense ratio. The Fund indirectly bears its proportionate share of the expenses of any underlying Fidelity Central Funds.
G Amount does not include the portfolio activity of any underlying Fidelity Central Funds.
H Investment income per share reflects a large, non-recurring dividend which amounted to $.09 per share. Excluding this non-recurring dividend, the ratio of net investment income (loss) to average net assets would have been .50%.
I For the period May 2, 2012 (commencement of operations) to October 31, 2012.
J Expense ratios reflect operating expenses of the class. Expenses before reductions do not reflect amounts reimbursed by the investment adviser or reductions from brokerage service arrangements or reductions from other expense offset arrangements and do not represent the amount paid by the class during periods when reimbursements or reductions occur. Expense ratios before reductions for start-up periods may not be representative of longer-term operating periods. Expenses net of fee waivers reflect expenses after reimbursement by the investment adviser but prior to reductions from brokerage service arrangements or other expense offset arrangements. Expenses net of all reductions represent the net expenses paid by the class.
K Amount not annualized.
See accompanying notes which are an integral part of the financial statements.
Annual Report
Financial Highlights - Institutional Class
Years ended October 31, | 2014 | 2013 | 2012H |
Selected Per-Share Data | | | |
Net asset value, beginning of period | $ 12.22 | $ 10.15 | $ 10.00 |
Income from Investment Operations | | | |
Net investment income (loss) D | .28G | .21 | .10 |
Net realized and unrealized gain (loss) | .90 | 2.07 | .16 |
Total from investment operations | 1.18 | 2.28 | .26 |
Distributions from net investment income | (.25) | (.20) | (.11) |
Distributions from net realized gain | (.18) | (.01) | - |
Total distributions | (.43) | (.21) | (.11) |
Net asset value, end of period | $ 12.97 | $ 12.22 | $ 10.15 |
Total ReturnB, C | 9.86% | 22.71% | 2.61% |
Ratios to Average Net Assets E, I | | | |
Expenses before reductions | 2.35% | 4.46% | 7.23%A |
Expenses net of fee waivers, if any | 1.20% | 1.20% | 1.20%A |
Expenses net of all reductions | 1.20% | 1.18% | 1.19%A |
Net investment income (loss) | 2.20%G | 1.91% | 2.14%A |
Supplemental Data | | | |
Net assets, end of period (000 omitted) | $ 1,334 | $ 1,231 | $ 939 |
Portfolio turnover rateF | 112% | 78% | 36% J |
A Annualized
B Total returns for periods of less than one year are not annualized.
C Total returns would have been lower if certain expenses had not been reduced during the applicable periods shown.
D Calculated based on average shares outstanding during the period.
E Fees and expenses of any underlying Fidelity Central Funds are not included in the Fund's expense ratio. The Fund indirectly bears its proportionate share of the expenses of any underlying Fidelity Central Funds.
F Amount does not include the portfolio activity of any underlying Fidelity Central Funds.
G Investment income per share reflects a large, non-recurring dividend which amounted to $.09 per share. Excluding this non-recurring dividend, the ratio of net investment income (loss) to average net assets would have been 1.50%.
H For the period May 2, 2012 (commencement of operations) to October 31, 2012.
I Expense ratios reflect operating expenses of the class. Expenses before reductions do not reflect amounts reimbursed by the investment adviser or reductions from brokerage service arrangements or reductions from other expense offset arrangements and do not represent the amount paid by the class during periods when reimbursements or reductions occur. Expense ratios before reductions for start-up periods may not be representative of longer-term operating periods. Expenses net of fee waivers reflect expenses after reimbursement by the investment adviser but prior to reductions from brokerage service arrangements or other expense offset arrangements. Expenses net of all reductions represent the net expenses paid by the class.
J Amount not annualized.
See accompanying notes which are an integral part of the financial statements.
Annual Report
Notes to Financial Statements
For the period ended October 31, 2014
1. Organization.
Fidelity Advisor Global Equity Income Fund (the Fund) is a fund of Fidelity Advisor Series VIII (the Trust) and is authorized to issue an unlimited number of shares. The Trust is registered under the Investment Company Act of 1940, as amended (the 1940 Act), as an open-end management investment company organized as a Massachusetts business trust. The Fund offers Class A, Class T, Class C and Institutional Class shares, each of which has equal rights as to assets and voting privileges. Each class has exclusive voting rights with respect to matters that affect that class.
2. Investments in Fidelity Central Funds.
The Fund invests in Fidelity Central Funds, which are open-end investment companies generally available only to other investment companies and accounts managed by the investment adviser and its affiliates. The Fund's Schedule of Investments lists each of the Fidelity Central Funds held as of period end, if any, as an investment of the Fund, but does not include the underlying holdings of each Fidelity Central Fund. As an Investing Fund, the Fund indirectly bears its proportionate share of the expenses of the underlying Fidelity Central Funds.
The Money Market Central Funds seek preservation of capital and current income and are managed by Fidelity Investments Money Management, Inc. (FIMM), an affiliate of the investment adviser. Annualized expenses of the Money Market Central Funds as of their most recent shareholder report date are less than .01%.
A complete unaudited list of holdings for each Fidelity Central Fund is available upon request or at the Securities and Exchange Commission (the SEC) website at www.sec.gov. In addition, the financial statements of the Fidelity Central Funds, which are not covered by the Fund's Report of Independent Registered Public Accounting Firm, are available on the SEC website or upon request.
3. Significant Accounting Policies.
The financial statements have been prepared in conformity with accounting principles generally accepted in the United States of America (GAAP), which require management to make certain estimates and assumptions at the date of the financial statements. Actual results could differ from those estimates. Subsequent events, if any, through the date that the financial statements were issued have been evaluated in the preparation of the financial statements. The following summarizes the significant accounting policies of the Fund:
Investment Valuation. Investments are valued as of 4:00 p.m. Eastern time on the last calendar day of the period. In accordance with valuation policies and procedures approved by the Board of Trustees (the Board), the Fund attempts to obtain prices from
Annual Report
Notes to Financial Statements - continued
3. Significant Accounting Policies - continued
Investment Valuation - continued
one or more third party pricing vendors or brokers to value its investments. When current market prices, quotations or currency exchange rates are not readily available or reliable, investments will be fair valued in good faith by the Fidelity Management & Research Company (FMR) Fair Value Committee (the Committee), in accordance with procedures adopted by the Board. Factors used in determining fair value vary by investment type and may include market or investment specific events, changes in interest rates and credit quality. The frequency with which these procedures are used cannot be predicted and they may be utilized to a significant extent. The Committee oversees the Fund's valuation policies and procedures and is responsible for approving and reporting to the Board all fair value determinations.
The Fund categorizes the inputs to valuation techniques used to value its investments into a disclosure hierarchy consisting of three levels as shown below:
Level 1 - quoted prices in active markets for identical investments
Level 2 - other significant observable inputs (including quoted prices for similar investments, interest rates, prepayment speeds, etc.)
Level 3 - unobservable inputs (including the Fund's own assumptions based on the best information available)
Valuation techniques used to value the Fund's investments by major category are as follows:
Equity securities, including restricted securities, for which market quotations are readily available, are valued at the last reported sale price or official closing price as reported by a third party pricing vendor on the primary market or exchange on which they are traded and are categorized as Level 1 in the hierarchy. In the event there were no sales during the day or closing prices are not available, securities are valued at the last quoted bid price or may be valued using the last available price and are generally categorized as Level 2 in the hierarchy. For foreign equity securities, when market or security specific events arise, comparisons to the valuation of American Depositary Receipts (ADRs), futures contracts, Exchange-Traded Funds (ETFs) and certain indexes as well as quoted prices for similar securities may be used and would be categorized as Level 2 in the hierarchy. Utilizing these techniques may result in transfers between Level 1 and Level 2. For equity securities, including restricted securities, where observable inputs are limited, assumptions about market activity and risk are used and these securities may be categorized as Level 3 in the hierarchy.
Annual Report
3. Significant Accounting Policies - continued
Investment Valuation - continued
Debt securities, including restricted securities, are valued based on evaluated prices received from third party pricing vendors or from brokers who make markets in such securities. Corporate bonds are valued by pricing vendors who utilize matrix pricing which considers yield or price of bonds of comparable quality, coupon, maturity and type or by broker-supplied prices. When independent prices are unavailable or unreliable, debt securities may be valued utilizing pricing methodologies which consider similar factors that would be used by third party pricing vendors. Debt securities are generally categorized as Level 2 in the hierarchy but may be Level 3 depending on the circumstances.
Investments in open-end mutual funds, including the Fidelity Central Funds, are valued at their closing net asset value (NAV) each business day and are categorized as Level 1 in the hierarchy.
Changes in valuation techniques may result in transfers in or out of an assigned level within the disclosure hierarchy. The aggregate value of investments by input level, as of October 31, 2014, including information on transfers between Levels 1 and 2, is included at the end of the Fund's Schedule of Investments.
Foreign Currency. The Fund may use foreign currency contracts to facilitate transactions in foreign-denominated securities. Gains and losses from these transactions may arise from changes in the value of the foreign currency or if the counterparties do not perform under the contracts' terms.
Foreign-denominated assets, including investment securities, and liabilities are translated into U.S. dollars at the exchange rates at period end. Purchases and sales of investment securities, income and dividends received and expenses denominated in foreign currencies are translated into U.S. dollars at the exchange rate in effect on the transaction date.
The effects of exchange rate fluctuations on investments are included with the net realized and unrealized gain (loss) on investment securities. Other foreign currency transactions resulting in realized and unrealized gain (loss) are disclosed separately.
Investment Transactions and Income. For financial reporting purposes, the Fund's investment holdings and NAV include trades executed through the end of the last business day of the period. The NAV per share for processing shareholder transactions is calculated as of the close of business of the New York Stock Exchange (NYSE), normally 4:00 p.m. Eastern time and includes trades executed through the end of the prior business day. Gains and losses on securities sold are determined on the basis of identified cost. Dividend income is recorded on the ex-dividend date, except for certain dividends
Annual Report
Notes to Financial Statements - continued
3. Significant Accounting Policies - continued
Investment Transactions and Income - continued
from foreign securities where the ex-dividend date may have passed, which are recorded as soon as the Fund is informed of the ex-dividend date. Non-cash dividends included in dividend income, if any, are recorded at the fair market value of the securities received. Income and capital gain distributions from Fidelity Central Funds, if any, are recorded on the ex-dividend date. Distributions received on securities that represent a return of capital or capital gain are recorded as a reduction of cost of investments and/or as a realized gain. Subsequent to ex-dividend date the Fund determines the components of these distributions, based upon receipt of tax filings or other correspondence relating to the underlying investment. Large, non-recurring dividends recognized by the Fund are presented separately on the Statement of Operations as "Special Dividends" and the impact of these dividends is presented in the Financial Highlights. Investment income is recorded net of foreign taxes withheld where recovery of such taxes is uncertain.
Class Allocations and Expenses. Investment income, realized and unrealized capital gains and losses, common expenses of the Fund, and certain fund-level expense reductions, if any, are allocated daily on a pro-rata basis to each class based on the relative net assets of each class to the total net assets of the Fund. Each class differs with respect to transfer agent and distribution and service plan fees incurred. Certain expense reductions may also differ by class. For the reporting period, the allocated portion of income and expenses to each class as a percent of its average net assets may vary due to the timing of recording these transactions in relation to fluctuating net assets of the classes. Expenses directly attributable to a fund are charged to that fund. Expenses attributable to more than one fund are allocated among the respective funds on the basis of relative net assets or other appropriate methods. Expense estimates are accrued in the period to which they relate and adjustments are made when actual amounts are known.
Income Tax Information and Distributions to Shareholders. Each year, the Fund intends to qualify as a regulated investment company under Subchapter M of the Internal Revenue Code, including distributing substantially all of its taxable income and realized gains. As a result, no provision for U.S. Federal income taxes is required. As of October 31, 2014, the Fund did not have any unrecognized tax benefits in the financial statements; nor is the Fund aware of any tax positions for which it is reasonably possible that the total amounts of unrecognized tax benefits will significantly change in the next twelve months. The Fund files a U.S. federal tax return, in addition to state and local tax returns as required. The Fund's federal income tax returns are subject to examination by the Internal Revenue Service (IRS) for a period of three fiscal years after they are filed. State and local tax returns may be subject to examination for an additional fiscal year depending on the jurisdiction. Foreign taxes are provided for based on the Fund's understanding of the tax rules and rates that exist in the foreign markets in which it invests.
Annual Report
3. Significant Accounting Policies - continued
Income Tax Information and Distributions to Shareholders - continued
Distributions are declared and recorded on the ex-dividend date. Income dividends and capital gain distributions are declared separately for each class. Income and capital gain distributions are determined in accordance with income tax regulations, which may differ from GAAP. In addition, the Fund claimed a portion of the payment made to redeeming shareholders as a distribution for income tax purposes.
Capital accounts within the financial statements are adjusted for permanent book-tax differences. These adjustments have no impact on net assets or the results of operations. Capital accounts are not adjusted for temporary book-tax differences which will reverse in a subsequent period.
Book-tax differences are primarily due to foreign currency transactions, passive foreign investment companies (PFIC), partnerships, and losses deferred due to wash sales.
The federal tax cost of investment securities and unrealized appreciation (depreciation) as of period end were as follows:
Gross unrealized appreciation | $ 1,102,511 |
Gross unrealized depreciation | (300,994) |
Net unrealized appreciation (depreciation) on securities | $ 801,517 |
| |
Tax Cost | $ 9,822,236 |
The tax-based components of distributable earnings as of period end were as follows:
Undistributed ordinary income | $ 164,846 |
Undistributed long-term capital gain | $ 409,769 |
Net unrealized appreciation (depreciation) on securities and other investments | $ 801,262 |
The tax character of distributions paid was as follows:
| October 31, 2014 | October 31, 2013 |
Ordinary Income | $ 169,657 | $ 67,455 |
Long-term Capital Gains | 71,624 | - |
Total | $ 241,281 | $ 67,455 |
New Accounting Pronouncement. In June 2014, the Financial Accounting Standards Board issued Accounting Standard Update No. 2014-11, Repurchase-to-Maturity Transactions, Repurchase Financings, and Disclosures. The update amends the accounting for certain repurchase agreements and expands disclosure requirements for reverse
Annual Report
Notes to Financial Statements - continued
3. Significant Accounting Policies - continued
New Accounting Pronouncement - continued
repurchase agreements, securities lending and other similar transactions. The disclosure requirements are effective for annual and interim reporting periods beginning after December 15, 2014. Management is currently evaluating the impact of the Update on the Fund's financial statements and related disclosures.
4. Purchases and Sales of Investments.
Purchases and sales of securities, other than short-term securities, aggregated $13,519,087 and $9,863,508, respectively.
5. Fees and Other Transactions with Affiliates.
Management Fee. Fidelity Management & Research Company (the investment adviser) and its affiliates provide the Fund with investment management related services for which the Fund pays a monthly management fee. The management fee is the sum of an individual fund fee rate that is based on an annual rate of .45% of the Fund's average net assets and an annualized group fee rate that averaged .25% during the period. The group fee rate is based upon the average net assets of all the mutual funds advised by the investment adviser, including any mutual funds previously advised by the investment adviser that are currently advised by Fidelity SelectCo, LLC, an affiliate of the investment adviser. The group fee rate decreases as assets under management increase and increases as assets under management decrease. For the reporting period, the total annual management fee rate was .70% of the Fund's average net assets.
Distribution and Service Plan Fees. In accordance with Rule 12b-1 of the 1940 Act, the Fund has adopted separate Distribution and Service Plans for each class of shares. Certain classes pay Fidelity Distributors Corporation (FDC), an affiliate of the investment adviser, separate Distribution and Service Fees, each of which is based on an annual percentage of each class' average net assets. In addition, FDC may pay financial intermediaries for selling shares of the Fund and providing shareholder support services. For the period, the Distribution and Service Fee rates, total fees and amounts retained by FDC were as follows:
| Distribution
Fee | Service
Fee | Total Fees | Retained
by FDC |
Class A | -% | .25% | $ 8,565 | $ 3,932 |
Class T | .25% | .25% | 9,224 | 3,788 |
Class C | .75% | .25% | 26,823 | 26,823 |
| | | $ 44,612 | $ 34,543 |
Annual Report
5. Fees and Other Transactions with Affiliates - continued
Sales Load. FDC may receive a front-end sales charge of up to 5.75% for selling Class A shares and 3.50% for selling Class T shares, some of which is paid to financial intermediaries for selling shares of the Fund. Depending on the holding period, FDC may receive contingent deferred sales charges levied on Class A, Class T and Class C redemptions. The deferred sales charges range from 1.00% for Class C shares, 1.00% for certain purchases of Class A shares and .25% for certain purchases of Class T shares.
For the period, sales charge amounts retained by FDC were as follows:
| Retained
by FDC |
Class A | $ 4,442 |
Class T | 1,676 |
Class C* | 672 |
| $ 6,790 |
* When Class C shares are initially sold, FDC pays commissions from its own resources to financial intermediaries through which the sales are made.
Transfer Agent Fees. Fidelity Investments Institutional Operations Company, Inc., (FIIOC), an affiliate of the investment adviser, is the transfer, dividend disbursing and shareholder servicing agent for each class of the Fund. FIIOC receives account fees and asset-based fees that vary according to the account size and type of account of the shareholders of the respective classes of the Fund. FIIOC pays for typesetting, printing and mailing of shareholder reports, except proxy statements.
For the period, transfer agent fees for each class were as follows:
| Amount | % of
Class-Level Average
Net Assets |
Class A | $ 8,123 | .24 |
Class T | 4,738 | .26 |
Class C | 7,225 | .27 |
Institutional Class | 1,607 | .12 |
| $ 21,693 | |
Accounting Fees. Fidelity Service Company, Inc. (FSC), an affiliate of the investment adviser, maintains the Fund's accounting records. The fee is based on the level of average net assets for each month.
Brokerage Commissions. The Fund placed a portion of its portfolio transactions with brokerage firms which are affiliates of the investment adviser. Brokerage commissions are included in net realized gain (loss) and change in net unrealized appreciation (depreciation) in the Statement of Operations. The commissions paid to these affiliated firms were $108 for the period.
Annual Report
Notes to Financial Statements - continued
6. Committed Line of Credit.
The Fund participates with other funds managed by the investment adviser or an affiliate in a $4.25 billion credit facility (the "line of credit") to be utilized for temporary or emergency purposes to fund shareholder redemptions or for other short-term liquidity purposes. The Fund has agreed to pay commitment fees on its pro-rata portion of the line of credit, which amounted to $14 and is reflected in Miscellaneous expenses on the Statement of Operations. During the period, the Fund did not borrow on this line of credit.
7. Expense Reductions.
The investment adviser contractually agreed to reimburse each class to the extent annual operating expenses exceeded certain levels of average net assets as noted in the table below. This reimbursement will remain in place through December 31, 2015. Some expenses, for example interest expense, including commitment fees, are excluded from this reimbursement.
The following classes were in reimbursement during the period:
| Expense
Limitations | Reimbursement |
Class A | 1.45% | $ 40,521 |
Class T | 1.70% | 23,254 |
Class C | 2.20% | 33,024 |
Institutional Class | 1.20% | 15,174 |
| | $ 111,973 |
Commissions paid to certain brokers with whom the investment adviser, or its affiliates, places trades on behalf of the Fund include an amount in addition to trade execution, which may be rebated back to the Fund to offset certain expenses. This amount totaled $62 for the period. In addition, through arrangements with the Fund's custodian, credits realized as a result of uninvested cash balances were used to reduce the Fund's expenses. During the period, these credits reduced the Fund's custody expenses by $8.
8. Distributions to Shareholders.
Distributions to shareholders of each class were as follows:
Years ended October 31, | 2014 | 2013 |
From net investment income | | |
Class A | $ 59,134 | $ 21,341 |
Class T | 28,554 | 12,502 |
Class C | 29,949 | 10,500 |
Institutional Class | 25,909 | 19,253 |
Total | $ 143,546 | $ 63,596 |
Annual Report
8. Distributions to Shareholders - continued
Years ended October 31, | 2014 | 2013 |
From net realized gain | | |
Class A | $ 37,020 | $ 1,245 |
Class T | 20,549 | 822 |
Class C | 22,043 | 950 |
Institutional Class | 18,123 | 842 |
Total | $ 97,735 | $ 3,859 |
9. Share Transactions.
Share transactions for each class were as follows and may contain automatic conversions between classes or exchanges between funds:
| Shares | Dollars |
Years ended October 31, | 2014 | 2013 | 2014 | 2013 |
Class A | | | | |
Shares sold | 196,535 | 119,194 | $ 2,476,199 | $ 1,351,801 |
Reinvestment of distributions | 7,392 | 1,927 | 92,391 | 21,243 |
Shares redeemed | (66,552) | (22,370) | (854,492) | (259,766) |
Net increase (decrease) | 137,375 | 98,751 | $ 1,714,098 | $ 1,113,278 |
Class T | | | | |
Shares sold | 95,686 | 33,371 | $ 1,188,546 | $ 382,233 |
Reinvestment of distributions | 3,827 | 1,184 | 47,754 | 12,976 |
Shares redeemed | (48,139) | (804) | (610,330) | (9,101) |
Net increase (decrease) | 51,374 | 33,751 | $ 625,970 | $ 386,108 |
Class C | | | | |
Shares sold | 179,385 | 88,544 | $ 2,234,467 | $ 997,819 |
Reinvestment of distributions | 3,965 | 1,023 | 49,411 | 11,159 |
Shares redeemed | (56,526) | (36,610) | (715,924) | (423,633) |
Net increase (decrease) | 126,824 | 52,957 | $ 1,567,954 | $ 585,345 |
Institutional Class | | | | |
Shares sold | 9,677 | 6,507 | $ 123,415 | $ 73,274 |
Reinvestment of distributions | 3,513 | 1,821 | 43,809 | 19,977 |
Shares redeemed | (11,104) | (56) | (142,306) | (544) |
Net increase (decrease) | 2,086 | 8,272 | $ 24,918 | $ 92,707 |
10. Other.
The Fund's organizational documents provide former and current trustees and officers with a limited indemnification against liabilities arising in connection with the performance of their duties to the Fund. In the normal course of business, the Fund may also enter into contracts that provide general indemnifications. The Fund's maximum exposure under these arrangements is unknown as this would be dependent on future
Annual Report
Notes to Financial Statements - continued
10. Other - continued
claims that may be made against the Fund. The risk of material loss from such claims is considered remote.
At the end of the period, the investment adviser or its affiliates were the owners of record of 23% of the total outstanding shares of the Fund.
Annual Report
To the Trustees of Fidelity Advisor Series VIII and the Shareholders of Fidelity Advisor Global Equity Income Fund:
In our opinion, the accompanying statement of assets and liabilities, including the schedule of investments, and the related statements of operations and of changes in net assets and the financial highlights present fairly, in all material respects, the financial position of Fidelity Advisor Global Equity Income Fund (a fund of Fidelity Advisor Series VIII) at October 31, 2014, the results of its operations for the year then ended, the changes in its net assets for each of the two years in the period then ended and the financial highlights for each of the periods indicated, in conformity with accounting principles generally accepted in the United States of America. These financial statements and financial highlights (hereafter referred to as "financial statements") are the responsibility of the Fidelity Advisor Global Equity Income Fund's management. Our responsibility is to express an opinion on these financial statements based on our audits. We conducted our audits of these financial statements in accordance with the standards of the Public Company Accounting Oversight Board (United States). Those standards require that we plan and perform the audit to obtain reasonable assurance about whether the financial statements are free of material misstatement. An audit includes examining, on a test basis, evidence supporting the amounts and disclosures in the financial statements, assessing the accounting principles used and significant estimates made by management, and evaluating the overall financial statement presentation. We believe that our audits, which included confirmation of securities at October 31, 2014 by correspondence with the custodian and brokers, provide a reasonable basis for our opinion.
PricewaterhouseCoopers LLP
Boston, Massachusetts
December 19, 2014
Annual Report
The Trustees, Member of the Advisory Board, and officers of the trust and fund, as applicable, are listed below. The Board of Trustees governs the fund and is responsible for protecting the interests of shareholders. The Trustees are experienced executives who meet periodically throughout the year to oversee the fund's activities, review contractual arrangements with companies that provide services to the fund, oversee management of the risks associated with such activities and contractual arrangements, and review the fund's performance. Except for James C. Curvey, each of the Trustees oversees 174 funds. Mr. Curvey oversees 407 funds.
The Trustees hold office without limit in time except that (a) any Trustee may resign; (b) any Trustee may be removed by written instrument, signed by at least two-thirds of the number of Trustees prior to such removal; (c) any Trustee who requests to be retired or who has become incapacitated by illness or injury may be retired by written instrument signed by a majority of the other Trustees; and (d) any Trustee may be removed at any special meeting of shareholders by a two-thirds vote of the outstanding voting securities of the trust. Each Trustee who is not an interested person (as defined in the 1940 Act) of the trust and the fund (Independent Trustee), shall retire not later than the last day of the calendar year in which his or her 75th birthday occurs. The Independent Trustees may waive this mandatory retirement age policy with respect to individual Trustees. The officers and Advisory Board Member hold office without limit in time, except that any officer and Advisory Board Member may resign or may be removed by a vote of a majority of the Trustees at any regular meeting or any special meeting of the Trustees. Except as indicated, each individual has held the office shown or other offices in the same company for the past five years.
Experience, Skills, Attributes, and Qualifications of the Fund's Trustees. The Governance and Nominating Committee has adopted a statement of policy that describes the experience, qualifications, attributes, and skills that are necessary and desirable for potential Independent Trustee candidates (Statement of Policy). The Board believes that each Trustee satisfied at the time he or she was initially elected or appointed a Trustee, and continues to satisfy, the standards contemplated by the Statement of Policy. The Governance and Nominating Committee also engages professional search firms to help identify potential Independent Trustee candidates who have the experience, qualifications, attributes, and skills consistent with the Statement of Policy. From time to time, additional criteria based on the composition and skills of the current Independent Trustees, as well as experience or skills that may be appropriate in light of future changes to board composition, business conditions, and regulatory or other developments, have also been considered by the professional search firms and the Governance and Nominating Committee. In addition, the Board takes into account the Trustees' commitment and participation in Board and committee meetings, as well as their leadership of standing and ad hoc committees throughout their tenure.
In determining that a particular Trustee was and continues to be qualified to serve as a Trustee, the Board has considered a variety of criteria, none of which, in isolation, was controlling. The Board believes that, collectively, the Trustees have balanced and diverse experience, qualifications, attributes, and skills, which allow the Board to operate effectively in governing the fund and protecting the interests of shareholders. Information about the specific experience, skills, attributes, and qualifications of each Trustee, which in each case led to the Board's conclusion that the Trustee should serve (or continue to serve) as a trustee of the fund, is provided below.
Annual Report
Board Structure and Oversight Function. James C. Curvey is an interested person (as defined in the 1940 Act) and currently serves as Chairman. The Trustees have determined that an interested Chairman is appropriate and benefits shareholders because an interested Chairman has a personal and professional stake in the quality and continuity of services provided to the fund. Independent Trustees exercise their informed business judgment to appoint an individual of their choosing to serve as Chairman, regardless of whether the Trustee happens to be independent or a member of management. The Independent Trustees have determined that they can act independently and effectively without having an Independent Trustee serve as Chairman and that a key structural component for assuring that they are in a position to do so is for the Independent Trustees to constitute a substantial majority for the Board. The Independent Trustees also regularly meet in executive session. Ned C. Lautenbach serves as Chairman of the Independent Trustees and as such (i) acts as a liaison between the Independent Trustees and management with respect to matters important to the Independent Trustees and (ii) with management prepares agendas for Board meetings.
Fidelity funds are overseen by different Boards of Trustees. The fund's Board oversees Fidelity's equity and high income funds and another Board oversees Fidelity's investment-grade bond, money market, and asset allocation funds. The asset allocation funds may invest in Fidelity funds overseen by the fund's Board. The use of separate Boards, each with its own committee structure, allows the Trustees of each group of Fidelity funds to focus on the unique issues of the funds they oversee, including common research, investment, and operational issues. On occasion, the separate Boards establish joint committees to address issues of overlapping consequences for the Fidelity funds overseen by each Board.
The Trustees operate using a system of committees to facilitate the timely and efficient consideration of all matters of importance to the Trustees, the fund, and fund shareholders and to facilitate compliance with legal and regulatory requirements and oversight of the fund's activities and associated risks. The Board, acting through its committees, has charged FMR and its affiliates with (i) identifying events or circumstances the occurrence of which could have demonstrably adverse effects on the fund's business and/or reputation; (ii) implementing processes and controls to lessen the possibility that such events or circumstances occur or to mitigate the effects of such events or circumstances if they do occur; and (iii) creating and maintaining a system designed to evaluate continuously business and market conditions in order to facilitate the identification and implementation processes described in (i) and (ii) above. Because the day-to-day operations and activities of the fund are carried out by or through FMR, its affiliates and other service providers, the fund's exposure to risks is mitigated but not eliminated by the processes overseen by the Trustees. While each of the Board's committees has responsibility for overseeing different aspects of the fund's activities, oversight is exercised primarily through the Operations, Audit, and Compliance Committees. In addition, the Independent Trustees have worked with FMR to enhance the Board's oversight of investment and financial risks, legal and regulatory risks, technology risks, and operational risks, including the development of additional risk reporting to the Board. For example, a working group comprised of Independent Trustees and FMR has worked and continues to work to review the Fidelity funds' valuation-related activities, reporting and risk management. Appropriate personnel, including but not limited to the fund's Chief Compliance Officer (CCO), FMR's internal auditor, the independent accountants, the fund's Treasurer and portfolio management personnel, make periodic reports to the Board's committees, as appropriate, including an annual review of FMR's risk management program for the Fidelity funds. The responsibilities of each standing committee, including their oversight responsibilities, are described further under "Standing Committees of the Fund's Trustees."
Annual Report
Trustees and Officers - continued
The fund's Statement of Additional Information (SAI) includes more information about the Trustees. To request a free copy, call Fidelity at 1-877-208-0098.
Interested Trustees*:
Correspondence intended for each Trustee who is an interested person may be sent to Fidelity Investments, 245 Summer Street, Boston, Massachusetts 02210.
Name, Year of Birth; Principal Occupations and Other Relevant Experience+ |
James C. Curvey (1935) |
Year of Election or Appointment: 2007 Trustee Chairman of the Board of Trustees |
| Mr. Curvey also serves as Trustee of other Fidelity funds. Mr. Curvey is a Director of Fidelity Research & Analysis Co. (2009-present), and Vice Chairman (2007-present) and Director of FMR LLC. In addition, Mr. Curvey serves as an Overseer for the Boston Symphony Orchestra and a member of the board of Artis-Naples, Naples, Florida, and as a Trustee for Brewster Academy, Wolfeboro, New Hampshire. Previously, Mr. Curvey served as a Director of Fidelity Investments Money Management, Inc. (2009-2014), a Director of FMR (2007-2014), and a Director of FMR Co., Inc. (2007-2014). |
Charles S. Morrison (1960) |
Year of Election or Appointment: 2014 Trustee |
| Mr. Morrison also serves as Trustee of other funds. He serves as a Director of Fidelity Investments Money Management, Inc. (FIMM) (2014-present), Director of Fidelity SelectCo, LLC (2014-present), President, Asset Management (2014-present), and is an employee of Fidelity Investments. Previously, Mr. Morrison served as Vice President of Fidelity's Fixed Income and Asset Allocation Funds (2012-2014), President, Fixed Income (2011-2014), Vice President of Fidelity's Money Market Funds (2005-2009), President, Money Market Group Leader of FMR (2009), and Senior Vice President, Money Market Group of FMR (2004-2009). Mr. Morrison also served as Vice President of Fidelity's Bond Funds (2002-2005), certain Balanced Funds (2002-2005), and certain Asset Allocation Funds (2002-2007), and as Senior Vice President (2002-2005) of Fidelity's Bond Division. |
* Trustees have been determined to be "Interested Trustees" by virtue of, among other things, their affiliation with the trust or various entities under common control with FMR.
+ The information above includes each Trustee's principal occupation during the last five years and other information relating to the experience, attributes, and skills relevant to each Trustee's qualifications to serve as a Trustee, which led to the conclusion that each Trustee should serve as a Trustee for the fund.
Annual Report
Trustees and Officers - continued
Independent Trustees:
Correspondence intended for each Independent Trustee (that is, the Trustees other than the Interested Trustees) may be sent to Fidelity Investments, P.O. Box 55235, Boston, Massachusetts 02205-5235.
Name, Year of Birth; Principal Occupations and Other Relevant Experience+ |
Dennis J. Dirks (1948) |
Year of Election or Appointment: 2005 Trustee |
| Mr. Dirks also serves as Trustee of other Fidelity funds. Prior to his retirement in May 2003, Mr. Dirks was Chief Operating Officer and a member of the Board of The Depository Trust & Clearing Corporation (DTCC). He also served as President, Chief Operating Officer, and Board member of The Depository Trust Company (DTC) and President and Board member of the National Securities Clearing Corporation (NSCC). In addition, Mr. Dirks served as Chief Executive Officer and Board member of the Government Securities Clearing Corporation, Chief Executive Officer and Board member of the Mortgage-Backed Securities Clearing Corporation, as a Trustee and a member of the Finance Committee of Manhattan College (2005-2008), and as a Trustee and a member of the Finance Committee of AHRC of Nassau County (2006-2008). Mr. Dirks is a member of the Independent Directors Council (IDC) Governing Council (2010-present) and Board of Directors for The Brookville Center for Children's Services, Inc. (2009-present). |
Alan J. Lacy (1953) |
Year of Election or Appointment: 2008 Trustee |
| Mr. Lacy also serves as Trustee of other Fidelity funds. Mr. Lacy serves as Senior Adviser (2007-present) of Oak Hill Capital Partners, L.P. (private equity). Mr. Lacy also served as Chief Executive Officer (2000-2005) and Vice Chairman (2005-2006) of Sears Holdings Corporation and Sears, Roebuck and Co. (retail). In addition, Mr. Lacy serves as a member of the Board of Directors of Dave & Buster's Entertainment, Inc. (restaurant and entertainment complexes, 2010-present), Earth Fare, Inc. (retail grocery, 2012-present), The Hillman Companies, Inc. (hardware wholesalers, 2010-present), and Bristol-Myers Squibb Company (global pharmaceuticals, 2008-present). Mr. Lacy is a member of the Board of Trustees of The National Parks Conservation Association (2006-present). Previously, Mr. Lacy served as Chairman of the Board of Trustees of the National Parks Conservation Association (2008-2011) and as a member of the Board of Directors for the Western Union Company (global money transfer, 2006-2011). |
Ned C. Lautenbach (1944) |
Year of Election or Appointment: 2000 Trustee Chairman of the Independent Trustees |
| Mr. Lautenbach also serves as Trustee of other Fidelity funds. Mr. Lautenbach currently serves as the Lead Director of the Eaton Corporation Board of Directors (diversified industrial, 1997-present). Mr. Lautenbach is Chairman of the Board of Directors of the Philharmonic Center for the Arts in Naples, Florida (2012-present) and a member of the Council on Foreign Relations (1994-present). Previously, Mr. Lautenbach was a Partner/Advisory Partner at Clayton, Dubilier & Rice, LLC (private equity investment, 1998-2010), as well as a Director of Sony Corporation (2006-2007). |
Joseph Mauriello (1944) |
Year of Election or Appointment: 2008 Trustee |
| Mr. Mauriello also serves as Trustee of other Fidelity funds. Prior to his retirement in January 2006, Mr. Mauriello served in numerous senior management positions including Deputy Chairman and Chief Operating Officer (2004-2005), and Vice Chairman of Financial Services (2002-2004) of KPMG LLP US (professional services, 1965-2005). Mr. Mauriello currently serves as a member of the Board of Directors of XL Group plc. (global insurance and re-insurance, 2006-present). Previously, Mr. Mauriello served as a Director of the Hamilton Funds of the Bank of New York (2006-2007) and of Arcadia Resources Inc. (health care services and products, 2007-2012). |
Robert W. Selander (1950) |
Year of Election or Appointment: 2011 Trustee |
| Mr. Selander also serves as Trustee of other Fidelity funds. Previously, Mr. Selander served as a Member of the Advisory Board of other Fidelity funds (2011), and Executive Vice Chairman (2010), Chief Executive Officer (2009-2010), and President and Chief Executive Officer (1997-2009) of Mastercard, Inc. |
Cornelia M. Small (1944) |
Year of Election or Appointment: 2005 Trustee |
| Ms. Small also serves as Trustee of other Fidelity funds. Ms. Small is a member of the Board of Directors (2009-present) and Chair of the Investment Committee (2010-present) of the Teagle Foundation. Ms. Small also serves on the Investment Committee of the Berkshire Taconic Community Foundation (2008-present). Previously, Ms. Small served as Chairperson (2002-2008) and a member of the Investment Committee and Chairperson (2008-2012) and a member of the Board of Trustees of Smith College. In addition, Ms. Small served as Chief Investment Officer, Director of Global Equity Investments, and a member of the Board of Directors of Scudder, Stevens & Clark and Scudder Kemper Investments. |
William S. Stavropoulos (1939) |
Year of Election or Appointment: 2001 Trustee Vice Chairman of the Independent Trustees |
| Mr. Stavropoulos also serves as Trustee of other Fidelity funds. Mr. Stavropoulos serves as President and Founder of the Michigan Baseball Foundation, the Great Lakes Loons (2007-present). Mr. Stavropoulos is Chairman Emeritus of the Board of Directors of The Dow Chemical Company, where he previously served in numerous senior management positions, including President, CEO (1995-2000; 2002-2004), Chairman of the Executive Committee (2000-2006), and as a member of the Board of Directors (1990-2006). Currently, Mr. Stavropoulos is Chairman of the Board of Directors of Univar Inc. (global distributor of commodity and specialty chemicals), a Director of Teradata Corporation (data warehousing and technology solutions), and Maersk Inc. (industrial conglomerate), and a member of the Advisory Board for Metalmark Capital LLC (private equity investment, 2005-present). Mr. Stavropoulos is an operating advisor to Clayton, Dubilier & Rice, LLC (private equity investment). In addition, Mr. Stavropoulos is a member of the University of Notre Dame Advisory Council for the College of Science, a Trustee of the Rollin L. Gerstacker Foundation, and a Director of the Naples Philharmonic Center for the Arts. Previously, Mr. Stavropoulos served as a Director of Chemical Financial Corporation (bank holding company, 1993-2012) and Tyco International, Ltd. (multinational manufacturing and services, 2007-2012). |
David M. Thomas (1949) |
Year of Election or Appointment: 2008 Trustee |
| Mr. Thomas also serves as Trustee of other Fidelity funds. Mr. Thomas serves as Non-Executive Chairman of the Board of Directors of Fortune Brands Home and Security (home and security products, 2011-present), and as a member of the Board of Directors of Interpublic Group of Companies, Inc. (marketing communication, 2004-present). Previously, Mr. Thomas served as Executive Chairman (2005-2006) and Chairman and Chief Executive Officer (2000-2005) of IMS Health, Inc. (pharmaceutical and healthcare information solutions), and a Director of Fortune Brands, Inc. (consumer products, 2000-2011). |
+ The information above includes each Trustee's principal occupation during the last five years and other information relating to the experience, attributes, and skills relevant to each Trustee's qualifications to serve as a Trustee, which led to the conclusion that each Trustee should serve as a Trustee for the fund.
Advisory Board Member and Officers:
Correspondence intended for each officer and Peter S. Lynch may be sent to Fidelity Investments, 245 Summer Street, Boston, Massachusetts 02210. Officers appear below in alphabetical order.
Name, Year of Birth; Principal Occupation |
Peter S. Lynch (1944) |
Year of Election or Appointment: 2003 Member of the Advisory Board |
| Mr. Lynch also serves as Member of the Advisory Board of other Fidelity funds. Mr. Lynch is Vice Chairman and a Director of FMR and FMR Co., Inc. In addition, Mr. Lynch serves as a Trustee of Boston College and as the Chairman of the Inner-City Scholarship Fund. Previously, Mr. Lynch served on the Special Olympics International Board of Directors (1997-2006). |
Elizabeth Paige Baumann (1968) |
Year of Election or Appointment: 2012 Anti-Money Laundering (AML) Officer |
| Ms. Baumann also serves as AML Officer of other funds. She is Chief AML Officer of FMR LLC (2012-present) and is an employee of Fidelity Investments. Previously, Ms. Baumann served as Vice President and Deputy Anti-Money Laundering Officer (2007-2012). |
William C. Coffey (1969) |
Year of Election or Appointment: 2009 Assistant Secretary |
| Mr. Coffey also serves as Assistant Secretary of other funds. He is Senior Vice President and Deputy General Counsel of FMR LLC (2010-present), and is an employee of Fidelity Investments. Previously, Mr. Coffey served as Vice President and Associate General Counsel of FMR LLC (2005-2009). |
Timothy M. Cohen (1969) |
Year of Election or Appointment: 2014 Vice President of certain Equity Funds |
| Mr. Cohen also serves as Vice President of other funds. Mr. Cohen serves as a Director and Chief Compliance Officer of Fidelity Management & Research (U.K.) Inc. (2013-present) and is an employee of Fidelity Investments. |
Jonathan Davis (1968) |
Year of Election or Appointment: 2010 Assistant Treasurer |
| Mr. Davis also serves as Assistant Treasurer of other funds. Mr. Davis is an employee of Fidelity Investments. Previously, Mr. Davis served as Vice President and Associate General Counsel of FMR LLC (2003-2010). |
Adrien E. Deberghes (1967) |
Year of Election or Appointment: 2008 Deputy Treasurer |
| Mr. Deberghes also serves as an officer of other funds. He is an employee of Fidelity Investments (2008-present). Prior to joining Fidelity Investments, Mr. Deberghes was Senior Vice President of Mutual Fund Administration at State Street Corporation (2007-2008), Senior Director of Mutual Fund Administration at Investors Bank & Trust (2005-2007), and Director of Finance for Dunkin' Brands (2000-2005). |
Stephanie J. Dorsey (1969) |
Year of Election or Appointment: 2010 Assistant Treasurer |
| Ms. Dorsey also serves as an officer of other funds. She is an employee of Fidelity Investments (2008-present) and has served in other fund officer roles. Prior to joining Fidelity Investments, Ms. Dorsey served as Treasurer (2004-2008) of the JPMorgan Mutual Funds and Vice President (2004-2008) of JPMorgan Chase Bank. |
Howard J. Galligan III (1966) |
Year of Election or Appointment: 2014 Chief Financial Officer |
| Mr. Galligan also serves as Chief Financial Officer of other funds. Mr. Galligan serves as President of Fidelity Pricing and Cash Management Services (FPCMS) (2014-present) and as a Director of Strategic Advisers, Inc. (2008-present). Previously, Mr. Galligan served as Chief Administrative Officer of Asset Management (2011-2014) and Chief Operating Officer and Senior Vice President of Investment Support for Strategic Advisers, Inc. (2003-2011). |
Scott C. Goebel (1968) |
Year of Election or Appointment: 2008 Secretary and Chief Legal Officer (CLO) |
| Mr. Goebel serves as Secretary and CLO of other funds. Mr. Goebel also serves as Secretary of Fidelity SelectCo, LLC (2013-present), Fidelity Investments Money Management, Inc. (FIMM) (2010-present) and Fidelity Research and Analysis Company (FRAC) (2010-present); General Counsel, Secretary, and Senior Vice President of FMR (2008-present) and FMR Co., Inc. (2008-present); Chief Legal Officer of Fidelity Management & Research (Hong Kong) Limited (2008-present); and Assistant Secretary of Fidelity Management & Research (Japan) Limited (2008-present) and Fidelity Management & Research (U.K.) Inc. (2008-present). Previously, Mr. Goebel served as Secretary and CLO of other Fidelity funds (2008-2013), Assistant Secretary of FIMM (2008-2010), FRAC (2008-2010), and certain funds (2007-2008); and as Vice President and Secretary of Fidelity Distributors Corporation (FDC) (2005-2007). Mr. Goebel has been employed by FMR LLC or an affiliate since 2001. |
Brian B. Hogan (1964) |
Year of Election or Appointment: 2012 Vice President |
| Mr. Hogan also serves as Trustee or Vice President of other funds. Mr. Hogan serves as a Director of Fidelity SelectCo, LLC (2014-present) and President of FMR's Equity Division (2009-present). Previously, Mr. Hogan served as Senior Vice President, Equity Research of FMR (2006-2009) and as a portfolio manager. |
Chris Maher (1972) |
Year of Election or Appointment: 2013 Assistant Treasurer |
| Mr. Maher serves as Assistant Treasurer of other funds. Mr. Maher is Vice President of Valuation Oversight and is an employee of Fidelity Investments. Previously, Mr. Maher served as Vice President of Asset Management Compliance (2013), Vice President of FMR's Program Management Group (2010-2013), and Vice President of Valuation Oversight (2008-2010). |
Kenneth B. Robins (1969) |
Year of Election or Appointment: 2008 President and Treasurer |
| Mr. Robins also serves as an officer of other funds. Mr. Robins serves as Executive Vice President of Fidelity Investments Money Management, Inc. (FIMM) (2013-present) and is an employee of Fidelity Investments (2004-present). Previously, Mr. Robins served in other fund officer roles. |
Stephen Sadoski (1971) |
Year of Election or Appointment: 2012 Deputy Treasurer |
| Mr. Sadoski also serves as Deputy Treasurer of other funds. He is an employee of Fidelity Investments (2012-present) and has served in another fund officer role. Prior to joining Fidelity Investments, Mr. Sadoski served as an assistant chief accountant in the Division of Investment Management of the Securities and Exchange Commission (SEC) (2009-2012) and as a senior manager at Deloitte & Touche LLP (1997-2009). |
Stacie M. Smith (1974) |
Year of Election or Appointment: 2013 Deputy Treasurer |
| Ms. Smith also serves as an officer of other funds. She is an employee of Fidelity Investments (2009-present) and has served in other fund officer roles. Prior to joining Fidelity Investments, Ms. Smith served as Senior Audit Manager of Ernst & Young LLP (1996-2009). |
Renee Stagnone (1975) |
Year of Election or Appointment: 2013 Deputy Treasurer |
| Ms. Stagnone also serves as Deputy Treasurer of other funds. Ms. Stagnone is an employee of Fidelity Investments. |
Linda J. Wondrack (1964) |
Year of Election or Appointment: 2014 Chief Compliance Officer |
| Ms. Wondrack also serves as Chief Compliance Officer of other funds. Ms. Wondrack is Executive Vice President and head of the Ethics Office and Asset Management Compliance for Fidelity Investments (2012- present). Ms. Wondrack also serves as Chief Compliance Officer of Fidelity SelectCo, LLC (2014-present); Chief Compliance Officer of Impresa Management LLC (2013-present); and Chief Compliance Officer of FMR Co., Inc., Fidelity Investments Money Management, Inc., Fidelity Management & Research (Japan) Limited, Fidelity Management & Research (U.K.) Inc., Fidelity Management & Research (Hong Kong), Fidelity Management & Research Company, Pyramis Global Advisors, LLC, and Strategic Advisers, Inc., Ballyrock Investment Advisors LLC, and Northern Neck Investors LLC (2012-present). Previously, Ms. Wondrack served as Senior Vice President and Chief Compliance Officer for Columbia Management Investment Advisers, LLC (2005-2012); Chief Compliance Officer for certain funds within the Columbia Family of Funds (2007-2012); and Senior Vice President of Compliance Risk Management at Bank of America (2005-2010). |
Joseph F. Zambello (1957) |
Year of Election or Appointment: 2011 Deputy Treasurer |
| Mr. Zambello also serves as Deputy Treasurer of other funds. Mr. Zambello is an employee of Fidelity Investments. Previously, Mr. Zambello served as Vice President of FMR's Program Management Group (2009-2011) and Vice President of the Transfer Agent Oversight Group (2005-2009). |
Annual Report
The Board of Trustees of Fidelity Advisor Global Equity Income Fund voted to pay on December 08, 2014, to shareholders of record at the opening of business on December 05, 2014, a distribution of $0.709 per share derived from capital gains realized from sales of portfolio securities and a dividend of $0.022 per share from net investment income.
The fund hereby designates as a capital gain dividend with respect to the taxable year ended October 31, 2014, $412,376, or, if subsequently determined to be different, the net capital gain of such year
The Institutional Class designates 100% of dividends distributed during the fiscal year as amounts which may be taken into account as a dividend for purposes of the maximum rate under section 1(h)(11) of the Internal Revenue Code.
The Institutional Class designates 11%, 50%, 43%, and 40% of the dividends distributed in December 2013, April 2014, July 2014 and October 2014 respectively during the fiscal year as qualifying for the dividends-received deduction for corporate shareholders.
A total of 0.05% of the dividends distributed during the fiscal year was derived from interest on U.S. Government securities which is generally exempt from state income tax.
The amounts per share which represent income derived from sources within, and taxes paid to, foreign countries or possessions of the United States are as follows:
| Pay Date | Income | Taxes |
Institutional Class | 12/09/2013 | $0.0236 | $0.0045 |
| 04/07/2014 | $0.0327 | $0.0070 |
| 07/06/2014 | $0.0147 | $0.0027 |
| 10/06/2014 | $0.0086 | $0.0012 |
The fund will notify shareholders in January 2015 of amounts for use in preparing 2014 income tax returns.
Annual Report
Board Approval of Investment Advisory Contracts and Management Fees
Fidelity Advisor Global Equity Income Fund
Each year, the Board of Trustees, including the Independent Trustees (together, the Board), votes on the renewal of the management contract with Fidelity Management & Research Company (FMR) and the sub-advisory agreements (together, the Advisory Contracts) for the fund. The Board, assisted by the advice of fund counsel and Independent Trustees' counsel, requests and considers a broad range of information relevant to the renewal of the Advisory Contracts throughout the year.
The Board meets regularly and, at each of its meetings, covers an extensive agenda of topics and materials and considers factors that are relevant to its annual consideration of the renewal of the fund's Advisory Contracts, including the services and support provided to the fund and its shareholders. The Board has established various standing committees (Committees), each composed of and chaired by Independent Trustees with varying backgrounds, to which the Board has assigned specific subject matter responsibilities in order to enhance effective decision-making by the Board. The Board, acting directly and through its Committees, requests and receives information concerning the annual consideration of the renewal of the fund's Advisory Contracts. The Board also meets as needed to consider matters specifically related to the Board's annual consideration of the renewal of the Advisory Contracts. Members of the Board may also meet with trustees of other Fidelity funds through ad hoc joint committees to discuss certain matters relevant to the Fidelity funds.
At its July 2014 meeting, the Board, including the Independent Trustees, unanimously determined to renew the fund's Advisory Contracts. In reaching its determination, the Board considered all factors it believed relevant, including (i) the nature, extent, and quality of the services to be provided to the fund and its shareholders (including the investment performance of the fund); (ii) the competitiveness of the fund's management fee and total expense ratio relative to peer funds; (iii) the total costs of the services to be provided by and the profits to be realized by Fidelity from its relationship with the fund; (iv) the extent to which economies of scale exist and would be realized as the fund grows; and (v) whether fee levels reflect these economies of scale, if any, for the benefit of fund shareholders. In connection with separate internal corporate reorganizations involving Fidelity Management & Research (U.K.) Inc. (FMR U.K.) and Fidelity Management & Research (Japan) Inc. (FMR Japan), the Board approved certain non-material amendments to the fund's sub-advisory agreements with FMR U.K. and FMR Japan to reflect that, after these reorganizations, FMR Investment Management (UK) Limited and Fidelity Management & Research (Japan) Limited will carry on the business of FMR U.K. and FMR Japan, respectively. The Board noted that no changes to the portfolio managers or to the foreign research or investment advisory services provided to the fund were expected in connection with either reorganization and that the same personnel and resources would continue to be available to the fund at the new entities.
Annual Report
Board Approval of Investment Advisory Contracts and
Management Fees - continued
In considering whether to renew the Advisory Contracts for the fund, the Board reached a determination, with the assistance of fund counsel and Independent Trustees' counsel and through the exercise of its business judgment, that the renewal of the Advisory Contracts was in the best interests of the fund and its shareholders and that the compensation payable under the Advisory Contracts was fair and reasonable. The Board's decision to renew the Advisory Contracts was not based on any single factor, but rather was based on a comprehensive consideration of all the information provided to the Board at its meetings throughout the year. The Board, in reaching its determination to renew the Advisory Contracts, was aware that shareholders of the fund have a broad range of investment choices available to them, including a wide choice among funds offered by Fidelity's competitors, and that the fund's shareholders, who have the opportunity to review and weigh the disclosure provided by the fund in its prospectus and other public disclosures, have chosen to invest in this fund, which is part of the Fidelity family of funds.
Nature, Extent, and Quality of Services Provided. The Board considered Fidelity's staffing as it relates to the fund, including the backgrounds of investment personnel of FMR and the sub-advisers (together, the Investment Advisers), and also considered the fund's investment objective, strategies, and related investment philosophy. The Independent Trustees also had discussions with senior management of Fidelity's investment operations and investment groups. The Board considered the structure of the portfolio manager compensation program and whether this structure provides appropriate incentives to act in the best interests of the fund. Additionally, the Board considered the portfolio managers' investments, if any, in the funds that they manage.
Resources Dedicated to Investment Management and Support Services. The Board and the Fund Oversight and Research Committees reviewed the general qualifications and capabilities of Fidelity's investment staff, including its size, education, experience, and resources, as well as Fidelity's approach to recruiting, training, managing, and compensating investment personnel. The Board noted that Fidelity has continued to increase the resources devoted to non-U.S. offices, including expansion of Fidelity's global investment organization. The Board also noted that Fidelity's analysts have extensive resources, tools and capabilities that allow them to conduct sophisticated quantitative and fundamental analysis, as well as credit analysis of issuers, counterparties and guarantors. Further, the Board believes that Fidelity's investment professionals have sufficient access to global information and data so as to provide competitive investment results over time, and that those professionals also have access to sophisticated tools that permit them to assess portfolio construction and risk and performance attribution characteristics continuously, as well as to transmit new information and research conclusions rapidly around the world. Additionally, in its deliberations, the Board considered Fidelity's trading and risk management capabilities and resources and global compliance infrastructure, which are an integral part of the investment management process.
Annual Report
Shareholder and Administrative Services. The Board considered (i) the nature, extent, quality, and cost of advisory, administrative, and shareholder services performed by the Investment Advisers and their affiliates under the Advisory Contracts and under separate agreements covering transfer agency, pricing and bookkeeping, and securities lending services for the fund; (ii) the nature and extent of the supervision of third party service providers, principally custodians and subcustodians; and (iii) the resources devoted to, and the record of compliance with, the fund's compliance policies and procedures. The Board also reviewed the allocation of fund brokerage, including allocations to brokers affiliated with the Investment Advisers, the use of brokerage commissions to pay fund expenses, and the use of "soft" commission dollars to pay for research services.
The Board noted that the growth of fund assets over time across the complex allows Fidelity to reinvest in the development of services designed to enhance the value or convenience of the Fidelity funds as investment vehicles. These services include 24-hour access to account information and market information through telephone representatives and over the Internet, investor education materials and asset allocation tools, and the expanded availability of Fidelity Investor Centers.
In 2014, the Board formed an ad hoc Committee on Transfer Agency Fees to review the variety of transfer agency fee structures throughout the industry and Fidelity's competitive positioning with respect to industry participants.
Investment in a Large Fund Family. The Board considered the benefits to shareholders of investing in a Fidelity fund, including the benefits of investing in a fund that is part of a large family of funds offering a variety of investment disciplines and providing a large variety of mutual fund investor services. The Board noted that Fidelity had taken, or had made recommendations that resulted in the Fidelity funds taking, a number of actions over the previous year that benefited particular funds, including (i) continuing to dedicate additional resources to investment research and to the support of the senior management team that oversees asset management; (ii) persisting in efforts to enhance Fidelity's global research capabilities; (iii) launching new funds and making other enhancements to meet client needs for income-oriented solutions; (iv) reducing fund expenses for certain index funds; (v) continuing to launch dedicated lower cost underlying funds to meet portfolio construction needs related to expanding underlying fund options for Fidelity funds of funds, specifically for the Freedom Fund product lines; (vi) rationalizing product lines and gaining increased efficiencies through fund mergers; (vii) launching sector-based exchange-traded funds and establishing a new Fidelity adviser to manage sector-based funds and products; (viii) continuing to develop and implement technology to improve security and increase efficiency; (ix) modifying the eligibility criteria for certain share classes to increase their marketability to a portion of the defined contribution plan market; (x) waiving redemption fees for certain qualified fund-of-fund and wrap programs and certain retirement plan transactions; and (xi) launching new Institutional Class shares of certain money market funds to attract and retain assets and to fill a gap in the money market fund lineup.
Annual Report
Board Approval of Investment Advisory Contracts and
Management Fees - continued
Investment Performance. The Board considered whether the fund has operated in accordance with its investment objective, as well as its record of compliance with its investment restrictions and its performance history.
The Board took into account discussions with the Investment Advisers about fund investment performance that occur at Board meetings throughout the year. In this regard the Board noted that as part of regularly scheduled fund reviews and other reports to the Board on fund performance, the Board periodically considers annualized return information for the fund, for different time periods, measured against a securities market index ("benchmark index") and a peer group of funds with similar objectives ("peer group"). In its evaluation of fund investment performance, the Board gave particular attention to information indicating changes in performance of certain Fidelity funds for specific time periods and the Investment Advisers' explanations for any overperformance or underperformance.
In addition to reviewing absolute and relative fund performance, the Independent Trustees periodically consider the appropriateness of fund performance metrics in evaluating the results achieved. In general, the Independent Trustees believe that fund performance should be evaluated based on net performance (after fees and expenses) of both the highest performing and lowest performing classes, where applicable, compared to appropriate benchmark indices, over appropriate time periods which may include full market cycles, and compared to peer groups, as applicable, over the same periods, taking into account relevant factors including the following: general market conditions; issuer-specific information; tactical opportunities for investment; and fund cash flows and other factors.
The Independent Trustees recognize that shareholders evaluate performance on a net basis over their own holding periods, for which one-, three-, and five-year periods are often used as a proxy. For this reason, the performance information reviewed by the Board also included net cumulative calendar year total return information for the fund and an appropriate benchmark index and peer group for the most recent one-year period, as shown below. Returns are shown compared to the 25th percentile (top of box, 75% beaten) and 75th percentile (bottom of box, 25% beaten) of the peer universe. Returns of the benchmark index are "net MA," i.e., adjusted for tax withholding rates applicable to U.S.-based funds organized as Massachusetts business trusts.
Annual Report
Fidelity Advisor Global Equity Income Fund
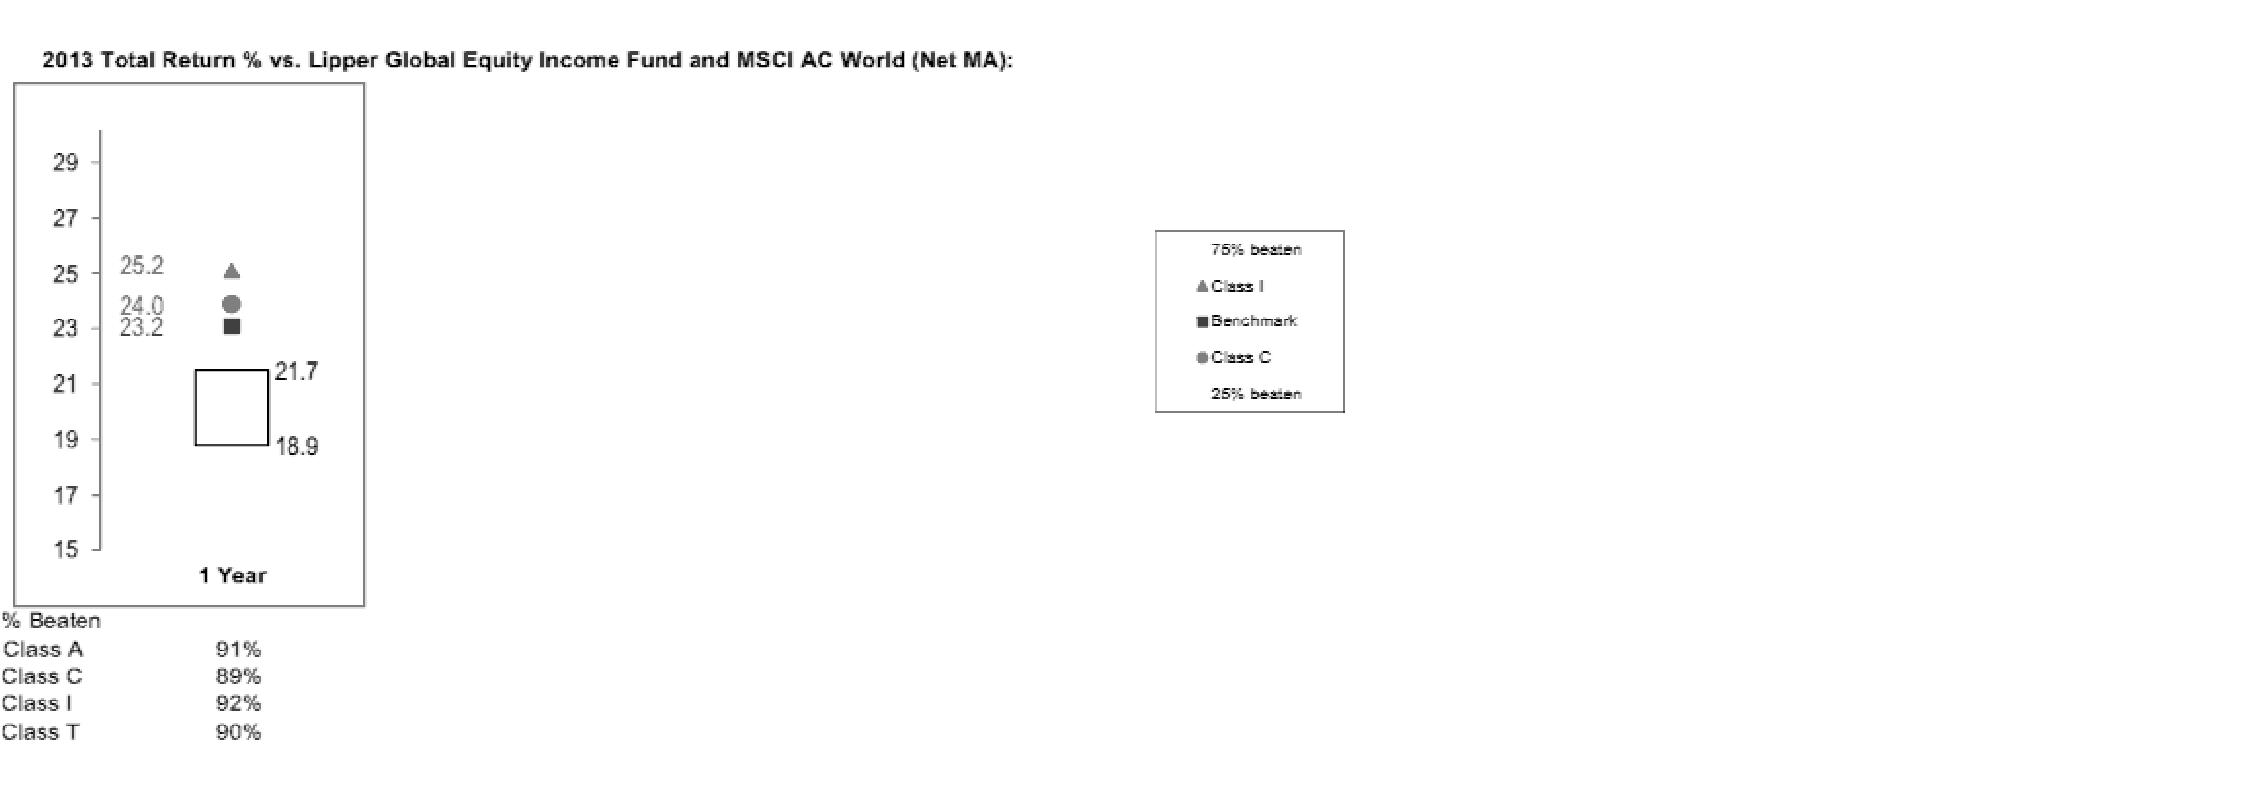
Based on its review, the Board concluded that the nature, extent, and quality of services provided to the fund under the Advisory Contracts should benefit the fund's shareholders.
Competitiveness of Management Fee and Total Expense Ratio. The Board considered the fund's management fee and total expense ratio compared to "mapped groups" of competitive funds and classes. Fidelity creates "mapped groups" by combining similar Lipper investment objective categories that have comparable investment mandates. Combining Lipper investment objective categories aids the Board's management fee and total expense ratio comparisons by broadening the competitive group used for comparison and by reducing the number of universes to which various Fidelity funds are compared.
Management Fee. The Board considered two proprietary management fee comparisons for the 12-month (or shorter) periods shown in the chart below. The group of Lipper funds used by the Board for management fee comparisons is referred to below as the "Total Mapped Group." The Total Mapped Group is broader than the Lipper peer group used by the Board for performance comparisons because the Total Mapped Group combines several Lipper investment objective categories while the Lipper peer group does not. The Total Mapped Group comparison focuses on a fund's standing in terms of gross management fees before expense reimbursements or caps relative to the total universe of funds with comparable investment mandates, regardless of whether their management fee structures also are comparable. Funds with comparable investment mandates offer exposure to similar types of securities. Funds with comparable management fee structures have similar management fee contractual arrangements (e.g., flat rate charged for advisory services, all-inclusive fee rate, etc.). "TMG %" represents the percentage of funds in the Total Mapped Group that had management fees that were lower than the fund's. For example, a hypothetical TMG % of 20% would mean that 80% of the funds in the Total Mapped Group had higher, and 20% had lower, management fees than the fund. The fund's actual TMG %s are in the chart below. The "Asset-Size Peer Group" (ASPG) comparison focuses on a fund's standing relative to a subset of non-Fidelity funds within the Total Mapped Group that are similar in size and management fee structure. For example, if a fund is in the first quartile of the ASPG, the fund's management fee ranks in the least expensive or lowest 25% of funds in the ASPG. The ASPG represents at least 15% of the funds in the Total Mapped Group with comparable asset size and management fee structures, subject to a minimum of 50 funds (or all funds in the Total Mapped Group if fewer than 50). Additional information, such as the ASPG quartile in which the fund's management fee rate ranked, is also included in the chart and considered by the Board.
Annual Report
Board Approval of Investment Advisory Contracts and
Management Fees - continued
Fidelity Advisor Global Equity Income Fund

The Board noted that the fund's management fee rate ranked below the median of its Total Mapped Group and below the median of its ASPG for 2013.
The Board also noted that, in August 2013, the ad hoc Committee on Management Fees was formed to conduct an in-depth review of the management fee rates of Fidelity's active equity mutual funds. The Committee focused on the following areas: (i) standard fee structures; (ii) research consumption and trading evolution; (iii) management fee competitiveness/profitability by category; and (iv) factors that drive institutional pricing.
Annual Report
Based on its review, the Board concluded that the fund's management fee is fair and reasonable in light of the services that the fund receives and the other factors considered.
Total Expense Ratio. In its review of each class's total expense ratio, the Board considered the fund's management fee as well as other fund or class expenses, as applicable, such as transfer agent fees, pricing and bookkeeping fees, fund-paid 12b-1 fees, and custodial, legal, and audit fees. The Board also noted the effects of any waivers and reimbursements on fees and expenses. As part of its review, the Board also considered the current and historical total expense ratios of each class of the fund compared to competitive fund median expenses. Each class of the fund is compared to those funds and classes in the Total Mapped Group (used by the Board for management fee comparisons) that have a similar sales load structure.
The Board noted that the total expense ratio of each class ranked above its competitive median for 2013. The Board considered that, in general, various factors can affect total expense ratios. The Board noted that the total expense ratio of Class T was above the competitive median primarily because of higher 12b-1 fees on Class T as compared to most competitor funds. Class T has a higher 12b-1 fee, but a lower front-end sales charge, than traditionally priced front-end sales charge classes. The Board considered that Class T is primarily sold load-waived in the retirement plan market where its 0.50% 12b-1 fee is comparable to competing no-load, higher 12b-1 fee classes designed specifically for retirement plans. The Board noted that the fund offers multiple classes, each of which has a different sales load and 12b-1 fee structure, and that the multiple structures are intended to offer a range of pricing options for the intermediary market. The Board also noted that the total expense ratios of the classes vary primarily by the level of their 12b-1 fees, although differences in transfer agent fees may also cause expenses to vary from class to class.
The Board further considered that FMR contractually agreed to reimburse Class A, Class T, Class C, and Institutional Class of the fund to the extent that total expenses (excluding interest, certain taxes, certain securities lending costs, brokerage commissions, extraordinary expenses, and acquired fund fees and expenses, if any), as a percentage of their respective average net assets, exceed 1.45%, 1.70%, 2.20%, and 1.20% through December 31, 2014.
Fees Charged to Other Fidelity Clients. The Board also considered Fidelity fee structures and other information with respect to clients of Fidelity, such as other funds advised or subadvised by Fidelity, pension plan clients, and other institutional clients. The Board noted the findings of the 2013 ad hoc joint committee (created with the board of other Fidelity funds), which reviewed and compared Fidelity's institutional investment advisory business with its business of providing services to the Fidelity funds, including the differences in services provided, fees charged, and costs incurred, as well as competition in their respective marketplaces.
Annual Report
Board Approval of Investment Advisory Contracts and
Management Fees - continued
Based on its review of total expense ratios and fees charged to other Fidelity clients, the Board concluded that the total expense ratio of each class of the fund was reasonable, although in all cases above the median of the universe presented for comparison, in light of the services that the fund and its shareholders receive and the other factors considered.
Costs of the Services and Profitability. The Board considered the revenues earned and the expenses incurred by Fidelity in conducting the business of developing, marketing, distributing, managing, administering and servicing the fund and servicing the fund's shareholders. The Board also considered the level of Fidelity's profits in respect of all the Fidelity funds.
On an annual basis, Fidelity presents to the Board Fidelity's profitability for the fund. Fidelity calculates the profitability for each fund, as well as aggregate profitability for groups of Fidelity funds and all Fidelity funds, using a series of detailed revenue and cost allocation methodologies which originate with the books and records of Fidelity on which Fidelity's audited financial statements are based. The Audit Committee of the Board reviews any significant changes from the prior year's methodologies.
PricewaterhouseCoopers LLP (PwC), independent registered public accounting firm and auditor to Fidelity and certain Fidelity funds, has been engaged annually by the Board as part of the Board's assessment of Fidelity's profitability analysis. PwC's engagement includes the review and assessment of the methodologies used by Fidelity in determining the revenues and expenses attributable to Fidelity's mutual fund business, and completion of agreed-upon procedures in respect of the mathematical accuracy of fund profitability and its conformity to established allocation methodologies. After considering PwC's reports issued under the engagement and information provided by Fidelity, the Board concluded that while other allocation methods may also be reasonable, Fidelity's profitability methodologies are reasonable in all material respects.
The Board also reviewed Fidelity's non-fund businesses and fall-out benefits related to the mutual fund business as well as cases where Fidelity's affiliates may benefit from or be related to the fund's business.
The Board considered the costs of the services provided by and the profits realized by Fidelity in connection with the operation of the fund and was satisfied that the profitability was not excessive in the circumstances.
Economies of Scale. The Board considered whether there have been economies of scale in respect of the management of the Fidelity funds, whether the Fidelity funds (including the fund) have appropriately benefited from any such economies of scale, and whether there is potential for realization of any further economies of scale. The Board considered the extent to which the fund will benefit from economies of scale through increased services to the fund, through waivers or reimbursements, or through fee or expense ratio reductions. The Board also noted that in 2013, it and the boards of other Fidelity funds created an ad hoc committee (the Economies of Scale Committee) to analyze whether Fidelity attains economies of scale in respect of the management and servicing of the Fidelity funds, whether the Fidelity funds have appropriately benefited from such economies of scale, and whether there is potential for realization of any further economies of scale.
Annual Report
The Board recognized that the fund's management contract incorporates a "group fee" structure, which provides for lower group fee rates as total group assets increase, and for higher group fee rates as total group assets decrease (with "group assets" defined to include fund assets under FMR's management plus sector fund assets previously under FMR's management and currently managed by Fidelity SelectCo, LLC). FMR calculates the group fee rates based on a tiered asset "breakpoint" schedule that varies based on asset class. The Board considered that the group fee is designed to deliver the benefits of economies of scale to fund shareholders when total Fidelity fund assets increase, even if assets of any particular fund are unchanged or have declined, because some portion of Fidelity's costs are attributable to services provided to all Fidelity funds, and all funds benefit if those costs can be allocated among more assets. The Board concluded that, given the group fee structure, fund shareholders will benefit from lower management fees as group assets increase at the fund complex level, regardless of whether Fidelity achieves any such economies of scale.
The Board concluded, taking into account the analysis of the Economies of Scale Committee, that economies of scale, if any, are being appropriately shared between fund shareholders and Fidelity.
Additional Information Requested by the Board. In order to develop fully the factual basis for consideration of the Fidelity funds' Advisory Contracts, the Board requested and received additional information on certain topics, including: (i) fund performance trends and Fidelity's long-term strategies for certain funds; (ii) Fidelity's strategic marketing and product lineup goals; (iii) the methodology with respect to competitive fund data and peer group classifications; (iv) the arrangements with, and performance of, certain sub-advisers on behalf of the Fidelity funds, as well as certain proposed participating affiliate arrangements; (v) the realization of fall-out benefits in certain Fidelity business units; (vi) Fidelity's group fee structures, including the rationale for the individual fee rates of certain categories of funds and the definition of group assets; (vii) trends regarding industry use of performance fee structures and the performance adjustment methodologies applicable to the Fidelity funds; (viii) additional competitive analysis regarding the total expenses for certain classes; (ix) fund profitability methodology, including Fidelity's cost allocation methodology, and the impact of certain factors on fund profitability results; and (x) the process by which Fidelity determines sub-advisory fees for funds it advises.
Annual Report
Board Approval of Investment Advisory Contracts and
Management Fees - continued
Based on its evaluation of all of the conclusions noted above, and after considering all factors it believed relevant, the Board ultimately concluded that the advisory fee structures are fair and reasonable, and that the fund's Advisory Contracts should be renewed.
Annual Report
Investment Adviser
Fidelity Management & Research Company
Boston, MA
Investment Sub-Advisers
FMR Co., Inc.
Fidelity Management & Research
(U.K.) Inc.
Fidelity Management & Research
(Hong Kong) Limited
Fidelity Management & Research
(Japan) Limited
FIL Investments (Japan) Limited
FIL Investment Advisors
FIL Investment Advisors (UK) Limited
General Distributor
Fidelity Distributors Corporation
Smithfield, RI
Transfer and Service Agents
Fidelity Investments Institutional
Operations Company, Inc.
Boston, MA
Fidelity Service Company, Inc.
Boston, MA
Custodian
Citibank, N.A.
New York, NY
(Fidelity Investment logo)(registered trademark)
AGEDI-UANN-1214
1.938141.102
(Fidelity Investment logo)(registered trademark)
Fidelity Advisor®
International
Capital Appreciation
Fund - Class A, Class T, Class B
and Class C
Annual Report
October 31, 2014
(Fidelity Cover Art)
Contents
Performance | (Click Here) | How the fund has done over time. |
Management's Discussion of Fund Performance | (Click Here) | The Portfolio Manager's review of fund performance and strategy. |
Shareholder Expense Example | (Click Here) | An example of shareholder expenses. |
Investment Changes | (Click Here) | A summary of major shifts in the fund's investments over the past six months. |
Investments | (Click Here) | A complete list of the fund's investments with their market values. |
Financial Statements | (Click Here) | Statements of assets and liabilities, operations, and changes in net assets, as well as financial highlights. |
Notes | (Click Here) | Notes to the financial statements. |
Report of Independent Registered Public Accounting Firm | (Click Here) | |
Trustees and Officers | (Click Here) | |
Distributions | (Click Here) | |
Board Approval of Investment Advisory Contracts and Management Fees | (Click Here) | |
To view a fund's proxy voting guidelines and proxy voting record for the 12-month period ended June 30, visit http://www.fidelity.com/proxyvotingresults or visit the Securities and Exchange Commission's (SEC) web site at http://www.sec.gov. You may also call 1-877-208-0098 to request a free copy of the proxy voting guidelines.
Standard & Poor's, S&P and S&P 500 are registered service marks of The McGraw-Hill Companies, Inc. and have been licensed for use by Fidelity Distributors Corporation.
Other third-party marks appearing herein are the property of their respective owners.
All other marks appearing herein are registered or unregistered trademarks or service marks of FMR LLC or an affiliated company. © 2014 FMR LLC. All rights reserved.
Annual Report
This report and the financial statements contained herein are submitted for the general information of the shareholders of the fund. This report is not authorized for distribution to prospective investors in the fund unless preceded or accompanied by an effective prospectus.
A fund files its complete schedule of portfolio holdings with the SEC for the first and third quarters of each fiscal year on Form N-Q. Forms N-Q are available on the SEC's web site at http://www.sec.gov. A fund's Forms N-Q may be reviewed and copied at the SEC's Public Reference Room in Washington, DC. Information regarding the operation of the SEC's Public Reference Room may be obtained by calling 1-800-SEC-0330. For a complete list of a fund's portfolio holdings, view the most recent holdings listing, semiannual report, or annual report on Fidelity's web site at http://www.fidelity.com, http://www.advisor.fidelity.com, or http://www.401k.com, as applicable.
NOT FDIC INSURED • MAY LOSE VALUE • NO BANK GUARANTEE
Neither the fund nor Fidelity Distributors Corporation is a bank.
Annual Report
Average annual total return reflects the change in the value of an investment, assuming reinvestment of the class' distributions from dividend income and capital gains (the profits earned upon the sale of securities that have grown in value, if any) and assuming a constant rate of performance each year. The $10,000 table and the fund's returns do not reflect the deduction of taxes that a shareholder would pay on fund distributions or the redemption of fund shares. During periods of reimbursement by Fidelity, a fund's total return will be greater than it would be had the reimbursement not occurred. How a fund did yesterday is no guarantee of how it will do tomorrow. Returns reflect the conversion of Class B shares to Class A shares after a maximum of seven years.
Average Annual Total Returns
Periods ended October 31, 2014 | Past 1
year | Past 5
years | Past 10
years |
Class A (incl. 5.75% sales charge) | 0.19% | 9.67% | 5.49% |
Class T (incl. 3.50% sales charge) | 2.36% | 9.90% | 5.48% |
Class B (incl. contingent deferred sales charge)A | 0.52% | 9.86% | 5.54% |
Class C (incl. contingent deferred sales charge)B | 4.54% | 10.15% | 5.33% |
A Class B shares' contingent deferred sales charges included in the past one year, past five years, and past ten years total return figures are 5%, 2%, and 0%, respectively.
B Class C shares' contingent deferred sales charges included in the past one year, past five years, and past ten years total return figures are 1%, 0%, and 0%, respectively.
Annual Report
$10,000 Over 10 Years
Let's say hypothetically that $10,000 was invested in Fidelity Advisor® International Capital Appreciation Fund - Class A on October 31, 2004, and the current 5.75% sales charge was paid. The chart shows how the value of your investment would have changed, and also shows how the MSCI ACWI (All Country World Index) ex USA Index performed over the same period.
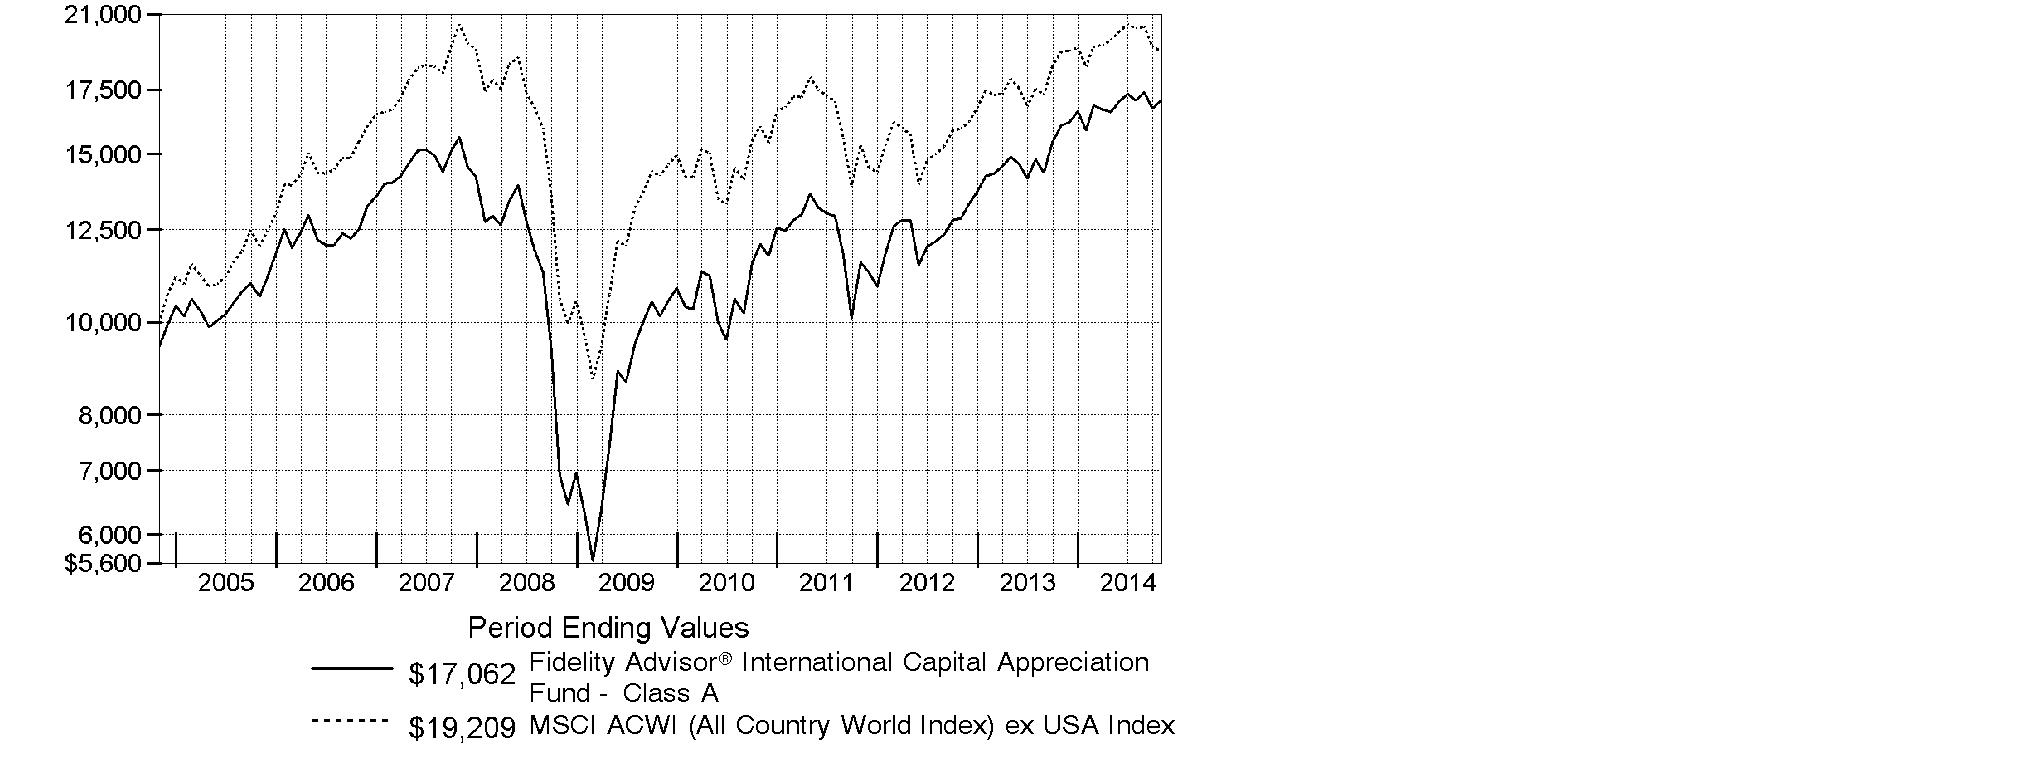
Annual Report
Market Recap: Global equities posted a healthy gain for the 12 months ending October 31, 2014, overcoming an October market decline driven by recessionary pressures in China and tepid growth in Europe. The MSCI ACWI (All Country World Index) Index rose 8.15%, helped by subdued market volatility for much of the period and supported by solid corporate earnings, especially in the United States. Stocks also benefited from easy monetary policies in Japan and the eurozone, as well as increased stimulus efforts in China. All but three of the 24 industry groups that compose the index marked a positive return. The U.S. (+17%) remained a pillar of strength, while a strongly rising dollar in the latter part of the period detracted from investors' returns in most non-U.S. markets. Canada (+5%) notched broad gains outside of its energy and materials sectors, as did Asia-Pacific ex Japan (+4%), led by investor enthusiasm for companies in India. The U.K., Europe and Japan, meanwhile, all underperformed. Among sectors, health care (+24%) led the index, with a strong contribution from the pharmaceuticals, biotechnology & life sciences industry. Information technology (+21%) also outperformed. Conversely, materials (-4%) and energy (-1%) lagged the index due to a higher supply of and lower demand for commodities.
Comments from Sammy Simnegar, Portfolio Manager of Fidelity Advisor® International Capital Appreciation Fund: For the year, the fund's Class A, Class T, Class B and Class C shares returned 6.31%, 6.07%, 5.52% and 5.54%, respectively (excluding sales charges), handily besting the 0.18% gain of the MSCI ACWI (All Country World Index) ex USA Index. Versus this index, the fund's significant non-index exposure to the United States bolstered performance, as did its positioning in emerging markets, especially India and China. Bitauto Holdings, a Chinese automotive website that I sold, was the fund's top relative contributor. Other contributors from China's Internet industry were Baidu and Alibaba Group. Two India-based contributors were Amara Raja Batteries and Axis Bank. Elsewhere, our stake in Ireland's Shire Pharmaceuticals benefited from a buyout offer from U.S. drug company AbbVie. I sold Shire before the deal fell apart in October and subsequently bought it back at a much lower price. Conversely, not owning two strong-performing, large-capitalization drugs stocks in the index, Switzerland's Novartis and U.K.-based AstraZeneca, weighed on relative performance. Russian Internet search firm Yandex also detracted, mainly due to a plunging ruble. Not knowing how to quantify our risk here, I sold this stock. Most of the stocks mentioned in this report were not in the index.
The views expressed above reflect those of the portfolio manager(s) only through the end of the period as stated on the cover of this report and do not necessarily represent the views of Fidelity or any other person in the Fidelity organization. Any such views are subject to change at any time based upon market or other conditions and Fidelity disclaims any responsibility to update such views. These views may not be relied on as investment advice and, because investment decisions for a Fidelity fund are based on numerous factors, may not be relied on as an indication of trading intent on behalf of any Fidelity fund.
Annual Report
Shareholder Expense Example
As a shareholder of the Fund, you incur two types of costs: (1) transaction costs, including sales charges (loads) on purchase payments or redemption proceeds, redemption fees and (2) ongoing costs, including management fees, distribution and/or service (12b-1) fees and other Fund expenses. This Example is intended to help you understand your ongoing costs (in dollars) of investing in the Fund and to compare these costs with the ongoing costs of investing in other mutual funds.
The Example is based on an investment of $1,000 invested at the beginning of the period and held for the entire period (May 1, 2014 to October 31, 2014).
Actual Expenses
The first line of the accompanying table for each class of the Fund provides information about actual account values and actual expenses. You may use the information in this line, together with the amount you invested, to estimate the expenses that you paid over the period. Simply divide your account value by $1,000.00 (for example, an $8,600 account value divided by $1,000.00 = 8.6), then multiply the result by the number in the first line for a class of the Fund under the heading entitled "Expenses Paid During Period" to estimate the expenses you paid on your account during this period. In addition, the Fund, as a shareholder in the underlying Fidelity Central Funds, will indirectly bear its pro-rata share of the fees and expenses incurred by the underlying Fidelity Central Funds. These fees and expenses are not included in the Fund's annualized expense ratio used to calculate the expense estimate in the table below.
Hypothetical Example for Comparison Purposes
The second line of the accompanying table for each class of the Fund provides information about hypothetical account values and hypothetical expenses based on a Class' actual expense ratio and an assumed rate of return of 5% per year before expenses, which is not the Class' actual return. The hypothetical account values and expenses may not be used to estimate the actual ending account balance or expenses you paid for the period. You may use this information to compare the ongoing costs of investing in the Fund and other funds. To do so, compare this 5% hypothetical example with the 5% hypothetical examples that appear in the shareholder reports of the other funds. In addition, the Fund, as a shareholder in the underlying Fidelity Central Funds, will indirectly bear its pro-rata share of the fees and expenses incurred by the underlying Fidelity Central Funds. These fees and expenses are not included in the Fund's annualized expense ratio used to calculate the expense estimate in the table below.
Please note that the expenses shown in the table are meant to highlight your ongoing costs only and do not reflect any transaction costs. Therefore, the second line of the table is useful in comparing ongoing costs only, and will not help you determine the relative total costs of owning different funds. In addition, if these transactional costs were included, your costs would have been higher.
Annual Report
| Annualized
Expense Ratio B | Beginning
Account Value
May 1, 2014 | Ending
Account Value
October 31, 2014 | Expenses Paid
During Period*
May 1, 2014
to October 31, 2014 |
Class A | 1.45% | | | |
Actual | | $ 1,000.00 | $ 1,028.60 | $ 7.41 |
Hypothetical A | | $ 1,000.00 | $ 1,017.90 | $ 7.38 |
Class T | 1.70% | | | |
Actual | | $ 1,000.00 | $ 1,027.00 | $ 8.69 |
Hypothetical A | | $ 1,000.00 | $ 1,016.64 | $ 8.64 |
Class B | 2.20% | | | |
Actual | | $ 1,000.00 | $ 1,024.50 | $ 11.23 |
Hypothetical A | | $ 1,000.00 | $ 1,014.12 | $ 11.17 |
Class C | 2.20% | | | |
Actual | | $ 1,000.00 | $ 1,024.60 | $ 11.23 |
Hypothetical A | | $ 1,000.00 | $ 1,014.12 | $ 11.17 |
Institutional Class | 1.20% | | | |
Actual | | $ 1,000.00 | $ 1,029.40 | $ 6.14 |
Hypothetical A | | $ 1,000.00 | $ 1,019.16 | $ 6.11 |
A 5% return per year before expenses
B Annualized expense ratio reflects expenses net of applicable fee waivers.
* Expenses are equal to each Class' annualized expense ratio, multiplied by the average account value over the period, multiplied by 184/365 (to reflect the one-half year period).
Annual Report
Investment Changes (Unaudited)
Top Five Stocks as of October 31, 2014 |
| % of fund's
net assets | % of fund's net assets
6 months ago |
Nestle SA sponsored ADR (Switzerland, Food Products) | 1.6 | 0.0 |
Bayer AG (Germany, Pharmaceuticals) | 1.0 | 0.9 |
British American Tobacco PLC (United Kingdom) (United Kingdom, Tobacco) | 0.9 | 0.8 |
Novo Nordisk A/S Series B sponsored ADR (Denmark, Pharmaceuticals) | 0.8 | 0.7 |
Anheuser-Busch InBev SA NV (Belgium, Beverages) | 0.7 | 0.7 |
| 5.0 | |
Top Five Market Sectors as of October 31, 2014 |
| % of fund's
net assets | % of fund's net assets
6 months ago |
Consumer Discretionary | 21.1 | 23.0 |
Industrials | 18.1 | 21.0 |
Financials | 14.8 | 10.3 |
Health Care | 12.3 | 12.7 |
Materials | 11.1 | 6.7 |
Top Five Countries as of October 31, 2014 |
(excluding cash equivalents) | % of fund's
net assets | % of fund's net assets
6 months ago |
United States of America | 15.8 | 16.6 |
United Kingdom | 15.0 | 16.1 |
Japan | 7.4 | 10.1 |
India | 5.6 | 2.9 |
France | 5.4 | 5.3 |
Percentages are adjusted for the effect of open futures contracts, if applicable. |
Asset Allocation (% of fund's net assets) |
As of October 31, 2014 | As of April 30, 2014 |
 | Stocks 98.9% | | | Stocks 99.0% | |
 | Short-Term
Investments and
Net Other Assets (Liabilities) 1.1% | | | Short-Term
Investments and
Net Other Assets (Liabilities) 1.0% | |

Annual Report
Investments October 31, 2014
Showing Percentage of Net Assets
Common Stocks - 98.2% |
| Shares | | Value |
Australia - 4.0% |
Amcor Ltd. | 59,012 | | $ 612,949 |
Carsales.com Ltd. | 76,566 | | 722,505 |
CSL Ltd. | 11,433 | | 807,203 |
DuluxGroup Ltd. | 127,061 | | 600,475 |
Ramsay Health Care Ltd. | 11,739 | | 542,675 |
realestate.com.au Ltd. | 17,793 | | 712,452 |
SEEK Ltd. | 46,235 | | 678,493 |
Sydney Airport unit | 165,382 | | 642,961 |
Transurban Group unit | 97,279 | | 696,703 |
TOTAL AUSTRALIA | | 6,016,416 |
Bailiwick of Jersey - 1.6% |
Experian PLC | 44,831 | | 673,056 |
Shire PLC | 14,100 | | 946,067 |
WPP PLC | 38,000 | | 742,241 |
TOTAL BAILIWICK OF JERSEY | | 2,361,364 |
Belgium - 0.9% |
Anheuser-Busch InBev SA NV | 10,580 | | 1,173,263 |
Arseus NV | 6,800 | | 271,833 |
TOTAL BELGIUM | | 1,445,096 |
Bermuda - 0.8% |
Credicorp Ltd. (United States) | 3,520 | | 566,720 |
Invesco Ltd. | 15,100 | | 611,097 |
TOTAL BERMUDA | | 1,177,817 |
Brazil - 2.0% |
BB Seguridade Participacoes SA | 47,100 | | 628,406 |
Cielo SA | 37,720 | | 619,406 |
Kroton Educacional SA | 95,400 | | 679,916 |
Qualicorp SA (a) | 54,300 | | 552,226 |
Ultrapar Participacoes SA | 25,400 | | 554,046 |
TOTAL BRAZIL | | 3,034,000 |
British Virgin Islands - 0.7% |
Mail.Ru Group Ltd. GDR (Reg. S) (a) | 20,800 | | 504,192 |
Michael Kors Holdings Ltd. (a) | 6,900 | | 542,271 |
TOTAL BRITISH VIRGIN ISLANDS | | 1,046,463 |
Canada - 3.9% |
Alimentation Couche-Tard, Inc. Class B (sub. vtg.) | 18,200 | | 617,674 |
AutoCanada, Inc. | 8,870 | | 492,668 |
Common Stocks - continued |
| Shares | | Value |
Canada - continued |
Canadian National Railway Co. | 15,360 | | $ 1,082,921 |
Canadian Pacific Railway Ltd. | 4,410 | | 917,294 |
CI Financial Corp. | 19,700 | | 572,795 |
Constellation Software, Inc. | 2,150 | | 605,674 |
Jean Coutu Group, Inc. Class A (sub. vtg.) | 23,000 | | 527,324 |
PrairieSky Royalty Ltd. (d) | 16,300 | | 501,850 |
Stantec, Inc. | 8,400 | | 532,225 |
TOTAL CANADA | | 5,850,425 |
Cayman Islands - 2.6% |
Alibaba Group Holding Ltd. sponsored ADR | 6,900 | | 680,340 |
Baidu.com, Inc. sponsored ADR (a) | 2,800 | | 668,556 |
Melco Crown Entertainment Ltd. sponsored ADR | 25,400 | | 689,356 |
Sands China Ltd. | 117,800 | | 734,732 |
Tencent Holdings Ltd. | 71,800 | | 1,153,989 |
TOTAL CAYMAN ISLANDS | | 3,926,973 |
Denmark - 1.5% |
Novo Nordisk A/S Series B sponsored ADR | 28,200 | | 1,274,076 |
Topdanmark A/S (a) | 17,000 | | 540,955 |
Tryg A/S | 4,900 | | 529,641 |
TOTAL DENMARK | | 2,344,672 |
Egypt - 0.4% |
Commercial International Bank SAE sponsored GDR | 84,000 | | 571,200 |
Finland - 0.9% |
Kone Oyj (B Shares) | 14,700 | | 631,851 |
Sampo Oyj (A Shares) | 16,300 | | 779,674 |
TOTAL FINLAND | | 1,411,525 |
France - 5.4% |
Air Liquide SA | 7,282 | | 878,323 |
Bureau Veritas SA | 25,394 | | 627,858 |
Christian Dior SA | 5,000 | | 884,411 |
Dassault Systemes SA | 8,990 | | 569,712 |
Essilor International SA | 6,342 | | 700,173 |
Ingenico SA | 5,780 | | 575,618 |
L'Oreal SA | 5,000 | | 783,845 |
Pernod Ricard SA | 5,400 | | 614,648 |
Publicis Groupe SA (a) | 9,630 | | 666,989 |
Safran SA | 10,730 | | 679,038 |
Common Stocks - continued |
| Shares | | Value |
France - continued |
Sodexo SA | 6,900 | | $ 664,675 |
Zodiac Aerospace | 19,220 | | 586,122 |
TOTAL FRANCE | | 8,231,412 |
Germany - 4.4% |
Axel Springer Verlag AG | 10,430 | | 572,351 |
Bayer AG | 10,400 | | 1,478,567 |
CTS Eventim AG | 22,122 | | 583,275 |
Fresenius SE & Co. KGaA | 12,900 | | 663,599 |
Henkel AG & Co. KGaA | 8,333 | | 757,186 |
Linde AG | 4,500 | | 829,805 |
ProSiebenSat.1 Media AG | 16,290 | | 656,406 |
Symrise AG | 9,800 | | 551,104 |
Wirecard AG | 15,930 | | 570,034 |
TOTAL GERMANY | | 6,662,327 |
Hong Kong - 1.2% |
AIA Group Ltd. | 187,000 | | 1,043,539 |
Galaxy Entertainment Group Ltd. | 104,000 | | 711,141 |
TOTAL HONG KONG | | 1,754,680 |
India - 5.6% |
Amara Raja Batteries Ltd. (a) | 52,534 | | 560,516 |
Axis Bank Ltd. (a) | 87,263 | | 643,148 |
Exide Industries Ltd. | 210,669 | | 540,119 |
GlaxoSmithKline Consumer Healthcare Ltd. | 5,551 | | 499,817 |
Grasim Industries Ltd. sponsored GDR | 9,942 | | 569,975 |
HDFC Bank Ltd. | 39,382 | | 638,593 |
Housing Development Finance Corp. Ltd. | 43,324 | | 780,232 |
ICICI Bank Ltd. (a) | 24,730 | | 656,755 |
ITC Ltd. (a) | 98,334 | | 568,558 |
Larsen & Toubro Ltd. (a) | 25,821 | | 695,856 |
LIC Housing Finance Ltd. | 115,805 | | 681,946 |
Sun Pharmaceutical Industries Ltd. | 38,701 | | 532,597 |
Sun TV Ltd. | 103,907 | | 552,608 |
Titan Co. Ltd. (a) | 77,668 | | 510,199 |
TOTAL INDIA | | 8,430,919 |
Indonesia - 2.8% |
PT ACE Hardware Indonesia Tbk | 8,557,300 | | 574,347 |
PT Bank Central Asia Tbk | 554,800 | | 598,929 |
PT Bank Rakyat Indonesia Tbk | 702,000 | | 643,310 |
PT Global Mediacom Tbk | 3,732,200 | | 605,738 |
Common Stocks - continued |
| Shares | | Value |
Indonesia - continued |
PT Indocement Tunggal Prakarsa Tbk | 326,900 | | $ 647,911 |
PT Semen Gresik (Persero) Tbk | 470,600 | | 618,158 |
PT Surya Citra Media Tbk | 1,939,100 | | 542,792 |
TOTAL INDONESIA | | 4,231,185 |
Ireland - 2.4% |
Actavis PLC (a) | 2,756 | | 668,991 |
Allegion PLC | 10,900 | | 578,681 |
Jazz Pharmaceuticals PLC (a) | 3,300 | | 557,172 |
Kerry Group PLC Class A | 8,990 | | 610,495 |
Mallinckrodt PLC (a) | 6,200 | | 571,516 |
Perrigo Co. PLC | 3,700 | | 597,365 |
TOTAL IRELAND | | 3,584,220 |
Italy - 0.4% |
Azimut Holding SpA | 23,300 | | 544,258 |
Japan - 7.4% |
Astellas Pharma, Inc. | 49,500 | | 768,265 |
Daikin Industries Ltd. | 11,200 | | 700,091 |
Daito Trust Construction Co. Ltd. | 4,200 | | 523,323 |
Dentsu, Inc. | 18,060 | | 671,462 |
Fuji Heavy Industries Ltd. | 20,600 | | 685,633 |
Hoya Corp. | 20,200 | | 714,814 |
Kansai Paint Co. Ltd. | 43,000 | | 657,321 |
Keyence Corp. | 1,487 | | 720,574 |
Misumi Group, Inc. | 21,500 | | 678,408 |
Nippon Paint Holdings Co. Ltd. | 28,000 | | 635,806 |
OBIC Co. Ltd. | 15,100 | | 539,056 |
Olympus Corp. (a) | 17,100 | | 613,977 |
OMRON Corp. | 15,270 | | 722,800 |
Recruit Holdings Co. Ltd. (a) | 18,800 | | 642,557 |
SK Kaken Co. Ltd. | 7,130 | | 545,677 |
SMC Corp. | 2,200 | | 623,994 |
Suzuki Motor Corp. | 21,800 | | 730,704 |
TOTAL JAPAN | | 11,174,462 |
Kenya - 0.7% |
Kenya Commercial Bank Ltd. | 908,300 | | 558,485 |
Safaricom Ltd. | 4,219,000 | | 575,425 |
TOTAL KENYA | | 1,133,910 |
Common Stocks - continued |
| Shares | | Value |
Korea (South) - 0.8% |
Coway Co. Ltd. | 6,919 | | $ 525,472 |
NAVER Corp. | 923 | | 647,722 |
TOTAL KOREA (SOUTH) | | 1,173,194 |
Luxembourg - 0.9% |
Altice SA | 11,100 | | 691,186 |
Eurofins Scientific SA | 2,800 | | 707,554 |
TOTAL LUXEMBOURG | | 1,398,740 |
Mexico - 2.1% |
Banregio Grupo Financiero S.A.B. de CV | 85,025 | | 491,729 |
Fomento Economico Mexicano S.A.B. de CV sponsored ADR | 6,420 | | 617,861 |
Grupo Aeroportuario del Pacifico SA de CV Series B | 74,100 | | 504,152 |
Grupo Aeroportuario Norte S.A.B. de CV | 99,200 | | 494,223 |
Grupo Televisa SA de CV (CPO) sponsored ADR | 18,500 | | 668,590 |
Megacable Holdings S.A.B. de CV unit | 96,700 | | 442,991 |
TOTAL MEXICO | | 3,219,546 |
Netherlands - 0.9% |
IMCD Group BV | 21,200 | | 584,469 |
Reed Elsevier NV | 35,534 | | 817,783 |
TOTAL NETHERLANDS | | 1,402,252 |
Nigeria - 0.7% |
Dangote Cement PLC | 404,093 | | 524,479 |
Guaranty Trust Bank PLC | 3,248,238 | | 490,226 |
TOTAL NIGERIA | | 1,014,705 |
Norway - 0.8% |
Gjensidige Forsikring ASA (d) | 29,300 | | 532,139 |
Schibsted ASA (B Shares) (d) | 11,860 | | 627,556 |
TOTAL NORWAY | | 1,159,695 |
Philippines - 1.4% |
Alliance Global Group, Inc. | 1,033,900 | | 581,527 |
GT Capital Holdings, Inc. | 22,565 | | 507,023 |
SM Investments Corp. | 30,915 | | 538,714 |
SM Prime Holdings, Inc. | 1,333,300 | | 518,290 |
TOTAL PHILIPPINES | | 2,145,554 |
Russia - 0.4% |
Magnit OJSC GDR (Reg. S) | 9,595 | | 642,865 |
Common Stocks - continued |
| Shares | | Value |
South Africa - 1.5% |
Aspen Pharmacare Holdings Ltd. | 16,730 | | $ 596,772 |
Life Healthcare Group Holdings Ltd. | 153,300 | | 579,579 |
Naspers Ltd. Class N | 8,230 | | 1,024,214 |
TOTAL SOUTH AFRICA | | 2,200,565 |
Spain - 1.0% |
Amadeus IT Holding SA Class A | 19,760 | | 725,534 |
Grifols SA ADR | 20,500 | | 725,495 |
TOTAL SPAIN | | 1,451,029 |
Sweden - 2.2% |
ASSA ABLOY AB (B Shares) | 13,006 | | 688,860 |
Atlas Copco AB (A Shares) (d) | 26,000 | | 750,337 |
Elekta AB (B Shares) | 61,700 | | 631,694 |
Hexagon AB (B Shares) | 18,800 | | 632,679 |
HEXPOL AB (B Shares) | 7,200 | | 636,715 |
TOTAL SWEDEN | | 3,340,285 |
Switzerland - 4.0% |
Compagnie Financiere Richemont SA Series A | 11,614 | | 977,138 |
Givaudan SA | 370 | | 616,442 |
Nestle SA sponsored ADR | 32,900 | | 2,412,551 |
Partners Group Holding AG | 2,280 | | 606,049 |
SGS SA (Reg.) | 320 | | 702,427 |
Sika AG (Bearer) | 185 | | 659,513 |
TOTAL SWITZERLAND | | 5,974,120 |
Thailand - 0.7% |
Airports of Thailand PCL (For. Reg.) | 71,400 | | 530,381 |
Kasikornbank PCL (For. Reg.) | 80,100 | | 580,145 |
TOTAL THAILAND | | 1,110,526 |
Turkey - 0.4% |
TAV Havalimanlari Holding A/S | 70,000 | | 587,362 |
United Kingdom - 15.0% |
Aberdeen Asset Management PLC | 90,700 | | 629,703 |
Al Noor Hospitals Group PLC | 35,200 | | 573,793 |
Aon PLC | 7,000 | | 602,000 |
Ashtead Group PLC | 38,940 | | 650,332 |
Berendsen PLC | 36,700 | | 592,961 |
Berkeley Group Holdings PLC | 14,900 | | 543,450 |
British American Tobacco PLC (United Kingdom) | 23,893 | | 1,354,198 |
Bunzl PLC | 23,300 | | 631,778 |
Common Stocks - continued |
| Shares | | Value |
United Kingdom - continued |
Burberry Group PLC | 25,900 | | $ 634,327 |
Capita Group PLC | 36,500 | | 640,528 |
Compass Group PLC | 46,641 | | 750,593 |
Diageo PLC sponsored ADR | 9,766 | | 1,152,095 |
Diploma PLC | 50,490 | | 561,747 |
Elementis PLC | 143,500 | | 605,801 |
Filtrona PLC | 56,900 | | 624,872 |
Galiform PLC | 105,203 | | 576,068 |
Halma PLC | 61,200 | | 609,927 |
InterContinental Hotel Group PLC | 16,000 | | 607,762 |
Intertek Group PLC | 13,830 | | 602,211 |
ITV PLC | 194,100 | | 630,319 |
Johnson Matthey PLC | 13,338 | | 634,556 |
London Stock Exchange Group PLC | 20,463 | | 659,603 |
Persimmon PLC | 26,000 | | 608,494 |
Prudential PLC | 43,739 | | 1,012,822 |
Reckitt Benckiser Group PLC | 11,100 | | 932,225 |
Rightmove PLC | 17,130 | | 578,200 |
SABMiller PLC | 15,660 | | 883,058 |
Schroders PLC | 15,400 | | 593,959 |
St. James's Place Capital PLC | 57,119 | | 680,731 |
Standard Life PLC | 98,856 | | 622,597 |
The Restaurant Group PLC | 53,215 | | 575,891 |
Whitbread PLC | 10,319 | | 720,379 |
Zoopla Property Group PLC (d) | 161,100 | | 533,979 |
TOTAL UNITED KINGDOM | | 22,610,959 |
United States of America - 15.8% |
A.O. Smith Corp. | 10,707 | | 571,218 |
Affiliated Managers Group, Inc. (a) | 3,300 | | 659,307 |
AMETEK, Inc. | 11,300 | | 589,295 |
Amphenol Corp. Class A | 11,068 | | 559,819 |
AutoZone, Inc. (a) | 1,061 | | 587,285 |
Ball Corp. | 8,900 | | 573,427 |
Biogen Idec, Inc. (a) | 1,800 | | 577,944 |
Danaher Corp. | 7,269 | | 584,428 |
Domino's Pizza, Inc. | 5,800 | | 514,982 |
Ecolab, Inc. | 5,600 | | 622,888 |
Fidelity National Information Services, Inc. | 9,763 | | 570,062 |
Fiserv, Inc. (a) | 7,439 | | 516,862 |
Gartner, Inc. Class A (a) | 6,600 | | 532,686 |
Google, Inc. Class C (a) | 1,143 | | 639,028 |
Common Stocks - continued |
| Shares | | Value |
United States of America - continued |
Home Depot, Inc. | 5,600 | | $ 546,112 |
International Flavors & Fragrances, Inc. | 5,800 | | 575,070 |
Kansas City Southern | 4,591 | | 563,729 |
Las Vegas Sands Corp. | 11,646 | | 725,080 |
MasterCard, Inc. Class A | 7,700 | | 644,875 |
McGraw Hill Financial, Inc. | 6,904 | | 624,674 |
McKesson Corp. | 3,250 | | 661,083 |
Mettler-Toledo International, Inc. (a) | 2,500 | | 646,175 |
Moody's Corp. | 5,400 | | 535,842 |
NIKE, Inc. Class B | 5,400 | | 502,038 |
Pall Corp. | 6,500 | | 594,230 |
PPG Industries, Inc. | 3,090 | | 629,402 |
Praxair, Inc. | 4,600 | | 579,554 |
priceline.com, Inc. (a) | 553 | | 667,034 |
Roper Industries, Inc. | 3,700 | | 585,710 |
Sherwin-Williams Co. | 2,700 | | 619,812 |
The Walt Disney Co. | 6,193 | | 565,916 |
Thermo Fisher Scientific, Inc. | 4,800 | | 564,336 |
TransDigm Group, Inc. | 3,400 | | 635,902 |
Union Pacific Corp. | 5,500 | | 640,475 |
United Technologies Corp. | 5,481 | | 586,467 |
Valspar Corp. | 7,300 | | 599,768 |
Verisk Analytics, Inc. (a) | 9,000 | | 561,150 |
Visa, Inc. Class A | 2,950 | | 712,219 |
W.R. Grace & Co. (a) | 6,440 | | 609,224 |
Wyndham Worldwide Corp. | 7,600 | | 590,292 |
TOTAL UNITED STATES OF AMERICA | | 23,865,400 |
TOTAL COMMON STOCKS (Cost $134,540,345) |
148,230,121
|
Nonconvertible Preferred Stocks - 0.7% |
| | | |
Colombia - 0.3% |
Grupo Aval Acciones y Valores SA | 759,572 | | 514,995 |
Germany - 0.4% |
Sartorius AG (non-vtg.) | 5,497 | | 599,305 |
TOTAL NONCONVERTIBLE PREFERRED STOCKS (Cost $1,116,695) |
1,114,300
|
Money Market Funds - 2.5% |
| Shares | | Value |
Fidelity Cash Central Fund, 0.11% (b) | 1,565,446 | | $ 1,565,446 |
Fidelity Securities Lending Cash Central Fund, 0.11% (b)(c) | 2,149,267 | | 2,149,267 |
TOTAL MONEY MARKET FUNDS (Cost $3,714,713) |
3,714,713
|
TOTAL INVESTMENT PORTFOLIO - 101.4% (Cost $139,371,753) | | 153,059,134 |
NET OTHER ASSETS (LIABILITIES) - (1.4)% | | (2,101,414) |
NET ASSETS - 100% | $ 150,957,720 |
Legend |
(a) Non-income producing |
(b) Affiliated fund that is generally available only to investment companies and other accounts managed by Fidelity Investments. The rate quoted is the annualized seven-day yield of the fund at period end. A complete unaudited listing of the fund's holdings as of its most recent quarter end is available upon request. In addition, each Fidelity Central Fund's financial statements, which are not covered by the Fund's Report of Independent Registered Public Accounting Firm, are available on the SEC's website or upon request. |
(c) Investment made with cash collateral received from securities on loan. |
(d) Security or a portion of the security is on loan at period end. |
Affiliated Central Funds |
Information regarding fiscal year to date income earned by the Fund from investments in Fidelity Central Funds is as follows: |
Fund | Income earned |
Fidelity Cash Central Fund | $ 794 |
Fidelity Securities Lending Cash Central Fund | 26,748 |
Total | $ 27,542 |
Other Information |
Categorizations in the Schedule of Investments are based on country or territory of incorporation. |
The following is a summary of the inputs used, as of October 31, 2014, involving the Fund's assets and liabilities carried at fair value. The inputs or methodology used for valuing securities may not be an indication of the risk associated with investing in those securities. For more information on valuation inputs, and their aggregation into the levels used in the tables below, please refer to the Investment Valuation section in the accompanying Notes to Financial Statements. |
Valuation Inputs at Reporting Date: |
Description | Total | Level 1 | Level 2 | Level 3 |
Investments in Securities: | | | | |
Equities: | | | | |
Consumer Discretionary | $ 31,445,638 | $ 22,523,708 | $ 8,921,930 | $ - |
Consumer Staples | 14,147,663 | 10,551,827 | 3,595,836 | - |
Energy | 1,055,896 | 1,055,896 | - | - |
Financials | 22,974,840 | 14,146,785 | 8,828,055 | - |
Health Care | 18,410,032 | 14,199,248 | 4,210,784 | - |
Industrials | 27,198,769 | 19,628,568 | 7,570,201 | - |
Information Technology | 16,692,662 | 12,118,924 | 4,573,738 | - |
Materials | 16,843,496 | 12,525,199 | 4,318,297 | - |
Telecommunication Services | 575,425 | 575,425 | - | - |
Money Market Funds | 3,714,713 | 3,714,713 | - | - |
Total Investments in Securities: | $ 153,059,134 | $ 111,040,293 | $ 42,018,841 | $ - |
The following is a summary of transfers between Level 1 and Level 2 for the period ended October 31, 2014. Transfers are assumed to have occurred at the beginning of the period, and are primarily attributable to the valuation techniques used for foreign equity securities, as discussed in the accompanying Notes to Financial Statements: |
Transfers | Total |
Level 1 to Level 2 | $ 11,921,613 |
Level 2 to Level 1 | $ 0 |
See accompanying notes which are an integral part of the financial statements.
Annual Report
Statement of Assets and Liabilities
| October 31, 2014 |
| | |
Assets | | |
Investment in securities, at value (including securities loaned of $2,059,178) - See accompanying schedule: Unaffiliated issuers (cost $135,657,040) | $ 149,344,421 | |
Fidelity Central Funds (cost $3,714,713) | 3,714,713 | |
Total Investments (cost $139,371,753) | | $ 153,059,134 |
Foreign currency held at value (cost $89,040) | | 89,040 |
Receivable for investments sold | | 2,564,924 |
Receivable for fund shares sold | | 178,375 |
Dividends receivable | | 189,885 |
Distributions receivable from Fidelity Central Funds | | 832 |
Prepaid expenses | | 407 |
Receivable from investment adviser for expense reductions | | 38,473 |
Other receivables | | 227,531 |
Total assets | | 156,348,601 |
| | |
Liabilities | | |
Payable for investments purchased | $ 2,620,328 | |
Unrealized depreciation on foreign currency contracts | 772 | |
Payable for fund shares redeemed | 194,602 | |
Accrued management fee | 106,502 | |
Distribution and service plan fees payable | 51,773 | |
Other affiliated payables | 38,045 | |
Other payables and accrued expenses | 229,592 | |
Collateral on securities loaned, at value | 2,149,267 | |
Total liabilities | | 5,390,881 |
| | |
Net Assets | | $ 150,957,720 |
Net Assets consist of: | | |
Paid in capital | | $ 206,522,161 |
Undistributed net investment income | | 157,952 |
Accumulated undistributed net realized gain (loss) on investments and foreign currency transactions | | (69,220,288) |
Net unrealized appreciation (depreciation) on investments and assets and liabilities in foreign currencies | | 13,497,895 |
Net Assets | | $ 150,957,720 |
See accompanying notes which are an integral part of the financial statements.
Annual Report
Financial Statements - continued
Statement of Assets and Liabilities - continued
| October 31, 2014 |
| | |
Calculation of Maximum Offering Price Class A:
Net Asset Value and redemption price per share ($51,567,048 ÷ 3,492,183 shares) | | $ 14.77 |
| | |
Maximum offering price per share (100/94.25 of $14.77) | | $ 15.67 |
Class T:
Net Asset Value and redemption price per share ($58,454,176 ÷ 4,040,004 shares) | | $ 14.47 |
| | |
Maximum offering price per share (100/96.50 of $14.47) | | $ 14.99 |
Class B:
Net Asset Value and offering price per share ($1,577,039 ÷ 117,876 shares)A | | $ 13.38 |
| | |
Class C:
Net Asset Value and offering price per share ($20,910,335 ÷ 1,568,930 shares)A | | $ 13.33 |
| | |
Institutional Class:
Net Asset Value, offering price and redemption price per share ($18,449,122 ÷ 1,171,354 shares) | | $ 15.75 |
A Redemption price per share is equal to net asset value less any applicable contingent deferred sales charge.
See accompanying notes which are an integral part of the financial statements.
Annual Report
Statement of Operations
| Year ended October 31, 2014 |
| | |
Investment Income | | |
Dividends | | $ 2,857,116 |
Income from Fidelity Central Funds | | 27,542 |
Income before foreign taxes withheld | | 2,884,658 |
Less foreign taxes withheld | | (200,663) |
Total income | | 2,683,995 |
| | |
Expenses | | |
Management fee
Basic fee | $ 1,008,061 | |
Performance adjustment | 262,396 | |
Transfer agent fees | 375,894 | |
Distribution and service plan fees | 651,528 | |
Accounting and security lending fees | 74,843 | |
Custodian fees and expenses | 227,831 | |
Independent trustees' compensation | 588 | |
Registration fees | 64,507 | |
Audit | 79,131 | |
Legal | 619 | |
Miscellaneous | 1,262 | |
Total expenses before reductions | 2,746,660 | |
Expense reductions | (376,204) | 2,370,456 |
Net investment income (loss) | | 313,539 |
Realized and Unrealized Gain (Loss) Net realized gain (loss) on: | | |
Investment securities: | | |
Unaffiliated issuers (net of foreign taxes of $95,019) | 17,479,071 | |
Foreign currency transactions | (81,172) | |
Total net realized gain (loss) | | 17,397,899 |
Change in net unrealized appreciation (depreciation) on: Investment securities (net of decrease in deferred foreign taxes of $37,720) | (9,394,720) | |
Assets and liabilities in foreign currencies | (120) | |
Total change in net unrealized appreciation (depreciation) | | (9,394,840) |
Net gain (loss) | | 8,003,059 |
Net increase (decrease) in net assets resulting from operations | | $ 8,316,598 |
See accompanying notes which are an integral part of the financial statements.
Annual Report
Financial Statements - continued
Statement of Changes in Net Assets
| Year ended
October 31,
2014 | Year ended
October 31,
2013 |
Increase (Decrease) in Net Assets | | |
Operations | | |
Net investment income (loss) | $ 313,539 | $ 465,401 |
Net realized gain (loss) | 17,397,899 | 18,319,822 |
Change in net unrealized appreciation (depreciation) | (9,394,840) | 9,778,382 |
Net increase (decrease) in net assets resulting
from operations | 8,316,598 | 28,563,605 |
Distributions to shareholders from net investment income | (450,291) | (589,021) |
Share transactions - net increase (decrease) | 1,810,485 | (6,558,856) |
Redemption fees | 1,603 | 1,022 |
Total increase (decrease) in net assets | 9,678,395 | 21,416,750 |
| | |
Net Assets | | |
Beginning of period | 141,279,325 | 119,862,575 |
End of period (including undistributed net investment income of $157,952 and undistributed net investment income of $430,763, respectively) | $ 150,957,720 | $ 141,279,325 |
See accompanying notes which are an integral part of the financial statements.
Annual Report
Financial Highlights - Class A
Years ended October 31, | 2014 | 2013 | 2012 | 2011 | 2010 |
Selected Per-Share Data | | | | | |
Net asset value, beginning of period | $ 13.96 | $ 11.25 | $ 10.21 | $ 10.85 | $ 9.34 |
Income from Investment Operations | | | | | |
Net investment income (loss) C | .06 | .07 | .08 | .08F | .06 |
Net realized and unrealized gain (loss) | .82 | 2.73 | 1.05 | (.53) | 1.69 |
Total from investment operations | .88 | 2.80 | 1.13 | (.45) | 1.75 |
Distributions from net investment income | (.07) | (.09) | (.09) | (.08) | (.08) |
Distributions from net realized gain | - | - | (.01) | (.12) | (.16) |
Total distributions | (.07) | (.09) | (.09) I | (.19) J | (.24) |
Redemption fees added to paid in capital C,H | - | - | - | - | - |
Net asset value, end of period | $ 14.77 | $ 13.96 | $ 11.25 | $ 10.21 | $ 10.85 |
Total ReturnA, B | 6.31% | 24.99% | 11.19% | (4.25)% | 18.98% |
Ratios to Average Net Assets D, G | | | | | |
Expenses before reductions | 1.73% | 1.74% | 1.78% | 1.64% | 1.45% |
Expenses net of fee waivers, if any | 1.45% | 1.45% | 1.45% | 1.45% | 1.45% |
Expenses net of all reductions | 1.44% | 1.39% | 1.41% | 1.38% | 1.27% |
Net investment income (loss) | .42% | .58% | .73% | .74% F | .66% |
Supplemental Data | | | | | |
Net assets, end of period (000 omitted) | $ 51,567 | $ 49,797 | $ 40,624 | $ 40,364 | $ 49,058 |
Portfolio turnover rateE | 197% | 138% | 142% | 254% | 490% |
A Total returns would have been lower if certain expenses had not been reduced during the applicable periods shown.
B Total returns do not include the effect of the sales charges.
C Calculated based on average shares outstanding during the period.
D Fees and expenses of any underlying Fidelity Central Funds are not included in the Fund's expense ratio. The Fund indirectly bears its proportionate share of the expenses of any underlying Fidelity Central Funds.
E Amount does not include the portfolio activity of any underlying Fidelity Central Funds.
F Investment income per share reflects a large, non-recurring dividend which amounted to $.03 per share. Excluding this non-recurring dividend, the ratio of net investment income (loss) to average net assets would have been .49%.
G Expense ratios reflect operating expenses of the class. Expenses before reductions do not reflect amounts reimbursed by the investment adviser or reductions from brokerage service arrangements or reductions from other expense offset arrangements and do not represent the amount paid by the class during periods when reimbursements or reductions occur. Expenses net of fee waivers reflect expenses after reimbursement by the investment adviser but prior to reductions from brokerage service arrangements or other expense offset arrangements. Expenses net of all reductions represent the net expenses paid by the class.
H Amount represents less than $.01 per share.
I Total distributions of $.09 per share is comprised of distributions from net investment income of $.085 and distributions from net realized gain of $.005 per share.
J Total distributions of $.19 per share is comprised of distributions from net investment income of $.077 and distributions from net realized gain of $.116 per share.
See accompanying notes which are an integral part of the financial statements.
Annual Report
Financial Highlights - Class T
Years ended October 31, | 2014 | 2013 | 2012 | 2011 | 2010 |
Selected Per-Share Data | | | | | |
Net asset value, beginning of period | $ 13.68 | $ 11.03 | $ 10.00 | $ 10.63 | $ 9.16 |
Income from Investment Operations | | | | | |
Net investment income (loss) C | .02 | .04 | .05 | .05F | .04 |
Net realized and unrealized gain (loss) | .81 | 2.66 | 1.04 | (.52) | 1.65 |
Total from investment operations | .83 | 2.70 | 1.09 | (.47) | 1.69 |
Distributions from net investment income | (.04) | (.05) | (.06) | (.05) | (.06) |
Distributions from net realized gain | - | - | (.01) | (.12) | (.16) |
Total distributions | (.04) | (.05) | (.06) I | (.16) J | (.22) |
Redemption fees added to paid in capital C,H | - | - | - | - | - |
Net asset value, end of period | $ 14.47 | $ 13.68 | $ 11.03 | $ 10.00 | $ 10.63 |
Total ReturnA, B | 6.07% | 24.57% | 10.99% | (4.51)% | 18.65% |
Ratios to Average Net Assets D, G | | | | | |
Expenses before reductions | 1.94% | 1.96% | 2.03% | 1.88% | 1.69% |
Expenses net of fee waivers, if any | 1.70% | 1.70% | 1.70% | 1.70% | 1.69% |
Expenses net of all reductions | 1.69% | 1.64% | 1.66% | 1.62% | 1.51% |
Net investment income (loss) | .17% | .33% | .48% | .49% F | .42% |
Supplemental Data | | | | | |
Net assets, end of period (000 omitted) | $ 58,454 | $ 60,152 | $ 53,835 | $ 59,914 | $ 74,056 |
Portfolio turnover rateE | 197% | 138% | 142% | 254% | 490% |
A Total returns would have been lower if certain expenses had not been reduced during the applicable periods shown.
B Total returns do not include the effect of the sales charges.
C Calculated based on average shares outstanding during the period.
D Fees and expenses of any underlying Fidelity Central Funds are not included in the Fund's expense ratio. The Fund indirectly bears its proportionate share of the expenses of any underlying Fidelity Central Funds.
E Amount does not include the portfolio activity of any underlying Fidelity Central Funds.
F Investment income per share reflects a large, non-recurring dividend which amounted to $.03 per share. Excluding this non-recurring dividend, the ratio of net investment income (loss) to average net assets would have been .24%.
G Expense ratios reflect operating expenses of the class. Expenses before reductions do not reflect amounts reimbursed by the investment adviser or reductions from brokerage service arrangements or reductions from other expense offset arrangements and do not represent the amount paid by the class during periods when reimbursements or reductions occur. Expenses net of fee waivers reflect expenses after reimbursement by the investment adviser but prior to reductions from brokerage service arrangements or other expense offset arrangements. Expenses net of all reductions represent the net expenses paid by the class.
H Amount represents less than $.01 per share.
I Total distributions of $.06 per share is comprised of distributions from net investment income of $.056 and distributions from net realized gain of $.005 per share.
J Total distributions of $.16 per share is comprised of distributions from net investment income of $.047 and distributions from net realized gain of $.116 per share.
See accompanying notes which are an integral part of the financial statements.
Annual Report
Financial Highlights - Class B
Years ended October 31, | 2014 | 2013 | 2012 | 2011 | 2010 |
Selected Per-Share Data | | | | | |
Net asset value, beginning of period | $ 12.68 | $ 10.22 | $ 9.26 | $ 9.84 | $ 8.51 |
Income from Investment Operations | | | | | |
Net investment income (loss) C | (.04) | (.02) | - H | - F, H | (.01) |
Net realized and unrealized gain (loss) | .74 | 2.48 | .96 | (.48) | 1.53 |
Total from investment operations | .70 | 2.46 | .96 | (.48) | 1.52 |
Distributions from net investment income | - | - | - | (.01) | (.03) |
Distributions from net realized gain | - | - | - | (.09) | (.16) |
Total distributions | - | - | - | (.10) | (.19) |
Redemption fees added to paid in capital C,H | - | - | - | - | - |
Net asset value, end of period | $ 13.38 | $ 12.68 | $ 10.22 | $ 9.26 | $ 9.84 |
Total ReturnA, B | 5.52% | 24.07% | 10.37% | (4.99)% | 18.03% |
Ratios to Average Net Assets D, G | | | | | |
Expenses before reductions | 2.50% | 2.51% | 2.54% | 2.39% | 2.20% |
Expenses net of fee waivers, if any | 2.20% | 2.20% | 2.20% | 2.20% | 2.20% |
Expenses net of all reductions | 2.19% | 2.15% | 2.16% | 2.13% | 2.02% |
Net investment income (loss) | (.33)% | (.17)% | (.02)% | (.01)% F | (.09)% |
Supplemental Data | | | | | |
Net assets, end of period (000 omitted) | $ 1,577 | $ 2,228 | $ 2,745 | $ 4,241 | $ 8,737 |
Portfolio turnover rateE | 197% | 138% | 142% | 254% | 490% |
A Total returns would have been lower if certain expenses had not been reduced during the applicable periods shown.
B Total returns do not include the effect of the contingent deferred sales charge.
C Calculated based on average shares outstanding during the period.
D Fees and expenses of any underlying Fidelity Central Funds are not included in the Fund's expense ratio. The Fund indirectly bears its proportionate share of the expenses of any underlying Fidelity Central Funds.
E Amount does not include the portfolio activity of any underlying Fidelity Central Funds.
F Investment income per share reflects a large, non-recurring dividend which amounted to $.03 per share. Excluding this non-recurring dividend, the ratio of net investment income (loss) to average net assets would have been (.26) %.
G Expense ratios reflect operating expenses of the class. Expenses before reductions do not reflect amounts reimbursed by the investment adviser or reductions from brokerage service arrangements or reductions from other expense offset arrangements and do not represent the amount paid by the class during periods when reimbursements or reductions occur. Expenses net of fee waivers reflect expenses after reimbursement by the investment adviser but prior to reductions from brokerage service arrangements or other expense offset arrangements. Expenses net of all reductions represent the net expenses paid by the class.
H Amount represents less than $.01 per share.
See accompanying notes which are an integral part of the financial statements.
Annual Report
Financial Highlights - Class C
Years ended October 31, | 2014 | 2013 | 2012 | 2011 | 2010 |
Selected Per-Share Data | | | | | |
Net asset value, beginning of period | $ 12.63 | $ 10.18 | $ 9.23 | $ 9.84 | $ 8.51 |
Income from Investment Operations | | | | | |
Net investment income (loss) C | (.04) | (.02) | - H | - F, H | (.01) |
Net realized and unrealized gain (loss) | .74 | 2.47 | .96 | (.49) | 1.53 |
Total from investment operations | .70 | 2.45 | .96 | (.49) | 1.52 |
Distributions from net investment income | - | - | (.01) | (.01) | (.04) |
Distributions from net realized gain | - | - | (.01) | (.11) | (.16) |
Total distributions | - | - | (.01) I | (.12) | (.19) J |
Redemption fees added to paid in capital C,H | - | - | - | - | - |
Net asset value, end of period | $ 13.33 | $ 12.63 | $ 10.18 | $ 9.23 | $ 9.84 |
Total ReturnA, B | 5.54% | 24.07% | 10.41% | (5.07)% | 18.12% |
Ratios to Average Net Assets D, G | | | | | |
Expenses before reductions | 2.47% | 2.49% | 2.53% | 2.39% | 2.20% |
Expenses net of fee waivers, if any | 2.20% | 2.20% | 2.20% | 2.20% | 2.20% |
Expenses net of all reductions | 2.19% | 2.14% | 2.16% | 2.13% | 2.02% |
Net investment income (loss) | (.33)% | (.17)% | (.02)% | (.01)% F | (.09)% |
Supplemental Data | | | | | |
Net assets, end of period (000 omitted) | $ 20,910 | $ 21,334 | $ 18,090 | $ 19,619 | $ 24,809 |
Portfolio turnover rateE | 197% | 138% | 142% | 254% | 490% |
A Total returns would have been lower if certain expenses had not been reduced during the applicable periods shown.
B Total returns do not include the effect of the contingent deferred sales charge.
C Calculated based on average shares outstanding during the period.
D Fees and expenses of any underlying Fidelity Central Funds are not included in the Fund's expense ratio. The Fund indirectly bears its proportionate share of the expenses of any underlying Fidelity Central Funds.
E Amount does not include the portfolio activity of any underlying Fidelity Central Funds.
F Investment income per share reflects a large, non-recurring dividend which amounted to $.03 per share. Excluding this non-recurring dividend, the ratio of net investment income (loss) to average net assets would have been (.26) %.
G Expense ratios reflect operating expenses of the class. Expenses before reductions do not reflect amounts reimbursed by the investment adviser or reductions from brokerage service arrangements or reductions from other expense offset arrangements and do not represent the amount paid by the class during periods when reimbursements or reductions occur. Expenses net of fee waivers reflect expenses after reimbursement by the investment adviser but prior to reductions from brokerage service arrangements or other expense offset arrangements. Expenses net of all reductions represent the net expenses paid by the class.
H Amount represents less than $.01 per share.
I Total distributions of $.01 per share is comprised of distributions from net investment income of $.005 and distributions from net realized gain of $.005 per share.
J Total distributions of $.19 per share is comprised of distributions from net investment income of $.037 and distributions from net realized gain of $.155 per share.
See accompanying notes which are an integral part of the financial statements.
Annual Report
Financial Highlights - Institutional Class
Years ended October 31, | 2014 | 2013 | 2012 | 2011 | 2010 |
Selected Per-Share Data | | | | | |
Net asset value, beginning of period | $ 14.87 | $ 11.99 | $ 10.87 | $ 11.54 | $ 9.91 |
Income from Investment Operations | | | | | |
Net investment income (loss) B | .10 | .11 | .11 | .12E | .10 |
Net realized and unrealized gain (loss) | .87 | 2.89 | 1.13 | (.57) | 1.78 |
Total from investment operations | .97 | 3.00 | 1.24 | (.45) | 1.88 |
Distributions from net investment income | (.09) | (.12) | (.12) | (.11) | (.09) |
Distributions from net realized gain | - | - | (.01) | (.12) | (.16) |
Total distributions | (.09) | (.12) | (.12) H | (.22) I | (.25) |
Redemption fees added to paid in capital B, G | - | - | - | - | - |
Net asset value, end of period | $ 15.75 | $ 14.87 | $ 11.99 | $ 10.87 | $ 11.54 |
Total ReturnA | 6.58% | 25.20% | 11.56% | (4.01)% | 19.22% |
Ratios to Average Net Assets C, F | | | | | |
Expenses before reductions | 1.38% | 1.39% | 1.48% | 1.35% | 1.19% |
Expenses net of fee waivers, if any | 1.20% | 1.20% | 1.20% | 1.20% | 1.19% |
Expenses net of all reductions | 1.20% | 1.14% | 1.16% | 1.12% | 1.01% |
Net investment income (loss) | .67% | .83% | .98% | 1.00% E | .93% |
Supplemental Data | | | | | |
Net assets, end of period (000 omitted) | $ 18,449 | $ 7,768 | $ 4,568 | $ 4,335 | $ 4,345 |
Portfolio turnover rateD | 197% | 138% | 142% | 254% | 490% |
A Total returns would have been lower if certain expenses had not been reduced during the applicable periods shown.
B Calculated based on average shares outstanding during the period.
C Fees and expenses of any underlying Fidelity Central Funds are not included in the Fund's expense ratio. The Fund indirectly bears its proportionate share of the expenses of any underlying Fidelity Central Funds.
D Amount does not include the portfolio activity of any underlying Fidelity Central Funds.
E Investment income per share reflects a large, non-recurring dividend which amounted to $.03 per share. Excluding this non-recurring dividend, the ratio of net investment income (loss) to average net assets would have been .74%.
F Expense ratios reflect operating expenses of the class. Expenses before reductions do not reflect amounts reimbursed by the investment adviser or reductions from brokerage service arrangements or reductions from other expense offset arrangements and do not represent the amount paid by the class during periods when reimbursements or reductions occur. Expenses net of fee waivers reflect expenses after reimbursement by the investment adviser but prior to reductions from brokerage service arrangements or other expense offset arrangements. Expenses net of all reductions represent the net expenses paid by the class.
G Amount represents less than $.01 per share.
H Total distributions of $.12 per share is comprised of distributions from net investment income of $.115 and distributions from net realized gain of $.005 per share.
I Total distributions of $.22 per share is comprised of distributions from net investment income of $.107 and distributions from net realized gain of $.116 per share.
See accompanying notes which are an integral part of the financial statements.
Annual Report
Notes to Financial Statements
For the period ended October 31, 2014
1. Organization.
Fidelity Advisor International Capital Appreciation Fund (the Fund) is a fund of Fidelity Advisor Series VIII (the Trust) and is authorized to issue an unlimited number of shares. The Trust is registered under the Investment Company Act of 1940, as amended (the 1940 Act), as an open-end management investment company organized as a Massachusetts business trust. The Fund offers Class A, Class T, Class C and Institutional Class shares, each of which, along with Class B shares, has equal rights as to assets and voting privileges. Class B shares are closed to new accounts and additional purchases, except for exchanges and reinvestments. Each class has exclusive voting rights with respect to matters that affect that class. Class B shares will automatically convert to Class A shares after a holding period of seven years from the initial date of purchase. The Fund's investments in emerging markets can be subject to social, economic, regulatory, and political uncertainties and can be extremely volatile.
2. Investments in Fidelity Central Funds.
The Fund invests in Fidelity Central Funds, which are open-end investment companies generally available only to other investment companies and accounts managed by the investment adviser and its affiliates. The Fund's Schedule of Investments lists each of the Fidelity Central Funds held as of period end, if any, as an investment of the Fund, but does not include the underlying holdings of each Fidelity Central Fund. As an Investing Fund, the Fund indirectly bears its proportionate share of the expenses of the underlying Fidelity Central Funds.
The Money Market Central Funds seek preservation of capital and current income and are managed by Fidelity Investments Money Management, Inc. (FIMM), an affiliate of the investment adviser. Annualized expenses of the Money Market Central Funds as of their most recent shareholder report date are less than .01%.
A complete unaudited list of holdings for each Fidelity Central Fund is available upon request or at the Securities and Exchange Commission (the SEC) website at www.sec.gov. In addition, the financial statements of the Fidelity Central Funds, which are not covered by the Fund's Report of Independent Registered Public Accounting Firm, are available on the SEC website or upon request.
3. Significant Accounting Policies.
The financial statements have been prepared in conformity with accounting principles generally accepted in the United States of America (GAAP), which require management to make certain estimates and assumptions at the date of the financial statements. Actual results could differ from those estimates. Subsequent events, if any, through the date that the financial statements were issued have been evaluated in the preparation of
Annual Report
3. Significant Accounting Policies - continued
the financial statements. The following summarizes the significant accounting policies of the Fund:
Investment Valuation. Investments are valued as of 4:00 p.m. Eastern time on the last calendar day of the period. In accordance with valuation policies and procedures approved by the Board of Trustees (the Board), the Fund attempts to obtain prices from one or more third party pricing vendors or brokers to value its investments. When current market prices, quotations or currency exchange rates are not readily available or reliable, investments will be fair valued in good faith by the Fidelity Management & Research Company (FMR) Fair Value Committee (the Committee), in accordance with procedures adopted by the Board. Factors used in determining fair value vary by investment type and may include market or investment specific events. The frequency with which these procedures are used cannot be predicted and they may be utilized to a significant extent. The Committee oversees the Fund's valuation policies and procedures and is responsible for approving and reporting to the Board all fair value determinations.
The Fund categorizes the inputs to valuation techniques used to value its investments into a disclosure hierarchy consisting of three levels as shown below:
Level 1 - quoted prices in active markets for identical investments
Level 2 - other significant observable inputs (including quoted prices for similar investments, interest rates, prepayment speeds, etc.)
Level 3 - unobservable inputs (including the Fund's own assumptions based on the best information available)
Valuation techniques used to value the Fund's investments by major category are as follows:
Equity securities, including restricted securities, for which market quotations are readily available, are valued at the last reported sale price or official closing price as reported by a third party pricing vendor on the primary market or exchange on which they are traded and are categorized as Level 1 in the hierarchy. In the event there were no sales during the day or closing prices are not available, securities are valued at the last quoted bid price or may be valued using the last available price and are generally categorized as Level 2 in the hierarchy. For foreign equity securities, when market or security specific events arise, comparisons to the valuation of American Depositary Receipts (ADRs), futures contracts, Exchange-Traded Funds (ETFs) and certain indexes as well as quoted prices for similar securities may be used and would be categorized as Level 2 in the hierarchy. Utilizing these techniques may result in transfers between Level 1 and Level 2. For equity securities, including restricted securities, where observable inputs are
Annual Report
Notes to Financial Statements - continued
3. Significant Accounting Policies - continued
Investment Valuation - continued
limited, assumptions about market activity and risk are used and these securities may be categorized as Level 3 in the hierarchy.
Investments in open-end mutual funds, including the Fidelity Central Funds, are valued at their closing net asset value (NAV) each business day and are categorized as Level 1 in the hierarchy.
Changes in valuation techniques may result in transfers in or out of an assigned level within the disclosure hierarchy. The aggregate value of investments by input level, as of October 31, 2014, including information on transfers between Levels 1 and 2 is included at the end of the Fund's Schedule of Investments.
Foreign Currency. The Fund may use foreign currency contracts to facilitate transactions in foreign-denominated securities. Gains and losses from these transactions may arise from changes in the value of the foreign currency or if the counterparties do not perform under the contracts' terms.
Foreign-denominated assets, including investment securities, and liabilities are translated into U.S. dollars at the exchange rates at period end. Purchases and sales of investment securities, income and dividends received and expenses denominated in foreign currencies are translated into U.S. dollars at the exchange rate in effect on the transaction date.
The effects of exchange rate fluctuations on investments are included with the net realized and unrealized gain (loss) on investment securities. Other foreign currency transactions resulting in realized and unrealized gain (loss) are disclosed separately.
Investment Transactions and Income. For financial reporting purposes, the Fund's investment holdings and NAV include trades executed through the end of the last business day of the period. The NAV per share for processing shareholder transactions is calculated as of the close of business of the New York Stock Exchange (NYSE), normally 4:00 p.m. Eastern time and includes trades executed through the end of the prior business day. Gains and losses on securities sold are determined on the basis of identified cost and may include proceeds received from litigation. Dividend income is recorded on the ex-dividend date, except for certain dividends from foreign securities where the ex-dividend date may have passed, which are recorded as soon as the Fund is informed of the ex-dividend date. Non-cash dividends included in dividend income, if any, are recorded at the fair market value of the securities received. Income and capital gain distributions from Fidelity Central Funds, if any, are recorded on the ex-dividend date. Distributions received on securities that represent a return of capital or capital gain are recorded as a reduction of cost of investments and/or as a realized gain. Subsequent to
Annual Report
3. Significant Accounting Policies - continued
Investment Transactions and Income - continued
ex-dividend date the Fund determines the components of these distributions, based upon receipt of tax filings or other correspondence relating to the underlying investment. Investment income is recorded net of foreign taxes withheld where recovery of such taxes is uncertain.
Class Allocations and Expenses. Investment income, realized and unrealized capital gains and losses, common expenses of the Fund, and certain fund-level expense reductions, if any, are allocated daily on a pro-rata basis to each class based on the relative net assets of each class to the total net assets of the Fund. Each class differs with respect to transfer agent and distribution and service plan fees incurred. Certain expense reductions may also differ by class. For the reporting period, the allocated portion of income and expenses to each class as a percent of its average net assets may vary due to the timing of recording these transactions in relation to fluctuating net assets of the classes. Expenses directly attributable to a fund are charged to that fund. Expenses attributable to more than one fund are allocated among the respective funds on the basis of relative net assets or other appropriate methods. Expense estimates are accrued in the period to which they relate and adjustments are made when actual amounts are known.
Income Tax Information and Distributions to Shareholders. Each year, the Fund intends to qualify as a regulated investment company under Subchapter M of the Internal Revenue Code, including distributing substantially all of its taxable income and realized gains. As a result, no provision for U.S. Federal income taxes is required. As of October 31, 2014, the Fund did not have any unrecognized tax benefits in the financial statements; nor is the Fund aware of any tax positions for which it is reasonably possible that the total amounts of unrecognized tax benefits will significantly change in the next twelve months. The Fund files a U.S. federal tax return, in addition to state and local tax returns as required. The Fund's federal income tax returns are subject to examination by the Internal Revenue Service (IRS) for a period of three fiscal years after they are filed. State and local tax returns may be subject to examination for an additional fiscal year depending on the jurisdiction. Foreign taxes are provided for based on the Fund's understanding of the tax rules and rates that exist in the foreign markets in which it invests. The Fund is subject to a tax imposed on capital gains by certain countries in which it invests. An estimated deferred tax liability for net unrealized appreciation on the applicable securities is included in Other payables and accrued expenses on the Statement of Assets & Liabilities.
Distributions are declared and recorded on the ex-dividend date. Income dividends and capital gain distributions are declared separately for each class. Income and capital gain distributions are determined in accordance with income tax regulations, which may differ from GAAP.
Annual Report
Notes to Financial Statements - continued
3. Significant Accounting Policies - continued
Income Tax Information and Distributions to Shareholders - continued
Capital accounts within the financial statements are adjusted for permanent book-tax differences. These adjustments have no impact on net assets or the results of operations. Capital accounts are not adjusted for temporary book-tax differences which will reverse in a subsequent period.
Book-tax differences are primarily due to foreign currency transactions, certain foreign taxes, passive foreign investment companies (PFIC), partnerships, capital loss carryforwards and losses deferred due to wash sales.
The federal tax cost of investment securities and unrealized appreciation (depreciation) as of period end were as follows:
Gross unrealized appreciation | $ 16,855,011 |
Gross unrealized depreciation | (3,597,611) |
Net unrealized appreciation (depreciation) on securities | $ 13,257,400 |
| |
Tax Cost | $ 139,801,734 |
The tax-based components of distributable earnings as of period end were as follows:
Undistributed ordinary income | $ 161,594 |
Capital loss carryforward | $ (68,790,306) |
Net unrealized appreciation (depreciation) on securities and other investments | $ 13,155,342 |
Capital loss carryforwards are only available to offset future capital gains of the Fund to the extent provided by regulations and may be limited. Under the Regulated Investment Company Modernization Act of 2010 (the Act), the Fund is permitted to carry forward capital losses incurred in taxable years beginning after December 22, 2010 for an unlimited period and such capital losses are required to be used prior to any losses that expire. The capital loss carryforward information presented below, including any applicable limitation, is estimated as of fiscal period end and is subject to adjustment.
Fiscal year of expiration | |
2016 | $ (44,822,434) |
2017 | (23,967,872) |
Total capital loss carryforward | $ (68,790,306) |
The tax character of distributions paid was as follows:
| October 31, 2014 | October 31, 2013 |
Ordinary Income | $ 450,291 | $ 589,021 |
Annual Report
3. Significant Accounting Policies - continued
Short-Term Trading (Redemption) Fees. During the period, shares held by investors in the Fund less than 30 days may have been subject to a redemption fee equal to 1.00% of the NAV of shares redeemed. All redemption fees, which reduce the proceeds of the shareholder redemption, are retained by the Fund and accounted for as an addition to paid in capital.
New Accounting Pronouncement. In June 2014, the Financial Accounting Standards Board issued Accounting Standard Update No. 2014-11, Repurchase-to-Maturity Transactions, Repurchase Financings, and Disclosures. The Update amends the accounting for certain repurchase agreements and expands disclosure requirements for reverse repurchase agreements, securities lending and other similar transactions. The disclosure requirements are effective for annual and interim reporting periods beginning after December 15, 2014. Management is currently evaluating the impact of the Update on the Fund's financial statements and related disclosures.
4. Purchases and Sales of Investments.
Purchases and sales of securities, other than short-term securities, aggregated $284,334,736 and $283,544,326, respectively.
5. Fees and Other Transactions with Affiliates.
Management Fee. Fidelity Management & Research Company (the investment adviser) and its affiliates provide the Fund with investment management related services for which the Fund pays a monthly management fee. The management fee is the sum of an individual fund fee rate that is based on an annual rate of .45% of the Fund's average net assets and an annualized group fee rate that averaged .25% during the period. The group fee rate is based upon the average net assets of all the mutual funds advised by the investment adviser, including any mutual funds previously advised by the investment adviser that are currently advised by Fidelity SelectCo, LLC, an affiliate of the investment adviser. The group fee rate decreases as assets under management increase and increases as assets under management decrease. In addition, the management fee is subject to a performance adjustment (up to a maximum of ± .20% of the Fund's average net assets over a 36 month performance period). The upward or downward adjustment to the management fee is based on the relative investment performance of the Institutional Class of the Fund as compared to its benchmark index, the MSCI All Country World ex USA Index, over the same 36 month performance period. For the reporting period, the total annual management fee rate, including the performance adjustment, was .88% of the Fund's average net assets. The performance adjustment included in the management fee rate may be higher or lower than the maximum performance adjustment rate due to the difference between the average net assets for the reporting and performance periods.
Annual Report
Notes to Financial Statements - continued
5. Fees and Other Transactions with Affiliates - continued
Distribution and Service Plan Fees. In accordance with Rule 12b-1 of the 1940 Act, the Fund has adopted separate Distribution and Service Plans for each class of shares. Certain classes pay Fidelity Distributors Corporation (FDC), an affiliate of the investment adviser, separate Distribution and Service Fees, each of which is based on an annual percentage of each class' average net assets. In addition, FDC may pay financial intermediaries for selling shares of the Fund and providing shareholder support services. For the period, the Distribution and Service Fee rates, total fees and amounts retained by FDC were as follows:
| Distribution
Fee | Service
Fee | Total Fees | Retained
by FDC |
Class A | -% | .25% | $ 128,903 | $ 1,848 |
Class T | .25% | .25% | 295,198 | 1,314 |
Class B | .75% | .25% | 19,143 | 14,497 |
Class C | .75% | .25% | 208,284 | 12,266 |
| | | $ 651,528 | $ 29,925 |
Sales Load. FDC may receive a front-end sales charge of up to 5.75% for selling Class A shares and 3.50% for selling Class T shares, some of which is paid to financial intermediaries for selling shares of the Fund. Depending on the holding period, FDC may receive contingent deferred sales charges levied on Class A, Class T, Class B and Class C redemptions. The deferred sales charges range from 5.00% to 1.00% for Class B shares, 1.00% for Class C shares, 1.00% for certain purchases of Class A shares and .25% for certain purchases of Class T shares.
For the period, sales charge amounts retained by FDC were as follows:
| Retained
by FDC |
Class A | $ 11,032 |
Class T | 4,460 |
Class B* | 925 |
Class C* | 624 |
| $ 17,041 |
* When Class B and Class C shares are initially sold, FDC pays commissions from its own resources to financial intermediaries through which the sales are made.
Transfer Agent Fees. Fidelity Investments Institutional Operations Company, Inc., (FIIOC), an affiliate of the investment adviser, is the transfer, dividend disbursing and shareholder servicing agent for each class of the Fund. FIIOC receives account fees and asset-based fees that vary according to the account size and type of account of the shareholders of the respective classes of the Fund. FIIOC pays for typesetting, printing and mailing of shareholder reports, except proxy statements.
Annual Report
5. Fees and Other Transactions with Affiliates - continued
Transfer Agent Fees - continued
For the period, transfer agent fees for each class were as follows:
| Amount | % of
Class-Level Average
Net Assets |
Class A | $ 145,961 | .28 |
Class T | 146,337 | .25 |
Class B | 5,821 | .30 |
Class C | 57,949 | .28 |
Institutional Class | 19,826 | .19 |
| $ 375,894 | |
Accounting and Security Lending Fees. Fidelity Service Company, Inc. (FSC), an affiliate of the investment adviser, maintains the Fund's accounting records. The accounting fee is based on the level of average net assets for each month. Under a separate contract, FSC administers the security lending program. The security lending fee is based on the number and duration of lending transactions.
Brokerage Commissions. The Fund placed a portion of its portfolio transactions with brokerage firms which are affiliates of the investment adviser. Brokerage commissions are included in net realized gain (loss) and change in net unrealized appreciation (depreciation) in the Statement of Operations. The commissions paid to these affiliated firms were $1,125 for the period.
6. Committed Line of Credit.
The Fund participates with other funds managed by the investment adviser or an affiliate in a $4.25 billion credit facility (the "line of credit") to be utilized for temporary or emergency purposes to fund shareholder redemptions or for other short-term liquidity purposes. The Fund has agreed to pay commitment fees on its pro-rata portion of the line of credit, which amounted to $231 and is reflected in Miscellaneous expenses on the Statement of Operations. During the period, the Fund did not borrow on this line of credit.
7. Security Lending.
The Fund lends portfolio securities through a lending agent from time to time in order to earn additional income. For equity securities, a lending agent is used and may loan securities to certain qualified borrowers, including Fidelity Capital Markets (FCM), a broker-dealer affiliated with the Fund. On the settlement date of the loan, the Fund receives collateral (in the form of U.S. Treasury obligations, letters of credit and/or cash)
Annual Report
Notes to Financial Statements - continued
7. Security Lending - continued
against the loaned securities and maintains collateral in an amount not less than 100% of the market value of the loaned securities during the period of the loan. The market value of the loaned securities is determined at the close of business of the Fund and any additional required collateral is delivered to the Fund on the next business day. If the borrower defaults on its obligation to return the securities loaned because of insolvency or other reasons, the Fund may apply collateral received from the borrower against the obligation. The Fund may experience delays and costs in recovering the securities loaned. Any cash collateral received is invested in the Fidelity Securities Lending Cash Central Fund. The value of loaned securities and cash collateral at period end are disclosed on the Fund's Statement of Assets and Liabilities. Security lending income represents the income earned on investing cash collateral, less rebates paid to borrowers and any lending agent fees associated with the loan, plus any premium payments received for lending certain types of securities. Security lending income is presented in the Statement of Operations as a component of income from Fidelity Central Funds. Total security lending income during the period amounted to $26,748. During the period, there were no securities loaned to FCM.
8. Expense Reductions.
The investment adviser voluntarily agreed to reimburse each class to the extent annual operating expenses exceeded certain levels of average net assets as noted in the table below. Some expenses, for example interest expense, including commitment fees, are excluded from this reimbursement.
The following classes were in reimbursement during the period:
| Expense
Limitations | Reimbursement |
| | |
Class A | 1.45% | $ 142,758 |
Class T | 1.70% | 143,072 |
Class B | 2.20% | 5,810 |
Class C | 2.20% | 56,744 |
Institutional Class | 1.20% | 18,766 |
| | $ 367,150 |
Commissions paid to certain brokers with whom the investment adviser, or its affiliates, places trades on behalf of the Fund include an amount in addition to trade execution, which may be rebated back to the Fund to offset certain expenses. This amount totaled $8,891 for the period. In addition, through arrangements with the Fund's custodian, credits realized as a result of uninvested cash balances were used to reduce the Fund's expenses. During the period, these credits reduced the Fund's custody expenses by $163.
Annual Report
9. Distributions to Shareholders.
Distributions to shareholders of each class were as follows:
Years ended October 31, | 2014 | 2013 |
From net investment income | | |
Class A | $ 236,147 | $ 304,584 |
Class T | 164,337 | 238,717 |
Institutional Class | 49,807 | 45,720 |
Total | $ 450,291 | $ 589,021 |
10. Share Transactions.
Share transactions for each class were as follows and may contain automatic conversions between classes or exchanges between funds:
| Shares | Dollars |
Years ended October 31, | 2014 | 2013 | 2014 | 2013 |
Class A | | | | |
Shares sold | 642,209 | 542,469 | $ 9,254,741 | $ 6,750,503 |
Reinvestment of distributions | 15,568 | 23,725 | 216,240 | 277,180 |
Shares redeemed | (733,015) | (609,733) | (10,574,352) | (7,602,328) |
Net increase (decrease) | (75,238) | (43,539) | $ (1,103,371) | $ (574,645) |
Class T | | | | |
Shares sold | 398,294 | 451,400 | $ 5,642,426 | $ 5,558,789 |
Reinvestment of distributions | 11,818 | 20,410 | 161,195 | 234,026 |
Shares redeemed | (765,657) | (959,232) | (10,811,536) | (11,719,932) |
Net increase (decrease) | (355,545) | (487,422) | $ (5,007,915) | $ (5,927,117) |
Class B | | | | |
Shares sold | 922 | 6,302 | $ 12,411 | $ 70,561 |
Shares redeemed | (58,773) | (99,127) | (768,373) | (1,122,489) |
Net increase (decrease) | (57,851) | (92,825) | $ (755,962) | $ (1,051,928) |
Class C | | | | |
Shares sold | 194,612 | 239,470 | $ 2,542,538 | $ 2,763,917 |
Shares redeemed | (314,314) | (327,038) | (4,057,639) | (3,712,216) |
Net increase (decrease) | (119,702) | (87,568) | $ (1,515,101) | $ (948,299) |
Institutional Class | | | | |
Shares sold | 801,555 | 235,849 | $ 12,565,571 | $ 3,203,149 |
Reinvestment of distributions | 2,539 | 3,069 | 37,521 | 38,142 |
Shares redeemed | (154,955) | (97,820) | (2,410,258) | (1,298,158) |
Net increase (decrease) | 649,139 | 141,098 | $ 10,192,834 | $ 1,943,133 |
Annual Report
Notes to Financial Statements - continued
11. Other.
The Fund's organizational documents provide former and current trustees and officers with a limited indemnification against liabilities arising in connection with the performance of their duties to the Fund. In the normal course of business, the Fund may also enter into contracts that provide general indemnifications. The Fund's maximum exposure under these arrangements is unknown as this would be dependent on future claims that may be made against the Fund. The risk of material loss from such claims is considered remote.
Annual Report
To the Trustees of Fidelity Advisor Series VIII and Shareholders of Fidelity Advisor International Capital Appreciation Fund:
We have audited the accompanying statement of assets and liabilities of Fidelity Advisor International Capital Appreciation Fund (the Fund), a fund of Fidelity Advisor Series VIII, including the schedule of investments, as of October 31, 2014, and the related statement of operations for the year then ended, the statement of changes in net assets for each of the two years in the period then ended, and the financial highlights for each of the five years in the period then ended. These financial statements and financial highlights are the responsibility of the Fund's management. Our responsibility is to express an opinion on these financial statements and financial highlights based on our audits.
We conducted our audits in accordance with the standards of the Public Company Accounting Oversight Board (United States). Those standards require that we plan and perform the audit to obtain reasonable assurance about whether the financial statements and financial highlights are free of material misstatement. The Fund is not required to have, nor were we engaged to perform, an audit of its internal control over financial reporting. Our audits included consideration of internal control over financial reporting as a basis for designing audit procedures that are appropriate in the circumstances, but not for the purpose of expressing an opinion on the effectiveness of the Fund's internal control over financial reporting. Accordingly, we express no such opinion. An audit also includes examining, on a test basis, evidence supporting the amounts and disclosures in the financial statements, assessing the accounting principles used and significant estimates made by management, as well as evaluating the overall financial statement presentation. Our procedures included confirmation of securities owned as of October 31, 2014, by correspondence with the custodians and brokers; where replies were not received from brokers, we performed other auditing procedures. We believe that our audits provide a reasonable basis for our opinion.
In our opinion, the financial statements and financial highlights referred to above present fairly, in all material respects, the financial position of Fidelity Advisor International Capital Appreciation Fund as of October 31, 2014, the results of its operations for the year then ended, the changes in its net assets for each of the two years in the period then ended, and the financial highlights for each of the five years in the period then ended, in conformity with accounting principles generally accepted in the United States of America.
DELOITTE & TOUCHE LLP
Boston, Massachusetts
December 18, 2014
Annual Report
The Trustees, Member of the Advisory Board, and officers of the trust and fund, as applicable, are listed below. The Board of Trustees governs the fund and is responsible for protecting the interests of shareholders. The Trustees are experienced executives who meet periodically throughout the year to oversee the fund's activities, review contractual arrangements with companies that provide services to the fund, oversee management of the risks associated with such activities and contractual arrangements, and review the fund's performance. Except for James C. Curvey, each of the Trustees oversees 174 funds. Mr. Curvey oversees 407 funds.
The Trustees hold office without limit in time except that (a) any Trustee may resign; (b) any Trustee may be removed by written instrument, signed by at least two-thirds of the number of Trustees prior to such removal; (c) any Trustee who requests to be retired or who has become incapacitated by illness or injury may be retired by written instrument signed by a majority of the other Trustees; and (d) any Trustee may be removed at any special meeting of shareholders by a two-thirds vote of the outstanding voting securities of the trust. Each Trustee who is not an interested person (as defined in the 1940 Act) of the trust and the fund (Independent Trustee), shall retire not later than the last day of the calendar year in which his or her 75th birthday occurs. The Independent Trustees may waive this mandatory retirement age policy with respect to individual Trustees. The officers and Advisory Board Member hold office without limit in time, except that any officer and Advisory Board Member may resign or may be removed by a vote of a majority of the Trustees at any regular meeting or any special meeting of the Trustees. Except as indicated, each individual has held the office shown or other offices in the same company for the past five years.
Experience, Skills, Attributes, and Qualifications of the Fund's Trustees. The Governance and Nominating Committee has adopted a statement of policy that describes the experience, qualifications, attributes, and skills that are necessary and desirable for potential Independent Trustee candidates (Statement of Policy). The Board believes that each Trustee satisfied at the time he or she was initially elected or appointed a Trustee, and continues to satisfy, the standards contemplated by the Statement of Policy. The Governance and Nominating Committee also engages professional search firms to help identify potential Independent Trustee candidates who have the experience, qualifications, attributes, and skills consistent with the Statement of Policy. From time to time, additional criteria based on the composition and skills of the current Independent Trustees, as well as experience or skills that may be appropriate in light of future changes to board composition, business conditions, and regulatory or other developments, have also been considered by the professional search firms and the Governance and Nominating Committee. In addition, the Board takes into account the Trustees' commitment and participation in Board and committee meetings, as well as their leadership of standing and ad hoc committees throughout their tenure.
In determining that a particular Trustee was and continues to be qualified to serve as a Trustee, the Board has considered a variety of criteria, none of which, in isolation, was controlling. The Board believes that, collectively, the Trustees have balanced and diverse experience, qualifications, attributes, and skills, which allow the Board to operate effectively in governing the fund and protecting the interests of shareholders. Information about the specific experience, skills, attributes, and qualifications of each Trustee, which in each case led to the Board's conclusion that the Trustee should serve (or continue to serve) as a trustee of the fund, is provided below.
Annual Report
Board Structure and Oversight Function. James C. Curvey is an interested person (as defined in the 1940 Act) and currently serves as Chairman. The Trustees have determined that an interested Chairman is appropriate and benefits shareholders because an interested Chairman has a personal and professional stake in the quality and continuity of services provided to the fund. Independent Trustees exercise their informed business judgment to appoint an individual of their choosing to serve as Chairman, regardless of whether the Trustee happens to be independent or a member of management. The Independent Trustees have determined that they can act independently and effectively without having an Independent Trustee serve as Chairman and that a key structural component for assuring that they are in a position to do so is for the Independent Trustees to constitute a substantial majority for the Board. The Independent Trustees also regularly meet in executive session. Ned C. Lautenbach serves as Chairman of the Independent Trustees and as such (i) acts as a liaison between the Independent Trustees and management with respect to matters important to the Independent Trustees and (ii) with management prepares agendas for Board meetings.
Fidelity funds are overseen by different Boards of Trustees. The fund's Board oversees Fidelity's equity and high income funds and another Board oversees Fidelity's investment-grade bond, money market, and asset allocation funds. The asset allocation funds may invest in Fidelity funds overseen by the fund's Board. The use of separate Boards, each with its own committee structure, allows the Trustees of each group of Fidelity funds to focus on the unique issues of the funds they oversee, including common research, investment, and operational issues. On occasion, the separate Boards establish joint committees to address issues of overlapping consequences for the Fidelity funds overseen by each Board.
The Trustees operate using a system of committees to facilitate the timely and efficient consideration of all matters of importance to the Trustees, the fund, and fund shareholders and to facilitate compliance with legal and regulatory requirements and oversight of the fund's activities and associated risks. The Board, acting through its committees, has charged FMR and its affiliates with (i) identifying events or circumstances the occurrence of which could have demonstrably adverse effects on the fund's business and/or reputation; (ii) implementing processes and controls to lessen the possibility that such events or circumstances occur or to mitigate the effects of such events or circumstances if they do occur; and (iii) creating and maintaining a system designed to evaluate continuously business and market conditions in order to facilitate the identification and implementation processes described in (i) and (ii) above. Because the day-to-day operations and activities of the fund are carried out by or through FMR, its affiliates and other service providers, the fund's exposure to risks is mitigated but not eliminated by the processes overseen by the Trustees. While each of the Board's committees has responsibility for overseeing different aspects of the fund's activities, oversight is exercised primarily through the Operations, Audit, and Compliance Committees. In addition, the Independent Trustees have worked with FMR to enhance the Board's oversight of investment and financial risks, legal and regulatory risks, technology risks, and operational risks, including the development of additional risk reporting to the Board. For example, a working group comprised of Independent Trustees and FMR has worked and continues to work to review the Fidelity funds' valuation-related activities, reporting and risk management. Appropriate personnel, including but not limited to the fund's Chief Compliance Officer (CCO), FMR's internal auditor, the independent accountants, the fund's Treasurer and portfolio management personnel, make periodic reports to the Board's committees, as appropriate, including an annual review of FMR's risk management program for the Fidelity funds. The responsibilities of each standing committee, including their oversight responsibilities, are described further under "Standing Committees of the Fund's Trustees."
Annual Report
Trustees and Officers - continued
The fund's Statement of Additional Information (SAI) includes more information about the Trustees. To request a free copy, call Fidelity at 1-877-208-0098.
Interested Trustees*:
Correspondence intended for each Trustee who is an interested person may be sent to Fidelity Investments, 245 Summer Street, Boston, Massachusetts 02210.
Name, Year of Birth; Principal Occupations and Other Relevant Experience+ |
James C. Curvey (1935) |
Year of Election or Appointment: 2007 Trustee Chairman of the Board of Trustees |
| Mr. Curvey also serves as Trustee of other Fidelity funds. Mr. Curvey is a Director of Fidelity Research & Analysis Co. (2009-present), and Vice Chairman (2007-present) and Director of FMR LLC. In addition, Mr. Curvey serves as an Overseer for the Boston Symphony Orchestra and a member of the board of Artis-Naples, Naples, Florida, and as a Trustee for Brewster Academy, Wolfeboro, New Hampshire. Previously, Mr. Curvey served as a Director of Fidelity Investments Money Management, Inc. (2009-2014), a Director of FMR (2007-2014) and a Director of FMR Co., Inc. (2007-2014). |
Charles S. Morrison (1960) |
Year of Election or Appointment: 2014 Trustee |
| Mr. Morrison also serves as Trustee of other funds. He serves as a Director of Fidelity Investments Money Management, Inc. (FIMM) (2014-present), Director of Fidelity SelectCo, LLC (2014-present), President, Asset Management (2014-present), and is an employee of Fidelity Investments. Previously, Mr. Morrison served as Vice President of Fidelity's Fixed Income and Asset Allocation Funds (2012-2014), President, Fixed Income (2011-2014), Vice President of Fidelity's Money Market Funds (2005-2009), President, Money Market Group Leader of FMR (2009), and Senior Vice President, Money Market Group of FMR (2004-2009). Mr. Morrison also served as Vice President of Fidelity's Bond Funds (2002-2005), certain Balanced Funds (2002-2005), and certain Asset Allocation Funds (2002-2007), and as Senior Vice President (2002-2005) of Fidelity's Bond Division. |
* Trustees have been determined to be "Interested Trustees" by virtue of, among other things, their affiliation with the trust or various entities under common control with FMR.
+ The information above includes each Trustee's principal occupation during the last five years and other information relating to the experience, attributes, and skills relevant to each Trustee's qualifications to serve as a Trustee, which led to the conclusion that each Trustee should serve as a Trustee for the fund.
Annual Report
Trustees and Officers - continued
Independent Trustees:
Correspondence intended for each Independent Trustee (that is, the Trustees other than the Interested Trustees) may be sent to Fidelity Investments, P.O. Box 55235, Boston, Massachusetts 02205-5235.
Name, Year of Birth; Principal Occupations and Other Relevant Experience+ |
Dennis J. Dirks (1948) |
Year of Election or Appointment: 2005 Trustee |
| Mr. Dirks also serves as Trustee of other Fidelity funds. Prior to his retirement in May 2003, Mr. Dirks was Chief Operating Officer and a member of the Board of The Depository Trust & Clearing Corporation (DTCC). He also served as President, Chief Operating Officer, and Board member of The Depository Trust Company (DTC) and President and Board member of the National Securities Clearing Corporation (NSCC). In addition, Mr. Dirks served as Chief Executive Officer and Board member of the Government Securities Clearing Corporation, Chief Executive Officer and Board member of the Mortgage-Backed Securities Clearing Corporation, as a Trustee and a member of the Finance Committee of Manhattan College (2005-2008), and as a Trustee and a member of the Finance Committee of AHRC of Nassau County (2006-2008). Mr. Dirks is a member of the Independent Directors Council (IDC) Governing Council (2010-present) and Board of Directors for The Brookville Center for Children's Services, Inc. (2009-present). |
Alan J. Lacy (1953) |
Year of Election or Appointment: 2008 Trustee |
| Mr. Lacy also serves as Trustee of other Fidelity funds. Mr. Lacy serves as Senior Adviser (2007-present) of Oak Hill Capital Partners, L.P. (private equity). Mr. Lacy also served as Chief Executive Officer (2000-2005) and Vice Chairman (2005-2006) of Sears Holdings Corporation and Sears, Roebuck and Co. (retail). In addition, Mr. Lacy serves as a member of the Board of Directors of Dave & Buster's Entertainment, Inc. (restaurant and entertainment complexes, 2010-present), Earth Fare, Inc. (retail grocery, 2012-present), The Hillman Companies, Inc. (hardware wholesalers, 2010-present), and Bristol-Myers Squibb Company (global pharmaceuticals, 2008-present). Mr. Lacy is a member of the Board of Trustees of The National Parks Conservation Association (2006-present). Previously, Mr. Lacy served as Chairman of the Board of Trustees of the National Parks Conservation Association (2008-2011) and as a member of the Board of Directors for the Western Union Company (global money transfer, 2006-2011). |
Ned C. Lautenbach (1944) |
Year of Election or Appointment: 2000 Trustee Chairman of the Independent Trustees |
| Mr. Lautenbach also serves as Trustee of other Fidelity funds. Mr. Lautenbach currently serves as the Lead Director of the Eaton Corporation Board of Directors (diversified industrial, 1997-present). Mr. Lautenbach is Chairman of the Board of Directors of the Philharmonic Center for the Arts in Naples, Florida (2012-present) and a member of the Council on Foreign Relations (1994-present). Previously, Mr. Lautenbach was a Partner/Advisory Partner at Clayton, Dubilier & Rice, LLC (private equity investment, 1998-2010), as well as a Director of Sony Corporation (2006-2007). |
Joseph Mauriello (1944) |
Year of Election or Appointment: 2008 Trustee |
| Mr. Mauriello also serves as Trustee of other Fidelity funds. Prior to his retirement in January 2006, Mr. Mauriello served in numerous senior management positions including Deputy Chairman and Chief Operating Officer (2004-2005), and Vice Chairman of Financial Services (2002-2004) of KPMG LLP US (professional services, 1965-2005). Mr. Mauriello currently serves as a member of the Board of Directors of XL Group plc. (global insurance and re-insurance, 2006-present). Previously, Mr. Mauriello served as a Director of the Hamilton Funds of the Bank of New York (2006-2007) and of Arcadia Resources Inc. (health care services and products, 2007-2012). |
Robert W. Selander (1950) |
Year of Election or Appointment: 2011 Trustee |
| Mr. Selander also serves as Trustee of other Fidelity funds. Previously, Mr. Selander served as a Member of the Advisory Board of other Fidelity funds (2011), and Executive Vice Chairman (2010), Chief Executive Officer (2009-2010), and President and Chief Executive Officer (1997-2009) of Mastercard, Inc. |
Cornelia M. Small (1944) |
Year of Election or Appointment: 2005 Trustee |
| Ms. Small also serves as Trustee of other Fidelity funds. Ms. Small is a member of the Board of Directors (2009-present) and Chair of the Investment Committee (2010-present) of the Teagle Foundation. Ms. Small also serves on the Investment Committee of the Berkshire Taconic Community Foundation (2008-present). Previously, Ms. Small served as Chairperson (2002-2008) and a member of the Investment Committee and Chairperson (2008-2012) and a member of the Board of Trustees of Smith College. In addition, Ms. Small served as Chief Investment Officer, Director of Global Equity Investments, and a member of the Board of Directors of Scudder, Stevens & Clark and Scudder Kemper Investments. |
William S. Stavropoulos (1939) |
Year of Election or Appointment: 2001 Trustee Vice Chairman of the Independent Trustees |
| Mr. Stavropoulos also serves as Trustee of other Fidelity funds. Mr. Stavropoulos serves as President and Founder of the Michigan Baseball Foundation, the Great Lakes Loons (2007-present). Mr. Stavropoulos is Chairman Emeritus of the Board of Directors of The Dow Chemical Company, where he previously served in numerous senior management positions, including President, CEO (1995-2000; 2002-2004), Chairman of the Executive Committee (2000-2006), and as a member of the Board of Directors (1990-2006). Currently, Mr. Stavropoulos is Chairman of the Board of Directors of Univar Inc. (global distributor of commodity and specialty chemicals), a Director of Teradata Corporation (data warehousing and technology solutions), and Maersk Inc. (industrial conglomerate), and a member of the Advisory Board for Metalmark Capital LLC (private equity investment, 2005-present). Mr. Stavropoulos is an operating advisor to Clayton, Dubilier & Rice, LLC (private equity investment). In addition, Mr. Stavropoulos is a member of the University of Notre Dame Advisory Council for the College of Science, a Trustee of the Rollin L. Gerstacker Foundation, and a Director of the Naples Philharmonic Center for the Arts. Previously, Mr. Stavropoulos served as a Director of Chemical Financial Corporation (bank holding company, 1993-2012) and Tyco International, Ltd. (multinational manufacturing and services, 2007-2012). |
David M. Thomas (1949) |
Year of Election or Appointment: 2008 Trustee |
| Mr. Thomas also serves as Trustee of other Fidelity funds. Mr. Thomas serves as Non-Executive Chairman of the Board of Directors of Fortune Brands Home and Security (home and security products, 2011-present), and as a member of the Board of Directors of Interpublic Group of Companies, Inc. (marketing communication, 2004-present). Previously, Mr. Thomas served as Executive Chairman (2005-2006) and Chairman and Chief Executive Officer (2000-2005) of IMS Health, Inc. (pharmaceutical and healthcare information solutions), and a Director of Fortune Brands, Inc. (consumer products, 2000-2011). |
+ The information above includes each Trustee's principal occupation during the last five years and other information relating to the experience, attributes, and skills relevant to each Trustee's qualifications to serve as a Trustee, which led to the conclusion that each Trustee should serve as a Trustee for the fund.
Advisory Board Member and Officers:
Correspondence intended for each officer and Peter S. Lynch may be sent to Fidelity Investments, 245 Summer Street, Boston, Massachusetts 02210. Officers appear below in alphabetical order.
Name, Year of Birth; Principal Occupation |
Peter S. Lynch (1944) |
Year of Election or Appointment: 2003 Member of the Advisory Board |
| Mr. Lynch also serves as Member of the Advisory Board of other Fidelity funds. Mr. Lynch is Vice Chairman and a Director of FMR and FMR Co., Inc. In addition, Mr. Lynch serves as a Trustee of Boston College and as the Chairman of the Inner-City Scholarship Fund. Previously, Mr. Lynch served on the Special Olympics International Board of Directors (1997-2006). |
Elizabeth Paige Baumann (1968) |
Year of Election or Appointment: 2012 Anti-Money Laundering (AML) Officer |
| Ms. Baumann also serves as AML Officer of other funds. She is Chief AML Officer of FMR LLC (2012-present) and is an employee of Fidelity Investments. Previously, Ms. Baumann served as Vice President and Deputy Anti-Money Laundering Officer (2007-2012). |
William C. Coffey (1969) |
Year of Election or Appointment: 2009 Assistant Secretary |
| Mr. Coffey also serves as Assistant Secretary of other funds. He is Senior Vice President and Deputy General Counsel of FMR LLC (2010-present), and is an employee of Fidelity Investments. Previously, Mr. Coffey served as Vice President and Associate General Counsel of FMR LLC (2005-2009). |
Timothy M. Cohen (1969) |
Year of Election or Appointment: 2014 Vice President of certain Equity Funds |
| Mr. Cohen also serves as Vice President of other funds. Mr. Cohen serves as a Director and Chief Compliance Officer of Fidelity Management & Research (U.K.) Inc. (2013-present) and is an employee of Fidelity Investments. |
Jonathan Davis (1968) |
Year of Election or Appointment: 2010 Assistant Treasurer |
| Mr. Davis also serves as Assistant Treasurer of other funds. Mr. Davis is an employee of Fidelity Investments. Previously, Mr. Davis served as Vice President and Associate General Counsel of FMR LLC (2003-2010). |
Adrien E. Deberghes (1967) |
Year of Election or Appointment: 2008 Deputy Treasurer |
| Mr. Deberghes also serves as an officer of other funds. He is an employee of Fidelity Investments (2008-present). Prior to joining Fidelity Investments, Mr. Deberghes was Senior Vice President of Mutual Fund Administration at State Street Corporation (2007-2008), Senior Director of Mutual Fund Administration at Investors Bank & Trust (2005-2007), and Director of Finance for Dunkin' Brands (2000-2005). |
Stephanie J. Dorsey (1969) |
Year of Election or Appointment: 2010 Assistant Treasurer |
| Ms. Dorsey also serves as an officer of other funds. She is an employee of Fidelity Investments (2008-present) and has served in other fund officer roles. Prior to joining Fidelity Investments, Ms. Dorsey served as Treasurer (2004-2008) of the JPMorgan Mutual Funds and Vice President (2004-2008) of JPMorgan Chase Bank. |
Howard J. Galligan III (1966) |
Year of Election or Appointment: 2014 Chief Financial Officer |
| Mr. Galligan also serves as Chief Financial Officer of other funds. Mr. Galligan serves as President of Fidelity Pricing and Cash Management Services (FPCMS) (2014-present) and as a Director of Strategic Advisers, Inc. (2008-present). Previously, Mr. Galligan served as Chief Administrative Officer of Asset Management (2011-2014) and Chief Operating Officer and Senior Vice President of Investment Support for Strategic Advisers, Inc. (2003-2011). |
Scott C. Goebel (1968) |
Year of Election or Appointment: 2008 Secretary and Chief Legal Officer (CLO) |
| Mr. Goebel serves as Secretary and CLO of other funds. Mr. Goebel also serves as Secretary of Fidelity SelectCo, LLC (2013-present), Fidelity Investments Money Management, Inc. (FIMM) (2010-present) and Fidelity Research and Analysis Company (FRAC) (2010-present); General Counsel, Secretary, and Senior Vice President of FMR (2008-present) and FMR Co., Inc. (2008-present); Chief Legal Officer of Fidelity Management & Research (Hong Kong) Limited (2008-present); and Assistant Secretary of Fidelity Management & Research (Japan) Limited (2008- present) and Fidelity Management & Research (U.K.) Inc. (2008- present). Previously, Mr. Goebel served as Secretary and CLO of other Fidelity funds (2008-2013), Assistant Secretary of FIMM (2008-2010), FRAC (2008-2010), and certain funds (2007-2008); and as Vice President and Secretary of Fidelity Distributors Corporation (FDC) (2005-2007). Mr. Goebel has been employed by FMR LLC or an affiliate since 2001. |
Brian B. Hogan (1964) |
Year of Election or Appointment: 2009 Vice President |
| Mr. Hogan also serves as Trustee or Vice President of other funds. Mr. Hogan serves as a Director of Fidelity SelectCo, LLC (2014-present) and President of FMR's Equity Division (2009-present). Previously, Mr. Hogan served as Senior Vice President, Equity Research of FMR (2006-2009) and as a portfolio manager. |
Chris Maher (1972) |
Year of Election or Appointment: 2013 Assistant Treasurer |
| Mr. Maher serves as Assistant Treasurer of other funds. Mr. Maher is Vice President of Valuation Oversight and is an employee of Fidelity Investments. Previously, Mr. Maher served as Vice President of Asset Management Compliance (2013), Vice President of FMR's Program Management Group (2010-2013), and Vice President of Valuation Oversight (2008-2010). |
Kenneth B. Robins (1969) |
Year of Election or Appointment: 2008 President and Treasurer |
| Mr. Robins also serves as an officer of other funds. Mr. Robins serves as Executive Vice President of Fidelity Investments Money Management, Inc. (FIMM) (2013-present) and is an employee of Fidelity Investments (2004-present). Previously, Mr. Robins served in other fund officer roles. |
Stephen Sadoski (1971) |
Year of Election or Appointment: 2012 Deputy Treasurer |
| Mr. Sadoski also serves as Deputy Treasurer of other funds. He is an employee of Fidelity Investments (2012-present) and has served in another fund officer role. Prior to joining Fidelity Investments, Mr. Sadoski served as an assistant chief accountant in the Division of Investment Management of the Securities and Exchange Commission (SEC) (2009-2012) and as a senior manager at Deloitte & Touche LLP (1997-2009). |
Stacie M. Smith (1974) |
Year of Election or Appointment: 2013 Deputy Treasurer |
| Ms. Smith also serves as an officer of other funds. She is an employee of Fidelity Investments (2009-present) and has served in other fund officer roles. Prior to joining Fidelity Investments, Ms. Smith served as Senior Audit Manager of Ernst & Young LLP (1996-2009). |
Renee Stagnone (1975) |
Year of Election or Appointment: 2013 Deputy Treasurer |
| Ms. Stagnone also serves as Deputy Treasurer of other funds. Ms. Stagnone is an employee of Fidelity Investments. |
Linda J. Wondrack (1964) |
Year of Election or Appointment: 2014 Chief Compliance Officer |
| Ms. Wondrack also serves as Chief Compliance Officer of other funds. Ms. Wondrack is Executive Vice President and head of the Ethics Office and Asset Management Compliance for Fidelity Investments (2012- present). Ms. Wondrack also serves as Chief Compliance Officer of Fidelity SelectCo, LLC (2014-present); Chief Compliance Officer of Impresa Management LLC (2013-present); and Chief Compliance Officer of FMR Co., Inc., Fidelity Investments Money Management, Inc., Fidelity Management & Research (Japan) Limited, Fidelity Management & Research (U.K.) Inc., Fidelity Management & Research (Hong Kong), Fidelity Management & Research Company, Pyramis Global Advisors, LLC, and Strategic Advisers, Inc., Ballyrock Investment Advisors LLC, and Northern Neck Investors LLC (2012-present). Previously, Ms. Wondrack served as Senior Vice President and Chief Compliance Officer for Columbia Management Investment Advisers, LLC (2005-2012); Chief Compliance Officer for certain funds within the Columbia Family of Funds (2007-2012); and Senior Vice President of Compliance Risk Management at Bank of America (2005-2010). |
Joseph F. Zambello (1957) |
Year of Election or Appointment: 2011 Deputy Treasurer |
| Mr. Zambello also serves as Deputy Treasurer of other funds. Mr. Zambello is an employee of Fidelity Investments. Previously, Mr. Zambello served as Vice President of FMR's Program Management Group (2009-2011) and Vice President of the Transfer Agent Oversight Group (2005-2009). |
Annual Report
Class A designates 32% and Class T designates 48% of the dividends distributed in December 2013 during the fiscal year as qualifying for the dividends-received deduction for corporate shareholders.
Class A and Class T designates 100% of the dividends distributed during the fiscal year as amounts which may be taken into account as a dividend for purposes of the maximum rate under section 1(h)(11) of the Internal Revenue Code.
The amounts per share which represent income derived from sources within, and taxes paid to, foreign countries or possessions of the United States are as follows:
| Pay Date | Income | Taxes |
Class A | 12/09/13 | $0.0851 | $0.0191 |
Class T | 12/09/13 | $0.0571 | $0.0191 |
The fund will notify shareholders in January 2015 of amounts for use in preparing 2014 income tax returns.
Annual Report
Board Approval of Investment Advisory Contracts and Management Fees
Fidelity Advisor International Capital Appreciation Fund
Each year, the Board of Trustees, including the Independent Trustees (together, the Board), votes on the renewal of the management contract with Fidelity Management & Research Company (FMR) and the sub-advisory agreements (together, the Advisory Contracts) for the fund. The Board, assisted by the advice of fund counsel and Independent Trustees' counsel, requests and considers a broad range of information relevant to the renewal of the Advisory Contracts throughout the year.
The Board meets regularly and, at each of its meetings, covers an extensive agenda of topics and materials and considers factors that are relevant to its annual consideration of the renewal of the fund's Advisory Contracts, including the services and support provided to the fund and its shareholders. The Board has established various standing committees (Committees), each composed of and chaired by Independent Trustees with varying backgrounds, to which the Board has assigned specific subject matter responsibilities in order to enhance effective decision-making by the Board. The Board, acting directly and through its Committees, requests and receives information concerning the annual consideration of the renewal of the fund's Advisory Contracts. The Board also meets as needed to consider matters specifically related to the Board's annual consideration of the renewal of the Advisory Contracts. Members of the Board may also meet with trustees of other Fidelity funds through ad hoc joint committees to discuss certain matters relevant to the Fidelity funds.
At its July 2014 meeting, the Board, including the Independent Trustees, unanimously determined to renew the fund's Advisory Contracts. In reaching its determination, the Board considered all factors it believed relevant, including (i) the nature, extent, and quality of the services to be provided to the fund and its shareholders (including the investment performance of the fund); (ii) the competitiveness of the fund's management fee and total expense ratio relative to peer funds; (iii) the total costs of the services to be provided by and the profits to be realized by Fidelity from its relationship with the fund; (iv) the extent to which economies of scale exist and would be realized as the fund grows; and (v) whether fee levels reflect these economies of scale, if any, for the benefit of fund shareholders. In connection with separate internal corporate reorganizations involving Fidelity Management & Research (U.K.) Inc. (FMR U.K.) and Fidelity Management & Research (Japan) Inc. (FMR Japan), the Board approved certain non-material amendments to the fund's sub-advisory agreements with FMR U.K. and FMR Japan to reflect that, after these reorganizations, FMR Investment Management (UK) Limited and Fidelity Management & Research (Japan) Limited will carry on the business of FMR U.K. and FMR Japan, respectively. The Board noted that no changes to the portfolio managers or to the foreign research or investment advisory services provided to the fund were expected in connection with either reorganization and that the same personnel and resources would continue to be available to the fund at the new entities.
Annual Report
Board Approval of Investment Advisory Contracts and
Management Fees - continued
In considering whether to renew the Advisory Contracts for the fund, the Board reached a determination, with the assistance of fund counsel and Independent Trustees' counsel and through the exercise of its business judgment, that the renewal of the Advisory Contracts was in the best interests of the fund and its shareholders and that the compensation payable under the Advisory Contracts was fair and reasonable. The Board's decision to renew the Advisory Contracts was not based on any single factor, but rather was based on a comprehensive consideration of all the information provided to the Board at its meetings throughout the year. The Board, in reaching its determination to renew the Advisory Contracts, was aware that shareholders of the fund have a broad range of investment choices available to them, including a wide choice among funds offered by Fidelity's competitors, and that the fund's shareholders, who have the opportunity to review and weigh the disclosure provided by the fund in its prospectus and other public disclosures, have chosen to invest in this fund, which is part of the Fidelity family of funds.
Nature, Extent, and Quality of Services Provided. The Board considered Fidelity's staffing as it relates to the fund, including the backgrounds of investment personnel of FMR and the sub-advisers (together, the Investment Advisers), and also considered the fund's investment objective, strategies, and related investment philosophy. The Independent Trustees also had discussions with senior management of Fidelity's investment operations and investment groups. The Board considered the structure of the portfolio manager compensation program and whether this structure provides appropriate incentives to act in the best interests of the fund. Additionally, the Board considered the portfolio managers' investments, if any, in the funds that they manage.
Resources Dedicated to Investment Management and Support Services. The Board and the Fund Oversight and Research Committees reviewed the general qualifications and capabilities of Fidelity's investment staff, including its size, education, experience, and resources, as well as Fidelity's approach to recruiting, training, managing, and compensating investment personnel. The Board noted that Fidelity has continued to increase the resources devoted to non-U.S. offices, including expansion of Fidelity's global investment organization. The Board also noted that Fidelity's analysts have extensive resources, tools and capabilities that allow them to conduct sophisticated quantitative and fundamental analysis, as well as credit analysis of issuers, counterparties and guarantors. Further, the Board believes that Fidelity's investment professionals have sufficient access to global information and data so as to provide competitive investment results over time, and that those professionals also have access to sophisticated tools that permit them to assess portfolio construction and risk and performance attribution characteristics continuously, as well as to transmit new information and research conclusions rapidly around the world. Additionally, in its deliberations, the Board considered Fidelity's trading and risk management capabilities and resources and global compliance infrastructure, which are an integral part of the investment management process.
Annual Report
Shareholder and Administrative Services. The Board considered (i) the nature, extent, quality, and cost of advisory, administrative, and shareholder services performed by the Investment Advisers and their affiliates under the Advisory Contracts and under separate agreements covering transfer agency, pricing and bookkeeping, and securities lending services for the fund; (ii) the nature and extent of the supervision of third party service providers, principally custodians and subcustodians; and (iii) the resources devoted to, and the record of compliance with, the fund's compliance policies and procedures. The Board also reviewed the allocation of fund brokerage, including allocations to brokers affiliated with the Investment Advisers, the use of brokerage commissions to pay fund expenses, and the use of "soft" commission dollars to pay for research services.
The Board noted that the growth of fund assets over time across the complex allows Fidelity to reinvest in the development of services designed to enhance the value or convenience of the Fidelity funds as investment vehicles. These services include 24-hour access to account information and market information through telephone representatives and over the Internet, investor education materials and asset allocation tools, and the expanded availability of Fidelity Investor Centers.
In 2014, the Board formed an ad hoc Committee on Transfer Agency Fees to review the variety of transfer agency fee structures throughout the industry and Fidelity's competitive positioning with respect to industry participants.
Investment in a Large Fund Family. The Board considered the benefits to shareholders of investing in a Fidelity fund, including the benefits of investing in a fund that is part of a large family of funds offering a variety of investment disciplines and providing a large variety of mutual fund investor services. The Board noted that Fidelity had taken, or had made recommendations that resulted in the Fidelity funds taking, a number of actions over the previous year that benefited particular funds, including (i) continuing to dedicate additional resources to investment research and to the support of the senior management team that oversees asset management; (ii) persisting in efforts to enhance Fidelity's global research capabilities; (iii) launching new funds and making other enhancements to meet client needs for income-oriented solutions; (iv) reducing fund expenses for certain index funds; (v) continuing to launch dedicated lower cost underlying funds to meet portfolio construction needs related to expanding underlying fund options for Fidelity funds of funds, specifically for the Freedom Fund product lines; (vi) rationalizing product lines and gaining increased efficiencies through fund mergers; (vii) launching sector-based exchange-traded funds and establishing a new Fidelity adviser to manage sector-based funds and products; (viii) continuing to develop and implement technology to improve security and increase efficiency; (ix) modifying the eligibility criteria for certain share classes to increase their marketability to a portion of the defined contribution plan market; (x) waiving redemption fees for certain qualified fund-of-fund and wrap programs and certain retirement plan transactions; and (xi) launching new Institutional Class shares of certain money market funds to attract and retain assets and to fill a gap in the money market fund lineup.
Annual Report
Board Approval of Investment Advisory Contracts and
Management Fees - continued
Investment Performance. The Board considered whether the fund has operated in accordance with its investment objective, as well as its record of compliance with its investment restrictions and its performance history.
The Board took into account discussions with the Investment Advisers about fund investment performance that occur at Board meetings throughout the year. In this regard the Board noted that as part of regularly scheduled fund reviews and other reports to the Board on fund performance, the Board periodically considers annualized return information for the fund, for different time periods, measured against a securities market index ("benchmark index") and a peer group of funds with similar objectives ("peer group"). In its evaluation of fund investment performance, the Board gave particular attention to information indicating changes in performance of certain Fidelity funds for specific time periods and the Investment Advisers' explanations for any overperformance or underperformance.
In addition to reviewing absolute and relative fund performance, the Independent Trustees periodically consider the appropriateness of fund performance metrics in evaluating the results achieved. In general, the Independent Trustees believe that fund performance should be evaluated based on net performance (after fees and expenses) of both the highest performing and lowest performing classes, where applicable, compared to appropriate benchmark indices, over appropriate time periods which may include full market cycles, and compared to peer groups, as applicable, over the same periods, taking into account relevant factors including the following: general market conditions; issuer-specific information; tactical opportunities for investment; and fund cash flows and other factors.
The Independent Trustees recognize that shareholders evaluate performance on a net basis over their own holding periods, for which one-, three-, and five-year periods are often used as a proxy. For this reason, the performance information reviewed by the Board also included net cumulative calendar year total return information for the fund and an appropriate benchmark index and peer group for the most recent one-, three-, and five-year periods, as shown below. Returns are shown compared to the 25th percentile (top of box, 75% beaten) and 75th percentile (bottom of box, 25% beaten) of the peer universe. Returns of the benchmark index are "net MA," i.e., adjusted for tax withholding rates applicable to U.S.-based funds organized as Massachusetts business trusts.
Annual Report
Fidelity Advisor International Capital Appreciation Fund

The Board also considered that the fund's management fee is subject to upward or downward adjustment depending upon whether, and to what extent, the fund's investment performance for the performance period exceeds, or is exceeded by, a securities index, thus leading to a performance adjustment for the same period. The Board noted that the performance adjustment provides FMR with a strong economic incentive to seek to achieve superior performance for the fund's shareholders and helps to more closely align the interests of FMR and the fund's shareholders.
Based on its review, the Board concluded that the nature, extent, and quality of services provided to the fund under the Advisory Contracts should benefit the fund's shareholders.
Competitiveness of Management Fee and Total Expense Ratio. The Board considered the fund's management fee and total expense ratio compared to "mapped groups" of competitive funds and classes. Fidelity creates "mapped groups" by combining similar Lipper investment objective categories that have comparable investment mandates. Combining Lipper investment objective categories aids the Board's management fee and total expense ratio comparisons by broadening the competitive group used for comparison and by reducing the number of universes to which various Fidelity funds are compared.
Management Fee. The Board considered two proprietary management fee comparisons for the 12-month periods shown in the chart below. The group of Lipper funds used by the Board for management fee comparisons is referred to below as the "Total Mapped Group." The Total Mapped Group comparison focuses on a fund's standing in terms of gross management fees before expense reimbursements or caps, and without giving effect to the fund's performance adjustment, relative to the total universe of funds with comparable investment mandates, regardless of whether their management fee structures also are comparable. Funds with comparable investment mandates offer exposure to similar types of securities. Funds with comparable management fee structures have similar management fee contractual arrangements (e.g., flat rate charged for advisory services, all-inclusive fee rate, etc.). "TMG %" represents the percentage of funds in the Total Mapped Group that had management fees that were lower than the fund's. For example, a hypothetical TMG % of 20% would mean that 80% of the funds in the Total Mapped Group had higher, and 20% had lower, management fees than the fund. The fund's actual TMG %s are in the chart below. The "Asset-Size Peer Group" (ASPG) comparison focuses on a fund's standing relative to a subset of non-Fidelity funds within the Total Mapped Group that are similar in size and management fee structure. For example, if a fund is in the first quartile of the ASPG, the fund's management fee ranks in the least expensive or lowest 25% of funds in the ASPG. The ASPG represents at least 15% of the funds in the Total Mapped Group with comparable asset size and management fee structures, subject to a minimum of 50 funds (or all funds in the Total Mapped Group if fewer than 50). Additional information, such as the ASPG quartile in which the fund's management fee rate ranked and the impact of the fund's performance adjustment, is also included in the chart and considered by the Board.
Annual Report
Board Approval of Investment Advisory Contracts and
Management Fees - continued
Fidelity Advisor International Capital Appreciation Fund

The Board noted that the fund's management fee rate ranked below the median of its Total Mapped Group and below the median of its ASPG for 2013. The Board also noted the effect of the fund's positive performance adjustment on the fund's management fee ranking.
Annual Report
The Board also noted that, in August 2013, the ad hoc Committee on Management Fees was formed to conduct an in-depth review of the management fee rates of Fidelity's active equity mutual funds. The Committee focused on the following areas: (i) standard fee structures; (ii) research consumption and trading evolution; (iii) management fee competitiveness/profitability by category; and (iv) factors that drive institutional pricing.
Based on its review, the Board concluded that the fund's management fee is fair and reasonable in light of the services that the fund receives and the other factors considered.
Total Expense Ratio. In its review of each class's total expense ratio, the Board considered the fund's management fee as well as other fund or class expenses, as applicable, such as transfer agent fees, pricing and bookkeeping fees, fund-paid 12b-1 fees, and custodial, legal, and audit fees. The Board also noted the effects of any waivers and reimbursements on fees and expenses, as well as the impact of the fund's performance adjustment. As part of its review, the Board also considered the current and historical total expense ratios of each class of the fund compared to competitive fund median expenses. Each class of the fund is compared to those funds and classes in the Total Mapped Group (used by the Board for management fee comparisons) that have a similar sales load structure.
The Board noted that the total expense ratio of each class ranked above its competitive median for 2013. The Board considered that, in general, various factors can affect total expense ratios. The Board noted that the total expense ratio of Class T was above the competitive median primarily because of higher 12b-1 fees on Class T as compared to most competitor funds. Class T has a higher 12b-1 fee, but a lower front-end sales charge, than traditionally priced front-end sales charge classes. The Board considered that Class T is primarily sold load-waived in the retirement plan market where its 0.50% 12b-1 fee is comparable to competing no-load, higher 12b-1 fee classes designed specifically for retirement plans. The Board noted that the fund offers multiple classes, each of which has a different sales load and 12b-1 fee structure, and that the multiple structures are intended to offer a range of pricing options for the intermediary market. The Board also noted that the total expense ratios of the classes vary primarily by the level of their 12b-1 fees, although differences in transfer agent fees may also cause expenses to vary from class to class.
Fees Charged to Other Fidelity Clients. The Board also considered Fidelity fee structures and other information with respect to clients of Fidelity, such as other funds advised or subadvised by Fidelity, pension plan clients, and other institutional clients. The Board noted the findings of the 2013 ad hoc joint committee (created with the board of other Fidelity funds), which reviewed and compared Fidelity's institutional investment advisory business with its business of providing services to the Fidelity funds, including the differences in services provided, fees charged, and costs incurred, as well as competition in their respective marketplaces.
Annual Report
Board Approval of Investment Advisory Contracts and
Management Fees - continued
Based on its review of total expense ratios and fees charged to other Fidelity clients, the Board concluded that the total expense ratio of each class of the fund was reasonable, although in all cases above the median of the universe presented for comparison, in light of the services that the fund and its shareholders receive and the other factors considered.
Costs of the Services and Profitability. The Board considered the revenues earned and the expenses incurred by Fidelity in conducting the business of developing, marketing, distributing, managing, administering and servicing the fund and servicing the fund's shareholders. The Board also considered the level of Fidelity's profits in respect of all the Fidelity funds.
On an annual basis, Fidelity presents to the Board Fidelity's profitability for the fund. Fidelity calculates the profitability for each fund, as well as aggregate profitability for groups of Fidelity funds and all Fidelity funds, using a series of detailed revenue and cost allocation methodologies which originate with the books and records of Fidelity on which Fidelity's audited financial statements are based. The Audit Committee of the Board reviews any significant changes from the prior year's methodologies.
PricewaterhouseCoopers LLP (PwC), independent registered public accounting firm and auditor to Fidelity and certain Fidelity funds, has been engaged annually by the Board as part of the Board's assessment of Fidelity's profitability analysis. PwC's engagement includes the review and assessment of the methodologies used by Fidelity in determining the revenues and expenses attributable to Fidelity's mutual fund business, and completion of agreed-upon procedures in respect of the mathematical accuracy of fund profitability and its conformity to established allocation methodologies. After considering PwC's reports issued under the engagement and information provided by Fidelity, the Board concluded that while other allocation methods may also be reasonable, Fidelity's profitability methodologies are reasonable in all material respects.
The Board also reviewed Fidelity's non-fund businesses and fall-out benefits related to the mutual fund business as well as cases where Fidelity's affiliates may benefit from or be related to the fund's business.
The Board considered the costs of the services provided by and the profits realized by Fidelity in connection with the operation of the fund and was satisfied that the profitability was not excessive in the circumstances.
Economies of Scale. The Board considered whether there have been economies of scale in respect of the management of the Fidelity funds, whether the Fidelity funds (including the fund) have appropriately benefited from any such economies of scale, and whether there is potential for realization of any further economies of scale. The Board considered the extent to which the fund will benefit from economies of scale through increased services to the fund, through waivers or reimbursements, or through fee or expense ratio reductions. The Board also noted that in 2013, it and the boards of other Fidelity funds created an ad hoc committee (the Economies of Scale Committee) to analyze whether Fidelity attains economies of scale in respect of the management and servicing of the Fidelity funds, whether the Fidelity funds have appropriately benefited from such economies of scale, and whether there is potential for realization of any further economies of scale.
Annual Report
The Board recognized that the fund's management contract incorporates a "group fee" structure, which provides for lower group fee rates as total group assets increase, and for higher group fee rates as total group assets decrease (with "group assets" defined to include fund assets under FMR's management plus sector fund assets previously under FMR's management and currently managed by Fidelity SelectCo, LLC). FMR calculates the group fee rates based on a tiered asset "breakpoint" schedule that varies based on asset class. The Board considered that the group fee is designed to deliver the benefits of economies of scale to fund shareholders when total Fidelity fund assets increase, even if assets of any particular fund are unchanged or have declined, because some portion of Fidelity's costs are attributable to services provided to all Fidelity funds, and all funds benefit if those costs can be allocated among more assets. The Board concluded that, given the group fee structure, fund shareholders will benefit from lower management fees as group assets increase at the fund complex level, regardless of whether Fidelity achieves any such economies of scale.
The Board concluded, taking into account the analysis of the Economies of Scale Committee, that economies of scale, if any, are being appropriately shared between fund shareholders and Fidelity.
Additional Information Requested by the Board. In order to develop fully the factual basis for consideration of the Fidelity funds' Advisory Contracts, the Board requested and received additional information on certain topics, including: (i) fund performance trends and Fidelity's long-term strategies for certain funds; (ii) Fidelity's strategic marketing and product lineup goals; (iii) the methodology with respect to competitive fund data and peer group classifications; (iv) the arrangements with, and performance of, certain sub-advisers on behalf of the Fidelity funds, as well as certain proposed participating affiliate arrangements; (v) the realization of fall-out benefits in certain Fidelity business units; (vi) Fidelity's group fee structures, including the rationale for the individual fee rates of certain categories of funds and the definition of group assets; (vii) trends regarding industry use of performance fee structures and the performance adjustment methodologies applicable to the Fidelity funds; (viii) additional competitive analysis regarding the total expenses for certain classes; (ix) fund profitability methodology, including Fidelity's cost allocation methodology, and the impact of certain factors on fund profitability results; and (x) the process by which Fidelity determines sub-advisory fees for funds it advises.
Based on its evaluation of all of the conclusions noted above, and after considering all factors it believed relevant, the Board ultimately concluded that the advisory fee structures are fair and reasonable, and that the fund's Advisory Contracts should be renewed.
Annual Report
Investment Adviser
Fidelity Management & Research Company
Boston, MA
Investment Sub-Advisers
FMR Co., Inc.
Fidelity Management & Research
(U.K.) Inc.
Fidelity Management & Research
(Hong Kong) Limited
Fidelity Management & Research
(Japan) Limited
FIL Investment Advisors
FIL Investments (Japan) Limited
FIL Investment Advisors (UK) Limited
General Distributor
Fidelity Distributors Corporation
Smithfield, RI
Transfer and Service Agents
Fidelity Investments Institutional Operations Company, Inc.
Boston, MA
Fidelity Service Company, Inc.
Boston, MA
Custodian
Brown Brothers Harriman & Co.
Boston, MA
(Fidelity Investment logo)(registered trademark)
AICAP-UANN-1214
1.784754.111
(Fidelity Investment logo)(registered trademark)
Fidelity Advisor®
International
Capital Appreciation
Fund - Institutional Class
Annual Report
October 31, 2014
(Fidelity Cover Art)
Contents
Performance | (Click Here) | How the fund has done over time. |
Management's Discussion of Fund Performance | (Click Here) | The Portfolio Manager's review of fund performance and strategy. |
Shareholder Expense Example | (Click Here) | An example of shareholder expenses. |
Investment Changes | (Click Here) | A summary of major shifts in the fund's investments over the past six months. |
Investments | (Click Here) | A complete list of the fund's investments with their market values. |
Financial Statements | (Click Here) | Statements of assets and liabilities, operations, and changes in net assets, as well as financial highlights. |
Notes | (Click Here) | Notes to the financial statements. |
Report of Independent Registered Public Accounting Firm | (Click Here) | |
Trustees and Officers | (Click Here) | |
Distributions | (Click Here) | |
Board Approval of Investment Advisory Contracts and Management Fees | (Click Here) | |
To view a fund's proxy voting guidelines and proxy voting record for the 12-month period ended June 30, visit http://www.fidelity.com/proxyvotingresults or visit the Securities and Exchange Commission's (SEC) web site at http://www.sec.gov. You may also call 1-877-208-0098 to request a free copy of the proxy voting guidelines.
Standard & Poor's, S&P and S&P 500 are registered service marks of The McGraw-Hill Companies, Inc. and have been licensed for use by Fidelity Distributors Corporation.
Other third-party marks appearing herein are the property of their respective owners.
All other marks appearing herein are registered or unregistered trademarks or service marks of FMR LLC or an affiliated company. © 2014 FMR LLC. All rights reserved.
Annual Report
This report and the financial statements contained herein are submitted for the general information of the shareholders of the fund. This report is not authorized for distribution to prospective investors in the fund unless preceded or accompanied by an effective prospectus.
A fund files its complete schedule of portfolio holdings with the SEC for the first and third quarters of each fiscal year on Form N-Q. Forms N-Q are available on the SEC's web site at http://www.sec.gov. A fund's Forms N-Q may be reviewed and copied at the SEC's Public Reference Room in Washington, DC. Information regarding the operation of the SEC's Public Reference Room may be obtained by calling 1-800-SEC-0330. For a complete list of a fund's portfolio holdings, view the most recent holdings listing, semiannual report, or annual report on Fidelity's web site at http://www.fidelity.com, http://www.advisor.fidelity.com, or http://www.401k.com, as applicable.
NOT FDIC INSURED • MAY LOSE VALUE • NO BANK GUARANTEE
Neither the fund nor Fidelity Distributors Corporation is a bank.
Annual Report
Average annual total return reflects the change in the value of an investment, assuming reinvestment of the class' distributions from dividend income and capital gains (the profits earned upon the sale of securities that have grown in value, if any) and assuming a constant rate of performance each year. The $10,000 table and the fund's returns do not reflect the deduction of taxes that a shareholder would pay on fund distributions or the redemption of fund shares. During periods of reimbursement by Fidelity, a fund's total return will be greater than it would be had the reimbursement not occurred. How a fund did yesterday is no guarantee of how it will do tomorrow.
Average Annual Total Returns
Periods ended October 31, 2014 | | Past 1
year | Past 5
years | Past 10
years |
Institutional Class | | 6.58% | 11.24% | 6.41% |
$10,000 Over 10 Years
Let's say hypothetically that $10,000 was invested in Fidelity Advisor® International Capital Appreciation Fund - Institutional Class on October 31, 2004. The chart shows how the value of your investment would have changed, and also shows how the MSCI ACWI (All Country World Index) ex USA Index performed over the same period.
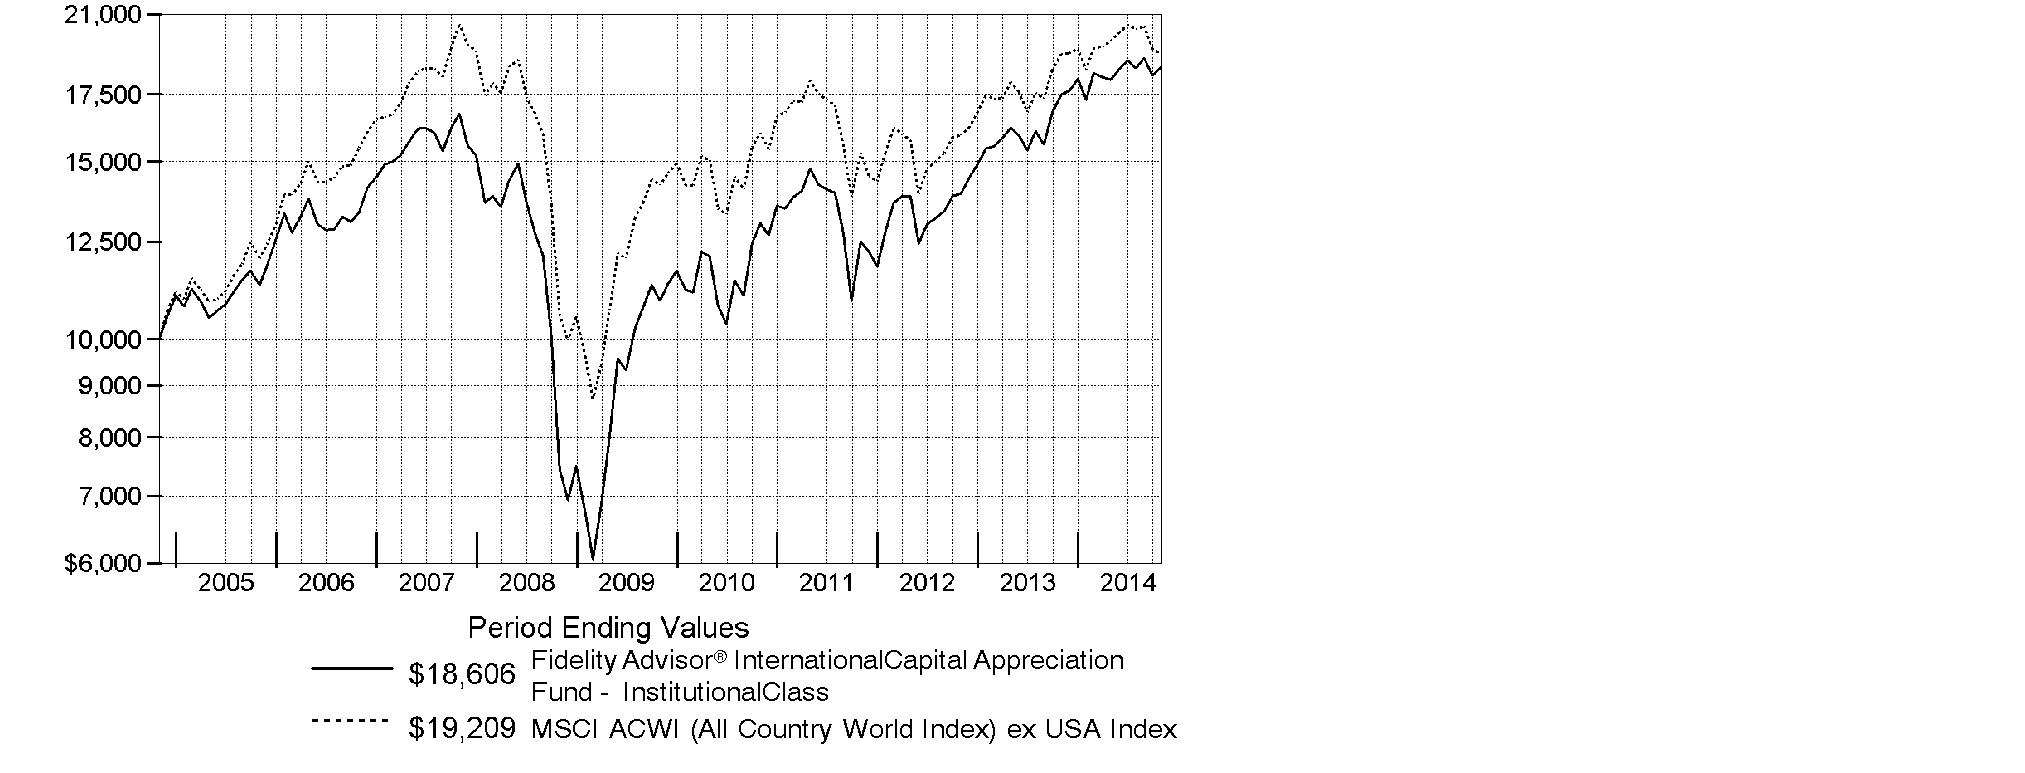
Annual Report
Market Recap: Global equities posted a healthy gain for the 12 months ending October 31, 2014, overcoming an October market decline driven by recessionary pressures in China and tepid growth in Europe. The MSCI ACWI (All Country World Index) Index rose 8.15%, helped by subdued market volatility for much of the period and supported by solid corporate earnings, especially in the United States. Stocks also benefited from easy monetary policies in Japan and the eurozone, as well as increased stimulus efforts in China. All but three of the 24 industry groups that compose the index marked a positive return. The U.S. (+17%) remained a pillar of strength, while a strongly rising dollar in the latter part of the period detracted from investors' returns in most non-U.S. markets. Canada (+5%) notched broad gains outside of its energy and materials sectors, as did Asia-Pacific ex Japan (+4%), led by investor enthusiasm for companies in India. The U.K., Europe and Japan, meanwhile, all underperformed. Among sectors, health care (+24%) led the index, with a strong contribution from the pharmaceuticals, biotechnology & life sciences industry. Information technology (+21%) also outperformed. Conversely, materials (-4%) and energy (-1%) lagged the index due to a higher supply of and lower demand for commodities.
Comments from Sammy Simnegar, Portfolio Manager of Fidelity Advisor® International Capital Appreciation Fund: For the year, the fund's Institutional Class shares returned 6.58%, handily besting the 0.18% gain of the MSCI ACWI (All Country World Index) ex USA Index. Versus this index, the fund's significant non-index exposure to the United States bolstered performance, as did its positioning in emerging markets, especially India and China. Bitauto Holdings, a Chinese automotive website that I sold, was the fund's top relative contributor. Other contributors from China's Internet industry were Baidu and Alibaba Group. Two India-based contributors were Amara Raja Batteries and Axis Bank. Elsewhere, our stake in Ireland's Shire Pharmaceuticals benefited from a buyout offer from U.S. drug company AbbVie. I sold Shire before the deal fell apart in October and subsequently bought it back at a much lower price. Conversely, not owning two strong-performing, large-capitalization drugs stocks in the index, Switzerland's Novartis and U.K.-based AstraZeneca, weighed on relative performance. Russian Internet search firm Yandex also detracted, mainly due to a plunging ruble. Not knowing how to quantify our risk here, I sold this stock. Most of the stocks mentioned in this report were not in the index.
The views expressed above reflect those of the portfolio manager(s) only through the end of the period as stated on the cover of this report and do not necessarily represent the views of Fidelity or any other person in the Fidelity organization. Any such views are subject to change at any time based upon market or other conditions and Fidelity disclaims any responsibility to update such views. These views may not be relied on as investment advice and, because investment decisions for a Fidelity fund are based on numerous factors, may not be relied on as an indication of trading intent on behalf of any Fidelity fund.
Annual Report
Shareholder Expense Example
As a shareholder of the Fund, you incur two types of costs: (1) transaction costs, including sales charges (loads) on purchase payments or redemption proceeds, redemption fees and (2) ongoing costs, including management fees, distribution and/or service (12b-1) fees and other Fund expenses. This Example is intended to help you understand your ongoing costs (in dollars) of investing in the Fund and to compare these costs with the ongoing costs of investing in other mutual funds.
The Example is based on an investment of $1,000 invested at the beginning of the period and held for the entire period (May 1, 2014 to October 31, 2014).
Actual Expenses
The first line of the accompanying table for each class of the Fund provides information about actual account values and actual expenses. You may use the information in this line, together with the amount you invested, to estimate the expenses that you paid over the period. Simply divide your account value by $1,000.00 (for example, an $8,600 account value divided by $1,000.00 = 8.6), then multiply the result by the number in the first line for a class of the Fund under the heading entitled "Expenses Paid During Period" to estimate the expenses you paid on your account during this period. In addition, the Fund, as a shareholder in the underlying Fidelity Central Funds, will indirectly bear its pro-rata share of the fees and expenses incurred by the underlying Fidelity Central Funds. These fees and expenses are not included in the Fund's annualized expense ratio used to calculate the expense estimate in the table below.
Hypothetical Example for Comparison Purposes
The second line of the accompanying table for each class of the Fund provides information about hypothetical account values and hypothetical expenses based on a Class' actual expense ratio and an assumed rate of return of 5% per year before expenses, which is not the Class' actual return. The hypothetical account values and expenses may not be used to estimate the actual ending account balance or expenses you paid for the period. You may use this information to compare the ongoing costs of investing in the Fund and other funds. To do so, compare this 5% hypothetical example with the 5% hypothetical examples that appear in the shareholder reports of the other funds. In addition, the Fund, as a shareholder in the underlying Fidelity Central Funds, will indirectly bear its pro-rata share of the fees and expenses incurred by the underlying Fidelity Central Funds. These fees and expenses are not included in the Fund's annualized expense ratio used to calculate the expense estimate in the table below.
Please note that the expenses shown in the table are meant to highlight your ongoing costs only and do not reflect any transaction costs. Therefore, the second line of the table is useful in comparing ongoing costs only, and will not help you determine the relative total costs of owning different funds. In addition, if these transactional costs were included, your costs would have been higher.
Annual Report
| Annualized
Expense Ratio B | Beginning
Account Value
May 1, 2014 | Ending
Account Value
October 31, 2014 | Expenses Paid
During Period*
May 1, 2014
to October 31, 2014 |
Class A | 1.45% | | | |
Actual | | $ 1,000.00 | $ 1,028.60 | $ 7.41 |
Hypothetical A | | $ 1,000.00 | $ 1,017.90 | $ 7.38 |
Class T | 1.70% | | | |
Actual | | $ 1,000.00 | $ 1,027.00 | $ 8.69 |
Hypothetical A | | $ 1,000.00 | $ 1,016.64 | $ 8.64 |
Class B | 2.20% | | | |
Actual | | $ 1,000.00 | $ 1,024.50 | $ 11.23 |
Hypothetical A | | $ 1,000.00 | $ 1,014.12 | $ 11.17 |
Class C | 2.20% | | | |
Actual | | $ 1,000.00 | $ 1,024.60 | $ 11.23 |
Hypothetical A | | $ 1,000.00 | $ 1,014.12 | $ 11.17 |
Institutional Class | 1.20% | | | |
Actual | | $ 1,000.00 | $ 1,029.40 | $ 6.14 |
Hypothetical A | | $ 1,000.00 | $ 1,019.16 | $ 6.11 |
A 5% return per year before expenses
B Annualized expense ratio reflects expenses net of applicable fee waivers.
* Expenses are equal to each Class' annualized expense ratio, multiplied by the average account value over the period, multiplied by 184/365 (to reflect the one-half year period).
Annual Report
Investment Changes (Unaudited)
Top Five Stocks as of October 31, 2014 |
| % of fund's
net assets | % of fund's net assets
6 months ago |
Nestle SA sponsored ADR (Switzerland, Food Products) | 1.6 | 0.0 |
Bayer AG (Germany, Pharmaceuticals) | 1.0 | 0.9 |
British American Tobacco PLC (United Kingdom) (United Kingdom, Tobacco) | 0.9 | 0.8 |
Novo Nordisk A/S Series B sponsored ADR (Denmark, Pharmaceuticals) | 0.8 | 0.7 |
Anheuser-Busch InBev SA NV (Belgium, Beverages) | 0.7 | 0.7 |
| 5.0 | |
Top Five Market Sectors as of October 31, 2014 |
| % of fund's
net assets | % of fund's net assets
6 months ago |
Consumer Discretionary | 21.1 | 23.0 |
Industrials | 18.1 | 21.0 |
Financials | 14.8 | 10.3 |
Health Care | 12.3 | 12.7 |
Materials | 11.1 | 6.7 |
Top Five Countries as of October 31, 2014 |
(excluding cash equivalents) | % of fund's
net assets | % of fund's net assets
6 months ago |
United States of America | 15.8 | 16.6 |
United Kingdom | 15.0 | 16.1 |
Japan | 7.4 | 10.1 |
India | 5.6 | 2.9 |
France | 5.4 | 5.3 |
Percentages are adjusted for the effect of open futures contracts, if applicable. |
Asset Allocation (% of fund's net assets) |
As of October 31, 2014 | As of April 30, 2014 |
 | Stocks 98.9% | | | Stocks 99.0% | |
 | Short-Term
Investments and
Net Other Assets (Liabilities) 1.1% | | | Short-Term
Investments and
Net Other Assets (Liabilities) 1.0% | |

Annual Report
Investments October 31, 2014
Showing Percentage of Net Assets
Common Stocks - 98.2% |
| Shares | | Value |
Australia - 4.0% |
Amcor Ltd. | 59,012 | | $ 612,949 |
Carsales.com Ltd. | 76,566 | | 722,505 |
CSL Ltd. | 11,433 | | 807,203 |
DuluxGroup Ltd. | 127,061 | | 600,475 |
Ramsay Health Care Ltd. | 11,739 | | 542,675 |
realestate.com.au Ltd. | 17,793 | | 712,452 |
SEEK Ltd. | 46,235 | | 678,493 |
Sydney Airport unit | 165,382 | | 642,961 |
Transurban Group unit | 97,279 | | 696,703 |
TOTAL AUSTRALIA | | 6,016,416 |
Bailiwick of Jersey - 1.6% |
Experian PLC | 44,831 | | 673,056 |
Shire PLC | 14,100 | | 946,067 |
WPP PLC | 38,000 | | 742,241 |
TOTAL BAILIWICK OF JERSEY | | 2,361,364 |
Belgium - 0.9% |
Anheuser-Busch InBev SA NV | 10,580 | | 1,173,263 |
Arseus NV | 6,800 | | 271,833 |
TOTAL BELGIUM | | 1,445,096 |
Bermuda - 0.8% |
Credicorp Ltd. (United States) | 3,520 | | 566,720 |
Invesco Ltd. | 15,100 | | 611,097 |
TOTAL BERMUDA | | 1,177,817 |
Brazil - 2.0% |
BB Seguridade Participacoes SA | 47,100 | | 628,406 |
Cielo SA | 37,720 | | 619,406 |
Kroton Educacional SA | 95,400 | | 679,916 |
Qualicorp SA (a) | 54,300 | | 552,226 |
Ultrapar Participacoes SA | 25,400 | | 554,046 |
TOTAL BRAZIL | | 3,034,000 |
British Virgin Islands - 0.7% |
Mail.Ru Group Ltd. GDR (Reg. S) (a) | 20,800 | | 504,192 |
Michael Kors Holdings Ltd. (a) | 6,900 | | 542,271 |
TOTAL BRITISH VIRGIN ISLANDS | | 1,046,463 |
Canada - 3.9% |
Alimentation Couche-Tard, Inc. Class B (sub. vtg.) | 18,200 | | 617,674 |
AutoCanada, Inc. | 8,870 | | 492,668 |
Common Stocks - continued |
| Shares | | Value |
Canada - continued |
Canadian National Railway Co. | 15,360 | | $ 1,082,921 |
Canadian Pacific Railway Ltd. | 4,410 | | 917,294 |
CI Financial Corp. | 19,700 | | 572,795 |
Constellation Software, Inc. | 2,150 | | 605,674 |
Jean Coutu Group, Inc. Class A (sub. vtg.) | 23,000 | | 527,324 |
PrairieSky Royalty Ltd. (d) | 16,300 | | 501,850 |
Stantec, Inc. | 8,400 | | 532,225 |
TOTAL CANADA | | 5,850,425 |
Cayman Islands - 2.6% |
Alibaba Group Holding Ltd. sponsored ADR | 6,900 | | 680,340 |
Baidu.com, Inc. sponsored ADR (a) | 2,800 | | 668,556 |
Melco Crown Entertainment Ltd. sponsored ADR | 25,400 | | 689,356 |
Sands China Ltd. | 117,800 | | 734,732 |
Tencent Holdings Ltd. | 71,800 | | 1,153,989 |
TOTAL CAYMAN ISLANDS | | 3,926,973 |
Denmark - 1.5% |
Novo Nordisk A/S Series B sponsored ADR | 28,200 | | 1,274,076 |
Topdanmark A/S (a) | 17,000 | | 540,955 |
Tryg A/S | 4,900 | | 529,641 |
TOTAL DENMARK | | 2,344,672 |
Egypt - 0.4% |
Commercial International Bank SAE sponsored GDR | 84,000 | | 571,200 |
Finland - 0.9% |
Kone Oyj (B Shares) | 14,700 | | 631,851 |
Sampo Oyj (A Shares) | 16,300 | | 779,674 |
TOTAL FINLAND | | 1,411,525 |
France - 5.4% |
Air Liquide SA | 7,282 | | 878,323 |
Bureau Veritas SA | 25,394 | | 627,858 |
Christian Dior SA | 5,000 | | 884,411 |
Dassault Systemes SA | 8,990 | | 569,712 |
Essilor International SA | 6,342 | | 700,173 |
Ingenico SA | 5,780 | | 575,618 |
L'Oreal SA | 5,000 | | 783,845 |
Pernod Ricard SA | 5,400 | | 614,648 |
Publicis Groupe SA (a) | 9,630 | | 666,989 |
Safran SA | 10,730 | | 679,038 |
Common Stocks - continued |
| Shares | | Value |
France - continued |
Sodexo SA | 6,900 | | $ 664,675 |
Zodiac Aerospace | 19,220 | | 586,122 |
TOTAL FRANCE | | 8,231,412 |
Germany - 4.4% |
Axel Springer Verlag AG | 10,430 | | 572,351 |
Bayer AG | 10,400 | | 1,478,567 |
CTS Eventim AG | 22,122 | | 583,275 |
Fresenius SE & Co. KGaA | 12,900 | | 663,599 |
Henkel AG & Co. KGaA | 8,333 | | 757,186 |
Linde AG | 4,500 | | 829,805 |
ProSiebenSat.1 Media AG | 16,290 | | 656,406 |
Symrise AG | 9,800 | | 551,104 |
Wirecard AG | 15,930 | | 570,034 |
TOTAL GERMANY | | 6,662,327 |
Hong Kong - 1.2% |
AIA Group Ltd. | 187,000 | | 1,043,539 |
Galaxy Entertainment Group Ltd. | 104,000 | | 711,141 |
TOTAL HONG KONG | | 1,754,680 |
India - 5.6% |
Amara Raja Batteries Ltd. (a) | 52,534 | | 560,516 |
Axis Bank Ltd. (a) | 87,263 | | 643,148 |
Exide Industries Ltd. | 210,669 | | 540,119 |
GlaxoSmithKline Consumer Healthcare Ltd. | 5,551 | | 499,817 |
Grasim Industries Ltd. sponsored GDR | 9,942 | | 569,975 |
HDFC Bank Ltd. | 39,382 | | 638,593 |
Housing Development Finance Corp. Ltd. | 43,324 | | 780,232 |
ICICI Bank Ltd. (a) | 24,730 | | 656,755 |
ITC Ltd. (a) | 98,334 | | 568,558 |
Larsen & Toubro Ltd. (a) | 25,821 | | 695,856 |
LIC Housing Finance Ltd. | 115,805 | | 681,946 |
Sun Pharmaceutical Industries Ltd. | 38,701 | | 532,597 |
Sun TV Ltd. | 103,907 | | 552,608 |
Titan Co. Ltd. (a) | 77,668 | | 510,199 |
TOTAL INDIA | | 8,430,919 |
Indonesia - 2.8% |
PT ACE Hardware Indonesia Tbk | 8,557,300 | | 574,347 |
PT Bank Central Asia Tbk | 554,800 | | 598,929 |
PT Bank Rakyat Indonesia Tbk | 702,000 | | 643,310 |
PT Global Mediacom Tbk | 3,732,200 | | 605,738 |
Common Stocks - continued |
| Shares | | Value |
Indonesia - continued |
PT Indocement Tunggal Prakarsa Tbk | 326,900 | | $ 647,911 |
PT Semen Gresik (Persero) Tbk | 470,600 | | 618,158 |
PT Surya Citra Media Tbk | 1,939,100 | | 542,792 |
TOTAL INDONESIA | | 4,231,185 |
Ireland - 2.4% |
Actavis PLC (a) | 2,756 | | 668,991 |
Allegion PLC | 10,900 | | 578,681 |
Jazz Pharmaceuticals PLC (a) | 3,300 | | 557,172 |
Kerry Group PLC Class A | 8,990 | | 610,495 |
Mallinckrodt PLC (a) | 6,200 | | 571,516 |
Perrigo Co. PLC | 3,700 | | 597,365 |
TOTAL IRELAND | | 3,584,220 |
Italy - 0.4% |
Azimut Holding SpA | 23,300 | | 544,258 |
Japan - 7.4% |
Astellas Pharma, Inc. | 49,500 | | 768,265 |
Daikin Industries Ltd. | 11,200 | | 700,091 |
Daito Trust Construction Co. Ltd. | 4,200 | | 523,323 |
Dentsu, Inc. | 18,060 | | 671,462 |
Fuji Heavy Industries Ltd. | 20,600 | | 685,633 |
Hoya Corp. | 20,200 | | 714,814 |
Kansai Paint Co. Ltd. | 43,000 | | 657,321 |
Keyence Corp. | 1,487 | | 720,574 |
Misumi Group, Inc. | 21,500 | | 678,408 |
Nippon Paint Holdings Co. Ltd. | 28,000 | | 635,806 |
OBIC Co. Ltd. | 15,100 | | 539,056 |
Olympus Corp. (a) | 17,100 | | 613,977 |
OMRON Corp. | 15,270 | | 722,800 |
Recruit Holdings Co. Ltd. (a) | 18,800 | | 642,557 |
SK Kaken Co. Ltd. | 7,130 | | 545,677 |
SMC Corp. | 2,200 | | 623,994 |
Suzuki Motor Corp. | 21,800 | | 730,704 |
TOTAL JAPAN | | 11,174,462 |
Kenya - 0.7% |
Kenya Commercial Bank Ltd. | 908,300 | | 558,485 |
Safaricom Ltd. | 4,219,000 | | 575,425 |
TOTAL KENYA | | 1,133,910 |
Common Stocks - continued |
| Shares | | Value |
Korea (South) - 0.8% |
Coway Co. Ltd. | 6,919 | | $ 525,472 |
NAVER Corp. | 923 | | 647,722 |
TOTAL KOREA (SOUTH) | | 1,173,194 |
Luxembourg - 0.9% |
Altice SA | 11,100 | | 691,186 |
Eurofins Scientific SA | 2,800 | | 707,554 |
TOTAL LUXEMBOURG | | 1,398,740 |
Mexico - 2.1% |
Banregio Grupo Financiero S.A.B. de CV | 85,025 | | 491,729 |
Fomento Economico Mexicano S.A.B. de CV sponsored ADR | 6,420 | | 617,861 |
Grupo Aeroportuario del Pacifico SA de CV Series B | 74,100 | | 504,152 |
Grupo Aeroportuario Norte S.A.B. de CV | 99,200 | | 494,223 |
Grupo Televisa SA de CV (CPO) sponsored ADR | 18,500 | | 668,590 |
Megacable Holdings S.A.B. de CV unit | 96,700 | | 442,991 |
TOTAL MEXICO | | 3,219,546 |
Netherlands - 0.9% |
IMCD Group BV | 21,200 | | 584,469 |
Reed Elsevier NV | 35,534 | | 817,783 |
TOTAL NETHERLANDS | | 1,402,252 |
Nigeria - 0.7% |
Dangote Cement PLC | 404,093 | | 524,479 |
Guaranty Trust Bank PLC | 3,248,238 | | 490,226 |
TOTAL NIGERIA | | 1,014,705 |
Norway - 0.8% |
Gjensidige Forsikring ASA (d) | 29,300 | | 532,139 |
Schibsted ASA (B Shares) (d) | 11,860 | | 627,556 |
TOTAL NORWAY | | 1,159,695 |
Philippines - 1.4% |
Alliance Global Group, Inc. | 1,033,900 | | 581,527 |
GT Capital Holdings, Inc. | 22,565 | | 507,023 |
SM Investments Corp. | 30,915 | | 538,714 |
SM Prime Holdings, Inc. | 1,333,300 | | 518,290 |
TOTAL PHILIPPINES | | 2,145,554 |
Russia - 0.4% |
Magnit OJSC GDR (Reg. S) | 9,595 | | 642,865 |
Common Stocks - continued |
| Shares | | Value |
South Africa - 1.5% |
Aspen Pharmacare Holdings Ltd. | 16,730 | | $ 596,772 |
Life Healthcare Group Holdings Ltd. | 153,300 | | 579,579 |
Naspers Ltd. Class N | 8,230 | | 1,024,214 |
TOTAL SOUTH AFRICA | | 2,200,565 |
Spain - 1.0% |
Amadeus IT Holding SA Class A | 19,760 | | 725,534 |
Grifols SA ADR | 20,500 | | 725,495 |
TOTAL SPAIN | | 1,451,029 |
Sweden - 2.2% |
ASSA ABLOY AB (B Shares) | 13,006 | | 688,860 |
Atlas Copco AB (A Shares) (d) | 26,000 | | 750,337 |
Elekta AB (B Shares) | 61,700 | | 631,694 |
Hexagon AB (B Shares) | 18,800 | | 632,679 |
HEXPOL AB (B Shares) | 7,200 | | 636,715 |
TOTAL SWEDEN | | 3,340,285 |
Switzerland - 4.0% |
Compagnie Financiere Richemont SA Series A | 11,614 | | 977,138 |
Givaudan SA | 370 | | 616,442 |
Nestle SA sponsored ADR | 32,900 | | 2,412,551 |
Partners Group Holding AG | 2,280 | | 606,049 |
SGS SA (Reg.) | 320 | | 702,427 |
Sika AG (Bearer) | 185 | | 659,513 |
TOTAL SWITZERLAND | | 5,974,120 |
Thailand - 0.7% |
Airports of Thailand PCL (For. Reg.) | 71,400 | | 530,381 |
Kasikornbank PCL (For. Reg.) | 80,100 | | 580,145 |
TOTAL THAILAND | | 1,110,526 |
Turkey - 0.4% |
TAV Havalimanlari Holding A/S | 70,000 | | 587,362 |
United Kingdom - 15.0% |
Aberdeen Asset Management PLC | 90,700 | | 629,703 |
Al Noor Hospitals Group PLC | 35,200 | | 573,793 |
Aon PLC | 7,000 | | 602,000 |
Ashtead Group PLC | 38,940 | | 650,332 |
Berendsen PLC | 36,700 | | 592,961 |
Berkeley Group Holdings PLC | 14,900 | | 543,450 |
British American Tobacco PLC (United Kingdom) | 23,893 | | 1,354,198 |
Bunzl PLC | 23,300 | | 631,778 |
Common Stocks - continued |
| Shares | | Value |
United Kingdom - continued |
Burberry Group PLC | 25,900 | | $ 634,327 |
Capita Group PLC | 36,500 | | 640,528 |
Compass Group PLC | 46,641 | | 750,593 |
Diageo PLC sponsored ADR | 9,766 | | 1,152,095 |
Diploma PLC | 50,490 | | 561,747 |
Elementis PLC | 143,500 | | 605,801 |
Filtrona PLC | 56,900 | | 624,872 |
Galiform PLC | 105,203 | | 576,068 |
Halma PLC | 61,200 | | 609,927 |
InterContinental Hotel Group PLC | 16,000 | | 607,762 |
Intertek Group PLC | 13,830 | | 602,211 |
ITV PLC | 194,100 | | 630,319 |
Johnson Matthey PLC | 13,338 | | 634,556 |
London Stock Exchange Group PLC | 20,463 | | 659,603 |
Persimmon PLC | 26,000 | | 608,494 |
Prudential PLC | 43,739 | | 1,012,822 |
Reckitt Benckiser Group PLC | 11,100 | | 932,225 |
Rightmove PLC | 17,130 | | 578,200 |
SABMiller PLC | 15,660 | | 883,058 |
Schroders PLC | 15,400 | | 593,959 |
St. James's Place Capital PLC | 57,119 | | 680,731 |
Standard Life PLC | 98,856 | | 622,597 |
The Restaurant Group PLC | 53,215 | | 575,891 |
Whitbread PLC | 10,319 | | 720,379 |
Zoopla Property Group PLC (d) | 161,100 | | 533,979 |
TOTAL UNITED KINGDOM | | 22,610,959 |
United States of America - 15.8% |
A.O. Smith Corp. | 10,707 | | 571,218 |
Affiliated Managers Group, Inc. (a) | 3,300 | | 659,307 |
AMETEK, Inc. | 11,300 | | 589,295 |
Amphenol Corp. Class A | 11,068 | | 559,819 |
AutoZone, Inc. (a) | 1,061 | | 587,285 |
Ball Corp. | 8,900 | | 573,427 |
Biogen Idec, Inc. (a) | 1,800 | | 577,944 |
Danaher Corp. | 7,269 | | 584,428 |
Domino's Pizza, Inc. | 5,800 | | 514,982 |
Ecolab, Inc. | 5,600 | | 622,888 |
Fidelity National Information Services, Inc. | 9,763 | | 570,062 |
Fiserv, Inc. (a) | 7,439 | | 516,862 |
Gartner, Inc. Class A (a) | 6,600 | | 532,686 |
Google, Inc. Class C (a) | 1,143 | | 639,028 |
Common Stocks - continued |
| Shares | | Value |
United States of America - continued |
Home Depot, Inc. | 5,600 | | $ 546,112 |
International Flavors & Fragrances, Inc. | 5,800 | | 575,070 |
Kansas City Southern | 4,591 | | 563,729 |
Las Vegas Sands Corp. | 11,646 | | 725,080 |
MasterCard, Inc. Class A | 7,700 | | 644,875 |
McGraw Hill Financial, Inc. | 6,904 | | 624,674 |
McKesson Corp. | 3,250 | | 661,083 |
Mettler-Toledo International, Inc. (a) | 2,500 | | 646,175 |
Moody's Corp. | 5,400 | | 535,842 |
NIKE, Inc. Class B | 5,400 | | 502,038 |
Pall Corp. | 6,500 | | 594,230 |
PPG Industries, Inc. | 3,090 | | 629,402 |
Praxair, Inc. | 4,600 | | 579,554 |
priceline.com, Inc. (a) | 553 | | 667,034 |
Roper Industries, Inc. | 3,700 | | 585,710 |
Sherwin-Williams Co. | 2,700 | | 619,812 |
The Walt Disney Co. | 6,193 | | 565,916 |
Thermo Fisher Scientific, Inc. | 4,800 | | 564,336 |
TransDigm Group, Inc. | 3,400 | | 635,902 |
Union Pacific Corp. | 5,500 | | 640,475 |
United Technologies Corp. | 5,481 | | 586,467 |
Valspar Corp. | 7,300 | | 599,768 |
Verisk Analytics, Inc. (a) | 9,000 | | 561,150 |
Visa, Inc. Class A | 2,950 | | 712,219 |
W.R. Grace & Co. (a) | 6,440 | | 609,224 |
Wyndham Worldwide Corp. | 7,600 | | 590,292 |
TOTAL UNITED STATES OF AMERICA | | 23,865,400 |
TOTAL COMMON STOCKS (Cost $134,540,345) |
148,230,121
|
Nonconvertible Preferred Stocks - 0.7% |
| | | |
Colombia - 0.3% |
Grupo Aval Acciones y Valores SA | 759,572 | | 514,995 |
Germany - 0.4% |
Sartorius AG (non-vtg.) | 5,497 | | 599,305 |
TOTAL NONCONVERTIBLE PREFERRED STOCKS (Cost $1,116,695) |
1,114,300
|
Money Market Funds - 2.5% |
| Shares | | Value |
Fidelity Cash Central Fund, 0.11% (b) | 1,565,446 | | $ 1,565,446 |
Fidelity Securities Lending Cash Central Fund, 0.11% (b)(c) | 2,149,267 | | 2,149,267 |
TOTAL MONEY MARKET FUNDS (Cost $3,714,713) |
3,714,713
|
TOTAL INVESTMENT PORTFOLIO - 101.4% (Cost $139,371,753) | | 153,059,134 |
NET OTHER ASSETS (LIABILITIES) - (1.4)% | | (2,101,414) |
NET ASSETS - 100% | $ 150,957,720 |
Legend |
(a) Non-income producing |
(b) Affiliated fund that is generally available only to investment companies and other accounts managed by Fidelity Investments. The rate quoted is the annualized seven-day yield of the fund at period end. A complete unaudited listing of the fund's holdings as of its most recent quarter end is available upon request. In addition, each Fidelity Central Fund's financial statements, which are not covered by the Fund's Report of Independent Registered Public Accounting Firm, are available on the SEC's website or upon request. |
(c) Investment made with cash collateral received from securities on loan. |
(d) Security or a portion of the security is on loan at period end. |
Affiliated Central Funds |
Information regarding fiscal year to date income earned by the Fund from investments in Fidelity Central Funds is as follows: |
Fund | Income earned |
Fidelity Cash Central Fund | $ 794 |
Fidelity Securities Lending Cash Central Fund | 26,748 |
Total | $ 27,542 |
Other Information |
Categorizations in the Schedule of Investments are based on country or territory of incorporation. |
The following is a summary of the inputs used, as of October 31, 2014, involving the Fund's assets and liabilities carried at fair value. The inputs or methodology used for valuing securities may not be an indication of the risk associated with investing in those securities. For more information on valuation inputs, and their aggregation into the levels used in the tables below, please refer to the Investment Valuation section in the accompanying Notes to Financial Statements. |
Valuation Inputs at Reporting Date: |
Description | Total | Level 1 | Level 2 | Level 3 |
Investments in Securities: | | | | |
Equities: | | | | |
Consumer Discretionary | $ 31,445,638 | $ 22,523,708 | $ 8,921,930 | $ - |
Consumer Staples | 14,147,663 | 10,551,827 | 3,595,836 | - |
Energy | 1,055,896 | 1,055,896 | - | - |
Financials | 22,974,840 | 14,146,785 | 8,828,055 | - |
Health Care | 18,410,032 | 14,199,248 | 4,210,784 | - |
Industrials | 27,198,769 | 19,628,568 | 7,570,201 | - |
Information Technology | 16,692,662 | 12,118,924 | 4,573,738 | - |
Materials | 16,843,496 | 12,525,199 | 4,318,297 | - |
Telecommunication Services | 575,425 | 575,425 | - | - |
Money Market Funds | 3,714,713 | 3,714,713 | - | - |
Total Investments in Securities: | $ 153,059,134 | $ 111,040,293 | $ 42,018,841 | $ - |
The following is a summary of transfers between Level 1 and Level 2 for the period ended October 31, 2014. Transfers are assumed to have occurred at the beginning of the period, and are primarily attributable to the valuation techniques used for foreign equity securities, as discussed in the accompanying Notes to Financial Statements: |
Transfers | Total |
Level 1 to Level 2 | $ 11,921,613 |
Level 2 to Level 1 | $ 0 |
See accompanying notes which are an integral part of the financial statements.
Annual Report
Statement of Assets and Liabilities
| October 31, 2014 |
| | |
Assets | | |
Investment in securities, at value (including securities loaned of $2,059,178) - See accompanying schedule: Unaffiliated issuers (cost $135,657,040) | $ 149,344,421 | |
Fidelity Central Funds (cost $3,714,713) | 3,714,713 | |
Total Investments (cost $139,371,753) | | $ 153,059,134 |
Foreign currency held at value (cost $89,040) | | 89,040 |
Receivable for investments sold | | 2,564,924 |
Receivable for fund shares sold | | 178,375 |
Dividends receivable | | 189,885 |
Distributions receivable from Fidelity Central Funds | | 832 |
Prepaid expenses | | 407 |
Receivable from investment adviser for expense reductions | | 38,473 |
Other receivables | | 227,531 |
Total assets | | 156,348,601 |
| | |
Liabilities | | |
Payable for investments purchased | $ 2,620,328 | |
Unrealized depreciation on foreign currency contracts | 772 | |
Payable for fund shares redeemed | 194,602 | |
Accrued management fee | 106,502 | |
Distribution and service plan fees payable | 51,773 | |
Other affiliated payables | 38,045 | |
Other payables and accrued expenses | 229,592 | |
Collateral on securities loaned, at value | 2,149,267 | |
Total liabilities | | 5,390,881 |
| | |
Net Assets | | $ 150,957,720 |
Net Assets consist of: | | |
Paid in capital | | $ 206,522,161 |
Undistributed net investment income | | 157,952 |
Accumulated undistributed net realized gain (loss) on investments and foreign currency transactions | | (69,220,288) |
Net unrealized appreciation (depreciation) on investments and assets and liabilities in foreign currencies | | 13,497,895 |
Net Assets | | $ 150,957,720 |
See accompanying notes which are an integral part of the financial statements.
Annual Report
Financial Statements - continued
Statement of Assets and Liabilities - continued
| October 31, 2014 |
| | |
Calculation of Maximum Offering Price Class A:
Net Asset Value and redemption price per share ($51,567,048 ÷ 3,492,183 shares) | | $ 14.77 |
| | |
Maximum offering price per share (100/94.25 of $14.77) | | $ 15.67 |
Class T:
Net Asset Value and redemption price per share ($58,454,176 ÷ 4,040,004 shares) | | $ 14.47 |
| | |
Maximum offering price per share (100/96.50 of $14.47) | | $ 14.99 |
Class B:
Net Asset Value and offering price per share ($1,577,039 ÷ 117,876 shares)A | | $ 13.38 |
| | |
Class C:
Net Asset Value and offering price per share ($20,910,335 ÷ 1,568,930 shares)A | | $ 13.33 |
| | |
Institutional Class:
Net Asset Value, offering price and redemption price per share ($18,449,122 ÷ 1,171,354 shares) | | $ 15.75 |
A Redemption price per share is equal to net asset value less any applicable contingent deferred sales charge.
See accompanying notes which are an integral part of the financial statements.
Annual Report
Statement of Operations
| Year ended October 31, 2014 |
| | |
Investment Income | | |
Dividends | | $ 2,857,116 |
Income from Fidelity Central Funds | | 27,542 |
Income before foreign taxes withheld | | 2,884,658 |
Less foreign taxes withheld | | (200,663) |
Total income | | 2,683,995 |
| | |
Expenses | | |
Management fee
Basic fee | $ 1,008,061 | |
Performance adjustment | 262,396 | |
Transfer agent fees | 375,894 | |
Distribution and service plan fees | 651,528 | |
Accounting and security lending fees | 74,843 | |
Custodian fees and expenses | 227,831 | |
Independent trustees' compensation | 588 | |
Registration fees | 64,507 | |
Audit | 79,131 | |
Legal | 619 | |
Miscellaneous | 1,262 | |
Total expenses before reductions | 2,746,660 | |
Expense reductions | (376,204) | 2,370,456 |
Net investment income (loss) | | 313,539 |
Realized and Unrealized Gain (Loss) Net realized gain (loss) on: | | |
Investment securities: | | |
Unaffiliated issuers (net of foreign taxes of $95,019) | 17,479,071 | |
Foreign currency transactions | (81,172) | |
Total net realized gain (loss) | | 17,397,899 |
Change in net unrealized appreciation (depreciation) on: Investment securities (net of decrease in deferred foreign taxes of $37,720) | (9,394,720) | |
Assets and liabilities in foreign currencies | (120) | |
Total change in net unrealized appreciation (depreciation) | | (9,394,840) |
Net gain (loss) | | 8,003,059 |
Net increase (decrease) in net assets resulting from operations | | $ 8,316,598 |
See accompanying notes which are an integral part of the financial statements.
Annual Report
Financial Statements - continued
Statement of Changes in Net Assets
| Year ended
October 31,
2014 | Year ended
October 31,
2013 |
Increase (Decrease) in Net Assets | | |
Operations | | |
Net investment income (loss) | $ 313,539 | $ 465,401 |
Net realized gain (loss) | 17,397,899 | 18,319,822 |
Change in net unrealized appreciation (depreciation) | (9,394,840) | 9,778,382 |
Net increase (decrease) in net assets resulting
from operations | 8,316,598 | 28,563,605 |
Distributions to shareholders from net investment income | (450,291) | (589,021) |
Share transactions - net increase (decrease) | 1,810,485 | (6,558,856) |
Redemption fees | 1,603 | 1,022 |
Total increase (decrease) in net assets | 9,678,395 | 21,416,750 |
| | |
Net Assets | | |
Beginning of period | 141,279,325 | 119,862,575 |
End of period (including undistributed net investment income of $157,952 and undistributed net investment income of $430,763, respectively) | $ 150,957,720 | $ 141,279,325 |
See accompanying notes which are an integral part of the financial statements.
Annual Report
Financial Highlights - Class A
Years ended October 31, | 2014 | 2013 | 2012 | 2011 | 2010 |
Selected Per-Share Data | | | | | |
Net asset value, beginning of period | $ 13.96 | $ 11.25 | $ 10.21 | $ 10.85 | $ 9.34 |
Income from Investment Operations | | | | | |
Net investment income (loss) C | .06 | .07 | .08 | .08F | .06 |
Net realized and unrealized gain (loss) | .82 | 2.73 | 1.05 | (.53) | 1.69 |
Total from investment operations | .88 | 2.80 | 1.13 | (.45) | 1.75 |
Distributions from net investment income | (.07) | (.09) | (.09) | (.08) | (.08) |
Distributions from net realized gain | - | - | (.01) | (.12) | (.16) |
Total distributions | (.07) | (.09) | (.09) I | (.19) J | (.24) |
Redemption fees added to paid in capital C,H | - | - | - | - | - |
Net asset value, end of period | $ 14.77 | $ 13.96 | $ 11.25 | $ 10.21 | $ 10.85 |
Total ReturnA, B | 6.31% | 24.99% | 11.19% | (4.25)% | 18.98% |
Ratios to Average Net Assets D, G | | | | | |
Expenses before reductions | 1.73% | 1.74% | 1.78% | 1.64% | 1.45% |
Expenses net of fee waivers, if any | 1.45% | 1.45% | 1.45% | 1.45% | 1.45% |
Expenses net of all reductions | 1.44% | 1.39% | 1.41% | 1.38% | 1.27% |
Net investment income (loss) | .42% | .58% | .73% | .74% F | .66% |
Supplemental Data | | | | | |
Net assets, end of period (000 omitted) | $ 51,567 | $ 49,797 | $ 40,624 | $ 40,364 | $ 49,058 |
Portfolio turnover rateE | 197% | 138% | 142% | 254% | 490% |
A Total returns would have been lower if certain expenses had not been reduced during the applicable periods shown.
B Total returns do not include the effect of the sales charges.
C Calculated based on average shares outstanding during the period.
D Fees and expenses of any underlying Fidelity Central Funds are not included in the Fund's expense ratio. The Fund indirectly bears its proportionate share of the expenses of any underlying Fidelity Central Funds.
E Amount does not include the portfolio activity of any underlying Fidelity Central Funds.
F Investment income per share reflects a large, non-recurring dividend which amounted to $.03 per share. Excluding this non-recurring dividend, the ratio of net investment income (loss) to average net assets would have been .49%.
G Expense ratios reflect operating expenses of the class. Expenses before reductions do not reflect amounts reimbursed by the investment adviser or reductions from brokerage service arrangements or reductions from other expense offset arrangements and do not represent the amount paid by the class during periods when reimbursements or reductions occur. Expenses net of fee waivers reflect expenses after reimbursement by the investment adviser but prior to reductions from brokerage service arrangements or other expense offset arrangements. Expenses net of all reductions represent the net expenses paid by the class.
H Amount represents less than $.01 per share.
I Total distributions of $.09 per share is comprised of distributions from net investment income of $.085 and distributions from net realized gain of $.005 per share.
J Total distributions of $.19 per share is comprised of distributions from net investment income of $.077 and distributions from net realized gain of $.116 per share.
See accompanying notes which are an integral part of the financial statements.
Annual Report
Financial Highlights - Class T
Years ended October 31, | 2014 | 2013 | 2012 | 2011 | 2010 |
Selected Per-Share Data | | | | | |
Net asset value, beginning of period | $ 13.68 | $ 11.03 | $ 10.00 | $ 10.63 | $ 9.16 |
Income from Investment Operations | | | | | |
Net investment income (loss) C | .02 | .04 | .05 | .05F | .04 |
Net realized and unrealized gain (loss) | .81 | 2.66 | 1.04 | (.52) | 1.65 |
Total from investment operations | .83 | 2.70 | 1.09 | (.47) | 1.69 |
Distributions from net investment income | (.04) | (.05) | (.06) | (.05) | (.06) |
Distributions from net realized gain | - | - | (.01) | (.12) | (.16) |
Total distributions | (.04) | (.05) | (.06) I | (.16) J | (.22) |
Redemption fees added to paid in capital C,H | - | - | - | - | - |
Net asset value, end of period | $ 14.47 | $ 13.68 | $ 11.03 | $ 10.00 | $ 10.63 |
Total ReturnA, B | 6.07% | 24.57% | 10.99% | (4.51)% | 18.65% |
Ratios to Average Net Assets D, G | | | | | |
Expenses before reductions | 1.94% | 1.96% | 2.03% | 1.88% | 1.69% |
Expenses net of fee waivers, if any | 1.70% | 1.70% | 1.70% | 1.70% | 1.69% |
Expenses net of all reductions | 1.69% | 1.64% | 1.66% | 1.62% | 1.51% |
Net investment income (loss) | .17% | .33% | .48% | .49% F | .42% |
Supplemental Data | | | | | |
Net assets, end of period (000 omitted) | $ 58,454 | $ 60,152 | $ 53,835 | $ 59,914 | $ 74,056 |
Portfolio turnover rateE | 197% | 138% | 142% | 254% | 490% |
A Total returns would have been lower if certain expenses had not been reduced during the applicable periods shown.
B Total returns do not include the effect of the sales charges.
C Calculated based on average shares outstanding during the period.
D Fees and expenses of any underlying Fidelity Central Funds are not included in the Fund's expense ratio. The Fund indirectly bears its proportionate share of the expenses of any underlying Fidelity Central Funds.
E Amount does not include the portfolio activity of any underlying Fidelity Central Funds.
F Investment income per share reflects a large, non-recurring dividend which amounted to $.03 per share. Excluding this non-recurring dividend, the ratio of net investment income (loss) to average net assets would have been .24%.
G Expense ratios reflect operating expenses of the class. Expenses before reductions do not reflect amounts reimbursed by the investment adviser or reductions from brokerage service arrangements or reductions from other expense offset arrangements and do not represent the amount paid by the class during periods when reimbursements or reductions occur. Expenses net of fee waivers reflect expenses after reimbursement by the investment adviser but prior to reductions from brokerage service arrangements or other expense offset arrangements. Expenses net of all reductions represent the net expenses paid by the class.
H Amount represents less than $.01 per share.
I Total distributions of $.06 per share is comprised of distributions from net investment income of $.056 and distributions from net realized gain of $.005 per share.
J Total distributions of $.16 per share is comprised of distributions from net investment income of $.047 and distributions from net realized gain of $.116 per share.
See accompanying notes which are an integral part of the financial statements.
Annual Report
Financial Highlights - Class B
Years ended October 31, | 2014 | 2013 | 2012 | 2011 | 2010 |
Selected Per-Share Data | | | | | |
Net asset value, beginning of period | $ 12.68 | $ 10.22 | $ 9.26 | $ 9.84 | $ 8.51 |
Income from Investment Operations | | | | | |
Net investment income (loss) C | (.04) | (.02) | - H | - F, H | (.01) |
Net realized and unrealized gain (loss) | .74 | 2.48 | .96 | (.48) | 1.53 |
Total from investment operations | .70 | 2.46 | .96 | (.48) | 1.52 |
Distributions from net investment income | - | - | - | (.01) | (.03) |
Distributions from net realized gain | - | - | - | (.09) | (.16) |
Total distributions | - | - | - | (.10) | (.19) |
Redemption fees added to paid in capital C,H | - | - | - | - | - |
Net asset value, end of period | $ 13.38 | $ 12.68 | $ 10.22 | $ 9.26 | $ 9.84 |
Total ReturnA, B | 5.52% | 24.07% | 10.37% | (4.99)% | 18.03% |
Ratios to Average Net Assets D, G | | | | | |
Expenses before reductions | 2.50% | 2.51% | 2.54% | 2.39% | 2.20% |
Expenses net of fee waivers, if any | 2.20% | 2.20% | 2.20% | 2.20% | 2.20% |
Expenses net of all reductions | 2.19% | 2.15% | 2.16% | 2.13% | 2.02% |
Net investment income (loss) | (.33)% | (.17)% | (.02)% | (.01)% F | (.09)% |
Supplemental Data | | | | | |
Net assets, end of period (000 omitted) | $ 1,577 | $ 2,228 | $ 2,745 | $ 4,241 | $ 8,737 |
Portfolio turnover rateE | 197% | 138% | 142% | 254% | 490% |
A Total returns would have been lower if certain expenses had not been reduced during the applicable periods shown.
B Total returns do not include the effect of the contingent deferred sales charge.
C Calculated based on average shares outstanding during the period.
D Fees and expenses of any underlying Fidelity Central Funds are not included in the Fund's expense ratio. The Fund indirectly bears its proportionate share of the expenses of any underlying Fidelity Central Funds.
E Amount does not include the portfolio activity of any underlying Fidelity Central Funds.
F Investment income per share reflects a large, non-recurring dividend which amounted to $.03 per share. Excluding this non-recurring dividend, the ratio of net investment income (loss) to average net assets would have been (.26) %.
G Expense ratios reflect operating expenses of the class. Expenses before reductions do not reflect amounts reimbursed by the investment adviser or reductions from brokerage service arrangements or reductions from other expense offset arrangements and do not represent the amount paid by the class during periods when reimbursements or reductions occur. Expenses net of fee waivers reflect expenses after reimbursement by the investment adviser but prior to reductions from brokerage service arrangements or other expense offset arrangements. Expenses net of all reductions represent the net expenses paid by the class.
H Amount represents less than $.01 per share.
See accompanying notes which are an integral part of the financial statements.
Annual Report
Financial Highlights - Class C
Years ended October 31, | 2014 | 2013 | 2012 | 2011 | 2010 |
Selected Per-Share Data | | | | | |
Net asset value, beginning of period | $ 12.63 | $ 10.18 | $ 9.23 | $ 9.84 | $ 8.51 |
Income from Investment Operations | | | | | |
Net investment income (loss) C | (.04) | (.02) | - H | - F, H | (.01) |
Net realized and unrealized gain (loss) | .74 | 2.47 | .96 | (.49) | 1.53 |
Total from investment operations | .70 | 2.45 | .96 | (.49) | 1.52 |
Distributions from net investment income | - | - | (.01) | (.01) | (.04) |
Distributions from net realized gain | - | - | (.01) | (.11) | (.16) |
Total distributions | - | - | (.01) I | (.12) | (.19) J |
Redemption fees added to paid in capital C,H | - | - | - | - | - |
Net asset value, end of period | $ 13.33 | $ 12.63 | $ 10.18 | $ 9.23 | $ 9.84 |
Total ReturnA, B | 5.54% | 24.07% | 10.41% | (5.07)% | 18.12% |
Ratios to Average Net Assets D, G | | | | | |
Expenses before reductions | 2.47% | 2.49% | 2.53% | 2.39% | 2.20% |
Expenses net of fee waivers, if any | 2.20% | 2.20% | 2.20% | 2.20% | 2.20% |
Expenses net of all reductions | 2.19% | 2.14% | 2.16% | 2.13% | 2.02% |
Net investment income (loss) | (.33)% | (.17)% | (.02)% | (.01)% F | (.09)% |
Supplemental Data | | | | | |
Net assets, end of period (000 omitted) | $ 20,910 | $ 21,334 | $ 18,090 | $ 19,619 | $ 24,809 |
Portfolio turnover rateE | 197% | 138% | 142% | 254% | 490% |
A Total returns would have been lower if certain expenses had not been reduced during the applicable periods shown.
B Total returns do not include the effect of the contingent deferred sales charge.
C Calculated based on average shares outstanding during the period.
D Fees and expenses of any underlying Fidelity Central Funds are not included in the Fund's expense ratio. The Fund indirectly bears its proportionate share of the expenses of any underlying Fidelity Central Funds.
E Amount does not include the portfolio activity of any underlying Fidelity Central Funds.
F Investment income per share reflects a large, non-recurring dividend which amounted to $.03 per share. Excluding this non-recurring dividend, the ratio of net investment income (loss) to average net assets would have been (.26) %.
G Expense ratios reflect operating expenses of the class. Expenses before reductions do not reflect amounts reimbursed by the investment adviser or reductions from brokerage service arrangements or reductions from other expense offset arrangements and do not represent the amount paid by the class during periods when reimbursements or reductions occur. Expenses net of fee waivers reflect expenses after reimbursement by the investment adviser but prior to reductions from brokerage service arrangements or other expense offset arrangements. Expenses net of all reductions represent the net expenses paid by the class.
H Amount represents less than $.01 per share.
I Total distributions of $.01 per share is comprised of distributions from net investment income of $.005 and distributions from net realized gain of $.005 per share.
J Total distributions of $.19 per share is comprised of distributions from net investment income of $.037 and distributions from net realized gain of $.155 per share.
See accompanying notes which are an integral part of the financial statements.
Annual Report
Financial Highlights - Institutional Class
Years ended October 31, | 2014 | 2013 | 2012 | 2011 | 2010 |
Selected Per-Share Data | | | | | |
Net asset value, beginning of period | $ 14.87 | $ 11.99 | $ 10.87 | $ 11.54 | $ 9.91 |
Income from Investment Operations | | | | | |
Net investment income (loss) B | .10 | .11 | .11 | .12E | .10 |
Net realized and unrealized gain (loss) | .87 | 2.89 | 1.13 | (.57) | 1.78 |
Total from investment operations | .97 | 3.00 | 1.24 | (.45) | 1.88 |
Distributions from net investment income | (.09) | (.12) | (.12) | (.11) | (.09) |
Distributions from net realized gain | - | - | (.01) | (.12) | (.16) |
Total distributions | (.09) | (.12) | (.12) H | (.22) I | (.25) |
Redemption fees added to paid in capital B, G | - | - | - | - | - |
Net asset value, end of period | $ 15.75 | $ 14.87 | $ 11.99 | $ 10.87 | $ 11.54 |
Total ReturnA | 6.58% | 25.20% | 11.56% | (4.01)% | 19.22% |
Ratios to Average Net Assets C, F | | | | | |
Expenses before reductions | 1.38% | 1.39% | 1.48% | 1.35% | 1.19% |
Expenses net of fee waivers, if any | 1.20% | 1.20% | 1.20% | 1.20% | 1.19% |
Expenses net of all reductions | 1.20% | 1.14% | 1.16% | 1.12% | 1.01% |
Net investment income (loss) | .67% | .83% | .98% | 1.00% E | .93% |
Supplemental Data | | | | | |
Net assets, end of period (000 omitted) | $ 18,449 | $ 7,768 | $ 4,568 | $ 4,335 | $ 4,345 |
Portfolio turnover rateD | 197% | 138% | 142% | 254% | 490% |
A Total returns would have been lower if certain expenses had not been reduced during the applicable periods shown.
B Calculated based on average shares outstanding during the period.
C Fees and expenses of any underlying Fidelity Central Funds are not included in the Fund's expense ratio. The Fund indirectly bears its proportionate share of the expenses of any underlying Fidelity Central Funds.
D Amount does not include the portfolio activity of any underlying Fidelity Central Funds.
E Investment income per share reflects a large, non-recurring dividend which amounted to $.03 per share. Excluding this non-recurring dividend, the ratio of net investment income (loss) to average net assets would have been .74%.
F Expense ratios reflect operating expenses of the class. Expenses before reductions do not reflect amounts reimbursed by the investment adviser or reductions from brokerage service arrangements or reductions from other expense offset arrangements and do not represent the amount paid by the class during periods when reimbursements or reductions occur. Expenses net of fee waivers reflect expenses after reimbursement by the investment adviser but prior to reductions from brokerage service arrangements or other expense offset arrangements. Expenses net of all reductions represent the net expenses paid by the class.
G Amount represents less than $.01 per share.
H Total distributions of $.12 per share is comprised of distributions from net investment income of $.115 and distributions from net realized gain of $.005 per share.
I Total distributions of $.22 per share is comprised of distributions from net investment income of $.107 and distributions from net realized gain of $.116 per share.
See accompanying notes which are an integral part of the financial statements.
Annual Report
Notes to Financial Statements
For the period ended October 31, 2014
1. Organization.
Fidelity Advisor International Capital Appreciation Fund (the Fund) is a fund of Fidelity Advisor Series VIII (the Trust) and is authorized to issue an unlimited number of shares. The Trust is registered under the Investment Company Act of 1940, as amended (the 1940 Act), as an open-end management investment company organized as a Massachusetts business trust. The Fund offers Class A, Class T, Class C and Institutional Class shares, each of which, along with Class B shares, has equal rights as to assets and voting privileges. Class B shares are closed to new accounts and additional purchases, except for exchanges and reinvestments. Each class has exclusive voting rights with respect to matters that affect that class. Class B shares will automatically convert to Class A shares after a holding period of seven years from the initial date of purchase. The Fund's investments in emerging markets can be subject to social, economic, regulatory, and political uncertainties and can be extremely volatile.
2. Investments in Fidelity Central Funds.
The Fund invests in Fidelity Central Funds, which are open-end investment companies generally available only to other investment companies and accounts managed by the investment adviser and its affiliates. The Fund's Schedule of Investments lists each of the Fidelity Central Funds held as of period end, if any, as an investment of the Fund, but does not include the underlying holdings of each Fidelity Central Fund. As an Investing Fund, the Fund indirectly bears its proportionate share of the expenses of the underlying Fidelity Central Funds.
The Money Market Central Funds seek preservation of capital and current income and are managed by Fidelity Investments Money Management, Inc. (FIMM), an affiliate of the investment adviser. Annualized expenses of the Money Market Central Funds as of their most recent shareholder report date are less than .01%.
A complete unaudited list of holdings for each Fidelity Central Fund is available upon request or at the Securities and Exchange Commission (the SEC) website at www.sec.gov. In addition, the financial statements of the Fidelity Central Funds, which are not covered by the Fund's Report of Independent Registered Public Accounting Firm, are available on the SEC website or upon request.
3. Significant Accounting Policies.
The financial statements have been prepared in conformity with accounting principles generally accepted in the United States of America (GAAP), which require management to make certain estimates and assumptions at the date of the financial statements. Actual results could differ from those estimates. Subsequent events, if any, through the date that the financial statements were issued have been evaluated in the preparation of
Annual Report
3. Significant Accounting Policies - continued
the financial statements. The following summarizes the significant accounting policies of the Fund:
Investment Valuation. Investments are valued as of 4:00 p.m. Eastern time on the last calendar day of the period. In accordance with valuation policies and procedures approved by the Board of Trustees (the Board), the Fund attempts to obtain prices from one or more third party pricing vendors or brokers to value its investments. When current market prices, quotations or currency exchange rates are not readily available or reliable, investments will be fair valued in good faith by the Fidelity Management & Research Company (FMR) Fair Value Committee (the Committee), in accordance with procedures adopted by the Board. Factors used in determining fair value vary by investment type and may include market or investment specific events. The frequency with which these procedures are used cannot be predicted and they may be utilized to a significant extent. The Committee oversees the Fund's valuation policies and procedures and is responsible for approving and reporting to the Board all fair value determinations.
The Fund categorizes the inputs to valuation techniques used to value its investments into a disclosure hierarchy consisting of three levels as shown below:
Level 1 - quoted prices in active markets for identical investments
Level 2 - other significant observable inputs (including quoted prices for similar investments, interest rates, prepayment speeds, etc.)
Level 3 - unobservable inputs (including the Fund's own assumptions based on the best information available)
Valuation techniques used to value the Fund's investments by major category are as follows:
Equity securities, including restricted securities, for which market quotations are readily available, are valued at the last reported sale price or official closing price as reported by a third party pricing vendor on the primary market or exchange on which they are traded and are categorized as Level 1 in the hierarchy. In the event there were no sales during the day or closing prices are not available, securities are valued at the last quoted bid price or may be valued using the last available price and are generally categorized as Level 2 in the hierarchy. For foreign equity securities, when market or security specific events arise, comparisons to the valuation of American Depositary Receipts (ADRs), futures contracts, Exchange-Traded Funds (ETFs) and certain indexes as well as quoted prices for similar securities may be used and would be categorized as Level 2 in the hierarchy. Utilizing these techniques may result in transfers between Level 1 and Level 2. For equity securities, including restricted securities, where observable inputs are
Annual Report
Notes to Financial Statements - continued
3. Significant Accounting Policies - continued
Investment Valuation - continued
limited, assumptions about market activity and risk are used and these securities may be categorized as Level 3 in the hierarchy.
Investments in open-end mutual funds, including the Fidelity Central Funds, are valued at their closing net asset value (NAV) each business day and are categorized as Level 1 in the hierarchy.
Changes in valuation techniques may result in transfers in or out of an assigned level within the disclosure hierarchy. The aggregate value of investments by input level, as of October 31, 2014, including information on transfers between Levels 1 and 2 is included at the end of the Fund's Schedule of Investments.
Foreign Currency. The Fund may use foreign currency contracts to facilitate transactions in foreign-denominated securities. Gains and losses from these transactions may arise from changes in the value of the foreign currency or if the counterparties do not perform under the contracts' terms.
Foreign-denominated assets, including investment securities, and liabilities are translated into U.S. dollars at the exchange rates at period end. Purchases and sales of investment securities, income and dividends received and expenses denominated in foreign currencies are translated into U.S. dollars at the exchange rate in effect on the transaction date.
The effects of exchange rate fluctuations on investments are included with the net realized and unrealized gain (loss) on investment securities. Other foreign currency transactions resulting in realized and unrealized gain (loss) are disclosed separately.
Investment Transactions and Income. For financial reporting purposes, the Fund's investment holdings and NAV include trades executed through the end of the last business day of the period. The NAV per share for processing shareholder transactions is calculated as of the close of business of the New York Stock Exchange (NYSE), normally 4:00 p.m. Eastern time and includes trades executed through the end of the prior business day. Gains and losses on securities sold are determined on the basis of identified cost and may include proceeds received from litigation. Dividend income is recorded on the ex-dividend date, except for certain dividends from foreign securities where the ex-dividend date may have passed, which are recorded as soon as the Fund is informed of the ex-dividend date. Non-cash dividends included in dividend income, if any, are recorded at the fair market value of the securities received. Income and capital gain distributions from Fidelity Central Funds, if any, are recorded on the ex-dividend date. Distributions received on securities that represent a return of capital or capital gain are recorded as a reduction of cost of investments and/or as a realized gain. Subsequent to
Annual Report
3. Significant Accounting Policies - continued
Investment Transactions and Income - continued
ex-dividend date the Fund determines the components of these distributions, based upon receipt of tax filings or other correspondence relating to the underlying investment. Investment income is recorded net of foreign taxes withheld where recovery of such taxes is uncertain.
Class Allocations and Expenses. Investment income, realized and unrealized capital gains and losses, common expenses of the Fund, and certain fund-level expense reductions, if any, are allocated daily on a pro-rata basis to each class based on the relative net assets of each class to the total net assets of the Fund. Each class differs with respect to transfer agent and distribution and service plan fees incurred. Certain expense reductions may also differ by class. For the reporting period, the allocated portion of income and expenses to each class as a percent of its average net assets may vary due to the timing of recording these transactions in relation to fluctuating net assets of the classes. Expenses directly attributable to a fund are charged to that fund. Expenses attributable to more than one fund are allocated among the respective funds on the basis of relative net assets or other appropriate methods. Expense estimates are accrued in the period to which they relate and adjustments are made when actual amounts are known.
Income Tax Information and Distributions to Shareholders. Each year, the Fund intends to qualify as a regulated investment company under Subchapter M of the Internal Revenue Code, including distributing substantially all of its taxable income and realized gains. As a result, no provision for U.S. Federal income taxes is required. As of October 31, 2014, the Fund did not have any unrecognized tax benefits in the financial statements; nor is the Fund aware of any tax positions for which it is reasonably possible that the total amounts of unrecognized tax benefits will significantly change in the next twelve months. The Fund files a U.S. federal tax return, in addition to state and local tax returns as required. The Fund's federal income tax returns are subject to examination by the Internal Revenue Service (IRS) for a period of three fiscal years after they are filed. State and local tax returns may be subject to examination for an additional fiscal year depending on the jurisdiction. Foreign taxes are provided for based on the Fund's understanding of the tax rules and rates that exist in the foreign markets in which it invests. The Fund is subject to a tax imposed on capital gains by certain countries in which it invests. An estimated deferred tax liability for net unrealized appreciation on the applicable securities is included in Other payables and accrued expenses on the Statement of Assets & Liabilities.
Distributions are declared and recorded on the ex-dividend date. Income dividends and capital gain distributions are declared separately for each class. Income and capital gain distributions are determined in accordance with income tax regulations, which may differ from GAAP.
Annual Report
Notes to Financial Statements - continued
3. Significant Accounting Policies - continued
Income Tax Information and Distributions to Shareholders - continued
Capital accounts within the financial statements are adjusted for permanent book-tax differences. These adjustments have no impact on net assets or the results of operations. Capital accounts are not adjusted for temporary book-tax differences which will reverse in a subsequent period.
Book-tax differences are primarily due to foreign currency transactions, certain foreign taxes, passive foreign investment companies (PFIC), partnerships, capital loss carryforwards and losses deferred due to wash sales.
The federal tax cost of investment securities and unrealized appreciation (depreciation) as of period end were as follows:
Gross unrealized appreciation | $ 16,855,011 |
Gross unrealized depreciation | (3,597,611) |
Net unrealized appreciation (depreciation) on securities | $ 13,257,400 |
| |
Tax Cost | $ 139,801,734 |
The tax-based components of distributable earnings as of period end were as follows:
Undistributed ordinary income | $ 161,594 |
Capital loss carryforward | $ (68,790,306) |
Net unrealized appreciation (depreciation) on securities and other investments | $ 13,155,342 |
Capital loss carryforwards are only available to offset future capital gains of the Fund to the extent provided by regulations and may be limited. Under the Regulated Investment Company Modernization Act of 2010 (the Act), the Fund is permitted to carry forward capital losses incurred in taxable years beginning after December 22, 2010 for an unlimited period and such capital losses are required to be used prior to any losses that expire. The capital loss carryforward information presented below, including any applicable limitation, is estimated as of fiscal period end and is subject to adjustment.
Fiscal year of expiration | |
2016 | $ (44,822,434) |
2017 | (23,967,872) |
Total capital loss carryforward | $ (68,790,306) |
The tax character of distributions paid was as follows:
| October 31, 2014 | October 31, 2013 |
Ordinary Income | $ 450,291 | $ 589,021 |
Annual Report
3. Significant Accounting Policies - continued
Short-Term Trading (Redemption) Fees. During the period, shares held by investors in the Fund less than 30 days may have been subject to a redemption fee equal to 1.00% of the NAV of shares redeemed. All redemption fees, which reduce the proceeds of the shareholder redemption, are retained by the Fund and accounted for as an addition to paid in capital.
New Accounting Pronouncement. In June 2014, the Financial Accounting Standards Board issued Accounting Standard Update No. 2014-11, Repurchase-to-Maturity Transactions, Repurchase Financings, and Disclosures. The Update amends the accounting for certain repurchase agreements and expands disclosure requirements for reverse repurchase agreements, securities lending and other similar transactions. The disclosure requirements are effective for annual and interim reporting periods beginning after December 15, 2014. Management is currently evaluating the impact of the Update on the Fund's financial statements and related disclosures.
4. Purchases and Sales of Investments.
Purchases and sales of securities, other than short-term securities, aggregated $284,334,736 and $283,544,326, respectively.
5. Fees and Other Transactions with Affiliates.
Management Fee. Fidelity Management & Research Company (the investment adviser) and its affiliates provide the Fund with investment management related services for which the Fund pays a monthly management fee. The management fee is the sum of an individual fund fee rate that is based on an annual rate of .45% of the Fund's average net assets and an annualized group fee rate that averaged .25% during the period. The group fee rate is based upon the average net assets of all the mutual funds advised by the investment adviser, including any mutual funds previously advised by the investment adviser that are currently advised by Fidelity SelectCo, LLC, an affiliate of the investment adviser. The group fee rate decreases as assets under management increase and increases as assets under management decrease. In addition, the management fee is subject to a performance adjustment (up to a maximum of ± .20% of the Fund's average net assets over a 36 month performance period). The upward or downward adjustment to the management fee is based on the relative investment performance of the Institutional Class of the Fund as compared to its benchmark index, the MSCI All Country World ex USA Index, over the same 36 month performance period. For the reporting period, the total annual management fee rate, including the performance adjustment, was .88% of the Fund's average net assets. The performance adjustment included in the management fee rate may be higher or lower than the maximum performance adjustment rate due to the difference between the average net assets for the reporting and performance periods.
Annual Report
Notes to Financial Statements - continued
5. Fees and Other Transactions with Affiliates - continued
Distribution and Service Plan Fees. In accordance with Rule 12b-1 of the 1940 Act, the Fund has adopted separate Distribution and Service Plans for each class of shares. Certain classes pay Fidelity Distributors Corporation (FDC), an affiliate of the investment adviser, separate Distribution and Service Fees, each of which is based on an annual percentage of each class' average net assets. In addition, FDC may pay financial intermediaries for selling shares of the Fund and providing shareholder support services. For the period, the Distribution and Service Fee rates, total fees and amounts retained by FDC were as follows:
| Distribution
Fee | Service
Fee | Total Fees | Retained
by FDC |
Class A | -% | .25% | $ 128,903 | $ 1,848 |
Class T | .25% | .25% | 295,198 | 1,314 |
Class B | .75% | .25% | 19,143 | 14,497 |
Class C | .75% | .25% | 208,284 | 12,266 |
| | | $ 651,528 | $ 29,925 |
Sales Load. FDC may receive a front-end sales charge of up to 5.75% for selling Class A shares and 3.50% for selling Class T shares, some of which is paid to financial intermediaries for selling shares of the Fund. Depending on the holding period, FDC may receive contingent deferred sales charges levied on Class A, Class T, Class B and Class C redemptions. The deferred sales charges range from 5.00% to 1.00% for Class B shares, 1.00% for Class C shares, 1.00% for certain purchases of Class A shares and .25% for certain purchases of Class T shares.
For the period, sales charge amounts retained by FDC were as follows:
| Retained
by FDC |
Class A | $ 11,032 |
Class T | 4,460 |
Class B* | 925 |
Class C* | 624 |
| $ 17,041 |
* When Class B and Class C shares are initially sold, FDC pays commissions from its own resources to financial intermediaries through which the sales are made.
Transfer Agent Fees. Fidelity Investments Institutional Operations Company, Inc., (FIIOC), an affiliate of the investment adviser, is the transfer, dividend disbursing and shareholder servicing agent for each class of the Fund. FIIOC receives account fees and asset-based fees that vary according to the account size and type of account of the shareholders of the respective classes of the Fund. FIIOC pays for typesetting, printing and mailing of shareholder reports, except proxy statements.
Annual Report
5. Fees and Other Transactions with Affiliates - continued
Transfer Agent Fees - continued
For the period, transfer agent fees for each class were as follows:
| Amount | % of
Class-Level Average
Net Assets |
Class A | $ 145,961 | .28 |
Class T | 146,337 | .25 |
Class B | 5,821 | .30 |
Class C | 57,949 | .28 |
Institutional Class | 19,826 | .19 |
| $ 375,894 | |
Accounting and Security Lending Fees. Fidelity Service Company, Inc. (FSC), an affiliate of the investment adviser, maintains the Fund's accounting records. The accounting fee is based on the level of average net assets for each month. Under a separate contract, FSC administers the security lending program. The security lending fee is based on the number and duration of lending transactions.
Brokerage Commissions. The Fund placed a portion of its portfolio transactions with brokerage firms which are affiliates of the investment adviser. Brokerage commissions are included in net realized gain (loss) and change in net unrealized appreciation (depreciation) in the Statement of Operations. The commissions paid to these affiliated firms were $1,125 for the period.
6. Committed Line of Credit.
The Fund participates with other funds managed by the investment adviser or an affiliate in a $4.25 billion credit facility (the "line of credit") to be utilized for temporary or emergency purposes to fund shareholder redemptions or for other short-term liquidity purposes. The Fund has agreed to pay commitment fees on its pro-rata portion of the line of credit, which amounted to $231 and is reflected in Miscellaneous expenses on the Statement of Operations. During the period, the Fund did not borrow on this line of credit.
7. Security Lending.
The Fund lends portfolio securities through a lending agent from time to time in order to earn additional income. For equity securities, a lending agent is used and may loan securities to certain qualified borrowers, including Fidelity Capital Markets (FCM), a broker-dealer affiliated with the Fund. On the settlement date of the loan, the Fund receives collateral (in the form of U.S. Treasury obligations, letters of credit and/or cash)
Annual Report
Notes to Financial Statements - continued
7. Security Lending - continued
against the loaned securities and maintains collateral in an amount not less than 100% of the market value of the loaned securities during the period of the loan. The market value of the loaned securities is determined at the close of business of the Fund and any additional required collateral is delivered to the Fund on the next business day. If the borrower defaults on its obligation to return the securities loaned because of insolvency or other reasons, the Fund may apply collateral received from the borrower against the obligation. The Fund may experience delays and costs in recovering the securities loaned. Any cash collateral received is invested in the Fidelity Securities Lending Cash Central Fund. The value of loaned securities and cash collateral at period end are disclosed on the Fund's Statement of Assets and Liabilities. Security lending income represents the income earned on investing cash collateral, less rebates paid to borrowers and any lending agent fees associated with the loan, plus any premium payments received for lending certain types of securities. Security lending income is presented in the Statement of Operations as a component of income from Fidelity Central Funds. Total security lending income during the period amounted to $26,748. During the period, there were no securities loaned to FCM.
8. Expense Reductions.
The investment adviser voluntarily agreed to reimburse each class to the extent annual operating expenses exceeded certain levels of average net assets as noted in the table below. Some expenses, for example interest expense, including commitment fees, are excluded from this reimbursement.
The following classes were in reimbursement during the period:
| Expense
Limitations | Reimbursement |
| | |
Class A | 1.45% | $ 142,758 |
Class T | 1.70% | 143,072 |
Class B | 2.20% | 5,810 |
Class C | 2.20% | 56,744 |
Institutional Class | 1.20% | 18,766 |
| | $ 367,150 |
Commissions paid to certain brokers with whom the investment adviser, or its affiliates, places trades on behalf of the Fund include an amount in addition to trade execution, which may be rebated back to the Fund to offset certain expenses. This amount totaled $8,891 for the period. In addition, through arrangements with the Fund's custodian, credits realized as a result of uninvested cash balances were used to reduce the Fund's expenses. During the period, these credits reduced the Fund's custody expenses by $163.
Annual Report
9. Distributions to Shareholders.
Distributions to shareholders of each class were as follows:
Years ended October 31, | 2014 | 2013 |
From net investment income | | |
Class A | $ 236,147 | $ 304,584 |
Class T | 164,337 | 238,717 |
Institutional Class | 49,807 | 45,720 |
Total | $ 450,291 | $ 589,021 |
10. Share Transactions.
Share transactions for each class were as follows and may contain automatic conversions between classes or exchanges between funds:
| Shares | Dollars |
Years ended October 31, | 2014 | 2013 | 2014 | 2013 |
Class A | | | | |
Shares sold | 642,209 | 542,469 | $ 9,254,741 | $ 6,750,503 |
Reinvestment of distributions | 15,568 | 23,725 | 216,240 | 277,180 |
Shares redeemed | (733,015) | (609,733) | (10,574,352) | (7,602,328) |
Net increase (decrease) | (75,238) | (43,539) | $ (1,103,371) | $ (574,645) |
Class T | | | | |
Shares sold | 398,294 | 451,400 | $ 5,642,426 | $ 5,558,789 |
Reinvestment of distributions | 11,818 | 20,410 | 161,195 | 234,026 |
Shares redeemed | (765,657) | (959,232) | (10,811,536) | (11,719,932) |
Net increase (decrease) | (355,545) | (487,422) | $ (5,007,915) | $ (5,927,117) |
Class B | | | | |
Shares sold | 922 | 6,302 | $ 12,411 | $ 70,561 |
Shares redeemed | (58,773) | (99,127) | (768,373) | (1,122,489) |
Net increase (decrease) | (57,851) | (92,825) | $ (755,962) | $ (1,051,928) |
Class C | | | | |
Shares sold | 194,612 | 239,470 | $ 2,542,538 | $ 2,763,917 |
Shares redeemed | (314,314) | (327,038) | (4,057,639) | (3,712,216) |
Net increase (decrease) | (119,702) | (87,568) | $ (1,515,101) | $ (948,299) |
Institutional Class | | | | |
Shares sold | 801,555 | 235,849 | $ 12,565,571 | $ 3,203,149 |
Reinvestment of distributions | 2,539 | 3,069 | 37,521 | 38,142 |
Shares redeemed | (154,955) | (97,820) | (2,410,258) | (1,298,158) |
Net increase (decrease) | 649,139 | 141,098 | $ 10,192,834 | $ 1,943,133 |
Annual Report
Notes to Financial Statements - continued
11. Other.
The Fund's organizational documents provide former and current trustees and officers with a limited indemnification against liabilities arising in connection with the performance of their duties to the Fund. In the normal course of business, the Fund may also enter into contracts that provide general indemnifications. The Fund's maximum exposure under these arrangements is unknown as this would be dependent on future claims that may be made against the Fund. The risk of material loss from such claims is considered remote.
Annual Report
To the Trustees of Fidelity Advisor Series VIII and Shareholders of Fidelity Advisor International Capital Appreciation Fund:
We have audited the accompanying statement of assets and liabilities of Fidelity Advisor International Capital Appreciation Fund (the Fund), a fund of Fidelity Advisor Series VIII, including the schedule of investments, as of October 31, 2014, and the related statement of operations for the year then ended, the statement of changes in net assets for each of the two years in the period then ended, and the financial highlights for each of the five years in the period then ended. These financial statements and financial highlights are the responsibility of the Fund's management. Our responsibility is to express an opinion on these financial statements and financial highlights based on our audits.
We conducted our audits in accordance with the standards of the Public Company Accounting Oversight Board (United States). Those standards require that we plan and perform the audit to obtain reasonable assurance about whether the financial statements and financial highlights are free of material misstatement. The Fund is not required to have, nor were we engaged to perform, an audit of its internal control over financial reporting. Our audits included consideration of internal control over financial reporting as a basis for designing audit procedures that are appropriate in the circumstances, but not for the purpose of expressing an opinion on the effectiveness of the Fund's internal control over financial reporting. Accordingly, we express no such opinion. An audit also includes examining, on a test basis, evidence supporting the amounts and disclosures in the financial statements, assessing the accounting principles used and significant estimates made by management, as well as evaluating the overall financial statement presentation. Our procedures included confirmation of securities owned as of October 31, 2014, by correspondence with the custodians and brokers; where replies were not received from brokers, we performed other auditing procedures. We believe that our audits provide a reasonable basis for our opinion.
In our opinion, the financial statements and financial highlights referred to above present fairly, in all material respects, the financial position of Fidelity Advisor International Capital Appreciation Fund as of October 31, 2014, the results of its operations for the year then ended, the changes in its net assets for each of the two years in the period then ended, and the financial highlights for each of the five years in the period then ended, in conformity with accounting principles generally accepted in the United States of America.
DELOITTE & TOUCHE LLP
Boston, Massachusetts
December 18, 2014
Annual Report
The Trustees, Member of the Advisory Board, and officers of the trust and fund, as applicable, are listed below. The Board of Trustees governs the fund and is responsible for protecting the interests of shareholders. The Trustees are experienced executives who meet periodically throughout the year to oversee the fund's activities, review contractual arrangements with companies that provide services to the fund, oversee management of the risks associated with such activities and contractual arrangements, and review the fund's performance. Except for James C. Curvey, each of the Trustees oversees 174 funds. Mr. Curvey oversees 407 funds.
The Trustees hold office without limit in time except that (a) any Trustee may resign; (b) any Trustee may be removed by written instrument, signed by at least two-thirds of the number of Trustees prior to such removal; (c) any Trustee who requests to be retired or who has become incapacitated by illness or injury may be retired by written instrument signed by a majority of the other Trustees; and (d) any Trustee may be removed at any special meeting of shareholders by a two-thirds vote of the outstanding voting securities of the trust. Each Trustee who is not an interested person (as defined in the 1940 Act) of the trust and the fund (Independent Trustee), shall retire not later than the last day of the calendar year in which his or her 75th birthday occurs. The Independent Trustees may waive this mandatory retirement age policy with respect to individual Trustees. The officers and Advisory Board Member hold office without limit in time, except that any officer and Advisory Board Member may resign or may be removed by a vote of a majority of the Trustees at any regular meeting or any special meeting of the Trustees. Except as indicated, each individual has held the office shown or other offices in the same company for the past five years.
Experience, Skills, Attributes, and Qualifications of the Fund's Trustees. The Governance and Nominating Committee has adopted a statement of policy that describes the experience, qualifications, attributes, and skills that are necessary and desirable for potential Independent Trustee candidates (Statement of Policy). The Board believes that each Trustee satisfied at the time he or she was initially elected or appointed a Trustee, and continues to satisfy, the standards contemplated by the Statement of Policy. The Governance and Nominating Committee also engages professional search firms to help identify potential Independent Trustee candidates who have the experience, qualifications, attributes, and skills consistent with the Statement of Policy. From time to time, additional criteria based on the composition and skills of the current Independent Trustees, as well as experience or skills that may be appropriate in light of future changes to board composition, business conditions, and regulatory or other developments, have also been considered by the professional search firms and the Governance and Nominating Committee. In addition, the Board takes into account the Trustees' commitment and participation in Board and committee meetings, as well as their leadership of standing and ad hoc committees throughout their tenure.
In determining that a particular Trustee was and continues to be qualified to serve as a Trustee, the Board has considered a variety of criteria, none of which, in isolation, was controlling. The Board believes that, collectively, the Trustees have balanced and diverse experience, qualifications, attributes, and skills, which allow the Board to operate effectively in governing the fund and protecting the interests of shareholders. Information about the specific experience, skills, attributes, and qualifications of each Trustee, which in each case led to the Board's conclusion that the Trustee should serve (or continue to serve) as a trustee of the fund, is provided below.
Annual Report
Board Structure and Oversight Function. James C. Curvey is an interested person (as defined in the 1940 Act) and currently serves as Chairman. The Trustees have determined that an interested Chairman is appropriate and benefits shareholders because an interested Chairman has a personal and professional stake in the quality and continuity of services provided to the fund. Independent Trustees exercise their informed business judgment to appoint an individual of their choosing to serve as Chairman, regardless of whether the Trustee happens to be independent or a member of management. The Independent Trustees have determined that they can act independently and effectively without having an Independent Trustee serve as Chairman and that a key structural component for assuring that they are in a position to do so is for the Independent Trustees to constitute a substantial majority for the Board. The Independent Trustees also regularly meet in executive session. Ned C. Lautenbach serves as Chairman of the Independent Trustees and as such (i) acts as a liaison between the Independent Trustees and management with respect to matters important to the Independent Trustees and (ii) with management prepares agendas for Board meetings.
Fidelity funds are overseen by different Boards of Trustees. The fund's Board oversees Fidelity's equity and high income funds and another Board oversees Fidelity's investment-grade bond, money market, and asset allocation funds. The asset allocation funds may invest in Fidelity funds overseen by the fund's Board. The use of separate Boards, each with its own committee structure, allows the Trustees of each group of Fidelity funds to focus on the unique issues of the funds they oversee, including common research, investment, and operational issues. On occasion, the separate Boards establish joint committees to address issues of overlapping consequences for the Fidelity funds overseen by each Board.
The Trustees operate using a system of committees to facilitate the timely and efficient consideration of all matters of importance to the Trustees, the fund, and fund shareholders and to facilitate compliance with legal and regulatory requirements and oversight of the fund's activities and associated risks. The Board, acting through its committees, has charged FMR and its affiliates with (i) identifying events or circumstances the occurrence of which could have demonstrably adverse effects on the fund's business and/or reputation; (ii) implementing processes and controls to lessen the possibility that such events or circumstances occur or to mitigate the effects of such events or circumstances if they do occur; and (iii) creating and maintaining a system designed to evaluate continuously business and market conditions in order to facilitate the identification and implementation processes described in (i) and (ii) above. Because the day-to-day operations and activities of the fund are carried out by or through FMR, its affiliates and other service providers, the fund's exposure to risks is mitigated but not eliminated by the processes overseen by the Trustees. While each of the Board's committees has responsibility for overseeing different aspects of the fund's activities, oversight is exercised primarily through the Operations, Audit, and Compliance Committees. In addition, the Independent Trustees have worked with FMR to enhance the Board's oversight of investment and financial risks, legal and regulatory risks, technology risks, and operational risks, including the development of additional risk reporting to the Board. For example, a working group comprised of Independent Trustees and FMR has worked and continues to work to review the Fidelity funds' valuation-related activities, reporting and risk management. Appropriate personnel, including but not limited to the fund's Chief Compliance Officer (CCO), FMR's internal auditor, the independent accountants, the fund's Treasurer and portfolio management personnel, make periodic reports to the Board's committees, as appropriate, including an annual review of FMR's risk management program for the Fidelity funds. The responsibilities of each standing committee, including their oversight responsibilities, are described further under "Standing Committees of the Fund's Trustees."
Annual Report
Trustees and Officers - continued
The fund's Statement of Additional Information (SAI) includes more information about the Trustees. To request a free copy, call Fidelity at 1-877-208-0098.
Interested Trustees*:
Correspondence intended for each Trustee who is an interested person may be sent to Fidelity Investments, 245 Summer Street, Boston, Massachusetts 02210.
Name, Year of Birth; Principal Occupations and Other Relevant Experience+ |
James C. Curvey (1935) |
Year of Election or Appointment: 2007 Trustee Chairman of the Board of Trustees |
| Mr. Curvey also serves as Trustee of other Fidelity funds. Mr. Curvey is a Director of Fidelity Research & Analysis Co. (2009-present), and Vice Chairman (2007-present) and Director of FMR LLC. In addition, Mr. Curvey serves as an Overseer for the Boston Symphony Orchestra and a member of the board of Artis-Naples, Naples, Florida, and as a Trustee for Brewster Academy, Wolfeboro, New Hampshire. Previously, Mr. Curvey served as a Director of Fidelity Investments Money Management, Inc. (2009-2014), a Director of FMR (2007-2014) and a Director of FMR Co., Inc. (2007-2014). |
Charles S. Morrison (1960) |
Year of Election or Appointment: 2014 Trustee |
| Mr. Morrison also serves as Trustee of other funds. He serves as a Director of Fidelity Investments Money Management, Inc. (FIMM) (2014-present), Director of Fidelity SelectCo, LLC (2014-present), President, Asset Management (2014-present), and is an employee of Fidelity Investments. Previously, Mr. Morrison served as Vice President of Fidelity's Fixed Income and Asset Allocation Funds (2012-2014), President, Fixed Income (2011-2014), Vice President of Fidelity's Money Market Funds (2005-2009), President, Money Market Group Leader of FMR (2009), and Senior Vice President, Money Market Group of FMR (2004-2009). Mr. Morrison also served as Vice President of Fidelity's Bond Funds (2002-2005), certain Balanced Funds (2002-2005), and certain Asset Allocation Funds (2002-2007), and as Senior Vice President (2002-2005) of Fidelity's Bond Division. |
* Trustees have been determined to be "Interested Trustees" by virtue of, among other things, their affiliation with the trust or various entities under common control with FMR.
+ The information above includes each Trustee's principal occupation during the last five years and other information relating to the experience, attributes, and skills relevant to each Trustee's qualifications to serve as a Trustee, which led to the conclusion that each Trustee should serve as a Trustee for the fund.
Annual Report
Trustees and Officers - continued
Independent Trustees:
Correspondence intended for each Independent Trustee (that is, the Trustees other than the Interested Trustees) may be sent to Fidelity Investments, P.O. Box 55235, Boston, Massachusetts 02205-5235.
Name, Year of Birth; Principal Occupations and Other Relevant Experience+ |
Dennis J. Dirks (1948) |
Year of Election or Appointment: 2005 Trustee |
| Mr. Dirks also serves as Trustee of other Fidelity funds. Prior to his retirement in May 2003, Mr. Dirks was Chief Operating Officer and a member of the Board of The Depository Trust & Clearing Corporation (DTCC). He also served as President, Chief Operating Officer, and Board member of The Depository Trust Company (DTC) and President and Board member of the National Securities Clearing Corporation (NSCC). In addition, Mr. Dirks served as Chief Executive Officer and Board member of the Government Securities Clearing Corporation, Chief Executive Officer and Board member of the Mortgage-Backed Securities Clearing Corporation, as a Trustee and a member of the Finance Committee of Manhattan College (2005-2008), and as a Trustee and a member of the Finance Committee of AHRC of Nassau County (2006-2008). Mr. Dirks is a member of the Independent Directors Council (IDC) Governing Council (2010-present) and Board of Directors for The Brookville Center for Children's Services, Inc. (2009-present). |
Alan J. Lacy (1953) |
Year of Election or Appointment: 2008 Trustee |
| Mr. Lacy also serves as Trustee of other Fidelity funds. Mr. Lacy serves as Senior Adviser (2007-present) of Oak Hill Capital Partners, L.P. (private equity). Mr. Lacy also served as Chief Executive Officer (2000-2005) and Vice Chairman (2005-2006) of Sears Holdings Corporation and Sears, Roebuck and Co. (retail). In addition, Mr. Lacy serves as a member of the Board of Directors of Dave & Buster's Entertainment, Inc. (restaurant and entertainment complexes, 2010-present), Earth Fare, Inc. (retail grocery, 2012-present), The Hillman Companies, Inc. (hardware wholesalers, 2010-present), and Bristol-Myers Squibb Company (global pharmaceuticals, 2008-present). Mr. Lacy is a member of the Board of Trustees of The National Parks Conservation Association (2006-present). Previously, Mr. Lacy served as Chairman of the Board of Trustees of the National Parks Conservation Association (2008-2011) and as a member of the Board of Directors for the Western Union Company (global money transfer, 2006-2011). |
Ned C. Lautenbach (1944) |
Year of Election or Appointment: 2000 Trustee Chairman of the Independent Trustees |
| Mr. Lautenbach also serves as Trustee of other Fidelity funds. Mr. Lautenbach currently serves as the Lead Director of the Eaton Corporation Board of Directors (diversified industrial, 1997-present). Mr. Lautenbach is Chairman of the Board of Directors of the Philharmonic Center for the Arts in Naples, Florida (2012-present) and a member of the Council on Foreign Relations (1994-present). Previously, Mr. Lautenbach was a Partner/Advisory Partner at Clayton, Dubilier & Rice, LLC (private equity investment, 1998-2010), as well as a Director of Sony Corporation (2006-2007). |
Joseph Mauriello (1944) |
Year of Election or Appointment: 2008 Trustee |
| Mr. Mauriello also serves as Trustee of other Fidelity funds. Prior to his retirement in January 2006, Mr. Mauriello served in numerous senior management positions including Deputy Chairman and Chief Operating Officer (2004-2005), and Vice Chairman of Financial Services (2002-2004) of KPMG LLP US (professional services, 1965-2005). Mr. Mauriello currently serves as a member of the Board of Directors of XL Group plc. (global insurance and re-insurance, 2006-present). Previously, Mr. Mauriello served as a Director of the Hamilton Funds of the Bank of New York (2006-2007) and of Arcadia Resources Inc. (health care services and products, 2007-2012). |
Robert W. Selander (1950) |
Year of Election or Appointment: 2011 Trustee |
| Mr. Selander also serves as Trustee of other Fidelity funds. Previously, Mr. Selander served as a Member of the Advisory Board of other Fidelity funds (2011), and Executive Vice Chairman (2010), Chief Executive Officer (2009-2010), and President and Chief Executive Officer (1997-2009) of Mastercard, Inc. |
Cornelia M. Small (1944) |
Year of Election or Appointment: 2005 Trustee |
| Ms. Small also serves as Trustee of other Fidelity funds. Ms. Small is a member of the Board of Directors (2009-present) and Chair of the Investment Committee (2010-present) of the Teagle Foundation. Ms. Small also serves on the Investment Committee of the Berkshire Taconic Community Foundation (2008-present). Previously, Ms. Small served as Chairperson (2002-2008) and a member of the Investment Committee and Chairperson (2008-2012) and a member of the Board of Trustees of Smith College. In addition, Ms. Small served as Chief Investment Officer, Director of Global Equity Investments, and a member of the Board of Directors of Scudder, Stevens & Clark and Scudder Kemper Investments. |
William S. Stavropoulos (1939) |
Year of Election or Appointment: 2001 Trustee Vice Chairman of the Independent Trustees |
| Mr. Stavropoulos also serves as Trustee of other Fidelity funds. Mr. Stavropoulos serves as President and Founder of the Michigan Baseball Foundation, the Great Lakes Loons (2007-present). Mr. Stavropoulos is Chairman Emeritus of the Board of Directors of The Dow Chemical Company, where he previously served in numerous senior management positions, including President, CEO (1995-2000; 2002-2004), Chairman of the Executive Committee (2000-2006), and as a member of the Board of Directors (1990-2006). Currently, Mr. Stavropoulos is Chairman of the Board of Directors of Univar Inc. (global distributor of commodity and specialty chemicals), a Director of Teradata Corporation (data warehousing and technology solutions), and Maersk Inc. (industrial conglomerate), and a member of the Advisory Board for Metalmark Capital LLC (private equity investment, 2005-present). Mr. Stavropoulos is an operating advisor to Clayton, Dubilier & Rice, LLC (private equity investment). In addition, Mr. Stavropoulos is a member of the University of Notre Dame Advisory Council for the College of Science, a Trustee of the Rollin L. Gerstacker Foundation, and a Director of the Naples Philharmonic Center for the Arts. Previously, Mr. Stavropoulos served as a Director of Chemical Financial Corporation (bank holding company, 1993-2012) and Tyco International, Ltd. (multinational manufacturing and services, 2007-2012). |
David M. Thomas (1949) |
Year of Election or Appointment: 2008 Trustee |
| Mr. Thomas also serves as Trustee of other Fidelity funds. Mr. Thomas serves as Non-Executive Chairman of the Board of Directors of Fortune Brands Home and Security (home and security products, 2011-present), and as a member of the Board of Directors of Interpublic Group of Companies, Inc. (marketing communication, 2004-present). Previously, Mr. Thomas served as Executive Chairman (2005-2006) and Chairman and Chief Executive Officer (2000-2005) of IMS Health, Inc. (pharmaceutical and healthcare information solutions), and a Director of Fortune Brands, Inc. (consumer products, 2000-2011). |
+ The information above includes each Trustee's principal occupation during the last five years and other information relating to the experience, attributes, and skills relevant to each Trustee's qualifications to serve as a Trustee, which led to the conclusion that each Trustee should serve as a Trustee for the fund.
Advisory Board Member and Officers:
Correspondence intended for each officer and Peter S. Lynch may be sent to Fidelity Investments, 245 Summer Street, Boston, Massachusetts 02210. Officers appear below in alphabetical order.
Name, Year of Birth; Principal Occupation |
Peter S. Lynch (1944) |
Year of Election or Appointment: 2003 Member of the Advisory Board |
| Mr. Lynch also serves as Member of the Advisory Board of other Fidelity funds. Mr. Lynch is Vice Chairman and a Director of FMR and FMR Co., Inc. In addition, Mr. Lynch serves as a Trustee of Boston College and as the Chairman of the Inner-City Scholarship Fund. Previously, Mr. Lynch served on the Special Olympics International Board of Directors (1997-2006). |
Elizabeth Paige Baumann (1968) |
Year of Election or Appointment: 2012 Anti-Money Laundering (AML) Officer |
| Ms. Baumann also serves as AML Officer of other funds. She is Chief AML Officer of FMR LLC (2012-present) and is an employee of Fidelity Investments. Previously, Ms. Baumann served as Vice President and Deputy Anti-Money Laundering Officer (2007-2012). |
William C. Coffey (1969) |
Year of Election or Appointment: 2009 Assistant Secretary |
| Mr. Coffey also serves as Assistant Secretary of other funds. He is Senior Vice President and Deputy General Counsel of FMR LLC (2010-present), and is an employee of Fidelity Investments. Previously, Mr. Coffey served as Vice President and Associate General Counsel of FMR LLC (2005-2009). |
Timothy M. Cohen (1969) |
Year of Election or Appointment: 2014 Vice President of certain Equity Funds |
| Mr. Cohen also serves as Vice President of other funds. Mr. Cohen serves as a Director and Chief Compliance Officer of Fidelity Management & Research (U.K.) Inc. (2013-present) and is an employee of Fidelity Investments. |
Jonathan Davis (1968) |
Year of Election or Appointment: 2010 Assistant Treasurer |
| Mr. Davis also serves as Assistant Treasurer of other funds. Mr. Davis is an employee of Fidelity Investments. Previously, Mr. Davis served as Vice President and Associate General Counsel of FMR LLC (2003-2010). |
Adrien E. Deberghes (1967) |
Year of Election or Appointment: 2008 Deputy Treasurer |
| Mr. Deberghes also serves as an officer of other funds. He is an employee of Fidelity Investments (2008-present). Prior to joining Fidelity Investments, Mr. Deberghes was Senior Vice President of Mutual Fund Administration at State Street Corporation (2007-2008), Senior Director of Mutual Fund Administration at Investors Bank & Trust (2005-2007), and Director of Finance for Dunkin' Brands (2000-2005). |
Stephanie J. Dorsey (1969) |
Year of Election or Appointment: 2010 Assistant Treasurer |
| Ms. Dorsey also serves as an officer of other funds. She is an employee of Fidelity Investments (2008-present) and has served in other fund officer roles. Prior to joining Fidelity Investments, Ms. Dorsey served as Treasurer (2004-2008) of the JPMorgan Mutual Funds and Vice President (2004-2008) of JPMorgan Chase Bank. |
Howard J. Galligan III (1966) |
Year of Election or Appointment: 2014 Chief Financial Officer |
| Mr. Galligan also serves as Chief Financial Officer of other funds. Mr. Galligan serves as President of Fidelity Pricing and Cash Management Services (FPCMS) (2014-present) and as a Director of Strategic Advisers, Inc. (2008-present). Previously, Mr. Galligan served as Chief Administrative Officer of Asset Management (2011-2014) and Chief Operating Officer and Senior Vice President of Investment Support for Strategic Advisers, Inc. (2003-2011). |
Scott C. Goebel (1968) |
Year of Election or Appointment: 2008 Secretary and Chief Legal Officer (CLO) |
| Mr. Goebel serves as Secretary and CLO of other funds. Mr. Goebel also serves as Secretary of Fidelity SelectCo, LLC (2013-present), Fidelity Investments Money Management, Inc. (FIMM) (2010-present) and Fidelity Research and Analysis Company (FRAC) (2010-present); General Counsel, Secretary, and Senior Vice President of FMR (2008-present) and FMR Co., Inc. (2008-present); Chief Legal Officer of Fidelity Management & Research (Hong Kong) Limited (2008-present); and Assistant Secretary of Fidelity Management & Research (Japan) Limited (2008- present) and Fidelity Management & Research (U.K.) Inc. (2008- present). Previously, Mr. Goebel served as Secretary and CLO of other Fidelity funds (2008-2013), Assistant Secretary of FIMM (2008-2010), FRAC (2008-2010), and certain funds (2007-2008); and as Vice President and Secretary of Fidelity Distributors Corporation (FDC) (2005-2007). Mr. Goebel has been employed by FMR LLC or an affiliate since 2001. |
Brian B. Hogan (1964) |
Year of Election or Appointment: 2009 Vice President |
| Mr. Hogan also serves as Trustee or Vice President of other funds. Mr. Hogan serves as a Director of Fidelity SelectCo, LLC (2014-present) and President of FMR's Equity Division (2009-present). Previously, Mr. Hogan served as Senior Vice President, Equity Research of FMR (2006-2009) and as a portfolio manager. |
Chris Maher (1972) |
Year of Election or Appointment: 2013 Assistant Treasurer |
| Mr. Maher serves as Assistant Treasurer of other funds. Mr. Maher is Vice President of Valuation Oversight and is an employee of Fidelity Investments. Previously, Mr. Maher served as Vice President of Asset Management Compliance (2013), Vice President of FMR's Program Management Group (2010-2013), and Vice President of Valuation Oversight (2008-2010). |
Kenneth B. Robins (1969) |
Year of Election or Appointment: 2008 President and Treasurer |
| Mr. Robins also serves as an officer of other funds. Mr. Robins serves as Executive Vice President of Fidelity Investments Money Management, Inc. (FIMM) (2013-present) and is an employee of Fidelity Investments (2004-present). Previously, Mr. Robins served in other fund officer roles. |
Stephen Sadoski (1971) |
Year of Election or Appointment: 2012 Deputy Treasurer |
| Mr. Sadoski also serves as Deputy Treasurer of other funds. He is an employee of Fidelity Investments (2012-present) and has served in another fund officer role. Prior to joining Fidelity Investments, Mr. Sadoski served as an assistant chief accountant in the Division of Investment Management of the Securities and Exchange Commission (SEC) (2009-2012) and as a senior manager at Deloitte & Touche LLP (1997-2009). |
Stacie M. Smith (1974) |
Year of Election or Appointment: 2013 Deputy Treasurer |
| Ms. Smith also serves as an officer of other funds. She is an employee of Fidelity Investments (2009-present) and has served in other fund officer roles. Prior to joining Fidelity Investments, Ms. Smith served as Senior Audit Manager of Ernst & Young LLP (1996-2009). |
Renee Stagnone (1975) |
Year of Election or Appointment: 2013 Deputy Treasurer |
| Ms. Stagnone also serves as Deputy Treasurer of other funds. Ms. Stagnone is an employee of Fidelity Investments. |
Linda J. Wondrack (1964) |
Year of Election or Appointment: 2014 Chief Compliance Officer |
| Ms. Wondrack also serves as Chief Compliance Officer of other funds. Ms. Wondrack is Executive Vice President and head of the Ethics Office and Asset Management Compliance for Fidelity Investments (2012- present). Ms. Wondrack also serves as Chief Compliance Officer of Fidelity SelectCo, LLC (2014-present); Chief Compliance Officer of Impresa Management LLC (2013-present); and Chief Compliance Officer of FMR Co., Inc., Fidelity Investments Money Management, Inc., Fidelity Management & Research (Japan) Limited, Fidelity Management & Research (U.K.) Inc., Fidelity Management & Research (Hong Kong), Fidelity Management & Research Company, Pyramis Global Advisors, LLC, and Strategic Advisers, Inc., Ballyrock Investment Advisors LLC, and Northern Neck Investors LLC (2012-present). Previously, Ms. Wondrack served as Senior Vice President and Chief Compliance Officer for Columbia Management Investment Advisers, LLC (2005-2012); Chief Compliance Officer for certain funds within the Columbia Family of Funds (2007-2012); and Senior Vice President of Compliance Risk Management at Bank of America (2005-2010). |
Joseph F. Zambello (1957) |
Year of Election or Appointment: 2011 Deputy Treasurer |
| Mr. Zambello also serves as Deputy Treasurer of other funds. Mr. Zambello is an employee of Fidelity Investments. Previously, Mr. Zambello served as Vice President of FMR's Program Management Group (2009-2011) and Vice President of the Transfer Agent Oversight Group (2005-2009). |
Annual Report
Institutional Class designates 24% of the dividends distributed during the fiscal year as qualifying for the dividends-received deduction for corporate shareholders.
Institutional Class designates 100% of the dividends distributed during the fiscal year as amounts which may be taken into account as a dividend for purposes of the maximum rate under section 1(h)(11) of the Internal Revenue Code.
The amounts per share which represent income derived from sources within, and taxes paid to, foreign countries or possessions of the United States are as follows:
| Pay Date | Income | Taxes |
Institutional Class | 12/09/13 | $0.1121 | $0.0191 |
The fund will notify shareholders in January 2015 of amounts for use in preparing 2014 income tax returns.
Annual Report
Board Approval of Investment Advisory Contracts and Management Fees
Fidelity Advisor International Capital Appreciation Fund
Each year, the Board of Trustees, including the Independent Trustees (together, the Board), votes on the renewal of the management contract with Fidelity Management & Research Company (FMR) and the sub-advisory agreements (together, the Advisory Contracts) for the fund. The Board, assisted by the advice of fund counsel and Independent Trustees' counsel, requests and considers a broad range of information relevant to the renewal of the Advisory Contracts throughout the year.
The Board meets regularly and, at each of its meetings, covers an extensive agenda of topics and materials and considers factors that are relevant to its annual consideration of the renewal of the fund's Advisory Contracts, including the services and support provided to the fund and its shareholders. The Board has established various standing committees (Committees), each composed of and chaired by Independent Trustees with varying backgrounds, to which the Board has assigned specific subject matter responsibilities in order to enhance effective decision-making by the Board. The Board, acting directly and through its Committees, requests and receives information concerning the annual consideration of the renewal of the fund's Advisory Contracts. The Board also meets as needed to consider matters specifically related to the Board's annual consideration of the renewal of the Advisory Contracts. Members of the Board may also meet with trustees of other Fidelity funds through ad hoc joint committees to discuss certain matters relevant to the Fidelity funds.
At its July 2014 meeting, the Board, including the Independent Trustees, unanimously determined to renew the fund's Advisory Contracts. In reaching its determination, the Board considered all factors it believed relevant, including (i) the nature, extent, and quality of the services to be provided to the fund and its shareholders (including the investment performance of the fund); (ii) the competitiveness of the fund's management fee and total expense ratio relative to peer funds; (iii) the total costs of the services to be provided by and the profits to be realized by Fidelity from its relationship with the fund; (iv) the extent to which economies of scale exist and would be realized as the fund grows; and (v) whether fee levels reflect these economies of scale, if any, for the benefit of fund shareholders. In connection with separate internal corporate reorganizations involving Fidelity Management & Research (U.K.) Inc. (FMR U.K.) and Fidelity Management & Research (Japan) Inc. (FMR Japan), the Board approved certain non-material amendments to the fund's sub-advisory agreements with FMR U.K. and FMR Japan to reflect that, after these reorganizations, FMR Investment Management (UK) Limited and Fidelity Management & Research (Japan) Limited will carry on the business of FMR U.K. and FMR Japan, respectively. The Board noted that no changes to the portfolio managers or to the foreign research or investment advisory services provided to the fund were expected in connection with either reorganization and that the same personnel and resources would continue to be available to the fund at the new entities.
Annual Report
Board Approval of Investment Advisory Contracts and
Management Fees - continued
In considering whether to renew the Advisory Contracts for the fund, the Board reached a determination, with the assistance of fund counsel and Independent Trustees' counsel and through the exercise of its business judgment, that the renewal of the Advisory Contracts was in the best interests of the fund and its shareholders and that the compensation payable under the Advisory Contracts was fair and reasonable. The Board's decision to renew the Advisory Contracts was not based on any single factor, but rather was based on a comprehensive consideration of all the information provided to the Board at its meetings throughout the year. The Board, in reaching its determination to renew the Advisory Contracts, was aware that shareholders of the fund have a broad range of investment choices available to them, including a wide choice among funds offered by Fidelity's competitors, and that the fund's shareholders, who have the opportunity to review and weigh the disclosure provided by the fund in its prospectus and other public disclosures, have chosen to invest in this fund, which is part of the Fidelity family of funds.
Nature, Extent, and Quality of Services Provided. The Board considered Fidelity's staffing as it relates to the fund, including the backgrounds of investment personnel of FMR and the sub-advisers (together, the Investment Advisers), and also considered the fund's investment objective, strategies, and related investment philosophy. The Independent Trustees also had discussions with senior management of Fidelity's investment operations and investment groups. The Board considered the structure of the portfolio manager compensation program and whether this structure provides appropriate incentives to act in the best interests of the fund. Additionally, the Board considered the portfolio managers' investments, if any, in the funds that they manage.
Resources Dedicated to Investment Management and Support Services. The Board and the Fund Oversight and Research Committees reviewed the general qualifications and capabilities of Fidelity's investment staff, including its size, education, experience, and resources, as well as Fidelity's approach to recruiting, training, managing, and compensating investment personnel. The Board noted that Fidelity has continued to increase the resources devoted to non-U.S. offices, including expansion of Fidelity's global investment organization. The Board also noted that Fidelity's analysts have extensive resources, tools and capabilities that allow them to conduct sophisticated quantitative and fundamental analysis, as well as credit analysis of issuers, counterparties and guarantors. Further, the Board believes that Fidelity's investment professionals have sufficient access to global information and data so as to provide competitive investment results over time, and that those professionals also have access to sophisticated tools that permit them to assess portfolio construction and risk and performance attribution characteristics continuously, as well as to transmit new information and research conclusions rapidly around the world. Additionally, in its deliberations, the Board considered Fidelity's trading and risk management capabilities and resources and global compliance infrastructure, which are an integral part of the investment management process.
Annual Report
Shareholder and Administrative Services. The Board considered (i) the nature, extent, quality, and cost of advisory, administrative, and shareholder services performed by the Investment Advisers and their affiliates under the Advisory Contracts and under separate agreements covering transfer agency, pricing and bookkeeping, and securities lending services for the fund; (ii) the nature and extent of the supervision of third party service providers, principally custodians and subcustodians; and (iii) the resources devoted to, and the record of compliance with, the fund's compliance policies and procedures. The Board also reviewed the allocation of fund brokerage, including allocations to brokers affiliated with the Investment Advisers, the use of brokerage commissions to pay fund expenses, and the use of "soft" commission dollars to pay for research services.
The Board noted that the growth of fund assets over time across the complex allows Fidelity to reinvest in the development of services designed to enhance the value or convenience of the Fidelity funds as investment vehicles. These services include 24-hour access to account information and market information through telephone representatives and over the Internet, investor education materials and asset allocation tools, and the expanded availability of Fidelity Investor Centers.
In 2014, the Board formed an ad hoc Committee on Transfer Agency Fees to review the variety of transfer agency fee structures throughout the industry and Fidelity's competitive positioning with respect to industry participants.
Investment in a Large Fund Family. The Board considered the benefits to shareholders of investing in a Fidelity fund, including the benefits of investing in a fund that is part of a large family of funds offering a variety of investment disciplines and providing a large variety of mutual fund investor services. The Board noted that Fidelity had taken, or had made recommendations that resulted in the Fidelity funds taking, a number of actions over the previous year that benefited particular funds, including (i) continuing to dedicate additional resources to investment research and to the support of the senior management team that oversees asset management; (ii) persisting in efforts to enhance Fidelity's global research capabilities; (iii) launching new funds and making other enhancements to meet client needs for income-oriented solutions; (iv) reducing fund expenses for certain index funds; (v) continuing to launch dedicated lower cost underlying funds to meet portfolio construction needs related to expanding underlying fund options for Fidelity funds of funds, specifically for the Freedom Fund product lines; (vi) rationalizing product lines and gaining increased efficiencies through fund mergers; (vii) launching sector-based exchange-traded funds and establishing a new Fidelity adviser to manage sector-based funds and products; (viii) continuing to develop and implement technology to improve security and increase efficiency; (ix) modifying the eligibility criteria for certain share classes to increase their marketability to a portion of the defined contribution plan market; (x) waiving redemption fees for certain qualified fund-of-fund and wrap programs and certain retirement plan transactions; and (xi) launching new Institutional Class shares of certain money market funds to attract and retain assets and to fill a gap in the money market fund lineup.
Annual Report
Board Approval of Investment Advisory Contracts and
Management Fees - continued
Investment Performance. The Board considered whether the fund has operated in accordance with its investment objective, as well as its record of compliance with its investment restrictions and its performance history.
The Board took into account discussions with the Investment Advisers about fund investment performance that occur at Board meetings throughout the year. In this regard the Board noted that as part of regularly scheduled fund reviews and other reports to the Board on fund performance, the Board periodically considers annualized return information for the fund, for different time periods, measured against a securities market index ("benchmark index") and a peer group of funds with similar objectives ("peer group"). In its evaluation of fund investment performance, the Board gave particular attention to information indicating changes in performance of certain Fidelity funds for specific time periods and the Investment Advisers' explanations for any overperformance or underperformance.
In addition to reviewing absolute and relative fund performance, the Independent Trustees periodically consider the appropriateness of fund performance metrics in evaluating the results achieved. In general, the Independent Trustees believe that fund performance should be evaluated based on net performance (after fees and expenses) of both the highest performing and lowest performing classes, where applicable, compared to appropriate benchmark indices, over appropriate time periods which may include full market cycles, and compared to peer groups, as applicable, over the same periods, taking into account relevant factors including the following: general market conditions; issuer-specific information; tactical opportunities for investment; and fund cash flows and other factors.
The Independent Trustees recognize that shareholders evaluate performance on a net basis over their own holding periods, for which one-, three-, and five-year periods are often used as a proxy. For this reason, the performance information reviewed by the Board also included net cumulative calendar year total return information for the fund and an appropriate benchmark index and peer group for the most recent one-, three-, and five-year periods, as shown below. Returns are shown compared to the 25th percentile (top of box, 75% beaten) and 75th percentile (bottom of box, 25% beaten) of the peer universe. Returns of the benchmark index are "net MA," i.e., adjusted for tax withholding rates applicable to U.S.-based funds organized as Massachusetts business trusts.
Annual Report
Fidelity Advisor International Capital Appreciation Fund
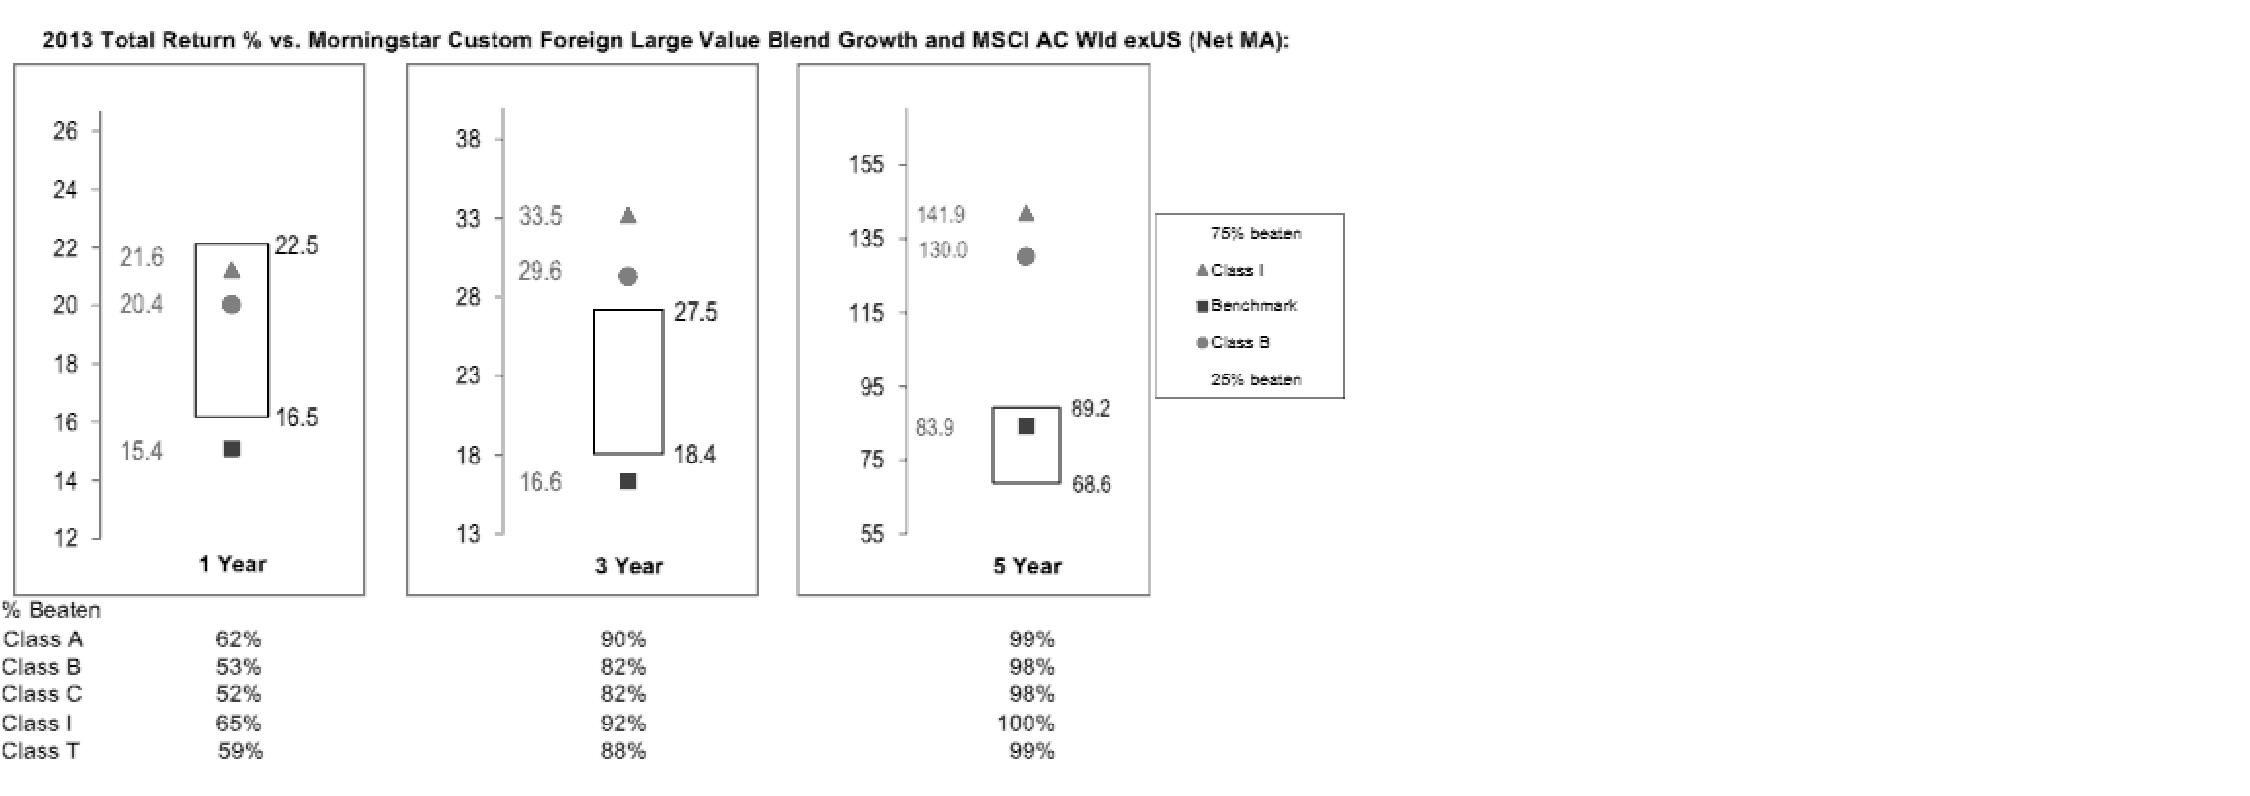
The Board also considered that the fund's management fee is subject to upward or downward adjustment depending upon whether, and to what extent, the fund's investment performance for the performance period exceeds, or is exceeded by, a securities index, thus leading to a performance adjustment for the same period. The Board noted that the performance adjustment provides FMR with a strong economic incentive to seek to achieve superior performance for the fund's shareholders and helps to more closely align the interests of FMR and the fund's shareholders.
Based on its review, the Board concluded that the nature, extent, and quality of services provided to the fund under the Advisory Contracts should benefit the fund's shareholders.
Competitiveness of Management Fee and Total Expense Ratio. The Board considered the fund's management fee and total expense ratio compared to "mapped groups" of competitive funds and classes. Fidelity creates "mapped groups" by combining similar Lipper investment objective categories that have comparable investment mandates. Combining Lipper investment objective categories aids the Board's management fee and total expense ratio comparisons by broadening the competitive group used for comparison and by reducing the number of universes to which various Fidelity funds are compared.
Management Fee. The Board considered two proprietary management fee comparisons for the 12-month periods shown in the chart below. The group of Lipper funds used by the Board for management fee comparisons is referred to below as the "Total Mapped Group." The Total Mapped Group comparison focuses on a fund's standing in terms of gross management fees before expense reimbursements or caps, and without giving effect to the fund's performance adjustment, relative to the total universe of funds with comparable investment mandates, regardless of whether their management fee structures also are comparable. Funds with comparable investment mandates offer exposure to similar types of securities. Funds with comparable management fee structures have similar management fee contractual arrangements (e.g., flat rate charged for advisory services, all-inclusive fee rate, etc.). "TMG %" represents the percentage of funds in the Total Mapped Group that had management fees that were lower than the fund's. For example, a hypothetical TMG % of 20% would mean that 80% of the funds in the Total Mapped Group had higher, and 20% had lower, management fees than the fund. The fund's actual TMG %s are in the chart below. The "Asset-Size Peer Group" (ASPG) comparison focuses on a fund's standing relative to a subset of non-Fidelity funds within the Total Mapped Group that are similar in size and management fee structure. For example, if a fund is in the first quartile of the ASPG, the fund's management fee ranks in the least expensive or lowest 25% of funds in the ASPG. The ASPG represents at least 15% of the funds in the Total Mapped Group with comparable asset size and management fee structures, subject to a minimum of 50 funds (or all funds in the Total Mapped Group if fewer than 50). Additional information, such as the ASPG quartile in which the fund's management fee rate ranked and the impact of the fund's performance adjustment, is also included in the chart and considered by the Board.
Annual Report
Board Approval of Investment Advisory Contracts and
Management Fees - continued
Fidelity Advisor International Capital Appreciation Fund
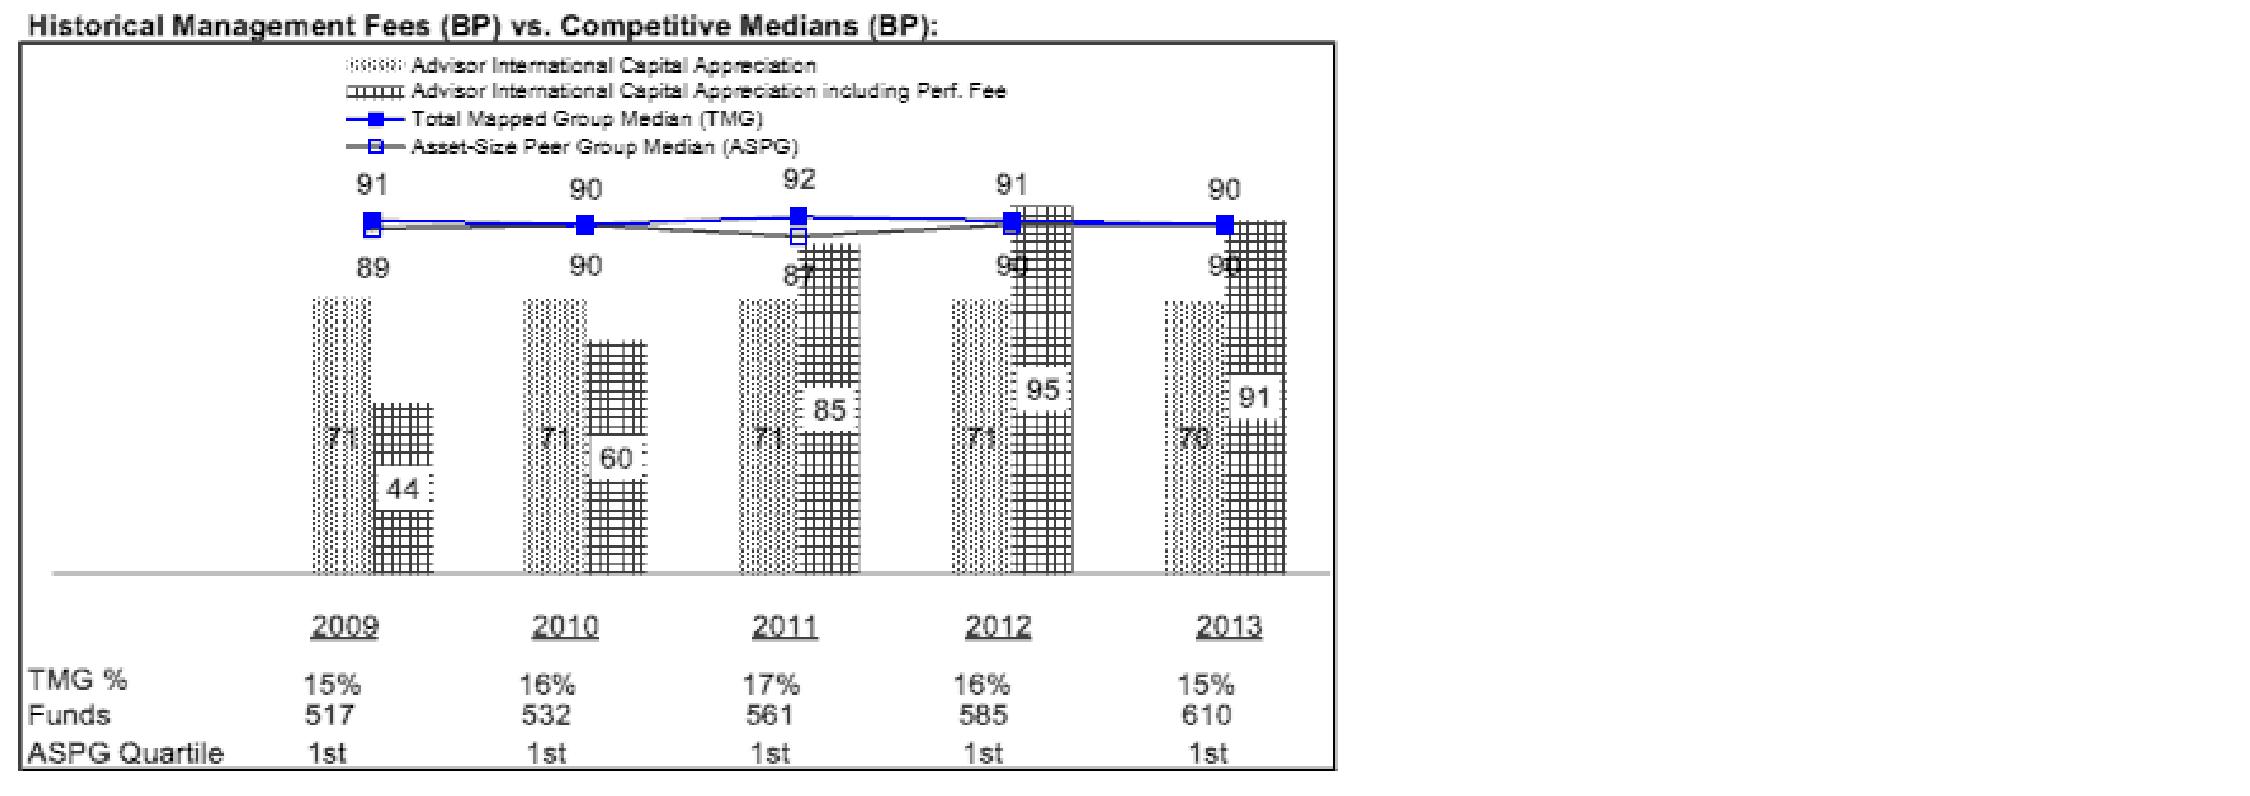
The Board noted that the fund's management fee rate ranked below the median of its Total Mapped Group and below the median of its ASPG for 2013. The Board also noted the effect of the fund's positive performance adjustment on the fund's management fee ranking.
Annual Report
The Board also noted that, in August 2013, the ad hoc Committee on Management Fees was formed to conduct an in-depth review of the management fee rates of Fidelity's active equity mutual funds. The Committee focused on the following areas: (i) standard fee structures; (ii) research consumption and trading evolution; (iii) management fee competitiveness/profitability by category; and (iv) factors that drive institutional pricing.
Based on its review, the Board concluded that the fund's management fee is fair and reasonable in light of the services that the fund receives and the other factors considered.
Total Expense Ratio. In its review of each class's total expense ratio, the Board considered the fund's management fee as well as other fund or class expenses, as applicable, such as transfer agent fees, pricing and bookkeeping fees, fund-paid 12b-1 fees, and custodial, legal, and audit fees. The Board also noted the effects of any waivers and reimbursements on fees and expenses, as well as the impact of the fund's performance adjustment. As part of its review, the Board also considered the current and historical total expense ratios of each class of the fund compared to competitive fund median expenses. Each class of the fund is compared to those funds and classes in the Total Mapped Group (used by the Board for management fee comparisons) that have a similar sales load structure.
The Board noted that the total expense ratio of each class ranked above its competitive median for 2013. The Board considered that, in general, various factors can affect total expense ratios. The Board noted that the total expense ratio of Class T was above the competitive median primarily because of higher 12b-1 fees on Class T as compared to most competitor funds. Class T has a higher 12b-1 fee, but a lower front-end sales charge, than traditionally priced front-end sales charge classes. The Board considered that Class T is primarily sold load-waived in the retirement plan market where its 0.50% 12b-1 fee is comparable to competing no-load, higher 12b-1 fee classes designed specifically for retirement plans. The Board noted that the fund offers multiple classes, each of which has a different sales load and 12b-1 fee structure, and that the multiple structures are intended to offer a range of pricing options for the intermediary market. The Board also noted that the total expense ratios of the classes vary primarily by the level of their 12b-1 fees, although differences in transfer agent fees may also cause expenses to vary from class to class.
Fees Charged to Other Fidelity Clients. The Board also considered Fidelity fee structures and other information with respect to clients of Fidelity, such as other funds advised or subadvised by Fidelity, pension plan clients, and other institutional clients. The Board noted the findings of the 2013 ad hoc joint committee (created with the board of other Fidelity funds), which reviewed and compared Fidelity's institutional investment advisory business with its business of providing services to the Fidelity funds, including the differences in services provided, fees charged, and costs incurred, as well as competition in their respective marketplaces.
Annual Report
Board Approval of Investment Advisory Contracts and
Management Fees - continued
Based on its review of total expense ratios and fees charged to other Fidelity clients, the Board concluded that the total expense ratio of each class of the fund was reasonable, although in all cases above the median of the universe presented for comparison, in light of the services that the fund and its shareholders receive and the other factors considered.
Costs of the Services and Profitability. The Board considered the revenues earned and the expenses incurred by Fidelity in conducting the business of developing, marketing, distributing, managing, administering and servicing the fund and servicing the fund's shareholders. The Board also considered the level of Fidelity's profits in respect of all the Fidelity funds.
On an annual basis, Fidelity presents to the Board Fidelity's profitability for the fund. Fidelity calculates the profitability for each fund, as well as aggregate profitability for groups of Fidelity funds and all Fidelity funds, using a series of detailed revenue and cost allocation methodologies which originate with the books and records of Fidelity on which Fidelity's audited financial statements are based. The Audit Committee of the Board reviews any significant changes from the prior year's methodologies.
PricewaterhouseCoopers LLP (PwC), independent registered public accounting firm and auditor to Fidelity and certain Fidelity funds, has been engaged annually by the Board as part of the Board's assessment of Fidelity's profitability analysis. PwC's engagement includes the review and assessment of the methodologies used by Fidelity in determining the revenues and expenses attributable to Fidelity's mutual fund business, and completion of agreed-upon procedures in respect of the mathematical accuracy of fund profitability and its conformity to established allocation methodologies. After considering PwC's reports issued under the engagement and information provided by Fidelity, the Board concluded that while other allocation methods may also be reasonable, Fidelity's profitability methodologies are reasonable in all material respects.
The Board also reviewed Fidelity's non-fund businesses and fall-out benefits related to the mutual fund business as well as cases where Fidelity's affiliates may benefit from or be related to the fund's business.
The Board considered the costs of the services provided by and the profits realized by Fidelity in connection with the operation of the fund and was satisfied that the profitability was not excessive in the circumstances.
Economies of Scale. The Board considered whether there have been economies of scale in respect of the management of the Fidelity funds, whether the Fidelity funds (including the fund) have appropriately benefited from any such economies of scale, and whether there is potential for realization of any further economies of scale. The Board considered the extent to which the fund will benefit from economies of scale through increased services to the fund, through waivers or reimbursements, or through fee or expense ratio reductions. The Board also noted that in 2013, it and the boards of other Fidelity funds created an ad hoc committee (the Economies of Scale Committee) to analyze whether Fidelity attains economies of scale in respect of the management and servicing of the Fidelity funds, whether the Fidelity funds have appropriately benefited from such economies of scale, and whether there is potential for realization of any further economies of scale.
Annual Report
The Board recognized that the fund's management contract incorporates a "group fee" structure, which provides for lower group fee rates as total group assets increase, and for higher group fee rates as total group assets decrease (with "group assets" defined to include fund assets under FMR's management plus sector fund assets previously under FMR's management and currently managed by Fidelity SelectCo, LLC). FMR calculates the group fee rates based on a tiered asset "breakpoint" schedule that varies based on asset class. The Board considered that the group fee is designed to deliver the benefits of economies of scale to fund shareholders when total Fidelity fund assets increase, even if assets of any particular fund are unchanged or have declined, because some portion of Fidelity's costs are attributable to services provided to all Fidelity funds, and all funds benefit if those costs can be allocated among more assets. The Board concluded that, given the group fee structure, fund shareholders will benefit from lower management fees as group assets increase at the fund complex level, regardless of whether Fidelity achieves any such economies of scale.
The Board concluded, taking into account the analysis of the Economies of Scale Committee, that economies of scale, if any, are being appropriately shared between fund shareholders and Fidelity.
Additional Information Requested by the Board. In order to develop fully the factual basis for consideration of the Fidelity funds' Advisory Contracts, the Board requested and received additional information on certain topics, including: (i) fund performance trends and Fidelity's long-term strategies for certain funds; (ii) Fidelity's strategic marketing and product lineup goals; (iii) the methodology with respect to competitive fund data and peer group classifications; (iv) the arrangements with, and performance of, certain sub-advisers on behalf of the Fidelity funds, as well as certain proposed participating affiliate arrangements; (v) the realization of fall-out benefits in certain Fidelity business units; (vi) Fidelity's group fee structures, including the rationale for the individual fee rates of certain categories of funds and the definition of group assets; (vii) trends regarding industry use of performance fee structures and the performance adjustment methodologies applicable to the Fidelity funds; (viii) additional competitive analysis regarding the total expenses for certain classes; (ix) fund profitability methodology, including Fidelity's cost allocation methodology, and the impact of certain factors on fund profitability results; and (x) the process by which Fidelity determines sub-advisory fees for funds it advises.
Based on its evaluation of all of the conclusions noted above, and after considering all factors it believed relevant, the Board ultimately concluded that the advisory fee structures are fair and reasonable, and that the fund's Advisory Contracts should be renewed.
Annual Report
Investment Adviser
Fidelity Management & Research Company
Boston, MA
Investment Sub-Advisers
FMR Co., Inc.
Fidelity Management & Research
(U.K.) Inc.
Fidelity Management & Research
(Hong Kong) Limited
Fidelity Management & Research
(Japan) Limited
FIL Investment Advisors
FIL Investments (Japan) Limited
FIL Investment Advisors (UK) Limited
General Distributor
Fidelity Distributors Corporation
Smithfield, RI
Transfer and Service Agents
Fidelity Investments Institutional Operations Company, Inc.
Boston, MA
Fidelity Service Company, Inc.
Boston, MA
Custodian
Brown Brothers Harriman & Co.
Boston, MA
(Fidelity Investment logo)(registered trademark)
AICAPI-UANN-1214
1.784755.111
(Fidelity Investment logo)(registered trademark)
Fidelity Advisor®
Overseas
Fund - Class A, Class T, Class B and Class C
Annual Report
October 31, 2014
(Fidelity Cover Art)
Contents
Performance | (Click Here) | How the fund has done over time. |
Management's Discussion of Fund Performance | (Click Here) | The Portfolio Manager's review of fund performance and strategy. |
Shareholder Expense Example | (Click Here) | An example of shareholder expenses. |
Investment Changes | (Click Here) | A summary of major shifts in the fund's investments over the past six months. |
Investments | (Click Here) | A complete list of the fund's investments with their market values. |
Financial Statements | (Click Here) | Statements of assets and liabilities, operations, and changes in net assets, as well as financial highlights. |
Notes | (Click Here) | Notes to the financial statements. |
Report of Independent Registered Public Accounting Firm | (Click Here) | |
Trustees and Officers | (Click Here) | |
Distributions | (Click Here) | |
Board Approval of Investment Advisory Contracts and Management Fees | (Click Here) | |
To view a fund's proxy voting guidelines and proxy voting record for the 12-month period ended June 30, visit http://www.fidelity.com/proxyvotingresults or visit the Securities and Exchange Commission's (SEC) web site at http://www.sec.gov. You may also call 1-877-208-0098 to request a free copy of the proxy voting guidelines.
Standard & Poor's, S&P and S&P 500 are registered service marks of The McGraw-Hill Companies, Inc. and have been licensed for use by Fidelity Distributors Corporation.
Other third-party marks appearing herein are the property of their respective owners.
All other marks appearing herein are registered or unregistered trademarks or service marks of FMR LLC or an affiliated company. © 2014 FMR LLC. All rights reserved.
Annual Report
This report and the financial statements contained herein are submitted for the general information of the shareholders of the fund. This report is not authorized for distribution to prospective investors in the fund unless preceded or accompanied by an effective prospectus.
A fund files its complete schedule of portfolio holdings with the SEC for the first and third quarters of each fiscal year on Form N-Q. Forms N-Q are available on the SEC's web site at http://www.sec.gov. A fund's Forms N-Q may be reviewed and copied at the SEC's Public Reference Room in Washington, DC. Information regarding the operation of the SEC's Public Reference Room may be obtained by calling 1-800-SEC-0330. For a complete list of a fund's portfolio holdings, view the most recent holdings listing, semiannual report, or annual report on Fidelity's web site at http://www.fidelity.com, http://www.advisor.fidelity.com, or http://www.401k.com, as applicable.
NOT FDIC INSURED • MAY LOSE VALUE • NO BANK GUARANTEE
Neither the fund nor Fidelity Distributors Corporation is a bank.
Annual Report
Average annual total return reflects the change in the value of an investment, assuming reinvestment of the class' distributions from dividend income and capital gains (the profits earned upon the sale of securities that have grown in value, if any) and assuming a constant rate of performance each year. The $10,000 table and the fund's returns do not reflect the deduction of taxes that a shareholder would pay on fund distributions or the redemption of fund shares. During periods of reimbursement by Fidelity, a fund's total return will be greater than it would be had the reimbursement not occurred. How a fund did yesterday is no guarantee of how it will do tomorrow. Returns reflect the conversion of Class B shares to Class A shares after a maximum of seven years.
Average Annual Total Returns
Periods ended October 31, 2014 | Past 1
year | Past 5
years | Past 10
years |
Class A (incl. 5.75% sales charge) | -6.91% | 6.40% | 5.06% |
Class T (incl. 3.50% sales charge) | -4.87% | 6.72% | 5.13% |
Class B (incl. contingent deferred sales charge) A | -6.89% | 6.54% | 5.11% |
Class C (incl. contingent deferred sales charge) B | -3.03% | 6.85% | 4.89% |
A Class B shares' contingent deferred sales charges included in the past one year, past five years, and past ten years total return figures are 5%, 2%, and 0%, respectively.
B Class C shares' contingent deferred sales charges included in the past one year, past five years, and past ten years total return figures are 1%, 0%, and 0%, respectively.
Annual Report
$10,000 Over 10 Years
Let's say hypothetically that $10,000 was invested in Fidelity Advisor® Overseas Fund - Class A on October 31, 2004, and the current 5.75% sales charge was paid. The chart shows how the value of your investment would have changed, and also shows how the MSCI EAFE Index performed over the same period.
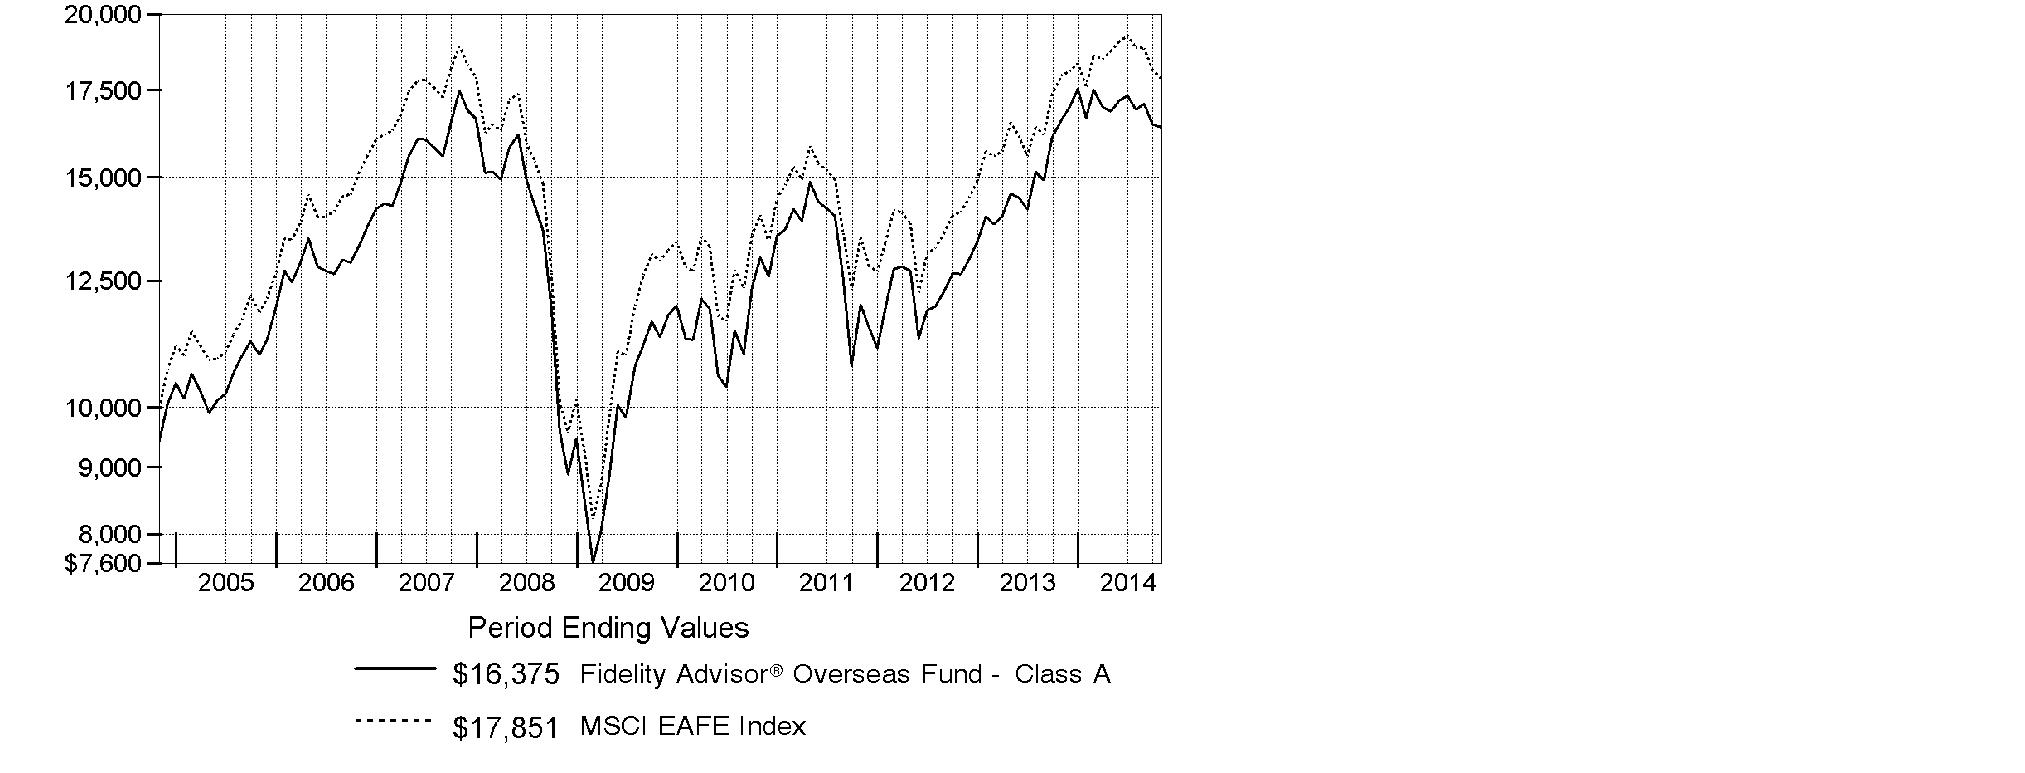
Annual Report
Market Recap: Global equities posted a healthy gain for the 12 months ending October 31, 2014, overcoming an October market decline driven by recessionary pressures in China and tepid growth in Europe. The MSCI ACWI (All Country World Index) Index rose 8.15%, helped by subdued market volatility for much of the period and supported by solid corporate earnings, especially in the United States. Stocks also benefited from easy monetary policies in Japan and the eurozone, as well as increased stimulus efforts in China. All but three of the 24 industry groups that compose the index marked a positive return. The U.S. (+17%) remained a pillar of strength, while a strongly rising dollar in the latter part of the period detracted from investors' returns in most non-U.S. markets. Canada (+5%) notched broad gains outside of its energy and materials sectors, as did Asia-Pacific ex Japan (+4%), led by investor enthusiasm for companies in India. The U.K., Europe and Japan, meanwhile, all underperformed. Among sectors, health care (+24%) led the index, with a strong contribution from the pharmaceuticals, biotechnology & life sciences industry. Information technology (+21%) also outperformed. Conversely, materials (-4%) and energy (-1%) lagged the index due to a higher supply of and lower demand for commodities.
Comments from Graeme Rockett, Portfolio Manager of Fidelity Advisor® Overseas Fund: For the year, the fund's Class A, Class T, Class B and Class C shares returned -1.24%, -1.42%, -2.03% and -2.06%, respectively (excluding sales charges), trailing the -0.48% return of the MSCI EAFE Index. Versus the index, a number of businesses that benefit from global Internet and broadband penetration detracted. I sold the fund's stake in Mail.Ru Group, as the stock was negatively affected by sanctions on the Russian economy and the devaluation of the ruble. In health care, it hurt to not own outperforming index component and Swiss pharmaceuticals firm Novartis. On the plus side, choices in information technology by far added the most value, including Chinese social media and e-commerce firm Tencent Holdings. I also continued to invest in online classifieds businesses, and a number of these stocks placed among the fund's top individual contributors: South Africa's Naspers - the largest position in the fund at period end - and China-based Bitauto Holdings and SouFun Holdings. As these stocks outperformed, I reduced our outsized exposure on short-term concerns. It also helped to acquire a position in Chinese e-commerce firm Alibaba Group Holding at its initial public offering in September. I felt the stock was undervalued at the IPO price, and the market agreed - the stock soared after an initial market dip.
The views expressed above reflect those of the portfolio manager(s) only through the end of the period as stated on the cover of this report and do not necessarily represent the views of Fidelity or any other person in the Fidelity organization. Any such views are subject to change at any time based upon market or other conditions and Fidelity disclaims any responsibility to update such views. These views may not be relied on as investment advice and, because investment decisions for a Fidelity fund are based on numerous factors, may not be relied on as an indication of trading intent on behalf of any Fidelity fund.
Annual Report
Shareholder Expense Example
As a shareholder of the Fund, you incur two types of costs: (1) transaction costs, including sales charges (loads) on purchase payments or redemption proceeds, redemption fees and (2) ongoing costs, including management fees, distribution and/or service (12b-1) fees and other Fund expenses. This Example is intended to help you understand your ongoing costs (in dollars) of investing in the Fund and to compare these costs with the ongoing costs of investing in other mutual funds.
The Example is based on an investment of $1,000 invested at the beginning of the period and held for the entire period (May 1, 2014 to October 31, 2014).
Actual Expenses
The first line of the accompanying table for each class of the Fund provides information about actual account values and actual expenses. You may use the information in this line, together with the amount you invested, to estimate the expenses that you paid over the period. Simply divide your account value by $1,000.00 (for example, an $8,600 account value divided by $1,000.00 = 8.6), then multiply the result by the number in the first line for a class of the Fund under the heading entitled "Expenses Paid During Period" to estimate the expenses you paid on your account during this period. In addition, the Fund, as a shareholder in the underlying Fidelity Central Funds, will indirectly bear its pro-rata share of the fees and expenses incurred by the underlying Fidelity Central Funds. These fees and expenses are not included in the Fund's annualized expense ratio used to calculate the expense estimate in the table below.
Hypothetical Example for Comparison Purposes
The second line of the accompanying table for each class of the Fund provides information about hypothetical account values and hypothetical expenses based on a Class' actual expense ratio and an assumed rate of return of 5% per year before expenses, which is not the Class' actual return. The hypothetical account values and expenses may not be used to estimate the actual ending account balance or expenses you paid for the period. You may use this information to compare the ongoing costs of investing in the Fund and other funds. To do so, compare this 5% hypothetical example with the 5% hypothetical examples that appear in the shareholder reports of the other funds. In addition, the Fund, as a shareholder in the underlying Fidelity Central Funds, will indirectly bear its pro-rata share of the fees and expenses incurred by the underlying Fidelity Central Funds. These fees and expenses are not included in the Fund's annualized expense ratio used to calculate the expense estimate in the table below.
Please note that the expenses shown in the table are meant to highlight your ongoing costs only and do not reflect any transaction costs. Therefore, the second line of the table is useful in comparing ongoing costs only, and will not help you determine the relative total costs of owning different funds. In addition, if these transactional costs were included, your costs would have been higher.
Annual Report
| Annualized
Expense RatioB | Beginning
Account Value
May 1, 2014 | Ending
Account Value
October 31, 2014 | Expenses Paid
During Period*
May 1, 2014
to October 31, 2014 |
Class A | 1.27% | | | |
Actual | | $ 1,000.00 | $ 972.30 | $ 6.31 |
HypotheticalA | | $ 1,000.00 | $ 1,018.80 | $ 6.46 |
Class T | 1.45% | | | |
Actual | | $ 1,000.00 | $ 971.20 | $ 7.20 |
HypotheticalA | | $ 1,000.00 | $ 1,017.90 | $ 7.38 |
Class B | 2.04% | | | |
Actual | | $ 1,000.00 | $ 968.70 | $ 10.12 |
HypotheticalA | | $ 1,000.00 | $ 1,014.92 | $ 10.36 |
Class C | 2.05% | | | |
Actual | | $ 1,000.00 | $ 968.10 | $ 10.17 |
HypotheticalA | | $ 1,000.00 | $ 1,014.87 | $ 10.41 |
Institutional Class | .93% | | | |
Actual | | $ 1,000.00 | $ 973.80 | $ 4.63 |
HypotheticalA | | $ 1,000.00 | $ 1,020.52 | $ 4.74 |
A 5% return per year before expenses
B Annualized expense ratio reflects expenses net of applicable fee waivers.
* Expenses are equal to each Class' annualized expense ratio, multiplied by the average account value over the period, multiplied by 184/365 (to reflect the one-half year period).
Annual Report
Investment Changes (Unaudited)
Top Five Stocks as of October 31, 2014 |
| % of fund's
net assets | % of fund's net assets
6 months ago |
Naspers Ltd. Class N (South Africa, Media) | 2.5 | 2.0 |
Nestle SA (Switzerland, Food Products) | 2.3 | 2.2 |
Sanofi SA (France, Pharmaceuticals) | 1.7 | 2.3 |
Novo Nordisk A/S Series B (Denmark, Pharmaceuticals) | 1.7 | 1.6 |
Rakuten, Inc. (Japan, Internet & Catalog Retail) | 1.6 | 1.4 |
| 9.8 | |
Top Five Market Sectors as of October 31, 2014 |
| % of fund's
net assets | % of fund's net assets
6 months ago |
Consumer Discretionary | 25.4 | 26.4 |
Financials | 17.6 | 17.9 |
Information Technology | 16.5 | 12.2 |
Consumer Staples | 12.0 | 11.3 |
Health Care | 10.4 | 9.7 |
Top Five Countries as of October 31, 2014 |
(excluding cash equivalents) | % of fund's
net assets | % of fund's net assets
6 months ago |
United Kingdom | 20.8 | 19.2 |
Japan | 18.8 | 16.4 |
United States of America | 9.1 | 6.8 |
Cayman Islands | 6.8 | 3.7 |
France | 6.6 | 9.5 |
Percentages are adjusted for the effect of open futures contracts, if applicable. |
Asset Allocation (% of fund's net assets) |
As of October 31, 2014 | As of April 30, 2014 |
 | Stocks 99.2% | | | Stocks 99.0% | |
 | Short-Term
Investments and
Net Other Assets (Liabilities) 0.8% | | | Short-Term
Investments and
Net Other Assets (Liabilities) 1.0% | |

Annual Report
Investments October 31, 2014
Showing Percentage of Net Assets
Common Stocks - 97.7% |
| Shares | | Value (000s) |
Australia - 2.2% |
AMP Ltd. | 186,173 | | $ 960 |
BHP Billiton Ltd. | 211,768 | | 6,335 |
Carsales.com Ltd. | 135,616 | | 1,280 |
G8 Education Ltd. | 306,470 | | 1,354 |
iSelect Ltd. (a) | 2,907,626 | | 3,548 |
Macquarie Group Ltd. | 41,347 | | 2,235 |
TOTAL AUSTRALIA | | 15,712 |
Bailiwick of Jersey - 1.0% |
Glencore Xstrata PLC | 526,430 | | 2,694 |
Shire PLC | 63,600 | | 4,267 |
TOTAL BAILIWICK OF JERSEY | | 6,961 |
Belgium - 0.7% |
Ageas | 35,290 | | 1,178 |
KBC Groupe SA (a) | 25,776 | | 1,381 |
UCB SA | 29,600 | | 2,388 |
TOTAL BELGIUM | | 4,947 |
Bermuda - 0.8% |
Clear Media Ltd. | 1,278,000 | | 1,308 |
Oriental Watch Holdings Ltd. | 2,992,000 | | 668 |
Signet Jewelers Ltd. | 32,000 | | 3,840 |
TOTAL BERMUDA | | 5,816 |
Brazil - 1.4% |
BB Seguridade Participacoes SA | 279,900 | | 3,734 |
Cielo SA | 236,560 | | 3,885 |
Kroton Educacional SA | 302,516 | | 2,156 |
TOTAL BRAZIL | | 9,775 |
British Virgin Islands - 0.2% |
Gem Diamonds Ltd. (a) | 465,700 | | 1,157 |
Canada - 0.4% |
Entertainment One Ltd. | 442,400 | | 2,217 |
MDC Partners, Inc. Class A (sub. vtg.) | 16,600 | | 344 |
Performance Sports Group Ltd. (a) | 23,000 | | 398 |
TOTAL CANADA | | 2,959 |
Cayman Islands - 6.8% |
58.com, Inc. ADR (d) | 67,600 | | 2,675 |
Alibaba Group Holding Ltd. sponsored ADR | 88,400 | | 8,716 |
Autohome, Inc. ADR Class A | 37,000 | | 1,957 |
Common Stocks - continued |
| Shares | | Value (000s) |
Cayman Islands - continued |
Baidu.com, Inc. sponsored ADR (a) | 30,100 | | $ 7,187 |
Bitauto Holdings Ltd. ADR (a) | 34,200 | | 2,863 |
Ctrip.com International Ltd. sponsored ADR (a) | 50,900 | | 2,967 |
GCL-Poly Energy Holdings Ltd. (a) | 8,557,000 | | 2,884 |
Greatview Aseptic Pack Co. Ltd. | 1,720,000 | | 1,132 |
Hengdeli Holdings Ltd. | 7,597,000 | | 1,223 |
Qunar Cayman Islands Ltd. sponsored ADR (d) | 50,600 | | 1,361 |
Sitoy Group Holdings Ltd. | 870,000 | | 717 |
SouFun Holdings Ltd. ADR (d) | 368,600 | | 3,594 |
Tencent Holdings Ltd. | 530,700 | | 8,530 |
WuXi PharmaTech Cayman, Inc. sponsored ADR (a) | 62,900 | | 2,371 |
TOTAL CAYMAN ISLANDS | | 48,177 |
China - 0.3% |
TravelSky Technology Ltd. (H Shares) | 1,713,000 | | 1,790 |
Denmark - 2.3% |
Danske Bank A/S | 51,111 | | 1,402 |
Novo Nordisk A/S: | | | |
Series B | 14,315 | | 647 |
Series B sponsored ADR | 245,100 | | 11,074 |
Pandora A/S | 34,400 | | 2,896 |
TOTAL DENMARK | | 16,019 |
France - 6.6% |
AXA SA | 49,558 | | 1,143 |
AXA SA sponsored ADR | 67,200 | | 1,560 |
BNP Paribas SA | 79,616 | | 5,003 |
Bollore Group (d) | 3,522 | | 1,668 |
Bollore Group (a) | 11 | | 5 |
Edenred SA | 50,231 | | 1,391 |
GameLoft SE (a) | 239,900 | | 1,233 |
Groupe FNAC SA (a) | 1 | | 0* |
Havas SA | 416,300 | | 3,365 |
Iliad SA | 6,166 | | 1,348 |
LVMH Moet Hennessy - Louis Vuitton SA | 13,222 | | 2,243 |
Pernod Ricard SA | 35,600 | | 4,052 |
Safran SA | 37,900 | | 2,398 |
Sanofi SA | 80,690 | | 7,322 |
Sanofi SA sponsored ADR | 95,600 | | 4,421 |
Societe Generale Series A | 36,162 | | 1,741 |
Total SA | 129,000 | | 7,702 |
TOTAL FRANCE | | 46,595 |
Common Stocks - continued |
| Shares | | Value (000s) |
Germany - 2.9% |
Allianz SE | 15,880 | | $ 2,525 |
Axel Springer Verlag AG | 51,400 | | 2,821 |
Bayer AG | 62,240 | | 8,849 |
Commerzbank AG (a) | 23,500 | | 354 |
CTS Eventim AG | 106,958 | | 2,820 |
Deutsche Bank AG | 31,560 | | 987 |
Deutsche Boerse AG | 36,969 | | 2,525 |
TOTAL GERMANY | | 20,881 |
Greece - 0.1% |
Greek Organization of Football Prognostics SA | 84,300 | | 1,022 |
Hong Kong - 1.3% |
AIA Group Ltd. | 970,800 | | 5,417 |
Television Broadcasts Ltd. | 761,000 | | 4,167 |
TOTAL HONG KONG | | 9,584 |
India - 0.5% |
Info Edge India Ltd. | 198,211 | | 2,724 |
Just Dial Ltd. | 25,947 | | 634 |
TOTAL INDIA | | 3,358 |
Ireland - 2.0% |
C&C Group PLC | 1,377,300 | | 6,134 |
Glanbia PLC | 157,200 | | 2,218 |
Kingspan Group PLC (United Kingdom) | 203,300 | | 3,195 |
Paddy Power PLC (Ireland) | 32,100 | | 2,341 |
TOTAL IRELAND | | 13,888 |
Isle of Man - 0.5% |
Playtech Ltd. | 314,323 | | 3,550 |
Israel - 0.5% |
Rami Levi Chain Stores Hashikma Marketing 2006 Ltd. | 33,700 | | 1,500 |
Sarine Technologies Ltd. | 750,000 | | 1,739 |
TOTAL ISRAEL | | 3,239 |
Italy - 1.9% |
Assicurazioni Generali SpA | 71,400 | | 1,462 |
Brunello Cucinelli SpA | 4,900 | | 99 |
Eni SpA | 60,300 | | 1,285 |
Eni SpA sponsored ADR | 22,300 | | 948 |
Intesa Sanpaolo SpA | 1,752,800 | | 5,153 |
Lottomatica SpA (d) | 36,500 | | 849 |
Common Stocks - continued |
| Shares | | Value (000s) |
Italy - continued |
Salvatore Ferragamo Italia SpA | 42,800 | | $ 1,010 |
Tod's SpA (d) | 25,929 | | 2,387 |
TOTAL ITALY | | 13,193 |
Japan - 18.8% |
Astellas Pharma, Inc. | 560,500 | | 8,699 |
Cosmos Pharmaceutical Corp. | 47,300 | | 6,763 |
Daiwa Securities Group, Inc. | 208,000 | | 1,644 |
Dentsu, Inc. | 183,300 | | 6,815 |
Enigmo, Inc. (a) | 310,000 | | 3,158 |
Fuji Media Holdings, Inc. | 68,900 | | 951 |
Fujitsu Ltd. | 231,000 | | 1,404 |
Hitachi Ltd. | 703,000 | | 5,524 |
Honda Motor Co. Ltd. | 118,700 | | 3,795 |
Hoya Corp. | 91,000 | | 3,220 |
Infomart Corp. | 23,200 | | 413 |
Japan Tobacco, Inc. | 138,600 | | 4,729 |
JTEKT Corp. | 85,200 | | 1,370 |
Keyence Corp. | 13,800 | | 6,687 |
Misumi Group, Inc. | 325,000 | | 10,255 |
Mitsubishi Electric Corp. | 318,000 | | 4,100 |
Mitsubishi UFJ Financial Group, Inc. | 1,172,700 | | 6,836 |
Mitsubishi UFJ Financial Group, Inc. sponsored ADR | 124,300 | | 731 |
MS&AD Insurance Group Holdings, Inc. | 75,400 | | 1,630 |
NEC Corp. | 394,000 | | 1,393 |
NEXT Co. Ltd. | 457,400 | | 2,600 |
Nomura Holdings, Inc. | 204,200 | | 1,276 |
Nomura Holdings, Inc. sponsored ADR | 40,900 | | 260 |
Olympus Corp. (a) | 57,600 | | 2,068 |
OMRON Corp. | 66,900 | | 3,167 |
ORIX Corp. | 459,800 | | 6,382 |
Pigeon Corp. | 15,400 | | 960 |
Proto Corp. | 36,500 | | 502 |
Rakuten, Inc. | 977,900 | | 11,027 |
Recruit Holdings Co. Ltd. (a) | 13,700 | | 468 |
Ship Healthcare Holdings, Inc. | 52,200 | | 1,222 |
SoftBank Corp. | 72,400 | | 5,271 |
Sumitomo Mitsui Financial Group, Inc. | 137,400 | | 5,604 |
Suzuki Motor Corp. | 54,400 | | 1,823 |
THK Co. Ltd. | 67,300 | | 1,693 |
Tokio Marine Holdings, Inc. | 59,300 | | 1,902 |
Common Stocks - continued |
| Shares | | Value (000s) |
Japan - continued |
Toyota Motor Corp. | 113,000 | | $ 6,800 |
Toyota Motor Corp. sponsored ADR | 4,300 | | 522 |
TOTAL JAPAN | | 133,664 |
Kenya - 0.1% |
East African Breweries Ltd. | 116,216 | | 370 |
Korea (South) - 1.3% |
Korea Express Co. Ltd. (a) | 14,796 | | 2,658 |
NAVER Corp. | 9,457 | | 6,637 |
TOTAL KOREA (SOUTH) | | 9,295 |
Malta - 0.6% |
Kambi Group PLC (a) | 228,400 | | 2,181 |
Unibet Group PLC unit | 40,100 | | 2,311 |
TOTAL MALTA | | 4,492 |
Netherlands - 0.8% |
AEGON NV | 109,900 | | 896 |
ASML Holding NV | 13,857 | | 1,381 |
ING Groep NV: | | | |
(Certificaten Van Aandelen) (a) | 193,910 | | 2,777 |
sponsored ADR (a) | 59,300 | | 849 |
TOTAL NETHERLANDS | | 5,903 |
New Zealand - 0.1% |
EBOS Group Ltd. | 99,154 | | 740 |
Nigeria - 0.1% |
Guinness Nigeria PLC | 395,662 | | 386 |
Nigerian Breweries PLC | 673,311 | | 658 |
TOTAL NIGERIA | | 1,044 |
Norway - 1.0% |
DNB ASA | 184,200 | | 3,384 |
Schibsted ASA (B Shares) (d) | 64,700 | | 3,424 |
Statoil ASA sponsored ADR | 23,300 | | 535 |
TOTAL NORWAY | | 7,343 |
Philippines - 0.6% |
Alliance Global Group, Inc. | 3,777,700 | | 2,125 |
Melco Crown Philippines Resort (a) | 7,218,600 | | 2,409 |
TOTAL PHILIPPINES | | 4,534 |
Common Stocks - continued |
| Shares | | Value (000s) |
South Africa - 3.4% |
Alexander Forbes Group Holding (a) | 916,508 | | $ 715 |
Capevin Holdings Ltd. | 66,096 | | 52 |
Clicks Group Ltd. | 385,766 | | 2,627 |
Distell Group Ltd. | 112,162 | | 1,358 |
Life Healthcare Group Holdings Ltd. | 272,900 | | 1,032 |
Naspers Ltd. Class N | 145,000 | | 18,038 |
TOTAL SOUTH AFRICA | | 23,822 |
Spain - 1.4% |
Atresmedia Corporacion de Medios de Comunicacion SA | 229,100 | | 3,356 |
Banco Bilbao Vizcaya Argentaria SA | 205,000 | | 2,293 |
Banco Santander SA: | | | |
rights 11/3/14 (a) | 147,016 | | 28 |
(Spain) | 147,053 | | 1,299 |
Mediaset Espana Comunicacion, S.A. (a) | 223,800 | | 2,802 |
TOTAL SPAIN | | 9,778 |
Sweden - 1.2% |
Nordea Bank AB | 249,400 | | 3,198 |
Svenska Cellulosa AB (SCA) (B Shares) | 191,800 | | 4,288 |
Swedbank AB (A Shares) | 51,612 | | 1,365 |
TOTAL SWEDEN | | 8,851 |
Switzerland - 5.6% |
Compagnie Financiere Richemont SA Series A | 64,450 | | 5,422 |
Credit Suisse Group AG | 163,141 | | 4,347 |
Credit Suisse Group AG sponsored ADR | 11,300 | | 301 |
Nestle SA | 218,204 | | 16,002 |
Swiss Re Ltd. | 19,790 | | 1,598 |
Syngenta AG (Switzerland) | 16,570 | | 5,124 |
UBS AG | 208,359 | | 3,623 |
UBS AG (NY Shares) | 108,277 | | 1,882 |
Zurich Insurance Group AG | 5,614 | | 1,697 |
TOTAL SWITZERLAND | | 39,996 |
Taiwan - 0.2% |
Addcn Technology Co. Ltd. | 153,000 | | 1,471 |
Thailand - 0.2% |
Thai Beverage PCL | 2,900,000 | | 1,727 |
United Kingdom - 20.8% |
Al Noor Hospitals Group PLC | 53,600 | | 874 |
Anglo American PLC (United Kingdom) | 120,700 | | 2,548 |
Common Stocks - continued |
| Shares | | Value (000s) |
United Kingdom - continued |
AstraZeneca PLC (United Kingdom) | 98,550 | | $ 7,199 |
Aviva PLC | 184,200 | | 1,541 |
Barclays PLC | 1,171,848 | | 4,507 |
Barclays PLC sponsored ADR | 52,868 | | 814 |
BG Group PLC | 163,618 | | 2,727 |
BHP Billiton PLC | 121,504 | | 3,139 |
BP PLC | 183,400 | | 1,320 |
BP PLC sponsored ADR | 49,166 | | 2,137 |
Brammer PLC | 527,500 | | 2,736 |
Burberry Group PLC | 165,900 | | 4,063 |
Dechra Pharmaceuticals PLC | 73,200 | | 888 |
Diageo PLC | 231,700 | | 6,833 |
Dunelm Group PLC | 195,800 | | 2,642 |
Exova Group Ltd. PLC (a) | 40,100 | | 109 |
Foxtons Group PLC | 194,600 | | 524 |
Galiform PLC | 1,002,300 | | 5,488 |
GlaxoSmithKline PLC | 168,000 | | 3,799 |
HSBC Holdings PLC sponsored ADR | 183,891 | | 9,382 |
Intertek Group PLC | 62,300 | | 2,713 |
ITV PLC | 1,571,900 | | 5,105 |
Johnson Matthey PLC | 72,319 | | 3,441 |
Lloyds Banking Group PLC (a) | 5,476,799 | | 6,763 |
M&C Saatchi PLC | 887,505 | | 4,199 |
Moneysupermarket.com Group PLC | 738,800 | | 2,364 |
Poundland Group PLC (a) | 74,176 | | 374 |
Prudential PLC | 100,209 | | 2,320 |
Reckitt Benckiser Group PLC | 27,300 | | 2,293 |
Rightmove PLC | 182,700 | | 6,167 |
Rio Tinto PLC | 94,332 | | 4,488 |
Rolls-Royce Group PLC | 164,274 | | 2,215 |
Royal Bank of Scotland Group PLC (a) | 120,080 | | 747 |
Royal Dutch Shell PLC: | | | |
Class A (United Kingdom) | 233,928 | | 8,356 |
Class B (United Kingdom) | 176,236 | | 6,511 |
SABMiller PLC | 155,100 | | 8,746 |
Standard Chartered PLC (United Kingdom) | 89,816 | | 1,350 |
SThree PLC | 190,600 | | 945 |
Taylor Wimpey PLC | 715,100 | | 1,354 |
Travis Perkins PLC | 81,800 | | 2,162 |
Vodafone Group PLC | 2,164,100 | | 7,197 |
William Hill PLC | 718,366 | | 4,143 |
TOTAL UNITED KINGDOM | | 147,223 |
Common Stocks - continued |
| Shares | | Value (000s) |
United States of America - 9.1% |
BlackRock, Inc. Class A | 10,800 | | $ 3,684 |
Boston Beer Co., Inc. Class A (a) | 6,500 | | 1,619 |
Dunkin' Brands Group, Inc. | 46,700 | | 2,124 |
eBay, Inc. (a) | 44,700 | | 2,347 |
Facebook, Inc. Class A (a) | 65,600 | | 4,919 |
Gilead Sciences, Inc. (a) | 46,200 | | 5,174 |
Google, Inc.: | | | |
Class A (a) | 6,700 | | 3,805 |
Class C (a) | 5,400 | | 3,019 |
Lorillard, Inc. | 39,600 | | 2,435 |
MercadoLibre, Inc. (d) | 18,800 | | 2,560 |
Monsanto Co. | 26,700 | | 3,072 |
Monster Beverage Corp. (a) | 64,600 | | 6,517 |
priceline.com, Inc. (a) | 3,500 | | 4,222 |
Sprouts Farmers Market LLC (a) | 97,800 | | 2,847 |
Tiffany & Co., Inc. | 49,600 | | 4,768 |
TripAdvisor, Inc. (a) | 17,900 | | 1,587 |
Visa, Inc. Class A | 28,500 | | 6,881 |
Zillow, Inc. (a)(d) | 26,000 | | 2,827 |
TOTAL UNITED STATES OF AMERICA | | 64,407 |
TOTAL COMMON STOCKS (Cost $610,873) |
693,283
|
Nonconvertible Preferred Stocks - 1.5% |
| | | |
Germany - 1.5% |
Sartorius AG (non-vtg.) | 16,700 | | 1,821 |
Volkswagen AG | 40,000 | | 8,524 |
TOTAL GERMANY | | 10,345 |
United Kingdom - 0.0% |
Rolls-Royce Group PLC | 14,784,660 | | 24 |
TOTAL NONCONVERTIBLE PREFERRED STOCKS (Cost $9,047) |
10,369
|
Money Market Funds - 2.7% |
| Shares | | Value (000s) |
Fidelity Cash Central Fund, 0.11% (b) | 1,115,066 | | $ 1,115 |
Fidelity Securities Lending Cash Central Fund, 0.11% (b)(c) | 17,737,960 | | 17,738 |
TOTAL MONEY MARKET FUNDS (Cost $18,853) |
18,853
|
TOTAL INVESTMENT PORTFOLIO - 101.9% (Cost $638,773) | | 722,505 |
NET OTHER ASSETS (LIABILITIES) - (1.9)% | | (13,166) |
NET ASSETS - 100% | $ 709,339 |
Legend |
(a) Non-income producing |
(b) Affiliated fund that is generally available only to investment companies and other accounts managed by Fidelity Investments. The rate quoted is the annualized seven-day yield of the fund at period end. A complete unaudited listing of the fund's holdings as of its most recent quarter end is available upon request. In addition, each Fidelity Central Fund's financial statements, which are not covered by the Fund's Report of Independent Registered Public Accounting Firm, are available on the SEC's website or upon request. |
(c) Investment made with cash collateral received from securities on loan. |
(d) Security or a portion of the security is on loan at period end. |
* Amount represents less than $1,000 |
Affiliated Central Funds |
Information regarding fiscal year to date income earned by the Fund from investments in Fidelity Central Funds is as follows: |
Fund | Income earned
(Amounts in thousands) |
Fidelity Cash Central Fund | $ 13 |
Fidelity Securities Lending Cash Central Fund | 326 |
Total | $ 339 |
Other Information |
Categorizations in the Schedule of Investments are based on country or territory of incorporation. |
The following is a summary of the inputs used, as of October 31, 2014, involving the Fund's assets and liabilities carried at fair value. The inputs or methodology used for valuing securities may not be an indication of the risk associated with investing in those securities. For more information on valuation inputs, and their aggregation into the levels used in the tables below, please refer to the Investment Valuation section in the accompanying Notes to Financial Statements. |
Valuation Inputs at Reporting Date: |
Description
(Amounts in thousands) | Total | Level 1 | Level 2 | Level 3 |
Investments in Securities: | | | | |
Equities: | | | | |
Consumer Discretionary | $ 177,659 | $ 127,952 | $ 49,707 | $ - |
Consumer Staples | 85,114 | 48,100 | 37,014 | - |
Energy | 31,521 | 3,620 | 27,901 | - |
Financials | 126,909 | 53,245 | 73,664 | - |
Health Care | 74,855 | 39,632 | 35,223 | - |
Industrials | 43,969 | 22,219 | 21,750 | - |
Information Technology | 116,679 | 72,400 | 44,279 | - |
Materials | 33,130 | 10,364 | 22,766 | - |
Telecommunication Services | 13,816 | 1,348 | 12,468 | - |
Money Market Funds | 18,853 | 18,853 | - | - |
Total Investments in Securities: | $ 722,505 | $ 397,733 | $ 324,772 | $ - |
The following is a summary of transfers between Level 1 and Level 2 for the period ended October 31, 2014. Transfers are assumed to have occurred at the beginning of the period, and are primarily attributable to the valuation techniques used for foreign equity securities, as discussed in the accompanying Notes to Financial Statements: |
Transfers | Total (000s) |
Level 1 to Level 2 | $ 44,934 |
Level 2 to Level 1 | $ 0 |
See accompanying notes which are an integral part of the financial statements.
Annual Report
Statement of Assets and Liabilities
Amounts in thousands (except per-share amounts) | October 31, 2014 |
| | |
Assets | | |
Investment in securities, at value (including securities loaned of $17,941) - See accompanying schedule: Unaffiliated issuers (cost $619,920) | $ 703,652 | |
Fidelity Central Funds (cost $18,853) | 18,853 | |
Total Investments (cost $638,773) | | $ 722,505 |
Receivable for investments sold | | 8,034 |
Receivable for fund shares sold | | 1,542 |
Dividends receivable | | 1,676 |
Distributions receivable from Fidelity Central Funds | | 11 |
Prepaid expenses | | 2 |
Other receivables | | 78 |
Total assets | | 733,848 |
| | |
Liabilities | | |
Payable for investments purchased | $ 5,509 | |
Payable for fund shares redeemed | 426 | |
Accrued management fee | 427 | |
Distribution and service plan fees payable | 150 | |
Other affiliated payables | 150 | |
Other payables and accrued expenses | 109 | |
Collateral on securities loaned, at value | 17,738 | |
Total liabilities | | 24,509 |
| | |
Net Assets | | $ 709,339 |
Net Assets consist of: | | |
Paid in capital | | $ 677,270 |
Undistributed net investment income | | 1,479 |
Accumulated undistributed net realized gain (loss) on investments and foreign currency transactions | | (53,054) |
Net unrealized appreciation (depreciation) on investments and assets and liabilities in foreign currencies | | 83,644 |
Net Assets | | $ 709,339 |
See accompanying notes which are an integral part of the financial statements.
Annual Report
Financial Statements - continued
Statement of Assets and Liabilities - continued
Amounts in thousands (except per-share amounts) | October 31, 2014 |
| | |
Calculation of Maximum Offering Price Class A:
Net Asset Value and redemption price per share ($65,257.9 ÷ 3,094.63 shares) | | $ 21.09 |
| | |
Maximum offering price per share (100/94.25 of $21.09) | | $ 22.38 |
Class T:
Net Asset Value and redemption price per share ($293,404.0 ÷ 13,570.92 shares) | | $ 21.62 |
| | |
Maximum offering price per share (100/96.50 of $21.62) | | $ 22.40 |
Class B:
Net Asset Value and offering price per share ($2,058.0 100.61 shares)A | | $ 20.46 |
| | |
Class C:
Net Asset Value and offering price per share ($18,970.9 ÷ 919.37 shares)A | | $ 20.63 |
| | |
Institutional Class:
Net Asset Value, offering price and redemption price per share ($329,647.7 ÷ 15,294.00 shares) | | $ 21.55 |
A Redemption price per share is equal to net asset value less any applicable contingent deferred sales charge.
See accompanying notes which are an integral part of the financial statements.
Annual Report
Statement of Operations
Amounts in thousands | Year ended October 31, 2014 |
| | |
Investment Income | | |
Dividends | | $ 18,929 |
Income from Fidelity Central Funds | | 339 |
Income before foreign taxes withheld | | 19,268 |
Less foreign taxes withheld | | (1,240) |
Total income | | 18,028 |
| | |
Expenses | | |
Management fee
Basic fee | $ 5,216 | |
Performance adjustment | (65) | |
Transfer agent fees | 1,509 | |
Distribution and service plan fees | 2,013 | |
Accounting and security lending fees | 367 | |
Custodian fees and expenses | 155 | |
Independent trustees' compensation | 3 | |
Registration fees | 72 | |
Audit | 78 | |
Legal | 4 | |
Miscellaneous | 6 | |
Total expenses | | 9,358 |
Net investment income (loss) | | 8,670 |
Realized and Unrealized Gain (Loss) Net realized gain (loss) on: | | |
Investment securities: | | |
Unaffiliated issuers | 58,093 | |
Foreign currency transactions | (155) | |
Total net realized gain (loss) | | 57,938 |
Change in net unrealized appreciation (depreciation) on: Investment securities | (75,457) | |
Assets and liabilities in foreign currencies | (68) | |
Total change in net unrealized appreciation (depreciation) | | (75,525) |
Net gain (loss) | | (17,587) |
Net increase (decrease) in net assets resulting from operations | | $ (8,917) |
See accompanying notes which are an integral part of the financial statements.
Annual Report
Financial Statements - continued
Statement of Changes in Net Assets
Amounts in thousands | Year ended
October 31,
2014 | Year ended
October 31,
2013 |
Increase (Decrease) in Net Assets | | |
Operations | | |
Net investment income (loss) | $ 8,670 | $ 6,363 |
Net realized gain (loss) | 57,938 | 35,511 |
Change in net unrealized appreciation (depreciation) | (75,525) | 138,935 |
Net increase (decrease) in net assets resulting
from operations | (8,917) | 180,809 |
Distributions to shareholders from net investment income | (6,228) | (8,840) |
Distributions to shareholders from net realized gain | (2,640) | (1,437) |
Total distributions | (8,868) | (10,277) |
Share transactions - net increase (decrease) | (1,301) | (49,806) |
Redemption fees | 19 | 12 |
Total increase (decrease) in net assets | (19,067) | 120,738 |
| | |
Net Assets | | |
Beginning of period | 728,406 | 607,668 |
End of period (including undistributed net investment income of $1,479 and undistributed net investment income of $6,237, respectively) | $ 709,339 | $ 728,406 |
See accompanying notes which are an integral part of the financial statements.
Annual Report
Financial Highlights - Class A
Years ended October 31, | 2014 | 2013 | 2012 | 2011 | 2010 |
Selected Per-Share Data | | | | | |
Net asset value, beginning of period | $ 21.61 | $ 16.76 | $ 16.13 | $ 17.77 | $ 15.68 |
Income from Investment Operations | | | | | |
Net investment income (loss) C | .24 | .17 | .23 | .16 | .17 |
Net realized and unrealized gain (loss) | (.50) | 4.97 | .64 | (1.54) | 2.16 |
Total from investment operations | (.26) | 5.14 | .87 | (1.38) | 2.33 |
Distributions from net investment income | (.18) | (.25) | (.24) | (.21) | (.21) |
Distributions from net realized gain | (.08) | (.04) | - | (.05) | (.03) |
Total distributions | (.26) | (.29) | (.24) | (.26) | (.24) |
Redemption fees added to paid in capital C, G | - | - | - | - | - |
Net asset value, end of period | $ 21.09 | $ 21.61 | $ 16.76 | $ 16.13 | $ 17.77 |
Total ReturnA, B | (1.24)% | 31.13% | 5.51% | (7.95)% | 14.99% |
Ratios to Average Net Assets D, F | | | | | |
Expenses before reductions | 1.30% | 1.37% | 1.33% | 1.34% | 1.36% |
Expenses net of fee waivers, if any | 1.30% | 1.37% | 1.33% | 1.34% | 1.36% |
Expenses net of all reductions | 1.30% | 1.36% | 1.32% | 1.32% | 1.33% |
Net investment income (loss) | 1.10% | .91% | 1.43% | .90% | 1.04% |
Supplemental Data | | | | | |
Net assets, end of period (in millions) | $ 65 | $ 69 | $ 60 | $ 60 | $ 70 |
Portfolio turnover rateE | 39% | 37% | 36% | 44% | 53% |
A Total returns would have been lower if certain expenses had not been reduced during the applicable periods shown.
B Total returns do not include the effect of the sales charges.
C Calculated based on average shares outstanding during the period.
D Fees and expenses of any underlying Fidelity Central Funds are not included in the Fund's expense ratio. The Fund indirectly bears its proportionate share of the expenses of any underlying Fidelity Central Funds.
E Amount does not include the portfolio activity of any underlying Fidelity Central Funds.
F Expense ratios reflect operating expenses of the class. Expenses before reductions do not reflect amounts reimbursed by the investment adviser or reductions from brokerage service arrangements or reductions from other expense offset arrangements and do not represent the amount paid by the class during periods when reimbursements or reductions occur. Expenses net of fee waivers reflect expenses after reimbursement by the investment adviser but prior to reductions from brokerage service arrangements or other expense offset arrangements. Expenses net of all reductions represent the net expenses paid by the class.
G Amount represents less than $.01 per share.
See accompanying notes which are an integral part of the financial statements.
Annual Report
Financial Highlights - Class T
Years ended October 31, | 2014 | 2013 | 2012 | 2011 | 2010 |
Selected Per-Share Data | | | | | |
Net asset value, beginning of period | $ 22.16 | $ 17.16 | $ 16.50 | $ 18.18 | $ 16.03 |
Income from Investment Operations | | | | | |
Net investment income (loss) C | .21 | .14 | .20 | .13 | .14 |
Net realized and unrealized gain (loss) | (.52) | 5.11 | .66 | (1.59) | 2.23 |
Total from investment operations | (.31) | 5.25 | .86 | (1.46) | 2.37 |
Distributions from net investment income | (.15) | (.21) | (.20) | (.17) | (.19) |
Distributions from net realized gain | (.08) | (.04) | - | (.05) | (.03) |
Total distributions | (.23) | (.25) | (.20) | (.22) | (.22) |
Redemption fees added to paid in capital C, G | - | - | - | - | - |
Net asset value, end of period | $ 21.62 | $ 22.16 | $ 17.16 | $ 16.50 | $ 18.18 |
Total ReturnA, B | (1.42)% | 30.96% | 5.32% | (8.17)% | 14.88% |
Ratios to Average Net Assets D, F | | | | | |
Expenses before reductions | 1.48% | 1.53% | 1.51% | 1.52% | 1.53% |
Expenses net of fee waivers, if any | 1.48% | 1.53% | 1.51% | 1.51% | 1.53% |
Expenses net of all reductions | 1.48% | 1.52% | 1.50% | 1.49% | 1.50% |
Net investment income (loss) | .92% | .74% | 1.25% | .73% | .86% |
Supplemental Data | | | | | |
Net assets, end of period (in millions) | $ 293 | $ 329 | $ 271 | $ 305 | $ 371 |
Portfolio turnover rateE | 39% | 37% | 36% | 44% | 53% |
A Total returns would have been lower if certain expenses had not been reduced during the applicable periods shown.
B Total returns do not include the effect of the sales charges.
C Calculated based on average shares outstanding during the period.
D Fees and expenses of any underlying Fidelity Central Funds are not included in the Fund's expense ratio. The Fund indirectly bears its proportionate share of the expenses of any underlying Fidelity Central Funds.
E Amount does not include the portfolio activity of any underlying Fidelity Central Funds.
F Expense ratios reflect operating expenses of the class. Expenses before reductions do not reflect amounts reimbursed by the investment adviser or reductions from brokerage service arrangements or reductions from other expense offset arrangements and do not represent the amount paid by the class during periods when reimbursements or reductions occur. Expenses net of fee waivers reflect expenses after reimbursement by the investment adviser but prior to reductions from brokerage service arrangements or other expense offset arrangements. Expenses net of all reductions represent the net expenses paid by the class.
G Amount represents less than $.01 per share.
See accompanying notes which are an integral part of the financial statements.
Annual Report
Financial Highlights - Class B
Years ended October 31, | 2014 | 2013 | 2012 | 2011 | 2010 |
Selected Per-Share Data | | | | | |
Net asset value, beginning of period | $ 21.02 | $ 16.25 | $ 15.58 | $ 17.18 | $ 15.16 |
Income from Investment Operations | | | | | |
Net investment income (loss) C | .07 | .03 | .10 | .03 | .04 |
Net realized and unrealized gain (loss) | (.49) | 4.85 | .63 | (1.51) | 2.10 |
Total from investment operations | (.42) | 4.88 | .73 | (1.48) | 2.14 |
Distributions from net investment income | (.06) | (.07) | (.06) | (.08) | (.09) |
Distributions from net realized gain | (.08) | (.04) | - | (.05) | (.03) |
Total distributions | (.14) | (.11) | (.06) | (.12) H | (.12) |
Redemption fees added to paid in capital C, G | - | - | - | - | - |
Net asset value, end of period | $ 20.46 | $ 21.02 | $ 16.25 | $ 15.58 | $ 17.18 |
Total ReturnA, B | (2.03)% | 30.21% | 4.72% | (8.67)% | 14.15% |
Ratios to Average Net Assets D, F | | | | | |
Expenses before reductions | 2.09% | 2.12% | 2.09% | 2.10% | 2.11% |
Expenses net of fee waivers, if any | 2.09% | 2.12% | 2.09% | 2.09% | 2.11% |
Expenses net of all reductions | 2.09% | 2.11% | 2.07% | 2.07% | 2.09% |
Net investment income (loss) | .31% | .16% | .67% | .15% | .28% |
Supplemental Data | | | | | |
Net assets, end of period (in millions) | $ 2 | $ 3 | $ 3 | $ 4 | $ 7 |
Portfolio turnover rateE | 39% | 37% | 36% | 44% | 53% |
A Total returns would have been lower if certain expenses had not been reduced during the applicable periods shown.
B Total returns do not include the effect of the contingent deferred sales charge.
C Calculated based on average shares outstanding during the period.
D Fees and expenses of any underlying Fidelity Central Funds are not included in the Fund's expense ratio. The Fund indirectly bears its proportionate share of the expenses of any underlying Fidelity Central Funds.
E Amount does not include the portfolio activity of any underlying Fidelity Central Funds.
F Expense ratios reflect operating expenses of the class. Expenses before reductions do not reflect amounts reimbursed by the investment adviser or reductions from brokerage service arrangements or reductions from other expense offset arrangements and do not represent the amount paid by the class during periods when reimbursements or reductions occur. Expenses net of fee waivers reflect expenses after reimbursement by the investment adviser but prior to reductions from brokerage service arrangements or other expense offset arrangements. Expenses net of all reductions represent the net expenses paid by the class.
G Amount represents less than $.01 per share.
H Total distributions of $.12 per share is comprised of distributions from net investment income of $.079 and distributions from net realized gain of $.045 per share.
See accompanying notes which are an integral part of the financial statements.
Annual Report
Financial Highlights - Class C
Years ended October 31, | 2014 | 2013 | 2012 | 2011 | 2010 |
Selected Per-Share Data | | | | | |
Net asset value, beginning of period | $ 21.21 | $ 16.43 | $ 15.78 | $ 17.39 | $ 15.36 |
Income from Investment Operations | | | | | |
Net investment income (loss) C | .07 | .03 | .11 | .03 | .05 |
Net realized and unrealized gain (loss) | (.50) | 4.89 | .64 | (1.52) | 2.12 |
Total from investment operations | (.43) | 4.92 | .75 | (1.49) | 2.17 |
Distributions from net investment income | (.07) | (.10) | (.10) | (.07) | (.11) |
Distributions from net realized gain | (.08) | (.04) | - | (.05) | (.03) |
Total distributions | (.15) | (.14) | (.10) | (.12) | (.14) |
Redemption fees added to paid in capital C, G | - | - | - | - | - |
Net asset value, end of period | $ 20.63 | $ 21.21 | $ 16.43 | $ 15.78 | $ 17.39 |
Total ReturnA, B | (2.06)% | 30.16% | 4.78% | (8.67)% | 14.17% |
Ratios to Average Net Assets D, F | | | | | |
Expenses before reductions | 2.08% | 2.12% | 2.09% | 2.09% | 2.10% |
Expenses net of fee waivers, if any | 2.08% | 2.12% | 2.09% | 2.09% | 2.10% |
Expenses net of all reductions | 2.08% | 2.10% | 2.07% | 2.07% | 2.08% |
Net investment income (loss) | .32% | .16% | .67% | .15% | .29% |
Supplemental Data | | | | | |
Net assets, end of period (in millions) | $ 19 | $ 21 | $ 16 | $ 19 | $ 22 |
Portfolio turnover rateE | 39% | 37% | 36% | 44% | 53% |
A Total returns would have been lower if certain expenses had not been reduced during the applicable periods shown.
B Total returns do not include the effect of the contingent deferred sales charge.
C Calculated based on average shares outstanding during the period.
D Fees and expenses of any underlying Fidelity Central Funds are not included in the Fund's expense ratio. The Fund indirectly bears its proportionate share of the expenses of any underlying Fidelity Central Funds.
E Amount does not include the portfolio activity of any underlying Fidelity Central Funds.
F Expense ratios reflect operating expenses of the class. Expenses before reductions do not reflect amounts reimbursed by the investment adviser or reductions from brokerage service arrangements or reductions from other expense offset arrangements and do not represent the amount paid by the class during periods when reimbursements or reductions occur. Expenses net of fee waivers reflect expenses after reimbursement by the investment adviser but prior to reductions from brokerage service arrangements or other expense offset arrangements. Expenses net of all reductions represent the net expenses paid by the class.
G Amount represents less than $.01 per share.
See accompanying notes which are an integral part of the financial statements.
Annual Report
Financial Highlights - Institutional Class
Years ended October 31, | 2014 | 2013 | 2012 | 2011 | 2010 |
Selected Per-Share Data | | | | | |
Net asset value, beginning of period | $ 22.07 | $ 17.11 | $ 16.45 | $ 18.10 | $ 15.95 |
Income from Investment Operations | | | | | |
Net investment income (loss) B | .32 | .24 | .29 | .23 | .22 |
Net realized and unrealized gain (loss) | (.52) | 5.08 | .65 | (1.59) | 2.23 |
Total from investment operations | (.20) | 5.32 | .94 | (1.36) | 2.45 |
Distributions from net investment income | (.24) | (.31) | (.28) | (.24) | (.27) |
Distributions from net realized gain | (.08) | (.04) | - | (.05) | (.03) |
Total distributions | (.32) | (.36)G | (.28) | (.29) | (.30) |
Redemption fees added to paid in capital B, F | - | - | - | - | - |
Net asset value, end of period | $ 21.55 | $ 22.07 | $ 17.11 | $ 16.45 | $ 18.10 |
Total ReturnA | (.95)% | 31.63% | 5.91% | (7.70)% | 15.49% |
Ratios to Average Net Assets C, E | | | | | |
Expenses before reductions | .96% | 1.02% | .99% | 1.00% | 1.01% |
Expenses net of fee waivers, if any | .96% | 1.02% | .99% | .99% | 1.01% |
Expenses net of all reductions | .96% | 1.01% | .97% | .97% | .98% |
Net investment income (loss) | 1.44% | 1.26% | 1.77% | 1.25% | 1.39% |
Supplemental Data | | | | | |
Net assets, end of period (in millions) | $ 330 | $ 307 | $ 257 | $ 349 | $ 678 |
Portfolio turnover rateD | 39% | 37% | 36% | 44% | 53% |
A Total returns would have been lower if certain expenses had not been reduced during the applicable periods shown.
B Calculated based on average shares outstanding during the period.
C Fees and expenses of any underlying Fidelity Central Funds are not included in the Fund's expense ratio. The Fund indirectly bears its proportionate share of the expenses of any underlying Fidelity Central Funds.
D Amount does not include the portfolio activity of any underlying Fidelity Central Funds.
E Expense ratios reflect operating expenses of the class. Expenses before reductions do not reflect amounts reimbursed by the investment adviser or reductions from brokerage service arrangements or reductions from other expense offset arrangements and do not represent the amount paid by the class during periods when reimbursements or reductions occur. Expenses net of fee waivers reflect expenses after reimbursement by the investment adviser but prior to reductions from brokerage service arrangements or other expense offset arrangements. Expenses net of all reductions represent the net expenses paid by the class.
F Amount represents less than $.01 per share.
G Total distributions of $.36 per share is comprised of distributions from net investment income of $.314 and distributions from net realized gain of $.041 per share.
See accompanying notes which are an integral part of the financial statements.
Annual Report
Notes to Financial Statements
For the period ended October 31, 2014
(Amounts in thousands except percentages)
1. Organization.
Fidelity Advisor Overseas Fund (the Fund) is a fund of Fidelity Advisor Series VIII (the Trust) and is authorized to issue an unlimited number of shares. The Trust is registered under the Investment Company Act of 1940, as amended (the 1940 Act), as an open-end management investment company organized as a Massachusetts business trust. The Fund offers Class A, Class T, Class C and Institutional Class shares, each of which, along with Class B shares, has equal rights as to assets and voting privileges. Class B shares are closed to new accounts and additional purchases, except for exchanges and reinvestments. Each class has exclusive voting rights with respect to matters that affect that class. Class B shares will automatically convert to Class A shares after a holding period of seven years from the initial date of purchase. The Fund's investments in emerging markets can be subject to social, economic, regulatory, and political uncertainties and can be extremely volatile.
2. Investments in Fidelity Central Funds.
The Fund invests in Fidelity Central Funds, which are open-end investment companies generally available only to other investment companies and accounts managed by the investment adviser and its affiliates. The Fund's Schedule of Investments lists each of the Fidelity Central Funds held as of period end, if any, as an investment of the Fund, but does not include the underlying holdings of each Fidelity Central Fund. As an Investing Fund, the Fund indirectly bears its proportionate share of the expenses of the underlying Fidelity Central Funds.
The Money Market Central Funds seek preservation of capital and current income and are managed by Fidelity Investments Money Management, Inc. (FIMM), an affiliate of the investment adviser. Annualized expenses of the Money Market Central Funds as of their most recent shareholder report date are less than .01%.
A complete unaudited list of holdings for each Fidelity Central Fund is available upon request or at the Securities and Exchange Commission (the SEC) website at www.sec.gov. In addition, the financial statements of the Fidelity Central Funds, which are not covered by the Fund's Report of Independent Registered Public Accounting Firm, are available on the SEC website or upon request.
3. Significant Accounting Policies.
The financial statements have been prepared in conformity with accounting principles generally accepted in the United States of America (GAAP), which require management to make certain estimates and assumptions at the date of the financial statements. Actual results could differ from those estimates. Subsequent events, if any, through the date that the financial statements were issued have been evaluated in the preparation of
Annual Report
Notes to Financial Statements - continued
(Amounts in thousands except percentages)
3. Significant Accounting Policies - continued
the financial statements. The following summarizes the significant accounting policies of the Fund:
Investment Valuation. Investments are valued as of 4:00 p.m. Eastern time on the last calendar day of the period. In accordance with valuation policies and procedures approved by the Board of Trustees (the Board), the Fund attempts to obtain prices from one or more third party pricing vendors or brokers to value its investments. When current market prices, quotations or currency exchange rates are not readily available or reliable, investments will be fair valued in good faith by the Fidelity Management & Research Company (FMR) Fair Value Committee (the Committee), in accordance with procedures adopted by the Board. Factors used in determining fair value vary by investment type and may include market or investment specific events. The frequency with which these procedures are used cannot be predicted and they may be utilized to a significant extent. The Committee oversees the Fund's valuation policies and procedures and is responsible for approving and reporting to the Board all fair value determinations.
The Fund categorizes the inputs to valuation techniques used to value its investments into a disclosure hierarchy consisting of three levels as shown below:
Level 1 - quoted prices in active markets for identical investments
Level 2 - other significant observable inputs (including quoted prices for similar investments, interest rates, prepayment speeds, etc.)
Level 3 - unobservable inputs (including the Fund's own assumptions based on the best information available)
Valuation techniques used to value the Fund's investments by major category are as follows:
Equity securities, including restricted securities, for which market quotations are readily available, are valued at the last reported sale price or official closing price as reported by a third party pricing vendor on the primary market or exchange on which they are traded and are categorized as Level 1 in the hierarchy. In the event there were no sales during the day or closing prices are not available, securities are valued at the last quoted bid price or may be valued using the last available price and are generally categorized as Level 2 in the hierarchy. For foreign equity securities, when market or security specific events arise, comparisons to the valuation of American Depositary Receipts (ADRs), futures contracts, Exchange-Traded Funds (ETFs) and certain indexes as well as quoted prices for similar securities may be used and would be categorized as Level 2 in the hierarchy. Utilizing these techniques may result in transfers between Level 1 and Level 2. For equity securities, including restricted securities, where observable inputs are
Annual Report
3. Significant Accounting Policies - continued
Investment Valuation - continued
limited, assumptions about market activity and risk are used and these securities may be categorized as Level 3 in the hierarchy.
Investments in open-end mutual funds, including the Fidelity Central Funds, are valued at their closing net asset value (NAV) each business day and are categorized as Level 1 in the hierarchy.
Changes in valuation techniques may result in transfers in or out of an assigned level within the disclosure hierarchy. The aggregate value of investments by input level, as of October 31, 2014, including information on transfers between Levels 1 and 2, is included at the end of the Fund's Schedule of Investments.
Foreign Currency. The Fund may use foreign currency contracts to facilitate transactions in foreign-denominated securities. Gains and losses from these transactions may arise from changes in the value of the foreign currency or if the counterparties do not perform under the contracts' terms.
Foreign-denominated assets, including investment securities, and liabilities are translated into U.S. dollars at the exchange rates at period end. Purchases and sales of investment securities, income and dividends received and expenses denominated in foreign currencies are translated into U.S. dollars at the exchange rate in effect on the transaction date.
The effects of exchange rate fluctuations on investments are included with the net realized and unrealized gain (loss) on investment securities. Other foreign currency transactions resulting in realized and unrealized gain (loss) are disclosed separately.
Investment Transactions and Income. For financial reporting purposes, the Fund's investment holdings and NAV include trades executed through the end of the last business day of the period. The NAV per share for processing shareholder transactions is calculated as of the close of business of the New York Stock Exchange (NYSE), normally 4:00 p.m. Eastern time and includes trades executed through the end of the prior business day. Gains and losses on securities sold are determined on the basis of identified cost and may include proceeds received from litigation. Dividend income is recorded on the ex-dividend date, except for certain dividends from foreign securities where the ex-dividend date may have passed, which are recorded as soon as the Fund is informed of the ex-dividend date. Non-cash dividends included in dividend income, if any, are recorded at the fair market value of the securities received. Income and capital gain distributions from Fidelity Central Funds, if any, are recorded on the ex-dividend date. Interest income is accrued as earned and includes coupon interest and amortization of
Annual Report
Notes to Financial Statements - continued
(Amounts in thousands except percentages)
3. Significant Accounting Policies - continued
Investment Transactions and Income - continued
premium and accretion of discount on debt securities as applicable. Investment income is recorded net of foreign taxes withheld where recovery of such taxes is uncertain.
Class Allocations and Expenses. Investment income, realized and unrealized capital gains and losses, common expenses of the Fund, and certain fund-level expense reductions, if any, are allocated daily on a pro-rata basis to each class based on the relative net assets of each class to the total net assets of the Fund. Each class differs with respect to transfer agent and distribution and service plan fees incurred. Certain expense reductions may also differ by class. For the reporting period, the allocated portion of income and expenses to each class as a percent of its average net assets may vary due to the timing of recording these transactions in relation to fluctuating net assets of the classes. Expenses directly attributable to a fund are charged to that fund. Expenses attributable to more than one fund are allocated among the respective funds on the basis of relative net assets or other appropriate methods. Expense estimates are accrued in the period to which they relate and adjustments are made when actual amounts are known.
Income Tax Information and Distributions to Shareholders. Each year, the Fund intends to qualify as a regulated investment company under Subchapter M of the Internal Revenue Code, including distributing substantially all of its taxable income and realized gains. As a result, no provision for U.S. Federal income taxes is required. As of October 31, 2014, the Fund did not have any unrecognized tax benefits in the financial statements; nor is the Fund aware of any tax positions for which it is reasonably possible that the total amounts of unrecognized tax benefits will significantly change in the next twelve months. The Fund files a U.S. federal tax return, in addition to state and local tax returns as required. The Fund's federal income tax returns are subject to examination by the Internal Revenue Service (IRS) for a period of three fiscal years after they are filed. State and local tax returns may be subject to examination for an additional fiscal year depending on the jurisdiction. Foreign taxes are provided for based on the Fund's understanding of the tax rules and rates that exist in the foreign markets in which it invests.
Distributions are declared and recorded on the ex-dividend date. Income dividends and capital gain distributions are declared separately for each class. Income and capital gain distributions are determined in accordance with income tax regulations, which may differ from GAAP. In addition, the Fund claimed a portion of the payment made to redeeming shareholders as a distribution for income tax purposes.
Capital accounts within the financial statements are adjusted for permanent book-tax differences. These adjustments have no impact on net assets or the results of operations.
Annual Report
3. Significant Accounting Policies - continued
Income Tax Information and Distributions to Shareholders - continued
Capital accounts are not adjusted for temporary book-tax differences which will reverse in a subsequent period.
Book-tax differences are primarily due to foreign currency transactions, passive foreign investment companies (PFIC), deferred trustees compensation, capital loss carryforwards and losses deferred due to wash sales.
The federal tax cost of investment securities and unrealized appreciation (depreciation) as of period end were as follows:
Gross unrealized appreciation | $ 131,149 |
Gross unrealized depreciation | (58,493) |
Net unrealized appreciation (depreciation) on securities | $ 72,656 |
| |
Tax Cost | $ 649,849 |
The tax-based components of distributable earnings as of period end were as follows:
Undistributed ordinary income | $ 1,490 |
Capital loss carryforward | $ (41,978) |
Net unrealized appreciation (depreciation) on securities and other investments | $ 72,557 |
Capital loss carryforwards are only available to offset future capital gains of the Fund to the extent provided by regulations and may be limited. Under the Regulated Investment Company Modernization Act of 2010 (the Act), the Fund is permitted to carry forward capital losses incurred in taxable years beginning after December 22, 2010 for an unlimited period and such capital losses are required to be used prior to any losses that expire. The capital loss carryforward information presented below, including any applicable limitation, is estimated as of fiscal period end and is subject to adjustment.
Fiscal year of expiration | |
2017 | $ (41,978) |
The tax character of distributions paid was as follows:
| October 31, 2014 | October 31, 2013 |
Ordinary Income | $ 8,868 | $ 10,277 |
Annual Report
Notes to Financial Statements - continued
(Amounts in thousands except percentages)
3. Significant Accounting Policies - continued
Short-Term Trading (Redemption) Fees. Shares held by investors in the Fund less than 30 days may have been subject to a redemption fee equal to 1.00% of the NAV of shares redeemed. All redemption fees, which reduce the proceeds of the shareholder redemption, are retained by the Fund and accounted for as an addition to paid in capital.
New Accounting Pronouncement. In June 2014, the Financial Accounting Standards Board issued Accounting Standard Update No. 2014-11, Repurchase-to-Maturity Transactions, Repurchase Financings, and Disclosures. The Update amends the accounting for certain repurchase agreements and expands disclosure requirements for reverse repurchase agreements, securities lending and other similar transactions. The disclosure requirements are effective for annual and interim reporting periods beginning after December 15, 2014. Management is currently evaluating the impact of the Update on the Fund's financial statements and related disclosures.
4. Purchases and Sales of Investments.
Purchases and sales of securities, other than short-term securities, aggregated $284,255 and $287,742, respectively.
5. Fees and Other Transactions with Affiliates.
Management Fee. Fidelity Management & Research Company (the investment adviser) and its affiliates provide the Fund with investment management related services for which the Fund pays a monthly management fee. The management fee is the sum of an individual fund fee rate that is based on an annual rate of .424% of the Fund's average net assets and an annualized group fee rate that averaged .25% during the period. Prior to August 1, 2014 the individual fund fee rate was .45%. The group fee rate is based upon the average net assets of all the mutual funds advised by the investment adviser, including any mutual funds previously advised by the investment adviser that are currently advised by Fidelity SelectCo, LLC, an affiliate of the investment adviser. The group fee rate decreases as assets under management increase and increases as assets under management decrease. In addition, the management fee is subject to a performance adjustment (up to a maximum of ±.20% of the Fund's average net assets over a 36 month performance period). The upward or downward adjustment to the management fee is based on the investment performance of the asset-weighted return of all classes as compared to its benchmark index, the MSCI EAFE Index, over the same 36 month performance period. For the reporting period, the total annual management fee rate, including the performance adjustment, was .69% of the Fund's average net assets. The performance adjustment included in the management fee rate may be higher or lower than the maximum performance adjustment rate due to the difference between the average net assets for the reporting and performance periods.
Annual Report
5. Fees and Other Transactions with Affiliates - continued
Distribution and Service Plan Fees. In accordance with Rule 12b-1 of the 1940 Act, the Fund has adopted separate Distribution and Service Plans for each class of shares. Certain classes pay Fidelity Distributors Corporation (FDC), an affiliate of the investment adviser, separate Distribution and Service Fees, each of which is based on an annual percentage of each class' average net assets. In addition, FDC may pay financial intermediaries for selling shares of the Fund and providing shareholder support services. For the period, the Distribution and Service Fee rates, total fees and amounts retained by FDC were as follows:
| Distribution
Fee | Service
Fee | Total Fees | Retained
by FDC |
Class A | -% | .25% | $ 174 | $ 5 |
Class T | .25% | .25% | 1,606 | 6 |
Class B | .75% | .25% | 26 | 19 |
Class C | .75% | .25% | 207 | 22 |
| | | $ 2,013 | $ 52 |
Sales Load. FDC may receive a front-end sales charge of up to 5.75% for selling Class A shares and 3.50% for selling Class T shares, some of which is paid to financial intermediaries for selling shares of the Fund. Depending on the holding period, FDC may receive contingent deferred sales charges levied on Class A, Class T, Class B, and Class C redemptions. The deferred sales charges range from 5.00% to 1.00% for Class B shares, 1.00% for Class C shares, 1.00% for certain purchases of Class A shares and .25% for certain purchases of Class T shares.
For the period, sales charge amounts retained by FDC were as follows:
| Retained
by FDC |
Class A | $ 11 |
Class T | 4 |
Class B* | 2 |
Class C* | 2 |
| $ 19 |
* When Class B and Class C shares are initially sold, FDC pays commissions from its own resources to financial intermediaries through which the sales are made.
Transfer Agent Fees. Fidelity Investments Institutional Operations Company, Inc., (FIIOC), an affiliate of the investment adviser, is the transfer, dividend disbursing and shareholder servicing agent for each class of the Fund. FIIOC receives account fees and asset-based fees that vary according to the account size and type of account of the shareholders of the respective classes of the Fund. FIIOC pays for typesetting, printing and mailing of shareholder reports, except proxy statements.
Annual Report
Notes to Financial Statements - continued
(Amounts in thousands except percentages)
5. Fees and Other Transactions with Affiliates - continued
Transfer Agent Fees - continued
For the period, transfer agent fees for each class were as follows:
| Amount | % of
Class-Level Average
Net Assets |
Class A | $ 188 | .27 |
Class T | 646 | .20 |
Class B | 8 | .30 |
Class C | 62 | .30 |
Institutional Class | 605 | .18 |
| $ 1,509 | |
Accounting and Security Lending Fees. Fidelity Service Company, Inc. (FSC), an affiliate of the investment adviser, maintains the Fund's accounting records. The accounting fee is based on the level of average net assets for each month. Under a separate contract, FSC administers the security lending program. The security lending fee is based on the number and duration of lending transactions.
Brokerage Commissions. The Fund placed a portion of its portfolio transactions with brokerage firms which are affiliates of the investment adviser. Brokerage commissions are included in net realized gain (loss) and change in net unrealized appreciation (depreciation) in the Statement of Operations. The commissions paid to these affiliated firms were $1 for the period.
6. Committed Line of Credit.
The Fund participates with other funds managed by the investment adviser or an affiliate in a $4.25 billion credit facility (the "line of credit") to be utilized for temporary or emergency purposes to fund shareholder redemptions or for other short-term liquidity purposes. The Fund has agreed to pay commitment fees on its pro-rata portion of the line of credit, which amounted to $1 and is reflected in Miscellaneous expenses on the Statement of Operations. During the period, the Fund did not borrow on this line of credit.
7. Security Lending.
The Fund lends portfolio securities through a lending agent from time to time in order to earn additional income. For equity securities, a lending agent is used and may loan securities to certain qualified borrowers, including Fidelity Capital Markets (FCM), a broker-dealer affiliated with the Fund. On the settlement date of the loan, the Fund
Annual Report
7. Security Lending - continued
receives collateral (in the form of U.S. Treasury obligations, letters of credit and/or cash) against the loaned securities and maintains collateral in an amount not less than 100% of the market value of the loaned securities during the period of the loan. The market value of the loaned securities is determined at the close of business of the Fund and any additional required collateral is delivered to the Fund on the next business day. If the borrower defaults on its obligation to return the securities loaned because of insolvency or other reasons, the Fund may apply collateral received from the borrower against the obligation. The Fund may experience delays and costs in recovering the securities loaned. Any cash collateral received is invested in the Fidelity Securities Lending Cash Central Fund. The value of loaned securities and cash collateral at period end are disclosed on the Fund's Statement of Assets and Liabilities. The value of securities loaned to FCM at period end was $2,120. Security lending income represents the income earned on investing cash collateral, less rebates paid to borrowers and any lending agent fees associated with the loan, plus any premium payments received for lending certain types of securities. Security lending income is presented in the Statement of Operations as a component of income from Fidelity Central Funds. Total security lending income during the period amounted to $326, including $8 from securities loaned to FCM.
8. Distributions to Shareholders.
Distributions to shareholders of each class were as follows:
Years ended October 31, | 2014 | 2013 |
From net investment income | | |
Class A | $ 576 | $ 874 |
Class T | 2,245 | 3,206 |
Class B | 8 | 13 |
Class C | 65 | 95 |
Institutional Class | 3,334 | 4,652 |
Total | $ 6,228 | $ 8,840 |
From net realized gain | | |
Class A | $ 256 | $ 144 |
Class T | 1,182 | 638 |
Class B | 11 | 7 |
Class C | 75 | 40 |
Institutional Class | 1,116 | 608 |
Total | $ 2,640 | $ 1,437 |
Annual Report
Notes to Financial Statements - continued
(Amounts in thousands except percentages)
9. Share Transactions.
Share transactions for each class were as follows and may contain automatic conversions between classes or exchanges between funds:
| Shares | Shares | Dollars | Dollars |
Years ended October 31, | 2014 | 2013 | 2014 | 2013 |
Class A | | | | |
Shares sold | 618 | 381 | $ 13,534 | $ 7,246 |
Reinvestment of distributions | 36 | 56 | 778 | 948 |
Shares redeemed | (735) | (864) | (16,018) | (16,342) |
Net increase (decrease) | (81) | (427) | $ (1,706) | $ (8,148) |
Class T | | | | |
Shares sold | 2,184 | 2,667 | $ 48,970 | $ 51,520 |
Reinvestment of distributions | 150 | 214 | 3,346 | 3,745 |
Shares redeemed | (3,597) | (3,829) | (80,489) | (73,469) |
Net increase (decrease) | (1,263) | (948) | $ (28,173) | $ (18,204) |
Class B | | | | |
Shares sold | 6 | 15 | $ 128 | $ 313 |
Reinvestment of distributions | 1 | 1 | 17 | 18 |
Shares redeemed | (46) | (62) | (989) | (1,123) |
Net increase (decrease) | (39) | (46) | $ (844) | $ (792) |
Class C | | | | |
Shares sold | 158 | 200 | $ 3,399 | $ 3,879 |
Reinvestment of distributions | 6 | 7 | 124 | 120 |
Shares redeemed | (224) | (208) | (4,777) | (3,808) |
Net increase (decrease) | (60) | (1) | $ (1,254) | $ 191 |
Institutional Class | | | | |
Shares sold | 3,011 | 958 | $ 67,092 | $ 18,221 |
Reinvestment of distributions | 198 | 298 | 4,371 | 5,176 |
Shares redeemed | (1,838) | (2,370) | (40,787) | (46,250) |
Net increase (decrease) | 1,371 | (1,114) | $ 30,676 | $ (22,853) |
10. Other.
The Fund's organizational documents provide former and current trustees and officers with a limited indemnification against liabilities arising in connection with the performance of their duties to the Fund. In the normal course of business, the Fund may also enter into contracts that provide general indemnifications. The Fund's maximum exposure under these arrangements is unknown as this would be dependent on future claims that may be made against the Fund. The risk of material loss from such claims is considered remote.
At the end of the period, Strategic Advisers International II Fund was the owner of record of approximately 20% of the total outstanding shares of the Fund.
Annual Report
To the Trustees of Fidelity Advisor Series VIII and the Shareholders of Fidelity Advisor Overseas Fund:
In our opinion, the accompanying statement of assets and liabilities, including the schedule of investments, and the related statements of operations and of changes in net assets and the financial highlights present fairly, in all material respects, the financial position of Fidelity Advisor Overseas Fund (a fund of Fidelity Advisor Series VIII) at October 31, 2014, the results of its operations for the year then ended, the changes in its net assets for each of the two years in the period then ended and the financial highlights for each of the five years in the period then ended, in conformity with accounting principles generally accepted in the United States of America. These financial statements and financial highlights (hereafter referred to as "financial statements") are the responsibility of the Fidelity Advisor Overseas Fund's management. Our responsibility is to express an opinion on these financial statements based on our audits. We conducted our audits of these financial statements in accordance with the standards of the Public Company Accounting Oversight Board (United States). Those standards require that we plan and perform the audit to obtain reasonable assurance about whether the financial statements are free of material misstatement. An audit includes examining, on a test basis, evidence supporting the amounts and disclosures in the financial statements, assessing the accounting principles used and significant estimates made by management, and evaluating the overall financial statement presentation. We believe that our audits, which included confirmation of securities at October 31, 2014 by correspondence with the custodian and brokers, provide a reasonable basis for our opinion.
PricewaterhouseCoopers LLP
Boston, Massachusetts
December 19, 2014
Annual Report
The Trustees, Member of the Advisory Board, and officers of the trust and fund, as applicable, are listed below. The Board of Trustees governs the fund and is responsible for protecting the interests of shareholders. The Trustees are experienced executives who meet periodically throughout the year to oversee the fund's activities, review contractual arrangements with companies that provide services to the fund, oversee management of the risks associated with such activities and contractual arrangements, and review the fund's performance. Except for James C. Curvey, each of the Trustees oversees 174 funds. Mr. Curvey oversees 407 funds.
The Trustees hold office without limit in time except that (a) any Trustee may resign; (b) any Trustee may be removed by written instrument, signed by at least two-thirds of the number of Trustees prior to such removal; (c) any Trustee who requests to be retired or who has become incapacitated by illness or injury may be retired by written instrument signed by a majority of the other Trustees; and (d) any Trustee may be removed at any special meeting of shareholders by a two-thirds vote of the outstanding voting securities of the trust. Each Trustee who is not an interested person (as defined in the 1940 Act) of the trust and the fund (Independent Trustee), shall retire not later than the last day of the calendar year in which his or her 75th birthday occurs. The Independent Trustees may waive this mandatory retirement age policy with respect to individual Trustees. The officers and Advisory Board Member hold office without limit in time, except that any officer and Advisory Board Member may resign or may be removed by a vote of a majority of the Trustees at any regular meeting or any special meeting of the Trustees. Except as indicated, each individual has held the office shown or other offices in the same company for the past five years.
Experience, Skills, Attributes, and Qualifications of the Fund's Trustees. The Governance and Nominating Committee has adopted a statement of policy that describes the experience, qualifications, attributes, and skills that are necessary and desirable for potential Independent Trustee candidates (Statement of Policy). The Board believes that each Trustee satisfied at the time he or she was initially elected or appointed a Trustee, and continues to satisfy, the standards contemplated by the Statement of Policy. The Governance and Nominating Committee also engages professional search firms to help identify potential Independent Trustee candidates who have the experience, qualifications, attributes, and skills consistent with the Statement of Policy. From time to time, additional criteria based on the composition and skills of the current Independent Trustees, as well as experience or skills that may be appropriate in light of future changes to board composition, business conditions, and regulatory or other developments, have also been considered by the professional search firms and the Governance and Nominating Committee. In addition, the Board takes into account the Trustees' commitment and participation in Board and committee meetings, as well as their leadership of standing and ad hoc committees throughout their tenure.
In determining that a particular Trustee was and continues to be qualified to serve as a Trustee, the Board has considered a variety of criteria, none of which, in isolation, was controlling. The Board believes that, collectively, the Trustees have balanced and diverse experience, qualifications, attributes, and skills, which allow the Board to operate effectively in governing the fund and protecting the interests of shareholders. Information about the specific experience, skills, attributes, and qualifications of each Trustee, which in each case led to the Board's conclusion that the Trustee should serve (or continue to serve) as a trustee of the fund, is provided below.
Annual Report
Board Structure and Oversight Function. James C. Curvey is an interested person (as defined in the 1940 Act) and currently serves as Chairman. The Trustees have determined that an interested Chairman is appropriate and benefits shareholders because an interested Chairman has a personal and professional stake in the quality and continuity of services provided to the fund. Independent Trustees exercise their informed business judgment to appoint an individual of their choosing to serve as Chairman, regardless of whether the Trustee happens to be independent or a member of management. The Independent Trustees have determined that they can act independently and effectively without having an Independent Trustee serve as Chairman and that a key structural component for assuring that they are in a position to do so is for the Independent Trustees to constitute a substantial majority for the Board. The Independent Trustees also regularly meet in executive session. Ned C. Lautenbach serves as Chairman of the Independent Trustees and as such (i) acts as a liaison between the Independent Trustees and management with respect to matters important to the Independent Trustees and (ii) with management prepares agendas for Board meetings.
Fidelity funds are overseen by different Boards of Trustees. The fund's Board oversees Fidelity's equity and high income funds and another Board oversees Fidelity's investment-grade bond, money market, and asset allocation funds. The asset allocation funds may invest in Fidelity funds overseen by the fund's Board. The use of separate Boards, each with its own committee structure, allows the Trustees of each group of Fidelity funds to focus on the unique issues of the funds they oversee, including common research, investment, and operational issues. On occasion, the separate Boards establish joint committees to address issues of overlapping consequences for the Fidelity funds overseen by each Board.
The Trustees operate using a system of committees to facilitate the timely and efficient consideration of all matters of importance to the Trustees, the fund, and fund shareholders and to facilitate compliance with legal and regulatory requirements and oversight of the fund's activities and associated risks. The Board, acting through its committees, has charged FMR and its affiliates with (i) identifying events or circumstances the occurrence of which could have demonstrably adverse effects on the fund's business and/or reputation; (ii) implementing processes and controls to lessen the possibility that such events or circumstances occur or to mitigate the effects of such events or circumstances if they do occur; and (iii) creating and maintaining a system designed to evaluate continuously business and market conditions in order to facilitate the identification and implementation processes described in (i) and (ii) above. Because the day-to-day operations and activities of the fund are carried out by or through FMR, its affiliates and other service providers, the fund's exposure to risks is mitigated but not eliminated by the processes overseen by the Trustees. While each of the Board's committees has responsibility for overseeing different aspects of the fund's activities, oversight is exercised primarily through the Operations, Audit, and Compliance Committees. In addition, the Independent Trustees have worked with FMR to enhance the Board's oversight of investment and financial risks, legal and regulatory risks, technology risks, and operational risks, including the development of additional risk reporting to the Board. For example, a working group comprised of Independent Trustees and FMR has worked and continues to work to review the Fidelity funds' valuation-related activities, reporting and risk management. Appropriate personnel, including but not limited to the fund's Chief Compliance Officer (CCO), FMR's internal auditor, the independent accountants, the fund's Treasurer and portfolio management personnel, make periodic reports to the Board's committees, as appropriate, including an annual review of FMR's risk management program for the Fidelity funds. The responsibilities of each standing committee, including their oversight responsibilities, are described further under "Standing Committees of the Fund's Trustees."
Annual Report
Trustees and Officers - continued
The fund's Statement of Additional Information (SAI) includes more information about the Trustees. To request a free copy, call Fidelity at 1-877-208-0098.
Interested Trustees*:
Correspondence intended for each Trustee who is an interested person may be sent to Fidelity Investments, 245 Summer Street, Boston, Massachusetts 02210.
Name, Year of Birth; Principal Occupations and Other Relevant Experience+ |
James C. Curvey (1935) |
Year of Election or Appointment: 2007 Trustee Chairman of the Board of Trustees |
| Mr. Curvey also serves as Trustee of other Fidelity funds. Mr. Curvey is a Director of Fidelity Research & Analysis Co. (2009-present), and Vice Chairman (2007-present) and Director of FMR LLC. In addition, Mr. Curvey serves as an Overseer for the Boston Symphony Orchestra and a member of the board of Artis-Naples, Naples, Florida, and as a Trustee for Brewster Academy, Wolfeboro, New Hampshire. Previously, Mr. Curvey served as a Director of Fidelity Investments Money Management, Inc. (2009-2014), a Director of FMR (2007-2014), and a Director of FMR Co., Inc. (2007-2014). |
Charles S. Morrison (1960) |
Year of Election or Appointment: 2014 Trustee |
| Mr. Morrison also serves as Trustee of other funds. He serves as a Director of Fidelity Investments Money Management, Inc. (FIMM) (2014-present), Director of Fidelity SelectCo, LLC (2014-present), President, Asset Management (2014-present), and is an employee of Fidelity Investments. Previously, Mr. Morrison served as Vice President of Fidelity's Fixed Income and Asset Allocation Funds (2012-2014), President, Fixed Income (2011-2014), Vice President of Fidelity's Money Market Funds (2005-2009), President, Money Market Group Leader of FMR (2009), and Senior Vice President, Money Market Group of FMR (2004-2009). Mr. Morrison also served as Vice President of Fidelity's Bond Funds (2002-2005), certain Balanced Funds (2002-2005), and certain Asset Allocation Funds (2002-2007), and as Senior Vice President (2002-2005) of Fidelity's Bond Division. |
* Trustees have been determined to be "Interested Trustees" by virtue of, among other things, their affiliation with the trust or various entities under common control with FMR.
+ The information above includes each Trustee's principal occupation during the last five years and other information relating to the experience, attributes, and skills relevant to each Trustee's qualifications to serve as a Trustee, which led to the conclusion that each Trustee should serve as a Trustee for the fund.
Annual Report
Trustees and Officers - continued
Independent Trustees:
Correspondence intended for each Independent Trustee (that is, the Trustees other than the Interested Trustees) may be sent to Fidelity Investments, P.O. Box 55235, Boston, Massachusetts 02205-5235.
Name, Year of Birth; Principal Occupations and Other Relevant Experience+ |
Dennis J. Dirks (1948) |
Year of Election or Appointment: 2005 Trustee |
| Mr. Dirks also serves as Trustee of other Fidelity funds. Prior to his retirement in May 2003, Mr. Dirks was Chief Operating Officer and a member of the Board of The Depository Trust & Clearing Corporation (DTCC). He also served as President, Chief Operating Officer, and Board member of The Depository Trust Company (DTC) and President and Board member of the National Securities Clearing Corporation (NSCC). In addition, Mr. Dirks served as Chief Executive Officer and Board member of the Government Securities Clearing Corporation, Chief Executive Officer and Board member of the Mortgage-Backed Securities Clearing Corporation, as a Trustee and a member of the Finance Committee of Manhattan College (2005-2008), and as a Trustee and a member of the Finance Committee of AHRC of Nassau County (2006-2008). Mr. Dirks is a member of the Independent Directors Council (IDC) Governing Council (2010-present) and Board of Directors for The Brookville Center for Children's Services, Inc. (2009-present). |
Alan J. Lacy (1953) |
Year of Election or Appointment: 2008 Trustee |
| Mr. Lacy also serves as Trustee of other Fidelity funds. Mr. Lacy serves as Senior Adviser (2007-present) of Oak Hill Capital Partners, L.P. (private equity). Mr. Lacy also served as Chief Executive Officer (2000-2005) and Vice Chairman (2005-2006) of Sears Holdings Corporation and Sears, Roebuck and Co. (retail). In addition, Mr. Lacy serves as a member of the Board of Directors of Dave & Buster's Entertainment, Inc. (restaurant and entertainment complexes, 2010-present), Earth Fare, Inc. (retail grocery, 2012-present), The Hillman Companies, Inc. (hardware wholesalers, 2010-present), and Bristol-Myers Squibb Company (global pharmaceuticals, 2008-present). Mr. Lacy is a member of the Board of Trustees of The National Parks Conservation Association (2006-present). Previously, Mr. Lacy served as Chairman of the Board of Trustees of the National Parks Conservation Association (2008-2011) and as a member of the Board of Directors for the Western Union Company (global money transfer, 2006-2011). |
Ned C. Lautenbach (1944) |
Year of Election or Appointment: 2000 Trustee Chairman of the Independent Trustees |
| Mr. Lautenbach also serves as Trustee of other Fidelity funds. Mr. Lautenbach currently serves as the Lead Director of the Eaton Corporation Board of Directors (diversified industrial, 1997-present). Mr. Lautenbach is Chairman of the Board of Directors of the Philharmonic Center for the Arts in Naples, Florida (2012-present) and a member of the Council on Foreign Relations (1994-present). Previously, Mr. Lautenbach was a Partner/Advisory Partner at Clayton, Dubilier & Rice, LLC (private equity investment, 1998-2010), as well as a Director of Sony Corporation (2006-2007). |
Joseph Mauriello (1944) |
Year of Election or Appointment: 2008 Trustee |
| Mr. Mauriello also serves as Trustee of other Fidelity funds. Prior to his retirement in January 2006, Mr. Mauriello served in numerous senior management positions including Deputy Chairman and Chief Operating Officer (2004-2005), and Vice Chairman of Financial Services (2002-2004) of KPMG LLP US (professional services, 1965-2005). Mr. Mauriello currently serves as a member of the Board of Directors of XL Group plc. (global insurance and re-insurance, 2006-present). Previously, Mr. Mauriello served as a Director of the Hamilton Funds of the Bank of New York (2006-2007) and of Arcadia Resources Inc. (health care services and products, 2007-2012). |
Robert W. Selander (1950) |
Year of Election or Appointment: 2011 Trustee |
| Mr. Selander also serves as Trustee of other Fidelity funds. Previously, Mr. Selander served as a Member of the Advisory Board of other Fidelity funds (2011), and Executive Vice Chairman (2010), Chief Executive Officer (2009-2010), and President and Chief Executive Officer (1997-2009) of Mastercard, Inc. |
Cornelia M. Small (1944) |
Year of Election or Appointment: 2005 Trustee |
| Ms. Small also serves as Trustee of other Fidelity funds. Ms. Small is a member of the Board of Directors (2009-present) and Chair of the Investment Committee (2010-present) of the Teagle Foundation. Ms. Small also serves on the Investment Committee of the Berkshire Taconic Community Foundation (2008-present). Previously, Ms. Small served as Chairperson (2002-2008) and a member of the Investment Committee and Chairperson (2008-2012) and a member of the Board of Trustees of Smith College. In addition, Ms. Small served as Chief Investment Officer, Director of Global Equity Investments, and a member of the Board of Directors of Scudder, Stevens & Clark and Scudder Kemper Investments. |
William S. Stavropoulos (1939) |
Year of Election or Appointment: 2001 Trustee Vice Chairman of the Independent Trustees |
| Mr. Stavropoulos also serves as Trustee of other Fidelity funds. Mr. Stavropoulos serves as President and Founder of the Michigan Baseball Foundation, the Great Lakes Loons (2007-present). Mr. Stavropoulos is Chairman Emeritus of the Board of Directors of The Dow Chemical Company, where he previously served in numerous senior management positions, including President, CEO (1995-2000; 2002-2004), Chairman of the Executive Committee (2000-2006), and as a member of the Board of Directors (1990-2006). Currently, Mr. Stavropoulos is Chairman of the Board of Directors of Univar Inc. (global distributor of commodity and specialty chemicals), a Director of Teradata Corporation (data warehousing and technology solutions), and Maersk Inc. (industrial conglomerate), and a member of the Advisory Board for Metalmark Capital LLC (private equity investment, 2005-present). Mr. Stavropoulos is an operating advisor to Clayton, Dubilier & Rice, LLC (private equity investment). In addition, Mr. Stavropoulos is a member of the University of Notre Dame Advisory Council for the College of Science, a Trustee of the Rollin L. Gerstacker Foundation, and a Director of the Naples Philharmonic Center for the Arts. Previously, Mr. Stavropoulos served as a Director of Chemical Financial Corporation (bank holding company, 1993-2012) and Tyco International, Ltd. (multinational manufacturing and services, 2007-2012). |
David M. Thomas (1949) |
Year of Election or Appointment: 2008 Trustee |
| Mr. Thomas also serves as Trustee of other Fidelity funds. Mr. Thomas serves as Non-Executive Chairman of the Board of Directors of Fortune Brands Home and Security (home and security products, 2011-present), and as a member of the Board of Directors of Interpublic Group of Companies, Inc. (marketing communication, 2004-present). Previously, Mr. Thomas served as Executive Chairman (2005-2006) and Chairman and Chief Executive Officer (2000-2005) of IMS Health, Inc. (pharmaceutical and healthcare information solutions), and a Director of Fortune Brands, Inc. (consumer products, 2000-2011). |
+ The information above includes each Trustee's principal occupation during the last five years and other information relating to the experience, attributes, and skills relevant to each Trustee's qualifications to serve as a Trustee, which led to the conclusion that each Trustee should serve as a Trustee for the fund.
Advisory Board Member and Officers:
Correspondence intended for each officer and Peter S. Lynch may be sent to Fidelity Investments, 245 Summer Street, Boston, Massachusetts 02210. Officers appear below in alphabetical order.
Name, Year of Birth; Principal Occupation |
Peter S. Lynch (1944) |
Year of Election or Appointment: 2003 Member of the Advisory Board |
| Mr. Lynch also serves as Member of the Advisory Board of other Fidelity funds. Mr. Lynch is Vice Chairman and a Director of FMR and FMR Co., Inc. In addition, Mr. Lynch serves as a Trustee of Boston College and as the Chairman of the Inner-City Scholarship Fund. Previously, Mr. Lynch served on the Special Olympics International Board of Directors (1997-2006). |
Elizabeth Paige Baumann (1968) |
Year of Election or Appointment: 2012 Anti-Money Laundering (AML) Officer |
| Ms. Baumann also serves as AML Officer of other funds. She is Chief AML Officer of FMR LLC (2012-present) and is an employee of Fidelity Investments. Previously, Ms. Baumann served as Vice President and Deputy Anti-Money Laundering Officer (2007-2012). |
William C. Coffey (1969) |
Year of Election or Appointment: 2009 Assistant Secretary |
| Mr. Coffey also serves as Assistant Secretary of other funds. He is Senior Vice President and Deputy General Counsel of FMR LLC (2010-present), and is an employee of Fidelity Investments. Previously, Mr. Coffey served as Vice President and Associate General Counsel of FMR LLC (2005-2009). |
Timothy M. Cohen (1969) |
Year of Election or Appointment: 2014 Vice President of certain Equity Funds |
| Mr. Cohen also serves as Vice President of other funds. Mr. Cohen serves as a Director and Chief Compliance Officer of Fidelity Management & Research (U.K.) Inc. (2013-present) and is an employee of Fidelity Investments. |
Jonathan Davis (1968) |
Year of Election or Appointment: 2010 Assistant Treasurer |
| Mr. Davis also serves as Assistant Treasurer of other funds. Mr. Davis is an employee of Fidelity Investments. Previously, Mr. Davis served as Vice President and Associate General Counsel of FMR LLC (2003-2010). |
Adrien E. Deberghes (1967) |
Year of Election or Appointment: 2008 Deputy Treasurer |
| Mr. Deberghes also serves as an officer of other funds. He is an employee of Fidelity Investments (2008-present). Prior to joining Fidelity Investments, Mr. Deberghes was Senior Vice President of Mutual Fund Administration at State Street Corporation (2007-2008), Senior Director of Mutual Fund Administration at Investors Bank & Trust (2005-2007), and Director of Finance for Dunkin' Brands (2000-2005). |
Stephanie J. Dorsey (1969) |
Year of Election or Appointment: 2010 Assistant Treasurer |
| Ms. Dorsey also serves as an officer of other funds. She is an employee of Fidelity Investments (2008-present) and has served in other fund officer roles. Prior to joining Fidelity Investments, Ms. Dorsey served as Treasurer (2004-2008) of the JPMorgan Mutual Funds and Vice President (2004-2008) of JPMorgan Chase Bank. |
Howard J. Galligan III (1966) |
Year of Election or Appointment: 2014 Chief Financial Officer |
| Mr. Galligan also serves as Chief Financial Officer of other funds. Mr. Galligan serves as President of Fidelity Pricing and Cash Management Services (FPCMS) (2014-present) and as a Director of Strategic Advisers, Inc. (2008-present). Previously, Mr. Galligan served as Chief Administrative Officer of Asset Management (2011-2014) and Chief Operating Officer and Senior Vice President of Investment Support for Strategic Advisers, Inc. (2003-2011). |
Scott C. Goebel (1968) |
Year of Election or Appointment: 2008 Secretary and Chief Legal Officer (CLO) |
| Mr. Goebel serves as Secretary and CLO of other funds. Mr. Goebel also serves as Secretary of Fidelity SelectCo, LLC (2013-present), Fidelity Investments Money Management, Inc. (FIMM) (2010-present) and Fidelity Research and Analysis Company (FRAC) (2010-present); General Counsel, Secretary, and Senior Vice President of FMR (2008-present) and FMR Co., Inc. (2008-present); Chief Legal Officer of Fidelity Management & Research (Hong Kong) Limited (2008-present); and Assistant Secretary of Fidelity Management & Research (Japan) Limited (2008-present) and Fidelity Management & Research (U.K.) Inc. (2008-present). Previously, Mr. Goebel served as Secretary and CLO of other Fidelity funds (2008-2013), Assistant Secretary of FIMM (2008-2010), FRAC (2008-2010), and certain funds (2007-2008); and as Vice President and Secretary of Fidelity Distributors Corporation (FDC) (2005-2007). Mr. Goebel has been employed by FMR LLC or an affiliate since 2001. |
Brian B. Hogan (1964) |
Year of Election or Appointment: 2009 Vice President |
| Mr. Hogan also serves as Trustee or Vice President of other funds. Mr. Hogan serves as a Director of Fidelity SelectCo, LLC (2014-present) and President of FMR's Equity Division (2009-present). Previously, Mr. Hogan served as Senior Vice President, Equity Research of FMR (2006-2009) and as a portfolio manager. |
Chris Maher (1972) |
Year of Election or Appointment: 2013 Assistant Treasurer |
| Mr. Maher serves as Assistant Treasurer of other funds. Mr. Maher is Vice President of Valuation Oversight and is an employee of Fidelity Investments. Previously, Mr. Maher served as Vice President of Asset Management Compliance (2013), Vice President of FMR's Program Management Group (2010-2013), and Vice President of Valuation Oversight (2008-2010). |
Kenneth B. Robins (1969) |
Year of Election or Appointment: 2008 President and Treasurer |
| Mr. Robins also serves as an officer of other funds. Mr. Robins serves as Executive Vice President of Fidelity Investments Money Management, Inc. (FIMM) (2013-present) and is an employee of Fidelity Investments (2004-present). Previously, Mr. Robins served in other fund officer roles. |
Stephen Sadoski (1971) |
Year of Election or Appointment: 2012 Deputy Treasurer |
| Mr. Sadoski also serves as Deputy Treasurer of other funds. He is an employee of Fidelity Investments (2012-present) and has served in another fund officer role. Prior to joining Fidelity Investments, Mr. Sadoski served as an assistant chief accountant in the Division of Investment Management of the Securities and Exchange Commission (SEC) (2009-2012) and as a senior manager at Deloitte & Touche LLP (1997-2009). |
Stacie M. Smith (1974) |
Year of Election or Appointment: 2013 Deputy Treasurer |
| Ms. Smith also serves as an officer of other funds. She is an employee of Fidelity Investments (2009-present) and has served in other fund officer roles. Prior to joining Fidelity Investments, Ms. Smith served as Senior Audit Manager of Ernst & Young LLP (1996-2009). |
Renee Stagnone (1975) |
Year of Election or Appointment: 2013 Deputy Treasurer |
| Ms. Stagnone also serves as Deputy Treasurer of other funds. Ms. Stagnone is an employee of Fidelity Investments. |
Linda J. Wondrack (1964) |
Year of Election or Appointment: 2014 Chief Compliance Officer |
| Ms. Wondrack also serves as Chief Compliance Officer of other funds. Ms. Wondrack is Executive Vice President and head of the Ethics Office and Asset Management Compliance for Fidelity Investments (2012-present). Ms. Wondrack also serves as Chief Compliance Officer of Fidelity SelectCo, LLC (2014-present); Chief Compliance Officer of Impresa Management LLC (2013-present); and Chief Compliance Officer of FMR Co., Inc., Fidelity Investments Money Management, Inc., Fidelity Management & Research (Japan) Limited, Fidelity Management & Research (U.K.) Inc., Fidelity Management & Research (Hong Kong), Fidelity Management & Research Company, Pyramis Global Advisors, LLC, and Strategic Advisers, Inc., Ballyrock Investment Advisors LLC, and Northern Neck Investors LLC (2012-present). Previously, Ms. Wondrack served as Senior Vice President and Chief Compliance Officer for Columbia Management Investment Advisers, LLC (2005-2012); Chief Compliance Officer for certain funds within the Columbia Family of Funds (2007-2012); and Senior Vice President of Compliance Risk Management at Bank of America (2005-2010). |
Joseph F. Zambello (1957) |
Year of Election or Appointment: 2011 Deputy Treasurer |
| Mr. Zambello also serves as Deputy Treasurer of other funds. Mr. Zambello is an employee of Fidelity Investments. Previously, Mr. Zambello served as Vice President of FMR's Program Management Group (2009-2011) and Vice President of the Transfer Agent Oversight Group (2005-2009). |
Annual Report
Class A, Class T, Class B, and Class C designates 100% of the dividends distributed during the fiscal year as amounts which may be taken into account as a dividend for purposes of the maximum rate under section 1(h)(11) of the Internal Revenue Code.
Class A designates 2%, Class T designates 3%, Class B designates 4%, and Class C designates 4%, of the dividends distributed in December 2013 as indicated in the Corporate Qualifying memo distributed by the Tax department, during the fiscal year as qualifying for the dividends received deduction for corporate shareholders.
The amounts per share which represent income derived from sources within, and taxes paid to, foreign countries or possessions of the United States are as follows:
| Pay Date | Income | Taxes |
Class A | 12/9/13 | $0.2201 | $0.0189 |
Class T | 12/9/13 | $0.1980 | $0.0189 |
Class B | 12/9/13 | $0.1246 | $0.0189 |
Class C | 12/9/13 | $0.1325 | $0.0189 |
The fund will notify shareholders in January 2015 of amounts for use in preparing 2014 income tax returns.
Annual Report
Board Approval of Investment Advisory Contracts and Management Fees
Fidelity Advisor Overseas Fund
Each year, the Board of Trustees, including the Independent Trustees (together, the Board), votes on the renewal of the management contract with Fidelity Management & Research Company (FMR) and the sub-advisory agreements (together, the Advisory Contracts) for the fund. The Board, assisted by the advice of fund counsel and Independent Trustees' counsel, requests and considers a broad range of information relevant to the renewal of the Advisory Contracts throughout the year.
The Board meets regularly and, at each of its meetings, covers an extensive agenda of topics and materials and considers factors that are relevant to its annual consideration of the renewal of the fund's Advisory Contracts, including the services and support provided to the fund and its shareholders. The Board has established various standing committees (Committees), each composed of and chaired by Independent Trustees with varying backgrounds, to which the Board has assigned specific subject matter responsibilities in order to enhance effective decision-making by the Board. The Board, acting directly and through its Committees, requests and receives information concerning the annual consideration of the renewal of the fund's Advisory Contracts. The Board also meets as needed to consider matters specifically related to the Board's annual consideration of the renewal of the Advisory Contracts. Members of the Board may also meet with trustees of other Fidelity funds through ad hoc joint committees to discuss certain matters relevant to the Fidelity funds.
At its July 2014 meeting, the Board, including the Independent Trustees, unanimously determined to renew the fund's Advisory Contracts. In reaching its determination, the Board considered all factors it believed relevant, including (i) the nature, extent, and quality of the services to be provided to the fund and its shareholders (including the investment performance of the fund); (ii) the competitiveness of the fund's management fee and total expense ratio relative to peer funds; (iii) the total costs of the services to be provided by and the profits to be realized by Fidelity from its relationship with the fund; (iv) the extent to which economies of scale exist and would be realized as the fund grows; and (v) whether fee levels reflect these economies of scale, if any, for the benefit of fund shareholders. In connection with separate internal corporate reorganizations involving Fidelity Management & Research (U.K.) Inc. (FMR U.K.) and Fidelity Management & Research (Japan) Inc. (FMR Japan), the Board approved certain non-material amendments to the fund's sub-advisory agreements with FMR U.K. and FMR Japan to reflect that, after these reorganizations, FMR Investment Management (UK) Limited and Fidelity Management & Research (Japan) Limited will carry on the business of FMR U.K. and FMR Japan, respectively. The Board noted that no changes to the portfolio managers or to the foreign research or investment advisory services provided to the fund were expected in connection with either reorganization and that the same personnel and resources would continue to be available to the fund at the new entities.
Annual Report
Board Approval of Investment Advisory Contracts and
Management Fees - continued
In considering whether to renew the Advisory Contracts for the fund, the Board reached a determination, with the assistance of fund counsel and Independent Trustees' counsel and through the exercise of its business judgment, that the renewal of the Advisory Contracts was in the best interests of the fund and its shareholders and that the compensation payable under the Advisory Contracts was fair and reasonable. The Board's decision to renew the Advisory Contracts was not based on any single factor, but rather was based on a comprehensive consideration of all the information provided to the Board at its meetings throughout the year. The Board, in reaching its determination to renew the Advisory Contracts, was aware that shareholders of the fund have a broad range of investment choices available to them, including a wide choice among funds offered by Fidelity's competitors, and that the fund's shareholders, who have the opportunity to review and weigh the disclosure provided by the fund in its prospectus and other public disclosures, have chosen to invest in this fund, which is part of the Fidelity family of funds.
Nature, Extent, and Quality of Services Provided. The Board considered Fidelity's staffing as it relates to the fund, including the backgrounds of investment personnel of FMR and the sub-advisers (together, the Investment Advisers), and also considered the fund's investment objective, strategies, and related investment philosophy. The Independent Trustees also had discussions with senior management of Fidelity's investment operations and investment groups. The Board considered the structure of the portfolio manager compensation program and whether this structure provides appropriate incentives to act in the best interests of the fund. Additionally, the Board considered the portfolio managers' investments, if any, in the funds that they manage.
Resources Dedicated to Investment Management and Support Services. The Board and the Fund Oversight and Research Committees reviewed the general qualifications and capabilities of Fidelity's investment staff, including its size, education, experience, and resources, as well as Fidelity's approach to recruiting, training, managing, and compensating investment personnel. The Board noted that Fidelity has continued to increase the resources devoted to non-U.S. offices, including expansion of Fidelity's global investment organization. The Board also noted that Fidelity's analysts have extensive resources, tools and capabilities that allow them to conduct sophisticated quantitative and fundamental analysis, as well as credit analysis of issuers, counterparties and guarantors. Further, the Board believes that Fidelity's investment professionals have sufficient access to global information and data so as to provide competitive investment results over time, and that those professionals also have access to sophisticated tools that permit them to assess portfolio construction and risk and performance attribution characteristics continuously, as well as to transmit new information and research conclusions rapidly around the world. Additionally, in its deliberations, the Board considered Fidelity's trading and risk management capabilities and resources and global compliance infrastructure, which are an integral part of the investment management process.
Annual Report
Shareholder and Administrative Services. The Board considered (i) the nature, extent, quality, and cost of advisory, administrative, and shareholder services performed by the Investment Advisers and their affiliates under the Advisory Contracts and under separate agreements covering transfer agency, pricing and bookkeeping, and securities lending services for the fund; (ii) the nature and extent of the supervision of third party service providers, principally custodians and subcustodians; and (iii) the resources devoted to, and the record of compliance with, the fund's compliance policies and procedures. The Board also reviewed the allocation of fund brokerage, including allocations to brokers affiliated with the Investment Advisers, the use of brokerage commissions to pay fund expenses, and the use of "soft" commission dollars to pay for research services.
The Board noted that the growth of fund assets over time across the complex allows Fidelity to reinvest in the development of services designed to enhance the value or convenience of the Fidelity funds as investment vehicles. These services include 24-hour access to account information and market information through telephone representatives and over the Internet, investor education materials and asset allocation tools, and the expanded availability of Fidelity Investor Centers.
In 2014, the Board formed an ad hoc Committee on Transfer Agency Fees to review the variety of transfer agency fee structures throughout the industry and Fidelity's competitive positioning with respect to industry participants.
Investment in a Large Fund Family. The Board considered the benefits to shareholders of investing in a Fidelity fund, including the benefits of investing in a fund that is part of a large family of funds offering a variety of investment disciplines and providing a large variety of mutual fund investor services. The Board noted that Fidelity had taken, or had made recommendations that resulted in the Fidelity funds taking, a number of actions over the previous year that benefited particular funds, including (i) continuing to dedicate additional resources to investment research and to the support of the senior management team that oversees asset management; (ii) persisting in efforts to enhance Fidelity's global research capabilities; (iii) launching new funds and making other enhancements to meet client needs for income-oriented solutions; (iv) reducing fund expenses for certain index funds; (v) continuing to launch dedicated lower cost underlying funds to meet portfolio construction needs related to expanding underlying fund options for Fidelity funds of funds, specifically for the Freedom Fund product lines; (vi) rationalizing product lines and gaining increased efficiencies through fund mergers; (vii) launching sector-based exchange-traded funds and establishing a new Fidelity adviser to manage sector-based funds and products; (viii) continuing to develop and implement technology to improve security and increase efficiency; (ix) modifying the eligibility criteria for certain share classes to increase their marketability to a portion of the defined contribution plan market; (x) waiving redemption fees for certain qualified fund-of-fund and wrap programs and certain retirement plan transactions; and (xi) launching new Institutional Class shares of certain money market funds to attract and retain assets and to fill a gap in the money market fund lineup.
Annual Report
Board Approval of Investment Advisory Contracts and
Management Fees - continued
Investment Performance. The Board considered whether the fund has operated in accordance with its investment objective, as well as its record of compliance with its investment restrictions and its performance history.
The Board took into account discussions with the Investment Advisers about fund investment performance that occur at Board meetings throughout the year. In this regard the Board noted that as part of regularly scheduled fund reviews and other reports to the Board on fund performance, the Board periodically considers annualized return information for the fund, for different time periods, measured against a securities market index ("benchmark index") and a peer group of funds with similar objectives ("peer group"). In its evaluation of fund investment performance, the Board gave particular attention to information indicating changes in performance of certain Fidelity funds for specific time periods and the Investment Advisers' explanations for any overperformance or underperformance.
In addition to reviewing absolute and relative fund performance, the Independent Trustees periodically consider the appropriateness of fund performance metrics in evaluating the results achieved. In general, the Independent Trustees believe that fund performance should be evaluated based on net performance (after fees and expenses) of both the highest performing and lowest performing classes, where applicable, compared to appropriate benchmark indices, over appropriate time periods which may include full market cycles, and compared to peer groups, as applicable, over the same periods, taking into account relevant factors including the following: general market conditions; issuer-specific information; tactical opportunities for investment; and fund cash flows and other factors.
The Independent Trustees recognize that shareholders evaluate performance on a net basis over their own holding periods, for which one-, three-, and five-year periods are often used as a proxy. For this reason, the performance information reviewed by the Board also included net cumulative calendar year total return information for the fund and an appropriate benchmark index and peer group for the most recent one-, three-, and five-year periods, as shown below. Returns are shown compared to the 25th percentile (top of box, 75% beaten) and 75th percentile (bottom of box, 25% beaten) of the peer universe. Returns of the benchmark index are "net MA," i.e., adjusted for tax withholding rates applicable to U.S.-based funds organized as Massachusetts business trusts.
Annual Report
Fidelity Advisor Overseas Fund

The Board also considered that the fund's management fee is subject to upward or downward adjustment depending upon whether, and to what extent, the fund's investment performance for the performance period exceeds, or is exceeded by, a securities index, thus leading to a performance adjustment for the same period. The Board noted that the performance adjustment provides FMR with a strong economic incentive to seek to achieve superior performance for the fund's shareholders and helps to more closely align the interests of FMR and the fund's shareholders.
Based on its review, the Board concluded that the nature, extent, and quality of services provided to the fund under the Advisory Contracts should benefit the fund's shareholders.
Competitiveness of Management Fee and Total Expense Ratio. The Board considered the fund's management fee and total expense ratio compared to "mapped groups" of competitive funds and classes. Fidelity creates "mapped groups" by combining similar Lipper investment objective categories that have comparable investment mandates. Combining Lipper investment objective categories aids the Board's management fee and total expense ratio comparisons by broadening the competitive group used for comparison and by reducing the number of universes to which various Fidelity funds are compared.
Management Fee. The Board considered two proprietary management fee comparisons for the 12-month periods shown in the chart below. The group of Lipper funds used by the Board for management fee comparisons is referred to below as the "Total Mapped Group." The Total Mapped Group comparison focuses on a fund's standing in terms of gross management fees before expense reimbursements or caps, and without giving effect to the fund's performance adjustment, relative to the total universe of funds with comparable investment mandates, regardless of whether their management fee structures also are comparable. Funds with comparable investment mandates offer exposure to similar types of securities. Funds with comparable management fee structures have similar management fee contractual arrangements (e.g., flat rate charged for advisory services, all-inclusive fee rate, etc.). "TMG %" represents the percentage of funds in the Total Mapped Group that had management fees that were lower than the fund's. For example, a hypothetical TMG % of 20% would mean that 80% of the funds in the Total Mapped Group had higher, and 20% had lower, management fees than the fund. The fund's actual TMG %s are in the chart below. The "Asset-Size Peer Group" (ASPG) comparison focuses on a fund's standing relative to a subset of non-Fidelity funds within the Total Mapped Group that are similar in size and management fee structure. For example, if a fund is in the first quartile of the ASPG, the fund's management fee ranks in the least expensive or lowest 25% of funds in the ASPG. The ASPG represents at least 15% of the funds in the Total Mapped Group with comparable asset size and management fee structures, subject to a minimum of 50 funds (or all funds in the Total Mapped Group if fewer than 50). Additional information, such as the ASPG quartile in which the fund's management fee rate ranked and the impact of the fund's performance adjustment, is also included in the chart and considered by the Board.
Annual Report
Board Approval of Investment Advisory Contracts and
Management Fees - continued
Fidelity Advisor Overseas Fund

The Board noted that the fund's management fee rate ranked below the median of its Total Mapped Group and below the median of its ASPG for 2013. The Board also noted the effect of the fund's positive performance adjustment on the fund's management fee ranking.
Annual Report
Furthermore, the Board considered that, on July 16, 2014, after the periods shown in the chart above, it had approved a reduction (effective August 1, 2014) in the individual fund fee rate component of the management fee rate for the fund from 0.450% to 0.424%.
The Board also noted that, in August 2013, the ad hoc Committee on Management Fees was formed to conduct an in-depth review of the management fee rates of Fidelity's active equity mutual funds. The Committee focused on the following areas: (i) standard fee structures; (ii) research consumption and trading evolution; (iii) management fee competitiveness/profitability by category; and (iv) factors that drive institutional pricing.
Based on its review, the Board concluded that the fund's management fee is fair and reasonable in light of the services that the fund receives and the other factors considered.
Total Expense Ratio. In its review of each class's total expense ratio, the Board considered the fund's management fee as well as other fund or class expenses, as applicable, such as transfer agent fees, pricing and bookkeeping fees, fund-paid 12b-1 fees, and custodial, legal, and audit fees. The Board also noted the effects of any waivers and reimbursements on fees and expenses, as well as the impact of the fund's performance adjustment. As part of its review, the Board also considered the current and historical total expense ratios of each class of the fund compared to competitive fund median expenses. Each class of the fund is compared to those funds and classes in the Total Mapped Group (used by the Board for management fee comparisons) that have a similar sales load structure.
The Board noted that the total expense ratio of each of Class A, Class B, and Institutional Class ranked below its competitive median for 2013 and the total expense ratio of each of Class T and Class C ranked above its competitive median for 2013. The Board considered that, in general, various factors can affect total expense ratios. The Board noted that the total expense ratio of Class T was above the competitive median primarily because of higher 12b-1 fees on Class T as compared to most competitor funds. Class T has a higher 12b-1 fee, but a lower front-end sales charge, than traditionally priced front-end sales charge classes. The Board considered that Class T is primarily sold load-waived in the retirement plan market where its 0.50% 12b-1 fee is comparable to competing no-load, higher 12b-1 fee classes designed specifically for retirement plans. The Board noted that the fund offers multiple classes, each of which has a different sales load and 12b-1 fee structure, and that the multiple structures are intended to offer a range of pricing options for the intermediary market. The Board also noted that the total expense ratios of the classes vary primarily by the level of their 12b-1 fees, although differences in transfer agent fees may also cause expenses to vary from class to class.
Annual Report
Board Approval of Investment Advisory Contracts and
Management Fees - continued
Fees Charged to Other Fidelity Clients. The Board also considered Fidelity fee structures and other information with respect to clients of Fidelity, such as other funds advised or subadvised by Fidelity, pension plan clients, and other institutional clients. The Board noted the findings of the 2013 ad hoc joint committee (created with the board of other Fidelity funds), which reviewed and compared Fidelity's institutional investment advisory business with its business of providing services to the Fidelity funds, including the differences in services provided, fees charged, and costs incurred, as well as competition in their respective marketplaces.
Based on its review of total expense ratios and fees charged to other Fidelity clients, the Board concluded that the total expense ratio of each class of the fund was reasonable, although in some cases above the median of the universe presented for comparison, in light of the services that the fund and its shareholders receive and the other factors considered.
Costs of the Services and Profitability. The Board considered the revenues earned and the expenses incurred by Fidelity in conducting the business of developing, marketing, distributing, managing, administering and servicing the fund and servicing the fund's shareholders. The Board also considered the level of Fidelity's profits in respect of all the Fidelity funds.
On an annual basis, Fidelity presents to the Board Fidelity's profitability for the fund. Fidelity calculates the profitability for each fund, as well as aggregate profitability for groups of Fidelity funds and all Fidelity funds, using a series of detailed revenue and cost allocation methodologies which originate with the books and records of Fidelity on which Fidelity's audited financial statements are based. The Audit Committee of the Board reviews any significant changes from the prior year's methodologies.
PricewaterhouseCoopers LLP (PwC), independent registered public accounting firm and auditor to Fidelity and certain Fidelity funds, has been engaged annually by the Board as part of the Board's assessment of Fidelity's profitability analysis. PwC's engagement includes the review and assessment of the methodologies used by Fidelity in determining the revenues and expenses attributable to Fidelity's mutual fund business, and completion of agreed-upon procedures in respect of the mathematical accuracy of fund profitability and its conformity to established allocation methodologies. After considering PwC's reports issued under the engagement and information provided by Fidelity, the Board concluded that while other allocation methods may also be reasonable, Fidelity's profitability methodologies are reasonable in all material respects.
The Board also reviewed Fidelity's non-fund businesses and fall-out benefits related to the mutual fund business as well as cases where Fidelity's affiliates may benefit from or be related to the fund's business.
Annual Report
The Board considered the costs of the services provided by and the profits realized by Fidelity in connection with the operation of the fund and was satisfied that the profitability was not excessive in the circumstances.
Economies of Scale. The Board considered whether there have been economies of scale in respect of the management of the Fidelity funds, whether the Fidelity funds (including the fund) have appropriately benefited from any such economies of scale, and whether there is potential for realization of any further economies of scale. The Board considered the extent to which the fund will benefit from economies of scale through increased services to the fund, through waivers or reimbursements, or through fee or expense ratio reductions. The Board also noted that in 2013, it and the boards of other Fidelity funds created an ad hoc committee (the Economies of Scale Committee) to analyze whether Fidelity attains economies of scale in respect of the management and servicing of the Fidelity funds, whether the Fidelity funds have appropriately benefited from such economies of scale, and whether there is potential for realization of any further economies of scale.
The Board recognized that the fund's management contract incorporates a "group fee" structure, which provides for lower group fee rates as total group assets increase, and for higher group fee rates as total group assets decrease (with "group assets" defined to include fund assets under FMR's management plus sector fund assets previously under FMR's management and currently managed by Fidelity SelectCo, LLC). FMR calculates the group fee rates based on a tiered asset "breakpoint" schedule that varies based on asset class. The Board considered that the group fee is designed to deliver the benefits of economies of scale to fund shareholders when total Fidelity fund assets increase, even if assets of any particular fund are unchanged or have declined, because some portion of Fidelity's costs are attributable to services provided to all Fidelity funds, and all funds benefit if those costs can be allocated among more assets. The Board concluded that, given the group fee structure, fund shareholders will benefit from lower management fees as group assets increase at the fund complex level, regardless of whether Fidelity achieves any such economies of scale.
The Board concluded, taking into account the analysis of the Economies of Scale Committee, that economies of scale, if any, are being appropriately shared between fund shareholders and Fidelity.
Additional Information Requested by the Board. In order to develop fully the factual basis for consideration of the Fidelity funds' Advisory Contracts, the Board requested and received additional information on certain topics, including: (i) fund performance trends and Fidelity's long-term strategies for certain funds; (ii) Fidelity's strategic marketing and product lineup goals; (iii) the methodology with respect to competitive fund data and peer group classifications; (iv) the arrangements with, and performance of, certain sub-advisers on behalf of the Fidelity funds, as well as certain proposed participating affiliate arrangements; (v) the realization of fall-out benefits in certain Fidelity business units; (vi) Fidelity's group fee structures, including the rationale for the individual fee rates of certain categories of funds and the definition of group assets; (vii) trends regarding industry use of performance fee structures and the performance adjustment methodologies applicable to the Fidelity funds; (viii) additional competitive analysis regarding the total expenses for certain classes; (ix) fund profitability methodology, including Fidelity's cost allocation methodology, and the impact of certain factors on fund profitability results; and (x) the process by which Fidelity determines sub-advisory fees for funds it advises.
Annual Report
Board Approval of Investment Advisory Contracts and
Management Fees - continued
Based on its evaluation of all of the conclusions noted above, and after considering all factors it believed relevant, the Board ultimately concluded that the advisory fee structures are fair and reasonable, and that the fund's Advisory Contracts should be renewed.
Annual Report
Investment Adviser
Fidelity Management & Research Company
Boston, MA
Investment Sub-Advisers
FMR Co., Inc.
Fidelity Management & Research
(U.K.) Inc.
Fidelity Management & Research
(Hong Kong) Limited
Fidelity Management & Research
(Japan) Limited
FIL Investment Advisors (UK) Limited
FIL Investments (Japan) Limited
FIL Investment Advisors
General Distributor
Fidelity Distributors Corporation
Smithfield, RI
Transfer and Service Agents
Fidelity Investments Institutional
Operations Company, Inc.
Boston, MA
Fidelity Service Company, Inc.
Boston, MA
Custodian
The Northern Trust Company
Chicago, IL
(Fidelity Investment logo)(registered trademark)
OS-UANN-1214
1.784767.111
(Fidelity Investment logo)(registered trademark)
Fidelity Advisor®
Overseas
Fund - Institutional Class
Annual Report
October 31, 2014
(Fidelity Cover Art)
Contents
Performance | (Click Here) | How the fund has done over time. |
Management's Discussion of Fund Performance | (Click Here) | The Portfolio Manager's review of fund performance and strategy. |
Shareholder Expense Example | (Click Here) | An example of shareholder expenses. |
Investment Changes | (Click Here) | A summary of major shifts in the fund's investments over the past six months. |
Investments | (Click Here) | A complete list of the fund's investments with their market values. |
Financial Statements | (Click Here) | Statements of assets and liabilities, operations, and changes in net assets, as well as financial highlights. |
Notes | (Click Here) | Notes to the financial statements. |
Report of Independent Registered Public Accounting Firm | (Click Here) | |
Trustees and Officers | (Click Here) | |
Distributions | (Click Here) | |
Board Approval of Investment Advisory Contracts and Management Fees | (Click Here) | |
To view a fund's proxy voting guidelines and proxy voting record for the 12-month period ended June 30, visit http://www.fidelity.com/proxyvotingresults or visit the Securities and Exchange Commission's (SEC) web site at http://www.sec.gov. You may also call 1-877-208-0098 to request a free copy of the proxy voting guidelines.
Standard & Poor's, S&P and S&P 500 are registered service marks of The McGraw-Hill Companies, Inc. and have been licensed for use by Fidelity Distributors Corporation.
Other third-party marks appearing herein are the property of their respective owners.
All other marks appearing herein are registered or unregistered trademarks or service marks of FMR LLC or an affiliated company. © 2014 FMR LLC. All rights reserved.
Annual Report
This report and the financial statements contained herein are submitted for the general information of the shareholders of the fund. This report is not authorized for distribution to prospective investors in the fund unless preceded or accompanied by an effective prospectus.
A fund files its complete schedule of portfolio holdings with the SEC for the first and third quarters of each fiscal year on Form N-Q. Forms N-Q are available on the SEC's web site at http://www.sec.gov. A fund's Forms N-Q may be reviewed and copied at the SEC's Public Reference Room in Washington, DC. Information regarding the operation of the SEC's Public Reference Room may be obtained by calling 1-800-SEC-0330. For a complete list of a fund's portfolio holdings, view the most recent holdings listing, semiannual report, or annual report on Fidelity's web site at http://www.fidelity.com, http://www.advisor.fidelity.com, or http://www.401k.com, as applicable.
NOT FDIC INSURED • MAY LOSE VALUE • NO BANK GUARANTEE
Neither the fund nor Fidelity Distributors Corporation is a bank.
Annual Report
Average annual total return reflects the change in the value of an investment, assuming reinvestment of the class' distributions from dividend income and capital gains (the profits earned upon the sale of securities that have grown in value, if any) and assuming a constant rate of performance each year. The $10,000 table and the fund's returns do not reflect the deduction of taxes that a shareholder would pay on fund distributions or the redemption of fund shares. During periods of reimbursement by Fidelity, a fund's total return will be greater than it would be had the reimbursement not occurred. How a fund did yesterday is no guarantee of how it will do tomorrow.
Average Annual Total Returns
Periods ended October 31, 2014 | Past 1
year | Past 5
years | Past 10
years |
Institutional Class | -0.95% | 8.04% | 6.04% |
$10,000 Over 10 Years
Let's say hypothetically that $10,000 was invested in Fidelity Advisor® Overseas Fund - Institutional Class on October 31, 2004. The chart shows how the value of your investment would have changed, and also shows how the MSCI EAFE Index performed over the same period.
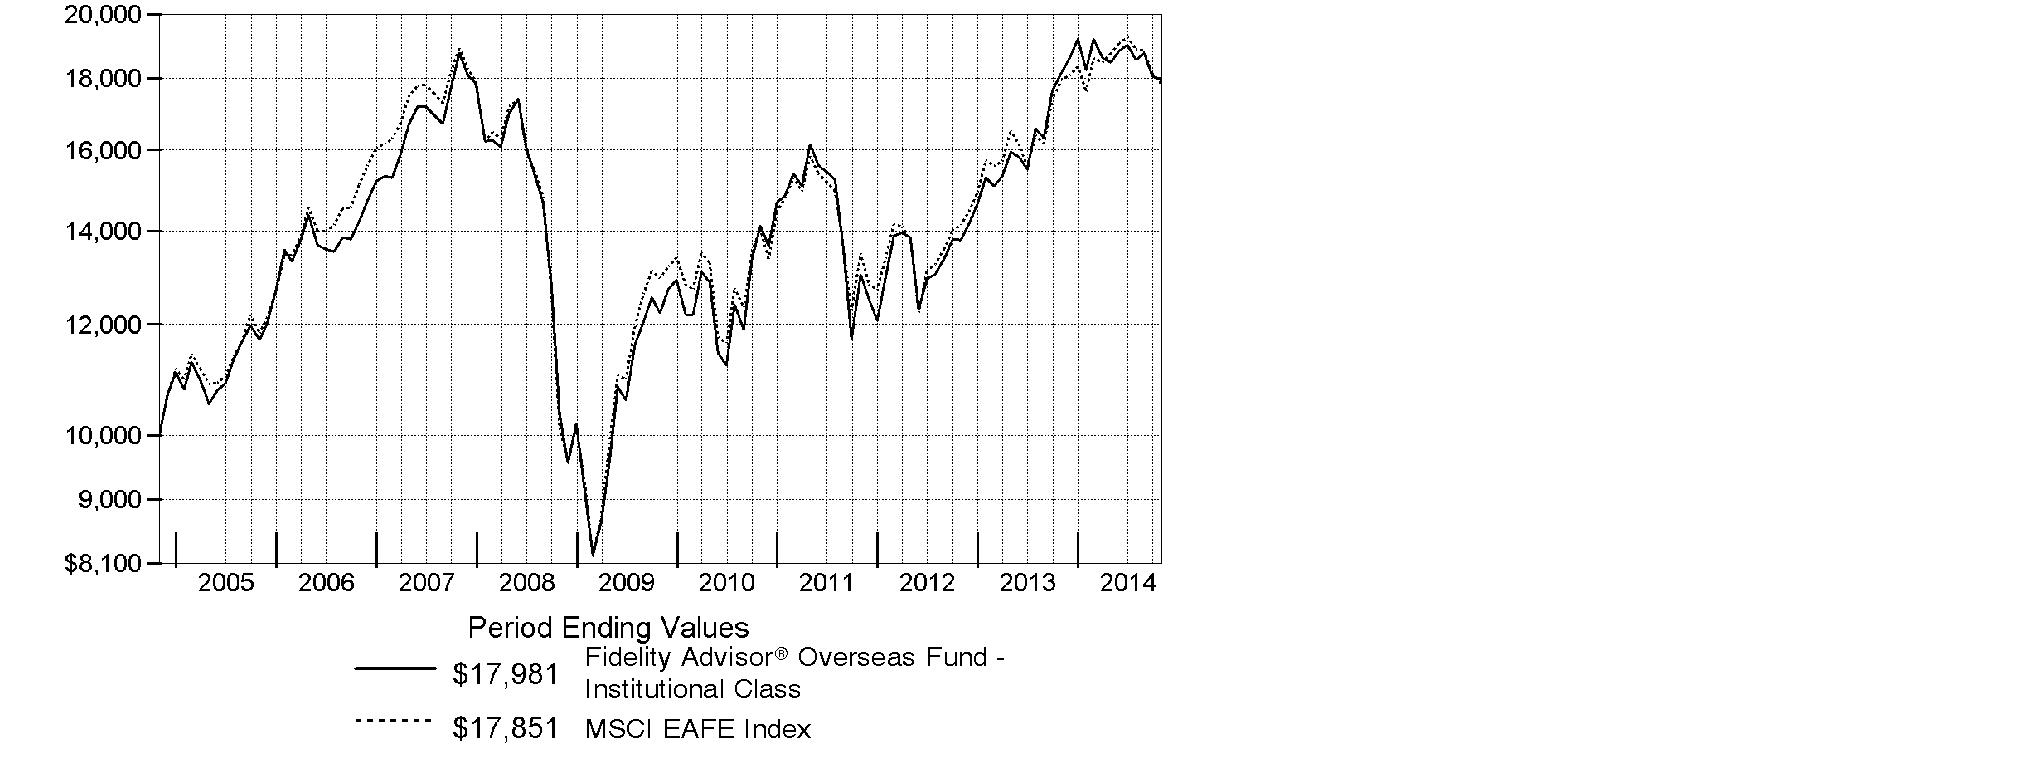
Annual Report
Market Recap: Global equities posted a healthy gain for the 12 months ending October 31, 2014, overcoming an October market decline driven by recessionary pressures in China and tepid growth in Europe. The MSCI ACWI (All Country World Index) Index rose 8.15%, helped by subdued market volatility for much of the period and supported by solid corporate earnings, especially in the United States. Stocks also benefited from easy monetary policies in Japan and the eurozone, as well as increased stimulus efforts in China. All but three of the 24 industry groups that compose the index marked a positive return. The U.S. (+17%) remained a pillar of strength, while a strongly rising dollar in the latter part of the period detracted from investors' returns in most non-U.S. markets. Canada (+5%) notched broad gains outside of its energy and materials sectors, as did Asia-Pacific ex Japan (+4%), led by investor enthusiasm for companies in India. The U.K., Europe and Japan, meanwhile, all underperformed. Among sectors, health care (+24%) led the index, with a strong contribution from the pharmaceuticals, biotechnology & life sciences industry. Information technology (+21%) also outperformed. Conversely, materials (-4%) and energy (-1%) lagged the index due to a higher supply of and lower demand for commodities.
Comments from Graeme Rockett, Portfolio Manager of Fidelity Advisor® Overseas Fund: For the year, the fund's Institutional Class shares returned -0.95%, trailing the -0.48% return of the MSCI EAFE Index. Versus the index, a number of businesses that benefit from global Internet and broadband penetration detracted. I sold the fund's stake in Mail.Ru Group, as the stock was negatively affected by sanctions on the Russian economy and the devaluation of the ruble. In health care, it hurt to not own outperforming index component and Swiss pharmaceuticals firm Novartis. On the plus side, choices in information technology by far added the most value, including Chinese social media and e-commerce firm Tencent Holdings. I also continued to invest in online classifieds businesses, and a number of these stocks placed among the fund's top individual contributors: South Africa's Naspers - the largest position in the fund at period end - and China-based Bitauto Holdings and SouFun Holdings. As these stocks outperformed, I reduced our outsized exposure on short-term concerns. It also helped to acquire a position in Chinese e-commerce firm Alibaba Group Holding at its initial public offering in September. I felt the stock was undervalued at the IPO price, and the market agreed - the stock soared after an initial market dip.
The views expressed above reflect those of the portfolio manager(s) only through the end of the period as stated on the cover of this report and do not necessarily represent the views of Fidelity or any other person in the Fidelity organization. Any such views are subject to change at any time based upon market or other conditions and Fidelity disclaims any responsibility to update such views. These views may not be relied on as investment advice and, because investment decisions for a Fidelity fund are based on numerous factors, may not be relied on as an indication of trading intent on behalf of any Fidelity fund.
Annual Report
Shareholder Expense Example
As a shareholder of the Fund, you incur two types of costs: (1) transaction costs, including sales charges (loads) on purchase payments or redemption proceeds, redemption fees and (2) ongoing costs, including management fees, distribution and/or service (12b-1) fees and other Fund expenses. This Example is intended to help you understand your ongoing costs (in dollars) of investing in the Fund and to compare these costs with the ongoing costs of investing in other mutual funds.
The Example is based on an investment of $1,000 invested at the beginning of the period and held for the entire period (May 1, 2014 to October 31, 2014).
Actual Expenses
The first line of the accompanying table for each class of the Fund provides information about actual account values and actual expenses. You may use the information in this line, together with the amount you invested, to estimate the expenses that you paid over the period. Simply divide your account value by $1,000.00 (for example, an $8,600 account value divided by $1,000.00 = 8.6), then multiply the result by the number in the first line for a class of the Fund under the heading entitled "Expenses Paid During Period" to estimate the expenses you paid on your account during this period. In addition, the Fund, as a shareholder in the underlying Fidelity Central Funds, will indirectly bear its pro-rata share of the fees and expenses incurred by the underlying Fidelity Central Funds. These fees and expenses are not included in the Fund's annualized expense ratio used to calculate the expense estimate in the table below.
Hypothetical Example for Comparison Purposes
The second line of the accompanying table for each class of the Fund provides information about hypothetical account values and hypothetical expenses based on a Class' actual expense ratio and an assumed rate of return of 5% per year before expenses, which is not the Class' actual return. The hypothetical account values and expenses may not be used to estimate the actual ending account balance or expenses you paid for the period. You may use this information to compare the ongoing costs of investing in the Fund and other funds. To do so, compare this 5% hypothetical example with the 5% hypothetical examples that appear in the shareholder reports of the other funds. In addition, the Fund, as a shareholder in the underlying Fidelity Central Funds, will indirectly bear its pro-rata share of the fees and expenses incurred by the underlying Fidelity Central Funds. These fees and expenses are not included in the Fund's annualized expense ratio used to calculate the expense estimate in the table below.
Please note that the expenses shown in the table are meant to highlight your ongoing costs only and do not reflect any transaction costs. Therefore, the second line of the table is useful in comparing ongoing costs only, and will not help you determine the relative total costs of owning different funds. In addition, if these transactional costs were included, your costs would have been higher.
Annual Report
| Annualized
Expense RatioB | Beginning
Account Value
May 1, 2014 | Ending
Account Value
October 31, 2014 | Expenses Paid
During Period*
May 1, 2014
to October 31, 2014 |
Class A | 1.27% | | | |
Actual | | $ 1,000.00 | $ 972.30 | $ 6.31 |
HypotheticalA | | $ 1,000.00 | $ 1,018.80 | $ 6.46 |
Class T | 1.45% | | | |
Actual | | $ 1,000.00 | $ 971.20 | $ 7.20 |
HypotheticalA | | $ 1,000.00 | $ 1,017.90 | $ 7.38 |
Class B | 2.04% | | | |
Actual | | $ 1,000.00 | $ 968.70 | $ 10.12 |
HypotheticalA | | $ 1,000.00 | $ 1,014.92 | $ 10.36 |
Class C | 2.05% | | | |
Actual | | $ 1,000.00 | $ 968.10 | $ 10.17 |
HypotheticalA | | $ 1,000.00 | $ 1,014.87 | $ 10.41 |
Institutional Class | .93% | | | |
Actual | | $ 1,000.00 | $ 973.80 | $ 4.63 |
HypotheticalA | | $ 1,000.00 | $ 1,020.52 | $ 4.74 |
A 5% return per year before expenses
B Annualized expense ratio reflects expenses net of applicable fee waivers.
* Expenses are equal to each Class' annualized expense ratio, multiplied by the average account value over the period, multiplied by 184/365 (to reflect the one-half year period).
Annual Report
Investment Changes (Unaudited)
Top Five Stocks as of October 31, 2014 |
| % of fund's
net assets | % of fund's net assets
6 months ago |
Naspers Ltd. Class N (South Africa, Media) | 2.5 | 2.0 |
Nestle SA (Switzerland, Food Products) | 2.3 | 2.2 |
Sanofi SA (France, Pharmaceuticals) | 1.7 | 2.3 |
Novo Nordisk A/S Series B (Denmark, Pharmaceuticals) | 1.7 | 1.6 |
Rakuten, Inc. (Japan, Internet & Catalog Retail) | 1.6 | 1.4 |
| 9.8 | |
Top Five Market Sectors as of October 31, 2014 |
| % of fund's
net assets | % of fund's net assets
6 months ago |
Consumer Discretionary | 25.4 | 26.4 |
Financials | 17.6 | 17.9 |
Information Technology | 16.5 | 12.2 |
Consumer Staples | 12.0 | 11.3 |
Health Care | 10.4 | 9.7 |
Top Five Countries as of October 31, 2014 |
(excluding cash equivalents) | % of fund's
net assets | % of fund's net assets
6 months ago |
United Kingdom | 20.8 | 19.2 |
Japan | 18.8 | 16.4 |
United States of America | 9.1 | 6.8 |
Cayman Islands | 6.8 | 3.7 |
France | 6.6 | 9.5 |
Percentages are adjusted for the effect of open futures contracts, if applicable. |
Asset Allocation (% of fund's net assets) |
As of October 31, 2014 | As of April 30, 2014 |
 | Stocks 99.2% | | | Stocks 99.0% | |
 | Short-Term
Investments and
Net Other Assets (Liabilities) 0.8% | | | Short-Term
Investments and
Net Other Assets (Liabilities) 1.0% | |

Annual Report
Investments October 31, 2014
Showing Percentage of Net Assets
Common Stocks - 97.7% |
| Shares | | Value (000s) |
Australia - 2.2% |
AMP Ltd. | 186,173 | | $ 960 |
BHP Billiton Ltd. | 211,768 | | 6,335 |
Carsales.com Ltd. | 135,616 | | 1,280 |
G8 Education Ltd. | 306,470 | | 1,354 |
iSelect Ltd. (a) | 2,907,626 | | 3,548 |
Macquarie Group Ltd. | 41,347 | | 2,235 |
TOTAL AUSTRALIA | | 15,712 |
Bailiwick of Jersey - 1.0% |
Glencore Xstrata PLC | 526,430 | | 2,694 |
Shire PLC | 63,600 | | 4,267 |
TOTAL BAILIWICK OF JERSEY | | 6,961 |
Belgium - 0.7% |
Ageas | 35,290 | | 1,178 |
KBC Groupe SA (a) | 25,776 | | 1,381 |
UCB SA | 29,600 | | 2,388 |
TOTAL BELGIUM | | 4,947 |
Bermuda - 0.8% |
Clear Media Ltd. | 1,278,000 | | 1,308 |
Oriental Watch Holdings Ltd. | 2,992,000 | | 668 |
Signet Jewelers Ltd. | 32,000 | | 3,840 |
TOTAL BERMUDA | | 5,816 |
Brazil - 1.4% |
BB Seguridade Participacoes SA | 279,900 | | 3,734 |
Cielo SA | 236,560 | | 3,885 |
Kroton Educacional SA | 302,516 | | 2,156 |
TOTAL BRAZIL | | 9,775 |
British Virgin Islands - 0.2% |
Gem Diamonds Ltd. (a) | 465,700 | | 1,157 |
Canada - 0.4% |
Entertainment One Ltd. | 442,400 | | 2,217 |
MDC Partners, Inc. Class A (sub. vtg.) | 16,600 | | 344 |
Performance Sports Group Ltd. (a) | 23,000 | | 398 |
TOTAL CANADA | | 2,959 |
Cayman Islands - 6.8% |
58.com, Inc. ADR (d) | 67,600 | | 2,675 |
Alibaba Group Holding Ltd. sponsored ADR | 88,400 | | 8,716 |
Autohome, Inc. ADR Class A | 37,000 | | 1,957 |
Common Stocks - continued |
| Shares | | Value (000s) |
Cayman Islands - continued |
Baidu.com, Inc. sponsored ADR (a) | 30,100 | | $ 7,187 |
Bitauto Holdings Ltd. ADR (a) | 34,200 | | 2,863 |
Ctrip.com International Ltd. sponsored ADR (a) | 50,900 | | 2,967 |
GCL-Poly Energy Holdings Ltd. (a) | 8,557,000 | | 2,884 |
Greatview Aseptic Pack Co. Ltd. | 1,720,000 | | 1,132 |
Hengdeli Holdings Ltd. | 7,597,000 | | 1,223 |
Qunar Cayman Islands Ltd. sponsored ADR (d) | 50,600 | | 1,361 |
Sitoy Group Holdings Ltd. | 870,000 | | 717 |
SouFun Holdings Ltd. ADR (d) | 368,600 | | 3,594 |
Tencent Holdings Ltd. | 530,700 | | 8,530 |
WuXi PharmaTech Cayman, Inc. sponsored ADR (a) | 62,900 | | 2,371 |
TOTAL CAYMAN ISLANDS | | 48,177 |
China - 0.3% |
TravelSky Technology Ltd. (H Shares) | 1,713,000 | | 1,790 |
Denmark - 2.3% |
Danske Bank A/S | 51,111 | | 1,402 |
Novo Nordisk A/S: | | | |
Series B | 14,315 | | 647 |
Series B sponsored ADR | 245,100 | | 11,074 |
Pandora A/S | 34,400 | | 2,896 |
TOTAL DENMARK | | 16,019 |
France - 6.6% |
AXA SA | 49,558 | | 1,143 |
AXA SA sponsored ADR | 67,200 | | 1,560 |
BNP Paribas SA | 79,616 | | 5,003 |
Bollore Group (d) | 3,522 | | 1,668 |
Bollore Group (a) | 11 | | 5 |
Edenred SA | 50,231 | | 1,391 |
GameLoft SE (a) | 239,900 | | 1,233 |
Groupe FNAC SA (a) | 1 | | 0* |
Havas SA | 416,300 | | 3,365 |
Iliad SA | 6,166 | | 1,348 |
LVMH Moet Hennessy - Louis Vuitton SA | 13,222 | | 2,243 |
Pernod Ricard SA | 35,600 | | 4,052 |
Safran SA | 37,900 | | 2,398 |
Sanofi SA | 80,690 | | 7,322 |
Sanofi SA sponsored ADR | 95,600 | | 4,421 |
Societe Generale Series A | 36,162 | | 1,741 |
Total SA | 129,000 | | 7,702 |
TOTAL FRANCE | | 46,595 |
Common Stocks - continued |
| Shares | | Value (000s) |
Germany - 2.9% |
Allianz SE | 15,880 | | $ 2,525 |
Axel Springer Verlag AG | 51,400 | | 2,821 |
Bayer AG | 62,240 | | 8,849 |
Commerzbank AG (a) | 23,500 | | 354 |
CTS Eventim AG | 106,958 | | 2,820 |
Deutsche Bank AG | 31,560 | | 987 |
Deutsche Boerse AG | 36,969 | | 2,525 |
TOTAL GERMANY | | 20,881 |
Greece - 0.1% |
Greek Organization of Football Prognostics SA | 84,300 | | 1,022 |
Hong Kong - 1.3% |
AIA Group Ltd. | 970,800 | | 5,417 |
Television Broadcasts Ltd. | 761,000 | | 4,167 |
TOTAL HONG KONG | | 9,584 |
India - 0.5% |
Info Edge India Ltd. | 198,211 | | 2,724 |
Just Dial Ltd. | 25,947 | | 634 |
TOTAL INDIA | | 3,358 |
Ireland - 2.0% |
C&C Group PLC | 1,377,300 | | 6,134 |
Glanbia PLC | 157,200 | | 2,218 |
Kingspan Group PLC (United Kingdom) | 203,300 | | 3,195 |
Paddy Power PLC (Ireland) | 32,100 | | 2,341 |
TOTAL IRELAND | | 13,888 |
Isle of Man - 0.5% |
Playtech Ltd. | 314,323 | | 3,550 |
Israel - 0.5% |
Rami Levi Chain Stores Hashikma Marketing 2006 Ltd. | 33,700 | | 1,500 |
Sarine Technologies Ltd. | 750,000 | | 1,739 |
TOTAL ISRAEL | | 3,239 |
Italy - 1.9% |
Assicurazioni Generali SpA | 71,400 | | 1,462 |
Brunello Cucinelli SpA | 4,900 | | 99 |
Eni SpA | 60,300 | | 1,285 |
Eni SpA sponsored ADR | 22,300 | | 948 |
Intesa Sanpaolo SpA | 1,752,800 | | 5,153 |
Lottomatica SpA (d) | 36,500 | | 849 |
Common Stocks - continued |
| Shares | | Value (000s) |
Italy - continued |
Salvatore Ferragamo Italia SpA | 42,800 | | $ 1,010 |
Tod's SpA (d) | 25,929 | | 2,387 |
TOTAL ITALY | | 13,193 |
Japan - 18.8% |
Astellas Pharma, Inc. | 560,500 | | 8,699 |
Cosmos Pharmaceutical Corp. | 47,300 | | 6,763 |
Daiwa Securities Group, Inc. | 208,000 | | 1,644 |
Dentsu, Inc. | 183,300 | | 6,815 |
Enigmo, Inc. (a) | 310,000 | | 3,158 |
Fuji Media Holdings, Inc. | 68,900 | | 951 |
Fujitsu Ltd. | 231,000 | | 1,404 |
Hitachi Ltd. | 703,000 | | 5,524 |
Honda Motor Co. Ltd. | 118,700 | | 3,795 |
Hoya Corp. | 91,000 | | 3,220 |
Infomart Corp. | 23,200 | | 413 |
Japan Tobacco, Inc. | 138,600 | | 4,729 |
JTEKT Corp. | 85,200 | | 1,370 |
Keyence Corp. | 13,800 | | 6,687 |
Misumi Group, Inc. | 325,000 | | 10,255 |
Mitsubishi Electric Corp. | 318,000 | | 4,100 |
Mitsubishi UFJ Financial Group, Inc. | 1,172,700 | | 6,836 |
Mitsubishi UFJ Financial Group, Inc. sponsored ADR | 124,300 | | 731 |
MS&AD Insurance Group Holdings, Inc. | 75,400 | | 1,630 |
NEC Corp. | 394,000 | | 1,393 |
NEXT Co. Ltd. | 457,400 | | 2,600 |
Nomura Holdings, Inc. | 204,200 | | 1,276 |
Nomura Holdings, Inc. sponsored ADR | 40,900 | | 260 |
Olympus Corp. (a) | 57,600 | | 2,068 |
OMRON Corp. | 66,900 | | 3,167 |
ORIX Corp. | 459,800 | | 6,382 |
Pigeon Corp. | 15,400 | | 960 |
Proto Corp. | 36,500 | | 502 |
Rakuten, Inc. | 977,900 | | 11,027 |
Recruit Holdings Co. Ltd. (a) | 13,700 | | 468 |
Ship Healthcare Holdings, Inc. | 52,200 | | 1,222 |
SoftBank Corp. | 72,400 | | 5,271 |
Sumitomo Mitsui Financial Group, Inc. | 137,400 | | 5,604 |
Suzuki Motor Corp. | 54,400 | | 1,823 |
THK Co. Ltd. | 67,300 | | 1,693 |
Tokio Marine Holdings, Inc. | 59,300 | | 1,902 |
Common Stocks - continued |
| Shares | | Value (000s) |
Japan - continued |
Toyota Motor Corp. | 113,000 | | $ 6,800 |
Toyota Motor Corp. sponsored ADR | 4,300 | | 522 |
TOTAL JAPAN | | 133,664 |
Kenya - 0.1% |
East African Breweries Ltd. | 116,216 | | 370 |
Korea (South) - 1.3% |
Korea Express Co. Ltd. (a) | 14,796 | | 2,658 |
NAVER Corp. | 9,457 | | 6,637 |
TOTAL KOREA (SOUTH) | | 9,295 |
Malta - 0.6% |
Kambi Group PLC (a) | 228,400 | | 2,181 |
Unibet Group PLC unit | 40,100 | | 2,311 |
TOTAL MALTA | | 4,492 |
Netherlands - 0.8% |
AEGON NV | 109,900 | | 896 |
ASML Holding NV | 13,857 | | 1,381 |
ING Groep NV: | | | |
(Certificaten Van Aandelen) (a) | 193,910 | | 2,777 |
sponsored ADR (a) | 59,300 | | 849 |
TOTAL NETHERLANDS | | 5,903 |
New Zealand - 0.1% |
EBOS Group Ltd. | 99,154 | | 740 |
Nigeria - 0.1% |
Guinness Nigeria PLC | 395,662 | | 386 |
Nigerian Breweries PLC | 673,311 | | 658 |
TOTAL NIGERIA | | 1,044 |
Norway - 1.0% |
DNB ASA | 184,200 | | 3,384 |
Schibsted ASA (B Shares) (d) | 64,700 | | 3,424 |
Statoil ASA sponsored ADR | 23,300 | | 535 |
TOTAL NORWAY | | 7,343 |
Philippines - 0.6% |
Alliance Global Group, Inc. | 3,777,700 | | 2,125 |
Melco Crown Philippines Resort (a) | 7,218,600 | | 2,409 |
TOTAL PHILIPPINES | | 4,534 |
Common Stocks - continued |
| Shares | | Value (000s) |
South Africa - 3.4% |
Alexander Forbes Group Holding (a) | 916,508 | | $ 715 |
Capevin Holdings Ltd. | 66,096 | | 52 |
Clicks Group Ltd. | 385,766 | | 2,627 |
Distell Group Ltd. | 112,162 | | 1,358 |
Life Healthcare Group Holdings Ltd. | 272,900 | | 1,032 |
Naspers Ltd. Class N | 145,000 | | 18,038 |
TOTAL SOUTH AFRICA | | 23,822 |
Spain - 1.4% |
Atresmedia Corporacion de Medios de Comunicacion SA | 229,100 | | 3,356 |
Banco Bilbao Vizcaya Argentaria SA | 205,000 | | 2,293 |
Banco Santander SA: | | | |
rights 11/3/14 (a) | 147,016 | | 28 |
(Spain) | 147,053 | | 1,299 |
Mediaset Espana Comunicacion, S.A. (a) | 223,800 | | 2,802 |
TOTAL SPAIN | | 9,778 |
Sweden - 1.2% |
Nordea Bank AB | 249,400 | | 3,198 |
Svenska Cellulosa AB (SCA) (B Shares) | 191,800 | | 4,288 |
Swedbank AB (A Shares) | 51,612 | | 1,365 |
TOTAL SWEDEN | | 8,851 |
Switzerland - 5.6% |
Compagnie Financiere Richemont SA Series A | 64,450 | | 5,422 |
Credit Suisse Group AG | 163,141 | | 4,347 |
Credit Suisse Group AG sponsored ADR | 11,300 | | 301 |
Nestle SA | 218,204 | | 16,002 |
Swiss Re Ltd. | 19,790 | | 1,598 |
Syngenta AG (Switzerland) | 16,570 | | 5,124 |
UBS AG | 208,359 | | 3,623 |
UBS AG (NY Shares) | 108,277 | | 1,882 |
Zurich Insurance Group AG | 5,614 | | 1,697 |
TOTAL SWITZERLAND | | 39,996 |
Taiwan - 0.2% |
Addcn Technology Co. Ltd. | 153,000 | | 1,471 |
Thailand - 0.2% |
Thai Beverage PCL | 2,900,000 | | 1,727 |
United Kingdom - 20.8% |
Al Noor Hospitals Group PLC | 53,600 | | 874 |
Anglo American PLC (United Kingdom) | 120,700 | | 2,548 |
Common Stocks - continued |
| Shares | | Value (000s) |
United Kingdom - continued |
AstraZeneca PLC (United Kingdom) | 98,550 | | $ 7,199 |
Aviva PLC | 184,200 | | 1,541 |
Barclays PLC | 1,171,848 | | 4,507 |
Barclays PLC sponsored ADR | 52,868 | | 814 |
BG Group PLC | 163,618 | | 2,727 |
BHP Billiton PLC | 121,504 | | 3,139 |
BP PLC | 183,400 | | 1,320 |
BP PLC sponsored ADR | 49,166 | | 2,137 |
Brammer PLC | 527,500 | | 2,736 |
Burberry Group PLC | 165,900 | | 4,063 |
Dechra Pharmaceuticals PLC | 73,200 | | 888 |
Diageo PLC | 231,700 | | 6,833 |
Dunelm Group PLC | 195,800 | | 2,642 |
Exova Group Ltd. PLC (a) | 40,100 | | 109 |
Foxtons Group PLC | 194,600 | | 524 |
Galiform PLC | 1,002,300 | | 5,488 |
GlaxoSmithKline PLC | 168,000 | | 3,799 |
HSBC Holdings PLC sponsored ADR | 183,891 | | 9,382 |
Intertek Group PLC | 62,300 | | 2,713 |
ITV PLC | 1,571,900 | | 5,105 |
Johnson Matthey PLC | 72,319 | | 3,441 |
Lloyds Banking Group PLC (a) | 5,476,799 | | 6,763 |
M&C Saatchi PLC | 887,505 | | 4,199 |
Moneysupermarket.com Group PLC | 738,800 | | 2,364 |
Poundland Group PLC (a) | 74,176 | | 374 |
Prudential PLC | 100,209 | | 2,320 |
Reckitt Benckiser Group PLC | 27,300 | | 2,293 |
Rightmove PLC | 182,700 | | 6,167 |
Rio Tinto PLC | 94,332 | | 4,488 |
Rolls-Royce Group PLC | 164,274 | | 2,215 |
Royal Bank of Scotland Group PLC (a) | 120,080 | | 747 |
Royal Dutch Shell PLC: | | | |
Class A (United Kingdom) | 233,928 | | 8,356 |
Class B (United Kingdom) | 176,236 | | 6,511 |
SABMiller PLC | 155,100 | | 8,746 |
Standard Chartered PLC (United Kingdom) | 89,816 | | 1,350 |
SThree PLC | 190,600 | | 945 |
Taylor Wimpey PLC | 715,100 | | 1,354 |
Travis Perkins PLC | 81,800 | | 2,162 |
Vodafone Group PLC | 2,164,100 | | 7,197 |
William Hill PLC | 718,366 | | 4,143 |
TOTAL UNITED KINGDOM | | 147,223 |
Common Stocks - continued |
| Shares | | Value (000s) |
United States of America - 9.1% |
BlackRock, Inc. Class A | 10,800 | | $ 3,684 |
Boston Beer Co., Inc. Class A (a) | 6,500 | | 1,619 |
Dunkin' Brands Group, Inc. | 46,700 | | 2,124 |
eBay, Inc. (a) | 44,700 | | 2,347 |
Facebook, Inc. Class A (a) | 65,600 | | 4,919 |
Gilead Sciences, Inc. (a) | 46,200 | | 5,174 |
Google, Inc.: | | | |
Class A (a) | 6,700 | | 3,805 |
Class C (a) | 5,400 | | 3,019 |
Lorillard, Inc. | 39,600 | | 2,435 |
MercadoLibre, Inc. (d) | 18,800 | | 2,560 |
Monsanto Co. | 26,700 | | 3,072 |
Monster Beverage Corp. (a) | 64,600 | | 6,517 |
priceline.com, Inc. (a) | 3,500 | | 4,222 |
Sprouts Farmers Market LLC (a) | 97,800 | | 2,847 |
Tiffany & Co., Inc. | 49,600 | | 4,768 |
TripAdvisor, Inc. (a) | 17,900 | | 1,587 |
Visa, Inc. Class A | 28,500 | | 6,881 |
Zillow, Inc. (a)(d) | 26,000 | | 2,827 |
TOTAL UNITED STATES OF AMERICA | | 64,407 |
TOTAL COMMON STOCKS (Cost $610,873) |
693,283
|
Nonconvertible Preferred Stocks - 1.5% |
| | | |
Germany - 1.5% |
Sartorius AG (non-vtg.) | 16,700 | | 1,821 |
Volkswagen AG | 40,000 | | 8,524 |
TOTAL GERMANY | | 10,345 |
United Kingdom - 0.0% |
Rolls-Royce Group PLC | 14,784,660 | | 24 |
TOTAL NONCONVERTIBLE PREFERRED STOCKS (Cost $9,047) |
10,369
|
Money Market Funds - 2.7% |
| Shares | | Value (000s) |
Fidelity Cash Central Fund, 0.11% (b) | 1,115,066 | | $ 1,115 |
Fidelity Securities Lending Cash Central Fund, 0.11% (b)(c) | 17,737,960 | | 17,738 |
TOTAL MONEY MARKET FUNDS (Cost $18,853) |
18,853
|
TOTAL INVESTMENT PORTFOLIO - 101.9% (Cost $638,773) | | 722,505 |
NET OTHER ASSETS (LIABILITIES) - (1.9)% | | (13,166) |
NET ASSETS - 100% | $ 709,339 |
Legend |
(a) Non-income producing |
(b) Affiliated fund that is generally available only to investment companies and other accounts managed by Fidelity Investments. The rate quoted is the annualized seven-day yield of the fund at period end. A complete unaudited listing of the fund's holdings as of its most recent quarter end is available upon request. In addition, each Fidelity Central Fund's financial statements, which are not covered by the Fund's Report of Independent Registered Public Accounting Firm, are available on the SEC's website or upon request. |
(c) Investment made with cash collateral received from securities on loan. |
(d) Security or a portion of the security is on loan at period end. |
* Amount represents less than $1,000 |
Affiliated Central Funds |
Information regarding fiscal year to date income earned by the Fund from investments in Fidelity Central Funds is as follows: |
Fund | Income earned
(Amounts in thousands) |
Fidelity Cash Central Fund | $ 13 |
Fidelity Securities Lending Cash Central Fund | 326 |
Total | $ 339 |
Other Information |
Categorizations in the Schedule of Investments are based on country or territory of incorporation. |
The following is a summary of the inputs used, as of October 31, 2014, involving the Fund's assets and liabilities carried at fair value. The inputs or methodology used for valuing securities may not be an indication of the risk associated with investing in those securities. For more information on valuation inputs, and their aggregation into the levels used in the tables below, please refer to the Investment Valuation section in the accompanying Notes to Financial Statements. |
Valuation Inputs at Reporting Date: |
Description
(Amounts in thousands) | Total | Level 1 | Level 2 | Level 3 |
Investments in Securities: | | | | |
Equities: | | | | |
Consumer Discretionary | $ 177,659 | $ 127,952 | $ 49,707 | $ - |
Consumer Staples | 85,114 | 48,100 | 37,014 | - |
Energy | 31,521 | 3,620 | 27,901 | - |
Financials | 126,909 | 53,245 | 73,664 | - |
Health Care | 74,855 | 39,632 | 35,223 | - |
Industrials | 43,969 | 22,219 | 21,750 | - |
Information Technology | 116,679 | 72,400 | 44,279 | - |
Materials | 33,130 | 10,364 | 22,766 | - |
Telecommunication Services | 13,816 | 1,348 | 12,468 | - |
Money Market Funds | 18,853 | 18,853 | - | - |
Total Investments in Securities: | $ 722,505 | $ 397,733 | $ 324,772 | $ - |
The following is a summary of transfers between Level 1 and Level 2 for the period ended October 31, 2014. Transfers are assumed to have occurred at the beginning of the period, and are primarily attributable to the valuation techniques used for foreign equity securities, as discussed in the accompanying Notes to Financial Statements: |
Transfers | Total (000s) |
Level 1 to Level 2 | $ 44,934 |
Level 2 to Level 1 | $ 0 |
See accompanying notes which are an integral part of the financial statements.
Annual Report
Statement of Assets and Liabilities
Amounts in thousands (except per-share amounts) | October 31, 2014 |
| | |
Assets | | |
Investment in securities, at value (including securities loaned of $17,941) - See accompanying schedule: Unaffiliated issuers (cost $619,920) | $ 703,652 | |
Fidelity Central Funds (cost $18,853) | 18,853 | |
Total Investments (cost $638,773) | | $ 722,505 |
Receivable for investments sold | | 8,034 |
Receivable for fund shares sold | | 1,542 |
Dividends receivable | | 1,676 |
Distributions receivable from Fidelity Central Funds | | 11 |
Prepaid expenses | | 2 |
Other receivables | | 78 |
Total assets | | 733,848 |
| | |
Liabilities | | |
Payable for investments purchased | $ 5,509 | |
Payable for fund shares redeemed | 426 | |
Accrued management fee | 427 | |
Distribution and service plan fees payable | 150 | |
Other affiliated payables | 150 | |
Other payables and accrued expenses | 109 | |
Collateral on securities loaned, at value | 17,738 | |
Total liabilities | | 24,509 |
| | |
Net Assets | | $ 709,339 |
Net Assets consist of: | | |
Paid in capital | | $ 677,270 |
Undistributed net investment income | | 1,479 |
Accumulated undistributed net realized gain (loss) on investments and foreign currency transactions | | (53,054) |
Net unrealized appreciation (depreciation) on investments and assets and liabilities in foreign currencies | | 83,644 |
Net Assets | | $ 709,339 |
See accompanying notes which are an integral part of the financial statements.
Annual Report
Financial Statements - continued
Statement of Assets and Liabilities - continued
Amounts in thousands (except per-share amounts) | October 31, 2014 |
| | |
Calculation of Maximum Offering Price Class A:
Net Asset Value and redemption price per share ($65,257.9 ÷ 3,094.63 shares) | | $ 21.09 |
| | |
Maximum offering price per share (100/94.25 of $21.09) | | $ 22.38 |
Class T:
Net Asset Value and redemption price per share ($293,404.0 ÷ 13,570.92 shares) | | $ 21.62 |
| | |
Maximum offering price per share (100/96.50 of $21.62) | | $ 22.40 |
Class B:
Net Asset Value and offering price per share ($2,058.0 ÷ 100.61 shares)A | | $ 20.46 |
| | |
Class C:
Net Asset Value and offering price per share ($18,970.9 ÷ 919.37 shares)A | | $ 20.63 |
| | |
Institutional Class:
Net Asset Value, offering price and redemption price per share ($329,647.7 ÷ 15,294.00 shares) | | $ 21.55 |
A Redemption price per share is equal to net asset value less any applicable contingent deferred sales charge.
See accompanying notes which are an integral part of the financial statements.
Annual Report
Statement of Operations
Amounts in thousands | Year ended October 31, 2014 |
| | |
Investment Income | | |
Dividends | | $ 18,929 |
Income from Fidelity Central Funds | | 339 |
Income before foreign taxes withheld | | 19,268 |
Less foreign taxes withheld | | (1,240) |
Total income | | 18,028 |
| | |
Expenses | | |
Management fee
Basic fee | $ 5,216 | |
Performance adjustment | (65) | |
Transfer agent fees | 1,509 | |
Distribution and service plan fees | 2,013 | |
Accounting and security lending fees | 367 | |
Custodian fees and expenses | 155 | |
Independent trustees' compensation | 3 | |
Registration fees | 72 | |
Audit | 78 | |
Legal | 4 | |
Miscellaneous | 6 | |
Total expenses | | 9,358 |
Net investment income (loss) | | 8,670 |
Realized and Unrealized Gain (Loss) Net realized gain (loss) on: | | |
Investment securities: | | |
Unaffiliated issuers | 58,093 | |
Foreign currency transactions | (155) | |
Total net realized gain (loss) | | 57,938 |
Change in net unrealized appreciation (depreciation) on: Investment securities | (75,457) | |
Assets and liabilities in foreign currencies | (68) | |
Total change in net unrealized appreciation (depreciation) | | (75,525) |
Net gain (loss) | | (17,587) |
Net increase (decrease) in net assets resulting from operations | | $ (8,917) |
See accompanying notes which are an integral part of the financial statements.
Annual Report
Financial Statements - continued
Statement of Changes in Net Assets
Amounts in thousands | Year ended
October 31,
2014 | Year ended
October 31,
2013 |
Increase (Decrease) in Net Assets | | |
Operations | | |
Net investment income (loss) | $ 8,670 | $ 6,363 |
Net realized gain (loss) | 57,938 | 35,511 |
Change in net unrealized appreciation (depreciation) | (75,525) | 138,935 |
Net increase (decrease) in net assets resulting
from operations | (8,917) | 180,809 |
Distributions to shareholders from net investment income | (6,228) | (8,840) |
Distributions to shareholders from net realized gain | (2,640) | (1,437) |
Total distributions | (8,868) | (10,277) |
Share transactions - net increase (decrease) | (1,301) | (49,806) |
Redemption fees | 19 | 12 |
Total increase (decrease) in net assets | (19,067) | 120,738 |
| | |
Net Assets | | |
Beginning of period | 728,406 | 607,668 |
End of period (including undistributed net investment income of $1,479 and undistributed net investment income of $6,237, respectively) | $ 709,339 | $ 728,406 |
See accompanying notes which are an integral part of the financial statements.
Annual Report
Financial Highlights - Class A
Years ended October 31, | 2014 | 2013 | 2012 | 2011 | 2010 |
Selected Per-Share Data | | | | | |
Net asset value, beginning of period | $ 21.61 | $ 16.76 | $ 16.13 | $ 17.77 | $ 15.68 |
Income from Investment Operations | | | | | |
Net investment income (loss) C | .24 | .17 | .23 | .16 | .17 |
Net realized and unrealized gain (loss) | (.50) | 4.97 | .64 | (1.54) | 2.16 |
Total from investment operations | (.26) | 5.14 | .87 | (1.38) | 2.33 |
Distributions from net investment income | (.18) | (.25) | (.24) | (.21) | (.21) |
Distributions from net realized gain | (.08) | (.04) | - | (.05) | (.03) |
Total distributions | (.26) | (.29) | (.24) | (.26) | (.24) |
Redemption fees added to paid in capital C, G | - | - | - | - | - |
Net asset value, end of period | $ 21.09 | $ 21.61 | $ 16.76 | $ 16.13 | $ 17.77 |
Total ReturnA, B | (1.24)% | 31.13% | 5.51% | (7.95)% | 14.99% |
Ratios to Average Net Assets D, F | | | | | |
Expenses before reductions | 1.30% | 1.37% | 1.33% | 1.34% | 1.36% |
Expenses net of fee waivers, if any | 1.30% | 1.37% | 1.33% | 1.34% | 1.36% |
Expenses net of all reductions | 1.30% | 1.36% | 1.32% | 1.32% | 1.33% |
Net investment income (loss) | 1.10% | .91% | 1.43% | .90% | 1.04% |
Supplemental Data | | | | | |
Net assets, end of period (in millions) | $ 65 | $ 69 | $ 60 | $ 60 | $ 70 |
Portfolio turnover rateE | 39% | 37% | 36% | 44% | 53% |
A Total returns would have been lower if certain expenses had not been reduced during the applicable periods shown.
B Total returns do not include the effect of the sales charges.
C Calculated based on average shares outstanding during the period.
D Fees and expenses of any underlying Fidelity Central Funds are not included in the Fund's expense ratio. The Fund indirectly bears its proportionate share of the expenses of any underlying Fidelity Central Funds.
E Amount does not include the portfolio activity of any underlying Fidelity Central Funds.
F Expense ratios reflect operating expenses of the class. Expenses before reductions do not reflect amounts reimbursed by the investment adviser or reductions from brokerage service arrangements or reductions from other expense offset arrangements and do not represent the amount paid by the class during periods when reimbursements or reductions occur. Expenses net of fee waivers reflect expenses after reimbursement by the investment adviser but prior to reductions from brokerage service arrangements or other expense offset arrangements. Expenses net of all reductions represent the net expenses paid by the class.
G Amount represents less than $.01 per share.
See accompanying notes which are an integral part of the financial statements.
Annual Report
Financial Highlights - Class T
Years ended October 31, | 2014 | 2013 | 2012 | 2011 | 2010 |
Selected Per-Share Data | | | | | |
Net asset value, beginning of period | $ 22.16 | $ 17.16 | $ 16.50 | $ 18.18 | $ 16.03 |
Income from Investment Operations | | | | | |
Net investment income (loss) C | .21 | .14 | .20 | .13 | .14 |
Net realized and unrealized gain (loss) | (.52) | 5.11 | .66 | (1.59) | 2.23 |
Total from investment operations | (.31) | 5.25 | .86 | (1.46) | 2.37 |
Distributions from net investment income | (.15) | (.21) | (.20) | (.17) | (.19) |
Distributions from net realized gain | (.08) | (.04) | - | (.05) | (.03) |
Total distributions | (.23) | (.25) | (.20) | (.22) | (.22) |
Redemption fees added to paid in capital C, G | - | - | - | - | - |
Net asset value, end of period | $ 21.62 | $ 22.16 | $ 17.16 | $ 16.50 | $ 18.18 |
Total ReturnA, B | (1.42)% | 30.96% | 5.32% | (8.17)% | 14.88% |
Ratios to Average Net Assets D, F | | | | | |
Expenses before reductions | 1.48% | 1.53% | 1.51% | 1.52% | 1.53% |
Expenses net of fee waivers, if any | 1.48% | 1.53% | 1.51% | 1.51% | 1.53% |
Expenses net of all reductions | 1.48% | 1.52% | 1.50% | 1.49% | 1.50% |
Net investment income (loss) | .92% | .74% | 1.25% | .73% | .86% |
Supplemental Data | | | | | |
Net assets, end of period (in millions) | $ 293 | $ 329 | $ 271 | $ 305 | $ 371 |
Portfolio turnover rateE | 39% | 37% | 36% | 44% | 53% |
A Total returns would have been lower if certain expenses had not been reduced during the applicable periods shown.
B Total returns do not include the effect of the sales charges.
C Calculated based on average shares outstanding during the period.
D Fees and expenses of any underlying Fidelity Central Funds are not included in the Fund's expense ratio. The Fund indirectly bears its proportionate share of the expenses of any underlying Fidelity Central Funds.
E Amount does not include the portfolio activity of any underlying Fidelity Central Funds.
F Expense ratios reflect operating expenses of the class. Expenses before reductions do not reflect amounts reimbursed by the investment adviser or reductions from brokerage service arrangements or reductions from other expense offset arrangements and do not represent the amount paid by the class during periods when reimbursements or reductions occur. Expenses net of fee waivers reflect expenses after reimbursement by the investment adviser but prior to reductions from brokerage service arrangements or other expense offset arrangements. Expenses net of all reductions represent the net expenses paid by the class.
G Amount represents less than $.01 per share.
See accompanying notes which are an integral part of the financial statements.
Annual Report
Financial Highlights - Class B
Years ended October 31, | 2014 | 2013 | 2012 | 2011 | 2010 |
Selected Per-Share Data | | | | | |
Net asset value, beginning of period | $ 21.02 | $ 16.25 | $ 15.58 | $ 17.18 | $ 15.16 |
Income from Investment Operations | | | | | |
Net investment income (loss) C | .07 | .03 | .10 | .03 | .04 |
Net realized and unrealized gain (loss) | (.49) | 4.85 | .63 | (1.51) | 2.10 |
Total from investment operations | (.42) | 4.88 | .73 | (1.48) | 2.14 |
Distributions from net investment income | (.06) | (.07) | (.06) | (.08) | (.09) |
Distributions from net realized gain | (.08) | (.04) | - | (.05) | (.03) |
Total distributions | (.14) | (.11) | (.06) | (.12) H | (.12) |
Redemption fees added to paid in capital C, G | - | - | - | - | - |
Net asset value, end of period | $ 20.46 | $ 21.02 | $ 16.25 | $ 15.58 | $ 17.18 |
Total ReturnA, B | (2.03)% | 30.21% | 4.72% | (8.67)% | 14.15% |
Ratios to Average Net Assets D, F | | | | | |
Expenses before reductions | 2.09% | 2.12% | 2.09% | 2.10% | 2.11% |
Expenses net of fee waivers, if any | 2.09% | 2.12% | 2.09% | 2.09% | 2.11% |
Expenses net of all reductions | 2.09% | 2.11% | 2.07% | 2.07% | 2.09% |
Net investment income (loss) | .31% | .16% | .67% | .15% | .28% |
Supplemental Data | | | | | |
Net assets, end of period (in millions) | $ 2 | $ 3 | $ 3 | $ 4 | $ 7 |
Portfolio turnover rateE | 39% | �� 37% | 36% | 44% | 53% |
A Total returns would have been lower if certain expenses had not been reduced during the applicable periods shown.
B Total returns do not include the effect of the contingent deferred sales charge.
C Calculated based on average shares outstanding during the period.
D Fees and expenses of any underlying Fidelity Central Funds are not included in the Fund's expense ratio. The Fund indirectly bears its proportionate share of the expenses of any underlying Fidelity Central Funds.
E Amount does not include the portfolio activity of any underlying Fidelity Central Funds.
F Expense ratios reflect operating expenses of the class. Expenses before reductions do not reflect amounts reimbursed by the investment adviser or reductions from brokerage service arrangements or reductions from other expense offset arrangements and do not represent the amount paid by the class during periods when reimbursements or reductions occur. Expenses net of fee waivers reflect expenses after reimbursement by the investment adviser but prior to reductions from brokerage service arrangements or other expense offset arrangements. Expenses net of all reductions represent the net expenses paid by the class.
G Amount represents less than $.01 per share.
H Total distributions of $.12 per share is comprised of distributions from net investment income of $.079 and distributions from net realized gain of $.045 per share.
See accompanying notes which are an integral part of the financial statements.
Annual Report
Financial Highlights - Class C
Years ended October 31, | 2014 | 2013 | 2012 | 2011 | 2010 |
Selected Per-Share Data | | | | | |
Net asset value, beginning of period | $ 21.21 | $ 16.43 | $ 15.78 | $ 17.39 | $ 15.36 |
Income from Investment Operations | | | | | |
Net investment income (loss) C | .07 | .03 | .11 | .03 | .05 |
Net realized and unrealized gain (loss) | (.50) | 4.89 | .64 | (1.52) | 2.12 |
Total from investment operations | (.43) | 4.92 | .75 | (1.49) | 2.17 |
Distributions from net investment income | (.07) | (.10) | (.10) | (.07) | (.11) |
Distributions from net realized gain | (.08) | (.04) | - | (.05) | (.03) |
Total distributions | (.15) | (.14) | (.10) | (.12) | (.14) |
Redemption fees added to paid in capital C, G | - | - | - | - | - |
Net asset value, end of period | $ 20.63 | $ 21.21 | $ 16.43 | $ 15.78 | $ 17.39 |
Total ReturnA, B | (2.06)% | 30.16% | 4.78% | (8.67)% | 14.17% |
Ratios to Average Net Assets D, F | | | | | |
Expenses before reductions | 2.08% | 2.12% | 2.09% | 2.09% | 2.10% |
Expenses net of fee waivers, if any | 2.08% | 2.12% | 2.09% | 2.09% | 2.10% |
Expenses net of all reductions | 2.08% | 2.10% | 2.07% | 2.07% | 2.08% |
Net investment income (loss) | .32% | .16% | .67% | .15% | .29% |
Supplemental Data | | | | | |
Net assets, end of period (in millions) | $ 19 | $ 21 | $ 16 | $ 19 | $ 22 |
Portfolio turnover rateE | 39% | 37% | 36% | 44% | 53% |
A Total returns would have been lower if certain expenses had not been reduced during the applicable periods shown.
B Total returns do not include the effect of the contingent deferred sales charge.
C Calculated based on average shares outstanding during the period.
D Fees and expenses of any underlying Fidelity Central Funds are not included in the Fund's expense ratio. The Fund indirectly bears its proportionate share of the expenses of any underlying Fidelity Central Funds.
E Amount does not include the portfolio activity of any underlying Fidelity Central Funds.
F Expense ratios reflect operating expenses of the class. Expenses before reductions do not reflect amounts reimbursed by the investment adviser or reductions from brokerage service arrangements or reductions from other expense offset arrangements and do not represent the amount paid by the class during periods when reimbursements or reductions occur. Expenses net of fee waivers reflect expenses after reimbursement by the investment adviser but prior to reductions from brokerage service arrangements or other expense offset arrangements. Expenses net of all reductions represent the net expenses paid by the class.
G Amount represents less than $.01 per share.
See accompanying notes which are an integral part of the financial statements.
Annual Report
Financial Highlights - Institutional Class
Years ended October 31, | 2014 | 2013 | 2012 | 2011 | 2010 |
Selected Per-Share Data | | | | | |
Net asset value, beginning of period | $ 22.07 | $ 17.11 | $ 16.45 | $ 18.10 | $ 15.95 |
Income from Investment Operations | | | | | |
Net investment income (loss) B | .32 | .24 | .29 | .23 | .22 |
Net realized and unrealized gain (loss) | (.52) | 5.08 | .65 | (1.59) | 2.23 |
Total from investment operations | (.20) | 5.32 | .94 | (1.36) | 2.45 |
Distributions from net investment income | (.24) | (.31) | (.28) | (.24) | (.27) |
Distributions from net realized gain | (.08) | (.04) | - | (.05) | (.03) |
Total distributions | (.32) | (.36)G | (.28) | (.29) | (.30) |
Redemption fees added to paid in capital B, F | - | - | - | - | - |
Net asset value, end of period | $ 21.55 | $ 22.07 | $ 17.11 | $ 16.45 | $ 18.10 |
Total ReturnA | (.95)% | 31.63% | 5.91% | (7.70)% | 15.49% |
Ratios to Average Net Assets C, E | | | | | |
Expenses before reductions | .96% | 1.02% | .99% | 1.00% | 1.01% |
Expenses net of fee waivers, if any | .96% | 1.02% | .99% | .99% | 1.01% |
Expenses net of all reductions | .96% | 1.01% | .97% | .97% | .98% |
Net investment income (loss) | 1.44% | 1.26% | 1.77% | 1.25% | 1.39% |
Supplemental Data | | | | | |
Net assets, end of period (in millions) | $ 330 | $ 307 | $ 257 | $ 349 | $ 678 |
Portfolio turnover rateD | 39% | 37% | 36% | 44% | 53% |
A Total returns would have been lower if certain expenses had not been reduced during the applicable periods shown.
B Calculated based on average shares outstanding during the period.
C Fees and expenses of any underlying Fidelity Central Funds are not included in the Fund's expense ratio. The Fund indirectly bears its proportionate share of the expenses of any underlying Fidelity Central Funds.
D Amount does not include the portfolio activity of any underlying Fidelity Central Funds.
E Expense ratios reflect operating expenses of the class. Expenses before reductions do not reflect amounts reimbursed by the investment adviser or reductions from brokerage service arrangements or reductions from other expense offset arrangements and do not represent the amount paid by the class during periods when reimbursements or reductions occur. Expenses net of fee waivers reflect expenses after reimbursement by the investment adviser but prior to reductions from brokerage service arrangements or other expense offset arrangements. Expenses net of all reductions represent the net expenses paid by the class.
F Amount represents less than $.01 per share.
G Total distributions of $.36 per share is comprised of distributions from net investment income of $.314 and distributions from net realized gain of $.041 per share.
See accompanying notes which are an integral part of the financial statements.
Annual Report
Notes to Financial Statements
For the period ended October 31, 2014
(Amounts in thousands except percentages)
1. Organization.
Fidelity Advisor Overseas Fund (the Fund) is a fund of Fidelity Advisor Series VIII (the Trust) and is authorized to issue an unlimited number of shares. The Trust is registered under the Investment Company Act of 1940, as amended (the 1940 Act), as an open-end management investment company organized as a Massachusetts business trust. The Fund offers Class A, Class T, Class C and Institutional Class shares, each of which, along with Class B shares, has equal rights as to assets and voting privileges. Class B shares are closed to new accounts and additional purchases, except for exchanges and reinvestments. Each class has exclusive voting rights with respect to matters that affect that class. Class B shares will automatically convert to Class A shares after a holding period of seven years from the initial date of purchase. The Fund's investments in emerging markets can be subject to social, economic, regulatory, and political uncertainties and can be extremely volatile.
2. Investments in Fidelity Central Funds.
The Fund invests in Fidelity Central Funds, which are open-end investment companies generally available only to other investment companies and accounts managed by the investment adviser and its affiliates. The Fund's Schedule of Investments lists each of the Fidelity Central Funds held as of period end, if any, as an investment of the Fund, but does not include the underlying holdings of each Fidelity Central Fund. As an Investing Fund, the Fund indirectly bears its proportionate share of the expenses of the underlying Fidelity Central Funds.
The Money Market Central Funds seek preservation of capital and current income and are managed by Fidelity Investments Money Management, Inc. (FIMM), an affiliate of the investment adviser. Annualized expenses of the Money Market Central Funds as of their most recent shareholder report date are less than .01%.
A complete unaudited list of holdings for each Fidelity Central Fund is available upon request or at the Securities and Exchange Commission (the SEC) website at www.sec.gov. In addition, the financial statements of the Fidelity Central Funds, which are not covered by the Fund's Report of Independent Registered Public Accounting Firm, are available on the SEC website or upon request.
3. Significant Accounting Policies.
The financial statements have been prepared in conformity with accounting principles generally accepted in the United States of America (GAAP), which require management to make certain estimates and assumptions at the date of the financial statements. Actual results could differ from those estimates. Subsequent events, if any, through the date that the financial statements were issued have been evaluated in the preparation of
Annual Report
Notes to Financial Statements - continued
(Amounts in thousands except percentages)
3. Significant Accounting Policies - continued
the financial statements. The following summarizes the significant accounting policies of the Fund:
Investment Valuation. Investments are valued as of 4:00 p.m. Eastern time on the last calendar day of the period. In accordance with valuation policies and procedures approved by the Board of Trustees (the Board), the Fund attempts to obtain prices from one or more third party pricing vendors or brokers to value its investments. When current market prices, quotations or currency exchange rates are not readily available or reliable, investments will be fair valued in good faith by the Fidelity Management & Research Company (FMR) Fair Value Committee (the Committee), in accordance with procedures adopted by the Board. Factors used in determining fair value vary by investment type and may include market or investment specific events. The frequency with which these procedures are used cannot be predicted and they may be utilized to a significant extent. The Committee oversees the Fund's valuation policies and procedures and is responsible for approving and reporting to the Board all fair value determinations.
The Fund categorizes the inputs to valuation techniques used to value its investments into a disclosure hierarchy consisting of three levels as shown below:
Level 1 - quoted prices in active markets for identical investments
Level 2 - other significant observable inputs (including quoted prices for similar investments, interest rates, prepayment speeds, etc.)
Level 3 - unobservable inputs (including the Fund's own assumptions based on the best information available)
Valuation techniques used to value the Fund's investments by major category are as follows:
Equity securities, including restricted securities, for which market quotations are readily available, are valued at the last reported sale price or official closing price as reported by a third party pricing vendor on the primary market or exchange on which they are traded and are categorized as Level 1 in the hierarchy. In the event there were no sales during the day or closing prices are not available, securities are valued at the last quoted bid price or may be valued using the last available price and are generally categorized as Level 2 in the hierarchy. For foreign equity securities, when market or security specific events arise, comparisons to the valuation of American Depositary Receipts (ADRs), futures contracts, Exchange-Traded Funds (ETFs) and certain indexes as well as quoted prices for similar securities may be used and would be categorized as Level 2 in the hierarchy. Utilizing these techniques may result in transfers between Level 1 and Level 2. For equity securities, including restricted securities, where observable inputs are
Annual Report
3. Significant Accounting Policies - continued
Investment Valuation - continued
limited, assumptions about market activity and risk are used and these securities may be categorized as Level 3 in the hierarchy.
Investments in open-end mutual funds, including the Fidelity Central Funds, are valued at their closing net asset value (NAV) each business day and are categorized as Level 1 in the hierarchy.
Changes in valuation techniques may result in transfers in or out of an assigned level within the disclosure hierarchy. The aggregate value of investments by input level, as of October 31, 2014, including information on transfers between Levels 1 and 2, is included at the end of the Fund's Schedule of Investments.
Foreign Currency. The Fund may use foreign currency contracts to facilitate transactions in foreign-denominated securities. Gains and losses from these transactions may arise from changes in the value of the foreign currency or if the counterparties do not perform under the contracts' terms.
Foreign-denominated assets, including investment securities, and liabilities are translated into U.S. dollars at the exchange rates at period end. Purchases and sales of investment securities, income and dividends received and expenses denominated in foreign currencies are translated into U.S. dollars at the exchange rate in effect on the transaction date.
The effects of exchange rate fluctuations on investments are included with the net realized and unrealized gain (loss) on investment securities. Other foreign currency transactions resulting in realized and unrealized gain (loss) are disclosed separately.
Investment Transactions and Income. For financial reporting purposes, the Fund's investment holdings and NAV include trades executed through the end of the last business day of the period. The NAV per share for processing shareholder transactions is calculated as of the close of business of the New York Stock Exchange (NYSE), normally 4:00 p.m. Eastern time and includes trades executed through the end of the prior business day. Gains and losses on securities sold are determined on the basis of identified cost and may include proceeds received from litigation. Dividend income is recorded on the ex-dividend date, except for certain dividends from foreign securities where the ex-dividend date may have passed, which are recorded as soon as the Fund is informed of the ex-dividend date. Non-cash dividends included in dividend income, if any, are recorded at the fair market value of the securities received. Income and capital gain distributions from Fidelity Central Funds, if any, are recorded on the ex-dividend date. Interest income is accrued as earned and includes coupon interest and amortization of
Annual Report
Notes to Financial Statements - continued
(Amounts in thousands except percentages)
3. Significant Accounting Policies - continued
Investment Transactions and Income - continued
premium and accretion of discount on debt securities as applicable. Investment income is recorded net of foreign taxes withheld where recovery of such taxes is uncertain.
Class Allocations and Expenses. Investment income, realized and unrealized capital gains and losses, common expenses of the Fund, and certain fund-level expense reductions, if any, are allocated daily on a pro-rata basis to each class based on the relative net assets of each class to the total net assets of the Fund. Each class differs with respect to transfer agent and distribution and service plan fees incurred. Certain expense reductions may also differ by class. For the reporting period, the allocated portion of income and expenses to each class as a percent of its average net assets may vary due to the timing of recording these transactions in relation to fluctuating net assets of the classes. Expenses directly attributable to a fund are charged to that fund. Expenses attributable to more than one fund are allocated among the respective funds on the basis of relative net assets or other appropriate methods. Expense estimates are accrued in the period to which they relate and adjustments are made when actual amounts are known.
Income Tax Information and Distributions to Shareholders. Each year, the Fund intends to qualify as a regulated investment company under Subchapter M of the Internal Revenue Code, including distributing substantially all of its taxable income and realized gains. As a result, no provision for U.S. Federal income taxes is required. As of October 31, 2014, the Fund did not have any unrecognized tax benefits in the financial statements; nor is the Fund aware of any tax positions for which it is reasonably possible that the total amounts of unrecognized tax benefits will significantly change in the next twelve months. The Fund files a U.S. federal tax return, in addition to state and local tax returns as required. The Fund's federal income tax returns are subject to examination by the Internal Revenue Service (IRS) for a period of three fiscal years after they are filed. State and local tax returns may be subject to examination for an additional fiscal year depending on the jurisdiction. Foreign taxes are provided for based on the Fund's understanding of the tax rules and rates that exist in the foreign markets in which it invests.
Distributions are declared and recorded on the ex-dividend date. Income dividends and capital gain distributions are declared separately for each class. Income and capital gain distributions are determined in accordance with income tax regulations, which may differ from GAAP. In addition, the Fund claimed a portion of the payment made to redeeming shareholders as a distribution for income tax purposes.
Capital accounts within the financial statements are adjusted for permanent book-tax differences. These adjustments have no impact on net assets or the results of operations.
Annual Report
3. Significant Accounting Policies - continued
Income Tax Information and Distributions to Shareholders - continued
Capital accounts are not adjusted for temporary book-tax differences which will reverse in a subsequent period.
Book-tax differences are primarily due to foreign currency transactions, passive foreign investment companies (PFIC), deferred trustees compensation, capital loss carryforwards and losses deferred due to wash sales.
The federal tax cost of investment securities and unrealized appreciation (depreciation) as of period end were as follows:
Gross unrealized appreciation | $ 131,149 |
Gross unrealized depreciation | (58,493) |
Net unrealized appreciation (depreciation) on securities | $ 72,656 |
| |
Tax Cost | $ 649,849 |
The tax-based components of distributable earnings as of period end were as follows:
Undistributed ordinary income | $ 1,490 |
Capital loss carryforward | $ (41,978) |
Net unrealized appreciation (depreciation) on securities and other investments | $ 72,557 |
Capital loss carryforwards are only available to offset future capital gains of the Fund to the extent provided by regulations and may be limited. Under the Regulated Investment Company Modernization Act of 2010 (the Act), the Fund is permitted to carry forward capital losses incurred in taxable years beginning after December 22, 2010 for an unlimited period and such capital losses are required to be used prior to any losses that expire. The capital loss carryforward information presented below, including any applicable limitation, is estimated as of fiscal period end and is subject to adjustment.
Fiscal year of expiration | |
2017 | $ (41,978) |
The tax character of distributions paid was as follows:
| October 31, 2014 | October 31, 2013 |
Ordinary Income | $ 8,868 | $ 10,277 |
Annual Report
Notes to Financial Statements - continued
(Amounts in thousands except percentages)
3. Significant Accounting Policies - continued
Short-Term Trading (Redemption) Fees. Shares held by investors in the Fund less than 30 days may have been subject to a redemption fee equal to 1.00% of the NAV of shares redeemed. All redemption fees, which reduce the proceeds of the shareholder redemption, are retained by the Fund and accounted for as an addition to paid in capital.
New Accounting Pronouncement. In June 2014, the Financial Accounting Standards Board issued Accounting Standard Update No. 2014-11, Repurchase-to-Maturity Transactions, Repurchase Financings, and Disclosures. The Update amends the accounting for certain repurchase agreements and expands disclosure requirements for reverse repurchase agreements, securities lending and other similar transactions. The disclosure requirements are effective for annual and interim reporting periods beginning after December 15, 2014. Management is currently evaluating the impact of the Update on the Fund's financial statements and related disclosures.
4. Purchases and Sales of Investments.
Purchases and sales of securities, other than short-term securities, aggregated $284,255 and $287,742, respectively.
5. Fees and Other Transactions with Affiliates.
Management Fee. Fidelity Management & Research Company (the investment adviser) and its affiliates provide the Fund with investment management related services for which the Fund pays a monthly management fee. The management fee is the sum of an individual fund fee rate that is based on an annual rate of .424% of the Fund's average net assets and an annualized group fee rate that averaged .25% during the period. Prior to August 1, 2014 the individual fund fee rate was .45%. The group fee rate is based upon the average net assets of all the mutual funds advised by the investment adviser, including any mutual funds previously advised by the investment adviser that are currently advised by Fidelity SelectCo, LLC, an affiliate of the investment adviser. The group fee rate decreases as assets under management increase and increases as assets under management decrease. In addition, the management fee is subject to a performance adjustment (up to a maximum of ±.20% of the Fund's average net assets over a 36 month performance period). The upward or downward adjustment to the management fee is based on the investment performance of the asset-weighted return of all classes as compared to its benchmark index, the MSCI EAFE Index, over the same 36 month performance period. For the reporting period, the total annual management fee rate, including the performance adjustment, was .69% of the Fund's average net assets. The performance adjustment included in the management fee rate may be higher or lower than the maximum performance adjustment rate due to the difference between the average net assets for the reporting and performance periods.
Annual Report
5. Fees and Other Transactions with Affiliates - continued
Distribution and Service Plan Fees. In accordance with Rule 12b-1 of the 1940 Act, the Fund has adopted separate Distribution and Service Plans for each class of shares. Certain classes pay Fidelity Distributors Corporation (FDC), an affiliate of the investment adviser, separate Distribution and Service Fees, each of which is based on an annual percentage of each class' average net assets. In addition, FDC may pay financial intermediaries for selling shares of the Fund and providing shareholder support services. For the period, the Distribution and Service Fee rates, total fees and amounts retained by FDC were as follows:
| Distribution
Fee | Service
Fee | Total Fees | Retained
by FDC |
Class A | -% | .25% | $ 174 | $ 5 |
Class T | .25% | .25% | 1,606 | 6 |
Class B | .75% | .25% | 26 | 19 |
Class C | .75% | .25% | 207 | 22 |
| | | $ 2,013 | $ 52 |
Sales Load. FDC may receive a front-end sales charge of up to 5.75% for selling Class A shares and 3.50% for selling Class T shares, some of which is paid to financial intermediaries for selling shares of the Fund. Depending on the holding period, FDC may receive contingent deferred sales charges levied on Class A, Class T, Class B, and Class C redemptions. The deferred sales charges range from 5.00% to 1.00% for Class B shares, 1.00% for Class C shares, 1.00% for certain purchases of Class A shares and .25% for certain purchases of Class T shares.
For the period, sales charge amounts retained by FDC were as follows:
| Retained
by FDC |
Class A | $ 11 |
Class T | 4 |
Class B* | 2 |
Class C* | 2 |
| $ 19 |
* When Class B and Class C shares are initially sold, FDC pays commissions from its own resources to financial intermediaries through which the sales are made.
Transfer Agent Fees. Fidelity Investments Institutional Operations Company, Inc., (FIIOC), an affiliate of the investment adviser, is the transfer, dividend disbursing and shareholder servicing agent for each class of the Fund. FIIOC receives account fees and asset-based fees that vary according to the account size and type of account of the shareholders of the respective classes of the Fund. FIIOC pays for typesetting, printing and mailing of shareholder reports, except proxy statements.
Annual Report
Notes to Financial Statements - continued
(Amounts in thousands except percentages)
5. Fees and Other Transactions with Affiliates - continued
Transfer Agent Fees - continued
For the period, transfer agent fees for each class were as follows:
| Amount | % of
Class-Level Average
Net Assets |
Class A | $ 188 | .27 |
Class T | 646 | .20 |
Class B | 8 | .30 |
Class C | 62 | .30 |
Institutional Class | 605 | .18 |
| $ 1,509 | |
Accounting and Security Lending Fees. Fidelity Service Company, Inc. (FSC), an affiliate of the investment adviser, maintains the Fund's accounting records. The accounting fee is based on the level of average net assets for each month. Under a separate contract, FSC administers the security lending program. The security lending fee is based on the number and duration of lending transactions.
Brokerage Commissions. The Fund placed a portion of its portfolio transactions with brokerage firms which are affiliates of the investment adviser. Brokerage commissions are included in net realized gain (loss) and change in net unrealized appreciation (depreciation) in the Statement of Operations. The commissions paid to these affiliated firms were $1 for the period.
6. Committed Line of Credit.
The Fund participates with other funds managed by the investment adviser or an affiliate in a $4.25 billion credit facility (the "line of credit") to be utilized for temporary or emergency purposes to fund shareholder redemptions or for other short-term liquidity purposes. The Fund has agreed to pay commitment fees on its pro-rata portion of the line of credit, which amounted to $1 and is reflected in Miscellaneous expenses on the Statement of Operations. During the period, the Fund did not borrow on this line of credit.
7. Security Lending.
The Fund lends portfolio securities through a lending agent from time to time in order to earn additional income. For equity securities, a lending agent is used and may loan securities to certain qualified borrowers, including Fidelity Capital Markets (FCM), a broker-dealer affiliated with the Fund. On the settlement date of the loan, the Fund
Annual Report
7. Security Lending - continued
receives collateral (in the form of U.S. Treasury obligations, letters of credit and/or cash) against the loaned securities and maintains collateral in an amount not less than 100% of the market value of the loaned securities during the period of the loan. The market value of the loaned securities is determined at the close of business of the Fund and any additional required collateral is delivered to the Fund on the next business day. If the borrower defaults on its obligation to return the securities loaned because of insolvency or other reasons, the Fund may apply collateral received from the borrower against the obligation. The Fund may experience delays and costs in recovering the securities loaned. Any cash collateral received is invested in the Fidelity Securities Lending Cash Central Fund. The value of loaned securities and cash collateral at period end are disclosed on the Fund's Statement of Assets and Liabilities. The value of securities loaned to FCM at period end was $2,120. Security lending income represents the income earned on investing cash collateral, less rebates paid to borrowers and any lending agent fees associated with the loan, plus any premium payments received for lending certain types of securities. Security lending income is presented in the Statement of Operations as a component of income from Fidelity Central Funds. Total security lending income during the period amounted to $326, including $8 from securities loaned to FCM.
8. Distributions to Shareholders.
Distributions to shareholders of each class were as follows:
Years ended October 31, | 2014 | 2013 |
From net investment income | | |
Class A | $ 576 | $ 874 |
Class T | 2,245 | 3,206 |
Class B | 8 | 13 |
Class C | 65 | 95 |
Institutional Class | 3,334 | 4,652 |
Total | $ 6,228 | $ 8,840 |
From net realized gain | | |
Class A | $ 256 | $ 144 |
Class T | 1,182 | 638 |
Class B | 11 | 7 |
Class C | 75 | 40 |
Institutional Class | 1,116 | 608 |
Total | $ 2,640 | $ 1,437 |
Annual Report
Notes to Financial Statements - continued
(Amounts in thousands except percentages)
9. Share Transactions.
Share transactions for each class were as follows and may contain automatic conversions between classes or exchanges between funds:
| Shares | Shares | Dollars | Dollars |
Years ended October 31, | 2014 | 2013 | 2014 | 2013 |
Class A | | | | |
Shares sold | 618 | 381 | $ 13,534 | $ 7,246 |
Reinvestment of distributions | 36 | 56 | 778 | 948 |
Shares redeemed | (735) | (864) | (16,018) | (16,342) |
Net increase (decrease) | (81) | (427) | $ (1,706) | $ (8,148) |
Class T | | | | |
Shares sold | 2,184 | 2,667 | $ 48,970 | $ 51,520 |
Reinvestment of distributions | 150 | 214 | 3,346 | 3,745 |
Shares redeemed | (3,597) | (3,829) | (80,489) | (73,469) |
Net increase (decrease) | (1,263) | (948) | $ (28,173) | $ (18,204) |
Class B | | | | |
Shares sold | 6 | 15 | $ 128 | $ 313 |
Reinvestment of distributions | 1 | 1 | 17 | 18 |
Shares redeemed | (46) | (62) | (989) | (1,123) |
Net increase (decrease) | (39) | (46) | $ (844) | $ (792) |
Class C | | | | |
Shares sold | 158 | 200 | $ 3,399 | $ 3,879 |
Reinvestment of distributions | 6 | 7 | 124 | 120 |
Shares redeemed | (224) | (208) | (4,777) | (3,808) |
Net increase (decrease) | (60) | (1) | $ (1,254) | $ 191 |
Institutional Class | | | | |
Shares sold | 3,011 | 958 | $ 67,092 | $ 18,221 |
Reinvestment of distributions | 198 | 298 | 4,371 | 5,176 |
Shares redeemed | (1,838) | (2,370) | (40,787) | (46,250) |
Net increase (decrease) | 1,371 | (1,114) | $ 30,676 | $ (22,853) |
10. Other.
The Fund's organizational documents provide former and current trustees and officers with a limited indemnification against liabilities arising in connection with the performance of their duties to the Fund. In the normal course of business, the Fund may also enter into contracts that provide general indemnifications. The Fund's maximum exposure under these arrangements is unknown as this would be dependent on future claims that may be made against the Fund. The risk of material loss from such claims is considered remote.
At the end of the period, Strategic Advisers International II Fund was the owner of record of approximately 20% of the total outstanding shares of the Fund.
Annual Report
To the Trustees of Fidelity Advisor Series VIII and the Shareholders of Fidelity Advisor Overseas Fund:
In our opinion, the accompanying statement of assets and liabilities, including the schedule of investments, and the related statements of operations and of changes in net assets and the financial highlights present fairly, in all material respects, the financial position of Fidelity Advisor Overseas Fund (a fund of Fidelity Advisor Series VIII) at October 31, 2014, the results of its operations for the year then ended, the changes in its net assets for each of the two years in the period then ended and the financial highlights for each of the five years in the period then ended, in conformity with accounting principles generally accepted in the United States of America. These financial statements and financial highlights (hereafter referred to as "financial statements") are the responsibility of the Fidelity Advisor Overseas Fund's management. Our responsibility is to express an opinion on these financial statements based on our audits. We conducted our audits of these financial statements in accordance with the standards of the Public Company Accounting Oversight Board (United States). Those standards require that we plan and perform the audit to obtain reasonable assurance about whether the financial statements are free of material misstatement. An audit includes examining, on a test basis, evidence supporting the amounts and disclosures in the financial statements, assessing the accounting principles used and significant estimates made by management, and evaluating the overall financial statement presentation. We believe that our audits, which included confirmation of securities at October 31, 2014 by correspondence with the custodian and brokers, provide a reasonable basis for our opinion.
PricewaterhouseCoopers LLP
Boston, Massachusetts
December 19, 2014
Annual Report
The Trustees, Member of the Advisory Board, and officers of the trust and fund, as applicable, are listed below. The Board of Trustees governs the fund and is responsible for protecting the interests of shareholders. The Trustees are experienced executives who meet periodically throughout the year to oversee the fund's activities, review contractual arrangements with companies that provide services to the fund, oversee management of the risks associated with such activities and contractual arrangements, and review the fund's performance. Except for James C. Curvey, each of the Trustees oversees 174 funds. Mr. Curvey oversees 407 funds.
The Trustees hold office without limit in time except that (a) any Trustee may resign; (b) any Trustee may be removed by written instrument, signed by at least two-thirds of the number of Trustees prior to such removal; (c) any Trustee who requests to be retired or who has become incapacitated by illness or injury may be retired by written instrument signed by a majority of the other Trustees; and (d) any Trustee may be removed at any special meeting of shareholders by a two-thirds vote of the outstanding voting securities of the trust. Each Trustee who is not an interested person (as defined in the 1940 Act) of the trust and the fund (Independent Trustee), shall retire not later than the last day of the calendar year in which his or her 75th birthday occurs. The Independent Trustees may waive this mandatory retirement age policy with respect to individual Trustees. The officers and Advisory Board Member hold office without limit in time, except that any officer and Advisory Board Member may resign or may be removed by a vote of a majority of the Trustees at any regular meeting or any special meeting of the Trustees. Except as indicated, each individual has held the office shown or other offices in the same company for the past five years.
Experience, Skills, Attributes, and Qualifications of the Fund's Trustees. The Governance and Nominating Committee has adopted a statement of policy that describes the experience, qualifications, attributes, and skills that are necessary and desirable for potential Independent Trustee candidates (Statement of Policy). The Board believes that each Trustee satisfied at the time he or she was initially elected or appointed a Trustee, and continues to satisfy, the standards contemplated by the Statement of Policy. The Governance and Nominating Committee also engages professional search firms to help identify potential Independent Trustee candidates who have the experience, qualifications, attributes, and skills consistent with the Statement of Policy. From time to time, additional criteria based on the composition and skills of the current Independent Trustees, as well as experience or skills that may be appropriate in light of future changes to board composition, business conditions, and regulatory or other developments, have also been considered by the professional search firms and the Governance and Nominating Committee. In addition, the Board takes into account the Trustees' commitment and participation in Board and committee meetings, as well as their leadership of standing and ad hoc committees throughout their tenure.
In determining that a particular Trustee was and continues to be qualified to serve as a Trustee, the Board has considered a variety of criteria, none of which, in isolation, was controlling. The Board believes that, collectively, the Trustees have balanced and diverse experience, qualifications, attributes, and skills, which allow the Board to operate effectively in governing the fund and protecting the interests of shareholders. Information about the specific experience, skills, attributes, and qualifications of each Trustee, which in each case led to the Board's conclusion that the Trustee should serve (or continue to serve) as a trustee of the fund, is provided below.
Annual Report
Board Structure and Oversight Function. James C. Curvey is an interested person (as defined in the 1940 Act) and currently serves as Chairman. The Trustees have determined that an interested Chairman is appropriate and benefits shareholders because an interested Chairman has a personal and professional stake in the quality and continuity of services provided to the fund. Independent Trustees exercise their informed business judgment to appoint an individual of their choosing to serve as Chairman, regardless of whether the Trustee happens to be independent or a member of management. The Independent Trustees have determined that they can act independently and effectively without having an Independent Trustee serve as Chairman and that a key structural component for assuring that they are in a position to do so is for the Independent Trustees to constitute a substantial majority for the Board. The Independent Trustees also regularly meet in executive session. Ned C. Lautenbach serves as Chairman of the Independent Trustees and as such (i) acts as a liaison between the Independent Trustees and management with respect to matters important to the Independent Trustees and (ii) with management prepares agendas for Board meetings.
Fidelity funds are overseen by different Boards of Trustees. The fund's Board oversees Fidelity's equity and high income funds and another Board oversees Fidelity's investment-grade bond, money market, and asset allocation funds. The asset allocation funds may invest in Fidelity funds overseen by the fund's Board. The use of separate Boards, each with its own committee structure, allows the Trustees of each group of Fidelity funds to focus on the unique issues of the funds they oversee, including common research, investment, and operational issues. On occasion, the separate Boards establish joint committees to address issues of overlapping consequences for the Fidelity funds overseen by each Board.
The Trustees operate using a system of committees to facilitate the timely and efficient consideration of all matters of importance to the Trustees, the fund, and fund shareholders and to facilitate compliance with legal and regulatory requirements and oversight of the fund's activities and associated risks. The Board, acting through its committees, has charged FMR and its affiliates with (i) identifying events or circumstances the occurrence of which could have demonstrably adverse effects on the fund's business and/or reputation; (ii) implementing processes and controls to lessen the possibility that such events or circumstances occur or to mitigate the effects of such events or circumstances if they do occur; and (iii) creating and maintaining a system designed to evaluate continuously business and market conditions in order to facilitate the identification and implementation processes described in (i) and (ii) above. Because the day-to-day operations and activities of the fund are carried out by or through FMR, its affiliates and other service providers, the fund's exposure to risks is mitigated but not eliminated by the processes overseen by the Trustees. While each of the Board's committees has responsibility for overseeing different aspects of the fund's activities, oversight is exercised primarily through the Operations, Audit, and Compliance Committees. In addition, the Independent Trustees have worked with FMR to enhance the Board's oversight of investment and financial risks, legal and regulatory risks, technology risks, and operational risks, including the development of additional risk reporting to the Board. For example, a working group comprised of Independent Trustees and FMR has worked and continues to work to review the Fidelity funds' valuation-related activities, reporting and risk management. Appropriate personnel, including but not limited to the fund's Chief Compliance Officer (CCO), FMR's internal auditor, the independent accountants, the fund's Treasurer and portfolio management personnel, make periodic reports to the Board's committees, as appropriate, including an annual review of FMR's risk management program for the Fidelity funds. The responsibilities of each standing committee, including their oversight responsibilities, are described further under "Standing Committees of the Fund's Trustees."
Annual Report
Trustees and Officers - continued
The fund's Statement of Additional Information (SAI) includes more information about the Trustees. To request a free copy, call Fidelity at 1-877-208-0098.
Interested Trustees*:
Correspondence intended for each Trustee who is an interested person may be sent to Fidelity Investments, 245 Summer Street, Boston, Massachusetts 02210.
Name, Year of Birth; Principal Occupations and Other Relevant Experience+ |
James C. Curvey (1935) |
Year of Election or Appointment: 2007 Trustee Chairman of the Board of Trustees |
| Mr. Curvey also serves as Trustee of other Fidelity funds. Mr. Curvey is a Director of Fidelity Research & Analysis Co. (2009-present), and Vice Chairman (2007-present) and Director of FMR LLC. In addition, Mr. Curvey serves as an Overseer for the Boston Symphony Orchestra and a member of the board of Artis-Naples, Naples, Florida, and as a Trustee for Brewster Academy, Wolfeboro, New Hampshire. Previously, Mr. Curvey served as a Director of Fidelity Investments Money Management, Inc. (2009-2014), a Director of FMR (2007-2014), and a Director of FMR Co., Inc. (2007-2014). |
Charles S. Morrison (1960) |
Year of Election or Appointment: 2014 Trustee |
| Mr. Morrison also serves as Trustee of other funds. He serves as a Director of Fidelity Investments Money Management, Inc. (FIMM) (2014-present), Director of Fidelity SelectCo, LLC (2014-present), President, Asset Management (2014-present), and is an employee of Fidelity Investments. Previously, Mr. Morrison served as Vice President of Fidelity's Fixed Income and Asset Allocation Funds (2012-2014), President, Fixed Income (2011-2014), Vice President of Fidelity's Money Market Funds (2005-2009), President, Money Market Group Leader of FMR (2009), and Senior Vice President, Money Market Group of FMR (2004-2009). Mr. Morrison also served as Vice President of Fidelity's Bond Funds (2002-2005), certain Balanced Funds (2002-2005), and certain Asset Allocation Funds (2002-2007), and as Senior Vice President (2002-2005) of Fidelity's Bond Division. |
* Trustees have been determined to be "Interested Trustees" by virtue of, among other things, their affiliation with the trust or various entities under common control with FMR.
+ The information above includes each Trustee's principal occupation during the last five years and other information relating to the experience, attributes, and skills relevant to each Trustee's qualifications to serve as a Trustee, which led to the conclusion that each Trustee should serve as a Trustee for the fund.
Annual Report
Trustees and Officers - continued
Independent Trustees:
Correspondence intended for each Independent Trustee (that is, the Trustees other than the Interested Trustees) may be sent to Fidelity Investments, P.O. Box 55235, Boston, Massachusetts 02205-5235.
Name, Year of Birth; Principal Occupations and Other Relevant Experience+ |
Dennis J. Dirks (1948) |
Year of Election or Appointment: 2005 Trustee |
| Mr. Dirks also serves as Trustee of other Fidelity funds. Prior to his retirement in May 2003, Mr. Dirks was Chief Operating Officer and a member of the Board of The Depository Trust & Clearing Corporation (DTCC). He also served as President, Chief Operating Officer, and Board member of The Depository Trust Company (DTC) and President and Board member of the National Securities Clearing Corporation (NSCC). In addition, Mr. Dirks served as Chief Executive Officer and Board member of the Government Securities Clearing Corporation, Chief Executive Officer and Board member of the Mortgage-Backed Securities Clearing Corporation, as a Trustee and a member of the Finance Committee of Manhattan College (2005-2008), and as a Trustee and a member of the Finance Committee of AHRC of Nassau County (2006-2008). Mr. Dirks is a member of the Independent Directors Council (IDC) Governing Council (2010-present) and Board of Directors for The Brookville Center for Children's Services, Inc. (2009-present). |
Alan J. Lacy (1953) |
Year of Election or Appointment: 2008 Trustee |
| Mr. Lacy also serves as Trustee of other Fidelity funds. Mr. Lacy serves as Senior Adviser (2007-present) of Oak Hill Capital Partners, L.P. (private equity). Mr. Lacy also served as Chief Executive Officer (2000-2005) and Vice Chairman (2005-2006) of Sears Holdings Corporation and Sears, Roebuck and Co. (retail). In addition, Mr. Lacy serves as a member of the Board of Directors of Dave & Buster's Entertainment, Inc. (restaurant and entertainment complexes, 2010-present), Earth Fare, Inc. (retail grocery, 2012-present), The Hillman Companies, Inc. (hardware wholesalers, 2010-present), and Bristol-Myers Squibb Company (global pharmaceuticals, 2008-present). Mr. Lacy is a member of the Board of Trustees of The National Parks Conservation Association (2006-present). Previously, Mr. Lacy served as Chairman of the Board of Trustees of the National Parks Conservation Association (2008-2011) and as a member of the Board of Directors for the Western Union Company (global money transfer, 2006-2011). |
Ned C. Lautenbach (1944) |
Year of Election or Appointment: 2000 Trustee Chairman of the Independent Trustees |
| Mr. Lautenbach also serves as Trustee of other Fidelity funds. Mr. Lautenbach currently serves as the Lead Director of the Eaton Corporation Board of Directors (diversified industrial, 1997-present). Mr. Lautenbach is Chairman of the Board of Directors of the Philharmonic Center for the Arts in Naples, Florida (2012-present) and a member of the Council on Foreign Relations (1994-present). Previously, Mr. Lautenbach was a Partner/Advisory Partner at Clayton, Dubilier & Rice, LLC (private equity investment, 1998-2010), as well as a Director of Sony Corporation (2006-2007). |
Joseph Mauriello (1944) |
Year of Election or Appointment: 2008 Trustee |
| Mr. Mauriello also serves as Trustee of other Fidelity funds. Prior to his retirement in January 2006, Mr. Mauriello served in numerous senior management positions including Deputy Chairman and Chief Operating Officer (2004-2005), and Vice Chairman of Financial Services (2002-2004) of KPMG LLP US (professional services, 1965-2005). Mr. Mauriello currently serves as a member of the Board of Directors of XL Group plc. (global insurance and re-insurance, 2006-present). Previously, Mr. Mauriello served as a Director of the Hamilton Funds of the Bank of New York (2006-2007) and of Arcadia Resources Inc. (health care services and products, 2007-2012). |
Robert W. Selander (1950) |
Year of Election or Appointment: 2011 Trustee |
| Mr. Selander also serves as Trustee of other Fidelity funds. Previously, Mr. Selander served as a Member of the Advisory Board of other Fidelity funds (2011), and Executive Vice Chairman (2010), Chief Executive Officer (2009-2010), and President and Chief Executive Officer (1997-2009) of Mastercard, Inc. |
Cornelia M. Small (1944) |
Year of Election or Appointment: 2005 Trustee |
| Ms. Small also serves as Trustee of other Fidelity funds. Ms. Small is a member of the Board of Directors (2009-present) and Chair of the Investment Committee (2010-present) of the Teagle Foundation. Ms. Small also serves on the Investment Committee of the Berkshire Taconic Community Foundation (2008-present). Previously, Ms. Small served as Chairperson (2002-2008) and a member of the Investment Committee and Chairperson (2008-2012) and a member of the Board of Trustees of Smith College. In addition, Ms. Small served as Chief Investment Officer, Director of Global Equity Investments, and a member of the Board of Directors of Scudder, Stevens & Clark and Scudder Kemper Investments. |
William S. Stavropoulos (1939) |
Year of Election or Appointment: 2001 Trustee Vice Chairman of the Independent Trustees |
| Mr. Stavropoulos also serves as Trustee of other Fidelity funds. Mr. Stavropoulos serves as President and Founder of the Michigan Baseball Foundation, the Great Lakes Loons (2007-present). Mr. Stavropoulos is Chairman Emeritus of the Board of Directors of The Dow Chemical Company, where he previously served in numerous senior management positions, including President, CEO (1995-2000; 2002-2004), Chairman of the Executive Committee (2000-2006), and as a member of the Board of Directors (1990-2006). Currently, Mr. Stavropoulos is Chairman of the Board of Directors of Univar Inc. (global distributor of commodity and specialty chemicals), a Director of Teradata Corporation (data warehousing and technology solutions), and Maersk Inc. (industrial conglomerate), and a member of the Advisory Board for Metalmark Capital LLC (private equity investment, 2005-present). Mr. Stavropoulos is an operating advisor to Clayton, Dubilier & Rice, LLC (private equity investment). In addition, Mr. Stavropoulos is a member of the University of Notre Dame Advisory Council for the College of Science, a Trustee of the Rollin L. Gerstacker Foundation, and a Director of the Naples Philharmonic Center for the Arts. Previously, Mr. Stavropoulos served as a Director of Chemical Financial Corporation (bank holding company, 1993-2012) and Tyco International, Ltd. (multinational manufacturing and services, 2007-2012). |
David M. Thomas (1949) |
Year of Election or Appointment: 2008 Trustee |
| Mr. Thomas also serves as Trustee of other Fidelity funds. Mr. Thomas serves as Non-Executive Chairman of the Board of Directors of Fortune Brands Home and Security (home and security products, 2011-present), and as a member of the Board of Directors of Interpublic Group of Companies, Inc. (marketing communication, 2004-present). Previously, Mr. Thomas served as Executive Chairman (2005-2006) and Chairman and Chief Executive Officer (2000-2005) of IMS Health, Inc. (pharmaceutical and healthcare information solutions), and a Director of Fortune Brands, Inc. (consumer products, 2000-2011). |
+ The information above includes each Trustee's principal occupation during the last five years and other information relating to the experience, attributes, and skills relevant to each Trustee's qualifications to serve as a Trustee, which led to the conclusion that each Trustee should serve as a Trustee for the fund.
Advisory Board Member and Officers:
Correspondence intended for each officer and Peter S. Lynch may be sent to Fidelity Investments, 245 Summer Street, Boston, Massachusetts 02210. Officers appear below in alphabetical order.
Name, Year of Birth; Principal Occupation |
Peter S. Lynch (1944) |
Year of Election or Appointment: 2003 Member of the Advisory Board |
| Mr. Lynch also serves as Member of the Advisory Board of other Fidelity funds. Mr. Lynch is Vice Chairman and a Director of FMR and FMR Co., Inc. In addition, Mr. Lynch serves as a Trustee of Boston College and as the Chairman of the Inner-City Scholarship Fund. Previously, Mr. Lynch served on the Special Olympics International Board of Directors (1997-2006). |
Elizabeth Paige Baumann (1968) |
Year of Election or Appointment: 2012 Anti-Money Laundering (AML) Officer |
| Ms. Baumann also serves as AML Officer of other funds. She is Chief AML Officer of FMR LLC (2012-present) and is an employee of Fidelity Investments. Previously, Ms. Baumann served as Vice President and Deputy Anti-Money Laundering Officer (2007-2012). |
William C. Coffey (1969) |
Year of Election or Appointment: 2009 Assistant Secretary |
| Mr. Coffey also serves as Assistant Secretary of other funds. He is Senior Vice President and Deputy General Counsel of FMR LLC (2010-present), and is an employee of Fidelity Investments. Previously, Mr. Coffey served as Vice President and Associate General Counsel of FMR LLC (2005-2009). |
Timothy M. Cohen (1969) |
Year of Election or Appointment: 2014 Vice President of certain Equity Funds |
| Mr. Cohen also serves as Vice President of other funds. Mr. Cohen serves as a Director and Chief Compliance Officer of Fidelity Management & Research (U.K.) Inc. (2013-present) and is an employee of Fidelity Investments. |
Jonathan Davis (1968) |
Year of Election or Appointment: 2010 Assistant Treasurer |
| Mr. Davis also serves as Assistant Treasurer of other funds. Mr. Davis is an employee of Fidelity Investments. Previously, Mr. Davis served as Vice President and Associate General Counsel of FMR LLC (2003-2010). |
Adrien E. Deberghes (1967) |
Year of Election or Appointment: 2008 Deputy Treasurer |
| Mr. Deberghes also serves as an officer of other funds. He is an employee of Fidelity Investments (2008-present). Prior to joining Fidelity Investments, Mr. Deberghes was Senior Vice President of Mutual Fund Administration at State Street Corporation (2007-2008), Senior Director of Mutual Fund Administration at Investors Bank & Trust (2005-2007), and Director of Finance for Dunkin' Brands (2000-2005). |
Stephanie J. Dorsey (1969) |
Year of Election or Appointment: 2010 Assistant Treasurer |
| Ms. Dorsey also serves as an officer of other funds. She is an employee of Fidelity Investments (2008-present) and has served in other fund officer roles. Prior to joining Fidelity Investments, Ms. Dorsey served as Treasurer (2004-2008) of the JPMorgan Mutual Funds and Vice President (2004-2008) of JPMorgan Chase Bank. |
Howard J. Galligan III (1966) |
Year of Election or Appointment: 2014 Chief Financial Officer |
| Mr. Galligan also serves as Chief Financial Officer of other funds. Mr. Galligan serves as President of Fidelity Pricing and Cash Management Services (FPCMS) (2014-present) and as a Director of Strategic Advisers, Inc. (2008-present). Previously, Mr. Galligan served as Chief Administrative Officer of Asset Management (2011-2014) and Chief Operating Officer and Senior Vice President of Investment Support for Strategic Advisers, Inc. (2003-2011). |
Scott C. Goebel (1968) |
Year of Election or Appointment: 2008 Secretary and Chief Legal Officer (CLO) |
| Mr. Goebel serves as Secretary and CLO of other funds. Mr. Goebel also serves as Secretary of Fidelity SelectCo, LLC (2013-present), Fidelity Investments Money Management, Inc. (FIMM) (2010-present) and Fidelity Research and Analysis Company (FRAC) (2010-present); General Counsel, Secretary, and Senior Vice President of FMR (2008-present) and FMR Co., Inc. (2008-present); Chief Legal Officer of Fidelity Management & Research (Hong Kong) Limited (2008-present); and Assistant Secretary of Fidelity Management & Research (Japan) Limited (2008-present) and Fidelity Management & Research (U.K.) Inc. (2008-present). Previously, Mr. Goebel served as Secretary and CLO of other Fidelity funds (2008-2013), Assistant Secretary of FIMM (2008-2010), FRAC (2008-2010), and certain funds (2007-2008); and as Vice President and Secretary of Fidelity Distributors Corporation (FDC) (2005-2007). Mr. Goebel has been employed by FMR LLC or an affiliate since 2001. |
Brian B. Hogan (1964) |
Year of Election or Appointment: 2009 Vice President |
| Mr. Hogan also serves as Trustee or Vice President of other funds. Mr. Hogan serves as a Director of Fidelity SelectCo, LLC (2014-present) and President of FMR's Equity Division (2009-present). Previously, Mr. Hogan served as Senior Vice President, Equity Research of FMR (2006-2009) and as a portfolio manager. |
Chris Maher (1972) |
Year of Election or Appointment: 2013 Assistant Treasurer |
| Mr. Maher serves as Assistant Treasurer of other funds. Mr. Maher is Vice President of Valuation Oversight and is an employee of Fidelity Investments. Previously, Mr. Maher served as Vice President of Asset Management Compliance (2013), Vice President of FMR's Program Management Group (2010-2013), and Vice President of Valuation Oversight (2008-2010). |
Kenneth B. Robins (1969) |
Year of Election or Appointment: 2008 President and Treasurer |
| Mr. Robins also serves as an officer of other funds. Mr. Robins serves as Executive Vice President of Fidelity Investments Money Management, Inc. (FIMM) (2013-present) and is an employee of Fidelity Investments (2004-present). Previously, Mr. Robins served in other fund officer roles. |
Stephen Sadoski (1971) |
Year of Election or Appointment: 2012 Deputy Treasurer |
| Mr. Sadoski also serves as Deputy Treasurer of other funds. He is an employee of Fidelity Investments (2012-present) and has served in another fund officer role. Prior to joining Fidelity Investments, Mr. Sadoski served as an assistant chief accountant in the Division of Investment Management of the Securities and Exchange Commission (SEC) (2009-2012) and as a senior manager at Deloitte & Touche LLP (1997-2009). |
Stacie M. Smith (1974) |
Year of Election or Appointment: 2013 Deputy Treasurer |
| Ms. Smith also serves as an officer of other funds. She is an employee of Fidelity Investments (2009-present) and has served in other fund officer roles. Prior to joining Fidelity Investments, Ms. Smith served as Senior Audit Manager of Ernst & Young LLP (1996-2009). |
Renee Stagnone (1975) |
Year of Election or Appointment: 2013 Deputy Treasurer |
| Ms. Stagnone also serves as Deputy Treasurer of other funds. Ms. Stagnone is an employee of Fidelity Investments. |
Linda J. Wondrack (1964) |
Year of Election or Appointment: 2014 Chief Compliance Officer |
| Ms. Wondrack also serves as Chief Compliance Officer of other funds. Ms. Wondrack is Executive Vice President and head of the Ethics Office and Asset Management Compliance for Fidelity Investments (2012-present). Ms. Wondrack also serves as Chief Compliance Officer of Fidelity SelectCo, LLC (2014-present); Chief Compliance Officer of Impresa Management LLC (2013-present); and Chief Compliance Officer of FMR Co., Inc., Fidelity Investments Money Management, Inc., Fidelity Management & Research (Japan) Limited, Fidelity Management & Research (U.K.) Inc., Fidelity Management & Research (Hong Kong), Fidelity Management & Research Company, Pyramis Global Advisors, LLC, and Strategic Advisers, Inc., Ballyrock Investment Advisors LLC, and Northern Neck Investors LLC (2012-present). Previously, Ms. Wondrack served as Senior Vice President and Chief Compliance Officer for Columbia Management Investment Advisers, LLC (2005-2012); Chief Compliance Officer for certain funds within the Columbia Family of Funds (2007-2012); and Senior Vice President of Compliance Risk Management at Bank of America (2005-2010). |
Joseph F. Zambello (1957) |
Year of Election or Appointment: 2011 Deputy Treasurer |
| Mr. Zambello also serves as Deputy Treasurer of other funds. Mr. Zambello is an employee of Fidelity Investments. Previously, Mr. Zambello served as Vice President of FMR's Program Management Group (2009-2011) and Vice President of the Transfer Agent Oversight Group (2005-2009). |
Annual Report
Institutional class designates 100% of the dividend distributed during the fiscal year as amounts which may be taken into account as a dividend for purposes of the maximum rate under section 1(h)(11) of the Internal Revenue Code.
Institutional class designates 2% of the dividends distributed in December 2013 as indicated in the Corporate Qualifying memo distributed by the Tax department, during the fiscal year as qualifying for the dividends received deduction for corporate shareholders.
The amounts per share which represent income derived from sources within, and taxes paid to, foreign countries or possessions of the United States are as follows:
| Pay Date | Income | Taxes |
Institutional Class | 12/9/13 | $.2666 | $.0189 |
The fund will notify shareholders in January 2015 of amounts for use in preparing 2014 income tax returns.
Annual Report
Board Approval of Investment Advisory Contracts and Management Fees
Fidelity Advisor Overseas Fund
Each year, the Board of Trustees, including the Independent Trustees (together, the Board), votes on the renewal of the management contract with Fidelity Management & Research Company (FMR) and the sub-advisory agreements (together, the Advisory Contracts) for the fund. The Board, assisted by the advice of fund counsel and Independent Trustees' counsel, requests and considers a broad range of information relevant to the renewal of the Advisory Contracts throughout the year.
The Board meets regularly and, at each of its meetings, covers an extensive agenda of topics and materials and considers factors that are relevant to its annual consideration of the renewal of the fund's Advisory Contracts, including the services and support provided to the fund and its shareholders. The Board has established various standing committees (Committees), each composed of and chaired by Independent Trustees with varying backgrounds, to which the Board has assigned specific subject matter responsibilities in order to enhance effective decision-making by the Board. The Board, acting directly and through its Committees, requests and receives information concerning the annual consideration of the renewal of the fund's Advisory Contracts. The Board also meets as needed to consider matters specifically related to the Board's annual consideration of the renewal of the Advisory Contracts. Members of the Board may also meet with trustees of other Fidelity funds through ad hoc joint committees to discuss certain matters relevant to the Fidelity funds.
At its July 2014 meeting, the Board, including the Independent Trustees, unanimously determined to renew the fund's Advisory Contracts. In reaching its determination, the Board considered all factors it believed relevant, including (i) the nature, extent, and quality of the services to be provided to the fund and its shareholders (including the investment performance of the fund); (ii) the competitiveness of the fund's management fee and total expense ratio relative to peer funds; (iii) the total costs of the services to be provided by and the profits to be realized by Fidelity from its relationship with the fund; (iv) the extent to which economies of scale exist and would be realized as the fund grows; and (v) whether fee levels reflect these economies of scale, if any, for the benefit of fund shareholders. In connection with separate internal corporate reorganizations involving Fidelity Management & Research (U.K.) Inc. (FMR U.K.) and Fidelity Management & Research (Japan) Inc. (FMR Japan), the Board approved certain non-material amendments to the fund's sub-advisory agreements with FMR U.K. and FMR Japan to reflect that, after these reorganizations, FMR Investment Management (UK) Limited and Fidelity Management & Research (Japan) Limited will carry on the business of FMR U.K. and FMR Japan, respectively. The Board noted that no changes to the portfolio managers or to the foreign research or investment advisory services provided to the fund were expected in connection with either reorganization and that the same personnel and resources would continue to be available to the fund at the new entities.
Annual Report
Board Approval of Investment Advisory Contracts and
Management Fees - continued
In considering whether to renew the Advisory Contracts for the fund, the Board reached a determination, with the assistance of fund counsel and Independent Trustees' counsel and through the exercise of its business judgment, that the renewal of the Advisory Contracts was in the best interests of the fund and its shareholders and that the compensation payable under the Advisory Contracts was fair and reasonable. The Board's decision to renew the Advisory Contracts was not based on any single factor, but rather was based on a comprehensive consideration of all the information provided to the Board at its meetings throughout the year. The Board, in reaching its determination to renew the Advisory Contracts, was aware that shareholders of the fund have a broad range of investment choices available to them, including a wide choice among funds offered by Fidelity's competitors, and that the fund's shareholders, who have the opportunity to review and weigh the disclosure provided by the fund in its prospectus and other public disclosures, have chosen to invest in this fund, which is part of the Fidelity family of funds.
Nature, Extent, and Quality of Services Provided. The Board considered Fidelity's staffing as it relates to the fund, including the backgrounds of investment personnel of FMR and the sub-advisers (together, the Investment Advisers), and also considered the fund's investment objective, strategies, and related investment philosophy. The Independent Trustees also had discussions with senior management of Fidelity's investment operations and investment groups. The Board considered the structure of the portfolio manager compensation program and whether this structure provides appropriate incentives to act in the best interests of the fund. Additionally, the Board considered the portfolio managers' investments, if any, in the funds that they manage.
Resources Dedicated to Investment Management and Support Services. The Board and the Fund Oversight and Research Committees reviewed the general qualifications and capabilities of Fidelity's investment staff, including its size, education, experience, and resources, as well as Fidelity's approach to recruiting, training, managing, and compensating investment personnel. The Board noted that Fidelity has continued to increase the resources devoted to non-U.S. offices, including expansion of Fidelity's global investment organization. The Board also noted that Fidelity's analysts have extensive resources, tools and capabilities that allow them to conduct sophisticated quantitative and fundamental analysis, as well as credit analysis of issuers, counterparties and guarantors. Further, the Board believes that Fidelity's investment professionals have sufficient access to global information and data so as to provide competitive investment results over time, and that those professionals also have access to sophisticated tools that permit them to assess portfolio construction and risk and performance attribution characteristics continuously, as well as to transmit new information and research conclusions rapidly around the world. Additionally, in its deliberations, the Board considered Fidelity's trading and risk management capabilities and resources and global compliance infrastructure, which are an integral part of the investment management process.
Annual Report
Shareholder and Administrative Services. The Board considered (i) the nature, extent, quality, and cost of advisory, administrative, and shareholder services performed by the Investment Advisers and their affiliates under the Advisory Contracts and under separate agreements covering transfer agency, pricing and bookkeeping, and securities lending services for the fund; (ii) the nature and extent of the supervision of third party service providers, principally custodians and subcustodians; and (iii) the resources devoted to, and the record of compliance with, the fund's compliance policies and procedures. The Board also reviewed the allocation of fund brokerage, including allocations to brokers affiliated with the Investment Advisers, the use of brokerage commissions to pay fund expenses, and the use of "soft" commission dollars to pay for research services.
The Board noted that the growth of fund assets over time across the complex allows Fidelity to reinvest in the development of services designed to enhance the value or convenience of the Fidelity funds as investment vehicles. These services include 24-hour access to account information and market information through telephone representatives and over the Internet, investor education materials and asset allocation tools, and the expanded availability of Fidelity Investor Centers.
In 2014, the Board formed an ad hoc Committee on Transfer Agency Fees to review the variety of transfer agency fee structures throughout the industry and Fidelity's competitive positioning with respect to industry participants.
Investment in a Large Fund Family. The Board considered the benefits to shareholders of investing in a Fidelity fund, including the benefits of investing in a fund that is part of a large family of funds offering a variety of investment disciplines and providing a large variety of mutual fund investor services. The Board noted that Fidelity had taken, or had made recommendations that resulted in the Fidelity funds taking, a number of actions over the previous year that benefited particular funds, including (i) continuing to dedicate additional resources to investment research and to the support of the senior management team that oversees asset management; (ii) persisting in efforts to enhance Fidelity's global research capabilities; (iii) launching new funds and making other enhancements to meet client needs for income-oriented solutions; (iv) reducing fund expenses for certain index funds; (v) continuing to launch dedicated lower cost underlying funds to meet portfolio construction needs related to expanding underlying fund options for Fidelity funds of funds, specifically for the Freedom Fund product lines; (vi) rationalizing product lines and gaining increased efficiencies through fund mergers; (vii) launching sector-based exchange-traded funds and establishing a new Fidelity adviser to manage sector-based funds and products; (viii) continuing to develop and implement technology to improve security and increase efficiency; (ix) modifying the eligibility criteria for certain share classes to increase their marketability to a portion of the defined contribution plan market; (x) waiving redemption fees for certain qualified fund-of-fund and wrap programs and certain retirement plan transactions; and (xi) launching new Institutional Class shares of certain money market funds to attract and retain assets and to fill a gap in the money market fund lineup.
Annual Report
Board Approval of Investment Advisory Contracts and
Management Fees - continued
Investment Performance. The Board considered whether the fund has operated in accordance with its investment objective, as well as its record of compliance with its investment restrictions and its performance history.
The Board took into account discussions with the Investment Advisers about fund investment performance that occur at Board meetings throughout the year. In this regard the Board noted that as part of regularly scheduled fund reviews and other reports to the Board on fund performance, the Board periodically considers annualized return information for the fund, for different time periods, measured against a securities market index ("benchmark index") and a peer group of funds with similar objectives ("peer group"). In its evaluation of fund investment performance, the Board gave particular attention to information indicating changes in performance of certain Fidelity funds for specific time periods and the Investment Advisers' explanations for any overperformance or underperformance.
In addition to reviewing absolute and relative fund performance, the Independent Trustees periodically consider the appropriateness of fund performance metrics in evaluating the results achieved. In general, the Independent Trustees believe that fund performance should be evaluated based on net performance (after fees and expenses) of both the highest performing and lowest performing classes, where applicable, compared to appropriate benchmark indices, over appropriate time periods which may include full market cycles, and compared to peer groups, as applicable, over the same periods, taking into account relevant factors including the following: general market conditions; issuer-specific information; tactical opportunities for investment; and fund cash flows and other factors.
The Independent Trustees recognize that shareholders evaluate performance on a net basis over their own holding periods, for which one-, three-, and five-year periods are often used as a proxy. For this reason, the performance information reviewed by the Board also included net cumulative calendar year total return information for the fund and an appropriate benchmark index and peer group for the most recent one-, three-, and five-year periods, as shown below. Returns are shown compared to the 25th percentile (top of box, 75% beaten) and 75th percentile (bottom of box, 25% beaten) of the peer universe. Returns of the benchmark index are "net MA," i.e., adjusted for tax withholding rates applicable to U.S.-based funds organized as Massachusetts business trusts.
Annual Report
Fidelity Advisor Overseas Fund
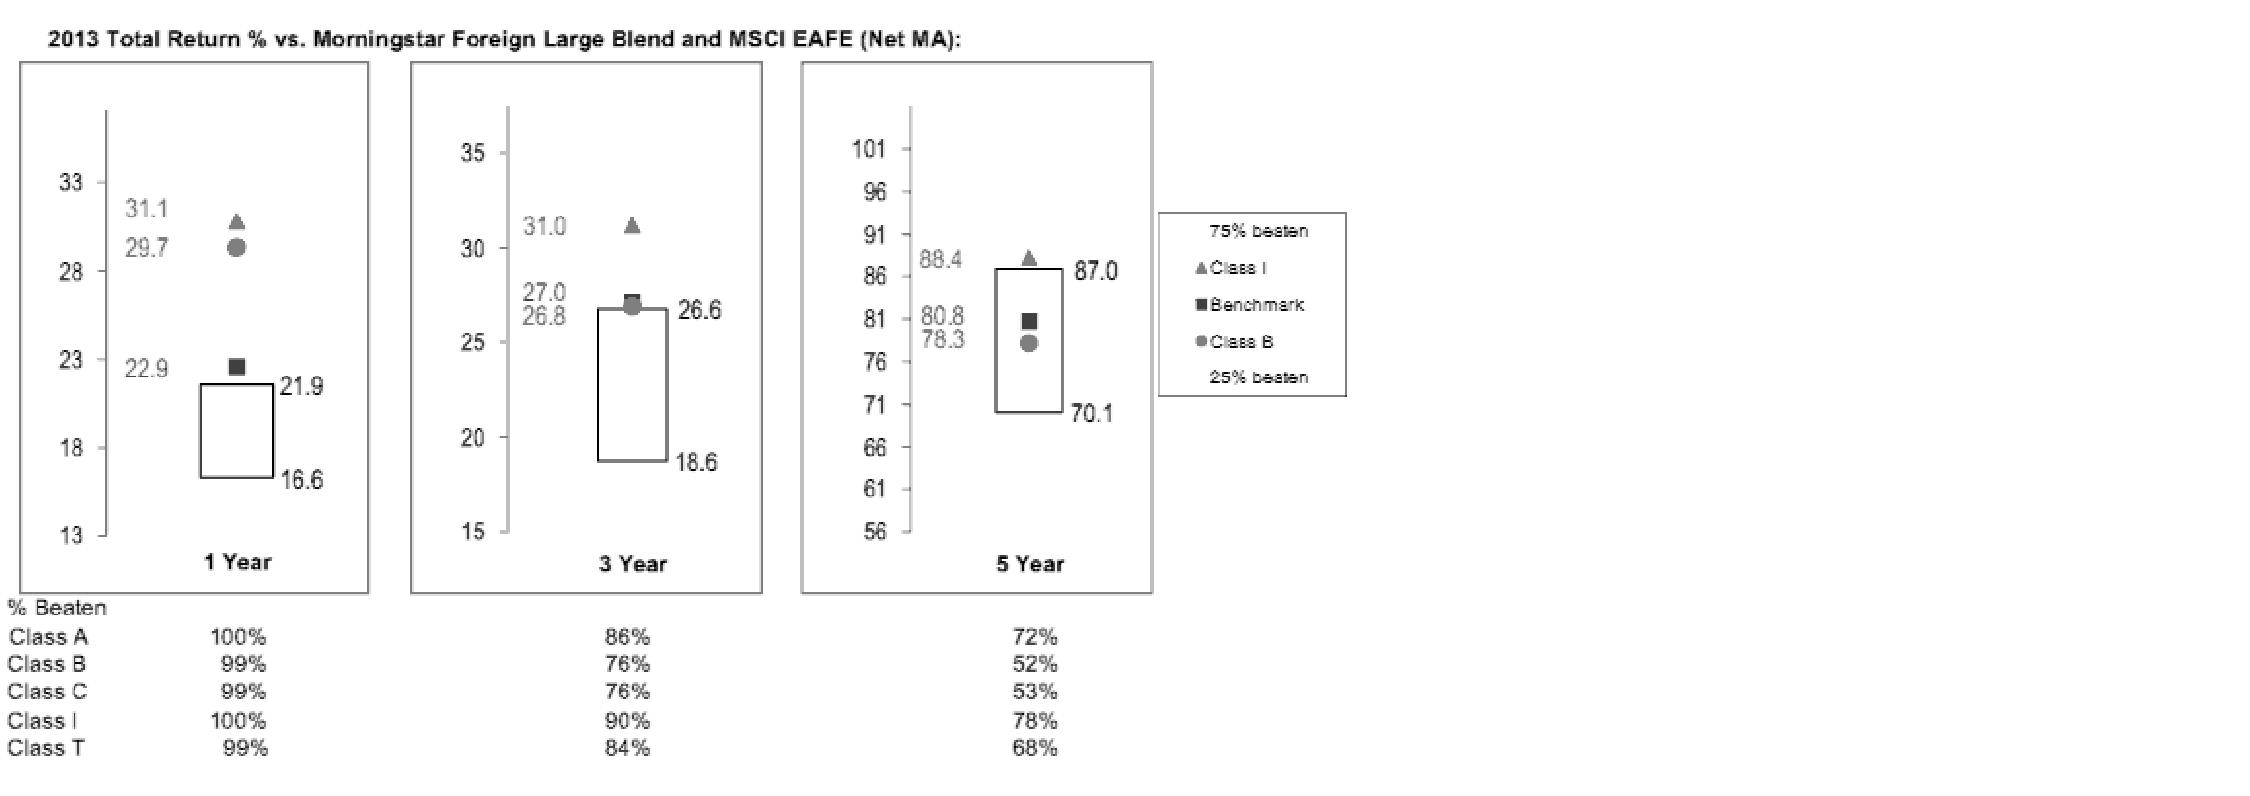
The Board also considered that the fund's management fee is subject to upward or downward adjustment depending upon whether, and to what extent, the fund's investment performance for the performance period exceeds, or is exceeded by, a securities index, thus leading to a performance adjustment for the same period. The Board noted that the performance adjustment provides FMR with a strong economic incentive to seek to achieve superior performance for the fund's shareholders and helps to more closely align the interests of FMR and the fund's shareholders.
Based on its review, the Board concluded that the nature, extent, and quality of services provided to the fund under the Advisory Contracts should benefit the fund's shareholders.
Competitiveness of Management Fee and Total Expense Ratio. The Board considered the fund's management fee and total expense ratio compared to "mapped groups" of competitive funds and classes. Fidelity creates "mapped groups" by combining similar Lipper investment objective categories that have comparable investment mandates. Combining Lipper investment objective categories aids the Board's management fee and total expense ratio comparisons by broadening the competitive group used for comparison and by reducing the number of universes to which various Fidelity funds are compared.
Management Fee. The Board considered two proprietary management fee comparisons for the 12-month periods shown in the chart below. The group of Lipper funds used by the Board for management fee comparisons is referred to below as the "Total Mapped Group." The Total Mapped Group comparison focuses on a fund's standing in terms of gross management fees before expense reimbursements or caps, and without giving effect to the fund's performance adjustment, relative to the total universe of funds with comparable investment mandates, regardless of whether their management fee structures also are comparable. Funds with comparable investment mandates offer exposure to similar types of securities. Funds with comparable management fee structures have similar management fee contractual arrangements (e.g., flat rate charged for advisory services, all-inclusive fee rate, etc.). "TMG %" represents the percentage of funds in the Total Mapped Group that had management fees that were lower than the fund's. For example, a hypothetical TMG % of 20% would mean that 80% of the funds in the Total Mapped Group had higher, and 20% had lower, management fees than the fund. The fund's actual TMG %s are in the chart below. The "Asset-Size Peer Group" (ASPG) comparison focuses on a fund's standing relative to a subset of non-Fidelity funds within the Total Mapped Group that are similar in size and management fee structure. For example, if a fund is in the first quartile of the ASPG, the fund's management fee ranks in the least expensive or lowest 25% of funds in the ASPG. The ASPG represents at least 15% of the funds in the Total Mapped Group with comparable asset size and management fee structures, subject to a minimum of 50 funds (or all funds in the Total Mapped Group if fewer than 50). Additional information, such as the ASPG quartile in which the fund's management fee rate ranked and the impact of the fund's performance adjustment, is also included in the chart and considered by the Board.
Annual Report
Board Approval of Investment Advisory Contracts and
Management Fees - continued
Fidelity Advisor Overseas Fund
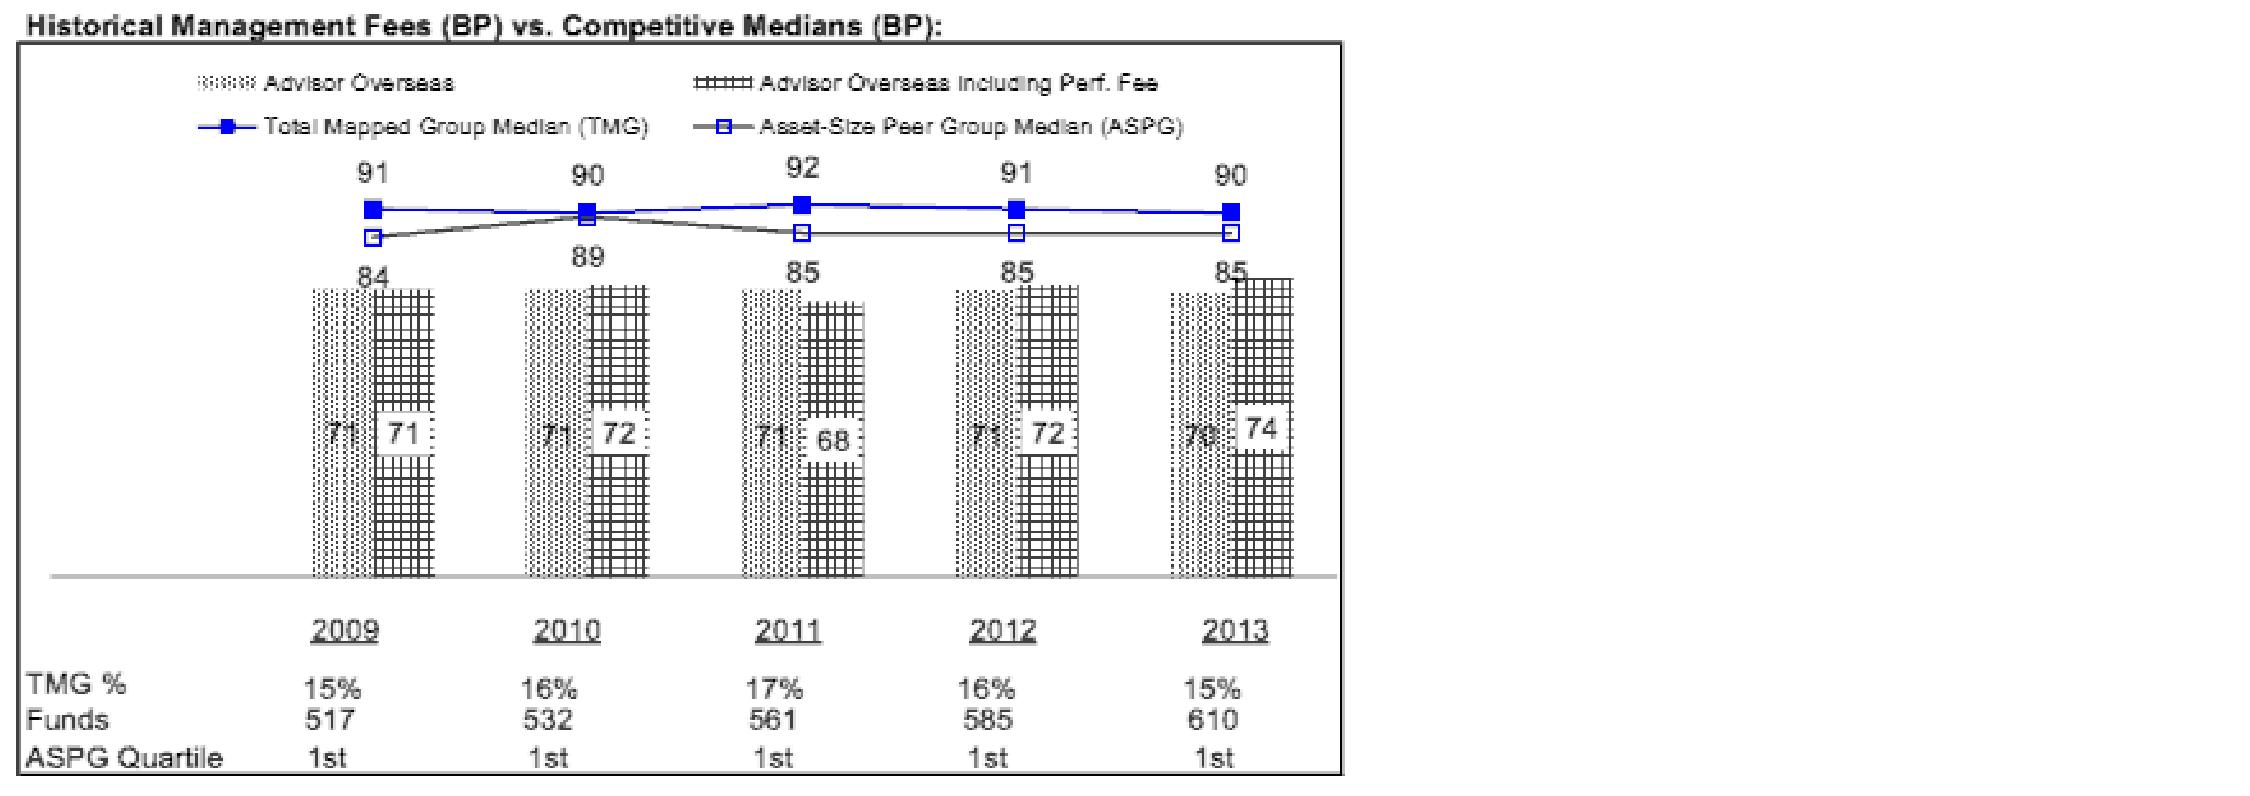
The Board noted that the fund's management fee rate ranked below the median of its Total Mapped Group and below the median of its ASPG for 2013. The Board also noted the effect of the fund's positive performance adjustment on the fund's management fee ranking.
Annual Report
Furthermore, the Board considered that, on July 16, 2014, after the periods shown in the chart above, it had approved a reduction (effective August 1, 2014) in the individual fund fee rate component of the management fee rate for the fund from 0.450% to 0.424%.
The Board also noted that, in August 2013, the ad hoc Committee on Management Fees was formed to conduct an in-depth review of the management fee rates of Fidelity's active equity mutual funds. The Committee focused on the following areas: (i) standard fee structures; (ii) research consumption and trading evolution; (iii) management fee competitiveness/profitability by category; and (iv) factors that drive institutional pricing.
Based on its review, the Board concluded that the fund's management fee is fair and reasonable in light of the services that the fund receives and the other factors considered.
Total Expense Ratio. In its review of each class's total expense ratio, the Board considered the fund's management fee as well as other fund or class expenses, as applicable, such as transfer agent fees, pricing and bookkeeping fees, fund-paid 12b-1 fees, and custodial, legal, and audit fees. The Board also noted the effects of any waivers and reimbursements on fees and expenses, as well as the impact of the fund's performance adjustment. As part of its review, the Board also considered the current and historical total expense ratios of each class of the fund compared to competitive fund median expenses. Each class of the fund is compared to those funds and classes in the Total Mapped Group (used by the Board for management fee comparisons) that have a similar sales load structure.
The Board noted that the total expense ratio of each of Class A, Class B, and Institutional Class ranked below its competitive median for 2013 and the total expense ratio of each of Class T and Class C ranked above its competitive median for 2013. The Board considered that, in general, various factors can affect total expense ratios. The Board noted that the total expense ratio of Class T was above the competitive median primarily because of higher 12b-1 fees on Class T as compared to most competitor funds. Class T has a higher 12b-1 fee, but a lower front-end sales charge, than traditionally priced front-end sales charge classes. The Board considered that Class T is primarily sold load-waived in the retirement plan market where its 0.50% 12b-1 fee is comparable to competing no-load, higher 12b-1 fee classes designed specifically for retirement plans. The Board noted that the fund offers multiple classes, each of which has a different sales load and 12b-1 fee structure, and that the multiple structures are intended to offer a range of pricing options for the intermediary market. The Board also noted that the total expense ratios of the classes vary primarily by the level of their 12b-1 fees, although differences in transfer agent fees may also cause expenses to vary from class to class.
Annual Report
Board Approval of Investment Advisory Contracts and
Management Fees - continued
Fees Charged to Other Fidelity Clients. The Board also considered Fidelity fee structures and other information with respect to clients of Fidelity, such as other funds advised or subadvised by Fidelity, pension plan clients, and other institutional clients. The Board noted the findings of the 2013 ad hoc joint committee (created with the board of other Fidelity funds), which reviewed and compared Fidelity's institutional investment advisory business with its business of providing services to the Fidelity funds, including the differences in services provided, fees charged, and costs incurred, as well as competition in their respective marketplaces.
Based on its review of total expense ratios and fees charged to other Fidelity clients, the Board concluded that the total expense ratio of each class of the fund was reasonable, although in some cases above the median of the universe presented for comparison, in light of the services that the fund and its shareholders receive and the other factors considered.
Costs of the Services and Profitability. The Board considered the revenues earned and the expenses incurred by Fidelity in conducting the business of developing, marketing, distributing, managing, administering and servicing the fund and servicing the fund's shareholders. The Board also considered the level of Fidelity's profits in respect of all the Fidelity funds.
On an annual basis, Fidelity presents to the Board Fidelity's profitability for the fund. Fidelity calculates the profitability for each fund, as well as aggregate profitability for groups of Fidelity funds and all Fidelity funds, using a series of detailed revenue and cost allocation methodologies which originate with the books and records of Fidelity on which Fidelity's audited financial statements are based. The Audit Committee of the Board reviews any significant changes from the prior year's methodologies.
PricewaterhouseCoopers LLP (PwC), independent registered public accounting firm and auditor to Fidelity and certain Fidelity funds, has been engaged annually by the Board as part of the Board's assessment of Fidelity's profitability analysis. PwC's engagement includes the review and assessment of the methodologies used by Fidelity in determining the revenues and expenses attributable to Fidelity's mutual fund business, and completion of agreed-upon procedures in respect of the mathematical accuracy of fund profitability and its conformity to established allocation methodologies. After considering PwC's reports issued under the engagement and information provided by Fidelity, the Board concluded that while other allocation methods may also be reasonable, Fidelity's profitability methodologies are reasonable in all material respects.
The Board also reviewed Fidelity's non-fund businesses and fall-out benefits related to the mutual fund business as well as cases where Fidelity's affiliates may benefit from or be related to the fund's business.
Annual Report
The Board considered the costs of the services provided by and the profits realized by Fidelity in connection with the operation of the fund and was satisfied that the profitability was not excessive in the circumstances.
Economies of Scale. The Board considered whether there have been economies of scale in respect of the management of the Fidelity funds, whether the Fidelity funds (including the fund) have appropriately benefited from any such economies of scale, and whether there is potential for realization of any further economies of scale. The Board considered the extent to which the fund will benefit from economies of scale through increased services to the fund, through waivers or reimbursements, or through fee or expense ratio reductions. The Board also noted that in 2013, it and the boards of other Fidelity funds created an ad hoc committee (the Economies of Scale Committee) to analyze whether Fidelity attains economies of scale in respect of the management and servicing of the Fidelity funds, whether the Fidelity funds have appropriately benefited from such economies of scale, and whether there is potential for realization of any further economies of scale.
The Board recognized that the fund's management contract incorporates a "group fee" structure, which provides for lower group fee rates as total group assets increase, and for higher group fee rates as total group assets decrease (with "group assets" defined to include fund assets under FMR's management plus sector fund assets previously under FMR's management and currently managed by Fidelity SelectCo, LLC). FMR calculates the group fee rates based on a tiered asset "breakpoint" schedule that varies based on asset class. The Board considered that the group fee is designed to deliver the benefits of economies of scale to fund shareholders when total Fidelity fund assets increase, even if assets of any particular fund are unchanged or have declined, because some portion of Fidelity's costs are attributable to services provided to all Fidelity funds, and all funds benefit if those costs can be allocated among more assets. The Board concluded that, given the group fee structure, fund shareholders will benefit from lower management fees as group assets increase at the fund complex level, regardless of whether Fidelity achieves any such economies of scale.
The Board concluded, taking into account the analysis of the Economies of Scale Committee, that economies of scale, if any, are being appropriately shared between fund shareholders and Fidelity.
Additional Information Requested by the Board. In order to develop fully the factual basis for consideration of the Fidelity funds' Advisory Contracts, the Board requested and received additional information on certain topics, including: (i) fund performance trends and Fidelity's long-term strategies for certain funds; (ii) Fidelity's strategic marketing and product lineup goals; (iii) the methodology with respect to competitive fund data and peer group classifications; (iv) the arrangements with, and performance of, certain sub-advisers on behalf of the Fidelity funds, as well as certain proposed participating affiliate arrangements; (v) the realization of fall-out benefits in certain Fidelity business units; (vi) Fidelity's group fee structures, including the rationale for the individual fee rates of certain categories of funds and the definition of group assets; (vii) trends regarding industry use of performance fee structures and the performance adjustment methodologies applicable to the Fidelity funds; (viii) additional competitive analysis regarding the total expenses for certain classes; (ix) fund profitability methodology, including Fidelity's cost allocation methodology, and the impact of certain factors on fund profitability results; and (x) the process by which Fidelity determines sub-advisory fees for funds it advises.
Annual Report
Board Approval of Investment Advisory Contracts and
Management Fees - continued
Based on its evaluation of all of the conclusions noted above, and after considering all factors it believed relevant, the Board ultimately concluded that the advisory fee structures are fair and reasonable, and that the fund's Advisory Contracts should be renewed.
Annual Report
Investment Adviser
Fidelity Management & Research Company
Boston, MA
Investment Sub-Advisers
FMR Co., Inc.
Fidelity Management & Research
(U.K.) Inc.
Fidelity Management & Research
(Hong Kong) Limited
Fidelity Management & Research (Japan) Limited
FIL Investment Advisors (UK) Limited
FIL Investments (Japan) Limited
FIL Investment Advisors
General Distributor
Fidelity Distributors Corporation
Smithfield, RI
Transfer and Service Agents
Fidelity Investments Institutional Operations Company, Inc.
Boston, MA
Fidelity Service Company, Inc.
Boston, MA
Custodian
The Northern Trust Company
Chicago, IL
(Fidelity Investment logo)(registered trademark)
OSI-UANN-1214
1.784768.111
(Fidelity Investment logo)(registered trademark)
Fidelity Advisor®
Value Leaders
Fund - Class A, Class T, Class B
and Class C
Annual Report
October 31, 2014
(Fidelity Cover Art)
Contents
Performance | (Click Here) | How the fund has done over time. |
Management's Discussion of Fund Performance | (Click Here) | The Portfolio Manager's review of fund performance and strategy. |
Shareholder Expense Example | (Click Here) | An example of shareholder expenses. |
Investment Changes | (Click Here) | A summary of major shifts in the fund's investments over the past six months. |
Investments | (Click Here) | A complete list of the fund's investments with their market values. |
Financial Statements | (Click Here) | Statements of assets and liabilities, operations, and changes in net assets, as well as financial highlights. |
Notes | (Click Here) | Notes to the financial statements. |
Report of Independent Registered Public Accounting Firm | (Click Here) | |
Trustees and Officers | (Click Here) | |
Board Approval of Investment Advisory Contracts and Management Fees | (Click Here) | |
To view a fund's proxy voting guidelines and proxy voting record for the 12-month period ended June 30, visit http://www.fidelity.com/proxyvotingresults or visit the Securities and Exchange Commission's (SEC) web site at http://www.sec.gov. You may also call 1-877-208-0098 to request a free copy of the proxy voting guidelines.
Standard & Poor's, S&P and S&P 500 are registered service marks of The McGraw-Hill Companies, Inc. and have been licensed for use by Fidelity Distributors Corporation.
Other third-party marks appearing herein are the property of their respective owners.
All other marks appearing herein are registered or unregistered trademarks or service marks of FMR LLC or an affiliated company. © 2014 FMR LLC. All rights reserved.
Annual Report
This report and the financial statements contained herein are submitted for the general information of the shareholders of the fund. This report is not authorized for distribution to prospective investors in the fund unless preceded or accompanied by an effective prospectus.
A fund files its complete schedule of portfolio holdings with the SEC for the first and third quarters of each fiscal year on Form N-Q. Forms N-Q are available on the SEC's web site at http://www.sec.gov. A fund's Forms N-Q may be reviewed and copied at the SEC's Public Reference Room in Washington, DC. Information regarding the operation of the SEC's Public Reference Room may be obtained by calling 1-800-SEC-0330. For a complete list of a fund's portfolio holdings, view the most recent holdings listing, semiannual report, or annual report on Fidelity's web site at http://www.fidelity.com, http://www.advisor.fidelity.com, or http://www.401k.com, as applicable.
NOT FDIC INSURED • MAY LOSE VALUE • NO BANK GUARANTEE
Neither the fund nor Fidelity Distributors Corporation is a bank.
Annual Report
Average annual total return reflects the change in the value of an investment, assuming reinvestment of the class' distributions from dividend income and capital gains (the profits earned upon the sale of securities that have grown in value, if any) and assuming a constant rate of performance each year. The $10,000 table and the fund's returns do not reflect the deduction of taxes that a shareholder would pay on fund distributions or the redemption of fund shares. During periods of reimbursement by Fidelity, a fund's total return will be greater than it would be had the reimbursement not occurred. How a fund did yesterday is no guarantee of how it will do tomorrow. Returns reflect the conversion of Class B shares to Class A shares after a maximum of seven years.
Average Annual Total Returns
Periods ended October 31, 2014 | Past 1
year | Past 5
years | Past 10 years |
Class A (incl. 5.75% sales charge) | 8.39% | 11.02% | 4.63% |
Class T (incl. 3.50% sales charge) | 10.75% | 11.28% | 4.61% |
Class B (incl. contingent deferred sales charge) A | 9.19% | 11.26% | 4.68% |
Class C (incl. contingent deferred sales charge) B | 13.21% | 11.52% | 4.46% |
A Class B shares' contingent deferred sales charges included in the past one year, past five years, and past ten years total return figures are 5%, 2%, and 0%, respectively.
B Class C shares' contingent deferred sales charges included in the past one year, past five years, and past ten years total return figures are 1%, 0%, and 0%, respectively.
Annual Report
$10,000 Over 10 Years
Let's say hypothetically that $10,000 was invested in Fidelity Advisor® Value Leaders Fund - Class A on October 31, 2004, and the current 5.75% sales charge was paid. The chart shows how the value of your investment would have changed, and also shows how the Russell 1000® Value Index performed over the same period.
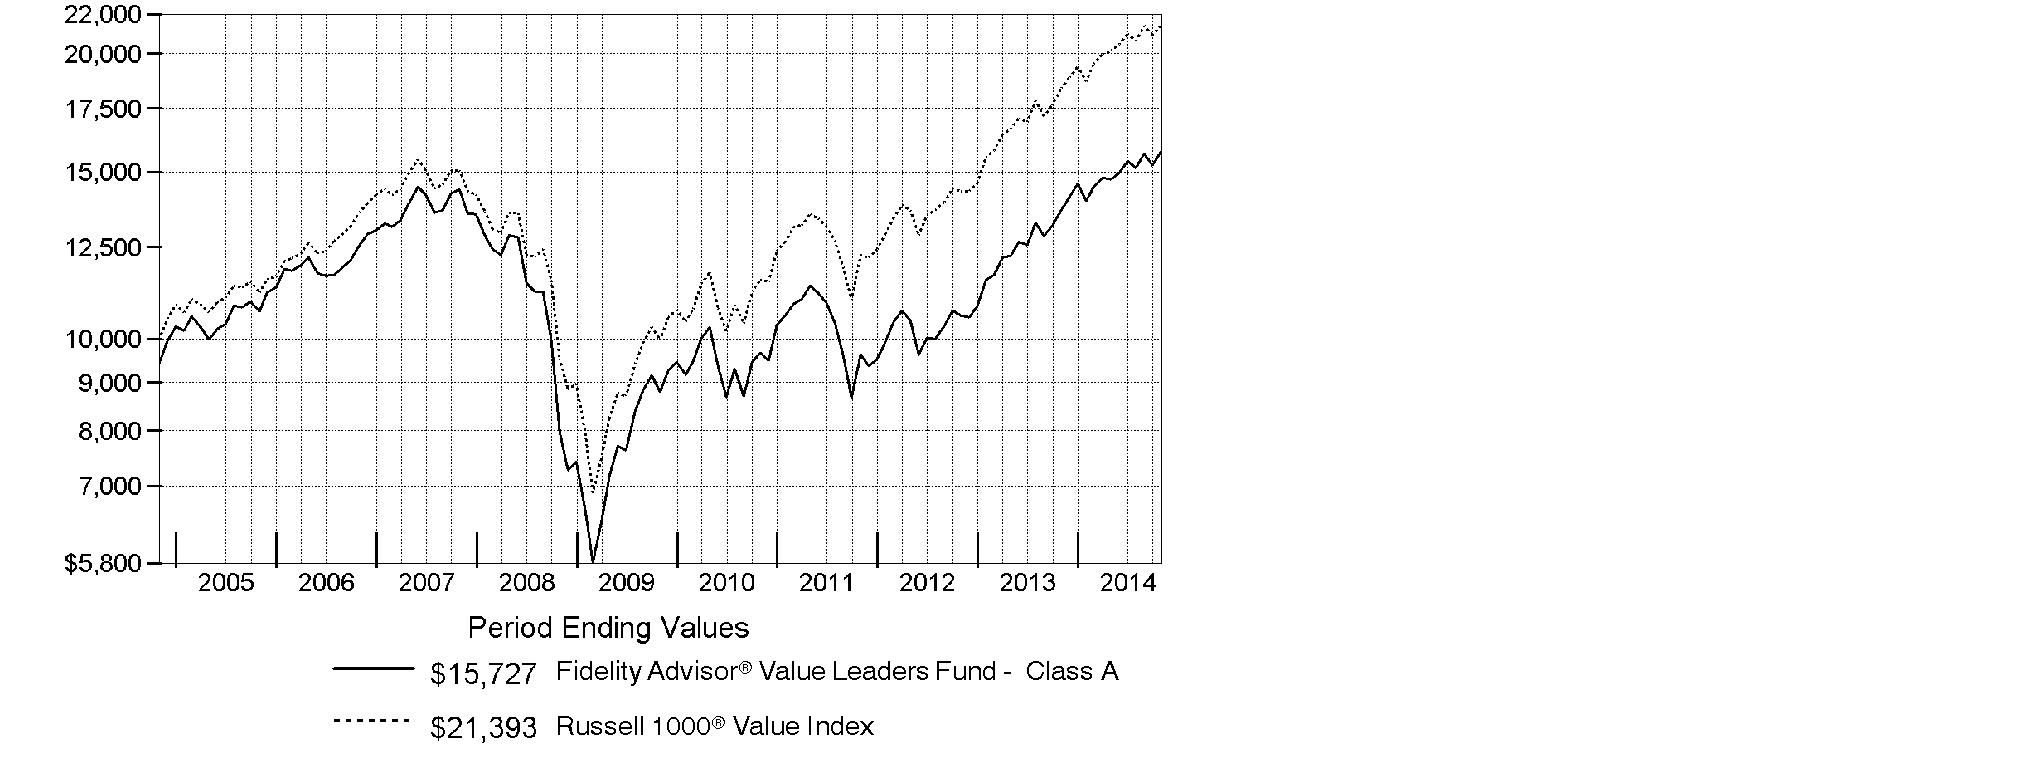
Annual Report
Market Recap: The U.S. market nearly closed at an all-time high for the 12 months ending October 31, 2014, supported by low interest rates and strong corporate profits. The large-cap S&P 500® Index gained 17.27%, clawing back from an October sell-off fueled by fears of a new global economic slump. Growth stocks in the index outperformed value-oriented names. The tech-heavy Nasdaq Composite Index® advanced 19.58%, while the small-cap Russell 2000® Index returned a relatively lackluster 8.06% amid growth and valuation worries. Health care (+30%) was the top sector in the S&P 500®, spurred partly by the pharmaceuticals, biotechnology & life sciences industry. Information technology (+26%) also outperformed. Conversely, energy (+4%) lagged the index, reflecting a sharp drop in crude prices beginning in June, attributed to weaker demand and a U.S. shale-drilling supply boom. Industrials (+15%) and consumer discretionary (+9%) - sectors that tend to rise and fall with economic expectations - also trailed the broader market. Volatility was tame for much of the period but spiked to a three-year high in October amid growth concerns, Ebola fears and continued unrest in Syria, Iraq and Ukraine. Stocks finished the period strongly, however, bolstered by the relative economic strength of the U.S., which marked a six-year low in its unemployment rate.
Comments from Sean Gavin, who became Portfolio Manager of Fidelity Advisor® Value Leaders Fund on October 1, 2014: For the year, the fund's Class A, Class T, Class B and Class C shares rose 15.00%, 14.76%, 14.19% and 14.21%, respectively (excluding sales charges), lagging the 16.46% advance of the benchmark Russell 1000® Value Index. Relative to the benchmark, the fund was hampered the most by security selection in the materials sector. The fund's average cash stake of about 5% also weighed on our result, although I was able to put most of that cash to work in the period's final month. On the positive side, security selection in telecommunication services and health care added value, including Israeli drugmaker Teva Pharmaceutical Industries and biotechnology company Amgen. On the negative side in health care, however, the fund was hampered by a position in Ireland-based specialty pharmaceuticals maker Shire. In mid-October, the market reacted poorly to news that a U.S. competitor, AbbVie, would not acquire Shire after all. I took advantage of the significant share-price drop to establish a stake, as I still saw good value in Shire. Other notable detractors included software maker Comverse and gold producer Newmont Mining, the latter of which was not in the benchmark, along with Teva and Shire. Comverse and Newmont Mining were not held at period end.
The views expressed above reflect those of the portfolio manager(s) only through the end of the period as stated on the cover of this report and do not necessarily represent the views of Fidelity or any other person in the Fidelity organization. Any such views are subject to change at any time based upon market or other conditions and Fidelity disclaims any responsibility to update such views. These views may not be relied on as investment advice and, because investment decisions for a Fidelity fund are based on numerous factors, may not be relied on as an indication of trading intent on behalf of any Fidelity fund.
Annual Report
Shareholder Expense Example
As a shareholder of the Fund, you incur two types of costs: (1) transaction costs, including sales charges (loads) on purchase payments or redemption proceeds, and (2) ongoing costs, including management fees, distribution and/or service (12b-1) fees and other Fund expenses. This Example is intended to help you understand your ongoing costs (in dollars) of investing in the Fund and to compare these costs with the ongoing costs of investing in other mutual funds.
The Example is based on an investment of $1,000 invested at the beginning of the period and held for the entire period (May 1, 2014 to October 31, 2014).
Actual Expenses
The first line of the accompanying table for each class of the Fund provides information about actual account values and actual expenses. You may use the information in this line, together with the amount you invested, to estimate the expenses that you paid over the period. Simply divide your account value by $1,000.00 (for example, an $8,600 account value divided by $1,000.00 = 8.6), then multiply the result by the number in the first line for a class of the Fund under the heading entitled "Expenses Paid During Period" to estimate the expenses you paid on your account during this period. In addition, the Fund, as a shareholder in the underlying Fidelity Central Funds, will indirectly bear its pro-rata share of the fees and expenses incurred by the underlying Fidelity Central Funds. These fees and expenses are not included in the Fund's annualized expense ratio used to calculate the expense estimate in the table below.
Hypothetical Example for Comparison Purposes
The second line of the accompanying table for each class of the Fund provides information about hypothetical account values and hypothetical expenses based on a Class' actual expense ratio and an assumed rate of return of 5% per year before expenses, which is not the Class' actual return. The hypothetical account values and expenses may not be used to estimate the actual ending account balance or expenses you paid for the period. You may use this information to compare the ongoing costs of investing in the Fund and other funds. To do so, compare this 5% hypothetical example with the 5% hypothetical examples that appear in the shareholder reports of the other funds. In addition, the Fund, as a shareholder in the underlying Fidelity Central Funds, will indirectly bear its pro-rata share of the fees and expenses incurred by the underlying Fidelity Central Funds. These fees and expenses are not included in the Fund's annualized expense ratio used to calculate the expense estimate in the table below.
Please note that the expenses shown in the table are meant to highlight your ongoing costs only and do not reflect any transaction costs. Therefore, the second line of the table is useful in comparing ongoing costs only, and will not help you determine the relative total costs of owning different funds. In addition, if these transactional costs were included, your costs would have been higher.
Annual Report
| Annualized
Expense RatioB | Beginning
Account Value
May 1, 2014 | Ending
Account Value
October 31, 2014 | Expenses Paid
During Period*
May 1, 2014 to
October 31, 2014 |
Class A | 1.25% | | | |
Actual | | $ 1,000.00 | $ 1,069.10 | $ 6.52 |
HypotheticalA | | $ 1,000.00 | $ 1,018.90 | $ 6.36 |
Class T | 1.50% | | | |
Actual | | $ 1,000.00 | $ 1,067.70 | $ 7.82 |
HypotheticalA | | $ 1,000.00 | $ 1,017.64 | $ 7.63 |
Class B | 2.00% | | | |
Actual | | $ 1,000.00 | $ 1,065.20 | $ 10.41 |
HypotheticalA | | $ 1,000.00 | $ 1,015.12 | $ 10.16 |
Class C | 2.00% | | | |
Actual | | $ 1,000.00 | $ 1,065.20 | $ 10.41 |
HypotheticalA | | $ 1,000.00 | $ 1,015.12 | $ 10.16 |
Institutional Class | 1.00% | | | |
Actual | | $ 1,000.00 | $ 1,070.60 | $ 5.22 |
HypotheticalA | | $ 1,000.00 | $ 1,020.16 | $ 5.09 |
A 5% return per year before expenses
B Annualized expense ratio reflects expenses net of applicable fee waivers.
* Expenses are equal to each Class' annualized expense ratio, multiplied by the average account value over the period, multiplied by 184/365 (to reflect the one-half year period).
Annual Report
Investment Changes (Unaudited)
Top Ten Stocks as of October 31, 2014 |
| % of fund's
net assets | % of fund's net assets
6 months ago |
Covidien PLC | 3.8 | 0.0 |
Samsung Electronics Co. Ltd. | 3.6 | 0.0 |
Teva Pharmaceutical Industries Ltd. sponsored ADR | 3.6 | 0.6 |
Oracle Corp. | 3.4 | 0.0 |
Berkshire Hathaway, Inc. Class B | 3.4 | 0.0 |
Chevron Corp. | 3.4 | 1.1 |
EMC Corp. | 3.4 | 0.0 |
Wells Fargo & Co. | 3.0 | 1.9 |
JPMorgan Chase & Co. | 2.9 | 2.8 |
Amgen, Inc. | 2.8 | 0.0 |
| 33.3 | |
Top Five Market Sectors as of October 31, 2014 |
| % of fund's
net assets | % of fund's net assets
6 months ago |
Financials | 26.8 | 25.5 |
Health Care | 21.4 | 13.3 |
Information Technology | 15.3 | 13.6 |
Consumer Discretionary | 12.3 | 5.2 |
Energy | 9.3 | 14.2 |
Asset Allocation (% of fund's net assets) |
As of October 31, 2014 * | As of April 30, 2014 ** |
 | Stocks 98.5% | | | Stocks 93.9% | |
 | Short-Term
Investments and
Net Other Assets (Liabilities) 1.5% | | | Short-Term
Investments and
Net Other Assets (Liabilities) 6.1% | |
* Foreign investments | 20.7% | | ** Foreign investments | 3.4% | |

Annual Report
Investments October 31, 2014
Showing Percentage of Net Assets
Common Stocks - 98.5% |
| Shares | | Value |
CONSUMER DISCRETIONARY - 12.3% |
Media - 6.8% |
DIRECTV (a) | 6,000 | | $ 520,740 |
Time Warner Cable, Inc. | 5,300 | | 780,213 |
Viacom, Inc. Class B (non-vtg.) | 9,200 | | 668,656 |
| | 1,969,609 |
Specialty Retail - 5.5% |
AutoZone, Inc. (a) | 1,400 | | 774,928 |
Bed Bath & Beyond, Inc. (a) | 5,400 | | 363,636 |
GNC Holdings, Inc. | 11,000 | | 457,270 |
| | 1,595,834 |
TOTAL CONSUMER DISCRETIONARY | | 3,565,443 |
CONSUMER STAPLES - 4.3% |
Food & Staples Retailing - 4.3% |
CVS Health Corp. | 7,090 | | 608,393 |
Kroger Co. | 11,300 | | 629,523 |
| | 1,237,916 |
ENERGY - 9.3% |
Energy Equipment & Services - 1.4% |
BW Offshore Ltd. | 326,500 | | 400,322 |
Oil, Gas & Consumable Fuels - 7.9% |
Chevron Corp. | 8,225 | | 986,589 |
Marathon Petroleum Corp. | 7,500 | | 681,750 |
Suncor Energy, Inc. | 17,600 | | 624,952 |
| | 2,293,291 |
TOTAL ENERGY | | 2,693,613 |
FINANCIALS - 26.8% |
Banks - 7.9% |
JPMorgan Chase & Co. | 14,025 | | 848,232 |
U.S. Bancorp | 13,571 | | 578,125 |
Wells Fargo & Co. | 16,426 | | 872,056 |
| | 2,298,413 |
Capital Markets - 2.5% |
Fortress Investment Group LLC | 50,900 | | 382,768 |
The Blackstone Group LP | 11,200 | | 337,344 |
| | 720,112 |
Common Stocks - continued |
| Shares | | Value |
FINANCIALS - continued |
Consumer Finance - 1.5% |
Capital One Financial Corp. | 5,200 | | $ 430,404 |
Diversified Financial Services - 3.4% |
Berkshire Hathaway, Inc. Class B (a) | 7,100 | | 995,136 |
Insurance - 7.9% |
ACE Ltd. | 4,700 | | 513,710 |
Allstate Corp. | 8,040 | | 521,394 |
Prudential PLC | 31,240 | | 723,394 |
The Travelers Companies, Inc. | 5,300 | | 534,240 |
| | 2,292,738 |
Real Estate Investment Trusts - 3.6% |
American Capital Agency Corp. | 16,500 | | 375,210 |
Annaly Capital Management, Inc. | 58,500 | | 667,485 |
| | 1,042,695 |
TOTAL FINANCIALS | | 7,779,498 |
HEALTH CARE - 21.4% |
Biotechnology - 2.8% |
Amgen, Inc. | 4,900 | | 794,682 |
Health Care Equipment & Supplies - 4.6% |
Covidien PLC | 12,100 | | 1,118,524 |
Medtronic, Inc. | 3,300 | | 224,928 |
| | 1,343,452 |
Health Care Providers & Services - 6.8% |
Cigna Corp. | 7,700 | | 766,689 |
Express Scripts Holding Co. (a) | 5,400 | | 414,828 |
UnitedHealth Group, Inc. | 8,200 | | 779,082 |
| | 1,960,599 |
Pharmaceuticals - 7.2% |
AbbVie, Inc. | 8,300 | | 526,718 |
Shire PLC | 7,900 | | 530,066 |
Teva Pharmaceutical Industries Ltd. sponsored ADR | 18,400 | | 1,039,048 |
| | 2,095,832 |
TOTAL HEALTH CARE | | 6,194,565 |
INDUSTRIALS - 5.6% |
Aerospace & Defense - 2.5% |
United Technologies Corp. | 6,700 | | 716,900 |
Common Stocks - continued |
| Shares | | Value |
INDUSTRIALS - continued |
Machinery - 2.1% |
Deere & Co. | 7,200 | | $ 615,888 |
Professional Services - 1.0% |
Dun & Bradstreet Corp. | 2,400 | | 294,744 |
TOTAL INDUSTRIALS | | 1,627,532 |
INFORMATION TECHNOLOGY - 15.3% |
Communications Equipment - 2.4% |
Cisco Systems, Inc. | 28,064 | | 686,726 |
IT Services - 2.5% |
IBM Corp. | 2,100 | | 345,240 |
The Western Union Co. | 22,000 | | 373,120 |
| | 718,360 |
Software - 3.4% |
Oracle Corp. | 25,700 | | 1,003,585 |
Technology Hardware, Storage & Peripherals - 7.0% |
EMC Corp. | 34,300 | | 985,439 |
Samsung Electronics Co. Ltd. | 911 | | 1,054,762 |
| | 2,040,201 |
TOTAL INFORMATION TECHNOLOGY | | 4,448,872 |
MATERIALS - 2.2% |
Chemicals - 2.2% |
CF Industries Holdings, Inc. | 2,500 | | 650,000 |
UTILITIES - 1.3% |
Multi-Utilities - 1.3% |
CMS Energy Corp. | 11,600 | | 378,972 |
TOTAL COMMON STOCKS (Cost $27,056,985) |
28,576,411
|
U.S. Treasury Obligations - 0.0% |
| Principal Amount | | |
U.S. Treasury Bills, yield at date of purchase 0.01% 12/11/14
(Cost $10,000) | | $ 10,000 | |
10,000
|
Money Market Funds - 1.3% |
| Shares | | Value |
Fidelity Cash Central Fund, 0.11% (b)
(Cost $363,861) | 363,861 | | $ 363,861 |
TOTAL INVESTMENT PORTFOLIO - 99.8% (Cost $27,430,846) | | 28,950,272 |
NET OTHER ASSETS (LIABILITIES) - 0.2% | | 60,478 |
NET ASSETS - 100% | $ 29,010,750 |
Legend |
(a) Non-income producing |
(b) Affiliated fund that is generally available only to investment companies and other accounts managed by Fidelity Investments. The rate quoted is the annualized seven-day yield of the fund at period end. A complete unaudited listing of the fund's holdings as of its most recent quarter end is available upon request. In addition, each Fidelity Central Fund's financial statements, which are not covered by the Fund's Report of Independent Registered Public Accounting Firm, are available on the SEC's website or upon request. |
Affiliated Central Funds |
Information regarding fiscal year to date income earned by the Fund from investments in Fidelity Central Funds is as follows: |
Fund | Income earned |
Fidelity Cash Central Fund | $ 1,729 |
Fidelity Securities Lending Cash Central Fund | 293 |
Total | $ 2,022 |
Other Information |
The following is a summary of the inputs used, as of October 31, 2014, involving the Fund's assets and liabilities carried at fair value. The inputs or methodology used for valuing securities may not be an indication of the risk associated with investing in those securities. For more information on valuation inputs, and their aggregation into the levels used in the table below, please refer to the Investment Valuation section in the accompanying Notes to Financial Statements. |
Valuation Inputs at Reporting Date: |
Description | Total | Level 1 | Level 2 | Level 3 |
Investments in Securities: | | | | |
Equities: | | | | |
Consumer Discretionary | $ 3,565,443 | $ 3,565,443 | $ - | $ - |
Consumer Staples | 1,237,916 | 1,237,916 | - | - |
Energy | 2,693,613 | 2,693,613 | - | - |
Financials | 7,779,498 | 7,056,104 | 723,394 | - |
Health Care | 6,194,565 | 5,664,499 | 530,066 | - |
Industrials | 1,627,532 | 1,627,532 | - | - |
Information Technology | 4,448,872 | 4,448,872 | - | - |
Materials | 650,000 | 650,000 | - | - |
Utilities | 378,972 | 378,972 | - | - |
U.S. Government and Government Agency Obligations | 10,000 | - | 10,000 | - |
Money Market Funds | 363,861 | 363,861 | - | - |
Total Investments in Securities: | $ 28,950,272 | $ 27,686,812 | $ 1,263,460 | $ - |
Distribution of investments by country or territory of incorporation, as a percentage of total net assets, is as follows (Unaudited): |
United States of America | 79.3% |
Ireland | 3.8% |
Korea (South) | 3.6% |
Israel | 3.6% |
United Kingdom | 2.5% |
Canada | 2.2% |
Bailiwick of Jersey | 1.8% |
Switzerland | 1.8% |
Bermuda | 1.4% |
| 100.0% |
See accompanying notes which are an integral part of the financial statements.
Annual Report
Statement of Assets and Liabilities
| October 31, 2014 |
| | |
Assets | | |
Investment in securities, at value - See accompanying schedule: Unaffiliated issuers (cost $27,066,985) | $ 28,586,411 | |
Fidelity Central Funds (cost $363,861) | 363,861 | |
Total Investments (cost $27,430,846) | | $ 28,950,272 |
Receivable for investments sold | | 230,679 |
Receivable for fund shares sold | | 34,309 |
Dividends receivable | | 24,166 |
Distributions receivable from Fidelity Central Funds | | 46 |
Prepaid expenses | | 79 |
Other receivables | | 103 |
Total assets | | 29,239,654 |
| | |
Liabilities | | |
Payable for investments purchased | $ 100,155 | |
Payable for fund shares redeemed | 58,981 | |
Accrued management fee | 11,536 | |
Distribution and service plan fees payable | 10,117 | |
Other affiliated payables | 7,353 | |
Other payables and accrued expenses | 40,762 | |
Total liabilities | | 228,904 |
| | |
Net Assets | | $ 29,010,750 |
Net Assets consist of: | | |
Paid in capital | | $ 53,968,888 |
Undistributed net investment income | | 124,802 |
Accumulated undistributed net realized gain (loss) on investments and foreign currency transactions | | (26,602,366) |
Net unrealized appreciation (depreciation) on investments | | 1,519,426 |
Net Assets | | $ 29,010,750 |
See accompanying notes which are an integral part of the financial statements.
Annual Report
Financial Statements - continued
Statement of Assets and Liabilities - continued
| October 31, 2014 |
| | |
Calculation of Maximum Offering Price
Class A:
Net Asset Value and redemption price per share
($15,066,801 ÷ 953,948 shares) | | $ 15.79 |
| | |
Maximum offering price per share (100/94.25 of $15.79) | | $ 16.75 |
Class T:
Net Asset Value and redemption price per share ($7,818,923 ÷ 495,431 shares) | | $ 15.78 |
| | |
Maximum offering price per share (100/96.50 of $15.78) | | $ 16.35 |
Class B:
Net Asset Value and offering price per share ($406,198 ÷ 26,150 shares)A | | $ 15.53 |
| | |
Class C:
Net Asset Value and offering price per share ($4,457,622 ÷ 290,427 shares)A | | $ 15.35 |
| | |
Institutional Class:
Net Asset Value, offering price and redemption price per share ($1,261,206 ÷ 79,152 shares) | | $ 15.93 |
A Redemption price per share is equal to net asset value less any applicable contingent deferred sales charge.
See accompanying notes which are an integral part of the financial statements.
Annual Report
Statement of Operations
| Year ended October 31, 2014 |
| | |
Investment Income | | |
Dividends | | $ 624,105 |
Interest | | 5 |
Income from Fidelity Central Funds | | 2,022 |
Total income | | 626,132 |
| | |
Expenses | | |
Management fee
Basic fee | $ 169,630 | |
Performance adjustment | (58,424) | |
Transfer agent fees | 80,979 | |
Distribution and service plan fees | 130,637 | |
Accounting and security lending fees | 12,026 | |
Custodian fees and expenses | 13,736 | |
Independent trustees' compensation | 127 | |
Registration fees | 57,762 | |
Audit | 49,991 | |
Legal | 169 | |
Miscellaneous | 507 | |
Total expenses before reductions | 457,140 | |
Expense reductions | (18,579) | 438,561 |
Net investment income (loss) | | 187,571 |
Realized and Unrealized Gain (Loss) Net realized gain (loss) on: | | |
Investment securities: | | |
Unaffiliated issuers | 4,943,799 | |
Foreign currency transactions | (2,722) | |
Futures contracts | (19,513) | |
Total net realized gain (loss) | | 4,921,564 |
Change in net unrealized appreciation (depreciation) on: Investment securities | (896,610) | |
Assets and liabilities in foreign currencies | (1) | |
Futures contracts | (12,341) | |
Total change in net unrealized appreciation (depreciation) | | (908,952) |
Net gain (loss) | | 4,012,612 |
Net increase (decrease) in net assets resulting from operations | | $ 4,200,183 |
See accompanying notes which are an integral part of the financial statements.
Annual Report
Financial Statements - continued
Statement of Changes in Net Assets
| Year ended
October 31,
2014 | Year ended
October 31,
2013 |
Increase (Decrease) in Net Assets | | |
Operations | | |
Net investment income (loss) | $ 187,571 | $ 176,674 |
Net realized gain (loss) | 4,921,564 | 3,425,945 |
Change in net unrealized appreciation (depreciation) | (908,952) | 3,254,893 |
Net increase (decrease) in net assets resulting
from operations | 4,200,183 | 6,857,512 |
Distributions to shareholders from net investment income | - | (419,258) |
Share transactions - net increase (decrease) | (3,923,371) | (3,943,841) |
Total increase (decrease) in net assets | 276,812 | 2,494,413 |
| | |
Net Assets | | |
Beginning of period | 28,733,938 | 26,239,525 |
End of period (including undistributed net investment income of $124,802 and distributions in excess of net investment income of $51,694, respectively) | $ 29,010,750 | $ 28,733,938 |
See accompanying notes which are an integral part of the financial statements.
Annual Report
Financial Highlights - Class A
Years ended October 31, | 2014 | 2013 | 2012 | 2011 | 2010 |
Selected Per-Share Data | | | | | |
Net asset value, beginning of period | $ 13.73 | $ 10.82 | $ 9.96 | $ 10.12 | $ 9.30 |
Income from Investment Operations | | | | | |
Net investment income (loss) C | .12 | .10 | .13 | .10 | .07F |
Net realized and unrealized gain (loss) | 1.94 | 3.01 | .85 | (.14) | .85 |
Total from investment operations | 2.06 | 3.11 | .98 | (.04) | .92 |
Distributions from net investment income | - | (.20) | (.12) | (.11) | (.09) |
Distributions from net realized gain | - | - | -H | (.01) | (.01) |
Total distributions | - | (.20) | (.12) | (.12) | (.10) |
Net asset value, end of period | $ 15.79 | $ 13.73 | $ 10.82 | $ 9.96 | $ 10.12 |
Total ReturnA, B | 15.00% | 29.24% | 10.00% | (.40)% | 9.91% |
Ratios to Average Net Assets D, G | | | | | |
Expenses before reductions | 1.30% | 1.33% | 1.28% | 1.24% | 1.22% |
Expenses net of fee waivers, if any | 1.25% | 1.25% | 1.25% | 1.24% | 1.22% |
Expenses net of all reductions | 1.25% | 1.23% | 1.24% | 1.23% | 1.21% |
Net investment income (loss) | .78% | .82% | 1.26% | .91% | .75%F |
Supplemental Data | | | | | |
Net assets, end of period (000 omitted) | $ 15,067 | $ 15,339 | $ 14,705 | $ 15,484 | $ 25,431 |
Portfolio turnover rateE | 182% | 87% | 94% | 161% | 51% |
A Total returns would have been lower if certain expenses had not been reduced during the applicable periods shown.
B Total returns do not include the effect of the sales charges.
C Calculated based on average shares outstanding during the period.
D Fees and expenses of any underlying Fidelity Central Funds are not included in the Fund's expense ratio. The Fund indirectly bears its proportionate share of the expenses of any underlying Fidelity Central Funds.
E Amount does not include the portfolio activity of any underlying Fidelity Central Funds.
F Investment income per share reflects a large, non-recurring dividend which amounted to $.02 per share. Excluding this non-recurring dividend, the ratio of net investment income (loss) to average net assets would have been .57%.
G Expense ratios reflect operating expenses of the class. Expenses before reductions do not reflect amounts reimbursed by the investment adviser or reductions from brokerage service arrangements or reductions from other expense offset arrangements and do not represent the amount paid by the class during periods when reimbursements or reductions occur. Expenses net of fee waivers reflect expenses after reimbursement by the investment adviser but prior to reductions from brokerage service arrangements or other expense offset arrangements. Expenses net of all reductions represent the net expenses paid by the class.
H Amount represents less than $.01 per share.
See accompanying notes which are an integral part of the financial statements.
Annual Report
Financial Highlights - Class T
Years ended October 31, | 2014 | 2013 | 2012 | 2011 | 2010 |
Selected Per-Share Data | | | | | |
Net asset value, beginning of period | $ 13.75 | $ 10.82 | $ 9.96 | $ 10.08 | $ 9.27 |
Income from Investment Operations | | | | | |
Net investment income (loss) C | .08 | .07 | .10 | .07 | .05F |
Net realized and unrealized gain (loss) | 1.95 | 3.02 | .85 | (.13) | .84 |
Total from investment operations | 2.03 | 3.09 | .95 | (.06) | .89 |
Distributions from net investment income | - | (.16) | (.09) | (.05) | (.07) |
Distributions from net realized gain | - | - | -H | (.01) | (.01) |
Total distributions | - | (.16) | (.09) | (.06) | (.08) |
Net asset value, end of period | $ 15.78 | $ 13.75 | $ 10.82 | $ 9.96 | $ 10.08 |
Total ReturnA, B | 14.76% | 28.97% | 9.68% | (.64)% | 9.62% |
Ratios to Average Net Assets D, G | | | | | |
Expenses before reductions | 1.58% | 1.60% | 1.55% | 1.49% | 1.45% |
Expenses net of fee waivers, if any | 1.50% | 1.50% | 1.50% | 1.49% | 1.45% |
Expenses net of all reductions | 1.50% | 1.48% | 1.49% | 1.48% | 1.45% |
Net investment income (loss) | .53% | .57% | 1.01% | .67% | .52%F |
Supplemental Data | | | | | |
Net assets, end of period (000 omitted) | $ 7,819 | $ 6,569 | $ 6,145 | $ 8,254 | $ 12,735 |
Portfolio turnover rateE | 182% | 87% | 94% | 161% | 51% |
A Total returns would have been lower if certain expenses had not been reduced during the applicable periods shown.
B Total returns do not include the effect of the sales charges.
C Calculated based on average shares outstanding during the period.
D Fees and expenses of any underlying Fidelity Central Funds are not included in the Fund's expense ratio. The Fund indirectly bears its proportionate share of the expenses of any underlying Fidelity Central Funds.
E Amount does not include the portfolio activity of any underlying Fidelity Central Funds.
F Investment income per share reflects a large, non-recurring dividend which amounted to $.02 per share. Excluding this non-recurring dividend, the ratio of net investment income (loss) to average net assets would have been .33%.
G Expense ratios reflect operating expenses of the class. Expenses before reductions do not reflect amounts reimbursed by the investment adviser or reductions from brokerage service arrangements or reductions from other expense offset arrangements and do not represent the amount paid by the class during periods when reimbursements or reductions occur. Expenses net of fee waivers reflect expenses after reimbursement by the investment adviser but prior to reductions from brokerage service arrangements or other expense offset arrangements. Expenses net of all reductions represent the net expenses paid by the class.
H Amount represents less than $.01 per share.
See accompanying notes which are an integral part of the financial statements.
Annual Report
Financial Highlights - Class B
Years ended October 31, | 2014 | 2013 | 2012 | 2011 | 2010 |
Selected Per-Share Data | | | | | |
Net asset value, beginning of period | $ 13.60 | $ 10.70 | $ 9.84 | $ 9.99 | $ 9.18 |
Income from Investment Operations | | | | | |
Net investment income (loss) C | -H | .01 | .05 | .02 | -F,H |
Net realized and unrealized gain (loss) | 1.93 | 2.99 | .85 | (.13) | .84 |
Total from investment operations | 1.93 | 3.00 | .90 | (.11) | .84 |
Distributions from net investment income | - | (.10) | (.03) | (.03) | (.02) |
Distributions from net realized gain | - | - | -H | (.01) | (.01) |
Total distributions | - | (.10) | (.04)I | (.04) | (.03) |
Net asset value, end of period | $ 15.53 | $ 13.60 | $ 10.70 | $ 9.84 | $ 9.99 |
Total ReturnA, B | 14.19% | 28.31% | 9.14% | (1.14)% | 9.11% |
Ratios to Average Net Assets D, G | | | | | |
Expenses before reductions | 2.12% | 2.10% | 2.04% | 1.99% | 1.97% |
Expenses net of fee waivers, if any | 2.00% | 2.00% | 2.00% | 1.99% | 1.97% |
Expenses net of all reductions | 2.00% | 1.98% | 1.99% | 1.98% | 1.97% |
Net investment income (loss) | .03% | .07% | .51% | .16% | (.01)%F |
Supplemental Data | | | | | |
Net assets, end of period (000 omitted) | $ 406 | $ 719 | $ 895 | $ 1,110 | $ 1,605 |
Portfolio turnover rateE | 182% | 87% | 94% | 161% | 51% |
A Total returns would have been lower if certain expenses had not been reduced during the applicable periods shown.
B Total returns do not include the effect of the contingent deferred sales charge.
C Calculated based on average shares outstanding during the period.
D Fees and expenses of any underlying Fidelity Central Funds are not included in the Fund's expense ratio. The Fund indirectly bears its proportionate share of the expenses of any underlying Fidelity Central Funds.
E Amount does not include the portfolio activity of any underlying Fidelity Central Funds.
F Investment income per share reflects a large, non-recurring dividend which amounted to $.02 per share. Excluding this non-recurring dividend, the ratio of net investment income (loss) to average net assets would have been (.19)%.
G Expense ratios reflect operating expenses of the class. Expenses before reductions do not reflect amounts reimbursed by the investment adviser or reductions from brokerage service arrangements or reductions from other expense offset arrangements and do not represent the amount paid by the class during periods when reimbursements or reductions occur. Expenses net of fee waivers reflect expenses after reimbursement by the investment adviser but prior to reductions from brokerage service arrangements or other expense offset arrangements. Expenses net of all reductions represent the net expenses paid by the class.
H Amount represents less than $.01 per share.
I Total distributions of $.04 per share is comprised of distributions from net investment income of $.031 and distributions from net realized gain of $.004 per share.
See accompanying notes which are an integral part of the financial statements.
Annual Report
Financial Highlights - Class C
Years ended October 31, | 2014 | 2013 | 2012 | 2011 | 2010 |
Selected Per-Share Data | | | | | |
Net asset value, beginning of period | $ 13.44 | $ 10.59 | $ 9.75 | $ 9.92 | $ 9.11 |
Income from Investment Operations | | | | | |
Net investment income (loss) C | -I | .01 | .05 | .02 | -G,I |
Net realized and unrealized gain (loss) | 1.91 | 2.95 | .84 | (.13) | .83 |
Total from investment operations | 1.91 | 2.96 | .89 | (.11) | .83 |
Distributions from net investment income | - | (.11) | (.05) | (.05) | (.02) |
Distributions from net realized gain | - | - | -I | (.01) | (.01) |
Total distributions | - | (.11) | (.05) | (.06) | (.02)J |
Net asset value, end of period | $ 15.35 | $ 13.44 | $ 10.59 | $ 9.75 | $ 9.92 |
Total ReturnA, B | 14.21% | 28.27% | 9.21% | (1.18)% | 9.12% |
Ratios to Average Net Assets D, H | | | | | |
Expenses before reductions | 2.09% | 2.08% | 2.04% | 2.00% | 1.97% |
Expenses net of fee waivers, if any | 2.00% | 2.00% | 2.00% | 2.00% | 1.97% |
Expenses net of all reductions | 2.00% | 1.97% | 1.99% | 1.98% | 1.97% |
Net investment income (loss) | .03% | .07% | .51% | .16% | .00%F,G |
Supplemental Data | | | | | |
Net assets, end of period (000 omitted) | $ 4,458 | $ 4,340 | $ 3,299 | $ 3,775 | $ 4,139 |
Portfolio turnover rateE | 182% | 87% | 94% | 161% | 51% |
A Total returns would have been lower if certain expenses had not been reduced during the applicable periods shown.
B Total returns do not include the effect of the contingent deferred sales charge.
C Calculated based on average shares outstanding during the period.
D Fees and expenses of any underlying Fidelity Central Funds are not included in the Fund's expense ratio. The Fund indirectly bears its proportionate share of the expenses of any underlying Fidelity Central Funds.
E Amount does not include the portfolio activity of any underlying Fidelity Central Funds.
F Amount represents less than .01%.
G Investment income per share reflects a large, non-recurring dividend which amounted to $.02 per share. Excluding this non-recurring dividend, the ratio of net investment income (loss) to average net assets would have been (.19)%.
H Expense ratios reflect operating expenses of the class. Expenses before reductions do not reflect amounts reimbursed by the investment adviser or reductions from brokerage service arrangements or reductions from other expense offset arrangements and do not represent the amount paid by the class during periods when reimbursements or reductions occur. Expenses net of fee waivers reflect expenses after reimbursement by the investment adviser but prior to reductions from brokerage service arrangements or other expense offset arrangements. Expenses net of all reductions represent the net expenses paid by the class.
I Amount represents less than $.01 per share.
J Total distributions of $.02 per share is comprised of distributions from net investment income of $.015 and distributions from net realized gain of $.005 per share.
See accompanying notes which are an integral part of the financial statements.
Annual Report
Financial Highlights - Institutional Class
Years ended October 31, | 2014 | 2013 | 2012 | 2011 | 2010 |
Selected Per-Share Data | | | | | |
Net asset value, beginning of period | $ 13.81 | $ 10.89 | $ 10.04 | $ 10.19 | $ 9.35 |
Income from Investment Operations | | | | | |
Net investment income (loss) B | .15 | .14 | .18 | .14 | .10E |
Net realized and unrealized gain (loss) | 1.97 | 3.02 | .83 | (.15) | .86 |
Total from investment operations | 2.12 | 3.16 | 1.01 | (.01) | .96 |
Distributions from net investment income | - | (.24) | (.16) | (.13) | (.11) |
Distributions from net realized gain | - | - | -G | (.01) | (.01) |
Total distributions | - | (.24) | (.16) | (.14) | (.12) |
Net asset value, end of period | $ 15.93 | $ 13.81 | $ 10.89 | $ 10.04 | $ 10.19 |
Total ReturnA | 15.35% | 29.65% | 10.30% | (.11)% | 10.28% |
Ratios to Average Net Assets C, F | | | | | |
Expenses before reductions | 1.01% | .94% | .83% | .89% | .98% |
Expenses net of fee waivers, if any | 1.00% | .94% | .83% | .89% | .98% |
Expenses net of all reductions | 1.00% | .92% | .82% | .88% | .97% |
Net investment income (loss) | 1.03% | 1.13% | 1.68% | 1.27% | .99%E |
Supplemental Data | | | | | |
Net assets, end of period (000 omitted) | $ 1,261 | $ 1,767 | $ 1,195 | $ 523 | $ 841 |
Portfolio turnover rateD | 182% | 87% | 94% | 161% | 51% |
A Total returns would have been lower if certain expenses had not been reduced during the applicable periods shown.
B Calculated based on average shares outstanding during the period.
C Fees and expenses of any underlying Fidelity Central Funds are not included in the Fund's expense ratio. The Fund indirectly bears its proportionate share of the expenses of any underlying Fidelity Central Funds.
D Amount does not include the portfolio activity of any underlying Fidelity Central Funds.
E Investment income per share reflects a large, non-recurring dividend which amounted to $.02 per share. Excluding this non-recurring dividend, the ratio of net investment income (loss) to average net assets would have been .81%.
F Expense ratios reflect operating expenses of the class. Expenses before reductions do not reflect amounts reimbursed by the investment adviser or reductions from brokerage service arrangements or reductions from other expense offset arrangements and do not represent the amount paid by the class during periods when reimbursements or reductions occur. Expenses net of fee waivers reflect expenses after reimbursement by the investment adviser but prior to reductions from brokerage service arrangements or other expense offset arrangements. Expenses net of all reductions represent the net expenses paid by the class.
G Amount represents less than $.01 per share.
See accompanying notes which are an integral part of the financial statements.
Annual Report
Notes to Financial Statements
For the period ended October 31, 2014
1. Organization.
Fidelity Advisor Value Leaders Fund (the Fund) is a fund of Fidelity Advisor Series VIII (the Trust) and is authorized to issue an unlimited number of shares. The Trust is registered under the Investment Company Act of 1940, as amended (the 1940 Act), as an open-end management investment company organized as a Massachusetts business trust. The Fund offers Class A, Class T, Class C and Institutional Class shares, each of which, along with Class B shares, has equal rights as to assets and voting privileges. Class B shares are closed to new accounts and additional purchases, except for exchanges and reinvestments. Each class has exclusive voting rights with respect to matters that affect that class. Class B shares will automatically convert to Class A shares after a holding period of seven years from the initial date of purchase.
2. Investments in Fidelity Central Funds.
The Fund invests in Fidelity Central Funds, which are open-end investment companies generally available only to other investment companies and accounts managed by the investment adviser and its affiliates. The Fund's Schedule of Investments lists each of the Fidelity Central Funds held as of period end, if any, as an investment of the Fund, but does not include the underlying holdings of each Fidelity Central Fund. As an Investing Fund, the Fund indirectly bears its proportionate share of the expenses of the underlying Fidelity Central Funds.
The Money Market Central Funds seek preservation of capital and current income and are managed by Fidelity Investments Money Management, Inc. (FIMM), an affiliate of the investment adviser. Annualized expenses of the Money Market Central Funds as of their most recent shareholder report date are less than .01%.
A complete unaudited list of holdings for each Fidelity Central Fund is available upon request or at the Securities and Exchange Commission (the SEC) website at www.sec.gov. In addition, the financial statements of the Fidelity Central Funds, which are not covered by the Fund's Report of Independent Registered Public Accounting Firm, are available on the SEC website or upon request.
3. Significant Accounting Policies.
The financial statements have been prepared in conformity with accounting principles generally accepted in the United States of America (GAAP), which require management to make certain estimates and assumptions at the date of the financial statements. Actual results could differ from those estimates. Subsequent events, if any, through the date that the financial statements were issued have been evaluated in the preparation of the financial statements. The following summarizes the significant accounting policies of the Fund:
Annual Report
3. Significant Accounting Policies - continued
Investment Valuation. Investments are valued as of 4:00 p.m. Eastern time on the last calendar day of the period. In accordance with valuation policies and procedures approved by the Board of Trustees (the Board), the Fund attempts to obtain prices from one or more third party pricing vendors or brokers to value its investments. When current market prices, quotations or currency exchange rates are not readily available or reliable, investments will be fair valued in good faith by the Fidelity Management & Research Company (FMR) Fair Value Committee (the Committee), in accordance with procedures adopted by the Board. Factors used in determining fair value vary by investment type and may include market or investment specific events, changes in interest rates and credit quality. The frequency with which these procedures are used cannot be predicted and they may be utilized to a significant extent. The Committee oversees the Fund's valuation policies and procedures and is responsible for approving and reporting to the Board all fair value determinations.
The Fund categorizes the inputs to valuation techniques used to value its investments into a disclosure hierarchy consisting of three levels as shown below:
Level 1 - quoted prices in active markets for identical investments
Level 2 - other significant observable inputs (including quoted prices for similar investments, interest rates, prepayment speeds, etc.)
Level 3 - unobservable inputs (including the Fund's own assumptions based on the best information available)
Valuation techniques used to value the Fund's investments by major category are as follows:
Equity securities, including restricted securities, for which market quotations are readily available, are valued at the last reported sale price or official closing price as reported by a third party pricing vendor on the primary market or exchange on which they are traded and are categorized as Level 1 in the hierarchy. In the event there were no sales during the day or closing prices are not available, securities are valued at the last quoted bid price or may be valued using the last available price and are generally categorized as Level 2 in the hierarchy. For foreign equity securities, when market or security specific events arise, comparisons to the valuation of American Depositary Receipts (ADRs), futures contracts, Exchange-Traded Funds (ETFs) and certain indexes as well as quoted prices for similar securities may be used and would be categorized as Level 2 in the hierarchy. Utilizing these techniques may result in transfers between Level 1 and Level 2. For equity securities, including restricted securities, where observable inputs are limited, assumptions about market activity and risk are used and these securities may be categorized as Level 3 in the hierarchy.
Annual Report
Notes to Financial Statements - continued
3. Significant Accounting Policies - continued
Investment Valuation - continued
Debt securities, including restricted securities, are valued based on evaluated prices received from third party pricing vendors or from brokers who make markets in such securities. U.S. government and government agency obligations are valued by pricing vendors who utilize matrix pricing which considers yield or price of bonds of comparable quality, coupon, maturity and type or by broker-supplied prices. When independent prices are unavailable or unreliable, debt securities may be valued utilizing pricing methodologies which consider similar factors that would be used by third party pricing vendors. Debt securities are generally categorized as Level 2 in the hierarchy but may be Level 3 depending on the circumstances.
Investments in open-end mutual funds, including the Fidelity Central Funds, are valued at their closing net asset value (NAV) each business day and are categorized as Level 1 in the hierarchy.
Changes in valuation techniques may result in transfers in or out of an assigned level within the disclosure hierarchy. The aggregate value of investments by input level, as of October 31, 2014, is included at the end of the Fund's Schedule of Investments.
Foreign Currency. The Fund may use foreign currency contracts to facilitate transactions in foreign-denominated securities. Gains and losses from these transactions may arise from changes in the value of the foreign currency or if the counterparties do not perform under the contracts' terms.
Foreign-denominated assets, including investment securities, and liabilities are translated into U.S. dollars at the exchange rates at period end. Purchases and sales of investment securities, income and dividends received and expenses denominated in foreign currencies are translated into U.S. dollars at the exchange rate in effect on the transaction date.
The effects of exchange rate fluctuations on investments are included with the net realized and unrealized gain (loss) on investment securities. Other foreign currency transactions resulting in realized and unrealized gain (loss) are disclosed separately.
Investment Transactions and Income. For financial reporting purposes, the Fund's investment holdings and NAV include trades executed through the end of the last business day of the period. The NAV per share for processing shareholder transactions is calculated as of the close of business of the New York Stock Exchange (NYSE), normally 4:00 p.m. Eastern time and includes trades executed through the end of the prior business day. Gains and losses on securities sold are determined on the basis of identified cost and may include proceeds received from litigation. Dividend income is recorded on
Annual Report
3. Significant Accounting Policies - continued
Investment Transactions and Income - continued
the ex-dividend date, except for certain dividends from foreign securities where the ex-dividend date may have passed, which are recorded as soon as the Fund is informed of the ex-dividend date. Non-cash dividends included in dividend income, if any, are recorded at the fair market value of the securities received. Income and capital gain distributions from Fidelity Central Funds, if any, are recorded on the ex-dividend date. Distributions received on securities that represent a return of capital or capital gain are recorded as a reduction of cost of investments and/or as a realized gain. Subsequent to ex-dividend date the Fund determines the components of these distributions, based upon receipt of tax filings or other correspondence relating to the underlying investment. Interest income is accrued as earned and includes coupon interest and amortization of premium and accretion of discount on debt securities as applicable. Investment income is recorded net of foreign taxes withheld where recovery of such taxes is uncertain.
Class Allocations and Expenses. Investment income, realized and unrealized capital gains and losses, common expenses of the Fund, and certain fund-level expense reductions, if any, are allocated daily on a pro-rata basis to each class based on the relative net assets of each class to the total net assets of the Fund. Each class differs with respect to transfer agent and distribution and service plan fees incurred. Certain expense reductions may also differ by class. For the reporting period, the allocated portion of income and expenses to each class as a percent of its average net assets may vary due to the timing of recording these transactions in relation to fluctuating net assets of the classes. Expenses directly attributable to a fund are charged to that fund. Expenses attributable to more than one fund are allocated among the respective funds on the basis of relative net assets or other appropriate methods. Expense estimates are accrued in the period to which they relate and adjustments are made when actual amounts are known.
Income Tax Information and Distributions to Shareholders. Each year, the Fund intends to qualify as a regulated investment company under Subchapter M of the Internal Revenue Code, including distributing substantially all of its taxable income and realized gains. As a result, no provision for U.S. Federal income taxes is required. As of October 31, 2014, the Fund did not have any unrecognized tax benefits in the financial statements; nor is the Fund aware of any tax positions for which it is reasonably possible that the total amounts of unrecognized tax benefits will significantly change in the next twelve months. The Fund files a U.S. federal tax return, in addition to state and local tax returns as required. The Fund's federal income tax returns are subject to examination by the Internal Revenue Service (IRS) for a period of three fiscal years after they are filed. State and local tax returns may be subject to examination for an additional fiscal year depending on the jurisdiction. Foreign taxes are provided for based on the Fund's understanding of the tax rules and rates that exist in the foreign markets in which it invests.
Annual Report
Notes to Financial Statements - continued
3. Significant Accounting Policies - continued
Income Tax Information and Distributions to Shareholders - continued
Distributions are declared and recorded on the ex-dividend date. Income dividends and capital gain distributions are declared separately for each class. Income and capital gain distributions are determined in accordance with income tax regulations, which may differ from GAAP.
Capital accounts within the financial statements are adjusted for permanent book-tax differences. These adjustments have no impact on net assets or the results of operations. Capital accounts are not adjusted for temporary book-tax differences which will reverse in a subsequent period.
Book-tax differences are primarily due to futures contracts, foreign currency transactions, partnerships, capital loss carryforwards, losses deferred due to wash sales and excise tax regulations.
The federal tax cost of investment securities and unrealized appreciation (depreciation) as of period end were as follows:
Gross unrealized appreciation | $ 1,672,715 |
Gross unrealized depreciation | (383,504) |
Net unrealized appreciation (depreciation) on securities | $ 1,289,211 |
| |
Tax Cost | $ 27,661,061 |
The tax-based components of distributable earnings as of period end were as follows:
Undistributed ordinary income | $ 124,802 |
Capital loss carryforward | $ (26,372,152) |
Net unrealized appreciation (depreciation) on securities and other investments | $ 1,289,211 |
Capital loss carryforwards are only available to offset future capital gains of the Fund to the extent provided by regulations and may be limited. Under the Regulated Investment Company Modernization Act of 2010 (the Act), the Fund is permitted to carry forward capital losses incurred in taxable years beginning after December 22, 2010 for an unlimited period and such capital losses are required to be used prior to any losses that expire. The capital loss carryforward information presented below, including any applicable limitation, is estimated as of fiscal period end and is subject to adjustment.
Fiscal year of expiration | |
2016 | $ (11,383,283) |
2017 | (14,819,668) |
2019 | (169,201) |
Total capital loss carryforward | $ (26,372,152) |
Annual Report
3. Significant Accounting Policies - continued
Income Tax Information and Distributions to Shareholders - continued
The tax character of distributions paid was as follows:
| October 31, 2014 | October 31, 2013 |
Ordinary Income | $ - | $ 419,258 |
New Accounting Pronouncement. In June 2014, the Financial Accounting Standards Board issued Accounting Standard Update No. 2014-11, Repurchase-to-Maturity Transactions, Repurchase Financings, and Disclosures. The Update amends the accounting for certain repurchase agreements and expands disclosure requirements for reverse repurchase agreements, securities lending and other similar transactions. The disclosure requirements are effective for annual and interim reporting periods beginning after December 15, 2014. Management is currently evaluating the impact of the Update on the Funds' financial statements and related disclosures.
4. Derivative Instruments.
Risk Exposures and the Use of Derivative Instruments. The Fund's investment objective allows the Fund to enter into various types of derivative contracts, including futures contracts. Derivatives are investments whose value is primarily derived from underlying assets, indices or reference rates and may be transacted on an exchange or over-the-counter (OTC). Derivatives may involve a future commitment to buy or sell a specified asset based on specified terms, to exchange future cash flows at periodic intervals based on a notional principal amount, or for one party to make one or more payments upon the occurrence of specified events in exchange for periodic payments from the other party.
The Fund used derivatives to increase returns and to manage exposure to certain risks as defined below. The success of any strategy involving derivatives depends on analysis of numerous economic factors, and if the strategies for investment do not work as intended, the Fund may not achieve its objectives.
The Fund's use of derivatives increased or decreased its exposure to the following risk:
Equity Risk | Equity risk relates to the fluctuations in the value of financial instruments as a result of changes in market prices (other than those arising from interest rate risk or foreign exchange risk), whether caused by factors specific to an individual investment, its issuer, or all factors affecting all instruments traded in a market or market segment. |
The Fund is also exposed to additional risks from investing in derivatives, such as liquidity risk and counterparty credit risk. Liquidity risk is the risk that the Fund will be unable to close out the derivative in the open market in a timely manner. Counterparty
Annual Report
Notes to Financial Statements - continued
4. Derivative Instruments - continued
Risk Exposures and the Use of Derivative Instruments - continued
credit risk is the risk that the counterparty will not be able to fulfill its obligation to the Fund. Counterparty credit risk related to exchange-traded futures contracts may be mitigated by the protection provided by the exchange on which they trade.
Investing in derivatives may involve greater risks than investing in the underlying assets directly and, to varying degrees, may involve risk of loss in excess of any initial investment and collateral received and amounts recognized in the Statement of Assets and Liabilities. In addition, there may be the risk that the change in value of the derivative contract does not correspond to the change in value of the underlying instrument.
Futures Contracts. A futures contract is an agreement between two parties to buy or sell a specified underlying instrument for a fixed price at a specified future date. The Fund used futures contracts to manage its exposure to the stock market.
Upon entering into a futures contract, a fund is required to deposit either cash or securities (initial margin) with a clearing broker in an amount equal to a certain percentage of the face value of the contract. Futures contracts are marked-to-market daily and subsequent daily payments (variation margin) are made or received by a fund depending on the daily fluctuations in the value of the futures contracts and are recorded as unrealized appreciation or (depreciation). This receivable and/or payable, if any, is included in daily variation margin for derivative instruments in the Statement of Assets and Liabilities. Realized gain or (loss) is recorded upon the expiration or closing of a futures contract.
Any open futures contracts at period end are presented in the Schedule of Investments under the caption "Futures Contracts." The underlying face amount at value reflects each contract's exposure to the underlying instrument or index at period end.
During the period the Fund recognized net realized gain (loss) of $(19,513) and a change in net unrealized appreciation (depreciation) of $(12,341) related to its investment in futures contracts. These amounts are included in the Statement of Operations.
5. Purchases and Sales of Investments.
Purchases and sales of securities, other than short-term securities, aggregated $52,934,663 and $54,949,500, respectively.
6. Fees and Other Transactions with Affiliates.
Management Fee. Fidelity Management & Research Company (the investment adviser) and its affiliates provide the Fund with investment management related services for which the Fund pays a monthly management fee. The management fee is the sum of an individual fund fee rate that is based on an annual rate of .30% of the Fund's
Annual Report
6. Fees and Other Transactions with Affiliates - continued
Management Fee - continued
average net assets and an annualized group fee rate that averaged .25% during the period. The group fee rate is based upon the average net assets of all the mutual funds advised by the investment adviser, including any mutual funds previously advised by the investment adviser that are currently advised by Fidelity SelectCo, LLC, an affiliate of the investment adviser. The group fee rate decreases as assets under management increase and increases as assets under management decrease. In addition, the management fee is subject to a performance adjustment (up to a maximum of ± .20% of the Fund's average net assets over a 36 month performance period). The upward or downward adjustment to the management fee is based on the relative investment performance of the Institutional Class of the Fund as compared to its benchmark index, the Russell 1000 Value Index, over the same 36 month performance period. For the reporting period, the total annual management fee rate, including the performance adjustment, was .36% of the Fund's average net assets. The performance adjustment included in the management fee rate may be higher or lower than the maximum performance adjustment rate due to the difference between the average net assets for the reporting and performance periods.
Distribution and Service Plan Fees. In accordance with Rule 12b-1 of the 1940 Act, the Fund has adopted separate Distribution and Service Plans for each class of shares. Certain classes pay Fidelity Distributors Corporation (FDC), an affiliate of the investment adviser, separate Distribution and Service Fees, each of which is based on an annual percentage of each class' average net assets. In addition, FDC may pay financial intermediaries for selling shares of the Fund and providing shareholder support services. For the period, the Distribution and Service Fee rates, total fees and amounts retained by FDC were as follows:
| Distribution
Fee | Service
Fee | Total Fees | Retained
by FDC |
Class A | -% | .25% | $ 39,794 | $ 530 |
Class T | .25% | .25% | 38,036 | 301 |
Class B | .75% | .25% | 5,359 | 4,035 |
Class C | .75% | .25% | 47,448 | 6,543 |
| | | $ 130,637 | $ 11,409 |
Sales Load. FDC may receive a front-end sales charge of up to 5.75% for selling Class A shares and 3.50% for selling Class T shares, some of which is paid to financial intermediaries for selling shares of the Fund. Depending on the holding period, FDC may receive contingent deferred sales charges levied on Class A, Class T, Class B, and Class C redemptions. The deferred sales charges range from 5.00% to 1.00% for Class B shares, 1.00% for Class C shares, 1.00% for certain purchases of Class A shares and .25% for certain purchases of Class T shares.
Annual Report
Notes to Financial Statements - continued
6. Fees and Other Transactions with Affiliates - continued
Sales Load - continued
For the period, sales charge amounts retained by FDC were as follows:
| Retained
by FDC |
Class A | $ 2,685 |
Class T | 2,517 |
Class B* | 174 |
Class C* | 1,030 |
| $ 6,406 |
* When Class B and Class C shares are initially sold, FDC pays commissions from its own resources to financial intermediaries through which the sales are made.
Transfer Agent Fees. Fidelity Investments Institutional Operations Company, Inc., (FIIOC), an affiliate of the investment adviser, is the transfer, dividend disbursing and shareholder servicing agent for each class of the Fund. FIIOC receives account fees and asset-based fees that vary according to the account size and type of account of the shareholders of the respective classes of the Fund. FIIOC pays for typesetting, printing and mailing of shareholder reports, except proxy statements.
For the period, transfer agent fees for each class were as follows:
| Amount | % of
Class-Level Average
Net Assets |
Class A | $ 39,204 | .25 |
Class T | 21,894 | .29 |
Class B | 1,620 | .30 |
Class C | 13,965 | .29 |
Institutional Class | 4,296 | .21 |
| $ 80,979 | |
Accounting and Security Lending Fees. Fidelity Service Company, Inc. (FSC), an affiliate of the investment adviser, maintains the Fund's accounting records. The accounting fee is based on the level of average net assets for each month. Under a separate contract, FSC administers the security lending program. The security lending fee is based on the number and duration of lending transactions.
Brokerage Commissions. The Fund placed a portion of its portfolio transactions with brokerage firms which are affiliates of the investment adviser. Brokerage commissions are included in net realized gain (loss) and change in net unrealized appreciation (depreciation) in the Statement of Operations. The commissions paid to these affiliated firms were $1,923 for the period.
Annual Report
7. Committed Line of Credit.
The Fund participates with other funds managed by the investment adviser or an affiliate in a $4.25 billion credit facility (the "line of credit") to be utilized for temporary or emergency purposes to fund shareholder redemptions or for other short-term liquidity purposes. The Fund has agreed to pay commitment fees on its pro-rata portion of the line of credit, which amounted to $50 and is reflected in Miscellaneous expenses on the Statement of Operations. During the period, the Fund did not borrow on this line of credit.
8. Security Lending.
The Fund lends portfolio securities through a lending agent from time to time in order to earn additional income. For equity securities, a lending agent is used and may loan securities to certain qualified borrowers, including Fidelity Capital Markets (FCM), a broker-dealer affiliated with the Fund. On the settlement date of the loan, the Fund receives collateral (in the form of U.S. Treasury obligations, letters of credit and/or cash) against the loaned securities and maintains collateral in an amount not less than 100% of the market value of the loaned securities during the period of the loan. The market value of the loaned securities is determined at the close of business of the Fund and any additional required collateral is delivered to the Fund on the next business day. If the borrower defaults on its obligation to return the securities loaned because of insolvency or other reasons, the Fund may apply collateral received from the borrower against the obligation. The Fund may experience delays and costs in recovering the securities loaned. Any cash collateral received is invested in the Fidelity Securities Lending Cash Central Fund. At period end, there were no security loans outstanding. Security lending income represents the income earned on investing cash collateral, less rebates paid to borrowers and any lending agent fees associated with the loan, plus any premium payments received for lending certain types of securities. Security lending income is presented in the Statement of Operations as a component of income from Fidelity Central Funds. Total security lending income during the period amounted to $293. During the period, there were no securities loaned to FCM.
9. Expense Reductions.
The investment adviser voluntarily agreed to reimburse each class to the extent annual operating expenses exceeded certain levels of average net assets as noted in the table below. Some expenses, for example interest expense, including commitment fees, are excluded from this reimbursement.
Annual Report
Notes to Financial Statements - continued
9. Expense Reductions - continued
The following classes were in reimbursement during the period:
| Expense
Limitations | Reimbursement |
Class A | 1.25% | $ 7,490 |
Class T | 1.50% | 5,986 |
Class B | 2.00% | 607 |
Class C | 2.00% | 4,081 |
Institutional Class | 1.00% | 261 |
| | $ 18,425 |
Commissions paid to certain brokers with whom the investment adviser, or its affiliates, places trades on behalf of the Fund include an amount in addition to trade execution, which may be rebated back to the Fund to offset certain expenses. This amount totaled $146 for the period. In addition, through arrangements with the Fund's custodian, credits realized as a result of uninvested cash balances were used to reduce the Fund's expenses. During the period, these credits reduced the Fund's custody expenses by $8.
10. Distributions to Shareholders.
Distributions to shareholders of each class were as follows:
Years ended October 31, | 2014 | 2013 |
From net investment income | | |
Class A | $ - | $ 265,618 |
Class T | - | 87,579 |
Class B | - | 8,055 |
Class C | - | 34,963 |
Institutional Class | - | 23,043 |
Total | $ - | $ 419,258 |
11. Share Transactions.
Share transactions for each class were as follows and may contain automatic conversions between classes or exchanges between funds:
| Shares | Dollars |
Years ended October 31, | 2014 | 2013 | 2014 | 2013 |
Class A | | | | |
Shares sold | 138,015 | 203,654 | $ 2,028,107 | $ 2,521,952 |
Reinvestment of distributions | - | 23,948 | - | 256,986 |
Shares redeemed | (301,611) | (469,651) | (4,564,426) | (5,674,710) |
Net increase (decrease) | (163,596) | (242,049) | $ (2,536,319) | $ (2,895,772) |
Annual Report
11. Share Transactions - continued
| Shares | Dollars |
Years ended October 31, | 2014 | 2013 | 2014 | 2013 |
Class T | | | | |
Shares sold | 118,612 | 51,753 | $ 1,713,933 | $ 642,034 |
Reinvestment of distributions | - | 7,985 | - | 86,093 |
Shares redeemed | (100,942) | (149,714) | (1,483,209) | (1,818,182) |
Net increase (decrease) | 17,670 | (89,976) | $ 230,724 | $ (1,090,055) |
Class B | | | | |
Shares sold | - | 1,256 | $ - | $ 15,666 |
Reinvestment of distributions | - | 676 | - | 7,246 |
Shares redeemed | (26,732) | (32,653) | (388,717) | (386,596) |
Net increase (decrease) | (26,732) | (30,721) | $ (388,717) | $ (363,684) |
Class C | | | | |
Shares sold | 65,526 | 81,393 | $ 939,665 | $ 983,333 |
Reinvestment of distributions | - | 3,063 | - | 32,411 |
Shares redeemed | (98,027) | (73,114) | (1,427,472) | (871,726) |
Net increase (decrease) | (32,501) | 11,342 | $ (487,807) | $ 144,018 |
Institutional Class | | | | |
Shares sold | 129,227 | 46,209 | $ 1,917,221 | $ 589,474 |
Reinvestment of distributions | - | 2,131 | - | 22,951 |
Shares redeemed | (178,032) | (30,086) | (2,658,473) | (350,773) |
Net increase (decrease) | (48,805) | 18,254 | $ (741,252) | $ 261,652 |
12. Other.
The Fund's organizational documents provide former and current trustees and officers with a limited indemnification against liabilities arising in connection with the performance of their duties to the Fund. In the normal course of business, the Fund may also enter into contracts that provide general indemnifications. The Fund's maximum exposure under these arrangements is unknown as this would be dependent on future claims that may be made against the Fund. The risk of material loss from such claims is considered remote.
Annual Report
To the Trustees of Fidelity Advisor Series VIII and the Shareholders of Fidelity Advisor Value Leaders Fund:
In our opinion, the accompanying statement of assets and liabilities, including the schedule of investments, and the related statements of operations and of changes in net assets and the financial highlights present fairly, in all material respects, the financial position of Fidelity Advisor Value Leaders Fund (a fund of Fidelity Advisor Series VIII) at October 31, 2014, the results of its operations for the year then ended, the changes in its net assets for each of the two years in the period then ended and the financial highlights for each of the five years in the period then ended, in conformity with accounting principles generally accepted in the United States of America. These financial statements and financial highlights (hereafter referred to as "financial statements") are the responsibility of the Fidelity Advisor Value Leaders Fund's management. Our responsibility is to express an opinion on these financial statements based on our audits. We conducted our audits of these financial statements in accordance with the standards of the Public Company Accounting Oversight Board (United States). Those standards require that we plan and perform the audit to obtain reasonable assurance about whether the financial statements are free of material misstatement. An audit includes examining, on a test basis, evidence supporting the amounts and disclosures in the financial statements, assessing the accounting principles used and significant estimates made by management, and evaluating the overall financial statement presentation. We believe that our audits, which included confirmation of securities at October 31, 2014 by correspondence with the custodian and brokers, provide a reasonable basis for our opinion.
PricewaterhouseCoopers LLP
Boston, Massachusetts
December 16, 2014
Annual Report
The Trustees, Member of the Advisory Board, and officers of the trust and fund, as applicable, are listed below. The Board of Trustees governs the fund and is responsible for protecting the interests of shareholders. The Trustees are experienced executives who meet periodically throughout the year to oversee the fund's activities, review contractual arrangements with companies that provide services to the fund, oversee management of the risks associated with such activities and contractual arrangements, and review the fund's performance. Except for James C. Curvey, each of the Trustees oversees 174 funds. Mr. Curvey oversees 407 funds.
The Trustees hold office without limit in time except that (a) any Trustee may resign; (b) any Trustee may be removed by written instrument, signed by at least two-thirds of the number of Trustees prior to such removal; (c) any Trustee who requests to be retired or who has become incapacitated by illness or injury may be retired by written instrument signed by a majority of the other Trustees; and (d) any Trustee may be removed at any special meeting of shareholders by a two-thirds vote of the outstanding voting securities of the trust. Each Trustee who is not an interested person (as defined in the 1940 Act) of the trust and the fund (Independent Trustee), shall retire not later than the last day of the calendar year in which his or her 75th birthday occurs. The Independent Trustees may waive this mandatory retirement age policy with respect to individual Trustees. The officers and Advisory Board Member hold office without limit in time, except that any officer and Advisory Board Member may resign or may be removed by a vote of a majority of the Trustees at any regular meeting or any special meeting of the Trustees. Except as indicated, each individual has held the office shown or other offices in the same company for the past five years.
Experience, Skills, Attributes, and Qualifications of the Fund's Trustees. The Governance and Nominating Committee has adopted a statement of policy that describes the experience, qualifications, attributes, and skills that are necessary and desirable for potential Independent Trustee candidates (Statement of Policy). The Board believes that each Trustee satisfied at the time he or she was initially elected or appointed a Trustee, and continues to satisfy, the standards contemplated by the Statement of Policy. The Governance and Nominating Committee also engages professional search firms to help identify potential Independent Trustee candidates who have the experience, qualifications, attributes, and skills consistent with the Statement of Policy. From time to time, additional criteria based on the composition and skills of the current Independent Trustees, as well as experience or skills that may be appropriate in light of future changes to board composition, business conditions, and regulatory or other developments, have also been considered by the professional search firms and the Governance and Nominating Committee. In addition, the Board takes into account the Trustees' commitment and participation in Board and committee meetings, as well as their leadership of standing and ad hoc committees throughout their tenure.
In determining that a particular Trustee was and continues to be qualified to serve as a Trustee, the Board has considered a variety of criteria, none of which, in isolation, was controlling. The Board believes that, collectively, the Trustees have balanced and diverse experience, qualifications, attributes, and skills, which allow the Board to operate effectively in governing the fund and protecting the interests of shareholders. Information about the specific experience, skills, attributes, and qualifications of each Trustee, which in each case led to the Board's conclusion that the Trustee should serve (or continue to serve) as a trustee of the fund, is provided below.
Annual Report
Trustees and Officers - continued
Board Structure and Oversight Function. James C. Curvey is an interested person (as defined in the 1940 Act) and currently serves as Chairman. The Trustees have determined that an interested Chairman is appropriate and benefits shareholders because an interested Chairman has a personal and professional stake in the quality and continuity of services provided to the fund. Independent Trustees exercise their informed business judgment to appoint an individual of their choosing to serve as Chairman, regardless of whether the Trustee happens to be independent or a member of management. The Independent Trustees have determined that they can act independently and effectively without having an Independent Trustee serve as Chairman and that a key structural component for assuring that they are in a position to do so is for the Independent Trustees to constitute a substantial majority for the Board. The Independent Trustees also regularly meet in executive session. Ned C. Lautenbach serves as Chairman of the Independent Trustees and as such (i) acts as a liaison between the Independent Trustees and management with respect to matters important to the Independent Trustees and (ii) with management prepares agendas for Board meetings.
Fidelity funds are overseen by different Boards of Trustees. The fund's Board oversees Fidelity's equity and high income funds and another Board oversees Fidelity's investment-grade bond, money market, and asset allocation funds. The asset allocation funds may invest in Fidelity funds overseen by the fund's Board. The use of separate Boards, each with its own committee structure, allows the Trustees of each group of Fidelity funds to focus on the unique issues of the funds they oversee, including common research, investment, and operational issues. On occasion, the separate Boards establish joint committees to address issues of overlapping consequences for the Fidelity funds overseen by each Board.
The Trustees operate using a system of committees to facilitate the timely and efficient consideration of all matters of importance to the Trustees, the fund, and fund shareholders and to facilitate compliance with legal and regulatory requirements and oversight of the fund's activities and associated risks. The Board, acting through its committees, has charged FMR and its affiliates with (i) identifying events or circumstances the occurrence of which could have demonstrably adverse effects on the fund's business and/or reputation; (ii) implementing processes and controls to lessen the possibility that such events or circumstances occur or to mitigate the effects of such events or circumstances if they do occur; and (iii) creating and maintaining a system designed to evaluate continuously business and market conditions in order to facilitate the identification and implementation processes described in (i) and (ii) above. Because the day-to-day operations and activities of the fund are carried out by or through FMR, its affiliates and other service providers, the fund's exposure to risks is mitigated but not eliminated by the processes overseen by the Trustees. While each of the Board's committees has responsibility for overseeing different aspects of the fund's activities, oversight is exercised primarily through the Operations, Audit, and Compliance Committees. In addition, the Independent Trustees have worked with FMR to enhance the Board's oversight of investment and financial risks, legal and regulatory risks, technology risks, and operational risks, including the development of additional risk reporting to the Board. For example, a working group comprised of Independent Trustees and FMR has worked and continues to work to review the Fidelity funds' valuation-related activities, reporting and risk management. Appropriate personnel, including but not limited to the fund's Chief Compliance Officer (CCO), FMR's internal auditor, the independent accountants, the fund's Treasurer and portfolio management personnel, make periodic reports to the Board's committees, as appropriate, including an annual review of FMR's risk management program for the Fidelity funds. The responsibilities of each standing committee, including their oversight responsibilities, are described further under "Standing Committees of the Fund's Trustees."
Annual Report
The fund's Statement of Additional Information (SAI) includes more information about the Trustees. To request a free copy, call Fidelity at 1-877-208-0098.
Interested Trustees*:
Correspondence intended for each Trustee who is an interested person may be sent to Fidelity Investments, 245 Summer Street, Boston, Massachusetts 02210.
Name, Year of Birth; Principal Occupations and Other Relevant Experience+ |
James C. Curvey (1935) |
Year of Election or Appointment: 2007 Trustee Chairman of the Board of Trustees |
| Mr. Curvey also serves as Trustee of other Fidelity funds. Mr. Curvey is a Director of Fidelity Research & Analysis Co. (2009-present), and Vice Chairman (2007-present) and Director of FMR LLC. In addition, Mr. Curvey serves as an Overseer for the Boston Symphony Orchestra and a member of the board of Artis-Naples, Naples, Florida, and as a Trustee for Brewster Academy, Wolfeboro, New Hampshire. Previously, Mr. Curvey served as a Director of Fidelity Investments Money Management, Inc. (2009-2014), a Director of FMR (2007-2014), and a Director of FMR Co., Inc. (2007-2014). |
Charles S. Morrison (1960) |
Year of Election or Appointment: 2014 Trustee |
| Mr. Morrison also serves as Trustee of other funds. He serves as a Director of Fidelity Investments Money Management, Inc. (FIMM) (2014-present), Director of Fidelity SelectCo, LLC (2014-present), President, Asset Management (2014-present), and is an employee of Fidelity Investments. Previously, Mr. Morrison served as Vice President of Fidelity's Fixed Income and Asset Allocation Funds (2012-2014), President, Fixed Income (2011-2014), Vice President of Fidelity's Money Market Funds (2005-2009), President, Money Market Group Leader of FMR (2009), and Senior Vice President, Money Market Group of FMR (2004-2009). Mr. Morrison also served as Vice President of Fidelity's Bond Funds (2002-2005), certain Balanced Funds (2002-2005), and certain Asset Allocation Funds (2002-2007), and as Senior Vice President (2002-2005) of Fidelity's Bond Division. |
* Trustees have been determined to be "Interested Trustees" by virtue of, among other things, their affiliation with the trust or various entities under common control with FMR.
+ The information above includes each Trustee's principal occupation during the last five years and other information relating to the experience, attributes, and skills relevant to each Trustee's qualifications to serve as a Trustee, which led to the conclusion that each Trustee should serve as a Trustee for the fund.
Annual Report
Independent Trustees:
Correspondence intended for each Independent Trustee (that is, the Trustees other than the Interested Trustees) may be sent to Fidelity Investments, P.O. Box 55235, Boston, Massachusetts 02205-5235.
Name, Year of Birth; Principal Occupations and Other Relevant Experience+ |
Dennis J. Dirks (1948) |
Year of Election or Appointment: 2005 Trustee |
| Mr. Dirks also serves as Trustee of other Fidelity funds. Prior to his retirement in May 2003, Mr. Dirks was Chief Operating Officer and a member of the Board of The Depository Trust & Clearing Corporation (DTCC). He also served as President, Chief Operating Officer, and Board member of The Depository Trust Company (DTC) and President and Board member of the National Securities Clearing Corporation (NSCC). In addition, Mr. Dirks served as Chief Executive Officer and Board member of the Government Securities Clearing Corporation, Chief Executive Officer and Board member of the Mortgage-Backed Securities Clearing Corporation, as a Trustee and a member of the Finance Committee of Manhattan College (2005-2008), and as a Trustee and a member of the Finance Committee of AHRC of Nassau County (2006-2008). Mr. Dirks is a member of the Independent Directors Council (IDC) Governing Council (2010-present) and Board of Directors for The Brookville Center for Children's Services, Inc. (2009-present). |
Alan J. Lacy (1953) |
Year of Election or Appointment: 2008 Trustee |
| Mr. Lacy also serves as Trustee of other Fidelity funds. Mr. Lacy serves as Senior Adviser (2007-present) of Oak Hill Capital Partners, L.P. (private equity). Mr. Lacy also served as Chief Executive Officer (2000-2005) and Vice Chairman (2005-2006) of Sears Holdings Corporation and Sears, Roebuck and Co. (retail). In addition, Mr. Lacy serves as a member of the Board of Directors of Dave & Buster's Entertainment, Inc. (restaurant and entertainment complexes, 2010-present), Earth Fare, Inc. (retail grocery, 2012-present), The Hillman Companies, Inc. (hardware wholesalers, 2010-present), and Bristol-Myers Squibb Company (global pharmaceuticals, 2008-present). Mr. Lacy is a member of the Board of Trustees of The National Parks Conservation Association (2006-present). Previously, Mr. Lacy served as Chairman of the Board of Trustees of the National Parks Conservation Association (2008-2011) and as a member of the Board of Directors for the Western Union Company (global money transfer, 2006-2011). |
Ned C. Lautenbach (1944) |
Year of Election or Appointment: 2000 Trustee Chairman of the Independent Trustees |
| Mr. Lautenbach also serves as Trustee of other Fidelity funds. Mr. Lautenbach currently serves as the Lead Director of the Eaton Corporation Board of Directors (diversified industrial, 1997-present). Mr. Lautenbach is Chairman of the Board of Directors of the Philharmonic Center for the Arts in Naples, Florida (2012-present) and a member of the Council on Foreign Relations (1994-present). Previously, Mr. Lautenbach was a Partner/Advisory Partner at Clayton, Dubilier & Rice, LLC (private equity investment, 1998-2010), as well as a Director of Sony Corporation (2006-2007). |
Joseph Mauriello (1944) |
Year of Election or Appointment: 2008 Trustee |
| Mr. Mauriello also serves as Trustee of other Fidelity funds. Prior to his retirement in January 2006, Mr. Mauriello served in numerous senior management positions including Deputy Chairman and Chief Operating Officer (2004-2005), and Vice Chairman of Financial Services (2002-2004) of KPMG LLP US (professional services, 1965-2005). Mr. Mauriello currently serves as a member of the Board of Directors of XL Group plc. (global insurance and re-insurance, 2006-present). Previously, Mr. Mauriello served as a Director of the Hamilton Funds of the Bank of New York (2006-2007) and of Arcadia Resources Inc. (health care services and products, 2007-2012). |
Robert W. Selander (1950) |
Year of Election or Appointment: 2011 Trustee |
| Mr. Selander also serves as Trustee of other Fidelity funds. Previously, Mr. Selander served as a Member of the Advisory Board of other Fidelity funds (2011), and Executive Vice Chairman (2010), Chief Executive Officer (2009-2010), and President and Chief Executive Officer (1997-2009) of Mastercard, Inc. |
Cornelia M. Small (1944) |
Year of Election or Appointment: 2005 Trustee |
| Ms. Small also serves as Trustee of other Fidelity funds. Ms. Small is a member of the Board of Directors (2009-present) and Chair of the Investment Committee (2010-present) of the Teagle Foundation. Ms. Small also serves on the Investment Committee of the Berkshire Taconic Community Foundation (2008-present). Previously, Ms. Small served as Chairperson (2002-2008) and a member of the Investment Committee and Chairperson (2008-2012) and a member of the Board of Trustees of Smith College. In addition, Ms. Small served as Chief Investment Officer, Director of Global Equity Investments, and a member of the Board of Directors of Scudder, Stevens & Clark and Scudder Kemper Investments. |
William S. Stavropoulos (1939) |
Year of Election or Appointment: 2001 Trustee Vice Chairman of the Independent Trustees |
| Mr. Stavropoulos also serves as Trustee of other Fidelity funds. Mr. Stavropoulos serves as President and Founder of the Michigan Baseball Foundation, the Great Lakes Loons (2007-present). Mr. Stavropoulos is Chairman Emeritus of the Board of Directors of The Dow Chemical Company, where he previously served in numerous senior management positions, including President, CEO (1995-2000; 2002-2004), Chairman of the Executive Committee (2000-2006), and as a member of the Board of Directors (1990-2006). Currently, Mr. Stavropoulos is Chairman of the Board of Directors of Univar Inc. (global distributor of commodity and specialty chemicals), a Director of Teradata Corporation (data warehousing and technology solutions), and Maersk Inc. (industrial conglomerate), and a member of the Advisory Board for Metalmark Capital LLC (private equity investment, 2005-present). Mr. Stavropoulos is an operating advisor to Clayton, Dubilier & Rice, LLC (private equity investment). In addition, Mr. Stavropoulos is a member of the University of Notre Dame Advisory Council for the College of Science, a Trustee of the Rollin L. Gerstacker Foundation, and a Director of the Naples Philharmonic Center for the Arts. Previously, Mr. Stavropoulos served as a Director of Chemical Financial Corporation (bank holding company, 1993-2012) and Tyco International, Ltd. (multinational manufacturing and services, 2007-2012). |
David M. Thomas (1949) |
Year of Election or Appointment: 2008 Trustee |
| Mr. Thomas also serves as Trustee of other Fidelity funds. Mr. Thomas serves as Non-Executive Chairman of the Board of Directors of Fortune Brands Home and Security (home and security products, 2011-present), and as a member of the Board of Directors of Interpublic Group of Companies, Inc. (marketing communication, 2004-present). Previously, Mr. Thomas served as Executive Chairman (2005-2006) and Chairman and Chief Executive Officer (2000-2005) of IMS Health, Inc. (pharmaceutical and healthcare information solutions), and a Director of Fortune Brands, Inc. (consumer products, 2000-2011). |
+ The information above includes each Trustee's principal occupation during the last five years and other information relating to the experience, attributes, and skills relevant to each Trustee's qualifications to serve as a Trustee, which led to the conclusion that each Trustee should serve as a Trustee for the fund.
Advisory Board Member and Officers:
Correspondence intended for each officer and Peter S. Lynch may be sent to Fidelity Investments, 245 Summer Street, Boston, Massachusetts 02210. Officers appear below in alphabetical order.
Name, Year of Birth; Principal Occupation |
Peter S. Lynch (1944) |
Year of Election or Appointment: 2003 Member of the Advisory Board |
| Mr. Lynch also serves as Member of the Advisory Board of other Fidelity funds. Mr. Lynch is Vice Chairman and a Director of FMR and FMR Co., Inc. In addition, Mr. Lynch serves as a Trustee of Boston College and as the Chairman of the Inner-City Scholarship Fund. Previously, Mr. Lynch served on the Special Olympics International Board of Directors (1997-2006). |
Elizabeth Paige Baumann (1968) |
Year of Election or Appointment: 2012 Anti-Money Laundering (AML) Officer |
| Ms. Baumann also serves as AML Officer of other funds. She is Chief AML Officer of FMR LLC (2012-present) and is an employee of Fidelity Investments. Previously, Ms. Baumann served as Vice President and Deputy Anti-Money Laundering Officer (2007-2012). |
William C. Coffey (1969) |
Year of Election or Appointment: 2009 Assistant Secretary |
| Mr. Coffey also serves as Assistant Secretary of other funds. He is Senior Vice President and Deputy General Counsel of FMR LLC (2010-present), and is an employee of Fidelity Investments. Previously, Mr. Coffey served as Vice President and Associate General Counsel of FMR LLC (2005-2009). |
Jonathan Davis (1968) |
Year of Election or Appointment: 2010 Assistant Treasurer |
| Mr. Davis also serves as Assistant Treasurer of other funds. Mr. Davis is an employee of Fidelity Investments. Previously, Mr. Davis served as Vice President and Associate General Counsel of FMR LLC (2003-2010). |
Adrien E. Deberghes (1967) |
Year of Election or Appointment: 2008 Deputy Treasurer |
| Mr. Deberghes also serves as an officer of other funds. He is an employee of Fidelity Investments (2008-present). Prior to joining Fidelity Investments, Mr. Deberghes was Senior Vice President of Mutual Fund Administration at State Street Corporation (2007-2008), Senior Director of Mutual Fund Administration at Investors Bank & Trust (2005-2007), and Director of Finance for Dunkin' Brands (2000-2005). |
Stephanie J. Dorsey (1969) |
Year of Election or Appointment: 2010 Assistant Treasurer |
| Ms. Dorsey also serves as an officer of other funds. She is an employee of Fidelity Investments (2008-present) and has served in other fund officer roles. Prior to joining Fidelity Investments, Ms. Dorsey served as Treasurer (2004-2008) of the JPMorgan Mutual Funds and Vice President (2004-2008) of JPMorgan Chase Bank. |
Howard J. Galligan III (1966) |
Year of Election or Appointment: 2014 Chief Financial Officer |
| Mr. Galligan also serves as Chief Financial Officer of other funds. Mr. Galligan serves as President of Fidelity Pricing and Cash Management Services (FPCMS) (2014-present) and as a Director of Strategic Advisers, Inc. (2008-present). Previously, Mr. Galligan served as Chief Administrative Officer of Asset Management (2011-2014) and Chief Operating Officer and Senior Vice President of Investment Support for Strategic Advisers, Inc. (2003-2011). |
Scott C. Goebel (1968) |
Year of Election or Appointment: 2008 Secretary and Chief Legal Officer (CLO) |
| Mr. Goebel serves as Secretary and CLO of other funds. Mr. Goebel also serves as Secretary of Fidelity SelectCo, LLC (2013-present), Fidelity Investments Money Management, Inc. (FIMM) (2010-present) and Fidelity Research and Analysis Company (FRAC) (2010-present); General Counsel, Secretary, and Senior Vice President of FMR (2008-present) and FMR Co., Inc. (2008-present); Chief Legal Officer of Fidelity Management & Research (Hong Kong) Limited (2008-present); and Assistant Secretary of Fidelity Management & Research (Japan) Limited (2008-present) and Fidelity Management & Research (U.K.) Inc. (2008-present). Previously, Mr. Goebel served as Secretary and CLO of other Fidelity funds (2008-2013), Assistant Secretary of FIMM (2008-2010), FRAC (2008-2010), and certain funds (2007-2008); and as Vice President and Secretary of Fidelity Distributors Corporation (FDC) (2005-2007). Mr. Goebel has been employed by FMR LLC or an affiliate since 2001. |
Thomas C. Hense (1964) |
Year of Election or Appointment: 2008/2010 Vice President |
| Mr. Hense also serves as Vice President of other funds (High Income (2008), Small Cap (2008), and Value (2010) funds). Previously, Mr. Hense served as a portfolio manager for Fidelity's Institutional Money Management Group (Pyramis) (2003-2008). |
Brian B. Hogan (1964) |
Year of Election or Appointment: 2009 Vice President |
| Mr. Hogan also serves as Trustee or Vice President of other funds. Mr. Hogan serves as a Director of Fidelity SelectCo, LLC (2014-present) and President of FMR's Equity Division (2009-present). Previously, Mr. Hogan served as Senior Vice President, Equity Research of FMR (2006-2009) and as a portfolio manager. |
Chris Maher (1972) |
Year of Election or Appointment: 2013 Assistant Treasurer |
| Mr. Maher serves as Assistant Treasurer of other funds. Mr. Maher is Vice President of Valuation Oversight and is an employee of Fidelity Investments. Previously, Mr. Maher served as Vice President of Asset Management Compliance (2013), Vice President of FMR's Program Management Group (2010-2013), and Vice President of Valuation Oversight (2008-2010). |
Kenneth B. Robins (1969) |
Year of Election or Appointment: 2008 President and Treasurer |
| Mr. Robins also serves as an officer of other funds. Mr. Robins serves as Executive Vice President of Fidelity Investments Money Management, Inc. (FIMM) (2013-present) and is an employee of Fidelity Investments (2004-present). Previously, Mr. Robins served in other fund officer roles. |
Stephen Sadoski (1971) |
Year of Election or Appointment: 2012 Deputy Treasurer |
| Mr. Sadoski also serves as Deputy Treasurer of other funds. He is an employee of Fidelity Investments (2012-present) and has served in another fund officer role. Prior to joining Fidelity Investments, Mr. Sadoski served as an assistant chief accountant in the Division of Investment Management of the Securities and Exchange Commission (SEC) (2009-2012) and as a senior manager at Deloitte & Touche LLP (1997-2009). |
Stacie M. Smith (1974) |
Year of Election or Appointment: 2013 Deputy Treasurer |
| Ms. Smith also serves as an officer of other funds. She is an employee of Fidelity Investments (2009-present) and has served in other fund officer roles. Prior to joining Fidelity Investments, Ms. Smith served as Senior Audit Manager of Ernst & Young LLP (1996-2009). |
Renee Stagnone (1975) |
Year of Election or Appointment: 2013 Deputy Treasurer |
| Ms. Stagnone also serves as Deputy Treasurer of other funds. Ms. Stagnone is an employee of Fidelity Investments. |
Linda J. Wondrack (1964) |
Year of Election or Appointment: 2014 Chief Compliance Officer |
| Ms. Wondrack also serves as Chief Compliance Officer of other funds. Ms. Wondrack is Executive Vice President and head of the Ethics Office and Asset Management Compliance for Fidelity Investments (2012-present). Ms. Wondrack also serves as Chief Compliance Officer of Fidelity SelectCo, LLC (2014-present); Chief Compliance Officer of Impresa Management LLC (2013-present); and Chief Compliance Officer of FMR Co., Inc., Fidelity Investments Money Management, Inc., Fidelity Management & Research (Japan) Limited, Fidelity Management & Research (U.K.) Inc., Fidelity Management & Research (Hong Kong), Fidelity Management & Research Company, Pyramis Global Advisors, LLC, and Strategic Advisers, Inc., Ballyrock Investment Advisors LLC, and Northern Neck Investors LLC (2012-present). Previously, Ms. Wondrack served as Senior Vice President and Chief Compliance Officer for Columbia Management Investment Advisers, LLC (2005-2012); Chief Compliance Officer for certain funds within the Columbia Family of Funds (2007-2012); and Senior Vice President of Compliance Risk Management at Bank of America (2005-2010). |
Joseph F. Zambello (1957) |
Year of Election or Appointment: 2011 Deputy Treasurer |
| Mr. Zambello also serves as Deputy Treasurer of other funds. Mr. Zambello is an employee of Fidelity Investments. Previously, Mr. Zambello served as Vice President of FMR's Program Management Group (2009-2011) and Vice President of the Transfer Agent Oversight Group (2005-2009). |
Annual Report
Board Approval of Investment Advisory Contracts and Management Fees
Fidelity Advisor Value Leaders Fund
Each year, the Board of Trustees, including the Independent Trustees (together, the Board), votes on the renewal of the management contract with Fidelity Management & Research Company (FMR) and the sub-advisory agreements (together, the Advisory Contracts) for the fund. The Board, assisted by the advice of fund counsel and Independent Trustees' counsel, requests and considers a broad range of information relevant to the renewal of the Advisory Contracts throughout the year.
The Board meets regularly and, at each of its meetings, covers an extensive agenda of topics and materials and considers factors that are relevant to its annual consideration of the renewal of the fund's Advisory Contracts, including the services and support provided to the fund and its shareholders. The Board has established various standing committees (Committees), each composed of and chaired by Independent Trustees with varying backgrounds, to which the Board has assigned specific subject matter responsibilities in order to enhance effective decision-making by the Board. The Board, acting directly and through its Committees, requests and receives information concerning the annual consideration of the renewal of the fund's Advisory Contracts. The Board also meets as needed to consider matters specifically related to the Board's annual consideration of the renewal of the Advisory Contracts. Members of the Board may also meet with trustees of other Fidelity funds through ad hoc joint committees to discuss certain matters relevant to the Fidelity funds.
At its July 2014 meeting, the Board, including the Independent Trustees, unanimously determined to renew the fund's Advisory Contracts. In reaching its determination, the Board considered all factors it believed relevant, including (i) the nature, extent, and quality of the services to be provided to the fund and its shareholders (including the investment performance of the fund); (ii) the competitiveness of the fund's management fee and total expense ratio relative to peer funds; (iii) the total costs of the services to be provided by and the profits to be realized by Fidelity from its relationship with the fund; (iv) the extent to which economies of scale exist and would be realized as the fund grows; and (v) whether fee levels reflect these economies of scale, if any, for the benefit of fund shareholders. In connection with separate internal corporate reorganizations involving Fidelity Management & Research (U.K.) Inc. (FMR U.K.) and Fidelity Management & Research (Japan) Inc. (FMR Japan), the Board approved certain non-material amendments to the fund's sub-advisory agreements with FMR U.K. and FMR Japan to reflect that, after these reorganizations, FMR Investment Management (UK) Limited and Fidelity Management & Research (Japan) Limited will carry on the business of FMR U.K. and FMR Japan, respectively. The Board noted that no changes to the portfolio managers or to the foreign research or investment advisory services provided to the fund were expected in connection with either reorganization and that the same personnel and resources would continue to be available to the fund at the new entities.
Annual Report
Board Approval of Investment Advisory Contracts and
Management Fees - continued
In considering whether to renew the Advisory Contracts for the fund, the Board reached a determination, with the assistance of fund counsel and Independent Trustees' counsel and through the exercise of its business judgment, that the renewal of the Advisory Contracts was in the best interests of the fund and its shareholders and that the compensation payable under the Advisory Contracts was fair and reasonable. The Board's decision to renew the Advisory Contracts was not based on any single factor, but rather was based on a comprehensive consideration of all the information provided to the Board at its meetings throughout the year. The Board, in reaching its determination to renew the Advisory Contracts, was aware that shareholders of the fund have a broad range of investment choices available to them, including a wide choice among funds offered by Fidelity's competitors, and that the fund's shareholders, who have the opportunity to review and weigh the disclosure provided by the fund in its prospectus and other public disclosures, have chosen to invest in this fund, which is part of the Fidelity family of funds.
Nature, Extent, and Quality of Services Provided. The Board considered Fidelity's staffing as it relates to the fund, including the backgrounds of investment personnel of FMR and the sub-advisers (together, the Investment Advisers), and also considered the fund's investment objective, strategies, and related investment philosophy. The Independent Trustees also had discussions with senior management of Fidelity's investment operations and investment groups. The Board considered the structure of the portfolio manager compensation program and whether this structure provides appropriate incentives to act in the best interests of the fund. Additionally, the Board considered the portfolio managers' investments, if any, in the funds that they manage.
Resources Dedicated to Investment Management and Support Services. The Board and the Fund Oversight and Research Committees reviewed the general qualifications and capabilities of Fidelity's investment staff, including its size, education, experience, and resources, as well as Fidelity's approach to recruiting, training, managing, and compensating investment personnel. The Board noted that Fidelity has continued to increase the resources devoted to non-U.S. offices, including expansion of Fidelity's global investment organization. The Board also noted that Fidelity's analysts have extensive resources, tools and capabilities that allow them to conduct sophisticated quantitative and fundamental analysis, as well as credit analysis of issuers, counterparties and guarantors. Further, the Board believes that Fidelity's investment professionals have sufficient access to global information and data so as to provide competitive investment results over time, and that those professionals also have access to sophisticated tools that permit them to assess portfolio construction and risk and performance attribution characteristics continuously, as well as to transmit new information and research conclusions rapidly around the world. Additionally, in its deliberations, the Board considered Fidelity's trading and risk management capabilities and resources and global compliance infrastructure, which are an integral part of the investment management process.
Annual Report
Shareholder and Administrative Services. The Board considered (i) the nature, extent, quality, and cost of advisory, administrative, and shareholder services performed by the Investment Advisers and their affiliates under the Advisory Contracts and under separate agreements covering transfer agency, pricing and bookkeeping, and securities lending services for the fund; (ii) the nature and extent of the supervision of third party service providers, principally custodians and subcustodians; and (iii) the resources devoted to, and the record of compliance with, the fund's compliance policies and procedures. The Board also reviewed the allocation of fund brokerage, including allocations to brokers affiliated with the Investment Advisers, the use of brokerage commissions to pay fund expenses, and the use of "soft" commission dollars to pay for research services.
The Board noted that the growth of fund assets over time across the complex allows Fidelity to reinvest in the development of services designed to enhance the value or convenience of the Fidelity funds as investment vehicles. These services include 24-hour access to account information and market information through telephone representatives and over the Internet, investor education materials and asset allocation tools, and the expanded availability of Fidelity Investor Centers.
In 2014, the Board formed an ad hoc Committee on Transfer Agency Fees to review the variety of transfer agency fee structures throughout the industry and Fidelity's competitive positioning with respect to industry participants.
Investment in a Large Fund Family. The Board considered the benefits to shareholders of investing in a Fidelity fund, including the benefits of investing in a fund that is part of a large family of funds offering a variety of investment disciplines and providing a large variety of mutual fund investor services. The Board noted that Fidelity had taken, or had made recommendations that resulted in the Fidelity funds taking, a number of actions over the previous year that benefited particular funds, including (i) continuing to dedicate additional resources to investment research and to the support of the senior management team that oversees asset management; (ii) persisting in efforts to enhance Fidelity's global research capabilities; (iii) launching new funds and making other enhancements to meet client needs for income-oriented solutions; (iv) reducing fund expenses for certain index funds; (v) continuing to launch dedicated lower cost underlying funds to meet portfolio construction needs related to expanding underlying fund options for Fidelity funds of funds, specifically for the Freedom Fund product lines; (vi) rationalizing product lines and gaining increased efficiencies through fund mergers; (vii) launching sector-based exchange-traded funds and establishing a new Fidelity adviser to manage sector-based funds and products; (viii) continuing to develop and implement technology to improve security and increase efficiency; (ix) modifying the eligibility criteria for certain share classes to increase their marketability to a portion of the defined contribution plan market; (x) waiving redemption fees for certain qualified fund-of-fund and wrap programs and certain retirement plan transactions; and (xi) launching new Institutional Class shares of certain money market funds to attract and retain assets and to fill a gap in the money market fund lineup.
Annual Report
Board Approval of Investment Advisory Contracts and
Management Fees - continued
Investment Performance. The Board considered whether the fund has operated in accordance with its investment objective, as well as its record of compliance with its investment restrictions and its performance history.
The Board took into account discussions with the Investment Advisers about fund investment performance that occur at Board meetings throughout the year. In this regard the Board noted that as part of regularly scheduled fund reviews and other reports to the Board on fund performance, the Board periodically considers annualized return information for the fund, for different time periods, measured against a securities market index ("benchmark index") and a peer group of funds with similar objectives ("peer group"). In its evaluation of fund investment performance, the Board gave particular attention to information indicating changes in performance of certain Fidelity funds for specific time periods and the Investment Advisers' explanations for any overperformance or underperformance.
In addition to reviewing absolute and relative fund performance, the Independent Trustees periodically consider the appropriateness of fund performance metrics in evaluating the results achieved. In general, the Independent Trustees believe that fund performance should be evaluated based on net performance (after fees and expenses) of both the highest performing and lowest performing classes, where applicable, compared to appropriate benchmark indices, over appropriate time periods which may include full market cycles, and compared to peer groups, as applicable, over the same periods, taking into account relevant factors including the following: general market conditions; issuer-specific information; tactical opportunities for investment; and fund cash flows and other factors.
The Independent Trustees recognize that shareholders evaluate performance on a net basis over their own holding periods, for which one-, three-, and five-year periods are often used as a proxy. For this reason, the performance information reviewed by the Board also included net cumulative calendar year total return information for the fund and an appropriate benchmark index and peer group for the most recent one-, three-, and five-year periods, as shown below. Returns are shown compared to the 25th percentile (top of box, 75% beaten) and 75th percentile (bottom of box, 25% beaten) of the peer universe.
Annual Report
Fidelity Advisor Value Leaders Fund
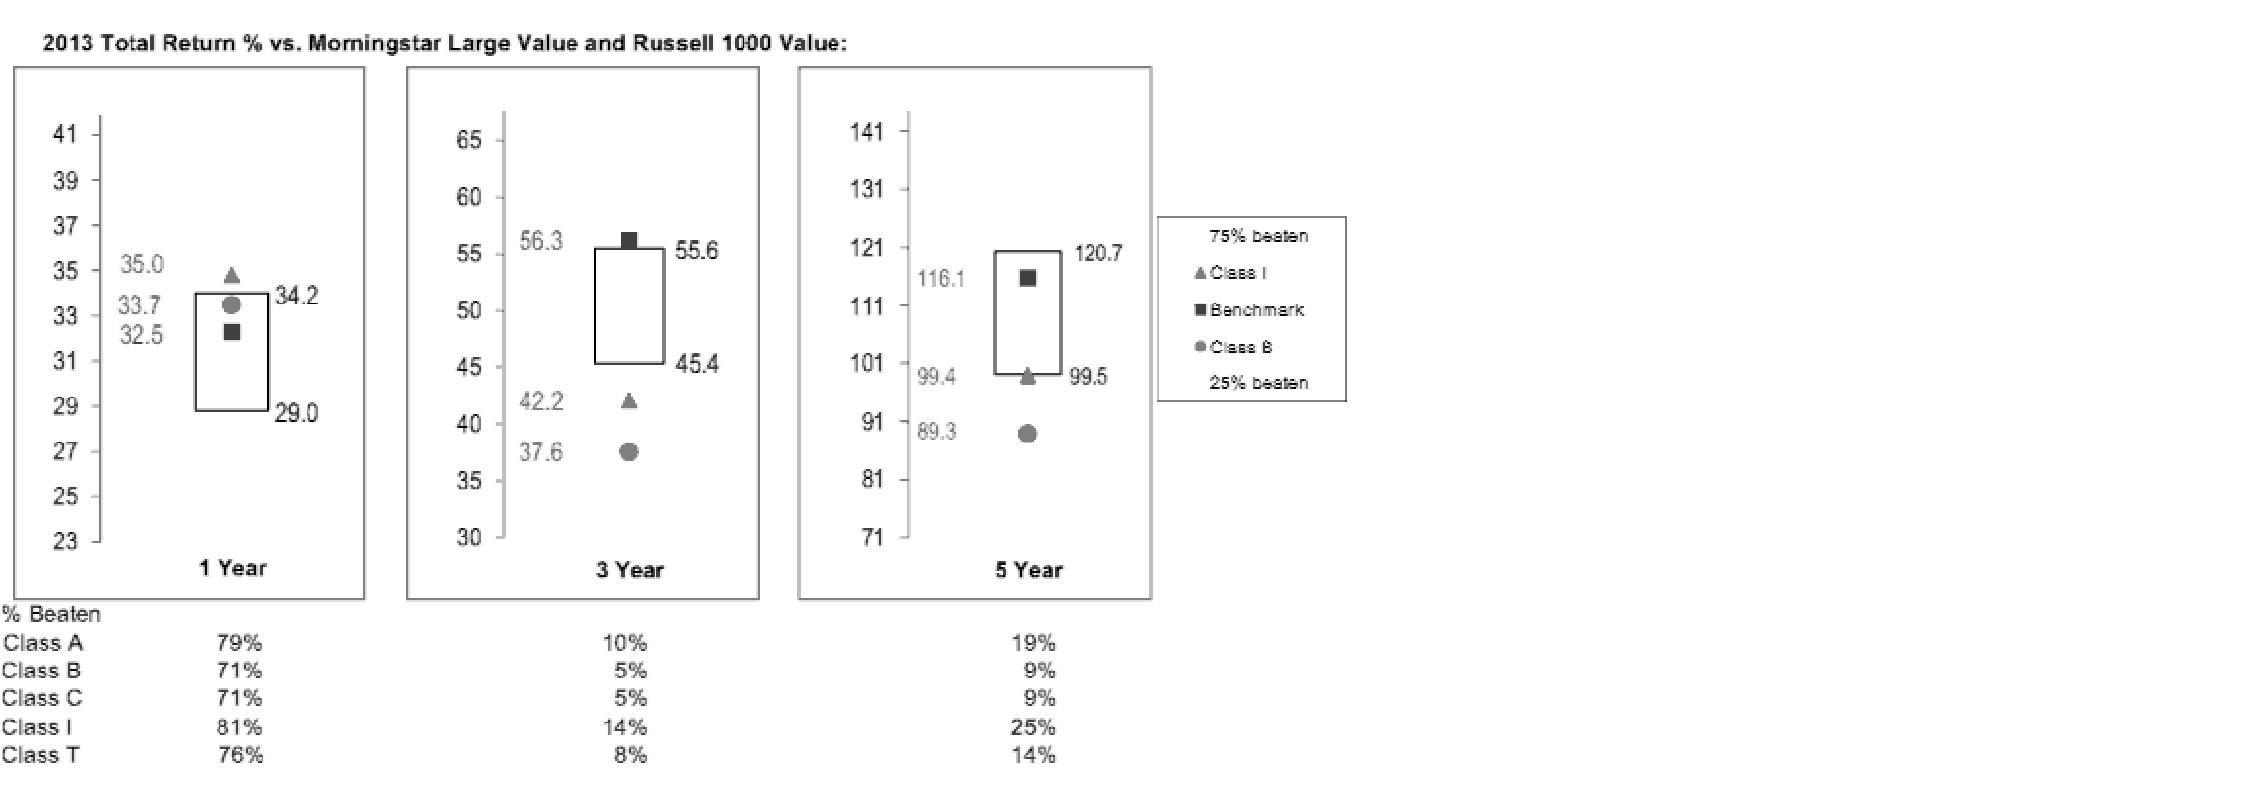
The Board also considered that the fund's management fee is subject to upward or downward adjustment depending upon whether, and to what extent, the fund's investment performance for the performance period exceeds, or is exceeded by, a securities index, thus leading to a performance adjustment for the same period. The Board noted that the performance adjustment provides FMR with a strong economic incentive to seek to achieve superior performance for the fund's shareholders and helps to more closely align the interests of FMR and the fund's shareholders.
Based on its review, the Board concluded that the nature, extent, and quality of services provided to the fund under the Advisory Contracts should benefit the fund's shareholders.
Competitiveness of Management Fee and Total Expense Ratio. The Board considered the fund's management fee and total expense ratio compared to "mapped groups" of competitive funds and classes. Fidelity creates "mapped groups" by combining similar Lipper investment objective categories that have comparable investment mandates. Combining Lipper investment objective categories aids the Board's management fee and total expense ratio comparisons by broadening the competitive group used for comparison and by reducing the number of universes to which various Fidelity funds are compared.
Management Fee. The Board considered two proprietary management fee comparisons for the 12-month periods shown in the chart below. The group of Lipper funds used by the Board for management fee comparisons is referred to below as the "Total Mapped Group." The Total Mapped Group comparison focuses on a fund's standing in terms of gross management fees before expense reimbursements or caps, and without giving effect to the fund's performance adjustment, relative to the total universe of funds with comparable investment mandates, regardless of whether their management fee structures also are comparable. Funds with comparable investment mandates offer exposure to similar types of securities. Funds with comparable management fee structures have similar management fee contractual arrangements (e.g., flat rate charged for advisory services, all-inclusive fee rate, etc.). "TMG %" represents the percentage of funds in the Total Mapped Group that had management fees that were lower than the fund's. For example, a hypothetical TMG % of 20% would mean that 80% of the funds in the Total Mapped Group had higher, and 20% had lower, management fees than the fund. The fund's actual TMG %s are in the chart below. The "Asset-Size Peer Group" (ASPG) comparison focuses on a fund's standing relative to a subset of non-Fidelity funds within the Total Mapped Group that are similar in size and management fee structure. For example, if a fund is in the first quartile of the ASPG, the fund's management fee ranks in the least expensive or lowest 25% of funds in the ASPG. The ASPG represents at least 15% of the funds in the Total Mapped Group with comparable asset size and management fee structures, subject to a minimum of 50 funds (or all funds in the Total Mapped Group if fewer than 50). Additional information, such as the ASPG quartile in which the fund's management fee rate ranked and the impact of the fund's performance adjustment, is also included in the chart and considered by the Board.
Annual Report
Board Approval of Investment Advisory Contracts and
Management Fees - continued
Fidelity Advisor Value Leaders Fund
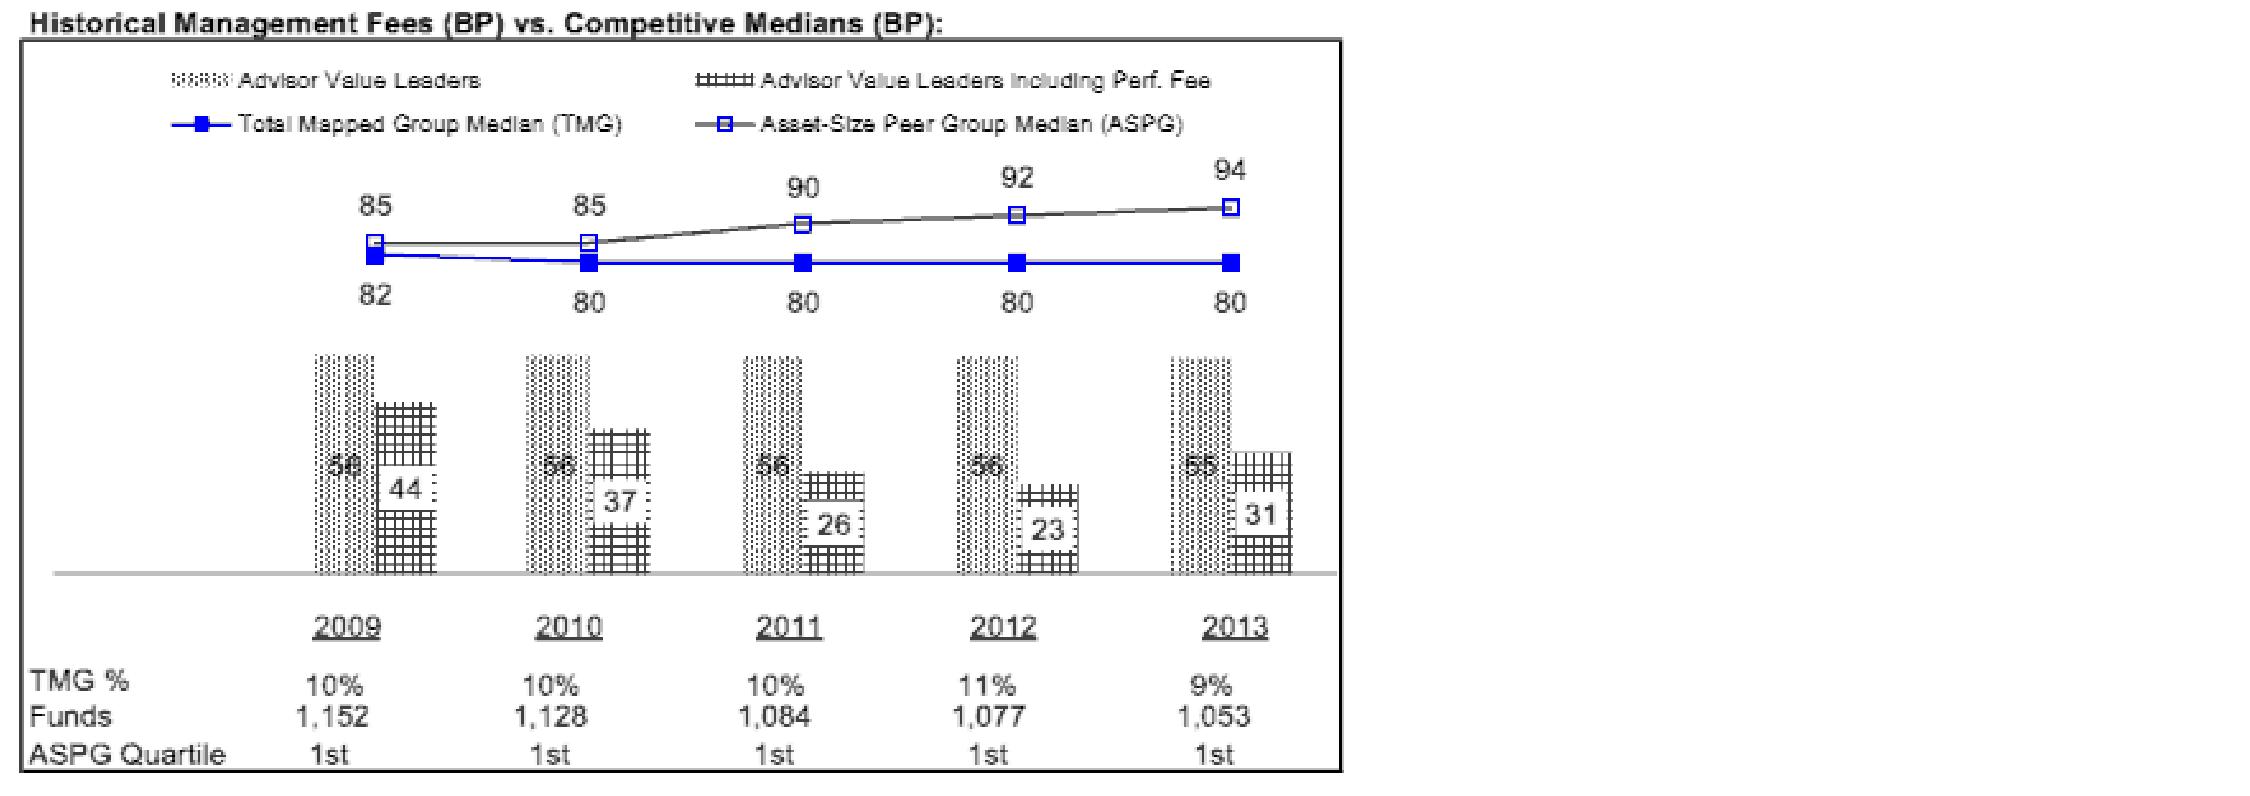
The Board noted that the fund's management fee rate ranked below the median of its Total Mapped Group and below the median of its ASPG for 2013. The Board also noted the effect of the fund's negative performance adjustment on the fund's management fee ranking.
Annual Report
The Board also noted that, in August 2013, the ad hoc Committee on Management Fees was formed to conduct an in-depth review of the management fee rates of Fidelity's active equity mutual funds. The Committee focused on the following areas: (i) standard fee structures; (ii) research consumption and trading evolution; (iii) management fee competitiveness/profitability by category; and (iv) factors that drive institutional pricing.
Based on its review, the Board concluded that the fund's management fee is fair and reasonable in light of the services that the fund receives and the other factors considered.
Total Expense Ratio. In its review of each class's total expense ratio, the Board considered the fund's management fee as well as other fund or class expenses, as applicable, such as transfer agent fees, pricing and bookkeeping fees, fund-paid 12b-1 fees, and custodial, legal, and audit fees. The Board also noted the effects of any waivers and reimbursements on fees and expenses, as well as the impact of the fund's performance adjustment. As part of its review, the Board also considered the current and historical total expense ratios of each class of the fund compared to competitive fund median expenses. Each class of the fund is compared to those funds and classes in the Total Mapped Group (used by the Board for management fee comparisons) that have a similar sales load structure.
The Board noted that the total expense ratio of Institutional Class ranked below its competitive median for 2013, the total expense ratio of Class A ranked equal to its competitive median for 2013, and the total expense ratio of each of Class T, Class B, and Class C ranked above its competitive median for 2013. The Board considered that, in general, various factors can affect total expense ratios. The Board noted that the total expense ratio of Class T was above the competitive median primarily because of higher 12b-1 fees on Class T as compared to most competitor funds. Class T has a higher 12b-1 fee, but a lower front-end sales charge, than traditionally priced front-end sales charge classes. The Board considered that Class T is primarily sold load-waived in the retirement plan market where its 0.50% 12b-1 fee is comparable to competing no-load, higher 12b-1 fee classes designed specifically for retirement plans. The Board noted that the fund offers multiple classes, each of which has a different sales load and 12b-1 fee structure, and that the multiple structures are intended to offer a range of pricing options for the intermediary market. The Board also noted that the total expense ratios of the classes vary primarily by the level of their 12b-1 fees, although differences in transfer agent fees may also cause expenses to vary from class to class.
Fees Charged to Other Fidelity Clients. The Board also considered Fidelity fee structures and other information with respect to clients of Fidelity, such as other funds advised or subadvised by Fidelity, pension plan clients, and other institutional clients. The Board noted the findings of the 2013 ad hoc joint committee (created with the board of other Fidelity funds), which reviewed and compared Fidelity's institutional investment advisory business with its business of providing services to the Fidelity funds, including the differences in services provided, fees charged, and costs incurred, as well as competition in their respective marketplaces.
Annual Report
Board Approval of Investment Advisory Contracts and
Management Fees - continued
Based on its review of total expense ratios and fees charged to other Fidelity clients, the Board concluded that the total expense ratio of each class of the fund was reasonable, although in some cases above the median of the universe presented for comparison, in light of the services that the fund and its shareholders receive and the other factors considered.
Costs of the Services and Profitability. The Board considered the revenues earned and the expenses incurred by Fidelity in conducting the business of developing, marketing, distributing, managing, administering and servicing the fund and servicing the fund's shareholders. The Board also considered the level of Fidelity's profits in respect of all the Fidelity funds.
On an annual basis, Fidelity presents to the Board Fidelity's profitability for the fund. Fidelity calculates the profitability for each fund, as well as aggregate profitability for groups of Fidelity funds and all Fidelity funds, using a series of detailed revenue and cost allocation methodologies which originate with the books and records of Fidelity on which Fidelity's audited financial statements are based. The Audit Committee of the Board reviews any significant changes from the prior year's methodologies.
PricewaterhouseCoopers LLP (PwC), independent registered public accounting firm and auditor to Fidelity and certain Fidelity funds, has been engaged annually by the Board as part of the Board's assessment of Fidelity's profitability analysis. PwC's engagement includes the review and assessment of the methodologies used by Fidelity in determining the revenues and expenses attributable to Fidelity's mutual fund business, and completion of agreed-upon procedures in respect of the mathematical accuracy of fund profitability and its conformity to established allocation methodologies. After considering PwC's reports issued under the engagement and information provided by Fidelity, the Board concluded that while other allocation methods may also be reasonable, Fidelity's profitability methodologies are reasonable in all material respects.
The Board also reviewed Fidelity's non-fund businesses and fall-out benefits related to the mutual fund business as well as cases where Fidelity's affiliates may benefit from or be related to the fund's business.
The Board considered the costs of the services provided by and the profits realized by Fidelity in connection with the operation of the fund and was satisfied that the profitability was not excessive in the circumstances.
Economies of Scale. The Board considered whether there have been economies of scale in respect of the management of the Fidelity funds, whether the Fidelity funds (including the fund) have appropriately benefited from any such economies of scale, and whether there is potential for realization of any further economies of scale. The Board considered the extent to which the fund will benefit from economies of scale through increased services to the fund, through waivers or reimbursements, or through fee or expense ratio reductions. The Board also noted that in 2013, it and the boards of other Fidelity funds created an ad hoc committee (the Economies of Scale Committee) to analyze whether Fidelity attains economies of scale in respect of the management and servicing of the Fidelity funds, whether the Fidelity funds have appropriately benefited from such economies of scale, and whether there is potential for realization of any further economies of scale.
Annual Report
The Board recognized that the fund's management contract incorporates a "group fee" structure, which provides for lower group fee rates as total group assets increase, and for higher group fee rates as total group assets decrease (with "group assets" defined to include fund assets under FMR's management plus sector fund assets previously under FMR's management and currently managed by Fidelity SelectCo, LLC). FMR calculates the group fee rates based on a tiered asset "breakpoint" schedule that varies based on asset class. The Board considered that the group fee is designed to deliver the benefits of economies of scale to fund shareholders when total Fidelity fund assets increase, even if assets of any particular fund are unchanged or have declined, because some portion of Fidelity's costs are attributable to services provided to all Fidelity funds, and all funds benefit if those costs can be allocated among more assets. The Board concluded that, given the group fee structure, fund shareholders will benefit from lower management fees as group assets increase at the fund complex level, regardless of whether Fidelity achieves any such economies of scale.
The Board concluded, taking into account the analysis of the Economies of Scale Committee, that economies of scale, if any, are being appropriately shared between fund shareholders and Fidelity.
Additional Information Requested by the Board. In order to develop fully the factual basis for consideration of the Fidelity funds' Advisory Contracts, the Board requested and received additional information on certain topics, including: (i) fund performance trends and Fidelity's long-term strategies for certain funds; (ii) Fidelity's strategic marketing and product lineup goals; (iii) the methodology with respect to competitive fund data and peer group classifications; (iv) the arrangements with, and performance of, certain sub-advisers on behalf of the Fidelity funds, as well as certain proposed participating affiliate arrangements; (v) the realization of fall-out benefits in certain Fidelity business units; (vi) Fidelity's group fee structures, including the rationale for the individual fee rates of certain categories of funds and the definition of group assets; (vii) trends regarding industry use of performance fee structures and the performance adjustment methodologies applicable to the Fidelity funds; (viii) additional competitive analysis regarding the total expenses for certain classes; (ix) fund profitability methodology, including Fidelity's cost allocation methodology, and the impact of certain factors on fund profitability results; and (x) the process by which Fidelity determines sub-advisory fees for funds it advises.
Annual Report
Board Approval of Investment Advisory Contracts and
Management Fees - continued
Based on its evaluation of all of the conclusions noted above, and after considering all factors it believed relevant, the Board ultimately concluded that the advisory fee structures are fair and reasonable, and that the fund's Advisory Contracts should be renewed.
Annual Report
Investment Adviser
Fidelity Management & Research Company
Boston, MA
Investment Sub-Advisers
FMR Co., Inc.
Fidelity Management & Research
(U.K.) Inc.
Fidelity Management & Research
(Hong Kong) Limited
Fidelity Management & Research
(Japan) Limited
General Distributor
Fidelity Distributors Corporation
Smithfield, RI
Transfer and Service Agents
Fidelity Investments Institutional Operations Company, Inc.
Boston, MA
Fidelity Service Company, Inc.
Boston, MA
Custodian
Brown Brothers Harriman & Company
Boston, MA
(Fidelity Investment logo)(registered trademark)
AVLF-UANN-1214
1.793576.111
(Fidelity Investment logo)(registered trademark)
Fidelity Advisor®
Value Leaders
Fund - Institutional Class
Annual Report
October 31, 2014
(Fidelity Cover Art)
Contents
Performance | (Click Here) | How the fund has done over time. |
Management's Discussion of Fund Performance | (Click Here) | The Portfolio Manager's review of fund performance and strategy. |
Shareholder Expense Example | (Click Here) | An example of shareholder expenses. |
Investment Changes | (Click Here) | A summary of major shifts in the fund's investments over the past six months. |
Investments | (Click Here) | A complete list of the fund's investments with their market values. |
Financial Statements | (Click Here) | Statements of assets and liabilities, operations, and changes in net assets, as well as financial highlights. |
Notes | (Click Here) | Notes to the financial statements. |
Report of Independent Registered Public Accounting Firm | (Click Here) | |
Trustees and Officers | (Click Here) | |
Board Approval of Investment Advisory Contracts and Management Fees | (Click Here) | |
To view a fund's proxy voting guidelines and proxy voting record for the 12-month period ended June 30, visit http://www.fidelity.com/proxyvotingresults or visit the Securities and Exchange Commission's (SEC) web site at http://www.sec.gov. You may also call 1-877-208-0098 to request a free copy of the proxy voting guidelines.
Standard & Poor's, S&P and S&P 500 are registered service marks of The McGraw-Hill Companies, Inc. and have been licensed for use by Fidelity Distributors Corporation.
Other third-party marks appearing herein are the property of their respective owners.
All other marks appearing herein are registered or unregistered trademarks or service marks of FMR LLC or an affiliated company. © 2014 FMR LLC. All rights reserved.
Annual Report
This report and the financial statements contained herein are submitted for the general information of the shareholders of the fund. This report is not authorized for distribution to prospective investors in the fund unless preceded or accompanied by an effective prospectus.
A fund files its complete schedule of portfolio holdings with the SEC for the first and third quarters of each fiscal year on Form N-Q. Forms N-Q are available on the SEC's web site at http://www.sec.gov. A fund's Forms N-Q may be reviewed and copied at the SEC's Public Reference Room in Washington, DC. Information regarding the operation of the SEC's Public Reference Room may be obtained by calling 1-800-SEC-0330. For a complete list of a fund's portfolio holdings, view the most recent holdings listing, semiannual report, or annual report on Fidelity's web site at http://www.fidelity.com, http://www.advisor.fidelity.com, or http://www.401k.com, as applicable.
NOT FDIC INSURED • MAY LOSE VALUE • NO BANK GUARANTEE
Neither the fund nor Fidelity Distributors Corporation is a bank.
Annual Report
Average annual total return reflects the change in the value of an investment, assuming reinvestment of the class' distributions from dividend income and capital gains (the profits earned upon the sale of securities that have grown in value, if any) and assuming a constant rate of performance each year. The $10,000 table and the fund's returns do not reflect the deduction of taxes that a shareholder would pay on fund distributions or the redemption of fund shares. During periods of reimbursement by Fidelity, a fund's total return will be greater than it would be had the reimbursement not occurred. How a fund did yesterday is no guarantee of how it will do tomorrow.
Average Annual Total Returns
Periods ended October 31, 2014 | Past 1
year | Past 5
years | Past 10 years |
Institutional Class | 15.35% | 12.69% | 5.53% |
$10,000 Over 10 Years
Let's say hypothetically that $10,000 was invested in Fidelity Advisor® Value Leaders Fund - Institutional Class on October 31, 2004. The chart shows how the value of your investment would have changed, and also shows how the Russell 1000® Value Index performed over the same period.
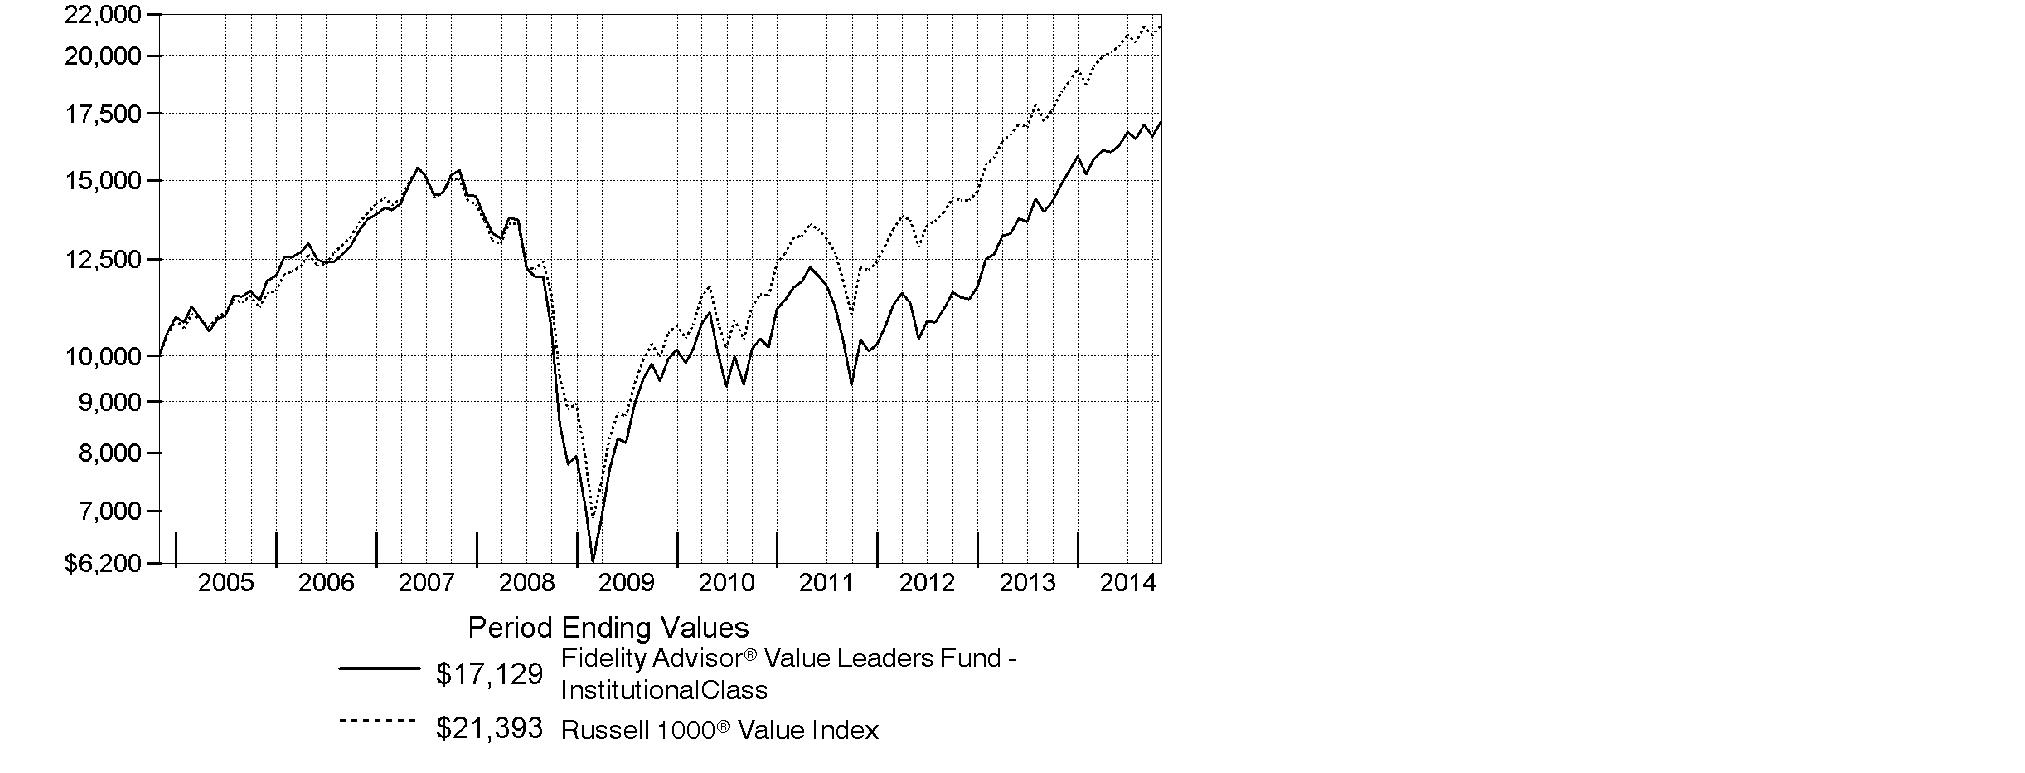
Annual Report
Market Recap: The U.S. market nearly closed at an all-time high for the 12 months ending October 31, 2014, supported by low interest rates and strong corporate profits. The large-cap S&P 500® Index gained 17.27%, clawing back from an October sell-off fueled by fears of a new global economic slump. Growth stocks in the index outperformed value-oriented names. The tech-heavy Nasdaq Composite Index® advanced 19.58%, while the small-cap Russell 2000® Index returned a relatively lackluster 8.06% amid growth and valuation worries. Health care (+30%) was the top sector in the S&P 500®, spurred partly by the pharmaceuticals, biotechnology & life sciences industry. Information technology (+26%) also outperformed. Conversely, energy (+4%) lagged the index, reflecting a sharp drop in crude prices beginning in June, attributed to weaker demand and a U.S. shale-drilling supply boom. Industrials (+15%) and consumer discretionary (+9%) - sectors that tend to rise and fall with economic expectations - also trailed the broader market. Volatility was tame for much of the period but spiked to a three-year high in October amid growth concerns, Ebola fears and continued unrest in Syria, Iraq and Ukraine. Stocks finished the period strongly, however, bolstered by the relative economic strength of the U.S., which marked a six-year low in its unemployment rate.
Comments from Sean Gavin, who became Portfolio Manager of Fidelity Advisor® Value Leaders Fund on October 1, 2014: For the year, the fund's Institutional Class shares rose 15.35%, lagging the 16.46% advance of the benchmark Russell 1000® Value Index. Relative to the benchmark, the fund was hampered the most by security selection in the materials sector. The fund's average cash stake of about 5% also weighed on our result, although I was able to put most of that cash to work in the period's final month. On the positive side, security selection in telecommunication services and health care added value, including Israeli drugmaker Teva Pharmaceutical Industries and biotechnology company Amgen. On the negative side in health care, however, the fund was hampered by a position in Ireland-based specialty pharmaceuticals maker Shire. In mid-October, the market reacted poorly to news that a U.S. competitor, AbbVie, would not acquire Shire after all. I took advantage of the significant share-price drop to establish a stake, as I still saw good value in Shire. Other notable detractors included software maker Comverse and gold producer Newmont Mining, the latter of which was not in the benchmark, along with Teva and Shire. Comverse and Newmont Mining were not held at period end.
The views expressed above reflect those of the portfolio manager(s) only through the end of the period as stated on the cover of this report and do not necessarily represent the views of Fidelity or any other person in the Fidelity organization. Any such views are subject to change at any time based upon market or other conditions and Fidelity disclaims any responsibility to update such views. These views may not be relied on as investment advice and, because investment decisions for a Fidelity fund are based on numerous factors, may not be relied on as an indication of trading intent on behalf of any Fidelity fund.
Annual Report
Shareholder Expense Example
As a shareholder of the Fund, you incur two types of costs: (1) transaction costs, including sales charges (loads) on purchase payments or redemption proceeds, and (2) ongoing costs, including management fees, distribution and/or service (12b-1) fees and other Fund expenses. This Example is intended to help you understand your ongoing costs (in dollars) of investing in the Fund and to compare these costs with the ongoing costs of investing in other mutual funds.
The Example is based on an investment of $1,000 invested at the beginning of the period and held for the entire period (May 1, 2014 to October 31, 2014).
Actual Expenses
The first line of the accompanying table for each class of the Fund provides information about actual account values and actual expenses. You may use the information in this line, together with the amount you invested, to estimate the expenses that you paid over the period. Simply divide your account value by $1,000.00 (for example, an $8,600 account value divided by $1,000.00 = 8.6), then multiply the result by the number in the first line for a class of the Fund under the heading entitled "Expenses Paid During Period" to estimate the expenses you paid on your account during this period. In addition, the Fund, as a shareholder in the underlying Fidelity Central Funds, will indirectly bear its pro-rata share of the fees and expenses incurred by the underlying Fidelity Central Funds. These fees and expenses are not included in the Fund's annualized expense ratio used to calculate the expense estimate in the table below.
Hypothetical Example for Comparison Purposes
The second line of the accompanying table for each class of the Fund provides information about hypothetical account values and hypothetical expenses based on a Class' actual expense ratio and an assumed rate of return of 5% per year before expenses, which is not the Class' actual return. The hypothetical account values and expenses may not be used to estimate the actual ending account balance or expenses you paid for the period. You may use this information to compare the ongoing costs of investing in the Fund and other funds. To do so, compare this 5% hypothetical example with the 5% hypothetical examples that appear in the shareholder reports of the other funds. In addition, the Fund, as a shareholder in the underlying Fidelity Central Funds, will indirectly bear its pro-rata share of the fees and expenses incurred by the underlying Fidelity Central Funds. These fees and expenses are not included in the Fund's annualized expense ratio used to calculate the expense estimate in the table below.
Please note that the expenses shown in the table are meant to highlight your ongoing costs only and do not reflect any transaction costs. Therefore, the second line of the table is useful in comparing ongoing costs only, and will not help you determine the relative total costs of owning different funds. In addition, if these transactional costs were included, your costs would have been higher.
Annual Report
| Annualized
Expense RatioB | Beginning
Account Value
May 1, 2014 | Ending
Account Value
October 31, 2014 | Expenses Paid
During Period*
May 1, 2014 to
October 31, 2014 |
Class A | 1.25% | | | |
Actual | | $ 1,000.00 | $ 1,069.10 | $ 6.52 |
HypotheticalA | | $ 1,000.00 | $ 1,018.90 | $ 6.36 |
Class T | 1.50% | | | |
Actual | | $ 1,000.00 | $ 1,067.70 | $ 7.82 |
HypotheticalA | | $ 1,000.00 | $ 1,017.64 | $ 7.63 |
Class B | 2.00% | | | |
Actual | | $ 1,000.00 | $ 1,065.20 | $ 10.41 |
HypotheticalA | | $ 1,000.00 | $ 1,015.12 | $ 10.16 |
Class C | 2.00% | | | |
Actual | | $ 1,000.00 | $ 1,065.20 | $ 10.41 |
HypotheticalA | | $ 1,000.00 | $ 1,015.12 | $ 10.16 |
Institutional Class | 1.00% | | | |
Actual | | $ 1,000.00 | $ 1,070.60 | $ 5.22 |
HypotheticalA | | $ 1,000.00 | $ 1,020.16 | $ 5.09 |
A 5% return per year before expenses
B Annualized expense ratio reflects expenses net of applicable fee waivers.
* Expenses are equal to each Class' annualized expense ratio, multiplied by the average account value over the period, multiplied by 184/365 (to reflect the one-half year period).
Annual Report
Investment Changes (Unaudited)
Top Ten Stocks as of October 31, 2014 |
| % of fund's
net assets | % of fund's net assets
6 months ago |
Covidien PLC | 3.8 | 0.0 |
Samsung Electronics Co. Ltd. | 3.6 | 0.0 |
Teva Pharmaceutical Industries Ltd. sponsored ADR | 3.6 | 0.6 |
Oracle Corp. | 3.4 | 0.0 |
Berkshire Hathaway, Inc. Class B | 3.4 | 0.0 |
Chevron Corp. | 3.4 | 1.1 |
EMC Corp. | 3.4 | 0.0 |
Wells Fargo & Co. | 3.0 | 1.9 |
JPMorgan Chase & Co. | 2.9 | 2.8 |
Amgen, Inc. | 2.8 | 0.0 |
| 33.3 | |
Top Five Market Sectors as of October 31, 2014 |
| % of fund's
net assets | % of fund's net assets
6 months ago |
Financials | 26.8 | 25.5 |
Health Care | 21.4 | 13.3 |
Information Technology | 15.3 | 13.6 |
Consumer Discretionary | 12.3 | 5.2 |
Energy | 9.3 | 14.2 |
Asset Allocation (% of fund's net assets) |
As of October 31, 2014 * | As of April 30, 2014 ** |
 | Stocks 98.5% | | | Stocks 93.9% | |
 | Short-Term
Investments and
Net Other Assets (Liabilities) 1.5% | | | Short-Term
Investments and
Net Other Assets (Liabilities) 6.1% | |
* Foreign investments | 20.7% | | ** Foreign investments | 3.4% | |

Annual Report
Investments October 31, 2014
Showing Percentage of Net Assets
Common Stocks - 98.5% |
| Shares | | Value |
CONSUMER DISCRETIONARY - 12.3% |
Media - 6.8% |
DIRECTV (a) | 6,000 | | $ 520,740 |
Time Warner Cable, Inc. | 5,300 | | 780,213 |
Viacom, Inc. Class B (non-vtg.) | 9,200 | | 668,656 |
| | 1,969,609 |
Specialty Retail - 5.5% |
AutoZone, Inc. (a) | 1,400 | | 774,928 |
Bed Bath & Beyond, Inc. (a) | 5,400 | | 363,636 |
GNC Holdings, Inc. | 11,000 | | 457,270 |
| | 1,595,834 |
TOTAL CONSUMER DISCRETIONARY | | 3,565,443 |
CONSUMER STAPLES - 4.3% |
Food & Staples Retailing - 4.3% |
CVS Health Corp. | 7,090 | | 608,393 |
Kroger Co. | 11,300 | | 629,523 |
| | 1,237,916 |
ENERGY - 9.3% |
Energy Equipment & Services - 1.4% |
BW Offshore Ltd. | 326,500 | | 400,322 |
Oil, Gas & Consumable Fuels - 7.9% |
Chevron Corp. | 8,225 | | 986,589 |
Marathon Petroleum Corp. | 7,500 | | 681,750 |
Suncor Energy, Inc. | 17,600 | | 624,952 |
| | 2,293,291 |
TOTAL ENERGY | | 2,693,613 |
FINANCIALS - 26.8% |
Banks - 7.9% |
JPMorgan Chase & Co. | 14,025 | | 848,232 |
U.S. Bancorp | 13,571 | | 578,125 |
Wells Fargo & Co. | 16,426 | | 872,056 |
| | 2,298,413 |
Capital Markets - 2.5% |
Fortress Investment Group LLC | 50,900 | | 382,768 |
The Blackstone Group LP | 11,200 | | 337,344 |
| | 720,112 |
Common Stocks - continued |
| Shares | | Value |
FINANCIALS - continued |
Consumer Finance - 1.5% |
Capital One Financial Corp. | 5,200 | | $ 430,404 |
Diversified Financial Services - 3.4% |
Berkshire Hathaway, Inc. Class B (a) | 7,100 | | 995,136 |
Insurance - 7.9% |
ACE Ltd. | 4,700 | | 513,710 |
Allstate Corp. | 8,040 | | 521,394 |
Prudential PLC | 31,240 | | 723,394 |
The Travelers Companies, Inc. | 5,300 | | 534,240 |
| | 2,292,738 |
Real Estate Investment Trusts - 3.6% |
American Capital Agency Corp. | 16,500 | | 375,210 |
Annaly Capital Management, Inc. | 58,500 | | 667,485 |
| | 1,042,695 |
TOTAL FINANCIALS | | 7,779,498 |
HEALTH CARE - 21.4% |
Biotechnology - 2.8% |
Amgen, Inc. | 4,900 | | 794,682 |
Health Care Equipment & Supplies - 4.6% |
Covidien PLC | 12,100 | | 1,118,524 |
Medtronic, Inc. | 3,300 | | 224,928 |
| | 1,343,452 |
Health Care Providers & Services - 6.8% |
Cigna Corp. | 7,700 | | 766,689 |
Express Scripts Holding Co. (a) | 5,400 | | 414,828 |
UnitedHealth Group, Inc. | 8,200 | | 779,082 |
| | 1,960,599 |
Pharmaceuticals - 7.2% |
AbbVie, Inc. | 8,300 | | 526,718 |
Shire PLC | 7,900 | | 530,066 |
Teva Pharmaceutical Industries Ltd. sponsored ADR | 18,400 | | 1,039,048 |
| | 2,095,832 |
TOTAL HEALTH CARE | | 6,194,565 |
INDUSTRIALS - 5.6% |
Aerospace & Defense - 2.5% |
United Technologies Corp. | 6,700 | | 716,900 |
Common Stocks - continued |
| Shares | | Value |
INDUSTRIALS - continued |
Machinery - 2.1% |
Deere & Co. | 7,200 | | $ 615,888 |
Professional Services - 1.0% |
Dun & Bradstreet Corp. | 2,400 | | 294,744 |
TOTAL INDUSTRIALS | | 1,627,532 |
INFORMATION TECHNOLOGY - 15.3% |
Communications Equipment - 2.4% |
Cisco Systems, Inc. | 28,064 | | 686,726 |
IT Services - 2.5% |
IBM Corp. | 2,100 | | 345,240 |
The Western Union Co. | 22,000 | | 373,120 |
| | 718,360 |
Software - 3.4% |
Oracle Corp. | 25,700 | | 1,003,585 |
Technology Hardware, Storage & Peripherals - 7.0% |
EMC Corp. | 34,300 | | 985,439 |
Samsung Electronics Co. Ltd. | 911 | | 1,054,762 |
| | 2,040,201 |
TOTAL INFORMATION TECHNOLOGY | | 4,448,872 |
MATERIALS - 2.2% |
Chemicals - 2.2% |
CF Industries Holdings, Inc. | 2,500 | | 650,000 |
UTILITIES - 1.3% |
Multi-Utilities - 1.3% |
CMS Energy Corp. | 11,600 | | 378,972 |
TOTAL COMMON STOCKS (Cost $27,056,985) |
28,576,411
|
U.S. Treasury Obligations - 0.0% |
| Principal Amount | | |
U.S. Treasury Bills, yield at date of purchase 0.01% 12/11/14
(Cost $10,000) | | $ 10,000 | |
10,000
|
Money Market Funds - 1.3% |
| Shares | | Value |
Fidelity Cash Central Fund, 0.11% (b)
(Cost $363,861) | 363,861 | | $ 363,861 |
TOTAL INVESTMENT PORTFOLIO - 99.8% (Cost $27,430,846) | | 28,950,272 |
NET OTHER ASSETS (LIABILITIES) - 0.2% | | 60,478 |
NET ASSETS - 100% | $ 29,010,750 |
Legend |
(a) Non-income producing |
(b) Affiliated fund that is generally available only to investment companies and other accounts managed by Fidelity Investments. The rate quoted is the annualized seven-day yield of the fund at period end. A complete unaudited listing of the fund's holdings as of its most recent quarter end is available upon request. In addition, each Fidelity Central Fund's financial statements, which are not covered by the Fund's Report of Independent Registered Public Accounting Firm, are available on the SEC's website or upon request. |
Affiliated Central Funds |
Information regarding fiscal year to date income earned by the Fund from investments in Fidelity Central Funds is as follows: |
Fund | Income earned |
Fidelity Cash Central Fund | $ 1,729 |
Fidelity Securities Lending Cash Central Fund | 293 |
Total | $ 2,022 |
Other Information |
The following is a summary of the inputs used, as of October 31, 2014, involving the Fund's assets and liabilities carried at fair value. The inputs or methodology used for valuing securities may not be an indication of the risk associated with investing in those securities. For more information on valuation inputs, and their aggregation into the levels used in the table below, please refer to the Investment Valuation section in the accompanying Notes to Financial Statements. |
Valuation Inputs at Reporting Date: |
Description | Total | Level 1 | Level 2 | Level 3 |
Investments in Securities: | | | | |
Equities: | | | | |
Consumer Discretionary | $ 3,565,443 | $ 3,565,443 | $ - | $ - |
Consumer Staples | 1,237,916 | 1,237,916 | - | - |
Energy | 2,693,613 | 2,693,613 | - | - |
Financials | 7,779,498 | 7,056,104 | 723,394 | - |
Health Care | 6,194,565 | 5,664,499 | 530,066 | - |
Industrials | 1,627,532 | 1,627,532 | - | - |
Information Technology | 4,448,872 | 4,448,872 | - | - |
Materials | 650,000 | 650,000 | - | - |
Utilities | 378,972 | 378,972 | - | - |
U.S. Government and Government Agency Obligations | 10,000 | - | 10,000 | - |
Money Market Funds | 363,861 | 363,861 | - | - |
Total Investments in Securities: | $ 28,950,272 | $ 27,686,812 | $ 1,263,460 | $ - |
Distribution of investments by country or territory of incorporation, as a percentage of total net assets, is as follows (Unaudited): |
United States of America | 79.3% |
Ireland | 3.8% |
Korea (South) | 3.6% |
Israel | 3.6% |
United Kingdom | 2.5% |
Canada | 2.2% |
Bailiwick of Jersey | 1.8% |
Switzerland | 1.8% |
Bermuda | 1.4% |
| 100.0% |
See accompanying notes which are an integral part of the financial statements.
Annual Report
Statement of Assets and Liabilities
| October 31, 2014 |
| | |
Assets | | |
Investment in securities, at value - See accompanying schedule: Unaffiliated issuers (cost $27,066,985) | $ 28,586,411 | |
Fidelity Central Funds (cost $363,861) | 363,861 | |
Total Investments (cost $27,430,846) | | $ 28,950,272 |
Receivable for investments sold | | 230,679 |
Receivable for fund shares sold | | 34,309 |
Dividends receivable | | 24,166 |
Distributions receivable from Fidelity Central Funds | | 46 |
Prepaid expenses | | 79 |
Other receivables | | 103 |
Total assets | | 29,239,654 |
| | |
Liabilities | | |
Payable for investments purchased | $ 100,155 | |
Payable for fund shares redeemed | 58,981 | |
Accrued management fee | 11,536 | |
Distribution and service plan fees payable | 10,117 | |
Other affiliated payables | 7,353 | |
Other payables and accrued expenses | 40,762 | |
Total liabilities | | 228,904 |
| | |
Net Assets | | $ 29,010,750 |
Net Assets consist of: | | |
Paid in capital | | $ 53,968,888 |
Undistributed net investment income | | 124,802 |
Accumulated undistributed net realized gain (loss) on investments and foreign currency transactions | | (26,602,366) |
Net unrealized appreciation (depreciation) on investments | | 1,519,426 |
Net Assets | | $ 29,010,750 |
See accompanying notes which are an integral part of the financial statements.
Annual Report
Financial Statements - continued
Statement of Assets and Liabilities - continued
| October 31, 2014 |
| | |
Calculation of Maximum Offering Price
Class A:
Net Asset Value and redemption price per share
($15,066,801 ÷ 953,948 shares) | | $ 15.79 |
| | |
Maximum offering price per share (100/94.25 of $15.79) | | $ 16.75 |
Class T:
Net Asset Value and redemption price per share ($7,818,923 ÷ 495,431 shares) | | $ 15.78 |
| | |
Maximum offering price per share (100/96.50 of $15.78) | | $ 16.35 |
Class B:
Net Asset Value and offering price per share ($406,198 ÷ 26,150 shares)A | | $ 15.53 |
| | |
Class C:
Net Asset Value and offering price per share ($4,457,622 ÷ 290,427 shares)A | | $ 15.35 |
| | |
Institutional Class:
Net Asset Value, offering price and redemption price per share ($1,261,206 ÷ 79,152 shares) | | $ 15.93 |
A Redemption price per share is equal to net asset value less any applicable contingent deferred sales charge.
See accompanying notes which are an integral part of the financial statements.
Annual Report
Statement of Operations
| Year ended October 31, 2014 |
| | |
Investment Income | | |
Dividends | | $ 624,105 |
Interest | | 5 |
Income from Fidelity Central Funds | | 2,022 |
Total income | | 626,132 |
| | |
Expenses | | |
Management fee
Basic fee | $ 169,630 | |
Performance adjustment | (58,424) | |
Transfer agent fees | 80,979 | |
Distribution and service plan fees | 130,637 | |
Accounting and security lending fees | 12,026 | |
Custodian fees and expenses | 13,736 | |
Independent trustees' compensation | 127 | |
Registration fees | 57,762 | |
Audit | 49,991 | |
Legal | 169 | |
Miscellaneous | 507 | |
Total expenses before reductions | 457,140 | |
Expense reductions | (18,579) | 438,561 |
Net investment income (loss) | | 187,571 |
Realized and Unrealized Gain (Loss) Net realized gain (loss) on: | | |
Investment securities: | | |
Unaffiliated issuers | 4,943,799 | |
Foreign currency transactions | (2,722) | |
Futures contracts | (19,513) | |
Total net realized gain (loss) | | 4,921,564 |
Change in net unrealized appreciation (depreciation) on: Investment securities | (896,610) | |
Assets and liabilities in foreign currencies | (1) | |
Futures contracts | (12,341) | |
Total change in net unrealized appreciation (depreciation) | | (908,952) |
Net gain (loss) | | 4,012,612 |
Net increase (decrease) in net assets resulting from operations | | $ 4,200,183 |
See accompanying notes which are an integral part of the financial statements.
Annual Report
Financial Statements - continued
Statement of Changes in Net Assets
| Year ended
October 31,
2014 | Year ended
October 31,
2013 |
Increase (Decrease) in Net Assets | | |
Operations | | |
Net investment income (loss) | $ 187,571 | $ 176,674 |
Net realized gain (loss) | 4,921,564 | 3,425,945 |
Change in net unrealized appreciation (depreciation) | (908,952) | 3,254,893 |
Net increase (decrease) in net assets resulting
from operations | 4,200,183 | 6,857,512 |
Distributions to shareholders from net investment income | - | (419,258) |
Share transactions - net increase (decrease) | (3,923,371) | (3,943,841) |
Total increase (decrease) in net assets | 276,812 | 2,494,413 |
| | |
Net Assets | | |
Beginning of period | 28,733,938 | 26,239,525 |
End of period (including undistributed net investment income of $124,802 and distributions in excess of net investment income of $51,694, respectively) | $ 29,010,750 | $ 28,733,938 |
See accompanying notes which are an integral part of the financial statements.
Annual Report
Financial Highlights - Class A
Years ended October 31, | 2014 | 2013 | 2012 | 2011 | 2010 |
Selected Per-Share Data | | | | | |
Net asset value, beginning of period | $ 13.73 | $ 10.82 | $ 9.96 | $ 10.12 | $ 9.30 |
Income from Investment Operations | | | | | |
Net investment income (loss) C | .12 | .10 | .13 | .10 | .07F |
Net realized and unrealized gain (loss) | 1.94 | 3.01 | .85 | (.14) | .85 |
Total from investment operations | 2.06 | 3.11 | .98 | (.04) | .92 |
Distributions from net investment income | - | (.20) | (.12) | (.11) | (.09) |
Distributions from net realized gain | - | - | -H | (.01) | (.01) |
Total distributions | - | (.20) | (.12) | (.12) | (.10) |
Net asset value, end of period | $ 15.79 | $ 13.73 | $ 10.82 | $ 9.96 | $ 10.12 |
Total ReturnA, B | 15.00% | 29.24% | 10.00% | (.40)% | 9.91% |
Ratios to Average Net Assets D, G | | | | | |
Expenses before reductions | 1.30% | 1.33% | 1.28% | 1.24% | 1.22% |
Expenses net of fee waivers, if any | 1.25% | 1.25% | 1.25% | 1.24% | 1.22% |
Expenses net of all reductions | 1.25% | 1.23% | 1.24% | 1.23% | 1.21% |
Net investment income (loss) | .78% | .82% | 1.26% | .91% | .75%F |
Supplemental Data | | | | | |
Net assets, end of period (000 omitted) | $ 15,067 | $ 15,339 | $ 14,705 | $ 15,484 | $ 25,431 |
Portfolio turnover rateE | 182% | 87% | 94% | 161% | 51% |
A Total returns would have been lower if certain expenses had not been reduced during the applicable periods shown.
B Total returns do not include the effect of the sales charges.
C Calculated based on average shares outstanding during the period.
D Fees and expenses of any underlying Fidelity Central Funds are not included in the Fund's expense ratio. The Fund indirectly bears its proportionate share of the expenses of any underlying Fidelity Central Funds.
E Amount does not include the portfolio activity of any underlying Fidelity Central Funds.
F Investment income per share reflects a large, non-recurring dividend which amounted to $.02 per share. Excluding this non-recurring dividend, the ratio of net investment income (loss) to average net assets would have been .57%.
G Expense ratios reflect operating expenses of the class. Expenses before reductions do not reflect amounts reimbursed by the investment adviser or reductions from brokerage service arrangements or reductions from other expense offset arrangements and do not represent the amount paid by the class during periods when reimbursements or reductions occur. Expenses net of fee waivers reflect expenses after reimbursement by the investment adviser but prior to reductions from brokerage service arrangements or other expense offset arrangements. Expenses net of all reductions represent the net expenses paid by the class.
H Amount represents less than $.01 per share.
See accompanying notes which are an integral part of the financial statements.
Annual Report
Financial Highlights - Class T
Years ended October 31, | 2014 | 2013 | 2012 | 2011 | 2010 |
Selected Per-Share Data | | | | | |
Net asset value, beginning of period | $ 13.75 | $ 10.82 | $ 9.96 | $ 10.08 | $ 9.27 |
Income from Investment Operations | | | | | |
Net investment income (loss) C | .08 | .07 | .10 | .07 | .05F |
Net realized and unrealized gain (loss) | 1.95 | 3.02 | .85 | (.13) | .84 |
Total from investment operations | 2.03 | 3.09 | .95 | (.06) | .89 |
Distributions from net investment income | - | (.16) | (.09) | (.05) | (.07) |
Distributions from net realized gain | - | - | -H | (.01) | (.01) |
Total distributions | - | (.16) | (.09) | (.06) | (.08) |
Net asset value, end of period | $ 15.78 | $ 13.75 | $ 10.82 | $ 9.96 | $ 10.08 |
Total ReturnA, B | 14.76% | 28.97% | 9.68% | (.64)% | 9.62% |
Ratios to Average Net Assets D, G | | | | | |
Expenses before reductions | 1.58% | 1.60% | 1.55% | 1.49% | 1.45% |
Expenses net of fee waivers, if any | 1.50% | 1.50% | 1.50% | 1.49% | 1.45% |
Expenses net of all reductions | 1.50% | 1.48% | 1.49% | 1.48% | 1.45% |
Net investment income (loss) | .53% | .57% | 1.01% | .67% | .52%F |
Supplemental Data | | | | | |
Net assets, end of period (000 omitted) | $ 7,819 | $ 6,569 | $ 6,145 | $ 8,254 | $ 12,735 |
Portfolio turnover rateE | 182% | 87% | 94% | 161% | 51% |
A Total returns would have been lower if certain expenses had not been reduced during the applicable periods shown.
B Total returns do not include the effect of the sales charges.
C Calculated based on average shares outstanding during the period.
D Fees and expenses of any underlying Fidelity Central Funds are not included in the Fund's expense ratio. The Fund indirectly bears its proportionate share of the expenses of any underlying Fidelity Central Funds.
E Amount does not include the portfolio activity of any underlying Fidelity Central Funds.
F Investment income per share reflects a large, non-recurring dividend which amounted to $.02 per share. Excluding this non-recurring dividend, the ratio of net investment income (loss) to average net assets would have been .33%.
G Expense ratios reflect operating expenses of the class. Expenses before reductions do not reflect amounts reimbursed by the investment adviser or reductions from brokerage service arrangements or reductions from other expense offset arrangements and do not represent the amount paid by the class during periods when reimbursements or reductions occur. Expenses net of fee waivers reflect expenses after reimbursement by the investment adviser but prior to reductions from brokerage service arrangements or other expense offset arrangements. Expenses net of all reductions represent the net expenses paid by the class.
H Amount represents less than $.01 per share.
See accompanying notes which are an integral part of the financial statements.
Annual Report
Financial Highlights - Class B
Years ended October 31, | 2014 | 2013 | 2012 | 2011 | 2010 |
Selected Per-Share Data | | | | | |
Net asset value, beginning of period | $ 13.60 | $ 10.70 | $ 9.84 | $ 9.99 | $ 9.18 |
Income from Investment Operations | | | | | |
Net investment income (loss) C | -H | .01 | .05 | .02 | -F,H |
Net realized and unrealized gain (loss) | 1.93 | 2.99 | .85 | (.13) | .84 |
Total from investment operations | 1.93 | 3.00 | .90 | (.11) | .84 |
Distributions from net investment income | - | (.10) | (.03) | (.03) | (.02) |
Distributions from net realized gain | - | - | -H | (.01) | (.01) |
Total distributions | - | (.10) | (.04)I | (.04) | (.03) |
Net asset value, end of period | $ 15.53 | $ 13.60 | $ 10.70 | $ 9.84 | $ 9.99 |
Total ReturnA, B | 14.19% | 28.31% | 9.14% | (1.14)% | 9.11% |
Ratios to Average Net Assets D, G | | | | | |
Expenses before reductions | 2.12% | 2.10% | 2.04% | 1.99% | 1.97% |
Expenses net of fee waivers, if any | 2.00% | 2.00% | 2.00% | 1.99% | 1.97% |
Expenses net of all reductions | 2.00% | 1.98% | 1.99% | 1.98% | 1.97% |
Net investment income (loss) | .03% | .07% | .51% | .16% | (.01)%F |
Supplemental Data | | | | | |
Net assets, end of period (000 omitted) | $ 406 | $ 719 | $ 895 | $ 1,110 | $ 1,605 |
Portfolio turnover rateE | 182% | 87% | 94% | 161% | 51% |
A Total returns would have been lower if certain expenses had not been reduced during the applicable periods shown.
B Total returns do not include the effect of the contingent deferred sales charge.
C Calculated based on average shares outstanding during the period.
D Fees and expenses of any underlying Fidelity Central Funds are not included in the Fund's expense ratio. The Fund indirectly bears its proportionate share of the expenses of any underlying Fidelity Central Funds.
E Amount does not include the portfolio activity of any underlying Fidelity Central Funds.
F Investment income per share reflects a large, non-recurring dividend which amounted to $.02 per share. Excluding this non-recurring dividend, the ratio of net investment income (loss) to average net assets would have been (.19)%.
G Expense ratios reflect operating expenses of the class. Expenses before reductions do not reflect amounts reimbursed by the investment adviser or reductions from brokerage service arrangements or reductions from other expense offset arrangements and do not represent the amount paid by the class during periods when reimbursements or reductions occur. Expenses net of fee waivers reflect expenses after reimbursement by the investment adviser but prior to reductions from brokerage service arrangements or other expense offset arrangements. Expenses net of all reductions represent the net expenses paid by the class.
H Amount represents less than $.01 per share.
I Total distributions of $.04 per share is comprised of distributions from net investment income of $.031 and distributions from net realized gain of $.004 per share.
See accompanying notes which are an integral part of the financial statements.
Annual Report
Financial Highlights - Class C
Years ended October 31, | 2014 | 2013 | 2012 | 2011 | 2010 |
Selected Per-Share Data | | | | | |
Net asset value, beginning of period | $ 13.44 | $ 10.59 | $ 9.75 | $ 9.92 | $ 9.11 |
Income from Investment Operations | | | | | |
Net investment income (loss) C | -I | .01 | .05 | .02 | -G,I |
Net realized and unrealized gain (loss) | 1.91 | 2.95 | .84 | (.13) | .83 |
Total from investment operations | 1.91 | 2.96 | .89 | (.11) | .83 |
Distributions from net investment income | - | (.11) | (.05) | (.05) | (.02) |
Distributions from net realized gain | - | - | -I | (.01) | (.01) |
Total distributions | - | (.11) | (.05) | (.06) | (.02)J |
Net asset value, end of period | $ 15.35 | $ 13.44 | $ 10.59 | $ 9.75 | $ 9.92 |
Total ReturnA, B | 14.21% | 28.27% | 9.21% | (1.18)% | 9.12% |
Ratios to Average Net Assets D, H | | | | | |
Expenses before reductions | 2.09% | 2.08% | 2.04% | 2.00% | 1.97% |
Expenses net of fee waivers, if any | 2.00% | 2.00% | 2.00% | 2.00% | 1.97% |
Expenses net of all reductions | 2.00% | 1.97% | 1.99% | 1.98% | 1.97% |
Net investment income (loss) | .03% | .07% | .51% | .16% | .00%F,G |
Supplemental Data | | | | | |
Net assets, end of period (000 omitted) | $ 4,458 | $ 4,340 | $ 3,299 | $ 3,775 | $ 4,139 |
Portfolio turnover rateE | 182% | 87% | 94% | 161% | 51% |
A Total returns would have been lower if certain expenses had not been reduced during the applicable periods shown.
B Total returns do not include the effect of the contingent deferred sales charge.
C Calculated based on average shares outstanding during the period.
D Fees and expenses of any underlying Fidelity Central Funds are not included in the Fund's expense ratio. The Fund indirectly bears its proportionate share of the expenses of any underlying Fidelity Central Funds.
E Amount does not include the portfolio activity of any underlying Fidelity Central Funds.
F Amount represents less than .01%.
G Investment income per share reflects a large, non-recurring dividend which amounted to $.02 per share. Excluding this non-recurring dividend, the ratio of net investment income (loss) to average net assets would have been (.19)%.
H Expense ratios reflect operating expenses of the class. Expenses before reductions do not reflect amounts reimbursed by the investment adviser or reductions from brokerage service arrangements or reductions from other expense offset arrangements and do not represent the amount paid by the class during periods when reimbursements or reductions occur. Expenses net of fee waivers reflect expenses after reimbursement by the investment adviser but prior to reductions from brokerage service arrangements or other expense offset arrangements. Expenses net of all reductions represent the net expenses paid by the class.
I Amount represents less than $.01 per share.
J Total distributions of $.02 per share is comprised of distributions from net investment income of $.015 and distributions from net realized gain of $.005 per share.
See accompanying notes which are an integral part of the financial statements.
Annual Report
Financial Highlights - Institutional Class
Years ended October 31, | 2014 | 2013 | 2012 | 2011 | 2010 |
Selected Per-Share Data | | | | | |
Net asset value, beginning of period | $ 13.81 | $ 10.89 | $ 10.04 | $ 10.19 | $ 9.35 |
Income from Investment Operations | | | | | |
Net investment income (loss) B | .15 | .14 | .18 | .14 | .10E |
Net realized and unrealized gain (loss) | 1.97 | 3.02 | .83 | (.15) | .86 |
Total from investment operations | 2.12 | 3.16 | 1.01 | (.01) | .96 |
Distributions from net investment income | - | (.24) | (.16) | (.13) | (.11) |
Distributions from net realized gain | - | - | -G | (.01) | (.01) |
Total distributions | - | (.24) | (.16) | (.14) | (.12) |
Net asset value, end of period | $ 15.93 | $ 13.81 | $ 10.89 | $ 10.04 | $ 10.19 |
Total ReturnA | 15.35% | 29.65% | 10.30% | (.11)% | 10.28% |
Ratios to Average Net Assets C, F | | | | | |
Expenses before reductions | 1.01% | .94% | .83% | .89% | .98% |
Expenses net of fee waivers, if any | 1.00% | .94% | .83% | .89% | .98% |
Expenses net of all reductions | 1.00% | .92% | .82% | .88% | .97% |
Net investment income (loss) | 1.03% | 1.13% | 1.68% | 1.27% | .99%E |
Supplemental Data | | | | | |
Net assets, end of period (000 omitted) | $ 1,261 | $ 1,767 | $ 1,195 | $ 523 | $ 841 |
Portfolio turnover rateD | 182% | 87% | 94% | 161% | 51% |
A Total returns would have been lower if certain expenses had not been reduced during the applicable periods shown.
B Calculated based on average shares outstanding during the period.
C Fees and expenses of any underlying Fidelity Central Funds are not included in the Fund's expense ratio. The Fund indirectly bears its proportionate share of the expenses of any underlying Fidelity Central Funds.
D Amount does not include the portfolio activity of any underlying Fidelity Central Funds.
E Investment income per share reflects a large, non-recurring dividend which amounted to $.02 per share. Excluding this non-recurring dividend, the ratio of net investment income (loss) to average net assets would have been .81%.
F Expense ratios reflect operating expenses of the class. Expenses before reductions do not reflect amounts reimbursed by the investment adviser or reductions from brokerage service arrangements or reductions from other expense offset arrangements and do not represent the amount paid by the class during periods when reimbursements or reductions occur. Expenses net of fee waivers reflect expenses after reimbursement by the investment adviser but prior to reductions from brokerage service arrangements or other expense offset arrangements. Expenses net of all reductions represent the net expenses paid by the class.
G Amount represents less than $.01 per share.
See accompanying notes which are an integral part of the financial statements.
Annual Report
Notes to Financial Statements
For the period ended October 31, 2014
1. Organization.
Fidelity Advisor Value Leaders Fund (the Fund) is a fund of Fidelity Advisor Series VIII (the Trust) and is authorized to issue an unlimited number of shares. The Trust is registered under the Investment Company Act of 1940, as amended (the 1940 Act), as an open-end management investment company organized as a Massachusetts business trust. The Fund offers Class A, Class T, Class C and Institutional Class shares, each of which, along with Class B shares, has equal rights as to assets and voting privileges. Class B shares are closed to new accounts and additional purchases, except for exchanges and reinvestments. Each class has exclusive voting rights with respect to matters that affect that class. Class B shares will automatically convert to Class A shares after a holding period of seven years from the initial date of purchase.
2. Investments in Fidelity Central Funds.
The Fund invests in Fidelity Central Funds, which are open-end investment companies generally available only to other investment companies and accounts managed by the investment adviser and its affiliates. The Fund's Schedule of Investments lists each of the Fidelity Central Funds held as of period end, if any, as an investment of the Fund, but does not include the underlying holdings of each Fidelity Central Fund. As an Investing Fund, the Fund indirectly bears its proportionate share of the expenses of the underlying Fidelity Central Funds.
The Money Market Central Funds seek preservation of capital and current income and are managed by Fidelity Investments Money Management, Inc. (FIMM), an affiliate of the investment adviser. Annualized expenses of the Money Market Central Funds as of their most recent shareholder report date are less than .01%.
A complete unaudited list of holdings for each Fidelity Central Fund is available upon request or at the Securities and Exchange Commission (the SEC) website at www.sec.gov. In addition, the financial statements of the Fidelity Central Funds, which are not covered by the Fund's Report of Independent Registered Public Accounting Firm, are available on the SEC website or upon request.
3. Significant Accounting Policies.
The financial statements have been prepared in conformity with accounting principles generally accepted in the United States of America (GAAP), which require management to make certain estimates and assumptions at the date of the financial statements. Actual results could differ from those estimates. Subsequent events, if any, through the date that the financial statements were issued have been evaluated in the preparation of the financial statements. The following summarizes the significant accounting policies of the Fund:
Annual Report
3. Significant Accounting Policies - continued
Investment Valuation. Investments are valued as of 4:00 p.m. Eastern time on the last calendar day of the period. In accordance with valuation policies and procedures approved by the Board of Trustees (the Board), the Fund attempts to obtain prices from one or more third party pricing vendors or brokers to value its investments. When current market prices, quotations or currency exchange rates are not readily available or reliable, investments will be fair valued in good faith by the Fidelity Management & Research Company (FMR) Fair Value Committee (the Committee), in accordance with procedures adopted by the Board. Factors used in determining fair value vary by investment type and may include market or investment specific events, changes in interest rates and credit quality. The frequency with which these procedures are used cannot be predicted and they may be utilized to a significant extent. The Committee oversees the Fund's valuation policies and procedures and is responsible for approving and reporting to the Board all fair value determinations.
The Fund categorizes the inputs to valuation techniques used to value its investments into a disclosure hierarchy consisting of three levels as shown below:
Level 1 - quoted prices in active markets for identical investments
Level 2 - other significant observable inputs (including quoted prices for similar investments, interest rates, prepayment speeds, etc.)
Level 3 - unobservable inputs (including the Fund's own assumptions based on the best information available)
Valuation techniques used to value the Fund's investments by major category are as follows:
Equity securities, including restricted securities, for which market quotations are readily available, are valued at the last reported sale price or official closing price as reported by a third party pricing vendor on the primary market or exchange on which they are traded and are categorized as Level 1 in the hierarchy. In the event there were no sales during the day or closing prices are not available, securities are valued at the last quoted bid price or may be valued using the last available price and are generally categorized as Level 2 in the hierarchy. For foreign equity securities, when market or security specific events arise, comparisons to the valuation of American Depositary Receipts (ADRs), futures contracts, Exchange-Traded Funds (ETFs) and certain indexes as well as quoted prices for similar securities may be used and would be categorized as Level 2 in the hierarchy. Utilizing these techniques may result in transfers between Level 1 and Level 2. For equity securities, including restricted securities, where observable inputs are limited, assumptions about market activity and risk are used and these securities may be categorized as Level 3 in the hierarchy.
Annual Report
Notes to Financial Statements - continued
3. Significant Accounting Policies - continued
Investment Valuation - continued
Debt securities, including restricted securities, are valued based on evaluated prices received from third party pricing vendors or from brokers who make markets in such securities. U.S. government and government agency obligations are valued by pricing vendors who utilize matrix pricing which considers yield or price of bonds of comparable quality, coupon, maturity and type or by broker-supplied prices. When independent prices are unavailable or unreliable, debt securities may be valued utilizing pricing methodologies which consider similar factors that would be used by third party pricing vendors. Debt securities are generally categorized as Level 2 in the hierarchy but may be Level 3 depending on the circumstances.
Investments in open-end mutual funds, including the Fidelity Central Funds, are valued at their closing net asset value (NAV) each business day and are categorized as Level 1 in the hierarchy.
Changes in valuation techniques may result in transfers in or out of an assigned level within the disclosure hierarchy. The aggregate value of investments by input level, as of October 31, 2014, is included at the end of the Fund's Schedule of Investments.
Foreign Currency. The Fund may use foreign currency contracts to facilitate transactions in foreign-denominated securities. Gains and losses from these transactions may arise from changes in the value of the foreign currency or if the counterparties do not perform under the contracts' terms.
Foreign-denominated assets, including investment securities, and liabilities are translated into U.S. dollars at the exchange rates at period end. Purchases and sales of investment securities, income and dividends received and expenses denominated in foreign currencies are translated into U.S. dollars at the exchange rate in effect on the transaction date.
The effects of exchange rate fluctuations on investments are included with the net realized and unrealized gain (loss) on investment securities. Other foreign currency transactions resulting in realized and unrealized gain (loss) are disclosed separately.
Investment Transactions and Income. For financial reporting purposes, the Fund's investment holdings and NAV include trades executed through the end of the last business day of the period. The NAV per share for processing shareholder transactions is calculated as of the close of business of the New York Stock Exchange (NYSE), normally 4:00 p.m. Eastern time and includes trades executed through the end of the prior business day. Gains and losses on securities sold are determined on the basis of identified cost and may include proceeds received from litigation. Dividend income is recorded on
Annual Report
3. Significant Accounting Policies - continued
Investment Transactions and Income - continued
the ex-dividend date, except for certain dividends from foreign securities where the ex-dividend date may have passed, which are recorded as soon as the Fund is informed of the ex-dividend date. Non-cash dividends included in dividend income, if any, are recorded at the fair market value of the securities received. Income and capital gain distributions from Fidelity Central Funds, if any, are recorded on the ex-dividend date. Distributions received on securities that represent a return of capital or capital gain are recorded as a reduction of cost of investments and/or as a realized gain. Subsequent to ex-dividend date the Fund determines the components of these distributions, based upon receipt of tax filings or other correspondence relating to the underlying investment. Interest income is accrued as earned and includes coupon interest and amortization of premium and accretion of discount on debt securities as applicable. Investment income is recorded net of foreign taxes withheld where recovery of such taxes is uncertain.
Class Allocations and Expenses. Investment income, realized and unrealized capital gains and losses, common expenses of the Fund, and certain fund-level expense reductions, if any, are allocated daily on a pro-rata basis to each class based on the relative net assets of each class to the total net assets of the Fund. Each class differs with respect to transfer agent and distribution and service plan fees incurred. Certain expense reductions may also differ by class. For the reporting period, the allocated portion of income and expenses to each class as a percent of its average net assets may vary due to the timing of recording these transactions in relation to fluctuating net assets of the classes. Expenses directly attributable to a fund are charged to that fund. Expenses attributable to more than one fund are allocated among the respective funds on the basis of relative net assets or other appropriate methods. Expense estimates are accrued in the period to which they relate and adjustments are made when actual amounts are known.
Income Tax Information and Distributions to Shareholders. Each year, the Fund intends to qualify as a regulated investment company under Subchapter M of the Internal Revenue Code, including distributing substantially all of its taxable income and realized gains. As a result, no provision for U.S. Federal income taxes is required. As of October 31, 2014, the Fund did not have any unrecognized tax benefits in the financial statements; nor is the Fund aware of any tax positions for which it is reasonably possible that the total amounts of unrecognized tax benefits will significantly change in the next twelve months. The Fund files a U.S. federal tax return, in addition to state and local tax returns as required. The Fund's federal income tax returns are subject to examination by the Internal Revenue Service (IRS) for a period of three fiscal years after they are filed. State and local tax returns may be subject to examination for an additional fiscal year depending on the jurisdiction. Foreign taxes are provided for based on the Fund's understanding of the tax rules and rates that exist in the foreign markets in which it invests.
Annual Report
Notes to Financial Statements - continued
3. Significant Accounting Policies - continued
Income Tax Information and Distributions to Shareholders - continued
Distributions are declared and recorded on the ex-dividend date. Income dividends and capital gain distributions are declared separately for each class. Income and capital gain distributions are determined in accordance with income tax regulations, which may differ from GAAP.
Capital accounts within the financial statements are adjusted for permanent book-tax differences. These adjustments have no impact on net assets or the results of operations. Capital accounts are not adjusted for temporary book-tax differences which will reverse in a subsequent period.
Book-tax differences are primarily due to futures contracts, foreign currency transactions, partnerships, capital loss carryforwards, losses deferred due to wash sales and excise tax regulations.
The federal tax cost of investment securities and unrealized appreciation (depreciation) as of period end were as follows:
Gross unrealized appreciation | $ 1,672,715 |
Gross unrealized depreciation | (383,504) |
Net unrealized appreciation (depreciation) on securities | $ 1,289,211 |
| |
Tax Cost | $ 27,661,061 |
The tax-based components of distributable earnings as of period end were as follows:
Undistributed ordinary income | $ 124,802 |
Capital loss carryforward | $ (26,372,152) |
Net unrealized appreciation (depreciation) on securities and other investments | $ 1,289,211 |
Capital loss carryforwards are only available to offset future capital gains of the Fund to the extent provided by regulations and may be limited. Under the Regulated Investment Company Modernization Act of 2010 (the Act), the Fund is permitted to carry forward capital losses incurred in taxable years beginning after December 22, 2010 for an unlimited period and such capital losses are required to be used prior to any losses that expire. The capital loss carryforward information presented below, including any applicable limitation, is estimated as of fiscal period end and is subject to adjustment.
Fiscal year of expiration | |
2016 | $ (11,383,283) |
2017 | (14,819,668) |
2019 | (169,201) |
Total capital loss carryforward | $ (26,372,152) |
Annual Report
3. Significant Accounting Policies - continued
Income Tax Information and Distributions to Shareholders - continued
The tax character of distributions paid was as follows:
| October 31, 2014 | October 31, 2013 |
Ordinary Income | $ - | $ 419,258 |
New Accounting Pronouncement. In June 2014, the Financial Accounting Standards Board issued Accounting Standard Update No. 2014-11, Repurchase-to-Maturity Transactions, Repurchase Financings, and Disclosures. The Update amends the accounting for certain repurchase agreements and expands disclosure requirements for reverse repurchase agreements, securities lending and other similar transactions. The disclosure requirements are effective for annual and interim reporting periods beginning after December 15, 2014. Management is currently evaluating the impact of the Update on the Funds' financial statements and related disclosures.
4. Derivative Instruments.
Risk Exposures and the Use of Derivative Instruments. The Fund's investment objective allows the Fund to enter into various types of derivative contracts, including futures contracts. Derivatives are investments whose value is primarily derived from underlying assets, indices or reference rates and may be transacted on an exchange or over-the-counter (OTC). Derivatives may involve a future commitment to buy or sell a specified asset based on specified terms, to exchange future cash flows at periodic intervals based on a notional principal amount, or for one party to make one or more payments upon the occurrence of specified events in exchange for periodic payments from the other party.
The Fund used derivatives to increase returns and to manage exposure to certain risks as defined below. The success of any strategy involving derivatives depends on analysis of numerous economic factors, and if the strategies for investment do not work as intended, the Fund may not achieve its objectives.
The Fund's use of derivatives increased or decreased its exposure to the following risk:
Equity Risk | Equity risk relates to the fluctuations in the value of financial instruments as a result of changes in market prices (other than those arising from interest rate risk or foreign exchange risk), whether caused by factors specific to an individual investment, its issuer, or all factors affecting all instruments traded in a market or market segment. |
The Fund is also exposed to additional risks from investing in derivatives, such as liquidity risk and counterparty credit risk. Liquidity risk is the risk that the Fund will be unable to close out the derivative in the open market in a timely manner. Counterparty
Annual Report
Notes to Financial Statements - continued
4. Derivative Instruments - continued
Risk Exposures and the Use of Derivative Instruments - continued
credit risk is the risk that the counterparty will not be able to fulfill its obligation to the Fund. Counterparty credit risk related to exchange-traded futures contracts may be mitigated by the protection provided by the exchange on which they trade.
Investing in derivatives may involve greater risks than investing in the underlying assets directly and, to varying degrees, may involve risk of loss in excess of any initial investment and collateral received and amounts recognized in the Statement of Assets and Liabilities. In addition, there may be the risk that the change in value of the derivative contract does not correspond to the change in value of the underlying instrument.
Futures Contracts. A futures contract is an agreement between two parties to buy or sell a specified underlying instrument for a fixed price at a specified future date. The Fund used futures contracts to manage its exposure to the stock market.
Upon entering into a futures contract, a fund is required to deposit either cash or securities (initial margin) with a clearing broker in an amount equal to a certain percentage of the face value of the contract. Futures contracts are marked-to-market daily and subsequent daily payments (variation margin) are made or received by a fund depending on the daily fluctuations in the value of the futures contracts and are recorded as unrealized appreciation or (depreciation). This receivable and/or payable, if any, is included in daily variation margin for derivative instruments in the Statement of Assets and Liabilities. Realized gain or (loss) is recorded upon the expiration or closing of a futures contract.
Any open futures contracts at period end are presented in the Schedule of Investments under the caption "Futures Contracts." The underlying face amount at value reflects each contract's exposure to the underlying instrument or index at period end.
During the period the Fund recognized net realized gain (loss) of $(19,513) and a change in net unrealized appreciation (depreciation) of $(12,341) related to its investment in futures contracts. These amounts are included in the Statement of Operations.
5. Purchases and Sales of Investments.
Purchases and sales of securities, other than short-term securities, aggregated $52,934,663 and $54,949,500, respectively.
6. Fees and Other Transactions with Affiliates.
Management Fee. Fidelity Management & Research Company (the investment adviser) and its affiliates provide the Fund with investment management related services for which the Fund pays a monthly management fee. The management fee is the sum of an individual fund fee rate that is based on an annual rate of .30% of the Fund's
Annual Report
6. Fees and Other Transactions with Affiliates - continued
Management Fee - continued
average net assets and an annualized group fee rate that averaged .25% during the period. The group fee rate is based upon the average net assets of all the mutual funds advised by the investment adviser, including any mutual funds previously advised by the investment adviser that are currently advised by Fidelity SelectCo, LLC, an affiliate of the investment adviser. The group fee rate decreases as assets under management increase and increases as assets under management decrease. In addition, the management fee is subject to a performance adjustment (up to a maximum of ± .20% of the Fund's average net assets over a 36 month performance period). The upward or downward adjustment to the management fee is based on the relative investment performance of the Institutional Class of the Fund as compared to its benchmark index, the Russell 1000 Value Index, over the same 36 month performance period. For the reporting period, the total annual management fee rate, including the performance adjustment, was .36% of the Fund's average net assets. The performance adjustment included in the management fee rate may be higher or lower than the maximum performance adjustment rate due to the difference between the average net assets for the reporting and performance periods.
Distribution and Service Plan Fees. In accordance with Rule 12b-1 of the 1940 Act, the Fund has adopted separate Distribution and Service Plans for each class of shares. Certain classes pay Fidelity Distributors Corporation (FDC), an affiliate of the investment adviser, separate Distribution and Service Fees, each of which is based on an annual percentage of each class' average net assets. In addition, FDC may pay financial intermediaries for selling shares of the Fund and providing shareholder support services. For the period, the Distribution and Service Fee rates, total fees and amounts retained by FDC were as follows:
| Distribution
Fee | Service
Fee | Total Fees | Retained
by FDC |
Class A | -% | .25% | $ 39,794 | $ 530 |
Class T | .25% | .25% | 38,036 | 301 |
Class B | .75% | .25% | 5,359 | 4,035 |
Class C | .75% | .25% | 47,448 | 6,543 |
| | | $ 130,637 | $ 11,409 |
Sales Load. FDC may receive a front-end sales charge of up to 5.75% for selling Class A shares and 3.50% for selling Class T shares, some of which is paid to financial intermediaries for selling shares of the Fund. Depending on the holding period, FDC may receive contingent deferred sales charges levied on Class A, Class T, Class B, and Class C redemptions. The deferred sales charges range from 5.00% to 1.00% for Class B shares, 1.00% for Class C shares, 1.00% for certain purchases of Class A shares and .25% for certain purchases of Class T shares.
Annual Report
Notes to Financial Statements - continued
6. Fees and Other Transactions with Affiliates - continued
Sales Load - continued
For the period, sales charge amounts retained by FDC were as follows:
| Retained
by FDC |
Class A | $ 2,685 |
Class T | 2,517 |
Class B* | 174 |
Class C* | 1,030 |
| $ 6,406 |
* When Class B and Class C shares are initially sold, FDC pays commissions from its own resources to financial intermediaries through which the sales are made.
Transfer Agent Fees. Fidelity Investments Institutional Operations Company, Inc., (FIIOC), an affiliate of the investment adviser, is the transfer, dividend disbursing and shareholder servicing agent for each class of the Fund. FIIOC receives account fees and asset-based fees that vary according to the account size and type of account of the shareholders of the respective classes of the Fund. FIIOC pays for typesetting, printing and mailing of shareholder reports, except proxy statements.
For the period, transfer agent fees for each class were as follows:
| Amount | % of
Class-Level Average
Net Assets |
Class A | $ 39,204 | .25 |
Class T | 21,894 | .29 |
Class B | 1,620 | .30 |
Class C | 13,965 | .29 |
Institutional Class | 4,296 | .21 |
| $ 80,979 | |
Accounting and Security Lending Fees. Fidelity Service Company, Inc. (FSC), an affiliate of the investment adviser, maintains the Fund's accounting records. The accounting fee is based on the level of average net assets for each month. Under a separate contract, FSC administers the security lending program. The security lending fee is based on the number and duration of lending transactions.
Brokerage Commissions. The Fund placed a portion of its portfolio transactions with brokerage firms which are affiliates of the investment adviser. Brokerage commissions are included in net realized gain (loss) and change in net unrealized appreciation (depreciation) in the Statement of Operations. The commissions paid to these affiliated firms were $1,923 for the period.
Annual Report
7. Committed Line of Credit.
The Fund participates with other funds managed by the investment adviser or an affiliate in a $4.25 billion credit facility (the "line of credit") to be utilized for temporary or emergency purposes to fund shareholder redemptions or for other short-term liquidity purposes. The Fund has agreed to pay commitment fees on its pro-rata portion of the line of credit, which amounted to $50 and is reflected in Miscellaneous expenses on the Statement of Operations. During the period, the Fund did not borrow on this line of credit.
8. Security Lending.
The Fund lends portfolio securities through a lending agent from time to time in order to earn additional income. For equity securities, a lending agent is used and may loan securities to certain qualified borrowers, including Fidelity Capital Markets (FCM), a broker-dealer affiliated with the Fund. On the settlement date of the loan, the Fund receives collateral (in the form of U.S. Treasury obligations, letters of credit and/or cash) against the loaned securities and maintains collateral in an amount not less than 100% of the market value of the loaned securities during the period of the loan. The market value of the loaned securities is determined at the close of business of the Fund and any additional required collateral is delivered to the Fund on the next business day. If the borrower defaults on its obligation to return the securities loaned because of insolvency or other reasons, the Fund may apply collateral received from the borrower against the obligation. The Fund may experience delays and costs in recovering the securities loaned. Any cash collateral received is invested in the Fidelity Securities Lending Cash Central Fund. At period end, there were no security loans outstanding. Security lending income represents the income earned on investing cash collateral, less rebates paid to borrowers and any lending agent fees associated with the loan, plus any premium payments received for lending certain types of securities. Security lending income is presented in the Statement of Operations as a component of income from Fidelity Central Funds. Total security lending income during the period amounted to $293. During the period, there were no securities loaned to FCM.
9. Expense Reductions.
The investment adviser voluntarily agreed to reimburse each class to the extent annual operating expenses exceeded certain levels of average net assets as noted in the table below. Some expenses, for example interest expense, including commitment fees, are excluded from this reimbursement.
Annual Report
Notes to Financial Statements - continued
9. Expense Reductions - continued
The following classes were in reimbursement during the period:
| Expense
Limitations | Reimbursement |
Class A | 1.25% | $ 7,490 |
Class T | 1.50% | 5,986 |
Class B | 2.00% | 607 |
Class C | 2.00% | 4,081 |
Institutional Class | 1.00% | 261 |
| | $ 18,425 |
Commissions paid to certain brokers with whom the investment adviser, or its affiliates, places trades on behalf of the Fund include an amount in addition to trade execution, which may be rebated back to the Fund to offset certain expenses. This amount totaled $146 for the period. In addition, through arrangements with the Fund's custodian, credits realized as a result of uninvested cash balances were used to reduce the Fund's expenses. During the period, these credits reduced the Fund's custody expenses by $8.
10. Distributions to Shareholders.
Distributions to shareholders of each class were as follows:
Years ended October 31, | 2014 | 2013 |
From net investment income | | |
Class A | $ - | $ 265,618 |
Class T | - | 87,579 |
Class B | - | 8,055 |
Class C | - | 34,963 |
Institutional Class | - | 23,043 |
Total | $ - | $ 419,258 |
11. Share Transactions.
Share transactions for each class were as follows and may contain automatic conversions between classes or exchanges between funds:
| Shares | Dollars |
Years ended October 31, | 2014 | 2013 | 2014 | 2013 |
Class A | | | | |
Shares sold | 138,015 | 203,654 | $ 2,028,107 | $ 2,521,952 |
Reinvestment of distributions | - | 23,948 | - | 256,986 |
Shares redeemed | (301,611) | (469,651) | (4,564,426) | (5,674,710) |
Net increase (decrease) | (163,596) | (242,049) | $ (2,536,319) | $ (2,895,772) |
Annual Report
11. Share Transactions - continued
| Shares | Dollars |
Years ended October 31, | 2014 | 2013 | 2014 | 2013 |
Class T | | | | |
Shares sold | 118,612 | 51,753 | $ 1,713,933 | $ 642,034 |
Reinvestment of distributions | - | 7,985 | - | 86,093 |
Shares redeemed | (100,942) | (149,714) | (1,483,209) | (1,818,182) |
Net increase (decrease) | 17,670 | (89,976) | $ 230,724 | $ (1,090,055) |
Class B | | | | |
Shares sold | - | 1,256 | $ - | $ 15,666 |
Reinvestment of distributions | - | 676 | - | 7,246 |
Shares redeemed | (26,732) | (32,653) | (388,717) | (386,596) |
Net increase (decrease) | (26,732) | (30,721) | $ (388,717) | $ (363,684) |
Class C | | | | |
Shares sold | 65,526 | 81,393 | $ 939,665 | $ 983,333 |
Reinvestment of distributions | - | 3,063 | - | 32,411 |
Shares redeemed | (98,027) | (73,114) | (1,427,472) | (871,726) |
Net increase (decrease) | (32,501) | 11,342 | $ (487,807) | $ 144,018 |
Institutional Class | | | | |
Shares sold | 129,227 | 46,209 | $ 1,917,221 | $ 589,474 |
Reinvestment of distributions | - | 2,131 | - | 22,951 |
Shares redeemed | (178,032) | (30,086) | (2,658,473) | (350,773) |
Net increase (decrease) | (48,805) | 18,254 | $ (741,252) | $ 261,652 |
12. Other.
The Fund's organizational documents provide former and current trustees and officers with a limited indemnification against liabilities arising in connection with the performance of their duties to the Fund. In the normal course of business, the Fund may also enter into contracts that provide general indemnifications. The Fund's maximum exposure under these arrangements is unknown as this would be dependent on future claims that may be made against the Fund. The risk of material loss from such claims is considered remote.
Annual Report
To the Trustees of Fidelity Advisor Series VIII and the Shareholders of Fidelity Advisor Value Leaders Fund:
In our opinion, the accompanying statement of assets and liabilities, including the schedule of investments, and the related statements of operations and of changes in net assets and the financial highlights present fairly, in all material respects, the financial position of Fidelity Advisor Value Leaders Fund (a fund of Fidelity Advisor Series VIII) at October 31, 2014, the results of its operations for the year then ended, the changes in its net assets for each of the two years in the period then ended and the financial highlights for each of the five years in the period then ended, in conformity with accounting principles generally accepted in the United States of America. These financial statements and financial highlights (hereafter referred to as "financial statements") are the responsibility of the Fidelity Advisor Value Leaders Fund's management. Our responsibility is to express an opinion on these financial statements based on our audits. We conducted our audits of these financial statements in accordance with the standards of the Public Company Accounting Oversight Board (United States). Those standards require that we plan and perform the audit to obtain reasonable assurance about whether the financial statements are free of material misstatement. An audit includes examining, on a test basis, evidence supporting the amounts and disclosures in the financial statements, assessing the accounting principles used and significant estimates made by management, and evaluating the overall financial statement presentation. We believe that our audits, which included confirmation of securities at October 31, 2014 by correspondence with the custodian and brokers, provide a reasonable basis for our opinion.
PricewaterhouseCoopers LLP
Boston, Massachusetts
December 16, 2014
Annual Report
The Trustees, Member of the Advisory Board, and officers of the trust and fund, as applicable, are listed below. The Board of Trustees governs the fund and is responsible for protecting the interests of shareholders. The Trustees are experienced executives who meet periodically throughout the year to oversee the fund's activities, review contractual arrangements with companies that provide services to the fund, oversee management of the risks associated with such activities and contractual arrangements, and review the fund's performance. Except for James C. Curvey, each of the Trustees oversees 174 funds. Mr. Curvey oversees 407 funds.
The Trustees hold office without limit in time except that (a) any Trustee may resign; (b) any Trustee may be removed by written instrument, signed by at least two-thirds of the number of Trustees prior to such removal; (c) any Trustee who requests to be retired or who has become incapacitated by illness or injury may be retired by written instrument signed by a majority of the other Trustees; and (d) any Trustee may be removed at any special meeting of shareholders by a two-thirds vote of the outstanding voting securities of the trust. Each Trustee who is not an interested person (as defined in the 1940 Act) of the trust and the fund (Independent Trustee), shall retire not later than the last day of the calendar year in which his or her 75th birthday occurs. The Independent Trustees may waive this mandatory retirement age policy with respect to individual Trustees. The officers and Advisory Board Member hold office without limit in time, except that any officer and Advisory Board Member may resign or may be removed by a vote of a majority of the Trustees at any regular meeting or any special meeting of the Trustees. Except as indicated, each individual has held the office shown or other offices in the same company for the past five years.
Experience, Skills, Attributes, and Qualifications of the Fund's Trustees. The Governance and Nominating Committee has adopted a statement of policy that describes the experience, qualifications, attributes, and skills that are necessary and desirable for potential Independent Trustee candidates (Statement of Policy). The Board believes that each Trustee satisfied at the time he or she was initially elected or appointed a Trustee, and continues to satisfy, the standards contemplated by the Statement of Policy. The Governance and Nominating Committee also engages professional search firms to help identify potential Independent Trustee candidates who have the experience, qualifications, attributes, and skills consistent with the Statement of Policy. From time to time, additional criteria based on the composition and skills of the current Independent Trustees, as well as experience or skills that may be appropriate in light of future changes to board composition, business conditions, and regulatory or other developments, have also been considered by the professional search firms and the Governance and Nominating Committee. In addition, the Board takes into account the Trustees' commitment and participation in Board and committee meetings, as well as their leadership of standing and ad hoc committees throughout their tenure.
In determining that a particular Trustee was and continues to be qualified to serve as a Trustee, the Board has considered a variety of criteria, none of which, in isolation, was controlling. The Board believes that, collectively, the Trustees have balanced and diverse experience, qualifications, attributes, and skills, which allow the Board to operate effectively in governing the fund and protecting the interests of shareholders. Information about the specific experience, skills, attributes, and qualifications of each Trustee, which in each case led to the Board's conclusion that the Trustee should serve (or continue to serve) as a trustee of the fund, is provided below.
Annual Report
Trustees and Officers - continued
Board Structure and Oversight Function. James C. Curvey is an interested person (as defined in the 1940 Act) and currently serves as Chairman. The Trustees have determined that an interested Chairman is appropriate and benefits shareholders because an interested Chairman has a personal and professional stake in the quality and continuity of services provided to the fund. Independent Trustees exercise their informed business judgment to appoint an individual of their choosing to serve as Chairman, regardless of whether the Trustee happens to be independent or a member of management. The Independent Trustees have determined that they can act independently and effectively without having an Independent Trustee serve as Chairman and that a key structural component for assuring that they are in a position to do so is for the Independent Trustees to constitute a substantial majority for the Board. The Independent Trustees also regularly meet in executive session. Ned C. Lautenbach serves as Chairman of the Independent Trustees and as such (i) acts as a liaison between the Independent Trustees and management with respect to matters important to the Independent Trustees and (ii) with management prepares agendas for Board meetings.
Fidelity funds are overseen by different Boards of Trustees. The fund's Board oversees Fidelity's equity and high income funds and another Board oversees Fidelity's investment-grade bond, money market, and asset allocation funds. The asset allocation funds may invest in Fidelity funds overseen by the fund's Board. The use of separate Boards, each with its own committee structure, allows the Trustees of each group of Fidelity funds to focus on the unique issues of the funds they oversee, including common research, investment, and operational issues. On occasion, the separate Boards establish joint committees to address issues of overlapping consequences for the Fidelity funds overseen by each Board.
The Trustees operate using a system of committees to facilitate the timely and efficient consideration of all matters of importance to the Trustees, the fund, and fund shareholders and to facilitate compliance with legal and regulatory requirements and oversight of the fund's activities and associated risks. The Board, acting through its committees, has charged FMR and its affiliates with (i) identifying events or circumstances the occurrence of which could have demonstrably adverse effects on the fund's business and/or reputation; (ii) implementing processes and controls to lessen the possibility that such events or circumstances occur or to mitigate the effects of such events or circumstances if they do occur; and (iii) creating and maintaining a system designed to evaluate continuously business and market conditions in order to facilitate the identification and implementation processes described in (i) and (ii) above. Because the day-to-day operations and activities of the fund are carried out by or through FMR, its affiliates and other service providers, the fund's exposure to risks is mitigated but not eliminated by the processes overseen by the Trustees. While each of the Board's committees has responsibility for overseeing different aspects of the fund's activities, oversight is exercised primarily through the Operations, Audit, and Compliance Committees. In addition, the Independent Trustees have worked with FMR to enhance the Board's oversight of investment and financial risks, legal and regulatory risks, technology risks, and operational risks, including the development of additional risk reporting to the Board. For example, a working group comprised of Independent Trustees and FMR has worked and continues to work to review the Fidelity funds' valuation-related activities, reporting and risk management. Appropriate personnel, including but not limited to the fund's Chief Compliance Officer (CCO), FMR's internal auditor, the independent accountants, the fund's Treasurer and portfolio management personnel, make periodic reports to the Board's committees, as appropriate, including an annual review of FMR's risk management program for the Fidelity funds. The responsibilities of each standing committee, including their oversight responsibilities, are described further under "Standing Committees of the Fund's Trustees."
Annual Report
The fund's Statement of Additional Information (SAI) includes more information about the Trustees. To request a free copy, call Fidelity at 1-877-208-0098.
Interested Trustees*:
Correspondence intended for each Trustee who is an interested person may be sent to Fidelity Investments, 245 Summer Street, Boston, Massachusetts 02210.
Name, Year of Birth; Principal Occupations and Other Relevant Experience+ |
James C. Curvey (1935) |
Year of Election or Appointment: 2007 Trustee Chairman of the Board of Trustees |
| Mr. Curvey also serves as Trustee of other Fidelity funds. Mr. Curvey is a Director of Fidelity Research & Analysis Co. (2009-present), and Vice Chairman (2007-present) and Director of FMR LLC. In addition, Mr. Curvey serves as an Overseer for the Boston Symphony Orchestra and a member of the board of Artis-Naples, Naples, Florida, and as a Trustee for Brewster Academy, Wolfeboro, New Hampshire. Previously, Mr. Curvey served as a Director of Fidelity Investments Money Management, Inc. (2009-2014), a Director of FMR (2007-2014), and a Director of FMR Co., Inc. (2007-2014). |
Charles S. Morrison (1960) |
Year of Election or Appointment: 2014 Trustee |
| Mr. Morrison also serves as Trustee of other funds. He serves as a Director of Fidelity Investments Money Management, Inc. (FIMM) (2014-present), Director of Fidelity SelectCo, LLC (2014-present), President, Asset Management (2014-present), and is an employee of Fidelity Investments. Previously, Mr. Morrison served as Vice President of Fidelity's Fixed Income and Asset Allocation Funds (2012-2014), President, Fixed Income (2011-2014), Vice President of Fidelity's Money Market Funds (2005-2009), President, Money Market Group Leader of FMR (2009), and Senior Vice President, Money Market Group of FMR (2004-2009). Mr. Morrison also served as Vice President of Fidelity's Bond Funds (2002-2005), certain Balanced Funds (2002-2005), and certain Asset Allocation Funds (2002-2007), and as Senior Vice President (2002-2005) of Fidelity's Bond Division. |
* Trustees have been determined to be "Interested Trustees" by virtue of, among other things, their affiliation with the trust or various entities under common control with FMR.
+ The information above includes each Trustee's principal occupation during the last five years and other information relating to the experience, attributes, and skills relevant to each Trustee's qualifications to serve as a Trustee, which led to the conclusion that each Trustee should serve as a Trustee for the fund.
Annual Report
Independent Trustees:
Correspondence intended for each Independent Trustee (that is, the Trustees other than the Interested Trustees) may be sent to Fidelity Investments, P.O. Box 55235, Boston, Massachusetts 02205-5235.
Name, Year of Birth; Principal Occupations and Other Relevant Experience+ |
Dennis J. Dirks (1948) |
Year of Election or Appointment: 2005 Trustee |
| Mr. Dirks also serves as Trustee of other Fidelity funds. Prior to his retirement in May 2003, Mr. Dirks was Chief Operating Officer and a member of the Board of The Depository Trust & Clearing Corporation (DTCC). He also served as President, Chief Operating Officer, and Board member of The Depository Trust Company (DTC) and President and Board member of the National Securities Clearing Corporation (NSCC). In addition, Mr. Dirks served as Chief Executive Officer and Board member of the Government Securities Clearing Corporation, Chief Executive Officer and Board member of the Mortgage-Backed Securities Clearing Corporation, as a Trustee and a member of the Finance Committee of Manhattan College (2005-2008), and as a Trustee and a member of the Finance Committee of AHRC of Nassau County (2006-2008). Mr. Dirks is a member of the Independent Directors Council (IDC) Governing Council (2010-present) and Board of Directors for The Brookville Center for Children's Services, Inc. (2009-present). |
Alan J. Lacy (1953) |
Year of Election or Appointment: 2008 Trustee |
| Mr. Lacy also serves as Trustee of other Fidelity funds. Mr. Lacy serves as Senior Adviser (2007-present) of Oak Hill Capital Partners, L.P. (private equity). Mr. Lacy also served as Chief Executive Officer (2000-2005) and Vice Chairman (2005-2006) of Sears Holdings Corporation and Sears, Roebuck and Co. (retail). In addition, Mr. Lacy serves as a member of the Board of Directors of Dave & Buster's Entertainment, Inc. (restaurant and entertainment complexes, 2010-present), Earth Fare, Inc. (retail grocery, 2012-present), The Hillman Companies, Inc. (hardware wholesalers, 2010-present), and Bristol-Myers Squibb Company (global pharmaceuticals, 2008-present). Mr. Lacy is a member of the Board of Trustees of The National Parks Conservation Association (2006-present). Previously, Mr. Lacy served as Chairman of the Board of Trustees of the National Parks Conservation Association (2008-2011) and as a member of the Board of Directors for the Western Union Company (global money transfer, 2006-2011). |
Ned C. Lautenbach (1944) |
Year of Election or Appointment: 2000 Trustee Chairman of the Independent Trustees |
| Mr. Lautenbach also serves as Trustee of other Fidelity funds. Mr. Lautenbach currently serves as the Lead Director of the Eaton Corporation Board of Directors (diversified industrial, 1997-present). Mr. Lautenbach is Chairman of the Board of Directors of the Philharmonic Center for the Arts in Naples, Florida (2012-present) and a member of the Council on Foreign Relations (1994-present). Previously, Mr. Lautenbach was a Partner/Advisory Partner at Clayton, Dubilier & Rice, LLC (private equity investment, 1998-2010), as well as a Director of Sony Corporation (2006-2007). |
Joseph Mauriello (1944) |
Year of Election or Appointment: 2008 Trustee |
| Mr. Mauriello also serves as Trustee of other Fidelity funds. Prior to his retirement in January 2006, Mr. Mauriello served in numerous senior management positions including Deputy Chairman and Chief Operating Officer (2004-2005), and Vice Chairman of Financial Services (2002-2004) of KPMG LLP US (professional services, 1965-2005). Mr. Mauriello currently serves as a member of the Board of Directors of XL Group plc. (global insurance and re-insurance, 2006-present). Previously, Mr. Mauriello served as a Director of the Hamilton Funds of the Bank of New York (2006-2007) and of Arcadia Resources Inc. (health care services and products, 2007-2012). |
Robert W. Selander (1950) |
Year of Election or Appointment: 2011 Trustee |
| Mr. Selander also serves as Trustee of other Fidelity funds. Previously, Mr. Selander served as a Member of the Advisory Board of other Fidelity funds (2011), and Executive Vice Chairman (2010), Chief Executive Officer (2009-2010), and President and Chief Executive Officer (1997-2009) of Mastercard, Inc. |
Cornelia M. Small (1944) |
Year of Election or Appointment: 2005 Trustee |
| Ms. Small also serves as Trustee of other Fidelity funds. Ms. Small is a member of the Board of Directors (2009-present) and Chair of the Investment Committee (2010-present) of the Teagle Foundation. Ms. Small also serves on the Investment Committee of the Berkshire Taconic Community Foundation (2008-present). Previously, Ms. Small served as Chairperson (2002-2008) and a member of the Investment Committee and Chairperson (2008-2012) and a member of the Board of Trustees of Smith College. In addition, Ms. Small served as Chief Investment Officer, Director of Global Equity Investments, and a member of the Board of Directors of Scudder, Stevens & Clark and Scudder Kemper Investments. |
William S. Stavropoulos (1939) |
Year of Election or Appointment: 2001 Trustee Vice Chairman of the Independent Trustees |
| Mr. Stavropoulos also serves as Trustee of other Fidelity funds. Mr. Stavropoulos serves as President and Founder of the Michigan Baseball Foundation, the Great Lakes Loons (2007-present). Mr. Stavropoulos is Chairman Emeritus of the Board of Directors of The Dow Chemical Company, where he previously served in numerous senior management positions, including President, CEO (1995-2000; 2002-2004), Chairman of the Executive Committee (2000-2006), and as a member of the Board of Directors (1990-2006). Currently, Mr. Stavropoulos is Chairman of the Board of Directors of Univar Inc. (global distributor of commodity and specialty chemicals), a Director of Teradata Corporation (data warehousing and technology solutions), and Maersk Inc. (industrial conglomerate), and a member of the Advisory Board for Metalmark Capital LLC (private equity investment, 2005-present). Mr. Stavropoulos is an operating advisor to Clayton, Dubilier & Rice, LLC (private equity investment). In addition, Mr. Stavropoulos is a member of the University of Notre Dame Advisory Council for the College of Science, a Trustee of the Rollin L. Gerstacker Foundation, and a Director of the Naples Philharmonic Center for the Arts. Previously, Mr. Stavropoulos served as a Director of Chemical Financial Corporation (bank holding company, 1993-2012) and Tyco International, Ltd. (multinational manufacturing and services, 2007-2012). |
David M. Thomas (1949) |
Year of Election or Appointment: 2008 Trustee |
| Mr. Thomas also serves as Trustee of other Fidelity funds. Mr. Thomas serves as Non-Executive Chairman of the Board of Directors of Fortune Brands Home and Security (home and security products, 2011-present), and as a member of the Board of Directors of Interpublic Group of Companies, Inc. (marketing communication, 2004-present). Previously, Mr. Thomas served as Executive Chairman (2005-2006) and Chairman and Chief Executive Officer (2000-2005) of IMS Health, Inc. (pharmaceutical and healthcare information solutions), and a Director of Fortune Brands, Inc. (consumer products, 2000-2011). |
+ The information above includes each Trustee's principal occupation during the last five years and other information relating to the experience, attributes, and skills relevant to each Trustee's qualifications to serve as a Trustee, which led to the conclusion that each Trustee should serve as a Trustee for the fund.
Advisory Board Member and Officers:
Correspondence intended for each officer and Peter S. Lynch may be sent to Fidelity Investments, 245 Summer Street, Boston, Massachusetts 02210. Officers appear below in alphabetical order.
Name, Year of Birth; Principal Occupation |
Peter S. Lynch (1944) |
Year of Election or Appointment: 2003 Member of the Advisory Board |
| Mr. Lynch also serves as Member of the Advisory Board of other Fidelity funds. Mr. Lynch is Vice Chairman and a Director of FMR and FMR Co., Inc. In addition, Mr. Lynch serves as a Trustee of Boston College and as the Chairman of the Inner-City Scholarship Fund. Previously, Mr. Lynch served on the Special Olympics International Board of Directors (1997-2006). |
Elizabeth Paige Baumann (1968) |
Year of Election or Appointment: 2012 Anti-Money Laundering (AML) Officer |
| Ms. Baumann also serves as AML Officer of other funds. She is Chief AML Officer of FMR LLC (2012-present) and is an employee of Fidelity Investments. Previously, Ms. Baumann served as Vice President and Deputy Anti-Money Laundering Officer (2007-2012). |
William C. Coffey (1969) |
Year of Election or Appointment: 2009 Assistant Secretary |
| Mr. Coffey also serves as Assistant Secretary of other funds. He is Senior Vice President and Deputy General Counsel of FMR LLC (2010-present), and is an employee of Fidelity Investments. Previously, Mr. Coffey served as Vice President and Associate General Counsel of FMR LLC (2005-2009). |
Jonathan Davis (1968) |
Year of Election or Appointment: 2010 Assistant Treasurer |
| Mr. Davis also serves as Assistant Treasurer of other funds. Mr. Davis is an employee of Fidelity Investments. Previously, Mr. Davis served as Vice President and Associate General Counsel of FMR LLC (2003-2010). |
Adrien E. Deberghes (1967) |
Year of Election or Appointment: 2008 Deputy Treasurer |
| Mr. Deberghes also serves as an officer of other funds. He is an employee of Fidelity Investments (2008-present). Prior to joining Fidelity Investments, Mr. Deberghes was Senior Vice President of Mutual Fund Administration at State Street Corporation (2007-2008), Senior Director of Mutual Fund Administration at Investors Bank & Trust (2005-2007), and Director of Finance for Dunkin' Brands (2000-2005). |
Stephanie J. Dorsey (1969) |
Year of Election or Appointment: 2010 Assistant Treasurer |
| Ms. Dorsey also serves as an officer of other funds. She is an employee of Fidelity Investments (2008-present) and has served in other fund officer roles. Prior to joining Fidelity Investments, Ms. Dorsey served as Treasurer (2004-2008) of the JPMorgan Mutual Funds and Vice President (2004-2008) of JPMorgan Chase Bank. |
Howard J. Galligan III (1966) |
Year of Election or Appointment: 2014 Chief Financial Officer |
| Mr. Galligan also serves as Chief Financial Officer of other funds. Mr. Galligan serves as President of Fidelity Pricing and Cash Management Services (FPCMS) (2014-present) and as a Director of Strategic Advisers, Inc. (2008-present). Previously, Mr. Galligan served as Chief Administrative Officer of Asset Management (2011-2014) and Chief Operating Officer and Senior Vice President of Investment Support for Strategic Advisers, Inc. (2003-2011). |
Scott C. Goebel (1968) |
Year of Election or Appointment: 2008 Secretary and Chief Legal Officer (CLO) |
| Mr. Goebel serves as Secretary and CLO of other funds. Mr. Goebel also serves as Secretary of Fidelity SelectCo, LLC (2013-present), Fidelity Investments Money Management, Inc. (FIMM) (2010-present) and Fidelity Research and Analysis Company (FRAC) (2010-present); General Counsel, Secretary, and Senior Vice President of FMR (2008-present) and FMR Co., Inc. (2008-present); Chief Legal Officer of Fidelity Management & Research (Hong Kong) Limited (2008-present); and Assistant Secretary of Fidelity Management & Research (Japan) Limited (2008-present) and Fidelity Management & Research (U.K.) Inc. (2008-present). Previously, Mr. Goebel served as Secretary and CLO of other Fidelity funds (2008-2013), Assistant Secretary of FIMM (2008-2010), FRAC (2008-2010), and certain funds (2007-2008); and as Vice President and Secretary of Fidelity Distributors Corporation (FDC) (2005-2007). Mr. Goebel has been employed by FMR LLC or an affiliate since 2001. |
Thomas C. Hense (1964) |
Year of Election or Appointment: 2008/2010 Vice President |
| Mr. Hense also serves as Vice President of other funds (High Income (2008), Small Cap (2008), and Value (2010) funds). Previously, Mr. Hense served as a portfolio manager for Fidelity's Institutional Money Management Group (Pyramis) (2003-2008). |
Brian B. Hogan (1964) |
Year of Election or Appointment: 2009 Vice President |
| Mr. Hogan also serves as Trustee or Vice President of other funds. Mr. Hogan serves as a Director of Fidelity SelectCo, LLC (2014-present) and President of FMR's Equity Division (2009-present). Previously, Mr. Hogan served as Senior Vice President, Equity Research of FMR (2006-2009) and as a portfolio manager. |
Chris Maher (1972) |
Year of Election or Appointment: 2013 Assistant Treasurer |
| Mr. Maher serves as Assistant Treasurer of other funds. Mr. Maher is Vice President of Valuation Oversight and is an employee of Fidelity Investments. Previously, Mr. Maher served as Vice President of Asset Management Compliance (2013), Vice President of FMR's Program Management Group (2010-2013), and Vice President of Valuation Oversight (2008-2010). |
Kenneth B. Robins (1969) |
Year of Election or Appointment: 2008 President and Treasurer |
| Mr. Robins also serves as an officer of other funds. Mr. Robins serves as Executive Vice President of Fidelity Investments Money Management, Inc. (FIMM) (2013-present) and is an employee of Fidelity Investments (2004-present). Previously, Mr. Robins served in other fund officer roles. |
Stephen Sadoski (1971) |
Year of Election or Appointment: 2012 Deputy Treasurer |
| Mr. Sadoski also serves as Deputy Treasurer of other funds. He is an employee of Fidelity Investments (2012-present) and has served in another fund officer role. Prior to joining Fidelity Investments, Mr. Sadoski served as an assistant chief accountant in the Division of Investment Management of the Securities and Exchange Commission (SEC) (2009-2012) and as a senior manager at Deloitte & Touche LLP (1997-2009). |
Stacie M. Smith (1974) |
Year of Election or Appointment: 2013 Deputy Treasurer |
| Ms. Smith also serves as an officer of other funds. She is an employee of Fidelity Investments (2009-present) and has served in other fund officer roles. Prior to joining Fidelity Investments, Ms. Smith served as Senior Audit Manager of Ernst & Young LLP (1996-2009). |
Renee Stagnone (1975) |
Year of Election or Appointment: 2013 Deputy Treasurer |
| Ms. Stagnone also serves as Deputy Treasurer of other funds. Ms. Stagnone is an employee of Fidelity Investments. |
Linda J. Wondrack (1964) |
Year of Election or Appointment: 2014 Chief Compliance Officer |
| Ms. Wondrack also serves as Chief Compliance Officer of other funds. Ms. Wondrack is Executive Vice President and head of the Ethics Office and Asset Management Compliance for Fidelity Investments (2012-present). Ms. Wondrack also serves as Chief Compliance Officer of Fidelity SelectCo, LLC (2014-present); Chief Compliance Officer of Impresa Management LLC (2013-present); and Chief Compliance Officer of FMR Co., Inc., Fidelity Investments Money Management, Inc., Fidelity Management & Research (Japan) Limited, Fidelity Management & Research (U.K.) Inc., Fidelity Management & Research (Hong Kong), Fidelity Management & Research Company, Pyramis Global Advisors, LLC, and Strategic Advisers, Inc., Ballyrock Investment Advisors LLC, and Northern Neck Investors LLC (2012-present). Previously, Ms. Wondrack served as Senior Vice President and Chief Compliance Officer for Columbia Management Investment Advisers, LLC (2005-2012); Chief Compliance Officer for certain funds within the Columbia Family of Funds (2007-2012); and Senior Vice President of Compliance Risk Management at Bank of America (2005-2010). |
Joseph F. Zambello (1957) |
Year of Election or Appointment: 2011 Deputy Treasurer |
| Mr. Zambello also serves as Deputy Treasurer of other funds. Mr. Zambello is an employee of Fidelity Investments. Previously, Mr. Zambello served as Vice President of FMR's Program Management Group (2009-2011) and Vice President of the Transfer Agent Oversight Group (2005-2009). |
Annual Report
Board Approval of Investment Advisory Contracts and Management Fees
Fidelity Advisor Value Leaders Fund
Each year, the Board of Trustees, including the Independent Trustees (together, the Board), votes on the renewal of the management contract with Fidelity Management & Research Company (FMR) and the sub-advisory agreements (together, the Advisory Contracts) for the fund. The Board, assisted by the advice of fund counsel and Independent Trustees' counsel, requests and considers a broad range of information relevant to the renewal of the Advisory Contracts throughout the year.
The Board meets regularly and, at each of its meetings, covers an extensive agenda of topics and materials and considers factors that are relevant to its annual consideration of the renewal of the fund's Advisory Contracts, including the services and support provided to the fund and its shareholders. The Board has established various standing committees (Committees), each composed of and chaired by Independent Trustees with varying backgrounds, to which the Board has assigned specific subject matter responsibilities in order to enhance effective decision-making by the Board. The Board, acting directly and through its Committees, requests and receives information concerning the annual consideration of the renewal of the fund's Advisory Contracts. The Board also meets as needed to consider matters specifically related to the Board's annual consideration of the renewal of the Advisory Contracts. Members of the Board may also meet with trustees of other Fidelity funds through ad hoc joint committees to discuss certain matters relevant to the Fidelity funds.
At its July 2014 meeting, the Board, including the Independent Trustees, unanimously determined to renew the fund's Advisory Contracts. In reaching its determination, the Board considered all factors it believed relevant, including (i) the nature, extent, and quality of the services to be provided to the fund and its shareholders (including the investment performance of the fund); (ii) the competitiveness of the fund's management fee and total expense ratio relative to peer funds; (iii) the total costs of the services to be provided by and the profits to be realized by Fidelity from its relationship with the fund; (iv) the extent to which economies of scale exist and would be realized as the fund grows; and (v) whether fee levels reflect these economies of scale, if any, for the benefit of fund shareholders. In connection with separate internal corporate reorganizations involving Fidelity Management & Research (U.K.) Inc. (FMR U.K.) and Fidelity Management & Research (Japan) Inc. (FMR Japan), the Board approved certain non-material amendments to the fund's sub-advisory agreements with FMR U.K. and FMR Japan to reflect that, after these reorganizations, FMR Investment Management (UK) Limited and Fidelity Management & Research (Japan) Limited will carry on the business of FMR U.K. and FMR Japan, respectively. The Board noted that no changes to the portfolio managers or to the foreign research or investment advisory services provided to the fund were expected in connection with either reorganization and that the same personnel and resources would continue to be available to the fund at the new entities.
Annual Report
Board Approval of Investment Advisory Contracts and
Management Fees - continued
In considering whether to renew the Advisory Contracts for the fund, the Board reached a determination, with the assistance of fund counsel and Independent Trustees' counsel and through the exercise of its business judgment, that the renewal of the Advisory Contracts was in the best interests of the fund and its shareholders and that the compensation payable under the Advisory Contracts was fair and reasonable. The Board's decision to renew the Advisory Contracts was not based on any single factor, but rather was based on a comprehensive consideration of all the information provided to the Board at its meetings throughout the year. The Board, in reaching its determination to renew the Advisory Contracts, was aware that shareholders of the fund have a broad range of investment choices available to them, including a wide choice among funds offered by Fidelity's competitors, and that the fund's shareholders, who have the opportunity to review and weigh the disclosure provided by the fund in its prospectus and other public disclosures, have chosen to invest in this fund, which is part of the Fidelity family of funds.
Nature, Extent, and Quality of Services Provided. The Board considered Fidelity's staffing as it relates to the fund, including the backgrounds of investment personnel of FMR and the sub-advisers (together, the Investment Advisers), and also considered the fund's investment objective, strategies, and related investment philosophy. The Independent Trustees also had discussions with senior management of Fidelity's investment operations and investment groups. The Board considered the structure of the portfolio manager compensation program and whether this structure provides appropriate incentives to act in the best interests of the fund. Additionally, the Board considered the portfolio managers' investments, if any, in the funds that they manage.
Resources Dedicated to Investment Management and Support Services. The Board and the Fund Oversight and Research Committees reviewed the general qualifications and capabilities of Fidelity's investment staff, including its size, education, experience, and resources, as well as Fidelity's approach to recruiting, training, managing, and compensating investment personnel. The Board noted that Fidelity has continued to increase the resources devoted to non-U.S. offices, including expansion of Fidelity's global investment organization. The Board also noted that Fidelity's analysts have extensive resources, tools and capabilities that allow them to conduct sophisticated quantitative and fundamental analysis, as well as credit analysis of issuers, counterparties and guarantors. Further, the Board believes that Fidelity's investment professionals have sufficient access to global information and data so as to provide competitive investment results over time, and that those professionals also have access to sophisticated tools that permit them to assess portfolio construction and risk and performance attribution characteristics continuously, as well as to transmit new information and research conclusions rapidly around the world. Additionally, in its deliberations, the Board considered Fidelity's trading and risk management capabilities and resources and global compliance infrastructure, which are an integral part of the investment management process.
Annual Report
Shareholder and Administrative Services. The Board considered (i) the nature, extent, quality, and cost of advisory, administrative, and shareholder services performed by the Investment Advisers and their affiliates under the Advisory Contracts and under separate agreements covering transfer agency, pricing and bookkeeping, and securities lending services for the fund; (ii) the nature and extent of the supervision of third party service providers, principally custodians and subcustodians; and (iii) the resources devoted to, and the record of compliance with, the fund's compliance policies and procedures. The Board also reviewed the allocation of fund brokerage, including allocations to brokers affiliated with the Investment Advisers, the use of brokerage commissions to pay fund expenses, and the use of "soft" commission dollars to pay for research services.
The Board noted that the growth of fund assets over time across the complex allows Fidelity to reinvest in the development of services designed to enhance the value or convenience of the Fidelity funds as investment vehicles. These services include 24-hour access to account information and market information through telephone representatives and over the Internet, investor education materials and asset allocation tools, and the expanded availability of Fidelity Investor Centers.
In 2014, the Board formed an ad hoc Committee on Transfer Agency Fees to review the variety of transfer agency fee structures throughout the industry and Fidelity's competitive positioning with respect to industry participants.
Investment in a Large Fund Family. The Board considered the benefits to shareholders of investing in a Fidelity fund, including the benefits of investing in a fund that is part of a large family of funds offering a variety of investment disciplines and providing a large variety of mutual fund investor services. The Board noted that Fidelity had taken, or had made recommendations that resulted in the Fidelity funds taking, a number of actions over the previous year that benefited particular funds, including (i) continuing to dedicate additional resources to investment research and to the support of the senior management team that oversees asset management; (ii) persisting in efforts to enhance Fidelity's global research capabilities; (iii) launching new funds and making other enhancements to meet client needs for income-oriented solutions; (iv) reducing fund expenses for certain index funds; (v) continuing to launch dedicated lower cost underlying funds to meet portfolio construction needs related to expanding underlying fund options for Fidelity funds of funds, specifically for the Freedom Fund product lines; (vi) rationalizing product lines and gaining increased efficiencies through fund mergers; (vii) launching sector-based exchange-traded funds and establishing a new Fidelity adviser to manage sector-based funds and products; (viii) continuing to develop and implement technology to improve security and increase efficiency; (ix) modifying the eligibility criteria for certain share classes to increase their marketability to a portion of the defined contribution plan market; (x) waiving redemption fees for certain qualified fund-of-fund and wrap programs and certain retirement plan transactions; and (xi) launching new Institutional Class shares of certain money market funds to attract and retain assets and to fill a gap in the money market fund lineup.
Annual Report
Board Approval of Investment Advisory Contracts and
Management Fees - continued
Investment Performance. The Board considered whether the fund has operated in accordance with its investment objective, as well as its record of compliance with its investment restrictions and its performance history.
The Board took into account discussions with the Investment Advisers about fund investment performance that occur at Board meetings throughout the year. In this regard the Board noted that as part of regularly scheduled fund reviews and other reports to the Board on fund performance, the Board periodically considers annualized return information for the fund, for different time periods, measured against a securities market index ("benchmark index") and a peer group of funds with similar objectives ("peer group"). In its evaluation of fund investment performance, the Board gave particular attention to information indicating changes in performance of certain Fidelity funds for specific time periods and the Investment Advisers' explanations for any overperformance or underperformance.
In addition to reviewing absolute and relative fund performance, the Independent Trustees periodically consider the appropriateness of fund performance metrics in evaluating the results achieved. In general, the Independent Trustees believe that fund performance should be evaluated based on net performance (after fees and expenses) of both the highest performing and lowest performing classes, where applicable, compared to appropriate benchmark indices, over appropriate time periods which may include full market cycles, and compared to peer groups, as applicable, over the same periods, taking into account relevant factors including the following: general market conditions; issuer-specific information; tactical opportunities for investment; and fund cash flows and other factors.
The Independent Trustees recognize that shareholders evaluate performance on a net basis over their own holding periods, for which one-, three-, and five-year periods are often used as a proxy. For this reason, the performance information reviewed by the Board also included net cumulative calendar year total return information for the fund and an appropriate benchmark index and peer group for the most recent one-, three-, and five-year periods, as shown below. Returns are shown compared to the 25th percentile (top of box, 75% beaten) and 75th percentile (bottom of box, 25% beaten) of the peer universe.
Annual Report
Fidelity Advisor Value Leaders Fund

The Board also considered that the fund's management fee is subject to upward or downward adjustment depending upon whether, and to what extent, the fund's investment performance for the performance period exceeds, or is exceeded by, a securities index, thus leading to a performance adjustment for the same period. The Board noted that the performance adjustment provides FMR with a strong economic incentive to seek to achieve superior performance for the fund's shareholders and helps to more closely align the interests of FMR and the fund's shareholders.
Based on its review, the Board concluded that the nature, extent, and quality of services provided to the fund under the Advisory Contracts should benefit the fund's shareholders.
Competitiveness of Management Fee and Total Expense Ratio. The Board considered the fund's management fee and total expense ratio compared to "mapped groups" of competitive funds and classes. Fidelity creates "mapped groups" by combining similar Lipper investment objective categories that have comparable investment mandates. Combining Lipper investment objective categories aids the Board's management fee and total expense ratio comparisons by broadening the competitive group used for comparison and by reducing the number of universes to which various Fidelity funds are compared.
Management Fee. The Board considered two proprietary management fee comparisons for the 12-month periods shown in the chart below. The group of Lipper funds used by the Board for management fee comparisons is referred to below as the "Total Mapped Group." The Total Mapped Group comparison focuses on a fund's standing in terms of gross management fees before expense reimbursements or caps, and without giving effect to the fund's performance adjustment, relative to the total universe of funds with comparable investment mandates, regardless of whether their management fee structures also are comparable. Funds with comparable investment mandates offer exposure to similar types of securities. Funds with comparable management fee structures have similar management fee contractual arrangements (e.g., flat rate charged for advisory services, all-inclusive fee rate, etc.). "TMG %" represents the percentage of funds in the Total Mapped Group that had management fees that were lower than the fund's. For example, a hypothetical TMG % of 20% would mean that 80% of the funds in the Total Mapped Group had higher, and 20% had lower, management fees than the fund. The fund's actual TMG %s are in the chart below. The "Asset-Size Peer Group" (ASPG) comparison focuses on a fund's standing relative to a subset of non-Fidelity funds within the Total Mapped Group that are similar in size and management fee structure. For example, if a fund is in the first quartile of the ASPG, the fund's management fee ranks in the least expensive or lowest 25% of funds in the ASPG. The ASPG represents at least 15% of the funds in the Total Mapped Group with comparable asset size and management fee structures, subject to a minimum of 50 funds (or all funds in the Total Mapped Group if fewer than 50). Additional information, such as the ASPG quartile in which the fund's management fee rate ranked and the impact of the fund's performance adjustment, is also included in the chart and considered by the Board.
Annual Report
Board Approval of Investment Advisory Contracts and
Management Fees - continued
Fidelity Advisor Value Leaders Fund

The Board noted that the fund's management fee rate ranked below the median of its Total Mapped Group and below the median of its ASPG for 2013. The Board also noted the effect of the fund's negative performance adjustment on the fund's management fee ranking.
Annual Report
The Board also noted that, in August 2013, the ad hoc Committee on Management Fees was formed to conduct an in-depth review of the management fee rates of Fidelity's active equity mutual funds. The Committee focused on the following areas: (i) standard fee structures; (ii) research consumption and trading evolution; (iii) management fee competitiveness/profitability by category; and (iv) factors that drive institutional pricing.
Based on its review, the Board concluded that the fund's management fee is fair and reasonable in light of the services that the fund receives and the other factors considered.
Total Expense Ratio. In its review of each class's total expense ratio, the Board considered the fund's management fee as well as other fund or class expenses, as applicable, such as transfer agent fees, pricing and bookkeeping fees, fund-paid 12b-1 fees, and custodial, legal, and audit fees. The Board also noted the effects of any waivers and reimbursements on fees and expenses, as well as the impact of the fund's performance adjustment. As part of its review, the Board also considered the current and historical total expense ratios of each class of the fund compared to competitive fund median expenses. Each class of the fund is compared to those funds and classes in the Total Mapped Group (used by the Board for management fee comparisons) that have a similar sales load structure.
The Board noted that the total expense ratio of Institutional Class ranked below its competitive median for 2013, the total expense ratio of Class A ranked equal to its competitive median for 2013, and the total expense ratio of each of Class T, Class B, and Class C ranked above its competitive median for 2013. The Board considered that, in general, various factors can affect total expense ratios. The Board noted that the total expense ratio of Class T was above the competitive median primarily because of higher 12b-1 fees on Class T as compared to most competitor funds. Class T has a higher 12b-1 fee, but a lower front-end sales charge, than traditionally priced front-end sales charge classes. The Board considered that Class T is primarily sold load-waived in the retirement plan market where its 0.50% 12b-1 fee is comparable to competing no-load, higher 12b-1 fee classes designed specifically for retirement plans. The Board noted that the fund offers multiple classes, each of which has a different sales load and 12b-1 fee structure, and that the multiple structures are intended to offer a range of pricing options for the intermediary market. The Board also noted that the total expense ratios of the classes vary primarily by the level of their 12b-1 fees, although differences in transfer agent fees may also cause expenses to vary from class to class.
Fees Charged to Other Fidelity Clients. The Board also considered Fidelity fee structures and other information with respect to clients of Fidelity, such as other funds advised or subadvised by Fidelity, pension plan clients, and other institutional clients. The Board noted the findings of the 2013 ad hoc joint committee (created with the board of other Fidelity funds), which reviewed and compared Fidelity's institutional investment advisory business with its business of providing services to the Fidelity funds, including the differences in services provided, fees charged, and costs incurred, as well as competition in their respective marketplaces.
Annual Report
Board Approval of Investment Advisory Contracts and
Management Fees - continued
Based on its review of total expense ratios and fees charged to other Fidelity clients, the Board concluded that the total expense ratio of each class of the fund was reasonable, although in some cases above the median of the universe presented for comparison, in light of the services that the fund and its shareholders receive and the other factors considered.
Costs of the Services and Profitability. The Board considered the revenues earned and the expenses incurred by Fidelity in conducting the business of developing, marketing, distributing, managing, administering and servicing the fund and servicing the fund's shareholders. The Board also considered the level of Fidelity's profits in respect of all the Fidelity funds.
On an annual basis, Fidelity presents to the Board Fidelity's profitability for the fund. Fidelity calculates the profitability for each fund, as well as aggregate profitability for groups of Fidelity funds and all Fidelity funds, using a series of detailed revenue and cost allocation methodologies which originate with the books and records of Fidelity on which Fidelity's audited financial statements are based. The Audit Committee of the Board reviews any significant changes from the prior year's methodologies.
PricewaterhouseCoopers LLP (PwC), independent registered public accounting firm and auditor to Fidelity and certain Fidelity funds, has been engaged annually by the Board as part of the Board's assessment of Fidelity's profitability analysis. PwC's engagement includes the review and assessment of the methodologies used by Fidelity in determining the revenues and expenses attributable to Fidelity's mutual fund business, and completion of agreed-upon procedures in respect of the mathematical accuracy of fund profitability and its conformity to established allocation methodologies. After considering PwC's reports issued under the engagement and information provided by Fidelity, the Board concluded that while other allocation methods may also be reasonable, Fidelity's profitability methodologies are reasonable in all material respects.
The Board also reviewed Fidelity's non-fund businesses and fall-out benefits related to the mutual fund business as well as cases where Fidelity's affiliates may benefit from or be related to the fund's business.
The Board considered the costs of the services provided by and the profits realized by Fidelity in connection with the operation of the fund and was satisfied that the profitability was not excessive in the circumstances.
Economies of Scale. The Board considered whether there have been economies of scale in respect of the management of the Fidelity funds, whether the Fidelity funds (including the fund) have appropriately benefited from any such economies of scale, and whether there is potential for realization of any further economies of scale. The Board considered the extent to which the fund will benefit from economies of scale through increased services to the fund, through waivers or reimbursements, or through fee or expense ratio reductions. The Board also noted that in 2013, it and the boards of other Fidelity funds created an ad hoc committee (the Economies of Scale Committee) to analyze whether Fidelity attains economies of scale in respect of the management and servicing of the Fidelity funds, whether the Fidelity funds have appropriately benefited from such economies of scale, and whether there is potential for realization of any further economies of scale.
Annual Report
The Board recognized that the fund's management contract incorporates a "group fee" structure, which provides for lower group fee rates as total group assets increase, and for higher group fee rates as total group assets decrease (with "group assets" defined to include fund assets under FMR's management plus sector fund assets previously under FMR's management and currently managed by Fidelity SelectCo, LLC). FMR calculates the group fee rates based on a tiered asset "breakpoint" schedule that varies based on asset class. The Board considered that the group fee is designed to deliver the benefits of economies of scale to fund shareholders when total Fidelity fund assets increase, even if assets of any particular fund are unchanged or have declined, because some portion of Fidelity's costs are attributable to services provided to all Fidelity funds, and all funds benefit if those costs can be allocated among more assets. The Board concluded that, given the group fee structure, fund shareholders will benefit from lower management fees as group assets increase at the fund complex level, regardless of whether Fidelity achieves any such economies of scale.
The Board concluded, taking into account the analysis of the Economies of Scale Committee, that economies of scale, if any, are being appropriately shared between fund shareholders and Fidelity.
Additional Information Requested by the Board. In order to develop fully the factual basis for consideration of the Fidelity funds' Advisory Contracts, the Board requested and received additional information on certain topics, including: (i) fund performance trends and Fidelity's long-term strategies for certain funds; (ii) Fidelity's strategic marketing and product lineup goals; (iii) the methodology with respect to competitive fund data and peer group classifications; (iv) the arrangements with, and performance of, certain sub-advisers on behalf of the Fidelity funds, as well as certain proposed participating affiliate arrangements; (v) the realization of fall-out benefits in certain Fidelity business units; (vi) Fidelity's group fee structures, including the rationale for the individual fee rates of certain categories of funds and the definition of group assets; (vii) trends regarding industry use of performance fee structures and the performance adjustment methodologies applicable to the Fidelity funds; (viii) additional competitive analysis regarding the total expenses for certain classes; (ix) fund profitability methodology, including Fidelity's cost allocation methodology, and the impact of certain factors on fund profitability results; and (x) the process by which Fidelity determines sub-advisory fees for funds it advises.
Annual Report
Board Approval of Investment Advisory Contracts and
Management Fees - continued
Based on its evaluation of all of the conclusions noted above, and after considering all factors it believed relevant, the Board ultimately concluded that the advisory fee structures are fair and reasonable, and that the fund's Advisory Contracts should be renewed.
Annual Report
Investment Adviser
Fidelity Management & Research Company
Boston, MA
Investment Sub-Advisers
FMR Co., Inc.
Fidelity Management & Research
(U.K.) Inc.
Fidelity Management & Research
(Japan) Limited
Fidelity Management & Research
(Hong Kong) Limited
General Distributor
Fidelity Distributors Corporation
Smithfield, RI
Transfer and Service Agents
Fidelity Investments Institutional Operations Company, Inc.
Boston, MA
Fidelity Service Company, Inc.
Boston, MA
Custodian
Brown Brothers Harriman & Company
Boston, MA
(Fidelity Investment logo)(registered trademark)
AVLFI-UANN-1214
1.793580.111
Item 2. Code of Ethics
As of the end of the period, October 31, 2014, Fidelity Advisor Series VIII (the trust) has adopted a code of ethics, as defined in Item 2 of Form N-CSR, that applies to its President and Treasurer and its Chief Financial Officer. A copy of the code of ethics is filed as an exhibit to this Form N-CSR.
Item 3. Audit Committee Financial Expert
The Board of Trustees of the trust has determined that Joseph Mauriello is an audit committee financial expert, as defined in Item 3 of Form N-CSR. Mr. Mauriello is independent for purposes of Item 3 of Form N-CSR.
Item 4. Principal Accountant Fees and Services
Fees and Services
The following table presents fees billed by Deloitte & Touche LLP, the member firms of Deloitte Touche Tohmatsu, and their respective affiliates (collectively, "Deloitte Entities") in each of the last two fiscal years for services rendered to Fidelity Advisor Emerging Markets Fund and Fidelity Advisor International Capital Appreciation Fund (the "Funds"):
Services Billed by Deloitte Entities
October 31, 2014 FeesA
| Audit Fees | Audit-Related Fees | Tax Fees | All Other Fees |
Fidelity Advisor Emerging Markets Fund | $44,000 | $- | $6,900 | $700 |
Fidelity Advisor International Capital Appreciation Fund | $50,000 | $- | $6,900 | $600 |
October 31, 2013 FeesA
| Audit Fees | Audit-Related Fees | Tax Fees | All Other Fees |
Fidelity Advisor Emerging Markets Fund | $44,000 | $- | $6,900 | $600 |
Fidelity Advisor International Capital Appreciation Fund | $51,000 | $- | $6,900 | $500 |
A Amounts may reflect rounding.
The following table presents fees billed by PricewaterhouseCoopers LLP ("PwC") in each of the last two fiscal years for services rendered to Fidelity Advisor Diversified International Fund, Fidelity Advisor Emerging Asia Fund, Fidelity Advisor Global Capital Appreciation Fund, Fidelity Advisor Global Equity Income Fund, Fidelity Advisor Overseas Fund, and Fidelity Advisor Value Leaders Fund (the "Funds"):
Services Billed by PwC
October 31, 2014 FeesA
| Audit Fees | Audit-Related Fees | Tax Fees | All Other Fees |
Fidelity Advisor Diversified International Fund | $57,000 | $- | $9,000 | $2,300 |
Fidelity Advisor Emerging Asia Fund | $64,000 | $- | $5,300 | $1,800 |
Fidelity Advisor Global Capital Appreciation Fund | $56,000 | $- | $5,600 | $1,700 |
Fidelity Advisor Global Equity Income Fund | $48,000 | $- | $6,100 | $1,200 |
Fidelity Advisor Overseas Fund | $65,000 | $- | $6,300 | $1,900 |
Fidelity Advisor Value Leaders Fund | $43,000 | $- | $4,500 | $1,700 |
October 31, 2013 FeesA
| Audit Fees | Audit-Related Fees | Tax Fees | All Other Fees |
Fidelity Advisor Diversified International Fund | $61,000 | $- | $32,500 | $2,200 |
Fidelity Advisor Emerging Asia Fund | $63,000 | $- | $5,200 | $1,600 |
Fidelity Advisor Global Capital Appreciation Fund | $56,000 | $- | $5,200 | $1,500 |
Fidelity Advisor Global Equity Income Fund | $42,000 | $- | $5,200 | $- |
Fidelity Advisor Overseas Fund | $64,000 | $- | $7,600 | $1,700 |
Fidelity Advisor Value Leaders Fund | $43,000 | $- | $4,400 | $1,500 |
A Amounts may reflect rounding.
The following table presents fees billed by PwC and Deloitte Entities that were required to be approved by the Audit Committee for services that relate directly to the operations and financial reporting of the Funds and that are rendered on behalf of Fidelity Management & Research Company ("FMR") and entities controlling, controlled by, or under common control with FMR (not including any sub-adviser whose role is primarily portfolio management and is subcontracted with or overseen by another investment adviser) that provide ongoing services to the Funds ("Fund Service Providers"):
Services Billed by Deloitte Entities
| October 31, 2014A | October 31, 2013A |
Audit-Related Fees | $150,000 | $1,010,000 |
Tax Fees | $- | $- |
All Other Fees | $590,000 | $800,000 |
A Amounts may reflect rounding.
Services Billed by PwC
| October 31, 2014A | October 31, 2013A |
Audit-Related Fees | $4,430,000 | $5,395,000 |
Tax Fees | $- | $- |
All Other Fees | $- | $50,000 |
A Amounts may reflect rounding.
"Audit-Related Fees" represent fees billed for assurance and related services that are reasonably related to the performance of the fund audit or the review of the fund's financial statements and that are not reported under Audit Fees.
"Tax Fees" represent fees billed for tax compliance, tax advice or tax planning that relate directly to the operations and financial reporting of the fund.
"All Other Fees" represent fees billed for services provided to the fund or Fund Service Provider, a significant portion of which are assurance related, that relate directly to the operations and financial reporting of the fund, excluding those services that are reported under Audit Fees, Audit-Related Fees or Tax Fees.
Assurance services must be performed by an independent public accountant.
* * *
The aggregate non-audit fees billed by PwC and Deloitte Entities for services rendered to the Funds, FMR (not including any sub-adviser whose role is primarily portfolio management and is subcontracted with or overseen by another investment adviser), and any Fund Service Provider for each of the last two fiscal years of the Funds are as follows:
Billed By | October 31, 2014 A | October 31, 2013 A,B |
PwC | $5,690,000 | $6,365,000 |
Deloitte Entities | $1,840,000 | $1,935,000 |
A Amounts may reflect rounding.
B Reflects current period presentation.
The trust's Audit Committee has considered non-audit services that were not pre-approved that were provided by PwC and Deloitte Entities to Fund Service Providers to be compatible with maintaining the independence of PwC and Deloitte Entities in their audits of the Funds, taking into account representations from PwC and Deloitte Entities, in accordance with Public Company Accounting Oversight Board rules, regarding their independence from the Funds and their related entities and FMR's review of the appropriateness and permissibility under applicable law of such non-audit services prior to their provision to the Fund Service Providers.
Audit Committee Pre-Approval Policies and Procedures
The trust's Audit Committee must pre-approve all audit and non-audit services provided by a fund's independent registered public accounting firm relating to the operations or financial reporting of the fund. Prior to the commencement of any audit or non-audit services to a fund, the Audit Committee reviews the services to determine whether they are appropriate and permissible under applicable law.
The Audit Committee has adopted policies and procedures to, among other purposes, provide a framework for the Committee's consideration of non-audit services by the audit firms that audit the Fidelity funds. The policies and procedures require that any non-audit service provided by a fund audit firm to a Fidelity fund and any non-audit service provided by a fund auditor to a Fund Service Provider that relates directly to the operations and financial reporting of a Fidelity fund ("Covered Service") are subject to approval by the Audit Committee before such service is provided.
All Covered Services must be approved in advance of provision of the service either: (i) by formal resolution of the Audit Committee, or (ii) by oral or written approval of the service by the Chair of the Audit Committee (or if the Chair is unavailable, such other member of the Audit Committee as may be designated by the Chair to act in the Chair's absence). The approval contemplated by (ii) above is permitted where the Treasurer determines that action on such an engagement is necessary before the next meeting of the Audit Committee.
Non-audit services provided by a fund audit firm to a Fund Service Provider that do not relate directly to the operations and financial reporting of a Fidelity fund are reported to the Audit Committee on a periodic basis.
Non-Audit Services Approved Pursuant to Rule 2-01(c)(7)(i)(C) and (ii) of Regulation S-X ("De Minimis Exception")
There were no non-audit services approved or required to be approved by the Audit Committee pursuant to the De Minimis Exception during the Funds' last two fiscal years relating to services provided to (i) the Funds or (ii) any Fund Service Provider that relate directly to the operations and financial reporting of the Funds.
Item 5. Audit Committee of Listed Registrants
Not applicable.
Item 6. Investments
(a) Not applicable.
(b) Not applicable
Item 7. Disclosure of Proxy Voting Policies and Procedures for Closed-End Management Investment Companies
Not applicable.
Item 8. Portfolio Managers of Closed-End Management Investment Companies
Not applicable.
Item 9. Purchase of Equity Securities by Closed-End Management Investment Company and Affiliated Purchasers
Not applicable.
Item 10. Submission of Matters to a Vote of Security Holders
There were no material changes to the procedures by which shareholders may recommend nominees to the trust's Board of Trustees.
Item 11. Controls and Procedures
(a)(i) The President and Treasurer and the Chief Financial Officer have concluded that the trust's disclosure controls and procedures (as defined in Rule 30a-3(c) under the Investment Company Act) provide reasonable assurances that material information relating to the trust is made known to them by the appropriate persons, based on their evaluation of these controls and procedures as of a date within 90 days of the filing date of this report.
(a)(ii) There was no change in the trust's internal control over financial reporting (as defined in Rule 30a-3(d) under the Investment Company Act) that occurred during the second fiscal quarter of the period covered by this report that has materially affected, or is reasonably likely to materially affect, the trust's internal control over financial reporting.
Item 12. Exhibits
(a) | (1) | Code of Ethics pursuant to Item 2 of Form N-CSR is filed and attached hereto as EX-99.CODE ETH. |
(a) | (2) | Certification pursuant to Rule 30a-2(a) under the Investment Company Act of 1940 (17 CFR 270.30a-2(a)) is filed and attached hereto as Exhibit 99.CERT. |
(a) | (3) | Not applicable. |
(b) | | Certification pursuant to Rule 30a-2(b) under the Investment Company Act of 1940 (17 CFR 270.30a-2(b)) is furnished and attached hereto as Exhibit 99.906CERT. |
SIGNATURES
Pursuant to the requirements of the Securities Exchange Act of 1934 and the Investment Company Act of 1940, the registrant has duly caused this report to be signed on its behalf by the undersigned, thereunto duly authorized.
Fidelity Advisor Series VIII
By: | /s/Kenneth B. Robins |
| Kenneth B. Robins |
| President and Treasurer |
| |
Date: | December 26, 2014 |
Pursuant to the requirements of the Securities Exchange Act of 1934 and the Investment Company Act of 1940, this report has been signed below by the following persons on behalf of the registrant and in the capacities and on the dates indicated.
By: | /s/Kenneth B. Robins |
| Kenneth B. Robins |
| President and Treasurer |
| |
Date: | December 26, 2014 |
By: | /s/Howard J. Galligan III |
| Howard J. Galligan III |
| Chief Financial Officer |
| |
Date: | December 26, 2014 |