UNITED STATES
SECURITIES AND EXCHANGE COMMISSION
Washington, D.C. 20549
FORM N-CSR
CERTIFIED SHAREHOLDER REPORT OF REGISTERED
MANAGEMENT INVESTMENT COMPANIES
Investment Company Act file number 811-3855
Fidelity Advisor Series VIII
(Exact name of registrant as specified in charter)
245 Summer St., Boston, Massachusetts 02210
(Address of principal executive offices) (Zip code)
Marc Bryant, Secretary
245 Summer St.
Boston, Massachusetts 02210
(Name and address of agent for service)
Registrant's telephone number, including area code:
617-563-7000
| |
Date of fiscal year end: | October 31 |
| |
Date of reporting period: | October 31, 2015 |
Item 1.
Reports to Stockholders
Fidelity Advisor® Diversified International Fund Class A, Class T, Class B and Class C
Annual Report October 31, 2015 |
 |
Contents
To view a fund's proxy voting guidelines and proxy voting record for the 12-month period ended June 30, visit http://www.fidelity.com/proxyvotingresults or visit the Securities and Exchange Commission's (SEC) web site at http://www.sec.gov.
You may also call 1-877-208-0098 to request a free copy of the proxy voting guidelines.
Standard & Poor's, S&P and S&P 500 are registered service marks of The McGraw-Hill Companies, Inc. and have been licensed for use by Fidelity Distributors Corporation.
Other third-party marks appearing herein are the property of their respective owners.
All other marks appearing herein are registered or unregistered trademarks or service marks of FMR LLC or an affiliated company. © 2015 FMR LLC. All rights reserved.
This report and the financial statements contained herein are submitted for the general information of the shareholders of the Fund. This report is not authorized for distribution to prospective investors in the Fund unless preceded or accompanied by an effective prospectus.
A fund files its complete schedule of portfolio holdings with the SEC for the first and third quarters of each fiscal year on Form N-Q. Forms N-Q are available on the SEC’s web site at http://www.sec.gov. A fund's Forms N-Q may be reviewed and copied at the SEC’s Public Reference Room in Washington, DC. Information regarding the operation of the SEC's Public Reference Room may be obtained by calling 1-800-SEC-0330.
For a complete list of a fund's portfolio holdings, view the most recent holdings listing, semiannual report, or annual report on Fidelity's web site at http://www.fidelity.com, http://www.advisor.fidelity.com, or http://www.401k.com, as applicable.
NOT FDIC INSURED •MAY LOSE VALUE •NO BANK GUARANTEE
Neither the Fund nor Fidelity Distributors Corporation is a bank.
Performance: The Bottom Line
Average annual total return reflects the change in the value of an investment, assuming reinvestment of distributions from dividend income and capital gains (the profits earned upon the sale of securities that have grown in value, if any) and assuming a constant rate of performance each year.
The hypothetical investment and the average annual total returns do not reflect the deduction of taxes that a shareholder would pay on fund distributions or the redemption of fund shares.
During periods of reimbursement by Fidelity, a fund’s total return will be greater than it would be had the reimbursement not occurred.
How a fund did yesterday is no guarantee of how it will do tomorrow.
Returns reflect the conversion of Class B shares to Class A shares after a maximum of seven years.
Average Annual Total Returns
| For the periods ended October 31, 2015 | Past 1 year | Past 5 years | Past 10 years |
| Class A (incl. 5.75% sales charge) | (2.05)% | 5.48% | 3.30% |
| Class T (incl. 3.50% sales charge) | 0.04% | 5.72% | 3.30% |
| Class B (incl. contingent deferred sales charge) | (1.89)% | 5.59% | 3.34% |
| Class C (incl. contingent deferred sales charge) | 2.15% | 5.96% | 3.14% |
Class B shares' contingent deferred sales charges included in the past one year, past five years and past ten years total return figures are 5%, 2% and 0%, respectively.
Class C shares' contingent deferred sales charges included in the past one year, past five years and past ten years total return figures are 1%, 0% and 0%, respectively.
$10,000 Over 10 Years
Let's say hypothetically that $10,000 was invested in Fidelity Advisor® Diversified International Fund - Class A on October 31, 2005, and the current 5.75% sales charge was paid.
The chart shows how the value of your investment would have changed, and also shows how the MSCI EAFE Index performed over the same period.
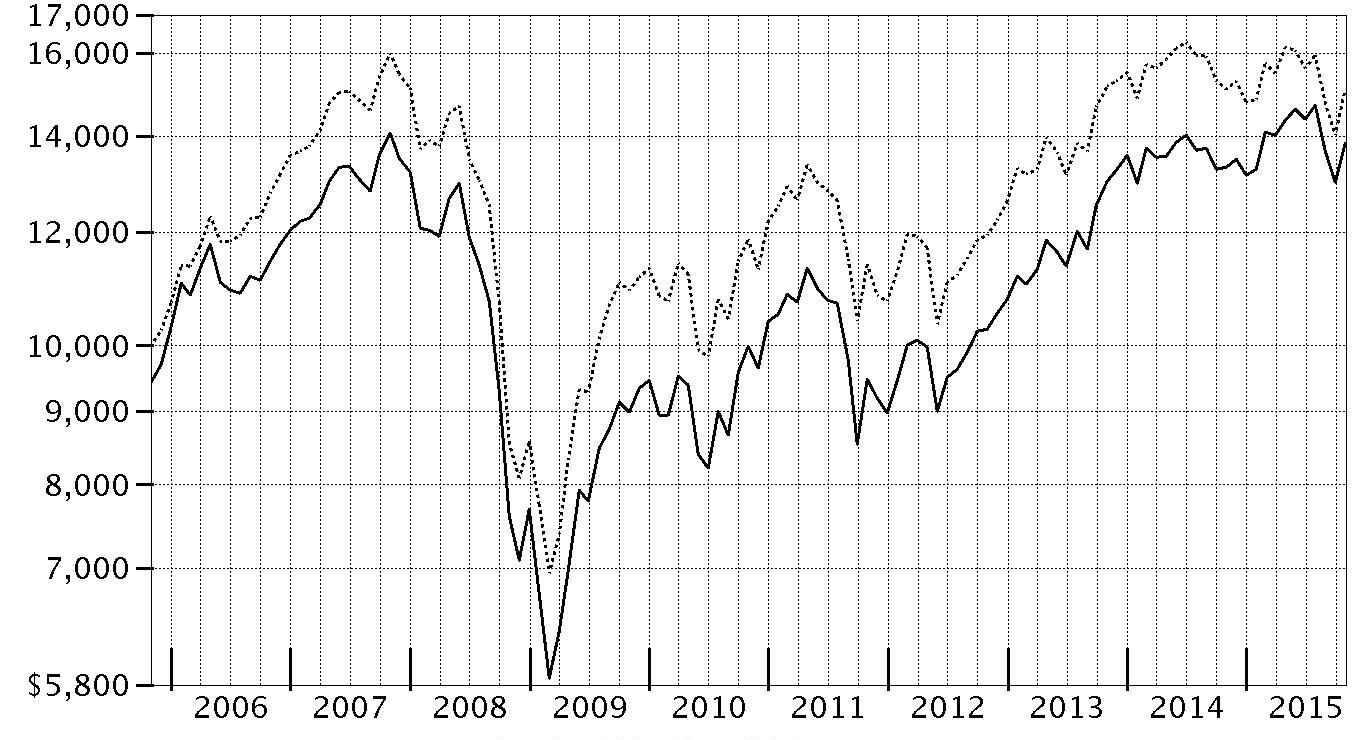
| Period Ending Values |
| $13,833 | Fidelity Advisor® Diversified International Fund - Class A |
| $15,102 | MSCI EAFE Index |
Management's Discussion of Fund Performance
Market Recap: International equities suffered a setback for the 12 months ending October 31, 2015, held back by a collapse in commodities prices that hurt resources-related sectors and geographies. The MSCI ACWI (All Country World Index) ex USA Index returned -4.55% for the period, affected also by concerns about global economic growth. Commodity producers remained under pressure for much of the past year, largely related to economic deceleration in China (-1%), the world’s second-largest economy and a leading consumer of raw materials. This effect was exacerbated by U.S. dollar strength relative to global currencies, which weighed on commodities priced in dollars and acutely impacted equity returns within regions most exposed to resources prices. The emerging-markets group, for example, returned about -15% this period. Canada, a significant energy producer, returned roughly -17%. Net energy consumer Japan (+9%) was the best-performing region by far. Only about a quarter of the nearly 50 index countries managed a gain this period: Ireland (+19%) – the EU’s fastest-growing economy – and Israel (+17%) proved top performers; Greece (-56%) and Brazil (-46%), among the worst. As for sectors, energy (-25%) and materials (-16%) declined sharply, whereas the two consumer sectors each gained about 6%.
Comments from Portfolio Manager William Bower: For the year, the fund’s share classes (excluding sales charges, if applicable) substantially outpaced the 0.08% result of the MSCI EAFE Index. Results versus the benchmark were affected by a downward fair-value pricing adjustment of -0.66 percentage points. Both stock selection and sector allocation helped the fund’s outperformance. Stock picks in the financials sector proved particularly beneficial, as did an overweighting in information technology and an underweighting in energy – avoidance of Royal Dutch Shell in particular. Positioning in the industrials and telecommunication services sectors were the fund's only overall sector negatives. From a geographical perspective, picks in Europe and the U.K. helped most, along with positioning in Asia Pacific ex Japan. An underweighting in Japan and unfavorable stock selection in the out-of-index emerging markets group detracted most. Among individual stocks, an overweighting in multinational cable and telecommunications provider Altice headed the list both of contributors and of detractors, blending to a net positive. After a strong run-up during the period, Altice changed its corporate structure and split its stock into two newly formed share classes, both of which declined in value. An overweighting in ORIX and a stake in out-of-index Alimentation Couche-Tard helped; gaming stocks Sands China and Melco Crown Entertainment detracted. The fund reduced its holdings in Sands China and eliminated Melco Crown. At period end, the fund remains positioned for a slow-growth world.
The views expressed above reflect those of the portfolio manager(s) only through the end of the period as stated on the cover of this report and do not necessarily represent the views of Fidelity or any other person in the Fidelity organization. Any such views are subject to change at any time based upon market or other conditions and Fidelity disclaims any responsibility to update such views. These views may not be relied on as investment advice and, because investment decisions for a Fidelity fund are based on numerous factors, may not be relied on as an indication of trading intent on behalf of any Fidelity fund.
Investment Summary (Unaudited)
Top Five Stocks as of October 31, 2015
| | % of fund's net assets | % of fund's net assets 6 months ago |
| Novo Nordisk A/S Series B (Denmark, Pharmaceuticals) | 1.9 | 1.9 |
| ORIX Corp. (Japan, Diversified Financial Services) | 1.8 | 1.8 |
| Anheuser-Busch InBev SA NV (Belgium, Beverages) | 1.6 | 1.8 |
| Bayer AG (Germany, Pharmaceuticals) | 1.5 | 1.5 |
| Sanofi SA (France, Pharmaceuticals) | 1.4 | 1.2 |
| | 8.2 | |
Top Five Market Sectors as of October 31, 2015
| | % of fund's net assets | % of fund's net assets 6 months ago |
| Financials | 21.4 | 21.4 |
| Health Care | 17.4 | 16.8 |
| Consumer Discretionary | 16.1 | 17.5 |
| Consumer Staples | 12.3 | 11.2 |
| Information Technology | 12.3 | 13.0 |
Top Five Countries as of October 31, 2015
| (excluding cash equivalents) | % of fund's net assets | % of fund's net assets 6 months ago |
| United Kingdom | 18.2 | 17.7 |
| Japan | 14.5 | 16.0 |
| Germany | 7.6 | 6.6 |
| United States of America | 7.3 | 7.0 |
| Switzerland | 4.7 | 4.6 |
Percentages are adjusted for the effect of open futures contracts, if applicable.
Asset Allocation (% of fund's net assets)
| As of October 31, 2015 |
| | Stocks and Equity Futures | 95.2% |
| | Other Investments | 0.1% |
| | Short-Term Investments and Net Other Assets (Liabilities) | 4.7% |

| As of April 30, 2015 |
| | Stocks and Equity Futures | 97.1% |
| | Other Investments | 0.1% |
| | Short-Term Investments and Net Other Assets (Liabilities) | 2.8% |

Investments October 31, 2015
Showing Percentage of Net Assets
| Common Stocks - 93.7% | | | |
| | | Shares | Value (000s) |
| Australia - 0.9% | | | |
| Ansell Ltd. | | 258,534 | $3,679 |
| Australia & New Zealand Banking Group Ltd. | | 628,447 | 12,154 |
| CSL Ltd. | | 23,957 | 1,592 |
|
| TOTAL AUSTRALIA | | | 17,425 |
|
| Austria - 0.3% | | | |
| Andritz AG | | 52,900 | 2,664 |
| Zumtobel AG | | 134,400 | 3,059 |
|
| TOTAL AUSTRIA | | | 5,723 |
|
| Bailiwick of Jersey - 2.2% | | | |
| Integrated Diagnostics Holdings PLC (a) | | 164,400 | 906 |
| Shire PLC | | 255,300 | 19,334 |
| Wolseley PLC | | 232,408 | 13,645 |
| WPP PLC | | 445,924 | 9,996 |
|
| TOTAL BAILIWICK OF JERSEY | | | 43,881 |
|
| Belgium - 2.5% | | | |
| Anheuser-Busch InBev SA NV | | 274,331 | 32,734 |
| Fagron NV | | 50,400 | 1,238 |
| KBC Groep NV | | 272,295 | 16,588 |
|
| TOTAL BELGIUM | | | 50,560 |
|
| Canada - 3.6% | | | |
| Agrium, Inc. | | 44,300 | 4,121 |
| Alimentation Couche-Tard, Inc. Class B (sub. vtg.) | | 421,300 | 18,123 |
| Canadian Energy Services & Technology Corp. (b) | | 223,800 | 967 |
| CGI Group, Inc. Class A (sub. vtg.) (a) | | 326,100 | 12,113 |
| Constellation Software, Inc. | | 26,400 | 11,407 |
| Entertainment One Ltd. | | 299,433 | 1,014 |
| Fairfax India Holdings Corp. (a) | | 494,000 | 5,187 |
| Imperial Oil Ltd. | | 105,900 | 3,524 |
| Keyera Corp. (b) | | 98,200 | 3,030 |
| PrairieSky Royalty Ltd. | | 38,000 | 748 |
| Suncor Energy, Inc. | | 274,400 | 8,165 |
| Tourmaline Oil Corp. (a) | | 171,500 | 3,569 |
|
| TOTAL CANADA | | | 71,968 |
|
| Cayman Islands - 1.7% | | | |
| 58.com, Inc. ADR (a) | | 43,400 | 2,278 |
| Alibaba Group Holding Ltd. sponsored ADR (a) | | 146,000 | 12,239 |
| Baidu.com, Inc. sponsored ADR (a) | | 34,600 | 6,486 |
| China Modern Dairy Holdings Ltd. (b) | | 5,945,000 | 1,788 |
| Lee's Pharmaceutical Holdings Ltd. | | 1,208,500 | 1,560 |
| PW Medtech Group Ltd. (a)(b) | | 5,174,000 | 1,082 |
| Regina Miracle International Holdings Ltd. | | 1,962,558 | 1,779 |
| Sands China Ltd. | | 976,400 | 3,516 |
| Vipshop Holdings Ltd. ADR (a) | | 154,000 | 3,160 |
|
| TOTAL CAYMAN ISLANDS | | | 33,888 |
|
| China - 0.7% | | | |
| Inner Mongoli Yili Industries Co. Ltd. | | 987,208 | 2,483 |
| Kweichow Moutai Co. Ltd. | | 175,010 | 5,909 |
| Qingdao Haier Co. Ltd. | | 3,912,122 | 5,956 |
| Weifu High-Technology Co. Ltd. (B Shares) | | 206,200 | 526 |
|
| TOTAL CHINA | | | 14,874 |
|
| Curacao - 0.4% | | | |
| Schlumberger Ltd. | | 93,200 | 7,285 |
| Denmark - 2.6% | | | |
| Genmab A/S (a) | | 114,600 | 11,304 |
| NNIT A/S | | 132,887 | 3,057 |
| Novo Nordisk A/S Series B | | 712,640 | 37,845 |
|
| TOTAL DENMARK | | | 52,206 |
|
| Finland - 0.3% | | | |
| Sampo Oyj (A Shares) | | 113,300 | 5,542 |
| France - 3.9% | | | |
| Accor SA | | 85,369 | 4,247 |
| Air Liquide SA | | 60,260 | 7,813 |
| AXA SA | | 486,600 | 12,986 |
| BNP Paribas SA | | 53,743 | 3,266 |
| Capgemini SA | | 46,900 | 4,179 |
| Danone SA | | 87,747 | 6,098 |
| Publicis Groupe SA | | 106,810 | 6,937 |
| Sanofi SA | | 290,858 | 29,341 |
| VINCI SA | | 45,600 | 3,078 |
| Zodiac Aerospace | | 56,500 | 1,429 |
|
| TOTAL FRANCE | | | 79,374 |
|
| Germany - 6.7% | | | |
| adidas AG | | 83,390 | 7,473 |
| Bayer AG | | 224,952 | 30,018 |
| Brenntag AG | | 75,600 | 4,568 |
| Continental AG | | 45,800 | 11,015 |
| Deutsche Boerse AG | | 49,200 | 4,531 |
| Deutsche Post AG | | 136,001 | 4,040 |
| Fresenius SE & Co. KGaA | | 338,000 | 24,837 |
| KION Group AG | | 108,500 | 4,893 |
| Linde AG | | 9,947 | 1,726 |
| OSRAM Licht AG | | 214,794 | 12,639 |
| ProSiebenSat.1 Media AG | | 254,000 | 13,739 |
| SAP AG | | 119,272 | 9,403 |
| Symrise AG | | 110,100 | 7,252 |
|
| TOTAL GERMANY | | | 136,134 |
|
| Hong Kong - 1.8% | | | |
| AIA Group Ltd. | | 4,847,600 | 28,423 |
| China Resources Beer Holdings Co. Ltd. | | 1,306,000 | 2,466 |
| Hang Seng Bank Ltd. | | 139,800 | 2,565 |
| Techtronic Industries Co. Ltd. | | 925,000 | 3,382 |
|
| TOTAL HONG KONG | | | 36,836 |
|
| India - 3.1% | | | |
| Apollo Hospitals Enterprise Ltd. (a) | | 155,738 | 3,122 |
| Axis Bank Ltd. (a) | | 599,285 | 4,340 |
| Bharti Infratel Ltd. | | 1,109,288 | 6,588 |
| Edelweiss Financial Services Ltd. | | 2,655,200 | 2,410 |
| Exide Industries Ltd. (a) | | 1,136,771 | 2,593 |
| HCL Technologies Ltd. | | 249,980 | 3,327 |
| HDFC Bank Ltd. (a) | | 793,748 | 15,920 |
| Housing Development Finance Corp. Ltd. | | 635,436 | 12,172 |
| ITC Ltd. | | 1,229,144 | 6,277 |
| Just Dial Ltd. | | 195,017 | 2,386 |
| LIC Housing Finance Ltd. (a) | | 274,208 | 2,002 |
| Pidilite Industries Ltd. (a) | | 241,934 | 2,075 |
|
| TOTAL INDIA | | | 63,212 |
|
| Indonesia - 0.4% | | | |
| PT Bank Central Asia Tbk | | 4,594,100 | 4,316 |
| PT Bank Rakyat Indonesia Tbk | | 6,106,100 | 4,673 |
|
| TOTAL INDONESIA | | | 8,989 |
|
| Ireland - 3.2% | | | |
| Allergan PLC (a) | | 64,300 | 19,835 |
| DCC PLC (United Kingdom) | | 71,500 | 5,737 |
| Greencore Group PLC | | 994,821 | 4,632 |
| Horizon Pharma PLC (a) | | 184,300 | 2,897 |
| Kerry Group PLC Class A | | 97,100 | 7,896 |
| Medtronic PLC | | 121,000 | 8,944 |
| Ryanair Holdings PLC sponsored ADR | | 184,860 | 14,454 |
|
| TOTAL IRELAND | | | 64,395 |
|
| Isle of Man - 0.6% | | | |
| Optimal Payments PLC (a) | | 1,284,533 | 6,020 |
| Playtech Ltd. | | 406,983 | 5,371 |
|
| TOTAL ISLE OF MAN | | | 11,391 |
|
| Israel - 1.7% | | | |
| Cellcom Israel Ltd. (Israel) (a) | | 486,900 | 3,624 |
| Check Point Software Technologies Ltd. (a) | | 120,100 | 10,201 |
| Partner Communications Co. Ltd. (a) | | 162,104 | 736 |
| Teva Pharmaceutical Industries Ltd. sponsored ADR | | 351,100 | 20,782 |
|
| TOTAL ISRAEL | | | 35,343 |
|
| Italy - 1.0% | | | |
| Intesa Sanpaolo SpA | | 3,501,400 | 12,198 |
| Mediaset SpA | | 851,100 | 4,324 |
| World Duty Free SpA (a) | | 419,842 | 4,737 |
|
| TOTAL ITALY | | | 21,259 |
|
| Japan - 14.5% | | | |
| Ain Holdings, Inc. | | 77,700 | 3,678 |
| Astellas Pharma, Inc. | | 1,379,600 | 20,024 |
| Daiichikosho Co. Ltd. | | 74,400 | 2,481 |
| Dentsu, Inc. | | 162,100 | 9,113 |
| Don Quijote Holdings Co. Ltd. | | 177,700 | 6,528 |
| Fast Retailing Co. Ltd. | | 20,700 | 7,561 |
| Glory Ltd. | | 98,100 | 2,482 |
| Hoya Corp. | | 677,700 | 27,966 |
| Japan Exchange Group, Inc. | | 665,400 | 10,707 |
| Japan Tobacco, Inc. | | 474,700 | 16,430 |
| KDDI Corp. | | 622,700 | 15,068 |
| Keyence Corp. | | 38,800 | 20,200 |
| Minebea Ltd. | | 120,000 | 1,322 |
| Misumi Group, Inc. | | 104,400 | 1,360 |
| Mitsubishi UFJ Financial Group, Inc. | | 4,002,100 | 25,884 |
| NGK Spark Plug Co. Ltd. | | 139,300 | 3,400 |
| Nitori Holdings Co. Ltd. | | 75,400 | 5,880 |
| Olympus Corp. | | 132,300 | 4,463 |
| OMRON Corp. | | 31,400 | 1,040 |
| ORIX Corp. | | 2,497,200 | 36,469 |
| Rakuten, Inc. | | 1,226,300 | 16,988 |
| Seven & i Holdings Co. Ltd. | | 129,500 | 5,883 |
| SHIMANO, Inc. | | 54,800 | 8,635 |
| Shinsei Bank Ltd. | | 2,310,000 | 4,844 |
| SoftBank Corp. | | 226,100 | 12,668 |
| Sundrug Co. Ltd. | | 100 | 5 |
| Suzuki Motor Corp. | | 167,000 | 5,468 |
| TDK Corp. | | 52,000 | 3,312 |
| Tsuruha Holdings, Inc. | | 127,100 | 10,069 |
| VT Holdings Co. Ltd. | | 437,600 | 2,706 |
| Welcia Holdings Co. Ltd. | | 18,200 | 897 |
|
| TOTAL JAPAN | | | 293,531 |
|
| Korea (South) - 0.2% | | | |
| Orion Corp. | | 5,836 | 4,907 |
| Luxembourg - 0.7% | | | |
| Eurofins Scientific SA | | 36,500 | 13,215 |
| Netherlands - 3.7% | | | |
| AEGON NV | | 666,600 | 4,091 |
| AerCap Holdings NV (a) | | 94,200 | 3,909 |
| Altice NV: | | | |
| Class A (a) | | 566,110 | 9,805 |
| Class B (a) | | 231,909 | 4,119 |
| Gree Electric Appliances, Inc. ELS (BNP Paribas Arbitrage Warrant Program) warrants 12/10/15 (c) | | 144,800 | 395 |
| IMCD Group BV | | 135,500 | 5,069 |
| ING Groep NV (Certificaten Van Aandelen) | | 883,700 | 12,861 |
| NXP Semiconductors NV (a) | | 21,500 | 1,685 |
| RELX NV | | 655,099 | 11,202 |
| Unilever NV (Certificaten Van Aandelen) (Bearer) | | 490,300 | 22,170 |
|
| TOTAL NETHERLANDS | | | 75,306 |
|
| Philippines - 0.2% | | | |
| Alliance Global Group, Inc. | | 12,852,154 | 4,993 |
| Singapore - 0.4% | | | |
| Avago Technologies Ltd. | | 16,700 | 2,056 |
| United Overseas Bank Ltd. | | 426,100 | 6,187 |
|
| TOTAL SINGAPORE | | | 8,243 |
|
| South Africa - 1.2% | | | |
| EOH Holdings Ltd. | | 427,200 | 4,723 |
| Naspers Ltd. Class N | | 132,300 | 19,378 |
|
| TOTAL SOUTH AFRICA | | | 24,101 |
|
| Spain - 1.9% | | | |
| Amadeus IT Holding SA Class A | | 257,400 | 10,971 |
| Hispania Activos Inmobiliarios SA (a) | | 207,200 | 3,122 |
| Inditex SA | | 649,055 | 24,342 |
|
| TOTAL SPAIN | | | 38,435 |
|
| Sweden - 2.4% | | | |
| ASSA ABLOY AB (B Shares) | | 301,800 | 6,004 |
| Coor Service Management Holding AB (a) | | 445,200 | 1,819 |
| HEXPOL AB (B Shares) | | 151,200 | 1,472 |
| Nordea Bank AB | | 1,101,000 | 12,178 |
| Sandvik AB | | 271,200 | 2,536 |
| Svenska Cellulosa AB (SCA) (B Shares) | | 585,900 | 17,257 |
| Svenska Handelsbanken AB (A Shares) | | 560,400 | 7,611 |
|
| TOTAL SWEDEN | | | 48,877 |
|
| Switzerland - 4.7% | | | |
| Actelion Ltd. | | 58,435 | 8,123 |
| Compagnie Financiere Richemont SA Series A | | 91,376 | 7,835 |
| Credit Suisse Group AG (d) | | 288,213 | 6,633 |
| GAM Holding Ltd. | | 84,407 | 1,546 |
| Roche Holding AG (participation certificate) | | 80,592 | 21,881 |
| Sika AG (Bearer) | | 2,320 | 7,614 |
| Syngenta AG (Switzerland) | | 66,171 | 22,231 |
| UBS Group AG | | 922,263 | 18,456 |
|
| TOTAL SWITZERLAND | | | 94,319 |
|
| Taiwan - 1.0% | | | |
| Taiwan Semiconductor Manufacturing Co. Ltd. sponsored ADR | | 926,800 | 20,353 |
| Thailand - 0.2% | | | |
| Kasikornbank PCL (For. Reg.) | | 837,400 | 4,051 |
| United Kingdom - 18.2% | | | |
| AA PLC | | 502,320 | 2,144 |
| Al Noor Hospitals Group PLC | | 275,700 | 4,998 |
| Associated British Foods PLC | | 175,100 | 9,326 |
| B&M European Value Retail S.A. | | 1,969,499 | 10,123 |
| Barclays PLC | | 2,393,576 | 8,528 |
| BG Group PLC | | 1,008,869 | 15,939 |
| British American Tobacco PLC sponsored ADR | | 103,200 | 12,188 |
| British Land Co. PLC | | 165,514 | 2,221 |
| BT Group PLC | | 2,052,100 | 14,655 |
| Bunzl PLC | | 146,400 | 4,196 |
| Capita Group PLC | | 266,100 | 5,230 |
| Compass Group PLC | | 542,400 | 9,324 |
| Diploma PLC | | 401,600 | 3,972 |
| Essentra PLC | | 1,159,700 | 15,053 |
| Exova Group Ltd. PLC | | 516,300 | 1,184 |
| Hikma Pharmaceuticals PLC | | 219,418 | 7,320 |
| Howden Joinery Group PLC | | 87,500 | 625 |
| HSBC Holdings PLC sponsored ADR | | 69,097 | 2,700 |
| IMI PLC | | 189,700 | 2,787 |
| Imperial Tobacco Group PLC | | 211,895 | 11,430 |
| Indivior PLC | | 864,100 | 2,739 |
| ITV PLC | | 3,635,100 | 14,144 |
| Johnson Matthey PLC | | 117,300 | 4,674 |
| JUST EAT Ltd. (a) | | 170,300 | 1,118 |
| Liberty Global PLC: | | | |
| Class A (a) | | 143,600 | 6,393 |
| Class C (a) | | 61,400 | 2,618 |
| LiLAC Class A (a) | | 5,925 | 229 |
| LiLAC Class C (a) | | 2,435 | 94 |
| Lloyds Banking Group PLC | | 24,688,900 | 28,022 |
| London Stock Exchange Group PLC | | 193,900 | 7,607 |
| Meggitt PLC | | 460,741 | 2,512 |
| Melrose PLC | | 604,900 | 2,482 |
| Micro Focus International PLC | | 538,200 | 10,421 |
| Next PLC | | 165,600 | 20,423 |
| Poundland Group PLC | | 1,221,232 | 5,177 |
| Prudential PLC | | 1,065,313 | 24,882 |
| Reckitt Benckiser Group PLC | | 191,113 | 18,651 |
| Rolls-Royce Group PLC | | 619,700 | 6,553 |
| Royal Bank of Scotland Group PLC (a) | | 699,900 | 3,420 |
| SABMiller PLC | | 188,000 | 11,578 |
| Schroders PLC | | 132,100 | 6,075 |
| Sophos Group PLC (a) | | 772,766 | 3,063 |
| Spectris PLC | | 150,900 | 3,878 |
| Sports Direct International PLC (a) | | 459,400 | 4,936 |
| St. James's Place Capital PLC | | 1,081,000 | 16,073 |
| The Restaurant Group PLC | | 138,100 | 1,526 |
| Virgin Money Holdings Uk PLC | | 989,500 | 5,916 |
| Whitbread PLC | | 122,013 | 9,341 |
|
| TOTAL UNITED KINGDOM | | | 368,488 |
|
| United States of America - 6.8% | | | |
| Alliance Data Systems Corp. (a) | | 20,900 | 6,214 |
| Alphabet, Inc.: | | | |
| Class A (a) | | 10,495 | 7,739 |
| Class C | | 19,849 | 14,109 |
| Amgen, Inc. | | 43,800 | 6,928 |
| Baxalta, Inc. | | 159,300 | 5,489 |
| Celgene Corp. (a) | | 45,300 | 5,559 |
| Celldex Therapeutics, Inc. (a) | | 24,600 | 297 |
| Cognizant Technology Solutions Corp. Class A (a) | | 44,400 | 3,024 |
| Fidelity National Information Services, Inc. | | 102,700 | 7,489 |
| HP, Inc. | | 180,500 | 4,866 |
| Las Vegas Sands Corp. | | 175,100 | 8,669 |
| MasterCard, Inc. Class A | | 127,700 | 12,641 |
| McGraw Hill Financial, Inc. | | 174,300 | 16,147 |
| Noble Energy, Inc. | | 86,100 | 3,086 |
| Oceaneering International, Inc. | | 95,000 | 3,992 |
| QUALCOMM, Inc. | | 115,500 | 6,863 |
| The Blackstone Group LP | | 168,100 | 5,557 |
| Visa, Inc. Class A | | 174,800 | 13,561 |
| Western Digital Corp. | | 80,200 | 5,359 |
|
| TOTAL UNITED STATES OF AMERICA | | | 137,589 |
|
| TOTAL COMMON STOCKS | | | |
| (Cost $1,543,758) | | | 1,896,693 |
|
| Preferred Stocks - 1.0% | | | |
| Convertible Preferred Stocks - 0.0% | | | |
| United States of America - 0.0% | | | |
| NJOY, Inc.: | | | |
| Series C (a)(d) | | 60,264 | 30 |
| Series D (a)(d) | | 18,951 | 9 |
| | | | 39 |
| Nonconvertible Preferred Stocks - 1.0% | | | |
| Brazil - 0.1% | | | |
| Itau Unibanco Holding SA | | 305,800 | 2,099 |
| Germany - 0.9% | | | |
| Henkel AG & Co. KGaA | | 159,300 | 17,290 |
| United Kingdom - 0.0% | | | |
| Rolls-Royce Group PLC | | 57,446,190 | 89 |
|
| TOTAL NONCONVERTIBLE PREFERRED STOCKS | | | 19,478 |
|
| TOTAL PREFERRED STOCKS | | | |
| (Cost $17,951) | | | 19,517 |
| | | Principal Amount (000s)(e) | Value (000s) |
|
| Government Obligations - 0.0% | | | |
| United States of America - 0.0% | | | |
U.S. Treasury Bills, yield at date of purchase 0.03% to 0.06% 12/3/15 to 12/17/15
(Cost $90)(f) | | 90 | 90 |
|
| Preferred Securities - 0.1% | | | |
| Ireland - 0.1% | | | |
Baggot Securities Ltd. 10.24%
(Cost $2,488)(c)(g) | EUR | 1,620 | 1,926 |
| | | Shares | Value (000s) |
|
| Money Market Funds - 5.7% | | | |
| Fidelity Cash Central Fund, 0.18% (h) | | 112,099,238 | 112,099 |
| Fidelity Securities Lending Cash Central Fund, 0.19% (h)(i) | | 4,169,950 | 4,170 |
| TOTAL MONEY MARKET FUNDS | | | |
| (Cost $116,269) | | | 116,269 |
| TOTAL INVESTMENT PORTFOLIO - 100.5% | | | |
| (Cost $1,680,556) | | | 2,034,495 |
| NET OTHER ASSETS (LIABILITIES) - (0.5)% | | | (9,127) |
| NET ASSETS - 100% | | | $2,025,368 |
| Futures Contracts | | | |
| | Expiration Date | Underlying Face Amount at Value (000s) | Unrealized Appreciation/(Depreciation) (000s) |
| Purchased | | | |
| Equity Index Contracts | | | |
| 97 CME Nikkei 225 Index Contracts (United States) | Dec. 2015 | 9,174 | $439 |
The face value of futures purchased as a percentage of Net Assets is 0.5%
Currency Abbreviations
EUR – European Monetary Unit
Categorizations in the Schedule of Investments are based on country or territory of incorporation.
Legend
(a) Non-income producing
(b) Security or a portion of the security is on loan at period end.
(c) Security exempt from registration under Rule 144A of the Securities Act of 1933. These securities may be resold in transactions exempt from registration, normally to qualified institutional buyers. At the end of the period, the value of these securities amounted to $2,321,000 or 0.1% of net assets.
(d) Restricted securities - Investment in securities not registered under the Securities Act of 1933 (excluding 144A issues). At the end of the period, the value of restricted securities (excluding 144A issues) amounted to $6,673,000 or 0.3% of net assets.
(e) Amount is stated in United States dollars unless otherwise noted.
(f) Security or a portion of the security was pledged to cover margin requirements for futures contracts. At period end, the value of securities pledged amounted to $90,000.
(g) Security is perpetual in nature with no stated maturity date.
(h) Affiliated fund that is generally available only to investment companies and other accounts managed by Fidelity Investments. The rate quoted is the annualized seven-day yield of the fund at period end. A complete unaudited listing of the fund's holdings as of its most recent quarter end is available upon request. In addition, each Fidelity Central Fund's financial statements, which are not covered by the Fund's Report of Independent Registered Public Accounting Firm, are available on the SEC's website or upon request.
(i) Investment made with cash collateral received from securities on loan.
Additional information on each restricted holding is as follows:
| Security | Acquisition Date | Acquisition Cost (000s) |
| Credit Suisse Group AG | 10/21/15 | $6,834 |
| NJOY, Inc. Series C | 6/7/13 | $487 |
| NJOY, Inc. Series D | 2/14/14 | $321 |
Affiliated Central Funds
Information regarding fiscal year to date income earned by the Fund from investments in Fidelity Central Funds is as follows:
| Fund | Income earned |
| | (Amounts in thousands) |
| Fidelity Cash Central Fund | $94 |
| Fidelity Securities Lending Cash Central Fund | 559 |
| Total | $653 |
Investment Valuation
The following is a summary of the inputs used, as of October 31, 2015, involving the Fund's assets and liabilities carried at fair value. The inputs or methodology used for valuing securities may not be an indication of the risk associated with investing in those securities. For more information on valuation inputs, and their aggregation into the levels used below, please refer to the Investment Valuation section in the accompanying Notes to Financial Statements.
| | Valuation Inputs at Reporting Date: |
| Description | Total | Level 1 | Level 2 | Level 3 |
| (Amounts in thousands) | | | | |
| Investments in Securities: | | | | |
| Equities: | | | | |
| Consumer Discretionary | $323,496 | $202,317 | $115,184 | $5,995 |
| Consumer Staples | 250,165 | 119,540 | 130,625 | -- |
| Energy | 50,305 | 34,366 | 15,939 | -- |
| Financials | 433,555 | 159,870 | 273,685 | -- |
| Health Care | 350,375 | 153,649 | 196,726 | -- |
| Industrials | 130,849 | 90,450 | 40,399 | -- |
| Information Technology | 250,095 | 210,427 | 39,668 | -- |
| Materials | 74,031 | 49,725 | 24,306 | -- |
| Telecommunication Services | 53,339 | 4,360 | 48,979 | -- |
| Government Obligations | 90 | -- | 90 | -- |
| Preferred Securities | 1,926 | -- | 1,926 | -- |
| Money Market Funds | 116,269 | 116,269 | -- | -- |
| Total Investments in Securities: | $2,034,495 | $1,140,973 | $887,527 | $5,995 |
| Derivative Instruments: | | | | |
| Assets | | | | |
| Futures Contracts | $439 | $439 | $-- | $-- |
| Total Assets | $439 | $439 | $-- | $-- |
| Total Derivative Instruments: | $439 | $439 | $-- | $-- |
The following is a summary of transfers between Level 1 and Level 2 for the period ended October 31, 2015. Transfers are assumed to have occurred at the beginning of the period, and are primarily attributable to the valuation techniques used for foreign equity securities, as discussed in the accompanying Notes to Financial Statements:
| Transfers | Total (000s) |
| Level 1 to Level 2 | $107,949 |
| Level 2 to Level 1 | $28,909 |
Value of Derivative Instruments
The following table is a summary of the Fund's value of derivative instruments by primary risk exposure as of October 31, 2015. For additional information on derivative instruments, please refer to the Derivative Instruments section in the accompanying Notes to Financial Statements.
| Primary Risk Exposure / Derivative Type | Value |
| (Amounts in thousands) | Asset | Liability |
| Equity Risk | | |
| Futures Contracts(a) | $439 | $0 |
| Total Equity Risk | 439 | 0 |
| Total Value of Derivatives | $439 | $0 |
(a) Reflects gross cumulative appreciation (depreciation) on futures contracts as presented in the Schedule of Investments. Only the period end receivable or payable for daily variation margin and net unrealized appreciation (depreciation) are presented in the Statement of Assets and Liabilities.
See accompanying notes which are an integral part of the financial statements.
Financial Statements
Statement of Assets and Liabilities
| Amounts in thousands (except per-share amounts) | | October 31, 2015 |
| Assets | | |
Investment in securities, at value (including securities loaned of $3,928) — See accompanying schedule:
Unaffiliated issuers (cost $1,564,287) | $1,918,226 | |
| Fidelity Central Funds (cost $116,269) | 116,269 | |
| Total Investments (cost $1,680,556) | | $2,034,495 |
| Segregated cash with brokers for derivative instruments | | 448 |
| Foreign currency held at value (cost $254) | | 254 |
| Receivable for investments sold | | 8,321 |
| Receivable for fund shares sold | | 2,913 |
| Dividends receivable | | 4,976 |
| Distributions receivable from Fidelity Central Funds | | 19 |
| Prepaid expenses | | 5 |
| Other receivables | | 724 |
| Total assets | | 2,052,155 |
| Liabilities | | |
| Payable for investments purchased | $11,241 | |
| Payable for fund shares redeemed | 8,661 | |
| Accrued management fee | 1,117 | |
| Distribution and service plan fees payable | 463 | |
| Payable for daily variation margin for derivative instruments | 51 | |
| Other affiliated payables | 418 | |
| Other payables and accrued expenses | 666 | |
| Collateral on securities loaned, at value | 4,170 | |
| Total liabilities | | 26,787 |
| Net Assets | | $2,025,368 |
| Net Assets consist of: | | |
| Paid in capital | | $4,281,587 |
| Undistributed net investment income | | 12,633 |
| Accumulated undistributed net realized gain (loss) on investments and foreign currency transactions | | (2,623,269) |
| Net unrealized appreciation (depreciation) on investments and assets and liabilities in foreign currencies | | 354,417 |
| Net Assets | | $2,025,368 |
| Calculation of Maximum Offering Price | | |
| Class A: | | |
| Net Asset Value and redemption price per share ($661,578 ÷ 32,911.1 shares) | | $20.10 |
| Maximum offering price per share (100/94.25 of $20.10) | | $21.33 |
| Class T: | | |
| Net Asset Value and redemption price per share ($271,487 ÷ 13,626.9 shares) | | $19.92 |
| Maximum offering price per share (100/96.50 of $19.92) | | $20.64 |
| Class B: | | |
| Net Asset Value and offering price per share ($11,093 ÷ 574.5 shares)(a) | | $19.31 |
| Class C: | | |
| Net Asset Value and offering price per share ($251,098 ÷ 13,086.2 shares)(a) | | $19.19 |
| Class I: | | |
| Net Asset Value, offering price and redemption price per share ($747,187 ÷ 36,519.7 shares) | | $20.46 |
| Class Z: | | |
| Net Asset Value, offering price and redemption price per share ($82,925 ÷ 4,052.2 shares) | | $20.46 |
(a) Redemption price per share is equal to net asset value less any applicable contingent deferred sales charge.
See accompanying notes which are an integral part of the financial statements.
Statement of Operations
| Amounts in thousands | | Year ended October 31, 2015 |
| Investment Income | | |
| Dividends | | $41,105 |
| Interest | | 27 |
| Income from Fidelity Central Funds | | 653 |
| Income before foreign taxes withheld | | 41,785 |
| Less foreign taxes withheld | | (3,009) |
| Total income | | 38,776 |
| Expenses | | |
| Management fee | $13,277 | |
| Transfer agent fees | 4,255 | |
| Distribution and service plan fees | 5,693 | |
| Accounting and security lending fees | 876 | |
| Custodian fees and expenses | 248 | |
| Independent trustees' compensation | 8 | |
| Registration fees | 135 | |
| Audit | 84 | |
| Legal | 6 | |
| Miscellaneous | 21 | |
| Total expenses before reductions | 24,603 | |
| Expense reductions | (147) | 24,456 |
| Net investment income (loss) | | 14,320 |
| Realized and Unrealized Gain (Loss) | | |
| Net realized gain (loss) on: | | |
| Investment securities: | | |
| Unaffiliated issuers | 39,912 | |
| Foreign currency transactions | (294) | |
| Futures contracts | (578) | |
| Total net realized gain (loss) | | 39,040 |
Change in net unrealized appreciation (depreciation) on:
Investment securities (net of decrease in deferred foreign taxes of $41) | 17,485 | |
| Assets and liabilities in foreign currencies | 194 | |
| Futures contracts | 439 | |
| Total change in net unrealized appreciation (depreciation) | | 18,118 |
| Net gain (loss) | | 57,158 |
| Net increase (decrease) in net assets resulting from operations | | $71,478 |
See accompanying notes which are an integral part of the financial statements.
Statement of Changes in Net Assets
| Amounts in thousands | Year ended October 31, 2015 | Year ended October 31, 2014 |
| Increase (Decrease) in Net Assets | | |
| Operations | | |
| Net investment income (loss) | $14,320 | $25,980 |
| Net realized gain (loss) | 39,040 | 174,288 |
| Change in net unrealized appreciation (depreciation) | 18,118 | (153,908) |
| Net increase (decrease) in net assets resulting from operations | 71,478 | 46,360 |
| Distributions to shareholders from net investment income | (18,738) | (17,375) |
| Distributions to shareholders from net realized gain | (2,141) | (17,564) |
| Total distributions | (20,879) | (34,939) |
| Share transactions - net increase (decrease) | 63,265 | (109,770) |
| Redemption fees | 27 | 19 |
| Total increase (decrease) in net assets | 113,891 | (98,330) |
| Net Assets | | |
| Beginning of period | 1,911,477 | 2,009,807 |
| End of period (including undistributed net investment income of $12,633 and undistributed net investment income of $18,417, respectively) | $2,025,368 | $1,911,477 |
See accompanying notes which are an integral part of the financial statements.
Financial Highlights — Fidelity Advisor Diversified International Fund Class A
| | | October 31, | | | |
| Years ended October 31, | 2015 | 2014 | 2013 | 2012 | 2011 |
| Selected Per–Share Data | | | | | |
| Net asset value, beginning of period | $19.56 | $19.47 | $15.63 | $14.61 | $15.63 |
| Income from Investment Operations | | | | | |
| Net investment income (loss)A | .15 | .27B | .19 | .18 | .22C |
| Net realized and unrealized gain (loss) | .61 | .17 | 3.92 | 1.03 | (1.01) |
| Total from investment operations | .76 | .44 | 4.11 | 1.21 | (.79) |
| Distributions from net investment income | (.20) | (.18) | (.21) | (.19) | (.20) |
| Distributions from net realized gain | (.02) | (.17) | (.06) | – | (.03) |
| Total distributions | (.22) | (.35) | (.27) | (.19) | (.23) |
| Redemption fees added to paid in capitalA,D | – | – | – | – | – |
| Net asset value, end of period | $20.10 | $19.56 | $19.47 | $15.63 | $14.61 |
| Total ReturnE,F | 3.93% | 2.28% | 26.69% | 8.47% | (5.15)% |
| Ratios to Average Net AssetsG,H | | | | | |
| Expenses before reductions | 1.22% | 1.26% | 1.31% | 1.32% | 1.31% |
| Expenses net of fee waivers, if any | 1.22% | 1.26% | 1.30% | 1.32% | 1.31% |
| Expenses net of all reductions | 1.21% | 1.26% | 1.28% | 1.31% | 1.29% |
| Net investment income (loss) | .75% | 1.34%B | 1.08% | 1.20% | 1.38%C |
| Supplemental Data | | | | | |
| Net assets, end of period (in millions) | $662 | $693 | $756 | $762 | $916 |
| Portfolio turnover rateI | 34% | 40% | 50% | 34% | 48% |
A Calculated based on average shares outstanding during the period.
B Investment income per share reflects a large, non-recurring dividend which amounted to $.10 per share. Excluding this non-recurring dividend, the ratio of net investment income (loss) to average net assets would have been .85%.
C Investment income per share reflects a large, non-recurring dividend which amounted to $.06 per share. Excluding this non-recurring dividend, the ratio of net investment income (loss) to average net assets would have been .98%.
D Amount represents less than $.005 per share.
E Total returns would have been lower if certain expenses had not been reduced during the applicable periods shown.
F Total returns do not include the effect of the sales charges.
G Fees and expenses of any underlying Fidelity Central Funds are not included in the Fund's expense ratio. The Fund indirectly bears its proportionate share of the expenses of any underlying Fidelity Central Funds.
H Expense ratios reflect operating expenses of the class. Expenses before reductions do not reflect amounts reimbursed by the investment adviser or reductions from brokerage service arrangements or reductions from other expense offset arrangements and do not represent the amount paid by the class during periods when reimbursements or reductions occur. Expenses net of fee waivers reflect expenses after reimbursement by the investment adviser but prior to reductions from brokerage service arrangements or other expense offset arrangements. Expenses net of all reductions represent the net expenses paid by the class.
I Amount does not include the portfolio activity of any underlying Fidelity Central Funds.
See accompanying notes which are an integral part of the financial statements.
Financial Highlights — Fidelity Advisor Diversified International Fund Class T
| | | October 31, | | | |
| Years ended October 31, | 2015 | 2014 | 2013 | 2012 | 2011 |
| Selected Per–Share Data | | | | | |
| Net asset value, beginning of period | $19.38 | $19.30 | $15.49 | $14.46 | $15.47 |
| Income from Investment Operations | | | | | |
| Net investment income (loss)A | .10 | .21B | .14 | .14 | .18C |
| Net realized and unrealized gain (loss) | .61 | .18 | 3.89 | 1.03 | (.99) |
| Total from investment operations | .71 | .39 | 4.03 | 1.17 | (.81) |
| Distributions from net investment income | (.15) | (.14) | (.16) | (.14) | (.16) |
| Distributions from net realized gain | (.02) | (.17) | (.06) | – | (.03) |
| Total distributions | (.17) | (.31) | (.22) | (.14) | (.20)D |
| Redemption fees added to paid in capitalA,E | – | – | – | – | – |
| Net asset value, end of period | $19.92 | $19.38 | $19.30 | $15.49 | $14.46 |
| Total ReturnF,G | 3.67% | 2.04% | 26.37% | 8.17% | (5.35)% |
| Ratios to Average Net AssetsH,I | | | | | |
| Expenses before reductions | 1.48% | 1.51% | 1.55% | 1.58% | 1.55% |
| Expenses net of fee waivers, if any | 1.48% | 1.51% | 1.55% | 1.58% | 1.55% |
| Expenses net of all reductions | 1.47% | 1.51% | 1.53% | 1.57% | 1.53% |
| Net investment income (loss) | .49% | 1.09%B | .83% | .94% | 1.14%C |
| Supplemental Data | | | | | |
| Net assets, end of period (in millions) | $271 | $284 | $319 | $304 | $404 |
| Portfolio turnover rateJ | 34% | 40% | 50% | 34% | 48% |
A Calculated based on average shares outstanding during the period.
B Investment income per share reflects a large, non-recurring dividend which amounted to $.10 per share. Excluding this non-recurring dividend, the ratio of net investment income (loss) to average net assets would have been .60%.
C Investment income per share reflects a large, non-recurring dividend which amounted to $.06 per share. Excluding this non-recurring dividend, the ratio of net investment income (loss) to average net assets would have been .74%.
D Total distributions of $.20 per share is comprised of distributions from net investment income of $.164 and distributions from net realized gain of $.034 per share.
E Amount represents less than $.005 per share.
F Total returns would have been lower if certain expenses had not been reduced during the applicable periods shown.
G Total returns do not include the effect of the sales charges.
H Fees and expenses of any underlying Fidelity Central Funds are not included in the Fund's expense ratio. The Fund indirectly bears its proportionate share of the expenses of any underlying Fidelity Central Funds.
I Expense ratios reflect operating expenses of the class. Expenses before reductions do not reflect amounts reimbursed by the investment adviser or reductions from brokerage service arrangements or reductions from other expense offset arrangements and do not represent the amount paid by the class during periods when reimbursements or reductions occur. Expenses net of fee waivers reflect expenses after reimbursement by the investment adviser but prior to reductions from brokerage service arrangements or other expense offset arrangements. Expenses net of all reductions represent the net expenses paid by the class.
J Amount does not include the portfolio activity of any underlying Fidelity Central Funds.
See accompanying notes which are an integral part of the financial statements.
Financial Highlights — Fidelity Advisor Diversified International Fund Class B
| | | October 31, | | | |
| Years ended October 31, | 2015 | 2014 | 2013 | 2012 | 2011 |
| Selected Per–Share Data | | | | | |
| Net asset value, beginning of period | $18.75 | $18.65 | $14.95 | $13.91 | $14.91 |
| Income from Investment Operations | | | | | |
| Net investment income (loss)A | (.01) | .10B | .05 | .06 | .09C |
| Net realized and unrealized gain (loss) | .59 | .17 | 3.77 | 1.00 | (.96) |
| Total from investment operations | .58 | .27 | 3.82 | 1.06 | (.87) |
| Distributions from net investment income | – | – | (.06) | (.02) | (.10) |
| Distributions from net realized gain | (.02) | (.17) | (.06) | – | (.03) |
| Total distributions | (.02) | (.17) | (.12) | (.02) | (.13) |
| Redemption fees added to paid in capitalA,D | – | – | – | – | – |
| Net asset value, end of period | $19.31 | $18.75 | $18.65 | $14.95 | $13.91 |
| Total ReturnE,F | 3.11% | 1.45% | 25.72% | 7.64% | (5.89)% |
| Ratios to Average Net AssetsG,H | | | | | |
| Expenses before reductions | 2.05% | 2.07% | 2.08% | 2.08% | 2.08% |
| Expenses net of fee waivers, if any | 2.05% | 2.07% | 2.08% | 2.08% | 2.08% |
| Expenses net of all reductions | 2.04% | 2.07% | 2.06% | 2.07% | 2.06% |
| Net investment income (loss) | (.08)% | .53%B | .30% | .44% | .61%C |
| Supplemental Data | | | | | |
| Net assets, end of period (in millions) | $11 | $19 | $36 | $59 | $94 |
| Portfolio turnover rateI | 34% | 40% | 50% | 34% | 48% |
A Calculated based on average shares outstanding during the period.
B Investment income per share reflects a large, non-recurring dividend which amounted to $.09 per share. Excluding this non-recurring dividend, the ratio of net investment income (loss) to average net assets would have been .04%.
C Investment income per share reflects a large, non-recurring dividend which amounted to $.06 per share. Excluding this non-recurring dividend, the ratio of net investment income (loss) to average net assets would have been .21%.
D Amount represents less than $.005 per share.
E Total returns would have been lower if certain expenses had not been reduced during the applicable periods shown.
F Total returns do not include the effect of the contingent deferred sales charge.
G Fees and expenses of any underlying Fidelity Central Funds are not included in the Fund's expense ratio. The Fund indirectly bears its proportionate share of the expenses of any underlying Fidelity Central Funds.
H Expense ratios reflect operating expenses of the class. Expenses before reductions do not reflect amounts reimbursed by the investment adviser or reductions from brokerage service arrangements or reductions from other expense offset arrangements and do not represent the amount paid by the class during periods when reimbursements or reductions occur. Expenses net of fee waivers reflect expenses after reimbursement by the investment adviser but prior to reductions from brokerage service arrangements or other expense offset arrangements. Expenses net of all reductions represent the net expenses paid by the class.
I Amount does not include the portfolio activity of any underlying Fidelity Central Funds.
See accompanying notes which are an integral part of the financial statements.
Financial Highlights — Fidelity Advisor Diversified International Fund Class C
| | | October 31, | | | |
| Years ended October 31, | 2015 | 2014 | 2013 | 2012 | 2011 |
| Selected Per–Share Data | | | | | |
| Net asset value, beginning of period | $18.68 | $18.63 | $14.97 | $13.95 | $14.95 |
| Income from Investment Operations | | | | | |
| Net investment income (loss)A | –B | .11C | .06 | .06 | .10D |
| Net realized and unrealized gain (loss) | .59 | .18 | 3.75 | 1.01 | (.96) |
| Total from investment operations | .59 | .29 | 3.81 | 1.07 | (.86) |
| Distributions from net investment income | (.06) | (.07) | (.09) | (.05) | (.11) |
| Distributions from net realized gain | (.02) | (.17) | (.06) | – | (.03) |
| Total distributions | (.08) | (.24) | (.15) | (.05) | (.14) |
| Redemption fees added to paid in capitalA,B | – | – | – | – | – |
| Net asset value, end of period | $19.19 | $18.68 | $18.63 | $14.97 | $13.95 |
| Total ReturnE,F | 3.15% | 1.58% | 25.71% | 7.71% | (5.83)% |
| Ratios to Average Net AssetsG,H | | | | | |
| Expenses before reductions | 1.97% | 2.00% | 2.04% | 2.06% | 2.05% |
| Expenses net of fee waivers, if any | 1.97% | 2.00% | 2.04% | 2.06% | 2.05% |
| Expenses net of all reductions | 1.96% | 2.00% | 2.01% | 2.05% | 2.03% |
| Net investment income (loss) | - %I | .60%C | .35% | .46% | .64%D |
| Supplemental Data | | | | | |
| Net assets, end of period (in millions) | $251 | $243 | $264 | $246 | $302 |
| Portfolio turnover rateJ | 34% | 40% | 50% | 34% | 48% |
A Calculated based on average shares outstanding during the period.
B Amount represents less than $.005 per share.
C Investment income per share reflects a large, non-recurring dividend which amounted to $.09 per share. Excluding this non-recurring dividend, the ratio of net investment income (loss) to average net assets would have been .11%.
D Investment income per share reflects a large, non-recurring dividend which amounted to $.06 per share. Excluding this non-recurring dividend, the ratio of net investment income (loss) to average net assets would have been .24%.
E Total returns would have been lower if certain expenses had not been reduced during the applicable periods shown.
F Total returns do not include the effect of the contingent deferred sales charge.
G Fees and expenses of any underlying Fidelity Central Funds are not included in the Fund's expense ratio. The Fund indirectly bears its proportionate share of the expenses of any underlying Fidelity Central Funds.
H Expense ratios reflect operating expenses of the class. Expenses before reductions do not reflect amounts reimbursed by the investment adviser or reductions from brokerage service arrangements or reductions from other expense offset arrangements and do not represent the amount paid by the class during periods when reimbursements or reductions occur. Expenses net of fee waivers reflect expenses after reimbursement by the investment adviser but prior to reductions from brokerage service arrangements or other expense offset arrangements. Expenses net of all reductions represent the net expenses paid by the class.
I Amount represents less than .005%
J Amount does not include the portfolio activity of any underlying Fidelity Central Funds.
See accompanying notes which are an integral part of the financial statements.
Financial Highlights — Fidelity Advisor Diversified International Fund Class I
| | | October 31, | | | |
| Years ended October 31, | 2015 | 2014 | 2013 | 2012 | 2011 |
| Selected Per–Share Data | | | | | |
| Net asset value, beginning of period | $19.91 | $19.80 | $15.90 | $14.87 | $15.90 |
| Income from Investment Operations | | | | | |
| Net investment income (loss)A | .21 | .33B | .24 | .23 | .28C |
| Net realized and unrealized gain (loss) | .63 | .18 | 3.98 | 1.05 | (1.03) |
| Total from investment operations | .84 | .51 | 4.22 | 1.28 | (.75) |
| Distributions from net investment income | (.26) | (.23) | (.26) | (.25) | (.25) |
| Distributions from net realized gain | (.02) | (.17) | (.06) | – | (.03) |
| Total distributions | (.29)D | (.40) | (.32) | (.25) | (.28) |
| Redemption fees added to paid in capitalA,E | – | – | – | – | – |
| Net asset value, end of period | $20.46 | $19.91 | $19.80 | $15.90 | $14.87 |
| Total ReturnF | 4.24% | 2.60% | 27.03% | 8.83% | (4.85)% |
| Ratios to Average Net AssetsG,H | | | | | |
| Expenses before reductions | .94% | .97% | .99% | 1.00% | .99% |
| Expenses net of fee waivers, if any | .94% | .97% | .99% | 1.00% | .99% |
| Expenses net of all reductions | .94% | .97% | .97% | .99% | .97% |
| Net investment income (loss) | 1.03% | 1.63%B | 1.39% | 1.52% | 1.70%C |
| Supplemental Data | | | | | |
| Net assets, end of period (in millions) | $747 | $648 | $636 | $546 | $723 |
| Portfolio turnover rateI | 34% | 40% | 50% | 34% | 48% |
A Calculated based on average shares outstanding during the period.
B Investment income per share reflects a large, non-recurring dividend which amounted to $.10 per share. Excluding this non-recurring dividend, the ratio of net investment income (loss) to average net assets would have been 1.14%.
C Investment income per share reflects a large, non-recurring dividend which amounted to $.06 per share. Excluding this non-recurring dividend, the ratio of net investment income (loss) to average net assets would have been 1.30%.
D Total distributions of $.29 per share is comprised of distributions from net investment income of $.263 and distributions from net realized gain of $.022 per share.
E Amount represents less than $.005 per share.
F Total returns would have been lower if certain expenses had not been reduced during the applicable periods shown.
G Fees and expenses of any underlying Fidelity Central Funds are not included in the Fund's expense ratio. The Fund indirectly bears its proportionate share of the expenses of any underlying Fidelity Central Funds.
H Expense ratios reflect operating expenses of the class. Expenses before reductions do not reflect amounts reimbursed by the investment adviser or reductions from brokerage service arrangements or reductions from other expense offset arrangements and do not represent the amount paid by the class during periods when reimbursements or reductions occur. Expenses net of fee waivers reflect expenses after reimbursement by the investment adviser but prior to reductions from brokerage service arrangements or other expense offset arrangements. Expenses net of all reductions represent the net expenses paid by the class.
I Amount does not include the portfolio activity of any underlying Fidelity Central Funds.
See accompanying notes which are an integral part of the financial statements.
Financial Highlights — Fidelity Advisor Diversified International Fund Class Z
| | | October 31, | |
| Years ended October 31, | 2015 | 2014 | 2013 A |
| Selected Per–Share Data | | | |
| Net asset value, beginning of period | $19.93 | $19.81 | $18.54 |
| Income from Investment Operations | | | |
| Net investment income (loss)B | .24 | .36C | .03 |
| Net realized and unrealized gain (loss) | .61 | .19 | 1.24 |
| Total from investment operations | .85 | .55 | 1.27 |
| Distributions from net investment income | (.30) | (.26) | – |
| Distributions from net realized gain | (.02) | (.17) | – |
| Total distributions | (.32) | (.43) | – |
| Redemption fees added to paid in capitalB | –D | –D | – |
| Net asset value, end of period | $20.46 | $19.93 | $19.81 |
| Total ReturnE,F | 4.34% | 2.81% | 6.85% |
| Ratios to Average Net AssetsG,H | | | |
| Expenses before reductions | .79% | .81% | .83%I |
| Expenses net of fee waivers, if any | .79% | .81% | .83%I |
| Expenses net of all reductions | .78% | .81% | .80%I |
| Net investment income (loss) | 1.18% | 1.79%C | .77%I |
| Supplemental Data | | | |
| Net assets, end of period (000 omitted) | $82,925 | $24,050 | $107 |
| Portfolio turnover rateJ | 34% | 40% | 50% |
A For the period August 13, 2013 (commencement of sale of shares) to October 31, 2013.
B Calculated based on average shares outstanding during the period.
C Investment income per share reflects a large, non-recurring dividend which amounted to $.10 per share. Excluding this non-recurring dividend, the ratio of net investment income (loss) to average net assets would have been 1.30%.
D Amount represents less than $.005 per share.
E Total returns for periods of less than one year are not annualized.
F Total returns would have been lower if certain expenses had not been reduced during the applicable periods shown.
G Fees and expenses of any underlying Fidelity Central Funds are not included in the Fund's expense ratio. The Fund indirectly bears its proportionate share of the expenses of any underlying Fidelity Central Funds.
H Expense ratios reflect operating expenses of the class. Expenses before reductions do not reflect amounts reimbursed by the investment adviser or reductions from brokerage service arrangements or reductions from other expense offset arrangements and do not represent the amount paid by the class during periods when reimbursements or reductions occur. Expenses net of fee waivers reflect expenses after reimbursement by the investment adviser but prior to reductions from brokerage service arrangements or other expense offset arrangements. Expenses net of all reductions represent the net expenses paid by the class.
I Annualized
J Amount does not include the portfolio activity of any underlying Fidelity Central Funds.
See accompanying notes which are an integral part of the financial statements.
Notes to Financial Statements
For the period ended October 31, 2015
(Amounts in thousands except percentages)
1. Organization.
Fidelity Advisor Diversified International Fund (the Fund) is a fund of Fidelity Advisor Series VIII (the Trust) and is authorized to issue an unlimited number of shares. The Trust is registered under the Investment Company Act of 1940, as amended (the 1940 Act), as an open-end management investment company organized as a Massachusetts business trust. The Fund offers Class A, Class T, Class C, Class I (formerly Institutional Class) and Class Z shares, each of which, along with Class B shares, has equal rights as to assets and voting privileges. Class B shares are closed to new accounts and additional purchases, except for exchanges and reinvestments. Each class has exclusive voting rights with respect to matters that affect that class. Class B shares will automatically convert to Class A shares after a holding period of seven years from the initial date of purchase.
2. Investments in Fidelity Central Funds.
The Fund invests in Fidelity Central Funds, which are open-end investment companies generally available only to other investment companies and accounts managed by the investment adviser and its affiliates. The Fund's Schedule of Investments lists each of the Fidelity Central Funds held as of period end, if any, as an investment of the Fund, but does not include the underlying holdings of each Fidelity Central Fund. As an Investing Fund, the Fund indirectly bears its proportionate share of the expenses of the underlying Fidelity Central Funds.
The Money Market Central Funds seek preservation of capital and current income and are managed by Fidelity Investments Money Management, Inc. (FIMM), an affiliate of the investment adviser. Annualized expenses of the Money Market Central Funds as of their most recent shareholder report date are less than .005%.
A complete unaudited list of holdings for each Fidelity Central Fund is available upon request or at the Securities and Exchange Commission (the SEC) website at www.sec.gov. In addition, the financial statements of the Fidelity Central Funds, which are not covered by the Fund's Report of Independent Registered Public Accounting Firm, are available on the SEC website or upon request.
3. Significant Accounting Policies.
The financial statements have been prepared in conformity with accounting principles generally accepted in the United States of America (GAAP), which require management to make certain estimates and assumptions at the date of the financial statements. Actual results could differ from those estimates. Subsequent events, if any, through the date that the financial statements were issued have been evaluated in the preparation of the financial statements. The following summarizes the significant accounting policies of the Fund:
Investment Valuation. Investments are valued as of 4:00 p.m. Eastern time on the last calendar day of the period. The Board of Trustees (the Board) has delegated the day to day responsibility for the valuation of the Fund's investments to the Fidelity Management & Research Company (FMR) Fair Value Committee (the Committee). In accordance with valuation policies and procedures approved by the Board, the Fund attempts to obtain prices from one or more third party pricing vendors or brokers to value its investments. When current market prices, quotations or currency exchange rates are not readily available or reliable, investments will be fair valued in good faith by the Committee, in accordance with procedures adopted by the Board. Factors used in determining fair value vary by investment type and may include market or investment specific events, changes in interest rates and credit quality. The frequency with which these procedures are used cannot be predicted and they may be utilized to a significant extent. The Committee oversees the Fund's valuation policies and procedures and reports to the Board on the Committee's activities and fair value determinations. The Board monitors the appropriateness of the procedures used in valuing the Fund's investments and ratifies the fair value determinations of the Committee.
The Fund categorizes the inputs to valuation techniques used to value its investments into a disclosure hierarchy consisting of three levels as shown below:
- Level 1 – quoted prices in active markets for identical investments
- Level 2 – other significant observable inputs (including quoted prices for similar investments, interest rates, prepayment speeds, etc.)
- Level 3 – unobservable inputs (including the Fund's own assumptions based on the best information available)
Valuation techniques used to value the Fund's investments by major category are as follows:
Equity securities, including restricted securities, for which market quotations are readily available, are valued at the last reported sale price or official closing price as reported by a third party pricing vendor on the primary market or exchange on which they are traded and are categorized as Level 1 in the hierarchy. In the event there were no sales during the day or closing prices are not available, securities are valued at the last quoted bid price or may be valued using the last available price and are generally categorized as Level 2 in the hierarchy. For foreign equity securities, when market or security specific events arise, comparisons to the valuation of American Depositary Receipts (ADRs), futures contracts, Exchange-Traded Funds (ETFs) and certain indexes as well as quoted prices for similar securities may be used and would be categorized as Level 2 in the hierarchy. Utilizing these techniques may result in transfers between Level 1 and Level 2. For equity securities, including restricted securities, where observable inputs are limited, assumptions about market activity and risk are used and these securities may be categorized as Level 3 in the hierarchy.
Debt securities, including restricted securities, are valued based on evaluated prices received from third party pricing vendors or from brokers who make markets in such securities. Preferred securities and U.S. government and government agency obligations are valued by pricing vendors who utilize matrix pricing which considers yield or price of bonds of comparable quality, coupon, maturity and type or by broker-supplied prices. When independent prices are unavailable or unreliable, debt securities may be valued utilizing pricing methodologies which consider similar factors that would be used by third party pricing vendors. Debt securities are generally categorized as Level 2 in the hierarchy but may be Level 3 depending on the circumstances.
Futures contracts are valued at the settlement price established each day by the board of trade or exchange on which they are traded and are categorized as Level 1 in the hierarchy. Investments in open-end mutual funds, including the other Fidelity Central Funds, are valued at their closing net asset value (NAV) each business day and are categorized as Level 1 in the hierarchy.
Changes in valuation techniques may result in transfers in or out of an assigned level within the disclosure hierarchy. The aggregate value of investments by input level as of October 31, 2015, including information on transfers between Levels 1 and 2, is included at the end of the Fund's Schedule of Investments.
Foreign Currency. The Fund may use foreign currency contracts to facilitate transactions in foreign-denominated securities. Gains and losses from these transactions may arise from changes in the value of the foreign currency or if the counterparties do not perform under the contracts' terms.
Foreign-denominated assets, including investment securities, and liabilities are translated into U.S. dollars at the exchange rates at period end. Purchases and sales of investment securities, income and dividends received and expenses denominated in foreign currencies are translated into U.S. dollars at the exchange rate in effect on the transaction date.
The effects of exchange rate fluctuations on investments are included with the net realized and unrealized gain (loss) on investment securities. Other foreign currency transactions resulting in realized and unrealized gain (loss) are disclosed separately.
Investment Transactions and Income. For financial reporting purposes, the Fund's investment holdings and NAV include trades executed through the end of the last business day of the period. The NAV per share for processing shareholder transactions is calculated as of the close of business of the New York Stock Exchange (NYSE), normally 4:00 p.m. Eastern time and includes trades executed through the end of the prior business day. Gains and losses on securities sold are determined on the basis of identified cost and may include proceeds received from litigation. Dividend income is recorded on the ex-dividend date, except for certain dividends from foreign securities where the ex-dividend date may have passed, which are recorded as soon as the Fund is informed of the ex-dividend date. Non-cash dividends included in dividend income, if any, are recorded at the fair market value of the securities received. Income and capital gain distributions from Fidelity Central Funds, if any, are recorded on the ex-dividend date. Distributions received on securities that represent a return of capital or capital gain are recorded as a reduction of cost of investments and/or as a realized gain. Subsequent to ex-dividend date the Fund determines the components of these distributions, based upon receipt of tax filings or other correspondence relating to the underlying investment. Interest income is accrued as earned and includes coupon interest and amortization of premium and accretion of discount on debt securities as applicable. Investment income is recorded net of foreign taxes withheld where recovery of such taxes is uncertain.
Class Allocations and Expenses. Investment income, realized and unrealized capital gains and losses, common expenses of the Fund, and certain fund-level expense reductions, if any, are allocated daily on a pro-rata basis to each class based on the relative net assets of each class to the total net assets of the Fund. Each class differs with respect to transfer agent and distribution and service plan fees incurred. Certain expense reductions may also differ by class. For the reporting period, the allocated portion of income and expenses to each class as a percent of its average net assets may vary due to the timing of recording these transactions in relation to fluctuating net assets of the classes. Expenses directly attributable to a fund are charged to that fund. Expenses attributable to more than one fund are allocated among the respective funds on the basis of relative net assets or other appropriate methods. Expense estimates are accrued in the period to which they relate and adjustments are made when actual amounts are known.
Deferred Trustee Compensation. Under a Deferred Compensation Plan (the Plan), independent Trustees may elect to defer receipt of a portion of their annual compensation. Deferred amounts are invested in a cross-section of Fidelity funds, are marked-to-market and remain in the Fund until distributed in accordance with the Plan. The investment of deferred amounts and the offsetting payable to the Trustees are included in the accompanying Statement of Assets and Liabilities.
Income Tax Information and Distributions to Shareholders. Each year, the Fund intends to qualify as a regulated investment company under Subchapter M of the Internal Revenue Code, including distributing substantially all of its taxable income and realized gains. As a result, no provision for U.S. Federal income taxes is required. As of October 31, 2015, the Fund did not have any unrecognized tax benefits in the financial statements; nor is the Fund aware of any tax positions for which it is reasonably possible that the total amounts of unrecognized tax benefits will significantly change in the next twelve months. The Fund files a U.S. federal tax return, in addition to state and local tax returns as required. The Fund's federal income tax returns are subject to examination by the Internal Revenue Service (IRS) for a period of three fiscal years after they are filed. State and local tax returns may be subject to examination for an additional fiscal year depending on the jurisdiction. Foreign taxes are provided for based on the Fund's understanding of the tax rules and rates that exist in the foreign markets in which it invests. The Fund is subject to a tax imposed on capital gains by certain countries in which it invests. An estimated deferred tax liability for net unrealized appreciation on the applicable securities is included in Other payables and accrued expenses on the Statement of Assets & Liabilities.
Distributions are declared and recorded on the ex-dividend date. Income dividends and capital gain distributions are declared separately for each class. Income and capital gain distributions are determined in accordance with income tax regulations, which may differ from GAAP.
Capital accounts within the financial statements are adjusted for permanent book-tax differences. These adjustments have no impact on net assets or the results of operations. Capital accounts are not adjusted for temporary book-tax differences which will reverse in a subsequent period.
Book-tax differences are primarily due to foreign currency transactions, partnerships, futures transactions, passive foreign investment companies (PFIC), market discount, deferred trustees compensation, capital loss carryforwards and losses deferred due to wash sales.
The federal tax cost of investment securities and unrealized appreciation (depreciation) as of period end were as follows:
| Gross unrealized appreciation | $428,251 |
| Gross unrealized depreciation | (91,122) |
| Net unrealized appreciation (depreciation) on securities | $337,129 |
| Tax Cost | $1,697,366 |
The tax-based components of distributable earnings as of period end were as follows:
| Undistributed ordinary income | $12,761 |
| Capital loss carryforward | $(2,606,019) |
| Net unrealized appreciation (depreciation) on securities and other investments | $337,144 |
Capital loss carryforwards are only available to offset future capital gains of the Fund to the extent provided by regulations and may be limited. Under the Regulated Investment Company Modernization Act of 2010 (the Act), the Fund is permitted to carry forward capital losses incurred in taxable years beginning after December 22, 2010 for an unlimited period and such capital losses are required to be used prior to any losses that expire. The capital loss carryforward information presented below, including any applicable limitation, is estimated as of fiscal period end and is subject to adjustment.
| Fiscal year of expiration | |
The tax character of distributions paid was as follows:
| | October 31, 2015 | October 31, 2014 |
| Ordinary Income | $20,879 | $ 34,939 |
Short-Term Trading (Redemption) Fees. Shares held by investors in the Fund less than 30 days may have been subject to a redemption fee equal to 1.00% of the NAV of shares redeemed. All redemption fees, which reduce the proceeds of the shareholder redemption, are retained by the Fund and accounted for as an addition to paid in capital.
Restricted Securities. The Fund may invest in securities that are subject to legal or contractual restrictions on resale. These securities generally may be resold in transactions exempt from registration or to the public if the securities are registered. Disposal of these securities may involve time-consuming negotiations and expense, and prompt sale at an acceptable price may be difficult. Information regarding restricted securities is included at the end of the Fund's Schedule of Investments.
4. Derivative Instruments.
Risk Exposures and the Use of Derivative Instruments. The Fund's investment objective allows the Fund to enter into various types of derivative contracts, including futures contracts. Derivatives are investments whose value is primarily derived from underlying assets, indices or reference rates and may be transacted on an exchange or over-the-counter (OTC). Derivatives may involve a future commitment to buy or sell a specified asset based on specified terms, to exchange future cash flows at periodic intervals based on a notional principal amount, or for one party to make one or more payments upon the occurrence of specified events in exchange for periodic payments from the other party.
The Fund used derivatives to increase returns and to manage exposure to certain risks as defined below. The success of any strategy involving derivatives depends on analysis of numerous economic factors, and if the strategies for investment do not work as intended, the Fund may not achieve its objectives.
The Fund's use of derivatives increased or decreased its exposure to the following risk:
| Equity Risk | Equity risk relates to the fluctuations in the value of financial instruments as a result of changes in market prices (other than those arising from interest rate risk or foreign exchange risk), whether caused by factors specific to an individual investment, its issuer, or all factors affecting all instruments traded in a market or market segment. |
The Fund is also exposed to additional risks from investing in derivatives, such as liquidity risk and counterparty credit risk. Liquidity risk is the risk that the Fund will be unable to close out the derivative in the open market in a timely manner. Counterparty credit risk is the risk that the counterparty will not be able to fulfill its obligation to the Fund. Counterparty credit risk related to exchange-traded futures contracts may be mitigated by the protection provided by the exchange on which they trade.
Investing in derivatives may involve greater risks than investing in the underlying assets directly and, to varying degrees, may involve risk of loss in excess of any initial investment and collateral received and amounts recognized in the Statement of Assets and Liabilities. In addition, there may be the risk that the change in value of the derivative contract does not correspond to the change in value of the underlying instrument.
Futures Contracts. A futures contract is an agreement between two parties to buy or sell a specified underlying instrument for a fixed price at a specified future date. The Fund used futures contracts to manage its exposure to the stock market.
Upon entering into a futures contract, a fund is required to deposit either cash or securities (initial margin) with a clearing broker in an amount equal to a certain percentage of the face value of the contract. Futures contracts are marked-to-market daily and subsequent daily payments (variation margin) are made or received by a fund depending on the daily fluctuations in the value of the futures contracts and are recorded as unrealized appreciation or (depreciation). This receivable and/or payable, if any, is included in daily variation margin for derivative instruments in the Statement of Assets and Liabilities. Realized gain or (loss) is recorded upon the expiration or closing of a futures contract.
Any open futures contracts at period end are presented in the Schedule of Investments under the caption "Futures Contracts". The underlying face amount at value reflects each contract's exposure to the underlying instrument or index at period end. Securities deposited to meet initial margin requirements are identified in the Schedule of Investments. Cash deposited to meet initial margin requirements is presented as segregated cash with brokers for derivative instruments in the Statement of Assets and Liabilities.
During the period the Fund recognized net realized gain (loss) of $(578) and a change in net unrealized appreciation (depreciation) of $439 related to its investment in futures contracts. This amount included in the Statement of Operations.
5. Purchases and Sales of Investments.
Purchases and sales of securities, other than short-term securities, aggregated $650,132 and $663,500, respectively.
6. Fees and Other Transactions with Affiliates.
Management Fee. Fidelity Management & Research Company (the investment adviser) and its affiliates provide the Fund with investment management related services for which the Fund pays a monthly management fee. The management fee is the sum of an individual fund fee rate that is based on an annual rate of .42% of the Fund's average net assets and an annualized group fee rate that averaged .25% during the period. The group fee rate is based upon the average net assets of all the mutual funds advised by the investment adviser, including any mutual funds previously advised by the investment adviser that are currently advised by Fidelity SelectCo, LLC, an affiliate of the investment adviser. The group fee rate decreases as assets under management increase and increases as assets under management decrease. For the reporting period, the total annual management fee rate was .67% of the Fund's average net assets.
Distribution and Service Plan Fees. In accordance with Rule 12b-1 of the 1940 Act, the Fund has adopted separate Distribution and Service Plans for each class of shares. Certain classes pay Fidelity Distributors Corporation (FDC), an affiliate of the investment adviser, separate Distribution and Service Fees, each of which is based on an annual percentage of each class' average net assets. In addition, FDC may pay financial intermediaries for selling shares of the Fund and providing shareholder support services. For the period, the Distribution and Service Fee rates, total fees and amounts retained by FDC were as follows:
| | Distribution
Fee | Service
Fee | Total Fees | Retained
by FDC |
| Class A | -% | .25% | $1,665 | $3 |
| Class T | .25% | .25% | 1,402 | –(a) |
| Class B | .75% | .25% | 151 | 113 |
| Class C | .75% | .25% | 2,475 | 120 |
| | | | $5,693 | $236 |
(a) In the amount of less than five hundred dollars.
Sales Load. FDC may receive a front-end sales charge of up to 5.75% for selling Class A shares and 3.50% for selling Class T shares, some of which is paid to financial intermediaries for selling shares of the Fund. Depending on the holding period, FDC may receive contingent deferred sales charges levied on Class A, Class T, Class B, and Class C redemptions. The deferred sales charges range from 5.00% to 1.00% for Class B shares, 1.00% for Class C shares, 1.00% for certain purchases of Class A shares and .25% for certain purchases of Class T shares.
For the period, sales charge amounts retained by FDC were as follows:
| | Retained
by FDC
|
| Class A | $119 |
| Class T | 27 |
| Class BA | 7 |
| Class CA | 7 |
| | 160 |
A When Class B and Class C shares are initially sold, FDC pays commissions from its own resources to financial intermediaries through which the sales are made.
Transfer Agent Fees. Fidelity Investments Institutional Operations Company, Inc., (FIIOC), an affiliate of the investment adviser, is the transfer, dividend disbursing and shareholder servicing agent for each class of the Fund. FIIOC receives account fees and asset-based fees that vary according to the account size and type of account of the shareholders of the respective classes of the Fund, except for Class Z. FIIOC receives an asset-based fee of Class Z's average net assets. FIIOC pays for typesetting, printing and mailing of shareholder reports, except proxy statements.
For the period, transfer agent fees for each class were as follows:
| | Amount | % of
Class-Level Average
Net Assets |
| Class A | $1,528 | .23 |
| Class T | 667 | .24 |
| Class B | 45 | .30 |
| Class C | 563 | .23 |
| Class I | 1,422 | .20 |
| Class Z | 30 | .05 |
| | $ 4,255 | |
Accounting and Security Lending Fees. Fidelity Service Company, Inc. (FSC), an affiliate of the investment adviser, maintains the Fund's accounting records. The accounting fee is based on the level of average net assets for each month. Under a separate contract, FSC administers the security lending program. The security lending fee is based on the number and duration of lending transactions.
Brokerage Commissions. The Fund placed a portion of its portfolio transactions with brokerage firms which are affiliates of the investment adviser. Brokerage commissions are included in net realized gain (loss) and change in net unrealized appreciation (depreciation) in the Statement of Operations. The commissions paid to these affiliated firms were $3 for the period.
Other. During the period, the investment adviser reimbursed the Fund for certain losses in the amount of $5.
7. Committed Line of Credit.
The Fund participates with other funds managed by the investment adviser or an affiliate in a $4.25 billion credit facility (the "line of credit") to be utilized for temporary or emergency purposes to fund shareholder redemptions or for other short-term liquidity purposes. The Fund has agreed to pay commitment fees on its pro-rata portion of the line of credit, which amounted to $3 and is reflected in Miscellaneous expenses on the Statement of Operations. During the period, the Fund did not borrow on this line of credit.
8. Security Lending.
The Fund lends portfolio securities through a lending agent from time to time in order to earn additional income. For equity securities, a lending agent is used and may loan securities to certain qualified borrowers, including Fidelity Capital Markets (FCM), a broker-dealer affiliated with the Fund. On the settlement date of the loan, the Fund receives collateral (in the form of U.S. Treasury obligations, letters of credit and/or cash) against the loaned securities and maintains collateral in an amount not less than 100% of the market value of the loaned securities during the period of the loan. The market value of the loaned securities is determined at the close of business of the Fund and any additional required collateral is delivered to the Fund on the next business day. The Fund or borrower may terminate the loan at any time, and if the borrower defaults on its obligation to return the securities loaned because of insolvency or other reasons, the Fund may apply collateral received from the borrower against the obligation. The Fund may experience delays and costs in recovering the securities loaned. Any cash collateral received is invested in the Fidelity Securities Lending Cash Central Fund. The value of loaned securities and cash collateral at period end are disclosed on the Fund's Statement of Assets and Liabilities. Security lending income represents the income earned on investing cash collateral, less rebates paid to borrowers and any lending agent fees associated with the loan, plus any premium payments received for lending certain types of securities. Security lending income is presented in the Statement of Operations as a component of income from Fidelity Central Funds. Total security lending income during the period amounted to $559, including $1 from securities loaned to FCM.
9. Expense Reductions.
Commissions paid to certain brokers with whom the investment adviser, or its affiliates, places trades on behalf of the Fund include an amount in addition to trade execution, which may be rebated back to the Fund to offset certain expenses. This amount totaled $97 for the period.
In addition, during the period the investment adviser reimbursed and/or waived a portion of fund-level operating expenses in the amount of $8 and a portion of class-level operating expenses as follows:
| | Amount |
| Class A | $17 |
| Class T | 7 |
| Class B | –(a) |
| Class C | 6 |
| Class I | 12 |
| | $42 |
(a) In the amount of less than five hundred dollars.
10. Distributions to Shareholders.
Distributions to shareholders of each class were as follows:
| Years ended October 31, | 2015 | 2014 |
| From net investment income | | |
| Class A | $7,030 | $6,853 |
| Class T | 2,091 | 2,251 |
| Class C | 706�� | 979 |
| Class I | 8,555 | 7,291 |
| Class Z | 356 | 1 |
| Total | $18,738 | $17,375 |
| From net realized gain | | |
| Class A | $727 | $6,584 |
| Class T | 317 | 2,789 |
| Class B | 21 | 307 |
| Class C | 280 | 2,390 |
| Class I | 770 | 5,493 |
| Class Z | 26 | 1 |
| Total | $2,141 | $17,564 |
11. Share Transactions.
Share transactions for each class were as follows and may contain automatic conversions between classes or exchanges between funds:
| | Shares | Shares | Dollars | Dollars |
| Years ended October 31, | 2015 | 2014 | 2015 | 2014 |
| Class A | | | | |
| Shares sold | 6,331 | 4,795 | $128,828 | $94,751 |
| Reinvestment of distributions | 378 | 646 | 7,410 | 12,430 |
| Shares redeemed | (9,229) | (8,821) | (183,333) | (174,243) |
| Net increase (decrease) | (2,520) | (3,380) | $(47,095) | $(67,062) |
| Class T | | | | |
| Shares sold | 1,574 | 1,185 | $31,817 | $23,252 |
| Reinvestment of distributions | 120 | 249 | 2,332 | 4,764 |
| Shares redeemed | (2,697) | (3,330) | (53,711) | (65,214) |
| Net increase (decrease) | (1,003) | (1,896) | $(19,562) | $(37,198) |
| Class B | | | | |
| Shares sold | 20 | 29 | $400 | $537 |
| Reinvestment of distributions | 1 | 15 | 19 | 278 |
| Shares redeemed | (467) | (933) | (9,077) | (17,767) |
| Net increase (decrease) | (446) | (889) | $(8,658) | $(16,952) |
| Class C | | | | |
| Shares sold | 2,044 | 874 | $40,003 | $16,572 |
| Reinvestment of distributions | 44 | 149 | 826 | 2,754 |
| Shares redeemed | (2,036) | (2,144) | (39,156) | (40,544) |
| Net increase (decrease) | 52 | (1,121) | $1,673 | $(21,218) |
| Class I | | | | |
| Shares sold | 13,465 | 7,676 | $273,323 | $154,759 |
| Reinvestment of distributions | 415 | 582 | 8,253 | 11,367 |
| Shares redeemed | (9,912) | (7,810) | (200,987) | (158,739) |
| Net increase (decrease) | 3,968 | 448 | $80,589 | $7,387 |
| Class Z | | | | |
| Shares sold | 3,275 | 1,246 | $65,174 | $26,144 |
| Reinvestment of distributions | 19 | – | 382 | 2 |
| Shares redeemed | (449) | (44) | (9,238) | (873) |
| Net increase (decrease) | 2,845 | 1,202 | $56,318 | $25,273 |
12. Other.
The Fund's organizational documents provide former and current trustees and officers with a limited indemnification against liabilities arising in connection with the performance of their duties to the Fund. In the normal course of business, the Fund may also enter into contracts that provide general indemnifications. The Fund's maximum exposure under these arrangements is unknown as this would be dependent on future claims that may be made against the Fund. The risk of material loss from such claims is considered remote.
Report of Independent Registered Public Accounting Firm
To the Trustees of Fidelity Advisor Series VIII and Shareholders of Fidelity Advisor® Diversified International Fund:
In our opinion, the accompanying statement of assets and liabilities, including the schedule of investments, and the related statements of operations and of changes in net assets and the financial highlights present fairly, in all material respects, the financial position of Fidelity Advisor® Diversified International Fund (a fund of Fidelity Advisor Series VIII) at October 31, 2015, the results of its operations for the year then ended, the changes in its net assets for each of the two years in the period and the financial highlights for each of the periods indicated, in conformity with accounting principles generally accepted in the United States of America. These financial statements and financial highlights (hereafter referred to as “financial statements”) are the responsibility of the Fidelity Advisor® Diversified International Fund’s management. Our responsibility is to express an opinion on these financial statements based on our audits. We conducted our audits of these financial statements in accordance with the standards of the Public Company Accounting Oversight Board (United States). Those standards require that we plan and perform the audit to obtain reasonable assurance about whether the financial statements are free of material misstatement. An audit includes examining, on a test basis, evidence supporting the amounts and disclosures in the financial statements, assessing the accounting principles used and significant estimates made by management, and evaluating the overall financial statement presentation. We believe that our audits, which included confirmation of securities at October 31, 2015 by correspondence with the custodian and brokers, provide a reasonable basis for our opinion.
PricewaterhouseCoopers LLP
Boston, Massachusetts
December 16, 2015
Trustees and Officers
The Trustees, Members of the Advisory Board (if any), and officers of the trust and fund, as applicable, are listed below. The Board of Trustees governs the fund and is responsible for protecting the interests of shareholders. The Trustees are experienced executives who meet periodically throughout the year to oversee the fund's activities, review contractual arrangements with companies that provide services to the fund, oversee management of the risks associated with such activities and contractual arrangements, and review the fund's performance. Each of the Trustees oversees 170 funds.
The Trustees hold office without limit in time except that (a) any Trustee may resign; (b) any Trustee may be removed by written instrument, signed by at least two-thirds of the number of Trustees prior to such removal; (c) any Trustee who requests to be retired or who has become incapacitated by illness or injury may be retired by written instrument signed by a majority of the other Trustees; and (d) any Trustee may be removed at any special meeting of shareholders by a two-thirds vote of the outstanding voting securities of the trust. Each Trustee who is not an interested person (as defined in the 1940 Act) of the trust and the fund is referred to herein as an Independent Trustee. Each Independent Trustee shall retire not later than the last day of the calendar year in which his or her 75th birthday occurs. The Independent Trustees may waive this mandatory retirement age policy with respect to individual Trustees. Officers and Advisory Board Members hold office without limit in time, except that any officer or Advisory Board Member may resign or may be removed by a vote of a majority of the Trustees at any regular meeting or any special meeting of the Trustees. Except as indicated, each individual has held the office shown or other offices in the same company for the past five years.
The fund’s Statement of Additional Information (SAI) includes more information about the Trustees. To request a free copy, call Fidelity at 1-877-208-0098.
Experience, Skills, Attributes, and Qualifications of the Trustees. The Governance and Nominating Committee has adopted a statement of policy that describes the experience, qualifications, attributes, and skills that are necessary and desirable for potential Independent Trustee candidates (Statement of Policy). The Board believes that each Trustee satisfied at the time he or she was initially elected or appointed a Trustee, and continues to satisfy, the standards contemplated by the Statement of Policy. The Governance and Nominating Committee also engages professional search firms to help identify potential Independent Trustee candidates who have the experience, qualifications, attributes, and skills consistent with the Statement of Policy. From time to time, additional criteria based on the composition and skills of the current Independent Trustees, as well as experience or skills that may be appropriate in light of future changes to board composition, business conditions, and regulatory or other developments, have also been considered by the professional search firms and the Governance and Nominating Committee. In addition, the Board takes into account the Trustees' commitment and participation in Board and committee meetings, as well as their leadership of standing and ad hoc committees throughout their tenure.
In determining that a particular Trustee was and continues to be qualified to serve as a Trustee, the Board has considered a variety of criteria, none of which, in isolation, was controlling. The Board believes that, collectively, the Trustees have balanced and diverse experience, qualifications, attributes, and skills, which allow the Board to operate effectively in governing the fund and protecting the interests of shareholders. Information about the specific experience, skills, attributes, and qualifications of each Trustee, which in each case led to the Board's conclusion that the Trustee should serve (or continue to serve) as a trustee of the fund, is provided below.
Board Structure and Oversight Function. James C. Curvey is an interested person and currently serves as Chairman. The Trustees have determined that an interested Chairman is appropriate and benefits shareholders because an interested Chairman has a personal and professional stake in the quality and continuity of services provided to the fund. Independent Trustees exercise their informed business judgment to appoint an individual of their choosing to serve as Chairman, regardless of whether the Trustee happens to be independent or a member of management. The Independent Trustees have determined that they can act independently and effectively without having an Independent Trustee serve as Chairman and that a key structural component for assuring that they are in a position to do so is for the Independent Trustees to constitute a substantial majority for the Board. The Independent Trustees also regularly meet in executive session. Ned C. Lautenbach serves as Chairman of the Independent Trustees and as such (i) acts as a liaison between the Independent Trustees and management with respect to matters important to the Independent Trustees and (ii) with management prepares agendas for Board meetings.
Fidelity® funds are overseen by different Boards of Trustees. The fund's Board oversees Fidelity's high income and certain equity funds, and other Boards oversee Fidelity's investment-grade bond, money market, asset allocation, and sector funds. The asset allocation funds may invest in Fidelity® funds overseen by the fund's Board. The use of separate Boards, each with its own committee structure, allows the Trustees of each group of Fidelity® funds to focus on the unique issues of the funds they oversee, including common research, investment, and operational issues. On occasion, the separate Boards establish joint committees to address issues of overlapping consequences for the Fidelity® funds overseen by each Board.
The Trustees operate using a system of committees to facilitate the timely and efficient consideration of all matters of importance to the Trustees, the fund, and fund shareholders and to facilitate compliance with legal and regulatory requirements and oversight of the fund's activities and associated risks. The Board, acting through its committees, has charged FMR and its affiliates with (i) identifying events or circumstances the occurrence of which could have demonstrably adverse effects on the fund's business and/or reputation; (ii) implementing processes and controls to lessen the possibility that such events or circumstances occur or to mitigate the effects of such events or circumstances if they do occur; and (iii) creating and maintaining a system designed to evaluate continuously business and market conditions in order to facilitate the identification and implementation processes described in (i) and (ii) above. Because the day-to-day operations and activities of the fund are carried out by or through FMR, its affiliates, and other service providers, the fund's exposure to risks is mitigated but not eliminated by the processes overseen by the Trustees. While each of the Board's committees has responsibility for overseeing different aspects of the fund's activities, oversight is exercised primarily through the Operations, Audit, and Compliance Committees. In addition, the Independent Trustees have worked with FMR to enhance the Board's oversight of investment and financial risks, legal and regulatory risks, technology risks, and operational risks, including the development of additional risk reporting to the Board. For example, a working group comprised of Independent Trustees and FMR has worked and continues to work to review the Fidelity® funds' valuation-related activities, reporting and risk management. Appropriate personnel, including but not limited to the fund's Chief Compliance Officer (CCO), FMR's internal auditor, the independent accountants, the fund's Treasurer and portfolio management personnel, make periodic reports to the Board's committees, as appropriate, including an annual review of Fidelity's risk management program for the Fidelity® funds. The responsibilities of each standing committee, including their oversight responsibilities, are described further under "Standing Committees of the Trustees."
Interested Trustees*:
Correspondence intended for a Trustee who is an interested person may be sent to Fidelity Investments, 245 Summer Street, Boston, Massachusetts 02210.
Name, Year of Birth; Principal Occupations and Other Relevant Experience+
James C. Curvey (1935)
Year of Election or Appointment: 2007
Trustee
Chairman of the Board of Trustees
Mr. Curvey also serves as Trustee of other Fidelity® funds. Mr. Curvey is a Director of Fidelity Research & Analysis Co. (investment adviser firm, 2009-present), and Vice Chairman (2007-present) and Director of FMR LLC (diversified financial services company). In addition, Mr. Curvey serves as an Overseer for the Boston Symphony Orchestra and a member of the board of Artis-Naples, Naples, Florida, and as a Trustee for Brewster Academy, Wolfeboro, New Hampshire. Previously, Mr. Curvey served as a Director of Fidelity Investments Money Management, Inc. (investment adviser firm, 2009-2014) and a Director of FMR and FMR Co., Inc. (investment adviser firms, 2007-2014).
Charles S. Morrison (1960)
Year of Election or Appointment: 2014
Trustee
Mr. Morrison also serves as Trustee of other funds. He serves as a Director of Fidelity Investments Money Management, Inc. (FIMM) (investment adviser firm, 2014-present), Director of Fidelity SelectCo, LLC (investment adviser firm, 2014-present), President, Asset Management (2014-present), and is an employee of Fidelity Investments. Previously, Mr. Morrison served as Vice President of Fidelity's Fixed Income and Asset Allocation Funds (2012-2014), President, Fixed Income (2011-2014), Vice President of Fidelity's Money Market Funds (2005-2009), President, Money Market Group Leader of FMR (investment adviser firm, 2009), and Senior Vice President, Money Market Group of FMR (2004-2009). Mr. Morrison also served as Vice President of Fidelity's Bond Funds (2002-2005), certain Balanced Funds (2002-2005), and certain Asset Allocation Funds (2002-2007), and as Senior Vice President (2002-2005) of Fidelity's Bond Division.
* Determined to be an “Interested Trustee” by virtue of, among other things, his or her affiliation with the trust or various entities under common control with FMR.
+ The information includes the Trustee's principal occupation during the last five years and other information relating to the experience, attributes, and skills relevant to the Trustee's qualifications to serve as a Trustee, which led to the conclusion that the Trustee should serve as a Trustee for the fund.
Independent Trustees:
Correspondence intended for an Independent Trustee may be sent to Fidelity Investments, P.O. Box 55235, Boston, Massachusetts 02205-5235.
Name, Year of Birth; Principal Occupations and Other Relevant Experience+
Dennis J. Dirks (1948)
Year of Election or Appointment: 2005
Trustee
Mr. Dirks also serves as Trustee of other Fidelity® funds. Prior to his retirement in May 2003, Mr. Dirks was Chief Operating Officer and a member of the Board of The Depository Trust & Clearing Corporation (DTCC). He also served as President, Chief Operating Officer, and Board member of The Depository Trust Company (DTC) and President and Board member of the National Securities Clearing Corporation (NSCC). In addition, Mr. Dirks served as Chief Executive Officer and Board member of the Government Securities Clearing Corporation, Chief Executive Officer and Board member of the Mortgage-Backed Securities Clearing Corporation, as a Trustee and a member of the Finance Committee of Manhattan College (2005-2008), as a Trustee and a member of the Finance Committee of AHRC of Nassau County (2006-2008), and as a member of the Independent Directors Council (IDC) Governing Council (2010-2015). Mr. Dirks is a member of the Board of Directors for The Brookville Center for Children's Services, Inc. (2009-present).
Alan J. Lacy (1953)
Year of Election or Appointment: 2008
Trustee
Mr. Lacy also serves as Trustee of other Fidelity® funds. Mr. Lacy serves as a member of the Board of Directors of Dave & Buster's Entertainment, Inc. (restaurant and entertainment complexes, 2010-present) and Bristol-Myers Squibb Company (global pharmaceuticals, 2008-present). In addition, Mr. Lacy served as Senior Adviser (2007-2014) of Oak Hill Capital Partners, L.P. (private equity) and also served as Chief Executive Officer (2000-2005) and Vice Chairman (2005-2006) of Sears Holdings Corporation and Sears, Roebuck and Co. (retail). Mr. Lacy is a member of the Board of Trustees of The National Parks Conservation Association (2006-present). Previously, Mr. Lacy served as Chairman of the Board of Trustees of the National Parks Conservation Association (2008-2011) and as a member of the Board of Directors for The Western Union Company (global money transfer, 2006-2011), The Hillman Companies, Inc. (hardware wholesalers, 2010-2014), and Earth Fare, Inc. (retail grocery, 2010-2014).
Ned C. Lautenbach (1944)
Year of Election or Appointment: 2000
Trustee
Chairman of the Independent Trustees
Mr. Lautenbach also serves as Trustee of other Fidelity® funds. Mr. Lautenbach currently serves as the Lead Director of the Eaton Corporation Board of Directors (diversified industrial, 1997-present). Mr. Lautenbach is Chairman of the Board of Directors of Artis-Naples in Naples, Florida (2012-present), a member of the Council on Foreign Relations (1994-present), and a member of the Board of Governors, State University System of Florida (2013-present). Previously, Mr. Lautenbach was a Partner/Advisory Partner at Clayton, Dubilier & Rice, LLC (private equity investment, 1998-2010), as well as a Director of Sony Corporation (2006-2007).
Joseph Mauriello (1944)
Year of Election or Appointment: 2008
Trustee
Mr. Mauriello also serves as Trustee of other Fidelity® funds. Prior to his retirement in January 2006, Mr. Mauriello served in numerous senior management positions including Deputy Chairman and Chief Operating Officer (2004-2005), and Vice Chairman of Financial Services (2002-2004) of KPMG LLP US (professional services, 1965-2005). Mr. Mauriello currently serves as a member of the Board of Directors of XL Group plc. (global insurance and re-insurance, 2006-present) and the Independent Directors Council (IDC) Governing Council (2015-present). Previously, Mr. Mauriello served as a Director of the Hamilton Funds of the Bank of New York (2006-2007) and of Arcadia Resources Inc. (health care services and products, 2007-2012).
Robert W. Selander (1950)
Year of Election or Appointment: 2011
Trustee
Mr. Selander also serves as Trustee of other Fidelity® funds. Mr. Selander serves as a Director of The Western Union Company (global money transfer, 2014-present). Previously, Mr. Selander served as a Member of the Advisory Board of other Fidelity® funds (2011), and Executive Vice Chairman (2010), Chief Executive Officer (2009-2010), and President and Chief Executive Officer (1997-2009) of Mastercard, Inc.
Cornelia M. Small (1944)
Year of Election or Appointment: 2005
Trustee
Ms. Small also serves as Trustee of other Fidelity® funds. Ms. Small is a member of the Board of Directors (2009-present) and Chair of the Investment Committee (2010-present) of the Teagle Foundation. Ms. Small also serves on the Investment Committee of the Berkshire Taconic Community Foundation (2008-present). Previously, Ms. Small served as Chairperson (2002-2008) and a member of the Investment Committee and Chairperson (2008-2012) and a member of the Board of Trustees of Smith College. In addition, Ms. Small served as Chief Investment Officer, Director of Global Equity Investments, and a member of the Board of Directors of Scudder, Stevens & Clark and Scudder Kemper Investments.
William S. Stavropoulos (1939)
Year of Election or Appointment: 2001
Trustee
Vice Chairman of the Independent Trustees
Mr. Stavropoulos also serves as Trustee of other Fidelity® funds. Mr. Stavropoulos serves as President and Founder of the Michigan Baseball Foundation, the Great Lakes Loons (2007-present). Mr. Stavropoulos is Chairman Emeritus of the Board of Directors of The Dow Chemical Company, where he previously served in numerous senior management positions, including President, CEO (1995-2000; 2002-2004), Chairman of the Executive Committee (2000-2006), and as a member of the Board of Directors (1990-2006). Currently, Mr. Stavropoulos is Chairman of the Board of Directors of Univar Inc. (global distributor of commodity and specialty chemicals), a Director of Teradata Corporation (data warehousing and technology solutions), and Maersk Inc. (industrial conglomerate), and a member of the Advisory Board for Metalmark Capital LLC (private equity investment, 2005-present). Mr. Stavropoulos is an operating advisor to Clayton, Dubilier & Rice, LLC (private equity investment). In addition, Mr. Stavropoulos is a member of the University of Notre Dame Advisory Council for the College of Science, a Trustee of the Rollin L. Gerstacker Foundation, and a Director of the Naples Philharmonic Center for the Arts. Previously, Mr. Stavropoulos served as a Director of Chemical Financial Corporation (bank holding company, 1993-2012) and Tyco International, Ltd. (multinational manufacturing and services, 2007-2012).
David M. Thomas (1949)
Year of Election or Appointment: 2008
Trustee
Mr. Thomas also serves as Trustee of other Fidelity® funds. Mr. Thomas serves as Non-Executive Chairman of the Board of Directors of Fortune Brands Home and Security (home and security products, 2011-present), as a member of the Board of Directors (2004-present) and Presiding Director (2013-present) of Interpublic Group of Companies, Inc. (marketing communication), and as a member of the Board of Trustees of the University of Florida (2013-present). Previously, Mr. Thomas served as Executive Chairman (2005-2006) and Chairman and Chief Executive Officer (2000-2005) of IMS Health, Inc. (pharmaceutical and healthcare information solutions), and a Director of Fortune Brands, Inc. (consumer products, 2000-2011).
+ The information includes the Trustee's principal occupation during the last five years and other information relating to the experience, attributes, and skills relevant to the Trustee's qualifications to serve as a Trustee, which led to the conclusion that the Trustee should serve as a Trustee for the fund.
Advisory Board Members and Officers:
Correspondence intended for an officer or Peter S. Lynch may be sent to Fidelity Investments, 245 Summer Street, Boston, Massachusetts 02210. Officers appear below in alphabetical order.
Name, Year of Birth; Principal Occupation
Peter S. Lynch (1944)
Year of Election or Appointment: 2003
Member of the Advisory Board
Mr. Lynch also serves as Member of the Advisory Board of other Fidelity® funds. Mr. Lynch is Vice Chairman and a Director of FMR (investment adviser firm) and FMR Co., Inc. (investment adviser firm). In addition, Mr. Lynch serves as a Trustee of Boston College and as the Chairman of the Inner-City Scholarship Fund. Previously, Mr. Lynch served on the Special Olympics International Board of Directors (1997-2006).
Elizabeth Paige Baumann (1968)
Year of Election or Appointment: 2012
Anti-Money Laundering (AML) Officer
Ms. Baumann also serves as AML Officer of other funds. She is Chief AML Officer of FMR LLC (diversified financial services company, 2012-present) and is an employee of Fidelity Investments. Previously, Ms. Baumann served as Vice President and Deputy Anti-Money Laundering Officer (2007-2012).
Marc R. Bryant (1966)
Year of Election or Appointment: 2015
Secretary and Chief Legal Officer (CLO)
Mr. Bryant also serves as Secretary and CLO of other funds. Mr. Bryant serves as CLO, Secretary, and Senior Vice President of Fidelity Management & Research Company (investment adviser firm, 2015-present) and FMR Co., Inc. (investment adviser firm, 2015-present); Secretary of Fidelity SelectCo, LLC (investment adviser firm, 2015-present) and Fidelity Investments Money Management, Inc. (investment adviser firm, 2015-present); and CLO of Fidelity Management & Research (Hong Kong) Limited (investment adviser firm, 2015-present). He is Senior Vice President and Deputy General Counsel of FMR LLC (diversified financial services company). Previously, Mr. Bryant served as Secretary and Chief Legal Officer of Fidelity Rutland Square Trust II (2010-2014) and Assistant Secretary of Fidelity's Fixed Income and Asset Allocation Funds (2013-2015). Prior to joining Fidelity Investments, Mr. Bryant served as a Senior Vice President and the Head of Global Retail Legal for AllianceBernstein L.P. (2006-2010), and as the General Counsel for ProFund Advisors LLC (2001-2006).
Timothy M. Cohen (1969)
Vice President of certain Equity Funds
Mr. Cohen also serves as Vice President of other funds. Mr. Cohen serves as Chief Compliance Officer of FMR Investment Management (U.K.) Limited (investment adviser firm, 2013-present) and is an employee of Fidelity Investments. Previously, Mr. Cohen served as a Director of FMR Investment Management (U.K.) Limited (2013-2015).
William C. Coffey (1969)
Year of Election or Appointment: 2009
Assistant Secretary
Mr. Coffey also serves as Assistant Secretary of other funds. He is Senior Vice President and Deputy General Counsel of FMR LLC (diversified financial services company, 2010-present), and is an employee of Fidelity Investments. Previously, Mr. Coffey served as Vice President and Associate General Counsel of FMR LLC (2005-2009).
Jonathan Davis (1968)
Year of Election or Appointment: 2010
Assistant Treasurer
Mr. Davis also serves as Assistant Treasurer of other funds, and is an employee of Fidelity Investments. Previously, Mr. Davis served as Vice President and Associate General Counsel of FMR LLC (diversified financial services company, 2003-2010).
Adrien E. Deberghes (1967)
Year of Election or Appointment: 2008
Deputy Treasurer
Mr. Deberghes also serves as an officer of other funds. He is an employee of Fidelity Investments (2008-present). Prior to joining Fidelity Investments, Mr. Deberghes was Senior Vice President of Mutual Fund Administration at State Street Corporation (2007-2008), Senior Director of Mutual Fund Administration at Investors Bank & Trust (2005-2007), and Director of Finance for Dunkin' Brands (2000-2005).
Stephanie J. Dorsey (1969)
Year of Election or Appointment: 2010
Assistant Treasurer
Ms. Dorsey also serves as an officer of other funds. She is an employee of Fidelity Investments (2008-present) and has served in other fund officer roles. Prior to joining Fidelity Investments, Ms. Dorsey served as Treasurer (2004-2008) of the JPMorgan Mutual Funds and Vice President (2004-2008) of JPMorgan Chase Bank.
Howard J. Galligan III (1966)
Year of Election or Appointment: 2014
Chief Financial Officer
Mr. Galligan also serves as Chief Financial Officer of other funds. Mr. Galligan serves as President of Fidelity Pricing and Cash Management Services (FPCMS) (2014-present) and as a Director of Strategic Advisers, Inc. (investment adviser firm, 2008-present). Previously, Mr. Galligan served as Chief Administrative Officer of Asset Management (2011-2014) and Chief Operating Officer and Senior Vice President of Investment Support for Strategic Advisers, Inc. (2003-2011).
Scott C. Goebel (1968)
Year of Election or Appointment: 2015
Vice President
Mr. Goebel serves as Vice President of other funds and is an employee of Fidelity Investments (2001-present). Previously, Mr. Goebel served as Secretary of Fidelity SelectCo, LLC (investment adviser firm, 2013-2015), Fidelity Investments Money Management, Inc. (FIMM) (investment adviser firm, 2010-2015), and Fidelity Research and Analysis Company (FRAC) (investment adviser firm, 2010-2015); General Counsel, Secretary, and Senior Vice President of Fidelity Management & Research Company (investment adviser firm, 2008-2015) and FMR Co., Inc. (investment adviser firm, 2008-2015); Assistant Secretary of Fidelity Management & Research (Japan) Limited (investment adviser firm, 2008-2015) and FMR Investment Management (U.K.) Limited (investment adviser firm, 2008-2015); Chief Legal Officer (CLO) of Fidelity Management & Research (Hong Kong) Limited (investment adviser firm, 2008-2015); Secretary and CLO of certain Fidelity® funds (2008-2015); Assistant Secretary of FIMM (2008-2010), FRAC (2008-2010), and certain funds (2007-2008); and as Vice President and Secretary of Fidelity Distributors Corporation (FDC) (2005-2007).
Brian B. Hogan (1964)
Year of Election or Appointment: 2009
Vice President
Mr. Hogan also serves as Trustee or Vice President of other funds. Mr. Hogan serves as a Director of Fidelity SelectCo, LLC (investment adviser firm, 2014-present) and President of the Equity Division of FMR (investment adviser firm, 2009-present). Previously, Mr. Hogan served as Senior Vice President, Equity Research of FMR (2006-2009) and as a portfolio manager.
Chris Maher (1972)
Year of Election or Appointment: 2013
Assistant Treasurer
Mr. Maher serves as Assistant Treasurer of other funds. Mr. Maher is Vice President of Valuation Oversight and is an employee of Fidelity Investments. Previously, Mr. Maher served as Vice President of Asset Management Compliance (2013), Vice President of the Program Management Group of FMR (investment adviser firm, 2010-2013), and Vice President of Valuation Oversight (2008-2010).
Kenneth B. Robins (1969)
Year of Election or Appointment: 2008
President and Treasurer
Mr. Robins also serves as an officer of other funds. Mr. Robins serves as Executive Vice President of Fidelity Investments Money Management, Inc. (FIMM) (investment adviser firm, 2013-present) and is an employee of Fidelity Investments (2004-present). Previously, Mr. Robins served in other fund officer roles.
Stacie M. Smith (1974)
Year of Election or Appointment: 2013
Deputy Treasurer
Ms. Smith also serves as an officer of other funds. She is an employee of Fidelity Investments (2009-present) and has served in other fund officer roles. Prior to joining Fidelity Investments, Ms. Smith served as Senior Audit Manager of Ernst & Young LLP (1996-2009).
Renee Stagnone (1975)
Year of Election or Appointment: 2013
Deputy Treasurer
Ms. Stagnone also serves as Deputy Treasurer of other funds. Ms. Stagnone is an employee of Fidelity Investments (1997-present).
Linda J. Wondrack (1964)
Year of Election or Appointment: 2014
Chief Compliance Officer
Ms. Wondrack also serves as Chief Compliance Officer of other funds. Ms. Wondrack is Executive Vice President and head of the Ethics Office and Asset Management Compliance for Fidelity Investments (2012-present). Ms. Wondrack also serves as Chief Compliance Officer of Fidelity SelectCo, LLC (investment adviser firm, 2014-present); Chief Compliance Officer of Impresa Management LLC (2013-present); and Chief Compliance Officer of FMR Co., Inc. (investment adviser firm), Fidelity Investments Money Management, Inc. (investment adviser firm), Fidelity Management & Research (Japan) Limited (investment adviser firm), FMR Investment Management (U.K.) Limited (investment adviser firm), Fidelity Management & Research (Hong Kong) (investment adviser firm), Fidelity Management & Research Company (investment adviser firm), FIAM LLC (investment adviser firm), and Strategic Advisers, Inc. (investment adviser firm), Ballyrock Investment Advisors LLC, and Northern Neck Investors LLC (2012-present). Previously, Ms. Wondrack served as Senior Vice President and Chief Compliance Officer for Columbia Management Investment Advisers, LLC (2005-2012); Chief Compliance Officer for certain funds within the Columbia Family of Funds (2007-2012); and Senior Vice President of Compliance Risk Management at Bank of America (2005-2010).
Joseph F. Zambello (1957)
Year of Election or Appointment: 2011
Deputy Treasurer
Mr. Zambello also serves as Deputy Treasurer of other funds. Mr. Zambello is an employee of Fidelity Investments (1991-present). Previously, Mr. Zambello served as Vice President of the Program Management Group of FMR (investment adviser firm, 2009-2011) and Vice President of the Transfer Agent Oversight Group (2005-2009).
Shareholder Expense Example
As a shareholder of the Fund, you incur two types of costs: (1) transaction costs, including sales charges (loads) on purchase payments or redemption proceeds, redemption fees and (2) ongoing costs, including management fees, distribution and/or service (12b-1) fees and other Fund expenses. This Example is intended to help you understand your ongoing costs (in dollars) of investing in the Fund and to compare these costs with the ongoing costs of investing in other mutual funds.
The Example is based on an investment of $1,000 invested at the beginning of the period and held for the entire period (May 1, 2015 to October 31, 2015).
Actual Expenses
The first line of the accompanying table for each class of the Fund provides information about actual account values and actual expenses. You may use the information in this line, together with the amount you invested, to estimate the expenses that you paid over the period. Simply divide your account value by $1,000.00 (for example, an $8,600 account value divided by $1,000.00 = 8.6), then multiply the result by the number in the first line for a class of the Fund under the heading entitled "Expenses Paid During Period" to estimate the expenses you paid on your account during this period. In addition, the Fund, as a shareholder in the underlying Fidelity Central Funds, will indirectly bear its pro-rata share of the fees and expenses incurred by the underlying Fidelity Central Funds. These fees and expenses are not included in the Fund's annualized expense ratio used to calculate the expense estimate in the table below.
Hypothetical Example for Comparison Purposes
The second line of the accompanying table for each class of the Fund provides information about hypothetical account values and hypothetical expenses based on a Class' actual expense ratio and an assumed rate of return of 5% per year before expenses, which is not the Class' actual return. The hypothetical account values and expenses may not be used to estimate the actual ending account balance or expenses you paid for the period. You may use this information to compare the ongoing costs of investing in the Fund and other funds. To do so, compare this 5% hypothetical example with the 5% hypothetical examples that appear in the shareholder reports of the other funds. In addition, the Fund, as a shareholder in the underlying Fidelity Central Funds, will indirectly bear its pro-rata share of the fees and expenses incurred by the underlying Fidelity Central Funds. These fees and expenses are not included in the Fund's annualized expense ratio used to calculate the expense estimate in the table below.
Please note that the expenses shown in the table are meant to highlight your ongoing costs only and do not reflect any transaction costs. Therefore, the second line of the table is useful in comparing ongoing costs only, and will not help you determine the relative total costs of owning different funds. In addition, if these transactional costs were included, your costs would have been higher.
| | Annualized Expense Ratio-A | Beginning
Account Value
May 1, 2015 | Ending
Account Value
October 31, 2015 | Expenses Paid
During Period-B
May 1, 2015
to October 31, 2015 |
| Class A | 1.21% | | | |
| Actual | | $1,000.00 | $963.60 | $5.99 |
| Hypothetical-C | | $1,000.00 | $1,019.11 | $6.16 |
| Class T | 1.47% | | | |
| Actual | | $1,000.00 | $962.30 | $7.27 |
| Hypothetical-C | | $1,000.00 | $1,017.80 | $7.48 |
| Class B | 2.03% | | | |
| Actual | | $1,000.00 | $959.70 | $10.03 |
| Hypothetical-C | | $1,000.00 | $1,014.97 | $10.31 |
| Class C | 1.96% | | | |
| Actual | | $1,000.00 | $960.00 | $9.68 |
| Hypothetical-C | | $1,000.00 | $1,015.32 | $9.96 |
| Class I | .94% | | | |
| Actual | | $1,000.00 | $965.10 | $4.66 |
| Hypothetical-C | | $1,000.00 | $1,020.47 | $4.79 |
| Class Z | .79% | | | |
| Actual | | $1,000.00 | $965.50 | $3.91 |
| Hypothetical-C | | $1,000.00 | $1,021.22 | $4.02 |
A Annualized expense ratio reflects expenses net of applicable fee waivers.
B Expenses are equal to each Class' annualized expense ratio, multiplied by the average account value over the period, multiplied by 184/365 (to reflect the one-half year period).
C 5% return per year before expenses
Distributions (Unaudited)
A percentage of the dividends distributed during the fiscal year for the following funds qualifies for the dividends–received deduction for corporate shareholders:
| | 12/05/2014 | 12/26/2014 |
| | | |
| Class A | 7% | 13% |
| Class T | 10% | 13% |
| Class B | – | 13% |
| Class C | 21% | 13% |
Class A designates 100%, Class T designates 100%, Class B designates 100%, and Class C designates 100% of the dividends distributed during the fiscal year as amounts which may be taken into account as a dividend for purposes of the maximum rate under section 1(h)(11) of the Internal Revenue Code.
The amounts per share which represent income derived from sources within, and taxes paid to, foreign countries or possessions of the United States are as follows:
| | Pay Date | Income | Taxes |
| Class A | 12/08/14 | $0.2197 | $0.0197 |
| | 12/29/14 | $0.0220 | $0.0000 |
| Class T | 12/08/14 | $0.1647 | $0.0197 |
| | 12/29/14 | $0.0220 | $0.0000 |
| Class B | 12/08/14 | $0.0000 | $0.0000 |
| | 12/29/14 | $0.0220 | $0.0000 |
| Class C | 12/08/14 | $0.0747 | $0.0197 |
| | 12/29/14 | $0.0220 | $0.0000 |
The fund will notify shareholders in January 2016 of amounts for use in preparing 2015 income tax returns.
Board Approval of Investment Advisory Contracts and Management Fees
Fidelity Advisor Diversified International Fund
Each year, the Board of Trustees, including the Independent Trustees (together, the Board), votes on the renewal of the management contract with Fidelity Management & Research Company (FMR) and the sub-advisory agreements (together, the Advisory Contracts) for the fund. The Board, assisted by the advice of fund counsel and Independent Trustees' counsel, requests and considers a broad range of information relevant to the renewal of the Advisory Contracts throughout the year.
The Board meets regularly and, at each of its meetings, covers an extensive agenda of topics and materials and considers factors that are relevant to its annual consideration of the renewal of the fund's Advisory Contracts, including the services and support provided to the fund and its shareholders. The Board has established various standing committees (Committees), each composed of and chaired by Independent Trustees with varying backgrounds, to which the Board has assigned specific subject matter responsibilities in order to enhance effective decision-making by the Board. The Board, acting directly and through its Committees, requests and receives information concerning the annual consideration of the renewal of the fund's Advisory Contracts. The Board also meets as needed to consider matters specifically related to the Board's annual consideration of the renewal of the Advisory Contracts. Members of the Board may also meet with trustees of other Fidelity funds through ad hoc joint committees to discuss certain matters relevant to all of the Fidelity funds.
At its July 2015 meeting, the Board unanimously determined to renew the fund's Advisory Contracts. In reaching its determination, the Board considered all factors it believed relevant, including (i) the nature, extent, and quality of the services to be provided to the fund and its shareholders (including the investment performance of the fund); (ii) the competitiveness of the fund's management fee and total expense ratio relative to peer funds; (iii) the total costs of the services to be provided by and the profits to be realized by Fidelity from its relationship with the fund; and (iv) the extent to which (if any) economies of scale exist and would be realized as the fund grows, and whether any economies of scale are appropriately shared with fund shareholders.
In considering whether to renew the Advisory Contracts for the fund, the Board reached a determination, with the assistance of fund counsel and Independent Trustees' counsel and through the exercise of its business judgment, that the renewal of the Advisory Contracts was in the best interests of the fund and its shareholders and that the compensation payable under the Advisory Contracts was fair and reasonable. The Board's decision to renew the Advisory Contracts was not based on any single factor, but rather was based on a comprehensive consideration of all the information provided to the Board at its meetings throughout the year. The Board, in reaching its determination to renew the Advisory Contracts, was aware that shareholders of the fund have a broad range of investment choices available to them, including a wide choice among funds offered by Fidelity's competitors, and that the fund's shareholders, who have the opportunity to review and weigh the disclosure provided by the fund in its prospectus and other public disclosures, have chosen to invest in this fund, which is part of the Fidelity family of funds.
Nature, Extent, and Quality of Services Provided. The Board considered Fidelity's staffing as it relates to the fund, including the backgrounds of investment personnel of Fidelity, and also considered the fund's investment objective, strategies, and related investment philosophy. The Independent Trustees also had discussions with senior management of Fidelity's investment operations and investment groups. The Board considered the structure of the portfolio manager compensation program and whether this structure provides appropriate incentives to act in the best interests of the fund. Additionally, the Board considered the portfolio managers' investments, if any, in the funds that they manage.
Resources Dedicated to Investment Management and Support Services. The Board and the Fund Oversight and Research Committees reviewed the general qualifications and capabilities of Fidelity's investment staff, including its size, education, experience, and resources, as well as Fidelity's approach to recruiting, training, managing, and compensating investment personnel. The Board noted that Fidelity has continued to increase the resources devoted to non-U.S. offices, including expansion of Fidelity's global investment organization. The Board also noted that Fidelity's analysts have extensive resources, tools and capabilities that allow them to conduct sophisticated quantitative and fundamental analysis, as well as credit analysis of issuers, counterparties and guarantors. Further, the Board considered that Fidelity's investment professionals have sufficient access to global information and data so as to provide competitive investment results over time, and that those professionals also have access to sophisticated tools that permit them to assess portfolio construction and risk and performance attribution characteristics continuously, as well as to transmit new information and research conclusions rapidly around the world. Additionally, in its deliberations, the Board considered Fidelity's trading, risk management, and compliance capabilities and resources, which are integral parts of the investment management process.
Shareholder and Administrative Services. The Board considered (i) the nature, extent, quality, and cost of advisory, administrative, and shareholder services performed by FMR, the sub-advisers (together with FMR, the Investment Advisers), and their affiliates under the Advisory Contracts and under separate agreements covering transfer agency, pricing and bookkeeping, and securities lending services for the fund; (ii) the nature and extent of the supervision of third party service providers, principally custodians and subcustodians; and (iii) the resources devoted to, and the record of compliance with, the fund's compliance policies and procedures. The Board also reviewed the allocation of fund brokerage, including allocations to brokers affiliated with the Investment Advisers, the use of brokerage commissions to pay fund expenses, and the use of "soft" commission dollars to pay for research services.
The Board noted that the growth of fund assets over time across the complex allows Fidelity to reinvest in the development of services designed to enhance the value or convenience of the Fidelity funds as investment vehicles. These services include 24-hour access to account information and market information through telephone representatives and over the Internet, investor education materials and asset allocation tools, and the expanded availability of Fidelity Investor Centers.
In 2014, the Board formed an ad hoc Committee on Transfer Agency Fees to review the variety of transfer agency fee structures throughout the industry and Fidelity's competitive positioning with respect to industry participants.
Investment in a Large Fund Family. The Board considered the benefits to shareholders of investing in a Fidelity fund, including the benefits of investing in a fund that is part of a large family of funds offering a variety of investment disciplines and providing a large variety of mutual fund investor services. The Board noted that Fidelity had taken, or had made recommendations that resulted in the Fidelity funds taking, a number of actions over the previous year that benefited particular funds, including (i) continuing to dedicate additional resources to investment research and to the support of the senior management team that oversees asset management; (ii) continuing efforts to enhance Fidelity's global research capabilities; (iii) launching new funds and making other enhancements to meet client needs; (iv) reducing management fees and total expenses for certain index funds and diversified international funds; (v) continuing to launch dedicated lower cost underlying funds to meet portfolio construction needs related to expanding underlying fund options for Fidelity funds of funds, specifically for the Freedom Fund product lines; (vi) rationalizing product lines and gaining increased efficiencies through fund mergers; (vii) launching active fixed-income exchange-traded funds; (viii) continuing to develop, acquire and implement systems and technology to improve services to the funds and information security and to increase efficiency; (ix) implementing investment enhancements to further strengthen Fidelity's target date product line to increase investors' probability of success in achieving their goals; (x) modifying the eligibility criteria for certain share classes to accommodate roll-over assets from employer-sponsored retirement plans; (xi) launching a new Class W of the Freedom Index Funds to attract and retain Fidelity record-kept retirement plan assets; and (xii) implementing changes to Fidelity's money market product line in response to recent money market regulatory reforms.
Investment Performance. The Board considered whether the fund has operated in accordance with its investment objective, as well as its record of compliance with its investment restrictions and its performance history. The Board noted that there was a portfolio management change for the fund in January 2014.
The Board took into account discussions with representatives of the Investment Advisers about fund investment performance that occur at Board meetings throughout the year. In this regard the Board noted that as part of regularly scheduled fund reviews and other reports to the Board on fund performance, the Board considers annualized return information for the fund, for different time periods, measured against a securities market index ("benchmark index") and a peer group of funds with similar objectives ("peer group"), if any. In its evaluation of fund investment performance, the Board gave particular attention to information indicating changes in performance of certain Fidelity funds for specific time periods and discussed with the Investment Advisers the reasons for any overperformance or underperformance.
In addition to reviewing absolute and relative fund performance, the Independent Trustees periodically consider the appropriateness of fund performance metrics in evaluating the results achieved. In general, the Independent Trustees believe that fund performance should be evaluated based on net performance (after fees and expenses) of both the highest performing and lowest performing fund share classes, where applicable, compared to appropriate benchmark indices, over appropriate time periods that may include full market cycles, and compared to peer groups, as applicable, over the same periods, taking into account relevant factors including the following: general market conditions; issuer-specific information; and fund cash flows and other factors.
The Independent Trustees recognize that shareholders evaluate performance on a net basis over their own holding periods, for which one-, three-, and five-year periods are often used as a proxy. For this reason, the performance information reviewed by the Board also included net cumulative calendar year total return information for the fund and an appropriate benchmark index and peer group for the most recent one-, three-, and five-year periods, as shown below. Returns are shown compared to the 25th percentile (top of box, 75% beaten) and 75th percentile (bottom of box, 25% beaten) of the peer universe. Returns of the benchmark index are "net MA,"
i.e., adjusted for tax withholding rates applicable to U.S.-based funds organized as Massachusetts business trusts.
Fidelity Advisor Diversified International Fund
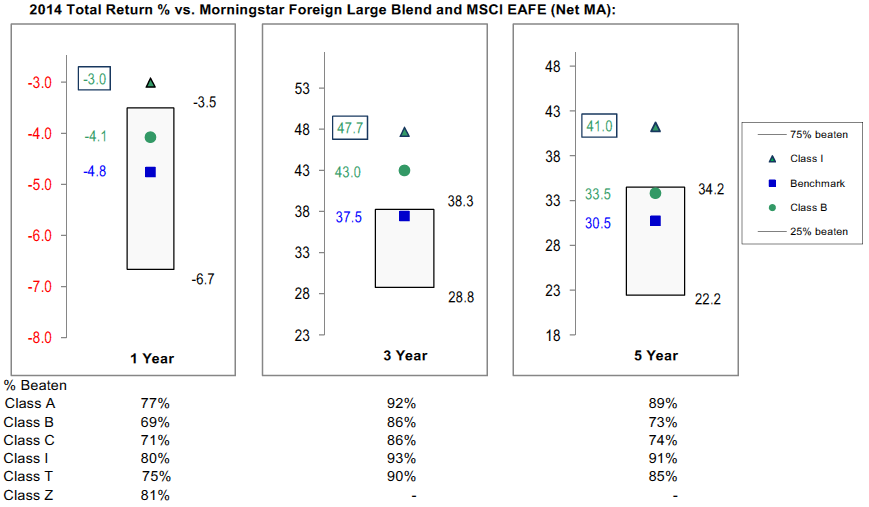
Based on its review, the Board concluded that the nature, extent, and quality of services provided to the fund under the Advisory Contracts should benefit the shareholders of the fund.
Competitiveness of Management Fee and Total Expense Ratio. The Board considered the fund's management fee and total expense ratio compared to "mapped groups" of competitive funds and classes created for the purpose of facilitating the Trustees' competitive analysis of management fees and total expenses. Fidelity creates "mapped groups" by combining similar Lipper investment objective categories that have comparable investment mandates. Combining Lipper investment objective categories aids the Board's management fee and total expense ratio comparisons by broadening the competitive group used for comparison.
Management Fee. The Board considered two proprietary management fee comparisons for the 12-month periods shown in basis points (BP) in the chart below. The group of Lipper funds used by the Board for management fee comparisons is referred to below as the "Total Mapped Group." The Total Mapped Group comparison focuses on a fund's standing in terms of gross management fees before expense reimbursements or caps relative to the total universe of funds with comparable investment mandates, regardless of whether their management fee structures also are comparable. Funds with comparable investment mandates offer exposure to similar types of securities. Funds with comparable management fee structures have similar management fee contractual arrangements (
e.g., flat rate charged for advisory services, all-inclusive fee rate,
etc.). "TMG %" represents the percentage of funds in the Total Mapped Group that had management fees that were lower than the fund's. For example, a hypothetical TMG % of 20% would mean that 80% of the funds in the Total Mapped Group had higher, and 20% had lower, management fees than the fund. The fund's actual TMG %s and the number of funds in the Total Mapped Group are in the chart below. The "Asset-Size Peer Group" (ASPG) comparison focuses on a fund's standing relative to a subset of non-Fidelity funds within the Total Mapped Group that are similar in size and management fee structure without taking into account performance adjustments, if any. For example, if a fund is in the first quartile of the ASPG, the fund's management fee ranks in the least expensive or lowest 25% of funds in the ASPG. The ASPG represents at least 15% of the funds in the Total Mapped Group with comparable asset size and management fee structures, subject to a minimum of 50 funds (or all funds in the Total Mapped Group if fewer than 50). Additional information, such as the ASPG quartile in which the fund's management fee rate ranked, is also included in the chart and considered by the Board.
Fidelity Advisor Diversified International Fund
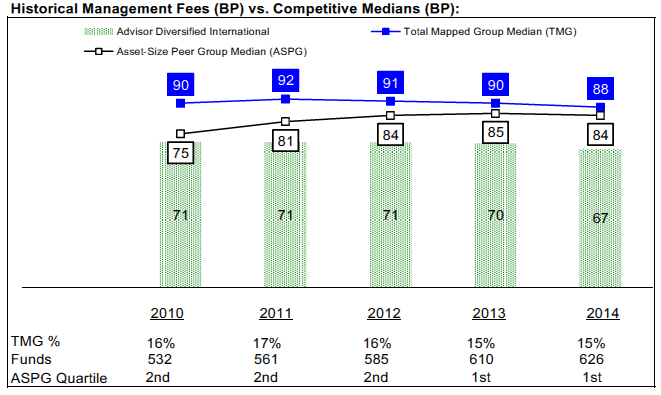
The Board noted that the fund's management fee rate ranked below the median of its Total Mapped Group and below the median of its ASPG for 2014.
Furthermore, the Board considered that it had approved a reduction (effective August 1, 2014) in the individual fund fee rate component of the management fee rate for the fund from 0.450% to 0.424%. The Board considered that the chart reflects the fund's lower management fee for 2014, as if the lower fee were in effect for the entire year.
The Board noted that, in 2014, the ad hoc Committee on Group Fee was formed by it and other Fidelity fund boards to conduct an in-depth review of the "group fee" component of the management fee of funds with such management fee structures. Committee focus included the mechanics of the group fee, the competitive landscape of group fee structures, Fidelity funds with no group fee component and investment products not included in group fee assets. The Board also considered that, for funds subject to the group fee, FMR agreed to voluntarily waive fees over a specified period of time in amounts designed to account for assets converted from certain funds to certain collective investment trusts.
The Board also noted that, in 2013, the ad hoc Committee on Management Fees was formed to conduct an in-depth review of the management fee rates of Fidelity's active equity mutual funds. The Committee focused on the following areas: (i) standard fee structures; (ii) research consumption and trading evolution; (iii) management fee competitiveness/profitability by category; and (iv) factors that drive institutional pricing.
Based on its review, the Board concluded that the fund's management fee is fair and reasonable in light of the services that the fund receives and the other factors considered.
Total Expense Ratio. In its review of each class's total expense ratio, the Board considered the fund's management fee as well as other fund or class expenses, as applicable, such as transfer agent fees, pricing and bookkeeping fees, fund-paid 12b-1 fees, and custodial, legal, and audit fees. The Board also noted that Fidelity may agree to waive fees and expenses from time to time, and the extent to which, if any, it has done so for the fund. As part of its review, the Board also considered the current and historical total expense ratios of each class of the fund compared to competitive fund median expenses. Each class of the fund is compared to those funds and classes in the Total Mapped Group (used by the Board for management fee comparisons) that have a similar sales load structure.
The Board noted that the total expense ratio of each of Class A, Class B, Class C, Class I, and Class Z ranked below its competitive median for 2014 and the total expense ratio of Class T ranked above its competitive median for 2014. The Board considered that, in general, various factors can affect total expense ratios. The Board noted that the total expense ratio of Class T was above the competitive median primarily because of higher 12b-1 fees on Class T as compared to most competitor funds. Class T has a higher 12b-1 fee, but a lower front-end sales charge, than traditionally priced front-end sales charge classes. The Board considered that Class T is primarily sold load-waived in the retirement plan market where its 0.50% 12b-1 fee is comparable to competing no-load, higher 12b-1 fee classes designed specifically for retirement plans. The Board noted that the fund offers multiple classes, each of which has a different sales load and 12b1 fee structure, and that the multiple structures are intended to offer a range of pricing options for the intermediary market. The Board also noted that the total expense ratios of the classes vary primarily by the level of their 12b1 fees, although differences in transfer agent fees may also cause expenses to vary from class to class.
Fees Charged to Other Fidelity Clients. The Board also considered Fidelity fee structures and other information with respect to clients of Fidelity, such as other funds advised or subadvised by Fidelity, pension plan clients, and other institutional clients with similar mandates. The Board noted the findings of the 2013 ad hoc joint committee (created with the board of other Fidelity funds), which reviewed and compared Fidelity's institutional investment advisory business with its business of providing services to the Fidelity funds, including the differences in services provided, fees charged, and costs incurred, as well as competition in their respective marketplaces.
Based on its review of total expense ratios and fees charged to other Fidelity clients, the Board concluded that, although Class T was above the median of the universe presented for comparison, the total expense ratio of each class of the fund was reasonable in light of the services that the fund and its shareholders receive and the other factors considered.
Costs of the Services and Profitability. The Board considered the revenues earned and the expenses incurred by Fidelity in conducting the business of developing, marketing, distributing, managing, administering and servicing the fund and servicing the fund's shareholders. The Board also considered the level of Fidelity's profits in respect of all the Fidelity funds.
On an annual basis, Fidelity presents to the Board information about the profitability of its relationship with the fund. Fidelity calculates profitability information for each fund, as well as aggregate profitability information for groups of Fidelity funds and all Fidelity funds, using a series of detailed revenue and cost allocation methodologies which originate with the books and records of Fidelity on which Fidelity's audited financial statements are based. The Audit Committee of the Board reviews any significant changes from the prior year's methodologies.
PricewaterhouseCoopers LLP (PwC), independent registered public accounting firm and auditor to Fidelity and certain Fidelity funds, has been engaged annually by the Board as part of the Board's assessment of Fidelity's profitability analysis. PwC's engagement includes the review and assessment of the methodologies used by Fidelity in determining the revenues and expenses attributable to Fidelity's mutual fund business, and completion of agreed-upon procedures in respect of the mathematical accuracy of fund profitability and its conformity to established allocation methodologies. After considering PwC's reports issued under the engagement and information provided by Fidelity, the Board concluded that while other allocation methods may also be reasonable, Fidelity's profitability methodologies are reasonable in all material respects.
The Board also reviewed Fidelity's non-fund businesses and fall-out benefits related to the mutual fund business as well as cases where Fidelity's affiliates may benefit from or be related to the fund's business.
The Board considered the costs of the services provided by and the profits realized by Fidelity in connection with the operation of the fund and was satisfied that the profitability was not excessive.
Economies of Scale. The Board considered whether there have been economies of scale in respect of the management of the Fidelity funds, whether the Fidelity funds (including the fund) have appropriately benefited from any such economies of scale, and whether there is potential for realization of any further economies of scale. The Board considered the extent to which the fund will benefit from economies of scale as assets grow through increased services to the fund, through waivers or reimbursements, or through fee or expense ratio reductions. The Board also noted that in 2013, it and the boards of other Fidelity funds created an ad hoc committee (the Economies of Scale Committee) to analyze whether Fidelity attains economies of scale in respect of the management and servicing of the Fidelity funds, whether the Fidelity funds have appropriately benefited from such economies of scale, and whether there is potential for realization of any further economies of scale.
The Board recognized that the fund's management contract incorporates a "group fee" structure, which provides for lower group fee rates as total group assets increase, and for higher group fee rates as total group assets decrease (with "group assets" defined to include fund assets under FMR's management plus sector fund assets previously under FMR's management and currently managed by Fidelity SelectCo, LLC). FMR calculates the group fee rates based on a tiered asset "breakpoint" schedule that varies based on asset class. The Board considered that the group fee is designed to deliver the benefits of economies of scale to fund shareholders when total Fidelity fund assets increase, even if assets of any particular fund are unchanged or have declined, because some portion of Fidelity's costs are attributable to services provided to all Fidelity funds, and all funds benefit if those costs can be allocated among more assets. The Board concluded that, given the group fee structure, fund shareholders will benefit from lower management fees as group assets increase at the fund complex level, regardless of whether Fidelity achieves any such economies of scale.
The Board concluded, taking into account the analysis of the Economies of Scale Committee, that economies of scale, if any, are being appropriately shared between fund shareholders and Fidelity.
Additional Information Requested by the Board. In order to develop fully the factual basis for consideration of the Fidelity funds' Advisory Contracts, the Board requested and received additional information on certain topics, including: (i) fund performance trends and Fidelity's long-term strategies for certain funds; (ii) the various share classes employed by Fidelity and the attributes of each class, together with similar information on the distribution and servicing payments made by Fidelity or the funds to third-party participants in the distribution channels; (iii) fund profitability, and fund performance in relation to fund profitability; (iv) the methodology with respect to evaluating competitive fund data and peer group classifications and fee comparisons; (v) annual fund profitability margins, with particular focus on certain funds with negative margins; (vi) the realization of fall-out benefits in certain Fidelity business units;
(vii) economies of scale and the way in which they are shared with fund shareholders;(viii) Fidelity's group fee structures, including the group fee schedule of breakpoints;(ix) the impact of cost containment measures on the funds; and (x) the transfer agent fee structure.
Based on its evaluation of all of the conclusions noted above, and after considering all factors it believed relevant, the Board concluded that the advisory fee structures are fair and reasonable, and that the fund's Advisory Contracts should be renewed.

ADIF-ANN-1215
1.728709.116
Fidelity Advisor® Diversified International Fund Class I (formerly Institutional Class)
Annual Report October 31, 2015 |
|
Contents
To view a fund's proxy voting guidelines and proxy voting record for the 12-month period ended June 30, visit http://www.fidelity.com/proxyvotingresults or visit the Securities and Exchange Commission's (SEC) web site at http://www.sec.gov.
You may also call 1-877-208-0098 to request a free copy of the proxy voting guidelines.
Standard & Poor's, S&P and S&P 500 are registered service marks of The McGraw-Hill Companies, Inc. and have been licensed for use by Fidelity Distributors Corporation.
Other third-party marks appearing herein are the property of their respective owners.
All other marks appearing herein are registered or unregistered trademarks or service marks of FMR LLC or an affiliated company. © 2015 FMR LLC. All rights reserved.
This report and the financial statements contained herein are submitted for the general information of the shareholders of the Fund. This report is not authorized for distribution to prospective investors in the Fund unless preceded or accompanied by an effective prospectus.
A fund files its complete schedule of portfolio holdings with the SEC for the first and third quarters of each fiscal year on Form N-Q. Forms N-Q are available on the SEC’s web site at http://www.sec.gov. A fund's Forms N-Q may be reviewed and copied at the SEC’s Public Reference Room in Washington, DC. Information regarding the operation of the SEC's Public Reference Room may be obtained by calling 1-800-SEC-0330.
For a complete list of a fund's portfolio holdings, view the most recent holdings listing, semiannual report, or annual report on Fidelity's web site at http://www.fidelity.com, http://www.advisor.fidelity.com, or http://www.401k.com, as applicable.
NOT FDIC INSURED •MAY LOSE VALUE •NO BANK GUARANTEE
Neither the Fund nor Fidelity Distributors Corporation is a bank.
Performance: The Bottom Line
Average annual total return reflects the change in the value of an investment, assuming reinvestment of distributions from dividend income and capital gains (the profits earned upon the sale of securities that have grown in value, if any) and assuming a constant rate of performance each year.
The hypothetical investment and the average annual total returns do not reflect the deduction of taxes that a shareholder would pay on fund distributions or the redemption of fund shares.
During periods of reimbursement by Fidelity, a fund’s total return will be greater than it would be had the reimbursement not occurred.
How a fund did yesterday is no guarantee of how it will do tomorrow.
Average Annual Total Returns
| For the periods ended October 31, 2015 | Past 1 year | Past 5 years | Past 10 years |
| Class I | 4.24% | 7.06% | 4.22% |
$10,000 Over 10 Years
Let's say hypothetically that $10,000 was invested in Fidelity Advisor® Diversified International Fund - Class I on October 31, 2005.
The chart shows how the value of your investment would have changed, and also shows how the MSCI EAFE Index performed over the same period.

| Period Ending Values |
| $15,124 | Fidelity Advisor® Diversified International Fund - Class I |
| $15,102 | MSCI EAFE Index |
Management's Discussion of Fund Performance
Market Recap: International equities suffered a setback for the 12 months ending October 31, 2015, held back by a collapse in commodities prices that hurt resources-related sectors and geographies. The MSCI ACWI (All Country World Index) ex USA Index returned -4.55% for the period, affected also by concerns about global economic growth. Commodity producers remained under pressure for much of the past year, largely related to economic deceleration in China (-1%), the world’s second-largest economy and a leading consumer of raw materials. This effect was exacerbated by U.S. dollar strength relative to global currencies, which weighed on commodities priced in dollars and acutely impacted equity returns within regions most exposed to resources prices. The emerging-markets group, for example, returned about -15% this period. Canada, a significant energy producer, returned roughly -17%. Net energy consumer Japan (+9%) was the best-performing region by far. Only about a quarter of the nearly 50 index countries managed a gain this period: Ireland (+19%) – the EU’s fastest-growing economy – and Israel (+17%) proved top performers; Greece (-56%) and Brazil (-46%), among the worst. As for sectors, energy (-25%) and materials (-16%) declined sharply, whereas the two consumer sectors each gained about 6%.
Comments from Portfolio Manager William Bower: For the year, the fund’s share classes (excluding sales charges, if applicable) substantially outpaced the 0.08% result of the MSCI EAFE Index. Results versus the benchmark were affected by a downward fair-value pricing adjustment of -0.66 percentage points. Both stock selection and sector allocation helped the fund’s outperformance. Stock picks in the financials sector proved particularly beneficial, as did an overweighting in information technology and an underweighting in energy – avoidance of Royal Dutch Shell in particular. Positioning in the industrials and telecommunication services sectors were the fund's only overall sector negatives. From a geographical perspective, picks in Europe and the U.K. helped most, along with positioning in Asia Pacific ex Japan. An underweighting in Japan and unfavorable stock selection in the out-of-index emerging markets group detracted most. Among individual stocks, an overweighting in multinational cable and telecommunications provider Altice headed the list both of contributors and of detractors, blending to a net positive. After a strong run-up during the period, Altice changed its corporate structure and split its stock into two newly formed share classes, both of which declined in value. An overweighting in ORIX and a stake in out-of-index Alimentation Couche-Tard helped; gaming stocks Sands China and Melco Crown Entertainment detracted. The fund reduced its holdings in Sands China and eliminated Melco Crown. At period end, the fund remains positioned for a slow-growth world.
The views expressed above reflect those of the portfolio manager(s) only through the end of the period as stated on the cover of this report and do not necessarily represent the views of Fidelity or any other person in the Fidelity organization. Any such views are subject to change at any time based upon market or other conditions and Fidelity disclaims any responsibility to update such views. These views may not be relied on as investment advice and, because investment decisions for a Fidelity fund are based on numerous factors, may not be relied on as an indication of trading intent on behalf of any Fidelity fund.
Investment Summary (Unaudited)
Top Five Stocks as of October 31, 2015
| | % of fund's net assets | % of fund's net assets 6 months ago |
| Novo Nordisk A/S Series B (Denmark, Pharmaceuticals) | 1.9 | 1.9 |
| ORIX Corp. (Japan, Diversified Financial Services) | 1.8 | 1.8 |
| Anheuser-Busch InBev SA NV (Belgium, Beverages) | 1.6 | 1.8 |
| Bayer AG (Germany, Pharmaceuticals) | 1.5 | 1.5 |
| Sanofi SA (France, Pharmaceuticals) | 1.4 | 1.2 |
| | 8.2 | |
Top Five Market Sectors as of October 31, 2015
| | % of fund's net assets | % of fund's net assets 6 months ago |
| Financials | 21.4 | 21.4 |
| Health Care | 17.4 | 16.8 |
| Consumer Discretionary | 16.1 | 17.5 |
| Consumer Staples | 12.3 | 11.2 |
| Information Technology | 12.3 | 13.0 |
Top Five Countries as of October 31, 2015
| (excluding cash equivalents) | % of fund's net assets | % of fund's net assets 6 months ago |
| United Kingdom | 18.2 | 17.7 |
| Japan | 14.5 | 16.0 |
| Germany | 7.6 | 6.6 |
| United States of America | 7.3 | 7.0 |
| Switzerland | 4.7 | 4.6 |
Percentages are adjusted for the effect of open futures contracts, if applicable.
Asset Allocation (% of fund's net assets)
| As of October 31, 2015 |
| | Stocks and Equity Futures | 95.2% |
| | Other Investments | 0.1% |
| | Short-Term Investments and Net Other Assets (Liabilities) | 4.7% |

| As of April 30, 2015 |
| | Stocks and Equity Futures | 97.1% |
| | Other Investments | 0.1% |
| | Short-Term Investments and Net Other Assets (Liabilities) | 2.8% |

Investments October 31, 2015
Showing Percentage of Net Assets
| Common Stocks - 93.7% | | | |
| | | Shares | Value (000s) |
| Australia - 0.9% | | | |
| Ansell Ltd. | | 258,534 | $3,679 |
| Australia & New Zealand Banking Group Ltd. | | 628,447 | 12,154 |
| CSL Ltd. | | 23,957 | 1,592 |
|
| TOTAL AUSTRALIA | | | 17,425 |
|
| Austria - 0.3% | | | |
| Andritz AG | | 52,900 | 2,664 |
| Zumtobel AG | | 134,400 | 3,059 |
|
| TOTAL AUSTRIA | | | 5,723 |
|
| Bailiwick of Jersey - 2.2% | | | |
| Integrated Diagnostics Holdings PLC (a) | | 164,400 | 906 |
| Shire PLC | | 255,300 | 19,334 |
| Wolseley PLC | | 232,408 | 13,645 |
| WPP PLC | | 445,924 | 9,996 |
|
| TOTAL BAILIWICK OF JERSEY | | | 43,881 |
|
| Belgium - 2.5% | | | |
| Anheuser-Busch InBev SA NV | | 274,331 | 32,734 |
| Fagron NV | | 50,400 | 1,238 |
| KBC Groep NV | | 272,295 | 16,588 |
|
| TOTAL BELGIUM | | | 50,560 |
|
| Canada - 3.6% | | | |
| Agrium, Inc. | | 44,300 | 4,121 |
| Alimentation Couche-Tard, Inc. Class B (sub. vtg.) | | 421,300 | 18,123 |
| Canadian Energy Services & Technology Corp. (b) | | 223,800 | 967 |
| CGI Group, Inc. Class A (sub. vtg.) (a) | | 326,100 | 12,113 |
| Constellation Software, Inc. | | 26,400 | 11,407 |
| Entertainment One Ltd. | | 299,433 | 1,014 |
| Fairfax India Holdings Corp. (a) | | 494,000 | 5,187 |
| Imperial Oil Ltd. | | 105,900 | 3,524 |
| Keyera Corp. (b) | | 98,200 | 3,030 |
| PrairieSky Royalty Ltd. | | 38,000 | 748 |
| Suncor Energy, Inc. | | 274,400 | 8,165 |
| Tourmaline Oil Corp. (a) | | 171,500 | 3,569 |
|
| TOTAL CANADA | | | 71,968 |
|
| Cayman Islands - 1.7% | | | |
| 58.com, Inc. ADR (a) | | 43,400 | 2,278 |
| Alibaba Group Holding Ltd. sponsored ADR (a) | | 146,000 | 12,239 |
| Baidu.com, Inc. sponsored ADR (a) | | 34,600 | 6,486 |
| China Modern Dairy Holdings Ltd. (b) | | 5,945,000 | 1,788 |
| Lee's Pharmaceutical Holdings Ltd. | | 1,208,500 | 1,560 |
| PW Medtech Group Ltd. (a)(b) | | 5,174,000 | 1,082 |
| Regina Miracle International Holdings Ltd. | | 1,962,558 | 1,779 |
| Sands China Ltd. | | 976,400 | 3,516 |
| Vipshop Holdings Ltd. ADR (a) | | 154,000 | 3,160 |
|
| TOTAL CAYMAN ISLANDS | | | 33,888 |
|
| China - 0.7% | | | |
| Inner Mongoli Yili Industries Co. Ltd. | | 987,208 | 2,483 |
| Kweichow Moutai Co. Ltd. | | 175,010 | 5,909 |
| Qingdao Haier Co. Ltd. | | 3,912,122 | 5,956 |
| Weifu High-Technology Co. Ltd. (B Shares) | | 206,200 | 526 |
|
| TOTAL CHINA | | | 14,874 |
|
| Curacao - 0.4% | | | |
| Schlumberger Ltd. | | 93,200 | 7,285 |
| Denmark - 2.6% | | | |
| Genmab A/S (a) | | 114,600 | 11,304 |
| NNIT A/S | | 132,887 | 3,057 |
| Novo Nordisk A/S Series B | | 712,640 | 37,845 |
|
| TOTAL DENMARK | | | 52,206 |
|
| Finland - 0.3% | | | |
| Sampo Oyj (A Shares) | | 113,300 | 5,542 |
| France - 3.9% | | | |
| Accor SA | | 85,369 | 4,247 |
| Air Liquide SA | | 60,260 | 7,813 |
| AXA SA | | 486,600 | 12,986 |
| BNP Paribas SA | | 53,743 | 3,266 |
| Capgemini SA | | 46,900 | 4,179 |
| Danone SA | | 87,747 | 6,098 |
| Publicis Groupe SA | | 106,810 | 6,937 |
| Sanofi SA | | 290,858 | 29,341 |
| VINCI SA | | 45,600 | 3,078 |
| Zodiac Aerospace | | 56,500 | 1,429 |
|
| TOTAL FRANCE | | | 79,374 |
|
| Germany - 6.7% | | | |
| adidas AG | | 83,390 | 7,473 |
| Bayer AG | | 224,952 | 30,018 |
| Brenntag AG | | 75,600 | 4,568 |
| Continental AG | | 45,800 | 11,015 |
| Deutsche Boerse AG | | 49,200 | 4,531 |
| Deutsche Post AG | | 136,001 | 4,040 |
| Fresenius SE & Co. KGaA | | 338,000 | 24,837 |
| KION Group AG | | 108,500 | 4,893 |
| Linde AG | | 9,947 | 1,726 |
| OSRAM Licht AG | | 214,794 | 12,639 |
| ProSiebenSat.1 Media AG | | 254,000 | 13,739 |
| SAP AG | | 119,272 | 9,403 |
| Symrise AG | | 110,100 | 7,252 |
|
| TOTAL GERMANY | | | 136,134 |
|
| Hong Kong - 1.8% | | | |
| AIA Group Ltd. | | 4,847,600 | 28,423 |
| China Resources Beer Holdings Co. Ltd. | | 1,306,000 | 2,466 |
| Hang Seng Bank Ltd. | | 139,800 | 2,565 |
| Techtronic Industries Co. Ltd. | | 925,000 | 3,382 |
|
| TOTAL HONG KONG | | | 36,836 |
|
| India - 3.1% | | | |
| Apollo Hospitals Enterprise Ltd. (a) | | 155,738 | 3,122 |
| Axis Bank Ltd. (a) | | 599,285 | 4,340 |
| Bharti Infratel Ltd. | | 1,109,288 | 6,588 |
| Edelweiss Financial Services Ltd. | | 2,655,200 | 2,410 |
| Exide Industries Ltd. (a) | | 1,136,771 | 2,593 |
| HCL Technologies Ltd. | | 249,980 | 3,327 |
| HDFC Bank Ltd. (a) | | 793,748 | 15,920 |
| Housing Development Finance Corp. Ltd. | | 635,436 | 12,172 |
| ITC Ltd. | | 1,229,144 | 6,277 |
| Just Dial Ltd. | | 195,017 | 2,386 |
| LIC Housing Finance Ltd. (a) | | 274,208 | 2,002 |
| Pidilite Industries Ltd. (a) | | 241,934 | 2,075 |
|
| TOTAL INDIA | | | 63,212 |
|
| Indonesia - 0.4% | | | |
| PT Bank Central Asia Tbk | | 4,594,100 | 4,316 |
| PT Bank Rakyat Indonesia Tbk | | 6,106,100 | 4,673 |
|
| TOTAL INDONESIA | | | 8,989 |
|
| Ireland - 3.2% | | | |
| Allergan PLC (a) | | 64,300 | 19,835 |
| DCC PLC (United Kingdom) | | 71,500 | 5,737 |
| Greencore Group PLC | | 994,821 | 4,632 |
| Horizon Pharma PLC (a) | | 184,300 | 2,897 |
| Kerry Group PLC Class A | | 97,100 | 7,896 |
| Medtronic PLC | | 121,000 | 8,944 |
| Ryanair Holdings PLC sponsored ADR | | 184,860 | 14,454 |
|
| TOTAL IRELAND | | | 64,395 |
|
| Isle of Man - 0.6% | | | |
| Optimal Payments PLC (a) | | 1,284,533 | 6,020 |
| Playtech Ltd. | | 406,983 | 5,371 |
|
| TOTAL ISLE OF MAN | | | 11,391 |
|
| Israel - 1.7% | | | |
| Cellcom Israel Ltd. (Israel) (a) | | 486,900 | 3,624 |
| Check Point Software Technologies Ltd. (a) | | 120,100 | 10,201 |
| Partner Communications Co. Ltd. (a) | | 162,104 | 736 |
| Teva Pharmaceutical Industries Ltd. sponsored ADR | | 351,100 | 20,782 |
|
| TOTAL ISRAEL | | | 35,343 |
|
| Italy - 1.0% | | | |
| Intesa Sanpaolo SpA | | 3,501,400 | 12,198 |
| Mediaset SpA | | 851,100 | 4,324 |
| World Duty Free SpA (a) | | 419,842 | 4,737 |
|
| TOTAL ITALY | | | 21,259 |
|
| Japan - 14.5% | | | |
| Ain Holdings, Inc. | | 77,700 | 3,678 |
| Astellas Pharma, Inc. | | 1,379,600 | 20,024 |
| Daiichikosho Co. Ltd. | | 74,400 | 2,481 |
| Dentsu, Inc. | | 162,100 | 9,113 |
| Don Quijote Holdings Co. Ltd. | | 177,700 | 6,528 |
| Fast Retailing Co. Ltd. | | 20,700 | 7,561 |
| Glory Ltd. | | 98,100 | 2,482 |
| Hoya Corp. | | 677,700 | 27,966 |
| Japan Exchange Group, Inc. | | 665,400 | 10,707 |
| Japan Tobacco, Inc. | | 474,700 | 16,430 |
| KDDI Corp. | | 622,700 | 15,068 |
| Keyence Corp. | | 38,800 | 20,200 |
| Minebea Ltd. | | 120,000 | 1,322 |
| Misumi Group, Inc. | | 104,400 | 1,360 |
| Mitsubishi UFJ Financial Group, Inc. | | 4,002,100 | 25,884 |
| NGK Spark Plug Co. Ltd. | | 139,300 | 3,400 |
| Nitori Holdings Co. Ltd. | | 75,400 | 5,880 |
| Olympus Corp. | | 132,300 | 4,463 |
| OMRON Corp. | | 31,400 | 1,040 |
| ORIX Corp. | | 2,497,200 | 36,469 |
| Rakuten, Inc. | | 1,226,300 | 16,988 |
| Seven & i Holdings Co. Ltd. | | 129,500 | 5,883 |
| SHIMANO, Inc. | | 54,800 | 8,635 |
| Shinsei Bank Ltd. | | 2,310,000 | 4,844 |
| SoftBank Corp. | | 226,100 | 12,668 |
| Sundrug Co. Ltd. | | 100 | 5 |
| Suzuki Motor Corp. | | 167,000 | 5,468 |
| TDK Corp. | | 52,000 | 3,312 |
| Tsuruha Holdings, Inc. | | 127,100 | 10,069 |
| VT Holdings Co. Ltd. | | 437,600 | 2,706 |
| Welcia Holdings Co. Ltd. | | 18,200 | 897 |
|
| TOTAL JAPAN | | | 293,531 |
|
| Korea (South) - 0.2% | | | |
| Orion Corp. | | 5,836 | 4,907 |
| Luxembourg - 0.7% | | | |
| Eurofins Scientific SA | | 36,500 | 13,215 |
| Netherlands - 3.7% | | | |
| AEGON NV | | 666,600 | 4,091 |
| AerCap Holdings NV (a) | | 94,200 | 3,909 |
| Altice NV: | | | |
| Class A (a) | | 566,110 | 9,805 |
| Class B (a) | | 231,909 | 4,119 |
| Gree Electric Appliances, Inc. ELS (BNP Paribas Arbitrage Warrant Program) warrants 12/10/15 (c) | | 144,800 | 395 |
| IMCD Group BV | | 135,500 | 5,069 |
| ING Groep NV (Certificaten Van Aandelen) | | 883,700 | 12,861 |
| NXP Semiconductors NV (a) | | 21,500 | 1,685 |
| RELX NV | | 655,099 | 11,202 |
| Unilever NV (Certificaten Van Aandelen) (Bearer) | | 490,300 | 22,170 |
|
| TOTAL NETHERLANDS | | | 75,306 |
|
| Philippines - 0.2% | | | |
| Alliance Global Group, Inc. | | 12,852,154 | 4,993 |
| Singapore - 0.4% | | | |
| Avago Technologies Ltd. | | 16,700 | 2,056 |
| United Overseas Bank Ltd. | | 426,100 | 6,187 |
|
| TOTAL SINGAPORE | | | 8,243 |
|
| South Africa - 1.2% | | | |
| EOH Holdings Ltd. | | 427,200 | 4,723 |
| Naspers Ltd. Class N | | 132,300 | 19,378 |
|
| TOTAL SOUTH AFRICA | | | 24,101 |
|
| Spain - 1.9% | | | |
| Amadeus IT Holding SA Class A | | 257,400 | 10,971 |
| Hispania Activos Inmobiliarios SA (a) | | 207,200 | 3,122 |
| Inditex SA | | 649,055 | 24,342 |
|
| TOTAL SPAIN | | | 38,435 |
|
| Sweden - 2.4% | | | |
| ASSA ABLOY AB (B Shares) | | 301,800 | 6,004 |
| Coor Service Management Holding AB (a) | | 445,200 | 1,819 |
| HEXPOL AB (B Shares) | | 151,200 | 1,472 |
| Nordea Bank AB | | 1,101,000 | 12,178 |
| Sandvik AB | | 271,200 | 2,536 |
| Svenska Cellulosa AB (SCA) (B Shares) | | 585,900 | 17,257 |
| Svenska Handelsbanken AB (A Shares) | | 560,400 | 7,611 |
|
| TOTAL SWEDEN | | | 48,877 |
|
| Switzerland - 4.7% | | | |
| Actelion Ltd. | | 58,435 | 8,123 |
| Compagnie Financiere Richemont SA Series A | | 91,376 | 7,835 |
| Credit Suisse Group AG (d) | | 288,213 | 6,633 |
| GAM Holding Ltd. | | 84,407 | 1,546 |
| Roche Holding AG (participation certificate) | | 80,592 | 21,881 |
| Sika AG (Bearer) | | 2,320 | 7,614 |
| Syngenta AG (Switzerland) | | 66,171 | 22,231 |
| UBS Group AG | | 922,263 | 18,456 |
|
| TOTAL SWITZERLAND | | | 94,319 |
|
| Taiwan - 1.0% | | | |
| Taiwan Semiconductor Manufacturing Co. Ltd. sponsored ADR | | 926,800 | 20,353 |
| Thailand - 0.2% | | | |
| Kasikornbank PCL (For. Reg.) | | 837,400 | 4,051 |
| United Kingdom - 18.2% | | | |
| AA PLC | | 502,320 | 2,144 |
| Al Noor Hospitals Group PLC | | 275,700 | 4,998 |
| Associated British Foods PLC | | 175,100 | 9,326 |
| B&M European Value Retail S.A. | | 1,969,499 | 10,123 |
| Barclays PLC | | 2,393,576 | 8,528 |
| BG Group PLC | | 1,008,869 | 15,939 |
| British American Tobacco PLC sponsored ADR | | 103,200 | 12,188 |
| British Land Co. PLC | | 165,514 | 2,221 |
| BT Group PLC | | 2,052,100 | 14,655 |
| Bunzl PLC | | 146,400 | 4,196 |
| Capita Group PLC | | 266,100 | 5,230 |
| Compass Group PLC | | 542,400 | 9,324 |
| Diploma PLC | | 401,600 | 3,972 |
| Essentra PLC | | 1,159,700 | 15,053 |
| Exova Group Ltd. PLC | | 516,300 | 1,184 |
| Hikma Pharmaceuticals PLC | | 219,418 | 7,320 |
| Howden Joinery Group PLC | | 87,500 | 625 |
| HSBC Holdings PLC sponsored ADR | | 69,097 | 2,700 |
| IMI PLC | | 189,700 | 2,787 |
| Imperial Tobacco Group PLC | | 211,895 | 11,430 |
| Indivior PLC | | 864,100 | 2,739 |
| ITV PLC | | 3,635,100 | 14,144 |
| Johnson Matthey PLC | | 117,300 | 4,674 |
| JUST EAT Ltd. (a) | | 170,300 | 1,118 |
| Liberty Global PLC: | | | |
| Class A (a) | | 143,600 | 6,393 |
| Class C (a) | | 61,400 | 2,618 |
| LiLAC Class A (a) | | 5,925 | 229 |
| LiLAC Class C (a) | | 2,435 | 94 |
| Lloyds Banking Group PLC | | 24,688,900 | 28,022 |
| London Stock Exchange Group PLC | | 193,900 | 7,607 |
| Meggitt PLC | | 460,741 | 2,512 |
| Melrose PLC | | 604,900 | 2,482 |
| Micro Focus International PLC | | 538,200 | 10,421 |
| Next PLC | | 165,600 | 20,423 |
| Poundland Group PLC | | 1,221,232 | 5,177 |
| Prudential PLC | | 1,065,313 | 24,882 |
| Reckitt Benckiser Group PLC | | 191,113 | 18,651 |
| Rolls-Royce Group PLC | | 619,700 | 6,553 |
| Royal Bank of Scotland Group PLC (a) | | 699,900 | 3,420 |
| SABMiller PLC | | 188,000 | 11,578 |
| Schroders PLC | | 132,100 | 6,075 |
| Sophos Group PLC (a) | | 772,766 | 3,063 |
| Spectris PLC | | 150,900 | 3,878 |
| Sports Direct International PLC (a) | | 459,400 | 4,936 |
| St. James's Place Capital PLC | | 1,081,000 | 16,073 |
| The Restaurant Group PLC | | 138,100 | 1,526 |
| Virgin Money Holdings Uk PLC | | 989,500 | 5,916 |
| Whitbread PLC | | 122,013 | 9,341 |
|
| TOTAL UNITED KINGDOM | | | 368,488 |
|
| United States of America - 6.8% | | | |
| Alliance Data Systems Corp. (a) | | 20,900 | 6,214 |
| Alphabet, Inc.: | | | |
| Class A (a) | | 10,495 | 7,739 |
| Class C | | 19,849 | 14,109 |
| Amgen, Inc. | | 43,800 | 6,928 |
| Baxalta, Inc. | | 159,300 | 5,489 |
| Celgene Corp. (a) | | 45,300 | 5,559 |
| Celldex Therapeutics, Inc. (a) | | 24,600 | 297 |
| Cognizant Technology Solutions Corp. Class A (a) | | 44,400 | 3,024 |
| Fidelity National Information Services, Inc. | | 102,700 | 7,489 |
| HP, Inc. | | 180,500 | 4,866 |
| Las Vegas Sands Corp. | | 175,100 | 8,669 |
| MasterCard, Inc. Class A | | 127,700 | 12,641 |
| McGraw Hill Financial, Inc. | | 174,300 | 16,147 |
| Noble Energy, Inc. | | 86,100 | 3,086 |
| Oceaneering International, Inc. | | 95,000 | 3,992 |
| QUALCOMM, Inc. | | 115,500 | 6,863 |
| The Blackstone Group LP | | 168,100 | 5,557 |
| Visa, Inc. Class A | | 174,800 | 13,561 |
| Western Digital Corp. | | 80,200 | 5,359 |
|
| TOTAL UNITED STATES OF AMERICA | | | 137,589 |
|
| TOTAL COMMON STOCKS | | | |
| (Cost $1,543,758) | | | 1,896,693 |
|
| Preferred Stocks - 1.0% | | | |
| Convertible Preferred Stocks - 0.0% | | | |
| United States of America - 0.0% | | | |
| NJOY, Inc.: | | | |
| Series C (a)(d) | | 60,264 | 30 |
| Series D (a)(d) | | 18,951 | 9 |
| | | | 39 |
| Nonconvertible Preferred Stocks - 1.0% | | | |
| Brazil - 0.1% | | | |
| Itau Unibanco Holding SA | | 305,800 | 2,099 |
| Germany - 0.9% | | | |
| Henkel AG & Co. KGaA | | 159,300 | 17,290 |
| United Kingdom - 0.0% | | | |
| Rolls-Royce Group PLC | | 57,446,190 | 89 |
|
| TOTAL NONCONVERTIBLE PREFERRED STOCKS | | | 19,478 |
|
| TOTAL PREFERRED STOCKS | | | |
| (Cost $17,951) | | | 19,517 |
| | | Principal Amount (000s)(e) | Value (000s) |
|
| Government Obligations - 0.0% | | | |
| United States of America - 0.0% | | | |
U.S. Treasury Bills, yield at date of purchase 0.03% to 0.06% 12/3/15 to 12/17/15
(Cost $90)(f) | | 90 | 90 |
|
| Preferred Securities - 0.1% | | | |
| Ireland - 0.1% | | | |
Baggot Securities Ltd. 10.24%
(Cost $2,488)(c)(g) | EUR | 1,620 | 1,926 |
| | | Shares | Value (000s) |
|
| Money Market Funds - 5.7% | | | |
| Fidelity Cash Central Fund, 0.18% (h) | | 112,099,238 | 112,099 |
| Fidelity Securities Lending Cash Central Fund, 0.19% (h)(i) | | 4,169,950 | 4,170 |
| TOTAL MONEY MARKET FUNDS | | | |
| (Cost $116,269) | | | 116,269 |
| TOTAL INVESTMENT PORTFOLIO - 100.5% | | | |
| (Cost $1,680,556) | | | 2,034,495 |
| NET OTHER ASSETS (LIABILITIES) - (0.5)% | | | (9,127) |
| NET ASSETS - 100% | | | $2,025,368 |
| Futures Contracts | | | |
| | Expiration Date | Underlying Face Amount at Value (000s) | Unrealized Appreciation/(Depreciation) (000s) |
| Purchased | | | |
| Equity Index Contracts | | | |
| 97 CME Nikkei 225 Index Contracts (United States) | Dec. 2015 | 9,174 | $439 |
The face value of futures purchased as a percentage of Net Assets is 0.5%
Currency Abbreviations
EUR – European Monetary Unit
Categorizations in the Schedule of Investments are based on country or territory of incorporation.
Legend
(a) Non-income producing
(b) Security or a portion of the security is on loan at period end.
(c) Security exempt from registration under Rule 144A of the Securities Act of 1933. These securities may be resold in transactions exempt from registration, normally to qualified institutional buyers. At the end of the period, the value of these securities amounted to $2,321,000 or 0.1% of net assets.
(d) Restricted securities - Investment in securities not registered under the Securities Act of 1933 (excluding 144A issues). At the end of the period, the value of restricted securities (excluding 144A issues) amounted to $6,673,000 or 0.3% of net assets.
(e) Amount is stated in United States dollars unless otherwise noted.
(f) Security or a portion of the security was pledged to cover margin requirements for futures contracts. At period end, the value of securities pledged amounted to $90,000.
(g) Security is perpetual in nature with no stated maturity date.
(h) Affiliated fund that is generally available only to investment companies and other accounts managed by Fidelity Investments. The rate quoted is the annualized seven-day yield of the fund at period end. A complete unaudited listing of the fund's holdings as of its most recent quarter end is available upon request. In addition, each Fidelity Central Fund's financial statements , which are not covered by the Fund's Report of Independent Registered Public Accounting Firm, are available on the SEC's website or upon request.
(i) Investment made with cash collateral received from securities on loan.
Additional information on each restricted holding is as follows:
| Security | Acquisition Date | Acquisition Cost (000s) |
| Credit Suisse Group AG | 10/21/15 | $6,834 |
| NJOY, Inc. Series C | 6/7/13 | $487 |
| NJOY, Inc. Series D | 2/14/14 | $321 |
Affiliated Central Funds
Information regarding fiscal year to date income earned by the Fund from investments in Fidelity Central Funds is as follows:
| Fund | Income earned |
| | (Amounts in thousands) |
| Fidelity Cash Central Fund | $94 |
| Fidelity Securities Lending Cash Central Fund | 559 |
| Total | $653 |
Investment Valuation
The following is a summary of the inputs used, as of October 31, 2015, involving the Fund's assets and liabilities carried at fair value. The inputs or methodology used for valuing securities may not be an indication of the risk associated with investing in those securities. For more information on valuation inputs, and their aggregation into the levels used below, please refer to the Investment Valuation section in the accompanying Notes to Financial Statements.
| | Valuation Inputs at Reporting Date: |
| Description | Total | Level 1 | Level 2 | Level 3 |
| (Amounts in thousands) | | | | |
| Investments in Securities: | | | | |
| Equities: | | | | |
| Consumer Discretionary | $323,496 | $202,317 | $115,184 | $5,995 |
| Consumer Staples | 250,165 | 119,540 | 130,625 | -- |
| Energy | 50,305 | 34,366 | 15,939 | -- |
| Financials | 433,555 | 159,870 | 273,685 | -- |
| Health Care | 350,375 | 153,649 | 196,726 | -- |
| Industrials | 130,849 | 90,450 | 40,399 | -- |
| Information Technology | 250,095 | 210,427 | 39,668 | -- |
| Materials | 74,031 | 49,725 | 24,306 | -- |
| Telecommunication Services | 53,339 | 4,360 | 48,979 | -- |
| Government Obligations | 90 | -- | 90 | -- |
| Preferred Securities | 1,926 | -- | 1,926 | -- |
| Money Market Funds | 116,269 | 116,269 | -- | -- |
| Total Investments in Securities: | $2,034,495 | $1,140,973 | $887,527 | $5,995 |
| Derivative Instruments: | | | | |
| Assets | | | | |
| Futures Contracts | $439 | $439 | $-- | $-- |
| Total Assets | $439 | $439 | $-- | $-- |
| Total Derivative Instruments: | $439 | $439 | $-- | $-- |
The following is a summary of transfers between Level 1 and Level 2 for the period ended October 31, 2015. Transfers are assumed to have occurred at the beginning of the period, and are primarily attributable to the valuation techniques used for foreign equity securities, as discussed in the accompanying Notes to Financial Statements:
| Transfers | Total (000s) |
| Level 1 to Level 2 | $107,949 |
| Level 2 to Level 1 | $28,909 |
Value of Derivative Instruments
The following table is a summary of the Fund's value of derivative instruments by primary risk exposure as of October 31, 2015. For additional information on derivative instruments, please refer to the Derivative Instruments section in the accompanying Notes to Financial Statements.
| Primary Risk Exposure / Derivative Type | Value |
| (Amounts in thousands) | Asset | Liability |
| Equity Risk | | |
| Futures Contracts(a) | $439 | $0 |
| Total Equity Risk | 439 | 0 |
| Total Value of Derivatives | $439 | $0 |
(a) Reflects gross cumulative appreciation (depreciation) on futures contracts as presented in the Schedule of Investments. Only the period end receivable or payable for daily variation margin and net unrealized appreciation (depreciation) are presented in the Statement of Assets and Liabilities.
See accompanying notes which are an integral part of the financial statements.
Financial Statements
Statement of Assets and Liabilities
| Amounts in thousands (except per-share amounts) | | October 31, 2015 |
| Assets | | |
Investment in securities, at value (including securities loaned of $3,928) — See accompanying schedule:
Unaffiliated issuers (cost $1,564,287) | $1,918,226 | |
| Fidelity Central Funds (cost $116,269) | 116,269 | |
| Total Investments (cost $1,680,556) | | $2,034,495 |
| Segregated cash with brokers for derivative instruments | | 448 |
| Foreign currency held at value (cost $254) | | 254 |
| Receivable for investments sold | | 8,321 |
| Receivable for fund shares sold | | 2,913 |
| Dividends receivable | | 4,976 |
| Distributions receivable from Fidelity Central Funds | | 19 |
| Prepaid expenses | | 5 |
| Other receivables | | 724 |
| Total assets | | 2,052,155 |
| Liabilities | | |
| Payable for investments purchased | $11,241 | |
| Payable for fund shares redeemed | 8,661 | |
| Accrued management fee | 1,117 | |
| Distribution and service plan fees payable | 463 | |
| Payable for daily variation margin for derivative instruments | 51 | |
| Other affiliated payables | 418 | |
| Other payables and accrued expenses | 666 | |
| Collateral on securities loaned, at value | 4,170 | |
| Total liabilities | | 26,787 |
| Net Assets | | $2,025,368 |
| Net Assets consist of: | | |
| Paid in capital | | $4,281,587 |
| Undistributed net investment income | | 12,633 |
| Accumulated undistributed net realized gain (loss) on investments and foreign currency transactions | | (2,623,269) |
| Net unrealized appreciation (depreciation) on investments and assets and liabilities in foreign currencies | | 354,417 |
| Net Assets | | $2,025,368 |
| Calculation of Maximum Offering Price | | |
| Class A: | | |
| Net Asset Value and redemption price per share ($661,578 ÷ 32,911.1 shares) | | $20.10 |
| Maximum offering price per share (100/94.25 of $20.10) | | $21.33 |
| Class T: | | |
| Net Asset Value and redemption price per share ($271,487 ÷ 13,626.9 shares) | | $19.92 |
| Maximum offering price per share (100/96.50 of $19.92) | | $20.64 |
| Class B: | | |
| Net Asset Value and offering price per share ($11,093 ÷ 574.5 shares)(a) | | $19.31 |
| Class C: | | |
| Net Asset Value and offering price per share ($251,098 ÷ 13,086.2 shares)(a) | | $19.19 |
| Class I: | | |
| Net Asset Value, offering price and redemption price per share ($747,187 ÷ 36,519.7 shares) | | $20.46 |
| Class Z: | | |
| Net Asset Value, offering price and redemption price per share ($82,925 ÷ 4,052.2 shares) | | $20.46 |
(a) Redemption price per share is equal to net asset value less any applicable contingent deferred sales charge.
See accompanying notes which are an integral part of the financial statements.
Statement of Operations
| Amounts in thousands | | Year ended October 31, 2015 |
| Investment Income | | |
| Dividends | | $41,105 |
| Interest | | 27 |
| Income from Fidelity Central Funds | | 653 |
| Income before foreign taxes withheld | | 41,785 |
| Less foreign taxes withheld | | (3,009) |
| Total income | | 38,776 |
| Expenses | | |
| Management fee | $13,277 | |
| Transfer agent fees | 4,255 | |
| Distribution and service plan fees | 5,693 | |
| Accounting and security lending fees | 876 | |
| Custodian fees and expenses | 248 | |
| Independent trustees' compensation | 8 | |
| Registration fees | 135 | |
| Audit | 84 | |
| Legal | 6 | |
| Miscellaneous | 21 | |
| Total expenses before reductions | 24,603 | |
| Expense reductions | (147) | 24,456 |
| Net investment income (loss) | | 14,320 |
| Realized and Unrealized Gain (Loss) | | |
| Net realized gain (loss) on: | | |
| Investment securities: | | |
| Unaffiliated issuers | 39,912 | |
| Foreign currency transactions | (294) | |
| Futures contracts | (578) | |
| Total net realized gain (loss) | | 39,040 |
Change in net unrealized appreciation (depreciation) on:
Investment securities (net of decrease in deferred foreign taxes of $41) | 17,485 | |
| Assets and liabilities in foreign currencies | 194 | |
| Futures contracts | 439 | |
| Total change in net unrealized appreciation (depreciation) | | 18,118 |
| Net gain (loss) | | 57,158 |
| Net increase (decrease) in net assets resulting from operations | | $71,478 |
See accompanying notes which are an integral part of the financial statements.
Statement of Changes in Net Assets
| Amounts in thousands | Year ended October 31, 2015 | Year ended October 31, 2014 |
| Increase (Decrease) in Net Assets | | |
| Operations | | |
| Net investment income (loss) | $14,320 | $25,980 |
| Net realized gain (loss) | 39,040 | 174,288 |
| Change in net unrealized appreciation (depreciation) | 18,118 | (153,908) |
| Net increase (decrease) in net assets resulting from operations | 71,478 | 46,360 |
| Distributions to shareholders from net investment income | (18,738) | (17,375) |
| Distributions to shareholders from net realized gain | (2,141) | (17,564) |
| Total distributions | (20,879) | (34,939) |
| Share transactions - net increase (decrease) | 63,265 | (109,770) |
| Redemption fees | 27 | 19 |
| Total increase (decrease) in net assets | 113,891 | (98,330) |
| Net Assets | | |
| Beginning of period | 1,911,477 | 2,009,807 |
| End of period (including undistributed net investment income of $12,633 and undistributed net investment income of $18,417, respectively) | $2,025,368 | $1,911,477 |
See accompanying notes which are an integral part of the financial statements.
Financial Highlights — Fidelity Advisor Diversified International Fund Class A
| | | October 31, | | | |
| Years ended October 31, | 2015 | 2014 | 2013 | 2012 | 2011 |
| Selected Per–Share Data | | | | | |
| Net asset value, beginning of period | $19.56 | $19.47 | $15.63 | $14.61 | $15.63 |
| Income from Investment Operations | | | | | |
| Net investment income (loss)A | .15 | .27B | .19 | .18 | .22C |
| Net realized and unrealized gain (loss) | .61 | .17 | 3.92 | 1.03 | (1.01) |
| Total from investment operations | .76 | .44 | 4.11 | 1.21 | (.79) |
| Distributions from net investment income | (.20) | (.18) | (.21) | (.19) | (.20) |
| Distributions from net realized gain | (.02) | (.17) | (.06) | – | (.03) |
| Total distributions | (.22) | (.35) | (.27) | (.19) | (.23) |
| Redemption fees added to paid in capitalA,D | – | – | – | – | – |
| Net asset value, end of period | $20.10 | $19.56 | $19.47 | $15.63 | $14.61 |
| Total ReturnE,F | 3.93% | 2.28% | 26.69% | 8.47% | (5.15)% |
| Ratios to Average Net AssetsG,H | | | | | |
| Expenses before reductions | 1.22% | 1.26% | 1.31% | 1.32% | 1.31% |
| Expenses net of fee waivers, if any | 1.22% | 1.26% | 1.30% | 1.32% | 1.31% |
| Expenses net of all reductions | 1.21% | 1.26% | 1.28% | 1.31% | 1.29% |
| Net investment income (loss) | .75% | 1.34%B | 1.08% | 1.20% | 1.38%C |
| Supplemental Data | | | | | |
| Net assets, end of period (in millions) | $662 | $693 | $756 | $762 | $916 |
| Portfolio turnover rateI | 34% | 40% | 50% | 34% | 48% |
A Calculated based on average shares outstanding during the period.
B Investment income per share reflects a large, non-recurring dividend which amounted to $.10 per share. Excluding this non-recurring dividend, the ratio of net investment income (loss) to average net assets would have been .85%.
C Investment income per share reflects a large, non-recurring dividend which amounted to $.06 per share. Excluding this non-recurring dividend, the ratio of net investment income (loss) to average net assets would have been .98%.
D Amount represents less than $.005 per share.
E Total returns would have been lower if certain expenses had not been reduced during the applicable periods shown.
F Total returns do not include the effect of the sales charges.
G Fees and expenses of any underlying Fidelity Central Funds are not included in the Fund's expense ratio. The Fund indirectly bears its proportionate share of the expenses of any underlying Fidelity Central Funds.
H Expense ratios reflect operating expenses of the class. Expenses before reductions do not reflect amounts reimbursed by the investment adviser or reductions from brokerage service arrangements or reductions from other expense offset arrangements and do not represent the amount paid by the class during periods when reimbursements or reductions occur. Expenses net of fee waivers reflect expenses after reimbursement by the investment adviser but prior to reductions from brokerage service arrangements or other expense offset arrangements. Expenses net of all reductions represent the net expenses paid by the class.
I Amount does not include the portfolio activity of any underlying Fidelity Central Funds.
See accompanying notes which are an integral part of the financial statements.
Financial Highlights — Fidelity Advisor Diversified International Fund Class T
| | | October 31, | | | |
| Years ended October 31, | 2015 | 2014 | 2013 | 2012 | 2011 |
| Selected Per–Share Data | | | | | |
| Net asset value, beginning of period | $19.38 | $19.30 | $15.49 | $14.46 | $15.47 |
| Income from Investment Operations | | | | | |
| Net investment income (loss)A | .10 | .21B | .14 | .14 | .18C |
| Net realized and unrealized gain (loss) | .61 | .18 | 3.89 | 1.03 | (.99) |
| Total from investment operations | .71 | .39 | 4.03 | 1.17 | (.81) |
| Distributions from net investment income | (.15) | (.14) | (.16) | (.14) | (.16) |
| Distributions from net realized gain | (.02) | (.17) | (.06) | – | (.03) |
| Total distributions | (.17) | (.31) | (.22) | (.14) | (.20)D |
| Redemption fees added to paid in capitalA,E | – | – | – | – | – |
| Net asset value, end of period | $19.92 | $19.38 | $19.30 | $15.49 | $14.46 |
| Total ReturnF,G | 3.67% | 2.04% | 26.37% | 8.17% | (5.35)% |
| Ratios to Average Net AssetsH,I | | | | | |
| Expenses before reductions | 1.48% | 1.51% | 1.55% | 1.58% | 1.55% |
| Expenses net of fee waivers, if any | 1.48% | 1.51% | 1.55% | 1.58% | 1.55% |
| Expenses net of all reductions | 1.47% | 1.51% | 1.53% | 1.57% | 1.53% |
| Net investment income (loss) | .49% | 1.09%B | .83% | .94% | 1.14%C |
| Supplemental Data | | | | | |
| Net assets, end of period (in millions) | $271 | $284 | $319 | $304 | $404 |
| Portfolio turnover rateJ | 34% | 40% | 50% | 34% | 48% |
A Calculated based on average shares outstanding during the period.
B Investment income per share reflects a large, non-recurring dividend which amounted to $.10 per share. Excluding this non-recurring dividend, the ratio of net investment income (loss) to average net assets would have been .60%.
C Investment income per share reflects a large, non-recurring dividend which amounted to $.06 per share. Excluding this non-recurring dividend, the ratio of net investment income (loss) to average net assets would have been .74%.
D Total distributions of $.20 per share is comprised of distributions from net investment income of $.164 and distributions from net realized gain of $.034 per share.
E Amount represents less than $.005 per share.
F Total returns would have been lower if certain expenses had not been reduced during the applicable periods shown.
G Total returns do not include the effect of the sales charges.
H Fees and expenses of any underlying Fidelity Central Funds are not included in the Fund's expense ratio. The Fund indirectly bears its proportionate share of the expenses of any underlying Fidelity Central Funds.
I Expense ratios reflect operating expenses of the class. Expenses before reductions do not reflect amounts reimbursed by the investment adviser or reductions from brokerage service arrangements or reductions from other expense offset arrangements and do not represent the amount paid by the class during periods when reimbursements or reductions occur. Expenses net of fee waivers reflect expenses after reimbursement by the investment adviser but prior to reductions from brokerage service arrangements or other expense offset arrangements. Expenses net of all reductions represent the net expenses paid by the class.
J Amount does not include the portfolio activity of any underlying Fidelity Central Funds.
See accompanying notes which are an integral part of the financial statements.
Financial Highlights — Fidelity Advisor Diversified International Fund Class B
| | | October 31, | | | |
| Years ended October 31, | 2015 | 2014 | 2013 | 2012 | 2011 |
| Selected Per–Share Data | | | | | |
| Net asset value, beginning of period | $18.75 | $18.65 | $14.95 | $13.91 | $14.91 |
| Income from Investment Operations | | | | | |
| Net investment income (loss)A | (.01) | .10B | .05 | .06 | .09C |
| Net realized and unrealized gain (loss) | .59 | .17 | 3.77 | 1.00 | (.96) |
| Total from investment operations | .58 | .27 | 3.82 | 1.06 | (.87) |
| Distributions from net investment income | – | – | (.06) | (.02) | (.10) |
| Distributions from net realized gain | (.02) | (.17) | (.06) | – | (.03) |
| Total distributions | (.02) | (.17) | (.12) | (.02) | (.13) |
| Redemption fees added to paid in capitalA,D | – | – | – | – | – |
| Net asset value, end of period | $19.31 | $18.75 | $18.65 | $14.95 | $13.91 |
| Total ReturnE,F | 3.11% | 1.45% | 25.72% | 7.64% | (5.89)% |
| Ratios to Average Net AssetsG,H | | | | | |
| Expenses before reductions | 2.05% | 2.07% | 2.08% | 2.08% | 2.08% |
| Expenses net of fee waivers, if any | 2.05% | 2.07% | 2.08% | 2.08% | 2.08% |
| Expenses net of all reductions | 2.04% | 2.07% | 2.06% | 2.07% | 2.06% |
| Net investment income (loss) | (.08)% | .53%B | .30% | .44% | .61%C |
| Supplemental Data | | | | | |
| Net assets, end of period (in millions) | $11 | $19 | $36 | $59 | $94 |
| Portfolio turnover rateI | 34% | 40% | 50% | 34% | 48% |
A Calculated based on average shares outstanding during the period.
B Investment income per share reflects a large, non-recurring dividend which amounted to $.09 per share. Excluding this non-recurring dividend, the ratio of net investment income (loss) to average net assets would have been .04%.
C Investment income per share reflects a large, non-recurring dividend which amounted to $.06 per share. Excluding this non-recurring dividend, the ratio of net investment income (loss) to average net assets would have been .21%.
D Amount represents less than $.005 per share.
E Total returns would have been lower if certain expenses had not been reduced during the applicable periods shown.
F Total returns do not include the effect of the contingent deferred sales charge.
G Fees and expenses of any underlying Fidelity Central Funds are not included in the Fund's expense ratio. The Fund indirectly bears its proportionate share of the expenses of any underlying Fidelity Central Funds.
H Expense ratios reflect operating expenses of the class. Expenses before reductions do not reflect amounts reimbursed by the investment adviser or reductions from brokerage service arrangements or reductions from other expense offset arrangements and do not represent the amount paid by the class during periods when reimbursements or reductions occur. Expenses net of fee waivers reflect expenses after reimbursement by the investment adviser but prior to reductions from brokerage service arrangements or other expense offset arrangements. Expenses net of all reductions represent the net expenses paid by the class.
I Amount does not include the portfolio activity of any underlying Fidelity Central Funds.
See accompanying notes which are an integral part of the financial statements.
Financial Highlights — Fidelity Advisor Diversified International Fund Class C
| | | October 31, | | | |
| Years ended October 31, | 2015 | 2014 | 2013 | 2012 | 2011 |
| Selected Per–Share Data | | | | | |
| Net asset value, beginning of period | $18.68 | $18.63 | $14.97 | $13.95 | $14.95 |
| Income from Investment Operations | | | | | |
| Net investment income (loss)A | –B | .11C | .06 | .06 | .10D |
| Net realized and unrealized gain (loss) | .59 | .18 | 3.75 | 1.01 | (.96) |
| Total from investment operations | .59 | .29 | 3.81 | 1.07 | (.86) |
| Distributions from net investment income | (.06) | (.07) | (.09) | (.05) | (.11) |
| Distributions from net realized gain | (.02) | (.17) | (.06) | – | (.03) |
| Total distributions | (.08) | (.24) | (.15) | (.05) | (.14) |
| Redemption fees added to paid in capitalA,B | – | – | – | – | – |
| Net asset value, end of period | $19.19 | $18.68 | $18.63 | $14.97 | $13.95 |
| Total ReturnE,F | 3.15% | 1.58% | 25.71% | 7.71% | (5.83)% |
| Ratios to Average Net AssetsG,H | | | | | |
| Expenses before reductions | 1.97% | 2.00% | 2.04% | 2.06% | 2.05% |
| Expenses net of fee waivers, if any | 1.97% | 2.00% | 2.04% | 2.06% | 2.05% |
| Expenses net of all reductions | 1.96% | 2.00% | 2.01% | 2.05% | 2.03% |
| Net investment income (loss) | - %I | .60%C | .35% | .46% | .64%D |
| Supplemental Data | | | | | |
| Net assets, end of period (in millions) | $251 | $243 | $264 | $246 | $302 |
| Portfolio turnover rateJ | 34% | 40% | 50% | 34% | 48% |
A Calculated based on average shares outstanding during the period.
B Amount represents less than $.005 per share.
C Investment income per share reflects a large, non-recurring dividend which amounted to $.09 per share. Excluding this non-recurring dividend, the ratio of net investment income (loss) to average net assets would have been .11%.
D Investment income per share reflects a large, non-recurring dividend which amounted to $.06 per share. Excluding this non-recurring dividend, the ratio of net investment income (loss) to average net assets would have been .24%.
E Total returns would have been lower if certain expenses had not been reduced during the applicable periods shown.
F Total returns do not include the effect of the contingent deferred sales charge.
G Fees and expenses of any underlying Fidelity Central Funds are not included in the Fund's expense ratio. The Fund indirectly bears its proportionate share of the expenses of any underlying Fidelity Central Funds.
H Expense ratios reflect operating expenses of the class. Expenses before reductions do not reflect amounts reimbursed by the investment adviser or reductions from brokerage service arrangements or reductions from other expense offset arrangements and do not represent the amount paid by the class during periods when reimbursements or reductions occur. Expenses net of fee waivers reflect expenses after reimbursement by the investment adviser but prior to reductions from brokerage service arrangements or other expense offset arrangements. Expenses net of all reductions represent the net expenses paid by the class.
I Amount represents less than .005%
J Amount does not include the portfolio activity of any underlying Fidelity Central Funds.
See accompanying notes which are an integral part of the financial statements.
Financial Highlights — Fidelity Advisor Diversified International Fund Class I
| | | October 31, | | | |
| Years ended October 31, | 2015 | 2014 | 2013 | 2012 | 2011 |
| Selected Per–Share Data | | | | | |
| Net asset value, beginning of period | $19.91 | $19.80 | $15.90 | $14.87 | $15.90 |
| Income from Investment Operations | | | | | |
| Net investment income (loss)A | .21 | .33B | .24 | .23 | .28C |
| Net realized and unrealized gain (loss) | .63 | .18 | 3.98 | 1.05 | (1.03) |
| Total from investment operations | .84 | .51 | 4.22 | 1.28 | (.75) |
| Distributions from net investment income | (.26) | (.23) | (.26) | (.25) | (.25) |
| Distributions from net realized gain | (.02) | (.17) | (.06) | – | (.03) |
| Total distributions | (.29)D | (.40) | (.32) | (.25) | (.28) |
| Redemption fees added to paid in capitalA,E | – | – | – | – | – |
| Net asset value, end of period | $20.46 | $19.91 | $19.80 | $15.90 | $14.87 |
| Total ReturnF | 4.24% | 2.60% | 27.03% | 8.83% | (4.85)% |
| Ratios to Average Net AssetsG,H | | | | | |
| Expenses before reductions | .94% | .97% | .99% | 1.00% | .99% |
| Expenses net of fee waivers, if any | .94% | .97% | .99% | 1.00% | .99% |
| Expenses net of all reductions | .94% | .97% | .97% | .99% | .97% |
| Net investment income (loss) | 1.03% | 1.63%B | 1.39% | 1.52% | 1.70%C |
| Supplemental Data | | | | | |
| Net assets, end of period (in millions) | $747 | $648 | $636 | $546 | $723 |
| Portfolio turnover rateI | 34% | 40% | 50% | 34% | 48% |
A Calculated based on average shares outstanding during the period.
B Investment income per share reflects a large, non-recurring dividend which amounted to $.10 per share. Excluding this non-recurring dividend, the ratio of net investment income (loss) to average net assets would have been 1.14%.
C Investment income per share reflects a large, non-recurring dividend which amounted to $.06 per share. Excluding this non-recurring dividend, the ratio of net investment income (loss) to average net assets would have been 1.30%.
D Total distributions of $.29 per share is comprised of distributions from net investment income of $.263 and distributions from net realized gain of $.022 per share.
E Amount represents less than $.005 per share.
F Total returns would have been lower if certain expenses had not been reduced during the applicable periods shown.
G Fees and expenses of any underlying Fidelity Central Funds are not included in the Fund's expense ratio. The Fund indirectly bears its proportionate share of the expenses of any underlying Fidelity Central Funds.
H Expense ratios reflect operating expenses of the class. Expenses before reductions do not reflect amounts reimbursed by the investment adviser or reductions from brokerage service arrangements or reductions from other expense offset arrangements and do not represent the amount paid by the class during periods when reimbursements or reductions occur. Expenses net of fee waivers reflect expenses after reimbursement by the investment adviser but prior to reductions from brokerage service arrangements or other expense offset arrangements. Expenses net of all reductions represent the net expenses paid by the class.
I Amount does not include the portfolio activity of any underlying Fidelity Central Funds.
See accompanying notes which are an integral part of the financial statements.
Financial Highlights — Fidelity Advisor Diversified International Fund Class Z
| | | October 31, | |
| Years ended October 31, | 2015 | 2014 | 2013 A |
| Selected Per–Share Data | | | |
| Net asset value, beginning of period | $19.93 | $19.81 | $18.54 |
| Income from Investment Operations | | | |
| Net investment income (loss)B | .24 | .36C | .03 |
| Net realized and unrealized gain (loss) | .61 | .19 | 1.24 |
| Total from investment operations | .85 | .55 | 1.27 |
| Distributions from net investment income | (.30) | (.26) | – |
| Distributions from net realized gain | (.02) | (.17) | – |
| Total distributions | (.32) | (.43) | – |
| Redemption fees added to paid in capitalB | –D | –D | – |
| Net asset value, end of period | $20.46 | $19.93 | $19.81 |
| Total ReturnE,F | 4.34% | 2.81% | 6.85% |
| Ratios to Average Net AssetsG,H | | | |
| Expenses before reductions | .79% | .81% | .83%I |
| Expenses net of fee waivers, if any | .79% | .81% | .83%I |
| Expenses net of all reductions | .78% | .81% | .80%I |
| Net investment income (loss) | 1.18% | 1.79%C | .77%I |
| Supplemental Data | | | |
| Net assets, end of period (000 omitted) | $82,925 | $24,050 | $107 |
| Portfolio turnover rateJ | 34% | 40% | 50% |
A For the period August 13, 2013 (commencement of sale of shares) to October 31, 2013.
B Calculated based on average shares outstanding during the period.
C Investment income per share reflects a large, non-recurring dividend which amounted to $.10 per share. Excluding this non-recurring dividend, the ratio of net investment income (loss) to average net assets would have been 1.30%.
D Amount represents less than $.005 per share.
E Total returns for periods of less than one year are not annualized.
F Total returns would have been lower if certain expenses had not been reduced during the applicable periods shown.
G Fees and expenses of any underlying Fidelity Central Funds are not included in the Fund's expense ratio. The Fund indirectly bears its proportionate share of the expenses of any underlying Fidelity Central Funds.
H Expense ratios reflect operating expenses of the class. Expenses before reductions do not reflect amounts reimbursed by the investment adviser or reductions from brokerage service arrangements or reductions from other expense offset arrangements and do not represent the amount paid by the class during periods when reimbursements or reductions occur. Expenses net of fee waivers reflect expenses after reimbursement by the investment adviser but prior to reductions from brokerage service arrangements or other expense offset arrangements. Expenses net of all reductions represent the net expenses paid by the class.
I Annualized
J Amount does not include the portfolio activity of any underlying Fidelity Central Funds.
See accompanying notes which are an integral part of the financial statements.
Notes to Financial Statements
For the period ended October 31, 2015
(Amounts in thousands except percentages)
1. Organization.
Fidelity Advisor Diversified International Fund (the Fund) is a fund of Fidelity Advisor Series VIII (the Trust) and is authorized to issue an unlimited number of shares. The Trust is registered under the Investment Company Act of 1940, as amended (the 1940 Act), as an open-end management investment company organized as a Massachusetts business trust. The Fund offers Class A, Class T, Class C, Class I (formerly Institutional Class) and Class Z shares, each of which, along with Class B shares, has equal rights as to assets and voting privileges. Class B shares are closed to new accounts and additional purchases, except for exchanges and reinvestments. Each class has exclusive voting rights with respect to matters that affect that class. Class B shares will automatically convert to Class A shares after a holding period of seven years from the initial date of purchase.
2. Investments in Fidelity Central Funds.
The Fund invests in Fidelity Central Funds, which are open-end investment companies generally available only to other investment companies and accounts managed by the investment adviser and its affiliates. The Fund's Schedule of Investments lists each of the Fidelity Central Funds held as of period end, if any, as an investment of the Fund, but does not include the underlying holdings of each Fidelity Central Fund. As an Investing Fund, the Fund indirectly bears its proportionate share of the expenses of the underlying Fidelity Central Funds.
The Money Market Central Funds seek preservation of capital and current income and are managed by Fidelity Investments Money Management, Inc. (FIMM), an affiliate of the investment adviser. Annualized expenses of the Money Market Central Funds as of their most recent shareholder report date are less than .005%.
A complete unaudited list of holdings for each Fidelity Central Fund is available upon request or at the Securities and Exchange Commission (the SEC) website at www.sec.gov. In addition, the financial statements of the Fidelity Central Funds, which are not covered by the Fund's Report of Independent Registered Public Accounting Firm, are available on the SEC website or upon request.
3. Significant Accounting Policies.
The financial statements have been prepared in conformity with accounting principles generally accepted in the United States of America (GAAP), which require management to make certain estimates and assumptions at the date of the financial statements. Actual results could differ from those estimates. Subsequent events, if any, through the date that the financial statements were issued have been evaluated in the preparation of the financial statements. The following summarizes the significant accounting policies of the Fund:
Investment Valuation. Investments are valued as of 4:00 p.m. Eastern time on the last calendar day of the period. The Board of Trustees (the Board) has delegated the day to day responsibility for the valuation of the Fund's investments to the Fidelity Management & Research Company (FMR) Fair Value Committee (the Committee). In accordance with valuation policies and procedures approved by the Board, the Fund attempts to obtain prices from one or more third party pricing vendors or brokers to value its investments. When current market prices, quotations or currency exchange rates are not readily available or reliable, investments will be fair valued in good faith by the Committee, in accordance with procedures adopted by the Board. Factors used in determining fair value vary by investment type and may include market or investment specific events, changes in interest rates and credit quality. The frequency with which these procedures are used cannot be predicted and they may be utilized to a significant extent. The Committee oversees the Fund's valuation policies and procedures and reports to the Board on the Committee's activities and fair value determinations. The Board monitors the appropriateness of the procedures used in valuing the Fund's investments and ratifies the fair value determinations of the Committee.
The Fund categorizes the inputs to valuation techniques used to value its investments into a disclosure hierarchy consisting of three levels as shown below:
- Level 1 – quoted prices in active markets for identical investments
- Level 2 – other significant observable inputs (including quoted prices for similar investments, interest rates, prepayment speeds, etc.)
- Level 3 – unobservable inputs (including the Fund's own assumptions based on the best information available)
Valuation techniques used to value the Fund's investments by major category are as follows:
Equity securities, including restricted securities, for which market quotations are readily available, are valued at the last reported sale price or official closing price as reported by a third party pricing vendor on the primary market or exchange on which they are traded and are categorized as Level 1 in the hierarchy. In the event there were no sales during the day or closing prices are not available, securities are valued at the last quoted bid price or may be valued using the last available price and are generally categorized as Level 2 in the hierarchy. For foreign equity securities, when market or security specific events arise, comparisons to the valuation of American Depositary Receipts (ADRs), futures contracts, Exchange-Traded Funds (ETFs) and certain indexes as well as quoted prices for similar securities may be used and would be categorized as Level 2 in the hierarchy. Utilizing these techniques may result in transfers between Level 1 and Level 2. For equity securities, including restricted securities, where observable inputs are limited, assumptions about market activity and risk are used and these securities may be categorized as Level 3 in the hierarchy.
Debt securities, including restricted securities, are valued based on evaluated prices received from third party pricing vendors or from brokers who make markets in such securities. Preferred securities and U.S. government and government agency obligations are valued by pricing vendors who utilize matrix pricing which considers yield or price of bonds of comparable quality, coupon, maturity and type or by broker-supplied prices. When independent prices are unavailable or unreliable, debt securities may be valued utilizing pricing methodologies which consider similar factors that would be used by third party pricing vendors. Debt securities are generally categorized as Level 2 in the hierarchy but may be Level 3 depending on the circumstances.
Futures contracts are valued at the settlement price established each day by the board of trade or exchange on which they are traded and are categorized as Level 1 in the hierarchy. Investments in open-end mutual funds, including the other Fidelity Central Funds, are valued at their closing net asset value (NAV) each business day and are categorized as Level 1 in the hierarchy.
Changes in valuation techniques may result in transfers in or out of an assigned level within the disclosure hierarchy. The aggregate value of investments by input level as of October 31, 2015, including information on transfers between Levels 1 and 2, is included at the end of the Fund's Schedule of Investments.
Foreign Currency. The Fund may use foreign currency contracts to facilitate transactions in foreign-denominated securities. Gains and losses from these transactions may arise from changes in the value of the foreign currency or if the counterparties do not perform under the contracts' terms.
Foreign-denominated assets, including investment securities, and liabilities are translated into U.S. dollars at the exchange rates at period end. Purchases and sales of investment securities, income and dividends received and expenses denominated in foreign currencies are translated into U.S. dollars at the exchange rate in effect on the transaction date.
The effects of exchange rate fluctuations on investments are included with the net realized and unrealized gain (loss) on investment securities. Other foreign currency transactions resulting in realized and unrealized gain (loss) are disclosed separately.
Investment Transactions and Income. For financial reporting purposes, the Fund's investment holdings and NAV include trades executed through the end of the last business day of the period. The NAV per share for processing shareholder transactions is calculated as of the close of business of the New York Stock Exchange (NYSE), normally 4:00 p.m. Eastern time and includes trades executed through the end of the prior business day. Gains and losses on securities sold are determined on the basis of identified cost and may include proceeds received from litigation. Dividend income is recorded on the ex-dividend date, except for certain dividends from foreign securities where the ex-dividend date may have passed, which are recorded as soon as the Fund is informed of the ex-dividend date. Non-cash dividends included in dividend income, if any, are recorded at the fair market value of the securities received. Income and capital gain distributions from Fidelity Central Funds, if any, are recorded on the ex-dividend date. Distributions received on securities that represent a return of capital or capital gain are recorded as a reduction of cost of investments and/or as a realized gain. Subsequent to ex-dividend date the Fund determines the components of these distributions, based upon receipt of tax filings or other correspondence relating to the underlying investment. Interest income is accrued as earned and includes coupon interest and amortization of premium and accretion of discount on debt securities as applicable. Investment income is recorded net of foreign taxes withheld where recovery of such taxes is uncertain.
Class Allocations and Expenses. Investment income, realized and unrealized capital gains and losses, common expenses of the Fund, and certain fund-level expense reductions, if any, are allocated daily on a pro-rata basis to each class based on the relative net assets of each class to the total net assets of the Fund. Each class differs with respect to transfer agent and distribution and service plan fees incurred. Certain expense reductions may also differ by class. For the reporting period, the allocated portion of income and expenses to each class as a percent of its average net assets may vary due to the timing of recording these transactions in relation to fluctuating net assets of the classes. Expenses directly attributable to a fund are charged to that fund. Expenses attributable to more than one fund are allocated among the respective funds on the basis of relative net assets or other appropriate methods. Expense estimates are accrued in the period to which they relate and adjustments are made when actual amounts are known.
Deferred Trustee Compensation. Under a Deferred Compensation Plan (the Plan), independent Trustees may elect to defer receipt of a portion of their annual compensation. Deferred amounts are invested in a cross-section of Fidelity funds, are marked-to-market and remain in the Fund until distributed in accordance with the Plan. The investment of deferred amounts and the offsetting payable to the Trustees are included in the accompanying Statement of Assets and Liabilities.
Income Tax Information and Distributions to Shareholders. Each year, the Fund intends to qualify as a regulated investment company under Subchapter M of the Internal Revenue Code, including distributing substantially all of its taxable income and realized gains. As a result, no provision for U.S. Federal income taxes is required. As of October 31, 2015, the Fund did not have any unrecognized tax benefits in the financial statements; nor is the Fund aware of any tax positions for which it is reasonably possible that the total amounts of unrecognized tax benefits will significantly change in the next twelve months. The Fund files a U.S. federal tax return, in addition to state and local tax returns as required. The Fund's federal income tax returns are subject to examination by the Internal Revenue Service (IRS) for a period of three fiscal years after they are filed. State and local tax returns may be subject to examination for an additional fiscal year depending on the jurisdiction. Foreign taxes are provided for based on the Fund's understanding of the tax rules and rates that exist in the foreign markets in which it invests. The Fund is subject to a tax imposed on capital gains by certain countries in which it invests. An estimated deferred tax liability for net unrealized appreciation on the applicable securities is included in Other payables and accrued expenses on the Statement of Assets & Liabilities.
Distributions are declared and recorded on the ex-dividend date. Income dividends and capital gain distributions are declared separately for each class. Income and capital gain distributions are determined in accordance with income tax regulations, which may differ from GAAP.
Capital accounts within the financial statements are adjusted for permanent book-tax differences. These adjustments have no impact on net assets or the results of operations. Capital accounts are not adjusted for temporary book-tax differences which will reverse in a subsequent period.
Book-tax differences are primarily due to foreign currency transactions, partnerships, futures transactions, passive foreign investment companies (PFIC), market discount, deferred trustees compensation, capital loss carryforwards and losses deferred due to wash sales.
The federal tax cost of investment securities and unrealized appreciation (depreciation) as of period end were as follows:
| Gross unrealized appreciation | $428,251 |
| Gross unrealized depreciation | (91,122) |
| Net unrealized appreciation (depreciation) on securities | $337,129 |
| Tax Cost | $1,697,366 |
The tax-based components of distributable earnings as of period end were as follows:
| Undistributed ordinary income | $12,761 |
| Capital loss carryforward | $(2,606,019) |
| Net unrealized appreciation (depreciation) on securities and other investments | $337,144 |
Capital loss carryforwards are only available to offset future capital gains of the Fund to the extent provided by regulations and may be limited. Under the Regulated Investment Company Modernization Act of 2010 (the Act), the Fund is permitted to carry forward capital losses incurred in taxable years beginning after December 22, 2010 for an unlimited period and such capital losses are required to be used prior to any losses that expire. The capital loss carryforward information presented below, including any applicable limitation, is estimated as of fiscal period end and is subject to adjustment.
| Fiscal year of expiration | |
The tax character of distributions paid was as follows:
| | October 31, 2015 | October 31, 2014 |
| Ordinary Income | $20,879 | $ 34,939 |
Short-Term Trading (Redemption) Fees. Shares held by investors in the Fund less than 30 days may have been subject to a redemption fee equal to 1.00% of the NAV of shares redeemed. All redemption fees, which reduce the proceeds of the shareholder redemption, are retained by the Fund and accounted for as an addition to paid in capital.
Restricted Securities. The Fund may invest in securities that are subject to legal or contractual restrictions on resale. These securities generally may be resold in transactions exempt from registration or to the public if the securities are registered. Disposal of these securities may involve time-consuming negotiations and expense, and prompt sale at an acceptable price may be difficult. Information regarding restricted securities is included at the end of the Fund's Schedule of Investments.
4. Derivative Instruments.
Risk Exposures and the Use of Derivative Instruments. The Fund's investment objective allows the Fund to enter into various types of derivative contracts, including futures contracts. Derivatives are investments whose value is primarily derived from underlying assets, indices or reference rates and may be transacted on an exchange or over-the-counter (OTC). Derivatives may involve a future commitment to buy or sell a specified asset based on specified terms, to exchange future cash flows at periodic intervals based on a notional principal amount, or for one party to make one or more payments upon the occurrence of specified events in exchange for periodic payments from the other party.
The Fund used derivatives to increase returns and to manage exposure to certain risks as defined below. The success of any strategy involving derivatives depends on analysis of numerous economic factors, and if the strategies for investment do not work as intended, the Fund may not achieve its objectives.
The Fund's use of derivatives increased or decreased its exposure to the following risk:
| Equity Risk | Equity risk relates to the fluctuations in the value of financial instruments as a result of changes in market prices (other than those arising from interest rate risk or foreign exchange risk), whether caused by factors specific to an individual investment, its issuer, or all factors affecting all instruments traded in a market or market segment. |
The Fund is also exposed to additional risks from investing in derivatives, such as liquidity risk and counterparty credit risk. Liquidity risk is the risk that the Fund will be unable to close out the derivative in the open market in a timely manner. Counterparty credit risk is the risk that the counterparty will not be able to fulfill its obligation to the Fund. Counterparty credit risk related to exchange-traded futures contracts may be mitigated by the protection provided by the exchange on which they trade.
Investing in derivatives may involve greater risks than investing in the underlying assets directly and, to varying degrees, may involve risk of loss in excess of any initial investment and collateral received and amounts recognized in the Statement of Assets and Liabilities. In addition, there may be the risk that the change in value of the derivative contract does not correspond to the change in value of the underlying instrument.
Futures Contracts. A futures contract is an agreement between two parties to buy or sell a specified underlying instrument for a fixed price at a specified future date. The Fund used futures contracts to manage its exposure to the stock market.
Upon entering into a futures contract, a fund is required to deposit either cash or securities (initial margin) with a clearing broker in an amount equal to a certain percentage of the face value of the contract. Futures contracts are marked-to-market daily and subsequent daily payments (variation margin) are made or received by a fund depending on the daily fluctuations in the value of the futures contracts and are recorded as unrealized appreciation or (depreciation). This receivable and/or payable, if any, is included in daily variation margin for derivative instruments in the Statement of Assets and Liabilities. Realized gain or (loss) is recorded upon the expiration or closing of a futures contract.
Any open futures contracts at period end are presented in the Schedule of Investments under the caption "Futures Contracts". The underlying face amount at value reflects each contract's exposure to the underlying instrument or index at period end. Securities deposited to meet initial margin requirements are identified in the Schedule of Investments. Cash deposited to meet initial margin requirements is presented as segregated cash with brokers for derivative instruments in the Statement of Assets and Liabilities.
During the period the Fund recognized net realized gain (loss) of $(578) and a change in net unrealized appreciation (depreciation) of $439 related to its investment in futures contracts. This amount included in the Statement of Operations.
5. Purchases and Sales of Investments.
Purchases and sales of securities, other than short-term securities, aggregated $650,132 and $663,500, respectively.
6. Fees and Other Transactions with Affiliates.
Management Fee. Fidelity Management & Research Company (the investment adviser) and its affiliates provide the Fund with investment management related services for which the Fund pays a monthly management fee. The management fee is the sum of an individual fund fee rate that is based on an annual rate of .42% of the Fund's average net assets and an annualized group fee rate that averaged .25% during the period. The group fee rate is based upon the average net assets of all the mutual funds advised by the investment adviser, including any mutual funds previously advised by the investment adviser that are currently advised by Fidelity SelectCo, LLC, an affiliate of the investment adviser. The group fee rate decreases as assets under management increase and increases as assets under management decrease. For the reporting period, the total annual management fee rate was .67% of the Fund's average net assets.
Distribution and Service Plan Fees. In accordance with Rule 12b-1 of the 1940 Act, the Fund has adopted separate Distribution and Service Plans for each class of shares. Certain classes pay Fidelity Distributors Corporation (FDC), an affiliate of the investment adviser, separate Distribution and Service Fees, each of which is based on an annual percentage of each class' average net assets. In addition, FDC may pay financial intermediaries for selling shares of the Fund and providing shareholder support services. For the period, the Distribution and Service Fee rates, total fees and amounts retained by FDC were as follows:
| | Distribution
Fee | Service
Fee | Total Fees | Retained
by FDC |
| Class A | -% | .25% | $1,665 | $3 |
| Class T | .25% | .25% | 1,402 | –(a) |
| Class B | .75% | .25% | 151 | 113 |
| Class C | .75% | .25% | 2,475 | 120 |
| | | | $5,693 | $236 |
(a) In the amount of less than five hundred dollars.
Sales Load. FDC may receive a front-end sales charge of up to 5.75% for selling Class A shares and 3.50% for selling Class T shares, some of which is paid to financial intermediaries for selling shares of the Fund. Depending on the holding period, FDC may receive contingent deferred sales charges levied on Class A, Class T, Class B, and Class C redemptions. The deferred sales charges range from 5.00% to 1.00% for Class B shares, 1.00% for Class C shares, 1.00% for certain purchases of Class A shares and .25% for certain purchases of Class T shares.
For the period, sales charge amounts retained by FDC were as follows:
| | Retained
by FDC
|
| Class A | $119 |
| Class T | 27 |
| Class BA | 7 |
| Class CA | 7 |
| | 160 |
A When Class B and Class C shares are initially sold, FDC pays commissions from its own resources to financial intermediaries through which the sales are made.
Transfer Agent Fees. Fidelity Investments Institutional Operations Company, Inc., (FIIOC), an affiliate of the investment adviser, is the transfer, dividend disbursing and shareholder servicing agent for each class of the Fund. FIIOC receives account fees and asset-based fees that vary according to the account size and type of account of the shareholders of the respective classes of the Fund, except for Class Z. FIIOC receives an asset-based fee of Class Z's average net assets. FIIOC pays for typesetting, printing and mailing of shareholder reports, except proxy statements.
For the period, transfer agent fees for each class were as follows:
| | Amount | % of
Class-Level Average
Net Assets |
| Class A | $1,528 | .23 |
| Class T | 667 | .24 |
| Class B | 45 | .30 |
| Class C | 563 | .23 |
| Class I | 1,422 | .20 |
| Class Z | 30 | .05 |
| | $ 4,255 | |
Accounting and Security Lending Fees. Fidelity Service Company, Inc. (FSC), an affiliate of the investment adviser, maintains the Fund's accounting records. The accounting fee is based on the level of average net assets for each month. Under a separate contract, FSC administers the security lending program. The security lending fee is based on the number and duration of lending transactions.
Brokerage Commissions. The Fund placed a portion of its portfolio transactions with brokerage firms which are affiliates of the investment adviser. Brokerage commissions are included in net realized gain (loss) and change in net unrealized appreciation (depreciation) in the Statement of Operations. The commissions paid to these affiliated firms were $3 for the period.
Other. During the period, the investment adviser reimbursed the Fund for certain losses in the amount of $5.
7. Committed Line of Credit.
The Fund participates with other funds managed by the investment adviser or an affiliate in a $4.25 billion credit facility (the "line of credit") to be utilized for temporary or emergency purposes to fund shareholder redemptions or for other short-term liquidity purposes. The Fund has agreed to pay commitment fees on its pro-rata portion of the line of credit, which amounted to $3 and is reflected in Miscellaneous expenses on the Statement of Operations. During the period, the Fund did not borrow on this line of credit.
8. Security Lending.
The Fund lends portfolio securities through a lending agent from time to time in order to earn additional income. For equity securities, a lending agent is used and may loan securities to certain qualified borrowers, including Fidelity Capital Markets (FCM), a broker-dealer affiliated with the Fund. On the settlement date of the loan, the Fund receives collateral (in the form of U.S. Treasury obligations, letters of credit and/or cash) against the loaned securities and maintains collateral in an amount not less than 100% of the market value of the loaned securities during the period of the loan. The market value of the loaned securities is determined at the close of business of the Fund and any additional required collateral is delivered to the Fund on the next business day. The Fund or borrower may terminate the loan at any time, and if the borrower defaults on its obligation to return the securities loaned because of insolvency or other reasons, the Fund may apply collateral received from the borrower against the obligation. The Fund may experience delays and costs in recovering the securities loaned. Any cash collateral received is invested in the Fidelity Securities Lending Cash Central Fund. The value of loaned securities and cash collateral at period end are disclosed on the Fund's Statement of Assets and Liabilities. Security lending income represents the income earned on investing cash collateral, less rebates paid to borrowers and any lending agent fees associated with the loan, plus any premium payments received for lending certain types of securities. Security lending income is presented in the Statement of Operations as a component of income from Fidelity Central Funds. Total security lending income during the period amounted to $559, including $1 from securities loaned to FCM.
9. Expense Reductions.
Commissions paid to certain brokers with whom the investment adviser, or its affiliates, places trades on behalf of the Fund include an amount in addition to trade execution, which may be rebated back to the Fund to offset certain expenses. This amount totaled $97 for the period.
In addition, during the period the investment adviser reimbursed and/or waived a portion of fund-level operating expenses in the amount of $8 and a portion of class-level operating expenses as follows:
| | Amount |
| Class A | $17 |
| Class T | 7 |
| Class B | –(a) |
| Class C | 6 |
| Class I | 12 |
| | $42 |
(a) In the amount of less than five hundred dollars.
10. Distributions to Shareholders.
Distributions to shareholders of each class were as follows:
| Years ended October 31, | 2015 | 2014 |
| From net investment income | | |
| Class A | $7,030 | $6,853 |
| Class T | 2,091 | 2,251 |
| Class C | 706 | 979 |
| Class I | 8,555 | 7,291 |
| Class Z | 356 | 1 |
| Total | $18,738 | $17,375 |
| From net realized gain | | |
| Class A | $727 | $6,584 |
| Class T | 317 | 2,789 |
| Class B | 21 | 307 |
| Class C | 280 | 2,390 |
| Class I | 770 | 5,493 |
| Class Z | 26 | 1 |
| Total | $2,141 | $17,564 |
11. Share Transactions.
Share transactions for each class were as follows and may contain automatic conversions between classes or exchanges between funds:
| | Shares | Shares | Dollars | Dollars |
| Years ended October 31, | 2015 | 2014 | 2015 | 2014 |
| Class A | | | | |
| Shares sold | 6,331 | 4,795 | $128,828 | $94,751 |
| Reinvestment of distributions | 378 | 646 | 7,410 | 12,430 |
| Shares redeemed | (9,229) | (8,821) | (183,333) | (174,243) |
| Net increase (decrease) | (2,520) | (3,380) | $(47,095) | $(67,062) |
| Class T | | | | |
| Shares sold | 1,574 | 1,185 | $31,817 | $23,252 |
| Reinvestment of distributions | 120 | 249 | 2,332 | 4,764 |
| Shares redeemed | (2,697) | (3,330) | (53,711) | (65,214) |
| Net increase (decrease) | (1,003) | (1,896) | $(19,562) | $(37,198) |
| Class B | | | | |
| Shares sold | 20 | 29 | $400 | $537 |
| Reinvestment of distributions | 1 | 15 | 19 | 278 |
| Shares redeemed | (467) | (933) | (9,077) | (17,767) |
| Net increase (decrease) | (446) | (889) | $(8,658) | $(16,952) |
| Class C | | | | |
| Shares sold | 2,044 | 874 | $40,003 | $16,572 |
| Reinvestment of distributions | 44 | 149 | 826 | 2,754 |
| Shares redeemed | (2,036) | (2,144) | (39,156) | (40,544) |
| Net increase (decrease) | 52 | (1,121) | $1,673 | $(21,218) |
| Class I | | | | |
| Shares sold | 13,465 | 7,676 | $273,323 | $154,759 |
| Reinvestment of distributions | 415 | 582 | 8,253 | 11,367 |
| Shares redeemed | (9,912) | (7,810) | (200,987) | (158,739) |
| Net increase (decrease) | 3,968 | 448 | $80,589 | $7,387 |
| Class Z | | | | |
| Shares sold | 3,275 | 1,246 | $65,174 | $26,144 |
| Reinvestment of distributions | 19 | – | 382 | 2 |
| Shares redeemed | (449) | (44) | (9,238) | (873) |
| Net increase (decrease) | 2,845 | 1,202 | $56,318 | $25,273 |
12. Other.
The Fund's organizational documents provide former and current trustees and officers with a limited indemnification against liabilities arising in connection with the performance of their duties to the Fund. In the normal course of business, the Fund may also enter into contracts that provide general indemnifications. The Fund's maximum exposure under these arrangements is unknown as this would be dependent on future claims that may be made against the Fund. The risk of material loss from such claims is considered remote.
Report of Independent Registered Public Accounting Firm
To the Trustees of Fidelity Advisor Series VIII and Shareholders of Fidelity Advisor® Diversified International Fund:
In our opinion, the accompanying statement of assets and liabilities, including the schedule of investments, and the related statements of operations and of changes in net assets and the financial highlights present fairly, in all material respects, the financial position of Fidelity Advisor® Diversified International Fund (a fund of Fidelity Advisor Series VIII) at October 31, 2015, the results of its operations for the year then ended, the changes in its net assets for each of the two years in the period and the financial highlights for each of the periods indicated, in conformity with accounting principles generally accepted in the United States of America. These financial statements and financial highlights (hereafter referred to as “financial statements”) are the responsibility of the Fidelity Advisor® Diversified International Fund’s management. Our responsibility is to express an opinion on these financial statements based on our audits. We conducted our audits of these financial statements in accordance with the standards of the Public Company Accounting Oversight Board (United States). Those standards require that we plan and perform the audit to obtain reasonable assurance about whether the financial statements are free of material misstatement. An audit includes examining, on a test basis, evidence supporting the amounts and disclosures in the financial statements, assessing the accounting principles used and significant estimates made by management, and evaluating the overall financial statement presentation. We believe that our audits, which included confirmation of securities at October 31, 2015 by correspondence with the custodian and brokers, provide a reasonable basis for our opinion.
PricewaterhouseCoopers LLP
Boston, Massachusetts
December 16, 2015
Trustees and Officers
The Trustees, Members of the Advisory Board (if any), and officers of the trust and fund, as applicable, are listed below. The Board of Trustees governs the fund and is responsible for protecting the interests of shareholders. The Trustees are experienced executives who meet periodically throughout the year to oversee the fund's activities, review contractual arrangements with companies that provide services to the fund, oversee management of the risks associated with such activities and contractual arrangements, and review the fund's performance. Each of the Trustees oversees 170 funds.
The Trustees hold office without limit in time except that (a) any Trustee may resign; (b) any Trustee may be removed by written instrument, signed by at least two-thirds of the number of Trustees prior to such removal; (c) any Trustee who requests to be retired or who has become incapacitated by illness or injury may be retired by written instrument signed by a majority of the other Trustees; and (d) any Trustee may be removed at any special meeting of shareholders by a two-thirds vote of the outstanding voting securities of the trust. Each Trustee who is not an interested person (as defined in the 1940 Act) of the trust and the fund is referred to herein as an Independent Trustee. Each Independent Trustee shall retire not later than the last day of the calendar year in which his or her 75th birthday occurs. The Independent Trustees may waive this mandatory retirement age policy with respect to individual Trustees. Officers and Advisory Board Members hold office without limit in time, except that any officer or Advisory Board Member may resign or may be removed by a vote of a majority of the Trustees at any regular meeting or any special meeting of the Trustees. Except as indicated, each individual has held the office shown or other offices in the same company for the past five years.
The fund’s Statement of Additional Information (SAI) includes more information about the Trustees. To request a free copy, call Fidelity at 1-877-208-0098.
Experience, Skills, Attributes, and Qualifications of the Trustees. The Governance and Nominating Committee has adopted a statement of policy that describes the experience, qualifications, attributes, and skills that are necessary and desirable for potential Independent Trustee candidates (Statement of Policy). The Board believes that each Trustee satisfied at the time he or she was initially elected or appointed a Trustee, and continues to satisfy, the standards contemplated by the Statement of Policy. The Governance and Nominating Committee also engages professional search firms to help identify potential Independent Trustee candidates who have the experience, qualifications, attributes, and skills consistent with the Statement of Policy. From time to time, additional criteria based on the composition and skills of the current Independent Trustees, as well as experience or skills that may be appropriate in light of future changes to board composition, business conditions, and regulatory or other developments, have also been considered by the professional search firms and the Governance and Nominating Committee. In addition, the Board takes into account the Trustees' commitment and participation in Board and committee meetings, as well as their leadership of standing and ad hoc committees throughout their tenure.
In determining that a particular Trustee was and continues to be qualified to serve as a Trustee, the Board has considered a variety of criteria, none of which, in isolation, was controlling. The Board believes that, collectively, the Trustees have balanced and diverse experience, qualifications, attributes, and skills, which allow the Board to operate effectively in governing the fund and protecting the interests of shareholders. Information about the specific experience, skills, attributes, and qualifications of each Trustee, which in each case led to the Board's conclusion that the Trustee should serve (or continue to serve) as a trustee of the fund, is provided below.
Board Structure and Oversight Function. James C. Curvey is an interested person and currently serves as Chairman. The Trustees have determined that an interested Chairman is appropriate and benefits shareholders because an interested Chairman has a personal and professional stake in the quality and continuity of services provided to the fund. Independent Trustees exercise their informed business judgment to appoint an individual of their choosing to serve as Chairman, regardless of whether the Trustee happens to be independent or a member of management. The Independent Trustees have determined that they can act independently and effectively without having an Independent Trustee serve as Chairman and that a key structural component for assuring that they are in a position to do so is for the Independent Trustees to constitute a substantial majority for the Board. The Independent Trustees also regularly meet in executive session. Ned C. Lautenbach serves as Chairman of the Independent Trustees and as such (i) acts as a liaison between the Independent Trustees and management with respect to matters important to the Independent Trustees and (ii) with management prepares agendas for Board meetings.
Fidelity® funds are overseen by different Boards of Trustees. The fund's Board oversees Fidelity's high income and certain equity funds, and other Boards oversee Fidelity's investment-grade bond, money market, asset allocation, and sector funds. The asset allocation funds may invest in Fidelity® funds overseen by the fund's Board. The use of separate Boards, each with its own committee structure, allows the Trustees of each group of Fidelity® funds to focus on the unique issues of the funds they oversee, including common research, investment, and operational issues. On occasion, the separate Boards establish joint committees to address issues of overlapping consequences for the Fidelity® funds overseen by each Board.
The Trustees operate using a system of committees to facilitate the timely and efficient consideration of all matters of importance to the Trustees, the fund, and fund shareholders and to facilitate compliance with legal and regulatory requirements and oversight of the fund's activities and associated risks. The Board, acting through its committees, has charged FMR and its affiliates with (i) identifying events or circumstances the occurrence of which could have demonstrably adverse effects on the fund's business and/or reputation; (ii) implementing processes and controls to lessen the possibility that such events or circumstances occur or to mitigate the effects of such events or circumstances if they do occur; and (iii) creating and maintaining a system designed to evaluate continuously business and market conditions in order to facilitate the identification and implementation processes described in (i) and (ii) above. Because the day-to-day operations and activities of the fund are carried out by or through FMR, its affiliates, and other service providers, the fund's exposure to risks is mitigated but not eliminated by the processes overseen by the Trustees. While each of the Board's committees has responsibility for overseeing different aspects of the fund's activities, oversight is exercised primarily through the Operations, Audit, and Compliance Committees. In addition, the Independent Trustees have worked with FMR to enhance the Board's oversight of investment and financial risks, legal and regulatory risks, technology risks, and operational risks, including the development of additional risk reporting to the Board. For example, a working group comprised of Independent Trustees and FMR has worked and continues to work to review the Fidelity® funds' valuation-related activities, reporting and risk management. Appropriate personnel, including but not limited to the fund's Chief Compliance Officer (CCO), FMR's internal auditor, the independent accountants, the fund's Treasurer and portfolio management personnel, make periodic reports to the Board's committees, as appropriate, including an annual review of Fidelity's risk management program for the Fidelity® funds. The responsibilities of each standing committee, including their oversight responsibilities, are described further under "Standing Committees of the Trustees."
Interested Trustees*:
Correspondence intended for a Trustee who is an interested person may be sent to Fidelity Investments, 245 Summer Street, Boston, Massachusetts 02210.
Name, Year of Birth; Principal Occupations and Other Relevant Experience+
James C. Curvey (1935)
Year of Election or Appointment: 2007
Trustee
Chairman of the Board of Trustees
Mr. Curvey also serves as Trustee of other Fidelity® funds. Mr. Curvey is a Director of Fidelity Research & Analysis Co. (investment adviser firm, 2009-present), and Vice Chairman (2007-present) and Director of FMR LLC (diversified financial services company). In addition, Mr. Curvey serves as an Overseer for the Boston Symphony Orchestra and a member of the board of Artis-Naples, Naples, Florida, and as a Trustee for Brewster Academy, Wolfeboro, New Hampshire. Previously, Mr. Curvey served as a Director of Fidelity Investments Money Management, Inc. (investment adviser firm, 2009-2014) and a Director of FMR and FMR Co., Inc. (investment adviser firms, 2007-2014).
Charles S. Morrison (1960)
Year of Election or Appointment: 2014
Trustee
Mr. Morrison also serves as Trustee of other funds. He serves as a Director of Fidelity Investments Money Management, Inc. (FIMM) (investment adviser firm, 2014-present), Director of Fidelity SelectCo, LLC (investment adviser firm, 2014-present), President, Asset Management (2014-present), and is an employee of Fidelity Investments. Previously, Mr. Morrison served as Vice President of Fidelity's Fixed Income and Asset Allocation Funds (2012-2014), President, Fixed Income (2011-2014), Vice President of Fidelity's Money Market Funds (2005-2009), President, Money Market Group Leader of FMR (investment adviser firm, 2009), and Senior Vice President, Money Market Group of FMR (2004-2009). Mr. Morrison also served as Vice President of Fidelity's Bond Funds (2002-2005), certain Balanced Funds (2002-2005), and certain Asset Allocation Funds (2002-2007), and as Senior Vice President (2002-2005) of Fidelity's Bond Division.
* Determined to be an “Interested Trustee” by virtue of, among other things, his or her affiliation with the trust or various entities under common control with FMR.
+ The information includes the Trustee's principal occupation during the last five years and other information relating to the experience, attributes, and skills relevant to the Trustee's qualifications to serve as a Trustee, which led to the conclusion that the Trustee should serve as a Trustee for the fund.
Independent Trustees:
Correspondence intended for an Independent Trustee may be sent to Fidelity Investments, P.O. Box 55235, Boston, Massachusetts 02205-5235.
Name, Year of Birth; Principal Occupations and Other Relevant Experience+
Dennis J. Dirks (1948)
Year of Election or Appointment: 2005
Trustee
Mr. Dirks also serves as Trustee of other Fidelity® funds. Prior to his retirement in May 2003, Mr. Dirks was Chief Operating Officer and a member of the Board of The Depository Trust & Clearing Corporation (DTCC). He also served as President, Chief Operating Officer, and Board member of The Depository Trust Company (DTC) and President and Board member of the National Securities Clearing Corporation (NSCC). In addition, Mr. Dirks served as Chief Executive Officer and Board member of the Government Securities Clearing Corporation, Chief Executive Officer and Board member of the Mortgage-Backed Securities Clearing Corporation, as a Trustee and a member of the Finance Committee of Manhattan College (2005-2008), as a Trustee and a member of the Finance Committee of AHRC of Nassau County (2006-2008), and as a member of the Independent Directors Council (IDC) Governing Council (2010-2015). Mr. Dirks is a member of the Board of Directors for The Brookville Center for Children's Services, Inc. (2009-present).
Alan J. Lacy (1953)
Year of Election or Appointment: 2008
Trustee
Mr. Lacy also serves as Trustee of other Fidelity® funds. Mr. Lacy serves as a member of the Board of Directors of Dave & Buster's Entertainment, Inc. (restaurant and entertainment complexes, 2010-present) and Bristol-Myers Squibb Company (global pharmaceuticals, 2008-present). In addition, Mr. Lacy served as Senior Adviser (2007-2014) of Oak Hill Capital Partners, L.P. (private equity) and also served as Chief Executive Officer (2000-2005) and Vice Chairman (2005-2006) of Sears Holdings Corporation and Sears, Roebuck and Co. (retail). Mr. Lacy is a member of the Board of Trustees of The National Parks Conservation Association (2006-present). Previously, Mr. Lacy served as Chairman of the Board of Trustees of the National Parks Conservation Association (2008-2011) and as a member of the Board of Directors for The Western Union Company (global money transfer, 2006-2011), The Hillman Companies, Inc. (hardware wholesalers, 2010-2014), and Earth Fare, Inc. (retail grocery, 2010-2014).
Ned C. Lautenbach (1944)
Year of Election or Appointment: 2000
Trustee
Chairman of the Independent Trustees
Mr. Lautenbach also serves as Trustee of other Fidelity® funds. Mr. Lautenbach currently serves as the Lead Director of the Eaton Corporation Board of Directors (diversified industrial, 1997-present). Mr. Lautenbach is Chairman of the Board of Directors of Artis-Naples in Naples, Florida (2012-present), a member of the Council on Foreign Relations (1994-present), and a member of the Board of Governors, State University System of Florida (2013-present). Previously, Mr. Lautenbach was a Partner/Advisory Partner at Clayton, Dubilier & Rice, LLC (private equity investment, 1998-2010), as well as a Director of Sony Corporation (2006-2007).
Joseph Mauriello (1944)
Year of Election or Appointment: 2008
Trustee
Mr. Mauriello also serves as Trustee of other Fidelity® funds. Prior to his retirement in January 2006, Mr. Mauriello served in numerous senior management positions including Deputy Chairman and Chief Operating Officer (2004-2005), and Vice Chairman of Financial Services (2002-2004) of KPMG LLP US (professional services, 1965-2005). Mr. Mauriello currently serves as a member of the Board of Directors of XL Group plc. (global insurance and re-insurance, 2006-present) and the Independent Directors Council (IDC) Governing Council (2015-present). Previously, Mr. Mauriello served as a Director of the Hamilton Funds of the Bank of New York (2006-2007) and of Arcadia Resources Inc. (health care services and products, 2007-2012).
Robert W. Selander (1950)
Year of Election or Appointment: 2011
Trustee
Mr. Selander also serves as Trustee of other Fidelity® funds. Mr. Selander serves as a Director of The Western Union Company (global money transfer, 2014-present). Previously, Mr. Selander served as a Member of the Advisory Board of other Fidelity® funds (2011), and Executive Vice Chairman (2010), Chief Executive Officer (2009-2010), and President and Chief Executive Officer (1997-2009) of Mastercard, Inc.
Cornelia M. Small (1944)
Year of Election or Appointment: 2005
Trustee
Ms. Small also serves as Trustee of other Fidelity® funds. Ms. Small is a member of the Board of Directors (2009-present) and Chair of the Investment Committee (2010-present) of the Teagle Foundation. Ms. Small also serves on the Investment Committee of the Berkshire Taconic Community Foundation (2008-present). Previously, Ms. Small served as Chairperson (2002-2008) and a member of the Investment Committee and Chairperson (2008-2012) and a member of the Board of Trustees of Smith College. In addition, Ms. Small served as Chief Investment Officer, Director of Global Equity Investments, and a member of the Board of Directors of Scudder, Stevens & Clark and Scudder Kemper Investments.
William S. Stavropoulos (1939)
Year of Election or Appointment: 2001
Trustee
Vice Chairman of the Independent Trustees
Mr. Stavropoulos also serves as Trustee of other Fidelity® funds. Mr. Stavropoulos serves as President and Founder of the Michigan Baseball Foundation, the Great Lakes Loons (2007-present). Mr. Stavropoulos is Chairman Emeritus of the Board of Directors of The Dow Chemical Company, where he previously served in numerous senior management positions, including President, CEO (1995-2000; 2002-2004), Chairman of the Executive Committee (2000-2006), and as a member of the Board of Directors (1990-2006). Currently, Mr. Stavropoulos is Chairman of the Board of Directors of Univar Inc. (global distributor of commodity and specialty chemicals), a Director of Teradata Corporation (data warehousing and technology solutions), and Maersk Inc. (industrial conglomerate), and a member of the Advisory Board for Metalmark Capital LLC (private equity investment, 2005-present). Mr. Stavropoulos is an operating advisor to Clayton, Dubilier & Rice, LLC (private equity investment). In addition, Mr. Stavropoulos is a member of the University of Notre Dame Advisory Council for the College of Science, a Trustee of the Rollin L. Gerstacker Foundation, and a Director of the Naples Philharmonic Center for the Arts. Previously, Mr. Stavropoulos served as a Director of Chemical Financial Corporation (bank holding company, 1993-2012) and Tyco International, Ltd. (multinational manufacturing and services, 2007-2012).
David M. Thomas (1949)
Year of Election or Appointment: 2008
Trustee
Mr. Thomas also serves as Trustee of other Fidelity® funds. Mr. Thomas serves as Non-Executive Chairman of the Board of Directors of Fortune Brands Home and Security (home and security products, 2011-present), as a member of the Board of Directors (2004-present) and Presiding Director (2013-present) of Interpublic Group of Companies, Inc. (marketing communication), and as a member of the Board of Trustees of the University of Florida (2013-present). Previously, Mr. Thomas served as Executive Chairman (2005-2006) and Chairman and Chief Executive Officer (2000-2005) of IMS Health, Inc. (pharmaceutical and healthcare information solutions), and a Director of Fortune Brands, Inc. (consumer products, 2000-2011).
+ The information includes the Trustee's principal occupation during the last five years and other information relating to the experience, attributes, and skills relevant to the Trustee's qualifications to serve as a Trustee, which led to the conclusion that the Trustee should serve as a Trustee for the fund.
Advisory Board Members and Officers:
Correspondence intended for an officer or Peter S. Lynch may be sent to Fidelity Investments, 245 Summer Street, Boston, Massachusetts 02210. Officers appear below in alphabetical order.
Name, Year of Birth; Principal Occupation
Peter S. Lynch (1944)
Year of Election or Appointment: 2003
Member of the Advisory Board
Mr. Lynch also serves as Member of the Advisory Board of other Fidelity® funds. Mr. Lynch is Vice Chairman and a Director of FMR (investment adviser firm) and FMR Co., Inc. (investment adviser firm). In addition, Mr. Lynch serves as a Trustee of Boston College and as the Chairman of the Inner-City Scholarship Fund. Previously, Mr. Lynch served on the Special Olympics International Board of Directors (1997-2006).
Elizabeth Paige Baumann (1968)
Year of Election or Appointment: 2012
Anti-Money Laundering (AML) Officer
Ms. Baumann also serves as AML Officer of other funds. She is Chief AML Officer of FMR LLC (diversified financial services company, 2012-present) and is an employee of Fidelity Investments. Previously, Ms. Baumann served as Vice President and Deputy Anti-Money Laundering Officer (2007-2012).
Marc R. Bryant (1966)
Year of Election or Appointment: 2015
Secretary and Chief Legal Officer (CLO)
Mr. Bryant also serves as Secretary and CLO of other funds. Mr. Bryant serves as CLO, Secretary, and Senior Vice President of Fidelity Management & Research Company (investment adviser firm, 2015-present) and FMR Co., Inc. (investment adviser firm, 2015-present); Secretary of Fidelity SelectCo, LLC (investment adviser firm, 2015-present) and Fidelity Investments Money Management, Inc. (investment adviser firm, 2015-present); and CLO of Fidelity Management & Research (Hong Kong) Limited (investment adviser firm, 2015-present). He is Senior Vice President and Deputy General Counsel of FMR LLC (diversified financial services company). Previously, Mr. Bryant served as Secretary and Chief Legal Officer of Fidelity Rutland Square Trust II (2010-2014) and Assistant Secretary of Fidelity's Fixed Income and Asset Allocation Funds (2013-2015). Prior to joining Fidelity Investments, Mr. Bryant served as a Senior Vice President and the Head of Global Retail Legal for AllianceBernstein L.P. (2006-2010), and as the General Counsel for ProFund Advisors LLC (2001-2006).
Timothy M. Cohen (1969)
Vice President of certain Equity Funds
Mr. Cohen also serves as Vice President of other funds. Mr. Cohen serves as Chief Compliance Officer of FMR Investment Management (U.K.) Limited (investment adviser firm, 2013-present) and is an employee of Fidelity Investments. Previously, Mr. Cohen served as a Director of FMR Investment Management (U.K.) Limited (2013-2015).
William C. Coffey (1969)
Year of Election or Appointment: 2009
Assistant Secretary
Mr. Coffey also serves as Assistant Secretary of other funds. He is Senior Vice President and Deputy General Counsel of FMR LLC (diversified financial services company, 2010-present), and is an employee of Fidelity Investments. Previously, Mr. Coffey served as Vice President and Associate General Counsel of FMR LLC (2005-2009).
Jonathan Davis (1968)
Year of Election or Appointment: 2010
Assistant Treasurer
Mr. Davis also serves as Assistant Treasurer of other funds, and is an employee of Fidelity Investments. Previously, Mr. Davis served as Vice President and Associate General Counsel of FMR LLC (diversified financial services company, 2003-2010).
Adrien E. Deberghes (1967)
Year of Election or Appointment: 2008
Deputy Treasurer
Mr. Deberghes also serves as an officer of other funds. He is an employee of Fidelity Investments (2008-present). Prior to joining Fidelity Investments, Mr. Deberghes was Senior Vice President of Mutual Fund Administration at State Street Corporation (2007-2008), Senior Director of Mutual Fund Administration at Investors Bank & Trust (2005-2007), and Director of Finance for Dunkin' Brands (2000-2005).
Stephanie J. Dorsey (1969)
Year of Election or Appointment: 2010
Assistant Treasurer
Ms. Dorsey also serves as an officer of other funds. She is an employee of Fidelity Investments (2008-present) and has served in other fund officer roles. Prior to joining Fidelity Investments, Ms. Dorsey served as Treasurer (2004-2008) of the JPMorgan Mutual Funds and Vice President (2004-2008) of JPMorgan Chase Bank.
Howard J. Galligan III (1966)
Year of Election or Appointment: 2014
Chief Financial Officer
Mr. Galligan also serves as Chief Financial Officer of other funds. Mr. Galligan serves as President of Fidelity Pricing and Cash Management Services (FPCMS) (2014-present) and as a Director of Strategic Advisers, Inc. (investment adviser firm, 2008-present). Previously, Mr. Galligan served as Chief Administrative Officer of Asset Management (2011-2014) and Chief Operating Officer and Senior Vice President of Investment Support for Strategic Advisers, Inc. (2003-2011).
Scott C. Goebel (1968)
Year of Election or Appointment: 2015
Vice President
Mr. Goebel serves as Vice President of other funds and is an employee of Fidelity Investments (2001-present). Previously, Mr. Goebel served as Secretary of Fidelity SelectCo, LLC (investment adviser firm, 2013-2015), Fidelity Investments Money Management, Inc. (FIMM) (investment adviser firm, 2010-2015), and Fidelity Research and Analysis Company (FRAC) (investment adviser firm, 2010-2015); General Counsel, Secretary, and Senior Vice President of Fidelity Management & Research Company (investment adviser firm, 2008-2015) and FMR Co., Inc. (investment adviser firm, 2008-2015); Assistant Secretary of Fidelity Management & Research (Japan) Limited (investment adviser firm, 2008-2015) and FMR Investment Management (U.K.) Limited (investment adviser firm, 2008-2015); Chief Legal Officer (CLO) of Fidelity Management & Research (Hong Kong) Limited (investment adviser firm, 2008-2015); Secretary and CLO of certain Fidelity® funds (2008-2015); Assistant Secretary of FIMM (2008-2010), FRAC (2008-2010), and certain funds (2007-2008); and as Vice President and Secretary of Fidelity Distributors Corporation (FDC) (2005-2007).
Brian B. Hogan (1964)
Year of Election or Appointment: 2009
Vice President
Mr. Hogan also serves as Trustee or Vice President of other funds. Mr. Hogan serves as a Director of Fidelity SelectCo, LLC (investment adviser firm, 2014-present) and President of the Equity Division of FMR (investment adviser firm, 2009-present). Previously, Mr. Hogan served as Senior Vice President, Equity Research of FMR (2006-2009) and as a portfolio manager.
Chris Maher (1972)
Year of Election or Appointment: 2013
Assistant Treasurer
Mr. Maher serves as Assistant Treasurer of other funds. Mr. Maher is Vice President of Valuation Oversight and is an employee of Fidelity Investments. Previously, Mr. Maher served as Vice President of Asset Management Compliance (2013), Vice President of the Program Management Group of FMR (investment adviser firm, 2010-2013), and Vice President of Valuation Oversight (2008-2010).
Kenneth B. Robins (1969)
Year of Election or Appointment: 2008
President and Treasurer
Mr. Robins also serves as an officer of other funds. Mr. Robins serves as Executive Vice President of Fidelity Investments Money Management, Inc. (FIMM) (investment adviser firm, 2013-present) and is an employee of Fidelity Investments (2004-present). Previously, Mr. Robins served in other fund officer roles.
Stacie M. Smith (1974)
Year of Election or Appointment: 2013
Deputy Treasurer
Ms. Smith also serves as an officer of other funds. She is an employee of Fidelity Investments (2009-present) and has served in other fund officer roles. Prior to joining Fidelity Investments, Ms. Smith served as Senior Audit Manager of Ernst & Young LLP (1996-2009).
Renee Stagnone (1975)
Year of Election or Appointment: 2013
Deputy Treasurer
Ms. Stagnone also serves as Deputy Treasurer of other funds. Ms. Stagnone is an employee of Fidelity Investments (1997-present).
Linda J. Wondrack (1964)
Year of Election or Appointment: 2014
Chief Compliance Officer
Ms. Wondrack also serves as Chief Compliance Officer of other funds. Ms. Wondrack is Executive Vice President and head of the Ethics Office and Asset Management Compliance for Fidelity Investments (2012-present). Ms. Wondrack also serves as Chief Compliance Officer of Fidelity SelectCo, LLC (investment adviser firm, 2014-present); Chief Compliance Officer of Impresa Management LLC (2013-present); and Chief Compliance Officer of FMR Co., Inc. (investment adviser firm), Fidelity Investments Money Management, Inc. (investment adviser firm), Fidelity Management & Research (Japan) Limited (investment adviser firm), FMR Investment Management (U.K.) Limited (investment adviser firm), Fidelity Management & Research (Hong Kong) (investment adviser firm), Fidelity Management & Research Company (investment adviser firm), FIAM LLC (investment adviser firm), and Strategic Advisers, Inc. (investment adviser firm), Ballyrock Investment Advisors LLC, and Northern Neck Investors LLC (2012-present). Previously, Ms. Wondrack served as Senior Vice President and Chief Compliance Officer for Columbia Management Investment Advisers, LLC (2005-2012); Chief Compliance Officer for certain funds within the Columbia Family of Funds (2007-2012); and Senior Vice President of Compliance Risk Management at Bank of America (2005-2010).
Joseph F. Zambello (1957)
Year of Election or Appointment: 2011
Deputy Treasurer
Mr. Zambello also serves as Deputy Treasurer of other funds. Mr. Zambello is an employee of Fidelity Investments (1991-present). Previously, Mr. Zambello served as Vice President of the Program Management Group of FMR (investment adviser firm, 2009-2011) and Vice President of the Transfer Agent Oversight Group (2005-2009).
Shareholder Expense Example
As a shareholder of the Fund, you incur two types of costs: (1) transaction costs, including sales charges (loads) on purchase payments or redemption proceeds, redemption fees and (2) ongoing costs, including management fees, distribution and/or service (12b-1) fees and other Fund expenses. This Example is intended to help you understand your ongoing costs (in dollars) of investing in the Fund and to compare these costs with the ongoing costs of investing in other mutual funds.
The Example is based on an investment of $1,000 invested at the beginning of the period and held for the entire period (May 1, 2015 to October 31, 2015).
Actual Expenses
The first line of the accompanying table for each class of the Fund provides information about actual account values and actual expenses. You may use the information in this line, together with the amount you invested, to estimate the expenses that you paid over the period. Simply divide your account value by $1,000.00 (for example, an $8,600 account value divided by $1,000.00 = 8.6), then multiply the result by the number in the first line for a class of the Fund under the heading entitled "Expenses Paid During Period" to estimate the expenses you paid on your account during this period. In addition, the Fund, as a shareholder in the underlying Fidelity Central Funds, will indirectly bear its pro-rata share of the fees and expenses incurred by the underlying Fidelity Central Funds. These fees and expenses are not included in the Fund's annualized expense ratio used to calculate the expense estimate in the table below.
Hypothetical Example for Comparison Purposes
The second line of the accompanying table for each class of the Fund provides information about hypothetical account values and hypothetical expenses based on a Class' actual expense ratio and an assumed rate of return of 5% per year before expenses, which is not the Class' actual return. The hypothetical account values and expenses may not be used to estimate the actual ending account balance or expenses you paid for the period. You may use this information to compare the ongoing costs of investing in the Fund and other funds. To do so, compare this 5% hypothetical example with the 5% hypothetical examples that appear in the shareholder reports of the other funds. In addition, the Fund, as a shareholder in the underlying Fidelity Central Funds, will indirectly bear its pro-rata share of the fees and expenses incurred by the underlying Fidelity Central Funds. These fees and expenses are not included in the Fund's annualized expense ratio used to calculate the expense estimate in the table below.
Please note that the expenses shown in the table are meant to highlight your ongoing costs only and do not reflect any transaction costs. Therefore, the second line of the table is useful in comparing ongoing costs only, and will not help you determine the relative total costs of owning different funds. In addition, if these transactional costs were included, your costs would have been higher.
| | Annualized Expense Ratio-A | Beginning
Account Value
May 1, 2015 | Ending
Account Value
October 31, 2015 | Expenses Paid
During Period-B
May 1, 2015
to October 31, 2015 |
| Class A | 1.21% | | | |
| Actual | | $1,000.00 | $963.60 | $5.99 |
| Hypothetical-C | | $1,000.00 | $1,019.11 | $6.16 |
| Class T | 1.47% | | | |
| Actual | | $1,000.00 | $962.30 | $7.27 |
| Hypothetical-C | | $1,000.00 | $1,017.80 | $7.48 |
| Class B | 2.03% | | | |
| Actual | | $1,000.00 | $959.70 | $10.03 |
| Hypothetical-C | | $1,000.00 | $1,014.97 | $10.31 |
| Class C | 1.96% | | | |
| Actual | | $1,000.00 | $960.00 | $9.68 |
| Hypothetical-C | | $1,000.00 | $1,015.32 | $9.96 |
| Class I | .94% | | | |
| Actual | | $1,000.00 | $965.10 | $4.66 |
| Hypothetical-C | | $1,000.00 | $1,020.47 | $4.79 |
| Class Z | .79% | | | |
| Actual | | $1,000.00 | $965.50 | $3.91 |
| Hypothetical-C | | $1,000.00 | $1,021.22 | $4.02 |
A Annualized expense ratio reflects expenses net of applicable fee waivers.
B Expenses are equal to each Class' annualized expense ratio, multiplied by the average account value over the period, multiplied by 184/365 (to reflect the one-half year period).
C 5% return per year before expenses
Distributions (Unaudited)
A percentage of the dividends distributed during the fiscal year for the following funds qualifies for the dividends–received deduction for corporate shareholders:
| | 12/05/2014 | 12/26/2014 |
| | | |
| Class I | 6% | 13% |
Class I designates 100% of the dividends distributed during the fiscal year as amounts which may be taken into account as a dividend for purposes of the maximum rate under section 1(h)(11) of the Internal Revenue Code.
The amounts per share which represent income derived from sources within, and taxes paid to, foreign countries or possessions of the United States are as follows:
| | Pay Date | Income | Taxes |
| Class I | 12/08/14 | $0.2827 | $0.0197 |
| | 12/29/14 | $0.0220 | $0.0000 |
The fund will notify shareholders in January 2016 of amounts for use in preparing 2015 income tax returns.
Board Approval of Investment Advisory Contracts and Management Fees
Fidelity Advisor Diversified International Fund
Each year, the Board of Trustees, including the Independent Trustees (together, the Board), votes on the renewal of the management contract with Fidelity Management & Research Company (FMR) and the sub-advisory agreements (together, the Advisory Contracts) for the fund. The Board, assisted by the advice of fund counsel and Independent Trustees' counsel, requests and considers a broad range of information relevant to the renewal of the Advisory Contracts throughout the year.
The Board meets regularly and, at each of its meetings, covers an extensive agenda of topics and materials and considers factors that are relevant to its annual consideration of the renewal of the fund's Advisory Contracts, including the services and support provided to the fund and its shareholders. The Board has established various standing committees (Committees), each composed of and chaired by Independent Trustees with varying backgrounds, to which the Board has assigned specific subject matter responsibilities in order to enhance effective decision-making by the Board. The Board, acting directly and through its Committees, requests and receives information concerning the annual consideration of the renewal of the fund's Advisory Contracts. The Board also meets as needed to consider matters specifically related to the Board's annual consideration of the renewal of the Advisory Contracts. Members of the Board may also meet with trustees of other Fidelity funds through ad hoc joint committees to discuss certain matters relevant to all of the Fidelity funds.
At its July 2015 meeting, the Board unanimously determined to renew the fund's Advisory Contracts. In reaching its determination, the Board considered all factors it believed relevant, including (i) the nature, extent, and quality of the services to be provided to the fund and its shareholders (including the investment performance of the fund); (ii) the competitiveness of the fund's management fee and total expense ratio relative to peer funds; (iii) the total costs of the services to be provided by and the profits to be realized by Fidelity from its relationship with the fund; and (iv) the extent to which (if any) economies of scale exist and would be realized as the fund grows, and whether any economies of scale are appropriately shared with fund shareholders.
In considering whether to renew the Advisory Contracts for the fund, the Board reached a determination, with the assistance of fund counsel and Independent Trustees' counsel and through the exercise of its business judgment, that the renewal of the Advisory Contracts was in the best interests of the fund and its shareholders and that the compensation payable under the Advisory Contracts was fair and reasonable. The Board's decision to renew the Advisory Contracts was not based on any single factor, but rather was based on a comprehensive consideration of all the information provided to the Board at its meetings throughout the year. The Board, in reaching its determination to renew the Advisory Contracts, was aware that shareholders of the fund have a broad range of investment choices available to them, including a wide choice among funds offered by Fidelity's competitors, and that the fund's shareholders, who have the opportunity to review and weigh the disclosure provided by the fund in its prospectus and other public disclosures, have chosen to invest in this fund, which is part of the Fidelity family of funds.
Nature, Extent, and Quality of Services Provided. The Board considered Fidelity's staffing as it relates to the fund, including the backgrounds of investment personnel of Fidelity, and also considered the fund's investment objective, strategies, and related investment philosophy. The Independent Trustees also had discussions with senior management of Fidelity's investment operations and investment groups. The Board considered the structure of the portfolio manager compensation program and whether this structure provides appropriate incentives to act in the best interests of the fund. Additionally, the Board considered the portfolio managers' investments, if any, in the funds that they manage.
Resources Dedicated to Investment Management and Support Services. The Board and the Fund Oversight and Research Committees reviewed the general qualifications and capabilities of Fidelity's investment staff, including its size, education, experience, and resources, as well as Fidelity's approach to recruiting, training, managing, and compensating investment personnel. The Board noted that Fidelity has continued to increase the resources devoted to non-U.S. offices, including expansion of Fidelity's global investment organization. The Board also noted that Fidelity's analysts have extensive resources, tools and capabilities that allow them to conduct sophisticated quantitative and fundamental analysis, as well as credit analysis of issuers, counterparties and guarantors. Further, the Board considered that Fidelity's investment professionals have sufficient access to global information and data so as to provide competitive investment results over time, and that those professionals also have access to sophisticated tools that permit them to assess portfolio construction and risk and performance attribution characteristics continuously, as well as to transmit new information and research conclusions rapidly around the world. Additionally, in its deliberations, the Board considered Fidelity's trading, risk management, and compliance capabilities and resources, which are integral parts of the investment management process.
Shareholder and Administrative Services. The Board considered (i) the nature, extent, quality, and cost of advisory, administrative, and shareholder services performed by FMR, the sub-advisers (together with FMR, the Investment Advisers), and their affiliates under the Advisory Contracts and under separate agreements covering transfer agency, pricing and bookkeeping, and securities lending services for the fund; (ii) the nature and extent of the supervision of third party service providers, principally custodians and subcustodians; and (iii) the resources devoted to, and the record of compliance with, the fund's compliance policies and procedures. The Board also reviewed the allocation of fund brokerage, including allocations to brokers affiliated with the Investment Advisers, the use of brokerage commissions to pay fund expenses, and the use of "soft" commission dollars to pay for research services.
The Board noted that the growth of fund assets over time across the complex allows Fidelity to reinvest in the development of services designed to enhance the value or convenience of the Fidelity funds as investment vehicles. These services include 24-hour access to account information and market information through telephone representatives and over the Internet, investor education materials and asset allocation tools, and the expanded availability of Fidelity Investor Centers.
In 2014, the Board formed an ad hoc Committee on Transfer Agency Fees to review the variety of transfer agency fee structures throughout the industry and Fidelity's competitive positioning with respect to industry participants.
Investment in a Large Fund Family. The Board considered the benefits to shareholders of investing in a Fidelity fund, including the benefits of investing in a fund that is part of a large family of funds offering a variety of investment disciplines and providing a large variety of mutual fund investor services. The Board noted that Fidelity had taken, or had made recommendations that resulted in the Fidelity funds taking, a number of actions over the previous year that benefited particular funds, including (i) continuing to dedicate additional resources to investment research and to the support of the senior management team that oversees asset management; (ii) continuing efforts to enhance Fidelity's global research capabilities; (iii) launching new funds and making other enhancements to meet client needs; (iv) reducing management fees and total expenses for certain index funds and diversified international funds; (v) continuing to launch dedicated lower cost underlying funds to meet portfolio construction needs related to expanding underlying fund options for Fidelity funds of funds, specifically for the Freedom Fund product lines; (vi) rationalizing product lines and gaining increased efficiencies through fund mergers; (vii) launching active fixed-income exchange-traded funds; (viii) continuing to develop, acquire and implement systems and technology to improve services to the funds and information security and to increase efficiency; (ix) implementing investment enhancements to further strengthen Fidelity's target date product line to increase investors' probability of success in achieving their goals; (x) modifying the eligibility criteria for certain share classes to accommodate roll-over assets from employer-sponsored retirement plans; (xi) launching a new Class W of the Freedom Index Funds to attract and retain Fidelity record-kept retirement plan assets; and (xii) implementing changes to Fidelity's money market product line in response to recent money market regulatory reforms.
Investment Performance. The Board considered whether the fund has operated in accordance with its investment objective, as well as its record of compliance with its investment restrictions and its performance history. The Board noted that there was a portfolio management change for the fund in January 2014.
The Board took into account discussions with representatives of the Investment Advisers about fund investment performance that occur at Board meetings throughout the year. In this regard the Board noted that as part of regularly scheduled fund reviews and other reports to the Board on fund performance, the Board considers annualized return information for the fund, for different time periods, measured against a securities market index ("benchmark index") and a peer group of funds with similar objectives ("peer group"), if any. In its evaluation of fund investment performance, the Board gave particular attention to information indicating changes in performance of certain Fidelity funds for specific time periods and discussed with the Investment Advisers the reasons for any overperformance or underperformance.
In addition to reviewing absolute and relative fund performance, the Independent Trustees periodically consider the appropriateness of fund performance metrics in evaluating the results achieved. In general, the Independent Trustees believe that fund performance should be evaluated based on net performance (after fees and expenses) of both the highest performing and lowest performing fund share classes, where applicable, compared to appropriate benchmark indices, over appropriate time periods that may include full market cycles, and compared to peer groups, as applicable, over the same periods, taking into account relevant factors including the following: general market conditions; issuer-specific information; and fund cash flows and other factors.
The Independent Trustees recognize that shareholders evaluate performance on a net basis over their own holding periods, for which one-, three-, and five-year periods are often used as a proxy. For this reason, the performance information reviewed by the Board also included net cumulative calendar year total return information for the fund and an appropriate benchmark index and peer group for the most recent one-, three-, and five-year periods, as shown below. Returns are shown compared to the 25th percentile (top of box, 75% beaten) and 75th percentile (bottom of box, 25% beaten) of the peer universe. Returns of the benchmark index are "net MA,"
i.e., adjusted for tax withholding rates applicable to U.S.-based funds organized as Massachusetts business trusts.
Fidelity Advisor Diversified International Fund
Based on its review, the Board concluded that the nature, extent, and quality of services provided to the fund under the Advisory Contracts should benefit the shareholders of the fund.
Competitiveness of Management Fee and Total Expense Ratio. The Board considered the fund's management fee and total expense ratio compared to "mapped groups" of competitive funds and classes created for the purpose of facilitating the Trustees' competitive analysis of management fees and total expenses. Fidelity creates "mapped groups" by combining similar Lipper investment objective categories that have comparable investment mandates. Combining Lipper investment objective categories aids the Board's management fee and total expense ratio comparisons by broadening the competitive group used for comparison.
Management Fee. The Board considered two proprietary management fee comparisons for the 12-month periods shown in basis points (BP) in the chart below. The group of Lipper funds used by the Board for management fee comparisons is referred to below as the "Total Mapped Group." The Total Mapped Group comparison focuses on a fund's standing in terms of gross management fees before expense reimbursements or caps relative to the total universe of funds with comparable investment mandates, regardless of whether their management fee structures also are comparable. Funds with comparable investment mandates offer exposure to similar types of securities. Funds with comparable management fee structures have similar management fee contractual arrangements (
e.g., flat rate charged for advisory services, all-inclusive fee rate,
etc.). "TMG %" represents the percentage of funds in the Total Mapped Group that had management fees that were lower than the fund's. For example, a hypothetical TMG % of 20% would mean that 80% of the funds in the Total Mapped Group had higher, and 20% had lower, management fees than the fund. The fund's actual TMG %s and the number of funds in the Total Mapped Group are in the chart below. The "Asset-Size Peer Group" (ASPG) comparison focuses on a fund's standing relative to a subset of non-Fidelity funds within the Total Mapped Group that are similar in size and management fee structure without taking into account performance adjustments, if any. For example, if a fund is in the first quartile of the ASPG, the fund's management fee ranks in the least expensive or lowest 25% of funds in the ASPG. The ASPG represents at least 15% of the funds in the Total Mapped Group with comparable asset size and management fee structures, subject to a minimum of 50 funds (or all funds in the Total Mapped Group if fewer than 50). Additional information, such as the ASPG quartile in which the fund's management fee rate ranked, is also included in the chart and considered by the Board.
Fidelity Advisor Diversified International Fund
The Board noted that the fund's management fee rate ranked below the median of its Total Mapped Group and below the median of its ASPG for 2014.
Furthermore, the Board considered that it had approved a reduction (effective August 1, 2014) in the individual fund fee rate component of the management fee rate for the fund from 0.450% to 0.424%. The Board considered that the chart reflects the fund's lower management fee for 2014, as if the lower fee were in effect for the entire year.
The Board noted that, in 2014, the ad hoc Committee on Group Fee was formed by it and other Fidelity fund boards to conduct an in-depth review of the "group fee" component of the management fee of funds with such management fee structures. Committee focus included the mechanics of the group fee, the competitive landscape of group fee structures, Fidelity funds with no group fee component and investment products not included in group fee assets. The Board also considered that, for funds subject to the group fee, FMR agreed to voluntarily waive fees over a specified period of time in amounts designed to account for assets converted from certain funds to certain collective investment trusts.
The Board also noted that, in 2013, the ad hoc Committee on Management Fees was formed to conduct an in-depth review of the management fee rates of Fidelity's active equity mutual funds. The Committee focused on the following areas: (i) standard fee structures; (ii) research consumption and trading evolution; (iii) management fee competitiveness/profitability by category; and (iv) factors that drive institutional pricing.
Based on its review, the Board concluded that the fund's management fee is fair and reasonable in light of the services that the fund receives and the other factors considered.
Total Expense Ratio. In its review of each class's total expense ratio, the Board considered the fund's management fee as well as other fund or class expenses, as applicable, such as transfer agent fees, pricing and bookkeeping fees, fund-paid 12b-1 fees, and custodial, legal, and audit fees. The Board also noted that Fidelity may agree to waive fees and expenses from time to time, and the extent to which, if any, it has done so for the fund. As part of its review, the Board also considered the current and historical total expense ratios of each class of the fund compared to competitive fund median expenses. Each class of the fund is compared to those funds and classes in the Total Mapped Group (used by the Board for management fee comparisons) that have a similar sales load structure.
The Board noted that the total expense ratio of each of Class A, Class B, Class C, Class I, and Class Z ranked below its competitive median for 2014 and the total expense ratio of Class T ranked above its competitive median for 2014. The Board considered that, in general, various factors can affect total expense ratios. The Board noted that the total expense ratio of Class T was above the competitive median primarily because of higher 12b-1 fees on Class T as compared to most competitor funds. Class T has a higher 12b-1 fee, but a lower front-end sales charge, than traditionally priced front-end sales charge classes. The Board considered that Class T is primarily sold load-waived in the retirement plan market where its 0.50% 12b-1 fee is comparable to competing no-load, higher 12b-1 fee classes designed specifically for retirement plans. The Board noted that the fund offers multiple classes, each of which has a different sales load and 12b1 fee structure, and that the multiple structures are intended to offer a range of pricing options for the intermediary market. The Board also noted that the total expense ratios of the classes vary primarily by the level of their 12b1 fees, although differences in transfer agent fees may also cause expenses to vary from class to class.
Fees Charged to Other Fidelity Clients. The Board also considered Fidelity fee structures and other information with respect to clients of Fidelity, such as other funds advised or subadvised by Fidelity, pension plan clients, and other institutional clients with similar mandates. The Board noted the findings of the 2013 ad hoc joint committee (created with the board of other Fidelity funds), which reviewed and compared Fidelity's institutional investment advisory business with its business of providing services to the Fidelity funds, including the differences in services provided, fees charged, and costs incurred, as well as competition in their respective marketplaces.
Based on its review of total expense ratios and fees charged to other Fidelity clients, the Board concluded that, although Class T was above the median of the universe presented for comparison, the total expense ratio of each class of the fund was reasonable in light of the services that the fund and its shareholders receive and the other factors considered.
Costs of the Services and Profitability. The Board considered the revenues earned and the expenses incurred by Fidelity in conducting the business of developing, marketing, distributing, managing, administering and servicing the fund and servicing the fund's shareholders. The Board also considered the level of Fidelity's profits in respect of all the Fidelity funds.
On an annual basis, Fidelity presents to the Board information about the profitability of its relationship with the fund. Fidelity calculates profitability information for each fund, as well as aggregate profitability information for groups of Fidelity funds and all Fidelity funds, using a series of detailed revenue and cost allocation methodologies which originate with the books and records of Fidelity on which Fidelity's audited financial statements are based. The Audit Committee of the Board reviews any significant changes from the prior year's methodologies.
PricewaterhouseCoopers LLP (PwC), independent registered public accounting firm and auditor to Fidelity and certain Fidelity funds, has been engaged annually by the Board as part of the Board's assessment of Fidelity's profitability analysis. PwC's engagement includes the review and assessment of the methodologies used by Fidelity in determining the revenues and expenses attributable to Fidelity's mutual fund business, and completion of agreed-upon procedures in respect of the mathematical accuracy of fund profitability and its conformity to established allocation methodologies. After considering PwC's reports issued under the engagement and information provided by Fidelity, the Board concluded that while other allocation methods may also be reasonable, Fidelity's profitability methodologies are reasonable in all material respects.
The Board also reviewed Fidelity's non-fund businesses and fall-out benefits related to the mutual fund business as well as cases where Fidelity's affiliates may benefit from or be related to the fund's business.
The Board considered the costs of the services provided by and the profits realized by Fidelity in connection with the operation of the fund and was satisfied that the profitability was not excessive.
Economies of Scale. The Board considered whether there have been economies of scale in respect of the management of the Fidelity funds, whether the Fidelity funds (including the fund) have appropriately benefited from any such economies of scale, and whether there is potential for realization of any further economies of scale. The Board considered the extent to which the fund will benefit from economies of scale as assets grow through increased services to the fund, through waivers or reimbursements, or through fee or expense ratio reductions. The Board also noted that in 2013, it and the boards of other Fidelity funds created an ad hoc committee (the Economies of Scale Committee) to analyze whether Fidelity attains economies of scale in respect of the management and servicing of the Fidelity funds, whether the Fidelity funds have appropriately benefited from such economies of scale, and whether there is potential for realization of any further economies of scale.
The Board recognized that the fund's management contract incorporates a "group fee" structure, which provides for lower group fee rates as total group assets increase, and for higher group fee rates as total group assets decrease (with "group assets" defined to include fund assets under FMR's management plus sector fund assets previously under FMR's management and currently managed by Fidelity SelectCo, LLC). FMR calculates the group fee rates based on a tiered asset "breakpoint" schedule that varies based on asset class. The Board considered that the group fee is designed to deliver the benefits of economies of scale to fund shareholders when total Fidelity fund assets increase, even if assets of any particular fund are unchanged or have declined, because some portion of Fidelity's costs are attributable to services provided to all Fidelity funds, and all funds benefit if those costs can be allocated among more assets. The Board concluded that, given the group fee structure, fund shareholders will benefit from lower management fees as group assets increase at the fund complex level, regardless of whether Fidelity achieves any such economies of scale.
The Board concluded, taking into account the analysis of the Economies of Scale Committee, that economies of scale, if any, are being appropriately shared between fund shareholders and Fidelity.
Additional Information Requested by the Board. In order to develop fully the factual basis for consideration of the Fidelity funds' Advisory Contracts, the Board requested and received additional information on certain topics, including: (i) fund performance trends and Fidelity's long-term strategies for certain funds; (ii) the various share classes employed by Fidelity and the attributes of each class, together with similar information on the distribution and servicing payments made by Fidelity or the funds to third-party participants in the distribution channels; (iii) fund profitability, and fund performance in relation to fund profitability; (iv) the methodology with respect to evaluating competitive fund data and peer group classifications and fee comparisons; (v) annual fund profitability margins, with particular focus on certain funds with negative margins; (vi) the realization of fall-out benefits in certain Fidelity business units;
(vii) economies of scale and the way in which they are shared with fund shareholders;(viii) Fidelity's group fee structures, including the group fee schedule of breakpoints;(ix) the impact of cost containment measures on the funds; and (x) the transfer agent fee structure.
Based on its evaluation of all of the conclusions noted above, and after considering all factors it believed relevant, the Board concluded that the advisory fee structures are fair and reasonable, and that the fund's Advisory Contracts should be renewed.
ADIFI-ANN-1215
1.728710.116
Fidelity Advisor® Diversified International Fund Class Z
Annual Report October 31, 2015 |
|
Contents
To view a fund's proxy voting guidelines and proxy voting record for the 12-month period ended June 30, visit http://www.fidelity.com/proxyvotingresults or visit the Securities and Exchange Commission's (SEC) web site at http://www.sec.gov.
You may also call 1-877-208-0098 to request a free copy of the proxy voting guidelines.
Standard & Poor's, S&P and S&P 500 are registered service marks of The McGraw-Hill Companies, Inc. and have been licensed for use by Fidelity Distributors Corporation.
Other third-party marks appearing herein are the property of their respective owners.
All other marks appearing herein are registered or unregistered trademarks or service marks of FMR LLC or an affiliated company. © 2015 FMR LLC. All rights reserved.
This report and the financial statements contained herein are submitted for the general information of the shareholders of the Fund. This report is not authorized for distribution to prospective investors in the Fund unless preceded or accompanied by an effective prospectus.
A fund files its complete schedule of portfolio holdings with the SEC for the first and third quarters of each fiscal year on Form N-Q. Forms N-Q are available on the SEC’s web site at http://www.sec.gov. A fund's Forms N-Q may be reviewed and copied at the SEC’s Public Reference Room in Washington, DC. Information regarding the operation of the SEC's Public Reference Room may be obtained by calling 1-800-SEC-0330.
For a complete list of a fund's portfolio holdings, view the most recent holdings listing, semiannual report, or annual report on Fidelity's web site at http://www.fidelity.com, http://www.advisor.fidelity.com, or http://www.401k.com, as applicable.
NOT FDIC INSURED •MAY LOSE VALUE •NO BANK GUARANTEE
Neither the Fund nor Fidelity Distributors Corporation is a bank.
Performance: The Bottom Line
Average annual total return reflects the change in the value of an investment, assuming reinvestment of distributions from dividend income and capital gains (the profits earned upon the sale of securities that have grown in value, if any) and assuming a constant rate of performance each year.
The hypothetical investment and the average annual total returns do not reflect the deduction of taxes that a shareholder would pay on fund distributions or the redemption of fund shares.
During periods of reimbursement by Fidelity, a fund’s total return will be greater than it would be had the reimbursement not occurred.
How a fund did yesterday is no guarantee of how it will do tomorrow.
Average Annual Total Returns
| For the periods ended October 31, 2015 | Past 1 year | Past 5 years | Past 10 years |
| Class Z | 4.34% | 7.14% | 4.26% |
The initial offering of Class Z shares took place on August 13, 2013. Returns prior to August 13, 2013, are those of Class I.
$10,000 Over 10 Years
Let's say hypothetically that $10,000 was invested in Fidelity Advisor® Diversified International Fund - Class Z on October 31, 2005.
The chart shows how the value of your investment would have changed, and also shows how the MSCI EAFE Index performed over the same period.
See above for additional information regarding the performance of Class Z.
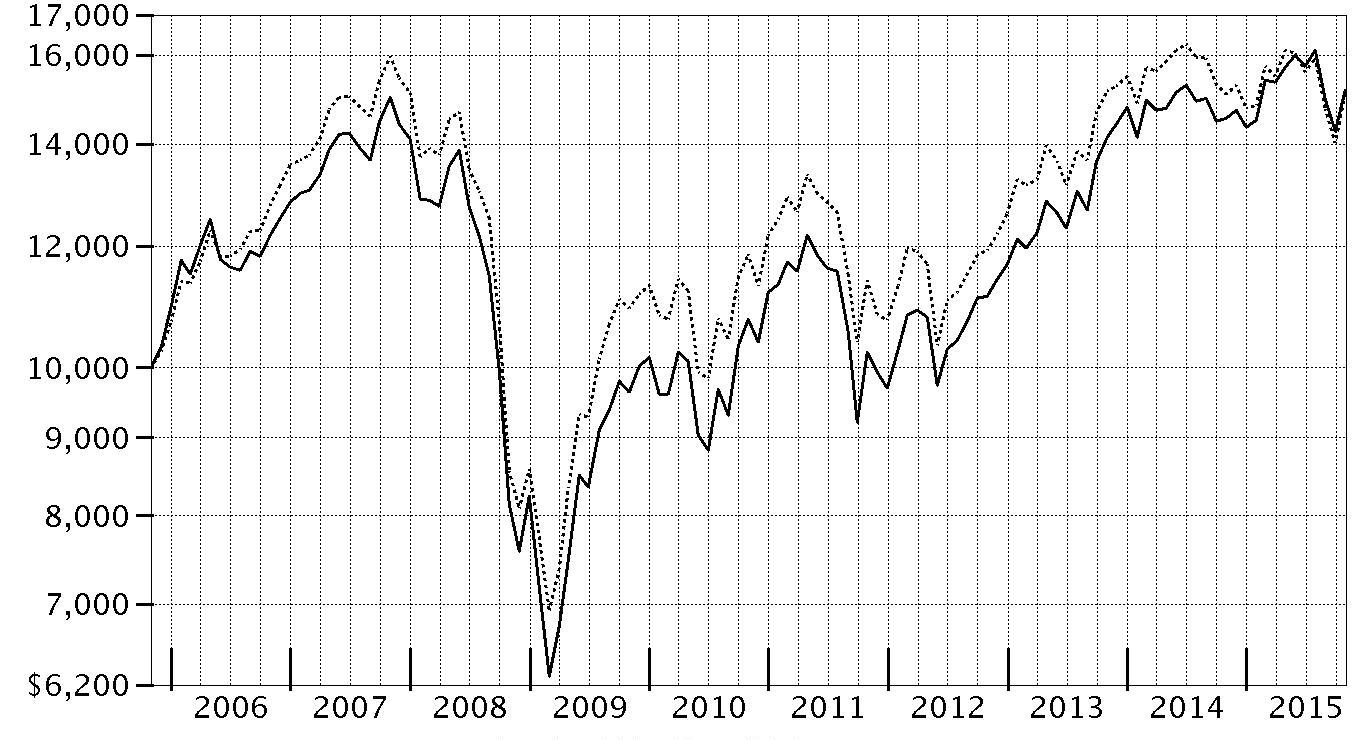
| Period Ending Values |
| $15,177 | Fidelity Advisor® Diversified International Fund - Class Z |
| $15,102 | MSCI EAFE Index |
Management's Discussion of Fund Performance
Market Recap: International equities suffered a setback for the 12 months ending October 31, 2015, held back by a collapse in commodities prices that hurt resources-related sectors and geographies. The MSCI ACWI (All Country World Index) ex USA Index returned -4.55% for the period, affected also by concerns about global economic growth. Commodity producers remained under pressure for much of the past year, largely related to economic deceleration in China (-1%), the world’s second-largest economy and a leading consumer of raw materials. This effect was exacerbated by U.S. dollar strength relative to global currencies, which weighed on commodities priced in dollars and acutely impacted equity returns within regions most exposed to resources prices. The emerging-markets group, for example, returned about -15% this period. Canada, a significant energy producer, returned roughly -17%. Net energy consumer Japan (+9%) was the best-performing region by far. Only about a quarter of the nearly 50 index countries managed a gain this period: Ireland (+19%) – the EU’s fastest-growing economy – and Israel (+17%) proved top performers; Greece (-56%) and Brazil (-46%), among the worst. As for sectors, energy (-25%) and materials (-16%) declined sharply, whereas the two consumer sectors each gained about 6%.
Comments from Portfolio Manager William Bower: For the year, the fund’s share classes (excluding sales charges, if applicable) substantially outpaced the 0.08% result of the MSCI EAFE Index. Results versus the benchmark were affected by a downward fair-value pricing adjustment of -0.66 percentage points. Both stock selection and sector allocation helped the fund’s outperformance. Stock picks in the financials sector proved particularly beneficial, as did an overweighting in information technology and an underweighting in energy – avoidance of Royal Dutch Shell in particular. Positioning in the industrials and telecommunication services sectors were the fund's only overall sector negatives. From a geographical perspective, picks in Europe and the U.K. helped most, along with positioning in Asia Pacific ex Japan. An underweighting in Japan and unfavorable stock selection in the out-of-index emerging markets group detracted most. Among individual stocks, an overweighting in multinational cable and telecommunications provider Altice headed the list both of contributors and of detractors, blending to a net positive. After a strong run-up during the period, Altice changed its corporate structure and split its stock into two newly formed share classes, both of which declined in value. An overweighting in ORIX and a stake in out-of-index Alimentation Couche-Tard helped; gaming stocks Sands China and Melco Crown Entertainment detracted. The fund reduced its holdings in Sands China and eliminated Melco Crown. At period end, the fund remains positioned for a slow-growth world.
The views expressed above reflect those of the portfolio manager(s) only through the end of the period as stated on the cover of this report and do not necessarily represent the views of Fidelity or any other person in the Fidelity organization. Any such views are subject to change at any time based upon market or other conditions and Fidelity disclaims any responsibility to update such views. These views may not be relied on as investment advice and, because investment decisions for a Fidelity fund are based on numerous factors, may not be relied on as an indication of trading intent on behalf of any Fidelity fund.
Investment Summary (Unaudited)
Top Five Stocks as of October 31, 2015
| | % of fund's net assets | % of fund's net assets 6 months ago |
| Novo Nordisk A/S Series B (Denmark, Pharmaceuticals) | 1.9 | 1.9 |
| ORIX Corp. (Japan, Diversified Financial Services) | 1.8 | 1.8 |
| Anheuser-Busch InBev SA NV (Belgium, Beverages) | 1.6 | 1.8 |
| Bayer AG (Germany, Pharmaceuticals) | 1.5 | 1.5 |
| Sanofi SA (France, Pharmaceuticals) | 1.4 | 1.2 |
| | 8.2 | |
Top Five Market Sectors as of October 31, 2015
| | % of fund's net assets | % of fund's net assets 6 months ago |
| Financials | 21.4 | 21.4 |
| Health Care | 17.4 | 16.8 |
| Consumer Discretionary | 16.1 | 17.5 |
| Consumer Staples | 12.3 | 11.2 |
| Information Technology | 12.3 | 13.0 |
Top Five Countries as of October 31, 2015
| (excluding cash equivalents) | % of fund's net assets | % of fund's net assets 6 months ago |
| United Kingdom | 18.2 | 17.7 |
| Japan | 14.5 | 16.0 |
| Germany | 7.6 | 6.6 |
| United States of America | 7.3 | 7.0 |
| Switzerland | 4.7 | 4.6 |
Percentages are adjusted for the effect of open futures contracts, if applicable.
Asset Allocation (% of fund's net assets)
| As of October 31, 2015 |
| | Stocks and Equity Futures | 95.2% |
| | Other Investments | 0.1% |
| | Short-Term Investments and Net Other Assets (Liabilities) | 4.7% |

| As of April 30, 2015 |
| | Stocks and Equity Futures | 97.1% |
| | Other Investments | 0.1% |
| | Short-Term Investments and Net Other Assets (Liabilities) | 2.8% |

Investments October 31, 2015
Showing Percentage of Net Assets
| Common Stocks - 93.7% | | | |
| | | Shares | Value (000s) |
| Australia - 0.9% | | | |
| Ansell Ltd. | | 258,534 | $3,679 |
| Australia & New Zealand Banking Group Ltd. | | 628,447 | 12,154 |
| CSL Ltd. | | 23,957 | 1,592 |
|
| TOTAL AUSTRALIA | | | 17,425 |
|
| Austria - 0.3% | | | |
| Andritz AG | | 52,900 | 2,664 |
| Zumtobel AG | | 134,400 | 3,059 |
|
| TOTAL AUSTRIA | | | 5,723 |
|
| Bailiwick of Jersey - 2.2% | | | |
| Integrated Diagnostics Holdings PLC (a) | | 164,400 | 906 |
| Shire PLC | | 255,300 | 19,334 |
| Wolseley PLC | | 232,408 | 13,645 |
| WPP PLC | | 445,924 | 9,996 |
|
| TOTAL BAILIWICK OF JERSEY | | | 43,881 |
|
| Belgium - 2.5% | | | |
| Anheuser-Busch InBev SA NV | | 274,331 | 32,734 |
| Fagron NV | | 50,400 | 1,238 |
| KBC Groep NV | | 272,295 | 16,588 |
|
| TOTAL BELGIUM | | | 50,560 |
|
| Canada - 3.6% | | | |
| Agrium, Inc. | | 44,300 | 4,121 |
| Alimentation Couche-Tard, Inc. Class B (sub. vtg.) | | 421,300 | 18,123 |
| Canadian Energy Services & Technology Corp. (b) | | 223,800 | 967 |
| CGI Group, Inc. Class A (sub. vtg.) (a) | | 326,100 | 12,113 |
| Constellation Software, Inc. | | 26,400 | 11,407 |
| Entertainment One Ltd. | | 299,433 | 1,014 |
| Fairfax India Holdings Corp. (a) | | 494,000 | 5,187 |
| Imperial Oil Ltd. | | 105,900 | 3,524 |
| Keyera Corp. (b) | | 98,200 | 3,030 |
| PrairieSky Royalty Ltd. | | 38,000 | 748 |
| Suncor Energy, Inc. | | 274,400 | 8,165 |
| Tourmaline Oil Corp. (a) | | 171,500 | 3,569 |
|
| TOTAL CANADA | | | 71,968 |
|
| Cayman Islands - 1.7% | | | |
| 58.com, Inc. ADR (a) | | 43,400 | 2,278 |
| Alibaba Group Holding Ltd. sponsored ADR (a) | | 146,000 | 12,239 |
| Baidu.com, Inc. sponsored ADR (a) | | 34,600 | 6,486 |
| China Modern Dairy Holdings Ltd. (b) | | 5,945,000 | 1,788 |
| Lee's Pharmaceutical Holdings Ltd. | | 1,208,500 | 1,560 |
| PW Medtech Group Ltd. (a)(b) | | 5,174,000 | 1,082 |
| Regina Miracle International Holdings Ltd. | | 1,962,558 | 1,779 |
| Sands China Ltd. | | 976,400 | 3,516 |
| Vipshop Holdings Ltd. ADR (a) | | 154,000 | 3,160 |
|
| TOTAL CAYMAN ISLANDS | | | 33,888 |
|
| China - 0.7% | | | |
| Inner Mongoli Yili Industries Co. Ltd. | | 987,208 | 2,483 |
| Kweichow Moutai Co. Ltd. | | 175,010 | 5,909 |
| Qingdao Haier Co. Ltd. | | 3,912,122 | 5,956 |
| Weifu High-Technology Co. Ltd. (B Shares) | | 206,200 | 526 |
|
| TOTAL CHINA | | | 14,874 |
|
| Curacao - 0.4% | | | |
| Schlumberger Ltd. | | 93,200 | 7,285 |
| Denmark - 2.6% | | | |
| Genmab A/S (a) | | 114,600 | 11,304 |
| NNIT A/S | | 132,887 | 3,057 |
| Novo Nordisk A/S Series B | | 712,640 | 37,845 |
|
| TOTAL DENMARK | | | 52,206 |
|
| Finland - 0.3% | | | |
| Sampo Oyj (A Shares) | | 113,300 | 5,542 |
| France - 3.9% | | | |
| Accor SA | | 85,369 | 4,247 |
| Air Liquide SA | | 60,260 | 7,813 |
| AXA SA | | 486,600 | 12,986 |
| BNP Paribas SA | | 53,743 | 3,266 |
| Capgemini SA | | 46,900 | 4,179 |
| Danone SA | | 87,747 | 6,098 |
| Publicis Groupe SA | | 106,810 | 6,937 |
| Sanofi SA | | 290,858 | 29,341 |
| VINCI SA | | 45,600 | 3,078 |
| Zodiac Aerospace | | 56,500 | 1,429 |
|
| TOTAL FRANCE | | | 79,374 |
|
| Germany - 6.7% | | | |
| adidas AG | | 83,390 | 7,473 |
| Bayer AG | | 224,952 | 30,018 |
| Brenntag AG | | 75,600 | 4,568 |
| Continental AG | | 45,800 | 11,015 |
| Deutsche Boerse AG | | 49,200 | 4,531 |
| Deutsche Post AG | | 136,001 | 4,040 |
| Fresenius SE & Co. KGaA | | 338,000 | 24,837 |
| KION Group AG | | 108,500 | 4,893 |
| Linde AG | | 9,947 | 1,726 |
| OSRAM Licht AG | | 214,794 | 12,639 |
| ProSiebenSat.1 Media AG | | 254,000 | 13,739 |
| SAP AG | | 119,272 | 9,403 |
| Symrise AG | | 110,100 | 7,252 |
|
| TOTAL GERMANY | | | 136,134 |
|
| Hong Kong - 1.8% | | | |
| AIA Group Ltd. | | 4,847,600 | 28,423 |
| China Resources Beer Holdings Co. Ltd. | | 1,306,000 | 2,466 |
| Hang Seng Bank Ltd. | | 139,800 | 2,565 |
| Techtronic Industries Co. Ltd. | | 925,000 | 3,382 |
|
| TOTAL HONG KONG | | | 36,836 |
|
| India - 3.1% | | | |
| Apollo Hospitals Enterprise Ltd. (a) | | 155,738 | 3,122 |
| Axis Bank Ltd. (a) | | 599,285 | 4,340 |
| Bharti Infratel Ltd. | | 1,109,288 | 6,588 |
| Edelweiss Financial Services Ltd. | | 2,655,200 | 2,410 |
| Exide Industries Ltd. (a) | | 1,136,771 | 2,593 |
| HCL Technologies Ltd. | | 249,980 | 3,327 |
| HDFC Bank Ltd. (a) | | 793,748 | 15,920 |
| Housing Development Finance Corp. Ltd. | | 635,436 | 12,172 |
| ITC Ltd. | | 1,229,144 | 6,277 |
| Just Dial Ltd. | | 195,017 | 2,386 |
| LIC Housing Finance Ltd. (a) | | 274,208 | 2,002 |
| Pidilite Industries Ltd. (a) | | 241,934 | 2,075 |
|
| TOTAL INDIA | | | 63,212 |
|
| Indonesia - 0.4% | | | |
| PT Bank Central Asia Tbk | | 4,594,100 | 4,316 |
| PT Bank Rakyat Indonesia Tbk | | 6,106,100 | 4,673 |
|
| TOTAL INDONESIA | | | 8,989 |
|
| Ireland - 3.2% | | | |
| Allergan PLC (a) | | 64,300 | 19,835 |
| DCC PLC (United Kingdom) | | 71,500 | 5,737 |
| Greencore Group PLC | | 994,821 | 4,632 |
| Horizon Pharma PLC (a) | | 184,300 | 2,897 |
| Kerry Group PLC Class A | | 97,100 | 7,896 |
| Medtronic PLC | | 121,000 | 8,944 |
| Ryanair Holdings PLC sponsored ADR | | 184,860 | 14,454 |
|
| TOTAL IRELAND | | | 64,395 |
|
| Isle of Man - 0.6% | | | |
| Optimal Payments PLC (a) | | 1,284,533 | 6,020 |
| Playtech Ltd. | | 406,983 | 5,371 |
|
| TOTAL ISLE OF MAN | | | 11,391 |
|
| Israel - 1.7% | | | |
| Cellcom Israel Ltd. (Israel) (a) | | 486,900 | 3,624 |
| Check Point Software Technologies Ltd. (a) | | 120,100 | 10,201 |
| Partner Communications Co. Ltd. (a) | | 162,104 | 736 |
| Teva Pharmaceutical Industries Ltd. sponsored ADR | | 351,100 | 20,782 |
|
| TOTAL ISRAEL | | | 35,343 |
|
| Italy - 1.0% | | | |
| Intesa Sanpaolo SpA | | 3,501,400 | 12,198 |
| Mediaset SpA | | 851,100 | 4,324 |
| World Duty Free SpA (a) | | 419,842 | 4,737 |
|
| TOTAL ITALY | | | 21,259 |
|
| Japan - 14.5% | | | |
| Ain Holdings, Inc. | | 77,700 | 3,678 |
| Astellas Pharma, Inc. | | 1,379,600 | 20,024 |
| Daiichikosho Co. Ltd. | | 74,400 | 2,481 |
| Dentsu, Inc. | | 162,100 | 9,113 |
| Don Quijote Holdings Co. Ltd. | | 177,700 | 6,528 |
| Fast Retailing Co. Ltd. | | 20,700 | 7,561 |
| Glory Ltd. | | 98,100 | 2,482 |
| Hoya Corp. | | 677,700 | 27,966 |
| Japan Exchange Group, Inc. | | 665,400 | 10,707 |
| Japan Tobacco, Inc. | | 474,700 | 16,430 |
| KDDI Corp. | | 622,700 | 15,068 |
| Keyence Corp. | | 38,800 | 20,200 |
| Minebea Ltd. | | 120,000 | 1,322 |
| Misumi Group, Inc. | | 104,400 | 1,360 |
| Mitsubishi UFJ Financial Group, Inc. | | 4,002,100 | 25,884 |
| NGK Spark Plug Co. Ltd. | | 139,300 | 3,400 |
| Nitori Holdings Co. Ltd. | | 75,400 | 5,880 |
| Olympus Corp. | | 132,300 | 4,463 |
| OMRON Corp. | | 31,400 | 1,040 |
| ORIX Corp. | | 2,497,200 | 36,469 |
| Rakuten, Inc. | | 1,226,300 | 16,988 |
| Seven & i Holdings Co. Ltd. | | 129,500 | 5,883 |
| SHIMANO, Inc. | | 54,800 | 8,635 |
| Shinsei Bank Ltd. | | 2,310,000 | 4,844 |
| SoftBank Corp. | | 226,100 | 12,668 |
| Sundrug Co. Ltd. | | 100 | 5 |
| Suzuki Motor Corp. | | 167,000 | 5,468 |
| TDK Corp. | | 52,000 | 3,312 |
| Tsuruha Holdings, Inc. | | 127,100 | 10,069 |
| VT Holdings Co. Ltd. | | 437,600 | 2,706 |
| Welcia Holdings Co. Ltd. | | 18,200 | 897 |
|
| TOTAL JAPAN | | | 293,531 |
|
| Korea (South) - 0.2% | | | |
| Orion Corp. | | 5,836 | 4,907 |
| Luxembourg - 0.7% | | | |
| Eurofins Scientific SA | | 36,500 | 13,215 |
| Netherlands - 3.7% | | | |
| AEGON NV | | 666,600 | 4,091 |
| AerCap Holdings NV (a) | | 94,200 | 3,909 |
| Altice NV: | | | |
| Class A (a) | | 566,110 | 9,805 |
| Class B (a) | | 231,909 | 4,119 |
| Gree Electric Appliances, Inc. ELS (BNP Paribas Arbitrage Warrant Program) warrants 12/10/15 (c) | | 144,800 | 395 |
| IMCD Group BV | | 135,500 | 5,069 |
| ING Groep NV (Certificaten Van Aandelen) | | 883,700 | 12,861 |
| NXP Semiconductors NV (a) | | 21,500 | 1,685 |
| RELX NV | | 655,099 | 11,202 |
| Unilever NV (Certificaten Van Aandelen) (Bearer) | | 490,300 | 22,170 |
|
| TOTAL NETHERLANDS | | | 75,306 |
|
| Philippines - 0.2% | | | |
| Alliance Global Group, Inc. | | 12,852,154 | 4,993 |
| Singapore - 0.4% | | | |
| Avago Technologies Ltd. | | 16,700 | 2,056 |
| United Overseas Bank Ltd. | | 426,100 | 6,187 |
|
| TOTAL SINGAPORE | | | 8,243 |
|
| South Africa - 1.2% | | | |
| EOH Holdings Ltd. | | 427,200 | 4,723 |
| Naspers Ltd. Class N | | 132,300 | 19,378 |
|
| TOTAL SOUTH AFRICA | | | 24,101 |
|
| Spain - 1.9% | | | |
| Amadeus IT Holding SA Class A | | 257,400 | 10,971 |
| Hispania Activos Inmobiliarios SA (a) | | 207,200 | 3,122 |
| Inditex SA | | 649,055 | 24,342 |
|
| TOTAL SPAIN | | | 38,435 |
|
| Sweden - 2.4% | | | |
| ASSA ABLOY AB (B Shares) | | 301,800 | 6,004 |
| Coor Service Management Holding AB (a) | | 445,200 | 1,819 |
| HEXPOL AB (B Shares) | | 151,200 | 1,472 |
| Nordea Bank AB | | 1,101,000 | 12,178 |
| Sandvik AB | | 271,200 | 2,536 |
| Svenska Cellulosa AB (SCA) (B Shares) | | 585,900 | 17,257 |
| Svenska Handelsbanken AB (A Shares) | | 560,400 | 7,611 |
|
| TOTAL SWEDEN | | | 48,877 |
|
| Switzerland - 4.7% | | | |
| Actelion Ltd. | | 58,435 | 8,123 |
| Compagnie Financiere Richemont SA Series A | | 91,376 | 7,835 |
| Credit Suisse Group AG (d) | | 288,213 | 6,633 |
| GAM Holding Ltd. | | 84,407 | 1,546 |
| Roche Holding AG (participation certificate) | | 80,592 | 21,881 |
| Sika AG (Bearer) | | 2,320 | 7,614 |
| Syngenta AG (Switzerland) | | 66,171 | 22,231 |
| UBS Group AG | | 922,263 | 18,456 |
|
| TOTAL SWITZERLAND | | | 94,319 |
|
| Taiwan - 1.0% | | | |
| Taiwan Semiconductor Manufacturing Co. Ltd. sponsored ADR | | 926,800 | 20,353 |
| Thailand - 0.2% | | | |
| Kasikornbank PCL (For. Reg.) | | 837,400 | 4,051 |
| United Kingdom - 18.2% | | | |
| AA PLC | | 502,320 | 2,144 |
| Al Noor Hospitals Group PLC | | 275,700 | 4,998 |
| Associated British Foods PLC | | 175,100 | 9,326 |
| B&M European Value Retail S.A. | | 1,969,499 | 10,123 |
| Barclays PLC | | 2,393,576 | 8,528 |
| BG Group PLC | | 1,008,869 | 15,939 |
| British American Tobacco PLC sponsored ADR | | 103,200 | 12,188 |
| British Land Co. PLC | | 165,514 | 2,221 |
| BT Group PLC | | 2,052,100 | 14,655 |
| Bunzl PLC | | 146,400 | 4,196 |
| Capita Group PLC | | 266,100 | 5,230 |
| Compass Group PLC | | 542,400 | 9,324 |
| Diploma PLC | | 401,600 | 3,972 |
| Essentra PLC | | 1,159,700 | 15,053 |
| Exova Group Ltd. PLC | | 516,300 | 1,184 |
| Hikma Pharmaceuticals PLC | | 219,418 | 7,320 |
| Howden Joinery Group PLC | | 87,500 | 625 |
| HSBC Holdings PLC sponsored ADR | | 69,097 | 2,700 |
| IMI PLC | | 189,700 | 2,787 |
| Imperial Tobacco Group PLC | | 211,895 | 11,430 |
| Indivior PLC | | 864,100 | 2,739 |
| ITV PLC | | 3,635,100 | 14,144 |
| Johnson Matthey PLC | | 117,300 | 4,674 |
| JUST EAT Ltd. (a) | | 170,300 | 1,118 |
| Liberty Global PLC: | | | |
| Class A (a) | | 143,600 | 6,393 |
| Class C (a) | | 61,400 | 2,618 |
| LiLAC Class A (a) | | 5,925 | 229 |
| LiLAC Class C (a) | | 2,435 | 94 |
| Lloyds Banking Group PLC | | 24,688,900 | 28,022 |
| London Stock Exchange Group PLC | | 193,900 | 7,607 |
| Meggitt PLC | | 460,741 | 2,512 |
| Melrose PLC | | 604,900 | 2,482 |
| Micro Focus International PLC | | 538,200 | 10,421 |
| Next PLC | | 165,600 | 20,423 |
| Poundland Group PLC | | 1,221,232 | 5,177 |
| Prudential PLC | | 1,065,313 | 24,882 |
| Reckitt Benckiser Group PLC | | 191,113 | 18,651 |
| Rolls-Royce Group PLC | | 619,700 | 6,553 |
| Royal Bank of Scotland Group PLC (a) | | 699,900 | 3,420 |
| SABMiller PLC | | 188,000 | 11,578 |
| Schroders PLC | | 132,100 | 6,075 |
| Sophos Group PLC (a) | | 772,766 | 3,063 |
| Spectris PLC | | 150,900 | 3,878 |
| Sports Direct International PLC (a) | | 459,400 | 4,936 |
| St. James's Place Capital PLC | | 1,081,000 | 16,073 |
| The Restaurant Group PLC | | 138,100 | 1,526 |
| Virgin Money Holdings Uk PLC | | 989,500 | 5,916 |
| Whitbread PLC | | 122,013 | 9,341 |
|
| TOTAL UNITED KINGDOM | | | 368,488 |
|
| United States of America - 6.8% | | | |
| Alliance Data Systems Corp. (a) | | 20,900 | 6,214 |
| Alphabet, Inc.: | | | |
| Class A (a) | | 10,495 | 7,739 |
| Class C | | 19,849 | 14,109 |
| Amgen, Inc. | | 43,800 | 6,928 |
| Baxalta, Inc. | | 159,300 | 5,489 |
| Celgene Corp. (a) | | 45,300 | 5,559 |
| Celldex Therapeutics, Inc. (a) | | 24,600 | 297 |
| Cognizant Technology Solutions Corp. Class A (a) | | 44,400 | 3,024 |
| Fidelity National Information Services, Inc. | | 102,700 | 7,489 |
| HP, Inc. | | 180,500 | 4,866 |
| Las Vegas Sands Corp. | | 175,100 | 8,669 |
| MasterCard, Inc. Class A | | 127,700 | 12,641 |
| McGraw Hill Financial, Inc. | | 174,300 | 16,147 |
| Noble Energy, Inc. | | 86,100 | 3,086 |
| Oceaneering International, Inc. | | 95,000 | 3,992 |
| QUALCOMM, Inc. | | 115,500 | 6,863 |
| The Blackstone Group LP | | 168,100 | 5,557 |
| Visa, Inc. Class A | | 174,800 | 13,561 |
| Western Digital Corp. | | 80,200 | 5,359 |
|
| TOTAL UNITED STATES OF AMERICA | | | 137,589 |
|
| TOTAL COMMON STOCKS | | | |
| (Cost $1,543,758) | | | 1,896,693 |
|
| Preferred Stocks - 1.0% | | | |
| Convertible Preferred Stocks - 0.0% | | | |
| United States of America - 0.0% | | | |
| NJOY, Inc.: | | | |
| Series C (a)(d) | | 60,264 | 30 |
| Series D (a)(d) | | 18,951 | 9 |
| | | | 39 |
| Nonconvertible Preferred Stocks - 1.0% | | | |
| Brazil - 0.1% | | | |
| Itau Unibanco Holding SA | | 305,800 | 2,099 |
| Germany - 0.9% | | | |
| Henkel AG & Co. KGaA | | 159,300 | 17,290 |
| United Kingdom - 0.0% | | | |
| Rolls-Royce Group PLC | | 57,446,190 | 89 |
|
| TOTAL NONCONVERTIBLE PREFERRED STOCKS | | | 19,478 |
|
| TOTAL PREFERRED STOCKS | | | |
| (Cost $17,951) | | | 19,517 |
| | | Principal Amount (000s)(e) | Value (000s) |
|
| Government Obligations - 0.0% | | | |
| United States of America - 0.0% | | | |
U.S. Treasury Bills, yield at date of purchase 0.03% to 0.06% 12/3/15 to 12/17/15
(Cost $90)(f) | | 90 | 90 |
|
| Preferred Securities - 0.1% | | | |
| Ireland - 0.1% | | | |
Baggot Securities Ltd. 10.24%
(Cost $2,488)(c)(g) | EUR | 1,620 | 1,926 |
| | | Shares | Value (000s) |
|
| Money Market Funds - 5.7% | | | |
| Fidelity Cash Central Fund, 0.18% (h) | | 112,099,238 | 112,099 |
| Fidelity Securities Lending Cash Central Fund, 0.19% (h)(i) | | 4,169,950 | 4,170 |
| TOTAL MONEY MARKET FUNDS | | | |
| (Cost $116,269) | | | 116,269 |
| TOTAL INVESTMENT PORTFOLIO - 100.5% | | | |
| (Cost $1,680,556) | | | 2,034,495 |
| NET OTHER ASSETS (LIABILITIES) - (0.5)% | | | (9,127) |
| NET ASSETS - 100% | | | $2,025,368 |
| Futures Contracts | | | |
| | Expiration Date | Underlying Face Amount at Value (000s) | Unrealized Appreciation/(Depreciation) (000s) |
| Purchased | | | |
| Equity Index Contracts | | | |
| 97 CME Nikkei 225 Index Contracts (United States) | Dec. 2015 | 9,174 | $439 |
The face value of futures purchased as a percentage of Net Assets is 0.5%
Currency Abbreviations
EUR – European Monetary Unit
Categorizations in the Schedule of Investments are based on country or territory of incorporation.
Legend
(a) Non-income producing
(b) Security or a portion of the security is on loan at period end.
(c) Security exempt from registration under Rule 144A of the Securities Act of 1933. These securities may be resold in transactions exempt from registration, normally to qualified institutional buyers. At the end of the period, the value of these securities amounted to $2,321,000 or 0.1% of net assets.
(d) Restricted securities - Investment in securities not registered under the Securities Act of 1933 (excluding 144A issues). At the end of the period, the value of restricted securities (excluding 144A issues) amounted to $6,673,000 or 0.3% of net assets.
(e) Amount is stated in United States dollars unless otherwise noted.
(f) Security or a portion of the security was pledged to cover margin requirements for futures contracts. At period end, the value of securities pledged amounted to $90,000.
(g) Security is perpetual in nature with no stated maturity date.
(h) Affiliated fund that is generally available only to investment companies and other accounts managed by Fidelity Investments. The rate quoted is the annualized seven-day yield of the fund at period end. A complete unaudited listing of the fund's holdings as of its most recent quarter end is available upon request. In addition, each Fidelity Central Fund's financial statements, which are not covered by the Fund's Report of Independent Registered Public Accounting Firm, are available on the SEC's website or upon request.
(i) Investment made with cash collateral received from securities on loan.
Additional information on each restricted holding is as follows:
| Security | Acquisition Date | Acquisition Cost (000s) |
| Credit Suisse Group AG | 10/21/15 | $6,834 |
| NJOY, Inc. Series C | 6/7/13 | $487 |
| NJOY, Inc. Series D | 2/14/14 | $321 |
Affiliated Central Funds
Information regarding fiscal year to date income earned by the Fund from investments in Fidelity Central Funds is as follows:
| Fund | Income earned |
| | (Amounts in thousands) |
| Fidelity Cash Central Fund | $94 |
| Fidelity Securities Lending Cash Central Fund | 559 |
| Total | $653 |
Investment Valuation
The following is a summary of the inputs used, as of October 31, 2015, involving the Fund's assets and liabilities carried at fair value. The inputs or methodology used for valuing securities may not be an indication of the risk associated with investing in those securities. For more information on valuation inputs, and their aggregation into the levels used below, please refer to the Investment Valuation section in the accompanying Notes to Financial Statements.
| | Valuation Inputs at Reporting Date: |
| Description | Total | Level 1 | Level 2 | Level 3 |
| (Amounts in thousands) | | | | |
| Investments in Securities: | | | | |
| Equities: | | | | |
| Consumer Discretionary | $323,496 | $202,317 | $115,184 | $5,995 |
| Consumer Staples | 250,165 | 119,540 | 130,625 | -- |
| Energy | 50,305 | 34,366 | 15,939 | -- |
| Financials | 433,555 | 159,870 | 273,685 | -- |
| Health Care | 350,375 | 153,649 | 196,726 | -- |
| Industrials | 130,849 | 90,450 | 40,399 | -- |
| Information Technology | 250,095 | 210,427 | 39,668 | -- |
| Materials | 74,031 | 49,725 | 24,306 | -- |
| Telecommunication Services | 53,339 | 4,360 | 48,979 | -- |
| Government Obligations | 90 | -- | 90 | -- |
| Preferred Securities | 1,926 | -- | 1,926 | -- |
| Money Market Funds | 116,269 | 116,269 | -- | -- |
| Total Investments in Securities: | $2,034,495 | $1,140,973 | $887,527 | $5,995 |
| Derivative Instruments: | | | | |
| Assets | | | | |
| Futures Contracts | $439 | $439 | $-- | $-- |
| Total Assets | $439 | $439 | $-- | $-- |
| Total Derivative Instruments: | $439 | $439 | $-- | $-- |
The following is a summary of transfers between Level 1 and Level 2 for the period ended October 31, 2015. Transfers are assumed to have occurred at the beginning of the period, and are primarily attributable to the valuation techniques used for foreign equity securities, as discussed in the accompanying Notes to Financial Statements:
| Transfers | Total (000s) |
| Level 1 to Level 2 | $107,949 |
| Level 2 to Level 1 | $28,909 |
Value of Derivative Instruments
The following table is a summary of the Fund's value of derivative instruments by primary risk exposure as of October 31, 2015. For additional information on derivative instruments, please refer to the Derivative Instruments section in the accompanying Notes to Financial Statements.
| Primary Risk Exposure / Derivative Type | Value |
| (Amounts in thousands) | Asset | Liability |
| Equity Risk | | |
| Futures Contracts(a) | $439 | $0 |
| Total Equity Risk | 439 | 0 |
| Total Value of Derivatives | $439 | $0 |
(a) Reflects gross cumulative appreciation (depreciation) on futures contracts as presented in the Schedule of Investments. Only the period end receivable or payable for daily variation margin and net unrealized appreciation (depreciation) are presented in the Statement of Assets and Liabilities.
See accompanying notes which are an integral part of the financial statements.
Financial Statements
Statement of Assets and Liabilities
| Amounts in thousands (except per-share amounts) | | October 31, 2015 |
| Assets | | |
Investment in securities, at value (including securities loaned of $3,928) — See accompanying schedule:
Unaffiliated issuers (cost $1,564,287) | $1,918,226 | |
| Fidelity Central Funds (cost $116,269) | 116,269 | |
| Total Investments (cost $1,680,556) | | $2,034,495 |
| Segregated cash with brokers for derivative instruments | | 448 |
| Foreign currency held at value (cost $254) | | 254 |
| Receivable for investments sold | | 8,321 |
| Receivable for fund shares sold | | 2,913 |
| Dividends receivable | | 4,976 |
| Distributions receivable from Fidelity Central Funds | | 19 |
| Prepaid expenses | | 5 |
| Other receivables | | 724 |
| Total assets | | 2,052,155 |
| Liabilities | | |
| Payable for investments purchased | $11,241 | |
| Payable for fund shares redeemed | 8,661 | |
| Accrued management fee | 1,117 | |
| Distribution and service plan fees payable | 463 | |
| Payable for daily variation margin for derivative instruments | 51 | |
| Other affiliated payables | 418 | |
| Other payables and accrued expenses | 666 | |
| Collateral on securities loaned, at value | 4,170 | |
| Total liabilities | | 26,787 |
| Net Assets | | $2,025,368 |
| Net Assets consist of: | | |
| Paid in capital | | $4,281,587 |
| Undistributed net investment income | | 12,633 |
| Accumulated undistributed net realized gain (loss) on investments and foreign currency transactions | | (2,623,269) |
| Net unrealized appreciation (depreciation) on investments and assets and liabilities in foreign currencies | | 354,417 |
| Net Assets | | $2,025,368 |
| Calculation of Maximum Offering Price | | |
| Class A: | | |
| Net Asset Value and redemption price per share ($661,578 ÷ 32,911.1 shares) | | $20.10 |
| Maximum offering price per share (100/94.25 of $20.10) | | $21.33 |
| Class T: | | |
| Net Asset Value and redemption price per share ($271,487 ÷ 13,626.9 shares) | | $19.92 |
| Maximum offering price per share (100/96.50 of $19.92) | | $20.64 |
| Class B: | | |
| Net Asset Value and offering price per share ($11,093 ÷ 574.5 shares)(a) | | $19.31 |
| Class C: | | |
| Net Asset Value and offering price per share ($251,098 ÷ 13,086.2 shares)(a) | | $19.19 |
| Class I: | | |
| Net Asset Value, offering price and redemption price per share ($747,187 ÷ 36,519.7 shares) | | $20.46 |
| Class Z: | | |
| Net Asset Value, offering price and redemption price per share ($82,925 ÷ 4,052.2 shares) | | $20.46 |
(a) Redemption price per share is equal to net asset value less any applicable contingent deferred sales charge.
See accompanying notes which are an integral part of the financial statements.
Statement of Operations
| Amounts in thousands | | Year ended October 31, 2015 |
| Investment Income | | |
| Dividends | | $41,105 |
| Interest | | 27 |
| Income from Fidelity Central Funds | | 653 |
| Income before foreign taxes withheld | | 41,785 |
| Less foreign taxes withheld | | (3,009) |
| Total income | | 38,776 |
| Expenses | | |
| Management fee | $13,277 | |
| Transfer agent fees | 4,255 | |
| Distribution and service plan fees | 5,693 | |
| Accounting and security lending fees | 876 | |
| Custodian fees and expenses | 248 | |
| Independent trustees' compensation | 8 | |
| Registration fees | 135 | |
| Audit | 84 | |
| Legal | 6 | |
| Miscellaneous | 21 | |
| Total expenses before reductions | 24,603 | |
| Expense reductions | (147) | 24,456 |
| Net investment income (loss) | | 14,320 |
| Realized and Unrealized Gain (Loss) | | |
| Net realized gain (loss) on: | | |
| Investment securities: | | |
| Unaffiliated issuers | 39,912 | |
| Foreign currency transactions | (294) | |
| Futures contracts | (578) | |
| Total net realized gain (loss) | | 39,040 |
Change in net unrealized appreciation (depreciation) on:
Investment securities (net of decrease in deferred foreign taxes of $41) | 17,485 | |
| Assets and liabilities in foreign currencies | 194 | |
| Futures contracts | 439 | |
| Total change in net unrealized appreciation (depreciation) | | 18,118 |
| Net gain (loss) | | 57,158 |
| Net increase (decrease) in net assets resulting from operations | | $71,478 |
See accompanying notes which are an integral part of the financial statements.
Statement of Changes in Net Assets
| Amounts in thousands | Year ended October 31, 2015 | Year ended October 31, 2014 |
| Increase (Decrease) in Net Assets | | |
| Operations | | |
| Net investment income (loss) | $14,320 | $25,980 |
| Net realized gain (loss) | 39,040 | 174,288 |
| Change in net unrealized appreciation (depreciation) | 18,118 | (153,908) |
| Net increase (decrease) in net assets resulting from operations | 71,478 | 46,360 |
| Distributions to shareholders from net investment income | (18,738) | (17,375) |
| Distributions to shareholders from net realized gain | (2,141) | (17,564) |
| Total distributions | (20,879) | (34,939) |
| Share transactions - net increase (decrease) | 63,265 | (109,770) |
| Redemption fees | 27 | 19 |
| Total increase (decrease) in net assets | 113,891 | (98,330) |
| Net Assets | | |
| Beginning of period | 1,911,477 | 2,009,807 |
| End of period (including undistributed net investment income of $12,633 and undistributed net investment income of $18,417, respectively) | $2,025,368 | $1,911,477 |
See accompanying notes which are an integral part of the financial statements.
Financial Highlights — Fidelity Advisor Diversified International Fund Class A
| | | October 31, | | | |
| Years ended October 31, | 2015 | 2014 | 2013 | 2012 | 2011 |
| Selected Per–Share Data | | | | | |
| Net asset value, beginning of period | $19.56 | $19.47 | $15.63 | $14.61 | $15.63 |
| Income from Investment Operations | | | | | |
| Net investment income (loss)A | .15 | .27B | .19 | .18 | .22C |
| Net realized and unrealized gain (loss) | .61 | .17 | 3.92 | 1.03 | (1.01) |
| Total from investment operations | .76 | .44 | 4.11 | 1.21 | (.79) |
| Distributions from net investment income | (.20) | (.18) | (.21) | (.19) | (.20) |
| Distributions from net realized gain�� | (.02) | (.17) | (.06) | – | (.03) |
| Total distributions | (.22) | (.35) | (.27) | (.19) | (.23) |
| Redemption fees added to paid in capitalA,D | – | – | – | – | – |
| Net asset value, end of period | $20.10 | $19.56 | $19.47 | $15.63 | $14.61 |
| Total ReturnE,F | 3.93% | 2.28% | 26.69% | 8.47% | (5.15)% |
| Ratios to Average Net AssetsG,H | | | | | |
| Expenses before reductions | 1.22% | 1.26% | 1.31% | 1.32% | 1.31% |
| Expenses net of fee waivers, if any | 1.22% | 1.26% | 1.30% | 1.32% | 1.31% |
| Expenses net of all reductions | 1.21% | 1.26% | 1.28% | 1.31% | 1.29% |
| Net investment income (loss) | .75% | 1.34%B | 1.08% | 1.20% | 1.38%C |
| Supplemental Data | | | | | |
| Net assets, end of period (in millions) | $662 | $693 | $756 | $762 | $916 |
| Portfolio turnover rateI | 34% | 40% | 50% | 34% | 48% |
A Calculated based on average shares outstanding during the period.
B Investment income per share reflects a large, non-recurring dividend which amounted to $.10 per share. Excluding this non-recurring dividend, the ratio of net investment income (loss) to average net assets would have been .85%.
C Investment income per share reflects a large, non-recurring dividend which amounted to $.06 per share. Excluding this non-recurring dividend, the ratio of net investment income (loss) to average net assets would have been .98%.
D Amount represents less than $.005 per share.
E Total returns would have been lower if certain expenses had not been reduced during the applicable periods shown.
F Total returns do not include the effect of the sales charges.
G Fees and expenses of any underlying Fidelity Central Funds are not included in the Fund's expense ratio. The Fund indirectly bears its proportionate share of the expenses of any underlying Fidelity Central Funds.
H Expense ratios reflect operating expenses of the class. Expenses before reductions do not reflect amounts reimbursed by the investment adviser or reductions from brokerage service arrangements or reductions from other expense offset arrangements and do not represent the amount paid by the class during periods when reimbursements or reductions occur. Expenses net of fee waivers reflect expenses after reimbursement by the investment adviser but prior to reductions from brokerage service arrangements or other expense offset arrangements. Expenses net of all reductions represent the net expenses paid by the class.
I Amount does not include the portfolio activity of any underlying Fidelity Central Funds.
See accompanying notes which are an integral part of the financial statements.
Financial Highlights — Fidelity Advisor Diversified International Fund Class T
| | | October 31, | | | |
| Years ended October 31, | 2015 | 2014 | 2013 | 2012 | 2011 |
| Selected Per–Share Data | | | | | |
| Net asset value, beginning of period | $19.38 | $19.30 | $15.49 | $14.46 | $15.47 |
| Income from Investment Operations | | | | | |
| Net investment income (loss)A | .10 | .21B | .14 | .14 | .18C |
| Net realized and unrealized gain (loss) | .61 | .18 | 3.89 | 1.03 | (.99) |
| Total from investment operations | .71 | .39 | 4.03 | 1.17 | (.81) |
| Distributions from net investment income | (.15) | (.14) | (.16) | (.14) | (.16) |
| Distributions from net realized gain | (.02) | (.17) | (.06) | – | (.03) |
| Total distributions | (.17) | (.31) | (.22) | (.14) | (.20)D |
| Redemption fees added to paid in capitalA,E | – | – | – | – | – |
| Net asset value, end of period | $19.92 | $19.38 | $19.30 | $15.49 | $14.46 |
| Total ReturnF,G | 3.67% | 2.04% | 26.37% | 8.17% | (5.35)% |
| Ratios to Average Net AssetsH,I | | | | | |
| Expenses before reductions | 1.48% | 1.51% | 1.55% | 1.58% | 1.55% |
| Expenses net of fee waivers, if any | 1.48% | 1.51% | 1.55% | 1.58% | 1.55% |
| Expenses net of all reductions | 1.47% | 1.51% | 1.53% | 1.57% | 1.53% |
| Net investment income (loss) | .49% | 1.09%B | .83% | .94% | 1.14%C |
| Supplemental Data | | | | | |
| Net assets, end of period (in millions) | $271 | $284 | $319 | $304 | $404 |
| Portfolio turnover rateJ | 34% | 40% | 50% | 34% | 48% |
A Calculated based on average shares outstanding during the period.
B Investment income per share reflects a large, non-recurring dividend which amounted to $.10 per share. Excluding this non-recurring dividend, the ratio of net investment income (loss) to average net assets would have been .60%.
C Investment income per share reflects a large, non-recurring dividend which amounted to $.06 per share. Excluding this non-recurring dividend, the ratio of net investment income (loss) to average net assets would have been .74%.
D Total distributions of $.20 per share is comprised of distributions from net investment income of $.164 and distributions from net realized gain of $.034 per share.
E Amount represents less than $.005 per share.
F Total returns would have been lower if certain expenses had not been reduced during the applicable periods shown.
G Total returns do not include the effect of the sales charges.
H Fees and expenses of any underlying Fidelity Central Funds are not included in the Fund's expense ratio. The Fund indirectly bears its proportionate share of the expenses of any underlying Fidelity Central Funds.
I Expense ratios reflect operating expenses of the class. Expenses before reductions do not reflect amounts reimbursed by the investment adviser or reductions from brokerage service arrangements or reductions from other expense offset arrangements and do not represent the amount paid by the class during periods when reimbursements or reductions occur. Expenses net of fee waivers reflect expenses after reimbursement by the investment adviser but prior to reductions from brokerage service arrangements or other expense offset arrangements. Expenses net of all reductions represent the net expenses paid by the class.
J Amount does not include the portfolio activity of any underlying Fidelity Central Funds.
See accompanying notes which are an integral part of the financial statements.
Financial Highlights — Fidelity Advisor Diversified International Fund Class B
| | | October 31, | | | |
| Years ended October 31, | 2015 | 2014 | 2013 | 2012 | 2011 |
| Selected Per–Share Data | | | | | |
| Net asset value, beginning of period | $18.75 | $18.65 | $14.95 | $13.91 | $14.91 |
| Income from Investment Operations | | | | | |
| Net investment income (loss)A | (.01) | .10B | .05 | .06 | .09C |
| Net realized and unrealized gain (loss) | .59 | .17 | 3.77 | 1.00 | (.96) |
| Total from investment operations | .58 | .27 | 3.82 | 1.06 | (.87) |
| Distributions from net investment income | – | – | (.06) | (.02) | (.10) |
| Distributions from net realized gain | (.02) | (.17) | (.06) | – | (.03) |
| Total distributions | (.02) | (.17) | (.12) | (.02) | (.13) |
| Redemption fees added to paid in capitalA,D | – | – | – | – | – |
| Net asset value, end of period | $19.31 | $18.75 | $18.65 | $14.95 | $13.91 |
| Total ReturnE,F | 3.11% | 1.45% | 25.72% | 7.64% | (5.89)% |
| Ratios to Average Net AssetsG,H | | | | | |
| Expenses before reductions | 2.05% | 2.07% | 2.08% | 2.08% | 2.08% |
| Expenses net of fee waivers, if any | 2.05% | 2.07% | 2.08% | 2.08% | 2.08% |
| Expenses net of all reductions | 2.04% | 2.07% | 2.06% | 2.07% | 2.06% |
| Net investment income (loss) | (.08)% | .53%B | .30% | .44% | .61%C |
| Supplemental Data | | | | | |
| Net assets, end of period (in millions) | $11 | $19 | $36 | $59 | $94 |
| Portfolio turnover rateI | 34% | 40% | 50% | 34% | 48% |
A Calculated based on average shares outstanding during the period.
B Investment income per share reflects a large, non-recurring dividend which amounted to $.09 per share. Excluding this non-recurring dividend, the ratio of net investment income (loss) to average net assets would have been .04%.
C Investment income per share reflects a large, non-recurring dividend which amounted to $.06 per share. Excluding this non-recurring dividend, the ratio of net investment income (loss) to average net assets would have been .21%.
D Amount represents less than $.005 per share.
E Total returns would have been lower if certain expenses had not been reduced during the applicable periods shown.
F Total returns do not include the effect of the contingent deferred sales charge.
G Fees and expenses of any underlying Fidelity Central Funds are not included in the Fund's expense ratio. The Fund indirectly bears its proportionate share of the expenses of any underlying Fidelity Central Funds.
H Expense ratios reflect operating expenses of the class. Expenses before reductions do not reflect amounts reimbursed by the investment adviser or reductions from brokerage service arrangements or reductions from other expense offset arrangements and do not represent the amount paid by the class during periods when reimbursements or reductions occur. Expenses net of fee waivers reflect expenses after reimbursement by the investment adviser but prior to reductions from brokerage service arrangements or other expense offset arrangements. Expenses net of all reductions represent the net expenses paid by the class.
I Amount does not include the portfolio activity of any underlying Fidelity Central Funds.
See accompanying notes which are an integral part of the financial statements.
Financial Highlights — Fidelity Advisor Diversified International Fund Class C
| | | October 31, | | | |
| Years ended October 31, | 2015 | 2014 | 2013 | 2012 | 2011 |
| Selected Per–Share Data | | | | | |
| Net asset value, beginning of period | $18.68 | $18.63 | $14.97 | $13.95 | $14.95 |
| Income from Investment Operations | | | | | |
| Net investment income (loss)A | –B | .11C | .06 | .06 | .10D |
| Net realized and unrealized gain (loss) | .59 | .18 | 3.75 | 1.01 | (.96) |
| Total from investment operations | .59 | .29 | 3.81 | 1.07 | (.86) |
| Distributions from net investment income | (.06) | (.07) | (.09) | (.05) | (.11) |
| Distributions from net realized gain | (.02) | (.17) | (.06) | – | (.03) |
| Total distributions | (.08) | (.24) | (.15) | (.05) | (.14) |
| Redemption fees added to paid in capitalA,B | – | – | – | – | – |
| Net asset value, end of period | $19.19 | $18.68 | $18.63 | $14.97 | $13.95 |
| Total ReturnE,F | 3.15% | 1.58% | 25.71% | 7.71% | (5.83)% |
| Ratios to Average Net AssetsG,H | | | | | |
| Expenses before reductions | 1.97% | 2.00% | 2.04% | 2.06% | 2.05% |
| Expenses net of fee waivers, if any | 1.97% | 2.00% | 2.04% | 2.06% | 2.05% |
| Expenses net of all reductions | 1.96% | 2.00% | 2.01% | 2.05% | 2.03% |
| Net investment income (loss) | - %I | .60%C | .35% | .46% | .64%D |
| Supplemental Data | | | | | |
| Net assets, end of period (in millions) | $251 | $243 | $264 | $246 | $302 |
| Portfolio turnover rateJ | 34% | 40% | 50% | 34% | 48% |
A Calculated based on average shares outstanding during the period.
B Amount represents less than $.005 per share.
C Investment income per share reflects a large, non-recurring dividend which amounted to $.09 per share. Excluding this non-recurring dividend, the ratio of net investment income (loss) to average net assets would have been .11%.
D Investment income per share reflects a large, non-recurring dividend which amounted to $.06 per share. Excluding this non-recurring dividend, the ratio of net investment income (loss) to average net assets would have been .24%.
E Total returns would have been lower if certain expenses had not been reduced during the applicable periods shown.
F Total returns do not include the effect of the contingent deferred sales charge.
G Fees and expenses of any underlying Fidelity Central Funds are not included in the Fund's expense ratio. The Fund indirectly bears its proportionate share of the expenses of any underlying Fidelity Central Funds.
H Expense ratios reflect operating expenses of the class. Expenses before reductions do not reflect amounts reimbursed by the investment adviser or reductions from brokerage service arrangements or reductions from other expense offset arrangements and do not represent the amount paid by the class during periods when reimbursements or reductions occur. Expenses net of fee waivers reflect expenses after reimbursement by the investment adviser but prior to reductions from brokerage service arrangements or other expense offset arrangements. Expenses net of all reductions represent the net expenses paid by the class.
I Amount represents less than .005%
J Amount does not include the portfolio activity of any underlying Fidelity Central Funds.
See accompanying notes which are an integral part of the financial statements.
Financial Highlights — Fidelity Advisor Diversified International Fund Class I
| | | October 31, | | | |
| Years ended October 31, | 2015 | 2014 | 2013 | 2012 | 2011 |
| Selected Per–Share Data | | | | | |
| Net asset value, beginning of period | $19.91 | $19.80 | $15.90 | $14.87 | $15.90 |
| Income from Investment Operations | | | | | |
| Net investment income (loss)A | .21 | .33B | .24 | .23 | .28C |
| Net realized and unrealized gain (loss) | .63 | .18 | 3.98 | 1.05 | (1.03) |
| Total from investment operations | .84 | .51 | 4.22 | 1.28 | (.75) |
| Distributions from net investment income | (.26) | (.23) | (.26) | (.25) | (.25) |
| Distributions from net realized gain | (.02) | (.17) | (.06) | – | (.03) |
| Total distributions | (.29)D | (.40) | (.32) | (.25) | (.28) |
| Redemption fees added to paid in capitalA,E | – | – | – | – | – |
| Net asset value, end of period | $20.46 | $19.91 | $19.80 | $15.90 | $14.87 |
| Total ReturnF | 4.24% | 2.60% | 27.03% | 8.83% | (4.85)% |
| Ratios to Average Net AssetsG,H | | | | | |
| Expenses before reductions | .94% | .97% | .99% | 1.00% | .99% |
| Expenses net of fee waivers, if any | .94% | .97% | .99% | 1.00% | .99% |
| Expenses net of all reductions | .94% | .97% | .97% | .99% | .97% |
| Net investment income (loss) | 1.03% | 1.63%B | 1.39% | 1.52% | 1.70%C |
| Supplemental Data | | | | | |
| Net assets, end of period (in millions) | $747 | $648 | $636 | $546 | $723 |
| Portfolio turnover rateI | 34% | 40% | 50% | 34% | 48% |
A Calculated based on average shares outstanding during the period.
B Investment income per share reflects a large, non-recurring dividend which amounted to $.10 per share. Excluding this non-recurring dividend, the ratio of net investment income (loss) to average net assets would have been 1.14%.
C Investment income per share reflects a large, non-recurring dividend which amounted to $.06 per share. Excluding this non-recurring dividend, the ratio of net investment income (loss) to average net assets would have been 1.30%.
D Total distributions of $.29 per share is comprised of distributions from net investment income of $.263 and distributions from net realized gain of $.022 per share.
E Amount represents less than $.005 per share.
F Total returns would have been lower if certain expenses had not been reduced during the applicable periods shown.
G Fees and expenses of any underlying Fidelity Central Funds are not included in the Fund's expense ratio. The Fund indirectly bears its proportionate share of the expenses of any underlying Fidelity Central Funds.
H Expense ratios reflect operating expenses of the class. Expenses before reductions do not reflect amounts reimbursed by the investment adviser or reductions from brokerage service arrangements or reductions from other expense offset arrangements and do not represent the amount paid by the class during periods when reimbursements or reductions occur. Expenses net of fee waivers reflect expenses after reimbursement by the investment adviser but prior to reductions from brokerage service arrangements or other expense offset arrangements. Expenses net of all reductions represent the net expenses paid by the class.
I Amount does not include the portfolio activity of any underlying Fidelity Central Funds.
See accompanying notes which are an integral part of the financial statements.
Financial Highlights — Fidelity Advisor Diversified International Fund Class Z
| | | October 31, | |
| Years ended October 31, | 2015 | 2014 | 2013 A |
| Selected Per–Share Data | | | |
| Net asset value, beginning of period | $19.93 | $19.81 | $18.54 |
| Income from Investment Operations | | | |
| Net investment income (loss)B | .24 | .36C | .03 |
| Net realized and unrealized gain (loss) | .61 | .19 | 1.24 |
| Total from investment operations | .85 | .55 | 1.27 |
| Distributions from net investment income | (.30) | (.26) | – |
| Distributions from net realized gain | (.02) | (.17) | – |
| Total distributions | (.32) | (.43) | – |
| Redemption fees added to paid in capitalB | –D | –D | – |
| Net asset value, end of period | $20.46 | $19.93 | $19.81 |
| Total ReturnE,F | 4.34% | 2.81% | 6.85% |
| Ratios to Average Net AssetsG,H | | | |
| Expenses before reductions | .79% | .81% | .83%I |
| Expenses net of fee waivers, if any | .79% | .81% | .83%I |
| Expenses net of all reductions | .78% | .81% | .80%I |
| Net investment income (loss) | 1.18% | 1.79%C | .77%I |
| Supplemental Data | | | |
| Net assets, end of period (000 omitted) | $82,925 | $24,050 | $107 |
| Portfolio turnover rateJ | 34% | 40% | 50% |
A For the period August 13, 2013 (commencement of sale of shares) to October 31, 2013.
B Calculated based on average shares outstanding during the period.
C Investment income per share reflects a large, non-recurring dividend which amounted to $.10 per share. Excluding this non-recurring dividend, the ratio of net investment income (loss) to average net assets would have been 1.30%.
D Amount represents less than $.005 per share.
E Total returns for periods of less than one year are not annualized.
F Total returns would have been lower if certain expenses had not been reduced during the applicable periods shown.
G Fees and expenses of any underlying Fidelity Central Funds are not included in the Fund's expense ratio. The Fund indirectly bears its proportionate share of the expenses of any underlying Fidelity Central Funds.
H Expense ratios reflect operating expenses of the class. Expenses before reductions do not reflect amounts reimbursed by the investment adviser or reductions from brokerage service arrangements or reductions from other expense offset arrangements and do not represent the amount paid by the class during periods when reimbursements or reductions occur. Expenses net of fee waivers reflect expenses after reimbursement by the investment adviser but prior to reductions from brokerage service arrangements or other expense offset arrangements. Expenses net of all reductions represent the net expenses paid by the class.
I Annualized
J Amount does not include the portfolio activity of any underlying Fidelity Central Funds.
See accompanying notes which are an integral part of the financial statements.
Notes to Financial Statements
For the period ended October 31, 2015
(Amounts in thousands except percentages)
1. Organization.
Fidelity Advisor Diversified International Fund (the Fund) is a fund of Fidelity Advisor Series VIII (the Trust) and is authorized to issue an unlimited number of shares. The Trust is registered under the Investment Company Act of 1940, as amended (the 1940 Act), as an open-end management investment company organized as a Massachusetts business trust. The Fund offers Class A, Class T, Class C, Class I (formerly Institutional Class) and Class Z shares, each of which, along with Class B shares, has equal rights as to assets and voting privileges. Class B shares are closed to new accounts and additional purchases, except for exchanges and reinvestments. Each class has exclusive voting rights with respect to matters that affect that class. Class B shares will automatically convert to Class A shares after a holding period of seven years from the initial date of purchase.
2. Investments in Fidelity Central Funds.
The Fund invests in Fidelity Central Funds, which are open-end investment companies generally available only to other investment companies and accounts managed by the investment adviser and its affiliates. The Fund's Schedule of Investments lists each of the Fidelity Central Funds held as of period end, if any, as an investment of the Fund, but does not include the underlying holdings of each Fidelity Central Fund. As an Investing Fund, the Fund indirectly bears its proportionate share of the expenses of the underlying Fidelity Central Funds.
The Money Market Central Funds seek preservation of capital and current income and are managed by Fidelity Investments Money Management, Inc. (FIMM), an affiliate of the investment adviser. Annualized expenses of the Money Market Central Funds as of their most recent shareholder report date are less than .005%.
A complete unaudited list of holdings for each Fidelity Central Fund is available upon request or at the Securities and Exchange Commission (the SEC) website at www.sec.gov. In addition, the financial statements of the Fidelity Central Funds, which are not covered by the Fund's Report of Independent Registered Public Accounting Firm, are available on the SEC website or upon request.
3. Significant Accounting Policies.
The financial statements have been prepared in conformity with accounting principles generally accepted in the United States of America (GAAP), which require management to make certain estimates and assumptions at the date of the financial statements. Actual results could differ from those estimates. Subsequent events, if any, through the date that the financial statements were issued have been evaluated in the preparation of the financial statements. The following summarizes the significant accounting policies of the Fund:
Investment Valuation. Investments are valued as of 4:00 p.m. Eastern time on the last calendar day of the period. The Board of Trustees (the Board) has delegated the day to day responsibility for the valuation of the Fund's investments to the Fidelity Management & Research Company (FMR) Fair Value Committee (the Committee). In accordance with valuation policies and procedures approved by the Board, the Fund attempts to obtain prices from one or more third party pricing vendors or brokers to value its investments. When current market prices, quotations or currency exchange rates are not readily available or reliable, investments will be fair valued in good faith by the Committee, in accordance with procedures adopted by the Board. Factors used in determining fair value vary by investment type and may include market or investment specific events, changes in interest rates and credit quality. The frequency with which these procedures are used cannot be predicted and they may be utilized to a significant extent. The Committee oversees the Fund's valuation policies and procedures and reports to the Board on the Committee's activities and fair value determinations. The Board monitors the appropriateness of the procedures used in valuing the Fund's investments and ratifies the fair value determinations of the Committee.
The Fund categorizes the inputs to valuation techniques used to value its investments into a disclosure hierarchy consisting of three levels as shown below:
- Level 1 – quoted prices in active markets for identical investments
- Level 2 – other significant observable inputs (including quoted prices for similar investments, interest rates, prepayment speeds, etc.)
- Level 3 – unobservable inputs (including the Fund's own assumptions based on the best information available)
Valuation techniques used to value the Fund's investments by major category are as follows:
Equity securities, including restricted securities, for which market quotations are readily available, are valued at the last reported sale price or official closing price as reported by a third party pricing vendor on the primary market or exchange on which they are traded and are categorized as Level 1 in the hierarchy. In the event there were no sales during the day or closing prices are not available, securities are valued at the last quoted bid price or may be valued using the last available price and are generally categorized as Level 2 in the hierarchy. For foreign equity securities, when market or security specific events arise, comparisons to the valuation of American Depositary Receipts (ADRs), futures contracts, Exchange-Traded Funds (ETFs) and certain indexes as well as quoted prices for similar securities may be used and would be categorized as Level 2 in the hierarchy. Utilizing these techniques may result in transfers between Level 1 and Level 2. For equity securities, including restricted securities, where observable inputs are limited, assumptions about market activity and risk are used and these securities may be categorized as Level 3 in the hierarchy.
Debt securities, including restricted securities, are valued based on evaluated prices received from third party pricing vendors or from brokers who make markets in such securities. Preferred securities and U.S. government and government agency obligations are valued by pricing vendors who utilize matrix pricing which considers yield or price of bonds of comparable quality, coupon, maturity and type or by broker-supplied prices. When independent prices are unavailable or unreliable, debt securities may be valued utilizing pricing methodologies which consider similar factors that would be used by third party pricing vendors. Debt securities are generally categorized as Level 2 in the hierarchy but may be Level 3 depending on the circumstances.
Futures contracts are valued at the settlement price established each day by the board of trade or exchange on which they are traded and are categorized as Level 1 in the hierarchy. Investments in open-end mutual funds, including the other Fidelity Central Funds, are valued at their closing net asset value (NAV) each business day and are categorized as Level 1 in the hierarchy.
Changes in valuation techniques may result in transfers in or out of an assigned level within the disclosure hierarchy. The aggregate value of investments by input level as of October 31, 2015, including information on transfers between Levels 1 and 2, is included at the end of the Fund's Schedule of Investments.
Foreign Currency. The Fund may use foreign currency contracts to facilitate transactions in foreign-denominated securities. Gains and losses from these transactions may arise from changes in the value of the foreign currency or if the counterparties do not perform under the contracts' terms.
Foreign-denominated assets, including investment securities, and liabilities are translated into U.S. dollars at the exchange rates at period end. Purchases and sales of investment securities, income and dividends received and expenses denominated in foreign currencies are translated into U.S. dollars at the exchange rate in effect on the transaction date.
The effects of exchange rate fluctuations on investments are included with the net realized and unrealized gain (loss) on investment securities. Other foreign currency transactions resulting in realized and unrealized gain (loss) are disclosed separately.
Investment Transactions and Income. For financial reporting purposes, the Fund's investment holdings and NAV include trades executed through the end of the last business day of the period. The NAV per share for processing shareholder transactions is calculated as of the close of business of the New York Stock Exchange (NYSE), normally 4:00 p.m. Eastern time and includes trades executed through the end of the prior business day. Gains and losses on securities sold are determined on the basis of identified cost and may include proceeds received from litigation. Dividend income is recorded on the ex-dividend date, except for certain dividends from foreign securities where the ex-dividend date may have passed, which are recorded as soon as the Fund is informed of the ex-dividend date. Non-cash dividends included in dividend income, if any, are recorded at the fair market value of the securities received. Income and capital gain distributions from Fidelity Central Funds, if any, are recorded on the ex-dividend date. Distributions received on securities that represent a return of capital or capital gain are recorded as a reduction of cost of investments and/or as a realized gain. Subsequent to ex-dividend date the Fund determines the components of these distributions, based upon receipt of tax filings or other correspondence relating to the underlying investment. Interest income is accrued as earned and includes coupon interest and amortization of premium and accretion of discount on debt securities as applicable. Investment income is recorded net of foreign taxes withheld where recovery of such taxes is uncertain.
Class Allocations and Expenses. Investment income, realized and unrealized capital gains and losses, common expenses of the Fund, and certain fund-level expense reductions, if any, are allocated daily on a pro-rata basis to each class based on the relative net assets of each class to the total net assets of the Fund. Each class differs with respect to transfer agent and distribution and service plan fees incurred. Certain expense reductions may also differ by class. For the reporting period, the allocated portion of income and expenses to each class as a percent of its average net assets may vary due to the timing of recording these transactions in relation to fluctuating net assets of the classes. Expenses directly attributable to a fund are charged to that fund. Expenses attributable to more than one fund are allocated among the respective funds on the basis of relative net assets or other appropriate methods. Expense estimates are accrued in the period to which they relate and adjustments are made when actual amounts are known.
Deferred Trustee Compensation. Under a Deferred Compensation Plan (the Plan), independent Trustees may elect to defer receipt of a portion of their annual compensation. Deferred amounts are invested in a cross-section of Fidelity funds, are marked-to-market and remain in the Fund until distributed in accordance with the Plan. The investment of deferred amounts and the offsetting payable to the Trustees are included in the accompanying Statement of Assets and Liabilities.
Income Tax Information and Distributions to Shareholders. Each year, the Fund intends to qualify as a regulated investment company under Subchapter M of the Internal Revenue Code, including distributing substantially all of its taxable income and realized gains. As a result, no provision for U.S. Federal income taxes is required. As of October 31, 2015, the Fund did not have any unrecognized tax benefits in the financial statements; nor is the Fund aware of any tax positions for which it is reasonably possible that the total amounts of unrecognized tax benefits will significantly change in the next twelve months. The Fund files a U.S. federal tax return, in addition to state and local tax returns as required. The Fund's federal income tax returns are subject to examination by the Internal Revenue Service (IRS) for a period of three fiscal years after they are filed. State and local tax returns may be subject to examination for an additional fiscal year depending on the jurisdiction. Foreign taxes are provided for based on the Fund's understanding of the tax rules and rates that exist in the foreign markets in which it invests. The Fund is subject to a tax imposed on capital gains by certain countries in which it invests. An estimated deferred tax liability for net unrealized appreciation on the applicable securities is included in Other payables and accrued expenses on the Statement of Assets & Liabilities.
Distributions are declared and recorded on the ex-dividend date. Income dividends and capital gain distributions are declared separately for each class. Income and capital gain distributions are determined in accordance with income tax regulations, which may differ from GAAP.
Capital accounts within the financial statements are adjusted for permanent book-tax differences. These adjustments have no impact on net assets or the results of operations. Capital accounts are not adjusted for temporary book-tax differences which will reverse in a subsequent period.
Book-tax differences are primarily due to foreign currency transactions, partnerships, futures transactions, passive foreign investment companies (PFIC), market discount, deferred trustees compensation, capital loss carryforwards and losses deferred due to wash sales.
The federal tax cost of investment securities and unrealized appreciation (depreciation) as of period end were as follows:
| Gross unrealized appreciation | $428,251 |
| Gross unrealized depreciation | (91,122) |
| Net unrealized appreciation (depreciation) on securities | $337,129 |
| Tax Cost | $1,697,366 |
The tax-based components of distributable earnings as of period end were as follows:
| Undistributed ordinary income | $12,761 |
| Capital loss carryforward | $(2,606,019) |
| Net unrealized appreciation (depreciation) on securities and other investments | $337,144 |
Capital loss carryforwards are only available to offset future capital gains of the Fund to the extent provided by regulations and may be limited. Under the Regulated Investment Company Modernization Act of 2010 (the Act), the Fund is permitted to carry forward capital losses incurred in taxable years beginning after December 22, 2010 for an unlimited period and such capital losses are required to be used prior to any losses that expire. The capital loss carryforward information presented below, including any applicable limitation, is estimated as of fiscal period end and is subject to adjustment.
| Fiscal year of expiration | |
The tax character of distributions paid was as follows:
| | October 31, 2015 | October 31, 2014 |
| Ordinary Income | $20,879 | $ 34,939 |
Short-Term Trading (Redemption) Fees. Shares held by investors in the Fund less than 30 days may have been subject to a redemption fee equal to 1.00% of the NAV of shares redeemed. All redemption fees, which reduce the proceeds of the shareholder redemption, are retained by the Fund and accounted for as an addition to paid in capital.
Restricted Securities. The Fund may invest in securities that are subject to legal or contractual restrictions on resale. These securities generally may be resold in transactions exempt from registration or to the public if the securities are registered. Disposal of these securities may involve time-consuming negotiations and expense, and prompt sale at an acceptable price may be difficult. Information regarding restricted securities is included at the end of the Fund's Schedule of Investments.
4. Derivative Instruments.
Risk Exposures and the Use of Derivative Instruments. The Fund's investment objective allows the Fund to enter into various types of derivative contracts, including futures contracts. Derivatives are investments whose value is primarily derived from underlying assets, indices or reference rates and may be transacted on an exchange or over-the-counter (OTC). Derivatives may involve a future commitment to buy or sell a specified asset based on specified terms, to exchange future cash flows at periodic intervals based on a notional principal amount, or for one party to make one or more payments upon the occurrence of specified events in exchange for periodic payments from the other party.
The Fund used derivatives to increase returns and to manage exposure to certain risks as defined below. The success of any strategy involving derivatives depends on analysis of numerous economic factors, and if the strategies for investment do not work as intended, the Fund may not achieve its objectives.
The Fund's use of derivatives increased or decreased its exposure to the following risk:
| Equity Risk | Equity risk relates to the fluctuations in the value of financial instruments as a result of changes in market prices (other than those arising from interest rate risk or foreign exchange risk), whether caused by factors specific to an individual investment, its issuer, or all factors affecting all instruments traded in a market or market segment. |
The Fund is also exposed to additional risks from investing in derivatives, such as liquidity risk and counterparty credit risk. Liquidity risk is the risk that the Fund will be unable to close out the derivative in the open market in a timely manner. Counterparty credit risk is the risk that the counterparty will not be able to fulfill its obligation to the Fund. Counterparty credit risk related to exchange-traded futures contracts may be mitigated by the protection provided by the exchange on which they trade.
Investing in derivatives may involve greater risks than investing in the underlying assets directly and, to varying degrees, may involve risk of loss in excess of any initial investment and collateral received and amounts recognized in the Statement of Assets and Liabilities. In addition, there may be the risk that the change in value of the derivative contract does not correspond to the change in value of the underlying instrument.
Futures Contracts. A futures contract is an agreement between two parties to buy or sell a specified underlying instrument for a fixed price at a specified future date. The Fund used futures contracts to manage its exposure to the stock market.
Upon entering into a futures contract, a fund is required to deposit either cash or securities (initial margin) with a clearing broker in an amount equal to a certain percentage of the face value of the contract. Futures contracts are marked-to-market daily and subsequent daily payments (variation margin) are made or received by a fund depending on the daily fluctuations in the value of the futures contracts and are recorded as unrealized appreciation or (depreciation). This receivable and/or payable, if any, is included in daily variation margin for derivative instruments in the Statement of Assets and Liabilities. Realized gain or (loss) is recorded upon the expiration or closing of a futures contract.
Any open futures contracts at period end are presented in the Schedule of Investments under the caption "Futures Contracts". The underlying face amount at value reflects each contract's exposure to the underlying instrument or index at period end. Securities deposited to meet initial margin requirements are identified in the Schedule of Investments. Cash deposited to meet initial margin requirements is presented as segregated cash with brokers for derivative instruments in the Statement of Assets and Liabilities.
During the period the Fund recognized net realized gain (loss) of $(578) and a change in net unrealized appreciation (depreciation) of $439 related to its investment in futures contracts. This amount included in the Statement of Operations.
5. Purchases and Sales of Investments.
Purchases and sales of securities, other than short-term securities, aggregated $650,132 and $663,500, respectively.
6. Fees and Other Transactions with Affiliates.
Management Fee. Fidelity Management & Research Company (the investment adviser) and its affiliates provide the Fund with investment management related services for which the Fund pays a monthly management fee. The management fee is the sum of an individual fund fee rate that is based on an annual rate of .42% of the Fund's average net assets and an annualized group fee rate that averaged .25% during the period. The group fee rate is based upon the average net assets of all the mutual funds advised by the investment adviser, including any mutual funds previously advised by the investment adviser that are currently advised by Fidelity SelectCo, LLC, an affiliate of the investment adviser. The group fee rate decreases as assets under management increase and increases as assets under management decrease. For the reporting period, the total annual management fee rate was .67% of the Fund's average net assets.
Distribution and Service Plan Fees. In accordance with Rule 12b-1 of the 1940 Act, the Fund has adopted separate Distribution and Service Plans for each class of shares. Certain classes pay Fidelity Distributors Corporation (FDC), an affiliate of the investment adviser, separate Distribution and Service Fees, each of which is based on an annual percentage of each class' average net assets. In addition, FDC may pay financial intermediaries for selling shares of the Fund and providing shareholder support services. For the period, the Distribution and Service Fee rates, total fees and amounts retained by FDC were as follows:
| | Distribution
Fee | Service
Fee | Total Fees | Retained
by FDC |
| Class A | -% | .25% | $1,665 | $3 |
| Class T | .25% | .25% | 1,402 | –(a) |
| Class B | .75% | .25% | 151 | 113 |
| Class C | .75% | .25% | 2,475 | 120 |
| | | | $5,693 | $236 |
(a) In the amount of less than five hundred dollars.
Sales Load. FDC may receive a front-end sales charge of up to 5.75% for selling Class A shares and 3.50% for selling Class T shares, some of which is paid to financial intermediaries for selling shares of the Fund. Depending on the holding period, FDC may receive contingent deferred sales charges levied on Class A, Class T, Class B, and Class C redemptions. The deferred sales charges range from 5.00% to 1.00% for Class B shares, 1.00% for Class C shares, 1.00% for certain purchases of Class A shares and .25% for certain purchases of Class T shares.
For the period, sales charge amounts retained by FDC were as follows:
| | Retained
by FDC
|
| Class A | $119 |
| Class T | 27 |
| Class BA | 7 |
| Class CA | 7 |
| | 160 |
A When Class B and Class C shares are initially sold, FDC pays commissions from its own resources to financial intermediaries through which the sales are made.
Transfer Agent Fees. Fidelity Investments Institutional Operations Company, Inc., (FIIOC), an affiliate of the investment adviser, is the transfer, dividend disbursing and shareholder servicing agent for each class of the Fund. FIIOC receives account fees and asset-based fees that vary according to the account size and type of account of the shareholders of the respective classes of the Fund, except for Class Z. FIIOC receives an asset-based fee of Class Z's average net assets. FIIOC pays for typesetting, printing and mailing of shareholder reports, except proxy statements.
For the period, transfer agent fees for each class were as follows:
| | Amount | % of
Class-Level Average
Net Assets |
| Class A | $1,528 | .23 |
| Class T | 667 | .24 |
| Class B | 45 | .30 |
| Class C | 563 | .23 |
| Class I | 1,422 | .20 |
| Class Z | 30 | .05 |
| | $ 4,255 | |
Accounting and Security Lending Fees. Fidelity Service Company, Inc. (FSC), an affiliate of the investment adviser, maintains the Fund's accounting records. The accounting fee is based on the level of average net assets for each month. Under a separate contract, FSC administers the security lending program. The security lending fee is based on the number and duration of lending transactions.
Brokerage Commissions. The Fund placed a portion of its portfolio transactions with brokerage firms which are affiliates of the investment adviser. Brokerage commissions are included in net realized gain (loss) and change in net unrealized appreciation (depreciation) in the Statement of Operations. The commissions paid to these affiliated firms were $3 for the period.
Other. During the period, the investment adviser reimbursed the Fund for certain losses in the amount of $5.
7. Committed Line of Credit.
The Fund participates with other funds managed by the investment adviser or an affiliate in a $4.25 billion credit facility (the "line of credit") to be utilized for temporary or emergency purposes to fund shareholder redemptions or for other short-term liquidity purposes. The Fund has agreed to pay commitment fees on its pro-rata portion of the line of credit, which amounted to $3 and is reflected in Miscellaneous expenses on the Statement of Operations. During the period, the Fund did not borrow on this line of credit.
8. Security Lending.
The Fund lends portfolio securities through a lending agent from time to time in order to earn additional income. For equity securities, a lending agent is used and may loan securities to certain qualified borrowers, including Fidelity Capital Markets (FCM), a broker-dealer affiliated with the Fund. On the settlement date of the loan, the Fund receives collateral (in the form of U.S. Treasury obligations, letters of credit and/or cash) against the loaned securities and maintains collateral in an amount not less than 100% of the market value of the loaned securities during the period of the loan. The market value of the loaned securities is determined at the close of business of the Fund and any additional required collateral is delivered to the Fund on the next business day. The Fund or borrower may terminate the loan at any time, and if the borrower defaults on its obligation to return the securities loaned because of insolvency or other reasons, the Fund may apply collateral received from the borrower against the obligation. The Fund may experience delays and costs in recovering the securities loaned. Any cash collateral received is invested in the Fidelity Securities Lending Cash Central Fund. The value of loaned securities and cash collateral at period end are disclosed on the Fund's Statement of Assets and Liabilities. Security lending income represents the income earned on investing cash collateral, less rebates paid to borrowers and any lending agent fees associated with the loan, plus any premium payments received for lending certain types of securities. Security lending income is presented in the Statement of Operations as a component of income from Fidelity Central Funds. Total security lending income during the period amounted to $559, including $1 from securities loaned to FCM.
9. Expense Reductions.
Commissions paid to certain brokers with whom the investment adviser, or its affiliates, places trades on behalf of the Fund include an amount in addition to trade execution, which may be rebated back to the Fund to offset certain expenses. This amount totaled $97 for the period.
In addition, during the period the investment adviser reimbursed and/or waived a portion of fund-level operating expenses in the amount of $8 and a portion of class-level operating expenses as follows:
| | Amount |
| Class A | $17 |
| Class T | 7 |
| Class B | –(a) |
| Class C | 6 |
| Class I | 12 |
| | $42 |
(a) In the amount of less than five hundred dollars.
10. Distributions to Shareholders.
Distributions to shareholders of each class were as follows:
| Years ended October 31, | 2015 | 2014 |
| From net investment income | | |
| Class A | $7,030 | $6,853 |
| Class T | 2,091 | 2,251 |
| Class C | 706 | 979 |
| Class I | 8,555 | 7,291 |
| Class Z | 356 | 1 |
| Total | $18,738 | $17,375 |
| From net realized gain | | |
| Class A | $727 | $6,584 |
| Class T | 317 | 2,789 |
| Class B | 21 | 307 |
| Class C | 280 | 2,390 |
| Class I | 770 | 5,493 |
| Class Z | 26 | 1 |
| Total | $2,141 | $17,564 |
11. Share Transactions.
Share transactions for each class were as follows and may contain automatic conversions between classes or exchanges between funds:
| | Shares | Shares | Dollars | Dollars |
| Years ended October 31, | 2015 | 2014 | 2015 | 2014 |
| Class A | | | | |
| Shares sold | 6,331 | 4,795 | $128,828 | $94,751 |
| Reinvestment of distributions | 378 | 646 | 7,410 | 12,430 |
| Shares redeemed | (9,229) | (8,821) | (183,333) | (174,243) |
| Net increase (decrease) | (2,520) | (3,380) | $(47,095) | $(67,062) |
| Class T | | | | |
| Shares sold | 1,574 | 1,185 | $31,817 | $23,252 |
| Reinvestment of distributions | 120 | 249 | 2,332 | 4,764 |
| Shares redeemed | (2,697) | (3,330) | (53,711) | (65,214) |
| Net increase (decrease) | (1,003) | (1,896) | $(19,562) | $(37,198) |
| Class B | | | | |
| Shares sold | 20 | 29 | $400 | $537 |
| Reinvestment of distributions | 1 | 15 | 19 | 278 |
| Shares redeemed | (467) | (933) | (9,077) | (17,767) |
| Net increase (decrease) | (446) | (889) | $(8,658) | $(16,952) |
| Class C | | | | |
| Shares sold | 2,044 | 874 | $40,003 | $16,572 |
| Reinvestment of distributions | 44 | 149 | 826 | 2,754 |
| Shares redeemed | (2,036) | (2,144) | (39,156) | (40,544) |
| Net increase (decrease) | 52 | (1,121) | $1,673 | $(21,218) |
| Class I | | | | |
| Shares sold | 13,465 | 7,676 | $273,323 | $154,759 |
| Reinvestment of distributions | 415 | 582 | 8,253 | 11,367 |
| Shares redeemed | (9,912) | (7,810) | (200,987) | (158,739) |
| Net increase (decrease) | 3,968 | 448 | $80,589 | $7,387 |
| Class Z | | | | |
| Shares sold | 3,275 | 1,246 | $65,174 | $26,144 |
| Reinvestment of distributions | 19 | – | 382 | 2 |
| Shares redeemed | (449) | (44) | (9,238) | (873) |
| Net increase (decrease) | 2,845 | 1,202 | $56,318 | $25,273 |
12. Other.
The Fund's organizational documents provide former and current trustees and officers with a limited indemnification against liabilities arising in connection with the performance of their duties to the Fund. In the normal course of business, the Fund may also enter into contracts that provide general indemnifications. The Fund's maximum exposure under these arrangements is unknown as this would be dependent on future claims that may be made against the Fund. The risk of material loss from such claims is considered remote.
Report of Independent Registered Public Accounting Firm
To the Trustees of Fidelity Advisor Series VIII and Shareholders of Fidelity Advisor® Diversified International Fund:
In our opinion, the accompanying statement of assets and liabilities, including the schedule of investments, and the related statements of operations and of changes in net assets and the financial highlights present fairly, in all material respects, the financial position of Fidelity Advisor® Diversified International Fund (a fund of Fidelity Advisor Series VIII) at October 31, 2015, the results of its operations for the year then ended, the changes in its net assets for each of the two years in the period then ended and the financial highlights for each of the periods indicated, in conformity with accounting principles generally accepted in the United States of America. These financial statements and financial highlights (hereafter referred to as “financial statements”) are the responsibility of the Fidelity Advisor® Diversified International Fund’s management. Our responsibility is to express an opinion on these financial statements based on our audits. We conducted our audits of these financial statements in accordance with the standards of the Public Company Accounting Oversight Board (United States). Those standards require that we plan and perform the audit to obtain reasonable assurance about whether the financial statements are free of material misstatement. An audit includes examining, on a test basis, evidence supporting the amounts and disclosures in the financial statements, assessing the accounting principles used and significant estimates made by management, and evaluating the overall financial statement presentation. We believe that our audits, which included confirmation of securities at October 31, 2015 by correspondence with the custodian and brokers, provide a reasonable basis for our opinion.
PricewaterhouseCoopers LLP
Boston, Massachusetts
December 16, 2015
Trustees and Officers
The Trustees, Members of the Advisory Board (if any), and officers of the trust and fund, as applicable, are listed below. The Board of Trustees governs the fund and is responsible for protecting the interests of shareholders. The Trustees are experienced executives who meet periodically throughout the year to oversee the fund's activities, review contractual arrangements with companies that provide services to the fund, oversee management of the risks associated with such activities and contractual arrangements, and review the fund's performance. Each of the Trustees oversees 170 funds.
The Trustees hold office without limit in time except that (a) any Trustee may resign; (b) any Trustee may be removed by written instrument, signed by at least two-thirds of the number of Trustees prior to such removal; (c) any Trustee who requests to be retired or who has become incapacitated by illness or injury may be retired by written instrument signed by a majority of the other Trustees; and (d) any Trustee may be removed at any special meeting of shareholders by a two-thirds vote of the outstanding voting securities of the trust. Each Trustee who is not an interested person (as defined in the 1940 Act) of the trust and the fund is referred to herein as an Independent Trustee. Each Independent Trustee shall retire not later than the last day of the calendar year in which his or her 75th birthday occurs. The Independent Trustees may waive this mandatory retirement age policy with respect to individual Trustees. Officers and Advisory Board Members hold office without limit in time, except that any officer or Advisory Board Member may resign or may be removed by a vote of a majority of the Trustees at any regular meeting or any special meeting of the Trustees. Except as indicated, each individual has held the office shown or other offices in the same company for the past five years.
The fund’s Statement of Additional Information (SAI) includes more information about the Trustees. To request a free copy, call Fidelity at 1-877-208-0098.
Experience, Skills, Attributes, and Qualifications of the Trustees. The Governance and Nominating Committee has adopted a statement of policy that describes the experience, qualifications, attributes, and skills that are necessary and desirable for potential Independent Trustee candidates (Statement of Policy). The Board believes that each Trustee satisfied at the time he or she was initially elected or appointed a Trustee, and continues to satisfy, the standards contemplated by the Statement of Policy. The Governance and Nominating Committee also engages professional search firms to help identify potential Independent Trustee candidates who have the experience, qualifications, attributes, and skills consistent with the Statement of Policy. From time to time, additional criteria based on the composition and skills of the current Independent Trustees, as well as experience or skills that may be appropriate in light of future changes to board composition, business conditions, and regulatory or other developments, have also been considered by the professional search firms and the Governance and Nominating Committee. In addition, the Board takes into account the Trustees' commitment and participation in Board and committee meetings, as well as their leadership of standing and ad hoc committees throughout their tenure.
In determining that a particular Trustee was and continues to be qualified to serve as a Trustee, the Board has considered a variety of criteria, none of which, in isolation, was controlling. The Board believes that, collectively, the Trustees have balanced and diverse experience, qualifications, attributes, and skills, which allow the Board to operate effectively in governing the fund and protecting the interests of shareholders. Information about the specific experience, skills, attributes, and qualifications of each Trustee, which in each case led to the Board's conclusion that the Trustee should serve (or continue to serve) as a trustee of the fund, is provided below.
Board Structure and Oversight Function. James C. Curvey is an interested person and currently serves as Chairman. The Trustees have determined that an interested Chairman is appropriate and benefits shareholders because an interested Chairman has a personal and professional stake in the quality and continuity of services provided to the fund. Independent Trustees exercise their informed business judgment to appoint an individual of their choosing to serve as Chairman, regardless of whether the Trustee happens to be independent or a member of management. The Independent Trustees have determined that they can act independently and effectively without having an Independent Trustee serve as Chairman and that a key structural component for assuring that they are in a position to do so is for the Independent Trustees to constitute a substantial majority for the Board. The Independent Trustees also regularly meet in executive session. Ned C. Lautenbach serves as Chairman of the Independent Trustees and as such (i) acts as a liaison between the Independent Trustees and management with respect to matters important to the Independent Trustees and (ii) with management prepares agendas for Board meetings.
Fidelity® funds are overseen by different Boards of Trustees. The fund's Board oversees Fidelity's high income and certain equity funds, and other Boards oversee Fidelity's investment-grade bond, money market, asset allocation, and sector funds. The asset allocation funds may invest in Fidelity® funds overseen by the fund's Board. The use of separate Boards, each with its own committee structure, allows the Trustees of each group of Fidelity® funds to focus on the unique issues of the funds they oversee, including common research, investment, and operational issues. On occasion, the separate Boards establish joint committees to address issues of overlapping consequences for the Fidelity® funds overseen by each Board.
The Trustees operate using a system of committees to facilitate the timely and efficient consideration of all matters of importance to the Trustees, the fund, and fund shareholders and to facilitate compliance with legal and regulatory requirements and oversight of the fund's activities and associated risks. The Board, acting through its committees, has charged FMR and its affiliates with (i) identifying events or circumstances the occurrence of which could have demonstrably adverse effects on the fund's business and/or reputation; (ii) implementing processes and controls to lessen the possibility that such events or circumstances occur or to mitigate the effects of such events or circumstances if they do occur; and (iii) creating and maintaining a system designed to evaluate continuously business and market conditions in order to facilitate the identification and implementation processes described in (i) and (ii) above. Because the day-to-day operations and activities of the fund are carried out by or through FMR, its affiliates, and other service providers, the fund's exposure to risks is mitigated but not eliminated by the processes overseen by the Trustees. While each of the Board's committees has responsibility for overseeing different aspects of the fund's activities, oversight is exercised primarily through the Operations, Audit, and Compliance Committees. In addition, the Independent Trustees have worked with FMR to enhance the Board's oversight of investment and financial risks, legal and regulatory risks, technology risks, and operational risks, including the development of additional risk reporting to the Board. For example, a working group comprised of Independent Trustees and FMR has worked and continues to work to review the Fidelity® funds' valuation-related activities, reporting and risk management. Appropriate personnel, including but not limited to the fund's Chief Compliance Officer (CCO), FMR's internal auditor, the independent accountants, the fund's Treasurer and portfolio management personnel, make periodic reports to the Board's committees, as appropriate, including an annual review of Fidelity's risk management program for the Fidelity® funds. The responsibilities of each standing committee, including their oversight responsibilities, are described further under "Standing Committees of the Trustees."
Interested Trustees*:
Correspondence intended for a Trustee who is an interested person may be sent to Fidelity Investments, 245 Summer Street, Boston, Massachusetts 02210.
Name, Year of Birth; Principal Occupations and Other Relevant Experience+
James C. Curvey (1935)
Year of Election or Appointment: 2007
Trustee
Chairman of the Board of Trustees
Mr. Curvey also serves as Trustee of other Fidelity® funds. Mr. Curvey is a Director of Fidelity Research & Analysis Co. (investment adviser firm, 2009-present), and Vice Chairman (2007-present) and Director of FMR LLC (diversified financial services company). In addition, Mr. Curvey serves as an Overseer for the Boston Symphony Orchestra and a member of the board of Artis-Naples, Naples, Florida, and as a Trustee for Brewster Academy, Wolfeboro, New Hampshire. Previously, Mr. Curvey served as a Director of Fidelity Investments Money Management, Inc. (investment adviser firm, 2009-2014) and a Director of FMR and FMR Co., Inc. (investment adviser firms, 2007-2014).
Charles S. Morrison (1960)
Year of Election or Appointment: 2014
Trustee
Mr. Morrison also serves as Trustee of other funds. He serves as a Director of Fidelity Investments Money Management, Inc. (FIMM) (investment adviser firm, 2014-present), Director of Fidelity SelectCo, LLC (investment adviser firm, 2014-present), President, Asset Management (2014-present), and is an employee of Fidelity Investments. Previously, Mr. Morrison served as Vice President of Fidelity's Fixed Income and Asset Allocation Funds (2012-2014), President, Fixed Income (2011-2014), Vice President of Fidelity's Money Market Funds (2005-2009), President, Money Market Group Leader of FMR (investment adviser firm, 2009), and Senior Vice President, Money Market Group of FMR (2004-2009). Mr. Morrison also served as Vice President of Fidelity's Bond Funds (2002-2005), certain Balanced Funds (2002-2005), and certain Asset Allocation Funds (2002-2007), and as Senior Vice President (2002-2005) of Fidelity's Bond Division.
* Determined to be an “Interested Trustee” by virtue of, among other things, his or her affiliation with the trust or various entities under common control with FMR.
+ The information includes the Trustee's principal occupation during the last five years and other information relating to the experience, attributes, and skills relevant to the Trustee's qualifications to serve as a Trustee, which led to the conclusion that the Trustee should serve as a Trustee for the fund.
Independent Trustees:
Correspondence intended for an Independent Trustee may be sent to Fidelity Investments, P.O. Box 55235, Boston, Massachusetts 02205-5235.
Name, Year of Birth; Principal Occupations and Other Relevant Experience+
Dennis J. Dirks (1948)
Year of Election or Appointment: 2005
Trustee
Mr. Dirks also serves as Trustee of other Fidelity® funds. Prior to his retirement in May 2003, Mr. Dirks was Chief Operating Officer and a member of the Board of The Depository Trust & Clearing Corporation (DTCC). He also served as President, Chief Operating Officer, and Board member of The Depository Trust Company (DTC) and President and Board member of the National Securities Clearing Corporation (NSCC). In addition, Mr. Dirks served as Chief Executive Officer and Board member of the Government Securities Clearing Corporation, Chief Executive Officer and Board member of the Mortgage-Backed Securities Clearing Corporation, as a Trustee and a member of the Finance Committee of Manhattan College (2005-2008), as a Trustee and a member of the Finance Committee of AHRC of Nassau County (2006-2008), and as a member of the Independent Directors Council (IDC) Governing Council (2010-2015). Mr. Dirks is a member of the Board of Directors for The Brookville Center for Children's Services, Inc. (2009-present).
Alan J. Lacy (1953)
Year of Election or Appointment: 2008
Trustee
Mr. Lacy also serves as Trustee of other Fidelity® funds. Mr. Lacy serves as a member of the Board of Directors of Dave & Buster's Entertainment, Inc. (restaurant and entertainment complexes, 2010-present) and Bristol-Myers Squibb Company (global pharmaceuticals, 2008-present). In addition, Mr. Lacy served as Senior Adviser (2007-2014) of Oak Hill Capital Partners, L.P. (private equity) and also served as Chief Executive Officer (2000-2005) and Vice Chairman (2005-2006) of Sears Holdings Corporation and Sears, Roebuck and Co. (retail). Mr. Lacy is a member of the Board of Trustees of The National Parks Conservation Association (2006-present). Previously, Mr. Lacy served as Chairman of the Board of Trustees of the National Parks Conservation Association (2008-2011) and as a member of the Board of Directors for The Western Union Company (global money transfer, 2006-2011), The Hillman Companies, Inc. (hardware wholesalers, 2010-2014), and Earth Fare, Inc. (retail grocery, 2010-2014).
Ned C. Lautenbach (1944)
Year of Election or Appointment: 2000
Trustee
Chairman of the Independent Trustees
Mr. Lautenbach also serves as Trustee of other Fidelity® funds. Mr. Lautenbach currently serves as the Lead Director of the Eaton Corporation Board of Directors (diversified industrial, 1997-present). Mr. Lautenbach is Chairman of the Board of Directors of Artis-Naples in Naples, Florida (2012-present), a member of the Council on Foreign Relations (1994-present), and a member of the Board of Governors, State University System of Florida (2013-present). Previously, Mr. Lautenbach was a Partner/Advisory Partner at Clayton, Dubilier & Rice, LLC (private equity investment, 1998-2010), as well as a Director of Sony Corporation (2006-2007).
Joseph Mauriello (1944)
Year of Election or Appointment: 2008
Trustee
Mr. Mauriello also serves as Trustee of other Fidelity® funds. Prior to his retirement in January 2006, Mr. Mauriello served in numerous senior management positions including Deputy Chairman and Chief Operating Officer (2004-2005), and Vice Chairman of Financial Services (2002-2004) of KPMG LLP US (professional services, 1965-2005). Mr. Mauriello currently serves as a member of the Board of Directors of XL Group plc. (global insurance and re-insurance, 2006-present) and the Independent Directors Council (IDC) Governing Council (2015-present). Previously, Mr. Mauriello served as a Director of the Hamilton Funds of the Bank of New York (2006-2007) and of Arcadia Resources Inc. (health care services and products, 2007-2012).
Robert W. Selander (1950)
Year of Election or Appointment: 2011
Trustee
Mr. Selander also serves as Trustee of other Fidelity® funds. Mr. Selander serves as a Director of The Western Union Company (global money transfer, 2014-present). Previously, Mr. Selander served as a Member of the Advisory Board of other Fidelity® funds (2011), and Executive Vice Chairman (2010), Chief Executive Officer (2009-2010), and President and Chief Executive Officer (1997-2009) of Mastercard, Inc.
Cornelia M. Small (1944)
Year of Election or Appointment: 2005
Trustee
Ms. Small also serves as Trustee of other Fidelity® funds. Ms. Small is a member of the Board of Directors (2009-present) and Chair of the Investment Committee (2010-present) of the Teagle Foundation. Ms. Small also serves on the Investment Committee of the Berkshire Taconic Community Foundation (2008-present). Previously, Ms. Small served as Chairperson (2002-2008) and a member of the Investment Committee and Chairperson (2008-2012) and a member of the Board of Trustees of Smith College. In addition, Ms. Small served as Chief Investment Officer, Director of Global Equity Investments, and a member of the Board of Directors of Scudder, Stevens & Clark and Scudder Kemper Investments.
William S. Stavropoulos (1939)
Year of Election or Appointment: 2001
Trustee
Vice Chairman of the Independent Trustees
Mr. Stavropoulos also serves as Trustee of other Fidelity® funds. Mr. Stavropoulos serves as President and Founder of the Michigan Baseball Foundation, the Great Lakes Loons (2007-present). Mr. Stavropoulos is Chairman Emeritus of the Board of Directors of The Dow Chemical Company, where he previously served in numerous senior management positions, including President, CEO (1995-2000; 2002-2004), Chairman of the Executive Committee (2000-2006), and as a member of the Board of Directors (1990-2006). Currently, Mr. Stavropoulos is Chairman of the Board of Directors of Univar Inc. (global distributor of commodity and specialty chemicals), a Director of Teradata Corporation (data warehousing and technology solutions), and Maersk Inc. (industrial conglomerate), and a member of the Advisory Board for Metalmark Capital LLC (private equity investment, 2005-present). Mr. Stavropoulos is an operating advisor to Clayton, Dubilier & Rice, LLC (private equity investment). In addition, Mr. Stavropoulos is a member of the University of Notre Dame Advisory Council for the College of Science, a Trustee of the Rollin L. Gerstacker Foundation, and a Director of the Naples Philharmonic Center for the Arts. Previously, Mr. Stavropoulos served as a Director of Chemical Financial Corporation (bank holding company, 1993-2012) and Tyco International, Ltd. (multinational manufacturing and services, 2007-2012).
David M. Thomas (1949)
Year of Election or Appointment: 2008
Trustee
Mr. Thomas also serves as Trustee of other Fidelity® funds. Mr. Thomas serves as Non-Executive Chairman of the Board of Directors of Fortune Brands Home and Security (home and security products, 2011-present), as a member of the Board of Directors (2004-present) and Presiding Director (2013-present) of Interpublic Group of Companies, Inc. (marketing communication), and as a member of the Board of Trustees of the University of Florida (2013-present). Previously, Mr. Thomas served as Executive Chairman (2005-2006) and Chairman and Chief Executive Officer (2000-2005) of IMS Health, Inc. (pharmaceutical and healthcare information solutions), and a Director of Fortune Brands, Inc. (consumer products, 2000-2011).
+ The information includes the Trustee's principal occupation during the last five years and other information relating to the experience, attributes, and skills relevant to the Trustee's qualifications to serve as a Trustee, which led to the conclusion that the Trustee should serve as a Trustee for the fund.
Advisory Board Members and Officers:
Correspondence intended for an officer or Peter S. Lynch may be sent to Fidelity Investments, 245 Summer Street, Boston, Massachusetts 02210. Officers appear below in alphabetical order.
Name, Year of Birth; Principal Occupation
Peter S. Lynch (1944)
Year of Election or Appointment: 2003
Member of the Advisory Board
Mr. Lynch also serves as Member of the Advisory Board of other Fidelity® funds. Mr. Lynch is Vice Chairman and a Director of FMR (investment adviser firm) and FMR Co., Inc. (investment adviser firm). In addition, Mr. Lynch serves as a Trustee of Boston College and as the Chairman of the Inner-City Scholarship Fund. Previously, Mr. Lynch served on the Special Olympics International Board of Directors (1997-2006).
Elizabeth Paige Baumann (1968)
Year of Election or Appointment: 2012
Anti-Money Laundering (AML) Officer
Ms. Baumann also serves as AML Officer of other funds. She is Chief AML Officer of FMR LLC (diversified financial services company, 2012-present) and is an employee of Fidelity Investments. Previously, Ms. Baumann served as Vice President and Deputy Anti-Money Laundering Officer (2007-2012).
Marc R. Bryant (1966)
Year of Election or Appointment: 2015
Secretary and Chief Legal Officer (CLO)
Mr. Bryant also serves as Secretary and CLO of other funds. Mr. Bryant serves as CLO, Secretary, and Senior Vice President of Fidelity Management & Research Company (investment adviser firm, 2015-present) and FMR Co., Inc. (investment adviser firm, 2015-present); Secretary of Fidelity SelectCo, LLC (investment adviser firm, 2015-present) and Fidelity Investments Money Management, Inc. (investment adviser firm, 2015-present); and CLO of Fidelity Management & Research (Hong Kong) Limited (investment adviser firm, 2015-present). He is Senior Vice President and Deputy General Counsel of FMR LLC (diversified financial services company). Previously, Mr. Bryant served as Secretary and Chief Legal Officer of Fidelity Rutland Square Trust II (2010-2014) and Assistant Secretary of Fidelity's Fixed Income and Asset Allocation Funds (2013-2015). Prior to joining Fidelity Investments, Mr. Bryant served as a Senior Vice President and the Head of Global Retail Legal for AllianceBernstein L.P. (2006-2010), and as the General Counsel for ProFund Advisors LLC (2001-2006).
Timothy M. Cohen (1969)
Vice President of certain Equity Funds
Mr. Cohen also serves as Vice President of other funds. Mr. Cohen serves as Chief Compliance Officer of FMR Investment Management (U.K.) Limited (investment adviser firm, 2013-present) and is an employee of Fidelity Investments. Previously, Mr. Cohen served as a Director of FMR Investment Management (U.K.) Limited (2013-2015).
William C. Coffey (1969)
Year of Election or Appointment: 2009
Assistant Secretary
Mr. Coffey also serves as Assistant Secretary of other funds. He is Senior Vice President and Deputy General Counsel of FMR LLC (diversified financial services company, 2010-present), and is an employee of Fidelity Investments. Previously, Mr. Coffey served as Vice President and Associate General Counsel of FMR LLC (2005-2009).
Jonathan Davis (1968)
Year of Election or Appointment: 2010
Assistant Treasurer
Mr. Davis also serves as Assistant Treasurer of other funds, and is an employee of Fidelity Investments. Previously, Mr. Davis served as Vice President and Associate General Counsel of FMR LLC (diversified financial services company, 2003-2010).
Adrien E. Deberghes (1967)
Year of Election or Appointment: 2008
Deputy Treasurer
Mr. Deberghes also serves as an officer of other funds. He is an employee of Fidelity Investments (2008-present). Prior to joining Fidelity Investments, Mr. Deberghes was Senior Vice President of Mutual Fund Administration at State Street Corporation (2007-2008), Senior Director of Mutual Fund Administration at Investors Bank & Trust (2005-2007), and Director of Finance for Dunkin' Brands (2000-2005).
Stephanie J. Dorsey (1969)
Year of Election or Appointment: 2010
Assistant Treasurer
Ms. Dorsey also serves as an officer of other funds. She is an employee of Fidelity Investments (2008-present) and has served in other fund officer roles. Prior to joining Fidelity Investments, Ms. Dorsey served as Treasurer (2004-2008) of the JPMorgan Mutual Funds and Vice President (2004-2008) of JPMorgan Chase Bank.
Howard J. Galligan III (1966)
Year of Election or Appointment: 2014
Chief Financial Officer
Mr. Galligan also serves as Chief Financial Officer of other funds. Mr. Galligan serves as President of Fidelity Pricing and Cash Management Services (FPCMS) (2014-present) and as a Director of Strategic Advisers, Inc. (investment adviser firm, 2008-present). Previously, Mr. Galligan served as Chief Administrative Officer of Asset Management (2011-2014) and Chief Operating Officer and Senior Vice President of Investment Support for Strategic Advisers, Inc. (2003-2011).
Scott C. Goebel (1968)
Year of Election or Appointment: 2015
Vice President
Mr. Goebel serves as Vice President of other funds and is an employee of Fidelity Investments (2001-present). Previously, Mr. Goebel served as Secretary of Fidelity SelectCo, LLC (investment adviser firm, 2013-2015), Fidelity Investments Money Management, Inc. (FIMM) (investment adviser firm, 2010-2015), and Fidelity Research and Analysis Company (FRAC) (investment adviser firm, 2010-2015); General Counsel, Secretary, and Senior Vice President of Fidelity Management & Research Company (investment adviser firm, 2008-2015) and FMR Co., Inc. (investment adviser firm, 2008-2015); Assistant Secretary of Fidelity Management & Research (Japan) Limited (investment adviser firm, 2008-2015) and FMR Investment Management (U.K.) Limited (investment adviser firm, 2008-2015); Chief Legal Officer (CLO) of Fidelity Management & Research (Hong Kong) Limited (investment adviser firm, 2008-2015); Secretary and CLO of certain Fidelity® funds (2008-2015); Assistant Secretary of FIMM (2008-2010), FRAC (2008-2010), and certain funds (2007-2008); and as Vice President and Secretary of Fidelity Distributors Corporation (FDC) (2005-2007).
Brian B. Hogan (1964)
Year of Election or Appointment: 2009
Vice President
Mr. Hogan also serves as Trustee or Vice President of other funds. Mr. Hogan serves as a Director of Fidelity SelectCo, LLC (investment adviser firm, 2014-present) and President of the Equity Division of FMR (investment adviser firm, 2009-present). Previously, Mr. Hogan served as Senior Vice President, Equity Research of FMR (2006-2009) and as a portfolio manager.
Chris Maher (1972)
Year of Election or Appointment: 2013
Assistant Treasurer
Mr. Maher serves as Assistant Treasurer of other funds. Mr. Maher is Vice President of Valuation Oversight and is an employee of Fidelity Investments. Previously, Mr. Maher served as Vice President of Asset Management Compliance (2013), Vice President of the Program Management Group of FMR (investment adviser firm, 2010-2013), and Vice President of Valuation Oversight (2008-2010).
Kenneth B. Robins (1969)
Year of Election or Appointment: 2008
President and Treasurer
Mr. Robins also serves as an officer of other funds. Mr. Robins serves as Executive Vice President of Fidelity Investments Money Management, Inc. (FIMM) (investment adviser firm, 2013-present) and is an employee of Fidelity Investments (2004-present). Previously, Mr. Robins served in other fund officer roles.
Stacie M. Smith (1974)
Year of Election or Appointment: 2013
Deputy Treasurer
Ms. Smith also serves as an officer of other funds. She is an employee of Fidelity Investments (2009-present) and has served in other fund officer roles. Prior to joining Fidelity Investments, Ms. Smith served as Senior Audit Manager of Ernst & Young LLP (1996-2009).
Renee Stagnone (1975)
Year of Election or Appointment: 2013
Deputy Treasurer
Ms. Stagnone also serves as Deputy Treasurer of other funds. Ms. Stagnone is an employee of Fidelity Investments (1997-present).
Linda J. Wondrack (1964)
Year of Election or Appointment: 2014
Chief Compliance Officer
Ms. Wondrack also serves as Chief Compliance Officer of other funds. Ms. Wondrack is Executive Vice President and head of the Ethics Office and Asset Management Compliance for Fidelity Investments (2012-present). Ms. Wondrack also serves as Chief Compliance Officer of Fidelity SelectCo, LLC (investment adviser firm, 2014-present); Chief Compliance Officer of Impresa Management LLC (2013-present); and Chief Compliance Officer of FMR Co., Inc. (investment adviser firm), Fidelity Investments Money Management, Inc. (investment adviser firm), Fidelity Management & Research (Japan) Limited (investment adviser firm), FMR Investment Management (U.K.) Limited (investment adviser firm), Fidelity Management & Research (Hong Kong) (investment adviser firm), Fidelity Management & Research Company (investment adviser firm), FIAM LLC (investment adviser firm), and Strategic Advisers, Inc. (investment adviser firm), Ballyrock Investment Advisors LLC, and Northern Neck Investors LLC (2012-present). Previously, Ms. Wondrack served as Senior Vice President and Chief Compliance Officer for Columbia Management Investment Advisers, LLC (2005-2012); Chief Compliance Officer for certain funds within the Columbia Family of Funds (2007-2012); and Senior Vice President of Compliance Risk Management at Bank of America (2005-2010).
Joseph F. Zambello (1957)
Year of Election or Appointment: 2011
Deputy Treasurer
Mr. Zambello also serves as Deputy Treasurer of other funds. Mr. Zambello is an employee of Fidelity Investments (1991-present). Previously, Mr. Zambello served as Vice President of the Program Management Group of FMR (investment adviser firm, 2009-2011) and Vice President of the Transfer Agent Oversight Group (2005-2009).
Shareholder Expense Example
As a shareholder of the Fund, you incur two types of costs: (1) transaction costs, including sales charges (loads) on purchase payments or redemption proceeds, redemption fees and (2) ongoing costs, including management fees, distribution and/or service (12b-1) fees and other Fund expenses. This Example is intended to help you understand your ongoing costs (in dollars) of investing in the Fund and to compare these costs with the ongoing costs of investing in other mutual funds.
The Example is based on an investment of $1,000 invested at the beginning of the period and held for the entire period (May 1, 2015 to October 31, 2015).
Actual Expenses
The first line of the accompanying table for each class of the Fund provides information about actual account values and actual expenses. You may use the information in this line, together with the amount you invested, to estimate the expenses that you paid over the period. Simply divide your account value by $1,000.00 (for example, an $8,600 account value divided by $1,000.00 = 8.6), then multiply the result by the number in the first line for a class of the Fund under the heading entitled "Expenses Paid During Period" to estimate the expenses you paid on your account during this period. In addition, the Fund, as a shareholder in the underlying Fidelity Central Funds, will indirectly bear its pro-rata share of the fees and expenses incurred by the underlying Fidelity Central Funds. These fees and expenses are not included in the Fund's annualized expense ratio used to calculate the expense estimate in the table below.
Hypothetical Example for Comparison Purposes
The second line of the accompanying table for each class of the Fund provides information about hypothetical account values and hypothetical expenses based on a Class' actual expense ratio and an assumed rate of return of 5% per year before expenses, which is not the Class' actual return. The hypothetical account values and expenses may not be used to estimate the actual ending account balance or expenses you paid for the period. You may use this information to compare the ongoing costs of investing in the Fund and other funds. To do so, compare this 5% hypothetical example with the 5% hypothetical examples that appear in the shareholder reports of the other funds. In addition, the Fund, as a shareholder in the underlying Fidelity Central Funds, will indirectly bear its pro-rata share of the fees and expenses incurred by the underlying Fidelity Central Funds. These fees and expenses are not included in the Fund's annualized expense ratio used to calculate the expense estimate in the table below.
Please note that the expenses shown in the table are meant to highlight your ongoing costs only and do not reflect any transaction costs. Therefore, the second line of the table is useful in comparing ongoing costs only, and will not help you determine the relative total costs of owning different funds. In addition, if these transactional costs were included, your costs would have been higher.
| | Annualized Expense Ratio-A | Beginning
Account Value
May 1, 2015 | Ending
Account Value
October 31, 2015 | Expenses Paid
During Period-B
May 1, 2015
to October 31, 2015 |
| Class A | 1.21% | | | |
| Actual | | $1,000.00 | $963.60 | $5.99 |
| Hypothetical-C | | $1,000.00 | $1,019.11 | $6.16 |
| Class T | 1.47% | | | |
| Actual | | $1,000.00 | $962.30 | $7.27 |
| Hypothetical-C | | $1,000.00 | $1,017.80 | $7.48 |
| Class B | 2.03% | | | |
| Actual | | $1,000.00 | $959.70 | $10.03 |
| Hypothetical-C | | $1,000.00 | $1,014.97 | $10.31 |
| Class C | 1.96% | | | |
| Actual | | $1,000.00 | $960.00 | $9.68 |
| Hypothetical-C | | $1,000.00 | $1,015.32 | $9.96 |
| Class I | .94% | | | |
| Actual | | $1,000.00 | $965.10 | $4.66 |
| Hypothetical-C | | $1,000.00 | $1,020.47 | $4.79 |
| Class Z | .79% | | | |
| Actual | | $1,000.00 | $965.50 | $3.91 |
| Hypothetical-C | | $1,000.00 | $1,021.22 | $4.02 |
A Annualized expense ratio reflects expenses net of applicable fee waivers.
B Expenses are equal to each Class' annualized expense ratio, multiplied by the average account value over the period, multiplied by 184/365 (to reflect the one-half year period).
C 5% return per year before expenses
Distributions (Unaudited)
A percentage of the dividends distributed during the fiscal year for the following funds qualifies for the dividends–received deduction for corporate shareholders:
| | 12/05/2014 | 12/26/2014 |
| | | |
| Class Z | 5% | 13% |
Class Z designates 100% of the dividends distributed during the fiscal year as amounts which may be taken into account as a dividend for purposes of the maximum rate under section 1(h)(11) of the Internal Revenue Code.
The amounts per share which represent income derived from sources within, and taxes paid to, foreign countries or possessions of the United States are as follows:
| | Pay Date | Income | Taxes |
| Class Z | 12/08/2014 | $0.3217 | $0.0197 |
| | 12/29/2014 | $0.0220 | $0.0000 |
The fund will notify shareholders in January 2016 of amounts for use in preparing 2015 income tax returns.
Board Approval of Investment Advisory Contracts and Management Fees
Fidelity Advisor Diversified International Fund
Each year, the Board of Trustees, including the Independent Trustees (together, the Board), votes on the renewal of the management contract with Fidelity Management & Research Company (FMR) and the sub-advisory agreements (together, the Advisory Contracts) for the fund. The Board, assisted by the advice of fund counsel and Independent Trustees' counsel, requests and considers a broad range of information relevant to the renewal of the Advisory Contracts throughout the year.
The Board meets regularly and, at each of its meetings, covers an extensive agenda of topics and materials and considers factors that are relevant to its annual consideration of the renewal of the fund's Advisory Contracts, including the services and support provided to the fund and its shareholders. The Board has established various standing committees (Committees), each composed of and chaired by Independent Trustees with varying backgrounds, to which the Board has assigned specific subject matter responsibilities in order to enhance effective decision-making by the Board. The Board, acting directly and through its Committees, requests and receives information concerning the annual consideration of the renewal of the fund's Advisory Contracts. The Board also meets as needed to consider matters specifically related to the Board's annual consideration of the renewal of the Advisory Contracts. Members of the Board may also meet with trustees of other Fidelity funds through ad hoc joint committees to discuss certain matters relevant to all of the Fidelity funds.
At its July 2015 meeting, the Board unanimously determined to renew the fund's Advisory Contracts. In reaching its determination, the Board considered all factors it believed relevant, including (i) the nature, extent, and quality of the services to be provided to the fund and its shareholders (including the investment performance of the fund); (ii) the competitiveness of the fund's management fee and total expense ratio relative to peer funds; (iii) the total costs of the services to be provided by and the profits to be realized by Fidelity from its relationship with the fund; and (iv) the extent to which (if any) economies of scale exist and would be realized as the fund grows, and whether any economies of scale are appropriately shared with fund shareholders.
In considering whether to renew the Advisory Contracts for the fund, the Board reached a determination, with the assistance of fund counsel and Independent Trustees' counsel and through the exercise of its business judgment, that the renewal of the Advisory Contracts was in the best interests of the fund and its shareholders and that the compensation payable under the Advisory Contracts was fair and reasonable. The Board's decision to renew the Advisory Contracts was not based on any single factor, but rather was based on a comprehensive consideration of all the information provided to the Board at its meetings throughout the year. The Board, in reaching its determination to renew the Advisory Contracts, was aware that shareholders of the fund have a broad range of investment choices available to them, including a wide choice among funds offered by Fidelity's competitors, and that the fund's shareholders, who have the opportunity to review and weigh the disclosure provided by the fund in its prospectus and other public disclosures, have chosen to invest in this fund, which is part of the Fidelity family of funds.
Nature, Extent, and Quality of Services Provided. The Board considered Fidelity's staffing as it relates to the fund, including the backgrounds of investment personnel of Fidelity, and also considered the fund's investment objective, strategies, and related investment philosophy. The Independent Trustees also had discussions with senior management of Fidelity's investment operations and investment groups. The Board considered the structure of the portfolio manager compensation program and whether this structure provides appropriate incentives to act in the best interests of the fund. Additionally, the Board considered the portfolio managers' investments, if any, in the funds that they manage.
Resources Dedicated to Investment Management and Support Services. The Board and the Fund Oversight and Research Committees reviewed the general qualifications and capabilities of Fidelity's investment staff, including its size, education, experience, and resources, as well as Fidelity's approach to recruiting, training, managing, and compensating investment personnel. The Board noted that Fidelity has continued to increase the resources devoted to non-U.S. offices, including expansion of Fidelity's global investment organization. The Board also noted that Fidelity's analysts have extensive resources, tools and capabilities that allow them to conduct sophisticated quantitative and fundamental analysis, as well as credit analysis of issuers, counterparties and guarantors. Further, the Board considered that Fidelity's investment professionals have sufficient access to global information and data so as to provide competitive investment results over time, and that those professionals also have access to sophisticated tools that permit them to assess portfolio construction and risk and performance attribution characteristics continuously, as well as to transmit new information and research conclusions rapidly around the world. Additionally, in its deliberations, the Board considered Fidelity's trading, risk management, and compliance capabilities and resources, which are integral parts of the investment management process.
Shareholder and Administrative Services. The Board considered (i) the nature, extent, quality, and cost of advisory, administrative, and shareholder services performed by FMR, the sub-advisers (together with FMR, the Investment Advisers), and their affiliates under the Advisory Contracts and under separate agreements covering transfer agency, pricing and bookkeeping, and securities lending services for the fund; (ii) the nature and extent of the supervision of third party service providers, principally custodians and subcustodians; and (iii) the resources devoted to, and the record of compliance with, the fund's compliance policies and procedures. The Board also reviewed the allocation of fund brokerage, including allocations to brokers affiliated with the Investment Advisers, the use of brokerage commissions to pay fund expenses, and the use of "soft" commission dollars to pay for research services.
The Board noted that the growth of fund assets over time across the complex allows Fidelity to reinvest in the development of services designed to enhance the value or convenience of the Fidelity funds as investment vehicles. These services include 24-hour access to account information and market information through telephone representatives and over the Internet, investor education materials and asset allocation tools, and the expanded availability of Fidelity Investor Centers.
In 2014, the Board formed an ad hoc Committee on Transfer Agency Fees to review the variety of transfer agency fee structures throughout the industry and Fidelity's competitive positioning with respect to industry participants.
Investment in a Large Fund Family. The Board considered the benefits to shareholders of investing in a Fidelity fund, including the benefits of investing in a fund that is part of a large family of funds offering a variety of investment disciplines and providing a large variety of mutual fund investor services. The Board noted that Fidelity had taken, or had made recommendations that resulted in the Fidelity funds taking, a number of actions over the previous year that benefited particular funds, including (i) continuing to dedicate additional resources to investment research and to the support of the senior management team that oversees asset management; (ii) continuing efforts to enhance Fidelity's global research capabilities; (iii) launching new funds and making other enhancements to meet client needs; (iv) reducing management fees and total expenses for certain index funds and diversified international funds; (v) continuing to launch dedicated lower cost underlying funds to meet portfolio construction needs related to expanding underlying fund options for Fidelity funds of funds, specifically for the Freedom Fund product lines; (vi) rationalizing product lines and gaining increased efficiencies through fund mergers; (vii) launching active fixed-income exchange-traded funds; (viii) continuing to develop, acquire and implement systems and technology to improve services to the funds and information security and to increase efficiency; (ix) implementing investment enhancements to further strengthen Fidelity's target date product line to increase investors' probability of success in achieving their goals; (x) modifying the eligibility criteria for certain share classes to accommodate roll-over assets from employer-sponsored retirement plans; (xi) launching a new Class W of the Freedom Index Funds to attract and retain Fidelity record-kept retirement plan assets; and (xii) implementing changes to Fidelity's money market product line in response to recent money market regulatory reforms.
Investment Performance. The Board considered whether the fund has operated in accordance with its investment objective, as well as its record of compliance with its investment restrictions and its performance history. The Board noted that there was a portfolio management change for the fund in January 2014.
The Board took into account discussions with representatives of the Investment Advisers about fund investment performance that occur at Board meetings throughout the year. In this regard the Board noted that as part of regularly scheduled fund reviews and other reports to the Board on fund performance, the Board considers annualized return information for the fund, for different time periods, measured against a securities market index ("benchmark index") and a peer group of funds with similar objectives ("peer group"), if any. In its evaluation of fund investment performance, the Board gave particular attention to information indicating changes in performance of certain Fidelity funds for specific time periods and discussed with the Investment Advisers the reasons for any overperformance or underperformance.
In addition to reviewing absolute and relative fund performance, the Independent Trustees periodically consider the appropriateness of fund performance metrics in evaluating the results achieved. In general, the Independent Trustees believe that fund performance should be evaluated based on net performance (after fees and expenses) of both the highest performing and lowest performing fund share classes, where applicable, compared to appropriate benchmark indices, over appropriate time periods that may include full market cycles, and compared to peer groups, as applicable, over the same periods, taking into account relevant factors including the following: general market conditions; issuer-specific information; and fund cash flows and other factors.
The Independent Trustees recognize that shareholders evaluate performance on a net basis over their own holding periods, for which one-, three-, and five-year periods are often used as a proxy. For this reason, the performance information reviewed by the Board also included net cumulative calendar year total return information for the fund and an appropriate benchmark index and peer group for the most recent one-, three-, and five-year periods, as shown below. Returns are shown compared to the 25th percentile (top of box, 75% beaten) and 75th percentile (bottom of box, 25% beaten) of the peer universe. Returns of the benchmark index are "net MA,"
i.e., adjusted for tax withholding rates applicable to U.S.-based funds organized as Massachusetts business trusts.
Fidelity Advisor Diversified International Fund
Based on its review, the Board concluded that the nature, extent, and quality of services provided to the fund under the Advisory Contracts should benefit the shareholders of the fund.
Competitiveness of Management Fee and Total Expense Ratio. The Board considered the fund's management fee and total expense ratio compared to "mapped groups" of competitive funds and classes created for the purpose of facilitating the Trustees' competitive analysis of management fees and total expenses. Fidelity creates "mapped groups" by combining similar Lipper investment objective categories that have comparable investment mandates. Combining Lipper investment objective categories aids the Board's management fee and total expense ratio comparisons by broadening the competitive group used for comparison.
Management Fee. The Board considered two proprietary management fee comparisons for the 12-month periods shown in basis points (BP) in the chart below. The group of Lipper funds used by the Board for management fee comparisons is referred to below as the "Total Mapped Group." The Total Mapped Group comparison focuses on a fund's standing in terms of gross management fees before expense reimbursements or caps relative to the total universe of funds with comparable investment mandates, regardless of whether their management fee structures also are comparable. Funds with comparable investment mandates offer exposure to similar types of securities. Funds with comparable management fee structures have similar management fee contractual arrangements (
e.g., flat rate charged for advisory services, all-inclusive fee rate,
etc.). "TMG %" represents the percentage of funds in the Total Mapped Group that had management fees that were lower than the fund's. For example, a hypothetical TMG % of 20% would mean that 80% of the funds in the Total Mapped Group had higher, and 20% had lower, management fees than the fund. The fund's actual TMG %s and the number of funds in the Total Mapped Group are in the chart below. The "Asset-Size Peer Group" (ASPG) comparison focuses on a fund's standing relative to a subset of non-Fidelity funds within the Total Mapped Group that are similar in size and management fee structure without taking into account performance adjustments, if any. For example, if a fund is in the first quartile of the ASPG, the fund's management fee ranks in the least expensive or lowest 25% of funds in the ASPG. The ASPG represents at least 15% of the funds in the Total Mapped Group with comparable asset size and management fee structures, subject to a minimum of 50 funds (or all funds in the Total Mapped Group if fewer than 50). Additional information, such as the ASPG quartile in which the fund's management fee rate ranked, is also included in the chart and considered by the Board.
Fidelity Advisor Diversified International Fund
The Board noted that the fund's management fee rate ranked below the median of its Total Mapped Group and below the median of its ASPG for 2014.
Furthermore, the Board considered that it had approved a reduction (effective August 1, 2014) in the individual fund fee rate component of the management fee rate for the fund from 0.450% to 0.424%. The Board considered that the chart reflects the fund's lower management fee for 2014, as if the lower fee were in effect for the entire year.
The Board noted that, in 2014, the ad hoc Committee on Group Fee was formed by it and other Fidelity fund boards to conduct an in-depth review of the "group fee" component of the management fee of funds with such management fee structures. Committee focus included the mechanics of the group fee, the competitive landscape of group fee structures, Fidelity funds with no group fee component and investment products not included in group fee assets. The Board also considered that, for funds subject to the group fee, FMR agreed to voluntarily waive fees over a specified period of time in amounts designed to account for assets converted from certain funds to certain collective investment trusts.
The Board also noted that, in 2013, the ad hoc Committee on Management Fees was formed to conduct an in-depth review of the management fee rates of Fidelity's active equity mutual funds. The Committee focused on the following areas: (i) standard fee structures; (ii) research consumption and trading evolution; (iii) management fee competitiveness/profitability by category; and (iv) factors that drive institutional pricing.
Based on its review, the Board concluded that the fund's management fee is fair and reasonable in light of the services that the fund receives and the other factors considered.
Total Expense Ratio. In its review of each class's total expense ratio, the Board considered the fund's management fee as well as other fund or class expenses, as applicable, such as transfer agent fees, pricing and bookkeeping fees, fund-paid 12b-1 fees, and custodial, legal, and audit fees. The Board also noted that Fidelity may agree to waive fees and expenses from time to time, and the extent to which, if any, it has done so for the fund. As part of its review, the Board also considered the current and historical total expense ratios of each class of the fund compared to competitive fund median expenses. Each class of the fund is compared to those funds and classes in the Total Mapped Group (used by the Board for management fee comparisons) that have a similar sales load structure.
The Board noted that the total expense ratio of each of Class A, Class B, Class C, Class I, and Class Z ranked below its competitive median for 2014 and the total expense ratio of Class T ranked above its competitive median for 2014. The Board considered that, in general, various factors can affect total expense ratios. The Board noted that the total expense ratio of Class T was above the competitive median primarily because of higher 12b-1 fees on Class T as compared to most competitor funds. Class T has a higher 12b-1 fee, but a lower front-end sales charge, than traditionally priced front-end sales charge classes. The Board considered that Class T is primarily sold load-waived in the retirement plan market where its 0.50% 12b-1 fee is comparable to competing no-load, higher 12b-1 fee classes designed specifically for retirement plans. The Board noted that the fund offers multiple classes, each of which has a different sales load and 12b1 fee structure, and that the multiple structures are intended to offer a range of pricing options for the intermediary market. The Board also noted that the total expense ratios of the classes vary primarily by the level of their 12b1 fees, although differences in transfer agent fees may also cause expenses to vary from class to class.
Fees Charged to Other Fidelity Clients. The Board also considered Fidelity fee structures and other information with respect to clients of Fidelity, such as other funds advised or subadvised by Fidelity, pension plan clients, and other institutional clients with similar mandates. The Board noted the findings of the 2013 ad hoc joint committee (created with the board of other Fidelity funds), which reviewed and compared Fidelity's institutional investment advisory business with its business of providing services to the Fidelity funds, including the differences in services provided, fees charged, and costs incurred, as well as competition in their respective marketplaces.
Based on its review of total expense ratios and fees charged to other Fidelity clients, the Board concluded that, although Class T was above the median of the universe presented for comparison, the total expense ratio of each class of the fund was reasonable in light of the services that the fund and its shareholders receive and the other factors considered.
Costs of the Services and Profitability. The Board considered the revenues earned and the expenses incurred by Fidelity in conducting the business of developing, marketing, distributing, managing, administering and servicing the fund and servicing the fund's shareholders. The Board also considered the level of Fidelity's profits in respect of all the Fidelity funds.
On an annual basis, Fidelity presents to the Board information about the profitability of its relationship with the fund. Fidelity calculates profitability information for each fund, as well as aggregate profitability information for groups of Fidelity funds and all Fidelity funds, using a series of detailed revenue and cost allocation methodologies which originate with the books and records of Fidelity on which Fidelity's audited financial statements are based. The Audit Committee of the Board reviews any significant changes from the prior year's methodologies.
PricewaterhouseCoopers LLP (PwC), independent registered public accounting firm and auditor to Fidelity and certain Fidelity funds, has been engaged annually by the Board as part of the Board's assessment of Fidelity's profitability analysis. PwC's engagement includes the review and assessment of the methodologies used by Fidelity in determining the revenues and expenses attributable to Fidelity's mutual fund business, and completion of agreed-upon procedures in respect of the mathematical accuracy of fund profitability and its conformity to established allocation methodologies. After considering PwC's reports issued under the engagement and information provided by Fidelity, the Board concluded that while other allocation methods may also be reasonable, Fidelity's profitability methodologies are reasonable in all material respects.
The Board also reviewed Fidelity's non-fund businesses and fall-out benefits related to the mutual fund business as well as cases where Fidelity's affiliates may benefit from or be related to the fund's business.
The Board considered the costs of the services provided by and the profits realized by Fidelity in connection with the operation of the fund and was satisfied that the profitability was not excessive.
Economies of Scale. The Board considered whether there have been economies of scale in respect of the management of the Fidelity funds, whether the Fidelity funds (including the fund) have appropriately benefited from any such economies of scale, and whether there is potential for realization of any further economies of scale. The Board considered the extent to which the fund will benefit from economies of scale as assets grow through increased services to the fund, through waivers or reimbursements, or through fee or expense ratio reductions. The Board also noted that in 2013, it and the boards of other Fidelity funds created an ad hoc committee (the Economies of Scale Committee) to analyze whether Fidelity attains economies of scale in respect of the management and servicing of the Fidelity funds, whether the Fidelity funds have appropriately benefited from such economies of scale, and whether there is potential for realization of any further economies of scale.
The Board recognized that the fund's management contract incorporates a "group fee" structure, which provides for lower group fee rates as total group assets increase, and for higher group fee rates as total group assets decrease (with "group assets" defined to include fund assets under FMR's management plus sector fund assets previously under FMR's management and currently managed by Fidelity SelectCo, LLC). FMR calculates the group fee rates based on a tiered asset "breakpoint" schedule that varies based on asset class. The Board considered that the group fee is designed to deliver the benefits of economies of scale to fund shareholders when total Fidelity fund assets increase, even if assets of any particular fund are unchanged or have declined, because some portion of Fidelity's costs are attributable to services provided to all Fidelity funds, and all funds benefit if those costs can be allocated among more assets. The Board concluded that, given the group fee structure, fund shareholders will benefit from lower management fees as group assets increase at the fund complex level, regardless of whether Fidelity achieves any such economies of scale.
The Board concluded, taking into account the analysis of the Economies of Scale Committee, that economies of scale, if any, are being appropriately shared between fund shareholders and Fidelity.
Additional Information Requested by the Board. In order to develop fully the factual basis for consideration of the Fidelity funds' Advisory Contracts, the Board requested and received additional information on certain topics, including: (i) fund performance trends and Fidelity's long-term strategies for certain funds; (ii) the various share classes employed by Fidelity and the attributes of each class, together with similar information on the distribution and servicing payments made by Fidelity or the funds to third-party participants in the distribution channels; (iii) fund profitability, and fund performance in relation to fund profitability; (iv) the methodology with respect to evaluating competitive fund data and peer group classifications and fee comparisons; (v) annual fund profitability margins, with particular focus on certain funds with negative margins; (vi) the realization of fall-out benefits in certain Fidelity business units;
(vii) economies of scale and the way in which they are shared with fund shareholders;(viii) Fidelity's group fee structures, including the group fee schedule of breakpoints;(ix) the impact of cost containment measures on the funds; and (x) the transfer agent fee structure.
Based on its evaluation of all of the conclusions noted above, and after considering all factors it believed relevant, the Board concluded that the advisory fee structures are fair and reasonable, and that the fund's Advisory Contracts should be renewed.
ADIFZ-ANN-1215
1.9585027.102
Fidelity Advisor® Emerging Asia Fund Class A, Class T, Class B and Class C
Annual Report October 31, 2015 |
|
Contents
To view a fund's proxy voting guidelines and proxy voting record for the 12-month period ended June 30, visit http://www.fidelity.com/proxyvotingresults or visit the Securities and Exchange Commission's (SEC) web site at http://www.sec.gov.
You may also call 1-877-208-0098 to request a free copy of the proxy voting guidelines.
Standard & Poor's, S&P and S&P 500 are registered service marks of The McGraw-Hill Companies, Inc. and have been licensed for use by Fidelity Distributors Corporation.
Other third-party marks appearing herein are the property of their respective owners.
All other marks appearing herein are registered or unregistered trademarks or service marks of FMR LLC or an affiliated company. © 2015 FMR LLC. All rights reserved.
This report and the financial statements contained herein are submitted for the general information of the shareholders of the Fund. This report is not authorized for distribution to prospective investors in the Fund unless preceded or accompanied by an effective prospectus.
A fund files its complete schedule of portfolio holdings with the SEC for the first and third quarters of each fiscal year on Form N-Q. Forms N-Q are available on the SEC’s web site at http://www.sec.gov. A fund's Forms N-Q may be reviewed and copied at the SEC’s Public Reference Room in Washington, DC. Information regarding the operation of the SEC's Public Reference Room may be obtained by calling 1-800-SEC-0330.
For a complete list of a fund's portfolio holdings, view the most recent holdings listing, semiannual report, or annual report on Fidelity's web site at http://www.fidelity.com, http://www.advisor.fidelity.com, or http://www.401k.com, as applicable.
NOT FDIC INSURED •MAY LOSE VALUE •NO BANK GUARANTEE
Neither the Fund nor Fidelity Distributors Corporation is a bank.
Performance: The Bottom Line
Average annual total return reflects the change in the value of an investment, assuming reinvestment of distributions from dividend income and capital gains (the profits earned upon the sale of securities that have grown in value, if any) and assuming a constant rate of performance each year.
The hypothetical investment and the average annual total returns do not reflect the deduction of taxes that a shareholder would pay on fund distributions or the redemption of fund shares.
During periods of reimbursement by Fidelity, a fund’s total return will be greater than it would be had the reimbursement not occurred.
How a fund did yesterday is no guarantee of how it will do tomorrow.
Returns reflect the conversion of Class B shares to Class A shares after a maximum of seven years.
Average Annual Total Returns
| For the periods ended October 31, 2015 | Past 1 year | Past 5 years | Past 10 years |
| Class A (incl. 5.75% sales charge) | (10.25)% | 0.94% | 9.90% |
| Class T (incl. 3.50% sales charge) | (8.38)% | 1.11% | 9.85% |
| Class B (incl. contingent deferred sales charge) | (9.99)% | 1.01% | 9.96% |
| Class C (incl. contingent deferred sales charge) | (6.35)% | 1.39% | 9.74% |
Class B shares' contingent deferred sales charges included in the past one year, past five years and past ten years total return figures are 5%, 2% and 0%, respectively.
Class C shares' contingent deferred sales charges included in the past one year, past five years and past ten years total return figures are 1%, 0% and 0%, respectively.
$10,000 Over 10 Years
Let's say hypothetically that $10,000 was invested in Fidelity Advisor® Emerging Asia Fund - Class A on October 31, 2005, and the current 5.75% sales charge was paid.
The chart shows how the value of your investment would have changed, and also shows how the MSCI AC (All Country) Asia ex Japan Index performed over the same period.
| Period Ending Values |
| $25,710 | Fidelity Advisor® Emerging Asia Fund - Class A |
| $21,884 | MSCI AC (All Country) Asia ex Japan Index |
Management's Discussion of Fund Performance
Market Recap: International equities suffered a moderate setback for the 12 months ending October 31, 2015, held back by a collapse in commodities prices that hurt resources-related sectors and geographies. The MSCI ACWI (All Country World Index) ex USA Index returned -4.55% for the period, affected also by concerns about global economic growth. Commodity producers remained under pressure for much of the past year, largely related to economic deceleration in China (-1%), the world’s second-largest economy and a leading consumer of raw materials. This effect was exacerbated by U.S. dollar strength relative to global currencies, which weighed on commodities priced in dollars and acutely impacted equity returns within regions most exposed to resources prices. The emerging-markets group, for example, returned about -15% this period. Canada, a significant energy producer, returned roughly -17%. Net energy consumer Japan (+9%) was the best-performing region by far. Only about a quarter of the nearly 50 index countries managed a gain this period: Ireland (+19%) – the EU’s fastest-growing economy – and Israel (+17%) proved top performers; Greece (-56%) and Brazil (-46%), among the worst. As for sectors, energy (-25%) and materials (-16%) declined sharply, whereas the two consumer sectors each gained about 6%.
Comments from Portfolio Manager Colin Chickles: For the year, the fund’s share classes (excluding sales charges, if applicable) recorded single-digit declines but handily outpaced the -7.22% return of the benchmark MSCI AC (All Country) Asia ex Japan Index. The fund’s relative performance was particularly bolstered by stock selection in industrials, consumer staples and information technology. Geographically, our picks in China, South Korea and Hong Kong were beneficial. The three biggest relative contributors were overweighted positions in China Railway Group, CRRC and China Communications Construction, three China-based companies with a strong presence in rail transportation. Given the huge gains in these positions, I sold the first two and considerably reduced our share count in China Communications Construction. Conversely, stock picking in utilities, materials and financials were negatives. From a country perspective, stock selection in Singapore detracted. At the stock level, the biggest relative detractor by a wide margin was Hong Kong Exchanges and Clearing, the company operating the stock exchange in that nation. The fund didn’t own this benchmark stock as it raced higher in April, but I built a position in May and sold it for a loss in July. Not owning strong-performing benchmark component CK Hutchison Holdings for most of the period also worked against us.
The views expressed above reflect those of the portfolio manager(s) only through the end of the period as stated on the cover of this report and do not necessarily represent the views of Fidelity or any other person in the Fidelity organization. Any such views are subject to change at any time based upon market or other conditions and Fidelity disclaims any responsibility to update such views. These views may not be relied on as investment advice and, because investment decisions for a Fidelity fund are based on numerous factors, may not be relied on as an indication of trading intent on behalf of any Fidelity fund.
Investment Summary (Unaudited)
Top Ten Stocks as of October 31, 2015
| | % of fund's net assets | % of fund's net assets 6 months ago |
| Samsung Electronics Co. Ltd. | 6.3 | 5.6 |
| Taiwan Semiconductor Manufacturing Co. Ltd. | 4.1 | 3.8 |
| Tencent Holdings Ltd. | 3.7 | 3.1 |
| AIA Group Ltd. | 2.9 | 2.6 |
| China Construction Bank Corp. (H Shares) | 2.7 | 2.6 |
| Industrial & Commercial Bank of China Ltd. (H Shares) | 1.9 | 2.0 |
| Hon Hai Precision Industry Co. Ltd. (Foxconn) | 1.9 | 1.5 |
| Ping An Insurance (Group) Co. of China Ltd. (H Shares) | 1.7 | 1.6 |
| China Mobile Ltd. | 1.6 | 1.1 |
| Bank of China Ltd. (H Shares) | 1.6 | 1.8 |
| | 28.4 | |
Top Five Market Sectors as of October 31, 2015
| | % of fund's net assets | % of fund's net assets 6 months ago |
| Financials | 35.3 | 32.8 |
| Information Technology | 22.1 | 20.7 |
| Consumer Discretionary | 9.0 | 10.6 |
| Telecommunication Services | 7.1 | 6.8 |
| Utilities | 6.3 | 5.2 |
Asset Allocation (% of fund's net assets)
| As of October 31, 2015 |
| | Stocks | 98.4% |
| | Short-Term Investments and Net Other Assets (Liabilities) | 1.6% |

| As of April 30, 2015 |
| | Stocks | 99.3% |
| | Short-Term Investments and Net Other Assets (Liabilities) | 0.7% |

Investments October 31, 2015
Showing Percentage of Net Assets
| Common Stocks - 98.4% | | | |
| | | Shares | Value |
| Australia - 0.1% | | | |
| Beacon Lighting Group Ltd. | | 122,049 | $156,140 |
| Sino Gas & Energy Ltd. (a) | | 1,335,338 | 82,192 |
|
| TOTAL AUSTRALIA | | | 238,332 |
|
| Bermuda - 2.3% | | | |
| Brilliance China Automotive Holdings Ltd. | | 648,000 | 898,545 |
| BW LPG Ltd. | | 9,210 | 62,544 |
| Cheung Kong Infrastructure Holdings Ltd. | | 106,000 | 983,360 |
| China Foods Ltd. (a) | | 692,000 | 315,598 |
| CSI Properties Ltd. | | 8,640,000 | 288,817 |
| Digital China Holdings Ltd. (H Shares) | | 484,000 | 493,796 |
| Hongkong Land Holdings Ltd. | | 182,700 | 1,369,920 |
| Joy City Property Ltd. | | 760,000 | 118,906 |
| Kerry Logistics Network Ltd. | | 454,000 | 675,257 |
| PAX Global Technology Ltd. | | 223,000 | 291,608 |
| Skyworth Digital Holdings Ltd. | | 1,095,448 | 810,718 |
|
| TOTAL BERMUDA | | | 6,309,069 |
|
| Cayman Islands - 12.9% | | | |
| 58.com, Inc. ADR (a) | | 15,800 | 829,342 |
| Alibaba Group Holding Ltd. sponsored ADR (a) | | 24,100 | 2,020,303 |
| AMVIG Holdings Ltd. | | 348,000 | 159,456 |
| Belle International Holdings Ltd. | | 713,000 | 692,064 |
| Changyou.com Ltd. (A Shares) ADR (a) | | 12,900 | 257,484 |
| Cheung Kong Property Holdings Ltd. | | 402,000 | 2,812,851 |
| China Modern Dairy Holdings Ltd. | | 2,062,000 | 620,250 |
| China Resources Cement Holdings Ltd. | | 2,809,972 | 1,133,935 |
| China Sanjiang Fine Chemicals Ltd. (a)(b) | | 1,845,000 | 388,919 |
| China State Construction International Holdings Ltd. | | 498,000 | 755,665 |
| ChinaCache International Holdings Ltd. sponsored ADR (a) | | 12,300 | 92,373 |
| CK Hutchison Holdings Ltd. | | 280,500 | 3,841,028 |
| Cosmo Lady (China) Holdings Co. Ltd. | | 380,000 | 377,409 |
| Ctrip.com International Ltd. sponsored ADR (a)(b) | | 9,200 | 855,324 |
| ENN Energy Holdings Ltd. | | 210,000 | 1,203,015 |
| Greatview Aseptic Pack Co. Ltd. | | 661,000 | 310,312 |
| iKang Healthcare Group, Inc. sponsored ADR (a) | | 8,900 | 137,594 |
| International Housewares Retail Co. Ltd. | | 1,909,000 | 398,452 |
| Ju Teng International Holdings Ltd. | | 796,000 | 435,321 |
| Lee's Pharmaceutical Holdings Ltd. | | 93,000 | 120,076 |
| Longfor Properties Co. Ltd. | | 1,043,500 | 1,398,133 |
| MGM China Holdings Ltd. | | 296,400 | 432,324 |
| New Oriental Education & Technology Group, Inc. sponsored ADR | | 14,800 | 407,148 |
| Pico Far East Holdings Ltd. | | 650,000 | 172,544 |
| Samson Holding Ltd. | | 1,152,000 | 145,402 |
| Sino Biopharmaceutical Ltd. | | 1,200,000 | 1,491,240 |
| SITC International Holdings Co. Ltd. | | 809,000 | 415,251 |
| Sitoy Group Holdings Ltd. | | 303,000 | 144,852 |
| SOHO China Ltd. | | 745,000 | 383,127 |
| Stella International Holdings Ltd. | | 127,000 | 313,651 |
| TCC International Holdings Ltd. | | 586,000 | 115,357 |
| Tencent Holdings Ltd. | | 529,900 | 9,988,286 |
| Value Partners Group Ltd. | | 266,000 | 281,672 |
| Vipshop Holdings Ltd. ADR (a) | | 24,100 | 494,532 |
| WuXi PharmaTech Cayman, Inc. sponsored ADR (a) | | 13,300 | 594,510 |
| Youku Tudou, Inc. ADR (a)(b) | | 16,200 | 394,308 |
| Zhen Ding Technology Holding Ltd. | | 80,000 | 228,677 |
|
| TOTAL CAYMAN ISLANDS | | | 34,842,187 |
|
| China - 17.2% | | | |
| Agricultural Bank of China Ltd. (H Shares) | | 3,636,000 | 1,486,799 |
| Anhui Conch Cement Co. Ltd. (H Shares) | | 255,500 | 779,607 |
| Bank of China Ltd. (H Shares) | | 9,182,000 | 4,329,877 |
| Beijing Urban Consolidated & Development Group Ltd. (H Shares) | | 45,000 | 27,686 |
| China Communications Construction Co. Ltd. (H Shares) | | 1,853,000 | 2,557,488 |
| China Construction Bank Corp. (H Shares) | | 10,085,000 | 7,309,164 |
| China Life Insurance Co. Ltd. (H Shares) | | 380,000 | 1,370,312 |
| China National Building Materials Co. Ltd. (H Shares) | | 440,000 | 273,380 |
| China Pacific Insurance (Group) Co. Ltd. (H Shares) | | 721,400 | 2,873,622 |
| China Petroleum & Chemical Corp. (H Shares) | | 4,496,000 | 3,240,915 |
| China Telecom Corp. Ltd. (H Shares) | | 4,770,000 | 2,488,138 |
| China Vanke Co. Ltd. (H Shares) | | 834,400 | 1,947,193 |
| Chongqing Changan Automobile Co. Ltd. (B Shares) | | 245,000 | 450,910 |
| Huadian Fuxin Energy Corp. Ltd. (H Shares) | | 1,836,000 | 562,494 |
| Huadian Power International Corp. Ltd. (H Shares) | | 1,120,000 | 818,900 |
| Industrial & Commercial Bank of China Ltd. (H Shares) | | 8,285,000 | 5,255,223 |
| Jiangling Motors Corp. Ltd. (B Shares) | | 70,301 | 226,077 |
| Jiangsu Hengrui Medicine Co. Ltd. | | 70,521 | 585,111 |
| Kweichow Moutai Co. Ltd. | | 28,983 | 978,576 |
| PICC Property & Casualty Co. Ltd. (H Shares) | | 741,060 | 1,681,517 |
| Ping An Insurance (Group) Co. of China Ltd. (H Shares) | | 818,000 | 4,591,639 |
| SAIC Motor Corp. Ltd. | | 171,451 | 483,099 |
| Shenzhen Expressway Co. (H Shares) | | 398,000 | 306,696 |
| Tong Ren Tang Technologies Co. Ltd. (H Shares) | | 218,000 | 340,505 |
| Zhejiang Expressway Co. Ltd. (H Shares) | | 1,120,000 | 1,376,871 |
|
| TOTAL CHINA | | | 46,341,799 |
|
| Hong Kong - 12.7% | | | |
| AIA Group Ltd. | | 1,313,400 | 7,700,899 |
| China Everbright Ltd. | | 352,000 | 828,448 |
| China Mobile Ltd. | | 364,500 | 4,370,317 |
| China Power International Development Ltd. | | 1,585,000 | 996,064 |
| China Resources Power Holdings Co. Ltd. | | 522,000 | 1,180,851 |
| CNOOC Ltd. sponsored ADR (b) | | 34,300 | 3,899,224 |
| Dah Sing Banking Group Ltd. | | 184,000 | 349,150 |
| Fosun International Ltd. | | 604,372 | 1,100,555 |
| Henderson Land Development Co. Ltd. | | 189,100 | 1,207,735 |
| HKT Trust/HKT Ltd. unit | | 1,394,500 | 1,661,442 |
| Hysan Development Co. Ltd. | | 329,000 | 1,459,289 |
| Lenovo Group Ltd. | | 1,002,000 | 930,995 |
| Magnificent Estates Ltd. | | 1,896,000 | 53,710 |
| New World Development Co. Ltd. | | 1,597,000 | 1,703,371 |
| PCCW Ltd. | | 3,323,000 | 1,789,241 |
| Power Assets Holdings Ltd. | | 211,000 | 2,098,693 |
| Shun Ho Technology Holdings Ltd. (a) | | 31,284 | 10,680 |
| Techtronic Industries Co. Ltd. | | 332,000 | 1,213,685 |
| Wheelock and Co. Ltd. | | 397,000 | 1,850,462 |
|
| TOTAL HONG KONG | | | 34,404,811 |
|
| India - 9.6% | | | |
| Adani Ports & Special Economic Zone (a) | | 90,030 | 406,493 |
| Apollo Tyres Ltd. | | 425,355 | 1,114,127 |
| Axis Bank Ltd. (a) | | 71,552 | 518,214 |
| Bajaj Finserv Ltd. | | 42,535 | 1,278,996 |
| Bharat Petroleum Corp. Ltd. (a) | | 83,752 | 1,113,213 |
| Bharti Infratel Ltd. (a) | | 95,622 | 567,930 |
| Cox & Kings India Ltd. (a) | | 240,045 | 990,639 |
| Dr. Reddy's Laboratories Ltd. (a) | | 22,092 | 1,435,408 |
| Edelweiss Financial Services Ltd. | | 525,264 | 476,720 |
| GAIL India Ltd. | | 96,413 | 454,016 |
| HCL Technologies Ltd. | | 58,877 | 783,667 |
| Hexaware Technologies Ltd. | | 164,537 | 601,598 |
| IL&FS Transportation Networks Ltd. | | 133,958 | 191,495 |
| Indian Oil Corp. Ltd. (a) | | 225,537 | 1,374,655 |
| JK Tyre & Industries Ltd. (a) | | 490,642 | 762,446 |
| Just Dial Ltd. (a) | | 16,816 | 205,707 |
| LIC Housing Finance Ltd. (a) | | 74,849 | 546,510 |
| Mahindra & Mahindra Ltd. (a) | | 52,098 | 940,711 |
| Maruti Suzuki India Ltd. (a) | | 10,552 | 717,678 |
| McLeod Russel India Ltd. (a) | | 94,682 | 248,467 |
| NTPC Ltd. | | 642,649 | 1,303,897 |
| Oil & Natural Gas Corp. Ltd. | | 228,160 | 860,723 |
| Petronet LNG Ltd. | | 440,925 | 1,306,769 |
| Power Finance Corp. Ltd. | | 145,742 | 531,974 |
| Power Grid Corp. of India Ltd. | | 131,131 | 257,774 |
| Redington India Ltd. (a) | | 192,326 | 349,534 |
| Reliance Capital Ltd. (a) | | 20,100 | 129,251 |
| Reliance Infrastructure Ltd. (a) | | 80,455 | 486,594 |
| Shriram City Union Finance Ltd. | | 14,220 | 398,568 |
| Sun TV Ltd. | | 109,142 | 661,167 |
| Tata Motors Ltd. (a) | | 274,008 | 1,617,141 |
| The Jammu & Kashmir Bank Ltd. | | 305,332 | 387,510 |
| UPL Ltd. | | 101,887 | 713,741 |
| Vakrangee Ltd. | | 75,631 | 151,133 |
| VST Industries Ltd. (a) | | 11,571 | 283,175 |
| Yes Bank Ltd. (a) | | 156,293 | 1,806,327 |
|
| TOTAL INDIA | | | 25,973,968 |
|
| Indonesia - 1.4% | | | |
| PT ACE Hardware Indonesia Tbk | | 3,485,600 | 169,685 |
| PT Bank Rakyat Indonesia Tbk | | 3,164,800 | 2,422,199 |
| PT Gudang Garam Tbk | | 279,900 | 876,132 |
| PT Summarecon Agung Tbk | | 3,581,600 | 362,513 |
| Sunway Construction Group Bhd (a) | | 48,990 | 14,736 |
|
| TOTAL INDONESIA | | | 3,845,265 |
|
| Israel - 0.0% | | | |
| Sarine Technologies Ltd. | | 96,600 | 107,373 |
| Japan - 1.4% | | | |
| Fuji Media Holdings, Inc. | | 77,300 | 919,549 |
| KDDI Corp. | | 60,600 | 1,466,419 |
| NGK Insulators Ltd. | | 13,000 | 281,448 |
| SoftBank Corp. | | 19,100 | 1,070,133 |
|
| TOTAL JAPAN | | | 3,737,549 |
|
| Korea (South) - 17.2% | | | |
| AMOREPACIFIC Corp. | | 4,946 | 1,635,281 |
| Daewoo International Corp. | | 15,163 | 264,941 |
| DGB Financial Group Co. Ltd. | | 77,194 | 716,656 |
| Dongbu Insurance Co. Ltd. | | 40,887 | 2,449,417 |
| Duksan Hi-Metal Co. Ltd. (a) | | 19,218 | 142,733 |
| Global & Yuasa Battery Co. Ltd. | | 4,616 | 164,948 |
| Hana Financial Group, Inc. | | 23,807 | 579,657 |
| Hyosung Corp. | | 8,903 | 912,312 |
| Hyundai Mobis | | 6,062 | 1,274,232 |
| Hyundai Motor Co. | | 28,497 | 3,893,544 |
| Hyundai Steel Co. | | 29,547 | 1,348,256 |
| KB Financial Group, Inc. | | 68,159 | 2,156,118 |
| Korea Aerospace Industries Ltd. | | 6,595 | 519,851 |
| Korea Electric Power Corp. | | 42,247 | 1,899,288 |
| Korea Petro Chemical Industries Co. Ltd. | | 3,957 | 613,424 |
| Korea Zinc Co. Ltd. | | 4,286 | 1,779,311 |
| LG Household & Health Care Ltd. | | 2,968 | 2,461,701 |
| LOTTE Hi-Mart Co. Ltd. | | 5,313 | 270,822 |
| Samsung Card Co. Ltd. | | 17,806 | 601,970 |
| Samsung Electronics Co. Ltd. | | 14,146 | 16,998,446 |
| Shinhan Financial Group Co. Ltd. | | 83,006 | 3,163,174 |
| SK Energy Co. Ltd. (a) | | 16,816 | 1,745,269 |
| SK Telecom Co. Ltd. | | 3,957 | 836,681 |
|
| TOTAL KOREA (SOUTH) | | | 46,428,032 |
|
| Malaysia - 2.2% | | | |
| AEON Credit Service Bhd | | 45,500 | 135,583 |
| AMMB Holdings Bhd | | 212,000 | 234,990 |
| Cahya Mata Sarawak Bhd | | 253,900 | 313,038 |
| Eversendai Corp. Bhd | | 266,400 | 48,244 |
| Glomac Bhd | | 439,300 | 92,496 |
| Media Prima Bhd | | 965,200 | 312,545 |
| MISC Bhd | | 251,000 | 526,653 |
| Sunway Bhd | | 489,900 | 353,088 |
| Tenaga Nasional Bhd | | 725,800 | 2,133,333 |
| YTL Corp. Bhd | | 2,891,300 | 1,015,355 |
| YTL Power International Bhd | | 2,195,800 | 771,146 |
|
| TOTAL MALAYSIA | | | 5,936,471 |
|
| Philippines - 1.1% | | | |
| ABS CBN Broadcasting Corp. (depositary receipt) | | 97,800 | 140,978 |
| Globe Telecom, Inc. | | 15,825 | 769,252 |
| LT Group, Inc. | | 518,300 | 138,312 |
| Metropolitan Bank & Trust Co. | | 669,360 | 1,215,404 |
| Robinsons Retail Holdings, Inc. | | 89,570 | 147,062 |
| Security Bank Corp. | | 226,866 | 687,473 |
|
| TOTAL PHILIPPINES | | | 3,098,481 |
|
| Singapore - 4.3% | | | |
| Boustead Projects Pte Ltd. (a) | | 33,854 | 20,410 |
| Boustead Singapore Ltd. | | 178,048 | 121,716 |
| CapitaLand Ltd. | | 504,500 | 1,112,883 |
| Centurion Corp. Ltd. | | 254,500 | 76,045 |
| CWT Ltd. | | 115,000 | 164,164 |
| Frasers Centrepoint Ltd. | | 120,000 | 139,538 |
| Hyflux Ltd. | | 451,000 | 218,128 |
| Interplex Holdings Ltd. | | 193,000 | 97,189 |
| Mapletree Industrial (REIT) | | 1,445,493 | 1,572,390 |
| Sheng Siong Group Ltd. | | 573,000 | 346,847 |
| Singapore Telecommunications Ltd. | | 881,000 | 2,503,144 |
| Sound Global Ltd. (a) | | 278,000 | 246,039 |
| United Overseas Bank Ltd. | | 232,500 | 3,376,083 |
| UOL Group Ltd. | | 165,000 | 770,015 |
| Wing Tai Holdings Ltd. | | 587,000 | 730,477 |
|
| TOTAL SINGAPORE | | | 11,495,068 |
|
| Taiwan - 13.2% | | | |
| ASUSTeK Computer, Inc. | | 137,000 | 1,227,999 |
| Cathay Financial Holding Co. Ltd. | | 1,921,000 | 2,745,554 |
| China Life Insurance Co. Ltd. | | 847,000 | 701,811 |
| Chinatrust Financial Holding Co. Ltd. | | 3,332,723 | 1,832,407 |
| Delta Electronics, Inc. | | 119,000 | 608,471 |
| E.SUN Financial Holdings Co. Ltd. | | 1,759,748 | 1,059,697 |
| Fubon Financial Holding Co. Ltd. | | 1,815,000 | 2,946,265 |
| Hon Hai Precision Industry Co. Ltd. (Foxconn) | | 1,909,850 | 5,094,502 |
| Novatek Microelectronics Corp. | | 195,000 | 666,718 |
| PChome Online, Inc. | | 23,814 | 267,738 |
| Pegatron Corp. | | 925,000 | 2,273,679 |
| Pou Chen Corp. | | 704,000 | 997,505 |
| Realtek Semiconductor Corp. | | 155,000 | 325,135 |
| Richtek Technology Corp. | | 57,000 | 332,712 |
| Sinopac Holdings Co. | | 5,778,145 | 1,913,293 |
| Taiwan Semiconductor Manufacturing Co. Ltd. | | 2,634,393 | 11,099,947 |
| Wistron NeWeb Corp. | | 239,700 | 633,490 |
| Yuanta Financial Holding Co. Ltd. | | 2,172,321 | 856,483 |
|
| TOTAL TAIWAN | | | 35,583,406 |
|
| Thailand - 2.0% | | | |
| Asian Property Development PCL (For. Reg.) | | 5,454,100 | 918,236 |
| Bangkok Expressway PCL (For.Reg.) | | 403,300 | 407,822 |
| CH. Karnchang PCL | | 461,600 | 366,921 |
| Intouch Holdings PCL: | | | |
| (For. Reg.) | | 690,901 | 1,456,044 |
| NVDR | | 147,400 | 310,639 |
| Preuksa Real Estate PCL (For. Reg.) | | 880,100 | 692,571 |
| Thai Beverage PCL | | 2,304,800 | 1,108,306 |
|
| TOTAL THAILAND | | | 5,260,539 |
|
| United States of America - 0.8% | | | |
| China Biologic Products, Inc. (a) | | 1,300 | 148,122 |
| Cognizant Technology Solutions Corp. Class A (a) | | 28,900 | 1,968,379 |
|
| TOTAL UNITED STATES OF AMERICA | | | 2,116,501 |
|
| TOTAL COMMON STOCKS | | | |
| (Cost $246,284,018) | | | 265,718,851 |
| | | Principal Amount(c) | Value |
|
| Nonconvertible Bonds - 0.0% | | | |
| India - 0.0% | | | |
NTPC Ltd. 8.49% 3/25/25
(Cost $123,312) | INR | 615,670 | 119,946 |
| | | Shares | Value |
|
| Money Market Funds - 1.8% | | | |
| Fidelity Cash Central Fund, 0.18% (d) | | 1,997,052 | 1,997,052 |
| Fidelity Securities Lending Cash Central Fund, 0.19% (d)(e) | | 2,769,250 | 2,769,250 |
| TOTAL MONEY MARKET FUNDS | | | |
| (Cost $4,766,302) | | | 4,766,302 |
| TOTAL INVESTMENT PORTFOLIO - 100.2% | | | |
| (Cost $251,173,632) | | | 270,605,099 |
| NET OTHER ASSETS (LIABILITIES) - (0.2)% | | | (551,390) |
| NET ASSETS - 100% | | | $270,053,709 |
Currency Abbreviations
INR – Indian rupee
Categorizations in the Schedule of Investments are based on country or territory of incorporation.
Legend
(a) Non-income producing
(b) Security or a portion of the security is on loan at period end.
(c) Amount is stated in United States dollars unless otherwise noted.
(d) Affiliated fund that is generally available only to investment companies and other accounts managed by Fidelity Investments. The rate quoted is the annualized seven-day yield of the fund at period end. A complete unaudited listing of the fund's holdings as of its most recent quarter end is available upon request. In addition, each Fidelity Central Fund's financial statements , which are not covered by the Fund's Report of Independent Registered Public Accounting Firm, are available on the SEC's website or upon request.
(e) Investment made with cash collateral received from securities on loan.
Affiliated Central Funds
Information regarding fiscal year to date income earned by the Fund from investments in Fidelity Central Funds is as follows:
| Fund | Income earned |
| Fidelity Cash Central Fund | $6,063 |
| Fidelity Securities Lending Cash Central Fund | 9,049 |
| Total | $15,112 |
Investment Valuation
The following is a summary of the inputs used, as of October 31, 2015, involving the Fund's assets and liabilities carried at fair value. The inputs or methodology used for valuing securities may not be an indication of the risk associated with investing in those securities. For more information on valuation inputs, and their aggregation into the levels used below, please refer to the Investment Valuation section in the accompanying Notes to Financial Statements.
| | Valuation Inputs at Reporting Date: |
| Description | Total | Level 1 | Level 2 | Level 3 |
| Investments in Securities: | | | | |
| Equities: | | | | |
| Consumer Discretionary | $23,761,028 | $8,358,055 | $14,919,874 | $483,099 |
| Consumer Staples | 9,021,395 | 4,096,982 | 4,924,413 | -- |
| Energy | 13,807,220 | 5,707,037 | 8,100,183 | -- |
| Financials | 95,210,637 | 16,403,210 | 78,807,427 | -- |
| Health Care | 4,852,566 | 880,226 | 3,972,340 | -- |
| Industrials | 14,925,587 | 784,792 | 14,140,795 | -- |
| Information Technology | 59,694,081 | 34,362,489 | 25,331,592 | -- |
| Materials | 8,528,010 | 4,653,303 | 3,874,707 | -- |
| Telecommunication Services | 19,289,380 | -- | 19,289,380 | -- |
| Utilities | 16,628,947 | -- | 16,382,908 | 246,039 |
| Corporate Bonds | 119,946 | -- | 119,946 | -- |
| Money Market Funds | 4,766,302 | 4,766,302 | -- | -- |
| Total Investments in Securities: | $270,605,099 | $80,012,396 | $189,863,565 | $729,138 |
The following is a summary of transfers between Level 1 and Level 2 for the period ended October 31, 2015. Transfers are assumed to have occurred at the beginning of the period, and are primarily attributable to the valuation techniques used for foreign equity securities, as discussed in the accompanying Notes to Financial Statements:
| Transfers | Total |
| Level 1 to Level 2 | $3,823,089 |
| Level 2 to Level 1 | $13,189,137 |
The following is a reconciliation of Investments in Securities for which Level 3 inputs were used in determining value:
| Industrials: | |
| Beginning Balance | $2,916,359 |
| Net Realized Gain (Loss) on Investment Securities | 2,027,462 |
| Net Unrealized Gain (Loss) on Investment Securities | (691,278) |
| Cost of Purchases | 1,615,871 |
| Proceeds of Sales | (5,868,414) |
| Amortization/Accretion | -- |
| Transfers into Level 3 | -- |
| Transfers out of Level 3 | -- |
| Ending Balance | $-- |
| The change in unrealized gain (loss) for the period attributable to Level 3 securities held at October 31, 2015 | -- |
| Other Investments in Securities: | |
| Beginning Balance | $-- |
| Net Realized Gain (Loss) on Investment Securities | (192,200) |
| Net Unrealized Gain (Loss) on Investment Securities | (188,763) |
| Cost of Purchases | 1,731,541 |
| Proceeds of Sales | (621,440) |
| Amortization/Accretion | -- |
| Transfers into Level 3 | -- |
| Transfers out of Level 3 | -- |
| Ending Balance | $729,138 |
| The change in unrealized gain (loss) for the period attributable to Level 3 securities held at October 31, 2015 | $(188,763) |
The information used in the above reconciliations represents fiscal year to date activity for any Investments in Securities identified as using Level 3 inputs at either the beginning or the end of the current fiscal period. Transfers in or out of Level 3 represent the beginning value of any Security or Instrument where a change in the pricing level occurred from the beginning to the end of the period. The cost of purchases and the proceeds of sales may include securities received or delivered through corporate actions or exchanges. Realized and unrealized gains (losses) disclosed in the reconciliations are included in Net Gain (Loss) on the Fund's Statement of Operations.
See accompanying notes which are an integral part of the financial statements.
Financial Statements
Statement of Assets and Liabilities
| | | October 31, 2015 |
| Assets | | |
Investment in securities, at value (including securities loaned of $2,711,876) — See accompanying schedule:
Unaffiliated issuers (cost $246,407,330) | $265,838,797 | |
| Fidelity Central Funds (cost $4,766,302) | 4,766,302 | |
| Total Investments (cost $251,173,632) | | $270,605,099 |
| Receivable for investments sold | | 10,863,972 |
| Receivable for fund shares sold | | 77,495 |
| Dividends receivable | | 87,527 |
| Interest receivable | | 483 |
| Distributions receivable from Fidelity Central Funds | | 644 |
| Prepaid expenses | | 851 |
| Other receivables | | 136,283 |
| Total assets | | 281,772,354 |
| Liabilities | | |
| Payable for investments purchased | $8,141,643 | |
| Payable for fund shares redeemed | 414,379 | |
| Accrued management fee | 157,909 | |
| Distribution and service plan fees payable | 88,170 | |
| Other affiliated payables | 66,087 | |
| Other payables and accrued expenses | 81,207 | |
| Collateral on securities loaned, at value | 2,769,250 | |
| Total liabilities | | 11,718,645 |
| Net Assets | | $270,053,709 |
| Net Assets consist of: | | |
| Paid in capital | | $247,866,307 |
| Undistributed net investment income | | 1,204,748 |
| Accumulated undistributed net realized gain (loss) on investments and foreign currency transactions | | 1,606,906 |
| Net unrealized appreciation (depreciation) on investments and assets and liabilities in foreign currencies | | 19,375,748 |
| Net Assets | | $270,053,709 |
| Calculation of Maximum Offering Price | | |
| Class A: | | |
| Net Asset Value and redemption price per share ($125,527,985 ÷ 4,365,934 shares) | | $28.75 |
| Maximum offering price per share (100/94.25 of $28.75) | | $30.50 |
| Class T: | | |
| Net Asset Value and redemption price per share ($37,720,112 ÷ 1,350,455 shares) | | $27.93 |
| Maximum offering price per share (100/96.50 of $27.93) | | $28.94 |
| Class B: | | |
| Net Asset Value and offering price per share ($3,585,124 ÷ 134,979 shares)(a) | | $26.56 |
| Class C: | | |
| Net Asset Value and offering price per share ($51,651,210 ÷ 1,973,722 shares)(a) | | $26.17 |
| Class I: | | |
| Net Asset Value, offering price and redemption price per share ($51,569,278 ÷ 1,740,560 shares) | | $29.63 |
(a) Redemption price per share is equal to net asset value less any applicable contingent deferred sales charge.
See accompanying notes which are an integral part of the financial statements.
Statement of Operations
| | | Year ended October 31, 2015 |
| Investment Income | | |
| Dividends | | $8,058,317 |
| Interest | | 490 |
| Income from Fidelity Central Funds | | 15,112 |
| Income before foreign taxes withheld | | 8,073,919 |
| Less foreign taxes withheld | | (809,681) |
| Total income | | 7,264,238 |
| Expenses | | |
| Management fee | $2,146,223 | |
| Transfer agent fees | 738,899 | |
| Distribution and service plan fees | 1,211,700 | |
| Accounting and security lending fees | 159,412 | |
| Custodian fees and expenses | 212,654 | |
| Independent trustees' compensation | 1,313 | |
| Registration fees | 85,258 | |
| Audit | 88,862 | |
| Legal | 789 | |
| Interest | 527 | |
| Miscellaneous | 2,019 | |
| Total expenses before reductions | 4,647,656 | |
| Expense reductions | (22,649) | 4,625,007 |
| Net investment income (loss) | | 2,639,231 |
| Realized and Unrealized Gain (Loss) | | |
| Net realized gain (loss) on: | | |
| Investment securities: | | |
| Unaffiliated issuers (net of foreign taxes of $288,936) | 3,743,148 | |
| Foreign currency transactions | (47,197) | |
| Total net realized gain (loss) | | 3,695,951 |
Change in net unrealized appreciation (depreciation) on:
Investment securities (net of decrease in deferred foreign taxes of $934,924) | (25,576,727) | |
| Assets and liabilities in foreign currencies | (5,142) | |
| Total change in net unrealized appreciation (depreciation) | | (25,581,869) |
| Net gain (loss) | | (21,885,918) |
| Net increase (decrease) in net assets resulting from operations | | $(19,246,687) |
See accompanying notes which are an integral part of the financial statements.
Statement of Changes in Net Assets
| | Year ended October 31, 2015 | Year ended October 31, 2014 |
| Increase (Decrease) in Net Assets | | |
| Operations | | |
| Net investment income (loss) | $2,639,231 | $2,377,197 |
| Net realized gain (loss) | 3,695,951 | 16,845,214 |
| Change in net unrealized appreciation (depreciation) | (25,581,869) | 735,749 |
| Net increase (decrease) in net assets resulting from operations | (19,246,687) | 19,958,160 |
| Distributions to shareholders from net investment income | (1,398,621) | (2,011,362) |
| Distributions to shareholders from net realized gain | (15,842,060) | (13,483,906) |
| Total distributions | (17,240,681) | (15,495,268) |
| Share transactions - net increase (decrease) | 4,069,053 | (13,223,545) |
| Redemption fees | 145,305 | 35,731 |
| Total increase (decrease) in net assets | (32,273,010) | (8,724,922) |
| Net Assets | | |
| Beginning of period | 302,326,719 | 311,051,641 |
| End of period (including undistributed net investment income of $1,204,748 and undistributed net investment income of $1,321,181, respectively) | $270,053,709 | $302,326,719 |
See accompanying notes which are an integral part of the financial statements.
Financial Highlights — Fidelity Advisor Emerging Asia Fund Class A
| | | | | | |
| Years ended October 31, | 2015 | 2014 | 2013 | 2012 | 2011 |
| Selected Per–Share Data | | | | | |
| Net asset value, beginning of period | $32.05 | $31.34 | $28.87 | $28.70 | $32.97 |
| Income from Investment Operations | | | | | |
| Net investment income (loss)A | .31 | .30 | .30 | .34 | .35 |
| Net realized and unrealized gain (loss) | (1.76) | 2.00B | 2.59 | 1.37 | (2.62) |
| Total from investment operations | (1.45) | 2.30 | 2.89 | 1.71 | (2.27) |
| Distributions from net investment income | (.18) | (.26) | (.33) | (.31) | (.20) |
| Distributions from net realized gain | (1.67) | (1.33) | (.09) | (1.23) | (1.81) |
| Total distributions | (1.86)C | (1.59) | (.42) | (1.54) | (2.01) |
| Redemption fees added to paid in capitalA | .01 | –D | –D | –D | .01 |
| Net asset value, end of period | $28.75 | $32.05 | $31.34 | $28.87 | $28.70 |
| Total ReturnE,F | (4.78)% | 7.70%B | 10.10% | 6.36% | (7.44)% |
| Ratios to Average Net AssetsG,H | | | | | |
| Expenses before reductions | 1.37% | 1.42% | 1.41% | 1.42% | 1.39% |
| Expenses net of fee waivers, if any | 1.37% | 1.42% | 1.41% | 1.42% | 1.39% |
| Expenses net of all reductions | 1.36% | 1.42% | 1.38% | 1.38% | 1.35% |
| Net investment income (loss) | 1.00% | .96% | .99% | 1.24% | 1.12% |
| Supplemental Data | | | | | |
| Net assets, end of period (000 omitted) | $125,528 | $145,184 | $155,104 | $160,427 | $179,346 |
| Portfolio turnover rateI | 70% | 91% | 95% | 95% | 119% |
A Calculated based on average shares outstanding during the period.
B In 2014, a change to the Indian tax rules invalidated a prior ruling that had exempted the Fund from taxes on realized gains. As a result, the Fund recorded a tax liability which resulted in a decrease to realized and unrealized gain (loss) per share of $.18 at period end. Excluding this amount, the total return would have been 8.29%.
C Total distributions of $1.86 per share is comprised of distributions from net investment income of $.183 and distributions from net realized gain of $1.674 per share.
D Amount represents less than $.005 per share.
E Total returns would have been lower if certain expenses had not been reduced during the applicable periods shown.
F Total returns do not include the effect of the sales charges.
G Fees and expenses of any underlying Fidelity Central Funds are not included in the Fund's expense ratio. The Fund indirectly bears its proportionate share of the expenses of any underlying Fidelity Central Funds.
H Expense ratios reflect operating expenses of the class. Expenses before reductions do not reflect amounts reimbursed by the investment adviser or reductions from brokerage service arrangements or reductions from other expense offset arrangements and do not represent the amount paid by the class during periods when reimbursements or reductions occur. Expenses net of fee waivers reflect expenses after reimbursement by the investment adviser but prior to reductions from brokerage service arrangements or other expense offset arrangements. Expenses net of all reductions represent the net expenses paid by the class.
I Amount does not include the portfolio activity of any underlying Fidelity Central Funds.
See accompanying notes which are an integral part of the financial statements.
Financial Highlights — Fidelity Advisor Emerging Asia Fund Class T
| Years ended October 31, | 2015 | 2014 | 2013 | 2012 | 2011 |
| Selected Per–Share Data | | | | | |
| Net asset value, beginning of period | $31.17 | $30.53 | $28.13 | $27.98 | $32.20 |
| Income from Investment Operations | | | | | |
| Net investment income (loss)A | .21 | .20 | .20 | .25 | .25 |
| Net realized and unrealized gain (loss) | (1.71) | 1.94B | 2.54 | 1.33 | (2.55) |
| Total from investment operations | (1.50) | 2.14 | 2.74 | 1.58 | (2.30) |
| Distributions from net investment income | (.08) | (.17) | (.25) | (.20) | (.12) |
| Distributions from net realized gain | (1.67) | (1.33) | (.09) | (1.23) | (1.81) |
| Total distributions | (1.75) | (1.50) | (.34) | (1.43) | (1.93) |
| Redemption fees added to paid in capitalA | .01 | –C | –C | –C | .01 |
| Net asset value, end of period | $27.93 | $31.17 | $30.53 | $28.13 | $27.98 |
| Total ReturnD,E | (5.05)% | 7.34%B | 9.80% | 6.04% | (7.70)% |
| Ratios to Average Net AssetsF,G | | | | | |
| Expenses before reductions | 1.68% | 1.73% | 1.70% | 1.70% | 1.70% |
| Expenses net of fee waivers, if any | 1.68% | 1.73% | 1.70% | 1.70% | 1.69% |
| Expenses net of all reductions | 1.67% | 1.73% | 1.67% | 1.67% | 1.65% |
| Net investment income (loss) | .69% | .66% | .70% | .95% | .82% |
| Supplemental Data | | | | | |
| Net assets, end of period (000 omitted) | $37,720 | $44,563 | $47,620 | $49,359 | $55,452 |
| Portfolio turnover rateH | 70% | 91% | 95% | 95% | 119% |
A Calculated based on average shares outstanding during the period.
B In 2014, a change to the Indian tax rules invalidated a prior ruling that had exempted the Fund from taxes on realized gains. As a result, the Fund recorded a tax liability which resulted in a decrease to realized and unrealized gain (loss) per share of $.18 at period end. Excluding this amount, the total return would have been 7.93%.
C Amount represents less than $.005 per share.
D Total returns would have been lower if certain expenses had not been reduced during the applicable periods shown.
E Total returns do not include the effect of the sales charges.
F Fees and expenses of any underlying Fidelity Central Funds are not included in the Fund's expense ratio. The Fund indirectly bears its proportionate share of the expenses of any underlying Fidelity Central Funds.
G Expense ratios reflect operating expenses of the class. Expenses before reductions do not reflect amounts reimbursed by the investment adviser or reductions from brokerage service arrangements or reductions from other expense offset arrangements and do not represent the amount paid by the class during periods when reimbursements or reductions occur. Expenses net of fee waivers reflect expenses after reimbursement by the investment adviser but prior to reductions from brokerage service arrangements or other expense offset arrangements. Expenses net of all reductions represent the net expenses paid by the class.
H Amount does not include the portfolio activity of any underlying Fidelity Central Funds.
See accompanying notes which are an integral part of the financial statements.
Financial Highlights — Fidelity Advisor Emerging Asia Fund Class B
| | | | | | |
| Years ended October 31, | 2015 | 2014 | 2013 | 2012 | 2011 |
| Selected Per–Share Data | | | | | |
| Net asset value, beginning of period | $29.63 | $29.06 | $26.77 | $26.62 | $30.72 |
| Income from Investment Operations | | | | | |
| Net investment income (loss)A | .05 | .05 | .06 | .12 | .10 |
| Net realized and unrealized gain (loss) | (1.61) | 1.85B | 2.41 | 1.26 | (2.44) |
| Total from investment operations | (1.56) | 1.90 | 2.47 | 1.38 | (2.34) |
| Distributions from net investment income | – | – | (.09) | – | – |
| Distributions from net realized gain | (1.52) | (1.33) | (.09) | (1.23) | (1.77) |
| Total distributions | (1.52) | (1.33) | (.18) | (1.23) | (1.77) |
| Redemption fees added to paid in capitalA | .01 | –C | –C | –C | .01 |
| Net asset value, end of period | $26.56 | $29.63 | $29.06 | $26.77 | $26.62 |
| Total ReturnD,E | (5.51)% | 6.84%B | 9.27% | 5.51% | (8.16)% |
| Ratios to Average Net AssetsF,G | | | | | |
| Expenses before reductions | 2.18% | 2.22% | 2.20% | 2.19% | 2.19% |
| Expenses net of fee waivers, if any | 2.18% | 2.22% | 2.20% | 2.19% | 2.18% |
| Expenses net of all reductions | 2.18% | 2.22% | 2.17% | 2.16% | 2.15% |
| Net investment income (loss) | .19% | .16% | .20% | .46% | .32% |
| Supplemental Data | | | | | |
| Net assets, end of period (000 omitted) | $3,585 | $6,661 | $10,194 | $15,823 | $20,831 |
| Portfolio turnover rateH | 70% | 91% | 95% | 95% | 119% |
A Calculated based on average shares outstanding during the period.
B In 2014, a change to the Indian tax rules invalidated a prior ruling that had exempted the Fund from taxes on realized gains. As a result, the Fund recorded a tax liability which resulted in a decrease to realized and unrealized gain (loss) per share of $.17 at period end. Excluding this amount, the total return would have been 7.43%.
C Amount represents less than $.005 per share.
D Total returns would have been lower if certain expenses had not been reduced during the applicable periods shown.
E Total returns do not include the effect of the contingent deferred sales charge.
F Fees and expenses of any underlying Fidelity Central Funds are not included in the Fund's expense ratio. The Fund indirectly bears its proportionate share of the expenses of any underlying Fidelity Central Funds.
G Expense ratios reflect operating expenses of the class. Expenses before reductions do not reflect amounts reimbursed by the investment adviser or reductions from brokerage service arrangements or reductions from other expense offset arrangements and do not represent the amount paid by the class during periods when reimbursements or reductions occur. Expenses net of fee waivers reflect expenses after reimbursement by the investment adviser but prior to reductions from brokerage service arrangements or other expense offset arrangements. Expenses net of all reductions represent the net expenses paid by the class.
H Amount does not include the portfolio activity of any underlying Fidelity Central Funds.
See accompanying notes which are an integral part of the financial statements.
Financial Highlights — Fidelity Advisor Emerging Asia Fund Class C
| | | | | | |
| Years ended October 31, | 2015 | 2014 | 2013 | 2012 | 2011 |
| Selected Per–Share Data | | | | | |
| Net asset value, beginning of period | $29.30 | $28.78 | $26.53 | $26.44 | $30.58 |
| Income from Investment Operations | | | | | |
| Net investment income (loss)A | .07 | .06 | .07 | .13 | .11 |
| Net realized and unrealized gain (loss) | (1.59) | 1.82B | 2.39 | 1.25 | (2.41) |
| Total from investment operations | (1.52) | 1.88 | 2.46 | 1.38 | (2.30) |
| Distributions from net investment income | – | (.03) | (.12) | (.06) | (.04) |
| Distributions from net realized gain | (1.62) | (1.33) | (.09) | (1.23) | (1.81) |
| Total distributions | (1.62) | (1.36) | (.21) | (1.29) | (1.85) |
| Redemption fees added to paid in capitalA | .01 | –C | –C | –C | .01 |
| Net asset value, end of period | $26.17 | $29.30 | $28.78 | $26.53 | $26.44 |
| Total ReturnD,E | (5.46)% | 6.85%B | 9.33% | 5.57% | (8.10)% |
| Ratios to Average Net AssetsF,G | | | | | |
| Expenses before reductions | 2.11% | 2.17% | 2.16% | 2.16% | 2.13% |
| Expenses net of fee waivers, if any | 2.11% | 2.17% | 2.16% | 2.16% | 2.13% |
| Expenses net of all reductions | 2.10% | 2.17% | 2.12% | 2.13% | 2.10% |
| Net investment income (loss) | .26% | .22% | .24% | .49% | .37% |
| Supplemental Data | | | | | |
| Net assets, end of period (000 omitted) | $51,651 | $57,226 | $61,824 | $67,074 | $78,939 |
| Portfolio turnover rateH | 70% | 91% | 95% | 95% | 119% |
A Calculated based on average shares outstanding during the period.
B In 2014, a change to the Indian tax rules invalidated a prior ruling that had exempted the Fund from taxes on realized gains. As a result, the Fund recorded a tax liability which resulted in a decrease to realized and unrealized gain (loss) per share $.17 at period end. Excluding this amount, the total return would have been 7.44%.
C Amount represents less than $.005 per share.
D Total returns would have been lower if certain expenses had not been reduced during the applicable periods shown.
E Total returns do not include the effect of the contingent deferred sales charge.
F Fees and expenses of any underlying Fidelity Central Funds are not included in the Fund's expense ratio. The Fund indirectly bears its proportionate share of the expenses of any underlying Fidelity Central Funds.
G Expense ratios reflect operating expenses of the class. Expenses before reductions do not reflect amounts reimbursed by the investment adviser or reductions from brokerage service arrangements or reductions from other expense offset arrangements and do not represent the amount paid by the class during periods when reimbursements or reductions occur. Expenses net of fee waivers reflect expenses after reimbursement by the investment adviser but prior to reductions from brokerage service arrangements or other expense offset arrangements. Expenses net of all reductions represent the net expenses paid by the class.
H Amount does not include the portfolio activity of any underlying Fidelity Central Funds.
See accompanying notes which are an integral part of the financial statements.
Financial Highlights — Fidelity Advisor Emerging Asia Fund Class I
| | | | | | |
| Years ended October 31, | 2015 | 2014 | 2013 | 2012 | 2011 |
| Selected Per–Share Data | | | | | |
| Net asset value, beginning of period | $33.00 | $32.24 | $29.67 | $29.49 | $33.80 |
| Income from Investment Operations | | | | | |
| Net investment income (loss)A | .41 | .40 | .40 | .44 | .46 |
| Net realized and unrealized gain (loss) | (1.81) | 2.04B | 2.68 | 1.39 | (2.69) |
| Total from investment operations | (1.40) | 2.44 | 3.08 | 1.83 | (2.23) |
| Distributions from net investment income | (.31) | (.35) | (.41) | (.42) | (.29) |
| Distributions from net realized gain | (1.67) | (1.33) | (.09) | (1.23) | (1.81) |
| Total distributions | (1.98) | (1.68) | (.51)C | (1.65) | (2.09)D |
| Redemption fees added to paid in capitalA | .01 | –E | –E | –E | .01 |
| Net asset value, end of period | $29.63 | $33.00 | $32.24 | $29.67 | $29.49 |
| Total ReturnF | (4.47)% | 7.98%B | 10.47% | 6.64% | (7.13)% |
| Ratios to Average Net AssetsG,H | | | | | |
| Expenses before reductions | 1.07% | 1.12% | 1.11% | 1.11% | 1.10% |
| Expenses net of fee waivers, if any | 1.07% | 1.12% | 1.11% | 1.11% | 1.10% |
| Expenses net of all reductions | 1.06% | 1.12% | 1.08% | 1.08% | 1.06% |
| Net investment income (loss) | 1.30% | 1.26% | 1.29% | 1.54% | 1.41% |
| Supplemental Data | | | | | |
| Net assets, end of period (000 omitted) | $51,569 | $48,693 | $36,310 | $40,026 | $49,888 |
| Portfolio turnover rateI | 70% | 91% | 95% | 95% | 119% |
A Calculated based on average shares outstanding during the period.
B In 2014, a change to the Indian tax rules invalidated a prior ruling that had exempted the Fund from taxes on realized gains. As a result, the Fund recorded a tax liability which resulted in a decrease to realized and unrealized gain (loss) per share of $.19 at period end. Excluding this amount, the total return would have been 8.57%.
C Total distributions of $.51 per share is comprised of distributions from net investment income of $.413 and distributions from net realized gain of $.092 per share.
D Total distributions of $2.09. per share is comprised of distributions from net investment income of $.288 and distributions from net realized gain of $1.805 per share.
E Amount represents less than $.005 per share.
F Total returns would have been lower if certain expenses had not been reduced during the applicable periods shown.
G Fees and expenses of any underlying Fidelity Central Funds are not included in the Fund's expense ratio. The Fund indirectly bears its proportionate share of the expenses of any underlying Fidelity Central Funds.
H Expense ratios reflect operating expenses of the class. Expenses before reductions do not reflect amounts reimbursed by the investment adviser or reductions from brokerage service arrangements or reductions from other expense offset arrangements and do not represent the amount paid by the class during periods when reimbursements or reductions occur. Expenses net of fee waivers reflect expenses after reimbursement by the investment adviser but prior to reductions from brokerage service arrangements or other expense offset arrangements. Expenses net of all reductions represent the net expenses paid by the class.
I Amount does not include the portfolio activity of any underlying Fidelity Central Funds.
See accompanying notes which are an integral part of the financial statements.
Notes to Financial Statements
For the period ended October 31, 2015
1. Organization.
Fidelity Advisor Emerging Asia Fund (the Fund) is a fund of Fidelity Advisor Series VIII (the Trust) and is authorized to issue an unlimited number of shares. The Trust is registered under the Investment Company Act of 1940, as amended (the 1940 Act), as an open-end management investment company organized as a Massachusetts business trust. The Fund offers Class A, Class T, Class C, and Class I (formerly Institutional Class) shares, each of which, along with Class B shares, has equal rights as to assets and voting privileges. Class B shares are closed to new accounts and additional purchases, except for exchanges and reinvestments. Each class has exclusive voting rights with respect to matters that affect that class. Class B shares will automatically convert to Class A shares after a holding period of seven years from the initial date of purchase. The Fund's investments in emerging markets can be subject to social, economic, regulatory, and political uncertainties and can be extremely volatile.
2. Investments in Fidelity Central Funds.
The Fund invests in Fidelity Central Funds, which are open-end investment companies generally available only to other investment companies and accounts managed by the investment adviser and its affiliates. The Fund's Schedule of Investments lists each of the Fidelity Central Funds held as of period end, if any, as an investment of the Fund, but does not include the underlying holdings of each Fidelity Central Fund. As an Investing Fund, the Fund indirectly bears its proportionate share of the expenses of the underlying Fidelity Central Funds.
The Money Market Central Funds seek preservation of capital and current income and are managed by Fidelity Investments Money Management, Inc. (FIMM), an affiliate of the investment adviser. Annualized expenses of the Money Market Central Funds as of their most recent shareholder report date are less than .005%.
A complete unaudited list of holdings for each Fidelity Central Fund is available upon request or at the Securities and Exchange Commission (the SEC) website at www.sec.gov. In addition, the financial statements of the Fidelity Central Funds, which are not covered by the Fund's Report of Independent Registered Public Accounting Firm, are available on the SEC website or upon request.
3. Significant Accounting Policies.
The financial statements have been prepared in conformity with accounting principles generally accepted in the United States of America (GAAP), which require management to make certain estimates and assumptions at the date of the financial statements. Actual results could differ from those estimates. Subsequent events, if any, through the date that the financial statements were issued have been evaluated in the preparation of the financial statements. The following summarizes the significant accounting policies of the Fund:
Investment Valuation. Investments are valued as of 4:00 p.m. Eastern time on the last calendar day of the period. The Board of Trustees (the Board) has delegated the day to day responsibility for the valuation of the Fund's investments to the Fidelity Management & Research Company (FMR) Fair Value Committee (the Committee). In accordance with valuation policies and procedures approved by the Board, the Fund attempts to obtain prices from one or more third party pricing vendors or brokers to value its investments. When current market prices, quotations or currency exchange rates are not readily available or reliable, investments will be fair valued in good faith by the Committee, in accordance with procedures adopted by the Board. Factors used in determining fair value vary by investment type and may include market or investment specific events, changes in interest rates and credit quality. The frequency with which these procedures are used cannot be predicted and they may be utilized to a significant extent. The Committee oversees the Fund's valuation policies and procedures and reports to the Board on the Committee's activities and fair value determinations. The Board monitors the appropriateness of the procedures used in valuing the Fund's investments and ratifies the fair value determinations of the Committee.
The Fund categorizes the inputs to valuation techniques used to value its investments into a disclosure hierarchy consisting of three levels as shown below:
- Level 1 – quoted prices in active markets for identical investments
- Level 2 – other significant observable inputs (including quoted prices for similar investments, interest rates, prepayment speeds, etc.)
- Level 3 – unobservable inputs (including the Fund's own assumptions based on the best information available)
Valuation techniques used to value the Fund's investments by major category are as follows:
Equity securities, including restricted securities, for which market quotations are readily available, are valued at the last reported sale price or official closing price as reported by a third party pricing vendor on the primary market or exchange on which they are traded and are categorized as Level 1 in the hierarchy. In the event there were no sales during the day or closing prices are not available, securities are valued at the last quoted bid price or may be valued using the last available price and are generally categorized as Level 2 in the hierarchy. For foreign equity securities, when market or security specific events arise, comparisons to the valuation of American Depositary Receipts (ADRs), futures contracts, Exchange-Traded Funds (ETFs) and certain indexes as well as quoted prices for similar securities may be used and would be categorized as Level 2 in the hierarchy. Utilizing these techniques may result in transfers between Level 1 and Level 2. For equity securities, including restricted securities, where observable inputs are limited, assumptions about market activity and risk are used and these securities may be categorized as Level 3 in the hierarchy.
Debt securities, including restricted securities, are valued based on evaluated prices received from third party pricing vendors or from brokers who make markets in such securities. Corporate bonds are valued by pricing vendors who utilize matrix pricing which considers yield or price of bonds of comparable quality, coupon, maturity and type or by broker-supplied prices. When independent prices are unavailable or unreliable, debt securities may be valued utilizing pricing methodologies which consider similar factors that would be used by third party pricing vendors. Debt securities are generally categorized as Level 2 in the hierarchy but may be Level 3 depending on the circumstances.
Investments in open-end mutual funds, including the Fidelity Central Funds, are valued at their closing net asset value (NAV) each business day and are categorized as Level 1 in the hierarchy.
Changes in valuation techniques may result in transfers in or out of an assigned level within the disclosure hierarchy. The aggregate value of investments by input level as of October 31, 2015, information on transfers between Levels 1 and 2 , as well as a roll forward of Level 3 investments, is included at the end of the Fund's Schedule of Investments.
Foreign Currency. The Fund may use foreign currency contracts to facilitate transactions in foreign-denominated securities. Gains and losses from these transactions may arise from changes in the value of the foreign currency or if the counterparties do not perform under the contracts' terms.
Foreign-denominated assets, including investment securities, and liabilities are translated into U.S. dollars at the exchange rates at period end. Purchases and sales of investment securities, income and dividends received and expenses denominated in foreign currencies are translated into U.S. dollars at the exchange rate in effect on the transaction date.
The effects of exchange rate fluctuations on investments are included with the net realized and unrealized gain (loss) on investment securities. Other foreign currency transactions resulting in realized and unrealized gain (loss) are disclosed separately.
Investment Transactions and Income. For financial reporting purposes, the Fund's investment holdings and NAV include trades executed through the end of the last business day of the period. The NAV per share for processing shareholder transactions is calculated as of the close of business of the New York Stock Exchange (NYSE), normally 4:00 p.m. Eastern time and includes trades executed through the end of the prior business day. Gains and losses on securities sold are determined on the basis of identified cost. Dividend income is recorded on the ex-dividend date, except for certain dividends from foreign securities where the ex-dividend date may have passed, which are recorded as soon as the Fund is informed of the ex-dividend date. Non-cash dividends included in dividend income, if any, are recorded at the fair market value of the securities received. Income and capital gain distributions from Fidelity Central Funds, if any, are recorded on the ex-dividend date. Interest income is accrued as earned and includes coupon interest and amortization of premium and accretion of discount on debt securities as applicable. Investment income is recorded net of foreign taxes withheld where recovery of such taxes is uncertain.
Class Allocations and Expenses. Investment income, realized and unrealized capital gains and losses, common expenses of the Fund, and certain fund-level expense reductions, if any, are allocated daily on a pro-rata basis to each class based on the relative net assets of each class to the total net assets of the Fund. Each class differs with respect to transfer agent and distribution and service plan fees incurred. Certain expense reductions may also differ by class. For the reporting period, the allocated portion of income and expenses to each class as a percent of its average net assets may vary due to the timing of recording these transactions in relation to fluctuating net assets of the classes. Expenses directly attributable to a fund are charged to that fund. Expenses attributable to more than one fund are allocated among the respective funds on the basis of relative net assets or other appropriate methods. Expense estimates are accrued in the period to which they relate and adjustments are made when actual amounts are known.
Income Tax Information and Distributions to Shareholders. Each year, the Fund intends to qualify as a regulated investment company under Subchapter M of the Internal Revenue Code, including distributing substantially all of its taxable income and realized gains. As a result, no provision for U.S. Federal income taxes is required. As of October 31, 2015, the Fund did not have any unrecognized tax benefits in the financial statements; nor is the Fund aware of any tax positions for which it is reasonably possible that the total amounts of unrecognized tax benefits will significantly change in the next twelve months. The Fund files a U.S. federal tax return, in addition to state and local tax returns as required. The Fund's federal income tax returns are subject to examination by the Internal Revenue Service (IRS) for a period of three fiscal years after they are filed. State and local tax returns may be subject to examination for an additional fiscal year depending on the jurisdiction. Foreign taxes are provided for based on the Fund's understanding of the tax rules and rates that exist in the foreign markets in which it invests. The Fund is subject to a tax imposed on capital gains by certain countries in which it invests. An estimated deferred tax liability for net unrealized appreciation on the applicable securities is included in Other payables and accrued expenses on the Statement of Assets & Liabilities.
Distributions are declared and recorded on the ex-dividend date. Income dividends and capital gain distributions are declared separately for each class. Income and capital gain distributions are determined in accordance with income tax regulations, which may differ from GAAP. In addition, the Fund claimed a portion of the payment made to redeeming shareholders as a distribution for income tax purposes.
Capital accounts within the financial statements are adjusted for permanent book-tax differences. These adjustments have no impact on net assets or the results of operations. Capital accounts are not adjusted for temporary book-tax differences which will reverse in a subsequent period.
Book-tax differences are primarily due to certain foreign taxes, passive foreign investment companies (PFIC) and losses deferred due to wash sales.
The federal tax cost of investment securities and unrealized appreciation (depreciation) as of period end were as follows:
| Gross unrealized appreciation | $44,008,834 |
| Gross unrealized depreciation | (25,172,267) |
| Net unrealized appreciation (depreciation) on securities | $18,836,567 |
| Tax Cost | $251,768,532 |
The tax-based components of distributable earnings as of period end were as follows:
| Undistributed ordinary income | $1,204,748 |
| Undistributed long-term capital gain | $2,201,807 |
| Net unrealized appreciation (depreciation) on securities and other investments | $18,781,082 |
The tax character of distributions paid was as follows:
| | October 31, 2015 | October 31, 2014 |
| Ordinary Income | $2,726,802 | $ 2,011,362 |
| Long-term Capital Gains | 14,513,879 | 13,483,906 |
| Total | $17,240,681 | $ 15,495,268 |
Short-Term Trading (Redemption) Fees. Shares held by investors in the Fund less than 90 days may have been subject to a redemption fee equal to 1.50% of the NAV of shares redeemed. All redemption fees, which reduce the proceeds of the shareholder redemption, are retained by the Fund and accounted for as an addition to paid in capital.
4. Purchases and Sales of Investments.
Purchases and sales of securities, other than short-term securities, aggregated $209,571,850 and $223,267,320, respectively.
5. Fees and Other Transactions with Affiliates.
Management Fee. Fidelity Management & Research Company (the investment adviser) and its affiliates provide the Fund with investment management related services for which the Fund pays a monthly management fee. The management fee is the sum of an individual fund fee rate that is based on an annual rate of .45% of the Fund's average net assets and an annualized group fee rate that averaged .25% during the period. The group fee rate is based upon the average net assets of all the mutual funds advised by the investment adviser, including any mutual funds previously advised by the investment adviser that are currently advised by Fidelity SelectCo, LLC, an affiliate of the investment adviser. The group fee rate decreases as assets under management increase and increases as assets under management decrease. For the reporting period, the total annual management fee rate was .70% of the Fund's average net assets.
Distribution and Service Plan Fees. In accordance with Rule 12b-1 of the 1940 Act, the Fund has adopted separate Distribution and Service Plans for each class of shares. Certain classes pay Fidelity Distributors Corporation (FDC), an affiliate of the investment adviser, separate Distribution and Service Fees, each of which is based on an annual percentage of each class' average net assets. In addition, FDC may pay financial intermediaries for selling shares of the Fund and providing shareholder support services. For the period, the Distribution and Service Fee rates, total fees and amounts retained by FDC were as follows:
| | Distribution
Fee | Service
Fee | Total Fees | Retained
by FDC |
| Class A | -% | .25% | $354,555 | $1,813 |
| Class T | .25% | .25% | 211,840 | 1,174 |
| Class B | .75% | .25% | 52,193 | 39,171 |
| Class C | .75% | .25% | 593,112 | 50,470 |
| | | | $1,211,700 | $92,628 |
Sales Load. FDC may receive a front-end sales charge of up to 5.75% for selling Class A shares and 3.50% for selling Class T shares, some of which is paid to financial intermediaries for selling shares of the Fund. Depending on the holding period, FDC may receive contingent deferred sales charges levied on Class A, Class T, Class B, and Class C redemptions. The deferred sales charges range from 5.00% to 1.00% for Class B shares, 1.00% for Class C shares, 1.00% for certain purchases of Class A shares and .25% for certain purchases of Class T shares.
For the period, sales charge amounts retained by FDC were as follows:
| | Retained by FDC |
| Class A | $35,334 |
| Class T | 6,975 |
| Class B(a) | 6,110 |
| Class C(a) | 2,872 |
| | $51,291 |
(a) When Class B and Class C shares are initially sold, FDC pays commissions from its own resources to financial intermediaries through which the sales are made.
Transfer Agent Fees. Fidelity Investments Institutional Operations Company, Inc., (FIIOC), an affiliate of the investment adviser, is the transfer, dividend disbursing and shareholder servicing agent for each class of the Fund. FIIOC receives account fees and asset-based fees that vary according to the account size and type of account of the shareholders of the respective classes of the Fund. FIIOC pays for typesetting, printing and mailing of shareholder reports, except proxy statements.
For the period, transfer agent fees for each class were as follows:
| | Amount | % of
Class-Level Average
Net Assets |
| Class A | $345,368 | .24 |
| Class T | 127,554 | .30 |
| Class B | 15,550 | .30 |
| Class C | 138,331 | .23 |
| Class I | 112,096 | .19 |
| | $738,899 | |
Accounting and Security Lending Fees. Fidelity Service Company, Inc. (FSC), an affiliate of the investment adviser, maintains the Fund's accounting records. The accounting fee is based on the level of average net assets for each month. Under a separate contract, FSC administers the security lending program. The security lending fee is based on the number and duration of lending transactions.
Brokerage Commissions. The Fund placed a portion of its portfolio transactions with brokerage firms which are affiliates of the investment adviser. Brokerage commissions are included in net realized gain (loss) and change in net unrealized appreciation (depreciation) in the Statement of Operations. The commissions paid to these affiliated firms were $328 for the period.
Other. During the period, the investment adviser reimbursed the Fund for certain losses in the amount of $8,064.
Interfund Lending Program. Pursuant to an Exemptive Order issued by the SEC, the Fund, along with other registered investment companies having management contracts with FMR or other affiliated entities of FMR, may participate in an interfund lending program. This program provides an alternative credit facility allowing the funds to borrow from, or lend money to, other participating affiliated funds. At period end, there were no interfund loans outstanding. The Fund's activity in this program during the period for which loans were outstanding was as follows:
| Borrower or Lender | Average Loan Balance | Weighted Average Interest Rate | Interest Expense |
| Borrower | $10,448,000 | .36% | $527 |
6. Committed Line of Credit.
The Fund participates with other funds managed by the investment adviser or an affiliate in a $4.25 billion credit facility (the "line of credit") to be utilized for temporary or emergency purposes to fund shareholder redemptions or for other short-term liquidity purposes. The Fund has agreed to pay commitment fees on its pro-rata portion of the line of credit, which amounted to $444 and is reflected in Miscellaneous expenses on the Statement of Operations. During the period, the Fund did not borrow on this line of credit.
7. Security Lending.
The Fund lends portfolio securities through a lending agent from time to time in order to earn additional income. For equity securities, a lending agent is used and may loan securities to certain qualified borrowers, including Fidelity Capital Markets (FCM), a broker-dealer affiliated with the Fund. On the settlement date of the loan, the Fund receives collateral (in the form of U.S. Treasury obligations, letters of credit and/or cash) against the loaned securities and maintains collateral in an amount not less than 100% of the market value of the loaned securities during the period of the loan. The market value of the loaned securities is determined at the close of business of the Fund and any additional required collateral is delivered to the Fund on the next business day. The Fund or borrower may terminate the loan at any time, and if the borrower defaults on its obligation to return the securities loaned because of insolvency or other reasons, the Fund may apply collateral received from the borrower against the obligation. The Fund may experience delays and costs in recovering the securities loaned. Any cash collateral received is invested in the Fidelity Securities Lending Cash Central Fund. The value of loaned securities and cash collateral at period end are disclosed on the Fund's Statement of Assets and Liabilities. Security lending income represents the income earned on investing cash collateral, less rebates paid to borrowers and any lending agent fees associated with the loan, plus any premium payments received for lending certain types of securities. Security lending income is presented in the Statement of Operations as a component of income from Fidelity Central Funds. Total security lending income during the period amounted to $9,049. During the period, there were no securities loaned to FCM.
8. Expense Reductions.
Commissions paid to certain brokers with whom the investment adviser, or its affiliates, places trades on behalf of the Fund include an amount in addition to trade execution, which may be rebated back to the Fund to offset certain expenses. This amount totaled $15,254 for the period.
In addition, during the period the investment adviser reimbursed and/or waived a portion of fund-level operating expenses in the amount of $1,359 and a portion of class-level operating expenses as follows:
| | Amount |
| Class A | $3,466 |
| Class T | 136 |
| Class B | 14 |
| Class C | 1,393 |
| Class I | 1,027 |
| | $6,036 |
9. Distributions to Shareholders.
Distributions to shareholders of each class were as follows:
| Years ended October 31, | 2015 | 2014 |
| From net investment income | | |
| Class A | $822,279 | $1,258,600 |
| Class T | 110,077 | 253,592 |
| Class C | – | 67,365 |
| Class I | 466,265 | 431,805 |
| Total | $1,398,621 | $2,011,362 |
| From net realized gain | | |
| Class A | $7,521,830 | $6,564,461 |
| Class T | 2,362,422 | 2,044,109 |
| Class B | 322,901 | 453,142 |
| Class C | 3,108,927 | 2,799,874 |
| Class I | 2,525,980 | 1,622,320 |
| Total | $15,842,060 | $13,483,906 |
10. Share Transactions.
Share transactions for each class were as follows and may contain automatic conversions between classes or exchanges between funds:
| | Shares | Shares | Dollars | Dollars |
| Years ended October 31, | 2015 | 2014 | 2015 | 2014 |
| Class A | | | | |
| Shares sold | 687,127 | 573,747 | $21,712,763 | $17,697,836 |
| Reinvestment of distributions | 249,985 | 228,279 | 7,544,560 | 6,811,859 |
| Shares redeemed | (1,101,494) | (1,220,608) | (33,216,845) | (37,276,981) |
| Net increase (decrease) | (164,382) | (418,582) | $(3,959,522) | $(12,767,286) |
| Class T | | | | |
| Shares sold | 134,384 | 138,080 | $4,095,325 | $4,191,092 |
| Reinvestment of distributions | 82,920 | 77,360 | 2,437,846 | 2,251,960 |
| Shares redeemed | (296,419) | (345,644) | (8,755,323) | (10,192,417) |
| Net increase (decrease) | (79,115) | (130,204) | $(2,222,152) | $(3,749,365) |
| Class B | | | | |
| Shares sold | 4,883 | 8,605 | $142,572 | $250,322 |
| Reinvestment of distributions | 10,090 | 13,707 | 283,216 | 380,925 |
| Shares redeemed | (104,780) | (148,296) | (2,930,407) | (4,170,831) |
| Net increase (decrease) | (89,807) | (125,984) | $(2,504,619) | $(3,539,584) |
| Class C | | | | |
| Shares sold | 485,886 | 212,902 | $14,051,553 | $6,070,821 |
| Reinvestment of distributions | 98,091 | 89,602 | 2,712,206 | 2,461,356 |
| Shares redeemed | (563,292) | (497,988) | (15,169,240) | (13,805,000) |
| Net increase (decrease) | 20,685 | (195,484) | $1,594,519 | $(5,272,823) |
| Class I | | | | |
| Shares sold | 1,486,922 | 1,068,125 | $48,941,250 | $34,572,790 |
| Reinvestment of distributions | 81,888 | 52,027 | 2,540,162 | 1,594,630 |
| Shares redeemed | (1,303,858) | (770,899) | (40,320,585) | (24,061,907) |
| Net increase (decrease) | 264,952 | 349,253 | $11,160,827 | $12,105,513 |
11. Other.
The Fund's organizational documents provide former and current trustees and officers with a limited indemnification against liabilities arising in connection with the performance of their duties to the Fund. In the normal course of business, the Fund may also enter into contracts that provide general indemnifications. The Fund's maximum exposure under these arrangements is unknown as this would be dependent on future claims that may be made against the Fund. The risk of material loss from such claims is considered remote.
Report of Independent Registered Public Accounting Firm
To the Trustees of Fidelity Advisor Series VIII and Shareholders of Fidelity Advisor® Emerging Asia Fund:
In our opinion, the accompanying statement of assets and liabilities, including the schedule of investments, and the related statements of operations and of changes in net assets and the financial highlights present fairly, in all material respects, the financial position of Fidelity Advisor® Emerging Asia Fund (a fund of Fidelity Advisor Series VIII) at October 31, 2015, the results of its operations for the year then ended, the changes in its net assets for each of the two years in the period then ended and the financial highlights for each of the five years in the period then ended, in conformity with accounting principles generally accepted in the United States of America. These financial statements and financial highlights (hereafter referred to as “financial statements”) are the responsibility of the Fidelity Advisor® Emerging Asia Fund’s management. Our responsibility is to express an opinion on these financial statements based on our audits. We conducted our audits of these financial statements in accordance with the standards of the Public Company Accounting Oversight Board (United States). Those standards require that we plan and perform the audit to obtain reasonable assurance about whether the financial statements are free of material misstatement. An audit includes examining, on a test basis, evidence supporting the amounts and disclosures in the financial statements, assessing the accounting principles used and significant estimates made by management, and evaluating the overall financial statement presentation. We believe that our audits, which included confirmation of securities at October 31, 2015 by correspondence with the custodian and brokers, provide a reasonable basis for our opinion.
PricewaterhouseCoopers LLP
Boston, Massachusetts
December 16, 2015
Trustees and Officers
The Trustees, Members of the Advisory Board (if any), and officers of the trust and fund, as applicable, are listed below. The Board of Trustees governs the fund and is responsible for protecting the interests of shareholders. The Trustees are experienced executives who meet periodically throughout the year to oversee the fund's activities, review contractual arrangements with companies that provide services to the fund, oversee management of the risks associated with such activities and contractual arrangements, and review the fund's performance. Each of the Trustees oversees 170 funds.
The Trustees hold office without limit in time except that (a) any Trustee may resign; (b) any Trustee may be removed by written instrument, signed by at least two-thirds of the number of Trustees prior to such removal; (c) any Trustee who requests to be retired or who has become incapacitated by illness or injury may be retired by written instrument signed by a majority of the other Trustees; and (d) any Trustee may be removed at any special meeting of shareholders by a two-thirds vote of the outstanding voting securities of the trust. Each Trustee who is not an interested person (as defined in the 1940 Act) of the trust and the fund is referred to herein as an Independent Trustee. Each Independent Trustee shall retire not later than the last day of the calendar year in which his or her 75th birthday occurs. The Independent Trustees may waive this mandatory retirement age policy with respect to individual Trustees. Officers and Advisory Board Members hold office without limit in time, except that any officer or Advisory Board Member may resign or may be removed by a vote of a majority of the Trustees at any regular meeting or any special meeting of the Trustees. Except as indicated, each individual has held the office shown or other offices in the same company for the past five years.
The fund’s Statement of Additional Information (SAI) includes more information about the Trustees. To request a free copy, call Fidelity at 1-877-208-0098.
Experience, Skills, Attributes, and Qualifications of the Trustees. The Governance and Nominating Committee has adopted a statement of policy that describes the experience, qualifications, attributes, and skills that are necessary and desirable for potential Independent Trustee candidates (Statement of Policy). The Board believes that each Trustee satisfied at the time he or she was initially elected or appointed a Trustee, and continues to satisfy, the standards contemplated by the Statement of Policy. The Governance and Nominating Committee also engages professional search firms to help identify potential Independent Trustee candidates who have the experience, qualifications, attributes, and skills consistent with the Statement of Policy. From time to time, additional criteria based on the composition and skills of the current Independent Trustees, as well as experience or skills that may be appropriate in light of future changes to board composition, business conditions, and regulatory or other developments, have also been considered by the professional search firms and the Governance and Nominating Committee. In addition, the Board takes into account the Trustees' commitment and participation in Board and committee meetings, as well as their leadership of standing and ad hoc committees throughout their tenure.
In determining that a particular Trustee was and continues to be qualified to serve as a Trustee, the Board has considered a variety of criteria, none of which, in isolation, was controlling. The Board believes that, collectively, the Trustees have balanced and diverse experience, qualifications, attributes, and skills, which allow the Board to operate effectively in governing the fund and protecting the interests of shareholders. Information about the specific experience, skills, attributes, and qualifications of each Trustee, which in each case led to the Board's conclusion that the Trustee should serve (or continue to serve) as a trustee of the fund, is provided below.
Board Structure and Oversight Function. James C. Curvey is an interested person and currently serves as Chairman. The Trustees have determined that an interested Chairman is appropriate and benefits shareholders because an interested Chairman has a personal and professional stake in the quality and continuity of services provided to the fund. Independent Trustees exercise their informed business judgment to appoint an individual of their choosing to serve as Chairman, regardless of whether the Trustee happens to be independent or a member of management. The Independent Trustees have determined that they can act independently and effectively without having an Independent Trustee serve as Chairman and that a key structural component for assuring that they are in a position to do so is for the Independent Trustees to constitute a substantial majority for the Board. The Independent Trustees also regularly meet in executive session. Ned C. Lautenbach serves as Chairman of the Independent Trustees and as such (i) acts as a liaison between the Independent Trustees and management with respect to matters important to the Independent Trustees and (ii) with management prepares agendas for Board meetings.
Fidelity® funds are overseen by different Boards of Trustees. The fund's Board oversees Fidelity's high income and certain equity funds, and other Boards oversee Fidelity's investment-grade bond, money market, asset allocation, and sector funds. The asset allocation funds may invest in Fidelity® funds overseen by the fund's Board. The use of separate Boards, each with its own committee structure, allows the Trustees of each group of Fidelity® funds to focus on the unique issues of the funds they oversee, including common research, investment, and operational issues. On occasion, the separate Boards establish joint committees to address issues of overlapping consequences for the Fidelity® funds overseen by each Board.
The Trustees operate using a system of committees to facilitate the timely and efficient consideration of all matters of importance to the Trustees, the fund, and fund shareholders and to facilitate compliance with legal and regulatory requirements and oversight of the fund's activities and associated risks. The Board, acting through its committees, has charged FMR and its affiliates with (i) identifying events or circumstances the occurrence of which could have demonstrably adverse effects on the fund's business and/or reputation; (ii) implementing processes and controls to lessen the possibility that such events or circumstances occur or to mitigate the effects of such events or circumstances if they do occur; and (iii) creating and maintaining a system designed to evaluate continuously business and market conditions in order to facilitate the identification and implementation processes described in (i) and (ii) above. Because the day-to-day operations and activities of the fund are carried out by or through FMR, its affiliates, and other service providers, the fund's exposure to risks is mitigated but not eliminated by the processes overseen by the Trustees. While each of the Board's committees has responsibility for overseeing different aspects of the fund's activities, oversight is exercised primarily through the Operations, Audit, and Compliance Committees. In addition, the Independent Trustees have worked with FMR to enhance the Board's oversight of investment and financial risks, legal and regulatory risks, technology risks, and operational risks, including the development of additional risk reporting to the Board. For example, a working group comprised of Independent Trustees and FMR has worked and continues to work to review the Fidelity® funds' valuation-related activities, reporting and risk management. Appropriate personnel, including but not limited to the fund's Chief Compliance Officer (CCO), FMR's internal auditor, the independent accountants, the fund's Treasurer and portfolio management personnel, make periodic reports to the Board's committees, as appropriate, including an annual review of Fidelity's risk management program for the Fidelity® funds. The responsibilities of each standing committee, including their oversight responsibilities, are described further under "Standing Committees of the Trustees."
Interested Trustees*:
Correspondence intended for a Trustee who is an interested person may be sent to Fidelity Investments, 245 Summer Street, Boston, Massachusetts 02210.
Name, Year of Birth; Principal Occupations and Other Relevant Experience+
James C. Curvey (1935)
Year of Election or Appointment: 2007
Trustee
Chairman of the Board of Trustees
Mr. Curvey also serves as Trustee of other Fidelity® funds. Mr. Curvey is a Director of Fidelity Research & Analysis Co. (investment adviser firm, 2009-present), and Vice Chairman (2007-present) and Director of FMR LLC (diversified financial services company). In addition, Mr. Curvey serves as an Overseer for the Boston Symphony Orchestra and a member of the board of Artis-Naples, Naples, Florida, and as a Trustee for Brewster Academy, Wolfeboro, New Hampshire. Previously, Mr. Curvey served as a Director of Fidelity Investments Money Management, Inc. (investment adviser firm, 2009-2014) and a Director of FMR and FMR Co., Inc. (investment adviser firms, 2007-2014).
Charles S. Morrison (1960)
Year of Election or Appointment: 2014
Trustee
Mr. Morrison also serves as Trustee of other funds. He serves as a Director of Fidelity Investments Money Management, Inc. (FIMM) (investment adviser firm, 2014-present), Director of Fidelity SelectCo, LLC (investment adviser firm, 2014-present), President, Asset Management (2014-present), and is an employee of Fidelity Investments. Previously, Mr. Morrison served as Vice President of Fidelity's Fixed Income and Asset Allocation Funds (2012-2014), President, Fixed Income (2011-2014), Vice President of Fidelity's Money Market Funds (2005-2009), President, Money Market Group Leader of FMR (investment adviser firm, 2009), and Senior Vice President, Money Market Group of FMR (2004-2009). Mr. Morrison also served as Vice President of Fidelity's Bond Funds (2002-2005), certain Balanced Funds (2002-2005), and certain Asset Allocation Funds (2002-2007), and as Senior Vice President (2002-2005) of Fidelity's Bond Division.
* Determined to be an “Interested Trustee” by virtue of, among other things, his or her affiliation with the trust or various entities under common control with FMR.
+ The information includes the Trustee's principal occupation during the last five years and other information relating to the experience, attributes, and skills relevant to the Trustee's qualifications to serve as a Trustee, which led to the conclusion that the Trustee should serve as a Trustee for the fund.
Independent Trustees:
Correspondence intended for an Independent Trustee may be sent to Fidelity Investments, P.O. Box 55235, Boston, Massachusetts 02205-5235.
Name, Year of Birth; Principal Occupations and Other Relevant Experience+
Dennis J. Dirks (1948)
Year of Election or Appointment: 2005
Trustee
Mr. Dirks also serves as Trustee of other Fidelity® funds. Prior to his retirement in May 2003, Mr. Dirks was Chief Operating Officer and a member of the Board of The Depository Trust & Clearing Corporation (DTCC). He also served as President, Chief Operating Officer, and Board member of The Depository Trust Company (DTC) and President and Board member of the National Securities Clearing Corporation (NSCC). In addition, Mr. Dirks served as Chief Executive Officer and Board member of the Government Securities Clearing Corporation, Chief Executive Officer and Board member of the Mortgage-Backed Securities Clearing Corporation, as a Trustee and a member of the Finance Committee of Manhattan College (2005-2008), as a Trustee and a member of the Finance Committee of AHRC of Nassau County (2006-2008), and as a member of the Independent Directors Council (IDC) Governing Council (2010-2015). Mr. Dirks is a member of the Board of Directors for The Brookville Center for Children's Services, Inc. (2009-present).
Alan J. Lacy (1953)
Year of Election or Appointment: 2008
Trustee
Mr. Lacy also serves as Trustee of other Fidelity® funds. Mr. Lacy serves as a member of the Board of Directors of Dave & Buster's Entertainment, Inc. (restaurant and entertainment complexes, 2010-present) and Bristol-Myers Squibb Company (global pharmaceuticals, 2008-present). In addition, Mr. Lacy served as Senior Adviser (2007-2014) of Oak Hill Capital Partners, L.P. (private equity) and also served as Chief Executive Officer (2000-2005) and Vice Chairman (2005-2006) of Sears Holdings Corporation and Sears, Roebuck and Co. (retail). Mr. Lacy is a member of the Board of Trustees of The National Parks Conservation Association (2006-present). Previously, Mr. Lacy served as Chairman of the Board of Trustees of the National Parks Conservation Association (2008-2011) and as a member of the Board of Directors for The Western Union Company (global money transfer, 2006-2011), The Hillman Companies, Inc. (hardware wholesalers, 2010-2014), and Earth Fare, Inc. (retail grocery, 2010-2014).
Ned C. Lautenbach (1944)
Year of Election or Appointment: 2000
Trustee
Chairman of the Independent Trustees
Mr. Lautenbach also serves as Trustee of other Fidelity® funds. Mr. Lautenbach currently serves as the Lead Director of the Eaton Corporation Board of Directors (diversified industrial, 1997-present). Mr. Lautenbach is Chairman of the Board of Directors of Artis-Naples in Naples, Florida (2012-present), a member of the Council on Foreign Relations (1994-present), and a member of the Board of Governors, State University System of Florida (2013-present). Previously, Mr. Lautenbach was a Partner/Advisory Partner at Clayton, Dubilier & Rice, LLC (private equity investment, 1998-2010), as well as a Director of Sony Corporation (2006-2007).
Joseph Mauriello (1944)
Year of Election or Appointment: 2008
Trustee
Mr. Mauriello also serves as Trustee of other Fidelity® funds. Prior to his retirement in January 2006, Mr. Mauriello served in numerous senior management positions including Deputy Chairman and Chief Operating Officer (2004-2005), and Vice Chairman of Financial Services (2002-2004) of KPMG LLP US (professional services, 1965-2005). Mr. Mauriello currently serves as a member of the Board of Directors of XL Group plc. (global insurance and re-insurance, 2006-present) and the Independent Directors Council (IDC) Governing Council (2015-present). Previously, Mr. Mauriello served as a Director of the Hamilton Funds of the Bank of New York (2006-2007) and of Arcadia Resources Inc. (health care services and products, 2007-2012).
Robert W. Selander (1950)
Year of Election or Appointment: 2011
Trustee
Mr. Selander also serves as Trustee of other Fidelity® funds. Mr. Selander serves as a Director of The Western Union Company (global money transfer, 2014-present). Previously, Mr. Selander served as a Member of the Advisory Board of other Fidelity® funds (2011), and Executive Vice Chairman (2010), Chief Executive Officer (2009-2010), and President and Chief Executive Officer (1997-2009) of Mastercard, Inc.
Cornelia M. Small (1944)
Year of Election or Appointment: 2005
Trustee
Ms. Small also serves as Trustee of other Fidelity® funds. Ms. Small is a member of the Board of Directors (2009-present) and Chair of the Investment Committee (2010-present) of the Teagle Foundation. Ms. Small also serves on the Investment Committee of the Berkshire Taconic Community Foundation (2008-present). Previously, Ms. Small served as Chairperson (2002-2008) and a member of the Investment Committee and Chairperson (2008-2012) and a member of the Board of Trustees of Smith College. In addition, Ms. Small served as Chief Investment Officer, Director of Global Equity Investments, and a member of the Board of Directors of Scudder, Stevens & Clark and Scudder Kemper Investments.
William S. Stavropoulos (1939)
Year of Election or Appointment: 2001
Trustee
Vice Chairman of the Independent Trustees
Mr. Stavropoulos also serves as Trustee of other Fidelity® funds. Mr. Stavropoulos serves as President and Founder of the Michigan Baseball Foundation, the Great Lakes Loons (2007-present). Mr. Stavropoulos is Chairman Emeritus of the Board of Directors of The Dow Chemical Company, where he previously served in numerous senior management positions, including President, CEO (1995-2000; 2002-2004), Chairman of the Executive Committee (2000-2006), and as a member of the Board of Directors (1990-2006). Currently, Mr. Stavropoulos is Chairman of the Board of Directors of Univar Inc. (global distributor of commodity and specialty chemicals), a Director of Teradata Corporation (data warehousing and technology solutions), and Maersk Inc. (industrial conglomerate), and a member of the Advisory Board for Metalmark Capital LLC (private equity investment, 2005-present). Mr. Stavropoulos is an operating advisor to Clayton, Dubilier & Rice, LLC (private equity investment). In addition, Mr. Stavropoulos is a member of the University of Notre Dame Advisory Council for the College of Science, a Trustee of the Rollin L. Gerstacker Foundation, and a Director of the Naples Philharmonic Center for the Arts. Previously, Mr. Stavropoulos served as a Director of Chemical Financial Corporation (bank holding company, 1993-2012) and Tyco International, Ltd. (multinational manufacturing and services, 2007-2012).
David M. Thomas (1949)
Year of Election or Appointment: 2008
Trustee
Mr. Thomas also serves as Trustee of other Fidelity® funds. Mr. Thomas serves as Non-Executive Chairman of the Board of Directors of Fortune Brands Home and Security (home and security products, 2011-present), as a member of the Board of Directors (2004-present) and Presiding Director (2013-present) of Interpublic Group of Companies, Inc. (marketing communication), and as a member of the Board of Trustees of the University of Florida (2013-present). Previously, Mr. Thomas served as Executive Chairman (2005-2006) and Chairman and Chief Executive Officer (2000-2005) of IMS Health, Inc. (pharmaceutical and healthcare information solutions), and a Director of Fortune Brands, Inc. (consumer products, 2000-2011).
+ The information includes the Trustee's principal occupation during the last five years and other information relating to the experience, attributes, and skills relevant to the Trustee's qualifications to serve as a Trustee, which led to the conclusion that the Trustee should serve as a Trustee for the fund.
Advisory Board Members and Officers:
Correspondence intended for an officer or Peter S. Lynch may be sent to Fidelity Investments, 245 Summer Street, Boston, Massachusetts 02210. Officers appear below in alphabetical order.
Name, Year of Birth; Principal Occupation
Peter S. Lynch (1944)
Year of Election or Appointment: 2003
Member of the Advisory Board
Mr. Lynch also serves as Member of the Advisory Board of other Fidelity® funds. Mr. Lynch is Vice Chairman and a Director of FMR (investment adviser firm) and FMR Co., Inc. (investment adviser firm). In addition, Mr. Lynch serves as a Trustee of Boston College and as the Chairman of the Inner-City Scholarship Fund. Previously, Mr. Lynch served on the Special Olympics International Board of Directors (1997-2006).
Elizabeth Paige Baumann (1968)
Year of Election or Appointment: 2012
Anti-Money Laundering (AML) Officer
Ms. Baumann also serves as AML Officer of other funds. She is Chief AML Officer of FMR LLC (diversified financial services company, 2012-present) and is an employee of Fidelity Investments. Previously, Ms. Baumann served as Vice President and Deputy Anti-Money Laundering Officer (2007-2012).
Marc R. Bryant (1966)
Year of Election or Appointment: 2015
Secretary and Chief Legal Officer (CLO)
Mr. Bryant also serves as Secretary and CLO of other funds. Mr. Bryant serves as CLO, Secretary, and Senior Vice President of Fidelity Management & Research Company (investment adviser firm, 2015-present) and FMR Co., Inc. (investment adviser firm, 2015-present); Secretary of Fidelity SelectCo, LLC (investment adviser firm, 2015-present) and Fidelity Investments Money Management, Inc. (investment adviser firm, 2015-present); and CLO of Fidelity Management & Research (Hong Kong) Limited (investment adviser firm, 2015-present). He is Senior Vice President and Deputy General Counsel of FMR LLC (diversified financial services company). Previously, Mr. Bryant served as Secretary and Chief Legal Officer of Fidelity Rutland Square Trust II (2010-2014) and Assistant Secretary of Fidelity's Fixed Income and Asset Allocation Funds (2013-2015). Prior to joining Fidelity Investments, Mr. Bryant served as a Senior Vice President and the Head of Global Retail Legal for AllianceBernstein L.P. (2006-2010), and as the General Counsel for ProFund Advisors LLC (2001-2006).
Timothy M. Cohen (1969)
Year of Election or Appointment: 2014
Vice President of certain Equity Funds
Mr. Cohen also serves as Vice President of other funds. Mr. Cohen serves as Chief Compliance Officer of FMR Investment Management (U.K.) Limited (investment adviser firm, 2013-present) and is an employee of Fidelity Investments. Previously, Mr. Cohen served as a Director of FMR Investment Management (U.K.) Limited (2013-2015).
William C. Coffey (1969)
Year of Election or Appointment: 2009
Assistant Secretary
Mr. Coffey also serves as Assistant Secretary of other funds. He is Senior Vice President and Deputy General Counsel of FMR LLC (diversified financial services company, 2010-present), and is an employee of Fidelity Investments. Previously, Mr. Coffey served as Vice President and Associate General Counsel of FMR LLC (2005-2009).
Jonathan Davis (1968)
Year of Election or Appointment: 2010
Assistant Treasurer
Mr. Davis also serves as Assistant Treasurer of other funds, and is an employee of Fidelity Investments. Previously, Mr. Davis served as Vice President and Associate General Counsel of FMR LLC (diversified financial services company, 2003-2010).
Adrien E. Deberghes (1967)
Year of Election or Appointment: 2008
Deputy Treasurer
Mr. Deberghes also serves as an officer of other funds. He is an employee of Fidelity Investments (2008-present). Prior to joining Fidelity Investments, Mr. Deberghes was Senior Vice President of Mutual Fund Administration at State Street Corporation (2007-2008), Senior Director of Mutual Fund Administration at Investors Bank & Trust (2005-2007), and Director of Finance for Dunkin' Brands (2000-2005).
Stephanie J. Dorsey (1969)
Year of Election or Appointment: 2010
Assistant Treasurer
Ms. Dorsey also serves as an officer of other funds. She is an employee of Fidelity Investments (2008-present) and has served in other fund officer roles. Prior to joining Fidelity Investments, Ms. Dorsey served as Treasurer (2004-2008) of the JPMorgan Mutual Funds and Vice President (2004-2008) of JPMorgan Chase Bank.
Howard J. Galligan III (1966)
Year of Election or Appointment: 2014
Chief Financial Officer
Mr. Galligan also serves as Chief Financial Officer of other funds. Mr. Galligan serves as President of Fidelity Pricing and Cash Management Services (FPCMS) (2014-present) and as a Director of Strategic Advisers, Inc. (investment adviser firm, 2008-present). Previously, Mr. Galligan served as Chief Administrative Officer of Asset Management (2011-2014) and Chief Operating Officer and Senior Vice President of Investment Support for Strategic Advisers, Inc. (2003-2011).
Scott C. Goebel (1968)
Year of Election or Appointment: 2015
Vice President
Mr. Goebel serves as Vice President of other funds and is an employee of Fidelity Investments (2001-present). Previously, Mr. Goebel served as Secretary of Fidelity SelectCo, LLC (investment adviser firm, 2013-2015), Fidelity Investments Money Management, Inc. (FIMM) (investment adviser firm, 2010-2015), and Fidelity Research and Analysis Company (FRAC) (investment adviser firm, 2010-2015); General Counsel, Secretary, and Senior Vice President of Fidelity Management & Research Company (investment adviser firm, 2008-2015) and FMR Co., Inc. (investment adviser firm, 2008-2015); Assistant Secretary of Fidelity Management & Research (Japan) Limited (investment adviser firm, 2008-2015) and FMR Investment Management (U.K.) Limited (investment adviser firm, 2008-2015); Chief Legal Officer (CLO) of Fidelity Management & Research (Hong Kong) Limited (investment adviser firm, 2008-2015); Secretary and CLO of certain Fidelity® funds (2008-2015); Assistant Secretary of FIMM (2008-2010), FRAC (2008-2010), and certain funds (2007-2008); and as Vice President and Secretary of Fidelity Distributors Corporation (FDC) (2005-2007).
Brian B. Hogan (1964)
Year of Election or Appointment: 2009
Vice President
Mr. Hogan also serves as Trustee or Vice President of other funds. Mr. Hogan serves as a Director of Fidelity SelectCo, LLC (investment adviser firm, 2014-present) and President of the Equity Division of FMR (investment adviser firm, 2009-present). Previously, Mr. Hogan served as Senior Vice President, Equity Research of FMR (2006-2009) and as a portfolio manager.
Chris Maher (1972)
Year of Election or Appointment: 2013
Assistant Treasurer
Mr. Maher serves as Assistant Treasurer of other funds. Mr. Maher is Vice President of Valuation Oversight and is an employee of Fidelity Investments. Previously, Mr. Maher served as Vice President of Asset Management Compliance (2013), Vice President of the Program Management Group of FMR (investment adviser firm, 2010-2013), and Vice President of Valuation Oversight (2008-2010).
Kenneth B. Robins (1969)
Year of Election or Appointment: 2008
President and Treasurer
Mr. Robins also serves as an officer of other funds. Mr. Robins serves as Executive Vice President of Fidelity Investments Money Management, Inc. (FIMM) (investment adviser firm, 2013-present) and is an employee of Fidelity Investments (2004-present). Previously, Mr. Robins served in other fund officer roles.
Stacie M. Smith (1974)
Year of Election or Appointment: 2013
Deputy Treasurer
Ms. Smith also serves as an officer of other funds. She is an employee of Fidelity Investments (2009-present) and has served in other fund officer roles. Prior to joining Fidelity Investments, Ms. Smith served as Senior Audit Manager of Ernst & Young LLP (1996-2009).
Renee Stagnone (1975)
Year of Election or Appointment: 2013
Deputy Treasurer
Ms. Stagnone also serves as Deputy Treasurer of other funds. Ms. Stagnone is an employee of Fidelity Investments (1997-present).
Linda J. Wondrack (1964)
Year of Election or Appointment: 2014
Chief Compliance Officer
Ms. Wondrack also serves as Chief Compliance Officer of other funds. Ms. Wondrack is Executive Vice President and head of the Ethics Office and Asset Management Compliance for Fidelity Investments (2012-present). Ms. Wondrack also serves as Chief Compliance Officer of Fidelity SelectCo, LLC (investment adviser firm, 2014-present); Chief Compliance Officer of Impresa Management LLC (2013-present); and Chief Compliance Officer of FMR Co., Inc. (investment adviser firm), Fidelity Investments Money Management, Inc. (investment adviser firm), Fidelity Management & Research (Japan) Limited (investment adviser firm), FMR Investment Management (U.K.) Limited (investment adviser firm), Fidelity Management & Research (Hong Kong) (investment adviser firm), Fidelity Management & Research Company (investment adviser firm), FIAM LLC (investment adviser firm), and Strategic Advisers, Inc. (investment adviser firm), Ballyrock Investment Advisors LLC, and Northern Neck Investors LLC (2012-present). Previously, Ms. Wondrack served as Senior Vice President and Chief Compliance Officer for Columbia Management Investment Advisers, LLC (2005-2012); Chief Compliance Officer for certain funds within the Columbia Family of Funds (2007-2012); and Senior Vice President of Compliance Risk Management at Bank of America (2005-2010).
Joseph F. Zambello (1957)
Year of Election or Appointment: 2011
Deputy Treasurer
Mr. Zambello also serves as Deputy Treasurer of other funds. Mr. Zambello is an employee of Fidelity Investments (1991-present). Previously, Mr. Zambello served as Vice President of the Program Management Group of FMR (investment adviser firm, 2009-2011) and Vice President of the Transfer Agent Oversight Group (2005-2009).
Shareholder Expense Example
As a shareholder of the Fund, you incur two types of costs: (1) transaction costs, including sales charges (loads) on purchase payments or redemption proceeds, redemption fees and (2) ongoing costs, including management fees, distribution and/or service (12b-1) fees and other Fund expenses. This Example is intended to help you understand your ongoing costs (in dollars) of investing in the Fund and to compare these costs with the ongoing costs of investing in other mutual funds.
The Example is based on an investment of $1,000 invested at the beginning of the period and held for the entire period (May 1, 2015 to October 31, 2015).
Actual Expenses
The first line of the accompanying table for each class of the Fund provides information about actual account values and actual expenses. You may use the information in this line, together with the amount you invested, to estimate the expenses that you paid over the period. Simply divide your account value by $1,000.00 (for example, an $8,600 account value divided by $1,000.00 = 8.6), then multiply the result by the number in the first line for a class of the Fund under the heading entitled "Expenses Paid During Period" to estimate the expenses you paid on your account during this period. In addition, the Fund, as a shareholder in the underlying Fidelity Central Funds, will indirectly bear its pro-rata share of the fees and expenses incurred by the underlying Fidelity Central Funds. These fees and expenses are not included in the Fund's annualized expense ratio used to calculate the expense estimate in the table below.
Hypothetical Example for Comparison Purposes
The second line of the accompanying table for each class of the Fund provides information about hypothetical account values and hypothetical expenses based on a Class' actual expense ratio and an assumed rate of return of 5% per year before expenses, which is not the Class' actual return. The hypothetical account values and expenses may not be used to estimate the actual ending account balance or expenses you paid for the period. You may use this information to compare the ongoing costs of investing in the Fund and other funds. To do so, compare this 5% hypothetical example with the 5% hypothetical examples that appear in the shareholder reports of the other funds. In addition, the Fund, as a shareholder in the underlying Fidelity Central Funds, will indirectly bear its pro-rata share of the fees and expenses incurred by the underlying Fidelity Central Funds. These fees and expenses are not included in the Fund's annualized expense ratio used to calculate the expense estimate in the table below.
Please note that the expenses shown in the table are meant to highlight your ongoing costs only and do not reflect any transaction costs. Therefore, the second line of the table is useful in comparing ongoing costs only, and will not help you determine the relative total costs of owning different funds. In addition, if these transactional costs were included, your costs would have been higher.
| | Annualized Expense Ratio-A | Beginning
Account Value
May 1, 2015 | Ending
Account Value
October 31, 2015 | Expenses Paid
During Period-B
May 1, 2015
to October 31, 2015 |
| Class A | 1.36% | | | |
| Actual | | $1,000.00 | $838.40 | $6.30 |
| Hypothetical-C | | $1,000.00 | $1,018.35 | $6.92 |
| Class T | 1.66% | | | |
| Actual | | $1,000.00 | $837.00 | $7.69 |
| Hypothetical-C | | $1,000.00 | $1,016.84 | $8.44 |
| Class B | 2.16% | | | |
| Actual | | $1,000.00 | $835.20 | $9.99 |
| Hypothetical-C | | $1,000.00 | $1,014.32 | $10.97 |
| Class C | 2.10% | | | |
| Actual | | $1,000.00 | $835.30 | $9.71 |
| Hypothetical-C | | $1,000.00 | $1,014.62 | $10.66 |
| Class I | 1.06% | | | |
| Actual | | $1,000.00 | $839.60 | $4.92 |
| Hypothetical-C | | $1,000.00 | $1,019.86 | $5.40 |
A Annualized expense ratio reflects expenses net of applicable fee waivers.
B Expenses are equal to each Class' annualized expense ratio, multiplied by the average account value over the period, multiplied by 184/365 (to reflect the one-half year period).
C 5% return per year before expenses
Distributions (Unaudited)
The Board of Trustees of Advisor Emerging Asia Fund voted to pay to shareholders of record at the opening of business on record date, the following distributions per share derived from capital gains realized from sales of portfolio securities, and dividends derived from net investment income:
| | Pay Date | Record Date | Dividends | Capital Gains |
| Class A | 12/07/15 | 12/04/15 | $ 0.2200 | $ 0.2300 |
| Class T | 12/07/15 | 12/04/15 | $ 0.1290 | $ 0.2300 |
| Class B | 12/07/15 | 12/04/15 | $ 0.0000 | $ 0.2300 |
| Class C | 12/07/15 | 12/04/15 | $ 0.0080 | $ 0.2300 |
The fund hereby designates as a capital gain dividend with respect to the taxable year ended October 31, 2015, $4,093,314 or, if subsequently determined to be different, the net capital gain of such year.
Class A designates 1%, Class T designates 1%, Class B designates 0%, and Class C designates 1% of the dividends distributed in December 2014, respectively during the fiscal year as qualifying for the dividends-received deduction for corporate shareholders.
Class A designates 99%, Class T designates 100%, Class B designates 0%, and Class C designates 100% of the dividends distributed during the fiscal year as amounts which may be taken into account as a dividend for purposes of the maximum rate under section 1(h)(11) of the Internal Revenue Code.
The amounts per share which represent income derived from sources within, and taxes paid to, foreign countries or possessions of the United States are as follows:
| | Pay Date | Income | Taxes |
| Class A | 12/08/14 | $ 0.4939 | $ 0.1569 |
| Class T | 12/08/14 | $ 0.3889 | $ 0.1569 |
| Class B | 12/08/14 | $ 0.0000 | $ 0.0000 |
| Class C | 12/08/14 | $ 0.2539 | $ 0.1569 |
The fund will notify shareholders in January 2016 of amounts for use in preparing 2015 income tax returns.
Board Approval of Investment Advisory Contracts and Management Fees
Fidelity Advisor Emerging Asia Fund
Each year, the Board of Trustees, including the Independent Trustees (together, the Board), votes on the renewal of the management contract with Fidelity Management & Research Company (FMR) and the sub-advisory agreements (together, the Advisory Contracts) for the fund. The Board, assisted by the advice of fund counsel and Independent Trustees' counsel, requests and considers a broad range of information relevant to the renewal of the Advisory Contracts throughout the year.
The Board meets regularly and, at each of its meetings, covers an extensive agenda of topics and materials and considers factors that are relevant to its annual consideration of the renewal of the fund's Advisory Contracts, including the services and support provided to the fund and its shareholders. The Board has established various standing committees (Committees), each composed of and chaired by Independent Trustees with varying backgrounds, to which the Board has assigned specific subject matter responsibilities in order to enhance effective decision-making by the Board. The Board, acting directly and through its Committees, requests and receives information concerning the annual consideration of the renewal of the fund's Advisory Contracts. The Board also meets as needed to consider matters specifically related to the Board's annual consideration of the renewal of the Advisory Contracts. Members of the Board may also meet with trustees of other Fidelity funds through ad hoc joint committees to discuss certain matters relevant to all of the Fidelity funds.
At its July 2015 meeting, the Board unanimously determined to renew the fund's Advisory Contracts. In reaching its determination, the Board considered all factors it believed relevant, including (i) the nature, extent, and quality of the services to be provided to the fund and its shareholders (including the investment performance of the fund); (ii) the competitiveness of the fund's management fee and total expense ratio relative to peer funds; (iii) the total costs of the services to be provided by and the profits to be realized by Fidelity from its relationship with the fund; and (iv) the extent to which (if any) economies of scale exist and would be realized as the fund grows, and whether any economies of scale are appropriately shared with fund shareholders.
In considering whether to renew the Advisory Contracts for the fund, the Board reached a determination, with the assistance of fund counsel and Independent Trustees' counsel and through the exercise of its business judgment, that the renewal of the Advisory Contracts was in the best interests of the fund and its shareholders and that the compensation payable under the Advisory Contracts was fair and reasonable. The Board's decision to renew the Advisory Contracts was not based on any single factor, but rather was based on a comprehensive consideration of all the information provided to the Board at its meetings throughout the year. The Board, in reaching its determination to renew the Advisory Contracts, was aware that shareholders of the fund have a broad range of investment choices available to them, including a wide choice among funds offered by Fidelity's competitors, and that the fund's shareholders, who have the opportunity to review and weigh the disclosure provided by the fund in its prospectus and other public disclosures, have chosen to invest in this fund, which is part of the Fidelity family of funds.
Nature, Extent, and Quality of Services Provided. The Board considered Fidelity's staffing as it relates to the fund, including the backgrounds of investment personnel of Fidelity, and also considered the fund's investment objective, strategies, and related investment philosophy. The Independent Trustees also had discussions with senior management of Fidelity's investment operations and investment groups. The Board considered the structure of the portfolio manager compensation program and whether this structure provides appropriate incentives to act in the best interests of the fund. Additionally, the Board considered the portfolio managers' investments, if any, in the funds that they manage.
Resources Dedicated to Investment Management and Support Services. The Board and the Fund Oversight and Research Committees reviewed the general qualifications and capabilities of Fidelity's investment staff, including its size, education, experience, and resources, as well as Fidelity's approach to recruiting, training, managing, and compensating investment personnel. The Board noted that Fidelity has continued to increase the resources devoted to non-U.S. offices, including expansion of Fidelity's global investment organization. The Board also noted that Fidelity's analysts have extensive resources, tools and capabilities that allow them to conduct sophisticated quantitative and fundamental analysis, as well as credit analysis of issuers, counterparties and guarantors. Further, the Board considered that Fidelity's investment professionals have sufficient access to global information and data so as to provide competitive investment results over time, and that those professionals also have access to sophisticated tools that permit them to assess portfolio construction and risk and performance attribution characteristics continuously, as well as to transmit new information and research conclusions rapidly around the world. Additionally, in its deliberations, the Board considered Fidelity's trading, risk management, and compliance capabilities and resources, which are integral parts of the investment management process.
Shareholder and Administrative Services. The Board considered (i) the nature, extent, quality, and cost of advisory, administrative, and shareholder services performed by FMR, the sub-advisers (together with FMR, the Investment Advisers), and their affiliates under the Advisory Contracts and under separate agreements covering transfer agency, pricing and bookkeeping, and securities lending services for the fund; (ii) the nature and extent of the supervision of third party service providers, principally custodians and subcustodians; and (iii) the resources devoted to, and the record of compliance with, the fund's compliance policies and procedures. The Board also reviewed the allocation of fund brokerage, including allocations to brokers affiliated with the Investment Advisers, the use of brokerage commissions to pay fund expenses, and the use of "soft" commission dollars to pay for research services.
The Board noted that the growth of fund assets over time across the complex allows Fidelity to reinvest in the development of services designed to enhance the value or convenience of the Fidelity funds as investment vehicles. These services include 24-hour access to account information and market information through telephone representatives and over the Internet, investor education materials and asset allocation tools, and the expanded availability of Fidelity Investor Centers.
In 2014, the Board formed an ad hoc Committee on Transfer Agency Fees to review the variety of transfer agency fee structures throughout the industry and Fidelity's competitive positioning with respect to industry participants.
Investment in a Large Fund Family. The Board considered the benefits to shareholders of investing in a Fidelity fund, including the benefits of investing in a fund that is part of a large family of funds offering a variety of investment disciplines and providing a large variety of mutual fund investor services. The Board noted that Fidelity had taken, or had made recommendations that resulted in the Fidelity funds taking, a number of actions over the previous year that benefited particular funds, including (i) continuing to dedicate additional resources to investment research and to the support of the senior management team that oversees asset management; (ii) continuing efforts to enhance Fidelity's global research capabilities; (iii) launching new funds and making other enhancements to meet client needs; (iv) reducing management fees and total expenses for certain index funds and diversified international funds; (v) continuing to launch dedicated lower cost underlying funds to meet portfolio construction needs related to expanding underlying fund options for Fidelity funds of funds, specifically for the Freedom Fund product lines; (vi) rationalizing product lines and gaining increased efficiencies through fund mergers; (vii) launching active fixed-income exchange-traded funds; (viii) continuing to develop, acquire and implement systems and technology to improve services to the funds and information security and to increase efficiency; (ix) implementing investment enhancements to further strengthen Fidelity's target date product line to increase investors' probability of success in achieving their goals; (x) modifying the eligibility criteria for certain share classes to accommodate roll-over assets from employer-sponsored retirement plans; (xi) launching a new Class W of the Freedom Index Funds to attract and retain Fidelity record-kept retirement plan assets; and (xii) implementing changes to Fidelity's money market product line in response to recent money market regulatory reforms.
Investment Performance. The Board considered whether the fund has operated in accordance with its investment objective, as well as its record of compliance with its investment restrictions and its performance history.
The Board took into account discussions with representatives of the Investment Advisers about fund investment performance that occur at Board meetings throughout the year. In this regard the Board noted that as part of regularly scheduled fund reviews and other reports to the Board on fund performance, the Board considers annualized return information for the fund, for different time periods, measured against a securities market index ("benchmark index") and a peer group of funds with similar objectives ("peer group"), if any. In its evaluation of fund investment performance, the Board gave particular attention to information indicating changes in performance of certain Fidelity funds for specific time periods and discussed with the Investment Advisers the reasons for any overperformance or underperformance.
In addition to reviewing absolute and relative fund performance, the Independent Trustees periodically consider the appropriateness of fund performance metrics in evaluating the results achieved. In general, the Independent Trustees believe that fund performance should be evaluated based on net performance (after fees and expenses) of both the highest performing and lowest performing fund share classes, where applicable, compared to appropriate benchmark indices, over appropriate time periods that may include full market cycles, and compared to peer groups, as applicable, over the same periods, taking into account relevant factors including the following: general market conditions; issuer-specific information; and fund cash flows and other factors.
The Independent Trustees recognize that shareholders evaluate performance on a net basis over their own holding periods, for which one-, three-, and five-year periods are often used as a proxy. For this reason, the performance information reviewed by the Board also included net cumulative calendar year total return information for the fund and an appropriate benchmark index for the most recent one-, three-, and five-year periods, as shown below. A peer group is not shown below because the fund does not generally utilize a peer group for performance comparison purposes. Returns of the benchmark index are "net MA,"
i.e., adjusted for tax withholding rates applicable to U.S.-based funds organized as Massachusetts business trusts.
Fidelity Advisor Emerging Asia Fund
Based on its review, the Board concluded that the nature, extent, and quality of services provided to the fund under the Advisory Contracts should benefit the shareholders of the fund.
Competitiveness of Management Fee and Total Expense Ratio. The Board considered the fund's management fee and total expense ratio compared to "mapped groups" of competitive funds and classes created for the purpose of facilitating the Trustees' competitive analysis of management fees and total expenses. Fidelity creates "mapped groups" by combining similar Lipper investment objective categories that have comparable investment mandates. Combining Lipper investment objective categories aids the Board's management fee and total expense ratio comparisons by broadening the competitive group used for comparison.
Management Fee. The Board considered two proprietary management fee comparisons for the 12-month periods shown in basis points (BP) in the chart below. The group of Lipper funds used by the Board for management fee comparisons is referred to below as the "Total Mapped Group." The Total Mapped Group comparison focuses on a fund's standing in terms of gross management fees before expense reimbursements or caps relative to the total universe of funds with comparable investment mandates, regardless of whether their management fee structures also are comparable. Funds with comparable investment mandates offer exposure to similar types of securities. Funds with comparable management fee structures have similar management fee contractual arrangements (
e.g., flat rate charged for advisory services, all-inclusive fee rate,
etc.). "TMG %" represents the percentage of funds in the Total Mapped Group that had management fees that were lower than the fund's. For example, a hypothetical TMG % of 20% would mean that 80% of the funds in the Total Mapped Group had higher, and 20% had lower, management fees than the fund. The fund's actual TMG %s and the number of funds in the Total Mapped Group are in the chart below. The "Asset-Size Peer Group" (ASPG) comparison focuses on a fund's standing relative to a subset of non-Fidelity funds within the Total Mapped Group that are similar in size and management fee structure without taking into account performance adjustments, if any. For example, if a fund is in the first quartile of the ASPG, the fund's management fee ranks in the least expensive or lowest 25% of funds in the ASPG. The ASPG represents at least 15% of the funds in the Total Mapped Group with comparable asset size and management fee structures, subject to a minimum of 50 funds (or all funds in the Total Mapped Group if fewer than 50). Additional information, such as the ASPG quartile in which the fund's management fee rate ranked, is also included in the chart and considered by the Board.
Fidelity Advisor Emerging Asia Fund
The Board noted that the fund's management fee rate ranked below the median of its Total Mapped Group and below the median of its ASPG for 2014.
The Board noted that, in 2014, the ad hoc Committee on Group Fee was formed by it and other Fidelity fund boards to conduct an in-depth review of the "group fee" component of the management fee of funds with such management fee structures. Committee focus included the mechanics of the group fee, the competitive landscape of group fee structures, Fidelity funds with no group fee component and investment products not included in group fee assets. The Board also considered that, for funds subject to the group fee, FMR agreed to voluntarily waive fees over a specified period of time in amounts designed to account for assets converted from certain funds to certain collective investment trusts.
The Board also noted that, in 2013, the ad hoc Committee on Management Fees was formed to conduct an in-depth review of the management fee rates of Fidelity's active equity mutual funds. The Committee focused on the following areas: (i) standard fee structures; (ii) research consumption and trading evolution; (iii) management fee competitiveness/profitability by category; and (iv) factors that drive institutional pricing.
Based on its review, the Board concluded that the fund's management fee is fair and reasonable in light of the services that the fund receives and the other factors considered.
Total Expense Ratio. In its review of each class's total expense ratio, the Board considered the fund's management fee as well as other fund or class expenses, as applicable, such as transfer agent fees, pricing and bookkeeping fees, fund-paid 12b-1 fees, and custodial, legal, and audit fees. The Board also noted that Fidelity may agree to waive fees and expenses from time to time, and the extent to which, if any, it has done so for the fund. As part of its review, the Board also considered the current and historical total expense ratios of each class of the fund compared to competitive fund median expenses. Each class of the fund is compared to those funds and classes in the Total Mapped Group (used by the Board for management fee comparisons) that have a similar sales load structure.
The Board noted that the total expense ratio of each of Class A, Class B, Class C, and Class I ranked below its competitive median for 2014 and the total expense ratio of Class T ranked above its competitive median for 2014. The Board considered that, in general, various factors can affect total expense ratios. The Board noted that the total expense ratio of Class T was above the competitive median primarily because of higher 12b-1 fees on Class T as compared to most competitor funds. Class T has a higher 12b-1 fee, but a lower front-end sales charge, than traditionally priced front-end sales charge classes. The Board considered that Class T is primarily sold load-waived in the retirement plan market where its 0.50% 12b-1 fee is comparable to competing no-load, higher 12b-1 fee classes designed specifically for retirement plans. The Board noted that the fund offers multiple classes, each of which has a different sales load and 12b-1 fee structure, and that the multiple structures are intended to offer a range of pricing options for the intermediary market. The Board also noted that the total expense ratios of the classes vary primarily by the level of their 12b-1 fees, although differences in transfer agent fees may also cause expenses to vary from class to class.
Fees Charged to Other Fidelity Clients. The Board also considered Fidelity fee structures and other information with respect to clients of Fidelity, such as other funds advised or subadvised by Fidelity, pension plan clients, and other institutional clients with similar mandates. The Board noted the findings of the 2013 ad hoc joint committee (created with the board of other Fidelity funds), which reviewed and compared Fidelity's institutional investment advisory business with its business of providing services to the Fidelity funds, including the differences in services provided, fees charged, and costs incurred, as well as competition in their respective marketplaces.
Based on its review of total expense ratios and fees charged to other Fidelity clients, the Board concluded that, although Class T was above the median of the universe presented for comparison, the total expense ratio of each class of the fund was reasonable in light of the services that the fund and its shareholders receive and the other factors considered.
Costs of the Services and Profitability. The Board considered the revenues earned and the expenses incurred by Fidelity in conducting the business of developing, marketing, distributing, managing, administering and servicing the fund and servicing the fund's shareholders. The Board also considered the level of Fidelity's profits in respect of all the Fidelity funds.
On an annual basis, Fidelity presents to the Board information about the profitability of its relationship with the fund. Fidelity calculates profitability information for each fund, as well as aggregate profitability information for groups of Fidelity funds and all Fidelity funds, using a series of detailed revenue and cost allocation methodologies which originate with the books and records of Fidelity on which Fidelity's audited financial statements are based. The Audit Committee of the Board reviews any significant changes from the prior year's methodologies.
PricewaterhouseCoopers LLP (PwC), independent registered public accounting firm and auditor to Fidelity and certain Fidelity funds, has been engaged annually by the Board as part of the Board's assessment of Fidelity's profitability analysis. PwC's engagement includes the review and assessment of the methodologies used by Fidelity in determining the revenues and expenses attributable to Fidelity's mutual fund business, and completion of agreed-upon procedures in respect of the mathematical accuracy of fund profitability and its conformity to established allocation methodologies. After considering PwC's reports issued under the engagement and information provided by Fidelity, the Board concluded that while other allocation methods may also be reasonable, Fidelity's profitability methodologies are reasonable in all material respects.
The Board also reviewed Fidelity's non-fund businesses and fall-out benefits related to the mutual fund business as well as cases where Fidelity's affiliates may benefit from or be related to the fund's business.
The Board considered the costs of the services provided by and the profits realized by Fidelity in connection with the operation of the fund and was satisfied that the profitability was not excessive.
Economies of Scale. The Board considered whether there have been economies of scale in respect of the management of the Fidelity funds, whether the Fidelity funds (including the fund) have appropriately benefited from any such economies of scale, and whether there is potential for realization of any further economies of scale. The Board considered the extent to which the fund will benefit from economies of scale as assets grow through increased services to the fund, through waivers or reimbursements, or through fee or expense ratio reductions. The Board also noted that in 2013, it and the boards of other Fidelity funds created an ad hoc committee (the Economies of Scale Committee) to analyze whether Fidelity attains economies of scale in respect of the management and servicing of the Fidelity funds, whether the Fidelity funds have appropriately benefited from such economies of scale, and whether there is potential for realization of any further economies of scale.
The Board recognized that the fund's management contract incorporates a "group fee" structure, which provides for lower group fee rates as total group assets increase, and for higher group fee rates as total group assets decrease (with "group assets" defined to include fund assets under FMR's management plus sector fund assets previously under FMR's management and currently managed by Fidelity SelectCo, LLC). FMR calculates the group fee rates based on a tiered asset "breakpoint" schedule that varies based on asset class. The Board considered that the group fee is designed to deliver the benefits of economies of scale to fund shareholders when total Fidelity fund assets increase, even if assets of any particular fund are unchanged or have declined, because some portion of Fidelity's costs are attributable to services provided to all Fidelity funds, and all funds benefit if those costs can be allocated among more assets. The Board concluded that, given the group fee structure, fund shareholders will benefit from lower management fees as group assets increase at the fund complex level, regardless of whether Fidelity achieves any such economies of scale.
The Board concluded, taking into account the analysis of the Economies of Scale Committee, that economies of scale, if any, are being appropriately shared between fund shareholders and Fidelity.
Additional Information Requested by the Board. In order to develop fully the factual basis for consideration of the Fidelity funds' Advisory Contracts, the Board requested and received additional information on certain topics, including: (i) fund performance trends and Fidelity's long-term strategies for certain funds; (ii) the various share classes employed by Fidelity and the attributes of each class, together with similar information on the distribution and servicing payments made by Fidelity or the funds to third-party participants in the distribution channels; (iii) fund profitability, and fund performance in relation to fund profitability; (iv) the methodology with respect to evaluating competitive fund data and peer group classifications and fee comparisons; (v) annual fund profitability margins, with particular focus on certain funds with negative margins; (vi) the realization of fall-out benefits in certain Fidelity business units;
(vii) economies of scale and the way in which they are shared with fund shareholders;(viii) Fidelity's group fee structures, including the group fee schedule of breakpoints;(ix) the impact of cost containment measures on the funds; and (x) the transfer agent fee structure.
Based on its evaluation of all of the conclusions noted above, and after considering all factors it believed relevant, the Board concluded that the advisory fee structures are fair and reasonable, and that the fund's Advisory Contracts should be renewed.
AEA-ANN-1215
1.703376.118
Fidelity Advisor® Emerging Asia Fund Class I (formerly Institutional Class)
Annual Report October 31, 2015 |
|
Contents
To view a fund's proxy voting guidelines and proxy voting record for the 12-month period ended June 30, visit http://www.fidelity.com/proxyvotingresults or visit the Securities and Exchange Commission's (SEC) web site at http://www.sec.gov.
You may also call 1-877-208-0098 to request a free copy of the proxy voting guidelines.
Standard & Poor's, S&P and S&P 500 are registered service marks of The McGraw-Hill Companies, Inc. and have been licensed for use by Fidelity Distributors Corporation.
Other third-party marks appearing herein are the property of their respective owners.
All other marks appearing herein are registered or unregistered trademarks or service marks of FMR LLC or an affiliated company. © 2015 FMR LLC. All rights reserved.
This report and the financial statements contained herein are submitted for the general information of the shareholders of the Fund. This report is not authorized for distribution to prospective investors in the Fund unless preceded or accompanied by an effective prospectus.
A fund files its complete schedule of portfolio holdings with the SEC for the first and third quarters of each fiscal year on Form N-Q. Forms N-Q are available on the SEC’s web site at http://www.sec.gov. A fund's Forms N-Q may be reviewed and copied at the SEC’s Public Reference Room in Washington, DC. Information regarding the operation of the SEC's Public Reference Room may be obtained by calling 1-800-SEC-0330.
For a complete list of a fund's portfolio holdings, view the most recent holdings listing, semiannual report, or annual report on Fidelity's web site at http://www.fidelity.com, http://www.advisor.fidelity.com, or http://www.401k.com, as applicable.
NOT FDIC INSURED •MAY LOSE VALUE •NO BANK GUARANTEE
Neither the Fund nor Fidelity Distributors Corporation is a bank.
Performance: The Bottom Line
Average annual total return reflects the change in the value of an investment, assuming reinvestment of distributions from dividend income and capital gains (the profits earned upon the sale of securities that have grown in value, if any) and assuming a constant rate of performance each year.
The hypothetical investment and the average annual total returns do not reflect the deduction of taxes that a shareholder would pay on fund distributions or the redemption of fund shares.
During periods of reimbursement by Fidelity, a fund’s total return will be greater than it would be had the reimbursement not occurred.
How a fund did yesterday is no guarantee of how it will do tomorrow.
Average Annual Total Returns
| For the periods ended October 31, 2015 | Past 1 year | Past 5 years | Past 10 years |
| Class I | (4.47)% | 2.45% | 10.87% |
$10,000 Over 10 Years
Let's say hypothetically that $10,000 was invested in Fidelity Advisor® Emerging Asia Fund - Class I on October 31, 2005.
The chart shows how the value of your investment would have changed, and also shows how the MSCI AC (All Country) Asia ex Japan Index performed over the same period.
| Period Ending Values |
| $28,067 | Fidelity Advisor® Emerging Asia Fund - Class I |
| $21,884 | MSCI AC (All Country) Asia ex Japan Index |
Management's Discussion of Fund Performance
Market Recap: International equities suffered a moderate setback for the 12 months ending October 31, 2015, held back by a collapse in commodities prices that hurt resources-related sectors and geographies. The MSCI ACWI (All Country World Index) ex USA Index returned -4.55% for the period, affected also by concerns about global economic growth. Commodity producers remained under pressure for much of the past year, largely related to economic deceleration in China (-1%), the world’s second-largest economy and a leading consumer of raw materials. This effect was exacerbated by U.S. dollar strength relative to global currencies, which weighed on commodities priced in dollars and acutely impacted equity returns within regions most exposed to resources prices. The emerging-markets group, for example, returned about -15% this period. Canada, a significant energy producer, returned roughly -17%. Net energy consumer Japan (+9%) was the best-performing region by far. Only about a quarter of the nearly 50 index countries managed a gain this period: Ireland (+19%) – the EU’s fastest-growing economy – and Israel (+17%) proved top performers; Greece (-56%) and Brazil (-46%), among the worst. As for sectors, energy (-25%) and materials (-16%) declined sharply, whereas the two consumer sectors each gained about 6%.
Comments from Portfolio Manager Colin Chickles: For the year, the fund’s share classes (excluding sales charges, if applicable) recorded single-digit declines but handily outpaced the -7.22% return of the benchmark MSCI AC (All Country) Asia ex Japan Index. The fund’s relative performance was particularly bolstered by stock selection in industrials, consumer staples and information technology. Geographically, our picks in China, South Korea and Hong Kong were beneficial. The three biggest relative contributors were overweighted positions in China Railway Group, CRRC and China Communications Construction, three China-based companies with a strong presence in rail transportation. Given the huge gains in these positions, I sold the first two and considerably reduced our share count in China Communications Construction. Conversely, stock picking in utilities, materials and financials were negatives. From a country perspective, stock selection in Singapore detracted. At the stock level, the biggest relative detractor by a wide margin was Hong Kong Exchanges and Clearing, the company operating the stock exchange in that nation. The fund didn’t own this benchmark stock as it raced higher in April, but I built a position in May and sold it for a loss in July. Not owning strong-performing benchmark component CK Hutchison Holdings for most of the period also worked against us.
The views expressed above reflect those of the portfolio manager(s) only through the end of the period as stated on the cover of this report and do not necessarily represent the views of Fidelity or any other person in the Fidelity organization. Any such views are subject to change at any time based upon market or other conditions and Fidelity disclaims any responsibility to update such views. These views may not be relied on as investment advice and, because investment decisions for a Fidelity fund are based on numerous factors, may not be relied on as an indication of trading intent on behalf of any Fidelity fund.
Investment Summary (Unaudited)
Top Ten Stocks as of October 31, 2015
| | % of fund's net assets | % of fund's net assets 6 months ago |
| Samsung Electronics Co. Ltd. | 6.3 | 5.6 |
| Taiwan Semiconductor Manufacturing Co. Ltd. | 4.1 | 3.8 |
| Tencent Holdings Ltd. | 3.7 | 3.1 |
| AIA Group Ltd. | 2.9 | 2.6 |
| China Construction Bank Corp. (H Shares) | 2.7 | 2.6 |
| Industrial & Commercial Bank of China Ltd. (H Shares) | 1.9 | 2.0 |
| Hon Hai Precision Industry Co. Ltd. (Foxconn) | 1.9 | 1.5 |
| Ping An Insurance (Group) Co. of China Ltd. (H Shares) | 1.7 | 1.6 |
| China Mobile Ltd. | 1.6 | 1.1 |
| Bank of China Ltd. (H Shares) | 1.6 | 1.8 |
| | 28.4 | |
Top Five Market Sectors as of October 31, 2015
| | % of fund's net assets | % of fund's net assets 6 months ago |
| Financials | 35.3 | 32.8 |
| Information Technology | 22.1 | 20.7 |
| Consumer Discretionary | 9.0 | 10.6 |
| Telecommunication Services | 7.1 | 6.8 |
| Utilities | 6.3 | 5.2 |
Asset Allocation (% of fund's net assets)
| As of October 31, 2015 |
| | Stocks | 98.4% |
| | Short-Term Investments and Net Other Assets (Liabilities) | 1.6% |

| As of April 30, 2015 |
| | Stocks | 99.3% |
| | Short-Term Investments and Net Other Assets (Liabilities) | 0.7% |

Investments October 31, 2015
Showing Percentage of Net Assets
| Common Stocks - 98.4% | | | |
| | | Shares | Value |
| Australia - 0.1% | | | |
| Beacon Lighting Group Ltd. | | 122,049 | $156,140 |
| Sino Gas & Energy Ltd. (a) | | 1,335,338 | 82,192 |
|
| TOTAL AUSTRALIA | | | 238,332 |
|
| Bermuda - 2.3% | | | |
| Brilliance China Automotive Holdings Ltd. | | 648,000 | 898,545 |
| BW LPG Ltd. | | 9,210 | 62,544 |
| Cheung Kong Infrastructure Holdings Ltd. | | 106,000 | 983,360 |
| China Foods Ltd. (a) | | 692,000 | 315,598 |
| CSI Properties Ltd. | | 8,640,000 | 288,817 |
| Digital China Holdings Ltd. (H Shares) | | 484,000 | 493,796 |
| Hongkong Land Holdings Ltd. | | 182,700 | 1,369,920 |
| Joy City Property Ltd. | | 760,000 | 118,906 |
| Kerry Logistics Network Ltd. | | 454,000 | 675,257 |
| PAX Global Technology Ltd. | | 223,000 | 291,608 |
| Skyworth Digital Holdings Ltd. | | 1,095,448 | 810,718 |
|
| TOTAL BERMUDA | | | 6,309,069 |
|
| Cayman Islands - 12.9% | | | |
| 58.com, Inc. ADR (a) | | 15,800 | 829,342 |
| Alibaba Group Holding Ltd. sponsored ADR (a) | | 24,100 | 2,020,303 |
| AMVIG Holdings Ltd. | | 348,000 | 159,456 |
| Belle International Holdings Ltd. | | 713,000 | 692,064 |
| Changyou.com Ltd. (A Shares) ADR (a) | | 12,900 | 257,484 |
| Cheung Kong Property Holdings Ltd. | | 402,000 | 2,812,851 |
| China Modern Dairy Holdings Ltd. | | 2,062,000 | 620,250 |
| China Resources Cement Holdings Ltd. | | 2,809,972 | 1,133,935 |
| China Sanjiang Fine Chemicals Ltd. (a)(b) | | 1,845,000 | 388,919 |
| China State Construction International Holdings Ltd. | | 498,000 | 755,665 |
| ChinaCache International Holdings Ltd. sponsored ADR (a) | | 12,300 | 92,373 |
| CK Hutchison Holdings Ltd. | | 280,500 | 3,841,028 |
| Cosmo Lady (China) Holdings Co. Ltd. | | 380,000 | 377,409 |
| Ctrip.com International Ltd. sponsored ADR (a)(b) | | 9,200 | 855,324 |
| ENN Energy Holdings Ltd. | | 210,000 | 1,203,015 |
| Greatview Aseptic Pack Co. Ltd. | | 661,000 | 310,312 |
| iKang Healthcare Group, Inc. sponsored ADR (a) | | 8,900 | 137,594 |
| International Housewares Retail Co. Ltd. | | 1,909,000 | 398,452 |
| Ju Teng International Holdings Ltd. | | 796,000 | 435,321 |
| Lee's Pharmaceutical Holdings Ltd. | | 93,000 | 120,076 |
| Longfor Properties Co. Ltd. | | 1,043,500 | 1,398,133 |
| MGM China Holdings Ltd. | | 296,400 | 432,324 |
| New Oriental Education & Technology Group, Inc. sponsored ADR | | 14,800 | 407,148 |
| Pico Far East Holdings Ltd. | | 650,000 | 172,544 |
| Samson Holding Ltd. | | 1,152,000 | 145,402 |
| Sino Biopharmaceutical Ltd. | | 1,200,000 | 1,491,240 |
| SITC International Holdings Co. Ltd. | | 809,000 | 415,251 |
| Sitoy Group Holdings Ltd. | | 303,000 | 144,852 |
| SOHO China Ltd. | | 745,000 | 383,127 |
| Stella International Holdings Ltd. | | 127,000 | 313,651 |
| TCC International Holdings Ltd. | | 586,000 | 115,357 |
| Tencent Holdings Ltd. | | 529,900 | 9,988,286 |
| Value Partners Group Ltd. | | 266,000 | 281,672 |
| Vipshop Holdings Ltd. ADR (a) | | 24,100 | 494,532 |
| WuXi PharmaTech Cayman, Inc. sponsored ADR (a) | | 13,300 | 594,510 |
| Youku Tudou, Inc. ADR (a)(b) | | 16,200 | 394,308 |
| Zhen Ding Technology Holding Ltd. | | 80,000 | 228,677 |
|
| TOTAL CAYMAN ISLANDS | | | 34,842,187 |
|
| China - 17.2% | | | |
| Agricultural Bank of China Ltd. (H Shares) | | 3,636,000 | 1,486,799 |
| Anhui Conch Cement Co. Ltd. (H Shares) | | 255,500 | 779,607 |
| Bank of China Ltd. (H Shares) | | 9,182,000 | 4,329,877 |
| Beijing Urban Consolidated & Development Group Ltd. (H Shares) | | 45,000 | 27,686 |
| China Communications Construction Co. Ltd. (H Shares) | | 1,853,000 | 2,557,488 |
| China Construction Bank Corp. (H Shares) | | 10,085,000 | 7,309,164 |
| China Life Insurance Co. Ltd. (H Shares) | | 380,000 | 1,370,312 |
| China National Building Materials Co. Ltd. (H Shares) | | 440,000 | 273,380 |
| China Pacific Insurance (Group) Co. Ltd. (H Shares) | | 721,400 | 2,873,622 |
| China Petroleum & Chemical Corp. (H Shares) | | 4,496,000 | 3,240,915 |
| China Telecom Corp. Ltd. (H Shares) | | 4,770,000 | 2,488,138 |
| China Vanke Co. Ltd. (H Shares) | | 834,400 | 1,947,193 |
| Chongqing Changan Automobile Co. Ltd. (B Shares) | | 245,000 | 450,910 |
| Huadian Fuxin Energy Corp. Ltd. (H Shares) | | 1,836,000 | 562,494 |
| Huadian Power International Corp. Ltd. (H Shares) | | 1,120,000 | 818,900 |
| Industrial & Commercial Bank of China Ltd. (H Shares) | | 8,285,000 | 5,255,223 |
| Jiangling Motors Corp. Ltd. (B Shares) | | 70,301 | 226,077 |
| Jiangsu Hengrui Medicine Co. Ltd. | | 70,521 | 585,111 |
| Kweichow Moutai Co. Ltd. | | 28,983 | 978,576 |
| PICC Property & Casualty Co. Ltd. (H Shares) | | 741,060 | 1,681,517 |
| Ping An Insurance (Group) Co. of China Ltd. (H Shares) | | 818,000 | 4,591,639 |
| SAIC Motor Corp. Ltd. | | 171,451 | 483,099 |
| Shenzhen Expressway Co. (H Shares) | | 398,000 | 306,696 |
| Tong Ren Tang Technologies Co. Ltd. (H Shares) | | 218,000 | 340,505 |
| Zhejiang Expressway Co. Ltd. (H Shares) | | 1,120,000 | 1,376,871 |
|
| TOTAL CHINA | | | 46,341,799 |
|
| Hong Kong - 12.7% | | | |
| AIA Group Ltd. | | 1,313,400 | 7,700,899 |
| China Everbright Ltd. | | 352,000 | 828,448 |
| China Mobile Ltd. | | 364,500 | 4,370,317 |
| China Power International Development Ltd. | | 1,585,000 | 996,064 |
| China Resources Power Holdings Co. Ltd. | | 522,000 | 1,180,851 |
| CNOOC Ltd. sponsored ADR (b) | | 34,300 | 3,899,224 |
| Dah Sing Banking Group Ltd. | | 184,000 | 349,150 |
| Fosun International Ltd. | | 604,372 | 1,100,555 |
| Henderson Land Development Co. Ltd. | | 189,100 | 1,207,735 |
| HKT Trust/HKT Ltd. unit | | 1,394,500 | 1,661,442 |
| Hysan Development Co. Ltd. | | 329,000 | 1,459,289 |
| Lenovo Group Ltd. | | 1,002,000 | 930,995 |
| Magnificent Estates Ltd. | | 1,896,000 | 53,710 |
| New World Development Co. Ltd. | | 1,597,000 | 1,703,371 |
| PCCW Ltd. | | 3,323,000 | 1,789,241 |
| Power Assets Holdings Ltd. | | 211,000 | 2,098,693 |
| Shun Ho Technology Holdings Ltd. (a) | | 31,284 | 10,680 |
| Techtronic Industries Co. Ltd. | | 332,000 | 1,213,685 |
| Wheelock and Co. Ltd. | | 397,000 | 1,850,462 |
|
| TOTAL HONG KONG | | | 34,404,811 |
|
| India - 9.6% | | | |
| Adani Ports & Special Economic Zone (a) | | 90,030 | 406,493 |
| Apollo Tyres Ltd. | | 425,355 | 1,114,127 |
| Axis Bank Ltd. (a) | | 71,552 | 518,214 |
| Bajaj Finserv Ltd. | | 42,535 | 1,278,996 |
| Bharat Petroleum Corp. Ltd. (a) | | 83,752 | 1,113,213 |
| Bharti Infratel Ltd. (a) | | 95,622 | 567,930 |
| Cox & Kings India Ltd. (a) | | 240,045 | 990,639 |
| Dr. Reddy's Laboratories Ltd. (a) | | 22,092 | 1,435,408 |
| Edelweiss Financial Services Ltd. | | 525,264 | 476,720 |
| GAIL India Ltd. | | 96,413 | 454,016 |
| HCL Technologies Ltd. | | 58,877 | 783,667 |
| Hexaware Technologies Ltd. | | 164,537 | 601,598 |
| IL&FS Transportation Networks Ltd. | | 133,958 | 191,495 |
| Indian Oil Corp. Ltd. (a) | | 225,537 | 1,374,655 |
| JK Tyre & Industries Ltd. (a) | | 490,642 | 762,446 |
| Just Dial Ltd. (a) | | 16,816 | 205,707 |
| LIC Housing Finance Ltd. (a) | | 74,849 | 546,510 |
| Mahindra & Mahindra Ltd. (a) | | 52,098 | 940,711 |
| Maruti Suzuki India Ltd. (a) | | 10,552 | 717,678 |
| McLeod Russel India Ltd. (a) | | 94,682 | 248,467 |
| NTPC Ltd. | | 642,649 | 1,303,897 |
| Oil & Natural Gas Corp. Ltd. | | 228,160 | 860,723 |
| Petronet LNG Ltd. | | 440,925 | 1,306,769 |
| Power Finance Corp. Ltd. | | 145,742 | 531,974 |
| Power Grid Corp. of India Ltd. | | 131,131 | 257,774 |
| Redington India Ltd. (a) | | 192,326 | 349,534 |
| Reliance Capital Ltd. (a) | | 20,100 | 129,251 |
| Reliance Infrastructure Ltd. (a) | | 80,455 | 486,594 |
| Shriram City Union Finance Ltd. | | 14,220 | 398,568 |
| Sun TV Ltd. | | 109,142 | 661,167 |
| Tata Motors Ltd. (a) | | 274,008 | 1,617,141 |
| The Jammu & Kashmir Bank Ltd. | | 305,332 | 387,510 |
| UPL Ltd. | | 101,887 | 713,741 |
| Vakrangee Ltd. | | 75,631 | 151,133 |
| VST Industries Ltd. (a) | | 11,571 | 283,175 |
| Yes Bank Ltd. (a) | | 156,293 | 1,806,327 |
|
| TOTAL INDIA | | | 25,973,968 |
|
| Indonesia - 1.4% | | | |
| PT ACE Hardware Indonesia Tbk | | 3,485,600 | 169,685 |
| PT Bank Rakyat Indonesia Tbk | | 3,164,800 | 2,422,199 |
| PT Gudang Garam Tbk | | 279,900 | 876,132 |
| PT Summarecon Agung Tbk | | 3,581,600 | 362,513 |
| Sunway Construction Group Bhd (a) | | 48,990 | 14,736 |
|
| TOTAL INDONESIA | | | 3,845,265 |
|
| Israel - 0.0% | | | |
| Sarine Technologies Ltd. | | 96,600 | 107,373 |
| Japan - 1.4% | | | |
| Fuji Media Holdings, Inc. | | 77,300 | 919,549 |
| KDDI Corp. | | 60,600 | 1,466,419 |
| NGK Insulators Ltd. | | 13,000 | 281,448 |
| SoftBank Corp. | | 19,100 | 1,070,133 |
|
| TOTAL JAPAN | | | 3,737,549 |
|
| Korea (South) - 17.2% | | | |
| AMOREPACIFIC Corp. | | 4,946 | 1,635,281 |
| Daewoo International Corp. | | 15,163 | 264,941 |
| DGB Financial Group Co. Ltd. | | 77,194 | 716,656 |
| Dongbu Insurance Co. Ltd. | | 40,887 | 2,449,417 |
| Duksan Hi-Metal Co. Ltd. (a) | | 19,218 | 142,733 |
| Global & Yuasa Battery Co. Ltd. | | 4,616 | 164,948 |
| Hana Financial Group, Inc. | | 23,807 | 579,657 |
| Hyosung Corp. | | 8,903 | 912,312 |
| Hyundai Mobis | | 6,062 | 1,274,232 |
| Hyundai Motor Co. | | 28,497 | 3,893,544 |
| Hyundai Steel Co. | | 29,547 | 1,348,256 |
| KB Financial Group, Inc. | | 68,159 | 2,156,118 |
| Korea Aerospace Industries Ltd. | | 6,595 | 519,851 |
| Korea Electric Power Corp. | | 42,247 | 1,899,288 |
| Korea Petro Chemical Industries Co. Ltd. | | 3,957 | 613,424 |
| Korea Zinc Co. Ltd. | | 4,286 | 1,779,311 |
| LG Household & Health Care Ltd. | | 2,968 | 2,461,701 |
| LOTTE Hi-Mart Co. Ltd. | | 5,313 | 270,822 |
| Samsung Card Co. Ltd. | | 17,806 | 601,970 |
| Samsung Electronics Co. Ltd. | | 14,146 | 16,998,446 |
| Shinhan Financial Group Co. Ltd. | | 83,006 | 3,163,174 |
| SK Energy Co. Ltd. (a) | | 16,816 | 1,745,269 |
| SK Telecom Co. Ltd. | | 3,957 | 836,681 |
|
| TOTAL KOREA (SOUTH) | | | 46,428,032 |
|
| Malaysia - 2.2% | | | |
| AEON Credit Service Bhd | | 45,500 | 135,583 |
| AMMB Holdings Bhd | | 212,000 | 234,990 |
| Cahya Mata Sarawak Bhd | | 253,900 | 313,038 |
| Eversendai Corp. Bhd | | 266,400 | 48,244 |
| Glomac Bhd | | 439,300 | 92,496 |
| Media Prima Bhd | | 965,200 | 312,545 |
| MISC Bhd | | 251,000 | 526,653 |
| Sunway Bhd | | 489,900 | 353,088 |
| Tenaga Nasional Bhd | | 725,800 | 2,133,333 |
| YTL Corp. Bhd | | 2,891,300 | 1,015,355 |
| YTL Power International Bhd | | 2,195,800 | 771,146 |
|
| TOTAL MALAYSIA | | | 5,936,471 |
|
| Philippines - 1.1% | | | |
| ABS CBN Broadcasting Corp. (depositary receipt) | | 97,800 | 140,978 |
| Globe Telecom, Inc. | | 15,825 | 769,252 |
| LT Group, Inc. | | 518,300 | 138,312 |
| Metropolitan Bank & Trust Co. | | 669,360 | 1,215,404 |
| Robinsons Retail Holdings, Inc. | | 89,570 | 147,062 |
| Security Bank Corp. | | 226,866 | 687,473 |
|
| TOTAL PHILIPPINES | | | 3,098,481 |
|
| Singapore - 4.3% | | | |
| Boustead Projects Pte Ltd. (a) | | 33,854 | 20,410 |
| Boustead Singapore Ltd. | | 178,048 | 121,716 |
| CapitaLand Ltd. | | 504,500 | 1,112,883 |
| Centurion Corp. Ltd. | | 254,500 | 76,045 |
| CWT Ltd. | | 115,000 | 164,164 |
| Frasers Centrepoint Ltd. | | 120,000 | 139,538 |
| Hyflux Ltd. | | 451,000 | 218,128 |
| Interplex Holdings Ltd. | | 193,000 | 97,189 |
| Mapletree Industrial (REIT) | | 1,445,493 | 1,572,390 |
| Sheng Siong Group Ltd. | | 573,000 | 346,847 |
| Singapore Telecommunications Ltd. | | 881,000 | 2,503,144 |
| Sound Global Ltd. (a) | | 278,000 | 246,039 |
| United Overseas Bank Ltd. | | 232,500 | 3,376,083 |
| UOL Group Ltd. | | 165,000 | 770,015 |
| Wing Tai Holdings Ltd. | | 587,000 | 730,477 |
|
| TOTAL SINGAPORE | | | 11,495,068 |
|
| Taiwan - 13.2% | | | |
| ASUSTeK Computer, Inc. | | 137,000 | 1,227,999 |
| Cathay Financial Holding Co. Ltd. | | 1,921,000 | 2,745,554 |
| China Life Insurance Co. Ltd. | | 847,000 | 701,811 |
| Chinatrust Financial Holding Co. Ltd. | | 3,332,723 | 1,832,407 |
| Delta Electronics, Inc. | | 119,000 | 608,471 |
| E.SUN Financial Holdings Co. Ltd. | | 1,759,748 | 1,059,697 |
| Fubon Financial Holding Co. Ltd. | | 1,815,000 | 2,946,265 |
| Hon Hai Precision Industry Co. Ltd. (Foxconn) | | 1,909,850 | 5,094,502 |
| Novatek Microelectronics Corp. | | 195,000 | 666,718 |
| PChome Online, Inc. | | 23,814 | 267,738 |
| Pegatron Corp. | | 925,000 | 2,273,679 |
| Pou Chen Corp. | | 704,000 | 997,505 |
| Realtek Semiconductor Corp. | | 155,000 | 325,135 |
| Richtek Technology Corp. | | 57,000 | 332,712 |
| Sinopac Holdings Co. | | 5,778,145 | 1,913,293 |
| Taiwan Semiconductor Manufacturing Co. Ltd. | | 2,634,393 | 11,099,947 |
| Wistron NeWeb Corp. | | 239,700 | 633,490 |
| Yuanta Financial Holding Co. Ltd. | | 2,172,321 | 856,483 |
|
| TOTAL TAIWAN | | | 35,583,406 |
|
| Thailand - 2.0% | | | |
| Asian Property Development PCL (For. Reg.) | | 5,454,100 | 918,236 |
| Bangkok Expressway PCL (For.Reg.) | | 403,300 | 407,822 |
| CH. Karnchang PCL | | 461,600 | 366,921 |
| Intouch Holdings PCL: | | | |
| (For. Reg.) | | 690,901 | 1,456,044 |
| NVDR | | 147,400 | 310,639 |
| Preuksa Real Estate PCL (For. Reg.) | | 880,100 | 692,571 |
| Thai Beverage PCL | | 2,304,800 | 1,108,306 |
|
| TOTAL THAILAND | | | 5,260,539 |
|
| United States of America - 0.8% | | | |
| China Biologic Products, Inc. (a) | | 1,300 | 148,122 |
| Cognizant Technology Solutions Corp. Class A (a) | | 28,900 | 1,968,379 |
|
| TOTAL UNITED STATES OF AMERICA | | | 2,116,501 |
|
| TOTAL COMMON STOCKS | | | |
| (Cost $246,284,018) | | | 265,718,851 |
| | | Principal Amount(c) | Value |
|
| Nonconvertible Bonds - 0.0% | | | |
| India - 0.0% | | | |
NTPC Ltd. 8.49% 3/25/25
(Cost $123,312) | INR | 615,670 | 119,946 |
| | | Shares | Value |
|
| Money Market Funds - 1.8% | | | |
| Fidelity Cash Central Fund, 0.18% (d) | | 1,997,052 | 1,997,052 |
| Fidelity Securities Lending Cash Central Fund, 0.19% (d)(e) | | 2,769,250 | 2,769,250 |
| TOTAL MONEY MARKET FUNDS | | | |
| (Cost $4,766,302) | | | 4,766,302 |
| TOTAL INVESTMENT PORTFOLIO - 100.2% | | | |
| (Cost $251,173,632) | | | 270,605,099 |
| NET OTHER ASSETS (LIABILITIES) - (0.2)% | | | (551,390) |
| NET ASSETS - 100% | | | $270,053,709 |
Currency Abbreviations
INR – Indian rupee
Categorizations in the Schedule of Investments are based on country or territory of incorporation.
Legend
(a) Non-income producing
(b) Security or a portion of the security is on loan at period end.
(c) Amount is stated in United States dollars unless otherwise noted.
(d) Affiliated fund that is generally available only to investment companies and other accounts managed by Fidelity Investments. The rate quoted is the annualized seven-day yield of the fund at period end. A complete unaudited listing of the fund's holdings as of its most recent quarter end is available upon request. In addition, each Fidelity Central Fund's financial statements , which are not covered by the Fund's Report of Independent Registered Public Accounting Firm, are available on the SEC's website or upon request.
(e) Investment made with cash collateral received from securities on loan.
Affiliated Central Funds
Information regarding fiscal year to date income earned by the Fund from investments in Fidelity Central Funds is as follows:
| Fund | Income earned |
| Fidelity Cash Central Fund | $6,063 |
| Fidelity Securities Lending Cash Central Fund | 9,049 |
| Total | $15,112 |
Investment Valuation
The following is a summary of the inputs used, as of October 31, 2015, involving the Fund's assets and liabilities carried at fair value. The inputs or methodology used for valuing securities may not be an indication of the risk associated with investing in those securities. For more information on valuation inputs, and their aggregation into the levels used below, please refer to the Investment Valuation section in the accompanying Notes to Financial Statements.
| | Valuation Inputs at Reporting Date: |
| Description | Total | Level 1 | Level 2 | Level 3 |
| Investments in Securities: | | | | |
| Equities: | | | | |
| Consumer Discretionary | $23,761,028 | $8,358,055 | $14,919,874 | $483,099 |
| Consumer Staples | 9,021,395 | 4,096,982 | 4,924,413 | -- |
| Energy | 13,807,220 | 5,707,037 | 8,100,183 | -- |
| Financials | 95,210,637 | 16,403,210 | 78,807,427 | -- |
| Health Care | 4,852,566 | 880,226 | 3,972,340 | -- |
| Industrials | 14,925,587 | 784,792 | 14,140,795 | -- |
| Information Technology | 59,694,081 | 34,362,489 | 25,331,592 | -- |
| Materials | 8,528,010 | 4,653,303 | 3,874,707 | -- |
| Telecommunication Services | 19,289,380 | -- | 19,289,380 | -- |
| Utilities | 16,628,947 | -- | 16,382,908 | 246,039 |
| Corporate Bonds | 119,946 | -- | 119,946 | -- |
| Money Market Funds | 4,766,302 | 4,766,302 | -- | -- |
| Total Investments in Securities: | $270,605,099 | $80,012,396 | $189,863,565 | $729,138 |
The following is a summary of transfers between Level 1 and Level 2 for the period ended October 31, 2015. Transfers are assumed to have occurred at the beginning of the period, and are primarily attributable to the valuation techniques used for foreign equity securities, as discussed in the accompanying Notes to Financial Statements:
| Transfers | Total |
| Level 1 to Level 2 | $3,823,089 |
| Level 2 to Level 1 | $13,189,137 |
The following is a reconciliation of Investments in Securities for which Level 3 inputs were used in determining value:
| Industrials: | |
| Beginning Balance | $2,916,359 |
| Net Realized Gain (Loss) on Investment Securities | 2,027,462 |
| Net Unrealized Gain (Loss) on Investment Securities | (691,278) |
| Cost of Purchases | 1,615,871 |
| Proceeds of Sales | (5,868,414) |
| Amortization/Accretion | -- |
| Transfers into Level 3 | -- |
| Transfers out of Level 3 | -- |
| Ending Balance | $-- |
| The change in unrealized gain (loss) for the period attributable to Level 3 securities held at October 31, 2015 | -- |
| Other Investments in Securities: | |
| Beginning Balance | $-- |
| Net Realized Gain (Loss) on Investment Securities | (192,200) |
| Net Unrealized Gain (Loss) on Investment Securities | (188,763) |
| Cost of Purchases | 1,731,541 |
| Proceeds of Sales | (621,440) |
| Amortization/Accretion | -- |
| Transfers into Level 3 | -- |
| Transfers out of Level 3 | -- |
| Ending Balance | $729,138 |
| The change in unrealized gain (loss) for the period attributable to Level 3 securities held at October 31, 2015 | $(188,763) |
The information used in the above reconciliations represents fiscal year to date activity for any Investments in Securities identified as using Level 3 inputs at either the beginning or the end of the current fiscal period. Transfers in or out of Level 3 represent the beginning value of any Security or Instrument where a change in the pricing level occurred from the beginning to the end of the period. The cost of purchases and the proceeds of sales may include securities received or delivered through corporate actions or exchanges. Realized and unrealized gains (losses) disclosed in the reconciliations are included in Net Gain (Loss) on the Fund's Statement of Operations.
See accompanying notes which are an integral part of the financial statements.
Financial Statements
Statement of Assets and Liabilities
| | | October 31, 2015 |
| Assets | | |
Investment in securities, at value (including securities loaned of $2,711,876) — See accompanying schedule:
Unaffiliated issuers (cost $246,407,330) | $265,838,797 | |
| Fidelity Central Funds (cost $4,766,302) | 4,766,302 | |
| Total Investments (cost $251,173,632) | | $270,605,099 |
| Receivable for investments sold | | 10,863,972 |
| Receivable for fund shares sold | | 77,495 |
| Dividends receivable | | 87,527 |
| Interest receivable | | 483 |
| Distributions receivable from Fidelity Central Funds | | 644 |
| Prepaid expenses | | 851 |
| Other receivables | | 136,283 |
| Total assets | | 281,772,354 |
| Liabilities | | |
| Payable for investments purchased | $8,141,643 | |
| Payable for fund shares redeemed | 414,379 | |
| Accrued management fee | 157,909 | |
| Distribution and service plan fees payable | 88,170 | |
| Other affiliated payables | 66,087 | |
| Other payables and accrued expenses | 81,207 | |
| Collateral on securities loaned, at value | 2,769,250 | |
| Total liabilities | | 11,718,645 |
| Net Assets | | $270,053,709 |
| Net Assets consist of: | | |
| Paid in capital | | $247,866,307 |
| Undistributed net investment income | | 1,204,748 |
| Accumulated undistributed net realized gain (loss) on investments and foreign currency transactions | | 1,606,906 |
| Net unrealized appreciation (depreciation) on investments and assets and liabilities in foreign currencies | | 19,375,748 |
| Net Assets | | $270,053,709 |
| Calculation of Maximum Offering Price | | |
| Class A: | | |
| Net Asset Value and redemption price per share ($125,527,985 ÷ 4,365,934 shares) | | $28.75 |
| Maximum offering price per share (100/94.25 of $28.75) | | $30.50 |
| Class T: | | |
| Net Asset Value and redemption price per share ($37,720,112 ÷ 1,350,455 shares) | | $27.93 |
| Maximum offering price per share (100/96.50 of $27.93) | | $28.94 |
| Class B: | | |
| Net Asset Value and offering price per share ($3,585,124 ÷ 134,979 shares)(a) | | $26.56 |
| Class C: | | |
| Net Asset Value and offering price per share ($51,651,210 ÷ 1,973,722 shares)(a) | | $26.17 |
| Class I: | | |
| Net Asset Value, offering price and redemption price per share ($51,569,278 ÷ 1,740,560 shares) | | $29.63 |
(a) Redemption price per share is equal to net asset value less any applicable contingent deferred sales charge.
See accompanying notes which are an integral part of the financial statements.
Statement of Operations
| | | Year ended October 31, 2015 |
| Investment Income | | |
| Dividends | | $8,058,317 |
| Interest | | 490 |
| Income from Fidelity Central Funds | | 15,112 |
| Income before foreign taxes withheld | | 8,073,919 |
| Less foreign taxes withheld | | (809,681) |
| Total income | | 7,264,238 |
| Expenses | | |
| Management fee | $2,146,223 | |
| Transfer agent fees | 738,899 | |
| Distribution and service plan fees | 1,211,700 | |
| Accounting and security lending fees | 159,412 | |
| Custodian fees and expenses | 212,654 | |
| Independent trustees' compensation | 1,313 | |
| Registration fees | 85,258 | |
| Audit | 88,862 | |
| Legal | 789 | |
| Interest | 527 | |
| Miscellaneous | 2,019 | |
| Total expenses before reductions | 4,647,656 | |
| Expense reductions | (22,649) | 4,625,007 |
| Net investment income (loss) | | 2,639,231 |
| Realized and Unrealized Gain (Loss) | | |
| Net realized gain (loss) on: | | |
| Investment securities: | | |
| Unaffiliated issuers (net of foreign taxes of $288,936) | 3,743,148 | |
| Foreign currency transactions | (47,197) | |
| Total net realized gain (loss) | | 3,695,951 |
Change in net unrealized appreciation (depreciation) on:
Investment securities (net of decrease in deferred foreign taxes of $934,924) | (25,576,727) | |
| Assets and liabilities in foreign currencies | (5,142) | |
| Total change in net unrealized appreciation (depreciation) | | (25,581,869) |
| Net gain (loss) | | (21,885,918) |
| Net increase (decrease) in net assets resulting from operations | | $(19,246,687) |
See accompanying notes which are an integral part of the financial statements.
Statement of Changes in Net Assets
| | Year ended October 31, 2015 | Year ended October 31, 2014 |
| Increase (Decrease) in Net Assets | | |
| Operations | | |
| Net investment income (loss) | $2,639,231 | $2,377,197 |
| Net realized gain (loss) | 3,695,951 | 16,845,214 |
| Change in net unrealized appreciation (depreciation) | (25,581,869) | 735,749 |
| Net increase (decrease) in net assets resulting from operations | (19,246,687) | 19,958,160 |
| Distributions to shareholders from net investment income | (1,398,621) | (2,011,362) |
| Distributions to shareholders from net realized gain | (15,842,060) | (13,483,906) |
| Total distributions | (17,240,681) | (15,495,268) |
| Share transactions - net increase (decrease) | 4,069,053 | (13,223,545) |
| Redemption fees | 145,305 | 35,731 |
| Total increase (decrease) in net assets | (32,273,010) | (8,724,922) |
| Net Assets | | |
| Beginning of period | 302,326,719 | 311,051,641 |
| End of period (including undistributed net investment income of $1,204,748 and undistributed net investment income of $1,321,181, respectively) | $270,053,709 | $302,326,719 |
See accompanying notes which are an integral part of the financial statements.
Financial Highlights — Fidelity Advisor Emerging Asia Fund Class A
| | | | | | |
| Years ended October 31, | 2015 | 2014 | 2013 | 2012 | 2011 |
| Selected Per–Share Data | | | | | |
| Net asset value, beginning of period | $32.05 | $31.34 | $28.87 | $28.70 | $32.97 |
| Income from Investment Operations | | | | | |
| Net investment income (loss)A | .31 | .30 | .30 | .34 | .35 |
| Net realized and unrealized gain (loss) | (1.76) | 2.00B | 2.59 | 1.37 | (2.62) |
| Total from investment operations | (1.45) | 2.30 | 2.89 | 1.71 | (2.27) |
| Distributions from net investment income | (.18) | (.26) | (.33) | (.31) | (.20) |
| Distributions from net realized gain | (1.67) | (1.33) | (.09) | (1.23) | (1.81) |
| Total distributions | (1.86)C | (1.59) | (.42) | (1.54) | (2.01) |
| Redemption fees added to paid in capitalA | .01 | –D | –D | –D | .01 |
| Net asset value, end of period | $28.75 | $32.05 | $31.34 | $28.87 | $28.70 |
| Total ReturnE,F | (4.78)% | 7.70%B | 10.10% | 6.36% | (7.44)% |
| Ratios to Average Net AssetsG,H | | | | | |
| Expenses before reductions | 1.37% | 1.42% | 1.41% | 1.42% | 1.39% |
| Expenses net of fee waivers, if any | 1.37% | 1.42% | 1.41% | 1.42% | 1.39% |
| Expenses net of all reductions | 1.36% | 1.42% | 1.38% | 1.38% | 1.35% |
| Net investment income (loss) | 1.00% | .96% | .99% | 1.24% | 1.12% |
| Supplemental Data | | | | | |
| Net assets, end of period (000 omitted) | $125,528 | $145,184 | $155,104 | $160,427 | $179,346 |
| Portfolio turnover rateI | 70% | 91% | 95% | 95% | 119% |
A Calculated based on average shares outstanding during the period.
B In 2014, a change to the Indian tax rules invalidated a prior ruling that had exempted the Fund from taxes on realized gains. As a result, the Fund recorded a tax liability which resulted in a decrease to realized and unrealized gain (loss) per share of $.18 at period end. Excluding this amount, the total return would have been 8.29%.
C Total distributions of $1.86 per share is comprised of distributions from net investment income of $.183 and distributions from net realized gain of $1.674 per share.
D Amount represents less than $.005 per share.
E Total returns would have been lower if certain expenses had not been reduced during the applicable periods shown.
F Total returns do not include the effect of the sales charges.
G Fees and expenses of any underlying Fidelity Central Funds are not included in the Fund's expense ratio. The Fund indirectly bears its proportionate share of the expenses of any underlying Fidelity Central Funds.
H Expense ratios reflect operating expenses of the class. Expenses before reductions do not reflect amounts reimbursed by the investment adviser or reductions from brokerage service arrangements or reductions from other expense offset arrangements and do not represent the amount paid by the class during periods when reimbursements or reductions occur. Expenses net of fee waivers reflect expenses after reimbursement by the investment adviser but prior to reductions from brokerage service arrangements or other expense offset arrangements. Expenses net of all reductions represent the net expenses paid by the class.
I Amount does not include the portfolio activity of any underlying Fidelity Central Funds.
See accompanying notes which are an integral part of the financial statements.
Financial Highlights — Fidelity Advisor Emerging Asia Fund Class T
| | | | | | |
| Years ended October 31, | 2015 | 2014 | 2013 | 2012 | 2011 |
| Selected Per–Share Data | | | | | |
| Net asset value, beginning of period | $31.17 | $30.53 | $28.13 | $27.98 | $32.20 |
| Income from Investment Operations | | | | | |
| Net investment income (loss)A | .21 | .20 | .20 | .25 | .25 |
| Net realized and unrealized gain (loss) | (1.71) | 1.94B | 2.54 | 1.33 | (2.55) |
| Total from investment operations | (1.50) | 2.14 | 2.74 | 1.58 | (2.30) |
| Distributions from net investment income | (.08) | (.17) | (.25) | (.20) | (.12) |
| Distributions from net realized gain | (1.67) | (1.33) | (.09) | (1.23) | (1.81) |
| Total distributions | (1.75) | (1.50) | (.34) | (1.43) | (1.93) |
| Redemption fees added to paid in capitalA | .01 | –C | –C | –C | .01 |
| Net asset value, end of period | $27.93 | $31.17 | $30.53 | $28.13 | $27.98 |
| Total ReturnD,E | (5.05)% | 7.34%B | 9.80% | 6.04% | (7.70)% |
| Ratios to Average Net AssetsF,G | | | | | |
| Expenses before reductions | 1.68% | 1.73% | 1.70% | 1.70% | 1.70% |
| Expenses net of fee waivers, if any | 1.68% | 1.73% | 1.70% | 1.70% | 1.69% |
| Expenses net of all reductions | 1.67% | 1.73% | 1.67% | 1.67% | 1.65% |
| Net investment income (loss) | .69% | .66% | .70% | .95% | .82% |
| Supplemental Data | | | | | |
| Net assets, end of period (000 omitted) | $37,720 | $44,563 | $47,620 | $49,359 | $55,452 |
| Portfolio turnover rateH | 70% | 91% | 95% | 95% | 119% |
A Calculated based on average shares outstanding during the period.
B In 2014, a change to the Indian tax rules invalidated a prior ruling that had exempted the Fund from taxes on realized gains. As a result, the Fund recorded a tax liability which resulted in a decrease to realized and unrealized gain (loss) per share of $.18 at period end. Excluding this amount, the total return would have been 7.93%.
C Amount represents less than $.005 per share.
D Total returns would have been lower if certain expenses had not been reduced during the applicable periods shown.
E Total returns do not include the effect of the sales charges.
F Fees and expenses of any underlying Fidelity Central Funds are not included in the Fund's expense ratio. The Fund indirectly bears its proportionate share of the expenses of any underlying Fidelity Central Funds.
G Expense ratios reflect operating expenses of the class. Expenses before reductions do not reflect amounts reimbursed by the investment adviser or reductions from brokerage service arrangements or reductions from other expense offset arrangements and do not represent the amount paid by the class during periods when reimbursements or reductions occur. Expenses net of fee waivers reflect expenses after reimbursement by the investment adviser but prior to reductions from brokerage service arrangements or other expense offset arrangements. Expenses net of all reductions represent the net expenses paid by the class.
H Amount does not include the portfolio activity of any underlying Fidelity Central Funds.
See accompanying notes which are an integral part of the financial statements.
Financial Highlights — Fidelity Advisor Emerging Asia Fund Class B
| | | | | | |
| Years ended October 31, | 2015 | 2014 | 2013 | 2012 | 2011 |
| Selected Per–Share Data | | | | | |
| Net asset value, beginning of period | $29.63 | $29.06 | $26.77 | $26.62 | $30.72 |
| Income from Investment Operations | | | | | |
| Net investment income (loss)A | .05 | .05 | .06 | .12 | .10 |
| Net realized and unrealized gain (loss) | (1.61) | 1.85B | 2.41 | 1.26 | (2.44) |
| Total from investment operations | (1.56) | 1.90 | 2.47 | 1.38 | (2.34) |
| Distributions from net investment income | – | – | (.09) | – | – |
| Distributions from net realized gain | (1.52) | (1.33) | (.09) | (1.23) | (1.77) |
| Total distributions | (1.52) | (1.33) | (.18) | (1.23) | (1.77) |
| Redemption fees added to paid in capitalA | .01 | –C | –C | –C | .01 |
| Net asset value, end of period | $26.56 | $29.63 | $29.06 | $26.77 | $26.62 |
| Total ReturnD,E | (5.51)% | 6.84%B | 9.27% | 5.51% | (8.16)% |
| Ratios to Average Net AssetsF,G | | | | | |
| Expenses before reductions | 2.18% | 2.22% | 2.20% | 2.19% | 2.19% |
| Expenses net of fee waivers, if any | 2.18% | 2.22% | 2.20% | 2.19% | 2.18% |
| Expenses net of all reductions | 2.18% | 2.22% | 2.17% | 2.16% | 2.15% |
| Net investment income (loss) | .19% | .16% | .20% | .46% | .32% |
| Supplemental Data | | | | | |
| Net assets, end of period (000 omitted) | $3,585 | $6,661 | $10,194 | $15,823 | $20,831 |
| Portfolio turnover rateH | 70% | 91% | 95% | 95% | 119% |
A Calculated based on average shares outstanding during the period.
B In 2014, a change to the Indian tax rules invalidated a prior ruling that had exempted the Fund from taxes on realized gains. As a result, the Fund recorded a tax liability which resulted in a decrease to realized and unrealized gain (loss) per share of $.17 at period end. Excluding this amount, the total return would have been 7.43%.
C Amount represents less than $.005 per share.
D Total returns would have been lower if certain expenses had not been reduced during the applicable periods shown.
E Total returns do not include the effect of the contingent deferred sales charge.
F Fees and expenses of any underlying Fidelity Central Funds are not included in the Fund's expense ratio. The Fund indirectly bears its proportionate share of the expenses of any underlying Fidelity Central Funds.
G Expense ratios reflect operating expenses of the class. Expenses before reductions do not reflect amounts reimbursed by the investment adviser or reductions from brokerage service arrangements or reductions from other expense offset arrangements and do not represent the amount paid by the class during periods when reimbursements or reductions occur. Expenses net of fee waivers reflect expenses after reimbursement by the investment adviser but prior to reductions from brokerage service arrangements or other expense offset arrangements. Expenses net of all reductions represent the net expenses paid by the class.
H Amount does not include the portfolio activity of any underlying Fidelity Central Funds.
See accompanying notes which are an integral part of the financial statements.
Financial Highlights — Fidelity Advisor Emerging Asia Fund Class C
| | | | | | |
| Years ended October 31, | 2015 | 2014 | 2013 | 2012 | 2011 |
| Selected Per–Share Data | | | | | |
| Net asset value, beginning of period | $29.30 | $28.78 | $26.53 | $26.44 | $30.58 |
| Income from Investment Operations | | | | | |
| Net investment income (loss)A | .07 | .06 | .07 | .13 | .11 |
| Net realized and unrealized gain (loss) | (1.59) | 1.82B | 2.39 | 1.25 | (2.41) |
| Total from investment operations | (1.52) | 1.88 | 2.46 | 1.38 | (2.30) |
| Distributions from net investment income | – | (.03) | (.12) | (.06) | (.04) |
| Distributions from net realized gain | (1.62) | (1.33) | (.09) | (1.23) | (1.81) |
| Total distributions | (1.62) | (1.36) | (.21) | (1.29) | (1.85) |
| Redemption fees added to paid in capitalA | .01 | –C | –C | –C | .01 |
| Net asset value, end of period | $26.17 | $29.30 | $28.78 | $26.53 | $26.44 |
| Total ReturnD,E | (5.46)% | 6.85%B | 9.33% | 5.57% | (8.10)% |
| Ratios to Average Net AssetsF,G | | | | | |
| Expenses before reductions | 2.11% | 2.17% | 2.16% | 2.16% | 2.13% |
| Expenses net of fee waivers, if any | 2.11% | 2.17% | 2.16% | 2.16% | 2.13% |
| Expenses net of all reductions | 2.10% | 2.17% | 2.12% | 2.13% | 2.10% |
| Net investment income (loss) | .26% | .22% | .24% | .49% | .37% |
| Supplemental Data | | | | | |
| Net assets, end of period (000 omitted) | $51,651 | $57,226 | $61,824 | $67,074 | $78,939 |
| Portfolio turnover rateH | 70% | 91% | 95% | 95% | 119% |
A Calculated based on average shares outstanding during the period.
B In 2014, a change to the Indian tax rules invalidated a prior ruling that had exempted the Fund from taxes on realized gains. As a result, the Fund recorded a tax liability which resulted in a decrease to realized and unrealized gain (loss) per share $.17 at period end. Excluding this amount, the total return would have been 7.44%.
C Amount represents less than $.005 per share.
D Total returns would have been lower if certain expenses had not been reduced during the applicable periods shown.
E Total returns do not include the effect of the contingent deferred sales charge.
F Fees and expenses of any underlying Fidelity Central Funds are not included in the Fund's expense ratio. The Fund indirectly bears its proportionate share of the expenses of any underlying Fidelity Central Funds.
G Expense ratios reflect operating expenses of the class. Expenses before reductions do not reflect amounts reimbursed by the investment adviser or reductions from brokerage service arrangements or reductions from other expense offset arrangements and do not represent the amount paid by the class during periods when reimbursements or reductions occur. Expenses net of fee waivers reflect expenses after reimbursement by the investment adviser but prior to reductions from brokerage service arrangements or other expense offset arrangements. Expenses net of all reductions represent the net expenses paid by the class.
H Amount does not include the portfolio activity of any underlying Fidelity Central Funds.
See accompanying notes which are an integral part of the financial statements.
Financial Highlights — Fidelity Advisor Emerging Asia Fund Class I
| | | | | | |
| Years ended October 31, | 2015 | 2014 | 2013 | 2012 | 2011 |
| Selected Per–Share Data | | | | | |
| Net asset value, beginning of period | $33.00 | $32.24 | $29.67 | $29.49 | $33.80 |
| Income from Investment Operations | | | | | |
| Net investment income (loss)A | .41 | .40 | .40 | .44 | .46 |
| Net realized and unrealized gain (loss) | (1.81) | 2.04B | 2.68 | 1.39 | (2.69) |
| Total from investment operations | (1.40) | 2.44 | 3.08 | 1.83 | (2.23) |
| Distributions from net investment income | (.31) | (.35) | (.41) | (.42) | (.29) |
| Distributions from net realized gain | (1.67) | (1.33) | (.09) | (1.23) | (1.81) |
| Total distributions | (1.98) | (1.68) | (.51)C | (1.65) | (2.09)D |
| Redemption fees added to paid in capitalA | .01 | –E | –E | –E | .01 |
| Net asset value, end of period | $29.63 | $33.00 | $32.24 | $29.67 | $29.49 |
| Total ReturnF | (4.47)% | 7.98%B | 10.47% | 6.64% | (7.13)% |
| Ratios to Average Net AssetsG,H | | | | | |
| Expenses before reductions | 1.07% | 1.12% | 1.11% | 1.11% | 1.10% |
| Expenses net of fee waivers, if any | 1.07% | 1.12% | 1.11% | 1.11% | 1.10% |
| Expenses net of all reductions | 1.06% | 1.12% | 1.08% | 1.08% | 1.06% |
| Net investment income (loss) | 1.30% | 1.26% | 1.29% | 1.54% | 1.41% |
| Supplemental Data | | | | | |
| Net assets, end of period (000 omitted) | $51,569 | $48,693 | $36,310 | $40,026 | $49,888 |
| Portfolio turnover rateI | 70% | 91% | 95% | 95% | 119% |
A Calculated based on average shares outstanding during the period.
B In 2014, a change to the Indian tax rules invalidated a prior ruling that had exempted the Fund from taxes on realized gains. As a result, the Fund recorded a tax liability which resulted in a decrease to realized and unrealized gain (loss) per share of $.19 at period end. Excluding this amount, the total return would have been 8.57%.
C Total distributions of $.51 per share is comprised of distributions from net investment income of $.413 and distributions from net realized gain of $.092 per share.
D Total distributions of $2.09. per share is comprised of distributions from net investment income of $.288 and distributions from net realized gain of $1.805 per share.
E Amount represents less than $.005 per share.
F Total returns would have been lower if certain expenses had not been reduced during the applicable periods shown.
G Fees and expenses of any underlying Fidelity Central Funds are not included in the Fund's expense ratio. The Fund indirectly bears its proportionate share of the expenses of any underlying Fidelity Central Funds.
H Expense ratios reflect operating expenses of the class. Expenses before reductions do not reflect amounts reimbursed by the investment adviser or reductions from brokerage service arrangements or reductions from other expense offset arrangements and do not represent the amount paid by the class during periods when reimbursements or reductions occur. Expenses net of fee waivers reflect expenses after reimbursement by the investment adviser but prior to reductions from brokerage service arrangements or other expense offset arrangements. Expenses net of all reductions represent the net expenses paid by the class.
I Amount does not include the portfolio activity of any underlying Fidelity Central Funds.
See accompanying notes which are an integral part of the financial statements.
Notes to Financial Statements
For the period ended October 31, 2015
1. Organization.
Fidelity Advisor Emerging Asia Fund (the Fund) is a fund of Fidelity Advisor Series VIII (the Trust) and is authorized to issue an unlimited number of shares. The Trust is registered under the Investment Company Act of 1940, as amended (the 1940 Act), as an open-end management investment company organized as a Massachusetts business trust. The Fund offers Class A, Class T, Class C, and Class I (formerly Institutional Class) shares, each of which, along with Class B shares, has equal rights as to assets and voting privileges. Class B shares are closed to new accounts and additional purchases, except for exchanges and reinvestments. Each class has exclusive voting rights with respect to matters that affect that class. Class B shares will automatically convert to Class A shares after a holding period of seven years from the initial date of purchase. The Fund's investments in emerging markets can be subject to social, economic, regulatory, and political uncertainties and can be extremely volatile.
2. Investments in Fidelity Central Funds.
The Fund invests in Fidelity Central Funds, which are open-end investment companies generally available only to other investment companies and accounts managed by the investment adviser and its affiliates. The Fund's Schedule of Investments lists each of the Fidelity Central Funds held as of period end, if any, as an investment of the Fund, but does not include the underlying holdings of each Fidelity Central Fund. As an Investing Fund, the Fund indirectly bears its proportionate share of the expenses of the underlying Fidelity Central Funds.
The Money Market Central Funds seek preservation of capital and current income and are managed by Fidelity Investments Money Management, Inc. (FIMM), an affiliate of the investment adviser. Annualized expenses of the Money Market Central Funds as of their most recent shareholder report date are less than .005%.
A complete unaudited list of holdings for each Fidelity Central Fund is available upon request or at the Securities and Exchange Commission (the SEC) website at www.sec.gov. In addition, the financial statements of the Fidelity Central Funds, which are not covered by the Fund's Report of Independent Registered Public Accounting Firm, are available on the SEC website or upon request.
3. Significant Accounting Policies.
The financial statements have been prepared in conformity with accounting principles generally accepted in the United States of America (GAAP), which require management to make certain estimates and assumptions at the date of the financial statements. Actual results could differ from those estimates. Subsequent events, if any, through the date that the financial statements were issued have been evaluated in the preparation of the financial statements. The following summarizes the significant accounting policies of the Fund:
Investment Valuation. Investments are valued as of 4:00 p.m. Eastern time on the last calendar day of the period. The Board of Trustees (the Board) has delegated the day to day responsibility for the valuation of the Fund's investments to the Fidelity Management & Research Company (FMR) Fair Value Committee (the Committee). In accordance with valuation policies and procedures approved by the Board, the Fund attempts to obtain prices from one or more third party pricing vendors or brokers to value its investments. When current market prices, quotations or currency exchange rates are not readily available or reliable, investments will be fair valued in good faith by the Committee, in accordance with procedures adopted by the Board. Factors used in determining fair value vary by investment type and may include market or investment specific events, changes in interest rates and credit quality. The frequency with which these procedures are used cannot be predicted and they may be utilized to a significant extent. The Committee oversees the Fund's valuation policies and procedures and reports to the Board on the Committee's activities and fair value determinations. The Board monitors the appropriateness of the procedures used in valuing the Fund's investments and ratifies the fair value determinations of the Committee.
The Fund categorizes the inputs to valuation techniques used to value its investments into a disclosure hierarchy consisting of three levels as shown below:
- Level 1 – quoted prices in active markets for identical investments
- Level 2 – other significant observable inputs (including quoted prices for similar investments, interest rates, prepayment speeds, etc.)
- Level 3 – unobservable inputs (including the Fund's own assumptions based on the best information available)
Valuation techniques used to value the Fund's investments by major category are as follows:
Equity securities, including restricted securities, for which market quotations are readily available, are valued at the last reported sale price or official closing price as reported by a third party pricing vendor on the primary market or exchange on which they are traded and are categorized as Level 1 in the hierarchy. In the event there were no sales during the day or closing prices are not available, securities are valued at the last quoted bid price or may be valued using the last available price and are generally categorized as Level 2 in the hierarchy. For foreign equity securities, when market or security specific events arise, comparisons to the valuation of American Depositary Receipts (ADRs), futures contracts, Exchange-Traded Funds (ETFs) and certain indexes as well as quoted prices for similar securities may be used and would be categorized as Level 2 in the hierarchy. Utilizing these techniques may result in transfers between Level 1 and Level 2. For equity securities, including restricted securities, where observable inputs are limited, assumptions about market activity and risk are used and these securities may be categorized as Level 3 in the hierarchy.
Debt securities, including restricted securities, are valued based on evaluated prices received from third party pricing vendors or from brokers who make markets in such securities. Corporate bonds are valued by pricing vendors who utilize matrix pricing which considers yield or price of bonds of comparable quality, coupon, maturity and type or by broker-supplied prices. When independent prices are unavailable or unreliable, debt securities may be valued utilizing pricing methodologies which consider similar factors that would be used by third party pricing vendors. Debt securities are generally categorized as Level 2 in the hierarchy but may be Level 3 depending on the circumstances.
Investments in open-end mutual funds, including the Fidelity Central Funds, are valued at their closing net asset value (NAV) each business day and are categorized as Level 1 in the hierarchy.
Changes in valuation techniques may result in transfers in or out of an assigned level within the disclosure hierarchy. The aggregate value of investments by input level as of October 31, 2015, information on transfers between Levels 1 and 2 , as well as a roll forward of Level 3 investments, is included at the end of the Fund's Schedule of Investments.
Foreign Currency. The Fund may use foreign currency contracts to facilitate transactions in foreign-denominated securities. Gains and losses from these transactions may arise from changes in the value of the foreign currency or if the counterparties do not perform under the contracts' terms.
Foreign-denominated assets, including investment securities, and liabilities are translated into U.S. dollars at the exchange rates at period end. Purchases and sales of investment securities, income and dividends received and expenses denominated in foreign currencies are translated into U.S. dollars at the exchange rate in effect on the transaction date.
The effects of exchange rate fluctuations on investments are included with the net realized and unrealized gain (loss) on investment securities. Other foreign currency transactions resulting in realized and unrealized gain (loss) are disclosed separately.
Investment Transactions and Income. For financial reporting purposes, the Fund's investment holdings and NAV include trades executed through the end of the last business day of the period. The NAV per share for processing shareholder transactions is calculated as of the close of business of the New York Stock Exchange (NYSE), normally 4:00 p.m. Eastern time and includes trades executed through the end of the prior business day. Gains and losses on securities sold are determined on the basis of identified cost. Dividend income is recorded on the ex-dividend date, except for certain dividends from foreign securities where the ex-dividend date may have passed, which are recorded as soon as the Fund is informed of the ex-dividend date. Non-cash dividends included in dividend income, if any, are recorded at the fair market value of the securities received. Income and capital gain distributions from Fidelity Central Funds, if any, are recorded on the ex-dividend date. Interest income is accrued as earned and includes coupon interest and amortization of premium and accretion of discount on debt securities as applicable. Investment income is recorded net of foreign taxes withheld where recovery of such taxes is uncertain.
Class Allocations and Expenses. Investment income, realized and unrealized capital gains and losses, common expenses of the Fund, and certain fund-level expense reductions, if any, are allocated daily on a pro-rata basis to each class based on the relative net assets of each class to the total net assets of the Fund. Each class differs with respect to transfer agent and distribution and service plan fees incurred. Certain expense reductions may also differ by class. For the reporting period, the allocated portion of income and expenses to each class as a percent of its average net assets may vary due to the timing of recording these transactions in relation to fluctuating net assets of the classes. Expenses directly attributable to a fund are charged to that fund. Expenses attributable to more than one fund are allocated among the respective funds on the basis of relative net assets or other appropriate methods. Expense estimates are accrued in the period to which they relate and adjustments are made when actual amounts are known.
Income Tax Information and Distributions to Shareholders. Each year, the Fund intends to qualify as a regulated investment company under Subchapter M of the Internal Revenue Code, including distributing substantially all of its taxable income and realized gains. As a result, no provision for U.S. Federal income taxes is required. As of October 31, 2015, the Fund did not have any unrecognized tax benefits in the financial statements; nor is the Fund aware of any tax positions for which it is reasonably possible that the total amounts of unrecognized tax benefits will significantly change in the next twelve months. The Fund files a U.S. federal tax return, in addition to state and local tax returns as required. The Fund's federal income tax returns are subject to examination by the Internal Revenue Service (IRS) for a period of three fiscal years after they are filed. State and local tax returns may be subject to examination for an additional fiscal year depending on the jurisdiction. Foreign taxes are provided for based on the Fund's understanding of the tax rules and rates that exist in the foreign markets in which it invests. The Fund is subject to a tax imposed on capital gains by certain countries in which it invests. An estimated deferred tax liability for net unrealized appreciation on the applicable securities is included in Other payables and accrued expenses on the Statement of Assets & Liabilities.
Distributions are declared and recorded on the ex-dividend date. Income dividends and capital gain distributions are declared separately for each class. Income and capital gain distributions are determined in accordance with income tax regulations, which may differ from GAAP. In addition, the Fund claimed a portion of the payment made to redeeming shareholders as a distribution for income tax purposes.
Capital accounts within the financial statements are adjusted for permanent book-tax differences. These adjustments have no impact on net assets or the results of operations. Capital accounts are not adjusted for temporary book-tax differences which will reverse in a subsequent period.
Book-tax differences are primarily due to certain foreign taxes, passive foreign investment companies (PFIC) and losses deferred due to wash sales.
The federal tax cost of investment securities and unrealized appreciation (depreciation) as of period end were as follows:
| Gross unrealized appreciation | $44,008,834 |
| Gross unrealized depreciation | (25,172,267) |
| Net unrealized appreciation (depreciation) on securities | $18,836,567 |
| Tax Cost | $251,768,532 |
The tax-based components of distributable earnings as of period end were as follows:
| Undistributed ordinary income | $1,204,748 |
| Undistributed long-term capital gain | $2,201,807 |
| Net unrealized appreciation (depreciation) on securities and other investments | $18,781,082 |
The tax character of distributions paid was as follows:
| | October 31, 2015 | October 31, 2014 |
| Ordinary Income | $2,726,802 | $ 2,011,362 |
| Long-term Capital Gains | 14,513,879 | 13,483,906 |
| Total | $17,240,681 | $ 15,495,268 |
Short-Term Trading (Redemption) Fees. Shares held by investors in the Fund less than 90 days may have been subject to a redemption fee equal to 1.50% of the NAV of shares redeemed. All redemption fees, which reduce the proceeds of the shareholder redemption, are retained by the Fund and accounted for as an addition to paid in capital.
4. Purchases and Sales of Investments.
Purchases and sales of securities, other than short-term securities, aggregated $209,571,850 and $223,267,320, respectively.
5. Fees and Other Transactions with Affiliates.
Management Fee. Fidelity Management & Research Company (the investment adviser) and its affiliates provide the Fund with investment management related services for which the Fund pays a monthly management fee. The management fee is the sum of an individual fund fee rate that is based on an annual rate of .45% of the Fund's average net assets and an annualized group fee rate that averaged .25% during the period. The group fee rate is based upon the average net assets of all the mutual funds advised by the investment adviser, including any mutual funds previously advised by the investment adviser that are currently advised by Fidelity SelectCo, LLC, an affiliate of the investment adviser. The group fee rate decreases as assets under management increase and increases as assets under management decrease. For the reporting period, the total annual management fee rate was .70% of the Fund's average net assets.
Distribution and Service Plan Fees. In accordance with Rule 12b-1 of the 1940 Act, the Fund has adopted separate Distribution and Service Plans for each class of shares. Certain classes pay Fidelity Distributors Corporation (FDC), an affiliate of the investment adviser, separate Distribution and Service Fees, each of which is based on an annual percentage of each class' average net assets. In addition, FDC may pay financial intermediaries for selling shares of the Fund and providing shareholder support services. For the period, the Distribution and Service Fee rates, total fees and amounts retained by FDC were as follows:
| | Distribution
Fee | Service
Fee | Total Fees | Retained
by FDC |
| Class A | -% | .25% | $354,555 | $1,813 |
| Class T | .25% | .25% | 211,840 | 1,174 |
| Class B | .75% | .25% | 52,193 | 39,171 |
| Class C | .75% | .25% | 593,112 | 50,470 |
| | | | $1,211,700 | $92,628 |
Sales Load. FDC may receive a front-end sales charge of up to 5.75% for selling Class A shares and 3.50% for selling Class T shares, some of which is paid to financial intermediaries for selling shares of the Fund. Depending on the holding period, FDC may receive contingent deferred sales charges levied on Class A, Class T, Class B, and Class C redemptions. The deferred sales charges range from 5.00% to 1.00% for Class B shares, 1.00% for Class C shares, 1.00% for certain purchases of Class A shares and .25% for certain purchases of Class T shares.
For the period, sales charge amounts retained by FDC were as follows:
| | Retained by FDC |
| Class A | $35,334 |
| Class T | 6,975 |
| Class B(a) | 6,110 |
| Class C(a) | 2,872 |
| | $51,291 |
(a) When Class B and Class C shares are initially sold, FDC pays commissions from its own resources to financial intermediaries through which the sales are made.
Transfer Agent Fees. Fidelity Investments Institutional Operations Company, Inc., (FIIOC), an affiliate of the investment adviser, is the transfer, dividend disbursing and shareholder servicing agent for each class of the Fund. FIIOC receives account fees and asset-based fees that vary according to the account size and type of account of the shareholders of the respective classes of the Fund. FIIOC pays for typesetting, printing and mailing of shareholder reports, except proxy statements.
For the period, transfer agent fees for each class were as follows:
| | Amount | % of
Class-Level Average
Net Assets |
| Class A | $345,368 | .24 |
| Class T | 127,554 | .30 |
| Class B | 15,550 | .30 |
| Class C | 138,331 | .23 |
| Class I | 112,096 | .19 |
| | $738,899 | |
Accounting and Security Lending Fees. Fidelity Service Company, Inc. (FSC), an affiliate of the investment adviser, maintains the Fund's accounting records. The accounting fee is based on the level of average net assets for each month. Under a separate contract, FSC administers the security lending program. The security lending fee is based on the number and duration of lending transactions.
Brokerage Commissions. The Fund placed a portion of its portfolio transactions with brokerage firms which are affiliates of the investment adviser. Brokerage commissions are included in net realized gain (loss) and change in net unrealized appreciation (depreciation) in the Statement of Operations. The commissions paid to these affiliated firms were $328 for the period.
Other. During the period, the investment adviser reimbursed the Fund for certain losses in the amount of $8,064.
Interfund Lending Program. Pursuant to an Exemptive Order issued by the SEC, the Fund, along with other registered investment companies having management contracts with FMR or other affiliated entities of FMR, may participate in an interfund lending program. This program provides an alternative credit facility allowing the funds to borrow from, or lend money to, other participating affiliated funds. At period end, there were no interfund loans outstanding. The Fund's activity in this program during the period for which loans were outstanding was as follows:
| Borrower or Lender | Average Loan Balance | Weighted Average Interest Rate | Interest Expense |
| Borrower | $10,448,000 | .36% | $527 |
6. Committed Line of Credit.
The Fund participates with other funds managed by the investment adviser or an affiliate in a $4.25 billion credit facility (the "line of credit") to be utilized for temporary or emergency purposes to fund shareholder redemptions or for other short-term liquidity purposes. The Fund has agreed to pay commitment fees on its pro-rata portion of the line of credit, which amounted to $444 and is reflected in Miscellaneous expenses on the Statement of Operations. During the period, the Fund did not borrow on this line of credit.
7. Security Lending.
The Fund lends portfolio securities through a lending agent from time to time in order to earn additional income. For equity securities, a lending agent is used and may loan securities to certain qualified borrowers, including Fidelity Capital Markets (FCM), a broker-dealer affiliated with the Fund. On the settlement date of the loan, the Fund receives collateral (in the form of U.S. Treasury obligations, letters of credit and/or cash) against the loaned securities and maintains collateral in an amount not less than 100% of the market value of the loaned securities during the period of the loan. The market value of the loaned securities is determined at the close of business of the Fund and any additional required collateral is delivered to the Fund on the next business day. The Fund or borrower may terminate the loan at any time, and if the borrower defaults on its obligation to return the securities loaned because of insolvency or other reasons, the Fund may apply collateral received from the borrower against the obligation. The Fund may experience delays and costs in recovering the securities loaned. Any cash collateral received is invested in the Fidelity Securities Lending Cash Central Fund. The value of loaned securities and cash collateral at period end are disclosed on the Fund's Statement of Assets and Liabilities. Security lending income represents the income earned on investing cash collateral, less rebates paid to borrowers and any lending agent fees associated with the loan, plus any premium payments received for lending certain types of securities. Security lending income is presented in the Statement of Operations as a component of income from Fidelity Central Funds. Total security lending income during the period amounted to $9,049. During the period, there were no securities loaned to FCM.
8. Expense Reductions.
Commissions paid to certain brokers with whom the investment adviser, or its affiliates, places trades on behalf of the Fund include an amount in addition to trade execution, which may be rebated back to the Fund to offset certain expenses. This amount totaled $15,254 for the period.
In addition, during the period the investment adviser reimbursed and/or waived a portion of fund-level operating expenses in the amount of $1,359 and a portion of class-level operating expenses as follows:
| | Amount |
| Class A | $3,466 |
| Class T | 136 |
| Class B | 14 |
| Class C | 1,393 |
| Class I | 1,027 |
| | $6,036 |
9. Distributions to Shareholders.
Distributions to shareholders of each class were as follows:
| Years ended October 31, | 2015 | 2014 |
| From net investment income | | |
| Class A | $822,279 | $1,258,600 |
| Class T | 110,077 | 253,592 |
| Class C | – | 67,365 |
| Class I | 466,265 | 431,805 |
| Total | $1,398,621 | $2,011,362 |
| From net realized gain | | |
| Class A | $7,521,830 | $6,564,461 |
| Class T | 2,362,422 | 2,044,109 |
| Class B | 322,901 | 453,142 |
| Class C | 3,108,927 | 2,799,874 |
| Class I | 2,525,980 | 1,622,320 |
| Total | $15,842,060 | $13,483,906 |
10. Share Transactions.
Share transactions for each class were as follows and may contain automatic conversions between classes or exchanges between funds:
| | Shares | Shares | Dollars | Dollars |
| Years ended October 31, | 2015 | 2014 | 2015 | 2014 |
| Class A | | | | |
| Shares sold | 687,127 | 573,747 | $21,712,763 | $17,697,836 |
| Reinvestment of distributions | 249,985 | 228,279 | 7,544,560 | 6,811,859 |
| Shares redeemed | (1,101,494) | (1,220,608) | (33,216,845) | (37,276,981) |
| Net increase (decrease) | (164,382) | (418,582) | $(3,959,522) | $(12,767,286) |
| Class T | | | | |
| Shares sold | 134,384 | 138,080 | $4,095,325 | $4,191,092 |
| Reinvestment of distributions | 82,920 | 77,360 | 2,437,846 | 2,251,960 |
| Shares redeemed | (296,419) | (345,644) | (8,755,323) | (10,192,417) |
| Net increase (decrease) | (79,115) | (130,204) | $(2,222,152) | $(3,749,365) |
| Class B | | | | |
| Shares sold | 4,883 | 8,605 | $142,572 | $250,322 |
| Reinvestment of distributions | 10,090 | 13,707 | 283,216 | 380,925 |
| Shares redeemed | (104,780) | (148,296) | (2,930,407) | (4,170,831) |
| Net increase (decrease) | (89,807) | (125,984) | $(2,504,619) | $(3,539,584) |
| Class C | | | | |
| Shares sold | 485,886 | 212,902 | $14,051,553 | $6,070,821 |
| Reinvestment of distributions | 98,091 | 89,602 | 2,712,206 | 2,461,356 |
| Shares redeemed | (563,292) | (497,988) | (15,169,240) | (13,805,000) |
| Net increase (decrease) | 20,685 | (195,484) | $1,594,519 | $(5,272,823) |
| Class I | | | | |
| Shares sold | 1,486,922 | 1,068,125 | $48,941,250 | $34,572,790 |
| Reinvestment of distributions | 81,888 | 52,027 | 2,540,162 | 1,594,630 |
| Shares redeemed | (1,303,858) | (770,899) | (40,320,585) | (24,061,907) |
| Net increase (decrease) | 264,952 | 349,253 | $11,160,827 | $12,105,513 |
11. Other.
The Fund's organizational documents provide former and current trustees and officers with a limited indemnification against liabilities arising in connection with the performance of their duties to the Fund. In the normal course of business, the Fund may also enter into contracts that provide general indemnifications. The Fund's maximum exposure under these arrangements is unknown as this would be dependent on future claims that may be made against the Fund. The risk of material loss from such claims is considered remote.
Report of Independent Registered Public Accounting Firm
To the Trustees of Fidelity Advisor Series VIII and Shareholders of Fidelity Advisor® Emerging Asia Fund:
In our opinion, the accompanying statement of assets and liabilities, including the schedule of investments, and the related statements of operations and of changes in net assets and the financial highlights present fairly, in all material respects, the financial position of Fidelity Advisor® Emerging Asia Fund (a fund of Fidelity Advisor Series VIII) at October 31, 2015, the results of its operations for the year then ended, the changes in its net assets for each of the two years in the period then ended and the financial highlights for each of the five years in the period then ended, in conformity with accounting principles generally accepted in the United States of America. These financial statements and financial highlights (hereafter referred to as “financial statements”) are the responsibility of the Fidelity Advisor® Emerging Asia Fund’s management. Our responsibility is to express an opinion on these financial statements based on our audits. We conducted our audits of these financial statements in accordance with the standards of the Public Company Accounting Oversight Board (United States). Those standards require that we plan and perform the audit to obtain reasonable assurance about whether the financial statements are free of material misstatement. An audit includes examining, on a test basis, evidence supporting the amounts and disclosures in the financial statements, assessing the accounting principles used and significant estimates made by management, and evaluating the overall financial statement presentation. We believe that our audits, which included confirmation of securities at October 31, 2015 by correspondence with the custodian and brokers, provide a reasonable basis for our opinion.
PricewaterhouseCoopers LLP
Boston, Massachusetts
December 16, 2015
Trustees and Officers
The Trustees, Members of the Advisory Board (if any), and officers of the trust and fund, as applicable, are listed below. The Board of Trustees governs the fund and is responsible for protecting the interests of shareholders. The Trustees are experienced executives who meet periodically throughout the year to oversee the fund's activities, review contractual arrangements with companies that provide services to the fund, oversee management of the risks associated with such activities and contractual arrangements, and review the fund's performance. Each of the Trustees oversees 170 funds.
The Trustees hold office without limit in time except that (a) any Trustee may resign; (b) any Trustee may be removed by written instrument, signed by at least two-thirds of the number of Trustees prior to such removal; (c) any Trustee who requests to be retired or who has become incapacitated by illness or injury may be retired by written instrument signed by a majority of the other Trustees; and (d) any Trustee may be removed at any special meeting of shareholders by a two-thirds vote of the outstanding voting securities of the trust. Each Trustee who is not an interested person (as defined in the 1940 Act) of the trust and the fund is referred to herein as an Independent Trustee. Each Independent Trustee shall retire not later than the last day of the calendar year in which his or her 75th birthday occurs. The Independent Trustees may waive this mandatory retirement age policy with respect to individual Trustees. Officers and Advisory Board Members hold office without limit in time, except that any officer or Advisory Board Member may resign or may be removed by a vote of a majority of the Trustees at any regular meeting or any special meeting of the Trustees. Except as indicated, each individual has held the office shown or other offices in the same company for the past five years.
The fund’s Statement of Additional Information (SAI) includes more information about the Trustees. To request a free copy, call Fidelity at 1-877-208-0098.
Experience, Skills, Attributes, and Qualifications of the Trustees. The Governance and Nominating Committee has adopted a statement of policy that describes the experience, qualifications, attributes, and skills that are necessary and desirable for potential Independent Trustee candidates (Statement of Policy). The Board believes that each Trustee satisfied at the time he or she was initially elected or appointed a Trustee, and continues to satisfy, the standards contemplated by the Statement of Policy. The Governance and Nominating Committee also engages professional search firms to help identify potential Independent Trustee candidates who have the experience, qualifications, attributes, and skills consistent with the Statement of Policy. From time to time, additional criteria based on the composition and skills of the current Independent Trustees, as well as experience or skills that may be appropriate in light of future changes to board composition, business conditions, and regulatory or other developments, have also been considered by the professional search firms and the Governance and Nominating Committee. In addition, the Board takes into account the Trustees' commitment and participation in Board and committee meetings, as well as their leadership of standing and ad hoc committees throughout their tenure.
In determining that a particular Trustee was and continues to be qualified to serve as a Trustee, the Board has considered a variety of criteria, none of which, in isolation, was controlling. The Board believes that, collectively, the Trustees have balanced and diverse experience, qualifications, attributes, and skills, which allow the Board to operate effectively in governing the fund and protecting the interests of shareholders. Information about the specific experience, skills, attributes, and qualifications of each Trustee, which in each case led to the Board's conclusion that the Trustee should serve (or continue to serve) as a trustee of the fund, is provided below.
Board Structure and Oversight Function. James C. Curvey is an interested person and currently serves as Chairman. The Trustees have determined that an interested Chairman is appropriate and benefits shareholders because an interested Chairman has a personal and professional stake in the quality and continuity of services provided to the fund. Independent Trustees exercise their informed business judgment to appoint an individual of their choosing to serve as Chairman, regardless of whether the Trustee happens to be independent or a member of management. The Independent Trustees have determined that they can act independently and effectively without having an Independent Trustee serve as Chairman and that a key structural component for assuring that they are in a position to do so is for the Independent Trustees to constitute a substantial majority for the Board. The Independent Trustees also regularly meet in executive session. Ned C. Lautenbach serves as Chairman of the Independent Trustees and as such (i) acts as a liaison between the Independent Trustees and management with respect to matters important to the Independent Trustees and (ii) with management prepares agendas for Board meetings.
Fidelity® funds are overseen by different Boards of Trustees. The fund's Board oversees Fidelity's high income and certain equity funds, and other Boards oversee Fidelity's investment-grade bond, money market, asset allocation, and sector funds. The asset allocation funds may invest in Fidelity® funds overseen by the fund's Board. The use of separate Boards, each with its own committee structure, allows the Trustees of each group of Fidelity® funds to focus on the unique issues of the funds they oversee, including common research, investment, and operational issues. On occasion, the separate Boards establish joint committees to address issues of overlapping consequences for the Fidelity® funds overseen by each Board.
The Trustees operate using a system of committees to facilitate the timely and efficient consideration of all matters of importance to the Trustees, the fund, and fund shareholders and to facilitate compliance with legal and regulatory requirements and oversight of the fund's activities and associated risks. The Board, acting through its committees, has charged FMR and its affiliates with (i) identifying events or circumstances the occurrence of which could have demonstrably adverse effects on the fund's business and/or reputation; (ii) implementing processes and controls to lessen the possibility that such events or circumstances occur or to mitigate the effects of such events or circumstances if they do occur; and (iii) creating and maintaining a system designed to evaluate continuously business and market conditions in order to facilitate the identification and implementation processes described in (i) and (ii) above. Because the day-to-day operations and activities of the fund are carried out by or through FMR, its affiliates, and other service providers, the fund's exposure to risks is mitigated but not eliminated by the processes overseen by the Trustees. While each of the Board's committees has responsibility for overseeing different aspects of the fund's activities, oversight is exercised primarily through the Operations, Audit, and Compliance Committees. In addition, the Independent Trustees have worked with FMR to enhance the Board's oversight of investment and financial risks, legal and regulatory risks, technology risks, and operational risks, including the development of additional risk reporting to the Board. For example, a working group comprised of Independent Trustees and FMR has worked and continues to work to review the Fidelity® funds' valuation-related activities, reporting and risk management. Appropriate personnel, including but not limited to the fund's Chief Compliance Officer (CCO), FMR's internal auditor, the independent accountants, the fund's Treasurer and portfolio management personnel, make periodic reports to the Board's committees, as appropriate, including an annual review of Fidelity's risk management program for the Fidelity® funds. The responsibilities of each standing committee, including their oversight responsibilities, are described further under "Standing Committees of the Trustees."
Interested Trustees*:
Correspondence intended for a Trustee who is an interested person may be sent to Fidelity Investments, 245 Summer Street, Boston, Massachusetts 02210.
Name, Year of Birth; Principal Occupations and Other Relevant Experience+
James C. Curvey (1935)
Year of Election or Appointment: 2007
Trustee
Chairman of the Board of Trustees
Mr. Curvey also serves as Trustee of other Fidelity® funds. Mr. Curvey is a Director of Fidelity Research & Analysis Co. (investment adviser firm, 2009-present), and Vice Chairman (2007-present) and Director of FMR LLC (diversified financial services company). In addition, Mr. Curvey serves as an Overseer for the Boston Symphony Orchestra and a member of the board of Artis-Naples, Naples, Florida, and as a Trustee for Brewster Academy, Wolfeboro, New Hampshire. Previously, Mr. Curvey served as a Director of Fidelity Investments Money Management, Inc. (investment adviser firm, 2009-2014) and a Director of FMR and FMR Co., Inc. (investment adviser firms, 2007-2014).
Charles S. Morrison (1960)
Year of Election or Appointment: 2014
Trustee
Mr. Morrison also serves as Trustee of other funds. He serves as a Director of Fidelity Investments Money Management, Inc. (FIMM) (investment adviser firm, 2014-present), Director of Fidelity SelectCo, LLC (investment adviser firm, 2014-present), President, Asset Management (2014-present), and is an employee of Fidelity Investments. Previously, Mr. Morrison served as Vice President of Fidelity's Fixed Income and Asset Allocation Funds (2012-2014), President, Fixed Income (2011-2014), Vice President of Fidelity's Money Market Funds (2005-2009), President, Money Market Group Leader of FMR (investment adviser firm, 2009), and Senior Vice President, Money Market Group of FMR (2004-2009). Mr. Morrison also served as Vice President of Fidelity's Bond Funds (2002-2005), certain Balanced Funds (2002-2005), and certain Asset Allocation Funds (2002-2007), and as Senior Vice President (2002-2005) of Fidelity's Bond Division.
* Determined to be an “Interested Trustee” by virtue of, among other things, his or her affiliation with the trust or various entities under common control with FMR.
+ The information includes the Trustee's principal occupation during the last five years and other information relating to the experience, attributes, and skills relevant to the Trustee's qualifications to serve as a Trustee, which led to the conclusion that the Trustee should serve as a Trustee for the fund.
Independent Trustees:
Correspondence intended for an Independent Trustee may be sent to Fidelity Investments, P.O. Box 55235, Boston, Massachusetts 02205-5235.
Name, Year of Birth; Principal Occupations and Other Relevant Experience+
Dennis J. Dirks (1948)
Year of Election or Appointment: 2005
Trustee
Mr. Dirks also serves as Trustee of other Fidelity® funds. Prior to his retirement in May 2003, Mr. Dirks was Chief Operating Officer and a member of the Board of The Depository Trust & Clearing Corporation (DTCC). He also served as President, Chief Operating Officer, and Board member of The Depository Trust Company (DTC) and President and Board member of the National Securities Clearing Corporation (NSCC). In addition, Mr. Dirks served as Chief Executive Officer and Board member of the Government Securities Clearing Corporation, Chief Executive Officer and Board member of the Mortgage-Backed Securities Clearing Corporation, as a Trustee and a member of the Finance Committee of Manhattan College (2005-2008), as a Trustee and a member of the Finance Committee of AHRC of Nassau County (2006-2008), and as a member of the Independent Directors Council (IDC) Governing Council (2010-2015). Mr. Dirks is a member of the Board of Directors for The Brookville Center for Children's Services, Inc. (2009-present).
Alan J. Lacy (1953)
Year of Election or Appointment: 2008
Trustee
Mr. Lacy also serves as Trustee of other Fidelity® funds. Mr. Lacy serves as a member of the Board of Directors of Dave & Buster's Entertainment, Inc. (restaurant and entertainment complexes, 2010-present) and Bristol-Myers Squibb Company (global pharmaceuticals, 2008-present). In addition, Mr. Lacy served as Senior Adviser (2007-2014) of Oak Hill Capital Partners, L.P. (private equity) and also served as Chief Executive Officer (2000-2005) and Vice Chairman (2005-2006) of Sears Holdings Corporation and Sears, Roebuck and Co. (retail). Mr. Lacy is a member of the Board of Trustees of The National Parks Conservation Association (2006-present). Previously, Mr. Lacy served as Chairman of the Board of Trustees of the National Parks Conservation Association (2008-2011) and as a member of the Board of Directors for The Western Union Company (global money transfer, 2006-2011), The Hillman Companies, Inc. (hardware wholesalers, 2010-2014), and Earth Fare, Inc. (retail grocery, 2010-2014).
Ned C. Lautenbach (1944)
Year of Election or Appointment: 2000
Trustee
Chairman of the Independent Trustees
Mr. Lautenbach also serves as Trustee of other Fidelity® funds. Mr. Lautenbach currently serves as the Lead Director of the Eaton Corporation Board of Directors (diversified industrial, 1997-present). Mr. Lautenbach is Chairman of the Board of Directors of Artis-Naples in Naples, Florida (2012-present), a member of the Council on Foreign Relations (1994-present), and a member of the Board of Governors, State University System of Florida (2013-present). Previously, Mr. Lautenbach was a Partner/Advisory Partner at Clayton, Dubilier & Rice, LLC (private equity investment, 1998-2010), as well as a Director of Sony Corporation (2006-2007).
Joseph Mauriello (1944)
Year of Election or Appointment: 2008
Trustee
Mr. Mauriello also serves as Trustee of other Fidelity® funds. Prior to his retirement in January 2006, Mr. Mauriello served in numerous senior management positions including Deputy Chairman and Chief Operating Officer (2004-2005), and Vice Chairman of Financial Services (2002-2004) of KPMG LLP US (professional services, 1965-2005). Mr. Mauriello currently serves as a member of the Board of Directors of XL Group plc. (global insurance and re-insurance, 2006-present) and the Independent Directors Council (IDC) Governing Council (2015-present). Previously, Mr. Mauriello served as a Director of the Hamilton Funds of the Bank of New York (2006-2007) and of Arcadia Resources Inc. (health care services and products, 2007-2012).
Robert W. Selander (1950)
Year of Election or Appointment: 2011
Trustee
Mr. Selander also serves as Trustee of other Fidelity® funds. Mr. Selander serves as a Director of The Western Union Company (global money transfer, 2014-present). Previously, Mr. Selander served as a Member of the Advisory Board of other Fidelity® funds (2011), and Executive Vice Chairman (2010), Chief Executive Officer (2009-2010), and President and Chief Executive Officer (1997-2009) of Mastercard, Inc.
Cornelia M. Small (1944)
Year of Election or Appointment: 2005
Trustee
Ms. Small also serves as Trustee of other Fidelity® funds. Ms. Small is a member of the Board of Directors (2009-present) and Chair of the Investment Committee (2010-present) of the Teagle Foundation. Ms. Small also serves on the Investment Committee of the Berkshire Taconic Community Foundation (2008-present). Previously, Ms. Small served as Chairperson (2002-2008) and a member of the Investment Committee and Chairperson (2008-2012) and a member of the Board of Trustees of Smith College. In addition, Ms. Small served as Chief Investment Officer, Director of Global Equity Investments, and a member of the Board of Directors of Scudder, Stevens & Clark and Scudder Kemper Investments.
William S. Stavropoulos (1939)
Year of Election or Appointment: 2001
Trustee
Vice Chairman of the Independent Trustees
Mr. Stavropoulos also serves as Trustee of other Fidelity® funds. Mr. Stavropoulos serves as President and Founder of the Michigan Baseball Foundation, the Great Lakes Loons (2007-present). Mr. Stavropoulos is Chairman Emeritus of the Board of Directors of The Dow Chemical Company, where he previously served in numerous senior management positions, including President, CEO (1995-2000; 2002-2004), Chairman of the Executive Committee (2000-2006), and as a member of the Board of Directors (1990-2006). Currently, Mr. Stavropoulos is Chairman of the Board of Directors of Univar Inc. (global distributor of commodity and specialty chemicals), a Director of Teradata Corporation (data warehousing and technology solutions), and Maersk Inc. (industrial conglomerate), and a member of the Advisory Board for Metalmark Capital LLC (private equity investment, 2005-present). Mr. Stavropoulos is an operating advisor to Clayton, Dubilier & Rice, LLC (private equity investment). In addition, Mr. Stavropoulos is a member of the University of Notre Dame Advisory Council for the College of Science, a Trustee of the Rollin L. Gerstacker Foundation, and a Director of the Naples Philharmonic Center for the Arts. Previously, Mr. Stavropoulos served as a Director of Chemical Financial Corporation (bank holding company, 1993-2012) and Tyco International, Ltd. (multinational manufacturing and services, 2007-2012).
David M. Thomas (1949)
Year of Election or Appointment: 2008
Trustee
Mr. Thomas also serves as Trustee of other Fidelity® funds. Mr. Thomas serves as Non-Executive Chairman of the Board of Directors of Fortune Brands Home and Security (home and security products, 2011-present), as a member of the Board of Directors (2004-present) and Presiding Director (2013-present) of Interpublic Group of Companies, Inc. (marketing communication), and as a member of the Board of Trustees of the University of Florida (2013-present). Previously, Mr. Thomas served as Executive Chairman (2005-2006) and Chairman and Chief Executive Officer (2000-2005) of IMS Health, Inc. (pharmaceutical and healthcare information solutions), and a Director of Fortune Brands, Inc. (consumer products, 2000-2011).
+ The information includes the Trustee's principal occupation during the last five years and other information relating to the experience, attributes, and skills relevant to the Trustee's qualifications to serve as a Trustee, which led to the conclusion that the Trustee should serve as a Trustee for the fund.
Advisory Board Members and Officers:
Correspondence intended for an officer or Peter S. Lynch may be sent to Fidelity Investments, 245 Summer Street, Boston, Massachusetts 02210. Officers appear below in alphabetical order.
Name, Year of Birth; Principal Occupation
Peter S. Lynch (1944)
Year of Election or Appointment: 2003
Member of the Advisory Board
Mr. Lynch also serves as Member of the Advisory Board of other Fidelity® funds. Mr. Lynch is Vice Chairman and a Director of FMR (investment adviser firm) and FMR Co., Inc. (investment adviser firm). In addition, Mr. Lynch serves as a Trustee of Boston College and as the Chairman of the Inner-City Scholarship Fund. Previously, Mr. Lynch served on the Special Olympics International Board of Directors (1997-2006).
Elizabeth Paige Baumann (1968)
Year of Election or Appointment: 2012
Anti-Money Laundering (AML) Officer
Ms. Baumann also serves as AML Officer of other funds. She is Chief AML Officer of FMR LLC (diversified financial services company, 2012-present) and is an employee of Fidelity Investments. Previously, Ms. Baumann served as Vice President and Deputy Anti-Money Laundering Officer (2007-2012).
Marc R. Bryant (1966)
Year of Election or Appointment: 2015
Secretary and Chief Legal Officer (CLO)
Mr. Bryant also serves as Secretary and CLO of other funds. Mr. Bryant serves as CLO, Secretary, and Senior Vice President of Fidelity Management & Research Company (investment adviser firm, 2015-present) and FMR Co., Inc. (investment adviser firm, 2015-present); Secretary of Fidelity SelectCo, LLC (investment adviser firm, 2015-present) and Fidelity Investments Money Management, Inc. (investment adviser firm, 2015-present); and CLO of Fidelity Management & Research (Hong Kong) Limited (investment adviser firm, 2015-present). He is Senior Vice President and Deputy General Counsel of FMR LLC (diversified financial services company). Previously, Mr. Bryant served as Secretary and Chief Legal Officer of Fidelity Rutland Square Trust II (2010-2014) and Assistant Secretary of Fidelity's Fixed Income and Asset Allocation Funds (2013-2015). Prior to joining Fidelity Investments, Mr. Bryant served as a Senior Vice President and the Head of Global Retail Legal for AllianceBernstein L.P. (2006-2010), and as the General Counsel for ProFund Advisors LLC (2001-2006).
Timothy M. Cohen (1969)
Year of Election or Appointment: 2014
Vice President of certain Equity Funds
Mr. Cohen also serves as Vice President of other funds. Mr. Cohen serves as Chief Compliance Officer of FMR Investment Management (U.K.) Limited (investment adviser firm, 2013-present) and is an employee of Fidelity Investments. Previously, Mr. Cohen served as a Director of FMR Investment Management (U.K.) Limited (2013-2015).
William C. Coffey (1969)
Year of Election or Appointment: 2009
Assistant Secretary
Mr. Coffey also serves as Assistant Secretary of other funds. He is Senior Vice President and Deputy General Counsel of FMR LLC (diversified financial services company, 2010-present), and is an employee of Fidelity Investments. Previously, Mr. Coffey served as Vice President and Associate General Counsel of FMR LLC (2005-2009).
Jonathan Davis (1968)
Year of Election or Appointment: 2010
Assistant Treasurer
Mr. Davis also serves as Assistant Treasurer of other funds, and is an employee of Fidelity Investments. Previously, Mr. Davis served as Vice President and Associate General Counsel of FMR LLC (diversified financial services company, 2003-2010).
Adrien E. Deberghes (1967)
Year of Election or Appointment: 2008
Deputy Treasurer
Mr. Deberghes also serves as an officer of other funds. He is an employee of Fidelity Investments (2008-present). Prior to joining Fidelity Investments, Mr. Deberghes was Senior Vice President of Mutual Fund Administration at State Street Corporation (2007-2008), Senior Director of Mutual Fund Administration at Investors Bank & Trust (2005-2007), and Director of Finance for Dunkin' Brands (2000-2005).
Stephanie J. Dorsey (1969)
Year of Election or Appointment: 2010
Assistant Treasurer
Ms. Dorsey also serves as an officer of other funds. She is an employee of Fidelity Investments (2008-present) and has served in other fund officer roles. Prior to joining Fidelity Investments, Ms. Dorsey served as Treasurer (2004-2008) of the JPMorgan Mutual Funds and Vice President (2004-2008) of JPMorgan Chase Bank.
Howard J. Galligan III (1966)
Year of Election or Appointment: 2014
Chief Financial Officer
Mr. Galligan also serves as Chief Financial Officer of other funds. Mr. Galligan serves as President of Fidelity Pricing and Cash Management Services (FPCMS) (2014-present) and as a Director of Strategic Advisers, Inc. (investment adviser firm, 2008-present). Previously, Mr. Galligan served as Chief Administrative Officer of Asset Management (2011-2014) and Chief Operating Officer and Senior Vice President of Investment Support for Strategic Advisers, Inc. (2003-2011).
Scott C. Goebel (1968)
Year of Election or Appointment: 2015
Vice President
Mr. Goebel serves as Vice President of other funds and is an employee of Fidelity Investments (2001-present). Previously, Mr. Goebel served as Secretary of Fidelity SelectCo, LLC (investment adviser firm, 2013-2015), Fidelity Investments Money Management, Inc. (FIMM) (investment adviser firm, 2010-2015), and Fidelity Research and Analysis Company (FRAC) (investment adviser firm, 2010-2015); General Counsel, Secretary, and Senior Vice President of Fidelity Management & Research Company (investment adviser firm, 2008-2015) and FMR Co., Inc. (investment adviser firm, 2008-2015); Assistant Secretary of Fidelity Management & Research (Japan) Limited (investment adviser firm, 2008-2015) and FMR Investment Management (U.K.) Limited (investment adviser firm, 2008-2015); Chief Legal Officer (CLO) of Fidelity Management & Research (Hong Kong) Limited (investment adviser firm, 2008-2015); Secretary and CLO of certain Fidelity® funds (2008-2015); Assistant Secretary of FIMM (2008-2010), FRAC (2008-2010), and certain funds (2007-2008); and as Vice President and Secretary of Fidelity Distributors Corporation (FDC) (2005-2007).
Brian B. Hogan (1964)
Year of Election or Appointment: 2009
Vice President
Mr. Hogan also serves as Trustee or Vice President of other funds. Mr. Hogan serves as a Director of Fidelity SelectCo, LLC (investment adviser firm, 2014-present) and President of the Equity Division of FMR (investment adviser firm, 2009-present). Previously, Mr. Hogan served as Senior Vice President, Equity Research of FMR (2006-2009) and as a portfolio manager.
Chris Maher (1972)
Year of Election or Appointment: 2013
Assistant Treasurer
Mr. Maher serves as Assistant Treasurer of other funds. Mr. Maher is Vice President of Valuation Oversight and is an employee of Fidelity Investments. Previously, Mr. Maher served as Vice President of Asset Management Compliance (2013), Vice President of the Program Management Group of FMR (investment adviser firm, 2010-2013), and Vice President of Valuation Oversight (2008-2010).
Kenneth B. Robins (1969)
Year of Election or Appointment: 2008
President and Treasurer
Mr. Robins also serves as an officer of other funds. Mr. Robins serves as Executive Vice President of Fidelity Investments Money Management, Inc. (FIMM) (investment adviser firm, 2013-present) and is an employee of Fidelity Investments (2004-present). Previously, Mr. Robins served in other fund officer roles.
Stacie M. Smith (1974)
Year of Election or Appointment: 2013
Deputy Treasurer
Ms. Smith also serves as an officer of other funds. She is an employee of Fidelity Investments (2009-present) and has served in other fund officer roles. Prior to joining Fidelity Investments, Ms. Smith served as Senior Audit Manager of Ernst & Young LLP (1996-2009).
Renee Stagnone (1975)
Year of Election or Appointment: 2013
Deputy Treasurer
Ms. Stagnone also serves as Deputy Treasurer of other funds. Ms. Stagnone is an employee of Fidelity Investments (1997-present).
Linda J. Wondrack (1964)
Year of Election or Appointment: 2014
Chief Compliance Officer
Ms. Wondrack also serves as Chief Compliance Officer of other funds. Ms. Wondrack is Executive Vice President and head of the Ethics Office and Asset Management Compliance for Fidelity Investments (2012-present). Ms. Wondrack also serves as Chief Compliance Officer of Fidelity SelectCo, LLC (investment adviser firm, 2014-present); Chief Compliance Officer of Impresa Management LLC (2013-present); and Chief Compliance Officer of FMR Co., Inc. (investment adviser firm), Fidelity Investments Money Management, Inc. (investment adviser firm), Fidelity Management & Research (Japan) Limited (investment adviser firm), FMR Investment Management (U.K.) Limited (investment adviser firm), Fidelity Management & Research (Hong Kong) (investment adviser firm), Fidelity Management & Research Company (investment adviser firm), FIAM LLC (investment adviser firm), and Strategic Advisers, Inc. (investment adviser firm), Ballyrock Investment Advisors LLC, and Northern Neck Investors LLC (2012-present). Previously, Ms. Wondrack served as Senior Vice President and Chief Compliance Officer for Columbia Management Investment Advisers, LLC (2005-2012); Chief Compliance Officer for certain funds within the Columbia Family of Funds (2007-2012); and Senior Vice President of Compliance Risk Management at Bank of America (2005-2010).
Joseph F. Zambello (1957)
Year of Election or Appointment: 2011
Deputy Treasurer
Mr. Zambello also serves as Deputy Treasurer of other funds. Mr. Zambello is an employee of Fidelity Investments (1991-present). Previously, Mr. Zambello served as Vice President of the Program Management Group of FMR (investment adviser firm, 2009-2011) and Vice President of the Transfer Agent Oversight Group (2005-2009).
Shareholder Expense Example
As a shareholder of the Fund, you incur two types of costs: (1) transaction costs, including sales charges (loads) on purchase payments or redemption proceeds, redemption fees and (2) ongoing costs, including management fees, distribution and/or service (12b-1) fees and other Fund expenses. This Example is intended to help you understand your ongoing costs (in dollars) of investing in the Fund and to compare these costs with the ongoing costs of investing in other mutual funds.
The Example is based on an investment of $1,000 invested at the beginning of the period and held for the entire period (May 1, 2015 to October 31, 2015).
Actual Expenses
The first line of the accompanying table for each class of the Fund provides information about actual account values and actual expenses. You may use the information in this line, together with the amount you invested, to estimate the expenses that you paid over the period. Simply divide your account value by $1,000.00 (for example, an $8,600 account value divided by $1,000.00 = 8.6), then multiply the result by the number in the first line for a class of the Fund under the heading entitled "Expenses Paid During Period" to estimate the expenses you paid on your account during this period. In addition, the Fund, as a shareholder in the underlying Fidelity Central Funds, will indirectly bear its pro-rata share of the fees and expenses incurred by the underlying Fidelity Central Funds. These fees and expenses are not included in the Fund's annualized expense ratio used to calculate the expense estimate in the table below.
Hypothetical Example for Comparison Purposes
The second line of the accompanying table for each class of the Fund provides information about hypothetical account values and hypothetical expenses based on a Class' actual expense ratio and an assumed rate of return of 5% per year before expenses, which is not the Class' actual return. The hypothetical account values and expenses may not be used to estimate the actual ending account balance or expenses you paid for the period. You may use this information to compare the ongoing costs of investing in the Fund and other funds. To do so, compare this 5% hypothetical example with the 5% hypothetical examples that appear in the shareholder reports of the other funds. In addition, the Fund, as a shareholder in the underlying Fidelity Central Funds, will indirectly bear its pro-rata share of the fees and expenses incurred by the underlying Fidelity Central Funds. These fees and expenses are not included in the Fund's annualized expense ratio used to calculate the expense estimate in the table below.
Please note that the expenses shown in the table are meant to highlight your ongoing costs only and do not reflect any transaction costs. Therefore, the second line of the table is useful in comparing ongoing costs only, and will not help you determine the relative total costs of owning different funds. In addition, if these transactional costs were included, your costs would have been higher.
| | Annualized Expense Ratio-A | Beginning
Account Value
May 1, 2015 | Ending
Account Value
October 31, 2015 | Expenses Paid
During Period-B
May 1, 2015
to October 31, 2015 |
| Class A | 1.36% | | | |
| Actual | | $1,000.00 | $838.40 | $6.30 |
| Hypothetical-C | | $1,000.00 | $1,018.35 | $6.92 |
| Class T | 1.66% | | | |
| Actual | | $1,000.00 | $837.00 | $7.69 |
| Hypothetical-C | | $1,000.00 | $1,016.84 | $8.44 |
| Class B | 2.16% | | | |
| Actual | | $1,000.00 | $835.20 | $9.99 |
| Hypothetical-C | | $1,000.00 | $1,014.32 | $10.97 |
| Class C | 2.10% | | | |
| Actual | | $1,000.00 | $835.30 | $9.71 |
| Hypothetical-C | | $1,000.00 | $1,014.62 | $10.66 |
| Class I | 1.06% | | | |
| Actual | | $1,000.00 | $839.60 | $4.92 |
| Hypothetical-C | | $1,000.00 | $1,019.86 | $5.40 |
A Annualized expense ratio reflects expenses net of applicable fee waivers.
B Expenses are equal to each Class' annualized expense ratio, multiplied by the average account value over the period, multiplied by 184/365 (to reflect the one-half year period).
C 5% return per year before expenses
Distributions (Unaudited)
The Board of Trustees of Advisor Emerging Asia Fund voted to pay to shareholders of record at the opening of business on record date, the following distributions per share derived from capital gains realized from sales of portfolio securities, and dividends derived from net investment income:
| | Pay Date | Record Date | Dividends | Capital Gains |
| Class I | 12/07/15 | 12/04/15 | $ 0.3160 | $ 0.2300 |
The fund hereby designates as a capital gain dividend with respect to the taxable year ended October 31, 2015, $4,093,314 or, if subsequently determined to be different, the net capital gain of such year.
Class I designates 1% of the dividends distributed in December 2014, respectively during the fiscal year as qualifying for the dividends-received deduction for corporate shareholders.
Class I designates 79% of the dividends distributed during the fiscal year as amounts which may be taken into account as a dividend for purposes of the maximum rate under section 1(h)(11) of the Internal Revenue Code.
The amounts per share which represent income derived from sources within, and taxes paid to, foreign countries or possessions of the United States are as follows:
| | Pay Date | Income | Taxes |
| Class I | 12/08/14 | $ 0.6199 | $ 0.1569 |
The fund will notify shareholders in January 2016 of amounts for use in preparing 2015 income tax returns.
Board Approval of Investment Advisory Contracts and Management Fees
Fidelity Advisor Emerging Asia Fund
Each year, the Board of Trustees, including the Independent Trustees (together, the Board), votes on the renewal of the management contract with Fidelity Management & Research Company (FMR) and the sub-advisory agreements (together, the Advisory Contracts) for the fund. The Board, assisted by the advice of fund counsel and Independent Trustees' counsel, requests and considers a broad range of information relevant to the renewal of the Advisory Contracts throughout the year.
The Board meets regularly and, at each of its meetings, covers an extensive agenda of topics and materials and considers factors that are relevant to its annual consideration of the renewal of the fund's Advisory Contracts, including the services and support provided to the fund and its shareholders. The Board has established various standing committees (Committees), each composed of and chaired by Independent Trustees with varying backgrounds, to which the Board has assigned specific subject matter responsibilities in order to enhance effective decision-making by the Board. The Board, acting directly and through its Committees, requests and receives information concerning the annual consideration of the renewal of the fund's Advisory Contracts. The Board also meets as needed to consider matters specifically related to the Board's annual consideration of the renewal of the Advisory Contracts. Members of the Board may also meet with trustees of other Fidelity funds through ad hoc joint committees to discuss certain matters relevant to all of the Fidelity funds.
At its July 2015 meeting, the Board unanimously determined to renew the fund's Advisory Contracts. In reaching its determination, the Board considered all factors it believed relevant, including (i) the nature, extent, and quality of the services to be provided to the fund and its shareholders (including the investment performance of the fund); (ii) the competitiveness of the fund's management fee and total expense ratio relative to peer funds; (iii) the total costs of the services to be provided by and the profits to be realized by Fidelity from its relationship with the fund; and (iv) the extent to which (if any) economies of scale exist and would be realized as the fund grows, and whether any economies of scale are appropriately shared with fund shareholders.
In considering whether to renew the Advisory Contracts for the fund, the Board reached a determination, with the assistance of fund counsel and Independent Trustees' counsel and through the exercise of its business judgment, that the renewal of the Advisory Contracts was in the best interests of the fund and its shareholders and that the compensation payable under the Advisory Contracts was fair and reasonable. The Board's decision to renew the Advisory Contracts was not based on any single factor, but rather was based on a comprehensive consideration of all the information provided to the Board at its meetings throughout the year. The Board, in reaching its determination to renew the Advisory Contracts, was aware that shareholders of the fund have a broad range of investment choices available to them, including a wide choice among funds offered by Fidelity's competitors, and that the fund's shareholders, who have the opportunity to review and weigh the disclosure provided by the fund in its prospectus and other public disclosures, have chosen to invest in this fund, which is part of the Fidelity family of funds.
Nature, Extent, and Quality of Services Provided. The Board considered Fidelity's staffing as it relates to the fund, including the backgrounds of investment personnel of Fidelity, and also considered the fund's investment objective, strategies, and related investment philosophy. The Independent Trustees also had discussions with senior management of Fidelity's investment operations and investment groups. The Board considered the structure of the portfolio manager compensation program and whether this structure provides appropriate incentives to act in the best interests of the fund. Additionally, the Board considered the portfolio managers' investments, if any, in the funds that they manage.
Resources Dedicated to Investment Management and Support Services. The Board and the Fund Oversight and Research Committees reviewed the general qualifications and capabilities of Fidelity's investment staff, including its size, education, experience, and resources, as well as Fidelity's approach to recruiting, training, managing, and compensating investment personnel. The Board noted that Fidelity has continued to increase the resources devoted to non-U.S. offices, including expansion of Fidelity's global investment organization. The Board also noted that Fidelity's analysts have extensive resources, tools and capabilities that allow them to conduct sophisticated quantitative and fundamental analysis, as well as credit analysis of issuers, counterparties and guarantors. Further, the Board considered that Fidelity's investment professionals have sufficient access to global information and data so as to provide competitive investment results over time, and that those professionals also have access to sophisticated tools that permit them to assess portfolio construction and risk and performance attribution characteristics continuously, as well as to transmit new information and research conclusions rapidly around the world. Additionally, in its deliberations, the Board considered Fidelity's trading, risk management, and compliance capabilities and resources, which are integral parts of the investment management process.
Shareholder and Administrative Services. The Board considered (i) the nature, extent, quality, and cost of advisory, administrative, and shareholder services performed by FMR, the sub-advisers (together with FMR, the Investment Advisers), and their affiliates under the Advisory Contracts and under separate agreements covering transfer agency, pricing and bookkeeping, and securities lending services for the fund; (ii) the nature and extent of the supervision of third party service providers, principally custodians and subcustodians; and (iii) the resources devoted to, and the record of compliance with, the fund's compliance policies and procedures. The Board also reviewed the allocation of fund brokerage, including allocations to brokers affiliated with the Investment Advisers, the use of brokerage commissions to pay fund expenses, and the use of "soft" commission dollars to pay for research services.
The Board noted that the growth of fund assets over time across the complex allows Fidelity to reinvest in the development of services designed to enhance the value or convenience of the Fidelity funds as investment vehicles. These services include 24-hour access to account information and market information through telephone representatives and over the Internet, investor education materials and asset allocation tools, and the expanded availability of Fidelity Investor Centers.
In 2014, the Board formed an ad hoc Committee on Transfer Agency Fees to review the variety of transfer agency fee structures throughout the industry and Fidelity's competitive positioning with respect to industry participants.
Investment in a Large Fund Family. The Board considered the benefits to shareholders of investing in a Fidelity fund, including the benefits of investing in a fund that is part of a large family of funds offering a variety of investment disciplines and providing a large variety of mutual fund investor services. The Board noted that Fidelity had taken, or had made recommendations that resulted in the Fidelity funds taking, a number of actions over the previous year that benefited particular funds, including (i) continuing to dedicate additional resources to investment research and to the support of the senior management team that oversees asset management; (ii) continuing efforts to enhance Fidelity's global research capabilities; (iii) launching new funds and making other enhancements to meet client needs; (iv) reducing management fees and total expenses for certain index funds and diversified international funds; (v) continuing to launch dedicated lower cost underlying funds to meet portfolio construction needs related to expanding underlying fund options for Fidelity funds of funds, specifically for the Freedom Fund product lines; (vi) rationalizing product lines and gaining increased efficiencies through fund mergers; (vii) launching active fixed-income exchange-traded funds; (viii) continuing to develop, acquire and implement systems and technology to improve services to the funds and information security and to increase efficiency; (ix) implementing investment enhancements to further strengthen Fidelity's target date product line to increase investors' probability of success in achieving their goals; (x) modifying the eligibility criteria for certain share classes to accommodate roll-over assets from employer-sponsored retirement plans; (xi) launching a new Class W of the Freedom Index Funds to attract and retain Fidelity record-kept retirement plan assets; and (xii) implementing changes to Fidelity's money market product line in response to recent money market regulatory reforms.
Investment Performance. The Board considered whether the fund has operated in accordance with its investment objective, as well as its record of compliance with its investment restrictions and its performance history.
The Board took into account discussions with representatives of the Investment Advisers about fund investment performance that occur at Board meetings throughout the year. In this regard the Board noted that as part of regularly scheduled fund reviews and other reports to the Board on fund performance, the Board considers annualized return information for the fund, for different time periods, measured against a securities market index ("benchmark index") and a peer group of funds with similar objectives ("peer group"), if any. In its evaluation of fund investment performance, the Board gave particular attention to information indicating changes in performance of certain Fidelity funds for specific time periods and discussed with the Investment Advisers the reasons for any overperformance or underperformance.
In addition to reviewing absolute and relative fund performance, the Independent Trustees periodically consider the appropriateness of fund performance metrics in evaluating the results achieved. In general, the Independent Trustees believe that fund performance should be evaluated based on net performance (after fees and expenses) of both the highest performing and lowest performing fund share classes, where applicable, compared to appropriate benchmark indices, over appropriate time periods that may include full market cycles, and compared to peer groups, as applicable, over the same periods, taking into account relevant factors including the following: general market conditions; issuer-specific information; and fund cash flows and other factors.
The Independent Trustees recognize that shareholders evaluate performance on a net basis over their own holding periods, for which one-, three-, and five-year periods are often used as a proxy. For this reason, the performance information reviewed by the Board also included net cumulative calendar year total return information for the fund and an appropriate benchmark index for the most recent one-, three-, and five-year periods, as shown below. A peer group is not shown below because the fund does not generally utilize a peer group for performance comparison purposes. Returns of the benchmark index are "net MA,"
i.e., adjusted for tax withholding rates applicable to U.S.-based funds organized as Massachusetts business trusts.
Fidelity Advisor Emerging Asia Fund
Based on its review, the Board concluded that the nature, extent, and quality of services provided to the fund under the Advisory Contracts should benefit the shareholders of the fund.
Competitiveness of Management Fee and Total Expense Ratio. The Board considered the fund's management fee and total expense ratio compared to "mapped groups" of competitive funds and classes created for the purpose of facilitating the Trustees' competitive analysis of management fees and total expenses. Fidelity creates "mapped groups" by combining similar Lipper investment objective categories that have comparable investment mandates. Combining Lipper investment objective categories aids the Board's management fee and total expense ratio comparisons by broadening the competitive group used for comparison.
Management Fee. The Board considered two proprietary management fee comparisons for the 12-month periods shown in basis points (BP) in the chart below. The group of Lipper funds used by the Board for management fee comparisons is referred to below as the "Total Mapped Group." The Total Mapped Group comparison focuses on a fund's standing in terms of gross management fees before expense reimbursements or caps relative to the total universe of funds with comparable investment mandates, regardless of whether their management fee structures also are comparable. Funds with comparable investment mandates offer exposure to similar types of securities. Funds with comparable management fee structures have similar management fee contractual arrangements (
e.g., flat rate charged for advisory services, all-inclusive fee rate,
etc.). "TMG %" represents the percentage of funds in the Total Mapped Group that had management fees that were lower than the fund's. For example, a hypothetical TMG % of 20% would mean that 80% of the funds in the Total Mapped Group had higher, and 20% had lower, management fees than the fund. The fund's actual TMG %s and the number of funds in the Total Mapped Group are in the chart below. The "Asset-Size Peer Group" (ASPG) comparison focuses on a fund's standing relative to a subset of non-Fidelity funds within the Total Mapped Group that are similar in size and management fee structure without taking into account performance adjustments, if any. For example, if a fund is in the first quartile of the ASPG, the fund's management fee ranks in the least expensive or lowest 25% of funds in the ASPG. The ASPG represents at least 15% of the funds in the Total Mapped Group with comparable asset size and management fee structures, subject to a minimum of 50 funds (or all funds in the Total Mapped Group if fewer than 50). Additional information, such as the ASPG quartile in which the fund's management fee rate ranked, is also included in the chart and considered by the Board.
Fidelity Advisor Emerging Asia Fund
The Board noted that the fund's management fee rate ranked below the median of its Total Mapped Group and below the median of its ASPG for 2014.
The Board noted that, in 2014, the ad hoc Committee on Group Fee was formed by it and other Fidelity fund boards to conduct an in-depth review of the "group fee" component of the management fee of funds with such management fee structures. Committee focus included the mechanics of the group fee, the competitive landscape of group fee structures, Fidelity funds with no group fee component and investment products not included in group fee assets. The Board also considered that, for funds subject to the group fee, FMR agreed to voluntarily waive fees over a specified period of time in amounts designed to account for assets converted from certain funds to certain collective investment trusts.
The Board also noted that, in 2013, the ad hoc Committee on Management Fees was formed to conduct an in-depth review of the management fee rates of Fidelity's active equity mutual funds. The Committee focused on the following areas: (i) standard fee structures; (ii) research consumption and trading evolution; (iii) management fee competitiveness/profitability by category; and (iv) factors that drive institutional pricing.
Based on its review, the Board concluded that the fund's management fee is fair and reasonable in light of the services that the fund receives and the other factors considered.
Total Expense Ratio. In its review of each class's total expense ratio, the Board considered the fund's management fee as well as other fund or class expenses, as applicable, such as transfer agent fees, pricing and bookkeeping fees, fund-paid 12b-1 fees, and custodial, legal, and audit fees. The Board also noted that Fidelity may agree to waive fees and expenses from time to time, and the extent to which, if any, it has done so for the fund. As part of its review, the Board also considered the current and historical total expense ratios of each class of the fund compared to competitive fund median expenses. Each class of the fund is compared to those funds and classes in the Total Mapped Group (used by the Board for management fee comparisons) that have a similar sales load structure.
The Board noted that the total expense ratio of each of Class A, Class B, Class C, and Class I ranked below its competitive median for 2014 and the total expense ratio of Class T ranked above its competitive median for 2014. The Board considered that, in general, various factors can affect total expense ratios. The Board noted that the total expense ratio of Class T was above the competitive median primarily because of higher 12b-1 fees on Class T as compared to most competitor funds. Class T has a higher 12b-1 fee, but a lower front-end sales charge, than traditionally priced front-end sales charge classes. The Board considered that Class T is primarily sold load-waived in the retirement plan market where its 0.50% 12b-1 fee is comparable to competing no-load, higher 12b-1 fee classes designed specifically for retirement plans. The Board noted that the fund offers multiple classes, each of which has a different sales load and 12b-1 fee structure, and that the multiple structures are intended to offer a range of pricing options for the intermediary market. The Board also noted that the total expense ratios of the classes vary primarily by the level of their 12b-1 fees, although differences in transfer agent fees may also cause expenses to vary from class to class.
Fees Charged to Other Fidelity Clients. The Board also considered Fidelity fee structures and other information with respect to clients of Fidelity, such as other funds advised or subadvised by Fidelity, pension plan clients, and other institutional clients with similar mandates. The Board noted the findings of the 2013 ad hoc joint committee (created with the board of other Fidelity funds), which reviewed and compared Fidelity's institutional investment advisory business with its business of providing services to the Fidelity funds, including the differences in services provided, fees charged, and costs incurred, as well as competition in their respective marketplaces.
Based on its review of total expense ratios and fees charged to other Fidelity clients, the Board concluded that, although Class T was above the median of the universe presented for comparison, the total expense ratio of each class of the fund was reasonable in light of the services that the fund and its shareholders receive and the other factors considered.
Costs of the Services and Profitability. The Board considered the revenues earned and the expenses incurred by Fidelity in conducting the business of developing, marketing, distributing, managing, administering and servicing the fund and servicing the fund's shareholders. The Board also considered the level of Fidelity's profits in respect of all the Fidelity funds.
On an annual basis, Fidelity presents to the Board information about the profitability of its relationship with the fund. Fidelity calculates profitability information for each fund, as well as aggregate profitability information for groups of Fidelity funds and all Fidelity funds, using a series of detailed revenue and cost allocation methodologies which originate with the books and records of Fidelity on which Fidelity's audited financial statements are based. The Audit Committee of the Board reviews any significant changes from the prior year's methodologies.
PricewaterhouseCoopers LLP (PwC), independent registered public accounting firm and auditor to Fidelity and certain Fidelity funds, has been engaged annually by the Board as part of the Board's assessment of Fidelity's profitability analysis. PwC's engagement includes the review and assessment of the methodologies used by Fidelity in determining the revenues and expenses attributable to Fidelity's mutual fund business, and completion of agreed-upon procedures in respect of the mathematical accuracy of fund profitability and its conformity to established allocation methodologies. After considering PwC's reports issued under the engagement and information provided by Fidelity, the Board concluded that while other allocation methods may also be reasonable, Fidelity's profitability methodologies are reasonable in all material respects.
The Board also reviewed Fidelity's non-fund businesses and fall-out benefits related to the mutual fund business as well as cases where Fidelity's affiliates may benefit from or be related to the fund's business.
The Board considered the costs of the services provided by and the profits realized by Fidelity in connection with the operation of the fund and was satisfied that the profitability was not excessive.
Economies of Scale. The Board considered whether there have been economies of scale in respect of the management of the Fidelity funds, whether the Fidelity funds (including the fund) have appropriately benefited from any such economies of scale, and whether there is potential for realization of any further economies of scale. The Board considered the extent to which the fund will benefit from economies of scale as assets grow through increased services to the fund, through waivers or reimbursements, or through fee or expense ratio reductions. The Board also noted that in 2013, it and the boards of other Fidelity funds created an ad hoc committee (the Economies of Scale Committee) to analyze whether Fidelity attains economies of scale in respect of the management and servicing of the Fidelity funds, whether the Fidelity funds have appropriately benefited from such economies of scale, and whether there is potential for realization of any further economies of scale.
The Board recognized that the fund's management contract incorporates a "group fee" structure, which provides for lower group fee rates as total group assets increase, and for higher group fee rates as total group assets decrease (with "group assets" defined to include fund assets under FMR's management plus sector fund assets previously under FMR's management and currently managed by Fidelity SelectCo, LLC). FMR calculates the group fee rates based on a tiered asset "breakpoint" schedule that varies based on asset class. The Board considered that the group fee is designed to deliver the benefits of economies of scale to fund shareholders when total Fidelity fund assets increase, even if assets of any particular fund are unchanged or have declined, because some portion of Fidelity's costs are attributable to services provided to all Fidelity funds, and all funds benefit if those costs can be allocated among more assets. The Board concluded that, given the group fee structure, fund shareholders will benefit from lower management fees as group assets increase at the fund complex level, regardless of whether Fidelity achieves any such economies of scale.
The Board concluded, taking into account the analysis of the Economies of Scale Committee, that economies of scale, if any, are being appropriately shared between fund shareholders and Fidelity.
Additional Information Requested by the Board. In order to develop fully the factual basis for consideration of the Fidelity funds' Advisory Contracts, the Board requested and received additional information on certain topics, including: (i) fund performance trends and Fidelity's long-term strategies for certain funds; (ii) the various share classes employed by Fidelity and the attributes of each class, together with similar information on the distribution and servicing payments made by Fidelity or the funds to third-party participants in the distribution channels; (iii) fund profitability, and fund performance in relation to fund profitability; (iv) the methodology with respect to evaluating competitive fund data and peer group classifications and fee comparisons; (v) annual fund profitability margins, with particular focus on certain funds with negative margins; (vi) the realization of fall-out benefits in certain Fidelity business units;
(vii) economies of scale and the way in which they are shared with fund shareholders;(viii) Fidelity's group fee structures, including the group fee schedule of breakpoints;(ix) the impact of cost containment measures on the funds; and (x) the transfer agent fee structure.
Based on its evaluation of all of the conclusions noted above, and after considering all factors it believed relevant, the Board concluded that the advisory fee structures are fair and reasonable, and that the fund's Advisory Contracts should be renewed.
AEAI-ANN-1215
1.730185.116
Fidelity Advisor® Emerging Markets Fund Class A, Class T, Class B and Class C
Annual Report October 31, 2015 |
|
Contents
To view a fund's proxy voting guidelines and proxy voting record for the 12-month period ended June 30, visit http://www.fidelity.com/proxyvotingresults or visit the Securities and Exchange Commission's (SEC) web site at http://www.sec.gov.
You may also call 1-877-208-0098 to request a free copy of the proxy voting guidelines.
Standard & Poor's, S&P and S&P 500 are registered service marks of The McGraw-Hill Companies, Inc. and have been licensed for use by Fidelity Distributors Corporation.
Other third-party marks appearing herein are the property of their respective owners.
All other marks appearing herein are registered or unregistered trademarks or service marks of FMR LLC or an affiliated company. © 2015 FMR LLC. All rights reserved.
This report and the financial statements contained herein are submitted for the general information of the shareholders of the Fund. This report is not authorized for distribution to prospective investors in the Fund unless preceded or accompanied by an effective prospectus.
A fund files its complete schedule of portfolio holdings with the SEC for the first and third quarters of each fiscal year on Form N-Q. Forms N-Q are available on the SEC’s web site at http://www.sec.gov. A fund's Forms N-Q may be reviewed and copied at the SEC’s Public Reference Room in Washington, DC. Information regarding the operation of the SEC's Public Reference Room may be obtained by calling 1-800-SEC-0330.
For a complete list of a fund's portfolio holdings, view the most recent holdings listing, semiannual report, or annual report on Fidelity's web site at http://www.fidelity.com, http://www.advisor.fidelity.com, or http://www.401k.com, as applicable.
NOT FDIC INSURED •MAY LOSE VALUE •NO BANK GUARANTEE
Neither the Fund nor Fidelity Distributors Corporation is a bank.
Performance: The Bottom Line
Average annual total return reflects the change in the value of an investment, assuming reinvestment of distributions from dividend income and capital gains (the profits earned upon the sale of securities that have grown in value, if any) and assuming a constant rate of performance each year.
The hypothetical investment and the average annual total returns do not reflect the deduction of taxes that a shareholder would pay on fund distributions or the redemption of fund shares.
During periods of reimbursement by Fidelity, a fund’s total return will be greater than it would be had the reimbursement not occurred.
How a fund did yesterday is no guarantee of how it will do tomorrow.
Returns reflect the conversion of Class B shares to Class A shares after a maximum of seven years.
Average Annual Total Returns
| For the periods ended October 31, 2015 | Past 1 year | Past 5 years | Past 10 years |
| Class A (incl. 5.75% sales charge) | (16.24)% | (3.18)% | 4.50% |
| Class T (incl. 3.50% sales charge) | (14.48)% | (2.98)% | 4.48% |
| Class B (incl. contingent deferred sales charge) | (16.19)% | (3.15)% | 4.57% |
| Class C (incl. contingent deferred sales charge) | (12.69)% | (2.77)% | 4.33% |
Class B shares' contingent deferred sales charges included in the past one year, past five years and past ten years total return figures are 5%, 2% and 0%, respectively.
Class C shares' contingent deferred sales charges included in the past one year, past five years and past ten years total return figures are 1%, 0% and 0%, respectively.
$10,000 Over 10 Years
Let's say hypothetically that $10,000 was invested in Fidelity Advisor® Emerging Markets Fund - Class A on October 31, 2005 and the current 5.75% sales charge was paid.
The chart shows how the value of your investment would have changed, and also shows how the MSCI Emerging Markets Index performed over the same period.
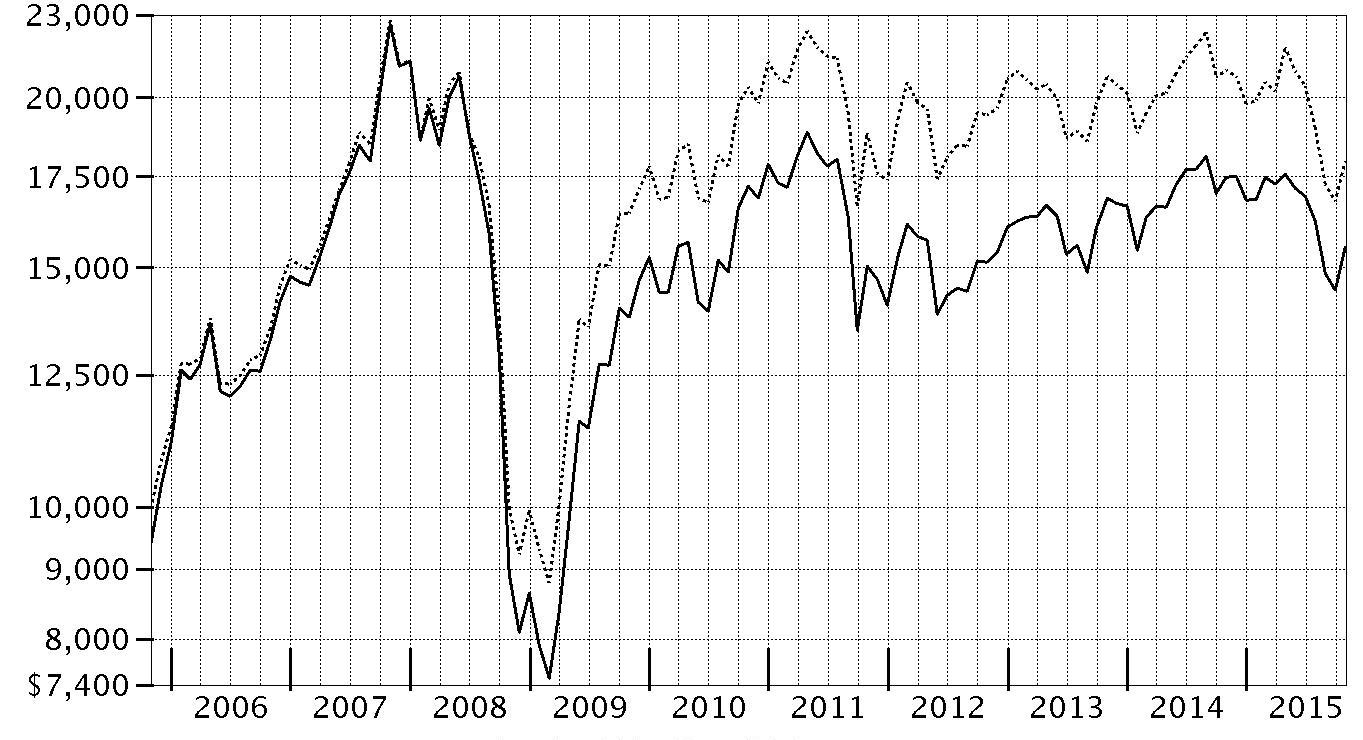
| Period Ending Values |
| $15,530 | Fidelity Advisor® Emerging Markets Fund - Class A |
| $17,967 | MSCI Emerging Markets Index |
Management's Discussion of Fund Performance
Market Recap: International equities suffered a moderate setback for the 12 months ending October 31, 2015, held back by a collapse in commodities prices that hurt resources-related sectors and geographies. The MSCI ACWI (All Country World Index) ex USA Index returned -4.55% for the period, affected also by concerns about global economic growth. Commodity producers remained under pressure for much of the past year, largely related to economic deceleration in China (-1%), the world’s second-largest economy and a leading consumer of raw materials. This effect was exacerbated by U.S. dollar strength relative to global currencies, which weighed on commodities priced in dollars and acutely impacted equity returns within regions most exposed to resources prices. The emerging-markets group, for example, returned about -15% this period. Canada, a significant energy producer, returned roughly -17%. Net energy consumer Japan (+9%) was the best-performing region by far. Only about a quarter of the nearly 50 index countries managed a gain this period: Ireland (+19%) – the EU’s fastest-growing economy – and Israel (+17%) proved top performers; Greece (-56%) and Brazil (-46%), among the worst. As for sectors, energy (-25%) and materials (-16%) declined sharply, whereas the two consumer sectors each gained about 6%.
Comments from Portfolio Manager Sammy Simnegar: For the year, the fund’s share classes (excluding sales charges, if applicable) recorded low-double-digit declines, handily topping the -14.22% return of the benchmark MSCI Emerging Markets Index. Versus the benchmark, sector and industry positioning – especially a sizable underweighting in energy – drove the fund, with stock selection also adding value. Geographically, non-benchmark exposure to the U.S. helped, as did positioning in India and picks in Mexico. The fund’s top relative contributor was Brazil-based oil producer Petroleo Brasileiro. This weak-performing index name helped our relative results because the fund didn’t own it, as did Brazilian metals miner Vale, also an index stock. Two other contributors – both out-of-benchmark positions established during the period – were health care holdings China Biologic Products and Jiangsu Hengrui Medicine. Conversely, stock selection in consumer discretionary detracted most. Underweighting China was a negative, along with stock picking in Russia. The fund’s first- and fourth-biggest relative detractors were China Life Insurance and Ping An Insurance Group. In both cases, the fund didn’t own the stock early on, but we built positions later. Overweighting Brazil-based Kroton Educacional, the world’s largest for-profit operator of colleges, also hurt.
The views expressed above reflect those of the portfolio manager(s) only through the end of the period as stated on the cover of this report and do not necessarily represent the views of Fidelity or any other person in the Fidelity organization. Any such views are subject to change at any time based upon market or other conditions and Fidelity disclaims any responsibility to update such views. These views may not be relied on as investment advice and, because investment decisions for a Fidelity fund are based on numerous factors, may not be relied on as an indication of trading intent on behalf of any Fidelity fund.
Investment Summary (Unaudited)
Top Five Stocks as of October 31, 2015
| | % of fund's net assets | % of fund's net assets 6 months ago |
| Samsung Electronics Co. Ltd. (Korea (South), Technology Hardware, Storage & Peripherals) | 4.5 | 4.4 |
| Taiwan Semiconductor Manufacturing Co. Ltd. (Taiwan, Semiconductors & Semiconductor Equipment) | 3.4 | 3.4 |
| Tencent Holdings Ltd. (Cayman Islands, Internet Software & Services) | 3.3 | 3.1 |
| Naspers Ltd. Class N (South Africa, Media) | 2.2 | 2.0 |
| Ping An Insurance (Group) Co. of China Ltd. (H Shares) (China, Insurance) | 1.4 | 0.0 |
| | 14.8 | |
Top Five Market Sectors as of October 31, 2015
| | % of fund's net assets | % of fund's net assets 6 months ago |
| Information Technology | 23.4 | 22.2 |
| Financials | 19.8 | 23.6 |
| Consumer Discretionary | 18.3 | 16.5 |
| Industrials | 11.2 | 11.3 |
| Consumer Staples | 8.8 | 7.5 |
Top Five Countries as of October 31, 2015
| (excluding cash equivalents) | % of fund's net assets | % of fund's net assets 6 months ago |
| India | 10.6 | 9.9 |
| Korea (South) | 8.7 | 5.7 |
| United States of America | 8.4 | 6.6 |
| China | 8.0 | 7.1 |
| Cayman Islands | 7.7 | 6.9 |
Asset Allocation (% of fund's net assets)
| As of October 31, 2015 |
| | Stocks | 99.9% |
| | Short-Term Investments and Net Other Assets (Liabilities) | 0.1% |

| As of April 30, 2015 |
| | Stocks | 99.2% |
| | Short-Term Investments and Net Other Assets (Liabilities) | 0.8% |

Percentages shown as 0.0% may reflect amounts less than 0.05%.
Investments October 31, 2015
Showing Percentage of Net Assets
| Common Stocks - 98.8% | | | |
| | | Shares | Value |
| Australia - 0.9% | | | |
| Amcor Ltd. | | 180,393 | $1,742,382 |
| Sydney Airport unit | | 450,846 | 2,060,415 |
|
| TOTAL AUSTRALIA | | | 3,802,797 |
|
| Bailiwick of Jersey - 0.4% | | | |
| Integrated Diagnostics Holdings PLC (a) | | 332,800 | 1,833,728 |
| Bermuda - 2.2% | | | |
| China Gas Holdings Ltd. | | 1,409,000 | 2,242,448 |
| China Resource Gas Group Ltd. | | 712,000 | 1,953,048 |
| Credicorp Ltd. (United States) | | 25,014 | 2,831,085 |
| PAX Global Technology Ltd. | | 1,745,000 | 2,281,869 |
|
| TOTAL BERMUDA | | | 9,308,450 |
|
| Brazil - 5.3% | | | |
| BB Seguridade Participacoes SA | | 368,200 | 2,539,607 |
| Brasil Foods SA | | 210,100 | 3,274,173 |
| Cetip SA - Mercados Organizado | | 231,000 | 2,042,525 |
| Cielo SA | | 292,472 | 2,776,419 |
| FPC Par Corretora de Seguros | | 178,400 | 499,134 |
| Kroton Educacional SA | | 1,015,900 | 2,597,341 |
| Qualicorp SA | | 563,800 | 2,368,324 |
| Smiles SA | | 229,300 | 1,789,664 |
| Ultrapar Participacoes SA | | 146,300 | 2,541,676 |
| Weg SA | | 525,830 | 1,963,400 |
|
| TOTAL BRAZIL | | | 22,392,263 |
|
| British Virgin Islands - 0.5% | | | |
| Mail.Ru Group Ltd. GDR (Reg. S) (a) | | 105,900 | 2,065,050 |
| Cayman Islands - 7.7% | | | |
| Alibaba Group Holding Ltd. sponsored ADR (a) | | 32,700 | 2,741,241 |
| ENN Energy Holdings Ltd. | | 432,000 | 2,474,774 |
| Fu Shou Yuan International Group Ltd. | | 2,700,000 | 1,840,953 |
| Hengan International Group Co. Ltd. | | 276,500 | 2,985,766 |
| Shenzhou International Group Holdings Ltd. | | 451,000 | 2,222,515 |
| Sino Biopharmaceutical Ltd. | | 1,840,000 | 2,286,569 |
| TAL Education Group ADR (a) | | 57,400 | 2,207,030 |
| Tencent Holdings Ltd. | | 730,100 | 13,761,931 |
| Vipshop Holdings Ltd. ADR (a)(b) | | 104,000 | 2,134,080 |
|
| TOTAL CAYMAN ISLANDS | | | 32,654,859 |
|
| China - 8.0% | | | |
| Beijing Capital International Airport Co. Ltd. (H Shares) | | 2,142,000 | 2,292,688 |
| China Life Insurance Co. Ltd. (H Shares) | | 686,000 | 2,473,774 |
| China Pacific Insurance (Group) Co. Ltd. (H Shares) | | 907,800 | 3,616,127 |
| Fuyao Glass Industries Group Co. Ltd. (a) | | 837,600 | 1,790,638 |
| Inner Mongoli Yili Industries Co. Ltd. | | 798,200 | 2,007,778 |
| Jiangsu Hengrui Medicine Co. Ltd. | | 276,860 | 2,297,100 |
| Kweichow Moutai Co. Ltd. | | 68,010 | 2,296,275 |
| PICC Property & Casualty Co. Ltd. (H Shares) | | 1,319,825 | 2,994,776 |
| Ping An Insurance (Group) Co. of China Ltd. (H Shares) | | 1,039,000 | 5,832,167 |
| Shanghai International Airport Co. Ltd. | | 475,700 | 2,269,275 |
| Weifu High-Technology Co. Ltd. (B Shares) | | 609,955 | 1,555,130 |
| Zhengzhou Yutong Bus Co. Ltd. | | 634,507 | 2,185,433 |
| Zhuzhou CSR Times Electric Co. Ltd. (H Shares) | | 351,000 | 2,272,179 |
|
| TOTAL CHINA | | | 33,883,340 |
|
| Denmark - 0.5% | | | |
| Novo Nordisk A/S Series B sponsored ADR | | 36,600 | 1,946,388 |
| Egypt - 0.6% | | | |
| Commercial International Bank SAE sponsored GDR | | 407,300 | 2,382,705 |
| France - 0.9% | | | |
| LVMH Moet Hennessy - Louis Vuitton SA | | 10,684 | 1,989,034 |
| Safran SA | | 24,900 | 1,891,256 |
|
| TOTAL FRANCE | | | 3,880,290 |
|
| Germany - 1.0% | | | |
| Bayer AG | | 14,200 | 1,894,884 |
| Wirecard AG | | 41,000 | 2,119,251 |
|
| TOTAL GERMANY | | | 4,014,135 |
|
| Hong Kong - 2.0% | | | |
| AIA Group Ltd. | | 353,000 | 2,069,756 |
| CSPC Pharmaceutical Group Ltd. | | 2,356,000 | 2,193,545 |
| Guangdong Investment Ltd. | | 1,548,000 | 2,177,047 |
| Techtronic Industries Co. Ltd. | | 553,500 | 2,023,417 |
|
| TOTAL HONG KONG | | | 8,463,765 |
|
| India - 10.6% | | | |
| Adani Ports & Special Economic Zone (a) | | 486,623 | 2,197,146 |
| Amara Raja Batteries Ltd. (a) | | 133,250 | 1,837,035 |
| Asian Paints India Ltd. | | 181,441 | 2,299,413 |
| Axis Bank Ltd. (a) | | 244,595 | 1,771,476 |
| Bharti Infratel Ltd. (a) | | 363,529 | 2,159,115 |
| Colgate-Palmolive (India) | | 121,884 | 1,776,806 |
| Exide Industries Ltd. (a) | | 757,787 | 1,728,758 |
| HCL Technologies Ltd. | | 229,234 | 3,051,158 |
| HDFC Bank Ltd. (a) | | 117,154 | 2,349,719 |
| Housing Development Finance Corp. Ltd. | | 284,796 | 5,455,293 |
| IndusInd Bank Ltd. | | 132,634 | 1,845,416 |
| LIC Housing Finance Ltd. (a) | | 281,237 | 2,053,453 |
| Lupin Ltd. | | 86,558 | 2,548,561 |
| Maruti Suzuki India Ltd. (a) | | 28,011 | 1,905,124 |
| Sun Pharmaceutical Industries Ltd. | | 259,412 | 3,525,178 |
| Tata Consultancy Services Ltd. | | 110,026 | 4,191,986 |
| Titan Co. Ltd. (a) | | 373,375 | 2,025,545 |
| Zee Entertainment Enterprises Ltd. | | 337,629 | 2,104,113 |
|
| TOTAL INDIA | | | 44,825,295 |
|
| Indonesia - 4.0% | | | |
| PT ACE Hardware Indonesia Tbk | | 44,531,500 | 2,167,869 |
| PT Bank Central Asia Tbk | | 3,645,200 | 3,424,400 |
| PT Bank Rakyat Indonesia Tbk | | 4,165,600 | 3,188,167 |
| PT Matahari Department Store Tbk | | 1,850,000 | 2,227,377 |
| PT Media Nusantara Citra Tbk | | 14,633,500 | 1,898,715 |
| PT Surya Citra Media Tbk | | 9,453,700 | 2,010,366 |
| PT Tower Bersama Infrastructure Tbk (a) | | 4,087,900 | 2,129,018 |
|
| TOTAL INDONESIA | | | 17,045,912 |
|
| Isle of Man - 0.5% | | | |
| Playtech Ltd. | | 162,735 | 2,147,467 |
| Israel - 0.9% | | | |
| Check Point Software Technologies Ltd. (a) | | 23,200 | 1,970,608 |
| Teva Pharmaceutical Industries Ltd. sponsored ADR | | 31,000 | 1,834,890 |
|
| TOTAL ISRAEL | | | 3,805,498 |
|
| Kenya - 0.5% | | | |
| Safaricom Ltd. | | 13,596,400 | 1,911,890 |
| Korea (South) - 8.7% | | | |
| AMOREPACIFIC Corp. | | 10,132 | 3,349,913 |
| Coway Co. Ltd. | | 29,003 | 2,164,232 |
| KEPCO Plant Service & Engineering Co. Ltd. | | 22,189 | 2,021,122 |
| LG Chemical Ltd. | | 12,994 | 3,465,385 |
| LG Household & Health Care Ltd. | | 3,672 | 3,045,608 |
| NAVER Corp. | | 6,870 | 3,610,184 |
| Samsung Electronics Co. Ltd. | | 15,916 | 19,125,355 |
|
| TOTAL KOREA (SOUTH) | | | 36,781,799 |
|
| Luxembourg - 0.9% | | | |
| Eurofins Scientific SA | | 5,800 | 2,099,947 |
| Samsonite International SA | | 642,100 | 1,896,274 |
|
| TOTAL LUXEMBOURG | | | 3,996,221 |
|
| Mexico - 6.8% | | | |
| Banregio Grupo Financiero S.A.B. de CV | | 307,766 | 1,660,332 |
| Fomento Economico Mexicano S.A.B. de CV unit | | 431,100 | 4,258,593 |
| Gruma S.A.B. de CV Series B | | 150,900 | 2,328,664 |
| Grupo Aeroportuario del Pacifico SA de CV Series B | | 244,221 | 2,199,612 |
| Grupo Aeroportuario del Sureste SA de CV Series B | | 148,550 | 2,300,673 |
| Grupo Aeroportuario Norte S.A.B. de CV | | 377,500 | 1,941,687 |
| Grupo Financiero Banorte S.A.B. de CV Series O | | 677,500 | 3,648,405 |
| Grupo GICSA SA de CV (a) | | 1,898,500 | 1,850,479 |
| Infraestructura Energetica Nova S.A.B. de CV | | 385,800 | 1,860,355 |
| Megacable Holdings S.A.B. de CV unit | | 541,984 | 2,065,523 |
| Promotora y Operadora de Infraestructura S.A.B. de CV (a) | | 191,800 | 2,404,902 |
| Tenedora Nemak SA de CV (a) | | 1,564,200 | 2,262,331 |
|
| TOTAL MEXICO | | | 28,781,556 |
|
| Netherlands - 0.5% | | | |
| Hangzhou Hikvision Digital Technology Co. Ltd. ELS (BNP Paribas Arbitrage Warrant Program) warrants 10/21/16(a) | | 350,500 | 1,909,216 |
| Philippines - 4.1% | | | |
| Ayala Corp. | | 133,440 | 2,222,302 |
| GT Capital Holdings, Inc. | | 72,535 | 2,035,503 |
| International Container Terminal Services, Inc. | | 1,233,590 | 2,174,900 |
| Jollibee Food Corp. | | 469,280 | 2,062,535 |
| Robinsons Land Corp. | | 3,094,300 | 2,022,753 |
| SM Investments Corp. | | 117,296 | 2,189,814 |
| SM Prime Holdings, Inc. | | 4,996,100 | 2,300,459 |
| Universal Robina Corp. | | 527,740 | 2,261,339 |
|
| TOTAL PHILIPPINES | | | 17,269,605 |
|
| Russia - 0.8% | | | |
| Magnit OJSC (a) | | 18,189 | 3,172,942 |
| South Africa - 7.4% | | | |
| Aspen Pharmacare Holdings Ltd. | | 119,593 | 2,685,938 |
| Bidvest Group Ltd. | | 107,615 | 2,752,779 |
| Discovery Ltd. | | 219,462 | 2,347,018 |
| FirstRand Ltd. | | 906,400 | 3,326,545 |
| Mr Price Group Ltd. | | 149,200 | 2,290,989 |
| Naspers Ltd. Class N | | 62,500 | 9,154,383 |
| Sanlam Ltd. | | 634,300 | 2,865,595 |
| Steinhoff International Holdings Ltd. | | 548,400 | 3,356,815 |
| Woolworths Holdings Ltd. | | 353,500 | 2,618,746 |
|
| TOTAL SOUTH AFRICA | | | 31,398,808 |
|
| Spain - 0.5% | | | |
| Amadeus IT Holding SA Class A | | 46,600 | 1,986,205 |
| Switzerland - 0.9% | | | |
| Compagnie Financiere Richemont SA Series A | | 23,737 | 2,035,390 |
| Sika AG (Bearer) | | 500 | 1,640,953 |
|
| TOTAL SWITZERLAND | | | 3,676,343 |
|
| Taiwan - 6.8% | | | |
| Advantech Co. Ltd. | | 291,000 | 2,092,977 |
| Catcher Technology Co. Ltd. | | 260,000 | 2,562,760 |
| ECLAT Textile Co. Ltd. | | 147,000 | 2,168,890 |
| Giant Manufacturing Co. Ltd. | | 263,000 | 1,988,803 |
| Largan Precision Co. Ltd. | | 41,000 | 3,201,448 |
| Merida Industry Co. Ltd. | | 351,650 | 2,063,432 |
| Taiwan Semiconductor Manufacturing Co. Ltd. | | 3,424,000 | 14,426,936 |
|
| TOTAL TAIWAN | | | 28,505,246 |
|
| Thailand - 1.5% | | | |
| Airports of Thailand PCL (For. Reg.) | | 294,900 | 2,465,082 |
| Bangkok Dusit Medical Services PCL (For. Reg.) | | 3,609,300 | 1,924,502 |
| Thai Beverage PCL | | 3,765,700 | 1,810,807 |
|
| TOTAL THAILAND | | | 6,200,391 |
|
| Turkey - 2.1% | | | |
| Koc Holding A/S | | 525,000 | 2,371,099 |
| TAV Havalimanlari Holding A/S | | 280,000 | 2,199,355 |
| Tofas Turk Otomobil Fabrikasi A/S | | 286,544 | 1,892,012 |
| Tupras Turkiye Petrol Rafinelleri A/S (a) | | 84,000 | 2,218,563 |
|
| TOTAL TURKEY | | | 8,681,029 |
|
| United Arab Emirates - 1.0% | | | |
| DP World Ltd. | | 112,015 | 2,263,823 |
| First Gulf Bank PJSC | | 596,553 | 2,005,834 |
|
| TOTAL UNITED ARAB EMIRATES | | | 4,269,657 |
|
| United Kingdom - 1.9% | | | |
| Al Noor Hospitals Group PLC | | 9,684 | 175,563 |
| InterContinental Hotel Group PLC | | 49,000 | 1,958,013 |
| Mondi PLC | | 103,900 | 2,408,990 |
| NMC Health PLC | | 135,000 | 1,585,844 |
| Prudential PLC | | 85,639 | 2,000,227 |
|
| TOTAL UNITED KINGDOM | | | 8,128,637 |
|
| United States of America - 8.4% | | | |
| A.O. Smith Corp. | | 28,300 | 2,174,006 |
| Alphabet, Inc. Class C | | 3,260 | 2,317,241 |
| Apple, Inc. | | 18,300 | 2,186,850 |
| China Biologic Products, Inc. (a) | | 21,400 | 2,438,316 |
| Cognizant Technology Solutions Corp. Class A (a) | | 29,100 | 1,982,001 |
| Ecolab, Inc. | | 16,670 | 2,006,235 |
| Facebook, Inc. Class A (a) | | 17,500 | 1,784,475 |
| International Flavors & Fragrances, Inc. | | 17,000 | 1,973,020 |
| MasterCard, Inc. Class A | | 20,200 | 1,999,598 |
| McGraw Hill Financial, Inc. | | 22,000 | 2,038,080 |
| MercadoLibre, Inc. (b) | | 20,500 | 2,016,585 |
| Mettler-Toledo International, Inc. (a) | | 6,800 | 2,114,732 |
| Moody's Corp. | | 21,000 | 2,019,360 |
| NIKE, Inc. Class B | | 14,200 | 1,860,626 |
| PPG Industries, Inc. | | 20,100 | 2,095,626 |
| Sherwin-Williams Co. | | 8,400 | 2,241,372 |
| Visa, Inc. Class A | | 26,300 | 2,040,354 |
|
| TOTAL UNITED STATES OF AMERICA | | | 35,288,477 |
|
| TOTAL COMMON STOCKS | | | |
| (Cost $402,424,098) | | | 416,409,964 |
|
| Nonconvertible Preferred Stocks - 1.1% | | | |
| Brazil - 1.1% | | | |
| Ambev SA sponsored ADR | | | |
| (Cost $7,259,887) | | 896,480 | 4,365,858 |
|
| Money Market Funds - 1.4% | | | |
| Fidelity Cash Central Fund, 0.18% (c) | | 1,852,843 | 1,852,843 |
| Fidelity Securities Lending Cash Central Fund, 0.19% (c)(d) | | 4,184,150 | 4,184,150 |
| TOTAL MONEY MARKET FUNDS | | | |
| (Cost $6,036,993) | | | 6,036,993 |
| TOTAL INVESTMENT PORTFOLIO - 101.3% | | | |
| (Cost $415,720,978) | | | 426,812,815 |
| NET OTHER ASSETS (LIABILITIES) - (1.3)% | | | (5,282,032) |
| NET ASSETS - 100% | | | $421,530,783 |
Security Type Abbreviations
ELS – Equity-Linked Security
Categorizations in the Schedule of Investments are based on country or territory of incorporation.
Legend
(a) Non-income producing
(b) Security or a portion of the security is on loan at period end.
(c) Affiliated fund that is generally available only to investment companies and other accounts managed by Fidelity Investments. The rate quoted is the annualized seven-day yield of the fund at period end. A complete unaudited listing of the fund's holdings as of its most recent quarter end is available upon request. In addition, each Fidelity Central Fund's financial statements, which are not covered by the Fund's Report of Independent Registered Public Accounting Firm, are available on the SEC's website or upon request.
(d) Investment made with cash collateral received from securities on loan.
Affiliated Central Funds
Information regarding fiscal year to date income earned by the Fund from investments in Fidelity Central Funds is as follows:
| Fund | Income earned |
| Fidelity Cash Central Fund | $7,486 |
| Fidelity Securities Lending Cash Central Fund | 62,534 |
| Total | $70,020 |
Investment Valuation
The following is a summary of the inputs used, as of October 31, 2015, involving the Fund's assets and liabilities carried at fair value. The inputs or methodology used for valuing securities may not be an indication of the risk associated with investing in those securities. For more information on valuation inputs, and their aggregation into the levels used below, please refer to the Investment Valuation section in the accompanying Notes to Financial Statements.
| | Valuation Inputs at Reporting Date: |
| Description | Total | Level 1 | Level 2 | Level 3 |
| Investments in Securities: | | | | |
| Equities: | | | | |
| Consumer Discretionary | $78,056,663 | $42,614,897 | $35,441,766 | $-- |
| Consumer Staples | 36,934,522 | 23,795,751 | 13,138,771 | -- |
| Energy | 4,760,239 | 4,760,239 | -- | -- |
| Financials | 81,621,688 | 29,191,109 | 52,430,579 | -- |
| Health Care | 35,754,009 | 20,978,554 | 14,775,455 | -- |
| Industrials | 48,427,681 | 22,221,359 | 26,206,322 | -- |
| Information Technology | 98,439,949 | 60,726,069 | 37,713,880 | -- |
| Materials | 19,873,376 | 15,831,581 | 4,041,795 | -- |
| Telecommunication Services | 6,200,023 | 1,911,890 | 4,288,133 | -- |
| Utilities | 10,707,672 | 1,860,355 | 8,847,317 | -- |
| Money Market Funds | 6,036,993 | 6,036,993 | -- | -- |
| Total Investments in Securities: | $426,812,815 | $229,928,797 | $196,884,018 | $-- |
The following is a summary of transfers between Level 1 and Level 2 for the period ended October 31, 2015. Transfers are assumed to have occurred at the beginning of the period, and are primarily attributable to the valuation techniques used for foreign equity securities, as discussed in the accompanying Notes to Financial Statements:
| Transfers | Total |
| Level 1 to Level 2 | $9,426,806 |
| Level 2 to Level 1 | $4,142,908 |
See accompanying notes which are an integral part of the financial statements.
Financial Statements
Statement of Assets and Liabilities
| | | October 31, 2015 |
| Assets | | |
Investment in securities, at value (including securities loaned of $4,156,038) — See accompanying schedule:
Unaffiliated issuers (cost $409,683,985) | $420,775,822 | |
| Fidelity Central Funds (cost $6,036,993) | 6,036,993 | |
| Total Investments (cost $415,720,978) | | $426,812,815 |
| Foreign currency held at value (cost $1,833,612) | | 1,835,136 |
| Receivable for investments sold | | 4,069,475 |
| Receivable for fund shares sold | | 212,639 |
| Dividends receivable | | 316,628 |
| Distributions receivable from Fidelity Central Funds | | 1,245 |
| Prepaid expenses | | 1,189 |
| Other receivables | | 68,322 |
| Total assets | | 433,317,449 |
| Liabilities | | |
| Payable to custodian bank | $36,823 | |
| Payable for investments purchased | 6,403,961 | |
| Payable for fund shares redeemed | 385,700 | |
| Accrued management fee | 279,207 | |
| Distribution and service plan fees payable | 82,914 | |
| Other affiliated payables | 99,023 | |
| Other payables and accrued expenses | 314,888 | |
| Collateral on securities loaned, at value | 4,184,150 | |
| Total liabilities | | 11,786,666 |
| Net Assets | | $421,530,783 |
| Net Assets consist of: | | |
| Paid in capital | | $471,344,430 |
| Undistributed net investment income | | 362,723 |
| Accumulated undistributed net realized gain (loss) on investments and foreign currency transactions | | (61,112,393) |
| Net unrealized appreciation (depreciation) on investments and assets and liabilities in foreign currencies | | 10,936,023 |
| Net Assets | | $421,530,783 |
| Calculation of Maximum Offering Price | | |
| Class A: | | |
| Net Asset Value and redemption price per share ($112,931,186 ÷ 5,447,364 shares) | | $20.73 |
| Maximum offering price per share (100/94.25 of $20.73) | | $21.99 |
| Class T: | | |
| Net Asset Value and redemption price per share ($43,364,934 ÷ 2,099,591 shares) | | $20.65 |
| Maximum offering price per share (100/96.50 of $20.65) | | $21.40 |
| Class B: | | |
| Net Asset Value and offering price per share ($3,255,132 ÷ 162,201 shares)(a) | | $20.07 |
| Class C: | | |
| Net Asset Value and offering price per share ($46,595,439 ÷ 2,327,093 shares)(a) | | $20.02 |
| Class I: | | |
| Net Asset Value, offering price and redemption price per share ($209,270,492 ÷ 10,045,868 shares) | | $20.83 |
| Class Z: | | |
| Net Asset Value, offering price and redemption price per share ($6,113,600 ÷ 293,490 shares) | | $20.83 |
(a) Redemption price per share is equal to net asset value less any applicable contingent deferred sales charge.
See accompanying notes which are an integral part of the financial statements.
Statement of Operations
| | | Year ended October 31, 2015 |
| Investment Income | | |
| Dividends | | $8,704,210 |
| Income from Fidelity Central Funds | | 70,020 |
| Income before foreign taxes withheld | | 8,774,230 |
| Less foreign taxes withheld | | (810,613) |
| Total income | | 7,963,617 |
| Expenses | | |
| Management fee | $3,566,825 | |
| Transfer agent fees | 1,124,739 | |
| Distribution and service plan fees | 1,175,651 | |
| Accounting and security lending fees | 232,505 | |
| Custodian fees and expenses | 353,863 | |
| Independent trustees' compensation | 1,909 | |
| Registration fees | 88,022 | |
| Audit | 85,683 | |
| Legal | 1,155 | |
| Interest | 205 | |
| Miscellaneous | 3,088 | |
| Total expenses before reductions | 6,633,645 | |
| Expense reductions | (71,051) | 6,562,594 |
| Net investment income (loss) | | 1,401,023 |
| Realized and Unrealized Gain (Loss) | | |
| Net realized gain (loss) on: | | |
| Investment securities: | | |
| Unaffiliated issuers (net of foreign taxes of $386,530) | (12,124,773) | |
| Foreign currency transactions | (297,899) | |
| Total net realized gain (loss) | | (12,422,672) |
Change in net unrealized appreciation (depreciation) on:
Investment securities (net of decrease in deferred foreign taxes of $441,453) | (41,632,461) | |
| Assets and liabilities in foreign currencies | (11,315) | |
| Total change in net unrealized appreciation (depreciation) | | (41,643,776) |
| Net gain (loss) | | (54,066,448) |
| Net increase (decrease) in net assets resulting from operations | | $(52,665,425) |
See accompanying notes which are an integral part of the financial statements.
Statement of Changes in Net Assets
| | Year ended October 31, 2015 | Year ended October 31, 2014 |
| Increase (Decrease) in Net Assets | | |
| Operations | | |
| Net investment income (loss) | $1,401,023 | $1,047,326 |
| Net realized gain (loss) | (12,422,672) | 3,497,507 |
| Change in net unrealized appreciation (depreciation) | (41,643,776) | 9,190,714 |
| Net increase (decrease) in net assets resulting from operations | (52,665,425) | 13,735,547 |
| Distributions to shareholders from net investment income | (1,046,601) | (1,113,231) |
| Distributions to shareholders from net realized gain | (487,287) | (185,956) |
| Total distributions | (1,533,888) | (1,299,187) |
| Share transactions - net increase (decrease) | 3,501,123 | 32,907,367 |
| Redemption fees | 73,251 | 31,634 |
| Total increase (decrease) in net assets | (50,624,939) | 45,375,361 |
| Net Assets | | |
| Beginning of period | 472,155,722 | 426,780,361 |
| End of period (including undistributed net investment income of $362,723 and undistributed net investment income of $1,039,628, respectively) | $421,530,783 | $472,155,722 |
See accompanying notes which are an integral part of the financial statements.
Financial Highlights — Fidelity Advisor Emerging Markets Fund Class A
| | | October 31, | | | |
| Years ended October 31, | 2015 | 2014 | 2013 | 2012 | 2011 |
| Selected Per–Share Data | | | | | |
| Net asset value, beginning of period | $23.38 | $22.62 | $20.51 | $20.50 | $23.71 |
| Income from Investment Operations | | | | | |
| Net investment income (loss)A | .06 | .06 | .08 | .22 | .21 |
| Net realized and unrealized gain (loss) | (2.66) | .76 | 2.23 | (.06) | (3.19) |
| Total from investment operations | (2.60) | .82 | 2.31 | .16 | (2.98) |
| Distributions from net investment income | (.02) | (.05) | (.20) | (.15) | (.11) |
| Distributions from net realized gain | (.03) | (.01) | – | – | (.13) |
| Total distributions | (.05) | (.06) | (.20) | (.15) | (.24) |
| Redemption fees added to paid in capitalA | –B | –B | –B | –B | .01 |
| Net asset value, end of period | $20.73 | $23.38 | $22.62 | $20.51 | $20.50 |
| Total ReturnC,D | (11.13)% | 3.65% | 11.34% | .80% | (12.69)% |
| Ratios to Average Net AssetsE,F | | | | | |
| Expenses before reductions | 1.52% | 1.52% | 1.56% | 1.54% | 1.54% |
| Expenses net of fee waivers, if any | 1.52% | 1.52% | 1.55% | 1.54% | 1.54% |
| Expenses net of all reductions | 1.50% | 1.52% | 1.50% | 1.48% | 1.47% |
| Net investment income (loss) | .28% | .26% | .38% | 1.07% | .92% |
| Supplemental Data | | | | | |
| Net assets, end of period (000 omitted) | $112,931 | $141,601 | $146,378 | $160,464 | $202,477 |
| Portfolio turnover rateG | 110% | 97% | 121% | 177% | 122% |
A Calculated based on average shares outstanding during the period.
B Amount represents less than $.005 per share.
C Total returns would have been lower if certain expenses had not been reduced during the applicable periods shown.
D Total returns do not include the effect of the sales charges.
E Fees and expenses of any underlying Fidelity Central Funds are not included in the Fund's expense ratio. The Fund indirectly bears its proportionate share of the expenses of any underlying Fidelity Central Funds.
F Expense ratios reflect operating expenses of the class. Expenses before reductions do not reflect amounts reimbursed by the investment adviser or reductions from brokerage service arrangements or reductions from other expense offset arrangements and do not represent the amount paid by the class during periods when reimbursements or reductions occur. Expenses net of fee waivers reflect expenses after reimbursement by the investment adviser but prior to reductions from brokerage service arrangements or other expense offset arrangements. Expenses net of all reductions represent the net expenses paid by the class.
G Amount does not include the portfolio activity of any underlying Fidelity Central Funds.
See accompanying notes which are an integral part of the financial statements.
Financial Highlights — Fidelity Advisor Emerging Markets Fund Class T
| | | October 31, | | | |
| Years ended October 31, | 2015 | 2014 | 2013 | 2012 | 2011 |
| Selected Per–Share Data | | | | | |
| Net asset value, beginning of period | $23.30 | $22.55 | $20.44 | $20.43 | $23.61 |
| Income from Investment Operations | | | | | |
| Net investment income (loss)A | .01 | –B | .03 | .16 | .15 |
| Net realized and unrealized gain (loss) | (2.66) | .76 | 2.22 | (.06) | (3.18) |
| Total from investment operations | (2.65) | .76 | 2.25 | .10 | (3.03) |
| Distributions from net investment income | – | –B | (.14) | (.09) | (.04) |
| Distributions from net realized gain | – | (.01) | – | – | (.13) |
| Total distributions | – | (.01) | (.14) | (.09) | (.16)C |
| Redemption fees added to paid in capitalA | –B | –B | –B | –B | .01 |
| Net asset value, end of period | $20.65 | $23.30 | $22.55 | $20.44 | $20.43 |
| Total ReturnD,E | (11.37)% | 3.39% | 11.06% | .49% | (12.89)% |
| Ratios to Average Net AssetsF,G | | | | | |
| Expenses before reductions | 1.78% | 1.78% | 1.81% | 1.80% | 1.79% |
| Expenses net of fee waivers, if any | 1.78% | 1.78% | 1.81% | 1.80% | 1.79% |
| Expenses net of all reductions | 1.76% | 1.78% | 1.76% | 1.73% | 1.73% |
| Net investment income (loss) | .02% | - %H | .13% | .81% | .66% |
| Supplemental Data | | | | | |
| Net assets, end of period (000 omitted) | $43,365 | $54,341 | $55,797 | $58,919 | $73,146 |
| Portfolio turnover rateI | 110% | 97% | 121% | 177% | 122% |
A Calculated based on average shares outstanding during the period.
B Amount represents less than $.005 per share.
C Total distributions of $.16 per share is comprised of distributions from net investment income of $.037 and distributions from net realized gain of $.125 per share.
D Total returns would have been lower if certain expenses had not been reduced during the applicable periods shown.
E Total returns do not include the effect of the sales charges.
F Fees and expenses of any underlying Fidelity Central Funds are not included in the Fund's expense ratio. The Fund indirectly bears its proportionate share of the expenses of any underlying Fidelity Central Funds.
G Expense ratios reflect operating expenses of the class. Expenses before reductions do not reflect amounts reimbursed by the investment adviser or reductions from brokerage service arrangements or reductions from other expense offset arrangements and do not represent the amount paid by the class during periods when reimbursements or reductions occur. Expenses net of fee waivers reflect expenses after reimbursement by the investment adviser but prior to reductions from brokerage service arrangements or other expense offset arrangements. Expenses net of all reductions represent the net expenses paid by the class.
H Amount represents less than .005%.
I Amount does not include the portfolio activity of any underlying Fidelity Central Funds.
See accompanying notes which are an integral part of the financial statements.
Financial Highlights — Fidelity Advisor Emerging Markets Fund Class B
| | | October 31, | | | |
| Years ended October 31, | 2015 | 2014 | 2013 | 2012 | 2011 |
| Selected Per–Share Data | | | | | |
| Net asset value, beginning of period | $22.75 | $22.11 | $20.03 | $20.03 | $23.14 |
| Income from Investment Operations | | | | | |
| Net investment income (loss)A | (.10) | (.11) | (.08) | .06 | .04 |
| Net realized and unrealized gain (loss) | (2.58) | .75 | 2.18 | (.06) | (3.13) |
| Total from investment operations | (2.68) | .64 | 2.10 | – | (3.09) |
| Distributions from net investment income | – | – | (.02) | – | (.01) |
| Distributions from net realized gain | – | – | – | – | (.03) |
| Total distributions | – | – | (.02) | – | (.03)B |
| Redemption fees added to paid in capitalA | –C | –C | –C | –C | .01 |
| Net asset value, end of period | $20.07 | $22.75 | $22.11 | $20.03 | $20.03 |
| Total ReturnD,E | (11.78)% | 2.89% | 10.50% | -% | (13.33)% |
| Ratios to Average Net AssetsF,G | | | | | |
| Expenses before reductions | 2.28% | 2.28% | 2.31% | 2.29% | 2.29% |
| Expenses net of fee waivers, if any | 2.28% | 2.28% | 2.31% | 2.29% | 2.29% |
| Expenses net of all reductions | 2.26% | 2.28% | 2.26% | 2.23% | 2.22% |
| Net investment income (loss) | (.48)% | (.49)% | (.37)% | .32% | .16% |
| Supplemental Data | | | | | |
| Net assets, end of period (000 omitted) | $3,255 | $7,546 | $11,391 | $15,994 | $21,304 |
| Portfolio turnover rateH | 110% | 97% | 121% | 177% | 122% |
A Calculated based on average shares outstanding during the period.
B Total distributions of $.03 per share is comprised of distributions from net investment income of $.005 and distributions from net realized gain of $.025 per share.
C Amount represents less than $.005 per share.
D Total returns would have been lower if certain expenses had not been reduced during the applicable periods shown.
E Total returns do not include the effect of the contingent deferred sales charge.
F Fees and expenses of any underlying Fidelity Central Funds are not included in the Fund's expense ratio. The Fund indirectly bears its proportionate share of the expenses of any underlying Fidelity Central Funds.
G Expense ratios reflect operating expenses of the class. Expenses before reductions do not reflect amounts reimbursed by the investment adviser or reductions from brokerage service arrangements or reductions from other expense offset arrangements and do not represent the amount paid by the class during periods when reimbursements or reductions occur. Expenses net of fee waivers reflect expenses after reimbursement by the investment adviser but prior to reductions from brokerage service arrangements or other expense offset arrangements. Expenses net of all reductions represent the net expenses paid by the class.
H Amount does not include the portfolio activity of any underlying Fidelity Central Funds.
See accompanying notes which are an integral part of the financial statements.
Financial Highlights — Fidelity Advisor Emerging Markets Fund Class C
| | | October 31, | | | |
| Years ended October 31, | 2015 | 2014 | 2013 | 2012 | 2011 |
| Selected Per–Share Data | | | | | |
| Net asset value, beginning of period | $22.70 | $22.06 | $20.00 | $20.00 | $23.13 |
| Income from Investment Operations | | | | | |
| Net investment income (loss)A | (.10) | (.11) | (.08) | .06 | .04 |
| Net realized and unrealized gain (loss) | (2.58) | .75 | 2.18 | (.06) | (3.12) |
| Total from investment operations | (2.68) | .64 | 2.10 | – | (3.08) |
| Distributions from net investment income | – | – | (.04) | – | (.01) |
| Distributions from net realized gain | – | – | – | – | (.05) |
| Total distributions | – | – | (.04) | – | (.06) |
| Redemption fees added to paid in capitalA | –B | –B | –B | –B | .01 |
| Net asset value, end of period | $20.02 | $22.70 | $22.06 | $20.00 | $20.00 |
| Total ReturnC,D | (11.81)% | 2.90% | 10.49% | -% | (13.33)% |
| Ratios to Average Net AssetsE,F | | | | | |
| Expenses before reductions | 2.27% | 2.27% | 2.31% | 2.29% | 2.28% |
| Expenses net of fee waivers, if any | 2.27% | 2.27% | 2.30% | 2.29% | 2.28% |
| Expenses net of all reductions | 2.26% | 2.27% | 2.25% | 2.23% | 2.22% |
| Net investment income (loss) | (.47)% | (.49)% | (.37)% | .32% | .17% |
| Supplemental Data | | | | | |
| Net assets, end of period (000 omitted) | $46,595 | $64,026 | $62,532 | $65,598 | $80,855 |
| Portfolio turnover rateG | 110% | 97% | 121% | 177% | 122% |
A Calculated based on average shares outstanding during the period.
B Amount represents less than $.005 per share.
C Total returns would have been lower if certain expenses had not been reduced during the applicable periods shown.
D Total returns do not include the effect of the contingent deferred sales charge.
E Fees and expenses of any underlying Fidelity Central Funds are not included in the Fund's expense ratio. The Fund indirectly bears its proportionate share of the expenses of any underlying Fidelity Central Funds.
F Expense ratios reflect operating expenses of the class. Expenses before reductions do not reflect amounts reimbursed by the investment adviser or reductions from brokerage service arrangements or reductions from other expense offset arrangements and do not represent the amount paid by the class during periods when reimbursements or reductions occur. Expenses net of fee waivers reflect expenses after reimbursement by the investment adviser but prior to reductions from brokerage service arrangements or other expense offset arrangements. Expenses net of all reductions represent the net expenses paid by the class.
G Amount does not include the portfolio activity of any underlying Fidelity Central Funds.
See accompanying notes which are an integral part of the financial statements.
Financial Highlights — Fidelity Advisor Emerging Markets Fund Class I
| | | October 31, | | | |
| Years ended October 31, | 2015 | 2014 | 2013 | 2012 | 2011 |
| Selected Per–Share Data | | | | | |
| Net asset value, beginning of period | $23.50 | $22.73 | $20.61 | $20.63 | $23.87 |
| Income from Investment Operations | | | | | |
| Net investment income (loss)A | .14 | .14 | .15 | .28 | .29 |
| Net realized and unrealized gain (loss) | (2.67) | .76 | 2.25 | (.06) | (3.21) |
| Total from investment operations | (2.53) | .90 | 2.40 | .22 | (2.92) |
| Distributions from net investment income | (.11) | (.12) | (.28) | (.24) | (.20) |
| Distributions from net realized gain | (.03) | (.01) | – | – | (.13) |
| Total distributions | (.14) | (.13) | (.28) | (.24) | (.33) |
| Redemption fees added to paid in capitalA | –B | –B | –B | –B | .01 |
| Net asset value, end of period | $20.83 | $23.50 | $22.73 | $20.61 | $20.63 |
| Total ReturnC | (10.83)% | 4.00% | 11.73% | 1.08% | (12.41)% |
| Ratios to Average Net AssetsD,E | | | | | |
| Expenses before reductions | 1.17% | 1.18% | 1.23% | 1.22% | 1.21% |
| Expenses net of fee waivers, if any | 1.17% | 1.18% | 1.22% | 1.22% | 1.21% |
| Expenses net of all reductions | 1.16% | 1.18% | 1.18% | 1.16% | 1.14% |
| Net investment income (loss) | .63% | .60% | .71% | 1.39% | 1.25% |
| Supplemental Data | | | | | |
| Net assets, end of period (000 omitted) | $209,270 | $199,098 | $150,576 | $145,782 | $138,312 |
| Portfolio turnover rateF | 110% | 97% | 121% | 177% | 122% |
A Calculated based on average shares outstanding during the period.
B Amount represents less than $.005 per share.
C Total returns would have been lower if certain expenses had not been reduced during the applicable periods shown.
D Fees and expenses of any underlying Fidelity Central Funds are not included in the Fund's expense ratio. The Fund indirectly bears its proportionate share of the expenses of any underlying Fidelity Central Funds.
E Expense ratios reflect operating expenses of the class. Expenses before reductions do not reflect amounts reimbursed by the investment adviser or reductions from brokerage service arrangements or reductions from other expense offset arrangements and do not represent the amount paid by the class during periods when reimbursements or reductions occur. Expenses net of fee waivers reflect expenses after reimbursement by the investment adviser but prior to reductions from brokerage service arrangements or other expense offset arrangements. Expenses net of all reductions represent the net expenses paid by the class.
F Amount does not include the portfolio activity of any underlying Fidelity Central Funds.
See accompanying notes which are an integral part of the financial statements.
Financial Highlights — Fidelity Advisor Emerging Markets Fund Class Z
| | | October 31, | |
| Years ended October 31, | 2015 | 2014 | 2013 A |
| Selected Per–Share Data | | | |
| Net asset value, beginning of period | $23.50 | $22.73 | $21.33 |
| Income from Investment Operations | | | |
| Net investment income (loss)B | .17 | .18 | .03 |
| Net realized and unrealized gain (loss) | (2.66) | .76 | 1.37 |
| Total from investment operations | (2.49) | .94 | 1.40 |
| Distributions from net investment income | (.14) | (.16) | – |
| Distributions from net realized gain | (.03) | (.01) | – |
| Total distributions | (.18)C | (.17) | – |
| Redemption fees added to paid in capitalB,D | – | – | – |
| Net asset value, end of period | $20.83 | $23.50 | $22.73 |
| Total ReturnE,F | (10.68)% | 4.19% | 6.56% |
| Ratios to Average Net AssetsG,H | | | |
| Expenses before reductions | 1.02% | 1.02% | 1.05%I |
| Expenses net of fee waivers, if any | 1.02% | 1.02% | 1.05%I |
| Expenses net of all reductions | 1.00% | 1.02% | 1.00%I |
| Net investment income (loss) | .78% | .77% | .62%I |
| Supplemental Data | | | |
| Net assets, end of period (000 omitted) | $6,114 | $5,544 | $107 |
| Portfolio turnover rateJ | 110% | 97% | 121% |
A For the period August 13, 2013 (commencement of sale of shares) to October 31, 2013.
B Calculated based on average shares outstanding during the period.
C Total distributions of $.18 per share is comprised of distributions from net investment income of $.143 and distributions from net realized gain of $.033 per share.
D Amount represents less than $.005 per share.
E Total returns for periods of less than one year are not annualized.
F Total returns would have been lower if certain expenses had not been reduced during the applicable periods shown.
G Fees and expenses of any underlying Fidelity Central Funds are not included in the Fund's expense ratio. The Fund indirectly bears its proportionate share of the expenses of any underlying Fidelity Central Funds.
H Expense ratios reflect operating expenses of the class. Expenses before reductions do not reflect amounts reimbursed by the investment adviser or reductions from brokerage service arrangements or reductions from other expense offset arrangements and do not represent the amount paid by the class during periods when reimbursements or reductions occur. Expense ratios before reductions for start-up periods may not be representative of longer-term operating periods. Expenses net of fee waivers reflect expenses after reimbursement by the investment adviser but prior to reductions from brokerage service arrangements or other expense offset arrangements. Expenses net of all reductions represent the net expenses paid by the class.
I Annualized
J Amount does not include the portfolio activity of any underlying Fidelity Central Funds.
See accompanying notes which are an integral part of the financial statements.
Notes to Financial Statements
For the period ended October 31, 2015
1. Organization.
Fidelity Advisor Emerging Markets Fund (the Fund) is a fund of Fidelity Advisor Series VIII (the Trust) and is authorized to issue an unlimited number of shares. The Trust is registered under the Investment Company Act of 1940, as amended (the 1940 Act), as an open-end management investment company organized as a Massachusetts business trust. The Fund offers Class A, Class T, Class C, Class I (formerly Institutional Class) and Class Z shares, each of which, along with Class B shares, has equal rights as to assets and voting privileges. Class B shares are closed to new accounts and additional purchases, except for exchanges and reinvestments. Each class has exclusive voting rights with respect to matters that affect that class. Class B shares will automatically convert to Class A shares after a holding period of seven years from the initial date of purchase. The Fund's investments in emerging markets can be subject to social, economic, regulatory, and political uncertainties and can be extremely volatile.
2. Investments in Fidelity Central Funds.
The Fund invests in Fidelity Central Funds, which are open-end investment companies generally available only to other investment companies and accounts managed by the investment adviser and its affiliates. The Fund's Schedule of Investments lists each of the Fidelity Central Funds held as of period end, if any, as an investment of the Fund, but does not include the underlying holdings of each Fidelity Central Fund. As an Investing Fund, the Fund indirectly bears its proportionate share of the expenses of the underlying Fidelity Central Funds.
The Money Market Central Funds seek preservation of capital and current income and are managed by Fidelity Investments Money Management, Inc. (FIMM), an affiliate of the investment adviser. Annualized expenses of the Money Market Central Funds as of their most recent shareholder report date are less than .005%.
A complete unaudited list of holdings for each Fidelity Central Fund is available upon request or at the Securities and Exchange Commission (the SEC) website at www.sec.gov. In addition, the financial statements of the Fidelity Central Funds, which are not covered by the Fund's Report of Independent Registered Public Accounting Firm, are available on the SEC website or upon request.
3. Significant Accounting Policies.
The financial statements have been prepared in conformity with accounting principles generally accepted in the United States of America (GAAP), which require management to make certain estimates and assumptions at the date of the financial statements. Actual results could differ from those estimates. Subsequent events, if any, through the date that the financial statements were issued have been evaluated in the preparation of the financial statements. The following summarizes the significant accounting policies of the Fund:
Investment Valuation. Investments are valued as of 4:00 p.m. Eastern time on the last calendar day of the period. The Board of Trustees (the Board) has delegated the day to day responsibility for the valuation of the Fund's investments to the Fidelity Management & Research Company (FMR) Fair Value Committee (the Committee). In accordance with valuation policies and procedures approved by the Board, the Fund attempts to obtain prices from one or more third party pricing vendors or brokers to value its investments. When current market prices, quotations or currency exchange rates are not readily available or reliable, investments will be fair valued in good faith by the Committee, in accordance with procedures adopted by the Board. Factors used in determining fair value vary by investment type and may include market or investment specific events. The frequency with which these procedures are used cannot be predicted and they may be utilized to a significant extent. The Committee oversees the Fund's valuation policies and procedures and reports to the Board on the Committee's activities and fair value determinations. The Board monitors the appropriateness of the procedures used in valuing the Fund's investments and ratifies the fair value determinations of the Committee.
The Fund categorizes the inputs to valuation techniques used to value its investments into a disclosure hierarchy consisting of three levels as shown below:
- Level 1 – quoted prices in active markets for identical investments
- Level 2 – other significant observable inputs (including quoted prices for similar investments, interest rates, prepayment speeds, etc.)
- Level 3 – unobservable inputs (including the Fund's own assumptions based on the best information available)
Valuation techniques used to value the Fund's investments by major category are as follows:
Equity securities, including restricted securities, for which market quotations are readily available, are valued at the last reported sale price or official closing price as reported by a third party pricing vendor on the primary market or exchange on which they are traded and are categorized as Level 1 in the hierarchy. In the event there were no sales during the day or closing prices are not available, securities are valued at the last quoted bid price or may be valued using the last available price and are generally categorized as Level 2 in the hierarchy. For foreign equity securities, when market or security specific events arise, comparisons to the valuation of American Depositary Receipts (ADRs), futures contracts, Exchange-Traded Funds (ETFs) and certain indexes as well as quoted prices for similar securities may be used and would be categorized as Level 2 in the hierarchy. Utilizing these techniques may result in transfers between Level 1 and Level 2. For equity securities, including restricted securities, where observable inputs are limited, assumptions about market activity and risk are used and these securities may be categorized as Level 3 in the hierarchy.
Investments in open-end mutual funds, including the Fidelity Central Funds, are valued at their closing net asset value (NAV) each business day and are categorized as Level 1 in the hierarchy.
Changes in valuation techniques may result in transfers in or out of an assigned level within the disclosure hierarchy. The aggregate value of investments by input level as of October 31, 2015, including information on transfers between Levels 1 and 2, is included at the end of the Fund's Schedule of Investments.
Foreign Currency. The Fund may use foreign currency contracts to facilitate transactions in foreign-denominated securities. Gains and losses from these transactions may arise from changes in the value of the foreign currency or if the counterparties do not perform under the contracts' terms.
Foreign-denominated assets, including investment securities, and liabilities are translated into U.S. dollars at the exchange rates at period end. Purchases and sales of investment securities, income and dividends received and expenses denominated in foreign currencies are translated into U.S. dollars at the exchange rate in effect on the transaction date.
The effects of exchange rate fluctuations on investments are included with the net realized and unrealized gain (loss) on investment securities. Other foreign currency transactions resulting in realized and unrealized gain (loss) are disclosed separately.
Investment Transactions and Income. For financial reporting purposes, the Fund's investment holdings and NAV include trades executed through the end of the last business day of the period. The NAV per share for processing shareholder transactions is calculated as of the close of business of the New York Stock Exchange (NYSE), normally 4:00 p.m. Eastern time and includes trades executed through the end of the prior business day. Gains and losses on securities sold are determined on the basis of identified cost and may include proceeds received from litigation. Dividend income is recorded on the ex-dividend date, except for certain dividends from foreign securities where the ex-dividend date may have passed, which are recorded as soon as the Fund is informed of the ex-dividend date. Non-cash dividends included in dividend income, if any, are recorded at the fair market value of the securities received. Income and capital gain distributions from Fidelity Central Funds, if any, are recorded on the ex-dividend date. Interest income is accrued as earned and includes coupon interest and amortization of premium and accretion of discount on debt securities as applicable. Investment income is recorded net of foreign taxes withheld where recovery of such taxes is uncertain.
Class Allocations and Expenses. Investment income, realized and unrealized capital gains and losses, common expenses of the Fund, and certain fund-level expense reductions, if any, are allocated daily on a pro-rata basis to each class based on the relative net assets of each class to the total net assets of the Fund. Each class differs with respect to transfer agent and distribution and service plan fees incurred. Certain expense reductions may also differ by class. For the reporting period, the allocated portion of income and expenses to each class as a percent of its average net assets may vary due to the timing of recording these transactions in relation to fluctuating net assets of the classes. Expenses directly attributable to a fund are charged to that fund. Expenses attributable to more than one fund are allocated among the respective funds on the basis of relative net assets or other appropriate methods. Expense estimates are accrued in the period to which they relate and adjustments are made when actual amounts are known.
Income Tax Information and Distributions to Shareholders. Each year, the Fund intends to qualify as a regulated investment company under Subchapter M of the Internal Revenue Code, including distributing substantially all of its taxable income and realized gains. As a result, no provision for U.S. Federal income taxes is required. As of October 31, 2015, the Fund did not have any unrecognized tax benefits in the financial statements; nor is the Fund aware of any tax positions for which it is reasonably possible that the total amounts of unrecognized tax benefits will significantly change in the next twelve months. The Fund files a U.S. federal tax return, in addition to state and local tax returns as required. The Fund's federal income tax returns are subject to examination by the Internal Revenue Service (IRS) for a period of three fiscal years after they are filed. State and local tax returns may be subject to examination for an additional fiscal year depending on the jurisdiction. Foreign taxes are provided for based on the Fund's understanding of the tax rules and rates that exist in the foreign markets in which it invests. The Fund is subject to a tax imposed on capital gains by certain countries in which it invests. An estimated deferred tax liability for net unrealized appreciation on the applicable securities is included in Other payables and accrued expenses on the Statement of Assets & Liabilities.
Distributions are declared and recorded on the ex-dividend date. Income dividends and capital gain distributions are declared separately for each class. Income and capital gain distributions are determined in accordance with income tax regulations, which may differ from GAAP.
Capital accounts within the financial statements are adjusted for permanent book-tax differences. These adjustments have no impact on net assets or the results of operations. Capital accounts are not adjusted for temporary book-tax differences which will reverse in a subsequent period.
Book-tax differences are primarily due to foreign currency transactions, certain foreign taxes, passive foreign investment companies (PFIC), capital loss carryforwards and losses deferred due to wash sales.
The federal tax cost of investment securities and unrealized appreciation (depreciation) as of period end were as follows:
| Gross unrealized appreciation | $42,619,526 |
| Gross unrealized depreciation | (32,272,187) |
| Net unrealized appreciation (depreciation) on securities | $10,347,339 |
| Tax Cost | $416,465,476 |
The tax-based components of distributable earnings as of period end were as follows:
| Undistributed ordinary income | $369,344 |
| Capital loss carryforward | $(60,367,895) |
| Net unrealized appreciation (depreciation) on securities and other investments | $10,326,489 |
Capital loss carryforwards are only available to offset future capital gains of the Fund to the extent provided by regulations and may be limited. Under the Regulated Investment Company Modernization Act of 2010 (the Act), the Fund is permitted to carry forward capital losses incurred in taxable years beginning after December 22, 2010 for an unlimited period and such capital losses are required to be used prior to any losses that expire. The capital loss carryforward information presented below, including any applicable limitation, is estimated as of fiscal period end and is subject to adjustment.
| Fiscal year of expiration | |
| 2017 | $(47,911,843) |
| Total with expiration | $(47,911,843) |
| No expiration | |
| Short-term | $(12,456,052) |
| Total with no expiration | $(12,456,052) |
| Total capital loss carryforward | $(60,367,895) |
The tax character of distributions paid was as follows:
| | October 31, 2015 | October 31, 2014 |
| Ordinary Income | $1,533,888 | $ 1,299,187 |
Short-Term Trading (Redemption) Fees. Shares held by investors in the Fund less than 90 days may have been subject to a redemption fee equal to 1.50% of the NAV of shares redeemed. All redemption fees, which reduce the proceeds of the shareholder redemption, are retained by the Fund and accounted for as an addition to paid in capital.
4. Purchases and Sales of Investments.
Purchases and sales of securities, other than short-term securities, aggregated $491,655,337 and $483,847,532, respectively.
5. Fees and Other Transactions with Affiliates.
Management Fee. Fidelity Management & Research Company (the investment adviser) and its affiliates provide the Fund with investment management related services for which the Fund pays a monthly management fee. The management fee is the sum of an individual fund fee rate that is based on an annual rate of .55% of the Fund's average net assets and an annualized group fee rate that averaged .25% during the period. The group fee rate is based upon the average net assets of all the mutual funds advised by the investment adviser, including any mutual funds previously advised by the investment adviser that are currently advised by Fidelity SelectCo, LLC, an affiliate of the investment adviser. The group fee rate decreases as assets under management increase and increases as assets under management decrease. For the reporting period, the total annual management fee rate was .80% of the Fund's average net assets.
Distribution and Service Plan Fees. In accordance with Rule 12b-1 of the 1940 Act, the Fund has adopted separate Distribution and Service Plans for each class of shares, except for the Institutional Class. Certain classes pay Fidelity Distributors Corporation (FDC), an affiliate of the investment adviser, separate Distribution and Service Fees, each of which is based on an annual percentage of each class' average net assets. In addition, FDC may pay financial intermediaries for selling shares of the Fund and providing shareholder support services. For the period, the Distribution and Service Fee rates, total fees and amounts retained by FDC were as follows:
| | Distribution
Fee | Service
Fee | Total Fees | Retained
by FDC |
| Class A | -% | .25% | $323,428 | $3,381 |
| Class T | .25% | .25% | 249,110 | – |
| Class B | .75% | .25% | 51,240 | 38,477 |
| Class C | .75% | .25% | 551,873 | 57,082 |
| | | | $1,175,651 | $98,940 |
Sales Load. FDC may receive a front-end sales charge of up to 5.75% for selling Class A shares and 3.50% for selling Class T shares, some of which is paid to financial intermediaries for selling shares of the Fund. Depending on the holding period, FDC may receive contingent deferred sales charges levied on Class A, Class T, Class B, and Class C redemptions. The deferred sales charges range from 5.00% to 1.00% for Class B shares, 1.00% for Class C shares, 1.00% for certain purchases of Class A shares and .25% for certain purchases of Class T shares.
For the period, sales charge amounts retained by FDC were as follows:
| | Retained
by FDC |
| Class A | $39,406 |
| Class T | 9,783 |
| Class B(a) | 3,265 |
| Class C(a) | 4,447 |
| | $56,901 |
(a) When Class B and Class C shares are initially sold, FDC pays commissions from its own resources to financial intermediaries through which the sales are made.
Transfer Agent Fees. Fidelity Investments Institutional Operations Company, Inc., (FIIOC), an affiliate of the investment adviser, is the transfer, dividend disbursing and shareholder servicing agent for each class of the Fund. FIIOC receives account fees and asset-based fees that vary according to the account size and type of account of the shareholders of the respective classes of the Fund, except for Class Z. FIIOC receives an asset-based fee of Class Z's average net assets. FIIOC pays for typesetting, printing and mailing of shareholder reports, except proxy statements.
For the period, transfer agent fees for each class were as follows:
| | Amount | % of
Class-Level Average
Net Assets |
| Class A | $385,423 | .30 |
| Class T | 151,579 | .30 |
| Class B | 15,229 | .30 |
| Class C | 165,378 | .30 |
| Class I | 404,444 | .20 |
| Class Z | 2,686 | .05 |
| | $1,124,739 | |
Accounting and Security Lending Fees. Fidelity Service Company, Inc. (FSC), an affiliate of the investment adviser, maintains the Fund's accounting records. The accounting fee is based on the level of average net assets for each month. Under a separate contract, FSC administers the security lending program. The security lending fee is based on the number and duration of lending transactions.
Brokerage Commissions. The Fund placed a portion of its portfolio transactions with brokerage firms which are affiliates of the investment adviser. Brokerage commissions are included in net realized gain (loss) and change in net unrealized appreciation (depreciation) in the Statement of Operations. The commissions paid to these affiliated firms were $1,687 for the period.
Interfund Lending Program. Pursuant to an Exemptive Order issued by the SEC, the Fund, along with other registered investment companies having management contracts with FMR or other affiliated entities of FMR, may participate in an interfund lending program. This program provides an alternative credit facility allowing the funds to borrow from, or lend money to, other participating affiliated funds. At period end, there were no interfund loans outstanding. The Fund's activity in this program during the period for which loans were outstanding was as follows:
| Borrower or Lender | Average Loan Balance | Weighted Average Interest Rate | Interest Expense |
| Borrower | $4,162,000 | .35% | $205 |
6. Committed Line of Credit.
The Fund participates with other funds managed by the investment adviser or an affiliate in a $4.25 billion credit facility (the "line of credit") to be utilized for temporary or emergency purposes to fund shareholder redemptions or for other short-term liquidity purposes. The Fund has agreed to pay commitment fees on its pro-rata portion of the line of credit, which amounted to $648 and is reflected in Miscellaneous expenses on the Statement of Operations. During the period, the Fund did not borrow on this line of credit.
7. Security Lending.
The Fund lends portfolio securities through a lending agent from time to time in order to earn additional income. For equity securities, a lending agent is used and may loan securities to certain qualified borrowers, including Fidelity Capital Markets (FCM), a broker-dealer affiliated with the Fund. On the settlement date of the loan, the Fund receives collateral (in the form of U.S. Treasury obligations, letters of credit and/or cash) against the loaned securities and maintains collateral in an amount not less than 100% of the market value of the loaned securities during the period of the loan. The market value of the loaned securities is determined at the close of business of the Fund and any additional required collateral is delivered to the Fund on the next business day. The Fund or borrower may terminate the loan at any time, and if the borrower defaults on its obligation to return the securities loaned because of insolvency or other reasons, the Fund may apply collateral received from the borrower against the obligation. The Fund may experience delays and costs in recovering the securities loaned. Any cash collateral received is invested in the Fidelity Securities Lending Cash Central Fund. The value of loaned securities and cash collateral at period end are disclosed on the Fund's Statement of Assets and Liabilities. At period end, there were no security loans outstanding with FCM. Security lending income represents the income earned on investing cash collateral, less rebates paid to borrowers and any lending agent fees associated with the loan, plus any premium payments received for lending certain types of securities. Security lending income is presented in the Statement of Operations as a component of income from Fidelity Central Funds. Total security lending income during the period amounted to $62,534, including $1,005 from securities loaned to FCM.
8. Expense Reductions.
Commissions paid to certain brokers with whom the investment adviser, or its affiliates, places trades on behalf of the Fund include an amount in addition to trade execution, which may be rebated back to the Fund to offset certain expenses. This amount totaled $64,703 for the period.
Through arrangements with the Fund's custodian, credits realized as a result of certain uninvested cash balances were used to reduce the Fund's expenses. During the period, these credits reduced the Fund's custody expenses by $52.
In addition, during the period the investment adviser reimbursed and/or waived a portion of fund-level operating expenses in the amount of $1,803 and a portion of class-level operating expenses as follows:
| | Amount |
| Class A | $724 |
| Class T | 128 |
| Class B | 11 |
| Class C | 133 |
| Class I | 3,497 |
| | $4,493 |
9. Distributions to Shareholders.
Distributions to shareholders of each class were as follows:
| Years ended October 31, | 2015 | 2014 |
| From net investment income | | |
| Class A | $115,150 | $314,541 |
| Class T | – | 2,453 |
| Class I | 898,042 | 791,098 |
| Class Z | 33,409 | 5,139 |
| Total | $1,046,601 | $1,113,231 |
| From net realized gain | | |
| Class A | $199,998 | $77,030 |
| Class T | – | 29,431 |
| Class I | 279,579 | 79,110 |
| Class Z | 7,710 | 385 |
| Total | $487,287 | $185,956 |
10. Share Transactions.
Share transactions for each class were as follows and may contain automatic conversions between classes or exchanges between funds:
| | Shares | Shares | Dollars | Dollars |
| Years ended October 31, | 2015 | 2014 | 2015 | 2014 |
| Class A | | | | |
| Shares sold | 1,093,525 | 1,306,708 | $24,402,020 | $29,667,252 |
| Reinvestment of distributions | 13,163 | 16,164 | 302,357 | 356,894 |
| Shares redeemed | (1,715,077) | (1,739,459) | (37,830,400) | (38,968,004) |
| Net increase (decrease) | (608,389) | (416,587) | $(13,126,023) | $(8,943,858) |
| Class T | | | | |
| Shares sold | 305,389 | 414,394 | $6,786,919 | $9,392,831 |
| Reinvestment of distributions | – | 1,397 | – | 30,813 |
| Shares redeemed | (537,767) | (558,505) | (11,710,693) | (12,438,338) |
| Net increase (decrease) | (232,378) | (142,714) | $(4,923,774) | $(3,014,694) |
| Class B | | | | |
| Shares sold | 2,482 | 16,905 | $54,329 | $374,479 |
| Shares redeemed | (171,894) | (200,427) | (3,727,701) | (4,400,967) |
| Net increase (decrease) | (169,412) | (183,522) | $(3,673,372) | $(4,026,488) |
| Class C | | | | |
| Shares sold | 365,122 | 651,900 | $7,912,445 | $14,559,904 |
| Shares redeemed | (858,213) | (666,053) | (18,293,083) | (14,339,508) |
| Net increase (decrease) | (493,091) | (14,153) | $(10,380,638) | $220,396 |
| Class I | | | | |
| Shares sold | 3,524,595 | 2,772,401 | $77,404,353 | $64,467,777 |
| Reinvestment of distributions | 49,091 | 36,756 | 1,129,581 | 813,035 |
| Shares redeemed | (1,999,205) | (963,648) | (44,250,238) | (22,091,792) |
| Net increase (decrease) | 1,574,481 | 1,845,509 | $34,283,696 | $43,189,020 |
| Class Z | | | | |
| Shares sold | 119,541 | 251,250 | $2,670,833 | $5,945,448 |
| Reinvestment of distributions | 1,789 | 250 | 41,119 | 5,524 |
| Shares redeemed | (63,727) | (20,301) | (1,390,718) | (467,981) |
| Net increase (decrease) | 57,603 | 231,199 | $1,321,234 | $5,482,991 |
11. Other.
The Fund's organizational documents provide former and current trustees and officers with a limited indemnification against liabilities arising in connection with the performance of their duties to the Fund. In the normal course of business, the Fund may also enter into contracts that provide general indemnifications. The Fund's maximum exposure under these arrangements is unknown as this would be dependent on future claims that may be made against the Fund. The risk of material loss from such claims is considered remote.
Report of Independent Registered Public Accounting Firm
To the Trustees of Fidelity Advisor Series VIII and Shareholders of Fidelity Advisor® Emerging Markets Fund:
We have audited the accompanying statement of assets and liabilities of Fidelity Advisor® Emerging Markets Fund (the Fund), a fund of Fidelity Advisor Series VIII, including the schedule of investments, as of October 31, 2015, and the related statement of operations for the year then ended, the statement of changes in net assets for each of the two years in the period then ended, and the financial highlights for each of the five years in the period then ended. These financial statements and financial highlights are the responsibility of the Fund's management. Our responsibility is to express an opinion on these financial statements and financial highlights based on our audits.
We conducted our audits in accordance with the standards of the Public Company Accounting Oversight Board (United States). Those standards require that we plan and perform the audit to obtain reasonable assurance about whether the financial statements and financial highlights are free of material misstatement. The Fund is not required to have, nor were we engaged to perform, an audit of its internal control over financial reporting. Our audits included consideration of internal control over financial reporting as a basis for designing audit procedures that are appropriate in the circumstances, but not for the purpose of expressing an opinion on the effectiveness of the Fund's internal control over financial reporting. Accordingly, we express no such opinion. An audit also includes examining, on a test basis, evidence supporting the amounts and disclosures in the financial statements, assessing the accounting principles used and significant estimates made by management, as well as evaluating the overall financial statement presentation. Our procedures included confirmation of securities owned as of October 31, 2015, by correspondence with the custodians and brokers; when replies were not received from brokers, we performed other auditing procedures. We believe our audits provide a reasonable basis for our opinion.
In our opinion, such financial statements and financial highlights referred to above present fairly, in all material respects, the financial position of Fidelity Advisor® Emerging Markets Fund as of October 31, 2015, the results of its operations for the year then ended, the changes in its net assets for each of the two years in the period then ended, and the financial highlights for each of the five years in the period then ended, in conformity with accounting principles generally accepted in the United States of America.
DELOITTE & TOUCHE LLP
Boston, Massachusetts
December 16, 2015
Trustees and Officers
The Trustees, Members of the Advisory Board (if any), and officers of the trust and fund, as applicable, are listed below. The Board of Trustees governs the fund and is responsible for protecting the interests of shareholders. The Trustees are experienced executives who meet periodically throughout the year to oversee the fund's activities, review contractual arrangements with companies that provide services to the fund, oversee management of the risks associated with such activities and contractual arrangements, and review the fund's performance. Each of the Trustees oversees 170 funds.
The Trustees hold office without limit in time except that (a) any Trustee may resign; (b) any Trustee may be removed by written instrument, signed by at least two-thirds of the number of Trustees prior to such removal; (c) any Trustee who requests to be retired or who has become incapacitated by illness or injury may be retired by written instrument signed by a majority of the other Trustees; and (d) any Trustee may be removed at any special meeting of shareholders by a two-thirds vote of the outstanding voting securities of the trust. Each Trustee who is not an interested person (as defined in the 1940 Act) of the trust and the fund is referred to herein as an Independent Trustee. Each Independent Trustee shall retire not later than the last day of the calendar year in which his or her 75th birthday occurs. The Independent Trustees may waive this mandatory retirement age policy with respect to individual Trustees. Officers and Advisory Board Members hold office without limit in time, except that any officer or Advisory Board Member may resign or may be removed by a vote of a majority of the Trustees at any regular meeting or any special meeting of the Trustees. Except as indicated, each individual has held the office shown or other offices in the same company for the past five years.
The fund’s Statement of Additional Information (SAI) includes more information about the Trustees. To request a free copy, call Fidelity at 1-877-208-0098.
Experience, Skills, Attributes, and Qualifications of the Trustees. The Governance and Nominating Committee has adopted a statement of policy that describes the experience, qualifications, attributes, and skills that are necessary and desirable for potential Independent Trustee candidates (Statement of Policy). The Board believes that each Trustee satisfied at the time he or she was initially elected or appointed a Trustee, and continues to satisfy, the standards contemplated by the Statement of Policy. The Governance and Nominating Committee also engages professional search firms to help identify potential Independent Trustee candidates who have the experience, qualifications, attributes, and skills consistent with the Statement of Policy. From time to time, additional criteria based on the composition and skills of the current Independent Trustees, as well as experience or skills that may be appropriate in light of future changes to board composition, business conditions, and regulatory or other developments, have also been considered by the professional search firms and the Governance and Nominating Committee. In addition, the Board takes into account the Trustees' commitment and participation in Board and committee meetings, as well as their leadership of standing and ad hoc committees throughout their tenure.
In determining that a particular Trustee was and continues to be qualified to serve as a Trustee, the Board has considered a variety of criteria, none of which, in isolation, was controlling. The Board believes that, collectively, the Trustees have balanced and diverse experience, qualifications, attributes, and skills, which allow the Board to operate effectively in governing the fund and protecting the interests of shareholders. Information about the specific experience, skills, attributes, and qualifications of each Trustee, which in each case led to the Board's conclusion that the Trustee should serve (or continue to serve) as a trustee of the fund, is provided below.
Board Structure and Oversight Function. James C. Curvey is an interested person and currently serves as Chairman. The Trustees have determined that an interested Chairman is appropriate and benefits shareholders because an interested Chairman has a personal and professional stake in the quality and continuity of services provided to the fund. Independent Trustees exercise their informed business judgment to appoint an individual of their choosing to serve as Chairman, regardless of whether the Trustee happens to be independent or a member of management. The Independent Trustees have determined that they can act independently and effectively without having an Independent Trustee serve as Chairman and that a key structural component for assuring that they are in a position to do so is for the Independent Trustees to constitute a substantial majority for the Board. The Independent Trustees also regularly meet in executive session. Ned C. Lautenbach serves as Chairman of the Independent Trustees and as such (i) acts as a liaison between the Independent Trustees and management with respect to matters important to the Independent Trustees and (ii) with management prepares agendas for Board meetings.
Fidelity® funds are overseen by different Boards of Trustees. The fund's Board oversees Fidelity's high income and certain equity funds, and other Boards oversee Fidelity's investment-grade bond, money market, asset allocation, and sector funds. The asset allocation funds may invest in Fidelity® funds overseen by the fund's Board. The use of separate Boards, each with its own committee structure, allows the Trustees of each group of Fidelity® funds to focus on the unique issues of the funds they oversee, including common research, investment, and operational issues. On occasion, the separate Boards establish joint committees to address issues of overlapping consequences for the Fidelity® funds overseen by each Board.
The Trustees operate using a system of committees to facilitate the timely and efficient consideration of all matters of importance to the Trustees, the fund, and fund shareholders and to facilitate compliance with legal and regulatory requirements and oversight of the fund's activities and associated risks. The Board, acting through its committees, has charged FMR and its affiliates with (i) identifying events or circumstances the occurrence of which could have demonstrably adverse effects on the fund's business and/or reputation; (ii) implementing processes and controls to lessen the possibility that such events or circumstances occur or to mitigate the effects of such events or circumstances if they do occur; and (iii) creating and maintaining a system designed to evaluate continuously business and market conditions in order to facilitate the identification and implementation processes described in (i) and (ii) above. Because the day-to-day operations and activities of the fund are carried out by or through FMR, its affiliates, and other service providers, the fund's exposure to risks is mitigated but not eliminated by the processes overseen by the Trustees. While each of the Board's committees has responsibility for overseeing different aspects of the fund's activities, oversight is exercised primarily through the Operations, Audit, and Compliance Committees. In addition, the Independent Trustees have worked with FMR to enhance the Board's oversight of investment and financial risks, legal and regulatory risks, technology risks, and operational risks, including the development of additional risk reporting to the Board. For example, a working group comprised of Independent Trustees and FMR has worked and continues to work to review the Fidelity® funds' valuation-related activities, reporting and risk management. Appropriate personnel, including but not limited to the fund's Chief Compliance Officer (CCO), FMR's internal auditor, the independent accountants, the fund's Treasurer and portfolio management personnel, make periodic reports to the Board's committees, as appropriate, including an annual review of Fidelity's risk management program for the Fidelity® funds. The responsibilities of each standing committee, including their oversight responsibilities, are described further under "Standing Committees of the Trustees."
Interested Trustees*:
Correspondence intended for a Trustee who is an interested person may be sent to Fidelity Investments, 245 Summer Street, Boston, Massachusetts 02210.
Name, Year of Birth; Principal Occupations and Other Relevant Experience+
James C. Curvey (1935)
Year of Election or Appointment: 2007
Trustee
Chairman of the Board of Trustees
Mr. Curvey also serves as Trustee of other Fidelity® funds. Mr. Curvey is a Director of Fidelity Research & Analysis Co. (investment adviser firm, 2009-present), and Vice Chairman (2007-present) and Director of FMR LLC (diversified financial services company). In addition, Mr. Curvey serves as an Overseer for the Boston Symphony Orchestra and a member of the board of Artis-Naples, Naples, Florida, and as a Trustee for Brewster Academy, Wolfeboro, New Hampshire. Previously, Mr. Curvey served as a Director of Fidelity Investments Money Management, Inc. (investment adviser firm, 2009-2014) and a Director of FMR and FMR Co., Inc. (investment adviser firms, 2007-2014).
Charles S. Morrison (1960)
Year of Election or Appointment: 2014
Trustee
Mr. Morrison also serves as Trustee of other funds. He serves as a Director of Fidelity Investments Money Management, Inc. (FIMM) (investment adviser firm, 2014-present), Director of Fidelity SelectCo, LLC (investment adviser firm, 2014-present), President, Asset Management (2014-present), and is an employee of Fidelity Investments. Previously, Mr. Morrison served as Vice President of Fidelity's Fixed Income and Asset Allocation Funds (2012-2014), President, Fixed Income (2011-2014), Vice President of Fidelity's Money Market Funds (2005-2009), President, Money Market Group Leader of FMR (investment adviser firm, 2009), and Senior Vice President, Money Market Group of FMR (2004-2009). Mr. Morrison also served as Vice President of Fidelity's Bond Funds (2002-2005), certain Balanced Funds (2002-2005), and certain Asset Allocation Funds (2002-2007), and as Senior Vice President (2002-2005) of Fidelity's Bond Division.
* Determined to be an “Interested Trustee” by virtue of, among other things, his or her affiliation with the trust or various entities under common control with FMR.
+ The information includes the Trustee's principal occupation during the last five years and other information relating to the experience, attributes, and skills relevant to the Trustee's qualifications to serve as a Trustee, which led to the conclusion that the Trustee should serve as a Trustee for the fund.
Independent Trustees:
Correspondence intended for an Independent Trustee may be sent to Fidelity Investments, P.O. Box 55235, Boston, Massachusetts 02205-5235.
Name, Year of Birth; Principal Occupations and Other Relevant Experience+
Dennis J. Dirks (1948)
Year of Election or Appointment: 2005
Trustee
Mr. Dirks also serves as Trustee of other Fidelity® funds. Prior to his retirement in May 2003, Mr. Dirks was Chief Operating Officer and a member of the Board of The Depository Trust & Clearing Corporation (DTCC). He also served as President, Chief Operating Officer, and Board member of The Depository Trust Company (DTC) and President and Board member of the National Securities Clearing Corporation (NSCC). In addition, Mr. Dirks served as Chief Executive Officer and Board member of the Government Securities Clearing Corporation, Chief Executive Officer and Board member of the Mortgage-Backed Securities Clearing Corporation, as a Trustee and a member of the Finance Committee of Manhattan College (2005-2008), as a Trustee and a member of the Finance Committee of AHRC of Nassau County (2006-2008), and as a member of the Independent Directors Council (IDC) Governing Council (2010-2015). Mr. Dirks is a member of the Board of Directors for The Brookville Center for Children's Services, Inc. (2009-present).
Alan J. Lacy (1953)
Year of Election or Appointment: 2008
Trustee
Mr. Lacy also serves as Trustee of other Fidelity® funds. Mr. Lacy serves as a member of the Board of Directors of Dave & Buster's Entertainment, Inc. (restaurant and entertainment complexes, 2010-present) and Bristol-Myers Squibb Company (global pharmaceuticals, 2008-present). In addition, Mr. Lacy served as Senior Adviser (2007-2014) of Oak Hill Capital Partners, L.P. (private equity) and also served as Chief Executive Officer (2000-2005) and Vice Chairman (2005-2006) of Sears Holdings Corporation and Sears, Roebuck and Co. (retail). Mr. Lacy is a member of the Board of Trustees of The National Parks Conservation Association (2006-present). Previously, Mr. Lacy served as Chairman of the Board of Trustees of the National Parks Conservation Association (2008-2011) and as a member of the Board of Directors for The Western Union Company (global money transfer, 2006-2011), The Hillman Companies, Inc. (hardware wholesalers, 2010-2014), and Earth Fare, Inc. (retail grocery, 2010-2014).
Ned C. Lautenbach (1944)
Year of Election or Appointment: 2000
Trustee
Chairman of the Independent Trustees
Mr. Lautenbach also serves as Trustee of other Fidelity® funds. Mr. Lautenbach currently serves as the Lead Director of the Eaton Corporation Board of Directors (diversified industrial, 1997-present). Mr. Lautenbach is Chairman of the Board of Directors of Artis-Naples in Naples, Florida (2012-present), a member of the Council on Foreign Relations (1994-present), and a member of the Board of Governors, State University System of Florida (2013-present). Previously, Mr. Lautenbach was a Partner/Advisory Partner at Clayton, Dubilier & Rice, LLC (private equity investment, 1998-2010), as well as a Director of Sony Corporation (2006-2007).
Joseph Mauriello (1944)
Year of Election or Appointment: 2008
Trustee
Mr. Mauriello also serves as Trustee of other Fidelity® funds. Prior to his retirement in January 2006, Mr. Mauriello served in numerous senior management positions including Deputy Chairman and Chief Operating Officer (2004-2005), and Vice Chairman of Financial Services (2002-2004) of KPMG LLP US (professional services, 1965-2005). Mr. Mauriello currently serves as a member of the Board of Directors of XL Group plc. (global insurance and re-insurance, 2006-present) and the Independent Directors Council (IDC) Governing Council (2015-present). Previously, Mr. Mauriello served as a Director of the Hamilton Funds of the Bank of New York (2006-2007) and of Arcadia Resources Inc. (health care services and products, 2007-2012).
Robert W. Selander (1950)
Year of Election or Appointment: 2011
Trustee
Mr. Selander also serves as Trustee of other Fidelity® funds. Mr. Selander serves as a Director of The Western Union Company (global money transfer, 2014-present). Previously, Mr. Selander served as a Member of the Advisory Board of other Fidelity® funds (2011), and Executive Vice Chairman (2010), Chief Executive Officer (2009-2010), and President and Chief Executive Officer (1997-2009) of Mastercard, Inc.
Cornelia M. Small (1944)
Year of Election or Appointment: 2005
Trustee
Ms. Small also serves as Trustee of other Fidelity® funds. Ms. Small is a member of the Board of Directors (2009-present) and Chair of the Investment Committee (2010-present) of the Teagle Foundation. Ms. Small also serves on the Investment Committee of the Berkshire Taconic Community Foundation (2008-present). Previously, Ms. Small served as Chairperson (2002-2008) and a member of the Investment Committee and Chairperson (2008-2012) and a member of the Board of Trustees of Smith College. In addition, Ms. Small served as Chief Investment Officer, Director of Global Equity Investments, and a member of the Board of Directors of Scudder, Stevens & Clark and Scudder Kemper Investments.
William S. Stavropoulos (1939)
Year of Election or Appointment: 2001
Trustee
Vice Chairman of the Independent Trustees
Mr. Stavropoulos also serves as Trustee of other Fidelity® funds. Mr. Stavropoulos serves as President and Founder of the Michigan Baseball Foundation, the Great Lakes Loons (2007-present). Mr. Stavropoulos is Chairman Emeritus of the Board of Directors of The Dow Chemical Company, where he previously served in numerous senior management positions, including President, CEO (1995-2000; 2002-2004), Chairman of the Executive Committee (2000-2006), and as a member of the Board of Directors (1990-2006). Currently, Mr. Stavropoulos is Chairman of the Board of Directors of Univar Inc. (global distributor of commodity and specialty chemicals), a Director of Teradata Corporation (data warehousing and technology solutions), and Maersk Inc. (industrial conglomerate), and a member of the Advisory Board for Metalmark Capital LLC (private equity investment, 2005-present). Mr. Stavropoulos is an operating advisor to Clayton, Dubilier & Rice, LLC (private equity investment). In addition, Mr. Stavropoulos is a member of the University of Notre Dame Advisory Council for the College of Science, a Trustee of the Rollin L. Gerstacker Foundation, and a Director of the Naples Philharmonic Center for the Arts. Previously, Mr. Stavropoulos served as a Director of Chemical Financial Corporation (bank holding company, 1993-2012) and Tyco International, Ltd. (multinational manufacturing and services, 2007-2012).
David M. Thomas (1949)
Year of Election or Appointment: 2008
Trustee
Mr. Thomas also serves as Trustee of other Fidelity® funds. Mr. Thomas serves as Non-Executive Chairman of the Board of Directors of Fortune Brands Home and Security (home and security products, 2011-present), as a member of the Board of Directors (2004-present) and Presiding Director (2013-present) of Interpublic Group of Companies, Inc. (marketing communication), and as a member of the Board of Trustees of the University of Florida (2013-present). Previously, Mr. Thomas served as Executive Chairman (2005-2006) and Chairman and Chief Executive Officer (2000-2005) of IMS Health, Inc. (pharmaceutical and healthcare information solutions), and a Director of Fortune Brands, Inc. (consumer products, 2000-2011).
+ The information includes the Trustee's principal occupation during the last five years and other information relating to the experience, attributes, and skills relevant to the Trustee's qualifications to serve as a Trustee, which led to the conclusion that the Trustee should serve as a Trustee for the fund.
Advisory Board Members and Officers:
Correspondence intended for an officer or Peter S. Lynch may be sent to Fidelity Investments, 245 Summer Street, Boston, Massachusetts 02210. Officers appear below in alphabetical order.
Name, Year of Birth; Principal Occupation
Peter S. Lynch (1944)
Year of Election or Appointment: 2003
Member of the Advisory Board
Mr. Lynch also serves as Member of the Advisory Board of other Fidelity® funds. Mr. Lynch is Vice Chairman and a Director of FMR (investment adviser firm) and FMR Co., Inc. (investment adviser firm). In addition, Mr. Lynch serves as a Trustee of Boston College and as the Chairman of the Inner-City Scholarship Fund. Previously, Mr. Lynch served on the Special Olympics International Board of Directors (1997-2006).
Elizabeth Paige Baumann (1968)
Year of Election or Appointment: 2012
Anti-Money Laundering (AML) Officer
Ms. Baumann also serves as AML Officer of other funds. She is Chief AML Officer of FMR LLC (diversified financial services company, 2012-present) and is an employee of Fidelity Investments. Previously, Ms. Baumann served as Vice President and Deputy Anti-Money Laundering Officer (2007-2012).
Marc R. Bryant (1966)
Year of Election or Appointment: 2015
Secretary and Chief Legal Officer (CLO)
Mr. Bryant also serves as Secretary and CLO of other funds. Mr. Bryant serves as CLO, Secretary, and Senior Vice President of Fidelity Management & Research Company (investment adviser firm, 2015-present) and FMR Co., Inc. (investment adviser firm, 2015-present); Secretary of Fidelity SelectCo, LLC (investment adviser firm, 2015-present) and Fidelity Investments Money Management, Inc. (investment adviser firm, 2015-present); and CLO of Fidelity Management & Research (Hong Kong) Limited (investment adviser firm, 2015-present). He is Senior Vice President and Deputy General Counsel of FMR LLC (diversified financial services company). Previously, Mr. Bryant served as Secretary and Chief Legal Officer of Fidelity Rutland Square Trust II (2010-2014) and Assistant Secretary of Fidelity's Fixed Income and Asset Allocation Funds (2013-2015). Prior to joining Fidelity Investments, Mr. Bryant served as a Senior Vice President and the Head of Global Retail Legal for AllianceBernstein L.P. (2006-2010), and as the General Counsel for ProFund Advisors LLC (2001-2006).
Timothy M. Cohen (1969)
Year of Election or Appointment: 2014
Vice President of certain Equity Funds
Mr. Cohen also serves as Vice President of other funds. Mr. Cohen serves as Chief Compliance Officer of FMR Investment Management (U.K.) Limited (investment adviser firm, 2013-present) and is an employee of Fidelity Investments. Previously, Mr. Cohen served as a Director of FMR Investment Management (U.K.) Limited (2013-2015).
William C. Coffey (1969)
Year of Election or Appointment: 2009
Assistant Secretary
Mr. Coffey also serves as Assistant Secretary of other funds. He is Senior Vice President and Deputy General Counsel of FMR LLC (diversified financial services company, 2010-present), and is an employee of Fidelity Investments. Previously, Mr. Coffey served as Vice President and Associate General Counsel of FMR LLC (2005-2009).
Jonathan Davis (1968)
Year of Election or Appointment: 2010
Assistant Treasurer
Mr. Davis also serves as Assistant Treasurer of other funds, and is an employee of Fidelity Investments. Previously, Mr. Davis served as Vice President and Associate General Counsel of FMR LLC (diversified financial services company, 2003-2010).
Adrien E. Deberghes (1967)
Year of Election or Appointment: 2008
Deputy Treasurer
Mr. Deberghes also serves as an officer of other funds. He is an employee of Fidelity Investments (2008-present). Prior to joining Fidelity Investments, Mr. Deberghes was Senior Vice President of Mutual Fund Administration at State Street Corporation (2007-2008), Senior Director of Mutual Fund Administration at Investors Bank & Trust (2005-2007), and Director of Finance for Dunkin' Brands (2000-2005).
Stephanie J. Dorsey (1969)
Year of Election or Appointment: 2010
Assistant Treasurer
Ms. Dorsey also serves as an officer of other funds. She is an employee of Fidelity Investments (2008-present) and has served in other fund officer roles. Prior to joining Fidelity Investments, Ms. Dorsey served as Treasurer (2004-2008) of the JPMorgan Mutual Funds and Vice President (2004-2008) of JPMorgan Chase Bank.
Howard J. Galligan III (1966)
Year of Election or Appointment: 2014
Chief Financial Officer
Mr. Galligan also serves as Chief Financial Officer of other funds. Mr. Galligan serves as President of Fidelity Pricing and Cash Management Services (FPCMS) (2014-present) and as a Director of Strategic Advisers, Inc. (investment adviser firm, 2008-present). Previously, Mr. Galligan served as Chief Administrative Officer of Asset Management (2011-2014) and Chief Operating Officer and Senior Vice President of Investment Support for Strategic Advisers, Inc. (2003-2011).
Scott C. Goebel (1968)
Year of Election or Appointment: 2015
Vice President
Mr. Goebel serves as Vice President of other funds and is an employee of Fidelity Investments (2001-present). Previously, Mr. Goebel served as Secretary of Fidelity SelectCo, LLC (investment adviser firm, 2013-2015), Fidelity Investments Money Management, Inc. (FIMM) (investment adviser firm, 2010-2015), and Fidelity Research and Analysis Company (FRAC) (investment adviser firm, 2010-2015); General Counsel, Secretary, and Senior Vice President of Fidelity Management & Research Company (investment adviser firm, 2008-2015) and FMR Co., Inc. (investment adviser firm, 2008-2015); Assistant Secretary of Fidelity Management & Research (Japan) Limited (investment adviser firm, 2008-2015) and FMR Investment Management (U.K.) Limited (investment adviser firm, 2008-2015); Chief Legal Officer (CLO) of Fidelity Management & Research (Hong Kong) Limited (investment adviser firm, 2008-2015); Secretary and CLO of certain Fidelity® funds (2008-2015); Assistant Secretary of FIMM (2008-2010), FRAC (2008-2010), and certain funds (2007-2008); and as Vice President and Secretary of Fidelity Distributors Corporation (FDC) (2005-2007).
Brian B. Hogan (1964)
Year of Election or Appointment: 2009
Vice President
Mr. Hogan also serves as Trustee or Vice President of other funds. Mr. Hogan serves as a Director of Fidelity SelectCo, LLC (investment adviser firm, 2014-present) and President of the Equity Division of FMR (investment adviser firm, 2009-present). Previously, Mr. Hogan served as Senior Vice President, Equity Research of FMR (2006-2009) and as a portfolio manager.
Chris Maher (1972)
Year of Election or Appointment: 2013
Assistant Treasurer
Mr. Maher serves as Assistant Treasurer of other funds. Mr. Maher is Vice President of Valuation Oversight and is an employee of Fidelity Investments. Previously, Mr. Maher served as Vice President of Asset Management Compliance (2013), Vice President of the Program Management Group of FMR (investment adviser firm, 2010-2013), and Vice President of Valuation Oversight (2008-2010).
Kenneth B. Robins (1969)
Year of Election or Appointment: 2008
President and Treasurer
Mr. Robins also serves as an officer of other funds. Mr. Robins serves as Executive Vice President of Fidelity Investments Money Management, Inc. (FIMM) (investment adviser firm, 2013-present) and is an employee of Fidelity Investments (2004-present). Previously, Mr. Robins served in other fund officer roles.
Stacie M. Smith (1974)
Year of Election or Appointment: 2013
Deputy Treasurer
Ms. Smith also serves as an officer of other funds. She is an employee of Fidelity Investments (2009-present) and has served in other fund officer roles. Prior to joining Fidelity Investments, Ms. Smith served as Senior Audit Manager of Ernst & Young LLP (1996-2009).
Renee Stagnone (1975)
Year of Election or Appointment: 2013
Deputy Treasurer
Ms. Stagnone also serves as Deputy Treasurer of other funds. Ms. Stagnone is an employee of Fidelity Investments (1997-present).
Linda J. Wondrack (1964)
Year of Election or Appointment: 2014
Chief Compliance Officer
Ms. Wondrack also serves as Chief Compliance Officer of other funds. Ms. Wondrack is Executive Vice President and head of the Ethics Office and Asset Management Compliance for Fidelity Investments (2012-present). Ms. Wondrack also serves as Chief Compliance Officer of Fidelity SelectCo, LLC (investment adviser firm, 2014-present); Chief Compliance Officer of Impresa Management LLC (2013-present); and Chief Compliance Officer of FMR Co., Inc. (investment adviser firm), Fidelity Investments Money Management, Inc. (investment adviser firm), Fidelity Management & Research (Japan) Limited (investment adviser firm), FMR Investment Management (U.K.) Limited (investment adviser firm), Fidelity Management & Research (Hong Kong) (investment adviser firm), Fidelity Management & Research Company (investment adviser firm), FIAM LLC (investment adviser firm), and Strategic Advisers, Inc. (investment adviser firm), Ballyrock Investment Advisors LLC, and Northern Neck Investors LLC (2012-present). Previously, Ms. Wondrack served as Senior Vice President and Chief Compliance Officer for Columbia Management Investment Advisers, LLC (2005-2012); Chief Compliance Officer for certain funds within the Columbia Family of Funds (2007-2012); and Senior Vice President of Compliance Risk Management at Bank of America (2005-2010).
Joseph F. Zambello (1957)
Year of Election or Appointment: 2011
Deputy Treasurer
Mr. Zambello also serves as Deputy Treasurer of other funds. Mr. Zambello is an employee of Fidelity Investments (1991-present). Previously, Mr. Zambello served as Vice President of the Program Management Group of FMR (investment adviser firm, 2009-2011) and Vice President of the Transfer Agent Oversight Group (2005-2009).
Shareholder Expense Example
As a shareholder of the Fund, you incur two types of costs: (1) transaction costs, including sales charges (loads) on purchase payments or redemption proceeds, redemption fees and (2) ongoing costs, including management fees, distribution and/or service (12b-1) fees and other Fund expenses. This Example is intended to help you understand your ongoing costs (in dollars) of investing in the Fund and to compare these costs with the ongoing costs of investing in other mutual funds.
The Example is based on an investment of $1,000 invested at the beginning of the period and held for the entire period (May 1, 2015 to October 31, 2015).
Actual Expenses
The first line of the accompanying table for each class of the Fund provides information about actual account values and actual expenses. You may use the information in this line, together with the amount you invested, to estimate the expenses that you paid over the period. Simply divide your account value by $1,000.00 (for example, an $8,600 account value divided by $1,000.00 = 8.6), then multiply the result by the number in the first line for a class of the Fund under the heading entitled "Expenses Paid During Period" to estimate the expenses you paid on your account during this period. In addition, the Fund, as a shareholder in the underlying Fidelity Central Funds, will indirectly bear its pro-rata share of the fees and expenses incurred by the underlying Fidelity Central Funds. These fees and expenses are not included in the Fund's annualized expense ratio used to calculate the expense estimate in the table below.
Hypothetical Example for Comparison Purposes
The second line of the accompanying table for each class of the Fund provides information about hypothetical account values and hypothetical expenses based on a Class' actual expense ratio and an assumed rate of return of 5% per year before expenses, which is not the Class' actual return. The hypothetical account values and expenses may not be used to estimate the actual ending account balance or expenses you paid for the period. You may use this information to compare the ongoing costs of investing in the Fund and other funds. To do so, compare this 5% hypothetical example with the 5% hypothetical examples that appear in the shareholder reports of the other funds. In addition, the Fund, as a shareholder in the underlying Fidelity Central Funds, will indirectly bear its pro-rata share of the fees and expenses incurred by the underlying Fidelity Central Funds. These fees and expenses are not included in the Fund's annualized expense ratio used to calculate the expense estimate in the table below.
Please note that the expenses shown in the table are meant to highlight your ongoing costs only and do not reflect any transaction costs. Therefore, the second line of the table is useful in comparing ongoing costs only, and will not help you determine the relative total costs of owning different funds. In addition, if these transactional costs were included, your costs would have been higher.
| | Annualized Expense Ratio-A | Beginning
Account Value
May 1, 2015 | Ending
Account Value
October 31, 2015 | Expenses Paid
During Period-B
May 1, 2015
to October 31, 2015 |
| Class A | 1.50% | | | |
| Actual | | $1,000.00 | $884.80 | $7.13 |
| Hypothetical-C | | $1,000.00 | $1,017.64 | $7.63 |
| Class T | 1.76% | | | |
| Actual | | $1,000.00 | $883.20 | $8.35 |
| Hypothetical-C | | $1,000.00 | $1,016.33 | $8.94 |
| Class B | 2.24% | | | |
| Actual | | $1,000.00 | $881.40 | $10.62 |
| Hypothetical-C | | $1,000.00 | $1,013.91 | $11.37 |
| Class C | 2.25% | | | |
| Actual | | $1,000.00 | $881.20 | $10.67 |
| Hypothetical-C | | $1,000.00 | $1,013.86 | $11.42 |
| Class I | 1.15% | | | |
| Actual | | $1,000.00 | $886.00 | $5.47 |
| Hypothetical-C | | $1,000.00 | $1,019.41 | $5.85 |
| Class Z | 1.01% | | | |
| Actual | | $1,000.00 | $886.80 | $4.80 |
| Hypothetical-C | | $1,000.00 | $1,020.11 | $5.14 |
A Annualized expense ratio reflects expenses net of applicable fee waivers.
B Expenses are equal to each Class' annualized expense ratio, multiplied by the average account value over the period, multiplied by 184/365 (to reflect the one-half year period).
C 5% return per year before expenses
Distributions (Unaudited)
Class A designates 100% of the dividends distributed during the fiscal year as amounts which may be taken into account as a dividend for purposes of the maximum rate under section 1(h)(11) of the Internal Revenue Code.
Class A designates 14% of the dividends distributed during the fiscal year as qualifying for the dividends-received deductions for corporate shareholders.
The amounts per share which represent income derived from sources within, and taxes paid to, foreign countries or possessions of the United States are as follows:
| | Pay Date | Income | Taxes | |
| Class A | 12/08/2014 | $0.1014 | $0.0494 | |
| | | | | |
| Class T | 12/08/2014 | – | – | |
| | | | | |
| Class B | 12/08/2014 | – | – | |
| | | | | |
| Class C | 12/08/2014 | – | – | |
| | | | | |
The fund will notify shareholders in January 2016 of amounts for use in preparing 2015 income tax returns.
Board Approval of Investment Advisory Contracts and Management Fees
Fidelity Advisor Emerging Markets Fund
Each year, the Board of Trustees, including the Independent Trustees (together, the Board), votes on the renewal of the management contract with Fidelity Management & Research Company (FMR) and the sub-advisory agreements (together, the Advisory Contracts) for the fund. The Board, assisted by the advice of fund counsel and Independent Trustees' counsel, requests and considers a broad range of information relevant to the renewal of the Advisory Contracts throughout the year.
The Board meets regularly and, at each of its meetings, covers an extensive agenda of topics and materials and considers factors that are relevant to its annual consideration of the renewal of the fund's Advisory Contracts, including the services and support provided to the fund and its shareholders. The Board has established various standing committees (Committees), each composed of and chaired by Independent Trustees with varying backgrounds, to which the Board has assigned specific subject matter responsibilities in order to enhance effective decision-making by the Board. The Board, acting directly and through its Committees, requests and receives information concerning the annual consideration of the renewal of the fund's Advisory Contracts. The Board also meets as needed to consider matters specifically related to the Board's annual consideration of the renewal of the Advisory Contracts. Members of the Board may also meet with trustees of other Fidelity funds through ad hoc joint committees to discuss certain matters relevant to all of the Fidelity funds.
At its July 2015 meeting, the Board unanimously determined to renew the fund's Advisory Contracts. In reaching its determination, the Board considered all factors it believed relevant, including (i) the nature, extent, and quality of the services to be provided to the fund and its shareholders (including the investment performance of the fund); (ii) the competitiveness of the fund's management fee and total expense ratio relative to peer funds; (iii) the total costs of the services to be provided by and the profits to be realized by Fidelity from its relationship with the fund; and (iv) the extent to which (if any) economies of scale exist and would be realized as the fund grows, and whether any economies of scale are appropriately shared with fund shareholders.
In considering whether to renew the Advisory Contracts for the fund, the Board reached a determination, with the assistance of fund counsel and Independent Trustees' counsel and through the exercise of its business judgment, that the renewal of the Advisory Contracts was in the best interests of the fund and its shareholders and that the compensation payable under the Advisory Contracts was fair and reasonable. The Board's decision to renew the Advisory Contracts was not based on any single factor, but rather was based on a comprehensive consideration of all the information provided to the Board at its meetings throughout the year. The Board, in reaching its determination to renew the Advisory Contracts, was aware that shareholders of the fund have a broad range of investment choices available to them, including a wide choice among funds offered by Fidelity's competitors, and that the fund's shareholders, who have the opportunity to review and weigh the disclosure provided by the fund in its prospectus and other public disclosures, have chosen to invest in this fund, which is part of the Fidelity family of funds.
Nature, Extent, and Quality of Services Provided. The Board considered Fidelity's staffing as it relates to the fund, including the backgrounds of investment personnel of Fidelity, and also considered the fund's investment objective, strategies, and related investment philosophy. The Independent Trustees also had discussions with senior management of Fidelity's investment operations and investment groups. The Board considered the structure of the portfolio manager compensation program and whether this structure provides appropriate incentives to act in the best interests of the fund. Additionally, the Board considered the portfolio managers' investments, if any, in the funds that they manage.
Resources Dedicated to Investment Management and Support Services. The Board and the Fund Oversight and Research Committees reviewed the general qualifications and capabilities of Fidelity's investment staff, including its size, education, experience, and resources, as well as Fidelity's approach to recruiting, training, managing, and compensating investment personnel. The Board noted that Fidelity has continued to increase the resources devoted to non-U.S. offices, including expansion of Fidelity's global investment organization. The Board also noted that Fidelity's analysts have extensive resources, tools and capabilities that allow them to conduct sophisticated quantitative and fundamental analysis, as well as credit analysis of issuers, counterparties and guarantors. Further, the Board considered that Fidelity's investment professionals have sufficient access to global information and data so as to provide competitive investment results over time, and that those professionals also have access to sophisticated tools that permit them to assess portfolio construction and risk and performance attribution characteristics continuously, as well as to transmit new information and research conclusions rapidly around the world. Additionally, in its deliberations, the Board considered Fidelity's trading, risk management, and compliance capabilities and resources, which are integral parts of the investment management process.
Shareholder and Administrative Services. The Board considered (i) the nature, extent, quality, and cost of advisory, administrative, and shareholder services performed by FMR, the sub-advisers (together with FMR, the Investment Advisers), and their affiliates under the Advisory Contracts and under separate agreements covering transfer agency, pricing and bookkeeping, and securities lending services for the fund; (ii) the nature and extent of the supervision of third party service providers, principally custodians and subcustodians; and (iii) the resources devoted to, and the record of compliance with, the fund's compliance policies and procedures. The Board also reviewed the allocation of fund brokerage, including allocations to brokers affiliated with the Investment Advisers, the use of brokerage commissions to pay fund expenses, and the use of "soft" commission dollars to pay for research services.
The Board noted that the growth of fund assets over time across the complex allows Fidelity to reinvest in the development of services designed to enhance the value or convenience of the Fidelity funds as investment vehicles. These services include 24-hour access to account information and market information through telephone representatives and over the Internet, investor education materials and asset allocation tools, and the expanded availability of Fidelity Investor Centers.
In 2014, the Board formed an ad hoc Committee on Transfer Agency Fees to review the variety of transfer agency fee structures throughout the industry and Fidelity's competitive positioning with respect to industry participants.
Investment in a Large Fund Family. The Board considered the benefits to shareholders of investing in a Fidelity fund, including the benefits of investing in a fund that is part of a large family of funds offering a variety of investment disciplines and providing a large variety of mutual fund investor services. The Board noted that Fidelity had taken, or had made recommendations that resulted in the Fidelity funds taking, a number of actions over the previous year that benefited particular funds, including (i) continuing to dedicate additional resources to investment research and to the support of the senior management team that oversees asset management; (ii) continuing efforts to enhance Fidelity's global research capabilities; (iii) launching new funds and making other enhancements to meet client needs; (iv) reducing management fees and total expenses for certain index funds and diversified international funds; (v) continuing to launch dedicated lower cost underlying funds to meet portfolio construction needs related to expanding underlying fund options for Fidelity funds of funds, specifically for the Freedom Fund product lines; (vi) rationalizing product lines and gaining increased efficiencies through fund mergers; (vii) launching active fixed-income exchange-traded funds; (viii) continuing to develop, acquire and implement systems and technology to improve services to the funds and information security and to increase efficiency; (ix) implementing investment enhancements to further strengthen Fidelity's target date product line to increase investors' probability of success in achieving their goals; (x) modifying the eligibility criteria for certain share classes to accommodate roll-over assets from employer-sponsored retirement plans; (xi) launching a new Class W of the Freedom Index Funds to attract and retain Fidelity record-kept retirement plan assets; and (xii) implementing changes to Fidelity's money market product line in response to recent money market regulatory reforms.
Investment Performance. The Board considered whether the fund has operated in accordance with its investment objective, as well as its record of compliance with its investment restrictions and its performance history. The Board noted that there was a portfolio management change for the fund in October 2012.
The Board took into account discussions with representatives of the Investment Advisers about fund investment performance that occur at Board meetings throughout the year. In this regard the Board noted that as part of regularly scheduled fund reviews and other reports to the Board on fund performance, the Board considers annualized return information for the fund, for different time periods, measured against a securities market index ("benchmark index") and a peer group of funds with similar objectives ("peer group"), if any. In its evaluation of fund investment performance, the Board gave particular attention to information indicating changes in performance of certain Fidelity funds for specific time periods and discussed with the Investment Advisers the reasons for any overperformance or underperformance.
In addition to reviewing absolute and relative fund performance, the Independent Trustees periodically consider the appropriateness of fund performance metrics in evaluating the results achieved. In general, the Independent Trustees believe that fund performance should be evaluated based on net performance (after fees and expenses) of both the highest performing and lowest performing fund share classes, where applicable, compared to appropriate benchmark indices, over appropriate time periods that may include full market cycles, and compared to peer groups, as applicable, over the same periods, taking into account relevant factors including the following: general market conditions; issuer-specific information; and fund cash flows and other factors.
The Independent Trustees recognize that shareholders evaluate performance on a net basis over their own holding periods, for which one-, three-, and five-year periods are often used as a proxy. For this reason, the performance information reviewed by the Board also included net cumulative calendar year total return information for the fund and an appropriate benchmark index and peer group for the most recent one-, three-, and five-year periods, as shown below. Returns are shown compared to the 25th percentile (top of box, 75% beaten) and 75th percentile (bottom of box, 25% beaten) of the peer universe.
Fidelity Advisor Emerging Markets Fund
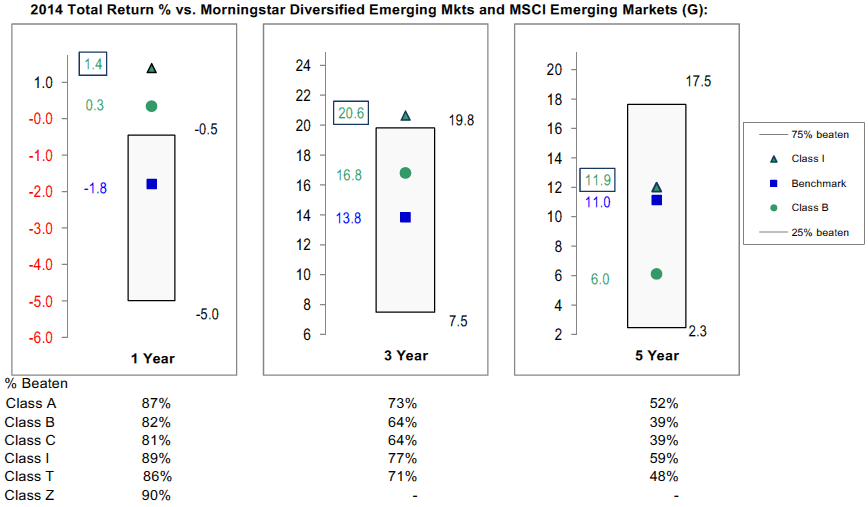
Based on its review, the Board concluded that the nature, extent, and quality of services provided to the fund under the Advisory Contracts should benefit the shareholders of the fund.
Competitiveness of Management Fee and Total Expense Ratio. The Board considered the fund's management fee and total expense ratio compared to "mapped groups" of competitive funds and classes created for the purpose of facilitating the Trustees' competitive analysis of management fees and total expenses. Fidelity creates "mapped groups" by combining similar Lipper investment objective categories that have comparable investment mandates. Combining Lipper investment objective categories aids the Board's management fee and total expense ratio comparisons by broadening the competitive group used for comparison.
Management Fee. The Board considered two proprietary management fee comparisons for the 12-month periods shown in basis points (BP) in the chart below. The group of Lipper funds used by the Board for management fee comparisons is referred to below as the "Total Mapped Group." The Total Mapped Group comparison focuses on a fund's standing in terms of gross management fees before expense reimbursements or caps relative to the total universe of funds with comparable investment mandates, regardless of whether their management fee structures also are comparable. Funds with comparable investment mandates offer exposure to similar types of securities. Funds with comparable management fee structures have similar management fee contractual arrangements (
e.g., flat rate charged for advisory services, all-inclusive fee rate,
etc.). "TMG %" represents the percentage of funds in the Total Mapped Group that had management fees that were lower than the fund's. For example, a hypothetical TMG % of 20% would mean that 80% of the funds in the Total Mapped Group had higher, and 20% had lower, management fees than the fund. The fund's actual TMG %s and the number of funds in the Total Mapped Group are in the chart below. The "Asset-Size Peer Group" (ASPG) comparison focuses on a fund's standing relative to a subset of non-Fidelity funds within the Total Mapped Group that are similar in size and management fee structure without taking into account performance adjustments, if any. For example, if a fund is in the first quartile of the ASPG, the fund's management fee ranks in the least expensive or lowest 25% of funds in the ASPG. The ASPG represents at least 15% of the funds in the Total Mapped Group with comparable asset size and management fee structures, subject to a minimum of 50 funds (or all funds in the Total Mapped Group if fewer than 50). Additional information, such as the ASPG quartile in which the fund's management fee rate ranked, is also included in the chart and considered by the Board.
Fidelity Advisor Emerging Markets Fund
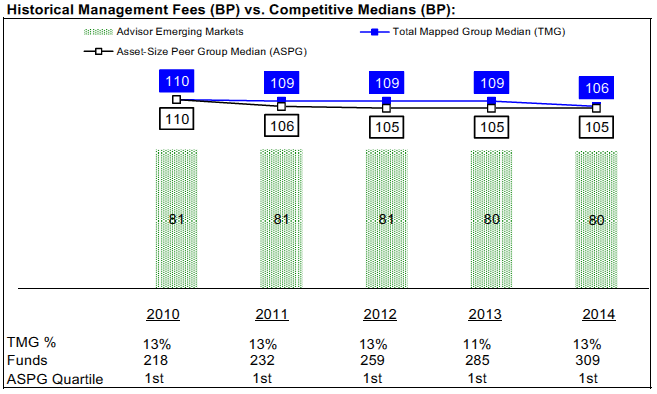
The Board noted that the fund's management fee rate ranked below the median of its Total Mapped Group and below the median of its ASPG for 2014.
The Board noted that, in 2014, the ad hoc Committee on Group Fee was formed by it and other Fidelity fund boards to conduct an in-depth review of the "group fee" component of the management fee of funds with such management fee structures. Committee focus included the mechanics of the group fee, the competitive landscape of group fee structures, Fidelity funds with no group fee component and investment products not included in group fee assets. The Board also considered that, for funds subject to the group fee, FMR agreed to voluntarily waive fees over a specified period of time in amounts designed to account for assets converted from certain funds to certain collective investment trusts.
The Board also noted that, in 2013, the ad hoc Committee on Management Fees was formed to conduct an in-depth review of the management fee rates of Fidelity's active equity mutual funds. The Committee focused on the following areas: (i) standard fee structures; (ii) research consumption and trading evolution; (iii) management fee competitiveness/profitability by category; and (iv) factors that drive institutional pricing.
Based on its review, the Board concluded that the fund's management fee is fair and reasonable in light of the services that the fund receives and the other factors considered.
Total Expense Ratio. In its review of each class's total expense ratio, the Board considered the fund's management fee as well as other fund or class expenses, as applicable, such as transfer agent fees, pricing and bookkeeping fees, fund-paid 12b-1 fees, and custodial, legal, and audit fees. The Board also noted that Fidelity may agree to waive fees and expenses from time to time, and the extent to which, if any, it has done so for the fund. As part of its review, the Board also considered the current and historical total expense ratios of each class of the fund compared to competitive fund median expenses. Each class of the fund is compared to those funds and classes in the Total Mapped Group (used by the Board for management fee comparisons) that have a similar sales load structure.
The Board noted that the total expense ratio of each of Class A, Class B, Class C, Class I, and Class Z ranked below its competitive median for 2014 and the total expense ratio of Class T ranked above its competitive median for 2014. The Board considered that, in general, various factors can affect total expense ratios. The Board noted that the total expense ratio of Class T was above the competitive median primarily because of higher 12b-1 fees on Class T as compared to most competitor funds. Class T has a higher 12b-1 fee, but a lower front-end sales charge, than traditionally priced front-end sales charge classes. The Board considered that Class T is primarily sold load-waived in the retirement plan market where its 0.50% 12b-1 fee is comparable to competing no-load, higher 12b-1 fee classes designed specifically for retirement plans. The Board noted that the fund offers multiple classes, each of which has a different sales load and 12b-1 fee structure, and that the multiple structures are intended to offer a range of pricing options for the intermediary market. The Board also noted that the total expense ratios of the classes vary primarily by the level of their 12b-1 fees, although differences in transfer agent fees may also cause expenses to vary from class to class.
Fees Charged to Other Fidelity Clients. The Board also considered Fidelity fee structures and other information with respect to clients of Fidelity, such as other funds advised or subadvised by Fidelity, pension plan clients, and other institutional clients with similar mandates. The Board noted the findings of the 2013 ad hoc joint committee (created with the board of other Fidelity funds), which reviewed and compared Fidelity's institutional investment advisory business with its business of providing services to the Fidelity funds, including the differences in services provided, fees charged, and costs incurred, as well as competition in their respective marketplaces.
Based on its review of total expense ratios and fees charged to other Fidelity clients, the Board concluded that, although Class T was above the median of the universe presented for comparison, the total expense ratio of each class of the fund was reasonable in light of the services that the fund and its shareholders receive and the other factors considered.
Costs of the Services and Profitability. The Board considered the revenues earned and the expenses incurred by Fidelity in conducting the business of developing, marketing, distributing, managing, administering and servicing the fund and servicing the fund's shareholders. The Board also considered the level of Fidelity's profits in respect of all the Fidelity funds.
On an annual basis, Fidelity presents to the Board information about the profitability of its relationship with the fund. Fidelity calculates profitability information for each fund, as well as aggregate profitability information for groups of Fidelity funds and all Fidelity funds, using a series of detailed revenue and cost allocation methodologies which originate with the books and records of Fidelity on which Fidelity's audited financial statements are based. The Audit Committee of the Board reviews any significant changes from the prior year's methodologies.
PricewaterhouseCoopers LLP (PwC), independent registered public accounting firm and auditor to Fidelity and certain Fidelity funds, has been engaged annually by the Board as part of the Board's assessment of Fidelity's profitability analysis. PwC's engagement includes the review and assessment of the methodologies used by Fidelity in determining the revenues and expenses attributable to Fidelity's mutual fund business, and completion of agreed-upon procedures in respect of the mathematical accuracy of fund profitability and its conformity to established allocation methodologies. After considering PwC's reports issued under the engagement and information provided by Fidelity, the Board concluded that while other allocation methods may also be reasonable, Fidelity's profitability methodologies are reasonable in all material respects.
The Board also reviewed Fidelity's non-fund businesses and fall-out benefits related to the mutual fund business as well as cases where Fidelity's affiliates may benefit from or be related to the fund's business.
The Board considered the costs of the services provided by and the profits realized by Fidelity in connection with the operation of the fund and was satisfied that the profitability was not excessive.
Economies of Scale. The Board considered whether there have been economies of scale in respect of the management of the Fidelity funds, whether the Fidelity funds (including the fund) have appropriately benefited from any such economies of scale, and whether there is potential for realization of any further economies of scale. The Board considered the extent to which the fund will benefit from economies of scale as assets grow through increased services to the fund, through waivers or reimbursements, or through fee or expense ratio reductions. The Board also noted that in 2013, it and the boards of other Fidelity funds created an ad hoc committee (the Economies of Scale Committee) to analyze whether Fidelity attains economies of scale in respect of the management and servicing of the Fidelity funds, whether the Fidelity funds have appropriately benefited from such economies of scale, and whether there is potential for realization of any further economies of scale.
The Board recognized that the fund's management contract incorporates a "group fee" structure, which provides for lower group fee rates as total group assets increase, and for higher group fee rates as total group assets decrease (with "group assets" defined to include fund assets under FMR's management plus sector fund assets previously under FMR's management and currently managed by Fidelity SelectCo, LLC). FMR calculates the group fee rates based on a tiered asset "breakpoint" schedule that varies based on asset class. The Board considered that the group fee is designed to deliver the benefits of economies of scale to fund shareholders when total Fidelity fund assets increase, even if assets of any particular fund are unchanged or have declined, because some portion of Fidelity's costs are attributable to services provided to all Fidelity funds, and all funds benefit if those costs can be allocated among more assets. The Board concluded that, given the group fee structure, fund shareholders will benefit from lower management fees as group assets increase at the fund complex level, regardless of whether Fidelity achieves any such economies of scale.
The Board concluded, taking into account the analysis of the Economies of Scale Committee, that economies of scale, if any, are being appropriately shared between fund shareholders and Fidelity.
Additional Information Requested by the Board. In order to develop fully the factual basis for consideration of the Fidelity funds' Advisory Contracts, the Board requested and received additional information on certain topics, including: (i) fund performance trends and Fidelity's long-term strategies for certain funds; (ii) the various share classes employed by Fidelity and the attributes of each class, together with similar information on the distribution and servicing payments made by Fidelity or the funds to third-party participants in the distribution channels; (iii) fund profitability, and fund performance in relation to fund profitability; (iv) the methodology with respect to evaluating competitive fund data and peer group classifications and fee comparisons; (v) annual fund profitability margins, with particular focus on certain funds with negative margins; (vi) the realization of fall-out benefits in certain Fidelity business units;
(vii) economies of scale and the way in which they are shared with fund shareholders;(viii) Fidelity's group fee structures, including the group fee schedule of breakpoints;(ix) the impact of cost containment measures on the funds; and (x) the transfer agent fee structure.
Based on its evaluation of all of the conclusions noted above, and after considering all factors it believed relevant, the Board concluded that the advisory fee structures are fair and reasonable, and that the fund's Advisory Contracts should be renewed.
FAEM-ANN-1215
1.809299.111
Fidelity Advisor® Emerging Markets Fund Class I (formerly Institutional Class)
Annual Report October 31, 2015 |
|
Contents
To view a fund's proxy voting guidelines and proxy voting record for the 12-month period ended June 30, visit http://www.fidelity.com/proxyvotingresults or visit the Securities and Exchange Commission's (SEC) web site at http://www.sec.gov.
You may also call 1-877-208-0098 to request a free copy of the proxy voting guidelines.
Standard & Poor's, S&P and S&P 500 are registered service marks of The McGraw-Hill Companies, Inc. and have been licensed for use by Fidelity Distributors Corporation.
Other third-party marks appearing herein are the property of their respective owners.
All other marks appearing herein are registered or unregistered trademarks or service marks of FMR LLC or an affiliated company. © 2015 FMR LLC. All rights reserved.
This report and the financial statements contained herein are submitted for the general information of the shareholders of the Fund. This report is not authorized for distribution to prospective investors in the Fund unless preceded or accompanied by an effective prospectus.
A fund files its complete schedule of portfolio holdings with the SEC for the first and third quarters of each fiscal year on Form N-Q. Forms N-Q are available on the SEC’s web site at http://www.sec.gov. A fund's Forms N-Q may be reviewed and copied at the SEC’s Public Reference Room in Washington, DC. Information regarding the operation of the SEC's Public Reference Room may be obtained by calling 1-800-SEC-0330.
For a complete list of a fund's portfolio holdings, view the most recent holdings listing, semiannual report, or annual report on Fidelity's web site at http://www.fidelity.com, http://www.advisor.fidelity.com, or http://www.401k.com, as applicable.
NOT FDIC INSURED •MAY LOSE VALUE •NO BANK GUARANTEE
Neither the Fund nor Fidelity Distributors Corporation is a bank.
Performance: The Bottom Line
Average annual total return reflects the change in the value of an investment, assuming reinvestment of distributions from dividend income and capital gains (the profits earned upon the sale of securities that have grown in value, if any) and assuming a constant rate of performance each year.
The hypothetical investment and the average annual total returns do not reflect the deduction of taxes that a shareholder would pay on fund distributions or the redemption of fund shares.
During periods of reimbursement by Fidelity, a fund’s total return will be greater than it would be had the reimbursement not occurred.
How a fund did yesterday is no guarantee of how it will do tomorrow.
Average Annual Total Returns
| For the periods ended October 31, 2015 | Past 1 year | Past 5 years | Past 10 years |
| Class I | (10.83)% | (1.71)% | 5.46% |
$10,000 Over 10 Years
Let's say hypothetically that $10,000 was invested in Fidelity Advisor® Emerging Markets Fund - Class I on October 31, 2005.
The chart shows how the value of your investment would have changed, and also shows how the MSCI Emerging Markets Index performed over the same period.
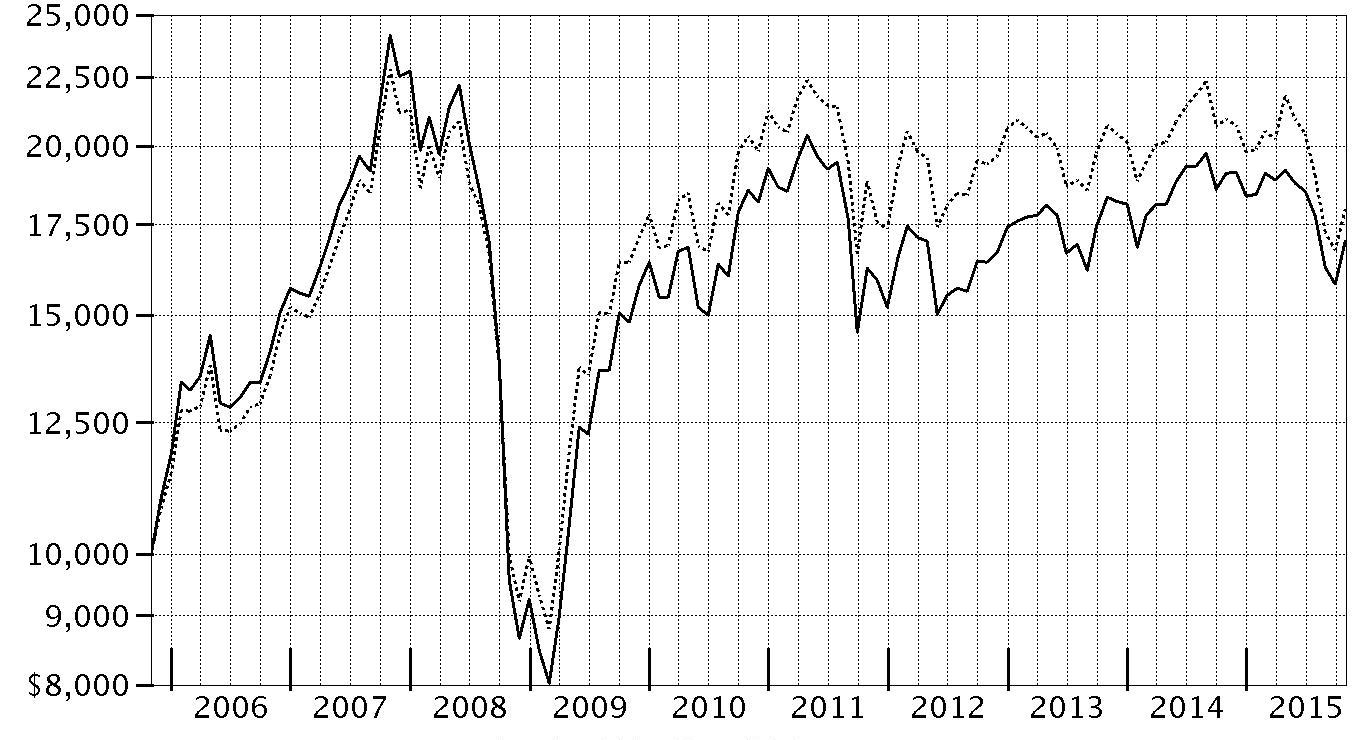
| Period Ending Values |
| $17,020 | Fidelity Advisor® Emerging Markets Fund - Class I |
| $17,967 | MSCI Emerging Markets Index |
Management's Discussion of Fund Performance
Market Recap: International equities suffered a moderate setback for the 12 months ending October 31, 2015, held back by a collapse in commodities prices that hurt resources-related sectors and geographies. The MSCI ACWI (All Country World Index) ex USA Index returned -4.55% for the period, affected also by concerns about global economic growth. Commodity producers remained under pressure for much of the past year, largely related to economic deceleration in China (-1%), the world’s second-largest economy and a leading consumer of raw materials. This effect was exacerbated by U.S. dollar strength relative to global currencies, which weighed on commodities priced in dollars and acutely impacted equity returns within regions most exposed to resources prices. The emerging-markets group, for example, returned about -15% this period. Canada, a significant energy producer, returned roughly -17%. Net energy consumer Japan (+9%) was the best-performing region by far. Only about a quarter of the nearly 50 index countries managed a gain this period: Ireland (+19%) – the EU’s fastest-growing economy – and Israel (+17%) proved top performers; Greece (-56%) and Brazil (-46%), among the worst. As for sectors, energy (-25%) and materials (-16%) declined sharply, whereas the two consumer sectors each gained about 6%.
Comments from Portfolio Manager Sammy Simnegar: For the year, the fund’s share classes (excluding sales charges, if applicable) recorded low-double-digit declines, handily topping the -14.22% return of the benchmark MSCI Emerging Markets Index. Versus the benchmark, sector and industry positioning – especially a sizable underweighting in energy – drove the fund, with stock selection also adding value. Geographically, non-benchmark exposure to the U.S. helped, as did positioning in India and picks in Mexico. The fund’s top relative contributor was Brazil-based oil producer Petroleo Brasileiro. This weak-performing index name helped our relative results because the fund didn’t own it, as did Brazilian metals miner Vale, also an index stock. Two other contributors – both out-of-benchmark positions established during the period – were health care holdings China Biologic Products and Jiangsu Hengrui Medicine. Conversely, stock selection in consumer discretionary detracted most. Underweighting China was a negative, along with stock picking in Russia. The fund’s first- and fourth-biggest relative detractors were China Life Insurance and Ping An Insurance Group. In both cases, the fund didn’t own the stock early on, but we built positions later. Overweighting Brazil-based Kroton Educacional, the world’s largest for-profit operator of colleges, also hurt.
The views expressed above reflect those of the portfolio manager(s) only through the end of the period as stated on the cover of this report and do not necessarily represent the views of Fidelity or any other person in the Fidelity organization. Any such views are subject to change at any time based upon market or other conditions and Fidelity disclaims any responsibility to update such views. These views may not be relied on as investment advice and, because investment decisions for a Fidelity fund are based on numerous factors, may not be relied on as an indication of trading intent on behalf of any Fidelity fund.
Investment Summary (Unaudited)
Top Five Stocks as of October 31, 2015
| | % of fund's net assets | % of fund's net assets 6 months ago |
| Samsung Electronics Co. Ltd. (Korea (South), Technology Hardware, Storage & Peripherals) | 4.5 | 4.4 |
| Taiwan Semiconductor Manufacturing Co. Ltd. (Taiwan, Semiconductors & Semiconductor Equipment) | 3.4 | 3.4 |
| Tencent Holdings Ltd. (Cayman Islands, Internet Software & Services) | 3.3 | 3.1 |
| Naspers Ltd. Class N (South Africa, Media) | 2.2 | 2.0 |
| Ping An Insurance (Group) Co. of China Ltd. (H Shares) (China, Insurance) | 1.4 | 0.0 |
| | 14.8 | |
Top Five Market Sectors as of October 31, 2015
| | % of fund's net assets | % of fund's net assets 6 months ago |
| Information Technology | 23.4 | 22.2 |
| Financials | 19.8 | 23.6 |
| Consumer Discretionary | 18.3 | 16.5 |
| Industrials | 11.2 | 11.3 |
| Consumer Staples | 8.8 | 7.5 |
Top Five Countries as of October 31, 2015
| (excluding cash equivalents) | % of fund's net assets | % of fund's net assets 6 months ago |
| India | 10.6 | 9.9 |
| Korea (South) | 8.7 | 5.7 |
| United States of America | 8.4 | 6.6 |
| China | 8.0 | 7.1 |
| Cayman Islands | 7.7 | 6.9 |
Asset Allocation (% of fund's net assets)
| As of October 31, 2015 |
| | Stocks | 99.9% |
| | Short-Term Investments and Net Other Assets (Liabilities) | 0.1% |

| As of April 30, 2015 |
| | Stocks | 99.2% |
| | Short-Term Investments and Net Other Assets (Liabilities) | 0.8% |

Percentages shown as 0.0% may reflect amounts less than 0.05%.
Investments October 31, 2015
Showing Percentage of Net Assets
| Common Stocks - 98.8% | | | |
| | | Shares | Value |
| Australia - 0.9% | | | |
| Amcor Ltd. | | 180,393 | $1,742,382 |
| Sydney Airport unit | | 450,846 | 2,060,415 |
|
| TOTAL AUSTRALIA | | | 3,802,797 |
|
| Bailiwick of Jersey - 0.4% | | | |
| Integrated Diagnostics Holdings PLC (a) | | 332,800 | 1,833,728 |
| Bermuda - 2.2% | | | |
| China Gas Holdings Ltd. | | 1,409,000 | 2,242,448 |
| China Resource Gas Group Ltd. | | 712,000 | 1,953,048 |
| Credicorp Ltd. (United States) | | 25,014 | 2,831,085 |
| PAX Global Technology Ltd. | | 1,745,000 | 2,281,869 |
|
| TOTAL BERMUDA | | | 9,308,450 |
|
| Brazil - 5.3% | | | |
| BB Seguridade Participacoes SA | | 368,200 | 2,539,607 |
| Brasil Foods SA | | 210,100 | 3,274,173 |
| Cetip SA - Mercados Organizado | | 231,000 | 2,042,525 |
| Cielo SA | | 292,472 | 2,776,419 |
| FPC Par Corretora de Seguros | | 178,400 | 499,134 |
| Kroton Educacional SA | | 1,015,900 | 2,597,341 |
| Qualicorp SA | | 563,800 | 2,368,324 |
| Smiles SA | | 229,300 | 1,789,664 |
| Ultrapar Participacoes SA | | 146,300 | 2,541,676 |
| Weg SA | | 525,830 | 1,963,400 |
|
| TOTAL BRAZIL | | | 22,392,263 |
|
| British Virgin Islands - 0.5% | | | |
| Mail.Ru Group Ltd. GDR (Reg. S) (a) | | 105,900 | 2,065,050 |
| Cayman Islands - 7.7% | | | |
| Alibaba Group Holding Ltd. sponsored ADR (a) | | 32,700 | 2,741,241 |
| ENN Energy Holdings Ltd. | | 432,000 | 2,474,774 |
| Fu Shou Yuan International Group Ltd. | | 2,700,000 | 1,840,953 |
| Hengan International Group Co. Ltd. | | 276,500 | 2,985,766 |
| Shenzhou International Group Holdings Ltd. | | 451,000 | 2,222,515 |
| Sino Biopharmaceutical Ltd. | | 1,840,000 | 2,286,569 |
| TAL Education Group ADR (a) | | 57,400 | 2,207,030 |
| Tencent Holdings Ltd. | | 730,100 | 13,761,931 |
| Vipshop Holdings Ltd. ADR (a)(b) | | 104,000 | 2,134,080 |
|
| TOTAL CAYMAN ISLANDS | | | 32,654,859 |
|
| China - 8.0% | | | |
| Beijing Capital International Airport Co. Ltd. (H Shares) | | 2,142,000 | 2,292,688 |
| China Life Insurance Co. Ltd. (H Shares) | | 686,000 | 2,473,774 |
| China Pacific Insurance (Group) Co. Ltd. (H Shares) | | 907,800 | 3,616,127 |
| Fuyao Glass Industries Group Co. Ltd. (a) | | 837,600 | 1,790,638 |
| Inner Mongoli Yili Industries Co. Ltd. | | 798,200 | 2,007,778 |
| Jiangsu Hengrui Medicine Co. Ltd. | | 276,860 | 2,297,100 |
| Kweichow Moutai Co. Ltd. | | 68,010 | 2,296,275 |
| PICC Property & Casualty Co. Ltd. (H Shares) | | 1,319,825 | 2,994,776 |
| Ping An Insurance (Group) Co. of China Ltd. (H Shares) | | 1,039,000 | 5,832,167 |
| Shanghai International Airport Co. Ltd. | | 475,700 | 2,269,275 |
| Weifu High-Technology Co. Ltd. (B Shares) | | 609,955 | 1,555,130 |
| Zhengzhou Yutong Bus Co. Ltd. | | 634,507 | 2,185,433 |
| Zhuzhou CSR Times Electric Co. Ltd. (H Shares) | | 351,000 | 2,272,179 |
|
| TOTAL CHINA | | | 33,883,340 |
|
| Denmark - 0.5% | | | |
| Novo Nordisk A/S Series B sponsored ADR | | 36,600 | 1,946,388 |
| Egypt - 0.6% | | | |
| Commercial International Bank SAE sponsored GDR | | 407,300 | 2,382,705 |
| France - 0.9% | | | |
| LVMH Moet Hennessy - Louis Vuitton SA | | 10,684 | 1,989,034 |
| Safran SA | | 24,900 | 1,891,256 |
|
| TOTAL FRANCE | | | 3,880,290 |
|
| Germany - 1.0% | | | |
| Bayer AG | | 14,200 | 1,894,884 |
| Wirecard AG | | 41,000 | 2,119,251 |
|
| TOTAL GERMANY | | | 4,014,135 |
|
| Hong Kong - 2.0% | | | |
| AIA Group Ltd. | | 353,000 | 2,069,756 |
| CSPC Pharmaceutical Group Ltd. | | 2,356,000 | 2,193,545 |
| Guangdong Investment Ltd. | | 1,548,000 | 2,177,047 |
| Techtronic Industries Co. Ltd. | | 553,500 | 2,023,417 |
|
| TOTAL HONG KONG | | | 8,463,765 |
|
| India - 10.6% | | | |
| Adani Ports & Special Economic Zone (a) | | 486,623 | 2,197,146 |
| Amara Raja Batteries Ltd. (a) | | 133,250 | 1,837,035 |
| Asian Paints India Ltd. | | 181,441 | 2,299,413 |
| Axis Bank Ltd. (a) | | 244,595 | 1,771,476 |
| Bharti Infratel Ltd. (a) | | 363,529 | 2,159,115 |
| Colgate-Palmolive (India) | | 121,884 | 1,776,806 |
| Exide Industries Ltd. (a) | | 757,787 | 1,728,758 |
| HCL Technologies Ltd. | | 229,234 | 3,051,158 |
| HDFC Bank Ltd. (a) | | 117,154 | 2,349,719 |
| Housing Development Finance Corp. Ltd. | | 284,796 | 5,455,293 |
| IndusInd Bank Ltd. | | 132,634 | 1,845,416 |
| LIC Housing Finance Ltd. (a) | | 281,237 | 2,053,453 |
| Lupin Ltd. | | 86,558 | 2,548,561 |
| Maruti Suzuki India Ltd. (a) | | 28,011 | 1,905,124 |
| Sun Pharmaceutical Industries Ltd. | | 259,412 | 3,525,178 |
| Tata Consultancy Services Ltd. | | 110,026 | 4,191,986 |
| Titan Co. Ltd. (a) | | 373,375 | 2,025,545 |
| Zee Entertainment Enterprises Ltd. | | 337,629 | 2,104,113 |
|
| TOTAL INDIA | | | 44,825,295 |
|
| Indonesia - 4.0% | | | |
| PT ACE Hardware Indonesia Tbk | | 44,531,500 | 2,167,869 |
| PT Bank Central Asia Tbk | | 3,645,200 | 3,424,400 |
| PT Bank Rakyat Indonesia Tbk | | 4,165,600 | 3,188,167 |
| PT Matahari Department Store Tbk | | 1,850,000 | 2,227,377 |
| PT Media Nusantara Citra Tbk | | 14,633,500 | 1,898,715 |
| PT Surya Citra Media Tbk | | 9,453,700 | 2,010,366 |
| PT Tower Bersama Infrastructure Tbk (a) | | 4,087,900 | 2,129,018 |
|
| TOTAL INDONESIA | | | 17,045,912 |
|
| Isle of Man - 0.5% | | | |
| Playtech Ltd. | | 162,735 | 2,147,467 |
| Israel - 0.9% | | | |
| Check Point Software Technologies Ltd. (a) | | 23,200 | 1,970,608 |
| Teva Pharmaceutical Industries Ltd. sponsored ADR | | 31,000 | 1,834,890 |
|
| TOTAL ISRAEL | | | 3,805,498 |
|
| Kenya - 0.5% | | | |
| Safaricom Ltd. | | 13,596,400 | 1,911,890 |
| Korea (South) - 8.7% | | | |
| AMOREPACIFIC Corp. | | 10,132 | 3,349,913 |
| Coway Co. Ltd. | | 29,003 | 2,164,232 |
| KEPCO Plant Service & Engineering Co. Ltd. | | 22,189 | 2,021,122 |
| LG Chemical Ltd. | | 12,994 | 3,465,385 |
| LG Household & Health Care Ltd. | | 3,672 | 3,045,608 |
| NAVER Corp. | | 6,870 | 3,610,184 |
| Samsung Electronics Co. Ltd. | | 15,916 | 19,125,355 |
|
| TOTAL KOREA (SOUTH) | | | 36,781,799 |
|
| Luxembourg - 0.9% | | | |
| Eurofins Scientific SA | | 5,800 | 2,099,947 |
| Samsonite International SA | | 642,100 | 1,896,274 |
|
| TOTAL LUXEMBOURG | | | 3,996,221 |
|
| Mexico - 6.8% | | | |
| Banregio Grupo Financiero S.A.B. de CV | | 307,766 | 1,660,332 |
| Fomento Economico Mexicano S.A.B. de CV unit | | 431,100 | 4,258,593 |
| Gruma S.A.B. de CV Series B | | 150,900 | 2,328,664 |
| Grupo Aeroportuario del Pacifico SA de CV Series B | | 244,221 | 2,199,612 |
| Grupo Aeroportuario del Sureste SA de CV Series B | | 148,550 | 2,300,673 |
| Grupo Aeroportuario Norte S.A.B. de CV | | 377,500 | 1,941,687 |
| Grupo Financiero Banorte S.A.B. de CV Series O | | 677,500 | 3,648,405 |
| Grupo GICSA SA de CV (a) | | 1,898,500 | 1,850,479 |
| Infraestructura Energetica Nova S.A.B. de CV | | 385,800 | 1,860,355 |
| Megacable Holdings S.A.B. de CV unit | | 541,984 | 2,065,523 |
| Promotora y Operadora de Infraestructura S.A.B. de CV (a) | | 191,800 | 2,404,902 |
| Tenedora Nemak SA de CV (a) | | 1,564,200 | 2,262,331 |
|
| TOTAL MEXICO | | | 28,781,556 |
|
| Netherlands - 0.5% | | | |
| Hangzhou Hikvision Digital Technology Co. Ltd. ELS (BNP Paribas Arbitrage Warrant Program) warrants 10/21/16(a) | | 350,500 | 1,909,216 |
| Philippines - 4.1% | | | |
| Ayala Corp. | | 133,440 | 2,222,302 |
| GT Capital Holdings, Inc. | | 72,535 | 2,035,503 |
| International Container Terminal Services, Inc. | | 1,233,590 | 2,174,900 |
| Jollibee Food Corp. | | 469,280 | 2,062,535 |
| Robinsons Land Corp. | | 3,094,300 | 2,022,753 |
| SM Investments Corp. | | 117,296 | 2,189,814 |
| SM Prime Holdings, Inc. | | 4,996,100 | 2,300,459 |
| Universal Robina Corp. | | 527,740 | 2,261,339 |
|
| TOTAL PHILIPPINES | | | 17,269,605 |
|
| Russia - 0.8% | | | |
| Magnit OJSC (a) | | 18,189 | 3,172,942 |
| South Africa - 7.4% | | | |
| Aspen Pharmacare Holdings Ltd. | | 119,593 | 2,685,938 |
| Bidvest Group Ltd. | | 107,615 | 2,752,779 |
| Discovery Ltd. | | 219,462 | 2,347,018 |
| FirstRand Ltd. | | 906,400 | 3,326,545 |
| Mr Price Group Ltd. | | 149,200 | 2,290,989 |
| Naspers Ltd. Class N | | 62,500 | 9,154,383 |
| Sanlam Ltd. | | 634,300 | 2,865,595 |
| Steinhoff International Holdings Ltd. | | 548,400 | 3,356,815 |
| Woolworths Holdings Ltd. | | 353,500 | 2,618,746 |
|
| TOTAL SOUTH AFRICA | | | 31,398,808 |
|
| Spain - 0.5% | | | |
| Amadeus IT Holding SA Class A | | 46,600 | 1,986,205 |
| Switzerland - 0.9% | | | |
| Compagnie Financiere Richemont SA Series A | | 23,737 | 2,035,390 |
| Sika AG (Bearer) | | 500 | 1,640,953 |
|
| TOTAL SWITZERLAND | | | 3,676,343 |
|
| Taiwan - 6.8% | | | |
| Advantech Co. Ltd. | | 291,000 | 2,092,977 |
| Catcher Technology Co. Ltd. | | 260,000 | 2,562,760 |
| ECLAT Textile Co. Ltd. | | 147,000 | 2,168,890 |
| Giant Manufacturing Co. Ltd. | | 263,000 | 1,988,803 |
| Largan Precision Co. Ltd. | | 41,000 | 3,201,448 |
| Merida Industry Co. Ltd. | | 351,650 | 2,063,432 |
| Taiwan Semiconductor Manufacturing Co. Ltd. | | 3,424,000 | 14,426,936 |
|
| TOTAL TAIWAN | | | 28,505,246 |
|
| Thailand - 1.5% | | | |
| Airports of Thailand PCL (For. Reg.) | | 294,900 | 2,465,082 |
| Bangkok Dusit Medical Services PCL (For. Reg.) | | 3,609,300 | 1,924,502 |
| Thai Beverage PCL | | 3,765,700 | 1,810,807 |
|
| TOTAL THAILAND | | | 6,200,391 |
|
| Turkey - 2.1% | | | |
| Koc Holding A/S | | 525,000 | 2,371,099 |
| TAV Havalimanlari Holding A/S | | 280,000 | 2,199,355 |
| Tofas Turk Otomobil Fabrikasi A/S | | 286,544 | 1,892,012 |
| Tupras Turkiye Petrol Rafinelleri A/S (a) | | 84,000 | 2,218,563 |
|
| TOTAL TURKEY | | | 8,681,029 |
|
| United Arab Emirates - 1.0% | | | |
| DP World Ltd. | | 112,015 | 2,263,823 |
| First Gulf Bank PJSC | | 596,553 | 2,005,834 |
|
| TOTAL UNITED ARAB EMIRATES | | | 4,269,657 |
|
| United Kingdom - 1.9% | | | |
| Al Noor Hospitals Group PLC | | 9,684 | 175,563 |
| InterContinental Hotel Group PLC | | 49,000 | 1,958,013 |
| Mondi PLC | | 103,900 | 2,408,990 |
| NMC Health PLC | | 135,000 | 1,585,844 |
| Prudential PLC | | 85,639 | 2,000,227 |
|
| TOTAL UNITED KINGDOM | | | 8,128,637 |
|
| United States of America - 8.4% | | | |
| A.O. Smith Corp. | | 28,300 | 2,174,006 |
| Alphabet, Inc. Class C | | 3,260 | 2,317,241 |
| Apple, Inc. | | 18,300 | 2,186,850 |
| China Biologic Products, Inc. (a) | | 21,400 | 2,438,316 |
| Cognizant Technology Solutions Corp. Class A (a) | | 29,100 | 1,982,001 |
| Ecolab, Inc. | | 16,670 | 2,006,235 |
| Facebook, Inc. Class A (a) | | 17,500 | 1,784,475 |
| International Flavors & Fragrances, Inc. | | 17,000 | 1,973,020 |
| MasterCard, Inc. Class A | | 20,200 | 1,999,598 |
| McGraw Hill Financial, Inc. | | 22,000 | 2,038,080 |
| MercadoLibre, Inc. (b) | | 20,500 | 2,016,585 |
| Mettler-Toledo International, Inc. (a) | | 6,800 | 2,114,732 |
| Moody's Corp. | | 21,000 | 2,019,360 |
| NIKE, Inc. Class B | | 14,200 | 1,860,626 |
| PPG Industries, Inc. | | 20,100 | 2,095,626 |
| Sherwin-Williams Co. | | 8,400 | 2,241,372 |
| Visa, Inc. Class A | | 26,300 | 2,040,354 |
|
| TOTAL UNITED STATES OF AMERICA | | | 35,288,477 |
|
| TOTAL COMMON STOCKS | | | |
| (Cost $402,424,098) | | | 416,409,964 |
|
| Nonconvertible Preferred Stocks - 1.1% | | | |
| Brazil - 1.1% | | | |
| Ambev SA sponsored ADR | | | |
| (Cost $7,259,887) | | 896,480 | 4,365,858 |
|
| Money Market Funds - 1.4% | | | |
| Fidelity Cash Central Fund, 0.18% (c) | | 1,852,843 | 1,852,843 |
| Fidelity Securities Lending Cash Central Fund, 0.19% (c)(d) | | 4,184,150 | 4,184,150 |
| TOTAL MONEY MARKET FUNDS | | | |
| (Cost $6,036,993) | | | 6,036,993 |
| TOTAL INVESTMENT PORTFOLIO - 101.3% | | | |
| (Cost $415,720,978) | | | 426,812,815 |
| NET OTHER ASSETS (LIABILITIES) - (1.3)% | | | (5,282,032) |
| NET ASSETS - 100% | | | $421,530,783 |
Security Type Abbreviations
ELS – Equity-Linked Security
Categorizations in the Schedule of Investments are based on country or territory of incorporation.
Legend
(a) Non-income producing
(b) Security or a portion of the security is on loan at period end.
(c) Affiliated fund that is generally available only to investment companies and other accounts managed by Fidelity Investments. The rate quoted is the annualized seven-day yield of the fund at period end. A complete unaudited listing of the fund's holdings as of its most recent quarter end is available upon request. In addition, each Fidelity Central Fund's financial statements , which are not covered by the Fund's Report of Independent Registered Public Accounting Firm, are available on the SEC's website or upon request.
(d) Investment made with cash collateral received from securities on loan.
Affiliated Central Funds
Information regarding fiscal year to date income earned by the Fund from investments in Fidelity Central Funds is as follows:
| Fund | Income earned |
| Fidelity Cash Central Fund | $7,486 |
| Fidelity Securities Lending Cash Central Fund | 62,534 |
| Total | $70,020 |
Investment Valuation
The following is a summary of the inputs used, as of October 31, 2015, involving the Fund's assets and liabilities carried at fair value. The inputs or methodology used for valuing securities may not be an indication of the risk associated with investing in those securities. For more information on valuation inputs, and their aggregation into the levels used below, please refer to the Investment Valuation section in the accompanying Notes to Financial Statements.
| | Valuation Inputs at Reporting Date: |
| Description | Total | Level 1 | Level 2 | Level 3 |
| Investments in Securities: | | | | |
| Equities: | | | | |
| Consumer Discretionary | $78,056,663 | $42,614,897 | $35,441,766 | $-- |
| Consumer Staples | 36,934,522 | 23,795,751 | 13,138,771 | -- |
| Energy | 4,760,239 | 4,760,239 | -- | -- |
| Financials | 81,621,688 | 29,191,109 | 52,430,579 | -- |
| Health Care | 35,754,009 | 20,978,554 | 14,775,455 | -- |
| Industrials | 48,427,681 | 22,221,359 | 26,206,322 | -- |
| Information Technology | 98,439,949 | 60,726,069 | 37,713,880 | -- |
| Materials | 19,873,376 | 15,831,581 | 4,041,795 | -- |
| Telecommunication Services | 6,200,023 | 1,911,890 | 4,288,133 | -- |
| Utilities | 10,707,672 | 1,860,355 | 8,847,317 | -- |
| Money Market Funds | 6,036,993 | 6,036,993 | -- | -- |
| Total Investments in Securities: | $426,812,815 | $229,928,797 | $196,884,018 | $-- |
The following is a summary of transfers between Level 1 and Level 2 for the period ended October 31, 2015. Transfers are assumed to have occurred at the beginning of the period, and are primarily attributable to the valuation techniques used for foreign equity securities, as discussed in the accompanying Notes to Financial Statements:
| Transfers | Total |
| Level 1 to Level 2 | $9,426,806 |
| Level 2 to Level 1 | $4,142,908 |
See accompanying notes which are an integral part of the financial statements.
Financial Statements
Statement of Assets and Liabilities
| | | October 31, 2015 |
| Assets | | |
Investment in securities, at value (including securities loaned of $4,156,038) — See accompanying schedule:
Unaffiliated issuers (cost $409,683,985) | $420,775,822 | |
| Fidelity Central Funds (cost $6,036,993) | 6,036,993 | |
| Total Investments (cost $415,720,978) | | $426,812,815 |
| Foreign currency held at value (cost $1,833,612) | | 1,835,136 |
| Receivable for investments sold | | 4,069,475 |
| Receivable for fund shares sold | | 212,639 |
| Dividends receivable | | 316,628 |
| Distributions receivable from Fidelity Central Funds | | 1,245 |
| Prepaid expenses | | 1,189 |
| Other receivables | | 68,322 |
| Total assets | | 433,317,449 |
| Liabilities | | |
| Payable to custodian bank | $36,823 | |
| Payable for investments purchased | 6,403,961 | |
| Payable for fund shares redeemed | 385,700 | |
| Accrued management fee | 279,207 | |
| Distribution and service plan fees payable | 82,914 | |
| Other affiliated payables | 99,023 | |
| Other payables and accrued expenses | 314,888 | |
| Collateral on securities loaned, at value | 4,184,150 | |
| Total liabilities | | 11,786,666 |
| Net Assets | | $421,530,783 |
| Net Assets consist of: | | |
| Paid in capital | | $471,344,430 |
| Undistributed net investment income | | 362,723 |
| Accumulated undistributed net realized gain (loss) on investments and foreign currency transactions | | (61,112,393) |
| Net unrealized appreciation (depreciation) on investments and assets and liabilities in foreign currencies | | 10,936,023 |
| Net Assets | | $421,530,783 |
| Calculation of Maximum Offering Price | | |
| Class A: | | |
| Net Asset Value and redemption price per share ($112,931,186 ÷ 5,447,364 shares) | | $20.73 |
| Maximum offering price per share (100/94.25 of $20.73) | | $21.99 |
| Class T: | | |
| Net Asset Value and redemption price per share ($43,364,934 ÷ 2,099,591 shares) | | $20.65 |
| Maximum offering price per share (100/96.50 of $20.65) | | $21.40 |
| Class B: | | |
| Net Asset Value and offering price per share ($3,255,132 ÷ 162,201 shares)(a) | | $20.07 |
| Class C: | | |
| Net Asset Value and offering price per share ($46,595,439 ÷ 2,327,093 shares)(a) | | $20.02 |
| Class I: | | |
| Net Asset Value, offering price and redemption price per share ($209,270,492 ÷ 10,045,868 shares) | | $20.83 |
| Class Z: | | |
| Net Asset Value, offering price and redemption price per share ($6,113,600 ÷ 293,490 shares) | | $20.83 |
(a) Redemption price per share is equal to net asset value less any applicable contingent deferred sales charge.
See accompanying notes which are an integral part of the financial statements.
Statement of Operations
| | | Year ended October 31, 2015 |
| Investment Income | | |
| Dividends | | $8,704,210 |
| Income from Fidelity Central Funds | | 70,020 |
| Income before foreign taxes withheld | | 8,774,230 |
| Less foreign taxes withheld | | (810,613) |
| Total income | | 7,963,617 |
| Expenses | | |
| Management fee | $3,566,825 | |
| Transfer agent fees | 1,124,739 | |
| Distribution and service plan fees | 1,175,651 | |
| Accounting and security lending fees | 232,505 | |
| Custodian fees and expenses | 353,863 | |
| Independent trustees' compensation | 1,909 | |
| Registration fees | 88,022 | |
| Audit | 85,683 | |
| Legal | 1,155 | |
| Interest | 205 | |
| Miscellaneous | 3,088 | |
| Total expenses before reductions | 6,633,645 | |
| Expense reductions | (71,051) | 6,562,594 |
| Net investment income (loss) | | 1,401,023 |
| Realized and Unrealized Gain (Loss) | | |
| Net realized gain (loss) on: | | |
| Investment securities: | | |
| Unaffiliated issuers (net of foreign taxes of $386,530) | (12,124,773) | |
| Foreign currency transactions | (297,899) | |
| Total net realized gain (loss) | | (12,422,672) |
Change in net unrealized appreciation (depreciation) on:
Investment securities (net of decrease in deferred foreign taxes of $441,453) | (41,632,461) | |
| Assets and liabilities in foreign currencies | (11,315) | |
| Total change in net unrealized appreciation (depreciation) | | (41,643,776) |
| Net gain (loss) | | (54,066,448) |
| Net increase (decrease) in net assets resulting from operations | | $(52,665,425) |
See accompanying notes which are an integral part of the financial statements.
Statement of Changes in Net Assets
| | Year ended October 31, 2015 | Year ended October 31, 2014 |
| Increase (Decrease) in Net Assets | | |
| Operations | | |
| Net investment income (loss) | $1,401,023 | $1,047,326 |
| Net realized gain (loss) | (12,422,672) | 3,497,507 |
| Change in net unrealized appreciation (depreciation) | (41,643,776) | 9,190,714 |
| Net increase (decrease) in net assets resulting from operations | (52,665,425) | 13,735,547 |
| Distributions to shareholders from net investment income | (1,046,601) | (1,113,231) |
| Distributions to shareholders from net realized gain | (487,287) | (185,956) |
| Total distributions | (1,533,888) | (1,299,187) |
| Share transactions - net increase (decrease) | 3,501,123 | 32,907,367 |
| Redemption fees | 73,251 | 31,634 |
| Total increase (decrease) in net assets | (50,624,939) | 45,375,361 |
| Net Assets | | |
| Beginning of period | 472,155,722 | 426,780,361 |
| End of period (including undistributed net investment income of $362,723 and undistributed net investment income of $1,039,628, respectively) | $421,530,783 | $472,155,722 |
See accompanying notes which are an integral part of the financial statements.
Financial Highlights — Fidelity Advisor Emerging Markets Fund Class A
| | | October 31, | | | |
| Years ended October 31, | 2015 | 2014 | 2013 | 2012 | 2011 |
| Selected Per–Share Data | | | | | |
| Net asset value, beginning of period | $23.38 | $22.62 | $20.51 | $20.50 | $23.71 |
| Income from Investment Operations | | | | | |
| Net investment income (loss)A | .06 | .06 | .08 | .22 | .21 |
| Net realized and unrealized gain (loss) | (2.66) | .76 | 2.23 | (.06) | (3.19) |
| Total from investment operations | (2.60) | .82 | 2.31 | .16 | (2.98) |
| Distributions from net investment income | (.02) | (.05) | (.20) | (.15) | (.11) |
| Distributions from net realized gain | (.03) | (.01) | – | – | (.13) |
| Total distributions | (.05) | (.06) | (.20) | (.15) | (.24) |
| Redemption fees added to paid in capitalA | –B | –B | –B | –B | .01 |
| Net asset value, end of period | $20.73 | $23.38 | $22.62 | $20.51 | $20.50 |
| Total ReturnC,D | (11.13)% | 3.65% | 11.34% | .80% | (12.69)% |
| Ratios to Average Net AssetsE,F | | | | | |
| Expenses before reductions | 1.52% | 1.52% | 1.56% | 1.54% | 1.54% |
| Expenses net of fee waivers, if any | 1.52% | 1.52% | 1.55% | 1.54% | 1.54% |
| Expenses net of all reductions | 1.50% | 1.52% | 1.50% | 1.48% | 1.47% |
| Net investment income (loss) | .28% | .26% | .38% | 1.07% | .92% |
| Supplemental Data | | | | | |
| Net assets, end of period (000 omitted) | $112,931 | $141,601 | $146,378 | $160,464 | $202,477 |
| Portfolio turnover rateG | 110% | 97% | 121% | 177% | 122% |
A Calculated based on average shares outstanding during the period.
B Amount represents less than $.005 per share.
C Total returns would have been lower if certain expenses had not been reduced during the applicable periods shown.
D Total returns do not include the effect of the sales charges.
E Fees and expenses of any underlying Fidelity Central Funds are not included in the Fund's expense ratio. The Fund indirectly bears its proportionate share of the expenses of any underlying Fidelity Central Funds.
F Expense ratios reflect operating expenses of the class. Expenses before reductions do not reflect amounts reimbursed by the investment adviser or reductions from brokerage service arrangements or reductions from other expense offset arrangements and do not represent the amount paid by the class during periods when reimbursements or reductions occur. Expenses net of fee waivers reflect expenses after reimbursement by the investment adviser but prior to reductions from brokerage service arrangements or other expense offset arrangements. Expenses net of all reductions represent the net expenses paid by the class.
G Amount does not include the portfolio activity of any underlying Fidelity Central Funds.
See accompanying notes which are an integral part of the financial statements.
Financial Highlights — Fidelity Advisor Emerging Markets Fund Class T
| | | October 31, | | | |
| Years ended October 31, | 2015 | 2014 | 2013 | 2012 | 2011 |
| Selected Per–Share Data | | | | | |
| Net asset value, beginning of period | $23.30 | $22.55 | $20.44 | $20.43 | $23.61 |
| Income from Investment Operations | | | | | |
| Net investment income (loss)A | .01 | –B | .03 | .16 | .15 |
| Net realized and unrealized gain (loss) | (2.66) | .76 | 2.22 | (.06) | (3.18) |
| Total from investment operations | (2.65) | .76 | 2.25 | .10 | (3.03) |
| Distributions from net investment income | – | –B | (.14) | (.09) | (.04) |
| Distributions from net realized gain | – | (.01) | – | – | (.13) |
| Total distributions | – | (.01) | (.14) | (.09) | (.16)C |
| Redemption fees added to paid in capitalA | –B | –B | –B | –B | .01 |
| Net asset value, end of period | $20.65 | $23.30 | $22.55 | $20.44 | $20.43 |
| Total ReturnD,E | (11.37)% | 3.39% | 11.06% | .49% | (12.89)% |
| Ratios to Average Net AssetsF,G | | | | | |
| Expenses before reductions | 1.78% | 1.78% | 1.81% | 1.80% | 1.79% |
| Expenses net of fee waivers, if any | 1.78% | 1.78% | 1.81% | 1.80% | 1.79% |
| Expenses net of all reductions | 1.76% | 1.78% | 1.76% | 1.73% | 1.73% |
| Net investment income (loss) | .02% | - %H | .13% | .81% | .66% |
| Supplemental Data | | | | | |
| Net assets, end of period (000 omitted) | $43,365 | $54,341 | $55,797 | $58,919 | $73,146 |
| Portfolio turnover rateI | 110% | 97% | 121% | 177% | 122% |
A Calculated based on average shares outstanding during the period.
B Amount represents less than $.005 per share.
C Total distributions of $.16 per share is comprised of distributions from net investment income of $.037 and distributions from net realized gain of $.125 per share.
D Total returns would have been lower if certain expenses had not been reduced during the applicable periods shown.
E Total returns do not include the effect of the sales charges.
F Fees and expenses of any underlying Fidelity Central Funds are not included in the Fund's expense ratio. The Fund indirectly bears its proportionate share of the expenses of any underlying Fidelity Central Funds.
G Expense ratios reflect operating expenses of the class. Expenses before reductions do not reflect amounts reimbursed by the investment adviser or reductions from brokerage service arrangements or reductions from other expense offset arrangements and do not represent the amount paid by the class during periods when reimbursements or reductions occur. Expenses net of fee waivers reflect expenses after reimbursement by the investment adviser but prior to reductions from brokerage service arrangements or other expense offset arrangements. Expenses net of all reductions represent the net expenses paid by the class.
H Amount represents less than .005%.
I Amount does not include the portfolio activity of any underlying Fidelity Central Funds.
See accompanying notes which are an integral part of the financial statements.
Financial Highlights — Fidelity Advisor Emerging Markets Fund Class B
| | | October 31, | | | |
| Years ended October 31, | 2015 | 2014 | 2013 | 2012 | 2011 |
| Selected Per–Share Data | | | | | |
| Net asset value, beginning of period | $22.75 | $22.11 | $20.03 | $20.03 | $23.14 |
| Income from Investment Operations | | | | | |
| Net investment income (loss)A | (.10) | (.11) | (.08) | .06 | .04 |
| Net realized and unrealized gain (loss) | (2.58) | .75 | 2.18 | (.06) | (3.13) |
| Total from investment operations | (2.68) | .64 | 2.10 | – | (3.09) |
| Distributions from net investment income | – | – | (.02) | – | (.01) |
| Distributions from net realized gain | – | – | – | – | (.03) |
| Total distributions | – | – | (.02) | – | (.03)B |
| Redemption fees added to paid in capitalA | –C | –C | –C | –C | .01 |
| Net asset value, end of period | $20.07 | $22.75 | $22.11 | $20.03 | $20.03 |
| Total ReturnD,E | (11.78)% | 2.89% | 10.50% | -% | (13.33)% |
| Ratios to Average Net AssetsF,G | | | | | |
| Expenses before reductions | 2.28% | 2.28% | 2.31% | 2.29% | 2.29% |
| Expenses net of fee waivers, if any | 2.28% | 2.28% | 2.31% | 2.29% | 2.29% |
| Expenses net of all reductions | 2.26% | 2.28% | 2.26% | 2.23% | 2.22% |
| Net investment income (loss) | (.48)% | (.49)% | (.37)% | .32% | .16% |
| Supplemental Data | | | | | |
| Net assets, end of period (000 omitted) | $3,255 | $7,546 | $11,391 | $15,994 | $21,304 |
| Portfolio turnover rateH | 110% | 97% | 121% | 177% | 122% |
A Calculated based on average shares outstanding during the period.
B Total distributions of $.03 per share is comprised of distributions from net investment income of $.005 and distributions from net realized gain of $.025 per share.
C Amount represents less than $.005 per share.
D Total returns would have been lower if certain expenses had not been reduced during the applicable periods shown.
E Total returns do not include the effect of the contingent deferred sales charge.
F Fees and expenses of any underlying Fidelity Central Funds are not included in the Fund's expense ratio. The Fund indirectly bears its proportionate share of the expenses of any underlying Fidelity Central Funds.
G Expense ratios reflect operating expenses of the class. Expenses before reductions do not reflect amounts reimbursed by the investment adviser or reductions from brokerage service arrangements or reductions from other expense offset arrangements and do not represent the amount paid by the class during periods when reimbursements or reductions occur. Expenses net of fee waivers reflect expenses after reimbursement by the investment adviser but prior to reductions from brokerage service arrangements or other expense offset arrangements. Expenses net of all reductions represent the net expenses paid by the class.
H Amount does not include the portfolio activity of any underlying Fidelity Central Funds.
See accompanying notes which are an integral part of the financial statements.
Financial Highlights — Fidelity Advisor Emerging Markets Fund Class C
| | | October 31, | | | |
| Years ended October 31, | 2015 | 2014 | 2013 | 2012 | 2011 |
| Selected Per–Share Data | | | | | |
| Net asset value, beginning of period | $22.70 | $22.06 | $20.00 | $20.00 | $23.13 |
| Income from Investment Operations | | | | | |
| Net investment income (loss)A | (.10) | (.11) | (.08) | .06 | .04 |
| Net realized and unrealized gain (loss) | (2.58) | .75 | 2.18 | (.06) | (3.12) |
| Total from investment operations | (2.68) | .64 | 2.10 | – | (3.08) |
| Distributions from net investment income | – | – | (.04) | – | (.01) |
| Distributions from net realized gain | – | – | – | – | (.05) |
| Total distributions | – | – | (.04) | – | (.06) |
| Redemption fees added to paid in capitalA | –B | –B | –B | –B | .01 |
| Net asset value, end of period | $20.02 | $22.70 | $22.06 | $20.00 | $20.00 |
| Total ReturnC,D | (11.81)% | 2.90% | 10.49% | -% | (13.33)% |
| Ratios to Average Net AssetsE,F | | | | | |
| Expenses before reductions | 2.27% | 2.27% | 2.31% | 2.29% | 2.28% |
| Expenses net of fee waivers, if any | 2.27% | 2.27% | 2.30% | 2.29% | 2.28% |
| Expenses net of all reductions | 2.26% | 2.27% | 2.25% | 2.23% | 2.22% |
| Net investment income (loss) | (.47)% | (.49)% | (.37)% | .32% | .17% |
| Supplemental Data | | | | | |
| Net assets, end of period (000 omitted) | $46,595 | $64,026 | $62,532 | $65,598 | $80,855 |
| Portfolio turnover rateG | 110% | 97% | 121% | 177% | 122% |
A Calculated based on average shares outstanding during the period.
B Amount represents less than $.005 per share.
C Total returns would have been lower if certain expenses had not been reduced during the applicable periods shown.
D Total returns do not include the effect of the contingent deferred sales charge.
E Fees and expenses of any underlying Fidelity Central Funds are not included in the Fund's expense ratio. The Fund indirectly bears its proportionate share of the expenses of any underlying Fidelity Central Funds.
F Expense ratios reflect operating expenses of the class. Expenses before reductions do not reflect amounts reimbursed by the investment adviser or reductions from brokerage service arrangements or reductions from other expense offset arrangements and do not represent the amount paid by the class during periods when reimbursements or reductions occur. Expenses net of fee waivers reflect expenses after reimbursement by the investment adviser but prior to reductions from brokerage service arrangements or other expense offset arrangements. Expenses net of all reductions represent the net expenses paid by the class.
G Amount does not include the portfolio activity of any underlying Fidelity Central Funds.
See accompanying notes which are an integral part of the financial statements.
Financial Highlights — Fidelity Advisor Emerging Markets Fund Class I
| | | October 31, | | | |
| Years ended October 31, | 2015 | 2014 | 2013 | 2012 | 2011 |
| Selected Per–Share Data | | | | | |
| Net asset value, beginning of period | $23.50 | $22.73 | $20.61 | $20.63 | $23.87 |
| Income from Investment Operations | | | | | |
| Net investment income (loss)A | .14 | .14 | .15 | .28 | .29 |
| Net realized and unrealized gain (loss) | (2.67) | .76 | 2.25 | (.06) | (3.21) |
| Total from investment operations | (2.53) | .90 | 2.40 | .22 | (2.92) |
| Distributions from net investment income | (.11) | (.12) | (.28) | (.24) | (.20) |
| Distributions from net realized gain | (.03) | (.01) | – | – | (.13) |
| Total distributions | (.14) | (.13) | (.28) | (.24) | (.33) |
| Redemption fees added to paid in capitalA | –B | –B | –B | –B | .01 |
| Net asset value, end of period | $20.83 | $23.50 | $22.73 | $20.61 | $20.63 |
| Total ReturnC | (10.83)% | 4.00% | 11.73% | 1.08% | (12.41)% |
| Ratios to Average Net AssetsD,E | | | | | |
| Expenses before reductions | 1.17% | 1.18% | 1.23% | 1.22% | 1.21% |
| Expenses net of fee waivers, if any | 1.17% | 1.18% | 1.22% | 1.22% | 1.21% |
| Expenses net of all reductions | 1.16% | 1.18% | 1.18% | 1.16% | 1.14% |
| Net investment income (loss) | .63% | .60% | .71% | 1.39% | 1.25% |
| Supplemental Data | | | | | |
| Net assets, end of period (000 omitted) | $209,270 | $199,098 | $150,576 | $145,782 | $138,312 |
| Portfolio turnover rateF | 110% | 97% | 121% | 177% | 122% |
A Calculated based on average shares outstanding during the period.
B Amount represents less than $.005 per share.
C Total returns would have been lower if certain expenses had not been reduced during the applicable periods shown.
D Fees and expenses of any underlying Fidelity Central Funds are not included in the Fund's expense ratio. The Fund indirectly bears its proportionate share of the expenses of any underlying Fidelity Central Funds.
E Expense ratios reflect operating expenses of the class. Expenses before reductions do not reflect amounts reimbursed by the investment adviser or reductions from brokerage service arrangements or reductions from other expense offset arrangements and do not represent the amount paid by the class during periods when reimbursements or reductions occur. Expenses net of fee waivers reflect expenses after reimbursement by the investment adviser but prior to reductions from brokerage service arrangements or other expense offset arrangements. Expenses net of all reductions represent the net expenses paid by the class.
F Amount does not include the portfolio activity of any underlying Fidelity Central Funds.
See accompanying notes which are an integral part of the financial statements.
Financial Highlights — Fidelity Advisor Emerging Markets Fund Class Z
| | | October 31, | |
| Years ended October 31, | 2015 | 2014 | 2013 A |
| Selected Per–Share Data | | | |
| Net asset value, beginning of period | $23.50 | $22.73 | $21.33 |
| Income from Investment Operations | | | |
| Net investment income (loss)B | .17 | .18 | .03 |
| Net realized and unrealized gain (loss) | (2.66) | .76 | 1.37 |
| Total from investment operations | (2.49) | .94 | 1.40 |
| Distributions from net investment income | (.14) | (.16) | – |
| Distributions from net realized gain | (.03) | (.01) | – |
| Total distributions | (.18)C | (.17) | – |
| Redemption fees added to paid in capitalB,D | – | – | – |
| Net asset value, end of period | $20.83 | $23.50 | $22.73 |
| Total ReturnE,F | (10.68)% | 4.19% | 6.56% |
| Ratios to Average Net AssetsG,H | | | |
| Expenses before reductions | 1.02% | 1.02% | 1.05%I |
| Expenses net of fee waivers, if any | 1.02% | 1.02% | 1.05%I |
| Expenses net of all reductions | 1.00% | 1.02% | 1.00%I |
| Net investment income (loss) | .78% | .77% | .62%I |
| Supplemental Data | | | |
| Net assets, end of period (000 omitted) | $6,114 | $5,544 | $107 |
| Portfolio turnover rateJ | 110% | 97% | 121% |
A For the period August 13, 2013 (commencement of sale of shares) to October 31, 2013.
B Calculated based on average shares outstanding during the period.
C Total distributions of $.18 per share is comprised of distributions from net investment income of $.143 and distributions from net realized gain of $.033 per share.
D Amount represents less than $.005 per share.
E Total returns for periods of less than one year are not annualized.
F Total returns would have been lower if certain expenses had not been reduced during the applicable periods shown.
G Fees and expenses of any underlying Fidelity Central Funds are not included in the Fund's expense ratio. The Fund indirectly bears its proportionate share of the expenses of any underlying Fidelity Central Funds.
H Expense ratios reflect operating expenses of the class. Expenses before reductions do not reflect amounts reimbursed by the investment adviser or reductions from brokerage service arrangements or reductions from other expense offset arrangements and do not represent the amount paid by the class during periods when reimbursements or reductions occur. Expense ratios before reductions for start-up periods may not be representative of longer-term operating periods. Expenses net of fee waivers reflect expenses after reimbursement by the investment adviser but prior to reductions from brokerage service arrangements or other expense offset arrangements. Expenses net of all reductions represent the net expenses paid by the class.
I Annualized
J Amount does not include the portfolio activity of any underlying Fidelity Central Funds.
See accompanying notes which are an integral part of the financial statements.
Notes to Financial Statements
For the period ended October 31, 2015
1. Organization.
Fidelity Advisor Emerging Markets Fund (the Fund) is a fund of Fidelity Advisor Series VIII (the Trust) and is authorized to issue an unlimited number of shares. The Trust is registered under the Investment Company Act of 1940, as amended (the 1940 Act), as an open-end management investment company organized as a Massachusetts business trust. The Fund offers Class A, Class T, Class C, Class I (formerly Institutional Class) and Class Z shares, each of which, along with Class B shares, has equal rights as to assets and voting privileges. Class B shares are closed to new accounts and additional purchases, except for exchanges and reinvestments. Each class has exclusive voting rights with respect to matters that affect that class. Class B shares will automatically convert to Class A shares after a holding period of seven years from the initial date of purchase. The Fund's investments in emerging markets can be subject to social, economic, regulatory, and political uncertainties and can be extremely volatile.
2. Investments in Fidelity Central Funds.
The Fund invests in Fidelity Central Funds, which are open-end investment companies generally available only to other investment companies and accounts managed by the investment adviser and its affiliates. The Fund's Schedule of Investments lists each of the Fidelity Central Funds held as of period end, if any, as an investment of the Fund, but does not include the underlying holdings of each Fidelity Central Fund. As an Investing Fund, the Fund indirectly bears its proportionate share of the expenses of the underlying Fidelity Central Funds.
The Money Market Central Funds seek preservation of capital and current income and are managed by Fidelity Investments Money Management, Inc. (FIMM), an affiliate of the investment adviser. Annualized expenses of the Money Market Central Funds as of their most recent shareholder report date are less than .005%.
A complete unaudited list of holdings for each Fidelity Central Fund is available upon request or at the Securities and Exchange Commission (the SEC) website at www.sec.gov. In addition, the financial statements of the Fidelity Central Funds, which are not covered by the Fund's Report of Independent Registered Public Accounting Firm, are available on the SEC website or upon request.
3. Significant Accounting Policies.
The financial statements have been prepared in conformity with accounting principles generally accepted in the United States of America (GAAP), which require management to make certain estimates and assumptions at the date of the financial statements. Actual results could differ from those estimates. Subsequent events, if any, through the date that the financial statements were issued have been evaluated in the preparation of the financial statements. The following summarizes the significant accounting policies of the Fund:
Investment Valuation. Investments are valued as of 4:00 p.m. Eastern time on the last calendar day of the period. The Board of Trustees (the Board) has delegated the day to day responsibility for the valuation of the Fund's investments to the Fidelity Management & Research Company (FMR) Fair Value Committee (the Committee). In accordance with valuation policies and procedures approved by the Board, the Fund attempts to obtain prices from one or more third party pricing vendors or brokers to value its investments. When current market prices, quotations or currency exchange rates are not readily available or reliable, investments will be fair valued in good faith by the Committee, in accordance with procedures adopted by the Board. Factors used in determining fair value vary by investment type and may include market or investment specific events. The frequency with which these procedures are used cannot be predicted and they may be utilized to a significant extent. The Committee oversees the Fund's valuation policies and procedures and reports to the Board on the Committee's activities and fair value determinations. The Board monitors the appropriateness of the procedures used in valuing the Fund's investments and ratifies the fair value determinations of the Committee.
The Fund categorizes the inputs to valuation techniques used to value its investments into a disclosure hierarchy consisting of three levels as shown below:
- Level 1 – quoted prices in active markets for identical investments
- Level 2 – other significant observable inputs (including quoted prices for similar investments, interest rates, prepayment speeds, etc.)
- Level 3 – unobservable inputs (including the Fund's own assumptions based on the best information available)
Valuation techniques used to value the Fund's investments by major category are as follows:
Equity securities, including restricted securities, for which market quotations are readily available, are valued at the last reported sale price or official closing price as reported by a third party pricing vendor on the primary market or exchange on which they are traded and are categorized as Level 1 in the hierarchy. In the event there were no sales during the day or closing prices are not available, securities are valued at the last quoted bid price or may be valued using the last available price and are generally categorized as Level 2 in the hierarchy. For foreign equity securities, when market or security specific events arise, comparisons to the valuation of American Depositary Receipts (ADRs), futures contracts, Exchange-Traded Funds (ETFs) and certain indexes as well as quoted prices for similar securities may be used and would be categorized as Level 2 in the hierarchy. Utilizing these techniques may result in transfers between Level 1 and Level 2. For equity securities, including restricted securities, where observable inputs are limited, assumptions about market activity and risk are used and these securities may be categorized as Level 3 in the hierarchy.
Investments in open-end mutual funds, including the Fidelity Central Funds, are valued at their closing net asset value (NAV) each business day and are categorized as Level 1 in the hierarchy.
Changes in valuation techniques may result in transfers in or out of an assigned level within the disclosure hierarchy. The aggregate value of investments by input level as of October 31, 2015, including information on transfers between Levels 1 and 2, is included at the end of the Fund's Schedule of Investments.
Foreign Currency. The Fund may use foreign currency contracts to facilitate transactions in foreign-denominated securities. Gains and losses from these transactions may arise from changes in the value of the foreign currency or if the counterparties do not perform under the contracts' terms.
Foreign-denominated assets, including investment securities, and liabilities are translated into U.S. dollars at the exchange rates at period end. Purchases and sales of investment securities, income and dividends received and expenses denominated in foreign currencies are translated into U.S. dollars at the exchange rate in effect on the transaction date.
The effects of exchange rate fluctuations on investments are included with the net realized and unrealized gain (loss) on investment securities. Other foreign currency transactions resulting in realized and unrealized gain (loss) are disclosed separately.
Investment Transactions and Income. For financial reporting purposes, the Fund's investment holdings and NAV include trades executed through the end of the last business day of the period. The NAV per share for processing shareholder transactions is calculated as of the close of business of the New York Stock Exchange (NYSE), normally 4:00 p.m. Eastern time and includes trades executed through the end of the prior business day. Gains and losses on securities sold are determined on the basis of identified cost and may include proceeds received from litigation. Dividend income is recorded on the ex-dividend date, except for certain dividends from foreign securities where the ex-dividend date may have passed, which are recorded as soon as the Fund is informed of the ex-dividend date. Non-cash dividends included in dividend income, if any, are recorded at the fair market value of the securities received. Income and capital gain distributions from Fidelity Central Funds, if any, are recorded on the ex-dividend date. Interest income is accrued as earned and includes coupon interest and amortization of premium and accretion of discount on debt securities as applicable. Investment income is recorded net of foreign taxes withheld where recovery of such taxes is uncertain.
Class Allocations and Expenses. Investment income, realized and unrealized capital gains and losses, common expenses of the Fund, and certain fund-level expense reductions, if any, are allocated daily on a pro-rata basis to each class based on the relative net assets of each class to the total net assets of the Fund. Each class differs with respect to transfer agent and distribution and service plan fees incurred. Certain expense reductions may also differ by class. For the reporting period, the allocated portion of income and expenses to each class as a percent of its average net assets may vary due to the timing of recording these transactions in relation to fluctuating net assets of the classes. Expenses directly attributable to a fund are charged to that fund. Expenses attributable to more than one fund are allocated among the respective funds on the basis of relative net assets or other appropriate methods. Expense estimates are accrued in the period to which they relate and adjustments are made when actual amounts are known.
Income Tax Information and Distributions to Shareholders. Each year, the Fund intends to qualify as a regulated investment company under Subchapter M of the Internal Revenue Code, including distributing substantially all of its taxable income and realized gains. As a result, no provision for U.S. Federal income taxes is required. As of October 31, 2015, the Fund did not have any unrecognized tax benefits in the financial statements; nor is the Fund aware of any tax positions for which it is reasonably possible that the total amounts of unrecognized tax benefits will significantly change in the next twelve months. The Fund files a U.S. federal tax return, in addition to state and local tax returns as required. The Fund's federal income tax returns are subject to examination by the Internal Revenue Service (IRS) for a period of three fiscal years after they are filed. State and local tax returns may be subject to examination for an additional fiscal year depending on the jurisdiction. Foreign taxes are provided for based on the Fund's understanding of the tax rules and rates that exist in the foreign markets in which it invests. The Fund is subject to a tax imposed on capital gains by certain countries in which it invests. An estimated deferred tax liability for net unrealized appreciation on the applicable securities is included in Other payables and accrued expenses on the Statement of Assets & Liabilities.
Distributions are declared and recorded on the ex-dividend date. Income dividends and capital gain distributions are declared separately for each class. Income and capital gain distributions are determined in accordance with income tax regulations, which may differ from GAAP.
Capital accounts within the financial statements are adjusted for permanent book-tax differences. These adjustments have no impact on net assets or the results of operations. Capital accounts are not adjusted for temporary book-tax differences which will reverse in a subsequent period.
Book-tax differences are primarily due to foreign currency transactions, certain foreign taxes, passive foreign investment companies (PFIC), capital loss carryforwards and losses deferred due to wash sales.
The federal tax cost of investment securities and unrealized appreciation (depreciation) as of period end were as follows:
| Gross unrealized appreciation | $42,619,526 |
| Gross unrealized depreciation | (32,272,187) |
| Net unrealized appreciation (depreciation) on securities | $10,347,339 |
| Tax Cost | $416,465,476 |
The tax-based components of distributable earnings as of period end were as follows:
| Undistributed ordinary income | $369,344 |
| Capital loss carryforward | $(60,367,895) |
| Net unrealized appreciation (depreciation) on securities and other investments | $10,326,489 |
Capital loss carryforwards are only available to offset future capital gains of the Fund to the extent provided by regulations and may be limited. Under the Regulated Investment Company Modernization Act of 2010 (the Act), the Fund is permitted to carry forward capital losses incurred in taxable years beginning after December 22, 2010 for an unlimited period and such capital losses are required to be used prior to any losses that expire. The capital loss carryforward information presented below, including any applicable limitation, is estimated as of fiscal period end and is subject to adjustment.
| Fiscal year of expiration | |
| 2017 | $(47,911,843) |
| Total with expiration | $(47,911,843) |
| No expiration | |
| Short-term | $(12,456,052) |
| Total with no expiration | $(12,456,052) |
| Total capital loss carryforward | $(60,367,895) |
The tax character of distributions paid was as follows:
| | October 31, 2015 | October 31, 2014 |
| Ordinary Income | $1,533,888 | $ 1,299,187 |
Short-Term Trading (Redemption) Fees. Shares held by investors in the Fund less than 90 days may have been subject to a redemption fee equal to 1.50% of the NAV of shares redeemed. All redemption fees, which reduce the proceeds of the shareholder redemption, are retained by the Fund and accounted for as an addition to paid in capital.
4. Purchases and Sales of Investments.
Purchases and sales of securities, other than short-term securities, aggregated $491,655,337 and $483,847,532, respectively.
5. Fees and Other Transactions with Affiliates.
Management Fee. Fidelity Management & Research Company (the investment adviser) and its affiliates provide the Fund with investment management related services for which the Fund pays a monthly management fee. The management fee is the sum of an individual fund fee rate that is based on an annual rate of .55% of the Fund's average net assets and an annualized group fee rate that averaged .25% during the period. The group fee rate is based upon the average net assets of all the mutual funds advised by the investment adviser, including any mutual funds previously advised by the investment adviser that are currently advised by Fidelity SelectCo, LLC, an affiliate of the investment adviser. The group fee rate decreases as assets under management increase and increases as assets under management decrease. For the reporting period, the total annual management fee rate was .80% of the Fund's average net assets.
Distribution and Service Plan Fees. In accordance with Rule 12b-1 of the 1940 Act, the Fund has adopted separate Distribution and Service Plans for each class of shares, except for the Institutional Class. Certain classes pay Fidelity Distributors Corporation (FDC), an affiliate of the investment adviser, separate Distribution and Service Fees, each of which is based on an annual percentage of each class' average net assets. In addition, FDC may pay financial intermediaries for selling shares of the Fund and providing shareholder support services. For the period, the Distribution and Service Fee rates, total fees and amounts retained by FDC were as follows:
| | Distribution
Fee | Service
Fee | Total Fees | Retained
by FDC |
| Class A | -% | .25% | $323,428 | $3,381 |
| Class T | .25% | .25% | 249,110 | – |
| Class B | .75% | .25% | 51,240 | 38,477 |
| Class C | .75% | .25% | 551,873 | 57,082 |
| | | | $1,175,651 | $98,940 |
Sales Load. FDC may receive a front-end sales charge of up to 5.75% for selling Class A shares and 3.50% for selling Class T shares, some of which is paid to financial intermediaries for selling shares of the Fund. Depending on the holding period, FDC may receive contingent deferred sales charges levied on Class A, Class T, Class B, and Class C redemptions. The deferred sales charges range from 5.00% to 1.00% for Class B shares, 1.00% for Class C shares, 1.00% for certain purchases of Class A shares and .25% for certain purchases of Class T shares.
For the period, sales charge amounts retained by FDC were as follows:
| | Retained
by FDC |
| Class A | $39,406 |
| Class T | 9,783 |
| Class B(a) | 3,265 |
| Class C(a) | 4,447 |
| | $56,901 |
(a) When Class B and Class C shares are initially sold, FDC pays commissions from its own resources to financial intermediaries through which the sales are made.
Transfer Agent Fees. Fidelity Investments Institutional Operations Company, Inc., (FIIOC), an affiliate of the investment adviser, is the transfer, dividend disbursing and shareholder servicing agent for each class of the Fund. FIIOC receives account fees and asset-based fees that vary according to the account size and type of account of the shareholders of the respective classes of the Fund, except for Class Z. FIIOC receives an asset-based fee of Class Z's average net assets. FIIOC pays for typesetting, printing and mailing of shareholder reports, except proxy statements.
For the period, transfer agent fees for each class were as follows:
| | Amount | % of
Class-Level Average
Net Assets |
| Class A | $385,423 | .30 |
| Class T | 151,579 | .30 |
| Class B | 15,229 | .30 |
| Class C | 165,378 | .30 |
| Class I | 404,444 | .20 |
| Class Z | 2,686 | .05 |
| | $1,124,739 | |
Accounting and Security Lending Fees. Fidelity Service Company, Inc. (FSC), an affiliate of the investment adviser, maintains the Fund's accounting records. The accounting fee is based on the level of average net assets for each month. Under a separate contract, FSC administers the security lending program. The security lending fee is based on the number and duration of lending transactions.
Brokerage Commissions. The Fund placed a portion of its portfolio transactions with brokerage firms which are affiliates of the investment adviser. Brokerage commissions are included in net realized gain (loss) and change in net unrealized appreciation (depreciation) in the Statement of Operations. The commissions paid to these affiliated firms were $1,687 for the period.
Interfund Lending Program. Pursuant to an Exemptive Order issued by the SEC, the Fund, along with other registered investment companies having management contracts with FMR or other affiliated entities of FMR, may participate in an interfund lending program. This program provides an alternative credit facility allowing the funds to borrow from, or lend money to, other participating affiliated funds. At period end, there were no interfund loans outstanding. The Fund's activity in this program during the period for which loans were outstanding was as follows:
| Borrower or Lender | Average Loan Balance | Weighted Average Interest Rate | Interest Expense |
| Borrower | $4,162,000 | .35% | $205 |
6. Committed Line of Credit.
The Fund participates with other funds managed by the investment adviser or an affiliate in a $4.25 billion credit facility (the "line of credit") to be utilized for temporary or emergency purposes to fund shareholder redemptions or for other short-term liquidity purposes. The Fund has agreed to pay commitment fees on its pro-rata portion of the line of credit, which amounted to $648 and is reflected in Miscellaneous expenses on the Statement of Operations. During the period, the Fund did not borrow on this line of credit.
7. Security Lending.
The Fund lends portfolio securities through a lending agent from time to time in order to earn additional income. For equity securities, a lending agent is used and may loan securities to certain qualified borrowers, including Fidelity Capital Markets (FCM), a broker-dealer affiliated with the Fund. On the settlement date of the loan, the Fund receives collateral (in the form of U.S. Treasury obligations, letters of credit and/or cash) against the loaned securities and maintains collateral in an amount not less than 100% of the market value of the loaned securities during the period of the loan. The market value of the loaned securities is determined at the close of business of the Fund and any additional required collateral is delivered to the Fund on the next business day. The Fund or borrower may terminate the loan at any time, and if the borrower defaults on its obligation to return the securities loaned because of insolvency or other reasons, the Fund may apply collateral received from the borrower against the obligation. The Fund may experience delays and costs in recovering the securities loaned. Any cash collateral received is invested in the Fidelity Securities Lending Cash Central Fund. The value of loaned securities and cash collateral at period end are disclosed on the Fund's Statement of Assets and Liabilities. At period end, there were no security loans outstanding with FCM. Security lending income represents the income earned on investing cash collateral, less rebates paid to borrowers and any lending agent fees associated with the loan, plus any premium payments received for lending certain types of securities. Security lending income is presented in the Statement of Operations as a component of income from Fidelity Central Funds. Total security lending income during the period amounted to $62,534, including $1,005 from securities loaned to FCM.
8. Expense Reductions.
Commissions paid to certain brokers with whom the investment adviser, or its affiliates, places trades on behalf of the Fund include an amount in addition to trade execution, which may be rebated back to the Fund to offset certain expenses. This amount totaled $64,703 for the period.
Through arrangements with the Fund's custodian, credits realized as a result of certain uninvested cash balances were used to reduce the Fund's expenses. During the period, these credits reduced the Fund's custody expenses by $52.
In addition, during the period the investment adviser reimbursed and/or waived a portion of fund-level operating expenses in the amount of $1,803 and a portion of class-level operating expenses as follows:
| | Amount |
| Class A | $724 |
| Class T | 128 |
| Class B | 11 |
| Class C | 133 |
| Class I | 3,497 |
| | $4,493 |
9. Distributions to Shareholders.
Distributions to shareholders of each class were as follows:
| Years ended October 31, | 2015 | 2014 |
| From net investment income | | |
| Class A | $115,150 | $314,541 |
| Class T | – | 2,453 |
| Class I | 898,042 | 791,098 |
| Class Z | 33,409 | 5,139 |
| Total | $1,046,601 | $1,113,231 |
| From net realized gain | | |
| Class A | $199,998 | $77,030 |
| Class T | – | 29,431 |
| Class I | 279,579 | 79,110 |
| Class Z | 7,710 | 385 |
| Total | $487,287 | $185,956 |
10. Share Transactions.
Share transactions for each class were as follows and may contain automatic conversions between classes or exchanges between funds:
| | Shares | Shares | Dollars | Dollars |
| Years ended October 31, | 2015 | 2014 | 2015 | 2014 |
| Class A | | | | |
| Shares sold | 1,093,525 | 1,306,708 | $24,402,020 | $29,667,252 |
| Reinvestment of distributions | 13,163 | 16,164 | 302,357 | 356,894 |
| Shares redeemed | (1,715,077) | (1,739,459) | (37,830,400) | (38,968,004) |
| Net increase (decrease) | (608,389) | (416,587) | $(13,126,023) | $(8,943,858) |
| Class T | | | | |
| Shares sold | 305,389 | 414,394 | $6,786,919 | $9,392,831 |
| Reinvestment of distributions | – | 1,397 | – | 30,813 |
| Shares redeemed | (537,767) | (558,505) | (11,710,693) | (12,438,338) |
| Net increase (decrease) | (232,378) | (142,714) | $(4,923,774) | $(3,014,694) |
| Class B | | | | |
| Shares sold | 2,482 | 16,905 | $54,329 | $374,479 |
| Shares redeemed | (171,894) | (200,427) | (3,727,701) | (4,400,967) |
| Net increase (decrease) | (169,412) | (183,522) | $(3,673,372) | $(4,026,488) |
| Class C | | | | |
| Shares sold | 365,122 | 651,900 | $7,912,445 | $14,559,904 |
| Shares redeemed | (858,213) | (666,053) | (18,293,083) | (14,339,508) |
| Net increase (decrease) | (493,091) | (14,153) | $(10,380,638) | $220,396 |
| Class I | | | | |
| Shares sold | 3,524,595 | 2,772,401 | $77,404,353 | $64,467,777 |
| Reinvestment of distributions | 49,091 | 36,756 | 1,129,581 | 813,035 |
| Shares redeemed | (1,999,205) | (963,648) | (44,250,238) | (22,091,792) |
| Net increase (decrease) | 1,574,481 | 1,845,509 | $34,283,696 | $43,189,020 |
| Class Z | | | | |
| Shares sold | 119,541 | 251,250 | $2,670,833 | $5,945,448 |
| Reinvestment of distributions | 1,789 | 250 | 41,119 | 5,524 |
| Shares redeemed | (63,727) | (20,301) | (1,390,718) | (467,981) |
| Net increase (decrease) | 57,603 | 231,199 | $1,321,234 | $5,482,991 |
11. Other.
The Fund's organizational documents provide former and current trustees and officers with a limited indemnification against liabilities arising in connection with the performance of their duties to the Fund. In the normal course of business, the Fund may also enter into contracts that provide general indemnifications. The Fund's maximum exposure under these arrangements is unknown as this would be dependent on future claims that may be made against the Fund. The risk of material loss from such claims is considered remote.
Report of Independent Registered Public Accounting Firm
To the Trustees of Fidelity Advisor Series VIII and Shareholders of Fidelity Advisor® Emerging Markets Fund:
We have audited the accompanying statement of assets and liabilities of Fidelity Advisor® Emerging Markets Fund (the Fund), a fund of Fidelity Advisor Series VIII, including the schedule of investments, as of October 31, 2015, and the related statement of operations for the year then ended, the statement of changes in net assets for each of the two years in the period then ended, and the financial highlights for each of the five years in the period then ended. These financial statements and financial highlights are the responsibility of the Fund's management. Our responsibility is to express an opinion on these financial statements and financial highlights based on our audits.
We conducted our audits in accordance with the standards of the Public Company Accounting Oversight Board (United States). Those standards require that we plan and perform the audit to obtain reasonable assurance about whether the financial statements and financial highlights are free of material misstatement. The Fund is not required to have, nor were we engaged to perform, an audit of its internal control over financial reporting. Our audits included consideration of internal control over financial reporting as a basis for designing audit procedures that are appropriate in the circumstances, but not for the purpose of expressing an opinion on the effectiveness of the Fund's internal control over financial reporting. Accordingly, we express no such opinion. An audit also includes examining, on a test basis, evidence supporting the amounts and disclosures in the financial statements, assessing the accounting principles used and significant estimates made by management, as well as evaluating the overall financial statement presentation. Our procedures included confirmation of securities owned as of October 31, 2015, by correspondence with the custodians and brokers; when replies were not received from brokers, we performed other auditing procedures. We believe our audits provide a reasonable basis for our opinion.
In our opinion, such financial statements and financial highlights referred to above present fairly, in all material respects, the financial position of Fidelity Advisor® Emerging Markets Fund as of October 31, 2015, the results of its operations for the year then ended, the changes in its net assets for each of the two years in the period then ended, and the financial highlights for each of the five years in the period then ended, in conformity with accounting principles generally accepted in the United States of America.
DELOITTE & TOUCHE LLP
Boston, Massachusetts
December 16, 2015
Trustees and Officers
The Trustees, Members of the Advisory Board (if any), and officers of the trust and fund, as applicable, are listed below. The Board of Trustees governs the fund and is responsible for protecting the interests of shareholders. The Trustees are experienced executives who meet periodically throughout the year to oversee the fund's activities, review contractual arrangements with companies that provide services to the fund, oversee management of the risks associated with such activities and contractual arrangements, and review the fund's performance. Each of the Trustees oversees 170 funds.
The Trustees hold office without limit in time except that (a) any Trustee may resign; (b) any Trustee may be removed by written instrument, signed by at least two-thirds of the number of Trustees prior to such removal; (c) any Trustee who requests to be retired or who has become incapacitated by illness or injury may be retired by written instrument signed by a majority of the other Trustees; and (d) any Trustee may be removed at any special meeting of shareholders by a two-thirds vote of the outstanding voting securities of the trust. Each Trustee who is not an interested person (as defined in the 1940 Act) of the trust and the fund is referred to herein as an Independent Trustee. Each Independent Trustee shall retire not later than the last day of the calendar year in which his or her 75th birthday occurs. The Independent Trustees may waive this mandatory retirement age policy with respect to individual Trustees. Officers and Advisory Board Members hold office without limit in time, except that any officer or Advisory Board Member may resign or may be removed by a vote of a majority of the Trustees at any regular meeting or any special meeting of the Trustees. Except as indicated, each individual has held the office shown or other offices in the same company for the past five years.
The fund’s Statement of Additional Information (SAI) includes more information about the Trustees. To request a free copy, call Fidelity at 1-877-208-0098.
Experience, Skills, Attributes, and Qualifications of the Trustees. The Governance and Nominating Committee has adopted a statement of policy that describes the experience, qualifications, attributes, and skills that are necessary and desirable for potential Independent Trustee candidates (Statement of Policy). The Board believes that each Trustee satisfied at the time he or she was initially elected or appointed a Trustee, and continues to satisfy, the standards contemplated by the Statement of Policy. The Governance and Nominating Committee also engages professional search firms to help identify potential Independent Trustee candidates who have the experience, qualifications, attributes, and skills consistent with the Statement of Policy. From time to time, additional criteria based on the composition and skills of the current Independent Trustees, as well as experience or skills that may be appropriate in light of future changes to board composition, business conditions, and regulatory or other developments, have also been considered by the professional search firms and the Governance and Nominating Committee. In addition, the Board takes into account the Trustees' commitment and participation in Board and committee meetings, as well as their leadership of standing and ad hoc committees throughout their tenure.
In determining that a particular Trustee was and continues to be qualified to serve as a Trustee, the Board has considered a variety of criteria, none of which, in isolation, was controlling. The Board believes that, collectively, the Trustees have balanced and diverse experience, qualifications, attributes, and skills, which allow the Board to operate effectively in governing the fund and protecting the interests of shareholders. Information about the specific experience, skills, attributes, and qualifications of each Trustee, which in each case led to the Board's conclusion that the Trustee should serve (or continue to serve) as a trustee of the fund, is provided below.
Board Structure and Oversight Function. James C. Curvey is an interested person and currently serves as Chairman. The Trustees have determined that an interested Chairman is appropriate and benefits shareholders because an interested Chairman has a personal and professional stake in the quality and continuity of services provided to the fund. Independent Trustees exercise their informed business judgment to appoint an individual of their choosing to serve as Chairman, regardless of whether the Trustee happens to be independent or a member of management. The Independent Trustees have determined that they can act independently and effectively without having an Independent Trustee serve as Chairman and that a key structural component for assuring that they are in a position to do so is for the Independent Trustees to constitute a substantial majority for the Board. The Independent Trustees also regularly meet in executive session. Ned C. Lautenbach serves as Chairman of the Independent Trustees and as such (i) acts as a liaison between the Independent Trustees and management with respect to matters important to the Independent Trustees and (ii) with management prepares agendas for Board meetings.
Fidelity® funds are overseen by different Boards of Trustees. The fund's Board oversees Fidelity's high income and certain equity funds, and other Boards oversee Fidelity's investment-grade bond, money market, asset allocation, and sector funds. The asset allocation funds may invest in Fidelity® funds overseen by the fund's Board. The use of separate Boards, each with its own committee structure, allows the Trustees of each group of Fidelity® funds to focus on the unique issues of the funds they oversee, including common research, investment, and operational issues. On occasion, the separate Boards establish joint committees to address issues of overlapping consequences for the Fidelity® funds overseen by each Board.
The Trustees operate using a system of committees to facilitate the timely and efficient consideration of all matters of importance to the Trustees, the fund, and fund shareholders and to facilitate compliance with legal and regulatory requirements and oversight of the fund's activities and associated risks. The Board, acting through its committees, has charged FMR and its affiliates with (i) identifying events or circumstances the occurrence of which could have demonstrably adverse effects on the fund's business and/or reputation; (ii) implementing processes and controls to lessen the possibility that such events or circumstances occur or to mitigate the effects of such events or circumstances if they do occur; and (iii) creating and maintaining a system designed to evaluate continuously business and market conditions in order to facilitate the identification and implementation processes described in (i) and (ii) above. Because the day-to-day operations and activities of the fund are carried out by or through FMR, its affiliates, and other service providers, the fund's exposure to risks is mitigated but not eliminated by the processes overseen by the Trustees. While each of the Board's committees has responsibility for overseeing different aspects of the fund's activities, oversight is exercised primarily through the Operations, Audit, and Compliance Committees. In addition, the Independent Trustees have worked with FMR to enhance the Board's oversight of investment and financial risks, legal and regulatory risks, technology risks, and operational risks, including the development of additional risk reporting to the Board. For example, a working group comprised of Independent Trustees and FMR has worked and continues to work to review the Fidelity® funds' valuation-related activities, reporting and risk management. Appropriate personnel, including but not limited to the fund's Chief Compliance Officer (CCO), FMR's internal auditor, the independent accountants, the fund's Treasurer and portfolio management personnel, make periodic reports to the Board's committees, as appropriate, including an annual review of Fidelity's risk management program for the Fidelity® funds. The responsibilities of each standing committee, including their oversight responsibilities, are described further under "Standing Committees of the Trustees."
Interested Trustees*:
Correspondence intended for a Trustee who is an interested person may be sent to Fidelity Investments, 245 Summer Street, Boston, Massachusetts 02210.
Name, Year of Birth; Principal Occupations and Other Relevant Experience+
James C. Curvey (1935)
Year of Election or Appointment: 2007
Trustee
Chairman of the Board of Trustees
Mr. Curvey also serves as Trustee of other Fidelity® funds. Mr. Curvey is a Director of Fidelity Research & Analysis Co. (investment adviser firm, 2009-present), and Vice Chairman (2007-present) and Director of FMR LLC (diversified financial services company). In addition, Mr. Curvey serves as an Overseer for the Boston Symphony Orchestra and a member of the board of Artis-Naples, Naples, Florida, and as a Trustee for Brewster Academy, Wolfeboro, New Hampshire. Previously, Mr. Curvey served as a Director of Fidelity Investments Money Management, Inc. (investment adviser firm, 2009-2014) and a Director of FMR and FMR Co., Inc. (investment adviser firms, 2007-2014).
Charles S. Morrison (1960)
Year of Election or Appointment: 2014
Trustee
Mr. Morrison also serves as Trustee of other funds. He serves as a Director of Fidelity Investments Money Management, Inc. (FIMM) (investment adviser firm, 2014-present), Director of Fidelity SelectCo, LLC (investment adviser firm, 2014-present), President, Asset Management (2014-present), and is an employee of Fidelity Investments. Previously, Mr. Morrison served as Vice President of Fidelity's Fixed Income and Asset Allocation Funds (2012-2014), President, Fixed Income (2011-2014), Vice President of Fidelity's Money Market Funds (2005-2009), President, Money Market Group Leader of FMR (investment adviser firm, 2009), and Senior Vice President, Money Market Group of FMR (2004-2009). Mr. Morrison also served as Vice President of Fidelity's Bond Funds (2002-2005), certain Balanced Funds (2002-2005), and certain Asset Allocation Funds (2002-2007), and as Senior Vice President (2002-2005) of Fidelity's Bond Division.
* Determined to be an “Interested Trustee” by virtue of, among other things, his or her affiliation with the trust or various entities under common control with FMR.
+ The information includes the Trustee's principal occupation during the last five years and other information relating to the experience, attributes, and skills relevant to the Trustee's qualifications to serve as a Trustee, which led to the conclusion that the Trustee should serve as a Trustee for the fund.
Independent Trustees:
Correspondence intended for an Independent Trustee may be sent to Fidelity Investments, P.O. Box 55235, Boston, Massachusetts 02205-5235.
Name, Year of Birth; Principal Occupations and Other Relevant Experience+
Dennis J. Dirks (1948)
Year of Election or Appointment: 2005
Trustee
Mr. Dirks also serves as Trustee of other Fidelity® funds. Prior to his retirement in May 2003, Mr. Dirks was Chief Operating Officer and a member of the Board of The Depository Trust & Clearing Corporation (DTCC). He also served as President, Chief Operating Officer, and Board member of The Depository Trust Company (DTC) and President and Board member of the National Securities Clearing Corporation (NSCC). In addition, Mr. Dirks served as Chief Executive Officer and Board member of the Government Securities Clearing Corporation, Chief Executive Officer and Board member of the Mortgage-Backed Securities Clearing Corporation, as a Trustee and a member of the Finance Committee of Manhattan College (2005-2008), as a Trustee and a member of the Finance Committee of AHRC of Nassau County (2006-2008), and as a member of the Independent Directors Council (IDC) Governing Council (2010-2015). Mr. Dirks is a member of the Board of Directors for The Brookville Center for Children's Services, Inc. (2009-present).
Alan J. Lacy (1953)
Year of Election or Appointment: 2008
Trustee
Mr. Lacy also serves as Trustee of other Fidelity® funds. Mr. Lacy serves as a member of the Board of Directors of Dave & Buster's Entertainment, Inc. (restaurant and entertainment complexes, 2010-present) and Bristol-Myers Squibb Company (global pharmaceuticals, 2008-present). In addition, Mr. Lacy served as Senior Adviser (2007-2014) of Oak Hill Capital Partners, L.P. (private equity) and also served as Chief Executive Officer (2000-2005) and Vice Chairman (2005-2006) of Sears Holdings Corporation and Sears, Roebuck and Co. (retail). Mr. Lacy is a member of the Board of Trustees of The National Parks Conservation Association (2006-present). Previously, Mr. Lacy served as Chairman of the Board of Trustees of the National Parks Conservation Association (2008-2011) and as a member of the Board of Directors for The Western Union Company (global money transfer, 2006-2011), The Hillman Companies, Inc. (hardware wholesalers, 2010-2014), and Earth Fare, Inc. (retail grocery, 2010-2014).
Ned C. Lautenbach (1944)
Year of Election or Appointment: 2000
Trustee
Chairman of the Independent Trustees
Mr. Lautenbach also serves as Trustee of other Fidelity® funds. Mr. Lautenbach currently serves as the Lead Director of the Eaton Corporation Board of Directors (diversified industrial, 1997-present). Mr. Lautenbach is Chairman of the Board of Directors of Artis-Naples in Naples, Florida (2012-present), a member of the Council on Foreign Relations (1994-present), and a member of the Board of Governors, State University System of Florida (2013-present). Previously, Mr. Lautenbach was a Partner/Advisory Partner at Clayton, Dubilier & Rice, LLC (private equity investment, 1998-2010), as well as a Director of Sony Corporation (2006-2007).
Joseph Mauriello (1944)
Year of Election or Appointment: 2008
Trustee
Mr. Mauriello also serves as Trustee of other Fidelity® funds. Prior to his retirement in January 2006, Mr. Mauriello served in numerous senior management positions including Deputy Chairman and Chief Operating Officer (2004-2005), and Vice Chairman of Financial Services (2002-2004) of KPMG LLP US (professional services, 1965-2005). Mr. Mauriello currently serves as a member of the Board of Directors of XL Group plc. (global insurance and re-insurance, 2006-present) and the Independent Directors Council (IDC) Governing Council (2015-present). Previously, Mr. Mauriello served as a Director of the Hamilton Funds of the Bank of New York (2006-2007) and of Arcadia Resources Inc. (health care services and products, 2007-2012).
Robert W. Selander (1950)
Year of Election or Appointment: 2011
Trustee
Mr. Selander also serves as Trustee of other Fidelity® funds. Mr. Selander serves as a Director of The Western Union Company (global money transfer, 2014-present). Previously, Mr. Selander served as a Member of the Advisory Board of other Fidelity® funds (2011), and Executive Vice Chairman (2010), Chief Executive Officer (2009-2010), and President and Chief Executive Officer (1997-2009) of Mastercard, Inc.
Cornelia M. Small (1944)
Year of Election or Appointment: 2005
Trustee
Ms. Small also serves as Trustee of other Fidelity® funds. Ms. Small is a member of the Board of Directors (2009-present) and Chair of the Investment Committee (2010-present) of the Teagle Foundation. Ms. Small also serves on the Investment Committee of the Berkshire Taconic Community Foundation (2008-present). Previously, Ms. Small served as Chairperson (2002-2008) and a member of the Investment Committee and Chairperson (2008-2012) and a member of the Board of Trustees of Smith College. In addition, Ms. Small served as Chief Investment Officer, Director of Global Equity Investments, and a member of the Board of Directors of Scudder, Stevens & Clark and Scudder Kemper Investments.
William S. Stavropoulos (1939)
Year of Election or Appointment: 2001
Trustee
Vice Chairman of the Independent Trustees
Mr. Stavropoulos also serves as Trustee of other Fidelity® funds. Mr. Stavropoulos serves as President and Founder of the Michigan Baseball Foundation, the Great Lakes Loons (2007-present). Mr. Stavropoulos is Chairman Emeritus of the Board of Directors of The Dow Chemical Company, where he previously served in numerous senior management positions, including President, CEO (1995-2000; 2002-2004), Chairman of the Executive Committee (2000-2006), and as a member of the Board of Directors (1990-2006). Currently, Mr. Stavropoulos is Chairman of the Board of Directors of Univar Inc. (global distributor of commodity and specialty chemicals), a Director of Teradata Corporation (data warehousing and technology solutions), and Maersk Inc. (industrial conglomerate), and a member of the Advisory Board for Metalmark Capital LLC (private equity investment, 2005-present). Mr. Stavropoulos is an operating advisor to Clayton, Dubilier & Rice, LLC (private equity investment). In addition, Mr. Stavropoulos is a member of the University of Notre Dame Advisory Council for the College of Science, a Trustee of the Rollin L. Gerstacker Foundation, and a Director of the Naples Philharmonic Center for the Arts. Previously, Mr. Stavropoulos served as a Director of Chemical Financial Corporation (bank holding company, 1993-2012) and Tyco International, Ltd. (multinational manufacturing and services, 2007-2012).
David M. Thomas (1949)
Year of Election or Appointment: 2008
Trustee
Mr. Thomas also serves as Trustee of other Fidelity® funds. Mr. Thomas serves as Non-Executive Chairman of the Board of Directors of Fortune Brands Home and Security (home and security products, 2011-present), as a member of the Board of Directors (2004-present) and Presiding Director (2013-present) of Interpublic Group of Companies, Inc. (marketing communication), and as a member of the Board of Trustees of the University of Florida (2013-present). Previously, Mr. Thomas served as Executive Chairman (2005-2006) and Chairman and Chief Executive Officer (2000-2005) of IMS Health, Inc. (pharmaceutical and healthcare information solutions), and a Director of Fortune Brands, Inc. (consumer products, 2000-2011).
+ The information includes the Trustee's principal occupation during the last five years and other information relating to the experience, attributes, and skills relevant to the Trustee's qualifications to serve as a Trustee, which led to the conclusion that the Trustee should serve as a Trustee for the fund.
Advisory Board Members and Officers:
Correspondence intended for an officer or Peter S. Lynch may be sent to Fidelity Investments, 245 Summer Street, Boston, Massachusetts 02210. Officers appear below in alphabetical order.
Name, Year of Birth; Principal Occupation
Peter S. Lynch (1944)
Year of Election or Appointment: 2003
Member of the Advisory Board
Mr. Lynch also serves as Member of the Advisory Board of other Fidelity® funds. Mr. Lynch is Vice Chairman and a Director of FMR (investment adviser firm) and FMR Co., Inc. (investment adviser firm). In addition, Mr. Lynch serves as a Trustee of Boston College and as the Chairman of the Inner-City Scholarship Fund. Previously, Mr. Lynch served on the Special Olympics International Board of Directors (1997-2006).
Elizabeth Paige Baumann (1968)
Year of Election or Appointment: 2012
Anti-Money Laundering (AML) Officer
Ms. Baumann also serves as AML Officer of other funds. She is Chief AML Officer of FMR LLC (diversified financial services company, 2012-present) and is an employee of Fidelity Investments. Previously, Ms. Baumann served as Vice President and Deputy Anti-Money Laundering Officer (2007-2012).
Marc R. Bryant (1966)
Year of Election or Appointment: 2015
Secretary and Chief Legal Officer (CLO)
Mr. Bryant also serves as Secretary and CLO of other funds. Mr. Bryant serves as CLO, Secretary, and Senior Vice President of Fidelity Management & Research Company (investment adviser firm, 2015-present) and FMR Co., Inc. (investment adviser firm, 2015-present); Secretary of Fidelity SelectCo, LLC (investment adviser firm, 2015-present) and Fidelity Investments Money Management, Inc. (investment adviser firm, 2015-present); and CLO of Fidelity Management & Research (Hong Kong) Limited (investment adviser firm, 2015-present). He is Senior Vice President and Deputy General Counsel of FMR LLC (diversified financial services company). Previously, Mr. Bryant served as Secretary and Chief Legal Officer of Fidelity Rutland Square Trust II (2010-2014) and Assistant Secretary of Fidelity's Fixed Income and Asset Allocation Funds (2013-2015). Prior to joining Fidelity Investments, Mr. Bryant served as a Senior Vice President and the Head of Global Retail Legal for AllianceBernstein L.P. (2006-2010), and as the General Counsel for ProFund Advisors LLC (2001-2006).
Timothy M. Cohen (1969)
Year of Election or Appointment: 2014
Vice President of certain Equity Funds
Mr. Cohen also serves as Vice President of other funds. Mr. Cohen serves as Chief Compliance Officer of FMR Investment Management (U.K.) Limited (investment adviser firm, 2013-present) and is an employee of Fidelity Investments. Previously, Mr. Cohen served as a Director of FMR Investment Management (U.K.) Limited (2013-2015).
William C. Coffey (1969)
Year of Election or Appointment: 2009
Assistant Secretary
Mr. Coffey also serves as Assistant Secretary of other funds. He is Senior Vice President and Deputy General Counsel of FMR LLC (diversified financial services company, 2010-present), and is an employee of Fidelity Investments. Previously, Mr. Coffey served as Vice President and Associate General Counsel of FMR LLC (2005-2009).
Jonathan Davis (1968)
Year of Election or Appointment: 2010
Assistant Treasurer
Mr. Davis also serves as Assistant Treasurer of other funds, and is an employee of Fidelity Investments. Previously, Mr. Davis served as Vice President and Associate General Counsel of FMR LLC (diversified financial services company, 2003-2010).
Adrien E. Deberghes (1967)
Year of Election or Appointment: 2008
Deputy Treasurer
Mr. Deberghes also serves as an officer of other funds. He is an employee of Fidelity Investments (2008-present). Prior to joining Fidelity Investments, Mr. Deberghes was Senior Vice President of Mutual Fund Administration at State Street Corporation (2007-2008), Senior Director of Mutual Fund Administration at Investors Bank & Trust (2005-2007), and Director of Finance for Dunkin' Brands (2000-2005).
Stephanie J. Dorsey (1969)
Year of Election or Appointment: 2010
Assistant Treasurer
Ms. Dorsey also serves as an officer of other funds. She is an employee of Fidelity Investments (2008-present) and has served in other fund officer roles. Prior to joining Fidelity Investments, Ms. Dorsey served as Treasurer (2004-2008) of the JPMorgan Mutual Funds and Vice President (2004-2008) of JPMorgan Chase Bank.
Howard J. Galligan III (1966)
Year of Election or Appointment: 2014
Chief Financial Officer
Mr. Galligan also serves as Chief Financial Officer of other funds. Mr. Galligan serves as President of Fidelity Pricing and Cash Management Services (FPCMS) (2014-present) and as a Director of Strategic Advisers, Inc. (investment adviser firm, 2008-present). Previously, Mr. Galligan served as Chief Administrative Officer of Asset Management (2011-2014) and Chief Operating Officer and Senior Vice President of Investment Support for Strategic Advisers, Inc. (2003-2011).
Scott C. Goebel (1968)
Year of Election or Appointment: 2015
Vice President
Mr. Goebel serves as Vice President of other funds and is an employee of Fidelity Investments (2001-present). Previously, Mr. Goebel served as Secretary of Fidelity SelectCo, LLC (investment adviser firm, 2013-2015), Fidelity Investments Money Management, Inc. (FIMM) (investment adviser firm, 2010-2015), and Fidelity Research and Analysis Company (FRAC) (investment adviser firm, 2010-2015); General Counsel, Secretary, and Senior Vice President of Fidelity Management & Research Company (investment adviser firm, 2008-2015) and FMR Co., Inc. (investment adviser firm, 2008-2015); Assistant Secretary of Fidelity Management & Research (Japan) Limited (investment adviser firm, 2008-2015) and FMR Investment Management (U.K.) Limited (investment adviser firm, 2008-2015); Chief Legal Officer (CLO) of Fidelity Management & Research (Hong Kong) Limited (investment adviser firm, 2008-2015); Secretary and CLO of certain Fidelity® funds (2008-2015); Assistant Secretary of FIMM (2008-2010), FRAC (2008-2010), and certain funds (2007-2008); and as Vice President and Secretary of Fidelity Distributors Corporation (FDC) (2005-2007).
Brian B. Hogan (1964)
Year of Election or Appointment: 2009
Vice President
Mr. Hogan also serves as Trustee or Vice President of other funds. Mr. Hogan serves as a Director of Fidelity SelectCo, LLC (investment adviser firm, 2014-present) and President of the Equity Division of FMR (investment adviser firm, 2009-present). Previously, Mr. Hogan served as Senior Vice President, Equity Research of FMR (2006-2009) and as a portfolio manager.
Chris Maher (1972)
Year of Election or Appointment: 2013
Assistant Treasurer
Mr. Maher serves as Assistant Treasurer of other funds. Mr. Maher is Vice President of Valuation Oversight and is an employee of Fidelity Investments. Previously, Mr. Maher served as Vice President of Asset Management Compliance (2013), Vice President of the Program Management Group of FMR (investment adviser firm, 2010-2013), and Vice President of Valuation Oversight (2008-2010).
Kenneth B. Robins (1969)
Year of Election or Appointment: 2008
President and Treasurer
Mr. Robins also serves as an officer of other funds. Mr. Robins serves as Executive Vice President of Fidelity Investments Money Management, Inc. (FIMM) (investment adviser firm, 2013-present) and is an employee of Fidelity Investments (2004-present). Previously, Mr. Robins served in other fund officer roles.
Stacie M. Smith (1974)
Year of Election or Appointment: 2013
Deputy Treasurer
Ms. Smith also serves as an officer of other funds. She is an employee of Fidelity Investments (2009-present) and has served in other fund officer roles. Prior to joining Fidelity Investments, Ms. Smith served as Senior Audit Manager of Ernst & Young LLP (1996-2009).
Renee Stagnone (1975)
Year of Election or Appointment: 2013
Deputy Treasurer
Ms. Stagnone also serves as Deputy Treasurer of other funds. Ms. Stagnone is an employee of Fidelity Investments (1997-present).
Linda J. Wondrack (1964)
Year of Election or Appointment: 2014
Chief Compliance Officer
Ms. Wondrack also serves as Chief Compliance Officer of other funds. Ms. Wondrack is Executive Vice President and head of the Ethics Office and Asset Management Compliance for Fidelity Investments (2012-present). Ms. Wondrack also serves as Chief Compliance Officer of Fidelity SelectCo, LLC (investment adviser firm, 2014-present); Chief Compliance Officer of Impresa Management LLC (2013-present); and Chief Compliance Officer of FMR Co., Inc. (investment adviser firm), Fidelity Investments Money Management, Inc. (investment adviser firm), Fidelity Management & Research (Japan) Limited (investment adviser firm), FMR Investment Management (U.K.) Limited (investment adviser firm), Fidelity Management & Research (Hong Kong) (investment adviser firm), Fidelity Management & Research Company (investment adviser firm), FIAM LLC (investment adviser firm), and Strategic Advisers, Inc. (investment adviser firm), Ballyrock Investment Advisors LLC, and Northern Neck Investors LLC (2012-present). Previously, Ms. Wondrack served as Senior Vice President and Chief Compliance Officer for Columbia Management Investment Advisers, LLC (2005-2012); Chief Compliance Officer for certain funds within the Columbia Family of Funds (2007-2012); and Senior Vice President of Compliance Risk Management at Bank of America (2005-2010).
Joseph F. Zambello (1957)
Year of Election or Appointment: 2011
Deputy Treasurer
Mr. Zambello also serves as Deputy Treasurer of other funds. Mr. Zambello is an employee of Fidelity Investments (1991-present). Previously, Mr. Zambello served as Vice President of the Program Management Group of FMR (investment adviser firm, 2009-2011) and Vice President of the Transfer Agent Oversight Group (2005-2009).
Shareholder Expense Example
As a shareholder of the Fund, you incur two types of costs: (1) transaction costs, including sales charges (loads) on purchase payments or redemption proceeds, redemption fees and (2) ongoing costs, including management fees, distribution and/or service (12b-1) fees and other Fund expenses. This Example is intended to help you understand your ongoing costs (in dollars) of investing in the Fund and to compare these costs with the ongoing costs of investing in other mutual funds.
The Example is based on an investment of $1,000 invested at the beginning of the period and held for the entire period (May 1, 2015 to October 31, 2015).
Actual Expenses
The first line of the accompanying table for each class of the Fund provides information about actual account values and actual expenses. You may use the information in this line, together with the amount you invested, to estimate the expenses that you paid over the period. Simply divide your account value by $1,000.00 (for example, an $8,600 account value divided by $1,000.00 = 8.6), then multiply the result by the number in the first line for a class of the Fund under the heading entitled "Expenses Paid During Period" to estimate the expenses you paid on your account during this period. In addition, the Fund, as a shareholder in the underlying Fidelity Central Funds, will indirectly bear its pro-rata share of the fees and expenses incurred by the underlying Fidelity Central Funds. These fees and expenses are not included in the Fund's annualized expense ratio used to calculate the expense estimate in the table below.
Hypothetical Example for Comparison Purposes
The second line of the accompanying table for each class of the Fund provides information about hypothetical account values and hypothetical expenses based on a Class' actual expense ratio and an assumed rate of return of 5% per year before expenses, which is not the Class' actual return. The hypothetical account values and expenses may not be used to estimate the actual ending account balance or expenses you paid for the period. You may use this information to compare the ongoing costs of investing in the Fund and other funds. To do so, compare this 5% hypothetical example with the 5% hypothetical examples that appear in the shareholder reports of the other funds. In addition, the Fund, as a shareholder in the underlying Fidelity Central Funds, will indirectly bear its pro-rata share of the fees and expenses incurred by the underlying Fidelity Central Funds. These fees and expenses are not included in the Fund's annualized expense ratio used to calculate the expense estimate in the table below.
Please note that the expenses shown in the table are meant to highlight your ongoing costs only and do not reflect any transaction costs. Therefore, the second line of the table is useful in comparing ongoing costs only, and will not help you determine the relative total costs of owning different funds. In addition, if these transactional costs were included, your costs would have been higher.
| | Annualized Expense Ratio-A | Beginning
Account Value
May 1, 2015 | Ending
Account Value
October 31, 2015 | Expenses Paid
During Period-B
May 1, 2015
to October 31, 2015 |
| Class A | 1.50% | | | |
| Actual | | $1,000.00 | $884.80 | $7.13 |
| Hypothetical-C | | $1,000.00 | $1,017.64 | $7.63 |
| Class T | 1.76% | | | |
| Actual | | $1,000.00 | $883.20 | $8.35 |
| Hypothetical-C | | $1,000.00 | $1,016.33 | $8.94 |
| Class B | 2.24% | | | |
| Actual | | $1,000.00 | $881.40 | $10.62 |
| Hypothetical-C | | $1,000.00 | $1,013.91 | $11.37 |
| Class C | 2.25% | | | |
| Actual | | $1,000.00 | $881.20 | $10.67 |
| Hypothetical-C | | $1,000.00 | $1,013.86 | $11.42 |
| Class I | 1.15% | | | |
| Actual | | $1,000.00 | $886.00 | $5.47 |
| Hypothetical-C | | $1,000.00 | $1,019.41 | $5.85 |
| Class Z | 1.01% | | | |
| Actual | | $1,000.00 | $886.80 | $4.80 |
| Hypothetical-C | | $1,000.00 | $1,020.11 | $5.14 |
A Annualized expense ratio reflects expenses net of applicable fee waivers.
B Expenses are equal to each Class' annualized expense ratio, multiplied by the average account value over the period, multiplied by 184/365 (to reflect the one-half year period).
C 5% return per year before expenses
Distributions (Unaudited)
Class I designates 100% of the dividends distributed during the fiscal year as amounts which may be taken into account as a dividend for purposes of the maximum rate under section 1(h)(11) of the Internal Revenue Code.
Class I designates 7% of the dividends distributed during the fiscal year as qualifying for the dividends-received deduction for corporate shareholders.
The amounts per share which represent income derived from sources within, and taxes paid to, foreign countries or possessions of the United States are as follows
| | Pay Date | Income | Taxes |
| Class I | 12/08/2014 | $0.1884 | $0.0494 |
The fund will notify shareholders in January 2016 of amounts for use in preparing 2015 income tax returns.
Board Approval of Investment Advisory Contracts and Management Fees
Fidelity Advisor Emerging Markets Fund
Each year, the Board of Trustees, including the Independent Trustees (together, the Board), votes on the renewal of the management contract with Fidelity Management & Research Company (FMR) and the sub-advisory agreements (together, the Advisory Contracts) for the fund. The Board, assisted by the advice of fund counsel and Independent Trustees' counsel, requests and considers a broad range of information relevant to the renewal of the Advisory Contracts throughout the year.
The Board meets regularly and, at each of its meetings, covers an extensive agenda of topics and materials and considers factors that are relevant to its annual consideration of the renewal of the fund's Advisory Contracts, including the services and support provided to the fund and its shareholders. The Board has established various standing committees (Committees), each composed of and chaired by Independent Trustees with varying backgrounds, to which the Board has assigned specific subject matter responsibilities in order to enhance effective decision-making by the Board. The Board, acting directly and through its Committees, requests and receives information concerning the annual consideration of the renewal of the fund's Advisory Contracts. The Board also meets as needed to consider matters specifically related to the Board's annual consideration of the renewal of the Advisory Contracts. Members of the Board may also meet with trustees of other Fidelity funds through ad hoc joint committees to discuss certain matters relevant to all of the Fidelity funds.
At its July 2015 meeting, the Board unanimously determined to renew the fund's Advisory Contracts. In reaching its determination, the Board considered all factors it believed relevant, including (i) the nature, extent, and quality of the services to be provided to the fund and its shareholders (including the investment performance of the fund); (ii) the competitiveness of the fund's management fee and total expense ratio relative to peer funds; (iii) the total costs of the services to be provided by and the profits to be realized by Fidelity from its relationship with the fund; and (iv) the extent to which (if any) economies of scale exist and would be realized as the fund grows, and whether any economies of scale are appropriately shared with fund shareholders.
In considering whether to renew the Advisory Contracts for the fund, the Board reached a determination, with the assistance of fund counsel and Independent Trustees' counsel and through the exercise of its business judgment, that the renewal of the Advisory Contracts was in the best interests of the fund and its shareholders and that the compensation payable under the Advisory Contracts was fair and reasonable. The Board's decision to renew the Advisory Contracts was not based on any single factor, but rather was based on a comprehensive consideration of all the information provided to the Board at its meetings throughout the year. The Board, in reaching its determination to renew the Advisory Contracts, was aware that shareholders of the fund have a broad range of investment choices available to them, including a wide choice among funds offered by Fidelity's competitors, and that the fund's shareholders, who have the opportunity to review and weigh the disclosure provided by the fund in its prospectus and other public disclosures, have chosen to invest in this fund, which is part of the Fidelity family of funds.
Nature, Extent, and Quality of Services Provided. The Board considered Fidelity's staffing as it relates to the fund, including the backgrounds of investment personnel of Fidelity, and also considered the fund's investment objective, strategies, and related investment philosophy. The Independent Trustees also had discussions with senior management of Fidelity's investment operations and investment groups. The Board considered the structure of the portfolio manager compensation program and whether this structure provides appropriate incentives to act in the best interests of the fund. Additionally, the Board considered the portfolio managers' investments, if any, in the funds that they manage.
Resources Dedicated to Investment Management and Support Services. The Board and the Fund Oversight and Research Committees reviewed the general qualifications and capabilities of Fidelity's investment staff, including its size, education, experience, and resources, as well as Fidelity's approach to recruiting, training, managing, and compensating investment personnel. The Board noted that Fidelity has continued to increase the resources devoted to non-U.S. offices, including expansion of Fidelity's global investment organization. The Board also noted that Fidelity's analysts have extensive resources, tools and capabilities that allow them to conduct sophisticated quantitative and fundamental analysis, as well as credit analysis of issuers, counterparties and guarantors. Further, the Board considered that Fidelity's investment professionals have sufficient access to global information and data so as to provide competitive investment results over time, and that those professionals also have access to sophisticated tools that permit them to assess portfolio construction and risk and performance attribution characteristics continuously, as well as to transmit new information and research conclusions rapidly around the world. Additionally, in its deliberations, the Board considered Fidelity's trading, risk management, and compliance capabilities and resources, which are integral parts of the investment management process.
Shareholder and Administrative Services. The Board considered (i) the nature, extent, quality, and cost of advisory, administrative, and shareholder services performed by FMR, the sub-advisers (together with FMR, the Investment Advisers), and their affiliates under the Advisory Contracts and under separate agreements covering transfer agency, pricing and bookkeeping, and securities lending services for the fund; (ii) the nature and extent of the supervision of third party service providers, principally custodians and subcustodians; and (iii) the resources devoted to, and the record of compliance with, the fund's compliance policies and procedures. The Board also reviewed the allocation of fund brokerage, including allocations to brokers affiliated with the Investment Advisers, the use of brokerage commissions to pay fund expenses, and the use of "soft" commission dollars to pay for research services.
The Board noted that the growth of fund assets over time across the complex allows Fidelity to reinvest in the development of services designed to enhance the value or convenience of the Fidelity funds as investment vehicles. These services include 24-hour access to account information and market information through telephone representatives and over the Internet, investor education materials and asset allocation tools, and the expanded availability of Fidelity Investor Centers.
In 2014, the Board formed an ad hoc Committee on Transfer Agency Fees to review the variety of transfer agency fee structures throughout the industry and Fidelity's competitive positioning with respect to industry participants.
Investment in a Large Fund Family. The Board considered the benefits to shareholders of investing in a Fidelity fund, including the benefits of investing in a fund that is part of a large family of funds offering a variety of investment disciplines and providing a large variety of mutual fund investor services. The Board noted that Fidelity had taken, or had made recommendations that resulted in the Fidelity funds taking, a number of actions over the previous year that benefited particular funds, including (i) continuing to dedicate additional resources to investment research and to the support of the senior management team that oversees asset management; (ii) continuing efforts to enhance Fidelity's global research capabilities; (iii) launching new funds and making other enhancements to meet client needs; (iv) reducing management fees and total expenses for certain index funds and diversified international funds; (v) continuing to launch dedicated lower cost underlying funds to meet portfolio construction needs related to expanding underlying fund options for Fidelity funds of funds, specifically for the Freedom Fund product lines; (vi) rationalizing product lines and gaining increased efficiencies through fund mergers; (vii) launching active fixed-income exchange-traded funds; (viii) continuing to develop, acquire and implement systems and technology to improve services to the funds and information security and to increase efficiency; (ix) implementing investment enhancements to further strengthen Fidelity's target date product line to increase investors' probability of success in achieving their goals; (x) modifying the eligibility criteria for certain share classes to accommodate roll-over assets from employer-sponsored retirement plans; (xi) launching a new Class W of the Freedom Index Funds to attract and retain Fidelity record-kept retirement plan assets; and (xii) implementing changes to Fidelity's money market product line in response to recent money market regulatory reforms.
Investment Performance. The Board considered whether the fund has operated in accordance with its investment objective, as well as its record of compliance with its investment restrictions and its performance history. The Board noted that there was a portfolio management change for the fund in October 2012.
The Board took into account discussions with representatives of the Investment Advisers about fund investment performance that occur at Board meetings throughout the year. In this regard the Board noted that as part of regularly scheduled fund reviews and other reports to the Board on fund performance, the Board considers annualized return information for the fund, for different time periods, measured against a securities market index ("benchmark index") and a peer group of funds with similar objectives ("peer group"), if any. In its evaluation of fund investment performance, the Board gave particular attention to information indicating changes in performance of certain Fidelity funds for specific time periods and discussed with the Investment Advisers the reasons for any overperformance or underperformance.
In addition to reviewing absolute and relative fund performance, the Independent Trustees periodically consider the appropriateness of fund performance metrics in evaluating the results achieved. In general, the Independent Trustees believe that fund performance should be evaluated based on net performance (after fees and expenses) of both the highest performing and lowest performing fund share classes, where applicable, compared to appropriate benchmark indices, over appropriate time periods that may include full market cycles, and compared to peer groups, as applicable, over the same periods, taking into account relevant factors including the following: general market conditions; issuer-specific information; and fund cash flows and other factors.
The Independent Trustees recognize that shareholders evaluate performance on a net basis over their own holding periods, for which one-, three-, and five-year periods are often used as a proxy. For this reason, the performance information reviewed by the Board also included net cumulative calendar year total return information for the fund and an appropriate benchmark index and peer group for the most recent one-, three-, and five-year periods, as shown below. Returns are shown compared to the 25th percentile (top of box, 75% beaten) and 75th percentile (bottom of box, 25% beaten) of the peer universe.
Fidelity Advisor Emerging Markets Fund
Based on its review, the Board concluded that the nature, extent, and quality of services provided to the fund under the Advisory Contracts should benefit the shareholders of the fund.
Competitiveness of Management Fee and Total Expense Ratio. The Board considered the fund's management fee and total expense ratio compared to "mapped groups" of competitive funds and classes created for the purpose of facilitating the Trustees' competitive analysis of management fees and total expenses. Fidelity creates "mapped groups" by combining similar Lipper investment objective categories that have comparable investment mandates. Combining Lipper investment objective categories aids the Board's management fee and total expense ratio comparisons by broadening the competitive group used for comparison.
Management Fee. The Board considered two proprietary management fee comparisons for the 12-month periods shown in basis points (BP) in the chart below. The group of Lipper funds used by the Board for management fee comparisons is referred to below as the "Total Mapped Group." The Total Mapped Group comparison focuses on a fund's standing in terms of gross management fees before expense reimbursements or caps relative to the total universe of funds with comparable investment mandates, regardless of whether their management fee structures also are comparable. Funds with comparable investment mandates offer exposure to similar types of securities. Funds with comparable management fee structures have similar management fee contractual arrangements (
e.g., flat rate charged for advisory services, all-inclusive fee rate,
etc.). "TMG %" represents the percentage of funds in the Total Mapped Group that had management fees that were lower than the fund's. For example, a hypothetical TMG % of 20% would mean that 80% of the funds in the Total Mapped Group had higher, and 20% had lower, management fees than the fund. The fund's actual TMG %s and the number of funds in the Total Mapped Group are in the chart below. The "Asset-Size Peer Group" (ASPG) comparison focuses on a fund's standing relative to a subset of non-Fidelity funds within the Total Mapped Group that are similar in size and management fee structure without taking into account performance adjustments, if any. For example, if a fund is in the first quartile of the ASPG, the fund's management fee ranks in the least expensive or lowest 25% of funds in the ASPG. The ASPG represents at least 15% of the funds in the Total Mapped Group with comparable asset size and management fee structures, subject to a minimum of 50 funds (or all funds in the Total Mapped Group if fewer than 50). Additional information, such as the ASPG quartile in which the fund's management fee rate ranked, is also included in the chart and considered by the Board.
Fidelity Advisor Emerging Markets Fund
The Board noted that the fund's management fee rate ranked below the median of its Total Mapped Group and below the median of its ASPG for 2014.
The Board noted that, in 2014, the ad hoc Committee on Group Fee was formed by it and other Fidelity fund boards to conduct an in-depth review of the "group fee" component of the management fee of funds with such management fee structures. Committee focus included the mechanics of the group fee, the competitive landscape of group fee structures, Fidelity funds with no group fee component and investment products not included in group fee assets. The Board also considered that, for funds subject to the group fee, FMR agreed to voluntarily waive fees over a specified period of time in amounts designed to account for assets converted from certain funds to certain collective investment trusts.
The Board also noted that, in 2013, the ad hoc Committee on Management Fees was formed to conduct an in-depth review of the management fee rates of Fidelity's active equity mutual funds. The Committee focused on the following areas: (i) standard fee structures; (ii) research consumption and trading evolution; (iii) management fee competitiveness/profitability by category; and (iv) factors that drive institutional pricing.
Based on its review, the Board concluded that the fund's management fee is fair and reasonable in light of the services that the fund receives and the other factors considered.
Total Expense Ratio. In its review of each class's total expense ratio, the Board considered the fund's management fee as well as other fund or class expenses, as applicable, such as transfer agent fees, pricing and bookkeeping fees, fund-paid 12b-1 fees, and custodial, legal, and audit fees. The Board also noted that Fidelity may agree to waive fees and expenses from time to time, and the extent to which, if any, it has done so for the fund. As part of its review, the Board also considered the current and historical total expense ratios of each class of the fund compared to competitive fund median expenses. Each class of the fund is compared to those funds and classes in the Total Mapped Group (used by the Board for management fee comparisons) that have a similar sales load structure.
The Board noted that the total expense ratio of each of Class A, Class B, Class C, Class I, and Class Z ranked below its competitive median for 2014 and the total expense ratio of Class T ranked above its competitive median for 2014. The Board considered that, in general, various factors can affect total expense ratios. The Board noted that the total expense ratio of Class T was above the competitive median primarily because of higher 12b-1 fees on Class T as compared to most competitor funds. Class T has a higher 12b-1 fee, but a lower front-end sales charge, than traditionally priced front-end sales charge classes. The Board considered that Class T is primarily sold load-waived in the retirement plan market where its 0.50% 12b-1 fee is comparable to competing no-load, higher 12b-1 fee classes designed specifically for retirement plans. The Board noted that the fund offers multiple classes, each of which has a different sales load and 12b-1 fee structure, and that the multiple structures are intended to offer a range of pricing options for the intermediary market. The Board also noted that the total expense ratios of the classes vary primarily by the level of their 12b-1 fees, although differences in transfer agent fees may also cause expenses to vary from class to class.
Fees Charged to Other Fidelity Clients. The Board also considered Fidelity fee structures and other information with respect to clients of Fidelity, such as other funds advised or subadvised by Fidelity, pension plan clients, and other institutional clients with similar mandates. The Board noted the findings of the 2013 ad hoc joint committee (created with the board of other Fidelity funds), which reviewed and compared Fidelity's institutional investment advisory business with its business of providing services to the Fidelity funds, including the differences in services provided, fees charged, and costs incurred, as well as competition in their respective marketplaces.
Based on its review of total expense ratios and fees charged to other Fidelity clients, the Board concluded that, although Class T was above the median of the universe presented for comparison, the total expense ratio of each class of the fund was reasonable in light of the services that the fund and its shareholders receive and the other factors considered.
Costs of the Services and Profitability. The Board considered the revenues earned and the expenses incurred by Fidelity in conducting the business of developing, marketing, distributing, managing, administering and servicing the fund and servicing the fund's shareholders. The Board also considered the level of Fidelity's profits in respect of all the Fidelity funds.
On an annual basis, Fidelity presents to the Board information about the profitability of its relationship with the fund. Fidelity calculates profitability information for each fund, as well as aggregate profitability information for groups of Fidelity funds and all Fidelity funds, using a series of detailed revenue and cost allocation methodologies which originate with the books and records of Fidelity on which Fidelity's audited financial statements are based. The Audit Committee of the Board reviews any significant changes from the prior year's methodologies.
PricewaterhouseCoopers LLP (PwC), independent registered public accounting firm and auditor to Fidelity and certain Fidelity funds, has been engaged annually by the Board as part of the Board's assessment of Fidelity's profitability analysis. PwC's engagement includes the review and assessment of the methodologies used by Fidelity in determining the revenues and expenses attributable to Fidelity's mutual fund business, and completion of agreed-upon procedures in respect of the mathematical accuracy of fund profitability and its conformity to established allocation methodologies. After considering PwC's reports issued under the engagement and information provided by Fidelity, the Board concluded that while other allocation methods may also be reasonable, Fidelity's profitability methodologies are reasonable in all material respects.
The Board also reviewed Fidelity's non-fund businesses and fall-out benefits related to the mutual fund business as well as cases where Fidelity's affiliates may benefit from or be related to the fund's business.
The Board considered the costs of the services provided by and the profits realized by Fidelity in connection with the operation of the fund and was satisfied that the profitability was not excessive.
Economies of Scale. The Board considered whether there have been economies of scale in respect of the management of the Fidelity funds, whether the Fidelity funds (including the fund) have appropriately benefited from any such economies of scale, and whether there is potential for realization of any further economies of scale. The Board considered the extent to which the fund will benefit from economies of scale as assets grow through increased services to the fund, through waivers or reimbursements, or through fee or expense ratio reductions. The Board also noted that in 2013, it and the boards of other Fidelity funds created an ad hoc committee (the Economies of Scale Committee) to analyze whether Fidelity attains economies of scale in respect of the management and servicing of the Fidelity funds, whether the Fidelity funds have appropriately benefited from such economies of scale, and whether there is potential for realization of any further economies of scale.
The Board recognized that the fund's management contract incorporates a "group fee" structure, which provides for lower group fee rates as total group assets increase, and for higher group fee rates as total group assets decrease (with "group assets" defined to include fund assets under FMR's management plus sector fund assets previously under FMR's management and currently managed by Fidelity SelectCo, LLC). FMR calculates the group fee rates based on a tiered asset "breakpoint" schedule that varies based on asset class. The Board considered that the group fee is designed to deliver the benefits of economies of scale to fund shareholders when total Fidelity fund assets increase, even if assets of any particular fund are unchanged or have declined, because some portion of Fidelity's costs are attributable to services provided to all Fidelity funds, and all funds benefit if those costs can be allocated among more assets. The Board concluded that, given the group fee structure, fund shareholders will benefit from lower management fees as group assets increase at the fund complex level, regardless of whether Fidelity achieves any such economies of scale.
The Board concluded, taking into account the analysis of the Economies of Scale Committee, that economies of scale, if any, are being appropriately shared between fund shareholders and Fidelity.
Additional Information Requested by the Board. In order to develop fully the factual basis for consideration of the Fidelity funds' Advisory Contracts, the Board requested and received additional information on certain topics, including: (i) fund performance trends and Fidelity's long-term strategies for certain funds; (ii) the various share classes employed by Fidelity and the attributes of each class, together with similar information on the distribution and servicing payments made by Fidelity or the funds to third-party participants in the distribution channels; (iii) fund profitability, and fund performance in relation to fund profitability; (iv) the methodology with respect to evaluating competitive fund data and peer group classifications and fee comparisons; (v) annual fund profitability margins, with particular focus on certain funds with negative margins; (vi) the realization of fall-out benefits in certain Fidelity business units;
(vii) economies of scale and the way in which they are shared with fund shareholders;(viii) Fidelity's group fee structures, including the group fee schedule of breakpoints;(ix) the impact of cost containment measures on the funds; and (x) the transfer agent fee structure.
Based on its evaluation of all of the conclusions noted above, and after considering all factors it believed relevant, the Board concluded that the advisory fee structures are fair and reasonable, and that the fund's Advisory Contracts should be renewed.
FAEMI-ANN-1215
1.809300.111
Fidelity Advisor® Emerging Markets Fund Class Z
Annual Report October 31, 2015 |
|
Contents
To view a fund's proxy voting guidelines and proxy voting record for the 12-month period ended June 30, visit http://www.fidelity.com/proxyvotingresults or visit the Securities and Exchange Commission's (SEC) web site at http://www.sec.gov.
You may also call 1-877-208-0098 to request a free copy of the proxy voting guidelines.
Standard & Poor's, S&P and S&P 500 are registered service marks of The McGraw-Hill Companies, Inc. and have been licensed for use by Fidelity Distributors Corporation.
Other third-party marks appearing herein are the property of their respective owners.
All other marks appearing herein are registered or unregistered trademarks or service marks of FMR LLC or an affiliated company. © 2015 FMR LLC. All rights reserved.
This report and the financial statements contained herein are submitted for the general information of the shareholders of the Fund. This report is not authorized for distribution to prospective investors in the Fund unless preceded or accompanied by an effective prospectus.
A fund files its complete schedule of portfolio holdings with the SEC for the first and third quarters of each fiscal year on Form N-Q. Forms N-Q are available on the SEC’s web site at http://www.sec.gov. A fund's Forms N-Q may be reviewed and copied at the SEC’s Public Reference Room in Washington, DC. Information regarding the operation of the SEC's Public Reference Room may be obtained by calling 1-800-SEC-0330.
For a complete list of a fund's portfolio holdings, view the most recent holdings listing, semiannual report, or annual report on Fidelity's web site at http://www.fidelity.com, http://www.advisor.fidelity.com, or http://www.401k.com, as applicable.
NOT FDIC INSURED •MAY LOSE VALUE •NO BANK GUARANTEE
Neither the Fund nor Fidelity Distributors Corporation is a bank.
Performance: The Bottom Line
Average annual total return reflects the change in the value of an investment, assuming reinvestment of distributions from dividend income and capital gains (the profits earned upon the sale of securities that have grown in value, if any) and assuming a constant rate of performance each year.
The hypothetical investment and the average annual total returns do not reflect the deduction of taxes that a shareholder would pay on fund distributions or the redemption of fund shares.
During periods of reimbursement by Fidelity, a fund’s total return will be greater than it would be had the reimbursement not occurred.
How a fund did yesterday is no guarantee of how it will do tomorrow.
Average Annual Total Returns
| For the periods ended October 31, 2015 | Past 1 year | Past 5 years | Past 10 years |
| Class Z | (10.68)% | (1.64)% | 5.50% |
The initial offering of Class Z shares took place on August 13, 2013. Returns prior to August 13, 2013, are those of Class I.
$10,000 Over 10 Years
Let's say hypothetically that $10,000 was invested in Fidelity Advisor® Emerging Markets Fund - Class Z on October 31, 2005.
The chart shows how the value of your investment would have changed, and also shows how the MSCI Emerging Markets Index performed over the same period.
See above for additional information regarding the performance of Class Z.

| Period Ending Values |
| $17,078 | Fidelity Advisor® Emerging Markets Fund - Class Z |
| $17,967 | MSCI Emerging Markets Index |
Management's Discussion of Fund Performance
Market Recap: International equities suffered a moderate setback for the 12 months ending October 31, 2015, held back by a collapse in commodities prices that hurt resources-related sectors and geographies. The MSCI ACWI (All Country World Index) ex USA Index returned -4.55% for the period, affected also by concerns about global economic growth. Commodity producers remained under pressure for much of the past year, largely related to economic deceleration in China (-1%), the world’s second-largest economy and a leading consumer of raw materials. This effect was exacerbated by U.S. dollar strength relative to global currencies, which weighed on commodities priced in dollars and acutely impacted equity returns within regions most exposed to resources prices. The emerging-markets group, for example, returned about -15% this period. Canada, a significant energy producer, returned roughly -17%. Net energy consumer Japan (+9%) was the best-performing region by far. Only about a quarter of the nearly 50 index countries managed a gain this period: Ireland (+19%) – the EU’s fastest-growing economy – and Israel (+17%) proved top performers; Greece (-56%) and Brazil (-46%), among the worst. As for sectors, energy (-25%) and materials (-16%) declined sharply, whereas the two consumer sectors each gained about 6%.
Comments from Portfolio Manager Sammy Simnegar: For the year, the fund’s share classes (excluding sales charges, if applicable) recorded low-double-digit declines, handily topping the -14.22% return of the benchmark MSCI Emerging Markets Index. Versus the benchmark, sector and industry positioning – especially a sizable underweighting in energy – drove the fund, with stock selection also adding value. Geographically, non-benchmark exposure to the U.S. helped, as did positioning in India and picks in Mexico. The fund’s top relative contributor was Brazil-based oil producer Petroleo Brasileiro. This weak-performing index name helped our relative results because the fund didn’t own it, as did Brazilian metals miner Vale, also an index stock. Two other contributors – both out-of-benchmark positions established during the period – were health care holdings China Biologic Products and Jiangsu Hengrui Medicine. Conversely, stock selection in consumer discretionary detracted most. Underweighting China was a negative, along with stock picking in Russia. The fund’s first- and fourth-biggest relative detractors were China Life Insurance and Ping An Insurance Group. In both cases, the fund didn’t own the stock early on, but we built positions later. Overweighting Brazil-based Kroton Educacional, the world’s largest for-profit operator of colleges, also hurt.
The views expressed above reflect those of the portfolio manager(s) only through the end of the period as stated on the cover of this report and do not necessarily represent the views of Fidelity or any other person in the Fidelity organization. Any such views are subject to change at any time based upon market or other conditions and Fidelity disclaims any responsibility to update such views. These views may not be relied on as investment advice and, because investment decisions for a Fidelity fund are based on numerous factors, may not be relied on as an indication of trading intent on behalf of any Fidelity fund.
Investment Summary (Unaudited)
Top Five Stocks as of October 31, 2015
| | % of fund's net assets | % of fund's net assets 6 months ago |
| Samsung Electronics Co. Ltd. (Korea (South), Technology Hardware, Storage & Peripherals) | 4.5 | 4.4 |
| Taiwan Semiconductor Manufacturing Co. Ltd. (Taiwan, Semiconductors & Semiconductor Equipment) | 3.4 | 3.4 |
| Tencent Holdings Ltd. (Cayman Islands, Internet Software & Services) | 3.3 | 3.1 |
| Naspers Ltd. Class N (South Africa, Media) | 2.2 | 2.0 |
| Ping An Insurance (Group) Co. of China Ltd. (H Shares) (China, Insurance) | 1.4 | 0.0 |
| | 14.8 | |
Top Five Market Sectors as of October 31, 2015
| | % of fund's net assets | % of fund's net assets 6 months ago |
| Information Technology | 23.4 | 22.2 |
| Financials | 19.8 | 23.6 |
| Consumer Discretionary | 18.3 | 16.5 |
| Industrials | 11.2 | 11.3 |
| Consumer Staples | 8.8 | 7.5 |
Top Five Countries as of October 31, 2015
| (excluding cash equivalents) | % of fund's net assets | % of fund's net assets 6 months ago |
| India | 10.6 | 9.9 |
| Korea (South) | 8.7 | 5.7 |
| United States of America | 8.4 | 6.6 |
| China | 8.0 | 7.1 |
| Cayman Islands | 7.7 | 6.9 |
Asset Allocation (% of fund's net assets)
| As of October 31, 2015 |
| | Stocks | 99.9% |
| | Short-Term Investments and Net Other Assets (Liabilities) | 0.1% |

| As of April 30, 2015 |
| | Stocks | 99.2% |
| | Short-Term Investments and Net Other Assets (Liabilities) | 0.8% |

Percentages shown as 0.0% may reflect amounts less than 0.05%.
Investments October 31, 2015
Showing Percentage of Net Assets
| Common Stocks - 98.8% | | | |
| | | Shares | Value |
| Australia - 0.9% | | | |
| Amcor Ltd. | | 180,393 | $1,742,382 |
| Sydney Airport unit | | 450,846 | 2,060,415 |
|
| TOTAL AUSTRALIA | | | 3,802,797 |
|
| Bailiwick of Jersey - 0.4% | | | |
| Integrated Diagnostics Holdings PLC (a) | | 332,800 | 1,833,728 |
| Bermuda - 2.2% | | | |
| China Gas Holdings Ltd. | | 1,409,000 | 2,242,448 |
| China Resource Gas Group Ltd. | | 712,000 | 1,953,048 |
| Credicorp Ltd. (United States) | | 25,014 | 2,831,085 |
| PAX Global Technology Ltd. | | 1,745,000 | 2,281,869 |
|
| TOTAL BERMUDA | | | 9,308,450 |
|
| Brazil - 5.3% | | | |
| BB Seguridade Participacoes SA | | 368,200 | 2,539,607 |
| Brasil Foods SA | | 210,100 | 3,274,173 |
| Cetip SA - Mercados Organizado | | 231,000 | 2,042,525 |
| Cielo SA | | 292,472 | 2,776,419 |
| FPC Par Corretora de Seguros | | 178,400 | 499,134 |
| Kroton Educacional SA | | 1,015,900 | 2,597,341 |
| Qualicorp SA | | 563,800 | 2,368,324 |
| Smiles SA | | 229,300 | 1,789,664 |
| Ultrapar Participacoes SA | | 146,300 | 2,541,676 |
| Weg SA | | 525,830 | 1,963,400 |
|
| TOTAL BRAZIL | | | 22,392,263 |
|
| British Virgin Islands - 0.5% | | | |
| Mail.Ru Group Ltd. GDR (Reg. S) (a) | | 105,900 | 2,065,050 |
| Cayman Islands - 7.7% | | | |
| Alibaba Group Holding Ltd. sponsored ADR (a) | | 32,700 | 2,741,241 |
| ENN Energy Holdings Ltd. | | 432,000 | 2,474,774 |
| Fu Shou Yuan International Group Ltd. | | 2,700,000 | 1,840,953 |
| Hengan International Group Co. Ltd. | | 276,500 | 2,985,766 |
| Shenzhou International Group Holdings Ltd. | | 451,000 | 2,222,515 |
| Sino Biopharmaceutical Ltd. | | 1,840,000 | 2,286,569 |
| TAL Education Group ADR (a) | | 57,400 | 2,207,030 |
| Tencent Holdings Ltd. | | 730,100 | 13,761,931 |
| Vipshop Holdings Ltd. ADR (a)(b) | | 104,000 | 2,134,080 |
|
| TOTAL CAYMAN ISLANDS | | | 32,654,859 |
|
| China - 8.0% | | | |
| Beijing Capital International Airport Co. Ltd. (H Shares) | | 2,142,000 | 2,292,688 |
| China Life Insurance Co. Ltd. (H Shares) | | 686,000 | 2,473,774 |
| China Pacific Insurance (Group) Co. Ltd. (H Shares) | | 907,800 | 3,616,127 |
| Fuyao Glass Industries Group Co. Ltd. (a) | | 837,600 | 1,790,638 |
| Inner Mongoli Yili Industries Co. Ltd. | | 798,200 | 2,007,778 |
| Jiangsu Hengrui Medicine Co. Ltd. | | 276,860 | 2,297,100 |
| Kweichow Moutai Co. Ltd. | | 68,010 | 2,296,275 |
| PICC Property & Casualty Co. Ltd. (H Shares) | | 1,319,825 | 2,994,776 |
| Ping An Insurance (Group) Co. of China Ltd. (H Shares) | | 1,039,000 | 5,832,167 |
| Shanghai International Airport Co. Ltd. | | 475,700 | 2,269,275 |
| Weifu High-Technology Co. Ltd. (B Shares) | | 609,955 | 1,555,130 |
| Zhengzhou Yutong Bus Co. Ltd. | | 634,507 | 2,185,433 |
| Zhuzhou CSR Times Electric Co. Ltd. (H Shares) | | 351,000 | 2,272,179 |
|
| TOTAL CHINA | | | 33,883,340 |
|
| Denmark - 0.5% | | | |
| Novo Nordisk A/S Series B sponsored ADR | | 36,600 | 1,946,388 |
| Egypt - 0.6% | | | |
| Commercial International Bank SAE sponsored GDR | | 407,300 | 2,382,705 |
| France - 0.9% | | | |
| LVMH Moet Hennessy - Louis Vuitton SA | | 10,684 | 1,989,034 |
| Safran SA | | 24,900 | 1,891,256 |
|
| TOTAL FRANCE | | | 3,880,290 |
|
| Germany - 1.0% | | | |
| Bayer AG | | 14,200 | 1,894,884 |
| Wirecard AG | | 41,000 | 2,119,251 |
|
| TOTAL GERMANY | | | 4,014,135 |
|
| Hong Kong - 2.0% | | | |
| AIA Group Ltd. | | 353,000 | 2,069,756 |
| CSPC Pharmaceutical Group Ltd. | | 2,356,000 | 2,193,545 |
| Guangdong Investment Ltd. | | 1,548,000 | 2,177,047 |
| Techtronic Industries Co. Ltd. | | 553,500 | 2,023,417 |
|
| TOTAL HONG KONG | | | 8,463,765 |
|
| India - 10.6% | | | |
| Adani Ports & Special Economic Zone (a) | | 486,623 | 2,197,146 |
| Amara Raja Batteries Ltd. (a) | | 133,250 | 1,837,035 |
| Asian Paints India Ltd. | | 181,441 | 2,299,413 |
| Axis Bank Ltd. (a) | | 244,595 | 1,771,476 |
| Bharti Infratel Ltd. (a) | | 363,529 | 2,159,115 |
| Colgate-Palmolive (India) | | 121,884 | 1,776,806 |
| Exide Industries Ltd. (a) | | 757,787 | 1,728,758 |
| HCL Technologies Ltd. | | 229,234 | 3,051,158 |
| HDFC Bank Ltd. (a) | | 117,154 | 2,349,719 |
| Housing Development Finance Corp. Ltd. | | 284,796 | 5,455,293 |
| IndusInd Bank Ltd. | | 132,634 | 1,845,416 |
| LIC Housing Finance Ltd. (a) | | 281,237 | 2,053,453 |
| Lupin Ltd. | | 86,558 | 2,548,561 |
| Maruti Suzuki India Ltd. (a) | | 28,011 | 1,905,124 |
| Sun Pharmaceutical Industries Ltd. | | 259,412 | 3,525,178 |
| Tata Consultancy Services Ltd. | | 110,026 | 4,191,986 |
| Titan Co. Ltd. (a) | | 373,375 | 2,025,545 |
| Zee Entertainment Enterprises Ltd. | | 337,629 | 2,104,113 |
|
| TOTAL INDIA | | | 44,825,295 |
|
| Indonesia - 4.0% | | | |
| PT ACE Hardware Indonesia Tbk | | 44,531,500 | 2,167,869 |
| PT Bank Central Asia Tbk | | 3,645,200 | 3,424,400 |
| PT Bank Rakyat Indonesia Tbk | | 4,165,600 | 3,188,167 |
| PT Matahari Department Store Tbk | | 1,850,000 | 2,227,377 |
| PT Media Nusantara Citra Tbk | | 14,633,500 | 1,898,715 |
| PT Surya Citra Media Tbk | | 9,453,700 | 2,010,366 |
| PT Tower Bersama Infrastructure Tbk (a) | | 4,087,900 | 2,129,018 |
|
| TOTAL INDONESIA | | | 17,045,912 |
|
| Isle of Man - 0.5% | | | |
| Playtech Ltd. | | 162,735 | 2,147,467 |
| Israel - 0.9% | | | |
| Check Point Software Technologies Ltd. (a) | | 23,200 | 1,970,608 |
| Teva Pharmaceutical Industries Ltd. sponsored ADR | | 31,000 | 1,834,890 |
|
| TOTAL ISRAEL | | | 3,805,498 |
|
| Kenya - 0.5% | | | |
| Safaricom Ltd. | | 13,596,400 | 1,911,890 |
| Korea (South) - 8.7% | | | |
| AMOREPACIFIC Corp. | | 10,132 | 3,349,913 |
| Coway Co. Ltd. | | 29,003 | 2,164,232 |
| KEPCO Plant Service & Engineering Co. Ltd. | | 22,189 | 2,021,122 |
| LG Chemical Ltd. | | 12,994 | 3,465,385 |
| LG Household & Health Care Ltd. | | 3,672 | 3,045,608 |
| NAVER Corp. | | 6,870 | 3,610,184 |
| Samsung Electronics Co. Ltd. | | 15,916 | 19,125,355 |
|
| TOTAL KOREA (SOUTH) | | | 36,781,799 |
|
| Luxembourg - 0.9% | | | |
| Eurofins Scientific SA | | 5,800 | 2,099,947 |
| Samsonite International SA | | 642,100 | 1,896,274 |
|
| TOTAL LUXEMBOURG | | | 3,996,221 |
|
| Mexico - 6.8% | | | |
| Banregio Grupo Financiero S.A.B. de CV | | 307,766 | 1,660,332 |
| Fomento Economico Mexicano S.A.B. de CV unit | | 431,100 | 4,258,593 |
| Gruma S.A.B. de CV Series B | | 150,900 | 2,328,664 |
| Grupo Aeroportuario del Pacifico SA de CV Series B | | 244,221 | 2,199,612 |
| Grupo Aeroportuario del Sureste SA de CV Series B | | 148,550 | 2,300,673 |
| Grupo Aeroportuario Norte S.A.B. de CV | | 377,500 | 1,941,687 |
| Grupo Financiero Banorte S.A.B. de CV Series O | | 677,500 | 3,648,405 |
| Grupo GICSA SA de CV (a) | | 1,898,500 | 1,850,479 |
| Infraestructura Energetica Nova S.A.B. de CV | | 385,800 | 1,860,355 |
| Megacable Holdings S.A.B. de CV unit | | 541,984 | 2,065,523 |
| Promotora y Operadora de Infraestructura S.A.B. de CV (a) | | 191,800 | 2,404,902 |
| Tenedora Nemak SA de CV (a) | | 1,564,200 | 2,262,331 |
|
| TOTAL MEXICO | | | 28,781,556 |
|
| Netherlands - 0.5% | | | |
| Hangzhou Hikvision Digital Technology Co. Ltd. ELS (BNP Paribas Arbitrage Warrant Program) warrants 10/21/16(a) | | 350,500 | 1,909,216 |
| Philippines - 4.1% | | | |
| Ayala Corp. | | 133,440 | 2,222,302 |
| GT Capital Holdings, Inc. | | 72,535 | 2,035,503 |
| International Container Terminal Services, Inc. | | 1,233,590 | 2,174,900 |
| Jollibee Food Corp. | | 469,280 | 2,062,535 |
| Robinsons Land Corp. | | 3,094,300 | 2,022,753 |
| SM Investments Corp. | | 117,296 | 2,189,814 |
| SM Prime Holdings, Inc. | | 4,996,100 | 2,300,459 |
| Universal Robina Corp. | | 527,740 | 2,261,339 |
|
| TOTAL PHILIPPINES | | | 17,269,605 |
|
| Russia - 0.8% | | | |
| Magnit OJSC (a) | | 18,189 | 3,172,942 |
| South Africa - 7.4% | | | |
| Aspen Pharmacare Holdings Ltd. | | 119,593 | 2,685,938 |
| Bidvest Group Ltd. | | 107,615 | 2,752,779 |
| Discovery Ltd. | | 219,462 | 2,347,018 |
| FirstRand Ltd. | | 906,400 | 3,326,545 |
| Mr Price Group Ltd. | | 149,200 | 2,290,989 |
| Naspers Ltd. Class N | | 62,500 | 9,154,383 |
| Sanlam Ltd. | | 634,300 | 2,865,595 |
| Steinhoff International Holdings Ltd. | | 548,400 | 3,356,815 |
| Woolworths Holdings Ltd. | | 353,500 | 2,618,746 |
|
| TOTAL SOUTH AFRICA | | | 31,398,808 |
|
| Spain - 0.5% | | | |
| Amadeus IT Holding SA Class A | | 46,600 | 1,986,205 |
| Switzerland - 0.9% | | | |
| Compagnie Financiere Richemont SA Series A | | 23,737 | 2,035,390 |
| Sika AG (Bearer) | | 500 | 1,640,953 |
|
| TOTAL SWITZERLAND | | | 3,676,343 |
|
| Taiwan - 6.8% | | | |
| Advantech Co. Ltd. | | 291,000 | 2,092,977 |
| Catcher Technology Co. Ltd. | | 260,000 | 2,562,760 |
| ECLAT Textile Co. Ltd. | | 147,000 | 2,168,890 |
| Giant Manufacturing Co. Ltd. | | 263,000 | 1,988,803 |
| Largan Precision Co. Ltd. | | 41,000 | 3,201,448 |
| Merida Industry Co. Ltd. | | 351,650 | 2,063,432 |
| Taiwan Semiconductor Manufacturing Co. Ltd. | | 3,424,000 | 14,426,936 |
|
| TOTAL TAIWAN | | | 28,505,246 |
|
| Thailand - 1.5% | | | |
| Airports of Thailand PCL (For. Reg.) | | 294,900 | 2,465,082 |
| Bangkok Dusit Medical Services PCL (For. Reg.) | | 3,609,300 | 1,924,502 |
| Thai Beverage PCL | | 3,765,700 | 1,810,807 |
|
| TOTAL THAILAND | | | 6,200,391 |
|
| Turkey - 2.1% | | | |
| Koc Holding A/S | | 525,000 | 2,371,099 |
| TAV Havalimanlari Holding A/S | | 280,000 | 2,199,355 |
| Tofas Turk Otomobil Fabrikasi A/S | | 286,544 | 1,892,012 |
| Tupras Turkiye Petrol Rafinelleri A/S (a) | | 84,000 | 2,218,563 |
|
| TOTAL TURKEY | | | 8,681,029 |
|
| United Arab Emirates - 1.0% | | | |
| DP World Ltd. | | 112,015 | 2,263,823 |
| First Gulf Bank PJSC | | 596,553 | 2,005,834 |
|
| TOTAL UNITED ARAB EMIRATES | | | 4,269,657 |
|
| United Kingdom - 1.9% | | | |
| Al Noor Hospitals Group PLC | | 9,684 | 175,563 |
| InterContinental Hotel Group PLC | | 49,000 | 1,958,013 |
| Mondi PLC | | 103,900 | 2,408,990 |
| NMC Health PLC | | 135,000 | 1,585,844 |
| Prudential PLC | | 85,639 | 2,000,227 |
|
| TOTAL UNITED KINGDOM | | | 8,128,637 |
|
| United States of America - 8.4% | | | |
| A.O. Smith Corp. | | 28,300 | 2,174,006 |
| Alphabet, Inc. Class C | | 3,260 | 2,317,241 |
| Apple, Inc. | | 18,300 | 2,186,850 |
| China Biologic Products, Inc. (a) | | 21,400 | 2,438,316 |
| Cognizant Technology Solutions Corp. Class A (a) | | 29,100 | 1,982,001 |
| Ecolab, Inc. | | 16,670 | 2,006,235 |
| Facebook, Inc. Class A (a) | | 17,500 | 1,784,475 |
| International Flavors & Fragrances, Inc. | | 17,000 | 1,973,020 |
| MasterCard, Inc. Class A | | 20,200 | 1,999,598 |
| McGraw Hill Financial, Inc. | | 22,000 | 2,038,080 |
| MercadoLibre, Inc. (b) | | 20,500 | 2,016,585 |
| Mettler-Toledo International, Inc. (a) | | 6,800 | 2,114,732 |
| Moody's Corp. | | 21,000 | 2,019,360 |
| NIKE, Inc. Class B | | 14,200 | 1,860,626 |
| PPG Industries, Inc. | | 20,100 | 2,095,626 |
| Sherwin-Williams Co. | | 8,400 | 2,241,372 |
| Visa, Inc. Class A | | 26,300 | 2,040,354 |
|
| TOTAL UNITED STATES OF AMERICA | | | 35,288,477 |
|
| TOTAL COMMON STOCKS | | | |
| (Cost $402,424,098) | | | 416,409,964 |
|
| Nonconvertible Preferred Stocks - 1.1% | | | |
| Brazil - 1.1% | | | |
| Ambev SA sponsored ADR | | | |
| (Cost $7,259,887) | | 896,480 | 4,365,858 |
|
| Money Market Funds - 1.4% | | | |
| Fidelity Cash Central Fund, 0.18% (c) | | 1,852,843 | 1,852,843 |
| Fidelity Securities Lending Cash Central Fund, 0.19% (c)(d) | | 4,184,150 | 4,184,150 |
| TOTAL MONEY MARKET FUNDS | | | |
| (Cost $6,036,993) | | | 6,036,993 |
| TOTAL INVESTMENT PORTFOLIO - 101.3% | | | |
| (Cost $415,720,978) | | | 426,812,815 |
| NET OTHER ASSETS (LIABILITIES) - (1.3)% | | | (5,282,032) |
| NET ASSETS - 100% | | | $421,530,783 |
Security Type Abbreviations
ELS – Equity-Linked Security
Categorizations in the Schedule of Investments are based on country or territory of incorporation.
Legend
(a) Non-income producing
(b) Security or a portion of the security is on loan at period end.
(c) Affiliated fund that is generally available only to investment companies and other accounts managed by Fidelity Investments. The rate quoted is the annualized seven-day yield of the fund at period end. A complete unaudited listing of the fund's holdings as of its most recent quarter end is available upon request. In addition, each Fidelity Central Fund's financial statements , which are not covered by the Fund's Report of Independent Registered Public Accounting Firm, are available on the SEC's website or upon request.
(d) Investment made with cash collateral received from securities on loan.
Affiliated Central Funds
Information regarding fiscal year to date income earned by the Fund from investments in Fidelity Central Funds is as follows:
| Fund | Income earned |
| Fidelity Cash Central Fund | $7,486 |
| Fidelity Securities Lending Cash Central Fund | 62,534 |
| Total | $70,020 |
Investment Valuation
The following is a summary of the inputs used, as of October 31, 2015, involving the Fund's assets and liabilities carried at fair value. The inputs or methodology used for valuing securities may not be an indication of the risk associated with investing in those securities. For more information on valuation inputs, and their aggregation into the levels used below, please refer to the Investment Valuation section in the accompanying Notes to Financial Statements.
| | Valuation Inputs at Reporting Date: |
| Description | Total | Level 1 | Level 2 | Level 3 |
| Investments in Securities: | | | | |
| Equities: | | | | |
| Consumer Discretionary | $78,056,663 | $42,614,897 | $35,441,766 | $-- |
| Consumer Staples | 36,934,522 | 23,795,751 | 13,138,771 | -- |
| Energy | 4,760,239 | 4,760,239 | -- | -- |
| Financials | 81,621,688 | 29,191,109 | 52,430,579 | -- |
| Health Care | 35,754,009 | 20,978,554 | 14,775,455 | -- |
| Industrials | 48,427,681 | 22,221,359 | 26,206,322 | -- |
| Information Technology | 98,439,949 | 60,726,069 | 37,713,880 | -- |
| Materials | 19,873,376 | 15,831,581 | 4,041,795 | -- |
| Telecommunication Services | 6,200,023 | 1,911,890 | 4,288,133 | -- |
| Utilities | 10,707,672 | 1,860,355 | 8,847,317 | -- |
| Money Market Funds | 6,036,993 | 6,036,993 | -- | -- |
| Total Investments in Securities: | $426,812,815 | $229,928,797 | $196,884,018 | $-- |
The following is a summary of transfers between Level 1 and Level 2 for the period ended October 31, 2015. Transfers are assumed to have occurred at the beginning of the period, and are primarily attributable to the valuation techniques used for foreign equity securities, as discussed in the accompanying Notes to Financial Statements:
| Transfers | Total |
| Level 1 to Level 2 | $9,426,806 |
| Level 2 to Level 1 | $4,142,908 |
See accompanying notes which are an integral part of the financial statements.
Financial Statements
Statement of Assets and Liabilities
| | | October 31, 2015 |
| Assets | | |
Investment in securities, at value (including securities loaned of $4,156,038) — See accompanying schedule:
Unaffiliated issuers (cost $409,683,985) | $420,775,822 | |
| Fidelity Central Funds (cost $6,036,993) | 6,036,993 | |
| Total Investments (cost $415,720,978) | | $426,812,815 |
| Foreign currency held at value (cost $1,833,612) | | 1,835,136 |
| Receivable for investments sold | | 4,069,475 |
| Receivable for fund shares sold | | 212,639 |
| Dividends receivable | | 316,628 |
| Distributions receivable from Fidelity Central Funds | | 1,245 |
| Prepaid expenses | | 1,189 |
| Other receivables | | 68,322 |
| Total assets | | 433,317,449 |
| Liabilities | | |
| Payable to custodian bank | $36,823 | |
| Payable for investments purchased | 6,403,961 | |
| Payable for fund shares redeemed | 385,700 | |
| Accrued management fee | 279,207 | |
| Distribution and service plan fees payable | 82,914 | |
| Other affiliated payables | 99,023 | |
| Other payables and accrued expenses | 314,888 | |
| Collateral on securities loaned, at value | 4,184,150 | |
| Total liabilities | | 11,786,666 |
| Net Assets | | $421,530,783 |
| Net Assets consist of: | | |
| Paid in capital | | $471,344,430 |
| Undistributed net investment income | | 362,723 |
| Accumulated undistributed net realized gain (loss) on investments and foreign currency transactions | | (61,112,393) |
| Net unrealized appreciation (depreciation) on investments and assets and liabilities in foreign currencies | | 10,936,023 |
| Net Assets | | $421,530,783 |
| Calculation of Maximum Offering Price | | |
| Class A: | | |
| Net Asset Value and redemption price per share ($112,931,186 ÷ 5,447,364 shares) | | $20.73 |
| Maximum offering price per share (100/94.25 of $20.73) | | $21.99 |
| Class T: | | |
| Net Asset Value and redemption price per share ($43,364,934 ÷ 2,099,591 shares) | | $20.65 |
| Maximum offering price per share (100/96.50 of $20.65) | | $21.40 |
| Class B: | | |
| Net Asset Value and offering price per share ($3,255,132 ÷ 162,201 shares)(a) | | $20.07 |
| Class C: | | |
| Net Asset Value and offering price per share ($46,595,439 ÷ 2,327,093 shares)(a) | | $20.02 |
| Class I: | | |
| Net Asset Value, offering price and redemption price per share ($209,270,492 ÷ 10,045,868 shares) | | $20.83 |
| Class Z: | | |
| Net Asset Value, offering price and redemption price per share ($6,113,600 ÷ 293,490 shares) | | $20.83 |
(a) Redemption price per share is equal to net asset value less any applicable contingent deferred sales charge.
See accompanying notes which are an integral part of the financial statements.
Statement of Operations
| | | Year ended October 31, 2015 |
| Investment Income | | |
| Dividends | | $8,704,210 |
| Income from Fidelity Central Funds | | 70,020 |
| Income before foreign taxes withheld | | 8,774,230 |
| Less foreign taxes withheld | | (810,613) |
| Total income | | 7,963,617 |
| Expenses | | |
| Management fee | $3,566,825 | |
| Transfer agent fees | 1,124,739 | |
| Distribution and service plan fees | 1,175,651 | |
| Accounting and security lending fees | 232,505 | |
| Custodian fees and expenses | 353,863 | |
| Independent trustees' compensation | 1,909 | |
| Registration fees | 88,022 | |
| Audit | 85,683 | |
| Legal | 1,155 | |
| Interest | 205 | |
| Miscellaneous | 3,088 | |
| Total expenses before reductions | 6,633,645 | |
| Expense reductions | (71,051) | 6,562,594 |
| Net investment income (loss) | | 1,401,023 |
| Realized and Unrealized Gain (Loss) | | |
| Net realized gain (loss) on: | | |
| Investment securities: | | |
| Unaffiliated issuers (net of foreign taxes of $386,530) | (12,124,773) | |
| Foreign currency transactions | (297,899) | |
| Total net realized gain (loss) | | (12,422,672) |
Change in net unrealized appreciation (depreciation) on:
Investment securities (net of decrease in deferred foreign taxes of $441,453) | (41,632,461) | |
| Assets and liabilities in foreign currencies | (11,315) | |
| Total change in net unrealized appreciation (depreciation) | | (41,643,776) |
| Net gain (loss) | | (54,066,448) |
| Net increase (decrease) in net assets resulting from operations | | $(52,665,425) |
See accompanying notes which are an integral part of the financial statements.
Statement of Changes in Net Assets
| | Year ended October 31, 2015 | Year ended October 31, 2014 |
| Increase (Decrease) in Net Assets | | |
| Operations | | |
| Net investment income (loss) | $1,401,023 | $1,047,326 |
| Net realized gain (loss) | (12,422,672) | 3,497,507 |
| Change in net unrealized appreciation (depreciation) | (41,643,776) | 9,190,714 |
| Net increase (decrease) in net assets resulting from operations | (52,665,425) | 13,735,547 |
| Distributions to shareholders from net investment income | (1,046,601) | (1,113,231) |
| Distributions to shareholders from net realized gain | (487,287) | (185,956) |
| Total distributions | (1,533,888) | (1,299,187) |
| Share transactions - net increase (decrease) | 3,501,123 | 32,907,367 |
| Redemption fees | 73,251 | 31,634 |
| Total increase (decrease) in net assets | (50,624,939) | 45,375,361 |
| Net Assets | | |
| Beginning of period | 472,155,722 | 426,780,361 |
| End of period (including undistributed net investment income of $362,723 and undistributed net investment income of $1,039,628, respectively) | $421,530,783 | $472,155,722 |
See accompanying notes which are an integral part of the financial statements.
Financial Highlights — Fidelity Advisor Emerging Markets Fund Class A
| | | October 31, | | | |
| Years ended October 31, | 2015 | 2014 | 2013 | 2012 | 2011 |
| Selected Per–Share Data | | | | | |
| Net asset value, beginning of period | $23.38 | $22.62 | $20.51 | $20.50 | $23.71 |
| Income from Investment Operations | | | | | |
| Net investment income (loss)A | .06 | .06 | .08 | .22 | .21 |
| Net realized and unrealized gain (loss) | (2.66) | .76 | 2.23 | (.06) | (3.19) |
| Total from investment operations | (2.60) | .82 | 2.31 | .16 | (2.98) |
| Distributions from net investment income | (.02) | (.05) | (.20) | (.15) | (.11) |
| Distributions from net realized gain | (.03) | (.01) | – | – | (.13) |
| Total distributions | (.05) | (.06) | (.20) | (.15) | (.24) |
| Redemption fees added to paid in capitalA | –B | –B | –B | –B | .01 |
| Net asset value, end of period | $20.73 | $23.38 | $22.62 | $20.51 | $20.50 |
| Total ReturnC,D | (11.13)% | 3.65% | 11.34% | .80% | (12.69)% |
| Ratios to Average Net AssetsE,F | | | | | |
| Expenses before reductions | 1.52% | 1.52% | 1.56% | 1.54% | 1.54% |
| Expenses net of fee waivers, if any | 1.52% | 1.52% | 1.55% | 1.54% | 1.54% |
| Expenses net of all reductions | 1.50% | 1.52% | 1.50% | 1.48% | 1.47% |
| Net investment income (loss) | .28% | .26% | .38% | 1.07% | .92% |
| Supplemental Data | | | | | |
| Net assets, end of period (000 omitted) | $112,931 | $141,601 | $146,378 | $160,464 | $202,477 |
| Portfolio turnover rateG | 110% | 97% | 121% | 177% | 122% |
A Calculated based on average shares outstanding during the period.
B Amount represents less than $.005 per share.
C Total returns would have been lower if certain expenses had not been reduced during the applicable periods shown.
D Total returns do not include the effect of the sales charges.
E Fees and expenses of any underlying Fidelity Central Funds are not included in the Fund's expense ratio. The Fund indirectly bears its proportionate share of the expenses of any underlying Fidelity Central Funds.
F Expense ratios reflect operating expenses of the class. Expenses before reductions do not reflect amounts reimbursed by the investment adviser or reductions from brokerage service arrangements or reductions from other expense offset arrangements and do not represent the amount paid by the class during periods when reimbursements or reductions occur. Expenses net of fee waivers reflect expenses after reimbursement by the investment adviser but prior to reductions from brokerage service arrangements or other expense offset arrangements. Expenses net of all reductions represent the net expenses paid by the class.
G Amount does not include the portfolio activity of any underlying Fidelity Central Funds.
See accompanying notes which are an integral part of the financial statements.
Financial Highlights — Fidelity Advisor Emerging Markets Fund Class T
| | | October 31, | | | |
| Years ended October 31, | 2015 | 2014 | 2013 | 2012 | 2011 |
| Selected Per–Share Data | | | | | |
| Net asset value, beginning of period | $23.30 | $22.55 | $20.44 | $20.43 | $23.61 |
| Income from Investment Operations | | | | | |
| Net investment income (loss)A | .01 | –B | .03 | .16 | .15 |
| Net realized and unrealized gain (loss) | (2.66) | .76 | 2.22 | (.06) | (3.18) |
| Total from investment operations | (2.65) | .76 | 2.25 | .10 | (3.03) |
| Distributions from net investment income | – | –B | (.14) | (.09) | (.04) |
| Distributions from net realized gain | – | (.01) | – | – | (.13) |
| Total distributions | – | (.01) | (.14) | (.09) | (.16)C |
| Redemption fees added to paid in capitalA | –B | –B | –B | –B | .01 |
| Net asset value, end of period | $20.65 | $23.30 | $22.55 | $20.44 | $20.43 |
| Total ReturnD,E | (11.37)% | 3.39% | 11.06% | .49% | (12.89)% |
| Ratios to Average Net AssetsF,G | | | | | |
| Expenses before reductions | 1.78% | 1.78% | 1.81% | 1.80% | 1.79% |
| Expenses net of fee waivers, if any | 1.78% | 1.78% | 1.81% | 1.80% | 1.79% |
| Expenses net of all reductions | 1.76% | 1.78% | 1.76% | 1.73% | 1.73% |
| Net investment income (loss) | .02% | - %H | .13% | .81% | .66% |
| Supplemental Data | | | | | |
| Net assets, end of period (000 omitted) | $43,365 | $54,341 | $55,797 | $58,919 | $73,146 |
| Portfolio turnover rateI | 110% | 97% | 121% | 177% | 122% |
A Calculated based on average shares outstanding during the period.
B Amount represents less than $.005 per share.
C Total distributions of $.16 per share is comprised of distributions from net investment income of $.037 and distributions from net realized gain of $.125 per share.
D Total returns would have been lower if certain expenses had not been reduced during the applicable periods shown.
E Total returns do not include the effect of the sales charges.
F Fees and expenses of any underlying Fidelity Central Funds are not included in the Fund's expense ratio. The Fund indirectly bears its proportionate share of the expenses of any underlying Fidelity Central Funds.
G Expense ratios reflect operating expenses of the class. Expenses before reductions do not reflect amounts reimbursed by the investment adviser or reductions from brokerage service arrangements or reductions from other expense offset arrangements and do not represent the amount paid by the class during periods when reimbursements or reductions occur. Expenses net of fee waivers reflect expenses after reimbursement by the investment adviser but prior to reductions from brokerage service arrangements or other expense offset arrangements. Expenses net of all reductions represent the net expenses paid by the class.
H Amount represents less than .005%.
I Amount does not include the portfolio activity of any underlying Fidelity Central Funds.
See accompanying notes which are an integral part of the financial statements.
Financial Highlights — Fidelity Advisor Emerging Markets Fund Class B
| | | October 31, | | | |
| Years ended October 31, | 2015 | 2014 | 2013 | 2012 | 2011 |
| Selected Per–Share Data | | | | | |
| Net asset value, beginning of period | $22.75 | $22.11 | $20.03 | $20.03 | $23.14 |
| Income from Investment Operations | | | | | |
| Net investment income (loss)A | (.10) | (.11) | (.08) | .06 | .04 |
| Net realized and unrealized gain (loss) | (2.58) | .75 | 2.18 | (.06) | (3.13) |
| Total from investment operations | (2.68) | .64 | 2.10 | – | (3.09) |
| Distributions from net investment income | – | – | (.02) | – | (.01) |
| Distributions from net realized gain | – | – | – | – | (.03) |
| Total distributions | – | – | (.02) | – | (.03)B |
| Redemption fees added to paid in capitalA | –C | –C | –C | –C | .01 |
| Net asset value, end of period | $20.07 | $22.75 | $22.11 | $20.03 | $20.03 |
| Total ReturnD,E | (11.78)% | 2.89% | 10.50% | -% | (13.33)% |
| Ratios to Average Net AssetsF,G | | | | | |
| Expenses before reductions | 2.28% | 2.28% | 2.31% | 2.29% | 2.29% |
| Expenses net of fee waivers, if any | 2.28% | 2.28% | 2.31% | 2.29% | 2.29% |
| Expenses net of all reductions | 2.26% | 2.28% | 2.26% | 2.23% | 2.22% |
| Net investment income (loss) | (.48)% | (.49)% | (.37)% | .32% | .16% |
| Supplemental Data | | | | | |
| Net assets, end of period (000 omitted) | $3,255 | $7,546 | $11,391 | $15,994 | $21,304 |
| Portfolio turnover rateH | 110% | 97% | 121% | 177% | 122% |
A Calculated based on average shares outstanding during the period.
B Total distributions of $.03 per share is comprised of distributions from net investment income of $.005 and distributions from net realized gain of $.025 per share.
C Amount represents less than $.005 per share.
D Total returns would have been lower if certain expenses had not been reduced during the applicable periods shown.
E Total returns do not include the effect of the contingent deferred sales charge.
F Fees and expenses of any underlying Fidelity Central Funds are not included in the Fund's expense ratio. The Fund indirectly bears its proportionate share of the expenses of any underlying Fidelity Central Funds.
G Expense ratios reflect operating expenses of the class. Expenses before reductions do not reflect amounts reimbursed by the investment adviser or reductions from brokerage service arrangements or reductions from other expense offset arrangements and do not represent the amount paid by the class during periods when reimbursements or reductions occur. Expenses net of fee waivers reflect expenses after reimbursement by the investment adviser but prior to reductions from brokerage service arrangements or other expense offset arrangements. Expenses net of all reductions represent the net expenses paid by the class.
H Amount does not include the portfolio activity of any underlying Fidelity Central Funds.
See accompanying notes which are an integral part of the financial statements.
Financial Highlights — Fidelity Advisor Emerging Markets Fund Class C
| | | October 31, | | | |
| Years ended October 31, | 2015 | 2014 | 2013 | 2012 | 2011 |
| Selected Per–Share Data | | | | | |
| Net asset value, beginning of period | $22.70 | $22.06 | $20.00 | $20.00 | $23.13 |
| Income from Investment Operations | | | | | |
| Net investment income (loss)A | (.10) | (.11) | (.08) | .06 | .04 |
| Net realized and unrealized gain (loss) | (2.58) | .75 | 2.18 | (.06) | (3.12) |
| Total from investment operations | (2.68) | .64 | 2.10 | – | (3.08) |
| Distributions from net investment income | – | – | (.04) | – | (.01) |
| Distributions from net realized gain | – | – | – | – | (.05) |
| Total distributions | – | – | (.04) | – | (.06) |
| Redemption fees added to paid in capitalA | –B | –B | –B | –B | .01 |
| Net asset value, end of period | $20.02 | $22.70 | $22.06 | $20.00 | $20.00 |
| Total ReturnC,D | (11.81)% | 2.90% | 10.49% | -% | (13.33)% |
| Ratios to Average Net AssetsE,F | | | | | |
| Expenses before reductions | 2.27% | 2.27% | 2.31% | 2.29% | 2.28% |
| Expenses net of fee waivers, if any | 2.27% | 2.27% | 2.30% | 2.29% | 2.28% |
| Expenses net of all reductions | 2.26% | 2.27% | 2.25% | 2.23% | 2.22% |
| Net investment income (loss) | (.47)% | (.49)% | (.37)% | .32% | .17% |
| Supplemental Data | | | | | |
| Net assets, end of period (000 omitted) | $46,595 | $64,026 | $62,532 | $65,598 | $80,855 |
| Portfolio turnover rateG | 110% | 97% | 121% | 177% | 122% |
A Calculated based on average shares outstanding during the period.
B Amount represents less than $.005 per share.
C Total returns would have been lower if certain expenses had not been reduced during the applicable periods shown.
D Total returns do not include the effect of the contingent deferred sales charge.
E Fees and expenses of any underlying Fidelity Central Funds are not included in the Fund's expense ratio. The Fund indirectly bears its proportionate share of the expenses of any underlying Fidelity Central Funds.
F Expense ratios reflect operating expenses of the class. Expenses before reductions do not reflect amounts reimbursed by the investment adviser or reductions from brokerage service arrangements or reductions from other expense offset arrangements and do not represent the amount paid by the class during periods when reimbursements or reductions occur. Expenses net of fee waivers reflect expenses after reimbursement by the investment adviser but prior to reductions from brokerage service arrangements or other expense offset arrangements. Expenses net of all reductions represent the net expenses paid by the class.
G Amount does not include the portfolio activity of any underlying Fidelity Central Funds.
See accompanying notes which are an integral part of the financial statements.
Financial Highlights — Fidelity Advisor Emerging Markets Fund Class I
| | | October 31, | | | |
| Years ended October 31, | 2015 | 2014 | 2013 | 2012 | 2011 |
| Selected Per–Share Data | | | | | |
| Net asset value, beginning of period | $23.50 | $22.73 | $20.61 | $20.63 | $23.87 |
| Income from Investment Operations | | | | | |
| Net investment income (loss)A | .14 | .14 | .15 | .28 | .29 |
| Net realized and unrealized gain (loss) | (2.67) | .76 | 2.25 | (.06) | (3.21) |
| Total from investment operations | (2.53) | .90 | 2.40 | .22 | (2.92) |
| Distributions from net investment income | (.11) | (.12) | (.28) | (.24) | (.20) |
| Distributions from net realized gain | (.03) | (.01) | – | – | (.13) |
| Total distributions | (.14) | (.13) | (.28) | (.24) | (.33) |
| Redemption fees added to paid in capitalA | –B | –B | –B | –B | .01 |
| Net asset value, end of period | $20.83 | $23.50 | $22.73 | $20.61 | $20.63 |
| Total ReturnC | (10.83)% | 4.00% | 11.73% | 1.08% | (12.41)% |
| Ratios to Average Net AssetsD,E | | | | | |
| Expenses before reductions | 1.17% | 1.18% | 1.23% | 1.22% | 1.21% |
| Expenses net of fee waivers, if any | 1.17% | 1.18% | 1.22% | 1.22% | 1.21% |
| Expenses net of all reductions | 1.16% | 1.18% | 1.18% | 1.16% | 1.14% |
| Net investment income (loss) | .63% | .60% | .71% | 1.39% | 1.25% |
| Supplemental Data | | | | | |
| Net assets, end of period (000 omitted) | $209,270 | $199,098 | $150,576 | $145,782 | $138,312 |
| Portfolio turnover rateF | 110% | 97% | 121% | 177% | 122% |
A Calculated based on average shares outstanding during the period.
B Amount represents less than $.005 per share.
C Total returns would have been lower if certain expenses had not been reduced during the applicable periods shown.
D Fees and expenses of any underlying Fidelity Central Funds are not included in the Fund's expense ratio. The Fund indirectly bears its proportionate share of the expenses of any underlying Fidelity Central Funds.
E Expense ratios reflect operating expenses of the class. Expenses before reductions do not reflect amounts reimbursed by the investment adviser or reductions from brokerage service arrangements or reductions from other expense offset arrangements and do not represent the amount paid by the class during periods when reimbursements or reductions occur. Expenses net of fee waivers reflect expenses after reimbursement by the investment adviser but prior to reductions from brokerage service arrangements or other expense offset arrangements. Expenses net of all reductions represent the net expenses paid by the class.
F Amount does not include the portfolio activity of any underlying Fidelity Central Funds.
See accompanying notes which are an integral part of the financial statements.
Financial Highlights — Fidelity Advisor Emerging Markets Fund Class Z
| | | October 31, | |
| Years ended October 31, | 2015 | 2014 | 2013 A |
| Selected Per–Share Data | | | |
| Net asset value, beginning of period | $23.50 | $22.73 | $21.33 |
| Income from Investment Operations | | | |
| Net investment income (loss)B | .17 | .18 | .03 |
| Net realized and unrealized gain (loss) | (2.66) | .76 | 1.37 |
| Total from investment operations | (2.49) | .94 | 1.40 |
| Distributions from net investment income | (.14) | (.16) | – |
| Distributions from net realized gain | (.03) | (.01) | – |
| Total distributions | (.18)C | (.17) | – |
| Redemption fees added to paid in capitalB,D | – | – | – |
| Net asset value, end of period | $20.83 | $23.50 | $22.73 |
| Total ReturnE,F | (10.68)% | 4.19% | 6.56% |
| Ratios to Average Net AssetsG,H | | | |
| Expenses before reductions | 1.02% | 1.02% | 1.05%I |
| Expenses net of fee waivers, if any | 1.02% | 1.02% | 1.05%I |
| Expenses net of all reductions | 1.00% | 1.02% | 1.00%I |
| Net investment income (loss) | .78% | .77% | .62%I |
| Supplemental Data | | | |
| Net assets, end of period (000 omitted) | $6,114 | $5,544 | $107 |
| Portfolio turnover rateJ | 110% | 97% | 121% |
A For the period August 13, 2013 (commencement of sale of shares) to October 31, 2013.
B Calculated based on average shares outstanding during the period.
C Total distributions of $.18 per share is comprised of distributions from net investment income of $.143 and distributions from net realized gain of $.033 per share.
D Amount represents less than $.005 per share.
E Total returns for periods of less than one year are not annualized.
F Total returns would have been lower if certain expenses had not been reduced during the applicable periods shown.
G Fees and expenses of any underlying Fidelity Central Funds are not included in the Fund's expense ratio. The Fund indirectly bears its proportionate share of the expenses of any underlying Fidelity Central Funds.
H Expense ratios reflect operating expenses of the class. Expenses before reductions do not reflect amounts reimbursed by the investment adviser or reductions from brokerage service arrangements or reductions from other expense offset arrangements and do not represent the amount paid by the class during periods when reimbursements or reductions occur. Expense ratios before reductions for start-up periods may not be representative of longer-term operating periods. Expenses net of fee waivers reflect expenses after reimbursement by the investment adviser but prior to reductions from brokerage service arrangements or other expense offset arrangements. Expenses net of all reductions represent the net expenses paid by the class.
I Annualized
J Amount does not include the portfolio activity of any underlying Fidelity Central Funds.
See accompanying notes which are an integral part of the financial statements.
Notes to Financial Statements
For the period ended October 31, 2015
1. Organization.
Fidelity Advisor Emerging Markets Fund (the Fund) is a fund of Fidelity Advisor Series VIII (the Trust) and is authorized to issue an unlimited number of shares. The Trust is registered under the Investment Company Act of 1940, as amended (the 1940 Act), as an open-end management investment company organized as a Massachusetts business trust. The Fund offers Class A, Class T, Class C, Class I (formerly Institutional Class) and Class Z shares, each of which, along with Class B shares, has equal rights as to assets and voting privileges. Class B shares are closed to new accounts and additional purchases, except for exchanges and reinvestments. Each class has exclusive voting rights with respect to matters that affect that class. Class B shares will automatically convert to Class A shares after a holding period of seven years from the initial date of purchase. The Fund's investments in emerging markets can be subject to social, economic, regulatory, and political uncertainties and can be extremely volatile.
2. Investments in Fidelity Central Funds.
The Fund invests in Fidelity Central Funds, which are open-end investment companies generally available only to other investment companies and accounts managed by the investment adviser and its affiliates. The Fund's Schedule of Investments lists each of the Fidelity Central Funds held as of period end, if any, as an investment of the Fund, but does not include the underlying holdings of each Fidelity Central Fund. As an Investing Fund, the Fund indirectly bears its proportionate share of the expenses of the underlying Fidelity Central Funds.
The Money Market Central Funds seek preservation of capital and current income and are managed by Fidelity Investments Money Management, Inc. (FIMM), an affiliate of the investment adviser. Annualized expenses of the Money Market Central Funds as of their most recent shareholder report date are less than .005%.
A complete unaudited list of holdings for each Fidelity Central Fund is available upon request or at the Securities and Exchange Commission (the SEC) website at www.sec.gov. In addition, the financial statements of the Fidelity Central Funds, which are not covered by the Fund's Report of Independent Registered Public Accounting Firm, are available on the SEC website or upon request.
3. Significant Accounting Policies.
The financial statements have been prepared in conformity with accounting principles generally accepted in the United States of America (GAAP), which require management to make certain estimates and assumptions at the date of the financial statements. Actual results could differ from those estimates. Subsequent events, if any, through the date that the financial statements were issued have been evaluated in the preparation of the financial statements. The following summarizes the significant accounting policies of the Fund:
Investment Valuation. Investments are valued as of 4:00 p.m. Eastern time on the last calendar day of the period. The Board of Trustees (the Board) has delegated the day to day responsibility for the valuation of the Fund's investments to the Fidelity Management & Research Company (FMR) Fair Value Committee (the Committee). In accordance with valuation policies and procedures approved by the Board, the Fund attempts to obtain prices from one or more third party pricing vendors or brokers to value its investments. When current market prices, quotations or currency exchange rates are not readily available or reliable, investments will be fair valued in good faith by the Committee, in accordance with procedures adopted by the Board. Factors used in determining fair value vary by investment type and may include market or investment specific events. The frequency with which these procedures are used cannot be predicted and they may be utilized to a significant extent. The Committee oversees the Fund's valuation policies and procedures and reports to the Board on the Committee's activities and fair value determinations. The Board monitors the appropriateness of the procedures used in valuing the Fund's investments and ratifies the fair value determinations of the Committee.
The Fund categorizes the inputs to valuation techniques used to value its investments into a disclosure hierarchy consisting of three levels as shown below:
- Level 1 – quoted prices in active markets for identical investments
- Level 2 – other significant observable inputs (including quoted prices for similar investments, interest rates, prepayment speeds, etc.)
- Level 3 – unobservable inputs (including the Fund's own assumptions based on the best information available)
Valuation techniques used to value the Fund's investments by major category are as follows:
Equity securities, including restricted securities, for which market quotations are readily available, are valued at the last reported sale price or official closing price as reported by a third party pricing vendor on the primary market or exchange on which they are traded and are categorized as Level 1 in the hierarchy. In the event there were no sales during the day or closing prices are not available, securities are valued at the last quoted bid price or may be valued using the last available price and are generally categorized as Level 2 in the hierarchy. For foreign equity securities, when market or security specific events arise, comparisons to the valuation of American Depositary Receipts (ADRs), futures contracts, Exchange-Traded Funds (ETFs) and certain indexes as well as quoted prices for similar securities may be used and would be categorized as Level 2 in the hierarchy. Utilizing these techniques may result in transfers between Level 1 and Level 2. For equity securities, including restricted securities, where observable inputs are limited, assumptions about market activity and risk are used and these securities may be categorized as Level 3 in the hierarchy.
Investments in open-end mutual funds, including the Fidelity Central Funds, are valued at their closing net asset value (NAV) each business day and are categorized as Level 1 in the hierarchy.
Changes in valuation techniques may result in transfers in or out of an assigned level within the disclosure hierarchy. The aggregate value of investments by input level as of October 31, 2015, including information on transfers between Levels 1 and 2, is included at the end of the Fund's Schedule of Investments.
Foreign Currency. The Fund may use foreign currency contracts to facilitate transactions in foreign-denominated securities. Gains and losses from these transactions may arise from changes in the value of the foreign currency or if the counterparties do not perform under the contracts' terms.
Foreign-denominated assets, including investment securities, and liabilities are translated into U.S. dollars at the exchange rates at period end. Purchases and sales of investment securities, income and dividends received and expenses denominated in foreign currencies are translated into U.S. dollars at the exchange rate in effect on the transaction date.
The effects of exchange rate fluctuations on investments are included with the net realized and unrealized gain (loss) on investment securities. Other foreign currency transactions resulting in realized and unrealized gain (loss) are disclosed separately.
Investment Transactions and Income. For financial reporting purposes, the Fund's investment holdings and NAV include trades executed through the end of the last business day of the period. The NAV per share for processing shareholder transactions is calculated as of the close of business of the New York Stock Exchange (NYSE), normally 4:00 p.m. Eastern time and includes trades executed through the end of the prior business day. Gains and losses on securities sold are determined on the basis of identified cost and may include proceeds received from litigation. Dividend income is recorded on the ex-dividend date, except for certain dividends from foreign securities where the ex-dividend date may have passed, which are recorded as soon as the Fund is informed of the ex-dividend date. Non-cash dividends included in dividend income, if any, are recorded at the fair market value of the securities received. Income and capital gain distributions from Fidelity Central Funds, if any, are recorded on the ex-dividend date. Interest income is accrued as earned and includes coupon interest and amortization of premium and accretion of discount on debt securities as applicable. Investment income is recorded net of foreign taxes withheld where recovery of such taxes is uncertain.
Class Allocations and Expenses. Investment income, realized and unrealized capital gains and losses, common expenses of the Fund, and certain fund-level expense reductions, if any, are allocated daily on a pro-rata basis to each class based on the relative net assets of each class to the total net assets of the Fund. Each class differs with respect to transfer agent and distribution and service plan fees incurred. Certain expense reductions may also differ by class. For the reporting period, the allocated portion of income and expenses to each class as a percent of its average net assets may vary due to the timing of recording these transactions in relation to fluctuating net assets of the classes. Expenses directly attributable to a fund are charged to that fund. Expenses attributable to more than one fund are allocated among the respective funds on the basis of relative net assets or other appropriate methods. Expense estimates are accrued in the period to which they relate and adjustments are made when actual amounts are known.
Income Tax Information and Distributions to Shareholders. Each year, the Fund intends to qualify as a regulated investment company under Subchapter M of the Internal Revenue Code, including distributing substantially all of its taxable income and realized gains. As a result, no provision for U.S. Federal income taxes is required. As of October 31, 2015, the Fund did not have any unrecognized tax benefits in the financial statements; nor is the Fund aware of any tax positions for which it is reasonably possible that the total amounts of unrecognized tax benefits will significantly change in the next twelve months. The Fund files a U.S. federal tax return, in addition to state and local tax returns as required. The Fund's federal income tax returns are subject to examination by the Internal Revenue Service (IRS) for a period of three fiscal years after they are filed. State and local tax returns may be subject to examination for an additional fiscal year depending on the jurisdiction. Foreign taxes are provided for based on the Fund's understanding of the tax rules and rates that exist in the foreign markets in which it invests. The Fund is subject to a tax imposed on capital gains by certain countries in which it invests. An estimated deferred tax liability for net unrealized appreciation on the applicable securities is included in Other payables and accrued expenses on the Statement of Assets & Liabilities.
Distributions are declared and recorded on the ex-dividend date. Income dividends and capital gain distributions are declared separately for each class. Income and capital gain distributions are determined in accordance with income tax regulations, which may differ from GAAP.
Capital accounts within the financial statements are adjusted for permanent book-tax differences. These adjustments have no impact on net assets or the results of operations. Capital accounts are not adjusted for temporary book-tax differences which will reverse in a subsequent period.
Book-tax differences are primarily due to foreign currency transactions, certain foreign taxes, passive foreign investment companies (PFIC), capital loss carryforwards and losses deferred due to wash sales.
The federal tax cost of investment securities and unrealized appreciation (depreciation) as of period end were as follows:
| Gross unrealized appreciation | $42,619,526 |
| Gross unrealized depreciation | (32,272,187) |
| Net unrealized appreciation (depreciation) on securities | $10,347,339 |
| Tax Cost | $416,465,476 |
The tax-based components of distributable earnings as of period end were as follows:
| Undistributed ordinary income | $369,344 |
| Capital loss carryforward | $(60,367,895) |
| Net unrealized appreciation (depreciation) on securities and other investments | $10,326,489 |
Capital loss carryforwards are only available to offset future capital gains of the Fund to the extent provided by regulations and may be limited. Under the Regulated Investment Company Modernization Act of 2010 (the Act), the Fund is permitted to carry forward capital losses incurred in taxable years beginning after December 22, 2010 for an unlimited period and such capital losses are required to be used prior to any losses that expire. The capital loss carryforward information presented below, including any applicable limitation, is estimated as of fiscal period end and is subject to adjustment.
| Fiscal year of expiration | |
| 2017 | $(47,911,843) |
| Total with expiration | $(47,911,843) |
| No expiration | |
| Short-term | $(12,456,052) |
| Total with no expiration | $(12,456,052) |
| Total capital loss carryforward | $(60,367,895) |
The tax character of distributions paid was as follows:
| | October 31, 2015 | October 31, 2014 |
| Ordinary Income | $1,533,888 | $ 1,299,187 |
Short-Term Trading (Redemption) Fees. Shares held by investors in the Fund less than 90 days may have been subject to a redemption fee equal to 1.50% of the NAV of shares redeemed. All redemption fees, which reduce the proceeds of the shareholder redemption, are retained by the Fund and accounted for as an addition to paid in capital.
4. Purchases and Sales of Investments.
Purchases and sales of securities, other than short-term securities, aggregated $491,655,337 and $483,847,532, respectively.
5. Fees and Other Transactions with Affiliates.
Management Fee. Fidelity Management & Research Company (the investment adviser) and its affiliates provide the Fund with investment management related services for which the Fund pays a monthly management fee. The management fee is the sum of an individual fund fee rate that is based on an annual rate of .55% of the Fund's average net assets and an annualized group fee rate that averaged .25% during the period. The group fee rate is based upon the average net assets of all the mutual funds advised by the investment adviser, including any mutual funds previously advised by the investment adviser that are currently advised by Fidelity SelectCo, LLC, an affiliate of the investment adviser. The group fee rate decreases as assets under management increase and increases as assets under management decrease. For the reporting period, the total annual management fee rate was .80% of the Fund's average net assets.
Distribution and Service Plan Fees. In accordance with Rule 12b-1 of the 1940 Act, the Fund has adopted separate Distribution and Service Plans for each class of shares, except for the Institutional Class. Certain classes pay Fidelity Distributors Corporation (FDC), an affiliate of the investment adviser, separate Distribution and Service Fees, each of which is based on an annual percentage of each class' average net assets. In addition, FDC may pay financial intermediaries for selling shares of the Fund and providing shareholder support services. For the period, the Distribution and Service Fee rates, total fees and amounts retained by FDC were as follows:
| | Distribution
Fee | Service
Fee | Total Fees | Retained
by FDC |
| Class A | -% | .25% | $323,428 | $3,381 |
| Class T | .25% | .25% | 249,110 | – |
| Class B | .75% | .25% | 51,240 | 38,477 |
| Class C | .75% | .25% | 551,873 | 57,082 |
| | | | $1,175,651 | $98,940 |
Sales Load. FDC may receive a front-end sales charge of up to 5.75% for selling Class A shares and 3.50% for selling Class T shares, some of which is paid to financial intermediaries for selling shares of the Fund. Depending on the holding period, FDC may receive contingent deferred sales charges levied on Class A, Class T, Class B, and Class C redemptions. The deferred sales charges range from 5.00% to 1.00% for Class B shares, 1.00% for Class C shares, 1.00% for certain purchases of Class A shares and .25% for certain purchases of Class T shares.
For the period, sales charge amounts retained by FDC were as follows:
| | Retained
by FDC |
| Class A | $39,406 |
| Class T | 9,783 |
| Class B(a) | 3,265 |
| Class C(a) | 4,447 |
| | $56,901 |
(a) When Class B and Class C shares are initially sold, FDC pays commissions from its own resources to financial intermediaries through which the sales are made.
Transfer Agent Fees. Fidelity Investments Institutional Operations Company, Inc., (FIIOC), an affiliate of the investment adviser, is the transfer, dividend disbursing and shareholder servicing agent for each class of the Fund. FIIOC receives account fees and asset-based fees that vary according to the account size and type of account of the shareholders of the respective classes of the Fund, except for Class Z. FIIOC receives an asset-based fee of Class Z's average net assets. FIIOC pays for typesetting, printing and mailing of shareholder reports, except proxy statements.
For the period, transfer agent fees for each class were as follows:
| | Amount | % of
Class-Level Average
Net Assets |
| Class A | $385,423 | .30 |
| Class T | 151,579 | .30 |
| Class B | 15,229 | .30 |
| Class C | 165,378 | .30 |
| Class I | 404,444 | .20 |
| Class Z | 2,686 | .05 |
| | $1,124,739 | |
Accounting and Security Lending Fees. Fidelity Service Company, Inc. (FSC), an affiliate of the investment adviser, maintains the Fund's accounting records. The accounting fee is based on the level of average net assets for each month. Under a separate contract, FSC administers the security lending program. The security lending fee is based on the number and duration of lending transactions.
Brokerage Commissions. The Fund placed a portion of its portfolio transactions with brokerage firms which are affiliates of the investment adviser. Brokerage commissions are included in net realized gain (loss) and change in net unrealized appreciation (depreciation) in the Statement of Operations. The commissions paid to these affiliated firms were $1,687 for the period.
Interfund Lending Program. Pursuant to an Exemptive Order issued by the SEC, the Fund, along with other registered investment companies having management contracts with FMR or other affiliated entities of FMR, may participate in an interfund lending program. This program provides an alternative credit facility allowing the funds to borrow from, or lend money to, other participating affiliated funds. At period end, there were no interfund loans outstanding. The Fund's activity in this program during the period for which loans were outstanding was as follows:
| Borrower or Lender | Average Loan Balance | Weighted Average Interest Rate | Interest Expense |
| Borrower | $4,162,000 | .35% | $205 |
6. Committed Line of Credit.
The Fund participates with other funds managed by the investment adviser or an affiliate in a $4.25 billion credit facility (the "line of credit") to be utilized for temporary or emergency purposes to fund shareholder redemptions or for other short-term liquidity purposes. The Fund has agreed to pay commitment fees on its pro-rata portion of the line of credit, which amounted to $648 and is reflected in Miscellaneous expenses on the Statement of Operations. During the period, the Fund did not borrow on this line of credit.
7. Security Lending.
The Fund lends portfolio securities through a lending agent from time to time in order to earn additional income. For equity securities, a lending agent is used and may loan securities to certain qualified borrowers, including Fidelity Capital Markets (FCM), a broker-dealer affiliated with the Fund. On the settlement date of the loan, the Fund receives collateral (in the form of U.S. Treasury obligations, letters of credit and/or cash) against the loaned securities and maintains collateral in an amount not less than 100% of the market value of the loaned securities during the period of the loan. The market value of the loaned securities is determined at the close of business of the Fund and any additional required collateral is delivered to the Fund on the next business day. The Fund or borrower may terminate the loan at any time, and if the borrower defaults on its obligation to return the securities loaned because of insolvency or other reasons, the Fund may apply collateral received from the borrower against the obligation. The Fund may experience delays and costs in recovering the securities loaned. Any cash collateral received is invested in the Fidelity Securities Lending Cash Central Fund. The value of loaned securities and cash collateral at period end are disclosed on the Fund's Statement of Assets and Liabilities. At period end, there were no security loans outstanding with FCM. Security lending income represents the income earned on investing cash collateral, less rebates paid to borrowers and any lending agent fees associated with the loan, plus any premium payments received for lending certain types of securities. Security lending income is presented in the Statement of Operations as a component of income from Fidelity Central Funds. Total security lending income during the period amounted to $62,534, including $1,005 from securities loaned to FCM.
8. Expense Reductions.
Commissions paid to certain brokers with whom the investment adviser, or its affiliates, places trades on behalf of the Fund include an amount in addition to trade execution, which may be rebated back to the Fund to offset certain expenses. This amount totaled $64,703 for the period.
Through arrangements with the Fund's custodian, credits realized as a result of certain uninvested cash balances were used to reduce the Fund's expenses. During the period, these credits reduced the Fund's custody expenses by $52.
In addition, during the period the investment adviser reimbursed and/or waived a portion of fund-level operating expenses in the amount of $1,803 and a portion of class-level operating expenses as follows:
| | Amount |
| Class A | $724 |
| Class T | 128 |
| Class B | 11 |
| Class C | 133 |
| Class I | 3,497 |
| | $4,493 |
9. Distributions to Shareholders.
Distributions to shareholders of each class were as follows:
| Years ended October 31, | 2015 | 2014 |
| From net investment income | | |
| Class A | $115,150 | $314,541 |
| Class T | – | 2,453 |
| Class I | 898,042 | 791,098 |
| Class Z | 33,409 | 5,139 |
| Total | $1,046,601 | $1,113,231 |
| From net realized gain | | |
| Class A | $199,998 | $77,030 |
| Class T | – | 29,431 |
| Class I | 279,579 | 79,110 |
| Class Z | 7,710 | 385 |
| Total | $487,287 | $185,956 |
10. Share Transactions.
Share transactions for each class were as follows and may contain automatic conversions between classes or exchanges between funds:
| | Shares | Shares | Dollars | Dollars |
| Years ended October 31, | 2015 | 2014 | 2015 | 2014 |
| Class A | | | | |
| Shares sold | 1,093,525 | 1,306,708 | $24,402,020 | $29,667,252 |
| Reinvestment of distributions | 13,163 | 16,164 | 302,357 | 356,894 |
| Shares redeemed | (1,715,077) | (1,739,459) | (37,830,400) | (38,968,004) |
| Net increase (decrease) | (608,389) | (416,587) | $(13,126,023) | $(8,943,858) |
| Class T | | | | |
| Shares sold | 305,389 | 414,394 | $6,786,919 | $9,392,831 |
| Reinvestment of distributions | – | 1,397 | – | 30,813 |
| Shares redeemed | (537,767) | (558,505) | (11,710,693) | (12,438,338) |
| Net increase (decrease) | (232,378) | (142,714) | $(4,923,774) | $(3,014,694) |
| Class B | | | | |
| Shares sold | 2,482 | 16,905 | $54,329 | $374,479 |
| Shares redeemed | (171,894) | (200,427) | (3,727,701) | (4,400,967) |
| Net increase (decrease) | (169,412) | (183,522) | $(3,673,372) | $(4,026,488) |
| Class C | | | | |
| Shares sold | 365,122 | 651,900 | $7,912,445 | $14,559,904 |
| Shares redeemed | (858,213) | (666,053) | (18,293,083) | (14,339,508) |
| Net increase (decrease) | (493,091) | (14,153) | $(10,380,638) | $220,396 |
| Class I | | | | |
| Shares sold | 3,524,595 | 2,772,401 | $77,404,353 | $64,467,777 |
| Reinvestment of distributions | 49,091 | 36,756 | 1,129,581 | 813,035 |
| Shares redeemed | (1,999,205) | (963,648) | (44,250,238) | (22,091,792) |
| Net increase (decrease) | 1,574,481 | 1,845,509 | $34,283,696 | $43,189,020 |
| Class Z | | | | |
| Shares sold | 119,541 | 251,250 | $2,670,833 | $5,945,448 |
| Reinvestment of distributions | 1,789 | 250 | 41,119 | 5,524 |
| Shares redeemed | (63,727) | (20,301) | (1,390,718) | (467,981) |
| Net increase (decrease) | 57,603 | 231,199 | $1,321,234 | $5,482,991 |
11. Other.
The Fund's organizational documents provide former and current trustees and officers with a limited indemnification against liabilities arising in connection with the performance of their duties to the Fund. In the normal course of business, the Fund may also enter into contracts that provide general indemnifications. The Fund's maximum exposure under these arrangements is unknown as this would be dependent on future claims that may be made against the Fund. The risk of material loss from such claims is considered remote.
Report of Independent Registered Public Accounting Firm
To the Trustees of Fidelity Advisor Series VIII and Shareholders of Fidelity Advisor® Emerging Markets Fund:
We have audited the accompanying statement of assets and liabilities of Fidelity Advisor® Emerging Markets Fund (the Fund), a fund of Fidelity Advisor Series VIII, including the schedule of investments, as of October 31, 2015, and the related statement of operations for the year then ended, the statement of changes in net assets for each of the two years in the period then ended, and the financial highlights for each of the five years in the period then ended. These financial statements and financial highlights are the responsibility of the Fund's management. Our responsibility is to express an opinion on these financial statements and financial highlights based on our audits.
We conducted our audits in accordance with the standards of the Public Company Accounting Oversight Board (United States). Those standards require that we plan and perform the audit to obtain reasonable assurance about whether the financial statements and financial highlights are free of material misstatement. The Fund is not required to have, nor were we engaged to perform, an audit of its internal control over financial reporting. Our audits included consideration of internal control over financial reporting as a basis for designing audit procedures that are appropriate in the circumstances, but not for the purpose of expressing an opinion on the effectiveness of the Fund's internal control over financial reporting. Accordingly, we express no such opinion. An audit also includes examining, on a test basis, evidence supporting the amounts and disclosures in the financial statements, assessing the accounting principles used and significant estimates made by management, as well as evaluating the overall financial statement presentation. Our procedures included confirmation of securities owned as of October 31, 2015, by correspondence with the custodians and brokers; when replies were not received from brokers, we performed other auditing procedures. We believe our audits provide a reasonable basis for our opinion.
In our opinion, such financial statements and financial highlights referred to above present fairly, in all material respects, the financial position of Fidelity Advisor® Emerging Markets Fund as of October 31, 2015, the results of its operations for the year then ended, the changes in its net assets for each of the two years in the period then ended, and the financial highlights for each of the five years in the period then ended, in conformity with accounting principles generally accepted in the United States of America.
DELOITTE & TOUCHE LLP
Boston, Massachusetts
December 16, 2015
Trustees and Officers
The Trustees, Members of the Advisory Board (if any), and officers of the trust and fund, as applicable, are listed below. The Board of Trustees governs the fund and is responsible for protecting the interests of shareholders. The Trustees are experienced executives who meet periodically throughout the year to oversee the fund's activities, review contractual arrangements with companies that provide services to the fund, oversee management of the risks associated with such activities and contractual arrangements, and review the fund's performance. Each of the Trustees oversees 170 funds.
The Trustees hold office without limit in time except that (a) any Trustee may resign; (b) any Trustee may be removed by written instrument, signed by at least two-thirds of the number of Trustees prior to such removal; (c) any Trustee who requests to be retired or who has become incapacitated by illness or injury may be retired by written instrument signed by a majority of the other Trustees; and (d) any Trustee may be removed at any special meeting of shareholders by a two-thirds vote of the outstanding voting securities of the trust. Each Trustee who is not an interested person (as defined in the 1940 Act) of the trust and the fund is referred to herein as an Independent Trustee. Each Independent Trustee shall retire not later than the last day of the calendar year in which his or her 75th birthday occurs. The Independent Trustees may waive this mandatory retirement age policy with respect to individual Trustees. Officers and Advisory Board Members hold office without limit in time, except that any officer or Advisory Board Member may resign or may be removed by a vote of a majority of the Trustees at any regular meeting or any special meeting of the Trustees. Except as indicated, each individual has held the office shown or other offices in the same company for the past five years.
The fund’s Statement of Additional Information (SAI) includes more information about the Trustees. To request a free copy, call Fidelity at 1-877-208-0098.
Experience, Skills, Attributes, and Qualifications of the Trustees. The Governance and Nominating Committee has adopted a statement of policy that describes the experience, qualifications, attributes, and skills that are necessary and desirable for potential Independent Trustee candidates (Statement of Policy). The Board believes that each Trustee satisfied at the time he or she was initially elected or appointed a Trustee, and continues to satisfy, the standards contemplated by the Statement of Policy. The Governance and Nominating Committee also engages professional search firms to help identify potential Independent Trustee candidates who have the experience, qualifications, attributes, and skills consistent with the Statement of Policy. From time to time, additional criteria based on the composition and skills of the current Independent Trustees, as well as experience or skills that may be appropriate in light of future changes to board composition, business conditions, and regulatory or other developments, have also been considered by the professional search firms and the Governance and Nominating Committee. In addition, the Board takes into account the Trustees' commitment and participation in Board and committee meetings, as well as their leadership of standing and ad hoc committees throughout their tenure.
In determining that a particular Trustee was and continues to be qualified to serve as a Trustee, the Board has considered a variety of criteria, none of which, in isolation, was controlling. The Board believes that, collectively, the Trustees have balanced and diverse experience, qualifications, attributes, and skills, which allow the Board to operate effectively in governing the fund and protecting the interests of shareholders. Information about the specific experience, skills, attributes, and qualifications of each Trustee, which in each case led to the Board's conclusion that the Trustee should serve (or continue to serve) as a trustee of the fund, is provided below.
Board Structure and Oversight Function. James C. Curvey is an interested person and currently serves as Chairman. The Trustees have determined that an interested Chairman is appropriate and benefits shareholders because an interested Chairman has a personal and professional stake in the quality and continuity of services provided to the fund. Independent Trustees exercise their informed business judgment to appoint an individual of their choosing to serve as Chairman, regardless of whether the Trustee happens to be independent or a member of management. The Independent Trustees have determined that they can act independently and effectively without having an Independent Trustee serve as Chairman and that a key structural component for assuring that they are in a position to do so is for the Independent Trustees to constitute a substantial majority for the Board. The Independent Trustees also regularly meet in executive session. Ned C. Lautenbach serves as Chairman of the Independent Trustees and as such (i) acts as a liaison between the Independent Trustees and management with respect to matters important to the Independent Trustees and (ii) with management prepares agendas for Board meetings.
Fidelity® funds are overseen by different Boards of Trustees. The fund's Board oversees Fidelity's high income and certain equity funds, and other Boards oversee Fidelity's investment-grade bond, money market, asset allocation, and sector funds. The asset allocation funds may invest in Fidelity® funds overseen by the fund's Board. The use of separate Boards, each with its own committee structure, allows the Trustees of each group of Fidelity® funds to focus on the unique issues of the funds they oversee, including common research, investment, and operational issues. On occasion, the separate Boards establish joint committees to address issues of overlapping consequences for the Fidelity® funds overseen by each Board.
The Trustees operate using a system of committees to facilitate the timely and efficient consideration of all matters of importance to the Trustees, the fund, and fund shareholders and to facilitate compliance with legal and regulatory requirements and oversight of the fund's activities and associated risks. The Board, acting through its committees, has charged FMR and its affiliates with (i) identifying events or circumstances the occurrence of which could have demonstrably adverse effects on the fund's business and/or reputation; (ii) implementing processes and controls to lessen the possibility that such events or circumstances occur or to mitigate the effects of such events or circumstances if they do occur; and (iii) creating and maintaining a system designed to evaluate continuously business and market conditions in order to facilitate the identification and implementation processes described in (i) and (ii) above. Because the day-to-day operations and activities of the fund are carried out by or through FMR, its affiliates, and other service providers, the fund's exposure to risks is mitigated but not eliminated by the processes overseen by the Trustees. While each of the Board's committees has responsibility for overseeing different aspects of the fund's activities, oversight is exercised primarily through the Operations, Audit, and Compliance Committees. In addition, the Independent Trustees have worked with FMR to enhance the Board's oversight of investment and financial risks, legal and regulatory risks, technology risks, and operational risks, including the development of additional risk reporting to the Board. For example, a working group comprised of Independent Trustees and FMR has worked and continues to work to review the Fidelity® funds' valuation-related activities, reporting and risk management. Appropriate personnel, including but not limited to the fund's Chief Compliance Officer (CCO), FMR's internal auditor, the independent accountants, the fund's Treasurer and portfolio management personnel, make periodic reports to the Board's committees, as appropriate, including an annual review of Fidelity's risk management program for the Fidelity® funds. The responsibilities of each standing committee, including their oversight responsibilities, are described further under "Standing Committees of the Trustees."
Interested Trustees*:
Correspondence intended for a Trustee who is an interested person may be sent to Fidelity Investments, 245 Summer Street, Boston, Massachusetts 02210.
Name, Year of Birth; Principal Occupations and Other Relevant Experience+
James C. Curvey (1935)
Year of Election or Appointment: 2007
Trustee
Chairman of the Board of Trustees
Mr. Curvey also serves as Trustee of other Fidelity® funds. Mr. Curvey is a Director of Fidelity Research & Analysis Co. (investment adviser firm, 2009-present), and Vice Chairman (2007-present) and Director of FMR LLC (diversified financial services company). In addition, Mr. Curvey serves as an Overseer for the Boston Symphony Orchestra and a member of the board of Artis-Naples, Naples, Florida, and as a Trustee for Brewster Academy, Wolfeboro, New Hampshire. Previously, Mr. Curvey served as a Director of Fidelity Investments Money Management, Inc. (investment adviser firm, 2009-2014) and a Director of FMR and FMR Co., Inc. (investment adviser firms, 2007-2014).
Charles S. Morrison (1960)
Year of Election or Appointment: 2014
Trustee
Mr. Morrison also serves as Trustee of other funds. He serves as a Director of Fidelity Investments Money Management, Inc. (FIMM) (investment adviser firm, 2014-present), Director of Fidelity SelectCo, LLC (investment adviser firm, 2014-present), President, Asset Management (2014-present), and is an employee of Fidelity Investments. Previously, Mr. Morrison served as Vice President of Fidelity's Fixed Income and Asset Allocation Funds (2012-2014), President, Fixed Income (2011-2014), Vice President of Fidelity's Money Market Funds (2005-2009), President, Money Market Group Leader of FMR (investment adviser firm, 2009), and Senior Vice President, Money Market Group of FMR (2004-2009). Mr. Morrison also served as Vice President of Fidelity's Bond Funds (2002-2005), certain Balanced Funds (2002-2005), and certain Asset Allocation Funds (2002-2007), and as Senior Vice President (2002-2005) of Fidelity's Bond Division.
* Determined to be an “Interested Trustee” by virtue of, among other things, his or her affiliation with the trust or various entities under common control with FMR.
+ The information includes the Trustee's principal occupation during the last five years and other information relating to the experience, attributes, and skills relevant to the Trustee's qualifications to serve as a Trustee, which led to the conclusion that the Trustee should serve as a Trustee for the fund.
Independent Trustees:
Correspondence intended for an Independent Trustee may be sent to Fidelity Investments, P.O. Box 55235, Boston, Massachusetts 02205-5235.
Name, Year of Birth; Principal Occupations and Other Relevant Experience+
Dennis J. Dirks (1948)
Year of Election or Appointment: 2005
Trustee
Mr. Dirks also serves as Trustee of other Fidelity® funds. Prior to his retirement in May 2003, Mr. Dirks was Chief Operating Officer and a member of the Board of The Depository Trust & Clearing Corporation (DTCC). He also served as President, Chief Operating Officer, and Board member of The Depository Trust Company (DTC) and President and Board member of the National Securities Clearing Corporation (NSCC). In addition, Mr. Dirks served as Chief Executive Officer and Board member of the Government Securities Clearing Corporation, Chief Executive Officer and Board member of the Mortgage-Backed Securities Clearing Corporation, as a Trustee and a member of the Finance Committee of Manhattan College (2005-2008), as a Trustee and a member of the Finance Committee of AHRC of Nassau County (2006-2008), and as a member of the Independent Directors Council (IDC) Governing Council (2010-2015). Mr. Dirks is a member of the Board of Directors for The Brookville Center for Children's Services, Inc. (2009-present).
Alan J. Lacy (1953)
Year of Election or Appointment: 2008
Trustee
Mr. Lacy also serves as Trustee of other Fidelity® funds. Mr. Lacy serves as a member of the Board of Directors of Dave & Buster's Entertainment, Inc. (restaurant and entertainment complexes, 2010-present) and Bristol-Myers Squibb Company (global pharmaceuticals, 2008-present). In addition, Mr. Lacy served as Senior Adviser (2007-2014) of Oak Hill Capital Partners, L.P. (private equity) and also served as Chief Executive Officer (2000-2005) and Vice Chairman (2005-2006) of Sears Holdings Corporation and Sears, Roebuck and Co. (retail). Mr. Lacy is a member of the Board of Trustees of The National Parks Conservation Association (2006-present). Previously, Mr. Lacy served as Chairman of the Board of Trustees of the National Parks Conservation Association (2008-2011) and as a member of the Board of Directors for The Western Union Company (global money transfer, 2006-2011), The Hillman Companies, Inc. (hardware wholesalers, 2010-2014), and Earth Fare, Inc. (retail grocery, 2010-2014).
Ned C. Lautenbach (1944)
Year of Election or Appointment: 2000
Trustee
Chairman of the Independent Trustees
Mr. Lautenbach also serves as Trustee of other Fidelity® funds. Mr. Lautenbach currently serves as the Lead Director of the Eaton Corporation Board of Directors (diversified industrial, 1997-present). Mr. Lautenbach is Chairman of the Board of Directors of Artis-Naples in Naples, Florida (2012-present), a member of the Council on Foreign Relations (1994-present), and a member of the Board of Governors, State University System of Florida (2013-present). Previously, Mr. Lautenbach was a Partner/Advisory Partner at Clayton, Dubilier & Rice, LLC (private equity investment, 1998-2010), as well as a Director of Sony Corporation (2006-2007).
Joseph Mauriello (1944)
Year of Election or Appointment: 2008
Trustee
Mr. Mauriello also serves as Trustee of other Fidelity® funds. Prior to his retirement in January 2006, Mr. Mauriello served in numerous senior management positions including Deputy Chairman and Chief Operating Officer (2004-2005), and Vice Chairman of Financial Services (2002-2004) of KPMG LLP US (professional services, 1965-2005). Mr. Mauriello currently serves as a member of the Board of Directors of XL Group plc. (global insurance and re-insurance, 2006-present) and the Independent Directors Council (IDC) Governing Council (2015-present). Previously, Mr. Mauriello served as a Director of the Hamilton Funds of the Bank of New York (2006-2007) and of Arcadia Resources Inc. (health care services and products, 2007-2012).
Robert W. Selander (1950)
Year of Election or Appointment: 2011
Trustee
Mr. Selander also serves as Trustee of other Fidelity® funds. Mr. Selander serves as a Director of The Western Union Company (global money transfer, 2014-present). Previously, Mr. Selander served as a Member of the Advisory Board of other Fidelity® funds (2011), and Executive Vice Chairman (2010), Chief Executive Officer (2009-2010), and President and Chief Executive Officer (1997-2009) of Mastercard, Inc.
Cornelia M. Small (1944)
Year of Election or Appointment: 2005
Trustee
Ms. Small also serves as Trustee of other Fidelity® funds. Ms. Small is a member of the Board of Directors (2009-present) and Chair of the Investment Committee (2010-present) of the Teagle Foundation. Ms. Small also serves on the Investment Committee of the Berkshire Taconic Community Foundation (2008-present). Previously, Ms. Small served as Chairperson (2002-2008) and a member of the Investment Committee and Chairperson (2008-2012) and a member of the Board of Trustees of Smith College. In addition, Ms. Small served as Chief Investment Officer, Director of Global Equity Investments, and a member of the Board of Directors of Scudder, Stevens & Clark and Scudder Kemper Investments.
William S. Stavropoulos (1939)
Year of Election or Appointment: 2001
Trustee
Vice Chairman of the Independent Trustees
Mr. Stavropoulos also serves as Trustee of other Fidelity® funds. Mr. Stavropoulos serves as President and Founder of the Michigan Baseball Foundation, the Great Lakes Loons (2007-present). Mr. Stavropoulos is Chairman Emeritus of the Board of Directors of The Dow Chemical Company, where he previously served in numerous senior management positions, including President, CEO (1995-2000; 2002-2004), Chairman of the Executive Committee (2000-2006), and as a member of the Board of Directors (1990-2006). Currently, Mr. Stavropoulos is Chairman of the Board of Directors of Univar Inc. (global distributor of commodity and specialty chemicals), a Director of Teradata Corporation (data warehousing and technology solutions), and Maersk Inc. (industrial conglomerate), and a member of the Advisory Board for Metalmark Capital LLC (private equity investment, 2005-present). Mr. Stavropoulos is an operating advisor to Clayton, Dubilier & Rice, LLC (private equity investment). In addition, Mr. Stavropoulos is a member of the University of Notre Dame Advisory Council for the College of Science, a Trustee of the Rollin L. Gerstacker Foundation, and a Director of the Naples Philharmonic Center for the Arts. Previously, Mr. Stavropoulos served as a Director of Chemical Financial Corporation (bank holding company, 1993-2012) and Tyco International, Ltd. (multinational manufacturing and services, 2007-2012).
David M. Thomas (1949)
Year of Election or Appointment: 2008
Trustee
Mr. Thomas also serves as Trustee of other Fidelity® funds. Mr. Thomas serves as Non-Executive Chairman of the Board of Directors of Fortune Brands Home and Security (home and security products, 2011-present), as a member of the Board of Directors (2004-present) and Presiding Director (2013-present) of Interpublic Group of Companies, Inc. (marketing communication), and as a member of the Board of Trustees of the University of Florida (2013-present). Previously, Mr. Thomas served as Executive Chairman (2005-2006) and Chairman and Chief Executive Officer (2000-2005) of IMS Health, Inc. (pharmaceutical and healthcare information solutions), and a Director of Fortune Brands, Inc. (consumer products, 2000-2011).
+ The information includes the Trustee's principal occupation during the last five years and other information relating to the experience, attributes, and skills relevant to the Trustee's qualifications to serve as a Trustee, which led to the conclusion that the Trustee should serve as a Trustee for the fund.
Advisory Board Members and Officers:
Correspondence intended for an officer or Peter S. Lynch may be sent to Fidelity Investments, 245 Summer Street, Boston, Massachusetts 02210. Officers appear below in alphabetical order.
Name, Year of Birth; Principal Occupation
Peter S. Lynch (1944)
Year of Election or Appointment: 2003
Member of the Advisory Board
Mr. Lynch also serves as Member of the Advisory Board of other Fidelity® funds. Mr. Lynch is Vice Chairman and a Director of FMR (investment adviser firm) and FMR Co., Inc. (investment adviser firm). In addition, Mr. Lynch serves as a Trustee of Boston College and as the Chairman of the Inner-City Scholarship Fund. Previously, Mr. Lynch served on the Special Olympics International Board of Directors (1997-2006).
Elizabeth Paige Baumann (1968)
Year of Election or Appointment: 2012
Anti-Money Laundering (AML) Officer
Ms. Baumann also serves as AML Officer of other funds. She is Chief AML Officer of FMR LLC (diversified financial services company, 2012-present) and is an employee of Fidelity Investments. Previously, Ms. Baumann served as Vice President and Deputy Anti-Money Laundering Officer (2007-2012).
Marc R. Bryant (1966)
Year of Election or Appointment: 2015
Secretary and Chief Legal Officer (CLO)
Mr. Bryant also serves as Secretary and CLO of other funds. Mr. Bryant serves as CLO, Secretary, and Senior Vice President of Fidelity Management & Research Company (investment adviser firm, 2015-present) and FMR Co., Inc. (investment adviser firm, 2015-present); Secretary of Fidelity SelectCo, LLC (investment adviser firm, 2015-present) and Fidelity Investments Money Management, Inc. (investment adviser firm, 2015-present); and CLO of Fidelity Management & Research (Hong Kong) Limited (investment adviser firm, 2015-present). He is Senior Vice President and Deputy General Counsel of FMR LLC (diversified financial services company). Previously, Mr. Bryant served as Secretary and Chief Legal Officer of Fidelity Rutland Square Trust II (2010-2014) and Assistant Secretary of Fidelity's Fixed Income and Asset Allocation Funds (2013-2015). Prior to joining Fidelity Investments, Mr. Bryant served as a Senior Vice President and the Head of Global Retail Legal for AllianceBernstein L.P. (2006-2010), and as the General Counsel for ProFund Advisors LLC (2001-2006).
Timothy M. Cohen (1969)
Year of Election or Appointment: 2014
Vice President of certain Equity Funds
Mr. Cohen also serves as Vice President of other funds. Mr. Cohen serves as Chief Compliance Officer of FMR Investment Management (U.K.) Limited (investment adviser firm, 2013-present) and is an employee of Fidelity Investments. Previously, Mr. Cohen served as a Director of FMR Investment Management (U.K.) Limited (2013-2015).
William C. Coffey (1969)
Year of Election or Appointment: 2009
Assistant Secretary
Mr. Coffey also serves as Assistant Secretary of other funds. He is Senior Vice President and Deputy General Counsel of FMR LLC (diversified financial services company, 2010-present), and is an employee of Fidelity Investments. Previously, Mr. Coffey served as Vice President and Associate General Counsel of FMR LLC (2005-2009).
Jonathan Davis (1968)
Year of Election or Appointment: 2010
Assistant Treasurer
Mr. Davis also serves as Assistant Treasurer of other funds, and is an employee of Fidelity Investments. Previously, Mr. Davis served as Vice President and Associate General Counsel of FMR LLC (diversified financial services company, 2003-2010).
Adrien E. Deberghes (1967)
Year of Election or Appointment: 2008
Deputy Treasurer
Mr. Deberghes also serves as an officer of other funds. He is an employee of Fidelity Investments (2008-present). Prior to joining Fidelity Investments, Mr. Deberghes was Senior Vice President of Mutual Fund Administration at State Street Corporation (2007-2008), Senior Director of Mutual Fund Administration at Investors Bank & Trust (2005-2007), and Director of Finance for Dunkin' Brands (2000-2005).
Stephanie J. Dorsey (1969)
Year of Election or Appointment: 2010
Assistant Treasurer
Ms. Dorsey also serves as an officer of other funds. She is an employee of Fidelity Investments (2008-present) and has served in other fund officer roles. Prior to joining Fidelity Investments, Ms. Dorsey served as Treasurer (2004-2008) of the JPMorgan Mutual Funds and Vice President (2004-2008) of JPMorgan Chase Bank.
Howard J. Galligan III (1966)
Year of Election or Appointment: 2014
Chief Financial Officer
Mr. Galligan also serves as Chief Financial Officer of other funds. Mr. Galligan serves as President of Fidelity Pricing and Cash Management Services (FPCMS) (2014-present) and as a Director of Strategic Advisers, Inc. (investment adviser firm, 2008-present). Previously, Mr. Galligan served as Chief Administrative Officer of Asset Management (2011-2014) and Chief Operating Officer and Senior Vice President of Investment Support for Strategic Advisers, Inc. (2003-2011).
Scott C. Goebel (1968)
Year of Election or Appointment: 2015
Vice President
Mr. Goebel serves as Vice President of other funds and is an employee of Fidelity Investments (2001-present). Previously, Mr. Goebel served as Secretary of Fidelity SelectCo, LLC (investment adviser firm, 2013-2015), Fidelity Investments Money Management, Inc. (FIMM) (investment adviser firm, 2010-2015), and Fidelity Research and Analysis Company (FRAC) (investment adviser firm, 2010-2015); General Counsel, Secretary, and Senior Vice President of Fidelity Management & Research Company (investment adviser firm, 2008-2015) and FMR Co., Inc. (investment adviser firm, 2008-2015); Assistant Secretary of Fidelity Management & Research (Japan) Limited (investment adviser firm, 2008-2015) and FMR Investment Management (U.K.) Limited (investment adviser firm, 2008-2015); Chief Legal Officer (CLO) of Fidelity Management & Research (Hong Kong) Limited (investment adviser firm, 2008-2015); Secretary and CLO of certain Fidelity® funds (2008-2015); Assistant Secretary of FIMM (2008-2010), FRAC (2008-2010), and certain funds (2007-2008); and as Vice President and Secretary of Fidelity Distributors Corporation (FDC) (2005-2007).
Brian B. Hogan (1964)
Year of Election or Appointment: 2009
Vice President
Mr. Hogan also serves as Trustee or Vice President of other funds. Mr. Hogan serves as a Director of Fidelity SelectCo, LLC (investment adviser firm, 2014-present) and President of the Equity Division of FMR (investment adviser firm, 2009-present). Previously, Mr. Hogan served as Senior Vice President, Equity Research of FMR (2006-2009) and as a portfolio manager.
Chris Maher (1972)
Year of Election or Appointment: 2013
Assistant Treasurer
Mr. Maher serves as Assistant Treasurer of other funds. Mr. Maher is Vice President of Valuation Oversight and is an employee of Fidelity Investments. Previously, Mr. Maher served as Vice President of Asset Management Compliance (2013), Vice President of the Program Management Group of FMR (investment adviser firm, 2010-2013), and Vice President of Valuation Oversight (2008-2010).
Kenneth B. Robins (1969)
Year of Election or Appointment: 2008
President and Treasurer
Mr. Robins also serves as an officer of other funds. Mr. Robins serves as Executive Vice President of Fidelity Investments Money Management, Inc. (FIMM) (investment adviser firm, 2013-present) and is an employee of Fidelity Investments (2004-present). Previously, Mr. Robins served in other fund officer roles.
Stacie M. Smith (1974)
Year of Election or Appointment: 2013
Deputy Treasurer
Ms. Smith also serves as an officer of other funds. She is an employee of Fidelity Investments (2009-present) and has served in other fund officer roles. Prior to joining Fidelity Investments, Ms. Smith served as Senior Audit Manager of Ernst & Young LLP (1996-2009).
Renee Stagnone (1975)
Year of Election or Appointment: 2013
Deputy Treasurer
Ms. Stagnone also serves as Deputy Treasurer of other funds. Ms. Stagnone is an employee of Fidelity Investments (1997-present).
Linda J. Wondrack (1964)
Year of Election or Appointment: 2014
Chief Compliance Officer
Ms. Wondrack also serves as Chief Compliance Officer of other funds. Ms. Wondrack is Executive Vice President and head of the Ethics Office and Asset Management Compliance for Fidelity Investments (2012-present). Ms. Wondrack also serves as Chief Compliance Officer of Fidelity SelectCo, LLC (investment adviser firm, 2014-present); Chief Compliance Officer of Impresa Management LLC (2013-present); and Chief Compliance Officer of FMR Co., Inc. (investment adviser firm), Fidelity Investments Money Management, Inc. (investment adviser firm), Fidelity Management & Research (Japan) Limited (investment adviser firm), FMR Investment Management (U.K.) Limited (investment adviser firm), Fidelity Management & Research (Hong Kong) (investment adviser firm), Fidelity Management & Research Company (investment adviser firm), FIAM LLC (investment adviser firm), and Strategic Advisers, Inc. (investment adviser firm), Ballyrock Investment Advisors LLC, and Northern Neck Investors LLC (2012-present). Previously, Ms. Wondrack served as Senior Vice President and Chief Compliance Officer for Columbia Management Investment Advisers, LLC (2005-2012); Chief Compliance Officer for certain funds within the Columbia Family of Funds (2007-2012); and Senior Vice President of Compliance Risk Management at Bank of America (2005-2010).
Joseph F. Zambello (1957)
Year of Election or Appointment: 2011
Deputy Treasurer
Mr. Zambello also serves as Deputy Treasurer of other funds. Mr. Zambello is an employee of Fidelity Investments (1991-present). Previously, Mr. Zambello served as Vice President of the Program Management Group of FMR (investment adviser firm, 2009-2011) and Vice President of the Transfer Agent Oversight Group (2005-2009).
Shareholder Expense Example
As a shareholder of the Fund, you incur two types of costs: (1) transaction costs, including sales charges (loads) on purchase payments or redemption proceeds, redemption fees and (2) ongoing costs, including management fees, distribution and/or service (12b-1) fees and other Fund expenses. This Example is intended to help you understand your ongoing costs (in dollars) of investing in the Fund and to compare these costs with the ongoing costs of investing in other mutual funds.
The Example is based on an investment of $1,000 invested at the beginning of the period and held for the entire period (May 1, 2015 to October 31, 2015).
Actual Expenses
The first line of the accompanying table for each class of the Fund provides information about actual account values and actual expenses. You may use the information in this line, together with the amount you invested, to estimate the expenses that you paid over the period. Simply divide your account value by $1,000.00 (for example, an $8,600 account value divided by $1,000.00 = 8.6), then multiply the result by the number in the first line for a class of the Fund under the heading entitled "Expenses Paid During Period" to estimate the expenses you paid on your account during this period. In addition, the Fund, as a shareholder in the underlying Fidelity Central Funds, will indirectly bear its pro-rata share of the fees and expenses incurred by the underlying Fidelity Central Funds. These fees and expenses are not included in the Fund's annualized expense ratio used to calculate the expense estimate in the table below.
Hypothetical Example for Comparison Purposes
The second line of the accompanying table for each class of the Fund provides information about hypothetical account values and hypothetical expenses based on a Class' actual expense ratio and an assumed rate of return of 5% per year before expenses, which is not the Class' actual return. The hypothetical account values and expenses may not be used to estimate the actual ending account balance or expenses you paid for the period. You may use this information to compare the ongoing costs of investing in the Fund and other funds. To do so, compare this 5% hypothetical example with the 5% hypothetical examples that appear in the shareholder reports of the other funds. In addition, the Fund, as a shareholder in the underlying Fidelity Central Funds, will indirectly bear its pro-rata share of the fees and expenses incurred by the underlying Fidelity Central Funds. These fees and expenses are not included in the Fund's annualized expense ratio used to calculate the expense estimate in the table below.
Please note that the expenses shown in the table are meant to highlight your ongoing costs only and do not reflect any transaction costs. Therefore, the second line of the table is useful in comparing ongoing costs only, and will not help you determine the relative total costs of owning different funds. In addition, if these transactional costs were included, your costs would have been higher.
| | Annualized Expense Ratio-A | Beginning
Account Value
May 1, 2015 | Ending
Account Value
October 31, 2015 | Expenses Paid
During Period-B
May 1, 2015
to October 31, 2015 |
| Class A | 1.50% | | | |
| Actual | | $1,000.00 | $884.80 | $7.13 |
| Hypothetical-C | | $1,000.00 | $1,017.64 | $7.63 |
| Class T | 1.76% | | | |
| Actual | | $1,000.00 | $883.20 | $8.35 |
| Hypothetical-C | | $1,000.00 | $1,016.33 | $8.94 |
| Class B | 2.24% | | | |
| Actual | | $1,000.00 | $881.40 | $10.62 |
| Hypothetical-C | | $1,000.00 | $1,013.91 | $11.37 |
| Class C | 2.25% | | | |
| Actual | | $1,000.00 | $881.20 | $10.67 |
| Hypothetical-C | | $1,000.00 | $1,013.86 | $11.42 |
| Class I | 1.15% | | | |
| Actual | | $1,000.00 | $886.00 | $5.47 |
| Hypothetical-C | | $1,000.00 | $1,019.41 | $5.85 |
| Class Z | 1.01% | | | |
| Actual | | $1,000.00 | $886.80 | $4.80 |
| Hypothetical-C | | $1,000.00 | $1,020.11 | $5.14 |
A Annualized expense ratio reflects expenses net of applicable fee waivers.
B Expenses are equal to each Class' annualized expense ratio, multiplied by the average account value over the period, multiplied by 184/365 (to reflect the one-half year period).
C 5% return per year before expenses
Distributions (Unaudited)
Class Z designates 100% of the dividends distributed during the fiscal year as amounts which may be taken into account as a dividend for the purposes of the maximum rate under section 1(h)(11) of the Internal Revenue Code.
Class Z designates 6% of the dividends distributed during the fiscal year as qualifying for the dividends-received deduction for corporate shareholders
The amounts per share which represent income derived from sources within, and taxes paid to, foreign countries or possessions of the United States are as follows:
| | Pay Date | Income | Taxes |
| Class Z | 12/08/2014 | $0.2254 | $0.0494 |
The fund will notify shareholders in January 2016 of amounts for use in preparing 2015 income tax returns.
Board Approval of Investment Advisory Contracts and Management Fees
Fidelity Advisor Emerging Markets Fund
Each year, the Board of Trustees, including the Independent Trustees (together, the Board), votes on the renewal of the management contract with Fidelity Management & Research Company (FMR) and the sub-advisory agreements (together, the Advisory Contracts) for the fund. The Board, assisted by the advice of fund counsel and Independent Trustees' counsel, requests and considers a broad range of information relevant to the renewal of the Advisory Contracts throughout the year.
The Board meets regularly and, at each of its meetings, covers an extensive agenda of topics and materials and considers factors that are relevant to its annual consideration of the renewal of the fund's Advisory Contracts, including the services and support provided to the fund and its shareholders. The Board has established various standing committees (Committees), each composed of and chaired by Independent Trustees with varying backgrounds, to which the Board has assigned specific subject matter responsibilities in order to enhance effective decision-making by the Board. The Board, acting directly and through its Committees, requests and receives information concerning the annual consideration of the renewal of the fund's Advisory Contracts. The Board also meets as needed to consider matters specifically related to the Board's annual consideration of the renewal of the Advisory Contracts. Members of the Board may also meet with trustees of other Fidelity funds through ad hoc joint committees to discuss certain matters relevant to all of the Fidelity funds.
At its July 2015 meeting, the Board unanimously determined to renew the fund's Advisory Contracts. In reaching its determination, the Board considered all factors it believed relevant, including (i) the nature, extent, and quality of the services to be provided to the fund and its shareholders (including the investment performance of the fund); (ii) the competitiveness of the fund's management fee and total expense ratio relative to peer funds; (iii) the total costs of the services to be provided by and the profits to be realized by Fidelity from its relationship with the fund; and (iv) the extent to which (if any) economies of scale exist and would be realized as the fund grows, and whether any economies of scale are appropriately shared with fund shareholders.
In considering whether to renew the Advisory Contracts for the fund, the Board reached a determination, with the assistance of fund counsel and Independent Trustees' counsel and through the exercise of its business judgment, that the renewal of the Advisory Contracts was in the best interests of the fund and its shareholders and that the compensation payable under the Advisory Contracts was fair and reasonable. The Board's decision to renew the Advisory Contracts was not based on any single factor, but rather was based on a comprehensive consideration of all the information provided to the Board at its meetings throughout the year. The Board, in reaching its determination to renew the Advisory Contracts, was aware that shareholders of the fund have a broad range of investment choices available to them, including a wide choice among funds offered by Fidelity's competitors, and that the fund's shareholders, who have the opportunity to review and weigh the disclosure provided by the fund in its prospectus and other public disclosures, have chosen to invest in this fund, which is part of the Fidelity family of funds.
Nature, Extent, and Quality of Services Provided. The Board considered Fidelity's staffing as it relates to the fund, including the backgrounds of investment personnel of Fidelity, and also considered the fund's investment objective, strategies, and related investment philosophy. The Independent Trustees also had discussions with senior management of Fidelity's investment operations and investment groups. The Board considered the structure of the portfolio manager compensation program and whether this structure provides appropriate incentives to act in the best interests of the fund. Additionally, the Board considered the portfolio managers' investments, if any, in the funds that they manage.
Resources Dedicated to Investment Management and Support Services. The Board and the Fund Oversight and Research Committees reviewed the general qualifications and capabilities of Fidelity's investment staff, including its size, education, experience, and resources, as well as Fidelity's approach to recruiting, training, managing, and compensating investment personnel. The Board noted that Fidelity has continued to increase the resources devoted to non-U.S. offices, including expansion of Fidelity's global investment organization. The Board also noted that Fidelity's analysts have extensive resources, tools and capabilities that allow them to conduct sophisticated quantitative and fundamental analysis, as well as credit analysis of issuers, counterparties and guarantors. Further, the Board considered that Fidelity's investment professionals have sufficient access to global information and data so as to provide competitive investment results over time, and that those professionals also have access to sophisticated tools that permit them to assess portfolio construction and risk and performance attribution characteristics continuously, as well as to transmit new information and research conclusions rapidly around the world. Additionally, in its deliberations, the Board considered Fidelity's trading, risk management, and compliance capabilities and resources, which are integral parts of the investment management process.
Shareholder and Administrative Services. The Board considered (i) the nature, extent, quality, and cost of advisory, administrative, and shareholder services performed by FMR, the sub-advisers (together with FMR, the Investment Advisers), and their affiliates under the Advisory Contracts and under separate agreements covering transfer agency, pricing and bookkeeping, and securities lending services for the fund; (ii) the nature and extent of the supervision of third party service providers, principally custodians and subcustodians; and (iii) the resources devoted to, and the record of compliance with, the fund's compliance policies and procedures. The Board also reviewed the allocation of fund brokerage, including allocations to brokers affiliated with the Investment Advisers, the use of brokerage commissions to pay fund expenses, and the use of "soft" commission dollars to pay for research services.
The Board noted that the growth of fund assets over time across the complex allows Fidelity to reinvest in the development of services designed to enhance the value or convenience of the Fidelity funds as investment vehicles. These services include 24-hour access to account information and market information through telephone representatives and over the Internet, investor education materials and asset allocation tools, and the expanded availability of Fidelity Investor Centers.
In 2014, the Board formed an ad hoc Committee on Transfer Agency Fees to review the variety of transfer agency fee structures throughout the industry and Fidelity's competitive positioning with respect to industry participants.
Investment in a Large Fund Family. The Board considered the benefits to shareholders of investing in a Fidelity fund, including the benefits of investing in a fund that is part of a large family of funds offering a variety of investment disciplines and providing a large variety of mutual fund investor services. The Board noted that Fidelity had taken, or had made recommendations that resulted in the Fidelity funds taking, a number of actions over the previous year that benefited particular funds, including (i) continuing to dedicate additional resources to investment research and to the support of the senior management team that oversees asset management; (ii) continuing efforts to enhance Fidelity's global research capabilities; (iii) launching new funds and making other enhancements to meet client needs; (iv) reducing management fees and total expenses for certain index funds and diversified international funds; (v) continuing to launch dedicated lower cost underlying funds to meet portfolio construction needs related to expanding underlying fund options for Fidelity funds of funds, specifically for the Freedom Fund product lines; (vi) rationalizing product lines and gaining increased efficiencies through fund mergers; (vii) launching active fixed-income exchange-traded funds; (viii) continuing to develop, acquire and implement systems and technology to improve services to the funds and information security and to increase efficiency; (ix) implementing investment enhancements to further strengthen Fidelity's target date product line to increase investors' probability of success in achieving their goals; (x) modifying the eligibility criteria for certain share classes to accommodate roll-over assets from employer-sponsored retirement plans; (xi) launching a new Class W of the Freedom Index Funds to attract and retain Fidelity record-kept retirement plan assets; and (xii) implementing changes to Fidelity's money market product line in response to recent money market regulatory reforms.
Investment Performance. The Board considered whether the fund has operated in accordance with its investment objective, as well as its record of compliance with its investment restrictions and its performance history. The Board noted that there was a portfolio management change for the fund in October 2012.
The Board took into account discussions with representatives of the Investment Advisers about fund investment performance that occur at Board meetings throughout the year. In this regard the Board noted that as part of regularly scheduled fund reviews and other reports to the Board on fund performance, the Board considers annualized return information for the fund, for different time periods, measured against a securities market index ("benchmark index") and a peer group of funds with similar objectives ("peer group"), if any. In its evaluation of fund investment performance, the Board gave particular attention to information indicating changes in performance of certain Fidelity funds for specific time periods and discussed with the Investment Advisers the reasons for any overperformance or underperformance.
In addition to reviewing absolute and relative fund performance, the Independent Trustees periodically consider the appropriateness of fund performance metrics in evaluating the results achieved. In general, the Independent Trustees believe that fund performance should be evaluated based on net performance (after fees and expenses) of both the highest performing and lowest performing fund share classes, where applicable, compared to appropriate benchmark indices, over appropriate time periods that may include full market cycles, and compared to peer groups, as applicable, over the same periods, taking into account relevant factors including the following: general market conditions; issuer-specific information; and fund cash flows and other factors.
The Independent Trustees recognize that shareholders evaluate performance on a net basis over their own holding periods, for which one-, three-, and five-year periods are often used as a proxy. For this reason, the performance information reviewed by the Board also included net cumulative calendar year total return information for the fund and an appropriate benchmark index and peer group for the most recent one-, three-, and five-year periods, as shown below. Returns are shown compared to the 25th percentile (top of box, 75% beaten) and 75th percentile (bottom of box, 25% beaten) of the peer universe.
Fidelity Advisor Emerging Markets Fund
Based on its review, the Board concluded that the nature, extent, and quality of services provided to the fund under the Advisory Contracts should benefit the shareholders of the fund.
Competitiveness of Management Fee and Total Expense Ratio. The Board considered the fund's management fee and total expense ratio compared to "mapped groups" of competitive funds and classes created for the purpose of facilitating the Trustees' competitive analysis of management fees and total expenses. Fidelity creates "mapped groups" by combining similar Lipper investment objective categories that have comparable investment mandates. Combining Lipper investment objective categories aids the Board's management fee and total expense ratio comparisons by broadening the competitive group used for comparison.
Management Fee. The Board considered two proprietary management fee comparisons for the 12-month periods shown in basis points (BP) in the chart below. The group of Lipper funds used by the Board for management fee comparisons is referred to below as the "Total Mapped Group." The Total Mapped Group comparison focuses on a fund's standing in terms of gross management fees before expense reimbursements or caps relative to the total universe of funds with comparable investment mandates, regardless of whether their management fee structures also are comparable. Funds with comparable investment mandates offer exposure to similar types of securities. Funds with comparable management fee structures have similar management fee contractual arrangements (
e.g., flat rate charged for advisory services, all-inclusive fee rate,
etc.). "TMG %" represents the percentage of funds in the Total Mapped Group that had management fees that were lower than the fund's. For example, a hypothetical TMG % of 20% would mean that 80% of the funds in the Total Mapped Group had higher, and 20% had lower, management fees than the fund. The fund's actual TMG %s and the number of funds in the Total Mapped Group are in the chart below. The "Asset-Size Peer Group" (ASPG) comparison focuses on a fund's standing relative to a subset of non-Fidelity funds within the Total Mapped Group that are similar in size and management fee structure without taking into account performance adjustments, if any. For example, if a fund is in the first quartile of the ASPG, the fund's management fee ranks in the least expensive or lowest 25% of funds in the ASPG. The ASPG represents at least 15% of the funds in the Total Mapped Group with comparable asset size and management fee structures, subject to a minimum of 50 funds (or all funds in the Total Mapped Group if fewer than 50). Additional information, such as the ASPG quartile in which the fund's management fee rate ranked, is also included in the chart and considered by the Board.
Fidelity Advisor Emerging Markets Fund
The Board noted that the fund's management fee rate ranked below the median of its Total Mapped Group and below the median of its ASPG for 2014.
The Board noted that, in 2014, the ad hoc Committee on Group Fee was formed by it and other Fidelity fund boards to conduct an in-depth review of the "group fee" component of the management fee of funds with such management fee structures. Committee focus included the mechanics of the group fee, the competitive landscape of group fee structures, Fidelity funds with no group fee component and investment products not included in group fee assets. The Board also considered that, for funds subject to the group fee, FMR agreed to voluntarily waive fees over a specified period of time in amounts designed to account for assets converted from certain funds to certain collective investment trusts.
The Board also noted that, in 2013, the ad hoc Committee on Management Fees was formed to conduct an in-depth review of the management fee rates of Fidelity's active equity mutual funds. The Committee focused on the following areas: (i) standard fee structures; (ii) research consumption and trading evolution; (iii) management fee competitiveness/profitability by category; and (iv) factors that drive institutional pricing.
Based on its review, the Board concluded that the fund's management fee is fair and reasonable in light of the services that the fund receives and the other factors considered.
Total Expense Ratio. In its review of each class's total expense ratio, the Board considered the fund's management fee as well as other fund or class expenses, as applicable, such as transfer agent fees, pricing and bookkeeping fees, fund-paid 12b-1 fees, and custodial, legal, and audit fees. The Board also noted that Fidelity may agree to waive fees and expenses from time to time, and the extent to which, if any, it has done so for the fund. As part of its review, the Board also considered the current and historical total expense ratios of each class of the fund compared to competitive fund median expenses. Each class of the fund is compared to those funds and classes in the Total Mapped Group (used by the Board for management fee comparisons) that have a similar sales load structure.
The Board noted that the total expense ratio of each of Class A, Class B, Class C, Class I, and Class Z ranked below its competitive median for 2014 and the total expense ratio of Class T ranked above its competitive median for 2014. The Board considered that, in general, various factors can affect total expense ratios. The Board noted that the total expense ratio of Class T was above the competitive median primarily because of higher 12b-1 fees on Class T as compared to most competitor funds. Class T has a higher 12b-1 fee, but a lower front-end sales charge, than traditionally priced front-end sales charge classes. The Board considered that Class T is primarily sold load-waived in the retirement plan market where its 0.50% 12b-1 fee is comparable to competing no-load, higher 12b-1 fee classes designed specifically for retirement plans. The Board noted that the fund offers multiple classes, each of which has a different sales load and 12b-1 fee structure, and that the multiple structures are intended to offer a range of pricing options for the intermediary market. The Board also noted that the total expense ratios of the classes vary primarily by the level of their 12b-1 fees, although differences in transfer agent fees may also cause expenses to vary from class to class.
Fees Charged to Other Fidelity Clients. The Board also considered Fidelity fee structures and other information with respect to clients of Fidelity, such as other funds advised or subadvised by Fidelity, pension plan clients, and other institutional clients with similar mandates. The Board noted the findings of the 2013 ad hoc joint committee (created with the board of other Fidelity funds), which reviewed and compared Fidelity's institutional investment advisory business with its business of providing services to the Fidelity funds, including the differences in services provided, fees charged, and costs incurred, as well as competition in their respective marketplaces.
Based on its review of total expense ratios and fees charged to other Fidelity clients, the Board concluded that, although Class T was above the median of the universe presented for comparison, the total expense ratio of each class of the fund was reasonable in light of the services that the fund and its shareholders receive and the other factors considered.
Costs of the Services and Profitability. The Board considered the revenues earned and the expenses incurred by Fidelity in conducting the business of developing, marketing, distributing, managing, administering and servicing the fund and servicing the fund's shareholders. The Board also considered the level of Fidelity's profits in respect of all the Fidelity funds.
On an annual basis, Fidelity presents to the Board information about the profitability of its relationship with the fund. Fidelity calculates profitability information for each fund, as well as aggregate profitability information for groups of Fidelity funds and all Fidelity funds, using a series of detailed revenue and cost allocation methodologies which originate with the books and records of Fidelity on which Fidelity's audited financial statements are based. The Audit Committee of the Board reviews any significant changes from the prior year's methodologies.
PricewaterhouseCoopers LLP (PwC), independent registered public accounting firm and auditor to Fidelity and certain Fidelity funds, has been engaged annually by the Board as part of the Board's assessment of Fidelity's profitability analysis. PwC's engagement includes the review and assessment of the methodologies used by Fidelity in determining the revenues and expenses attributable to Fidelity's mutual fund business, and completion of agreed-upon procedures in respect of the mathematical accuracy of fund profitability and its conformity to established allocation methodologies. After considering PwC's reports issued under the engagement and information provided by Fidelity, the Board concluded that while other allocation methods may also be reasonable, Fidelity's profitability methodologies are reasonable in all material respects.
The Board also reviewed Fidelity's non-fund businesses and fall-out benefits related to the mutual fund business as well as cases where Fidelity's affiliates may benefit from or be related to the fund's business.
The Board considered the costs of the services provided by and the profits realized by Fidelity in connection with the operation of the fund and was satisfied that the profitability was not excessive.
Economies of Scale. The Board considered whether there have been economies of scale in respect of the management of the Fidelity funds, whether the Fidelity funds (including the fund) have appropriately benefited from any such economies of scale, and whether there is potential for realization of any further economies of scale. The Board considered the extent to which the fund will benefit from economies of scale as assets grow through increased services to the fund, through waivers or reimbursements, or through fee or expense ratio reductions. The Board also noted that in 2013, it and the boards of other Fidelity funds created an ad hoc committee (the Economies of Scale Committee) to analyze whether Fidelity attains economies of scale in respect of the management and servicing of the Fidelity funds, whether the Fidelity funds have appropriately benefited from such economies of scale, and whether there is potential for realization of any further economies of scale.
The Board recognized that the fund's management contract incorporates a "group fee" structure, which provides for lower group fee rates as total group assets increase, and for higher group fee rates as total group assets decrease (with "group assets" defined to include fund assets under FMR's management plus sector fund assets previously under FMR's management and currently managed by Fidelity SelectCo, LLC). FMR calculates the group fee rates based on a tiered asset "breakpoint" schedule that varies based on asset class. The Board considered that the group fee is designed to deliver the benefits of economies of scale to fund shareholders when total Fidelity fund assets increase, even if assets of any particular fund are unchanged or have declined, because some portion of Fidelity's costs are attributable to services provided to all Fidelity funds, and all funds benefit if those costs can be allocated among more assets. The Board concluded that, given the group fee structure, fund shareholders will benefit from lower management fees as group assets increase at the fund complex level, regardless of whether Fidelity achieves any such economies of scale.
The Board concluded, taking into account the analysis of the Economies of Scale Committee, that economies of scale, if any, are being appropriately shared between fund shareholders and Fidelity.
Additional Information Requested by the Board. In order to develop fully the factual basis for consideration of the Fidelity funds' Advisory Contracts, the Board requested and received additional information on certain topics, including: (i) fund performance trends and Fidelity's long-term strategies for certain funds; (ii) the various share classes employed by Fidelity and the attributes of each class, together with similar information on the distribution and servicing payments made by Fidelity or the funds to third-party participants in the distribution channels; (iii) fund profitability, and fund performance in relation to fund profitability; (iv) the methodology with respect to evaluating competitive fund data and peer group classifications and fee comparisons; (v) annual fund profitability margins, with particular focus on certain funds with negative margins; (vi) the realization of fall-out benefits in certain Fidelity business units;
(vii) economies of scale and the way in which they are shared with fund shareholders;(viii) Fidelity's group fee structures, including the group fee schedule of breakpoints;(ix) the impact of cost containment measures on the funds; and (x) the transfer agent fee structure.
Based on its evaluation of all of the conclusions noted above, and after considering all factors it believed relevant, the Board concluded that the advisory fee structures are fair and reasonable, and that the fund's Advisory Contracts should be renewed.
FAEMZ-ANN-1215
1.9585022.102
Fidelity Advisor® Global Capital Appreciation Fund Class A, Class T, Class B and Class C
Annual Report October 31, 2015 |
|
Contents
To view a fund's proxy voting guidelines and proxy voting record for the 12-month period ended June 30, visit http://www.fidelity.com/proxyvotingresults or visit the Securities and Exchange Commission's (SEC) web site at http://www.sec.gov.
You may also call 1-877-208-0098 to request a free copy of the proxy voting guidelines.
Standard & Poor's, S&P and S&P 500 are registered service marks of The McGraw-Hill Companies, Inc. and have been licensed for use by Fidelity Distributors Corporation.
Other third-party marks appearing herein are the property of their respective owners.
All other marks appearing herein are registered or unregistered trademarks or service marks of FMR LLC or an affiliated company. © 2015 FMR LLC. All rights reserved.
This report and the financial statements contained herein are submitted for the general information of the shareholders of the Fund. This report is not authorized for distribution to prospective investors in the Fund unless preceded or accompanied by an effective prospectus.
A fund files its complete schedule of portfolio holdings with the SEC for the first and third quarters of each fiscal year on Form N-Q. Forms N-Q are available on the SEC’s web site at http://www.sec.gov. A fund's Forms N-Q may be reviewed and copied at the SEC’s Public Reference Room in Washington, DC. Information regarding the operation of the SEC's Public Reference Room may be obtained by calling 1-800-SEC-0330.
For a complete list of a fund's portfolio holdings, view the most recent holdings listing, semiannual report, or annual report on Fidelity's web site at http://www.fidelity.com, http://www.advisor.fidelity.com, or http://www.401k.com, as applicable.
NOT FDIC INSURED •MAY LOSE VALUE •NO BANK GUARANTEE
Neither the Fund nor Fidelity Distributors Corporation is a bank.
Performance: The Bottom Line
Average annual total return reflects the change in the value of an investment, assuming reinvestment of distributions from dividend income and capital gains (the profits earned upon the sale of securities that have grown in value, if any) and assuming a constant rate of performance each year.
The hypothetical investment and the average annual total returns do not reflect the deduction of taxes that a shareholder would pay on fund distributions or the redemption of fund shares.
During periods of reimbursement by Fidelity, a fund’s total return will be greater than it would be had the reimbursement not occurred.
How a fund did yesterday is no guarantee of how it will do tomorrow.
Returns reflect the conversion of Class B shares to Class A shares after a maximum of seven years.
Average Annual Total Returns
| For the periods ended October 31, 2015 | Past 1 year | Past 5 years | Past 10 years |
| Class A (incl. 5.75% sales charge) | (2.24)% | 5.80% | 4.08% |
| Class T (incl. 3.50% sales charge) | (0.18)% | 6.03% | 4.06% |
| Class B (incl. contingent deferred sales charge) | (2.02)% | 5.94% | 4.16% |
| Class C (incl. contingent deferred sales charge) | 1.92% | 6.27% | 3.92% |
Class B shares' contingent deferred sales charges included in the past one year, past five years and past ten years total return figures are 5%, 2% and 0%, respectively.
Class C shares' contingent deferred sales charges included in the past one year, past five years and past ten years total return figures are 1%, 0% and 0%, respectively.
$10,000 Over 10 Years
Let's say hypothetically that $10,000 was invested in Fidelity Advisor® Global Capital Appreciation Fund - Class A on October 31, 2005, and the current 5.75% sales charge was paid.
The chart shows how the value of your investment would have changed, and also shows how the MSCI ACWI (All Country World Index) Index performed over the same period.
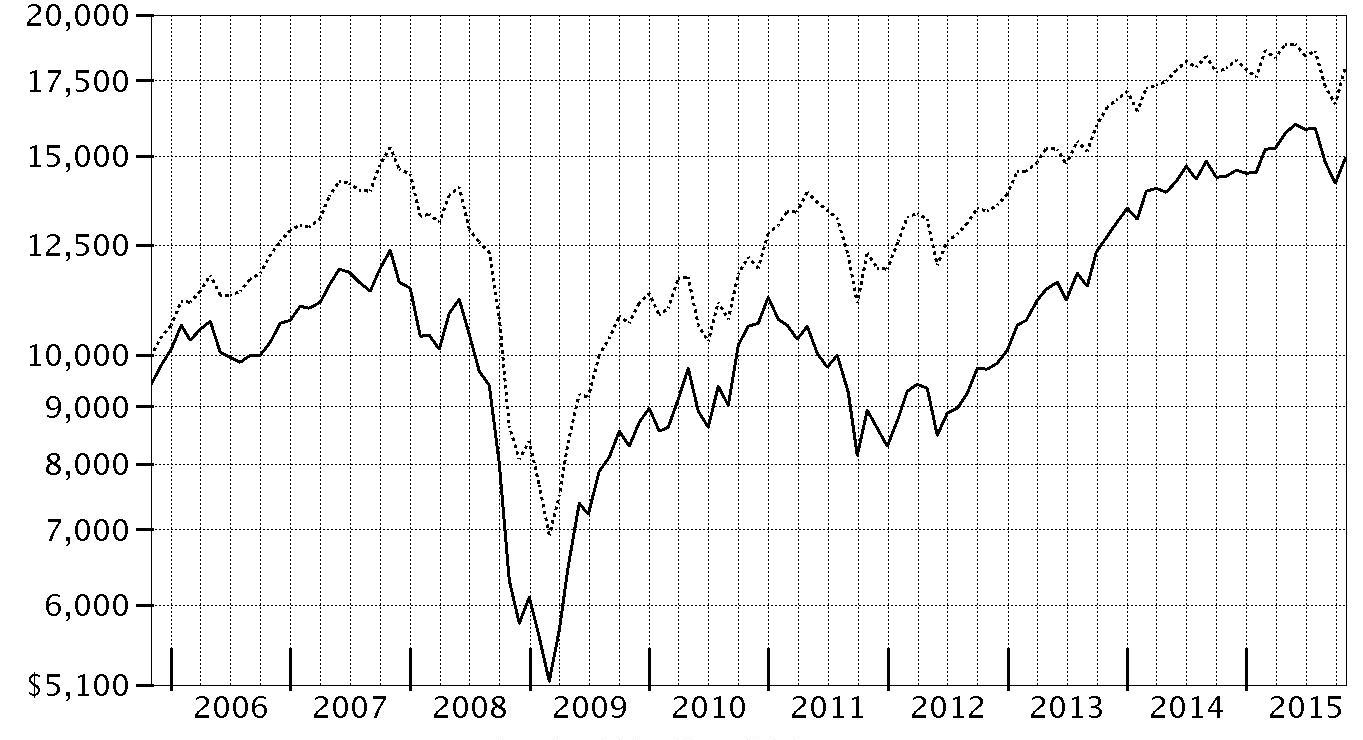
| Period Ending Values |
| $14,921 | Fidelity Advisor® Global Capital Appreciation Fund - Class A |
| $17,992 | MSCI ACWI (All Country World Index) Index |
Management's Discussion of Fund Performance
Market Recap: Following an August and September wherein a collapse in commodities prices hurt resources-related sectors and geographies, global equities rebounded in October to finish flat for the 12 months ending October 31, 2015. The MSCI ACWI (All Country World Index) Index returned 0.35% for the period. Commodity producers remained under pressure for much of the past year, largely related to economic deceleration in China (-1%), the world’s second-largest economy and a leading consumer of raw materials. This effect was exacerbated by the strength of the U.S. dollar relative to global currencies, which weighed on commodities priced in dollars and acutely impacted equity returns within regions most exposed to resources prices. For example, the emerging-markets group returned -15% this period. Canada, a significant energy producer, returned about -17%. Conversely, net energy consumer Japan (+9%) proved the best-performing region by far. Only about a quarter of the nearly 50 countries in the index managed a gain: Israel (+17%) and fast-growing Ireland (+12%) performed best; Greece (-56%) and Brazil (-46%), among the worst. As for sectors, energy (-22%) and materials (-12%) declined sharply, while consumer discretionary (+13%) saw a gain driven largely by demand in the United States (+5%).
Comments from Portfolio Manager Thomas Allen: For the year, the fund’s share classes (excluding sales charges, if applicable) posted low-single-digit gains but considerably outperformed the MSCI ACWI benchmark. Versus the index, picks in information technology, financials and industrials were noteworthy positives. A sizable underweighting in energy, by far the weakest-performing sector in the benchmark, also worked in our favor. Global Payments was the fund’s top contributor. The provider of payment processing services announced strong quarterly earnings in July and October, helping to boost our position here to a robust gain. Other noteworthy contributors included AMN Healthcare Services, which provides recruitment process outsourcing and placement of physicians, nurses and other health care professionals, and Denmark-based biotech company Genmab. All three contributors were non-benchmark positions, and I sold AMN from the portfolio in June. Conversely, the fund’s cash position was a drag on performance, as was its positioning in consumer staples to a lesser extent. Geographically, stock selection in China was a noteworthy negative. At the stock level, not owning strong-performing index stock Amazon.com was our biggest relative detractor. Non-index positions in Abraxas Petroleum and Belden, a manufacturer of networking, connectivity and cable products, also detracted.
The views expressed above reflect those of the portfolio manager(s) only through the end of the period as stated on the cover of this report and do not necessarily represent the views of Fidelity or any other person in the Fidelity organization. Any such views are subject to change at any time based upon market or other conditions and Fidelity disclaims any responsibility to update such views. These views may not be relied on as investment advice and, because investment decisions for a Fidelity fund are based on numerous factors, may not be relied on as an indication of trading intent on behalf of any Fidelity fund.
Investment Summary (Unaudited)
Top Five Stocks as of October 31, 2015
| | % of fund's net assets | % of fund's net assets 6 months ago |
| Citigroup, Inc. (United States of America, Banks) | 1.2 | 0.6 |
| Global Payments, Inc. (United States of America, IT Services) | 1.1 | 1.0 |
| Alphabet, Inc. Class A (United States of America, Internet Software & Services) | 1.1 | 0.0 |
| Vantiv, Inc. (United States of America, IT Services) | 1.0 | 0.0 |
| CDW Corp. (United States of America, Electronic Equipment & Components) | 0.9 | 0.7 |
| | 5.3 | |
Top Five Market Sectors as of October 31, 2015
| | % of fund's net assets | % of fund's net assets 6 months ago |
| Consumer Discretionary | 21.9 | 19.3 |
| Information Technology | 21.0 | 18.9 |
| Financials | 16.4 | 19.1 |
| Health Care | 13.0 | 12.7 |
| Industrials | 12.0 | 17.7 |
Top Five Countries as of October 31, 2015
| (excluding cash equivalents) | % of fund's net assets | % of fund's net assets 6 months ago |
| United States of America | 54.4 | 39.8 |
| Japan | 7.1 | 7.3 |
| United Kingdom | 4.5 | 5.1 |
| Canada | 3.0 | 3.2 |
| Germany | 2.4 | 3.5 |
Percentages are adjusted for the effect of futures contracts, if applicable.
Asset Allocation (% of fund's net assets)
| As of October 31, 2015 |
| | Stocks | 94.7% |
| | Short-Term Investments and Net Other Assets (Liabilities) | 5.3% |

| As of April 30, 2015 |
| | Stocks | 98.4% |
| | Short-Term Investments and Net Other Assets (Liabilities) | 1.6% |

Percentages shown as 0.0% may reflect amounts less than 0.05%.
Investments October 31, 2015
Showing Percentage of Net Assets
| Common Stocks - 94.4% | | | |
| | | Shares | Value |
| Australia - 1.4% | | | |
| Ausdrill Ltd. | | 246,041 | $60,156 |
| Burson Group Ltd. | | 147,119 | 374,059 |
| CSG Ltd. | | 222,798 | 255,140 |
| Echo Entertainment Group Ltd. | | 103,003 | 372,275 |
| Estia Health Ltd. | | 55,472 | 293,162 |
| Imdex Ltd. (a) | | 192,909 | 30,766 |
| Isentia Group Ltd. | | 89,437 | 262,767 |
| Japara Healthcare Ltd. | | 170,999 | 375,956 |
| Sonic Healthcare Ltd. | | 502 | 6,866 |
|
| TOTAL AUSTRALIA | | | 2,031,147 |
|
| Austria - 0.3% | | | |
| CA Immobilien Anlagen AG | | 18,300 | 358,904 |
| IMMOFINANZ Immobilien Anlagen AG (a) | | 46,100 | 118,218 |
|
| TOTAL AUSTRIA | | | 477,122 |
|
| Bailiwick of Jersey - 0.3% | | | |
| Delphi Automotive PLC | | 5,700 | 474,183 |
| Belgium - 0.3% | | | |
| Ion Beam Applications SA | | 10,700 | 381,815 |
| Bermuda - 1.3% | | | |
| Beijing Enterprises Water Group Ltd. | | 440,000 | 348,490 |
| BW LPG Ltd. | | 6,900 | 46,857 |
| Genpact Ltd. (a) | | 47,700 | 1,182,006 |
| Great Eagle Holdings Ltd. | | 34,590 | 113,779 |
| Hiscox Ltd. | | 14,815 | 220,965 |
|
| TOTAL BERMUDA | | | 1,912,097 |
|
| Brazil - 0.1% | | | |
| Brasil Foods SA | | 3,500 | 54,544 |
| Direcional Engenharia SA | | 57,600 | 52,872 |
| Natura Cosmeticos SA | | 3,700 | 21,970 |
|
| TOTAL BRAZIL | | | 129,386 |
|
| British Virgin Islands - 0.0% | | | |
| Epic Gas Ltd. (a) | | 5,100 | 9,003 |
| Canada - 3.0% | | | |
| B2Gold Corp. (a) | | 42,500 | 45,828 |
| CCL Industries, Inc. Class B | | 500 | 70,836 |
| Colliers International Group, Inc. | | 10,400 | 515,528 |
| Constellation Software, Inc. | | 600 | 259,254 |
| Descartes Systems Group, Inc. (a) | | 5,700 | 99,737 |
| Espial Group, Inc. (a) | | 119,635 | 230,560 |
| FirstService Corp. | | 2,700 | 94,983 |
| Lions Gate Entertainment Corp. | | 14,600 | 568,962 |
| MDC Partners, Inc. Class A (sub. vtg.) | | 24,500 | 513,520 |
| New Gold, Inc. (a) | | 5,700 | 14,124 |
| North West Co., Inc. | | 14,300 | 317,146 |
| Pason Systems, Inc. | | 4,300 | 63,270 |
| PrairieSky Royalty Ltd. | | 3,100 | 61,000 |
| Premium Brands Holdings Corp. | | 13,300 | 349,588 |
| Richelieu Hardware Ltd. | | 3,600 | 189,223 |
| Stella-Jones, Inc. | | 2,800 | 103,041 |
| Suncor Energy, Inc. | | 30,900 | 919,485 |
|
| TOTAL CANADA | | | 4,416,085 |
|
| Cayman Islands - 1.3% | | | |
| Anta Sports Products Ltd. | | 128,000 | 358,058 |
| Cheung Kong Property Holdings Ltd. | | 13,500 | 94,461 |
| Chlitina Holding Ltd. | | 42,000 | 344,124 |
| Fu Shou Yuan International Group Ltd. | | 554,000 | 377,736 |
| Geely Automobile Holdings Ltd. | | 680,000 | 362,622 |
| Greatview Aseptic Pack Co. Ltd. | | 206,000 | 96,708 |
| Xinyi Solar Holdings Ltd. | | 804,000 | 319,618 |
|
| TOTAL CAYMAN ISLANDS | | | 1,953,327 |
|
| China - 0.9% | | | |
| Beijing Urban Consolidated & Development Group Ltd. (H Shares) | | 158,000 | 97,208 |
| Inner Mongoli Yili Industries Co. Ltd. | | 137,900 | 346,871 |
| Kweichow Moutai Co. Ltd. | | 10,226 | 345,268 |
| PICC Property & Casualty Co. Ltd. (H Shares) | | 109,720 | 248,962 |
| Xinjiang Goldwind Science & Technology Co. Ltd. (H Shares) | | 169,800 | 318,880 |
|
| TOTAL CHINA | | | 1,357,189 |
|
| Curacao - 0.2% | | | |
| Sapiens International Corp. NV | | 26,281 | 310,687 |
| Denmark - 0.7% | | | |
| Ambu A/S Series B | | 700 | 18,990 |
| Genmab A/S (a) | | 6,400 | 631,286 |
| SimCorp A/S | | 7,300 | 357,877 |
|
| TOTAL DENMARK | | | 1,008,153 |
|
| France - 0.4% | | | |
| ALTEN | | 5,400 | 280,279 |
| Les Nouveaux Construct Investment SA | | 5,700 | 122,790 |
| Sartorius Stedim Biotech | | 600 | 212,024 |
|
| TOTAL FRANCE | | | 615,093 |
|
| Germany - 2.1% | | | |
| BAUER AG | | 17,000 | 358,926 |
| DIC Asset AG | | 38,500 | 378,997 |
| GFT Technologies AG | | 13,400 | 395,938 |
| Krones AG | | 1,900 | 228,573 |
| MLP AG | | 12,800 | 55,612 |
| Nemetschek AG | | 3,700 | 159,697 |
| Open Business Club AG | | 1,400 | 276,496 |
| Patrizia Immobilien AG | | 10,549 | 290,179 |
| Rational AG | | 800 | 317,623 |
| Stroer Out-of-Home Media AG | | 3,900 | 246,125 |
| VTG AG (b) | | 12,600 | 411,442 |
|
| TOTAL GERMANY | | | 3,119,608 |
|
| Greece - 0.1% | | | |
| Mytilineos Holdings SA | | 21,200 | 113,066 |
| Hong Kong - 0.6% | | | |
| Hang Lung Properties Ltd. | | 157,000 | 384,151 |
| MTR Corp. Ltd. | | 6 | 27 |
| Sino Land Ltd. | | 68,000 | 104,958 |
| Techtronic Industries Co. Ltd. | | 103,000 | 376,535 |
|
| TOTAL HONG KONG | | | 865,671 |
|
| India - 1.2% | | | |
| Bajaj Corp. Ltd. (a) | | 52,807 | 330,529 |
| Bharti Infratel Ltd. | | 25,014 | 148,566 |
| Britannia Industries Ltd. | | 179 | 8,828 |
| Dalmia Bharat Ltd. (a) | | 817 | 8,785 |
| HDFC Bank Ltd. (a) | | 13,770 | 276,180 |
| Housing Development Finance Corp. Ltd. | | 9,288 | 177,912 |
| Kalpataru Power Transmission Ltd. (a) | | 1,663 | 6,608 |
| Maruti Suzuki India Ltd. (a) | | 5,545 | 377,134 |
| Pc Jeweller Ltd. (a) | | 1,028 | 6,979 |
| Pfizer Ltd. | | 9,128 | 355,080 |
| Torrent Pharmaceuticals Ltd. | | 307 | 7,215 |
|
| TOTAL INDIA | | | 1,703,816 |
|
| Indonesia - 0.4% | | | |
| PT ACE Hardware Indonesia Tbk | | 98,900 | 4,815 |
| PT Astra International Tbk | | 11,100 | 4,772 |
| PT Bank Rakyat Indonesia Tbk | | 283,800 | 217,208 |
| Waskita Karya Persero Tbk PT | | 2,686,500 | 317,894 |
|
| TOTAL INDONESIA | | | 544,689 |
|
| Ireland - 1.8% | | | |
| Accenture PLC Class A | | 700 | 75,040 |
| C&C Group PLC | | 49,985 | 199,527 |
| Fleetmatics Group PLC (a) | | 5,500 | 306,130 |
| Jazz Pharmaceuticals PLC (a) | | 6,500 | 892,320 |
| Medtronic PLC | | 15,500 | 1,145,760 |
|
| TOTAL IRELAND | | | 2,618,777 |
|
| Isle of Man - 0.5% | | | |
| Optimal Payments PLC (a) | | 145,700 | 682,818 |
| Israel - 0.6% | | | |
| Frutarom Industries Ltd. | | 8,400 | 362,994 |
| Teva Pharmaceutical Industries Ltd. sponsored ADR | | 9,200 | 544,548 |
|
| TOTAL ISRAEL | | | 907,542 |
|
| Italy - 0.1% | | | |
| Mediaset SpA | | 34,100 | 173,241 |
| Japan - 7.1% | | | |
| Ain Holdings, Inc. | | 8,500 | 402,380 |
| Alps Electric Co. Ltd. | | 7,900 | 245,210 |
| Asahi Co. Ltd. | | 76,600 | 752,380 |
| ASKUL Corp. | | 4,400 | 161,506 |
| Broadleaf Co. Ltd. | | 19,300 | 221,074 |
| Chodai Co. Ltd. | | 27,500 | 131,127 |
| FJ Next Co. Ltd. | | 18,600 | 84,949 |
| GCA Savvian Group Corp. | | 10,800 | 126,807 |
| Gulliver International Co. Ltd. (b) | | 37,200 | 374,765 |
| Hoshizaki Electric Co. Ltd. | | 2,500 | 180,771 |
| Hoya Corp. | | 18,300 | 755,182 |
| Jamco Corp. | | 4,200 | 176,177 |
| JK Holdings Co. Ltd. | | 16,200 | 68,331 |
| KDDI Corp. | | 15,000 | 362,975 |
| Kinugawa Rubber Industrial Co. Ltd. | | 52,000 | 290,060 |
| Koshidaka Holdings Co. Ltd. | | 15,200 | 275,164 |
| Message Co. Ltd. | | 7,900 | 194,717 |
| Misumi Group, Inc. | | 15,600 | 203,145 |
| Monex Group, Inc. | | 132,300 | 371,898 |
| Nichi-iko Pharmaceutical Co. Ltd. | | 12,700 | 352,480 |
| Olympus Corp. | | 22,900 | 772,447 |
| Open House Co. Ltd. | | 24,700 | 450,586 |
| Penta-Ocean Construction Co. Ltd. | | 117,600 | 534,045 |
| Saizeriya Co. Ltd. | | 16,300 | 369,462 |
| Sakai Heavy Industries Ltd. | | 36,000 | 70,774 |
| Seikitokyu Kogyo Co. Ltd. | | 67,700 | 331,766 |
| Sohgo Security Services Co., Ltd. | | 4,400 | 212,270 |
| Suzuki Motor Corp. | | 7,500 | 245,576 |
| Temp Holdings Co., Ltd. | | 13,200 | 197,074 |
| Toshiba Corp. | | 29,000 | 81,811 |
| Tsuruha Holdings, Inc. | | 6,900 | 546,646 |
| United Arrows Ltd. | | 9,700 | 417,885 |
| Unizo Holdings Co. Ltd. | | 9,300 | 394,798 |
|
| TOTAL JAPAN | | | 10,356,238 |
|
| Korea (South) - 0.7% | | | |
| Cosmax Bti, Inc. | | 130 | 8,118 |
| Cuckoo Electronics Co. Ltd. | | 1,452 | 318,563 |
| Fila Korea Ltd. | | 1,480 | 129,623 |
| KONA I Co. Ltd. | | 8,453 | 271,335 |
| LG Household & Health Care Ltd. | | 16 | 13,271 |
| Osstem Implant Co. Ltd. (a) | | 6,209 | 363,262 |
|
| TOTAL KOREA (SOUTH) | | | 1,104,172 |
|
| Liberia - 0.2% | | | |
| Royal Caribbean Cruises Ltd. | | 2,900 | 285,215 |
| Malaysia - 0.8% | | | |
| Globetronics Technology Bhd | | 36,100 | 52,228 |
| Inari Amertron Bhd | | 400,500 | 331,980 |
| Kossan Rubber Industries Bhd | | 20,300 | 38,497 |
| My E.G.Services Bhd | | 526,300 | 361,398 |
| Top Glove Corp. Bhd | | 176,600 | 390,059 |
|
| TOTAL MALAYSIA | | | 1,174,162 |
|
| Marshall Islands - 0.1% | | | �� |
| StealthGas, Inc. (a) | | 46,700 | 197,074 |
| Mexico - 1.7% | | | |
| Controladora Vuela Compania de Aviacion S.A.B. de CV (a) | | 141,100 | 240,893 |
| El Puerto de Liverpool S.A.B. de CV Class C | | 26,438 | 367,156 |
| Grupo Aeroportuario del Pacifico SA de CV Series B | | 9,700 | 87,364 |
| Grupo Aeroportuario del Sureste SA de CV Series B | | 8,345 | 129,243 |
| Grupo Aeroportuario Norte S.A.B. de CV | | 69,300 | 356,447 |
| Grupo Lala S.A.B. de CV | | 162,700 | 415,768 |
| Promotora y Operadora de Infraestructura S.A.B. de CV (a) | | 30,500 | 382,427 |
| Unifin Financiera SAPI de CV (a) | | 152,200 | 462,005 |
|
| TOTAL MEXICO | | | 2,441,303 |
|
| Netherlands - 1.2% | | | |
| Euronext NV | | 10,000 | 439,640 |
| Grandvision NV | | 12,900 | 356,694 |
| Heijmans NV (Certificaten Van Aandelen) (a) | | 12,700 | 106,837 |
| LyondellBasell Industries NV Class A | | 3,800 | 353,058 |
| Nsi NV | | 35,061 | 152,754 |
| NXP Semiconductors NV (a) | | 4,000 | 313,400 |
|
| TOTAL NETHERLANDS | | | 1,722,383 |
|
| New Zealand - 0.1% | | | |
| Fisher & Paykel Healthcare Corp. | | 19,412 | 102,267 |
| Norway - 0.2% | | | |
| XXL ASA | | 29,300 | 312,940 |
| Panama - 0.1% | | | |
| Copa Holdings SA Class A | | 3,200 | 161,664 |
| Poland - 0.2% | | | |
| Kruk SA | | 6,000 | 285,611 |
| South Africa - 0.8% | | | |
| Capitec Bank Holdings Ltd. | | 5,400 | 233,536 |
| Consolidated Infra Group Ltd. (a) | | 137,100 | 346,440 |
| Famous Brands Ltd. | | 200 | 1,948 |
| Mpact Ltd. | | 358 | 1,251 |
| Peregrine Holdings Ltd. | | 42,200 | 93,890 |
| Pick 'n Pay Stores Ltd. | | 74,400 | 359,662 |
| Pioneer Foods Ltd. | | 300 | 4,303 |
| Spar Group Ltd. | | 100 | 1,437 |
| Transaction Capital Ltd. | | 185,800 | 142,985 |
| Woolworths Holdings Ltd. | | 500 | 3,704 |
|
| TOTAL SOUTH AFRICA | | | 1,189,156 |
|
| Spain - 0.2% | | | |
| Melia Hotels International SA (b) | | 19,000 | 274,956 |
| Sweden - 1.3% | | | |
| AarhusKarlshamn AB | | 8,200 | 590,750 |
| Betsson AB (B Shares) | | 10,600 | 172,458 |
| HEXPOL AB (B Shares) | | 19,700 | 191,845 |
| ITAB Shop Concept AB | | 12,600 | 367,962 |
| Nibe Industrier AB (B Shares) | | 16,450 | 529,686 |
|
| TOTAL SWEDEN | | | 1,852,701 |
|
| Switzerland - 1.2% | | | |
| ACE Ltd. | | 9,100 | 1,033,214 |
| Lonza Group AG | | 3,006 | 441,571 |
| u-blox Holding AG | | 1,430 | 276,756 |
|
| TOTAL SWITZERLAND | | | 1,751,541 |
|
| Taiwan - 0.7% | | | |
| Aerospace Industries Development Corp. | | 4,000 | 5,089 |
| ECLAT Textile Co. Ltd. | | 2,000 | 29,509 |
| Hota Industrial Manufacturing Co. Ltd. | | 117,000 | 389,219 |
| Iron Force Industrial Co. Ltd. | | 66,000 | 366,949 |
| Makalot Industrial Co. Ltd. | | 2,069 | 15,805 |
| Sporton International, Inc. | | 27,561 | 167,242 |
| Voltronic Power Technology Corp. | | 3,150 | 40,363 |
|
| TOTAL TAIWAN | | | 1,014,176 |
|
| Thailand - 0.6% | | | |
| Kasikornbank PCL (For. Reg.) | | 17,900 | 86,587 |
| KCE Electronics PCL | | 7,500 | 13,024 |
| MC Group PCL | | 11,400 | 4,451 |
| Srisawad Power 1979 PCL | | 302,300 | 370,668 |
| Unique Engineering and Construction PCL | | 601,600 | 363,153 |
|
| TOTAL THAILAND | | | 837,883 |
|
| Turkey - 0.7% | | | |
| Aksa Akrilik Kimya Sanayii | | 72,000 | 264,252 |
| Bim Birlesik Magazalar A/S JSC | | 20,000 | 406,805 |
| Soda Sanayii AS | | 49,013 | 81,033 |
| Turk Tuborg Bira ve Malt Sanayii A/S (a) | | 165,000 | 354,857 |
|
| TOTAL TURKEY | | | 1,106,947 |
|
| United Kingdom - 4.5% | | | |
| 4Imprint Group PLC | | 19,900 | 397,278 |
| B&M European Value Retail S.A. | | 19,857 | 102,059 |
| Barratt Developments PLC | | 71,800 | 677,957 |
| Bellway PLC | | 7,800 | 312,156 |
| Cineworld Group PLC | | 48,700 | 414,419 |
| Crest Nicholson PLC | | 34,400 | 288,489 |
| Development Securities PLC | | 26,800 | 98,536 |
| Domino's Pizza UK & IRL PLC | | 10,500 | 176,598 |
| Ensco PLC Class A | | 19,700 | 327,611 |
| Lloyds Banking Group PLC | | 299,900 | 340,390 |
| Marshalls PLC | | 61,900 | 330,648 |
| Micro Focus International PLC | | 18,600 | 360,142 |
| Moneysupermarket.com Group PLC | | 134,000 | 690,372 |
| Persimmon PLC | | 13,800 | 424,205 |
| Redrow PLC | | 42,686 | 305,400 |
| Rightmove PLC | | 5,600 | 331,419 |
| Taylor Wimpey PLC | | 128,100 | 391,008 |
| The Restaurant Group PLC | | 52,700 | 582,507 |
| Virgin Money Holdings Uk PLC | | 16,200 | 96,849 |
|
| TOTAL UNITED KINGDOM | | | 6,648,043 |
|
| United States of America - 54.4% | | | |
| Abraxas Petroleum Corp. (a) | | 408,100 | 648,879 |
| Acuity Brands, Inc. | | 800 | 174,880 |
| Adobe Systems, Inc. (a) | | 7,400 | 656,084 |
| AFLAC, Inc. | | 8,400 | 535,500 |
| Air Lease Corp. Class A | | 5,300 | 178,663 |
| Albemarle Corp. U.S. | | 14,300 | 765,336 |
| Alere, Inc. (a) | | 3,500 | 161,420 |
| Allegiant Travel Co. | | 3,000 | 592,350 |
| Alliance Data Systems Corp. (a) | | 4,000 | 1,189,240 |
| Alphabet, Inc.: | | | |
| Class A (a) | | 2,100 | 1,548,519 |
| Class C | | 1,259 | 894,910 |
| Altera Corp. | | 22,400 | 1,177,120 |
| AMC Networks, Inc. Class A (a) | | 8,900 | 657,621 |
| Amgen, Inc. | | 6,700 | 1,059,806 |
| Apache Corp. | | 15,200 | 716,376 |
| AutoZone, Inc. (a) | | 600 | 470,646 |
| Baxalta, Inc. | | 10,100 | 348,046 |
| Becton, Dickinson & Co. | | 7,800 | 1,111,656 |
| Biogen, Inc. (a) | | 1,900 | 551,969 |
| Blackhawk Network Holdings, Inc. (a) | | 26,600 | 1,132,628 |
| Boston Scientific Corp. (a) | | 66,700 | 1,219,276 |
| Brunswick Corp. | | 7,000 | 376,670 |
| Buffalo Wild Wings, Inc. (a) | | 100 | 15,427 |
| Cadence Design Systems, Inc. (a) | | 17,000 | 377,740 |
| Capital One Financial Corp. | | 11,600 | 915,240 |
| Catalent, Inc. (a) | | 24,800 | 659,184 |
| CBRE Group, Inc. (a) | | 20,100 | 749,328 |
| CDW Corp. | | 31,000 | 1,385,390 |
| Cigna Corp. | | 3,900 | 522,756 |
| CIT Group, Inc. | | 16,900 | 726,700 |
| Citigroup, Inc. | | 32,700 | 1,738,659 |
| Cognizant Technology Solutions Corp. Class A (a) | | 11,100 | 756,021 |
| Colfax Corp. (a) | | 11,600 | 312,736 |
| Cree, Inc. (a) | | 15,200 | 382,888 |
| Cummins, Inc. | | 3,100 | 320,881 |
| CVB Financial Corp. | | 68,300 | 1,191,835 |
| Cytec Industries, Inc. | | 1,700 | 126,514 |
| D.R. Horton, Inc. | | 13,000 | 382,720 |
| Deere & Co. | | 2,700 | 210,600 |
| Dermira, Inc. | | 3,100 | 83,669 |
| Discover Financial Services | | 6,400 | 359,808 |
| Dynegy, Inc. (a) | | 4,300 | 83,549 |
| Eastman Chemical Co. | | 4,200 | 303,114 |
| Electronic Arts, Inc. (a) | | 16,100 | 1,160,327 |
| Ethan Allen Interiors, Inc. | | 10,900 | 296,589 |
| Extra Space Storage, Inc. | | 2,200 | 174,328 |
| Facebook, Inc. Class A (a) | | 6,200 | 632,214 |
| Fair Isaac Corp. | | 9,300 | 859,041 |
| Fidelity National Information Services, Inc. | | 11,700 | 853,164 |
| First Republic Bank | | 16,900 | 1,103,739 |
| Foot Locker, Inc. | | 6,700 | 453,925 |
| Fortune Brands Home & Security, Inc. | | 8,200 | 429,106 |
| Fox Factory Holding Corp. (a) | | 44,600 | 791,650 |
| G-III Apparel Group Ltd. (a) | | 8,800 | 484,792 |
| Global Payments, Inc. | | 11,900 | 1,623,279 |
| Halliburton Co. | | 18,300 | 702,354 |
| Harris Corp. | | 7,100 | 561,823 |
| Heartland Payment Systems, Inc. | | 5,500 | 407,000 |
| Helmerich & Payne, Inc. | | 2,300 | 129,421 |
| Hilltop Holdings, Inc. (a) | | 15,900 | 333,423 |
| Hologic, Inc. (a) | | 11,500 | 446,890 |
| Hooker Furniture Corp. | | 21,600 | 536,112 |
| Houghton Mifflin Harcourt Co. (a) | | 19,800 | 387,882 |
| Interpublic Group of Companies, Inc. | | 32,600 | 747,518 |
| IPG Photonics Corp. (a) | | 8,700 | 718,794 |
| Johnson & Johnson | | 3,800 | 383,914 |
| Johnson Controls, Inc. | | 400 | 18,072 |
| Jones Lang LaSalle, Inc. | | 6,300 | 1,050,273 |
| Juniper Networks, Inc. | | 3,600 | 113,004 |
| Kate Spade & Co. (a) | | 17,400 | 312,678 |
| Keysight Technologies, Inc. (a) | | 2,000 | 66,160 |
| Knoll, Inc. | | 29,400 | 683,256 |
| Kroger Co. | | 14,500 | 548,100 |
| Laboratory Corp. of America Holdings (a) | | 4,500 | 552,330 |
| Ladder Capital Corp. Class A | | 10,400 | 148,304 |
| Lakeland Financial Corp. | | 11,100 | 498,723 |
| Lennar Corp. Class A | | 19,600 | 981,372 |
| Lennox International, Inc. | | 9,200 | 1,221,852 |
| Lithia Motors, Inc. Class A (sub. vtg.) | | 3,200 | 375,648 |
| M&T Bank Corp. | | 4,800 | 575,280 |
| Malibu Boats, Inc. Class A (a) | | 47,800 | 679,238 |
| Marsh & McLennan Companies, Inc. | | 2,700 | 150,498 |
| Matthews International Corp. Class A | | 6,600 | 381,018 |
| Maxim Integrated Products, Inc. | | 19,100 | 782,718 |
| McGraw Hill Financial, Inc. | | 4,900 | 453,936 |
| MedAssets, Inc. (a) | | 9,800 | 232,064 |
| Mohawk Industries, Inc. (a) | | 1,800 | 351,900 |
| Mueller Industries, Inc. | | 10,474 | 330,140 |
| Multi-Color Corp. | | 5,800 | 451,472 |
| News Corp. Class A | | 900 | 13,860 |
| NVR, Inc. (a) | | 400 | 655,104 |
| Oaktree Capital Group LLC Class A | | 1,500 | 74,790 |
| Omega Flex, Inc. | | 23,679 | 978,890 |
| Opus Bank | | 2,700 | 100,575 |
| PacWest Bancorp | | 16,100 | 725,144 |
| PDC Energy, Inc. (a) | | 3,300 | 199,122 |
| Polaris Industries, Inc. (b) | | 8,900 | 999,826 |
| Praxair, Inc. | | 3,100 | 344,379 |
| Priceline Group, Inc. (a) | | 800 | 1,163,392 |
| Procter & Gamble Co. | | 5,000 | 381,900 |
| Progressive Corp. | | 12,000 | 397,560 |
| PulteGroup, Inc. | | 59,500 | 1,090,635 |
| PVH Corp. | | 6,700 | 609,365 |
| QUALCOMM, Inc. | | 700 | 41,594 |
| Regions Financial Corp. | | 42,000 | 392,700 |
| Reinsurance Group of America, Inc. | | 3,100 | 279,744 |
| Rexnord Corp. (a) | | 59,900 | 1,106,952 |
| Rockwell Collins, Inc. | | 4,400 | 381,568 |
| Ruth's Hospitality Group, Inc. | | 53,400 | 828,234 |
| SM Energy Co. | | 5,100 | 170,085 |
| Southwestern Energy Co. (a) | | 42,800 | 472,512 |
| Sportsman's Warehouse Holdings, Inc. (a)(b) | | 26,900 | 289,444 |
| SS&C Technologies Holdings, Inc. | | 3,600 | 266,940 |
| Stanley Black & Decker, Inc. | | 3,600 | 381,528 |
| Steris Corp. (b) | | 10,900 | 816,955 |
| Store Capital Corp. | | 18,300 | 414,861 |
| Surgery Partners, Inc. | | 9,200 | 154,744 |
| Surgical Care Affiliates, Inc. (a) | | 9,900 | 293,139 |
| Tenneco, Inc. (a) | | 7,500 | 424,425 |
| The Western Union Co. | | 25,900 | 498,575 |
| Thermo Fisher Scientific, Inc. | | 9,200 | 1,203,176 |
| TJX Companies, Inc. | | 5,600 | 409,864 |
| Toll Brothers, Inc. (a) | | 31,800 | 1,143,846 |
| Total System Services, Inc. | | 13,600 | 713,320 |
| Twenty-First Century Fox, Inc. Class B | | 12,200 | 376,736 |
| U.S. Bancorp | | 16,700 | 704,406 |
| UMB Financial Corp. | | 13,000 | 638,040 |
| Vantiv, Inc. (a) | | 27,900 | 1,399,185 |
| Visa, Inc. Class A | | 8,800 | 682,704 |
| VSE Corp. | | 15,394 | 884,539 |
| Walgreens Boots Alliance, Inc. | | 4,100 | 347,188 |
| WESCO International, Inc. (a) | | 7,300 | 357,189 |
| Western Digital Corp. | | 10,100 | 674,882 |
| WestRock Co. | | 12,600 | 677,376 |
| Xylem, Inc. | | 24,200 | 881,122 |
| Yum! Brands, Inc. | | 2,200 | 156,002 |
| Zimmer Biomet Holdings, Inc. | | 4,400 | 460,108 |
|
| TOTAL UNITED STATES OF AMERICA | | | 79,605,900 |
|
| TOTAL COMMON STOCKS | | | |
| (Cost $128,303,287) | | | 138,228,847 |
|
| Nonconvertible Preferred Stocks - 0.3% | | | |
| Brazil - 0.0% | | | |
| Banco do Estado Rio Grande do Sul SA | | 36,300 | 56,381 |
| Germany - 0.3% | | | |
| Sartorius AG (non-vtg.) | | 1,600 | 362,093 |
| TOTAL NONCONVERTIBLE PREFERRED STOCKS | | | |
| (Cost $317,351) | | | 418,474 |
| | | Principal Amount | Value |
|
| Nonconvertible Bonds - 0.0% | | | |
| Canada - 0.0% | | | |
Constellation Software, Inc. 8.5% 3/31/40
(Cost $5,029)(c) | CAD | 5,600 | 4,925 |
| | | Shares | Value |
|
| Money Market Funds - 7.0% | | | |
| Fidelity Cash Central Fund, 0.18% (d) | | 8,682,990 | 8,682,990 |
| Fidelity Securities Lending Cash Central Fund, 0.19% (d)(e) | | 1,564,268 | 1,564,268 |
| TOTAL MONEY MARKET FUNDS | | | |
| (Cost $10,247,258) | | | 10,247,258 |
| TOTAL INVESTMENT PORTFOLIO - 101.7% | | | |
| (Cost $138,872,925) | | | 148,899,504 |
| NET OTHER ASSETS (LIABILITIES) - (1.7)% | | | (2,472,555) |
| NET ASSETS - 100% | | | $146,426,949 |
Currency Abbreviations
CAD – Canadian dollar
Categorizations in the Schedule of Investments are based on country or territory of incorporation.
Legend
(a) Non-income producing
(b) Security or a portion of the security is on loan at period end.
(c) Coupon rates for floating and adjustable rate securities reflect the rates in effect at period end.
(d) Affiliated fund that is generally available only to investment companies and other accounts managed by Fidelity Investments. The rate quoted is the annualized seven-day yield of the fund at period end. A complete unaudited listing of the fund's holdings as of its most recent quarter end is available upon request. In addition, each Fidelity Central Fund's financial statements, which are not covered by the Fund's Report of Independent Registered Public Accounting Firm, are available on the SEC's website or upon request.
(e) Investment made with cash collateral received from securities on loan.
Affiliated Central Funds
Information regarding fiscal year to date income earned by the Fund from investments in Fidelity Central Funds is as follows:
| Fund | Income earned |
| Fidelity Cash Central Fund | $5,114 |
| Fidelity Securities Lending Cash Central Fund | 12,466 |
| Total | $17,580 |
Investment Valuation
The following is a summary of the inputs used, as of October 31, 2015, involving the Fund's assets and liabilities carried at fair value. The inputs or methodology used for valuing securities may not be an indication of the risk associated with investing in those securities. For more information on valuation inputs, and their aggregation into the levels used below, please refer to the Investment Valuation section in the accompanying Notes to Financial Statements.
| | Valuation Inputs at Reporting Date: |
| Description | Total | Level 1 | Level 2 | Level 3 |
| Investments in Securities: | | | | |
| Equities: | | | | |
| Consumer Discretionary | $31,793,765 | $26,202,582 | $5,591,183 | $-- |
| Consumer Staples | 6,699,580 | 4,719,058 | 1,980,522 | -- |
| Energy | 4,663,049 | 4,663,049 | -- | -- |
| Financials | 23,444,316 | 19,684,971 | 3,759,345 | -- |
| Health Care | 18,898,699 | 15,357,038 | 3,541,661 | -- |
| Industrials | 18,037,403 | 14,686,186 | 3,351,217 | -- |
| Information Technology | 30,146,227 | 28,083,788 | 2,062,439 | -- |
| Materials | 4,020,702 | 3,884,443 | 136,259 | -- |
| Telecommunication Services | 511,541 | -- | 511,541 | -- |
| Utilities | 432,039 | 83,549 | 348,490 | -- |
| Corporate Bonds | 4,925 | -- | 4,925 | -- |
| Money Market Funds | 10,247,258 | 10,247,258 | -- | -- |
| Total Investments in Securities: | $148,899,504 | $127,611,922 | $21,287,582 | $-- |
See accompanying notes which are an integral part of the financial statements.
Financial Statements
Statement of Assets and Liabilities
| | | October 31, 2015 |
| Assets | | |
Investment in securities, at value (including securities loaned of $1,554,788) — See accompanying schedule:
Unaffiliated issuers (cost $128,625,667) | $138,652,246 | |
| Fidelity Central Funds (cost $10,247,258) | 10,247,258 | |
| Total Investments (cost $138,872,925) | | $148,899,504 |
| Foreign currency held at value (cost $13,640) | | 13,652 |
| Receivable for investments sold | | 420,783 |
| Receivable for fund shares sold | | 290,613 |
| Dividends receivable | | 128,075 |
| Interest receivable | | 32 |
| Distributions receivable from Fidelity Central Funds | | 2,338 |
| Prepaid expenses | | 405 |
| Receivable from investment adviser for expense reductions | | 32 |
| Other receivables | | 52,598 |
| Total assets | | 149,808,032 |
| Liabilities | | |
| Payable for investments purchased | $1,371,076 | |
| Payable for fund shares redeemed | 214,184 | |
| Accrued management fee | 101,094 | |
| Distribution and service plan fees payable | 36,357 | |
| Other affiliated payables | 30,965 | |
| Other payables and accrued expenses | 63,139 | |
| Collateral on securities loaned, at value | 1,564,268 | |
| Total liabilities | | 3,381,083 |
| Net Assets | | $146,426,949 |
| Net Assets consist of: | | |
| Paid in capital | | $136,029,676 |
| Accumulated net investment loss | | (52,047) |
| Accumulated undistributed net realized gain (loss) on investments and foreign currency transactions | | 451,090 |
| Net unrealized appreciation (depreciation) on investments and assets and liabilities in foreign currencies | | 9,998,230 |
| Net Assets | | $146,426,949 |
| Calculation of Maximum Offering Price | | |
| Class A: | | |
| Net Asset Value and redemption price per share ($41,224,878 ÷ 2,594,779 shares) | | $15.89 |
| Maximum offering price per share (100/94.25 of $15.89) | | $16.86 |
| Class T: | | |
| Net Asset Value and redemption price per share ($24,017,251 ÷ 1,567,817 shares) | | $15.32 |
| Maximum offering price per share (100/96.50 of $15.32) | | $15.88 |
| Class B: | | |
| Net Asset Value and offering price per share ($881,881 ÷ 62,277 shares)(a) | | $14.16 |
| Class C: | | |
| Net Asset Value and offering price per share ($21,185,766 ÷ 1,500,466 shares)(a) | | $14.12 |
| Class I: | | |
| Net Asset Value, offering price and redemption price per share ($59,117,173 ÷ 3,572,301 shares) | | $16.55 |
(a) Redemption price per share is equal to net asset value less any applicable contingent deferred sales charge.
See accompanying notes which are an integral part of the financial statements.
Statement of Operations
| | | Year ended October 31, 2015 |
| Investment Income | | |
| Dividends | | $1,923,035 |
| Interest | | 132 |
| Income from Fidelity Central Funds | | 17,580 |
| Income before foreign taxes withheld | | 1,940,747 |
| Less foreign taxes withheld | | (107,377) |
| Total income | | 1,833,370 |
| Expenses | | |
| Management fee | | |
| Basic fee | $933,317 | |
| Performance adjustment | 198,430 | |
| Transfer agent fees | 278,835 | |
| Distribution and service plan fees | 422,536 | |
| Accounting and security lending fees | 52,184 | |
| Custodian fees and expenses | 138,439 | |
| Independent trustees' compensation | 556 | |
| Registration fees | 65,742 | |
| Audit | 90,679 | |
| Legal | 336 | |
| Miscellaneous | 1,141 | |
| Total expenses before reductions | 2,182,195 | |
| Expense reductions | (168,666) | 2,013,529 |
| Net investment income (loss) | | (180,159) |
| Realized and Unrealized Gain (Loss) | | |
| Net realized gain (loss) on: | | |
| Investment securities: | | |
| Unaffiliated issuers (net of foreign taxes of $2,038) | 1,991,350 | |
| Foreign currency transactions | (130,162) | |
| Total net realized gain (loss) | | 1,861,188 |
Change in net unrealized appreciation (depreciation) on:
Investment securities | 511,038 | |
| Assets and liabilities in foreign currencies | (6,414) | |
| Total change in net unrealized appreciation (depreciation) | | 504,624 |
| Net gain (loss) | | 2,365,812 |
| Net increase (decrease) in net assets resulting from operations | | $2,185,653 |
See accompanying notes which are an integral part of the financial statements.
Statement of Changes in Net Assets
| | Year ended October 31, 2015 | Year ended October 31, 2014 |
| Increase (Decrease) in Net Assets | | |
| Operations | | |
| Net investment income (loss) | $(180,159) | $(2,050) |
| Net realized gain (loss) | 1,861,188 | 16,649,782 |
| Change in net unrealized appreciation (depreciation) | 504,624 | (4,085,442) |
| Net increase (decrease) in net assets resulting from operations | 2,185,653 | 12,562,290 |
| Distributions to shareholders from net investment income | – | (195,453) |
| Distributions to shareholders from net realized gain | – | (407,917) |
| Total distributions | – | (603,370) |
| Share transactions - net increase (decrease) | 31,147,206 | 3,705,620 |
| Redemption fees | 3,469 | 573 |
| Total increase (decrease) in net assets | 33,336,328 | 15,665,113 |
| Net Assets | | |
| Beginning of period | 113,090,621 | 97,425,508 |
| End of period (including accumulated net investment loss of $52,047 and undistributed net investment income of $23,087, respectively) | $146,426,949 | $113,090,621 |
See accompanying notes which are an integral part of the financial statements.
Fidelity Advisor Global Capital Appreciation Fund Class A
| | | | | | |
| Years ended October 31, | 2015 | 2014 | 2013 | 2012 | 2011 |
| Selected Per–Share Data | | | | | |
| Net asset value, beginning of period | $15.32 | $13.64 | $10.40 | $9.57 | $11.41 |
| Income from Investment Operations | | | | | |
| Net investment income (loss)A | (.01) | .01 | .04 | .02 | (.03) |
| Net realized and unrealized gain (loss) | .58 | 1.76 | 3.20 | .81 | (1.76) |
| Total from investment operations | .57 | 1.77 | 3.24 | .83 | (1.79) |
| Distributions from net investment income | – | (.02) | – | – | – |
| Distributions from net realized gain | – | (.06) | – | – | (.05) |
| Total distributions | – | (.09)B | – | – | (.05) |
| Redemption fees added to paid in capitalA,C | – | – | – | – | – |
| Net asset value, end of period | $15.89 | $15.32 | $13.64 | $10.40 | $9.57 |
| Total ReturnD,E | 3.72% | 13.03% | 31.15% | 8.67% | (15.81)% |
| Ratios to Average Net AssetsF,G | | | | | |
| Expenses before reductions | 1.57% | 1.62% | 1.38% | 1.43% | 1.51% |
| Expenses net of fee waivers, if any | 1.45% | 1.45% | 1.38% | 1.43% | 1.45% |
| Expenses net of all reductions | 1.44% | 1.45% | 1.35% | 1.40% | 1.43% |
| Net investment income (loss) | (.07)% | .07% | .33% | .22% | (.24)% |
| Supplemental Data | | | | | |
| Net assets, end of period (000 omitted) | $41,225 | $35,987 | $33,694 | $26,961 | $36,367 |
| Portfolio turnover rateH | 176% | 249% | 211% | 155% | 140% |
A Calculated based on average shares outstanding during the period.
B Total distributions of $.09 per share is comprised of distributions from net investment income of $.024 and distributions from net realized gain of $.064 per share.
C Amount represents less than $.005 per share.
D Total returns would have been lower if certain expenses had not been reduced during the applicable periods shown.
E Total returns do not include the effect of the sales charges.
F Fees and expenses of any underlying Fidelity Central Funds are not included in the Fund's expense ratio. The Fund indirectly bears its proportionate share of the expenses of any underlying Fidelity Central Funds.
G Expense ratios reflect operating expenses of the class. Expenses before reductions do not reflect amounts reimbursed by the investment adviser or reductions from brokerage service arrangements or reductions from other expense offset arrangements and do not represent the amount paid by the class during periods when reimbursements or reductions occur. Expenses net of fee waivers reflect expenses after reimbursement by the investment adviser but prior to reductions from brokerage service arrangements or other expense offset arrangements. Expenses net of all reductions represent the net expenses paid by the class.
H Amount does not include the portfolio activity of any underlying Fidelity Central Funds.
See accompanying notes which are an integral part of the financial statements.
Fidelity Advisor Global Capital Appreciation Fund Class T
| | | | | | |
| Years ended October 31, | 2015 | 2014 | 2013 | 2012 | 2011 |
| Selected Per–Share Data | | | | | |
| Net asset value, beginning of period | $14.81 | $13.19 | $10.09 | $9.31 | $11.11 |
| Income from Investment Operations | | | | | |
| Net investment income (loss)A | (.05) | (.03) | –B | –B | (.05) |
| Net realized and unrealized gain (loss) | .56 | 1.71 | 3.10 | .78 | (1.72) |
| Total from investment operations | .51 | 1.68 | 3.10 | .78 | (1.77) |
| Distributions from net realized gain | – | (.06) | – | – | (.03) |
| Redemption fees added to paid in capitalA,B | – | – | – | – | – |
| Net asset value, end of period | $15.32 | $14.81 | $13.19 | $10.09 | $9.31 |
| Total ReturnC,D | 3.44% | 12.77% | 30.72% | 8.38% | (15.97)% |
| Ratios to Average Net AssetsE,F | | | | | |
| Expenses before reductions | 1.89% | 1.93% | 1.68% | 1.71% | 1.80% |
| Expenses net of fee waivers, if any | 1.70% | 1.70% | 1.68% | 1.70% | 1.70% |
| Expenses net of all reductions | 1.69% | 1.70% | 1.64% | 1.68% | 1.68% |
| Net investment income (loss) | (.32)% | (.17)% | .04% | (.05)% | (.49)% |
| Supplemental Data | | | | | |
| Net assets, end of period (000 omitted) | $24,017 | $20,975 | $19,193 | $15,731 | $24,180 |
| Portfolio turnover rateG | 176% | 249% | 211% | 155% | 140% |
A Calculated based on average shares outstanding during the period.
B Amount represents less than $.005 per share.
C Total returns would have been lower if certain expenses had not been reduced during the applicable periods shown.
D Total returns do not include the effect of the sales charges.
E Fees and expenses of any underlying Fidelity Central Funds are not included in the Fund's expense ratio. The Fund indirectly bears its proportionate share of the expenses of any underlying Fidelity Central Funds.
F Expense ratios reflect operating expenses of the class. Expenses before reductions do not reflect amounts reimbursed by the investment adviser or reductions from brokerage service arrangements or reductions from other expense offset arrangements and do not represent the amount paid by the class during periods when reimbursements or reductions occur. Expenses net of fee waivers reflect expenses after reimbursement by the investment adviser but prior to reductions from brokerage service arrangements or other expense offset arrangements. Expenses net of all reductions represent the net expenses paid by the class.
G Amount does not include the portfolio activity of any underlying Fidelity Central Funds.
See accompanying notes which are an integral part of the financial statements.
Fidelity Advisor Global Capital Appreciation Fund Class B
| | | | | | |
| Years ended October 31, | 2015 | 2014 | 2013 | 2012 | 2011 |
| Selected Per–Share Data | | | | | |
| Net asset value, beginning of period | $13.75 | $12.27 | $9.43 | $8.74 | $10.46 |
| Income from Investment Operations | | | | | |
| Net investment income (loss)A | (.12) | (.09) | (.05) | (.05) | (.10) |
| Net realized and unrealized gain (loss) | .53 | 1.58 | 2.89 | .74 | (1.62) |
| Total from investment operations | .41 | 1.49 | 2.84 | .69 | (1.72) |
| Distributions from net realized gain | – | (.01) | – | – | –B |
| Redemption fees added to paid in capitalA,B | – | – | – | – | – |
| Net asset value, end of period | $14.16 | $13.75 | $12.27 | $9.43 | $8.74 |
| Total ReturnC,D | 2.98% | 12.11% | 30.12% | 7.89% | (16.42)% |
| Ratios to Average Net AssetsE,F | | | | | |
| Expenses before reductions | 2.44% | 2.44% | 2.17% | 2.19% | 2.32% |
| Expenses net of fee waivers, if any | 2.20% | 2.20% | 2.17% | 2.19% | 2.20% |
| Expenses net of all reductions | 2.19% | 2.20% | 2.13% | 2.17% | 2.18% |
| Net investment income (loss) | (.82)% | (.68)% | (.45)% | (.54)% | (.99)% |
| Supplemental Data | | | | | |
| Net assets, end of period (000 omitted) | $882 | $1,223 | $1,331 | $1,401 | $1,926 |
| Portfolio turnover rateG | 176% | 249% | 211% | 155% | 140% |
A Calculated based on average shares outstanding during the period.
B Amount represents less than $.005 per share.
C Total returns would have been lower if certain expenses had not been reduced during the applicable periods shown.
D Total returns do not include the effect of the contingent deferred sales charge.
E Fees and expenses of any underlying Fidelity Central Funds are not included in the Fund's expense ratio. The Fund indirectly bears its proportionate share of the expenses of any underlying Fidelity Central Funds.
F Expense ratios reflect operating expenses of the class. Expenses before reductions do not reflect amounts reimbursed by the investment adviser or reductions from brokerage service arrangements or reductions from other expense offset arrangements and do not represent the amount paid by the class during periods when reimbursements or reductions occur. Expenses net of fee waivers reflect expenses after reimbursement by the investment adviser but prior to reductions from brokerage service arrangements or other expense offset arrangements. Expenses net of all reductions represent the net expenses paid by the class.
G Amount does not include the portfolio activity of any underlying Fidelity Central Funds.
See accompanying notes which are an integral part of the financial statements.
Fidelity Advisor Global Capital Appreciation Fund Class C
| | | | | | |
| Years ended October 31, | 2015 | 2014 | 2013 | 2012 | 2011 |
| Selected Per–Share Data | | | | | |
| Net asset value, beginning of period | $13.72 | $12.26 | $9.41 | $8.73 | $10.46 |
| Income from Investment Operations | | | | | |
| Net investment income (loss)A | (.12) | (.09) | (.05) | (.05) | (.10) |
| Net realized and unrealized gain (loss) | .52 | 1.58 | 2.90 | .73 | (1.61) |
| Total from investment operations | .40 | 1.49 | 2.85 | .68 | (1.71) |
| Distributions from net realized gain | – | (.03) | – | – | (.02) |
| Redemption fees added to paid in capitalA,B | – | – | – | – | – |
| Net asset value, end of period | $14.12 | $13.72 | $12.26 | $9.41 | $8.73 |
| Total ReturnC,D | 2.92% | 12.13% | 30.29% | 7.79% | (16.38)% |
| Ratios to Average Net AssetsE,F | | | | | |
| Expenses before reductions | 2.34% | 2.40% | 2.16% | 2.18% | 2.28% |
| Expenses net of fee waivers, if any | 2.20% | 2.20% | 2.16% | 2.18% | 2.20% |
| Expenses net of all reductions | 2.19% | 2.20% | 2.13% | 2.16% | 2.18% |
| Net investment income (loss) | (.82)% | (.67)% | (.45)% | (.53)% | (.99)% |
| Supplemental Data | | | | | |
| Net assets, end of period (000 omitted) | $21,186 | $15,747 | $13,055 | $9,421 | $11,632 |
| Portfolio turnover rateG | 176% | 249% | 211% | 155% | 140% |
A Calculated based on average shares outstanding during the period.
B Amount represents less than $.005 per share.
C Total returns would have been lower if certain expenses had not been reduced during the applicable periods shown.
D Total returns do not include the effect of the contingent deferred sales charge.
E Fees and expenses of any underlying Fidelity Central Funds are not included in the Fund's expense ratio. The Fund indirectly bears its proportionate share of the expenses of any underlying Fidelity Central Funds.
F Expense ratios reflect operating expenses of the class. Expenses before reductions do not reflect amounts reimbursed by the investment adviser or reductions from brokerage service arrangements or reductions from other expense offset arrangements and do not represent the amount paid by the class during periods when reimbursements or reductions occur. Expenses net of fee waivers reflect expenses after reimbursement by the investment adviser but prior to reductions from brokerage service arrangements or other expense offset arrangements. Expenses net of all reductions represent the net expenses paid by the class.
G Amount does not include the portfolio activity of any underlying Fidelity Central Funds.
See accompanying notes which are an integral part of the financial statements.
Fidelity Advisor Global Capital Appreciation Fund Class I
| | | | | | |
| Years ended October 31, | 2015 | 2014 | 2013 | 2012 | 2011 |
| Selected Per–Share Data | | | | | |
| Net asset value, beginning of period | $15.92 | $14.18 | $10.78 | $9.88 | $11.76 |
| Income from Investment Operations | | | | | |
| Net investment income (loss)A | .03 | .05 | .09 | .06 | –B |
| Net realized and unrealized gain (loss) | .60 | 1.82 | 3.33 | .84 | (1.82) |
| Total from investment operations | .63 | 1.87 | 3.42 | .90 | (1.82) |
| Distributions from net investment income | – | (.06) | (.02) | – | – |
| Distributions from net realized gain | – | (.06) | – | – | (.06) |
| Total distributions | – | (.13)C | (.02) | – | (.06) |
| Redemption fees added to paid in capitalA,B | – | – | – | – | – |
| Net asset value, end of period | $16.55 | $15.92 | $14.18 | $10.78 | $9.88 |
| Total ReturnD | 3.96% | 13.27% | 31.74% | 9.11% | (15.60)% |
| Ratios to Average Net AssetsE,F | | | | | |
| Expenses before reductions | 1.26% | 1.29% | 1.02% | 1.06% | 1.18% |
| Expenses net of fee waivers, if any | 1.20% | 1.20% | 1.02% | 1.06% | 1.17% |
| Expenses net of all reductions | 1.19% | 1.20% | .99% | 1.03% | 1.15% |
| Net investment income (loss) | .18% | .33% | .69% | .59% | .04% |
| Supplemental Data | | | | | |
| Net assets, end of period (000 omitted) | $59,117 | $39,159 | $30,153 | $22,548 | $28,725 |
| Portfolio turnover rateG | 176% | 249% | 211% | 155% | 140% |
A Calculated based on average shares outstanding during the period.
B Amount represents less than $.005 per share.
C Total distributions of $.13 per share is comprised of distributions from net investment income of $.064 and distributions from net realized gain of $.064 per share.
D Total returns would have been lower if certain expenses had not been reduced during the applicable periods shown.
E Fees and expenses of any underlying Fidelity Central Funds are not included in the Fund's expense ratio. The Fund indirectly bears its proportionate share of the expenses of any underlying Fidelity Central Funds.
F Expense ratios reflect operating expenses of the class. Expenses before reductions do not reflect amounts reimbursed by the investment adviser or reductions from brokerage service arrangements or reductions from other expense offset arrangements and do not represent the amount paid by the class during periods when reimbursements or reductions occur. Expenses net of fee waivers reflect expenses after reimbursement by the investment adviser but prior to reductions from brokerage service arrangements or other expense offset arrangements. Expenses net of all reductions represent the net expenses paid by the class.
G Amount does not include the portfolio activity of any underlying Fidelity Central Funds.
See accompanying notes which are an integral part of the financial statements.
Notes to Financial Statements
For the period ended October 31, 2015
1. Organization.
Fidelity Advisor Global Capital Appreciation Fund (the Fund) is a fund of Fidelity Advisor Series VIII (the Trust) and is authorized to issue an unlimited number of shares. The Trust is registered under the Investment Company Act of 1940, as amended (the 1940 Act), as an open-end management investment company organized as a Massachusetts business trust. The Fund offers Class A, Class T, Class C and Class I (formerly Institutional Class) shares, each of which, along with Class B shares, has equal rights as to assets and voting privileges. Class B shares are closed to new accounts and additional purchases, except for exchanges and reinvestments. Each class has exclusive voting rights with respect to matters that affect that class. Class B shares will automatically convert to Class A shares after a holding period of seven years from the initial date of purchase. The Fund's investments in emerging markets can be subject to social, economic, regulatory, and political uncertainties and can be extremely volatile.
2. Investments in Fidelity Central Funds.
The Fund invests in Fidelity Central Funds, which are open-end investment companies generally available only to other investment companies and accounts managed by the investment adviser and its affiliates. The Fund's Schedule of Investments lists each of the Fidelity Central Funds held as of period end, if any, as an investment of the Fund, but does not include the underlying holdings of each Fidelity Central Fund. As an Investing Fund, the Fund indirectly bears its proportionate share of the expenses of the underlying Fidelity Central Funds.
The Money Market Central Funds seek preservation of capital and current income and are managed by Fidelity Investments Money Management, Inc. (FIMM), an affiliate of the investment adviser. Annualized expenses of the Money Market Central Funds as of their most recent shareholder report date are less than .005%.
A complete unaudited list of holdings for each Fidelity Central Fund is available upon request or at the Securities and Exchange Commission (the SEC) website at www.sec.gov. In addition, the financial statements of the Fidelity Central Funds, which are not covered by the Fund's Report of Independent Registered Public Accounting Firm, are available on the SEC website or upon request.
3. Significant Accounting Policies.
The financial statements have been prepared in conformity with accounting principles generally accepted in the United States of America (GAAP), which require management to make certain estimates and assumptions at the date of the financial statements. Actual results could differ from those estimates. Subsequent events, if any, through the date that the financial statements were issued have been evaluated in the preparation of the financial statements. The following summarizes the significant accounting policies of the Fund:
Investment Valuation. Investments are valued as of 4:00 p.m. Eastern time on the last calendar day of the period. The Board of Trustees (the Board) has delegated the day to day responsibility for the valuation of the Fund's investments to the Fidelity Management & Research Company (FMR) Fair Value Committee (the Committee). In accordance with valuation policies and procedures approved by the Board, the Fund attempts to obtain prices from one or more third party pricing vendors or brokers to value its investments. When current market prices, quotations or currency exchange rates are not readily available or reliable, investments will be fair valued in good faith by the Committee, in accordance with procedures adopted by the Board. Factors used in determining fair value vary by investment type and may include market or investment specific events, changes in interest rates and credit quality. The frequency with which these procedures are used cannot be predicted and they may be utilized to a significant extent. The Committee oversees the Fund's valuation policies and procedures and reports to the Board on the Committee's activities and fair value determinations. The Board monitors the appropriateness of the procedures used in valuing the Fund's investments and ratifies the fair value determinations of the Committee.
The Fund categorizes the inputs to valuation techniques used to value its investments into a disclosure hierarchy consisting of three levels as shown below:
- Level 1 – quoted prices in active markets for identical investments
- Level 2 – other significant observable inputs (including quoted prices for similar investments, interest rates, prepayment speeds, etc.)
- Level 3 – unobservable inputs (including the Fund's own assumptions based on the best information available)
Valuation techniques used to value the Fund's investments by major category are as follows:
Equity securities, including restricted securities, for which market quotations are readily available, are valued at the last reported sale price or official closing price as reported by a third party pricing vendor on the primary market or exchange on which they are traded and are categorized as Level 1 in the hierarchy. In the event there were no sales during the day or closing prices are not available, securities are valued at the last quoted bid price or may be valued using the last available price and are generally categorized as Level 2 in the hierarchy. For foreign equity securities, when market or security specific events arise, comparisons to the valuation of American Depositary Receipts (ADRs), futures contracts, Exchange-Traded Funds (ETFs) and certain indexes as well as quoted prices for similar securities may be used and would be categorized as Level 2 in the hierarchy. Utilizing these techniques may result in transfers between Level 1 and Level 2. For equity securities, including restricted securities, where observable inputs are limited, assumptions about market activity and risk are used and these securities may be categorized as Level 3 in the hierarchy.
Debt securities, including restricted securities, are valued based on evaluated prices received from third party pricing vendors or from brokers who make markets in such securities. Corporate bonds are valued by pricing vendors who utilize matrix pricing which considers yield or price of bonds of comparable quality, coupon, maturity and type or by broker-supplied prices. When independent prices are unavailable or unreliable, debt securities may be valued utilizing pricing methodologies which consider similar factors that would be used by third party pricing vendors. Debt securities are generally categorized as Level 2 in the hierarchy but may be Level 3 depending on the circumstances.
Investments in open-end mutual funds, including the Fidelity Central Funds, are valued at their closing net asset value (NAV) each business day and are categorized as Level 1 in the hierarchy.
Changes in valuation techniques may result in transfers in or out of an assigned level within the disclosure hierarchy. The aggregate value of investments by input level as of October 31, 2015, is included at the end of the Fund's Schedule of Investments.
Foreign Currency. The Fund may use foreign currency contracts to facilitate transactions in foreign-denominated securities. Gains and losses from these transactions may arise from changes in the value of the foreign currency or if the counterparties do not perform under the contracts' terms.
Foreign-denominated assets, including investment securities, and liabilities are translated into U.S. dollars at the exchange rates at period end. Purchases and sales of investment securities, income and dividends received and expenses denominated in foreign currencies are translated into U.S. dollars at the exchange rate in effect on the transaction date.
The effects of exchange rate fluctuations on investments are included with the net realized and unrealized gain (loss) on investment securities. Other foreign currency transactions resulting in realized and unrealized gain (loss) are disclosed separately.
Investment Transactions and Income. For financial reporting purposes, the Fund's investment holdings and NAV include trades executed through the end of the last business day of the period. The NAV per share for processing shareholder transactions is calculated as of the close of business of the New York Stock Exchange (NYSE), normally 4:00 p.m. Eastern time and includes trades executed through the end of the prior business day. Gains and losses on securities sold are determined on the basis of identified cost and may include proceeds received from litigation. Dividend income is recorded on the ex-dividend date, except for certain dividends from foreign securities where the ex-dividend date may have passed, which are recorded as soon as the Fund is informed of the ex-dividend date. Non-cash dividends included in dividend income, if any, are recorded at the fair market value of the securities received. Income and capital gain distributions from Fidelity Central Funds, if any, are recorded on the ex-dividend date. Distributions received on securities that represent a return of capital or capital gain are recorded as a reduction of cost of investments and/or as a realized gain. Subsequent to ex-dividend date the Fund determines the components of these distributions, based upon receipt of tax filings or other correspondence relating to the underlying investment. Interest income is accrued as earned and includes coupon interest and amortization of premium and accretion of discount on debt securities as applicable. Investment income is recorded net of foreign taxes withheld where recovery of such taxes is uncertain.
Class Allocations and Expenses. Investment income, realized and unrealized capital gains and losses, common expenses of the Fund, and certain fund-level expense reductions, if any, are allocated daily on a pro-rata basis to each class based on the relative net assets of each class to the total net assets of the Fund. Each class differs with respect to transfer agent and distribution and service plan fees incurred. Certain expense reductions may also differ by class. For the reporting period, the allocated portion of income and expenses to each class as a percent of its average net assets may vary due to the timing of recording these transactions in relation to fluctuating net assets of the classes. Expenses directly attributable to a fund are charged to that fund. Expenses attributable to more than one fund are allocated among the respective funds on the basis of relative net assets or other appropriate methods. Expense estimates are accrued in the period to which they relate and adjustments are made when actual amounts are known.
Income Tax Information and Distributions to Shareholders. Each year, the Fund intends to qualify as a regulated investment company under Subchapter M of the Internal Revenue Code, including distributing substantially all of its taxable income and realized gains. As a result, no provision for U.S. Federal income taxes is required. As of October 31, 2015, the Fund did not have any unrecognized tax benefits in the financial statements; nor is the Fund aware of any tax positions for which it is reasonably possible that the total amounts of unrecognized tax benefits will significantly change in the next twelve months. The Fund files a U.S. federal tax return, in addition to state and local tax returns as required. The Fund's federal income tax returns are subject to examination by the Internal Revenue Service (IRS) for a period of three fiscal years after they are filed. State and local tax returns may be subject to examination for an additional fiscal year depending on the jurisdiction. Foreign taxes are provided for based on the Fund's understanding of the tax rules and rates that exist in the foreign markets in which it invests. The Fund is subject to a tax imposed on capital gains by certain countries in which it invests.
Distributions are declared and recorded on the ex-dividend date. Income dividends and capital gain distributions are declared separately for each class. Income and capital gain distributions are determined in accordance with income tax regulations, which may differ from GAAP. In addition, the Fund claimed a portion of the payment made to redeeming shareholders as a distribution for income tax purposes.
Capital accounts within the financial statements are adjusted for permanent book-tax differences. These adjustments have no impact on net assets or the results of operations. Capital accounts are not adjusted for temporary book-tax differences which will reverse in a subsequent period.
Book-tax differences are primarily due to foreign currency transactions, certain foreign taxes, passive foreign investment companies (PFIC), partnerships, capital loss carryforwards and losses deferred due to wash sales.
The federal tax cost of investment securities and unrealized appreciation (depreciation) as of period end were as follows:
| Gross unrealized appreciation | $16,653,077 |
| Gross unrealized depreciation | (6,992,849) |
| Net unrealized appreciation (depreciation) on securities | $9,660,228 |
| Tax Cost | $139,239,276 |
The tax-based components of distributable earnings as of period end were as follows:
| Undistributed long-term capital gain | $817,444 |
| Net unrealized appreciation (depreciation) on securities and other investments | $9,633,824 |
The fund elected to defer to its next fiscal year approximately $53,990 of ordinary losses recognized during the period January 1, 2015 to October 31, 2015
The tax character of distributions paid was as follows:
| | October 31, 2015 | October 31, 2014 |
| Ordinary Income | $– | $ 603,370 |
Short-Term Trading (Redemption) Fees. Shares held by investors in the Fund less than 30 days may have been subject to a redemption fee equal to 1.00% of the NAV of shares redeemed. All redemption fees, which reduce the proceeds of the shareholder redemption, are retained by the Fund and accounted for as an addition to paid in capital.
4. Purchases and Sales of Investments.
Purchases and sales of securities, other than short-term securities, aggregated $254,164,528 and $228,252,851, respectively.
5. Fees and Other Transactions with Affiliates.
Management Fee. Fidelity Management & Research Company (the investment adviser) and its affiliates provide the Fund with investment management related services for which the Fund pays a monthly management fee. The management fee is the sum of an individual fund fee rate that is based on an annual rate of .45% of the Fund's average net assets and an annualized group fee rate that averaged .25% during the period. The group fee rate is based upon the average net assets of all the mutual funds advised by the investment adviser, including any mutual funds previously advised by the investment adviser that are currently advised by Fidelity SelectCo, LLC, an affiliate of the investment adviser. The group fee rate decreases as assets under management increase and increases as assets under management decrease. In addition, the management fee is subject to a performance adjustment (up to a maximum of +/- .20% of the Fund's average net assets over a 36 month performance period). The upward or downward adjustment to the management fee is based on the relative investment performance of the Institutional Class of the Fund as compared to its benchmark index, the MSCI All Country World Index, over the same 36 month performance period. For the reporting period, the total annual management fee rate, including the performance adjustment, was .84% of the Fund's average net assets. The performance adjustment included in the management fee rate may be higher or lower than the maximum performance adjustment rate due to the difference between the average net assets for the reporting and performance periods.
Distribution and Service Plan Fees. In accordance with Rule 12b-1 of the 1940 Act, the Fund has adopted separate Distribution and Service Plans for each class of shares. Certain classes pay Fidelity Distributors Corporation (FDC), an affiliate of the investment adviser, separate Distribution and Service Fees, each of which is based on an annual percentage of each class' average net assets. In addition, FDC may pay financial intermediaries for selling shares of the Fund and providing shareholder support services. For the period, the Distribution and Service Fee rates, total fees and amounts retained by FDC were as follows:
| | Distribution
Fee | Service
Fee | Total Fees | Retained
by FDC |
| Class A | -% | .25% | $108,323 | $1,432 |
| Class T | .25% | .25% | 116,366 | – |
| Class B | .75% | .25% | 10,272 | 7,718 |
| Class C | .75% | .25% | 187,575 | 32,446 |
| | | | $422,536 | $41,596 |
Sales Load. FDC may receive a front-end sales charge of up to 5.75% for selling Class A shares and 3.50% for selling Class T shares, some of which is paid to financial intermediaries for selling shares of the Fund. Depending on the holding period, FDC may receive contingent deferred sales charges levied on Class A, Class T, Class B, and Class C redemptions. The deferred sales charges range from 5.00% to 1.00% for Class B shares, 1.00% for Class C shares, 1.00% for certain purchases of Class A shares and .25% for certain purchases of Class T shares.
For the period, sales charge amounts retained by FDC were as follows:
| | Retained
by FDC |
| Class A | $18,157 |
| Class T | 6,482 |
| Class B(a) | 668 |
| Class C(a) | 2,257 |
| | $27,564 |
(a) When Class B and Class C shares are initially sold, FDC pays commissions from its own resources to financial intermediaries through which the sales are made.
Transfer Agent Fees. Fidelity Investments Institutional Operations Company, Inc., (FIIOC), an affiliate of the investment adviser, is the transfer, dividend disbursing and shareholder servicing agent for each class of the Fund. FIIOC receives account fees and asset-based fees that vary according to the account size and type of account of the shareholders of the respective classes of the Fund. FIIOC pays for typesetting, printing and mailing of shareholder reports, except proxy statements.
For the period, transfer agent fees for each class were as follows:
| | Amount | % of
Class-Level Average
Net Assets |
| Class A | $94,638 | .22 |
| Class T | 64,416 | .28 |
| Class B | 3,067 | .30 |
| Class C | 45,443 | .24 |
| Class I | 71,271 | .15 |
| | $278,835 | |
Accounting and Security Lending Fees. Fidelity Service Company, Inc. (FSC), an affiliate of the investment adviser, maintains the Fund's accounting records. The accounting fee is based on the level of average net assets for each month. Under a separate contract, FSC administers the security lending program. The security lending fee is based on the number and duration of lending transactions.
Brokerage Commissions. The Fund placed a portion of its portfolio transactions with brokerage firms which are affiliates of the investment adviser. Brokerage commissions are included in net realized gain (loss) and change in net unrealized appreciation (depreciation) in the Statement of Operations. The commissions paid to these affiliated firms were $2,096 for the period.
Other. During the period, the investment adviser reimbursed the Fund for certain losses in the amount of $1,146.
6. Committed Line of Credit.
The Fund participates with other funds managed by the investment adviser or an affiliate in a $4.25 billion credit facility (the "line of credit") to be utilized for temporary or emergency purposes to fund shareholder redemptions or for other short-term liquidity purposes. The Fund has agreed to pay commitment fees on its pro-rata portion of the line of credit, which amounted to $186 and is reflected in Miscellaneous expenses on the Statement of Operations. During the period, the Fund did not borrow on this line of credit.
7. Security Lending.
The Fund lends portfolio securities through a lending agent from time to time in order to earn additional income. For equity securities, a lending agent is used and may loan securities to certain qualified borrowers, including Fidelity Capital Markets (FCM), a broker-dealer affiliated with the Fund. On the settlement date of the loan, the Fund receives collateral (in the form of U.S. Treasury obligations, letters of credit and/or cash) against the loaned securities and maintains collateral in an amount not less than 100% of the market value of the loaned securities during the period of the loan. The market value of the loaned securities is determined at the close of business of the Fund and any additional required collateral is delivered to the Fund on the next business day. The Fund or borrower may terminate the loan at any time, and if the borrower defaults on its obligation to return the securities loaned because of insolvency or other reasons, the Fund may apply collateral received from the borrower against the obligation. The Fund may experience delays and costs in recovering the securities loaned. Any cash collateral received is invested in the Fidelity Securities Lending Cash Central Fund. The value of loaned securities and cash collateral at period end are disclosed on the Fund's Statement of Assets and Liabilities. Security lending income represents the income earned on investing cash collateral, less rebates paid to borrowers and any lending agent fees associated with the loan, plus any premium payments received for lending certain types of securities. Security lending income is presented in the Statement of Operations as a component of income from Fidelity Central Funds. Total security lending income during the period amounted to $12,466. During the period, there were no securities loaned to FCM.
8. Expense Reductions.
The investment adviser contractually agreed to reimburse each class to the extent annual operating expenses exceeded certain levels of average net assets as noted in the table below. This reimbursement will remain in place through December 31, 2015. Some expenses, for example interest expense, including commitment fees, are excluded from this reimbursement.
The following classes were in reimbursement during the period:
| | Expense
Limitations | Reimbursement |
| Class A | 1.45% | $50,528 |
| Class T | 1.70% | 44,572 |
| Class B | 2.20% | 2,469 |
| Class C | 2.20% | 26,813 |
| Class I | 1.20% | 27,369 |
| | | $151,751 |
Commissions paid to certain brokers with whom the investment adviser, or its affiliates, places trades on behalf of the Fund include an amount in addition to trade execution, which may be rebated back to the Fund to offset certain expenses. This amount totaled $14,062 for the period.
In addition, during the period the investment adviser reimbursed and/or waived a portion of fund-level operating expenses in the amount of $598 and a portion of class-level operating expenses as follows:
| | Amount |
| Class A | $801 |
| Class T | 345 |
| Class B | 3 |
| Class C | 310 |
| Class I | 796 |
| | $2,255 |
9. Distributions to Shareholders.
Distributions to shareholders of each class were as follows:
| Years ended October 31, | 2015 | 2014 |
| From net investment income | | |
| Class A | $– | $59,620 |
| Class I | – | 135,833 |
| Total | $– | $195,453 |
| From net realized gain | | |
| Class A | $– | $158,986 |
| Class T | – | 85,532 |
| Class B | – | 537 |
| Class C | – | 27,029 |
| Class I | – | 135,833 |
| Total | $– | $407,917 |
10. Share Transactions.
Share transactions for each class were as follows and may contain automatic conversions between classes or exchanges between funds:
| | Shares | Shares | Dollars | Dollars |
| Years ended October 31, | 2015 | 2014 | 2015 | 2014 |
| Class A | | | | |
| Shares sold | 1,624,998 | 591,626 | $27,021,428 | $8,791,852 |
| Reinvestment of distributions | – | 14,554 | – | 202,003 |
| Shares redeemed | (1,379,091) | (726,930) | (22,009,282) | (10,858,770) |
| Net increase (decrease) | 245,907 | (120,750) | $5,012,146 | $(1,864,915) |
| Class T | | | | |
| Shares sold | 370,447 | 191,912 | $5,817,431 | $2,773,971 |
| Reinvestment of distributions | – | 6,209 | – | 83,505 |
| Shares redeemed | (219,006) | (236,313) | (3,388,077) | (3,370,930) |
| Net increase (decrease) | 151,441 | (38,192) | $2,429,354 | $(513,454) |
| Class B | | | | |
| Shares sold | 8,363 | 7,695 | $124,801 | $100,901 |
| Reinvestment of distributions | – | 41 | – | 513 |
| Shares redeemed | (35,011) | (27,284) | (502,734) | (363,912) |
| Net increase (decrease) | (26,648) | (19,548) | $(377,933) | $(262,498) |
| Class C | | | | |
| Shares sold | 572,578 | 308,334 | $8,431,576 | $4,159,482 |
| Reinvestment of distributions | – | 2,025 | – | 25,331 |
| Shares redeemed | (219,967) | (227,752) | (3,119,457) | (3,054,673) |
| Net increase (decrease) | 352,611 | 82,607 | $5,312,119 | $1,130,140 |
| Class I | | | | |
| Shares sold | 1,401,232 | 494,369 | $23,612,800 | $7,721,563 |
| Reinvestment of distributions | – | 17,076 | – | 245,727 |
| Shares redeemed | (288,809) | (178,721) | (4,841,280) | (2,750,943) |
| Net increase (decrease) | 1,112,423 | 332,724 | $18,771,520 | $5,216,347 |
11. Other.
The Fund's organizational documents provide former and current trustees and officers with a limited indemnification against liabilities arising in connection with the performance of their duties to the Fund. In the normal course of business, the Fund may also enter into contracts that provide general indemnifications. The Fund's maximum exposure under these arrangements is unknown as this would be dependent on future claims that may be made against the Fund. The risk of material loss from such claims is considered remote.
At the end of the period, Strategic Advisers International II Fund was the owner of record of approximately 16% of the total outstanding shares of the Fund.
Report of Independent Registered Public Accounting Firm
To the Trustees of Fidelity Advisor Series VIII and Shareholders of Fidelity Advisor® Global Capital Appreciation Fund:
In our opinion, the accompanying statement of assets and liabilities, including the schedule of investments, and the related statements of operations and of changes in net assets and the financial highlights present fairly, in all material respects, the financial position of Fidelity Advisor® Global Capital Appreciation Fund (a fund of Fidelity Advisor Series VIII) at October 31, 2015, the results of its operations for the year then ended, the changes in its net assets for each of the two years in the period then ended and the financial highlights for each of the five years in the period then ended, in conformity with accounting principles generally accepted in the United States of America. These financial statements and financial highlights (hereafter referred to as “financial statements”) are the responsibility of the Fidelity Advisor® Global Capital Appreciation Fund’s management. Our responsibility is to express an opinion on these financial statements based on our audits. We conducted our audits of these financial statements in accordance with the standards of the Public Company Accounting Oversight Board (United States). Those standards require that we plan and perform the audit to obtain reasonable assurance about whether the financial statements are free of material misstatement. An audit includes examining, on a test basis, evidence supporting the amounts and disclosures in the financial statements, assessing the accounting principles used and significant estimates made by management, and evaluating the overall financial statement presentation. We believe that our audits, which included confirmation of securities at October 31, 2015 by correspondence with the custodian and brokers, provide a reasonable basis for our opinion.
PricewaterhouseCoopers LLP
Boston, Massachusetts
December 18, 2015
Trustees and Officers
The Trustees, Members of the Advisory Board (if any), and officers of the trust and fund, as applicable, are listed below. The Board of Trustees governs the fund and is responsible for protecting the interests of shareholders. The Trustees are experienced executives who meet periodically throughout the year to oversee the fund's activities, review contractual arrangements with companies that provide services to the fund, oversee management of the risks associated with such activities and contractual arrangements, and review the fund's performance. Each of the Trustees oversees 170 funds.
The Trustees hold office without limit in time except that (a) any Trustee may resign; (b) any Trustee may be removed by written instrument, signed by at least two-thirds of the number of Trustees prior to such removal; (c) any Trustee who requests to be retired or who has become incapacitated by illness or injury may be retired by written instrument signed by a majority of the other Trustees; and (d) any Trustee may be removed at any special meeting of shareholders by a two-thirds vote of the outstanding voting securities of the trust. Each Trustee who is not an interested person (as defined in the 1940 Act) of the trust and the fund is referred to herein as an Independent Trustee. Each Independent Trustee shall retire not later than the last day of the calendar year in which his or her 75th birthday occurs. The Independent Trustees may waive this mandatory retirement age policy with respect to individual Trustees. Officers and Advisory Board Members hold office without limit in time, except that any officer or Advisory Board Member may resign or may be removed by a vote of a majority of the Trustees at any regular meeting or any special meeting of the Trustees. Except as indicated, each individual has held the office shown or other offices in the same company for the past five years.
The fund’s Statement of Additional Information (SAI) includes more information about the Trustees. To request a free copy, call Fidelity at 1-877-208-0098.
Experience, Skills, Attributes, and Qualifications of the Trustees. The Governance and Nominating Committee has adopted a statement of policy that describes the experience, qualifications, attributes, and skills that are necessary and desirable for potential Independent Trustee candidates (Statement of Policy). The Board believes that each Trustee satisfied at the time he or she was initially elected or appointed a Trustee, and continues to satisfy, the standards contemplated by the Statement of Policy. The Governance and Nominating Committee also engages professional search firms to help identify potential Independent Trustee candidates who have the experience, qualifications, attributes, and skills consistent with the Statement of Policy. From time to time, additional criteria based on the composition and skills of the current Independent Trustees, as well as experience or skills that may be appropriate in light of future changes to board composition, business conditions, and regulatory or other developments, have also been considered by the professional search firms and the Governance and Nominating Committee. In addition, the Board takes into account the Trustees' commitment and participation in Board and committee meetings, as well as their leadership of standing and ad hoc committees throughout their tenure.
In determining that a particular Trustee was and continues to be qualified to serve as a Trustee, the Board has considered a variety of criteria, none of which, in isolation, was controlling. The Board believes that, collectively, the Trustees have balanced and diverse experience, qualifications, attributes, and skills, which allow the Board to operate effectively in governing the fund and protecting the interests of shareholders. Information about the specific experience, skills, attributes, and qualifications of each Trustee, which in each case led to the Board's conclusion that the Trustee should serve (or continue to serve) as a trustee of the fund, is provided below.
Board Structure and Oversight Function. James C. Curvey is an interested person and currently serves as Chairman. The Trustees have determined that an interested Chairman is appropriate and benefits shareholders because an interested Chairman has a personal and professional stake in the quality and continuity of services provided to the fund. Independent Trustees exercise their informed business judgment to appoint an individual of their choosing to serve as Chairman, regardless of whether the Trustee happens to be independent or a member of management. The Independent Trustees have determined that they can act independently and effectively without having an Independent Trustee serve as Chairman and that a key structural component for assuring that they are in a position to do so is for the Independent Trustees to constitute a substantial majority for the Board. The Independent Trustees also regularly meet in executive session. Ned C. Lautenbach serves as Chairman of the Independent Trustees and as such (i) acts as a liaison between the Independent Trustees and management with respect to matters important to the Independent Trustees and (ii) with management prepares agendas for Board meetings.
Fidelity® funds are overseen by different Boards of Trustees. The fund's Board oversees Fidelity's high income and certain equity funds, and other Boards oversee Fidelity's investment-grade bond, money market, asset allocation, and sector funds. The asset allocation funds may invest in Fidelity® funds overseen by the fund's Board. The use of separate Boards, each with its own committee structure, allows the Trustees of each group of Fidelity® funds to focus on the unique issues of the funds they oversee, including common research, investment, and operational issues. On occasion, the separate Boards establish joint committees to address issues of overlapping consequences for the Fidelity® funds overseen by each Board.
The Trustees operate using a system of committees to facilitate the timely and efficient consideration of all matters of importance to the Trustees, the fund, and fund shareholders and to facilitate compliance with legal and regulatory requirements and oversight of the fund's activities and associated risks. The Board, acting through its committees, has charged FMR and its affiliates with (i) identifying events or circumstances the occurrence of which could have demonstrably adverse effects on the fund's business and/or reputation; (ii) implementing processes and controls to lessen the possibility that such events or circumstances occur or to mitigate the effects of such events or circumstances if they do occur; and (iii) creating and maintaining a system designed to evaluate continuously business and market conditions in order to facilitate the identification and implementation processes described in (i) and (ii) above. Because the day-to-day operations and activities of the fund are carried out by or through FMR, its affiliates, and other service providers, the fund's exposure to risks is mitigated but not eliminated by the processes overseen by the Trustees. While each of the Board's committees has responsibility for overseeing different aspects of the fund's activities, oversight is exercised primarily through the Operations, Audit, and Compliance Committees. In addition, the Independent Trustees have worked with FMR to enhance the Board's oversight of investment and financial risks, legal and regulatory risks, technology risks, and operational risks, including the development of additional risk reporting to the Board. For example, a working group comprised of Independent Trustees and FMR has worked and continues to work to review the Fidelity® funds' valuation-related activities, reporting and risk management. Appropriate personnel, including but not limited to the fund's Chief Compliance Officer (CCO), FMR's internal auditor, the independent accountants, the fund's Treasurer and portfolio management personnel, make periodic reports to the Board's committees, as appropriate, including an annual review of Fidelity's risk management program for the Fidelity® funds. The responsibilities of each standing committee, including their oversight responsibilities, are described further under "Standing Committees of the Trustees."
Interested Trustees*:
Correspondence intended for a Trustee who is an interested person may be sent to Fidelity Investments, 245 Summer Street, Boston, Massachusetts 02210.
Name, Year of Birth; Principal Occupations and Other Relevant Experience+
James C. Curvey (1935)
Year of Election or Appointment: 2007
Trustee
Chairman of the Board of Trustees
Mr. Curvey also serves as Trustee of other Fidelity® funds. Mr. Curvey is a Director of Fidelity Research & Analysis Co. (investment adviser firm, 2009-present), and Vice Chairman (2007-present) and Director of FMR LLC (diversified financial services company). In addition, Mr. Curvey serves as an Overseer for the Boston Symphony Orchestra and a member of the board of Artis-Naples, Naples, Florida, and as a Trustee for Brewster Academy, Wolfeboro, New Hampshire. Previously, Mr. Curvey served as a Director of Fidelity Investments Money Management, Inc. (investment adviser firm, 2009-2014) and a Director of FMR and FMR Co., Inc. (investment adviser firms, 2007-2014).
Charles S. Morrison (1960)
Year of Election or Appointment: 2014
Trustee
Mr. Morrison also serves as Trustee of other funds. He serves as a Director of Fidelity Investments Money Management, Inc. (FIMM) (investment adviser firm, 2014-present), Director of Fidelity SelectCo, LLC (investment adviser firm, 2014-present), President, Asset Management (2014-present), and is an employee of Fidelity Investments. Previously, Mr. Morrison served as Vice President of Fidelity's Fixed Income and Asset Allocation Funds (2012-2014), President, Fixed Income (2011-2014), Vice President of Fidelity's Money Market Funds (2005-2009), President, Money Market Group Leader of FMR (investment adviser firm, 2009), and Senior Vice President, Money Market Group of FMR (2004-2009). Mr. Morrison also served as Vice President of Fidelity's Bond Funds (2002-2005), certain Balanced Funds (2002-2005), and certain Asset Allocation Funds (2002-2007), and as Senior Vice President (2002-2005) of Fidelity's Bond Division.
* Determined to be an “Interested Trustee” by virtue of, among other things, his or her affiliation with the trust or various entities under common control with FMR.
+ The information includes the Trustee's principal occupation during the last five years and other information relating to the experience, attributes, and skills relevant to the Trustee's qualifications to serve as a Trustee, which led to the conclusion that the Trustee should serve as a Trustee for the fund.
Independent Trustees:
Correspondence intended for an Independent Trustee may be sent to Fidelity Investments, P.O. Box 55235, Boston, Massachusetts 02205-5235.
Name, Year of Birth; Principal Occupations and Other Relevant Experience+
Dennis J. Dirks (1948)
Year of Election or Appointment: 2005
Trustee
Mr. Dirks also serves as Trustee of other Fidelity® funds. Prior to his retirement in May 2003, Mr. Dirks was Chief Operating Officer and a member of the Board of The Depository Trust & Clearing Corporation (DTCC). He also served as President, Chief Operating Officer, and Board member of The Depository Trust Company (DTC) and President and Board member of the National Securities Clearing Corporation (NSCC). In addition, Mr. Dirks served as Chief Executive Officer and Board member of the Government Securities Clearing Corporation, Chief Executive Officer and Board member of the Mortgage-Backed Securities Clearing Corporation, as a Trustee and a member of the Finance Committee of Manhattan College (2005-2008), as a Trustee and a member of the Finance Committee of AHRC of Nassau County (2006-2008), and as a member of the Independent Directors Council (IDC) Governing Council (2010-2015). Mr. Dirks is a member of the Board of Directors for The Brookville Center for Children's Services, Inc. (2009-present).
Alan J. Lacy (1953)
Year of Election or Appointment: 2008
Trustee
Mr. Lacy also serves as Trustee of other Fidelity® funds. Mr. Lacy serves as a member of the Board of Directors of Dave & Buster's Entertainment, Inc. (restaurant and entertainment complexes, 2010-present) and Bristol-Myers Squibb Company (global pharmaceuticals, 2008-present). In addition, Mr. Lacy served as Senior Adviser (2007-2014) of Oak Hill Capital Partners, L.P. (private equity) and also served as Chief Executive Officer (2000-2005) and Vice Chairman (2005-2006) of Sears Holdings Corporation and Sears, Roebuck and Co. (retail). Mr. Lacy is a member of the Board of Trustees of The National Parks Conservation Association (2006-present). Previously, Mr. Lacy served as Chairman of the Board of Trustees of the National Parks Conservation Association (2008-2011) and as a member of the Board of Directors for The Western Union Company (global money transfer, 2006-2011), The Hillman Companies, Inc. (hardware wholesalers, 2010-2014), and Earth Fare, Inc. (retail grocery, 2010-2014).
Ned C. Lautenbach (1944)
Year of Election or Appointment: 2000
Trustee
Chairman of the Independent Trustees
Mr. Lautenbach also serves as Trustee of other Fidelity® funds. Mr. Lautenbach currently serves as the Lead Director of the Eaton Corporation Board of Directors (diversified industrial, 1997-present). Mr. Lautenbach is Chairman of the Board of Directors of Artis-Naples in Naples, Florida (2012-present), a member of the Council on Foreign Relations (1994-present), and a member of the Board of Governors, State University System of Florida (2013-present). Previously, Mr. Lautenbach was a Partner/Advisory Partner at Clayton, Dubilier & Rice, LLC (private equity investment, 1998-2010), as well as a Director of Sony Corporation (2006-2007).
Joseph Mauriello (1944)
Year of Election or Appointment: 2008
Trustee
Mr. Mauriello also serves as Trustee of other Fidelity® funds. Prior to his retirement in January 2006, Mr. Mauriello served in numerous senior management positions including Deputy Chairman and Chief Operating Officer (2004-2005), and Vice Chairman of Financial Services (2002-2004) of KPMG LLP US (professional services, 1965-2005). Mr. Mauriello currently serves as a member of the Board of Directors of XL Group plc. (global insurance and re-insurance, 2006-present) and the Independent Directors Council (IDC) Governing Council (2015-present). Previously, Mr. Mauriello served as a Director of the Hamilton Funds of the Bank of New York (2006-2007) and of Arcadia Resources Inc. (health care services and products, 2007-2012).
Robert W. Selander (1950)
Year of Election or Appointment: 2011
Trustee
Mr. Selander also serves as Trustee of other Fidelity® funds. Mr. Selander serves as a Director of The Western Union Company (global money transfer, 2014-present). Previously, Mr. Selander served as a Member of the Advisory Board of other Fidelity® funds (2011), and Executive Vice Chairman (2010), Chief Executive Officer (2009-2010), and President and Chief Executive Officer (1997-2009) of Mastercard, Inc.
Cornelia M. Small (1944)
Year of Election or Appointment: 2005
Trustee
Ms. Small also serves as Trustee of other Fidelity® funds. Ms. Small is a member of the Board of Directors (2009-present) and Chair of the Investment Committee (2010-present) of the Teagle Foundation. Ms. Small also serves on the Investment Committee of the Berkshire Taconic Community Foundation (2008-present). Previously, Ms. Small served as Chairperson (2002-2008) and a member of the Investment Committee and Chairperson (2008-2012) and a member of the Board of Trustees of Smith College. In addition, Ms. Small served as Chief Investment Officer, Director of Global Equity Investments, and a member of the Board of Directors of Scudder, Stevens & Clark and Scudder Kemper Investments.
William S. Stavropoulos (1939)
Year of Election or Appointment: 2001
Trustee
Vice Chairman of the Independent Trustees
Mr. Stavropoulos also serves as Trustee of other Fidelity® funds. Mr. Stavropoulos serves as President and Founder of the Michigan Baseball Foundation, the Great Lakes Loons (2007-present). Mr. Stavropoulos is Chairman Emeritus of the Board of Directors of The Dow Chemical Company, where he previously served in numerous senior management positions, including President, CEO (1995-2000; 2002-2004), Chairman of the Executive Committee (2000-2006), and as a member of the Board of Directors (1990-2006). Currently, Mr. Stavropoulos is Chairman of the Board of Directors of Univar Inc. (global distributor of commodity and specialty chemicals), a Director of Teradata Corporation (data warehousing and technology solutions), and Maersk Inc. (industrial conglomerate), and a member of the Advisory Board for Metalmark Capital LLC (private equity investment, 2005-present). Mr. Stavropoulos is an operating advisor to Clayton, Dubilier & Rice, LLC (private equity investment). In addition, Mr. Stavropoulos is a member of the University of Notre Dame Advisory Council for the College of Science, a Trustee of the Rollin L. Gerstacker Foundation, and a Director of the Naples Philharmonic Center for the Arts. Previously, Mr. Stavropoulos served as a Director of Chemical Financial Corporation (bank holding company, 1993-2012) and Tyco International, Ltd. (multinational manufacturing and services, 2007-2012).
David M. Thomas (1949)
Year of Election or Appointment: 2008
Trustee
Mr. Thomas also serves as Trustee of other Fidelity® funds. Mr. Thomas serves as Non-Executive Chairman of the Board of Directors of Fortune Brands Home and Security (home and security products, 2011-present), as a member of the Board of Directors (2004-present) and Presiding Director (2013-present) of Interpublic Group of Companies, Inc. (marketing communication), and as a member of the Board of Trustees of the University of Florida (2013-present). Previously, Mr. Thomas served as Executive Chairman (2005-2006) and Chairman and Chief Executive Officer (2000-2005) of IMS Health, Inc. (pharmaceutical and healthcare information solutions), and a Director of Fortune Brands, Inc. (consumer products, 2000-2011).
+ The information includes the Trustee's principal occupation during the last five years and other information relating to the experience, attributes, and skills relevant to the Trustee's qualifications to serve as a Trustee, which led to the conclusion that the Trustee should serve as a Trustee for the fund.
Advisory Board Members and Officers:
Correspondence intended for an officer or Peter S. Lynch may be sent to Fidelity Investments, 245 Summer Street, Boston, Massachusetts 02210. Officers appear below in alphabetical order.
Name, Year of Birth; Principal Occupation
Peter S. Lynch (1944)
Year of Election or Appointment: 2003
Member of the Advisory Board
Mr. Lynch also serves as Member of the Advisory Board of other Fidelity® funds. Mr. Lynch is Vice Chairman and a Director of FMR (investment adviser firm) and FMR Co., Inc. (investment adviser firm). In addition, Mr. Lynch serves as a Trustee of Boston College and as the Chairman of the Inner-City Scholarship Fund. Previously, Mr. Lynch served on the Special Olympics International Board of Directors (1997-2006).
Elizabeth Paige Baumann (1968)
Year of Election or Appointment: 2012
Anti-Money Laundering (AML) Officer
Ms. Baumann also serves as AML Officer of other funds. She is Chief AML Officer of FMR LLC (diversified financial services company, 2012-present) and is an employee of Fidelity Investments. Previously, Ms. Baumann served as Vice President and Deputy Anti-Money Laundering Officer (2007-2012).
Marc R. Bryant (1966)
Year of Election or Appointment: 2015
Secretary and Chief Legal Officer (CLO)
Mr. Bryant also serves as Secretary and CLO of other funds. Mr. Bryant serves as CLO, Secretary, and Senior Vice President of Fidelity Management & Research Company (investment adviser firm, 2015-present) and FMR Co., Inc. (investment adviser firm, 2015-present); Secretary of Fidelity SelectCo, LLC (investment adviser firm, 2015-present) and Fidelity Investments Money Management, Inc. (investment adviser firm, 2015-present); and CLO of Fidelity Management & Research (Hong Kong) Limited (investment adviser firm, 2015-present). He is Senior Vice President and Deputy General Counsel of FMR LLC (diversified financial services company). Previously, Mr. Bryant served as Secretary and Chief Legal Officer of Fidelity Rutland Square Trust II (2010-2014) and Assistant Secretary of Fidelity's Fixed Income and Asset Allocation Funds (2013-2015). Prior to joining Fidelity Investments, Mr. Bryant served as a Senior Vice President and the Head of Global Retail Legal for AllianceBernstein L.P. (2006-2010), and as the General Counsel for ProFund Advisors LLC (2001-2006).
Timothy M. Cohen (1969)
Year of Election or Appointment: 2014
Vice President of certain Equity Funds
Mr. Cohen also serves as Vice President of other funds. Mr. Cohen serves as Chief Compliance Officer of FMR Investment Management (U.K.) Limited (investment adviser firm, 2013-present) and is an employee of Fidelity Investments. Previously, Mr. Cohen served as a Director of FMR Investment Management (U.K.) Limited (2013-2015).
William C. Coffey (1969)
Year of Election or Appointment: 2009
Assistant Secretary
Mr. Coffey also serves as Assistant Secretary of other funds. He is Senior Vice President and Deputy General Counsel of FMR LLC (diversified financial services company, 2010-present), and is an employee of Fidelity Investments. Previously, Mr. Coffey served as Vice President and Associate General Counsel of FMR LLC (2005-2009).
Jonathan Davis (1968)
Year of Election or Appointment: 2010
Assistant Treasurer
Mr. Davis also serves as Assistant Treasurer of other funds, and is an employee of Fidelity Investments. Previously, Mr. Davis served as Vice President and Associate General Counsel of FMR LLC (diversified financial services company, 2003-2010).
Adrien E. Deberghes (1967)
Year of Election or Appointment: 2008
Deputy Treasurer
Mr. Deberghes also serves as an officer of other funds. He is an employee of Fidelity Investments (2008-present). Prior to joining Fidelity Investments, Mr. Deberghes was Senior Vice President of Mutual Fund Administration at State Street Corporation (2007-2008), Senior Director of Mutual Fund Administration at Investors Bank & Trust (2005-2007), and Director of Finance for Dunkin' Brands (2000-2005).
Stephanie J. Dorsey (1969)
Year of Election or Appointment: 2010
Assistant Treasurer
Ms. Dorsey also serves as an officer of other funds. She is an employee of Fidelity Investments (2008-present) and has served in other fund officer roles. Prior to joining Fidelity Investments, Ms. Dorsey served as Treasurer (2004-2008) of the JPMorgan Mutual Funds and Vice President (2004-2008) of JPMorgan Chase Bank.
Howard J. Galligan III (1966)
Year of Election or Appointment: 2014
Chief Financial Officer
Mr. Galligan also serves as Chief Financial Officer of other funds. Mr. Galligan serves as President of Fidelity Pricing and Cash Management Services (FPCMS) (2014-present) and as a Director of Strategic Advisers, Inc. (investment adviser firm, 2008-present). Previously, Mr. Galligan served as Chief Administrative Officer of Asset Management (2011-2014) and Chief Operating Officer and Senior Vice President of Investment Support for Strategic Advisers, Inc. (2003-2011).
Scott C. Goebel (1968)
Year of Election or Appointment: 2015
Vice President
Mr. Goebel serves as Vice President of other funds and is an employee of Fidelity Investments (2001-present). Previously, Mr. Goebel served as Secretary of Fidelity SelectCo, LLC (investment adviser firm, 2013-2015), Fidelity Investments Money Management, Inc. (FIMM) (investment adviser firm, 2010-2015), and Fidelity Research and Analysis Company (FRAC) (investment adviser firm, 2010-2015); General Counsel, Secretary, and Senior Vice President of Fidelity Management & Research Company (investment adviser firm, 2008-2015) and FMR Co., Inc. (investment adviser firm, 2008-2015); Assistant Secretary of Fidelity Management & Research (Japan) Limited (investment adviser firm, 2008-2015) and FMR Investment Management (U.K.) Limited (investment adviser firm, 2008-2015); Chief Legal Officer (CLO) of Fidelity Management & Research (Hong Kong) Limited (investment adviser firm, 2008-2015); Secretary and CLO of certain Fidelity® funds (2008-2015); Assistant Secretary of FIMM (2008-2010), FRAC (2008-2010), and certain funds (2007-2008); and as Vice President and Secretary of Fidelity Distributors Corporation (FDC) (2005-2007).
Brian B. Hogan (1964)
Year of Election or Appointment: 2009
Vice President
Mr. Hogan also serves as Trustee or Vice President of other funds. Mr. Hogan serves as a Director of Fidelity SelectCo, LLC (investment adviser firm, 2014-present) and President of the Equity Division of FMR (investment adviser firm, 2009-present). Previously, Mr. Hogan served as Senior Vice President, Equity Research of FMR (2006-2009) and as a portfolio manager.
Chris Maher (1972)
Year of Election or Appointment: 2013
Assistant Treasurer
Mr. Maher serves as Assistant Treasurer of other funds. Mr. Maher is Vice President of Valuation Oversight and is an employee of Fidelity Investments. Previously, Mr. Maher served as Vice President of Asset Management Compliance (2013), Vice President of the Program Management Group of FMR (investment adviser firm, 2010-2013), and Vice President of Valuation Oversight (2008-2010).
Kenneth B. Robins (1969)
Year of Election or Appointment: 2008
President and Treasurer
Mr. Robins also serves as an officer of other funds. Mr. Robins serves as Executive Vice President of Fidelity Investments Money Management, Inc. (FIMM) (investment adviser firm, 2013-present) and is an employee of Fidelity Investments (2004-present). Previously, Mr. Robins served in other fund officer roles.
Stacie M. Smith (1974)
Year of Election or Appointment: 2013
Deputy Treasurer
Ms. Smith also serves as an officer of other funds. She is an employee of Fidelity Investments (2009-present) and has served in other fund officer roles. Prior to joining Fidelity Investments, Ms. Smith served as Senior Audit Manager of Ernst & Young LLP (1996-2009).
Renee Stagnone (1975)
Year of Election or Appointment: 2013
Deputy Treasurer
Ms. Stagnone also serves as Deputy Treasurer of other funds. Ms. Stagnone is an employee of Fidelity Investments (1997-present).
Linda J. Wondrack (1964)
Year of Election or Appointment: 2014
Chief Compliance Officer
Ms. Wondrack also serves as Chief Compliance Officer of other funds. Ms. Wondrack is Executive Vice President and head of the Ethics Office and Asset Management Compliance for Fidelity Investments (2012-present). Ms. Wondrack also serves as Chief Compliance Officer of Fidelity SelectCo, LLC (investment adviser firm, 2014-present); Chief Compliance Officer of Impresa Management LLC (2013-present); and Chief Compliance Officer of FMR Co., Inc. (investment adviser firm), Fidelity Investments Money Management, Inc. (investment adviser firm), Fidelity Management & Research (Japan) Limited (investment adviser firm), FMR Investment Management (U.K.) Limited (investment adviser firm), Fidelity Management & Research (Hong Kong) (investment adviser firm), Fidelity Management & Research Company (investment adviser firm), FIAM LLC (investment adviser firm), and Strategic Advisers, Inc. (investment adviser firm), Ballyrock Investment Advisors LLC, and Northern Neck Investors LLC (2012-present). Previously, Ms. Wondrack served as Senior Vice President and Chief Compliance Officer for Columbia Management Investment Advisers, LLC (2005-2012); Chief Compliance Officer for certain funds within the Columbia Family of Funds (2007-2012); and Senior Vice President of Compliance Risk Management at Bank of America (2005-2010).
Joseph F. Zambello (1957)
Year of Election or Appointment: 2011
Deputy Treasurer
Mr. Zambello also serves as Deputy Treasurer of other funds. Mr. Zambello is an employee of Fidelity Investments (1991-present). Previously, Mr. Zambello served as Vice President of the Program Management Group of FMR (investment adviser firm, 2009-2011) and Vice President of the Transfer Agent Oversight Group (2005-2009).
Shareholder Expense Example
As a shareholder of the Fund, you incur two types of costs: (1) transaction costs, including sales charges (loads) on purchase payments or redemption proceeds, redemption fees and (2) ongoing costs, including management fees, distribution and/or service (12b-1) fees and other Fund expenses. This Example is intended to help you understand your ongoing costs (in dollars) of investing in the Fund and to compare these costs with the ongoing costs of investing in other mutual funds.
The Example is based on an investment of $1,000 invested at the beginning of the period and held for the entire period (May 1, 2015 to October 31, 2015).
Actual Expenses
The first line of the accompanying table for each class of the Fund provides information about actual account values and actual expenses. You may use the information in this line, together with the amount you invested, to estimate the expenses that you paid over the period. Simply divide your account value by $1,000.00 (for example, an $8,600 account value divided by $1,000.00 = 8.6), then multiply the result by the number in the first line for a class of the Fund under the heading entitled "Expenses Paid During Period" to estimate the expenses you paid on your account during this period. In addition, the Fund, as a shareholder in the underlying Fidelity Central Funds, will indirectly bear its pro-rata share of the fees and expenses incurred by the underlying Fidelity Central Funds. These fees and expenses are not included in the Fund's annualized expense ratio used to calculate the expense estimate in the table below.
Hypothetical Example for Comparison Purposes
The second line of the accompanying table for each class of the Fund provides information about hypothetical account values and hypothetical expenses based on a Class' actual expense ratio and an assumed rate of return of 5% per year before expenses, which is not the Class' actual return. The hypothetical account values and expenses may not be used to estimate the actual ending account balance or expenses you paid for the period. You may use this information to compare the ongoing costs of investing in the Fund and other funds. To do so, compare this 5% hypothetical example with the 5% hypothetical examples that appear in the shareholder reports of the other funds. In addition, the Fund, as a shareholder in the underlying Fidelity Central Funds, will indirectly bear its pro-rata share of the fees and expenses incurred by the underlying Fidelity Central Funds. These fees and expenses are not included in the Fund's annualized expense ratio used to calculate the expense estimate in the table below.
Please note that the expenses shown in the table are meant to highlight your ongoing costs only and do not reflect any transaction costs. Therefore, the second line of the table is useful in comparing ongoing costs only, and will not help you determine the relative total costs of owning different funds. In addition, if these transactional costs were included, your costs would have been higher.
| | Annualized Expense Ratio-A | Beginning
Account Value
May 1, 2015 | Ending
Account Value
October 31, 2015 | Expenses Paid
During Period-B
May 1, 2015
to October 31, 2015 |
| Class A | 1.45% | | | |
| Actual | | $1,000.00 | $950.40 | $7.13 |
| Hypothetical-C | | $1,000.00 | $1,017.90 | $7.38 |
| Class T | 1.70% | | | |
| Actual | | $1,000.00 | $949.20 | $8.35 |
| Hypothetical-C | | $1,000.00 | $1,016.64 | $8.64 |
| Class B | 2.20% | | | |
| Actual | | $1,000.00 | $946.50 | $10.79 |
| Hypothetical-C | | $1,000.00 | $1,014.12 | $11.17 |
| Class C | 2.20% | | | |
| Actual | | $1,000.00 | $946.40 | $10.79 |
| Hypothetical-C | | $1,000.00 | $1,014.12 | $11.17 |
| Class I | 1.20% | | | |
| Actual | | $1,000.00 | $951.70 | $5.90 |
| Hypothetical-C | | $1,000.00 | $1,019.16 | $6.11 |
A Annualized expense ratio reflects expenses net of applicable fee waivers.
B Expenses are equal to each Class' annualized expense ratio, multiplied by the average account value over the period, multiplied by 184/365 (to reflect the one-half year period).
C 5% return per year before expenses
Distributions (Unaudited)
The Board of Trustees of Advisor Global Capital Appreciation Fund voted to pay to shareholders of record at the opening of business on record date, the following distributions per share derived from capital gains realized from sales of portfolio securities, and dividends derived from net investment income:
| | Pay Date | Record Date | Capital Gains |
| Class A | 12/07/15 | 12/04/15 | $0.089 |
| | | | |
| Class T | 12/07/15 | 12/04/15 | $0.089 |
| | | | |
| Class B | 12/07/15 | 12/04/15 | $0.089 |
| | | | |
| Class C | 12/07/15 | 12/04/15 | $0.089 |
|
The fund hereby designates as a capital gain dividend with respect to the taxable year ended October 31, 2015, $1,480,203, or, if subsequently determined to be different, the net capital gain of such year.
The fund will notify shareholders in January 2016 of amounts for use in preparing 2015 income tax returns.
Board Approval of Investment Advisory Contracts and Management Fees
Fidelity Advisor Global Capital Appreciation Fund
Each year, the Board of Trustees, including the Independent Trustees (together, the Board), votes on the renewal of the management contract with Fidelity Management & Research Company (FMR) and the sub-advisory agreements (together, the Advisory Contracts) for the fund. The Board, assisted by the advice of fund counsel and Independent Trustees' counsel, requests and considers a broad range of information relevant to the renewal of the Advisory Contracts throughout the year.
The Board meets regularly and, at each of its meetings, covers an extensive agenda of topics and materials and considers factors that are relevant to its annual consideration of the renewal of the fund's Advisory Contracts, including the services and support provided to the fund and its shareholders. The Board has established various standing committees (Committees), each composed of and chaired by Independent Trustees with varying backgrounds, to which the Board has assigned specific subject matter responsibilities in order to enhance effective decision-making by the Board. The Board, acting directly and through its Committees, requests and receives information concerning the annual consideration of the renewal of the fund's Advisory Contracts. The Board also meets as needed to consider matters specifically related to the Board's annual consideration of the renewal of the Advisory Contracts. Members of the Board may also meet with trustees of other Fidelity funds through ad hoc joint committees to discuss certain matters relevant to all of the Fidelity funds.
At its July 2015 meeting, the Board unanimously determined to renew the fund's Advisory Contracts. In reaching its determination, the Board considered all factors it believed relevant, including (i) the nature, extent, and quality of the services to be provided to the fund and its shareholders (including the investment performance of the fund); (ii) the competitiveness of the fund's management fee and total expense ratio relative to peer funds; (iii) the total costs of the services to be provided by and the profits to be realized by Fidelity from its relationship with the fund; and (iv) the extent to which (if any) economies of scale exist and would be realized as the fund grows, and whether any economies of scale are appropriately shared with fund shareholders.
In considering whether to renew the Advisory Contracts for the fund, the Board reached a determination, with the assistance of fund counsel and Independent Trustees' counsel and through the exercise of its business judgment, that the renewal of the Advisory Contracts was in the best interests of the fund and its shareholders and that the compensation payable under the Advisory Contracts was fair and reasonable. The Board's decision to renew the Advisory Contracts was not based on any single factor, but rather was based on a comprehensive consideration of all the information provided to the Board at its meetings throughout the year. The Board, in reaching its determination to renew the Advisory Contracts, was aware that shareholders of the fund have a broad range of investment choices available to them, including a wide choice among funds offered by Fidelity's competitors, and that the fund's shareholders, who have the opportunity to review and weigh the disclosure provided by the fund in its prospectus and other public disclosures, have chosen to invest in this fund, which is part of the Fidelity family of funds.
Nature, Extent, and Quality of Services Provided. The Board considered Fidelity's staffing as it relates to the fund, including the backgrounds of investment personnel of Fidelity, and also considered the fund's investment objective, strategies, and related investment philosophy. The Independent Trustees also had discussions with senior management of Fidelity's investment operations and investment groups. The Board considered the structure of the portfolio manager compensation program and whether this structure provides appropriate incentives to act in the best interests of the fund. Additionally, the Board considered the portfolio managers' investments, if any, in the funds that they manage.
Resources Dedicated to Investment Management and Support Services. The Board and the Fund Oversight and Research Committees reviewed the general qualifications and capabilities of Fidelity's investment staff, including its size, education, experience, and resources, as well as Fidelity's approach to recruiting, training, managing, and compensating investment personnel. The Board noted that Fidelity has continued to increase the resources devoted to non-U.S. offices, including expansion of Fidelity's global investment organization. The Board also noted that Fidelity's analysts have extensive resources, tools and capabilities that allow them to conduct sophisticated quantitative and fundamental analysis, as well as credit analysis of issuers, counterparties and guarantors. Further, the Board considered that Fidelity's investment professionals have sufficient access to global information and data so as to provide competitive investment results over time, and that those professionals also have access to sophisticated tools that permit them to assess portfolio construction and risk and performance attribution characteristics continuously, as well as to transmit new information and research conclusions rapidly around the world. Additionally, in its deliberations, the Board considered Fidelity's trading, risk management, and compliance capabilities and resources, which are integral parts of the investment management process.
Shareholder and Administrative Services. The Board considered (i) the nature, extent, quality, and cost of advisory, administrative, and shareholder services performed by FMR, the sub-advisers (together with FMR, the Investment Advisers), and their affiliates under the Advisory Contracts and under separate agreements covering transfer agency, pricing and bookkeeping, and securities lending services for the fund; (ii) the nature and extent of the supervision of third party service providers, principally custodians and subcustodians; and (iii) the resources devoted to, and the record of compliance with, the fund's compliance policies and procedures. The Board also reviewed the allocation of fund brokerage, including allocations to brokers affiliated with the Investment Advisers, the use of brokerage commissions to pay fund expenses, and the use of "soft" commission dollars to pay for research services.
The Board noted that the growth of fund assets over time across the complex allows Fidelity to reinvest in the development of services designed to enhance the value or convenience of the Fidelity funds as investment vehicles. These services include 24-hour access to account information and market information through telephone representatives and over the Internet, investor education materials and asset allocation tools, and the expanded availability of Fidelity Investor Centers.
In 2014, the Board formed an ad hoc Committee on Transfer Agency Fees to review the variety of transfer agency fee structures throughout the industry and Fidelity's competitive positioning with respect to industry participants.
Investment in a Large Fund Family. The Board considered the benefits to shareholders of investing in a Fidelity fund, including the benefits of investing in a fund that is part of a large family of funds offering a variety of investment disciplines and providing a large variety of mutual fund investor services. The Board noted that Fidelity had taken, or had made recommendations that resulted in the Fidelity funds taking, a number of actions over the previous year that benefited particular funds, including (i) continuing to dedicate additional resources to investment research and to the support of the senior management team that oversees asset management; (ii) continuing efforts to enhance Fidelity's global research capabilities; (iii) launching new funds and making other enhancements to meet client needs; (iv) reducing management fees and total expenses for certain index funds and diversified international funds; (v) continuing to launch dedicated lower cost underlying funds to meet portfolio construction needs related to expanding underlying fund options for Fidelity funds of funds, specifically for the Freedom Fund product lines; (vi) rationalizing product lines and gaining increased efficiencies through fund mergers; (vii) launching active fixed-income exchange-traded funds; (viii) continuing to develop, acquire and implement systems and technology to improve services to the funds and information security and to increase efficiency; (ix) implementing investment enhancements to further strengthen Fidelity's target date product line to increase investors' probability of success in achieving their goals; (x) modifying the eligibility criteria for certain share classes to accommodate roll-over assets from employer-sponsored retirement plans; (xi) launching a new Class W of the Freedom Index Funds to attract and retain Fidelity record-kept retirement plan assets; and (xii) implementing changes to Fidelity's money market product line in response to recent money market regulatory reforms.
Investment Performance. The Board considered whether the fund has operated in accordance with its investment objective, as well as its record of compliance with its investment restrictions and its performance history.
The Board took into account discussions with representatives of the Investment Advisers about fund investment performance that occur at Board meetings throughout the year. In this regard the Board noted that as part of regularly scheduled fund reviews and other reports to the Board on fund performance, the Board considers annualized return information for the fund, for different time periods, measured against a securities market index ("benchmark index") and a peer group of funds with similar objectives ("peer group"), if any. In its evaluation of fund investment performance, the Board gave particular attention to information indicating changes in performance of certain Fidelity funds for specific time periods and discussed with the Investment Advisers the reasons for any overperformance or underperformance.
In addition to reviewing absolute and relative fund performance, the Independent Trustees periodically consider the appropriateness of fund performance metrics in evaluating the results achieved. In general, the Independent Trustees believe that fund performance should be evaluated based on net performance (after fees and expenses) of both the highest performing and lowest performing fund share classes, where applicable, compared to appropriate benchmark indices, over appropriate time periods that may include full market cycles, and compared to peer groups, as applicable, over the same periods, taking into account relevant factors including the following: general market conditions; issuer-specific information; and fund cash flows and other factors.
The Independent Trustees recognize that shareholders evaluate performance on a net basis over their own holding periods, for which one-, three-, and five-year periods are often used as a proxy. For this reason, the performance information reviewed by the Board also included net cumulative calendar year total return information for the fund and an appropriate benchmark index and peer group for the most recent one-, three-, and five-year periods, as shown below. Returns are shown compared to the 25th percentile (top of box, 75% beaten) and 75th percentile (bottom of box, 25% beaten) of the peer universe. Returns of the benchmark index are "net MA,"
i.e., adjusted for tax withholding rates applicable to U.S.-based funds organized as Massachusetts business trusts.
Fidelity Advisor Global Capital Appreciation Fund
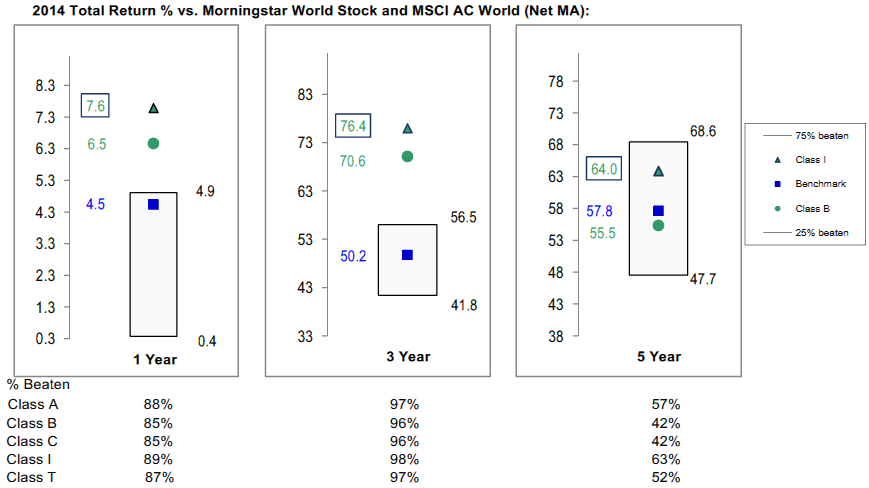
The Board also considered that the fund's management fee is subject to upward or downward adjustment depending upon whether, and to what extent, the fund's investment performance for the performance period exceeds, or is exceeded by, a securities index, thus leading to a performance adjustment for the same period. The Board noted that the performance adjustment provides FMR with a strong economic incentive to seek to achieve superior performance for the fund's shareholders and helps to more closely align the interests of FMR and the shareholders of the fund.
Based on its review, the Board concluded that the nature, extent, and quality of services provided to the fund under the Advisory Contracts should benefit the shareholders of the fund.
Competitiveness of Management Fee and Total Expense Ratio. The Board considered the fund's management fee and total expense ratio compared to "mapped groups" of competitive funds and classes created for the purpose of facilitating the Trustees' competitive analysis of management fees and total expenses. Fidelity creates "mapped groups" by combining similar Lipper investment objective categories that have comparable investment mandates. Combining Lipper investment objective categories aids the Board's management fee and total expense ratio comparisons by broadening the competitive group used for comparison.
Management Fee. The Board considered two proprietary management fee comparisons for the 12-month periods shown in basis points (BP) in the chart below. The group of Lipper funds used by the Board for management fee comparisons is referred to below as the "Total Mapped Group." The Total Mapped Group comparison focuses on a fund's standing in terms of gross management fees before expense reimbursements or caps, and without giving effect to the fund's performance adjustment, relative to the total universe of funds with comparable investment mandates, regardless of whether their management fee structures also are comparable. Funds with comparable investment mandates offer exposure to similar types of securities. Funds with comparable management fee structures have similar management fee contractual arrangements (
e.g., flat rate charged for advisory services, all-inclusive fee rate,
etc.). "TMG %" represents the percentage of funds in the Total Mapped Group that had management fees that were lower than the fund's. For example, a hypothetical TMG % of 20% would mean that 80% of the funds in the Total Mapped Group had higher, and 20% had lower, management fees than the fund. The fund's actual TMG %s and the number of funds in the Total Mapped Group are in the chart below. The "Asset-Size Peer Group" (ASPG) comparison focuses on a fund's standing relative to a subset of non-Fidelity funds within the Total Mapped Group that are similar in size and management fee structure without taking into account performance adjustments, if any. For example, if a fund is in the first quartile of the ASPG, the fund's management fee ranks in the least expensive or lowest 25% of funds in the ASPG. The ASPG represents at least 15% of the funds in the Total Mapped Group with comparable asset size and management fee structures, subject to a minimum of 50 funds (or all funds in the Total Mapped Group if fewer than 50). Additional information, such as the ASPG quartile in which the fund's management fee rate ranked and the impact of the fund's performance adjustment, is also included in the chart and considered by the Board.
Fidelity Advisor Global Capital Appreciation Fund
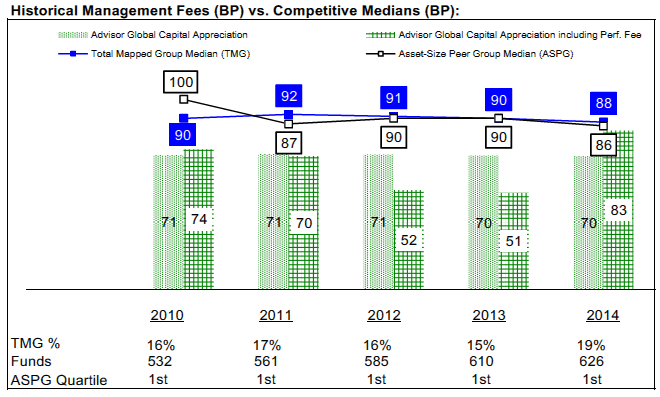
The Board noted that the fund's management fee rate ranked below the median of its Total Mapped Group and below the median of its ASPG for 2014. The Board also noted the effect of the fund's performance adjustment, if any, on the fund's management fee ranking.
The Board noted that, in 2014, the ad hoc Committee on Group Fee was formed by it and other Fidelity fund boards to conduct an in-depth review of the "group fee" component of the management fee of funds with such management fee structures. Committee focus included the mechanics of the group fee, the competitive landscape of group fee structures, Fidelity funds with no group fee component and investment products not included in group fee assets. The Board also considered that, for funds subject to the group fee, FMR agreed to voluntarily waive fees over a specified period of time in amounts designed to account for assets converted from certain funds to certain collective investment trusts.
The Board also noted that, in 2013, the ad hoc Committee on Management Fees was formed to conduct an in-depth review of the management fee rates of Fidelity's active equity mutual funds. The Committee focused on the following areas: (i) standard fee structures; (ii) research consumption and trading evolution; (iii) management fee competitiveness/profitability by category; and (iv) factors that drive institutional pricing.
Based on its review, the Board concluded that the fund's management fee is fair and reasonable in light of the services that the fund receives and the other factors considered.
Total Expense Ratio. In its review of each class's total expense ratio, the Board considered the fund's management fee as well as other fund or class expenses, as applicable, such as transfer agent fees, pricing and bookkeeping fees, fund-paid 12b-1 fees, and custodial, legal, and audit fees. The Board noted the impact of the fund's performance adjustment. The Board also noted that Fidelity may agree to waive fees and expenses from time to time, and the extent to which, if any, it has done so for the fund. As part of its review, the Board also considered the current and historical total expense ratios of each class of the fund compared to competitive fund median expenses. Each class of the fund is compared to those funds and classes in the Total Mapped Group (used by the Board for management fee comparisons) that have a similar sales load structure.
The Board noted that the total expense ratio of each class ranked above its competitive median for 2014. The Board considered that, in general, various factors can affect total expense ratios. The Board noted that the total expense ratio of each class of the fund was above the competitive median because of a significant positive performance fee adjustment in 2014. The Board noted that the total expense ratio of Class T was also above the competitive median because of higher 12b-1 fees on Class T as compared to most competitor funds. Class T has a higher 12b-1 fee, but a lower front-end sales charge, than traditionally priced front-end sales charge classes. The Board considered that Class T is primarily sold load-waived in the retirement plan market where its 0.50% 12b-1 fee is comparable to competing no-load, higher 12b-1 fee classes designed specifically for retirement plans. The Board noted that the fund offers multiple classes, each of which has a different sales load and 12b-1 fee structure, and that the multiple structures are intended to offer a range of pricing options for the intermediary market. The Board also noted that the total expense ratios of the classes vary primarily by the level of their 12b-1 fees, although differences in transfer agent fees may also cause expenses to vary from class to class.
The Board further considered that FMR contractually agreed to reimburse Class A, Class T, Class B, Class C, and Class I of the fund to the extent that total operating expenses (excluding interest, certain taxes, certain securities lending costs, brokerage commissions, extraordinary expenses, and acquired fund fees and expenses, if any), as a percentage of their respective average net assets, exceed 1.45%, 1.70%, 2.20%, 2.20%, and 1.20% through December 31, 2015.
Fees Charged to Other Fidelity Clients. The Board also considered Fidelity fee structures and other information with respect to clients of Fidelity, such as other funds advised or subadvised by Fidelity, pension plan clients, and other institutional clients with similar mandates. The Board noted the findings of the 2013 ad hoc joint committee (created with the board of other Fidelity funds), which reviewed and compared Fidelity's institutional investment advisory business with its business of providing services to the Fidelity funds, including the differences in services provided, fees charged, and costs incurred, as well as competition in their respective marketplaces.
Based on its review of total expense ratios and fees charged to other Fidelity clients, the Board concluded that, although in all cases above the median of the universe presented for comparison, the total expense ratio of each class of the fund was reasonable in light of the services that the fund and its shareholders receive and the other factors considered.
Costs of the Services and Profitability. The Board considered the revenues earned and the expenses incurred by Fidelity in conducting the business of developing, marketing, distributing, managing, administering and servicing the fund and servicing the fund's shareholders. The Board also considered the level of Fidelity's profits in respect of all the Fidelity funds.
On an annual basis, Fidelity presents to the Board information about the profitability of its relationship with the fund. Fidelity calculates profitability information for each fund, as well as aggregate profitability information for groups of Fidelity funds and all Fidelity funds, using a series of detailed revenue and cost allocation methodologies which originate with the books and records of Fidelity on which Fidelity's audited financial statements are based. The Audit Committee of the Board reviews any significant changes from the prior year's methodologies.
PricewaterhouseCoopers LLP (PwC), independent registered public accounting firm and auditor to Fidelity and certain Fidelity funds, has been engaged annually by the Board as part of the Board's assessment of Fidelity's profitability analysis. PwC's engagement includes the review and assessment of the methodologies used by Fidelity in determining the revenues and expenses attributable to Fidelity's mutual fund business, and completion of agreed-upon procedures in respect of the mathematical accuracy of fund profitability and its conformity to established allocation methodologies. After considering PwC's reports issued under the engagement and information provided by Fidelity, the Board concluded that while other allocation methods may also be reasonable, Fidelity's profitability methodologies are reasonable in all material respects.
The Board also reviewed Fidelity's non-fund businesses and fall-out benefits related to the mutual fund business as well as cases where Fidelity's affiliates may benefit from or be related to the fund's business.
The Board considered the costs of the services provided by and the profits realized by Fidelity in connection with the operation of the fund and was satisfied that the profitability was not excessive.
Economies of Scale. The Board considered whether there have been economies of scale in respect of the management of the Fidelity funds, whether the Fidelity funds (including the fund) have appropriately benefited from any such economies of scale, and whether there is potential for realization of any further economies of scale. The Board considered the extent to which the fund will benefit from economies of scale as assets grow through increased services to the fund, through waivers or reimbursements, or through fee or expense ratio reductions. The Board also noted that in 2013, it and the boards of other Fidelity funds created an ad hoc committee (the Economies of Scale Committee) to analyze whether Fidelity attains economies of scale in respect of the management and servicing of the Fidelity funds, whether the Fidelity funds have appropriately benefited from such economies of scale, and whether there is potential for realization of any further economies of scale.
The Board recognized that the fund's management contract incorporates a "group fee" structure, which provides for lower group fee rates as total group assets increase, and for higher group fee rates as total group assets decrease (with "group assets" defined to include fund assets under FMR's management plus sector fund assets previously under FMR's management and currently managed by Fidelity SelectCo, LLC). FMR calculates the group fee rates based on a tiered asset "breakpoint" schedule that varies based on asset class. The Board considered that the group fee is designed to deliver the benefits of economies of scale to fund shareholders when total Fidelity fund assets increase, even if assets of any particular fund are unchanged or have declined, because some portion of Fidelity's costs are attributable to services provided to all Fidelity funds, and all funds benefit if those costs can be allocated among more assets. The Board concluded that, given the group fee structure, fund shareholders will benefit from lower management fees as group assets increase at the fund complex level, regardless of whether Fidelity achieves any such economies of scale.
The Board concluded, taking into account the analysis of the Economies of Scale Committee, that economies of scale, if any, are being appropriately shared between fund shareholders and Fidelity.
Additional Information Requested by the Board. In order to develop fully the factual basis for consideration of the Fidelity funds' Advisory Contracts, the Board requested and received additional information on certain topics, including: (i) fund performance trends and Fidelity's long-term strategies for certain funds; (ii) the various share classes employed by Fidelity and the attributes of each class, together with similar information on the distribution and servicing payments made by Fidelity or the funds to third-party participants in the distribution channels; (iii) fund profitability, and fund performance in relation to fund profitability; (iv) the methodology with respect to evaluating competitive fund data and peer group classifications and fee comparisons; (v) annual fund profitability margins, with particular focus on certain funds with negative margins; (vi) the realization of fall-out benefits in certain Fidelity business units;
(vii) economies of scale and the way in which they are shared with fund shareholders;(viii) Fidelity's group fee structures, including the group fee schedule of breakpoints;(ix) the impact of cost containment measures on the funds; and (x) the transfer agent fee structure.
Based on its evaluation of all of the conclusions noted above, and after considering all factors it believed relevant, the Board concluded that the advisory fee structures are fair and reasonable, and that the fund's Advisory Contracts should be renewed.
AGLO-ANN-1215
1.728713.116
Fidelity Advisor® Global Capital Appreciation Fund Class I (formerly Institutional Class)
Annual Report October 31, 2015 |
|
Contents
To view a fund's proxy voting guidelines and proxy voting record for the 12-month period ended June 30, visit http://www.fidelity.com/proxyvotingresults or visit the Securities and Exchange Commission's (SEC) web site at http://www.sec.gov.
You may also call 1-877-208-0098 to request a free copy of the proxy voting guidelines.
Standard & Poor's, S&P and S&P 500 are registered service marks of The McGraw-Hill Companies, Inc. and have been licensed for use by Fidelity Distributors Corporation.
Other third-party marks appearing herein are the property of their respective owners.
All other marks appearing herein are registered or unregistered trademarks or service marks of FMR LLC or an affiliated company. © 2015 FMR LLC. All rights reserved.
This report and the financial statements contained herein are submitted for the general information of the shareholders of the Fund. This report is not authorized for distribution to prospective investors in the Fund unless preceded or accompanied by an effective prospectus.
A fund files its complete schedule of portfolio holdings with the SEC for the first and third quarters of each fiscal year on Form N-Q. Forms N-Q are available on the SEC’s web site at http://www.sec.gov. A fund's Forms N-Q may be reviewed and copied at the SEC’s Public Reference Room in Washington, DC. Information regarding the operation of the SEC's Public Reference Room may be obtained by calling 1-800-SEC-0330.
For a complete list of a fund's portfolio holdings, view the most recent holdings listing, semiannual report, or annual report on Fidelity's web site at http://www.fidelity.com, http://www.advisor.fidelity.com, or http://www.401k.com, as applicable.
NOT FDIC INSURED •MAY LOSE VALUE •NO BANK GUARANTEE
Neither the Fund nor Fidelity Distributors Corporation is a bank.
Performance: The Bottom Line
Average annual total return reflects the change in the value of an investment, assuming reinvestment of distributions from dividend income and capital gains (the profits earned upon the sale of securities that have grown in value, if any) and assuming a constant rate of performance each year.
The hypothetical investment and the average annual total returns do not reflect the deduction of taxes that a shareholder would pay on fund distributions or the redemption of fund shares.
During periods of reimbursement by Fidelity, a fund’s total return will be greater than it would be had the reimbursement not occurred.
How a fund did yesterday is no guarantee of how it will do tomorrow.
Average Annual Total Returns
| For the periods ended October 31, 2015 | Past 1 year | Past 5 years | Past 10 years |
| Class I | 3.96% | 7.39% | 4.99% |
$10,000 Over 10 Years
Let's say hypothetically that $10,000 was invested in Fidelity Advisor® Global Capital Appreciation Fund - Class I on October 31, 2005.
The chart shows how the value of your investment would have changed, and also shows how the MSCI ACWI (All Country World Index) Index performed over the same period.
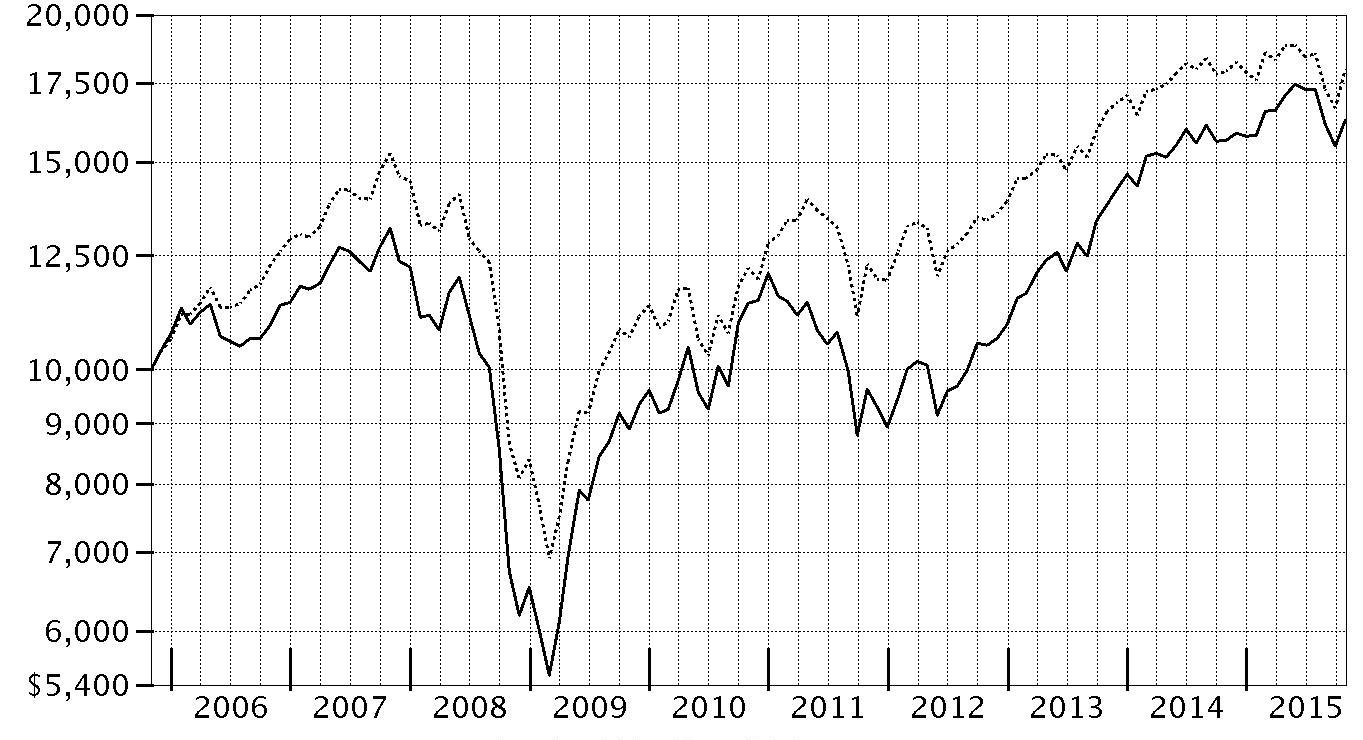
| Period Ending Values |
| $16,279 | Fidelity Advisor® Global Capital Appreciation Fund - Class I |
| $17,992 | MSCI ACWI (All Country World Index) Index |
Management's Discussion of Fund Performance
Market Recap: Following an August and September wherein a collapse in commodities prices hurt resources-related sectors and geographies, global equities rebounded in October to finish flat for the 12 months ending October 31, 2015. The MSCI ACWI (All Country World Index) Index returned 0.35% for the period. Commodity producers remained under pressure for much of the past year, largely related to economic deceleration in China (-1%), the world’s second-largest economy and a leading consumer of raw materials. This effect was exacerbated by the strength of the U.S. dollar relative to global currencies, which weighed on commodities priced in dollars and acutely impacted equity returns within regions most exposed to resources prices. For example, the emerging-markets group returned -15% this period. Canada, a significant energy producer, returned about -17%. Conversely, net energy consumer Japan (+9%) proved the best-performing region by far. Only about a quarter of the nearly 50 countries in the index managed a gain: Israel (+17%) and fast-growing Ireland (+12%) performed best; Greece (-56%) and Brazil (-46%), among the worst. As for sectors, energy (-22%) and materials (-12%) declined sharply, while consumer discretionary (+13%) saw a gain driven largely by demand in the United States (+5%).
Comments from Portfolio Manager Thomas Allen: For the year, the fund’s share classes (excluding sales charges, if applicable) posted low-single-digit gains but considerably outperformed the MSCI ACWI benchmark. Versus the index, picks in information technology, financials and industrials were noteworthy positives. A sizable underweighting in energy, by far the weakest-performing sector in the benchmark, also worked in our favor. Global Payments was the fund’s top contributor. The provider of payment processing services announced strong quarterly earnings in July and October, helping to boost our position here to a robust gain. Other noteworthy contributors included AMN Healthcare Services, which provides recruitment process outsourcing and placement of physicians, nurses and other health care professionals, and Denmark-based biotech company Genmab. All three contributors were non-benchmark positions, and I sold AMN from the portfolio in June. Conversely, the fund’s cash position was a drag on performance, as was its positioning in consumer staples to a lesser extent. Geographically, stock selection in China was a noteworthy negative. At the stock level, not owning strong-performing index stock Amazon.com was our biggest relative detractor. Non-index positions in Abraxas Petroleum and Belden, a manufacturer of networking, connectivity and cable products, also detracted.
The views expressed above reflect those of the portfolio manager(s) only through the end of the period as stated on the cover of this report and do not necessarily represent the views of Fidelity or any other person in the Fidelity organization. Any such views are subject to change at any time based upon market or other conditions and Fidelity disclaims any responsibility to update such views. These views may not be relied on as investment advice and, because investment decisions for a Fidelity fund are based on numerous factors, may not be relied on as an indication of trading intent on behalf of any Fidelity fund.
Investment Summary (Unaudited)
Top Five Stocks as of October 31, 2015
| | % of fund's net assets | % of fund's net assets 6 months ago |
| Citigroup, Inc. (United States of America, Banks) | 1.2 | 0.6 |
| Global Payments, Inc. (United States of America, IT Services) | 1.1 | 1.0 |
| Alphabet, Inc. Class A (United States of America, Internet Software & Services) | 1.1 | 0.0 |
| Vantiv, Inc. (United States of America, IT Services) | 1.0 | 0.0 |
| CDW Corp. (United States of America, Electronic Equipment & Components) | 0.9 | 0.7 |
| | 5.3 | |
Top Five Market Sectors as of October 31, 2015
| | % of fund's net assets | % of fund's net assets 6 months ago |
| Consumer Discretionary | 21.9 | 19.3 |
| Information Technology | 21.0 | 18.9 |
| Financials | 16.4 | 19.1 |
| Health Care | 13.0 | 12.7 |
| Industrials | 12.0 | 17.7 |
Top Five Countries as of October 31, 2015
| (excluding cash equivalents) | % of fund's net assets | % of fund's net assets 6 months ago |
| United States of America | 54.4 | 39.8 |
| Japan | 7.1 | 7.3 |
| United Kingdom | 4.5 | 5.1 |
| Canada | 3.0 | 3.2 |
| Germany | 2.4 | 3.5 |
Percentages are adjusted for the effect of futures contracts, if applicable.
Asset Allocation (% of fund's net assets)
| As of October 31, 2015 |
| | Stocks | 94.7% |
| | Short-Term Investments and Net Other Assets (Liabilities) | 5.3% |

| As of April 30, 2015 |
| | Stocks | 98.4% |
| | Short-Term Investments and Net Other Assets (Liabilities) | 1.6% |

Percentages shown as 0.0% may reflect amounts less than 0.05%.
Investments October 31, 2015
Showing Percentage of Net Assets
| Common Stocks - 94.4% | | | |
| | | Shares | Value |
| Australia - 1.4% | | | |
| Ausdrill Ltd. | | 246,041 | $60,156 |
| Burson Group Ltd. | | 147,119 | 374,059 |
| CSG Ltd. | | 222,798 | 255,140 |
| Echo Entertainment Group Ltd. | | 103,003 | 372,275 |
| Estia Health Ltd. | | 55,472 | 293,162 |
| Imdex Ltd. (a) | | 192,909 | 30,766 |
| Isentia Group Ltd. | | 89,437 | 262,767 |
| Japara Healthcare Ltd. | | 170,999 | 375,956 |
| Sonic Healthcare Ltd. | | 502 | 6,866 |
|
| TOTAL AUSTRALIA | | | 2,031,147 |
|
| Austria - 0.3% | | | |
| CA Immobilien Anlagen AG | | 18,300 | 358,904 |
| IMMOFINANZ Immobilien Anlagen AG (a) | | 46,100 | 118,218 |
|
| TOTAL AUSTRIA | | | 477,122 |
|
| Bailiwick of Jersey - 0.3% | | | |
| Delphi Automotive PLC | | 5,700 | 474,183 |
| Belgium - 0.3% | | | |
| Ion Beam Applications SA | | 10,700 | 381,815 |
| Bermuda - 1.3% | | | |
| Beijing Enterprises Water Group Ltd. | | 440,000 | 348,490 |
| BW LPG Ltd. | | 6,900 | 46,857 |
| Genpact Ltd. (a) | | 47,700 | 1,182,006 |
| Great Eagle Holdings Ltd. | | 34,590 | 113,779 |
| Hiscox Ltd. | | 14,815 | 220,965 |
|
| TOTAL BERMUDA | | | 1,912,097 |
|
| Brazil - 0.1% | | | |
| Brasil Foods SA | | 3,500 | 54,544 |
| Direcional Engenharia SA | | 57,600 | 52,872 |
| Natura Cosmeticos SA | | 3,700 | 21,970 |
|
| TOTAL BRAZIL | | | 129,386 |
|
| British Virgin Islands - 0.0% | | | |
| Epic Gas Ltd. (a) | | 5,100 | 9,003 |
| Canada - 3.0% | | | |
| B2Gold Corp. (a) | | 42,500 | 45,828 |
| CCL Industries, Inc. Class B | | 500 | 70,836 |
| Colliers International Group, Inc. | | 10,400 | 515,528 |
| Constellation Software, Inc. | | 600 | 259,254 |
| Descartes Systems Group, Inc. (a) | | 5,700 | 99,737 |
| Espial Group, Inc. (a) | | 119,635 | 230,560 |
| FirstService Corp. | | 2,700 | 94,983 |
| Lions Gate Entertainment Corp. | | 14,600 | 568,962 |
| MDC Partners, Inc. Class A (sub. vtg.) | | 24,500 | 513,520 |
| New Gold, Inc. (a) | | 5,700 | 14,124 |
| North West Co., Inc. | | 14,300 | 317,146 |
| Pason Systems, Inc. | | 4,300 | 63,270 |
| PrairieSky Royalty Ltd. | | 3,100 | 61,000 |
| Premium Brands Holdings Corp. | | 13,300 | 349,588 |
| Richelieu Hardware Ltd. | | 3,600 | 189,223 |
| Stella-Jones, Inc. | | 2,800 | 103,041 |
| Suncor Energy, Inc. | | 30,900 | 919,485 |
|
| TOTAL CANADA | | | 4,416,085 |
|
| Cayman Islands - 1.3% | | | |
| Anta Sports Products Ltd. | | 128,000 | 358,058 |
| Cheung Kong Property Holdings Ltd. | | 13,500 | 94,461 |
| Chlitina Holding Ltd. | | 42,000 | 344,124 |
| Fu Shou Yuan International Group Ltd. | | 554,000 | 377,736 |
| Geely Automobile Holdings Ltd. | | 680,000 | 362,622 |
| Greatview Aseptic Pack Co. Ltd. | | 206,000 | 96,708 |
| Xinyi Solar Holdings Ltd. | | 804,000 | 319,618 |
|
| TOTAL CAYMAN ISLANDS | | | 1,953,327 |
|
| China - 0.9% | | | |
| Beijing Urban Consolidated & Development Group Ltd. (H Shares) | | 158,000 | 97,208 |
| Inner Mongoli Yili Industries Co. Ltd. | | 137,900 | 346,871 |
| Kweichow Moutai Co. Ltd. | | 10,226 | 345,268 |
| PICC Property & Casualty Co. Ltd. (H Shares) | | 109,720 | 248,962 |
| Xinjiang Goldwind Science & Technology Co. Ltd. (H Shares) | | 169,800 | 318,880 |
|
| TOTAL CHINA | | | 1,357,189 |
|
| Curacao - 0.2% | | | |
| Sapiens International Corp. NV | | 26,281 | 310,687 |
| Denmark - 0.7% | | | |
| Ambu A/S Series B | | 700 | 18,990 |
| Genmab A/S (a) | | 6,400 | 631,286 |
| SimCorp A/S | | 7,300 | 357,877 |
|
| TOTAL DENMARK | | | 1,008,153 |
|
| France - 0.4% | | | |
| ALTEN | | 5,400 | 280,279 |
| Les Nouveaux Construct Investment SA | | 5,700 | 122,790 |
| Sartorius Stedim Biotech | | 600 | 212,024 |
|
| TOTAL FRANCE | | | 615,093 |
|
| Germany - 2.1% | | | |
| BAUER AG | | 17,000 | 358,926 |
| DIC Asset AG | | 38,500 | 378,997 |
| GFT Technologies AG | | 13,400 | 395,938 |
| Krones AG | | 1,900 | 228,573 |
| MLP AG | | 12,800 | 55,612 |
| Nemetschek AG | | 3,700 | 159,697 |
| Open Business Club AG | | 1,400 | 276,496 |
| Patrizia Immobilien AG | | 10,549 | 290,179 |
| Rational AG | | 800 | 317,623 |
| Stroer Out-of-Home Media AG | | 3,900 | 246,125 |
| VTG AG (b) | | 12,600 | 411,442 |
|
| TOTAL GERMANY | | | 3,119,608 |
|
| Greece - 0.1% | | | |
| Mytilineos Holdings SA | | 21,200 | 113,066 |
| Hong Kong - 0.6% | | | |
| Hang Lung Properties Ltd. | | 157,000 | 384,151 |
| MTR Corp. Ltd. | | 6 | 27 |
| Sino Land Ltd. | | 68,000 | 104,958 |
| Techtronic Industries Co. Ltd. | | 103,000 | 376,535 |
|
| TOTAL HONG KONG | | | 865,671 |
|
| India - 1.2% | | | |
| Bajaj Corp. Ltd. (a) | | 52,807 | 330,529 |
| Bharti Infratel Ltd. | | 25,014 | 148,566 |
| Britannia Industries Ltd. | | 179 | 8,828 |
| Dalmia Bharat Ltd. (a) | | 817 | 8,785 |
| HDFC Bank Ltd. (a) | | 13,770 | 276,180 |
| Housing Development Finance Corp. Ltd. | | 9,288 | 177,912 |
| Kalpataru Power Transmission Ltd. (a) | | 1,663 | 6,608 |
| Maruti Suzuki India Ltd. (a) | | 5,545 | 377,134 |
| Pc Jeweller Ltd. (a) | | 1,028 | 6,979 |
| Pfizer Ltd. | | 9,128 | 355,080 |
| Torrent Pharmaceuticals Ltd. | | 307 | 7,215 |
|
| TOTAL INDIA | | | 1,703,816 |
|
| Indonesia - 0.4% | | | |
| PT ACE Hardware Indonesia Tbk | | 98,900 | 4,815 |
| PT Astra International Tbk | | 11,100 | 4,772 |
| PT Bank Rakyat Indonesia Tbk | | 283,800 | 217,208 |
| Waskita Karya Persero Tbk PT | | 2,686,500 | 317,894 |
|
| TOTAL INDONESIA | | | 544,689 |
|
| Ireland - 1.8% | | | |
| Accenture PLC Class A | | 700 | 75,040 |
| C&C Group PLC | | 49,985 | 199,527 |
| Fleetmatics Group PLC (a) | | 5,500 | 306,130 |
| Jazz Pharmaceuticals PLC (a) | | 6,500 | 892,320 |
| Medtronic PLC | | 15,500 | 1,145,760 |
|
| TOTAL IRELAND | | | 2,618,777 |
|
| Isle of Man - 0.5% | | | |
| Optimal Payments PLC (a) | | 145,700 | 682,818 |
| Israel - 0.6% | | | |
| Frutarom Industries Ltd. | | 8,400 | 362,994 |
| Teva Pharmaceutical Industries Ltd. sponsored ADR | | 9,200 | 544,548 |
|
| TOTAL ISRAEL | | | 907,542 |
|
| Italy - 0.1% | | | |
| Mediaset SpA | | 34,100 | 173,241 |
| Japan - 7.1% | | | |
| Ain Holdings, Inc. | | 8,500 | 402,380 |
| Alps Electric Co. Ltd. | | 7,900 | 245,210 |
| Asahi Co. Ltd. | | 76,600 | 752,380 |
| ASKUL Corp. | | 4,400 | 161,506 |
| Broadleaf Co. Ltd. | | 19,300 | 221,074 |
| Chodai Co. Ltd. | | 27,500 | 131,127 |
| FJ Next Co. Ltd. | | 18,600 | 84,949 |
| GCA Savvian Group Corp. | | 10,800 | 126,807 |
| Gulliver International Co. Ltd. (b) | | 37,200 | 374,765 |
| Hoshizaki Electric Co. Ltd. | | 2,500 | 180,771 |
| Hoya Corp. | | 18,300 | 755,182 |
| Jamco Corp. | | 4,200 | 176,177 |
| JK Holdings Co. Ltd. | | 16,200 | 68,331 |
| KDDI Corp. | | 15,000 | 362,975 |
| Kinugawa Rubber Industrial Co. Ltd. | | 52,000 | 290,060 |
| Koshidaka Holdings Co. Ltd. | | 15,200 | 275,164 |
| Message Co. Ltd. | | 7,900 | 194,717 |
| Misumi Group, Inc. | | 15,600 | 203,145 |
| Monex Group, Inc. | | 132,300 | 371,898 |
| Nichi-iko Pharmaceutical Co. Ltd. | | 12,700 | 352,480 |
| Olympus Corp. | | 22,900 | 772,447 |
| Open House Co. Ltd. | | 24,700 | 450,586 |
| Penta-Ocean Construction Co. Ltd. | | 117,600 | 534,045 |
| Saizeriya Co. Ltd. | | 16,300 | 369,462 |
| Sakai Heavy Industries Ltd. | | 36,000 | 70,774 |
| Seikitokyu Kogyo Co. Ltd. | | 67,700 | 331,766 |
| Sohgo Security Services Co., Ltd. | | 4,400 | 212,270 |
| Suzuki Motor Corp. | | 7,500 | 245,576 |
| Temp Holdings Co., Ltd. | | 13,200 | 197,074 |
| Toshiba Corp. | | 29,000 | 81,811 |
| Tsuruha Holdings, Inc. | | 6,900 | 546,646 |
| United Arrows Ltd. | | 9,700 | 417,885 |
| Unizo Holdings Co. Ltd. | | 9,300 | 394,798 |
|
| TOTAL JAPAN | | | 10,356,238 |
|
| Korea (South) - 0.7% | | | |
| Cosmax Bti, Inc. | | 130 | 8,118 |
| Cuckoo Electronics Co. Ltd. | | 1,452 | 318,563 |
| Fila Korea Ltd. | | 1,480 | 129,623 |
| KONA I Co. Ltd. | | 8,453 | 271,335 |
| LG Household & Health Care Ltd. | | 16 | 13,271 |
| Osstem Implant Co. Ltd. (a) | | 6,209 | 363,262 |
|
| TOTAL KOREA (SOUTH) | | | 1,104,172 |
|
| Liberia - 0.2% | | | |
| Royal Caribbean Cruises Ltd. | | 2,900 | 285,215 |
| Malaysia - 0.8% | | | |
| Globetronics Technology Bhd | | 36,100 | 52,228 |
| Inari Amertron Bhd | | 400,500 | 331,980 |
| Kossan Rubber Industries Bhd | | 20,300 | 38,497 |
| My E.G.Services Bhd | | 526,300 | 361,398 |
| Top Glove Corp. Bhd | | 176,600 | 390,059 |
|
| TOTAL MALAYSIA | | | 1,174,162 |
|
| Marshall Islands - 0.1% | | | |
| StealthGas, Inc. (a) | | 46,700 | 197,074 |
| Mexico - 1.7% | | | |
| Controladora Vuela Compania de Aviacion S.A.B. de CV (a) | | 141,100 | 240,893 |
| El Puerto de Liverpool S.A.B. de CV Class C | | 26,438 | 367,156 |
| Grupo Aeroportuario del Pacifico SA de CV Series B | | 9,700 | 87,364 |
| Grupo Aeroportuario del Sureste SA de CV Series B | | 8,345 | 129,243 |
| Grupo Aeroportuario Norte S.A.B. de CV | | 69,300 | 356,447 |
| Grupo Lala S.A.B. de CV | | 162,700 | 415,768 |
| Promotora y Operadora de Infraestructura S.A.B. de CV (a) | | 30,500 | 382,427 |
| Unifin Financiera SAPI de CV (a) | | 152,200 | 462,005 |
|
| TOTAL MEXICO | | | 2,441,303 |
|
| Netherlands - 1.2% | | | |
| Euronext NV | | 10,000 | 439,640 |
| Grandvision NV | | 12,900 | 356,694 |
| Heijmans NV (Certificaten Van Aandelen) (a) | | 12,700 | 106,837 |
| LyondellBasell Industries NV Class A | | 3,800 | 353,058 |
| Nsi NV | | 35,061 | 152,754 |
| NXP Semiconductors NV (a) | | 4,000 | 313,400 |
|
| TOTAL NETHERLANDS | | | 1,722,383 |
|
| New Zealand - 0.1% | | | |
| Fisher & Paykel Healthcare Corp. | | 19,412 | 102,267 |
| Norway - 0.2% | | | |
| XXL ASA | | 29,300 | 312,940 |
| Panama - 0.1% | | | |
| Copa Holdings SA Class A | | 3,200 | 161,664 |
| Poland - 0.2% | | | |
| Kruk SA | | 6,000 | 285,611 |
| South Africa - 0.8% | | | |
| Capitec Bank Holdings Ltd. | | 5,400 | 233,536 |
| Consolidated Infra Group Ltd. (a) | | 137,100 | 346,440 |
| Famous Brands Ltd. | | 200 | 1,948 |
| Mpact Ltd. | | 358 | 1,251 |
| Peregrine Holdings Ltd. | | 42,200 | 93,890 |
| Pick 'n Pay Stores Ltd. | | 74,400 | 359,662 |
| Pioneer Foods Ltd. | | 300 | 4,303 |
| Spar Group Ltd. | | 100 | 1,437 |
| Transaction Capital Ltd. | | 185,800 | 142,985 |
| Woolworths Holdings Ltd. | | 500 | 3,704 |
|
| TOTAL SOUTH AFRICA | | | 1,189,156 |
|
| Spain - 0.2% | | | |
| Melia Hotels International SA (b) | | 19,000 | 274,956 |
| Sweden - 1.3% | | | |
| AarhusKarlshamn AB | | 8,200 | 590,750 |
| Betsson AB (B Shares) | | 10,600 | 172,458 |
| HEXPOL AB (B Shares) | | 19,700 | 191,845 |
| ITAB Shop Concept AB | | 12,600 | 367,962 |
| Nibe Industrier AB (B Shares) | | 16,450 | 529,686 |
|
| TOTAL SWEDEN | | | 1,852,701 |
|
| Switzerland - 1.2% | | | |
| ACE Ltd. | | 9,100 | 1,033,214 |
| Lonza Group AG | | 3,006 | 441,571 |
| u-blox Holding AG | | 1,430 | 276,756 |
|
| TOTAL SWITZERLAND | | | 1,751,541 |
|
| Taiwan - 0.7% | | | |
| Aerospace Industries Development Corp. | | 4,000 | 5,089 |
| ECLAT Textile Co. Ltd. | | 2,000 | 29,509 |
| Hota Industrial Manufacturing Co. Ltd. | | 117,000 | 389,219 |
| Iron Force Industrial Co. Ltd. | | 66,000 | 366,949 |
| Makalot Industrial Co. Ltd. | | 2,069 | 15,805 |
| Sporton International, Inc. | | 27,561 | 167,242 |
| Voltronic Power Technology Corp. | | 3,150 | 40,363 |
|
| TOTAL TAIWAN | | | 1,014,176 |
|
| Thailand - 0.6% | | | |
| Kasikornbank PCL (For. Reg.) | | 17,900 | 86,587 |
| KCE Electronics PCL | | 7,500 | 13,024 |
| MC Group PCL | | 11,400 | 4,451 |
| Srisawad Power 1979 PCL | | 302,300 | 370,668 |
| Unique Engineering and Construction PCL | | 601,600 | 363,153 |
|
| TOTAL THAILAND | | | 837,883 |
|
| Turkey - 0.7% | | | |
| Aksa Akrilik Kimya Sanayii | | 72,000 | 264,252 |
| Bim Birlesik Magazalar A/S JSC | | 20,000 | 406,805 |
| Soda Sanayii AS | | 49,013 | 81,033 |
| Turk Tuborg Bira ve Malt Sanayii A/S (a) | | 165,000 | 354,857 |
|
| TOTAL TURKEY | | | 1,106,947 |
|
| United Kingdom - 4.5% | | | |
| 4Imprint Group PLC | | 19,900 | 397,278 |
| B&M European Value Retail S.A. | | 19,857 | 102,059 |
| Barratt Developments PLC | | 71,800 | 677,957 |
| Bellway PLC | | 7,800 | 312,156 |
| Cineworld Group PLC | | 48,700 | 414,419 |
| Crest Nicholson PLC | | 34,400 | 288,489 |
| Development Securities PLC | | 26,800 | 98,536 |
| Domino's Pizza UK & IRL PLC | | 10,500 | 176,598 |
| Ensco PLC Class A | | 19,700 | 327,611 |
| Lloyds Banking Group PLC | | 299,900 | 340,390 |
| Marshalls PLC | | 61,900 | 330,648 |
| Micro Focus International PLC | | 18,600 | 360,142 |
| Moneysupermarket.com Group PLC | | 134,000 | 690,372 |
| Persimmon PLC | | 13,800 | 424,205 |
| Redrow PLC | | 42,686 | 305,400 |
| Rightmove PLC | | 5,600 | 331,419 |
| Taylor Wimpey PLC | | 128,100 | 391,008 |
| The Restaurant Group PLC | | 52,700 | 582,507 |
| Virgin Money Holdings Uk PLC | | 16,200 | 96,849 |
|
| TOTAL UNITED KINGDOM | | | 6,648,043 |
|
| United States of America - 54.4% | | | |
| Abraxas Petroleum Corp. (a) | | 408,100 | 648,879 |
| Acuity Brands, Inc. | | 800 | 174,880 |
| Adobe Systems, Inc. (a) | | 7,400 | 656,084 |
| AFLAC, Inc. | | 8,400 | 535,500 |
| Air Lease Corp. Class A | | 5,300 | 178,663 |
| Albemarle Corp. U.S. | | 14,300 | 765,336 |
| Alere, Inc. (a) | | 3,500 | 161,420 |
| Allegiant Travel Co. | | 3,000 | 592,350 |
| Alliance Data Systems Corp. (a) | | 4,000 | 1,189,240 |
| Alphabet, Inc.: | | | |
| Class A (a) | | 2,100 | 1,548,519 |
| Class C | | 1,259 | 894,910 |
| Altera Corp. | | 22,400 | 1,177,120 |
| AMC Networks, Inc. Class A (a) | | 8,900 | 657,621 |
| Amgen, Inc. | | 6,700 | 1,059,806 |
| Apache Corp. | | 15,200 | 716,376 |
| AutoZone, Inc. (a) | | 600 | 470,646 |
| Baxalta, Inc. | | 10,100 | 348,046 |
| Becton, Dickinson & Co. | | 7,800 | 1,111,656 |
| Biogen, Inc. (a) | | 1,900 | 551,969 |
| Blackhawk Network Holdings, Inc. (a) | | 26,600 | 1,132,628 |
| Boston Scientific Corp. (a) | | 66,700 | 1,219,276 |
| Brunswick Corp. | | 7,000 | 376,670 |
| Buffalo Wild Wings, Inc. (a) | | 100 | 15,427 |
| Cadence Design Systems, Inc. (a) | | 17,000 | 377,740 |
| Capital One Financial Corp. | | 11,600 | 915,240 |
| Catalent, Inc. (a) | | 24,800 | 659,184 |
| CBRE Group, Inc. (a) | | 20,100 | 749,328 |
| CDW Corp. | | 31,000 | 1,385,390 |
| Cigna Corp. | | 3,900 | 522,756 |
| CIT Group, Inc. | | 16,900 | 726,700 |
| Citigroup, Inc. | | 32,700 | 1,738,659 |
| Cognizant Technology Solutions Corp. Class A (a) | | 11,100 | 756,021 |
| Colfax Corp. (a) | | 11,600 | 312,736 |
| Cree, Inc. (a) | | 15,200 | 382,888 |
| Cummins, Inc. | | 3,100 | 320,881 |
| CVB Financial Corp. | | 68,300 | 1,191,835 |
| Cytec Industries, Inc. | | 1,700 | 126,514 |
| D.R. Horton, Inc. | | 13,000 | 382,720 |
| Deere & Co. | | 2,700 | 210,600 |
| Dermira, Inc. | | 3,100 | 83,669 |
| Discover Financial Services | | 6,400 | 359,808 |
| Dynegy, Inc. (a) | | 4,300 | 83,549 |
| Eastman Chemical Co. | | 4,200 | 303,114 |
| Electronic Arts, Inc. (a) | | 16,100 | 1,160,327 |
| Ethan Allen Interiors, Inc. | | 10,900 | 296,589 |
| Extra Space Storage, Inc. | | 2,200 | 174,328 |
| Facebook, Inc. Class A (a) | | 6,200 | 632,214 |
| Fair Isaac Corp. | | 9,300 | 859,041 |
| Fidelity National Information Services, Inc. | | 11,700 | 853,164 |
| First Republic Bank | | 16,900 | 1,103,739 |
| Foot Locker, Inc. | | 6,700 | 453,925 |
| Fortune Brands Home & Security, Inc. | | 8,200 | 429,106 |
| Fox Factory Holding Corp. (a) | | 44,600 | 791,650 |
| G-III Apparel Group Ltd. (a) | | 8,800 | 484,792 |
| Global Payments, Inc. | | 11,900 | 1,623,279 |
| Halliburton Co. | | 18,300 | 702,354 |
| Harris Corp. | | 7,100 | 561,823 |
| Heartland Payment Systems, Inc. | | 5,500 | 407,000 |
| Helmerich & Payne, Inc. | | 2,300 | 129,421 |
| Hilltop Holdings, Inc. (a) | | 15,900 | 333,423 |
| Hologic, Inc. (a) | | 11,500 | 446,890 |
| Hooker Furniture Corp. | | 21,600 | 536,112 |
| Houghton Mifflin Harcourt Co. (a) | | 19,800 | 387,882 |
| Interpublic Group of Companies, Inc. | | 32,600 | 747,518 |
| IPG Photonics Corp. (a) | | 8,700 | 718,794 |
| Johnson & Johnson | | 3,800 | 383,914 |
| Johnson Controls, Inc. | | 400 | 18,072 |
| Jones Lang LaSalle, Inc. | | 6,300 | 1,050,273 |
| Juniper Networks, Inc. | | 3,600 | 113,004 |
| Kate Spade & Co. (a) | | 17,400 | 312,678 |
| Keysight Technologies, Inc. (a) | | 2,000 | 66,160 |
| Knoll, Inc. | | 29,400 | 683,256 |
| Kroger Co. | | 14,500 | 548,100 |
| Laboratory Corp. of America Holdings (a) | | 4,500 | 552,330 |
| Ladder Capital Corp. Class A | | 10,400 | 148,304 |
| Lakeland Financial Corp. | | 11,100 | 498,723 |
| Lennar Corp. Class A | | 19,600 | 981,372 |
| Lennox International, Inc. | | 9,200 | 1,221,852 |
| Lithia Motors, Inc. Class A (sub. vtg.) | | 3,200 | 375,648 |
| M&T Bank Corp. | | 4,800 | 575,280 |
| Malibu Boats, Inc. Class A (a) | | 47,800 | 679,238 |
| Marsh & McLennan Companies, Inc. | | 2,700 | 150,498 |
| Matthews International Corp. Class A | | 6,600 | 381,018 |
| Maxim Integrated Products, Inc. | | 19,100 | 782,718 |
| McGraw Hill Financial, Inc. | | 4,900 | 453,936 |
| MedAssets, Inc. (a) | | 9,800 | 232,064 |
| Mohawk Industries, Inc. (a) | | 1,800 | 351,900 |
| Mueller Industries, Inc. | | 10,474 | 330,140 |
| Multi-Color Corp. | | 5,800 | 451,472 |
| News Corp. Class A | | 900 | 13,860 |
| NVR, Inc. (a) | | 400 | 655,104 |
| Oaktree Capital Group LLC Class A | | 1,500 | 74,790 |
| Omega Flex, Inc. | | 23,679 | 978,890 |
| Opus Bank | | 2,700 | 100,575 |
| PacWest Bancorp | | 16,100 | 725,144 |
| PDC Energy, Inc. (a) | | 3,300 | 199,122 |
| Polaris Industries, Inc. (b) | | 8,900 | 999,826 |
| Praxair, Inc. | | 3,100 | 344,379 |
| Priceline Group, Inc. (a) | | 800 | 1,163,392 |
| Procter & Gamble Co. | | 5,000 | 381,900 |
| Progressive Corp. | | 12,000 | 397,560 |
| PulteGroup, Inc. | | 59,500 | 1,090,635 |
| PVH Corp. | | 6,700 | 609,365 |
| QUALCOMM, Inc. | | 700 | 41,594 |
| Regions Financial Corp. | | 42,000 | 392,700 |
| Reinsurance Group of America, Inc. | | 3,100 | 279,744 |
| Rexnord Corp. (a) | | 59,900 | 1,106,952 |
| Rockwell Collins, Inc. | | 4,400 | 381,568 |
| Ruth's Hospitality Group, Inc. | | 53,400 | 828,234 |
| SM Energy Co. | | 5,100 | 170,085 |
| Southwestern Energy Co. (a) | | 42,800 | 472,512 |
| Sportsman's Warehouse Holdings, Inc. (a)(b) | | 26,900 | 289,444 |
| SS&C Technologies Holdings, Inc. | | 3,600 | 266,940 |
| Stanley Black & Decker, Inc. | | 3,600 | 381,528 |
| Steris Corp. (b) | | 10,900 | 816,955 |
| Store Capital Corp. | | 18,300 | 414,861 |
| Surgery Partners, Inc. | | 9,200 | 154,744 |
| Surgical Care Affiliates, Inc. (a) | | 9,900 | 293,139 |
| Tenneco, Inc. (a) | | 7,500 | 424,425 |
| The Western Union Co. | | 25,900 | 498,575 |
| Thermo Fisher Scientific, Inc. | | 9,200 | 1,203,176 |
| TJX Companies, Inc. | | 5,600 | 409,864 |
| Toll Brothers, Inc. (a) | | 31,800 | 1,143,846 |
| Total System Services, Inc. | | 13,600 | 713,320 |
| Twenty-First Century Fox, Inc. Class B | | 12,200 | 376,736 |
| U.S. Bancorp | | 16,700 | 704,406 |
| UMB Financial Corp. | | 13,000 | 638,040 |
| Vantiv, Inc. (a) | | 27,900 | 1,399,185 |
| Visa, Inc. Class A | | 8,800 | 682,704 |
| VSE Corp. | | 15,394 | 884,539 |
| Walgreens Boots Alliance, Inc. | | 4,100 | 347,188 |
| WESCO International, Inc. (a) | | 7,300 | 357,189 |
| Western Digital Corp. | | 10,100 | 674,882 |
| WestRock Co. | | 12,600 | 677,376 |
| Xylem, Inc. | | 24,200 | 881,122 |
| Yum! Brands, Inc. | | 2,200 | 156,002 |
| Zimmer Biomet Holdings, Inc. | | 4,400 | 460,108 |
|
| TOTAL UNITED STATES OF AMERICA | | | 79,605,900 |
|
| TOTAL COMMON STOCKS | | | |
| (Cost $128,303,287) | | | 138,228,847 |
|
| Nonconvertible Preferred Stocks - 0.3% | | | |
| Brazil - 0.0% | | | |
| Banco do Estado Rio Grande do Sul SA | | 36,300 | 56,381 |
| Germany - 0.3% | | | |
| Sartorius AG (non-vtg.) | | 1,600 | 362,093 |
| TOTAL NONCONVERTIBLE PREFERRED STOCKS | | | |
| (Cost $317,351) | | | 418,474 |
| | | Principal Amount | Value |
|
| Nonconvertible Bonds - 0.0% | | | |
| Canada - 0.0% | | | |
Constellation Software, Inc. 8.5% 3/31/40
(Cost $5,029)(c) | CAD | 5,600 | 4,925 |
| | | Shares | Value |
|
| Money Market Funds - 7.0% | | | |
| Fidelity Cash Central Fund, 0.18% (d) | | 8,682,990 | 8,682,990 |
| Fidelity Securities Lending Cash Central Fund, 0.19% (d)(e) | | 1,564,268 | 1,564,268 |
| TOTAL MONEY MARKET FUNDS | | | |
| (Cost $10,247,258) | | | 10,247,258 |
| TOTAL INVESTMENT PORTFOLIO - 101.7% | | | |
| (Cost $138,872,925) | | | 148,899,504 |
| NET OTHER ASSETS (LIABILITIES) - (1.7)% | | | (2,472,555) |
| NET ASSETS - 100% | | | $146,426,949 |
Currency Abbreviations
CAD – Canadian dollar
Categorizations in the Schedule of Investments are based on country or territory of incorporation.
Legend
(a) Non-income producing
(b) Security or a portion of the security is on loan at period end.
(c) Coupon rates for floating and adjustable rate securities reflect the rates in effect at period end.
(d) Affiliated fund that is generally available only to investment companies and other accounts managed by Fidelity Investments. The rate quoted is the annualized seven-day yield of the fund at period end. A complete unaudited listing of the fund's holdings as of its most recent quarter end is available upon request. In addition, each Fidelity Central Fund's financial statements, which are not covered by the Fund's Report of Independent Registered Public Accounting Firm, are available on the SEC's website or upon request.
(e) Investment made with cash collateral received from securities on loan.
Affiliated Central Funds
Information regarding fiscal year to date income earned by the Fund from investments in Fidelity Central Funds is as follows:
| Fund | Income earned |
| Fidelity Cash Central Fund | $5,114 |
| Fidelity Securities Lending Cash Central Fund | 12,466 |
| Total | $17,580 |
Investment Valuation
The following is a summary of the inputs used, as of October 31, 2015, involving the Fund's assets and liabilities carried at fair value. The inputs or methodology used for valuing securities may not be an indication of the risk associated with investing in those securities. For more information on valuation inputs, and their aggregation into the levels used below, please refer to the Investment Valuation section in the accompanying Notes to Financial Statements.
| | Valuation Inputs at Reporting Date: |
| Description | Total | Level 1 | Level 2 | Level 3 |
| Investments in Securities: | | | | |
| Equities: | | | | |
| Consumer Discretionary | $31,793,765 | $26,202,582 | $5,591,183 | $-- |
| Consumer Staples | 6,699,580 | 4,719,058 | 1,980,522 | -- |
| Energy | 4,663,049 | 4,663,049 | -- | -- |
| Financials | 23,444,316 | 19,684,971 | 3,759,345 | -- |
| Health Care | 18,898,699 | 15,357,038 | 3,541,661 | -- |
| Industrials | 18,037,403 | 14,686,186 | 3,351,217 | -- |
| Information Technology | 30,146,227 | 28,083,788 | 2,062,439 | -- |
| Materials | 4,020,702 | 3,884,443 | 136,259 | -- |
| Telecommunication Services | 511,541 | -- | 511,541 | -- |
| Utilities | 432,039 | 83,549 | 348,490 | -- |
| Corporate Bonds | 4,925 | -- | 4,925 | -- |
| Money Market Funds | 10,247,258 | 10,247,258 | -- | -- |
| Total Investments in Securities: | $148,899,504 | $127,611,922 | $21,287,582 | $-- |
See accompanying notes which are an integral part of the financial statements.
Financial Statements
Statement of Assets and Liabilities
| | | October 31, 2015 |
| Assets | | |
Investment in securities, at value (including securities loaned of $1,554,788) — See accompanying schedule:
Unaffiliated issuers (cost $128,625,667) | $138,652,246 | |
| Fidelity Central Funds (cost $10,247,258) | 10,247,258 | |
| Total Investments (cost $138,872,925) | | $148,899,504 |
| Foreign currency held at value (cost $13,640) | | 13,652 |
| Receivable for investments sold | | 420,783 |
| Receivable for fund shares sold | | 290,613 |
| Dividends receivable | | 128,075 |
| Interest receivable | | 32 |
| Distributions receivable from Fidelity Central Funds | | 2,338 |
| Prepaid expenses | | 405 |
| Receivable from investment adviser for expense reductions | | 32 |
| Other receivables | | 52,598 |
| Total assets | | 149,808,032 |
| Liabilities | | |
| Payable for investments purchased | $1,371,076 | |
| Payable for fund shares redeemed | 214,184 | |
| Accrued management fee | 101,094 | |
| Distribution and service plan fees payable | 36,357 | |
| Other affiliated payables | 30,965 | |
| Other payables and accrued expenses | 63,139 | |
| Collateral on securities loaned, at value | 1,564,268 | |
| Total liabilities | | 3,381,083 |
| Net Assets | | $146,426,949 |
| Net Assets consist of: | | |
| Paid in capital | | $136,029,676 |
| Accumulated net investment loss | | (52,047) |
| Accumulated undistributed net realized gain (loss) on investments and foreign currency transactions | | 451,090 |
| Net unrealized appreciation (depreciation) on investments and assets and liabilities in foreign currencies | | 9,998,230 |
| Net Assets | | $146,426,949 |
| Calculation of Maximum Offering Price | | |
| Class A: | | |
| Net Asset Value and redemption price per share ($41,224,878 ÷ 2,594,779 shares) | | $15.89 |
| Maximum offering price per share (100/94.25 of $15.89) | | $16.86 |
| Class T: | | |
| Net Asset Value and redemption price per share ($24,017,251 ÷ 1,567,817 shares) | | $15.32 |
| Maximum offering price per share (100/96.50 of $15.32) | | $15.88 |
| Class B: | | |
| Net Asset Value and offering price per share ($881,881 ÷ 62,277 shares)(a) | | $14.16 |
| Class C: | | |
| Net Asset Value and offering price per share ($21,185,766 ÷ 1,500,466 shares)(a) | | $14.12 |
| Class I: | | |
| Net Asset Value, offering price and redemption price per share ($59,117,173 ÷ 3,572,301 shares) | | $16.55 |
(a) Redemption price per share is equal to net asset value less any applicable contingent deferred sales charge.
See accompanying notes which are an integral part of the financial statements.
Statement of Operations
| | | Year ended October 31, 2015 |
| Investment Income | | |
| Dividends | | $1,923,035 |
| Interest | | 132 |
| Income from Fidelity Central Funds | | 17,580 |
| Income before foreign taxes withheld | | 1,940,747 |
| Less foreign taxes withheld | | (107,377) |
| Total income | | 1,833,370 |
| Expenses | | |
| Management fee | | |
| Basic fee | $933,317 | |
| Performance adjustment | 198,430 | |
| Transfer agent fees | 278,835 | |
| Distribution and service plan fees | 422,536 | |
| Accounting and security lending fees | 52,184 | |
| Custodian fees and expenses | 138,439 | |
| Independent trustees' compensation | 556 | |
| Registration fees | 65,742 | |
| Audit | 90,679 | |
| Legal | 336 | |
| Miscellaneous | 1,141 | |
| Total expenses before reductions | 2,182,195 | |
| Expense reductions | (168,666) | 2,013,529 |
| Net investment income (loss) | | (180,159) |
| Realized and Unrealized Gain (Loss) | | |
| Net realized gain (loss) on: | | |
| Investment securities: | | |
| Unaffiliated issuers (net of foreign taxes of $2,038) | 1,991,350 | |
| Foreign currency transactions | (130,162) | |
| Total net realized gain (loss) | | 1,861,188 |
Change in net unrealized appreciation (depreciation) on:
Investment securities | 511,038 | |
| Assets and liabilities in foreign currencies | (6,414) | |
| Total change in net unrealized appreciation (depreciation) | | 504,624 |
| Net gain (loss) | | 2,365,812 |
| Net increase (decrease) in net assets resulting from operations | | $2,185,653 |
See accompanying notes which are an integral part of the financial statements.
Statement of Changes in Net Assets
| | Year ended October 31, 2015 | Year ended October 31, 2014 |
| Increase (Decrease) in Net Assets | | |
| Operations | | |
| Net investment income (loss) | $(180,159) | $(2,050) |
| Net realized gain (loss) | 1,861,188 | 16,649,782 |
| Change in net unrealized appreciation (depreciation) | 504,624 | (4,085,442) |
| Net increase (decrease) in net assets resulting from operations | 2,185,653 | 12,562,290 |
| Distributions to shareholders from net investment income | – | (195,453) |
| Distributions to shareholders from net realized gain | – | (407,917) |
| Total distributions | – | (603,370) |
| Share transactions - net increase (decrease) | 31,147,206 | 3,705,620 |
| Redemption fees | 3,469 | 573 |
| Total increase (decrease) in net assets | 33,336,328 | 15,665,113 |
| Net Assets | | |
| Beginning of period | 113,090,621 | 97,425,508 |
| End of period (including accumulated net investment loss of $52,047 and undistributed net investment income of $23,087, respectively) | $146,426,949 | $113,090,621 |
See accompanying notes which are an integral part of the financial statements.
Fidelity Advisor Global Capital Appreciation Fund Class A
| | | | | | |
| Years ended October 31, | 2015 | 2014 | 2013 | 2012 | 2011 |
| Selected Per–Share Data | | | | | |
| Net asset value, beginning of period | $15.32 | $13.64 | $10.40 | $9.57 | $11.41 |
| Income from Investment Operations | | | | | |
| Net investment income (loss)A | (.01) | .01 | .04 | .02 | (.03) |
| Net realized and unrealized gain (loss) | .58 | 1.76 | 3.20 | .81 | (1.76) |
| Total from investment operations | .57 | 1.77 | 3.24 | .83 | (1.79) |
| Distributions from net investment income | – | (.02) | – | – | – |
| Distributions from net realized gain | – | (.06) | – | – | (.05) |
| Total distributions | – | (.09)B | – | – | (.05) |
| Redemption fees added to paid in capitalA,C | – | – | – | – | – |
| Net asset value, end of period | $15.89 | $15.32 | $13.64 | $10.40 | $9.57 |
| Total ReturnD,E | 3.72% | 13.03% | 31.15% | 8.67% | (15.81)% |
| Ratios to Average Net AssetsF,G | | | | | |
| Expenses before reductions | 1.57% | 1.62% | 1.38% | 1.43% | 1.51% |
| Expenses net of fee waivers, if any | 1.45% | 1.45% | 1.38% | 1.43% | 1.45% |
| Expenses net of all reductions | 1.44% | 1.45% | 1.35% | 1.40% | 1.43% |
| Net investment income (loss) | (.07)% | .07% | .33% | .22% | (.24)% |
| Supplemental Data | | | | | |
| Net assets, end of period (000 omitted) | $41,225 | $35,987 | $33,694 | $26,961 | $36,367 |
| Portfolio turnover rateH | 176% | 249% | 211% | 155% | 140% |
A Calculated based on average shares outstanding during the period.
B Total distributions of $.09 per share is comprised of distributions from net investment income of $.024 and distributions from net realized gain of $.064 per share.
C Amount represents less than $.005 per share.
D Total returns would have been lower if certain expenses had not been reduced during the applicable periods shown.
E Total returns do not include the effect of the sales charges.
F Fees and expenses of any underlying Fidelity Central Funds are not included in the Fund's expense ratio. The Fund indirectly bears its proportionate share of the expenses of any underlying Fidelity Central Funds.
G Expense ratios reflect operating expenses of the class. Expenses before reductions do not reflect amounts reimbursed by the investment adviser or reductions from brokerage service arrangements or reductions from other expense offset arrangements and do not represent the amount paid by the class during periods when reimbursements or reductions occur. Expenses net of fee waivers reflect expenses after reimbursement by the investment adviser but prior to reductions from brokerage service arrangements or other expense offset arrangements. Expenses net of all reductions represent the net expenses paid by the class.
H Amount does not include the portfolio activity of any underlying Fidelity Central Funds.
See accompanying notes which are an integral part of the financial statements.
Fidelity Advisor Global Capital Appreciation Fund Class T
| | | | | | |
| Years ended October 31, | 2015 | 2014 | 2013 | 2012 | 2011 |
| Selected Per–Share Data | | | | | |
| Net asset value, beginning of period | $14.81 | $13.19 | $10.09 | $9.31 | $11.11 |
| Income from Investment Operations | | | | | |
| Net investment income (loss)A | (.05) | (.03) | –B | –B | (.05) |
| Net realized and unrealized gain (loss) | .56 | 1.71 | 3.10 | .78 | (1.72) |
| Total from investment operations | .51 | 1.68 | 3.10 | .78 | (1.77) |
| Distributions from net realized gain | – | (.06) | – | – | (.03) |
| Redemption fees added to paid in capitalA,B | – | – | – | – | – |
| Net asset value, end of period | $15.32 | $14.81 | $13.19 | $10.09 | $9.31 |
| Total ReturnC,D | 3.44% | 12.77% | 30.72% | 8.38% | (15.97)% |
| Ratios to Average Net AssetsE,F | | | | | |
| Expenses before reductions | 1.89% | 1.93% | 1.68% | 1.71% | 1.80% |
| Expenses net of fee waivers, if any | 1.70% | 1.70% | 1.68% | 1.70% | 1.70% |
| Expenses net of all reductions | 1.69% | 1.70% | 1.64% | 1.68% | 1.68% |
| Net investment income (loss) | (.32)% | (.17)% | .04% | (.05)% | (.49)% |
| Supplemental Data | | | | | |
| Net assets, end of period (000 omitted) | $24,017 | $20,975 | $19,193 | $15,731 | $24,180 |
| Portfolio turnover rateG | 176% | 249% | 211% | 155% | 140% |
A Calculated based on average shares outstanding during the period.
B Amount represents less than $.005 per share.
C Total returns would have been lower if certain expenses had not been reduced during the applicable periods shown.
D Total returns do not include the effect of the sales charges.
E Fees and expenses of any underlying Fidelity Central Funds are not included in the Fund's expense ratio. The Fund indirectly bears its proportionate share of the expenses of any underlying Fidelity Central Funds.
F Expense ratios reflect operating expenses of the class. Expenses before reductions do not reflect amounts reimbursed by the investment adviser or reductions from brokerage service arrangements or reductions from other expense offset arrangements and do not represent the amount paid by the class during periods when reimbursements or reductions occur. Expenses net of fee waivers reflect expenses after reimbursement by the investment adviser but prior to reductions from brokerage service arrangements or other expense offset arrangements. Expenses net of all reductions represent the net expenses paid by the class.
G Amount does not include the portfolio activity of any underlying Fidelity Central Funds.
See accompanying notes which are an integral part of the financial statements.
Fidelity Advisor Global Capital Appreciation Fund Class B
| | | | | | |
| Years ended October 31, | 2015 | 2014 | 2013 | 2012 | 2011 |
| Selected Per–Share Data | | | | | |
| Net asset value, beginning of period | $13.75 | $12.27 | $9.43 | $8.74 | $10.46 |
| Income from Investment Operations | | | | | |
| Net investment income (loss)A | (.12) | (.09) | (.05) | (.05) | (.10) |
| Net realized and unrealized gain (loss) | .53 | 1.58 | 2.89 | .74 | (1.62) |
| Total from investment operations | .41 | 1.49 | 2.84 | .69 | (1.72) |
| Distributions from net realized gain | – | (.01) | – | – | –B |
| Redemption fees added to paid in capitalA,B | – | – | – | – | – |
| Net asset value, end of period | $14.16 | $13.75 | $12.27 | $9.43 | $8.74 |
| Total ReturnC,D | 2.98% | 12.11% | 30.12% | 7.89% | (16.42)% |
| Ratios to Average Net AssetsE,F | | | | | |
| Expenses before reductions | 2.44% | 2.44% | 2.17% | 2.19% | 2.32% |
| Expenses net of fee waivers, if any | 2.20% | 2.20% | 2.17% | 2.19% | 2.20% |
| Expenses net of all reductions | 2.19% | 2.20% | 2.13% | 2.17% | 2.18% |
| Net investment income (loss) | (.82)% | (.68)% | (.45)% | (.54)% | (.99)% |
| Supplemental Data | | | | | |
| Net assets, end of period (000 omitted) | $882 | $1,223 | $1,331 | $1,401 | $1,926 |
| Portfolio turnover rateG | 176% | 249% | 211% | 155% | 140% |
A Calculated based on average shares outstanding during the period.
B Amount represents less than $.005 per share.
C Total returns would have been lower if certain expenses had not been reduced during the applicable periods shown.
D Total returns do not include the effect of the contingent deferred sales charge.
E Fees and expenses of any underlying Fidelity Central Funds are not included in the Fund's expense ratio. The Fund indirectly bears its proportionate share of the expenses of any underlying Fidelity Central Funds.
F Expense ratios reflect operating expenses of the class. Expenses before reductions do not reflect amounts reimbursed by the investment adviser or reductions from brokerage service arrangements or reductions from other expense offset arrangements and do not represent the amount paid by the class during periods when reimbursements or reductions occur. Expenses net of fee waivers reflect expenses after reimbursement by the investment adviser but prior to reductions from brokerage service arrangements or other expense offset arrangements. Expenses net of all reductions represent the net expenses paid by the class.
G Amount does not include the portfolio activity of any underlying Fidelity Central Funds.
See accompanying notes which are an integral part of the financial statements.
Fidelity Advisor Global Capital Appreciation Fund Class C
| | | | | | |
| Years ended October 31, | 2015 | 2014 | 2013 | 2012 | 2011 |
| Selected Per–Share Data | | | | | |
| Net asset value, beginning of period | $13.72 | $12.26 | $9.41 | $8.73 | $10.46 |
| Income from Investment Operations | | | | | |
| Net investment income (loss)A | (.12) | (.09) | (.05) | (.05) | (.10) |
| Net realized and unrealized gain (loss) | .52 | 1.58 | 2.90 | .73 | (1.61) |
| Total from investment operations | .40 | 1.49 | 2.85 | .68 | (1.71) |
| Distributions from net realized gain | – | (.03) | – | – | (.02) |
| Redemption fees added to paid in capitalA,B | – | – | – | – | – |
| Net asset value, end of period | $14.12 | $13.72 | $12.26 | $9.41 | $8.73 |
| Total ReturnC,D | 2.92% | 12.13% | 30.29% | 7.79% | (16.38)% |
| Ratios to Average Net AssetsE,F | | | | | |
| Expenses before reductions | 2.34% | 2.40% | 2.16% | 2.18% | 2.28% |
| Expenses net of fee waivers, if any | 2.20% | 2.20% | 2.16% | 2.18% | 2.20% |
| Expenses net of all reductions | 2.19% | 2.20% | 2.13% | 2.16% | 2.18% |
| Net investment income (loss) | (.82)% | (.67)% | (.45)% | (.53)% | (.99)% |
| Supplemental Data | | | | | |
| Net assets, end of period (000 omitted) | $21,186 | $15,747 | $13,055 | $9,421 | $11,632 |
| Portfolio turnover rateG | 176% | 249% | 211% | 155% | 140% |
A Calculated based on average shares outstanding during the period.
B Amount represents less than $.005 per share.
C Total returns would have been lower if certain expenses had not been reduced during the applicable periods shown.
D Total returns do not include the effect of the contingent deferred sales charge.
E Fees and expenses of any underlying Fidelity Central Funds are not included in the Fund's expense ratio. The Fund indirectly bears its proportionate share of the expenses of any underlying Fidelity Central Funds.
F Expense ratios reflect operating expenses of the class. Expenses before reductions do not reflect amounts reimbursed by the investment adviser or reductions from brokerage service arrangements or reductions from other expense offset arrangements and do not represent the amount paid by the class during periods when reimbursements or reductions occur. Expenses net of fee waivers reflect expenses after reimbursement by the investment adviser but prior to reductions from brokerage service arrangements or other expense offset arrangements. Expenses net of all reductions represent the net expenses paid by the class.
G Amount does not include the portfolio activity of any underlying Fidelity Central Funds.
See accompanying notes which are an integral part of the financial statements.
Fidelity Advisor Global Capital Appreciation Fund Class I
| | | | | | |
| Years ended October 31, | 2015 | 2014 | 2013 | 2012 | 2011 |
| Selected Per–Share Data | | | | | |
| Net asset value, beginning of period | $15.92 | $14.18 | $10.78 | $9.88 | $11.76 |
| Income from Investment Operations | | | | | |
| Net investment income (loss)A | .03 | .05 | .09 | .06 | –B |
| Net realized and unrealized gain (loss) | .60 | 1.82 | 3.33 | .84 | (1.82) |
| Total from investment operations | .63 | 1.87 | 3.42 | .90 | (1.82) |
| Distributions from net investment income | – | (.06) | (.02) | – | – |
| Distributions from net realized gain | – | (.06) | – | – | (.06) |
| Total distributions | – | (.13)C | (.02) | – | (.06) |
| Redemption fees added to paid in capitalA,B | – | – | – | – | – |
| Net asset value, end of period | $16.55 | $15.92 | $14.18 | $10.78 | $9.88 |
| Total ReturnD | 3.96% | 13.27% | 31.74% | 9.11% | (15.60)% |
| Ratios to Average Net AssetsE,F | | | | | |
| Expenses before reductions | 1.26% | 1.29% | 1.02% | 1.06% | 1.18% |
| Expenses net of fee waivers, if any | 1.20% | 1.20% | 1.02% | 1.06% | 1.17% |
| Expenses net of all reductions | 1.19% | 1.20% | .99% | 1.03% | 1.15% |
| Net investment income (loss) | .18% | .33% | .69% | .59% | .04% |
| Supplemental Data | | | | | |
| Net assets, end of period (000 omitted) | $59,117 | $39,159 | $30,153 | $22,548 | $28,725 |
| Portfolio turnover rateG | 176% | 249% | 211% | 155% | 140% |
A Calculated based on average shares outstanding during the period.
B Amount represents less than $.005 per share.
C Total distributions of $.13 per share is comprised of distributions from net investment income of $.064 and distributions from net realized gain of $.064 per share.
D Total returns would have been lower if certain expenses had not been reduced during the applicable periods shown.
E Fees and expenses of any underlying Fidelity Central Funds are not included in the Fund's expense ratio. The Fund indirectly bears its proportionate share of the expenses of any underlying Fidelity Central Funds.
F Expense ratios reflect operating expenses of the class. Expenses before reductions do not reflect amounts reimbursed by the investment adviser or reductions from brokerage service arrangements or reductions from other expense offset arrangements and do not represent the amount paid by the class during periods when reimbursements or reductions occur. Expenses net of fee waivers reflect expenses after reimbursement by the investment adviser but prior to reductions from brokerage service arrangements or other expense offset arrangements. Expenses net of all reductions represent the net expenses paid by the class.
G Amount does not include the portfolio activity of any underlying Fidelity Central Funds.
See accompanying notes which are an integral part of the financial statements.
Notes to Financial Statements
For the period ended October 31, 2015
1. Organization.
Fidelity Advisor Global Capital Appreciation Fund (the Fund) is a fund of Fidelity Advisor Series VIII (the Trust) and is authorized to issue an unlimited number of shares. The Trust is registered under the Investment Company Act of 1940, as amended (the 1940 Act), as an open-end management investment company organized as a Massachusetts business trust. The Fund offers Class A, Class T, Class C and Class I (formerly Institutional Class) shares, each of which, along with Class B shares, has equal rights as to assets and voting privileges. Class B shares are closed to new accounts and additional purchases, except for exchanges and reinvestments. Each class has exclusive voting rights with respect to matters that affect that class. Class B shares will automatically convert to Class A shares after a holding period of seven years from the initial date of purchase. The Fund's investments in emerging markets can be subject to social, economic, regulatory, and political uncertainties and can be extremely volatile.
2. Investments in Fidelity Central Funds.
The Fund invests in Fidelity Central Funds, which are open-end investment companies generally available only to other investment companies and accounts managed by the investment adviser and its affiliates. The Fund's Schedule of Investments lists each of the Fidelity Central Funds held as of period end, if any, as an investment of the Fund, but does not include the underlying holdings of each Fidelity Central Fund. As an Investing Fund, the Fund indirectly bears its proportionate share of the expenses of the underlying Fidelity Central Funds.
The Money Market Central Funds seek preservation of capital and current income and are managed by Fidelity Investments Money Management, Inc. (FIMM), an affiliate of the investment adviser. Annualized expenses of the Money Market Central Funds as of their most recent shareholder report date are less than .005%.
A complete unaudited list of holdings for each Fidelity Central Fund is available upon request or at the Securities and Exchange Commission (the SEC) website at www.sec.gov. In addition, the financial statements of the Fidelity Central Funds, which are not covered by the Fund's Report of Independent Registered Public Accounting Firm, are available on the SEC website or upon request.
3. Significant Accounting Policies.
The financial statements have been prepared in conformity with accounting principles generally accepted in the United States of America (GAAP), which require management to make certain estimates and assumptions at the date of the financial statements. Actual results could differ from those estimates. Subsequent events, if any, through the date that the financial statements were issued have been evaluated in the preparation of the financial statements. The following summarizes the significant accounting policies of the Fund:
Investment Valuation. Investments are valued as of 4:00 p.m. Eastern time on the last calendar day of the period. The Board of Trustees (the Board) has delegated the day to day responsibility for the valuation of the Fund's investments to the Fidelity Management & Research Company (FMR) Fair Value Committee (the Committee). In accordance with valuation policies and procedures approved by the Board, the Fund attempts to obtain prices from one or more third party pricing vendors or brokers to value its investments. When current market prices, quotations or currency exchange rates are not readily available or reliable, investments will be fair valued in good faith by the Committee, in accordance with procedures adopted by the Board. Factors used in determining fair value vary by investment type and may include market or investment specific events, changes in interest rates and credit quality. The frequency with which these procedures are used cannot be predicted and they may be utilized to a significant extent. The Committee oversees the Fund's valuation policies and procedures and reports to the Board on the Committee's activities and fair value determinations. The Board monitors the appropriateness of the procedures used in valuing the Fund's investments and ratifies the fair value determinations of the Committee.
The Fund categorizes the inputs to valuation techniques used to value its investments into a disclosure hierarchy consisting of three levels as shown below:
- Level 1 – quoted prices in active markets for identical investments
- Level 2 – other significant observable inputs (including quoted prices for similar investments, interest rates, prepayment speeds, etc.)
- Level 3 – unobservable inputs (including the Fund's own assumptions based on the best information available)
Valuation techniques used to value the Fund's investments by major category are as follows:
Equity securities, including restricted securities, for which market quotations are readily available, are valued at the last reported sale price or official closing price as reported by a third party pricing vendor on the primary market or exchange on which they are traded and are categorized as Level 1 in the hierarchy. In the event there were no sales during the day or closing prices are not available, securities are valued at the last quoted bid price or may be valued using the last available price and are generally categorized as Level 2 in the hierarchy. For foreign equity securities, when market or security specific events arise, comparisons to the valuation of American Depositary Receipts (ADRs), futures contracts, Exchange-Traded Funds (ETFs) and certain indexes as well as quoted prices for similar securities may be used and would be categorized as Level 2 in the hierarchy. Utilizing these techniques may result in transfers between Level 1 and Level 2. For equity securities, including restricted securities, where observable inputs are limited, assumptions about market activity and risk are used and these securities may be categorized as Level 3 in the hierarchy.
Debt securities, including restricted securities, are valued based on evaluated prices received from third party pricing vendors or from brokers who make markets in such securities. Corporate bonds are valued by pricing vendors who utilize matrix pricing which considers yield or price of bonds of comparable quality, coupon, maturity and type or by broker-supplied prices. When independent prices are unavailable or unreliable, debt securities may be valued utilizing pricing methodologies which consider similar factors that would be used by third party pricing vendors. Debt securities are generally categorized as Level 2 in the hierarchy but may be Level 3 depending on the circumstances.
Investments in open-end mutual funds, including the Fidelity Central Funds, are valued at their closing net asset value (NAV) each business day and are categorized as Level 1 in the hierarchy.
Changes in valuation techniques may result in transfers in or out of an assigned level within the disclosure hierarchy. The aggregate value of investments by input level as of October 31, 2015, is included at the end of the Fund's Schedule of Investments.
Foreign Currency. The Fund may use foreign currency contracts to facilitate transactions in foreign-denominated securities. Gains and losses from these transactions may arise from changes in the value of the foreign currency or if the counterparties do not perform under the contracts' terms.
Foreign-denominated assets, including investment securities, and liabilities are translated into U.S. dollars at the exchange rates at period end. Purchases and sales of investment securities, income and dividends received and expenses denominated in foreign currencies are translated into U.S. dollars at the exchange rate in effect on the transaction date.
The effects of exchange rate fluctuations on investments are included with the net realized and unrealized gain (loss) on investment securities. Other foreign currency transactions resulting in realized and unrealized gain (loss) are disclosed separately.
Investment Transactions and Income. For financial reporting purposes, the Fund's investment holdings and NAV include trades executed through the end of the last business day of the period. The NAV per share for processing shareholder transactions is calculated as of the close of business of the New York Stock Exchange (NYSE), normally 4:00 p.m. Eastern time and includes trades executed through the end of the prior business day. Gains and losses on securities sold are determined on the basis of identified cost and may include proceeds received from litigation. Dividend income is recorded on the ex-dividend date, except for certain dividends from foreign securities where the ex-dividend date may have passed, which are recorded as soon as the Fund is informed of the ex-dividend date. Non-cash dividends included in dividend income, if any, are recorded at the fair market value of the securities received. Income and capital gain distributions from Fidelity Central Funds, if any, are recorded on the ex-dividend date. Distributions received on securities that represent a return of capital or capital gain are recorded as a reduction of cost of investments and/or as a realized gain. Subsequent to ex-dividend date the Fund determines the components of these distributions, based upon receipt of tax filings or other correspondence relating to the underlying investment. Interest income is accrued as earned and includes coupon interest and amortization of premium and accretion of discount on debt securities as applicable. Investment income is recorded net of foreign taxes withheld where recovery of such taxes is uncertain.
Class Allocations and Expenses. Investment income, realized and unrealized capital gains and losses, common expenses of the Fund, and certain fund-level expense reductions, if any, are allocated daily on a pro-rata basis to each class based on the relative net assets of each class to the total net assets of the Fund. Each class differs with respect to transfer agent and distribution and service plan fees incurred. Certain expense reductions may also differ by class. For the reporting period, the allocated portion of income and expenses to each class as a percent of its average net assets may vary due to the timing of recording these transactions in relation to fluctuating net assets of the classes. Expenses directly attributable to a fund are charged to that fund. Expenses attributable to more than one fund are allocated among the respective funds on the basis of relative net assets or other appropriate methods. Expense estimates are accrued in the period to which they relate and adjustments are made when actual amounts are known.
Income Tax Information and Distributions to Shareholders. Each year, the Fund intends to qualify as a regulated investment company under Subchapter M of the Internal Revenue Code, including distributing substantially all of its taxable income and realized gains. As a result, no provision for U.S. Federal income taxes is required. As of October 31, 2015, the Fund did not have any unrecognized tax benefits in the financial statements; nor is the Fund aware of any tax positions for which it is reasonably possible that the total amounts of unrecognized tax benefits will significantly change in the next twelve months. The Fund files a U.S. federal tax return, in addition to state and local tax returns as required. The Fund's federal income tax returns are subject to examination by the Internal Revenue Service (IRS) for a period of three fiscal years after they are filed. State and local tax returns may be subject to examination for an additional fiscal year depending on the jurisdiction. Foreign taxes are provided for based on the Fund's understanding of the tax rules and rates that exist in the foreign markets in which it invests. The Fund is subject to a tax imposed on capital gains by certain countries in which it invests.
Distributions are declared and recorded on the ex-dividend date. Income dividends and capital gain distributions are declared separately for each class. Income and capital gain distributions are determined in accordance with income tax regulations, which may differ from GAAP. In addition, the Fund claimed a portion of the payment made to redeeming shareholders as a distribution for income tax purposes.
Capital accounts within the financial statements are adjusted for permanent book-tax differences. These adjustments have no impact on net assets or the results of operations. Capital accounts are not adjusted for temporary book-tax differences which will reverse in a subsequent period.
Book-tax differences are primarily due to foreign currency transactions, certain foreign taxes, passive foreign investment companies (PFIC), partnerships, capital loss carryforwards and losses deferred due to wash sales.
The federal tax cost of investment securities and unrealized appreciation (depreciation) as of period end were as follows:
| Gross unrealized appreciation | $16,653,077 |
| Gross unrealized depreciation | (6,992,849) |
| Net unrealized appreciation (depreciation) on securities | $9,660,228 |
| Tax Cost | $139,239,276 |
The tax-based components of distributable earnings as of period end were as follows:
| Undistributed long-term capital gain | $817,444 |
| Net unrealized appreciation (depreciation) on securities and other investments | $9,633,824 |
The fund elected to defer to its next fiscal year approximately $53,990 of ordinary losses recognized during the period January 1, 2015 to October 31, 2015
The tax character of distributions paid was as follows:
| | October 31, 2015 | October 31, 2014 |
| Ordinary Income | $– | $ 603,370 |
Short-Term Trading (Redemption) Fees. Shares held by investors in the Fund less than 30 days may have been subject to a redemption fee equal to 1.00% of the NAV of shares redeemed. All redemption fees, which reduce the proceeds of the shareholder redemption, are retained by the Fund and accounted for as an addition to paid in capital.
4. Purchases and Sales of Investments.
Purchases and sales of securities, other than short-term securities, aggregated $254,164,528 and $228,252,851, respectively.
5. Fees and Other Transactions with Affiliates.
Management Fee. Fidelity Management & Research Company (the investment adviser) and its affiliates provide the Fund with investment management related services for which the Fund pays a monthly management fee. The management fee is the sum of an individual fund fee rate that is based on an annual rate of .45% of the Fund's average net assets and an annualized group fee rate that averaged .25% during the period. The group fee rate is based upon the average net assets of all the mutual funds advised by the investment adviser, including any mutual funds previously advised by the investment adviser that are currently advised by Fidelity SelectCo, LLC, an affiliate of the investment adviser. The group fee rate decreases as assets under management increase and increases as assets under management decrease. In addition, the management fee is subject to a performance adjustment (up to a maximum of +/- .20% of the Fund's average net assets over a 36 month performance period). The upward or downward adjustment to the management fee is based on the relative investment performance of the Institutional Class of the Fund as compared to its benchmark index, the MSCI All Country World Index, over the same 36 month performance period. For the reporting period, the total annual management fee rate, including the performance adjustment, was .84% of the Fund's average net assets. The performance adjustment included in the management fee rate may be higher or lower than the maximum performance adjustment rate due to the difference between the average net assets for the reporting and performance periods.
Distribution and Service Plan Fees. In accordance with Rule 12b-1 of the 1940 Act, the Fund has adopted separate Distribution and Service Plans for each class of shares. Certain classes pay Fidelity Distributors Corporation (FDC), an affiliate of the investment adviser, separate Distribution and Service Fees, each of which is based on an annual percentage of each class' average net assets. In addition, FDC may pay financial intermediaries for selling shares of the Fund and providing shareholder support services. For the period, the Distribution and Service Fee rates, total fees and amounts retained by FDC were as follows:
| | Distribution
Fee | Service
Fee | Total Fees | Retained
by FDC |
| Class A | -% | .25% | $108,323 | $1,432 |
| Class T | .25% | .25% | 116,366 | – |
| Class B | .75% | .25% | 10,272 | 7,718 |
| Class C | .75% | .25% | 187,575 | 32,446 |
| | | | $422,536 | $41,596 |
Sales Load. FDC may receive a front-end sales charge of up to 5.75% for selling Class A shares and 3.50% for selling Class T shares, some of which is paid to financial intermediaries for selling shares of the Fund. Depending on the holding period, FDC may receive contingent deferred sales charges levied on Class A, Class T, Class B, and Class C redemptions. The deferred sales charges range from 5.00% to 1.00% for Class B shares, 1.00% for Class C shares, 1.00% for certain purchases of Class A shares and .25% for certain purchases of Class T shares.
For the period, sales charge amounts retained by FDC were as follows:
| | Retained
by FDC |
| Class A | $18,157 |
| Class T | 6,482 |
| Class B(a) | 668 |
| Class C(a) | 2,257 |
| | $27,564 |
(a) When Class B and Class C shares are initially sold, FDC pays commissions from its own resources to financial intermediaries through which the sales are made.
Transfer Agent Fees. Fidelity Investments Institutional Operations Company, Inc., (FIIOC), an affiliate of the investment adviser, is the transfer, dividend disbursing and shareholder servicing agent for each class of the Fund. FIIOC receives account fees and asset-based fees that vary according to the account size and type of account of the shareholders of the respective classes of the Fund. FIIOC pays for typesetting, printing and mailing of shareholder reports, except proxy statements.
For the period, transfer agent fees for each class were as follows:
| | Amount | % of
Class-Level Average
Net Assets |
| Class A | $94,638 | .22 |
| Class T | 64,416 | .28 |
| Class B | 3,067 | .30 |
| Class C | 45,443 | .24 |
| Class I | 71,271 | .15 |
| | $278,835 | |
Accounting and Security Lending Fees. Fidelity Service Company, Inc. (FSC), an affiliate of the investment adviser, maintains the Fund's accounting records. The accounting fee is based on the level of average net assets for each month. Under a separate contract, FSC administers the security lending program. The security lending fee is based on the number and duration of lending transactions.
Brokerage Commissions. The Fund placed a portion of its portfolio transactions with brokerage firms which are affiliates of the investment adviser. Brokerage commissions are included in net realized gain (loss) and change in net unrealized appreciation (depreciation) in the Statement of Operations. The commissions paid to these affiliated firms were $2,096 for the period.
Other. During the period, the investment adviser reimbursed the Fund for certain losses in the amount of $1,146.
6. Committed Line of Credit.
The Fund participates with other funds managed by the investment adviser or an affiliate in a $4.25 billion credit facility (the "line of credit") to be utilized for temporary or emergency purposes to fund shareholder redemptions or for other short-term liquidity purposes. The Fund has agreed to pay commitment fees on its pro-rata portion of the line of credit, which amounted to $186 and is reflected in Miscellaneous expenses on the Statement of Operations. During the period, the Fund did not borrow on this line of credit.
7. Security Lending.
The Fund lends portfolio securities through a lending agent from time to time in order to earn additional income. For equity securities, a lending agent is used and may loan securities to certain qualified borrowers, including Fidelity Capital Markets (FCM), a broker-dealer affiliated with the Fund. On the settlement date of the loan, the Fund receives collateral (in the form of U.S. Treasury obligations, letters of credit and/or cash) against the loaned securities and maintains collateral in an amount not less than 100% of the market value of the loaned securities during the period of the loan. The market value of the loaned securities is determined at the close of business of the Fund and any additional required collateral is delivered to the Fund on the next business day. The Fund or borrower may terminate the loan at any time, and if the borrower defaults on its obligation to return the securities loaned because of insolvency or other reasons, the Fund may apply collateral received from the borrower against the obligation. The Fund may experience delays and costs in recovering the securities loaned. Any cash collateral received is invested in the Fidelity Securities Lending Cash Central Fund. The value of loaned securities and cash collateral at period end are disclosed on the Fund's Statement of Assets and Liabilities. Security lending income represents the income earned on investing cash collateral, less rebates paid to borrowers and any lending agent fees associated with the loan, plus any premium payments received for lending certain types of securities. Security lending income is presented in the Statement of Operations as a component of income from Fidelity Central Funds. Total security lending income during the period amounted to $12,466. During the period, there were no securities loaned to FCM.
8. Expense Reductions.
The investment adviser contractually agreed to reimburse each class to the extent annual operating expenses exceeded certain levels of average net assets as noted in the table below. This reimbursement will remain in place through December 31, 2015. Some expenses, for example interest expense, including commitment fees, are excluded from this reimbursement.
The following classes were in reimbursement during the period:
| | Expense
Limitations | Reimbursement |
| Class A | 1.45% | $50,528 |
| Class T | 1.70% | 44,572 |
| Class B | 2.20% | 2,469 |
| Class C | 2.20% | 26,813 |
| Class I | 1.20% | 27,369 |
| | | $151,751 |
Commissions paid to certain brokers with whom the investment adviser, or its affiliates, places trades on behalf of the Fund include an amount in addition to trade execution, which may be rebated back to the Fund to offset certain expenses. This amount totaled $14,062 for the period.
In addition, during the period the investment adviser reimbursed and/or waived a portion of fund-level operating expenses in the amount of $598 and a portion of class-level operating expenses as follows:
| | Amount |
| Class A | $801 |
| Class T | 345 |
| Class B | 3 |
| Class C | 310 |
| Class I | 796 |
| | $2,255 |
9. Distributions to Shareholders.
Distributions to shareholders of each class were as follows:
| Years ended October 31, | 2015 | 2014 |
| From net investment income | | |
| Class A | $– | $59,620 |
| Class I | – | 135,833 |
| Total | $– | $195,453 |
| From net realized gain | | |
| Class A | $– | $158,986 |
| Class T | – | 85,532 |
| Class B | – | 537 |
| Class C | – | 27,029 |
| Class I | – | 135,833 |
| Total | $– | $407,917 |
10. Share Transactions.
Share transactions for each class were as follows and may contain automatic conversions between classes or exchanges between funds:
| | Shares | Shares | Dollars | Dollars |
| Years ended October 31, | 2015 | 2014 | 2015 | 2014 |
| Class A | | | | |
| Shares sold | 1,624,998 | 591,626 | $27,021,428 | $8,791,852 |
| Reinvestment of distributions | – | 14,554 | – | 202,003 |
| Shares redeemed | (1,379,091) | (726,930) | (22,009,282) | (10,858,770) |
| Net increase (decrease) | 245,907 | (120,750) | $5,012,146 | $(1,864,915) |
| Class T | | | | |
| Shares sold | 370,447 | 191,912 | $5,817,431 | $2,773,971 |
| Reinvestment of distributions | – | 6,209 | – | 83,505 |
| Shares redeemed | (219,006) | (236,313) | (3,388,077) | (3,370,930) |
| Net increase (decrease) | 151,441 | (38,192) | $2,429,354 | $(513,454) |
| Class B | | | | |
| Shares sold | 8,363 | 7,695 | $124,801 | $100,901 |
| Reinvestment of distributions | – | 41 | – | 513 |
| Shares redeemed | (35,011) | (27,284) | (502,734) | (363,912) |
| Net increase (decrease) | (26,648) | (19,548) | $(377,933) | $(262,498) |
| Class C | | | | |
| Shares sold | 572,578 | 308,334 | $8,431,576 | $4,159,482 |
| Reinvestment of distributions | – | 2,025 | – | 25,331 |
| Shares redeemed | (219,967) | (227,752) | (3,119,457) | (3,054,673) |
| Net increase (decrease) | 352,611 | 82,607 | $5,312,119 | $1,130,140 |
| Class I | | | | |
| Shares sold | 1,401,232 | 494,369 | $23,612,800 | $7,721,563 |
| Reinvestment of distributions | – | 17,076 | – | 245,727 |
| Shares redeemed | (288,809) | (178,721) | (4,841,280) | (2,750,943) |
| Net increase (decrease) | 1,112,423 | 332,724 | $18,771,520 | $5,216,347 |
11. Other.
The Fund's organizational documents provide former and current trustees and officers with a limited indemnification against liabilities arising in connection with the performance of their duties to the Fund. In the normal course of business, the Fund may also enter into contracts that provide general indemnifications. The Fund's maximum exposure under these arrangements is unknown as this would be dependent on future claims that may be made against the Fund. The risk of material loss from such claims is considered remote.
At the end of the period, Strategic Advisers International II Fund was the owner of record of approximately 16% of the total outstanding shares of the Fund.
Report of Independent Registered Public Accounting Firm
To the Trustees of Fidelity Advisor Series VIII and Shareholders of Fidelity Advisor® Global Capital Appreciation Fund:
In our opinion, the accompanying statement of assets and liabilities, including the schedule of investments, and the related statements of operations and of changes in net assets and the financial highlights present fairly, in all material respects, the financial position of Fidelity Advisor® Global Capital Appreciation Fund (a fund of Fidelity Advisor Series VIII) at October 31, 2015, the results of its operations for the year then ended, the changes in its net assets for each of the two years in the period then ended and the financial highlights for each of the five years in the period then ended, in conformity with accounting principles generally accepted in the United States of America. These financial statements and financial highlights (hereafter referred to as “financial statements”) are the responsibility of the Fidelity Advisor® Global Capital Appreciation Fund’s management. Our responsibility is to express an opinion on these financial statements based on our audits. We conducted our audits of these financial statements in accordance with the standards of the Public Company Accounting Oversight Board (United States). Those standards require that we plan and perform the audit to obtain reasonable assurance about whether the financial statements are free of material misstatement. An audit includes examining, on a test basis, evidence supporting the amounts and disclosures in the financial statements, assessing the accounting principles used and significant estimates made by management, and evaluating the overall financial statement presentation. We believe that our audits, which included confirmation of securities at October 31, 2015 by correspondence with the custodian and brokers, provide a reasonable basis for our opinion.
PricewaterhouseCoopers LLP
Boston, Massachusetts
December 18, 2015
Trustees and Officers
The Trustees, Members of the Advisory Board (if any), and officers of the trust and fund, as applicable, are listed below. The Board of Trustees governs the fund and is responsible for protecting the interests of shareholders. The Trustees are experienced executives who meet periodically throughout the year to oversee the fund's activities, review contractual arrangements with companies that provide services to the fund, oversee management of the risks associated with such activities and contractual arrangements, and review the fund's performance. Each of the Trustees oversees 170 funds.
The Trustees hold office without limit in time except that (a) any Trustee may resign; (b) any Trustee may be removed by written instrument, signed by at least two-thirds of the number of Trustees prior to such removal; (c) any Trustee who requests to be retired or who has become incapacitated by illness or injury may be retired by written instrument signed by a majority of the other Trustees; and (d) any Trustee may be removed at any special meeting of shareholders by a two-thirds vote of the outstanding voting securities of the trust. Each Trustee who is not an interested person (as defined in the 1940 Act) of the trust and the fund is referred to herein as an Independent Trustee. Each Independent Trustee shall retire not later than the last day of the calendar year in which his or her 75th birthday occurs. The Independent Trustees may waive this mandatory retirement age policy with respect to individual Trustees. Officers and Advisory Board Members hold office without limit in time, except that any officer or Advisory Board Member may resign or may be removed by a vote of a majority of the Trustees at any regular meeting or any special meeting of the Trustees. Except as indicated, each individual has held the office shown or other offices in the same company for the past five years.
The fund’s Statement of Additional Information (SAI) includes more information about the Trustees. To request a free copy, call Fidelity at 1-877-208-0098.
Experience, Skills, Attributes, and Qualifications of the Trustees. The Governance and Nominating Committee has adopted a statement of policy that describes the experience, qualifications, attributes, and skills that are necessary and desirable for potential Independent Trustee candidates (Statement of Policy). The Board believes that each Trustee satisfied at the time he or she was initially elected or appointed a Trustee, and continues to satisfy, the standards contemplated by the Statement of Policy. The Governance and Nominating Committee also engages professional search firms to help identify potential Independent Trustee candidates who have the experience, qualifications, attributes, and skills consistent with the Statement of Policy. From time to time, additional criteria based on the composition and skills of the current Independent Trustees, as well as experience or skills that may be appropriate in light of future changes to board composition, business conditions, and regulatory or other developments, have also been considered by the professional search firms and the Governance and Nominating Committee. In addition, the Board takes into account the Trustees' commitment and participation in Board and committee meetings, as well as their leadership of standing and ad hoc committees throughout their tenure.
In determining that a particular Trustee was and continues to be qualified to serve as a Trustee, the Board has considered a variety of criteria, none of which, in isolation, was controlling. The Board believes that, collectively, the Trustees have balanced and diverse experience, qualifications, attributes, and skills, which allow the Board to operate effectively in governing the fund and protecting the interests of shareholders. Information about the specific experience, skills, attributes, and qualifications of each Trustee, which in each case led to the Board's conclusion that the Trustee should serve (or continue to serve) as a trustee of the fund, is provided below.
Board Structure and Oversight Function. James C. Curvey is an interested person and currently serves as Chairman. The Trustees have determined that an interested Chairman is appropriate and benefits shareholders because an interested Chairman has a personal and professional stake in the quality and continuity of services provided to the fund. Independent Trustees exercise their informed business judgment to appoint an individual of their choosing to serve as Chairman, regardless of whether the Trustee happens to be independent or a member of management. The Independent Trustees have determined that they can act independently and effectively without having an Independent Trustee serve as Chairman and that a key structural component for assuring that they are in a position to do so is for the Independent Trustees to constitute a substantial majority for the Board. The Independent Trustees also regularly meet in executive session. Ned C. Lautenbach serves as Chairman of the Independent Trustees and as such (i) acts as a liaison between the Independent Trustees and management with respect to matters important to the Independent Trustees and (ii) with management prepares agendas for Board meetings.
Fidelity® funds are overseen by different Boards of Trustees. The fund's Board oversees Fidelity's high income and certain equity funds, and other Boards oversee Fidelity's investment-grade bond, money market, asset allocation, and sector funds. The asset allocation funds may invest in Fidelity® funds overseen by the fund's Board. The use of separate Boards, each with its own committee structure, allows the Trustees of each group of Fidelity® funds to focus on the unique issues of the funds they oversee, including common research, investment, and operational issues. On occasion, the separate Boards establish joint committees to address issues of overlapping consequences for the Fidelity® funds overseen by each Board.
The Trustees operate using a system of committees to facilitate the timely and efficient consideration of all matters of importance to the Trustees, the fund, and fund shareholders and to facilitate compliance with legal and regulatory requirements and oversight of the fund's activities and associated risks. The Board, acting through its committees, has charged FMR and its affiliates with (i) identifying events or circumstances the occurrence of which could have demonstrably adverse effects on the fund's business and/or reputation; (ii) implementing processes and controls to lessen the possibility that such events or circumstances occur or to mitigate the effects of such events or circumstances if they do occur; and (iii) creating and maintaining a system designed to evaluate continuously business and market conditions in order to facilitate the identification and implementation processes described in (i) and (ii) above. Because the day-to-day operations and activities of the fund are carried out by or through FMR, its affiliates, and other service providers, the fund's exposure to risks is mitigated but not eliminated by the processes overseen by the Trustees. While each of the Board's committees has responsibility for overseeing different aspects of the fund's activities, oversight is exercised primarily through the Operations, Audit, and Compliance Committees. In addition, the Independent Trustees have worked with FMR to enhance the Board's oversight of investment and financial risks, legal and regulatory risks, technology risks, and operational risks, including the development of additional risk reporting to the Board. For example, a working group comprised of Independent Trustees and FMR has worked and continues to work to review the Fidelity® funds' valuation-related activities, reporting and risk management. Appropriate personnel, including but not limited to the fund's Chief Compliance Officer (CCO), FMR's internal auditor, the independent accountants, the fund's Treasurer and portfolio management personnel, make periodic reports to the Board's committees, as appropriate, including an annual review of Fidelity's risk management program for the Fidelity® funds. The responsibilities of each standing committee, including their oversight responsibilities, are described further under "Standing Committees of the Trustees."
Interested Trustees*:
Correspondence intended for a Trustee who is an interested person may be sent to Fidelity Investments, 245 Summer Street, Boston, Massachusetts 02210.
Name, Year of Birth; Principal Occupations and Other Relevant Experience+
James C. Curvey (1935)
Year of Election or Appointment: 2007
Trustee
Chairman of the Board of Trustees
Mr. Curvey also serves as Trustee of other Fidelity® funds. Mr. Curvey is a Director of Fidelity Research & Analysis Co. (investment adviser firm, 2009-present), and Vice Chairman (2007-present) and Director of FMR LLC (diversified financial services company). In addition, Mr. Curvey serves as an Overseer for the Boston Symphony Orchestra and a member of the board of Artis-Naples, Naples, Florida, and as a Trustee for Brewster Academy, Wolfeboro, New Hampshire. Previously, Mr. Curvey served as a Director of Fidelity Investments Money Management, Inc. (investment adviser firm, 2009-2014) and a Director of FMR and FMR Co., Inc. (investment adviser firms, 2007-2014).
Charles S. Morrison (1960)
Year of Election or Appointment: 2014
Trustee
Mr. Morrison also serves as Trustee of other funds. He serves as a Director of Fidelity Investments Money Management, Inc. (FIMM) (investment adviser firm, 2014-present), Director of Fidelity SelectCo, LLC (investment adviser firm, 2014-present), President, Asset Management (2014-present), and is an employee of Fidelity Investments. Previously, Mr. Morrison served as Vice President of Fidelity's Fixed Income and Asset Allocation Funds (2012-2014), President, Fixed Income (2011-2014), Vice President of Fidelity's Money Market Funds (2005-2009), President, Money Market Group Leader of FMR (investment adviser firm, 2009), and Senior Vice President, Money Market Group of FMR (2004-2009). Mr. Morrison also served as Vice President of Fidelity's Bond Funds (2002-2005), certain Balanced Funds (2002-2005), and certain Asset Allocation Funds (2002-2007), and as Senior Vice President (2002-2005) of Fidelity's Bond Division.
* Determined to be an “Interested Trustee” by virtue of, among other things, his or her affiliation with the trust or various entities under common control with FMR.
+ The information includes the Trustee's principal occupation during the last five years and other information relating to the experience, attributes, and skills relevant to the Trustee's qualifications to serve as a Trustee, which led to the conclusion that the Trustee should serve as a Trustee for the fund.
Independent Trustees:
Correspondence intended for an Independent Trustee may be sent to Fidelity Investments, P.O. Box 55235, Boston, Massachusetts 02205-5235.
Name, Year of Birth; Principal Occupations and Other Relevant Experience+
Dennis J. Dirks (1948)
Year of Election or Appointment: 2005
Trustee
Mr. Dirks also serves as Trustee of other Fidelity® funds. Prior to his retirement in May 2003, Mr. Dirks was Chief Operating Officer and a member of the Board of The Depository Trust & Clearing Corporation (DTCC). He also served as President, Chief Operating Officer, and Board member of The Depository Trust Company (DTC) and President and Board member of the National Securities Clearing Corporation (NSCC). In addition, Mr. Dirks served as Chief Executive Officer and Board member of the Government Securities Clearing Corporation, Chief Executive Officer and Board member of the Mortgage-Backed Securities Clearing Corporation, as a Trustee and a member of the Finance Committee of Manhattan College (2005-2008), as a Trustee and a member of the Finance Committee of AHRC of Nassau County (2006-2008), and as a member of the Independent Directors Council (IDC) Governing Council (2010-2015). Mr. Dirks is a member of the Board of Directors for The Brookville Center for Children's Services, Inc. (2009-present).
Alan J. Lacy (1953)
Year of Election or Appointment: 2008
Trustee
Mr. Lacy also serves as Trustee of other Fidelity® funds. Mr. Lacy serves as a member of the Board of Directors of Dave & Buster's Entertainment, Inc. (restaurant and entertainment complexes, 2010-present) and Bristol-Myers Squibb Company (global pharmaceuticals, 2008-present). In addition, Mr. Lacy served as Senior Adviser (2007-2014) of Oak Hill Capital Partners, L.P. (private equity) and also served as Chief Executive Officer (2000-2005) and Vice Chairman (2005-2006) of Sears Holdings Corporation and Sears, Roebuck and Co. (retail). Mr. Lacy is a member of the Board of Trustees of The National Parks Conservation Association (2006-present). Previously, Mr. Lacy served as Chairman of the Board of Trustees of the National Parks Conservation Association (2008-2011) and as a member of the Board of Directors for The Western Union Company (global money transfer, 2006-2011), The Hillman Companies, Inc. (hardware wholesalers, 2010-2014), and Earth Fare, Inc. (retail grocery, 2010-2014).
Ned C. Lautenbach (1944)
Year of Election or Appointment: 2000
Trustee
Chairman of the Independent Trustees
Mr. Lautenbach also serves as Trustee of other Fidelity® funds. Mr. Lautenbach currently serves as the Lead Director of the Eaton Corporation Board of Directors (diversified industrial, 1997-present). Mr. Lautenbach is Chairman of the Board of Directors of Artis-Naples in Naples, Florida (2012-present), a member of the Council on Foreign Relations (1994-present), and a member of the Board of Governors, State University System of Florida (2013-present). Previously, Mr. Lautenbach was a Partner/Advisory Partner at Clayton, Dubilier & Rice, LLC (private equity investment, 1998-2010), as well as a Director of Sony Corporation (2006-2007).
Joseph Mauriello (1944)
Year of Election or Appointment: 2008
Trustee
Mr. Mauriello also serves as Trustee of other Fidelity® funds. Prior to his retirement in January 2006, Mr. Mauriello served in numerous senior management positions including Deputy Chairman and Chief Operating Officer (2004-2005), and Vice Chairman of Financial Services (2002-2004) of KPMG LLP US (professional services, 1965-2005). Mr. Mauriello currently serves as a member of the Board of Directors of XL Group plc. (global insurance and re-insurance, 2006-present) and the Independent Directors Council (IDC) Governing Council (2015-present). Previously, Mr. Mauriello served as a Director of the Hamilton Funds of the Bank of New York (2006-2007) and of Arcadia Resources Inc. (health care services and products, 2007-2012).
Robert W. Selander (1950)
Year of Election or Appointment: 2011
Trustee
Mr. Selander also serves as Trustee of other Fidelity® funds. Mr. Selander serves as a Director of The Western Union Company (global money transfer, 2014-present). Previously, Mr. Selander served as a Member of the Advisory Board of other Fidelity® funds (2011), and Executive Vice Chairman (2010), Chief Executive Officer (2009-2010), and President and Chief Executive Officer (1997-2009) of Mastercard, Inc.
Cornelia M. Small (1944)
Year of Election or Appointment: 2005
Trustee
Ms. Small also serves as Trustee of other Fidelity® funds. Ms. Small is a member of the Board of Directors (2009-present) and Chair of the Investment Committee (2010-present) of the Teagle Foundation. Ms. Small also serves on the Investment Committee of the Berkshire Taconic Community Foundation (2008-present). Previously, Ms. Small served as Chairperson (2002-2008) and a member of the Investment Committee and Chairperson (2008-2012) and a member of the Board of Trustees of Smith College. In addition, Ms. Small served as Chief Investment Officer, Director of Global Equity Investments, and a member of the Board of Directors of Scudder, Stevens & Clark and Scudder Kemper Investments.
William S. Stavropoulos (1939)
Year of Election or Appointment: 2001
Trustee
Vice Chairman of the Independent Trustees
Mr. Stavropoulos also serves as Trustee of other Fidelity® funds. Mr. Stavropoulos serves as President and Founder of the Michigan Baseball Foundation, the Great Lakes Loons (2007-present). Mr. Stavropoulos is Chairman Emeritus of the Board of Directors of The Dow Chemical Company, where he previously served in numerous senior management positions, including President, CEO (1995-2000; 2002-2004), Chairman of the Executive Committee (2000-2006), and as a member of the Board of Directors (1990-2006). Currently, Mr. Stavropoulos is Chairman of the Board of Directors of Univar Inc. (global distributor of commodity and specialty chemicals), a Director of Teradata Corporation (data warehousing and technology solutions), and Maersk Inc. (industrial conglomerate), and a member of the Advisory Board for Metalmark Capital LLC (private equity investment, 2005-present). Mr. Stavropoulos is an operating advisor to Clayton, Dubilier & Rice, LLC (private equity investment). In addition, Mr. Stavropoulos is a member of the University of Notre Dame Advisory Council for the College of Science, a Trustee of the Rollin L. Gerstacker Foundation, and a Director of the Naples Philharmonic Center for the Arts. Previously, Mr. Stavropoulos served as a Director of Chemical Financial Corporation (bank holding company, 1993-2012) and Tyco International, Ltd. (multinational manufacturing and services, 2007-2012).
David M. Thomas (1949)
Year of Election or Appointment: 2008
Trustee
Mr. Thomas also serves as Trustee of other Fidelity® funds. Mr. Thomas serves as Non-Executive Chairman of the Board of Directors of Fortune Brands Home and Security (home and security products, 2011-present), as a member of the Board of Directors (2004-present) and Presiding Director (2013-present) of Interpublic Group of Companies, Inc. (marketing communication), and as a member of the Board of Trustees of the University of Florida (2013-present). Previously, Mr. Thomas served as Executive Chairman (2005-2006) and Chairman and Chief Executive Officer (2000-2005) of IMS Health, Inc. (pharmaceutical and healthcare information solutions), and a Director of Fortune Brands, Inc. (consumer products, 2000-2011).
+ The information includes the Trustee's principal occupation during the last five years and other information relating to the experience, attributes, and skills relevant to the Trustee's qualifications to serve as a Trustee, which led to the conclusion that the Trustee should serve as a Trustee for the fund.
Advisory Board Members and Officers:
Correspondence intended for an officer or Peter S. Lynch may be sent to Fidelity Investments, 245 Summer Street, Boston, Massachusetts 02210. Officers appear below in alphabetical order.
Name, Year of Birth; Principal Occupation
Peter S. Lynch (1944)
Year of Election or Appointment: 2003
Member of the Advisory Board
Mr. Lynch also serves as Member of the Advisory Board of other Fidelity® funds. Mr. Lynch is Vice Chairman and a Director of FMR (investment adviser firm) and FMR Co., Inc. (investment adviser firm). In addition, Mr. Lynch serves as a Trustee of Boston College and as the Chairman of the Inner-City Scholarship Fund. Previously, Mr. Lynch served on the Special Olympics International Board of Directors (1997-2006).
Elizabeth Paige Baumann (1968)
Year of Election or Appointment: 2012
Anti-Money Laundering (AML) Officer
Ms. Baumann also serves as AML Officer of other funds. She is Chief AML Officer of FMR LLC (diversified financial services company, 2012-present) and is an employee of Fidelity Investments. Previously, Ms. Baumann served as Vice President and Deputy Anti-Money Laundering Officer (2007-2012).
Marc R. Bryant (1966)
Year of Election or Appointment: 2015
Secretary and Chief Legal Officer (CLO)
Mr. Bryant also serves as Secretary and CLO of other funds. Mr. Bryant serves as CLO, Secretary, and Senior Vice President of Fidelity Management & Research Company (investment adviser firm, 2015-present) and FMR Co., Inc. (investment adviser firm, 2015-present); Secretary of Fidelity SelectCo, LLC (investment adviser firm, 2015-present) and Fidelity Investments Money Management, Inc. (investment adviser firm, 2015-present); and CLO of Fidelity Management & Research (Hong Kong) Limited (investment adviser firm, 2015-present). He is Senior Vice President and Deputy General Counsel of FMR LLC (diversified financial services company). Previously, Mr. Bryant served as Secretary and Chief Legal Officer of Fidelity Rutland Square Trust II (2010-2014) and Assistant Secretary of Fidelity's Fixed Income and Asset Allocation Funds (2013-2015). Prior to joining Fidelity Investments, Mr. Bryant served as a Senior Vice President and the Head of Global Retail Legal for AllianceBernstein L.P. (2006-2010), and as the General Counsel for ProFund Advisors LLC (2001-2006).
Timothy M. Cohen (1969)
Year of Election or Appointment: 2014
Vice President of certain Equity Funds
Mr. Cohen also serves as Vice President of other funds. Mr. Cohen serves as Chief Compliance Officer of FMR Investment Management (U.K.) Limited (investment adviser firm, 2013-present) and is an employee of Fidelity Investments. Previously, Mr. Cohen served as a Director of FMR Investment Management (U.K.) Limited (2013-2015).
William C. Coffey (1969)
Year of Election or Appointment: 2009
Assistant Secretary
Mr. Coffey also serves as Assistant Secretary of other funds. He is Senior Vice President and Deputy General Counsel of FMR LLC (diversified financial services company, 2010-present), and is an employee of Fidelity Investments. Previously, Mr. Coffey served as Vice President and Associate General Counsel of FMR LLC (2005-2009).
Jonathan Davis (1968)
Year of Election or Appointment: 2010
Assistant Treasurer
Mr. Davis also serves as Assistant Treasurer of other funds, and is an employee of Fidelity Investments. Previously, Mr. Davis served as Vice President and Associate General Counsel of FMR LLC (diversified financial services company, 2003-2010).
Adrien E. Deberghes (1967)
Year of Election or Appointment: 2008
Deputy Treasurer
Mr. Deberghes also serves as an officer of other funds. He is an employee of Fidelity Investments (2008-present). Prior to joining Fidelity Investments, Mr. Deberghes was Senior Vice President of Mutual Fund Administration at State Street Corporation (2007-2008), Senior Director of Mutual Fund Administration at Investors Bank & Trust (2005-2007), and Director of Finance for Dunkin' Brands (2000-2005).
Stephanie J. Dorsey (1969)
Year of Election or Appointment: 2010
Assistant Treasurer
Ms. Dorsey also serves as an officer of other funds. She is an employee of Fidelity Investments (2008-present) and has served in other fund officer roles. Prior to joining Fidelity Investments, Ms. Dorsey served as Treasurer (2004-2008) of the JPMorgan Mutual Funds and Vice President (2004-2008) of JPMorgan Chase Bank.
Howard J. Galligan III (1966)
Year of Election or Appointment: 2014
Chief Financial Officer
Mr. Galligan also serves as Chief Financial Officer of other funds. Mr. Galligan serves as President of Fidelity Pricing and Cash Management Services (FPCMS) (2014-present) and as a Director of Strategic Advisers, Inc. (investment adviser firm, 2008-present). Previously, Mr. Galligan served as Chief Administrative Officer of Asset Management (2011-2014) and Chief Operating Officer and Senior Vice President of Investment Support for Strategic Advisers, Inc. (2003-2011).
Scott C. Goebel (1968)
Year of Election or Appointment: 2015
Vice President
Mr. Goebel serves as Vice President of other funds and is an employee of Fidelity Investments (2001-present). Previously, Mr. Goebel served as Secretary of Fidelity SelectCo, LLC (investment adviser firm, 2013-2015), Fidelity Investments Money Management, Inc. (FIMM) (investment adviser firm, 2010-2015), and Fidelity Research and Analysis Company (FRAC) (investment adviser firm, 2010-2015); General Counsel, Secretary, and Senior Vice President of Fidelity Management & Research Company (investment adviser firm, 2008-2015) and FMR Co., Inc. (investment adviser firm, 2008-2015); Assistant Secretary of Fidelity Management & Research (Japan) Limited (investment adviser firm, 2008-2015) and FMR Investment Management (U.K.) Limited (investment adviser firm, 2008-2015); Chief Legal Officer (CLO) of Fidelity Management & Research (Hong Kong) Limited (investment adviser firm, 2008-2015); Secretary and CLO of certain Fidelity® funds (2008-2015); Assistant Secretary of FIMM (2008-2010), FRAC (2008-2010), and certain funds (2007-2008); and as Vice President and Secretary of Fidelity Distributors Corporation (FDC) (2005-2007).
Brian B. Hogan (1964)
Year of Election or Appointment: 2009
Vice President
Mr. Hogan also serves as Trustee or Vice President of other funds. Mr. Hogan serves as a Director of Fidelity SelectCo, LLC (investment adviser firm, 2014-present) and President of the Equity Division of FMR (investment adviser firm, 2009-present). Previously, Mr. Hogan served as Senior Vice President, Equity Research of FMR (2006-2009) and as a portfolio manager.
Chris Maher (1972)
Year of Election or Appointment: 2013
Assistant Treasurer
Mr. Maher serves as Assistant Treasurer of other funds. Mr. Maher is Vice President of Valuation Oversight and is an employee of Fidelity Investments. Previously, Mr. Maher served as Vice President of Asset Management Compliance (2013), Vice President of the Program Management Group of FMR (investment adviser firm, 2010-2013), and Vice President of Valuation Oversight (2008-2010).
Kenneth B. Robins (1969)
Year of Election or Appointment: 2008
President and Treasurer
Mr. Robins also serves as an officer of other funds. Mr. Robins serves as Executive Vice President of Fidelity Investments Money Management, Inc. (FIMM) (investment adviser firm, 2013-present) and is an employee of Fidelity Investments (2004-present). Previously, Mr. Robins served in other fund officer roles.
Stacie M. Smith (1974)
Year of Election or Appointment: 2013
Deputy Treasurer
Ms. Smith also serves as an officer of other funds. She is an employee of Fidelity Investments (2009-present) and has served in other fund officer roles. Prior to joining Fidelity Investments, Ms. Smith served as Senior Audit Manager of Ernst & Young LLP (1996-2009).
Renee Stagnone (1975)
Year of Election or Appointment: 2013
Deputy Treasurer
Ms. Stagnone also serves as Deputy Treasurer of other funds. Ms. Stagnone is an employee of Fidelity Investments (1997-present).
Linda J. Wondrack (1964)
Year of Election or Appointment: 2014
Chief Compliance Officer
Ms. Wondrack also serves as Chief Compliance Officer of other funds. Ms. Wondrack is Executive Vice President and head of the Ethics Office and Asset Management Compliance for Fidelity Investments (2012-present). Ms. Wondrack also serves as Chief Compliance Officer of Fidelity SelectCo, LLC (investment adviser firm, 2014-present); Chief Compliance Officer of Impresa Management LLC (2013-present); and Chief Compliance Officer of FMR Co., Inc. (investment adviser firm), Fidelity Investments Money Management, Inc. (investment adviser firm), Fidelity Management & Research (Japan) Limited (investment adviser firm), FMR Investment Management (U.K.) Limited (investment adviser firm), Fidelity Management & Research (Hong Kong) (investment adviser firm), Fidelity Management & Research Company (investment adviser firm), FIAM LLC (investment adviser firm), and Strategic Advisers, Inc. (investment adviser firm), Ballyrock Investment Advisors LLC, and Northern Neck Investors LLC (2012-present). Previously, Ms. Wondrack served as Senior Vice President and Chief Compliance Officer for Columbia Management Investment Advisers, LLC (2005-2012); Chief Compliance Officer for certain funds within the Columbia Family of Funds (2007-2012); and Senior Vice President of Compliance Risk Management at Bank of America (2005-2010).
Joseph F. Zambello (1957)
Year of Election or Appointment: 2011
Deputy Treasurer
Mr. Zambello also serves as Deputy Treasurer of other funds. Mr. Zambello is an employee of Fidelity Investments (1991-present). Previously, Mr. Zambello served as Vice President of the Program Management Group of FMR (investment adviser firm, 2009-2011) and Vice President of the Transfer Agent Oversight Group (2005-2009).
Shareholder Expense Example
As a shareholder of the Fund, you incur two types of costs: (1) transaction costs, including sales charges (loads) on purchase payments or redemption proceeds, redemption fees and (2) ongoing costs, including management fees, distribution and/or service (12b-1) fees and other Fund expenses. This Example is intended to help you understand your ongoing costs (in dollars) of investing in the Fund and to compare these costs with the ongoing costs of investing in other mutual funds.
The Example is based on an investment of $1,000 invested at the beginning of the period and held for the entire period (May 1, 2015 to October 31, 2015).
Actual Expenses
The first line of the accompanying table for each class of the Fund provides information about actual account values and actual expenses. You may use the information in this line, together with the amount you invested, to estimate the expenses that you paid over the period. Simply divide your account value by $1,000.00 (for example, an $8,600 account value divided by $1,000.00 = 8.6), then multiply the result by the number in the first line for a class of the Fund under the heading entitled "Expenses Paid During Period" to estimate the expenses you paid on your account during this period. In addition, the Fund, as a shareholder in the underlying Fidelity Central Funds, will indirectly bear its pro-rata share of the fees and expenses incurred by the underlying Fidelity Central Funds. These fees and expenses are not included in the Fund's annualized expense ratio used to calculate the expense estimate in the table below.
Hypothetical Example for Comparison Purposes
The second line of the accompanying table for each class of the Fund provides information about hypothetical account values and hypothetical expenses based on a Class' actual expense ratio and an assumed rate of return of 5% per year before expenses, which is not the Class' actual return. The hypothetical account values and expenses may not be used to estimate the actual ending account balance or expenses you paid for the period. You may use this information to compare the ongoing costs of investing in the Fund and other funds. To do so, compare this 5% hypothetical example with the 5% hypothetical examples that appear in the shareholder reports of the other funds. In addition, the Fund, as a shareholder in the underlying Fidelity Central Funds, will indirectly bear its pro-rata share of the fees and expenses incurred by the underlying Fidelity Central Funds. These fees and expenses are not included in the Fund's annualized expense ratio used to calculate the expense estimate in the table below.
Please note that the expenses shown in the table are meant to highlight your ongoing costs only and do not reflect any transaction costs. Therefore, the second line of the table is useful in comparing ongoing costs only, and will not help you determine the relative total costs of owning different funds. In addition, if these transactional costs were included, your costs would have been higher.
| | Annualized Expense Ratio-A | Beginning
Account Value
May 1, 2015 | Ending
Account Value
October 31, 2015 | Expenses Paid
During Period-B
May 1, 2015
to October 31, 2015 |
| Class A | 1.45% | | | |
| Actual | | $1,000.00 | $950.40 | $7.13 |
| Hypothetical-C | | $1,000.00 | $1,017.90 | $7.38 |
| Class T | 1.70% | | | |
| Actual | | $1,000.00 | $949.20 | $8.35 |
| Hypothetical-C | | $1,000.00 | $1,016.64 | $8.64 |
| Class B | 2.20% | | | |
| Actual | | $1,000.00 | $946.50 | $10.79 |
| Hypothetical-C | | $1,000.00 | $1,014.12 | $11.17 |
| Class C | 2.20% | | | |
| Actual | | $1,000.00 | $946.40 | $10.79 |
| Hypothetical-C | | $1,000.00 | $1,014.12 | $11.17 |
| Class I | 1.20% | | | |
| Actual | | $1,000.00 | $951.70 | $5.90 |
| Hypothetical-C | | $1,000.00 | $1,019.16 | $6.11 |
A Annualized expense ratio reflects expenses net of applicable fee waivers.
B Expenses are equal to each Class' annualized expense ratio, multiplied by the average account value over the period, multiplied by 184/365 (to reflect the one-half year period).
C 5% return per year before expenses
Distributions (Unaudited)
The Board of Trustees of Advisor Global Capital Appreciation Fund voted to pay to shareholders of record at the opening of business on record date, the following distributions per share derived from capital gains realized from sales of portfolio securities, and dividends derived from net investment income:
| | Pay Date | Record Date | | Capital Gains |
| Class I | 12/07/15 | 12/04/15 | | $0.089 |
The fund hereby designates as a capital gain dividend with respect to the taxable year ended October 31, 2015, $1,480,203, or, if subsequently determined to be different, the net capital gain of such year.
The fund will notify shareholders in January 2016 of amounts for use in preparing 2015 income tax returns.
Board Approval of Investment Advisory Contracts and Management Fees
Fidelity Advisor Global Capital Appreciation Fund
Each year, the Board of Trustees, including the Independent Trustees (together, the Board), votes on the renewal of the management contract with Fidelity Management & Research Company (FMR) and the sub-advisory agreements (together, the Advisory Contracts) for the fund. The Board, assisted by the advice of fund counsel and Independent Trustees' counsel, requests and considers a broad range of information relevant to the renewal of the Advisory Contracts throughout the year.
The Board meets regularly and, at each of its meetings, covers an extensive agenda of topics and materials and considers factors that are relevant to its annual consideration of the renewal of the fund's Advisory Contracts, including the services and support provided to the fund and its shareholders. The Board has established various standing committees (Committees), each composed of and chaired by Independent Trustees with varying backgrounds, to which the Board has assigned specific subject matter responsibilities in order to enhance effective decision-making by the Board. The Board, acting directly and through its Committees, requests and receives information concerning the annual consideration of the renewal of the fund's Advisory Contracts. The Board also meets as needed to consider matters specifically related to the Board's annual consideration of the renewal of the Advisory Contracts. Members of the Board may also meet with trustees of other Fidelity funds through ad hoc joint committees to discuss certain matters relevant to all of the Fidelity funds.
At its July 2015 meeting, the Board unanimously determined to renew the fund's Advisory Contracts. In reaching its determination, the Board considered all factors it believed relevant, including (i) the nature, extent, and quality of the services to be provided to the fund and its shareholders (including the investment performance of the fund); (ii) the competitiveness of the fund's management fee and total expense ratio relative to peer funds; (iii) the total costs of the services to be provided by and the profits to be realized by Fidelity from its relationship with the fund; and (iv) the extent to which (if any) economies of scale exist and would be realized as the fund grows, and whether any economies of scale are appropriately shared with fund shareholders.
In considering whether to renew the Advisory Contracts for the fund, the Board reached a determination, with the assistance of fund counsel and Independent Trustees' counsel and through the exercise of its business judgment, that the renewal of the Advisory Contracts was in the best interests of the fund and its shareholders and that the compensation payable under the Advisory Contracts was fair and reasonable. The Board's decision to renew the Advisory Contracts was not based on any single factor, but rather was based on a comprehensive consideration of all the information provided to the Board at its meetings throughout the year. The Board, in reaching its determination to renew the Advisory Contracts, was aware that shareholders of the fund have a broad range of investment choices available to them, including a wide choice among funds offered by Fidelity's competitors, and that the fund's shareholders, who have the opportunity to review and weigh the disclosure provided by the fund in its prospectus and other public disclosures, have chosen to invest in this fund, which is part of the Fidelity family of funds.
Nature, Extent, and Quality of Services Provided. The Board considered Fidelity's staffing as it relates to the fund, including the backgrounds of investment personnel of Fidelity, and also considered the fund's investment objective, strategies, and related investment philosophy. The Independent Trustees also had discussions with senior management of Fidelity's investment operations and investment groups. The Board considered the structure of the portfolio manager compensation program and whether this structure provides appropriate incentives to act in the best interests of the fund. Additionally, the Board considered the portfolio managers' investments, if any, in the funds that they manage.
Resources Dedicated to Investment Management and Support Services. The Board and the Fund Oversight and Research Committees reviewed the general qualifications and capabilities of Fidelity's investment staff, including its size, education, experience, and resources, as well as Fidelity's approach to recruiting, training, managing, and compensating investment personnel. The Board noted that Fidelity has continued to increase the resources devoted to non-U.S. offices, including expansion of Fidelity's global investment organization. The Board also noted that Fidelity's analysts have extensive resources, tools and capabilities that allow them to conduct sophisticated quantitative and fundamental analysis, as well as credit analysis of issuers, counterparties and guarantors. Further, the Board considered that Fidelity's investment professionals have sufficient access to global information and data so as to provide competitive investment results over time, and that those professionals also have access to sophisticated tools that permit them to assess portfolio construction and risk and performance attribution characteristics continuously, as well as to transmit new information and research conclusions rapidly around the world. Additionally, in its deliberations, the Board considered Fidelity's trading, risk management, and compliance capabilities and resources, which are integral parts of the investment management process.
Shareholder and Administrative Services. The Board considered (i) the nature, extent, quality, and cost of advisory, administrative, and shareholder services performed by FMR, the sub-advisers (together with FMR, the Investment Advisers), and their affiliates under the Advisory Contracts and under separate agreements covering transfer agency, pricing and bookkeeping, and securities lending services for the fund; (ii) the nature and extent of the supervision of third party service providers, principally custodians and subcustodians; and (iii) the resources devoted to, and the record of compliance with, the fund's compliance policies and procedures. The Board also reviewed the allocation of fund brokerage, including allocations to brokers affiliated with the Investment Advisers, the use of brokerage commissions to pay fund expenses, and the use of "soft" commission dollars to pay for research services.
The Board noted that the growth of fund assets over time across the complex allows Fidelity to reinvest in the development of services designed to enhance the value or convenience of the Fidelity funds as investment vehicles. These services include 24-hour access to account information and market information through telephone representatives and over the Internet, investor education materials and asset allocation tools, and the expanded availability of Fidelity Investor Centers.
In 2014, the Board formed an ad hoc Committee on Transfer Agency Fees to review the variety of transfer agency fee structures throughout the industry and Fidelity's competitive positioning with respect to industry participants.
Investment in a Large Fund Family. The Board considered the benefits to shareholders of investing in a Fidelity fund, including the benefits of investing in a fund that is part of a large family of funds offering a variety of investment disciplines and providing a large variety of mutual fund investor services. The Board noted that Fidelity had taken, or had made recommendations that resulted in the Fidelity funds taking, a number of actions over the previous year that benefited particular funds, including (i) continuing to dedicate additional resources to investment research and to the support of the senior management team that oversees asset management; (ii) continuing efforts to enhance Fidelity's global research capabilities; (iii) launching new funds and making other enhancements to meet client needs; (iv) reducing management fees and total expenses for certain index funds and diversified international funds; (v) continuing to launch dedicated lower cost underlying funds to meet portfolio construction needs related to expanding underlying fund options for Fidelity funds of funds, specifically for the Freedom Fund product lines; (vi) rationalizing product lines and gaining increased efficiencies through fund mergers; (vii) launching active fixed-income exchange-traded funds; (viii) continuing to develop, acquire and implement systems and technology to improve services to the funds and information security and to increase efficiency; (ix) implementing investment enhancements to further strengthen Fidelity's target date product line to increase investors' probability of success in achieving their goals; (x) modifying the eligibility criteria for certain share classes to accommodate roll-over assets from employer-sponsored retirement plans; (xi) launching a new Class W of the Freedom Index Funds to attract and retain Fidelity record-kept retirement plan assets; and (xii) implementing changes to Fidelity's money market product line in response to recent money market regulatory reforms.
Investment Performance. The Board considered whether the fund has operated in accordance with its investment objective, as well as its record of compliance with its investment restrictions and its performance history.
The Board took into account discussions with representatives of the Investment Advisers about fund investment performance that occur at Board meetings throughout the year. In this regard the Board noted that as part of regularly scheduled fund reviews and other reports to the Board on fund performance, the Board considers annualized return information for the fund, for different time periods, measured against a securities market index ("benchmark index") and a peer group of funds with similar objectives ("peer group"), if any. In its evaluation of fund investment performance, the Board gave particular attention to information indicating changes in performance of certain Fidelity funds for specific time periods and discussed with the Investment Advisers the reasons for any overperformance or underperformance.
In addition to reviewing absolute and relative fund performance, the Independent Trustees periodically consider the appropriateness of fund performance metrics in evaluating the results achieved. In general, the Independent Trustees believe that fund performance should be evaluated based on net performance (after fees and expenses) of both the highest performing and lowest performing fund share classes, where applicable, compared to appropriate benchmark indices, over appropriate time periods that may include full market cycles, and compared to peer groups, as applicable, over the same periods, taking into account relevant factors including the following: general market conditions; issuer-specific information; and fund cash flows and other factors.
The Independent Trustees recognize that shareholders evaluate performance on a net basis over their own holding periods, for which one-, three-, and five-year periods are often used as a proxy. For this reason, the performance information reviewed by the Board also included net cumulative calendar year total return information for the fund and an appropriate benchmark index and peer group for the most recent one-, three-, and five-year periods, as shown below. Returns are shown compared to the 25th percentile (top of box, 75% beaten) and 75th percentile (bottom of box, 25% beaten) of the peer universe. Returns of the benchmark index are "net MA,"
i.e., adjusted for tax withholding rates applicable to U.S.-based funds organized as Massachusetts business trusts.
Fidelity Advisor Global Capital Appreciation Fund
The Board also considered that the fund's management fee is subject to upward or downward adjustment depending upon whether, and to what extent, the fund's investment performance for the performance period exceeds, or is exceeded by, a securities index, thus leading to a performance adjustment for the same period. The Board noted that the performance adjustment provides FMR with a strong economic incentive to seek to achieve superior performance for the fund's shareholders and helps to more closely align the interests of FMR and the shareholders of the fund.
Based on its review, the Board concluded that the nature, extent, and quality of services provided to the fund under the Advisory Contracts should benefit the shareholders of the fund.
Competitiveness of Management Fee and Total Expense Ratio. The Board considered the fund's management fee and total expense ratio compared to "mapped groups" of competitive funds and classes created for the purpose of facilitating the Trustees' competitive analysis of management fees and total expenses. Fidelity creates "mapped groups" by combining similar Lipper investment objective categories that have comparable investment mandates. Combining Lipper investment objective categories aids the Board's management fee and total expense ratio comparisons by broadening the competitive group used for comparison.
Management Fee. The Board considered two proprietary management fee comparisons for the 12-month periods shown in basis points (BP) in the chart below. The group of Lipper funds used by the Board for management fee comparisons is referred to below as the "Total Mapped Group." The Total Mapped Group comparison focuses on a fund's standing in terms of gross management fees before expense reimbursements or caps, and without giving effect to the fund's performance adjustment, relative to the total universe of funds with comparable investment mandates, regardless of whether their management fee structures also are comparable. Funds with comparable investment mandates offer exposure to similar types of securities. Funds with comparable management fee structures have similar management fee contractual arrangements (
e.g., flat rate charged for advisory services, all-inclusive fee rate,
etc.). "TMG %" represents the percentage of funds in the Total Mapped Group that had management fees that were lower than the fund's. For example, a hypothetical TMG % of 20% would mean that 80% of the funds in the Total Mapped Group had higher, and 20% had lower, management fees than the fund. The fund's actual TMG %s and the number of funds in the Total Mapped Group are in the chart below. The "Asset-Size Peer Group" (ASPG) comparison focuses on a fund's standing relative to a subset of non-Fidelity funds within the Total Mapped Group that are similar in size and management fee structure without taking into account performance adjustments, if any. For example, if a fund is in the first quartile of the ASPG, the fund's management fee ranks in the least expensive or lowest 25% of funds in the ASPG. The ASPG represents at least 15% of the funds in the Total Mapped Group with comparable asset size and management fee structures, subject to a minimum of 50 funds (or all funds in the Total Mapped Group if fewer than 50). Additional information, such as the ASPG quartile in which the fund's management fee rate ranked and the impact of the fund's performance adjustment, is also included in the chart and considered by the Board.
Fidelity Advisor Global Capital Appreciation Fund
The Board noted that the fund's management fee rate ranked below the median of its Total Mapped Group and below the median of its ASPG for 2014. The Board also noted the effect of the fund's performance adjustment, if any, on the fund's management fee ranking.
The Board noted that, in 2014, the ad hoc Committee on Group Fee was formed by it and other Fidelity fund boards to conduct an in-depth review of the "group fee" component of the management fee of funds with such management fee structures. Committee focus included the mechanics of the group fee, the competitive landscape of group fee structures, Fidelity funds with no group fee component and investment products not included in group fee assets. The Board also considered that, for funds subject to the group fee, FMR agreed to voluntarily waive fees over a specified period of time in amounts designed to account for assets converted from certain funds to certain collective investment trusts.
The Board also noted that, in 2013, the ad hoc Committee on Management Fees was formed to conduct an in-depth review of the management fee rates of Fidelity's active equity mutual funds. The Committee focused on the following areas: (i) standard fee structures; (ii) research consumption and trading evolution; (iii) management fee competitiveness/profitability by category; and (iv) factors that drive institutional pricing.
Based on its review, the Board concluded that the fund's management fee is fair and reasonable in light of the services that the fund receives and the other factors considered.
Total Expense Ratio. In its review of each class's total expense ratio, the Board considered the fund's management fee as well as other fund or class expenses, as applicable, such as transfer agent fees, pricing and bookkeeping fees, fund-paid 12b-1 fees, and custodial, legal, and audit fees. The Board noted the impact of the fund's performance adjustment. The Board also noted that Fidelity may agree to waive fees and expenses from time to time, and the extent to which, if any, it has done so for the fund. As part of its review, the Board also considered the current and historical total expense ratios of each class of the fund compared to competitive fund median expenses. Each class of the fund is compared to those funds and classes in the Total Mapped Group (used by the Board for management fee comparisons) that have a similar sales load structure.
The Board noted that the total expense ratio of each class ranked above its competitive median for 2014. The Board considered that, in general, various factors can affect total expense ratios. The Board noted that the total expense ratio of each class of the fund was above the competitive median because of a significant positive performance fee adjustment in 2014. The Board noted that the total expense ratio of Class T was also above the competitive median because of higher 12b-1 fees on Class T as compared to most competitor funds. Class T has a higher 12b-1 fee, but a lower front-end sales charge, than traditionally priced front-end sales charge classes. The Board considered that Class T is primarily sold load-waived in the retirement plan market where its 0.50% 12b-1 fee is comparable to competing no-load, higher 12b-1 fee classes designed specifically for retirement plans. The Board noted that the fund offers multiple classes, each of which has a different sales load and 12b-1 fee structure, and that the multiple structures are intended to offer a range of pricing options for the intermediary market. The Board also noted that the total expense ratios of the classes vary primarily by the level of their 12b-1 fees, although differences in transfer agent fees may also cause expenses to vary from class to class.
The Board further considered that FMR contractually agreed to reimburse Class A, Class T, Class B, Class C, and Class I of the fund to the extent that total operating expenses (excluding interest, certain taxes, certain securities lending costs, brokerage commissions, extraordinary expenses, and acquired fund fees and expenses, if any), as a percentage of their respective average net assets, exceed 1.45%, 1.70%, 2.20%, 2.20%, and 1.20% through December 31, 2015.
Fees Charged to Other Fidelity Clients. The Board also considered Fidelity fee structures and other information with respect to clients of Fidelity, such as other funds advised or subadvised by Fidelity, pension plan clients, and other institutional clients with similar mandates. The Board noted the findings of the 2013 ad hoc joint committee (created with the board of other Fidelity funds), which reviewed and compared Fidelity's institutional investment advisory business with its business of providing services to the Fidelity funds, including the differences in services provided, fees charged, and costs incurred, as well as competition in their respective marketplaces.
Based on its review of total expense ratios and fees charged to other Fidelity clients, the Board concluded that, although in all cases above the median of the universe presented for comparison, the total expense ratio of each class of the fund was reasonable in light of the services that the fund and its shareholders receive and the other factors considered.
Costs of the Services and Profitability. The Board considered the revenues earned and the expenses incurred by Fidelity in conducting the business of developing, marketing, distributing, managing, administering and servicing the fund and servicing the fund's shareholders. The Board also considered the level of Fidelity's profits in respect of all the Fidelity funds.
On an annual basis, Fidelity presents to the Board information about the profitability of its relationship with the fund. Fidelity calculates profitability information for each fund, as well as aggregate profitability information for groups of Fidelity funds and all Fidelity funds, using a series of detailed revenue and cost allocation methodologies which originate with the books and records of Fidelity on which Fidelity's audited financial statements are based. The Audit Committee of the Board reviews any significant changes from the prior year's methodologies.
PricewaterhouseCoopers LLP (PwC), independent registered public accounting firm and auditor to Fidelity and certain Fidelity funds, has been engaged annually by the Board as part of the Board's assessment of Fidelity's profitability analysis. PwC's engagement includes the review and assessment of the methodologies used by Fidelity in determining the revenues and expenses attributable to Fidelity's mutual fund business, and completion of agreed-upon procedures in respect of the mathematical accuracy of fund profitability and its conformity to established allocation methodologies. After considering PwC's reports issued under the engagement and information provided by Fidelity, the Board concluded that while other allocation methods may also be reasonable, Fidelity's profitability methodologies are reasonable in all material respects.
The Board also reviewed Fidelity's non-fund businesses and fall-out benefits related to the mutual fund business as well as cases where Fidelity's affiliates may benefit from or be related to the fund's business.
The Board considered the costs of the services provided by and the profits realized by Fidelity in connection with the operation of the fund and was satisfied that the profitability was not excessive.
Economies of Scale. The Board considered whether there have been economies of scale in respect of the management of the Fidelity funds, whether the Fidelity funds (including the fund) have appropriately benefited from any such economies of scale, and whether there is potential for realization of any further economies of scale. The Board considered the extent to which the fund will benefit from economies of scale as assets grow through increased services to the fund, through waivers or reimbursements, or through fee or expense ratio reductions. The Board also noted that in 2013, it and the boards of other Fidelity funds created an ad hoc committee (the Economies of Scale Committee) to analyze whether Fidelity attains economies of scale in respect of the management and servicing of the Fidelity funds, whether the Fidelity funds have appropriately benefited from such economies of scale, and whether there is potential for realization of any further economies of scale.
The Board recognized that the fund's management contract incorporates a "group fee" structure, which provides for lower group fee rates as total group assets increase, and for higher group fee rates as total group assets decrease (with "group assets" defined to include fund assets under FMR's management plus sector fund assets previously under FMR's management and currently managed by Fidelity SelectCo, LLC). FMR calculates the group fee rates based on a tiered asset "breakpoint" schedule that varies based on asset class. The Board considered that the group fee is designed to deliver the benefits of economies of scale to fund shareholders when total Fidelity fund assets increase, even if assets of any particular fund are unchanged or have declined, because some portion of Fidelity's costs are attributable to services provided to all Fidelity funds, and all funds benefit if those costs can be allocated among more assets. The Board concluded that, given the group fee structure, fund shareholders will benefit from lower management fees as group assets increase at the fund complex level, regardless of whether Fidelity achieves any such economies of scale.
The Board concluded, taking into account the analysis of the Economies of Scale Committee, that economies of scale, if any, are being appropriately shared between fund shareholders and Fidelity.
Additional Information Requested by the Board. In order to develop fully the factual basis for consideration of the Fidelity funds' Advisory Contracts, the Board requested and received additional information on certain topics, including: (i) fund performance trends and Fidelity's long-term strategies for certain funds; (ii) the various share classes employed by Fidelity and the attributes of each class, together with similar information on the distribution and servicing payments made by Fidelity or the funds to third-party participants in the distribution channels; (iii) fund profitability, and fund performance in relation to fund profitability; (iv) the methodology with respect to evaluating competitive fund data and peer group classifications and fee comparisons; (v) annual fund profitability margins, with particular focus on certain funds with negative margins; (vi) the realization of fall-out benefits in certain Fidelity business units;
(vii) economies of scale and the way in which they are shared with fund shareholders;(viii) Fidelity's group fee structures, including the group fee schedule of breakpoints;(ix) the impact of cost containment measures on the funds; and (x) the transfer agent fee structure.
Based on its evaluation of all of the conclusions noted above, and after considering all factors it believed relevant, the Board concluded that the advisory fee structures are fair and reasonable, and that the fund's Advisory Contracts should be renewed.
AGLOI-ANN-1215
1.728714.116
Fidelity Advisor® Global Equity Income Fund Class A, Class T and Class C
Annual Report October 31, 2015 |
|
Contents
To view a fund's proxy voting guidelines and proxy voting record for the 12-month period ended June 30, visit http://www.fidelity.com/proxyvotingresults or visit the Securities and Exchange Commission's (SEC) web site at http://www.sec.gov.
You may also call 1-877-208-0098 to request a free copy of the proxy voting guidelines.
Standard & Poor's, S&P and S&P 500 are registered service marks of The McGraw-Hill Companies, Inc. and have been licensed for use by Fidelity Distributors Corporation.
Other third-party marks appearing herein are the property of their respective owners.
All other marks appearing herein are registered or unregistered trademarks or service marks of FMR LLC or an affiliated company. © 2015 FMR LLC. All rights reserved.
This report and the financial statements contained herein are submitted for the general information of the shareholders of the Fund. This report is not authorized for distribution to prospective investors in the Fund unless preceded or accompanied by an effective prospectus.
A fund files its complete schedule of portfolio holdings with the SEC for the first and third quarters of each fiscal year on Form N-Q. Forms N-Q are available on the SEC’s web site at http://www.sec.gov. A fund's Forms N-Q may be reviewed and copied at the SEC’s Public Reference Room in Washington, DC. Information regarding the operation of the SEC's Public Reference Room may be obtained by calling 1-800-SEC-0330.
For a complete list of a fund's portfolio holdings, view the most recent holdings listing, semiannual report, or annual report on Fidelity's web site at http://www.fidelity.com, http://www.advisor.fidelity.com, or http://www.401k.com, as applicable.
NOT FDIC INSURED •MAY LOSE VALUE •NO BANK GUARANTEE
Neither the Fund nor Fidelity Distributors Corporation is a bank.
Performance: The Bottom Line
Average annual total return reflects the change in the value of an investment, assuming reinvestment of distributions from dividend income and capital gains (the profits earned upon the sale of securities that have grown in value, if any) and assuming a constant rate of performance each year.
The hypothetical investment and the average annual total returns do not reflect the deduction of taxes that a shareholder would pay on fund distributions or the redemption of fund shares.
During periods of reimbursement by Fidelity, a fund’s total return will be greater than it would be had the reimbursement not occurred.
How a fund did yesterday is no guarantee of how it will do tomorrow.
Average Annual Total Returns
| For the periods ended October 31, 2015 | Past 1 year | Life of fundA |
| Class A (incl. 5.75% sales charge) | (3.07)% | 8.56% |
| Class T (incl. 3.50% sales charge) | (1.00)% | 9.01% |
| Class C (incl. contingent deferred sales charge) | 1.14% | 9.59% |
A From May 2, 2012
Class C shares' contingent deferred sales charges included in the past one year and life of fund total return figures are 1% and 0%, respectively.
$10,000 Over Life of Fund
Let's say hypothetically that $10,000 was invested in Fidelity Advisor® Global Equity Income Fund - Class A on May 2, 2012, when the fund started, and the current 5.75% sales charge was paid.
The chart shows how the value of your investment would have changed, and also shows how the MSCI ACWI (All Country World Index) Index performed over the same period.
| Period Ending Values |
| $13,329 | Fidelity Advisor® Global Equity Income Fund - Class A |
| $13,655 | MSCI ACWI (All Country World Index) Index |
Management's Discussion of Fund Performance
Market Recap: Following an August and September wherein a collapse in commodities prices hurt resources-related sectors and geographies, global equities rebounded in October to finish flat for the 12 months ending October 31, 2015. The MSCI ACWI (All Country World Index) Index returned 0.35% for the period. Commodity producers remained under pressure for much of the past year, largely related to economic deceleration in China (-1%), the world’s second-largest economy and a leading consumer of raw materials. This effect was exacerbated by the strength of the U.S. dollar relative to global currencies, which weighed on commodities priced in dollars and acutely impacted equity returns within regions most exposed to resources prices. For example, the emerging-markets group returned -15% this period. Canada, a significant energy producer, returned about -17%. Conversely, net energy consumer Japan (+9%) proved the best-performing region by far. Only about a quarter of the nearly 50 countries in the index managed a gain: Israel (+17%) and fast-growing Ireland (+12%) performed best; Greece (-56%) and Brazil (-46%), among the worst. As for sectors, energy (-22%) and materials (-12%) declined sharply, while consumer discretionary (+13%) saw a gain driven largely by demand in the United States (+5%).
Comments from Portfolio Manager Ramona Persaud: For the year, the fund’s share classes achieved modest gains (excluding sales charges, if applicable), outpacing the benchmark MSCI ACWI Index. Against an uptick in global macroeconomic volatility, investors generally favored the value- and quality-oriented investments pursued by the fund, which helped it to outperform. From a geographical perspective, positioning in emerging markets – China, Taiwan and South Africa, in particular – was a plus, as were stock picks in the United Kingdom. Stock picking in the U.S. was the biggest drag on results. Looking at individual names, a non-index stake in WH Smith was one of the biggest contributors. The U.K.-based chain of retail and online shops sells reading material, gifts and snacks to air and rail travelers on the go. The stock benefited from the firm’s growing international-travel sales and improving overall business mix. On the flip side, an overweighting in integrated-oil giant Chevron proved a large detractor. Chevron, one of the fund’s largest holdings, suffered along with the entire sector as energy prices collapsed.
The views expressed above reflect those of the portfolio manager(s) only through the end of the period as stated on the cover of this report and do not necessarily represent the views of Fidelity or any other person in the Fidelity organization. Any such views are subject to change at any time based upon market or other conditions and Fidelity disclaims any responsibility to update such views. These views may not be relied on as investment advice and, because investment decisions for a Fidelity fund are based on numerous factors, may not be relied on as an indication of trading intent on behalf of any Fidelity fund.
Investment Summary (Unaudited)
Top Five Stocks as of October 31, 2015
| | % of fund's net assets | % of fund's net assets 6 months ago |
| JPMorgan Chase & Co. (United States of America, Banks) | 2.7 | 2.0 |
| Apple, Inc. (United States of America, Technology Hardware, Storage & Peripherals) | 2.5 | 2.1 |
| Johnson & Johnson (United States of America, Pharmaceuticals) | 2.4 | 1.7 |
| General Electric Co. (United States of America, Industrial Conglomerates) | 2.4 | 0.9 |
| Accenture PLC Class A (Ireland, IT Services) | 1.9 | 1.2 |
| | 11.9 | |
Top Five Market Sectors as of October 31, 2015
| | % of fund's net assets | % of fund's net assets 6 months ago |
| Financials | 20.6 | 19.4 |
| Information Technology | 17.3 | 14.3 |
| Consumer Staples | 14.5 | 10.7 |
| Consumer Discretionary | 13.3 | 16.6 |
| Health Care | 13.2 | 14.4 |
Top Five Countries as of October 31, 2015
| (excluding cash equivalents) | % of fund's net assets | % of fund's net assets 6 months ago |
| United States of America | 41.4 | 41.1 |
| United Kingdom | 12.9 | 9.4 |
| Japan | 11.4�� | 9.8 |
| Ireland | 4.1 | 4.4 |
| Israel | 3.8 | 2.5 |
Percentages are adjusted for the effect of futures contracts, if applicable.
Asset Allocation (% of fund's net assets)
| As of October 31, 2015 |
| | Stocks | 96.0% |
| | Short-Term Investments and Net Other Assets (Liabilities) | 4.0% |

| As of April 30, 2015 |
| | Stocks | 95.1% |
| | Short-Term Investments and Net Other Assets (Liabilities) | 4.9% |

Investments October 31, 2015
Showing Percentage of Net Assets
| Common Stocks - 95.8% | | | |
| | | Shares | Value |
| Australia - 0.5% | | | |
| Telstra Corp. Ltd. | | 13,889 | $53,218 |
| Bailiwick of Jersey - 2.0% | | | |
| Shire PLC | | 1,537 | 116,398 |
| Wolseley PLC | | 1,821 | 106,913 |
|
| TOTAL BAILIWICK OF JERSEY | | | 223,311 |
|
| Belgium - 0.6% | | | |
| Anheuser-Busch InBev SA NV | | 600 | 71,595 |
| Canada - 3.3% | | | |
| Constellation Software, Inc. | | 150 | 64,813 |
| Fairfax Financial Holdings Ltd. (sub. vtg.) | | 130 | 64,018 |
| Potash Corp. of Saskatchewan, Inc. | | 2,540 | 51,437 |
| PrairieSky Royalty Ltd. | | 910 | 17,906 |
| Suncor Energy, Inc. | | 6,220 | 185,087 |
|
| TOTAL CANADA | | | 383,261 |
|
| Cayman Islands - 0.3% | | | |
| SITC International Holdings Co. Ltd. | | 76,000 | 39,010 |
| Chile - 0.3% | | | |
| Vina San Pedro SA | | 4,990,928 | 39,347 |
| France - 2.9% | | | |
| Cegedim SA (a) | | 1,000 | 35,464 |
| Renault SA | | 1,097 | 103,417 |
| Sanofi SA | | 1,899 | 191,563 |
|
| TOTAL FRANCE | | | 330,444 |
|
| Germany - 1.0% | | | |
| AURELIUS AG | | 1,379 | 61,536 |
| Muenchener Rueckversicherungs AG | | 240 | 47,855 |
|
| TOTAL GERMANY | | | 109,391 |
|
| Hong Kong - 1.9% | | | |
| HKT Trust/HKT Ltd. unit | | 64,280 | 76,585 |
| Techtronic Industries Co. Ltd. | | 37,000 | 135,260 |
|
| TOTAL HONG KONG | | | 211,845 |
|
| Indonesia - 0.5% | | | |
| PT Bank Central Asia Tbk | | 60,700 | 57,023 |
| Ireland - 4.1% | | | |
| Accenture PLC Class A | | 1,985 | 212,792 |
| Greencore Group PLC | | 18,915 | 88,061 |
| Medtronic PLC | | 2,205 | 162,994 |
|
| TOTAL IRELAND | | | 463,847 |
|
| Isle of Man - 1.2% | | | |
| Optimal Payments PLC (a) | | 16,800 | 78,733 |
| Playtech Ltd. | | 4,294 | 56,664 |
|
| TOTAL ISLE OF MAN | | | 135,397 |
|
| Israel - 3.8% | | | |
| Bezeq The Israel Telecommunication Corp. Ltd. | | 42,000 | 90,304 |
| Cellcom Israel Ltd. (Israel) (a) | | 9,678 | 72,038 |
| Partner Communications Co. Ltd. (a) | | 10,250 | 46,519 |
| Rami Levi Chain Stores Hashikma Marketing 2006 Ltd. | | 900 | 42,335 |
| Teva Pharmaceutical Industries Ltd. sponsored ADR | | 3,082 | 182,424 |
|
| TOTAL ISRAEL | | | 433,620 |
|
| Italy - 0.2% | | | |
| Astaldi SpA | | 3,000 | 24,148 |
| Japan - 11.4% | | | |
| A/S One Corp. | | 1,600 | 56,795 |
| Astellas Pharma, Inc. | | 11,000 | 159,659 |
| Broadleaf Co. Ltd. | | 4,800 | 54,982 |
| Daiichikosho Co. Ltd. | | 3,100 | 103,391 |
| Daito Trust Construction Co. Ltd. | | 800 | 86,597 |
| Hoya Corp. | | 3,800 | 156,814 |
| Japan Tobacco, Inc. | | 2,000 | 69,224 |
| KDDI Corp. | | 3,400 | 82,274 |
| NEC Corp. | | 26,000 | 80,210 |
| Olympus Corp. | | 2,600 | 87,701 |
| ORIX Corp. | | 2,500 | 36,509 |
| Shinsei Bank Ltd. | | 40,000 | 83,871 |
| Sony Corp. | | 2,500 | 71,064 |
| Suzuki Motor Corp. | | 2,100 | 68,761 |
| Tsuruha Holdings, Inc. | | 700 | 55,457 |
| United Arrows Ltd. | | 1,200 | 51,697 |
|
| TOTAL JAPAN | | | 1,305,006 |
|
| Netherlands - 1.3% | | | |
| Altice NV Class A (a) | | 2,712 | 46,970 |
| LyondellBasell Industries NV Class A | | 1,100 | 102,201 |
|
| TOTAL NETHERLANDS | | | 149,171 |
|
| Singapore - 0.6% | | | |
| United Overseas Bank Ltd. | | 4,579 | 66,491 |
| South Africa - 1.2% | | | |
| Capitec Bank Holdings Ltd. | | 1,600 | 69,196 |
| EOH Holdings Ltd. | | 3,000 | 33,167 |
| Lewis Group Ltd. | | 8,900 | 38,509 |
|
| TOTAL SOUTH AFRICA | | | 140,872 |
|
| Sweden - 0.8% | | | |
| Nordea Bank AB | | 4,190 | 46,345 |
| Sandvik AB | | 5,200 | 48,631 |
|
| TOTAL SWEDEN | | | 94,976 |
|
| Switzerland - 1.8% | | | |
| ACE Ltd. | | 600 | 68,124 |
| Banque Cantonale Vaudoise (Bearer) | | 110 | 67,773 |
| Sika AG (Bearer) | | 20 | 65,638 |
|
| TOTAL SWITZERLAND | | | 201,535 |
|
| Taiwan - 1.8% | | | |
| King's Town Bank | | 20,000 | 15,956 |
| Taiwan Semiconductor Manufacturing Co. Ltd. | | 45,000 | 189,606 |
|
| TOTAL TAIWAN | | | 205,562 |
|
| United Kingdom - 12.9% | | | |
| British American Tobacco PLC (United Kingdom) | | 2,773 | 164,743 |
| Hilton Food Group PLC | | 11,081 | 79,433 |
| Howden Joinery Group PLC | | 3,700 | 26,443 |
| Imperial Tobacco Group PLC | | 2,764 | 149,092 |
| ITV PLC | | 34,031 | 132,415 |
| Lloyds Banking Group PLC | | 139,368 | 158,184 |
| Micro Focus International PLC | | 7,831 | 151,628 |
| Reckitt Benckiser Group PLC | | 885 | 86,368 |
| SABMiller PLC | | 1,000 | 61,587 |
| St. James's Place Capital PLC | | 4,312 | 64,114 |
| Standard Chartered PLC (United Kingdom) | | 27 | 300 |
| Tesco PLC | | 14,540 | 41,007 |
| The Restaurant Group PLC | | 2,600 | 28,739 |
| Vodafone Group PLC | | 994 | 3,271 |
| WH Smith PLC | | 7,498 | 197,080 |
| Whitbread PLC | | 829 | 63,465 |
| William Hill PLC | | 14,705 | 71,750 |
|
| TOTAL UNITED KINGDOM | | | 1,479,619 |
|
| United States of America - 41.4% | | | |
| American Tower Corp. | | 1,092 | 111,635 |
| Amgen, Inc. | | 532 | 84,152 |
| Apple, Inc. | | 2,419 | 289,071 |
| Bank of America Corp. | | 9,393 | 157,615 |
| BWX Technologies, Inc. | | 3,635 | 102,871 |
| Chevron Corp. | | 2,259 | 205,298 |
| Comcast Corp. Class A | | 1,654 | 103,573 |
| CVB Financial Corp. | | 4,276 | 74,616 |
| CVS Health Corp. | | 2,063 | 203,783 |
| Danaher Corp. | | 1,130 | 105,440 |
| Deere & Co. | | 702 | 54,756 |
| Diamond Hill Investment Group, Inc. | | 411 | 82,221 |
| Dr. Pepper Snapple Group, Inc. | | 1,039 | 92,855 |
| EMC Corp. | | 3,740 | 98,063 |
| Exxon Mobil Corp. | | 2,169 | 179,463 |
| First NBC Bank Holding Co. (a) | | 400 | 14,876 |
| General Electric Co. | | 9,552 | 276,244 |
| HP, Inc. | | 2,600 | 70,096 |
| IBM Corp. | | 1,043 | 146,103 |
| Johnson & Johnson | | 2,756 | 278,439 |
| JPMorgan Chase & Co. | | 4,806 | 308,783 |
| Lakeland Financial Corp. | | 1,435 | 64,475 |
| McGraw Hill Financial, Inc. | | 970 | 89,861 |
| Microsoft Corp. | | 3,960 | 208,454 |
| Oracle Corp. | | 4,117 | 159,904 |
| PepsiCo, Inc. | | 1,393 | 142,351 |
| PJT Partners, Inc. (a) | | 37 | 796 |
| Procter & Gamble Co. | | 2,012 | 153,677 |
| SunTrust Banks, Inc. | | 2,126 | 88,272 |
| Target Corp. | | 2,634 | 203,292 |
| The Coca-Cola Co. | | 2,959 | 125,314 |
| U.S. Bancorp | | 3,310 | 139,616 |
| VF Corp. | | 684 | 46,184 |
| Wells Fargo & Co. | | 3,746 | 202,808 |
| Western Digital Corp. | | 1,071 | 71,564 |
|
| TOTAL UNITED STATES OF AMERICA | | | 4,736,521 |
|
| TOTAL COMMON STOCKS | | | |
| (Cost $10,168,662) | | | 10,955,210 |
|
| Nonconvertible Preferred Stocks - 0.2% | | | |
| Germany - 0.2% | | | |
| Volkswagen AG | | | |
| (Cost $29,103) | | 200 | 24,007 |
| | | Principal Amount(b) | Value |
|
| Nonconvertible Bonds - 0.0% | | | |
| Canada - 0.0% | | | |
| Constellation Software, Inc. 8.5% 3/31/40(c) | CAD | 500 | 440 |
| TOTAL NONCONVERTIBLE BONDS | | | |
| (Cost $429) | | | 440 |
| | | Shares | Value |
|
| Money Market Funds - 4.4% | | | |
| Fidelity Cash Central Fund, 0.18% (d) | | | |
| (Cost $498,806) | | 498,806 | 498,806 |
| TOTAL INVESTMENT PORTFOLIO - 100.4% | | | |
| (Cost $10,697,000) | | | 11,478,463 |
| NET OTHER ASSETS (LIABILITIES) - (0.4)% | | | (50,066) |
| NET ASSETS - 100% | | | $11,428,397 |
Currency Abbreviations
CAD – Canadian dollar
Categorizations in the Schedule of Investments are based on country or territory of incorporation.
Legend
(a) Non-income producing
(b) Amount is stated in United States dollars unless otherwise noted.
(c) Coupon rates for floating and adjustable rate securities reflect the rates in effect at period end.
(d) Affiliated fund that is generally available only to investment companies and other accounts managed by Fidelity Investments. The rate quoted is the annualized seven-day yield of the fund at period end. A complete unaudited listing of the fund's holdings as of its most recent quarter end is available upon request. In addition, each Fidelity Central Fund's financial statements, which are not covered by the Fund's Report of Independent Registered Public Accounting Firm, are available on the SEC's website or upon request.
Affiliated Central Funds
Information regarding fiscal year to date income earned by the Fund from investments in Fidelity Central Funds is as follows:
| Fund | Income earned |
| Fidelity Cash Central Fund | $736 |
Investment Valuation
The following is a summary of the inputs used, as of October 31, 2015, involving the Fund's assets and liabilities carried at fair value. The inputs or methodology used for valuing securities may not be an indication of the risk associated with investing in those securities. For more information on valuation inputs, and their aggregation into the levels used in the table below, please refer to the Investment Valuation section in the accompanying Notes to Financial Statements.
| | Valuation Inputs at Reporting Date: |
| Description | Total | Level 1 | Level 2 | Level 3 |
| Investments in Securities: | | | | |
| Equities: | | | | |
| Consumer Discretionary | $1,516,017 | $990,087 | $525,930 | $-- |
| Consumer Staples | 1,666,229 | 1,177,835 | 488,394 | -- |
| Energy | 587,754 | 587,754 | -- | -- |
| Financials | 2,329,466 | 1,792,936 | 536,530 | -- |
| Health Care | 1,512,403 | 743,473 | 768,930 | -- |
| Industrials | 758,013 | 612,090 | 145,923 | -- |
| Information Technology | 1,965,850 | 1,641,052 | 324,798 | -- |
| Materials | 219,276 | 219,276 | -- | -- |
| Telecommunication Services | 424,209 | 208,861 | 215,348 | -- |
| Corporate Bonds | 440 | -- | 440 | -- |
| Money Market Funds | 498,806 | 498,806 | -- | -- |
| Total Investments in Securities: | $11,478,463 | $8,472,170 | $3,006,293 | $-- |
See accompanying notes which are an integral part of the financial statements.
Financial Statements
Statement of Assets and Liabilities
| | | October 31, 2015 |
| Assets | | |
Investment in securities, at value — See accompanying schedule:
Unaffiliated issuers (cost $10,198,194) | $10,979,657 | |
| Fidelity Central Funds (cost $498,806) | 498,806 | |
| Total Investments (cost $10,697,000) | | $11,478,463 |
| Foreign currency held at value (cost $1,972) | | 1,924 |
| Receivable for investments sold | | 2,482 |
| Receivable for fund shares sold | | 16,737 |
| Dividends receivable | | 25,063 |
| Interest receivable | | 3 |
| Distributions receivable from Fidelity Central Funds | | 33 |
| Prepaid expenses | | 31 |
| Receivable from investment adviser for expense reductions | | 3,177 |
| Other receivables | | 623 |
| Total assets | | 11,528,536 |
| Liabilities | | |
| Payable for fund shares redeemed | $34,510 | |
| Accrued management fee | 6,595 | |
| Distribution and service plan fees payable | 4,690 | |
| Other affiliated payables | 2,942 | |
| Audit fee payable | 46,030 | |
| Other payables and accrued expenses | 5,372 | |
| Total liabilities | | 100,139 |
| Net Assets | | $11,428,397 |
| Net Assets consist of: | | |
| Paid in capital | | $10,552,446 |
| Undistributed net investment income | | 10,220 |
| Accumulated undistributed net realized gain (loss) on investments and foreign currency transactions | | 84,741 |
| Net unrealized appreciation (depreciation) on investments and assets and liabilities in foreign currencies | | 780,990 |
| Net Assets | | $11,428,397 |
| Calculation of Maximum Offering Price | | |
| Class A: | | |
| Net Asset Value and redemption price per share ($4,552,013 ÷ 364,268 shares) | | $12.50 |
| Maximum offering price per share (100/94.25 of $12.50) | | $13.26 |
| Class T: | | |
| Net Asset Value and redemption price per share ($2,484,397 ÷ 198,914 shares) | | $12.49 |
| Maximum offering price per share (100/96.50 of $12.49) | | $12.94 |
| Class C: | | |
| Net Asset Value and offering price per share ($3,225,384 ÷ 258,950 shares)(a) | | $12.46 |
| Class I: | | |
| Net Asset Value, offering price and redemption price per share ($1,166,603 ÷ 93,230 shares) | | $12.51 |
(a) Redemption price per share is equal to net asset value less any applicable contingent deferred sales charge.
See accompanying notes which are an integral part of the financial statements.
Statement of Operations
| | | Year ended October 31, 2015 |
| Investment Income | | |
| Dividends | | $277,638 |
| Interest | | 167 |
| Income from Fidelity Central Funds | | 736 |
| Income before foreign taxes withheld | | 278,541 |
| Less foreign taxes withheld | | (15,665) |
| Total income | | 262,876 |
| Expenses | | |
| Management fee | $76,732 | |
| Transfer agent fees | 29,216 | |
| Distribution and service plan fees | 54,356 | |
| Accounting fees and expenses | 5,687 | |
| Custodian fees and expenses | 17,080 | |
| Independent trustees' compensation | 46 | |
| Registration fees | 48,984 | |
| Audit | 63,388 | |
| Legal | 27 | |
| Miscellaneous | 302 | |
| Total expenses before reductions | 295,818 | |
| Expense reductions | (110,680) | 185,138 |
| Net investment income (loss) | | 77,738 |
| Realized and Unrealized Gain (Loss) | | |
| Net realized gain (loss) on: | | |
| Investment securities: | | |
| Unaffiliated issuers | 173,432 | |
| Foreign currency transactions | (2,254) | |
| Total net realized gain (loss) | | 171,178 |
Change in net unrealized appreciation (depreciation) on:
Investment securities | (62,909) | |
| Assets and liabilities in foreign currencies | (682) | |
| Total change in net unrealized appreciation (depreciation) | | (63,591) |
| Net gain (loss) | | 107,587 |
| Net increase (decrease) in net assets resulting from operations | | $185,325 |
See accompanying notes which are an integral part of the financial statements.
Statement of Changes in Net Assets
| | Year ended October 31, 2015 | Year ended October 31, 2014 |
| Increase (Decrease) in Net Assets | | |
| Operations | | |
| Net investment income (loss) | $77,738 | $159,837 |
| Net realized gain (loss) | 171,178 | 565,745 |
| Change in net unrealized appreciation (depreciation) | (63,591) | 67,098 |
| Net increase (decrease) in net assets resulting from operations | 185,325 | 792,680 |
| Distributions to shareholders from net investment income | (79,760) | (143,546) |
| Distributions to shareholders from net realized gain | (574,146) | (97,735) |
| Total distributions | (653,906) | (241,281) |
| Share transactions - net increase (decrease) | 1,350,797 | 3,932,940 |
| Total increase (decrease) in net assets | 882,216 | 4,484,339 |
| Net Assets | | |
| Beginning of period | 10,546,181 | 6,061,842 |
| End of period (including undistributed net investment income of $10,220 and undistributed net investment income of $4,288, respectively) | $11,428,397 | $10,546,181 |
See accompanying notes which are an integral part of the financial statements.
Fidelity Advisor Global Equity Income Fund Class A
| Years ended October 31, | 2015 | 2014 | 2013 | 2012 A |
| Selected Per–Share Data | | | | |
| Net asset value, beginning of period | $12.96 | $12.20 | $10.15 | $10.00 |
| Income from Investment Operations | | | | |
| Net investment income (loss)B | .12 | .25C | .19 | .09 |
| Net realized and unrealized gain (loss) | .24 | .91 | 2.05 | .16 |
| Total from investment operations | .36 | 1.16 | 2.24 | .25 |
| Distributions from net investment income | (.11) | (.22) | (.18) | (.10) |
| Distributions from net realized gain | (.71) | (.18) | (.01) | – |
| Total distributions | (.82) | (.40) | (.19) | (.10) |
| Net asset value, end of period | $12.50 | $12.96 | $12.20 | $10.15 |
| Total ReturnD,E,F | 2.85% | 9.70% | 22.28% | 2.51% |
| Ratios to Average Net AssetsG,H | | | | |
| Expenses before reductions | 2.42% | 2.63% | 4.37% | 7.41%I |
| Expenses net of fee waivers, if any | 1.45% | 1.45% | 1.45% | 1.45%I |
| Expenses net of all reductions | 1.44% | 1.45% | 1.43% | 1.44%I |
| Net investment income (loss) | .95% | 1.95%C | 1.66% | 1.89%I |
| Supplemental Data | | | | |
| Net assets, end of period (000 omitted) | $4,552 | $4,025 | $2,115 | $756 |
| Portfolio turnover rateJ | 87% | 112% | 78% | 36%K |
A For the period May 2, 2012 (commencement of operations) to October 31, 2012.
B Calculated based on average shares outstanding during the period.
C Investment income per share reflects a large, non-recurring dividend which amounted to $.09 per share. Excluding this non-recurring dividend, the ratio of net investment income (loss) to average net assets would have been 1.25%.
D Total returns for periods of less than one year are not annualized.
E Total returns would have been lower if certain expenses had not been reduced during the applicable periods shown.
F Total returns do not include the effect of the sales charges.
G Fees and expenses of any underlying Fidelity Central Funds are not included in the Fund's expense ratio. The Fund indirectly bears its proportionate share of the expenses of any underlying Fidelity Central Funds.
H Expense ratios reflect operating expenses of the class. Expenses before reductions do not reflect amounts reimbursed by the investment adviser or reductions from brokerage service arrangements or reductions from other expense offset arrangements and do not represent the amount paid by the class during periods when reimbursements or reductions occur. Expense ratios before reductions for start-up periods may not be representative of longer-term operating periods. Expenses net of fee waivers reflect expenses after reimbursement by the investment adviser but prior to reductions from brokerage service arrangements or other expense offset arrangements. Expenses net of all reductions represent the net expenses paid by the class.
I Annualized
J Amount does not include the portfolio activity of any underlying Fidelity Central Funds.
K Amount not annualized.
See accompanying notes which are an integral part of the financial statements.
Fidelity Advisor Global Equity Income Fund Class T
| Years ended October 31, | 2015 | 2014 | 2013 | 2012 A |
| Selected Per–Share Data | | | | |
| Net asset value, beginning of period | $12.95 | $12.20 | $10.14 | $10.00 |
| Income from Investment Operations | | | | |
| Net investment income (loss)B | .09 | .21C | .16 | .08 |
| Net realized and unrealized gain (loss) | .24 | .91 | 2.06 | .15 |
| Total from investment operations | .33 | 1.12 | 2.22 | .23 |
| Distributions from net investment income | (.08) | (.19) | (.15) | (.09) |
| Distributions from net realized gain | (.71) | (.18) | (.01) | – |
| Total distributions | (.79) | (.37) | (.16) | (.09) |
| Net asset value, end of period | $12.49 | $12.95 | $12.20 | $10.14 |
| Total ReturnD,E,F | 2.59% | 9.34% | 22.11% | 2.31% |
| Ratios to Average Net AssetsG,H | | | | |
| Expenses before reductions | 2.73% | 2.96% | 4.80% | 7.68%I |
| Expenses net of fee waivers, if any | 1.70% | 1.70% | 1.70% | 1.70%I |
| Expenses net of all reductions | 1.69% | 1.70% | 1.68% | 1.69%I |
| Net investment income (loss) | .70% | 1.70%C | 1.41% | 1.64%I |
| Supplemental Data | | | | |
| Net assets, end of period (000 omitted) | $2,484 | $2,014 | $1,270 | $714 |
| Portfolio turnover rateJ | 87% | 112% | 78% | 36%K |
A For the period May 2, 2012 (commencement of operations) to October 31, 2012.
B Calculated based on average shares outstanding during the period.
C Investment income per share reflects a large, non-recurring dividend which amounted to $.09 per share. Excluding this non-recurring dividend, the ratio of net investment income (loss) to average net assets would have been 1.00%.
D Total returns for periods of less than one year are not annualized.
E Total returns would have been lower if certain expenses had not been reduced during the applicable periods shown.
F Total returns do not include the effect of the sales charges.
G Fees and expenses of any underlying Fidelity Central Funds are not included in the Fund's expense ratio. The Fund indirectly bears its proportionate share of the expenses of any underlying Fidelity Central Funds.
H Expense ratios reflect operating expenses of the class. Expenses before reductions do not reflect amounts reimbursed by the investment adviser or reductions from brokerage service arrangements or reductions from other expense offset arrangements and do not represent the amount paid by the class during periods when reimbursements or reductions occur. Expense ratios before reductions for start-up periods may not be representative of longer-term operating periods. Expenses net of fee waivers reflect expenses after reimbursement by the investment adviser but prior to reductions from brokerage service arrangements or other expense offset arrangements. Expenses net of all reductions represent the net expenses paid by the class.
I Annualized
J Amount does not include the portfolio activity of any underlying Fidelity Central Funds.
K Amount not annualized.
See accompanying notes which are an integral part of the financial statements.
Fidelity Advisor Global Equity Income Fund Class C
| Years ended October 31, | 2015 | 2014 | 2013 | 2012 A |
| Selected Per–Share Data | | | | |
| Net asset value, beginning of period | $12.93 | $12.18 | $10.14 | $10.00 |
| Income from Investment Operations | | | | |
| Net investment income (loss)B | .03 | .15C | .10 | .06 |
| Net realized and unrealized gain (loss) | .24 | .91 | 2.06 | .15 |
| Total from investment operations | .27 | 1.06 | 2.16 | .21 |
| Distributions from net investment income | (.05) | (.14) | (.11) | (.07) |
| Distributions from net realized gain | (.70) | (.17) | (.01) | – |
| Total distributions | (.74)D | (.31) | (.12) | (.07) |
| Net asset value, end of period | $12.46 | $12.93 | $12.18 | $10.14 |
| Total ReturnE,F,G | 2.10% | 8.83% | 21.40% | 2.12% |
| Ratios to Average Net AssetsH,I | | | | |
| Expenses before reductions | 3.23% | 3.43% | 5.26% | 8.19%J |
| Expenses net of fee waivers, if any | 2.20% | 2.20% | 2.20% | 2.20%J |
| Expenses net of all reductions | 2.19% | 2.20% | 2.18% | 2.19%J |
| Net investment income (loss) | .20% | 1.20%C | .91% | 1.14%J |
| Supplemental Data | | | | |
| Net assets, end of period (000 omitted) | $3,225 | $3,173 | $1,445 | $666 |
| Portfolio turnover rateK | 87% | 112% | 78% | 36%L |
A For the period May 2, 2012 (commencement of operations) to October 31, 2012.
B Calculated based on average shares outstanding during the period.
C Investment income per share reflects a large, non-recurring dividend which amounted to $.09 per share. Excluding this non-recurring dividend, the ratio of net investment income (loss) to average net assets would have been .50%.
D Total distributions of $.74 per share is comprised of distributions from net investment income of $.046 and distributions from net realized gain of $.695 per share.
E Total returns for periods of less than one year are not annualized.
F Total returns would have been lower if certain expenses had not been reduced during the applicable periods shown.
G Total returns do not include the effect of the contingent deferred sales charge.
H Fees and expenses of any underlying Fidelity Central Funds are not included in the Fund's expense ratio. The Fund indirectly bears its proportionate share of the expenses of any underlying Fidelity Central Funds.
I Expense ratios reflect operating expenses of the class. Expenses before reductions do not reflect amounts reimbursed by the investment adviser or reductions from brokerage service arrangements or reductions from other expense offset arrangements and do not represent the amount paid by the class during periods when reimbursements or reductions occur. Expense ratios before reductions for start-up periods may not be representative of longer-term operating periods. Expenses net of fee waivers reflect expenses after reimbursement by the investment adviser but prior to reductions from brokerage service arrangements or other expense offset arrangements. Expenses net of all reductions represent the net expenses paid by the class.
J Annualized
K Amount does not include the portfolio activity of any underlying Fidelity Central Funds.
L Amount not annualized.
See accompanying notes which are an integral part of the financial statements.
Fidelity Advisor Global Equity Income Fund Class I
| Years ended October 31, | 2015 | 2014 | 2013 | 2012 A |
| Selected Per–Share Data | | | | |
| Net asset value, beginning of period | $12.97 | $12.22 | $10.15 | $10.00 |
| Income from Investment Operations | | | | |
| Net investment income (loss)B | .15 | .28C | .21 | .10 |
| Net realized and unrealized gain (loss) | .24 | .90 | 2.07 | .16 |
| Total from investment operations | .39 | 1.18 | 2.28 | .26 |
| Distributions from net investment income | (.14) | (.25) | (.20) | (.11) |
| Distributions from net realized gain | (.71) | (.18) | (.01) | – |
| Total distributions | (.85) | (.43) | (.21) | (.11) |
| Net asset value, end of period | $12.51 | $12.97 | $12.22 | $10.15 |
| Total ReturnD,E | 3.09% | 9.86% | 22.71% | 2.61% |
| Ratios to Average Net AssetsF,G | | | | |
| Expenses before reductions | 2.11% | 2.35% | 4.46% | 7.23%H |
| Expenses net of fee waivers, if any | 1.20% | 1.20% | 1.20% | 1.20%H |
| Expenses net of all reductions | 1.19% | 1.20% | 1.18% | 1.19%H |
| Net investment income (loss) | 1.20% | 2.20%C | 1.91% | 2.14%H |
| Supplemental Data | | | | |
| Net assets, end of period (000 omitted) | $1,167 | $1,334 | $1,231 | $939 |
| Portfolio turnover rateI | 87% | 112% | 78% | 36%J |
A For the period May 2, 2012 (commencement of operations) to October 31, 2012.
B Calculated based on average shares outstanding during the period.
C Investment income per share reflects a large, non-recurring dividend which amounted to $.09 per share. Excluding this non-recurring dividend, the ratio of net investment income (loss) to average net assets would have been 1.50%.
D Total returns for periods of less than one year are not annualized.
E Total returns would have been lower if certain expenses had not been reduced during the applicable periods shown.
F Fees and expenses of any underlying Fidelity Central Funds are not included in the Fund's expense ratio. The Fund indirectly bears its proportionate share of the expenses of any underlying Fidelity Central Funds.
G Expense ratios reflect operating expenses of the class. Expenses before reductions do not reflect amounts reimbursed by the investment adviser or reductions from brokerage service arrangements or reductions from other expense offset arrangements and do not represent the amount paid by the class during periods when reimbursements or reductions occur. Expense ratios before reductions for start-up periods may not be representative of longer-term operating periods. Expenses net of fee waivers reflect expenses after reimbursement by the investment adviser but prior to reductions from brokerage service arrangements or other expense offset arrangements. Expenses net of all reductions represent the net expenses paid by the class.
H Annualized
I Amount does not include the portfolio activity of any underlying Fidelity Central Funds.
J Amount not annualized.
See accompanying notes which are an integral part of the financial statements.
Notes to Financial Statements
For the period ended October 31, 2015
1. Organization.
Fidelity Advisor Global Equity Income Fund (the Fund) is a fund of Fidelity Advisor Series VIII (the Trust) and is authorized to issue an unlimited number of shares. The Trust is registered under the Investment Company Act of 1940, as amended (the 1940 Act), as an open-end management investment company organized as a Massachusetts business trust. The Fund offers Class A, Class T, Class C and Class I (formerly Institutional Class) shares, each of which has equal rights as to assets and voting privileges. Each class has exclusive voting rights with respect to matters that affect that class.
2. Investments in Fidelity Central Funds.
The Fund invests in Fidelity Central Funds, which are open-end investment companies generally available only to other investment companies and accounts managed by the investment adviser and its affiliates. The Fund's Schedule of Investments lists each of the Fidelity Central Funds held as of period end, if any, as an investment of the Fund, but does not include the underlying holdings of each Fidelity Central Fund. As an Investing Fund, the Fund indirectly bears its proportionate share of the expenses of the underlying Fidelity Central Funds.
The Money Market Central Funds seek preservation of capital and current income and are managed by Fidelity Investments Money Management, Inc. (FIMM), an affiliate of the investment adviser. Annualized expenses of the Money Market Central Funds as of their most recent shareholder report date are less than .005%.
A complete unaudited list of holdings for each Fidelity Central Fund is available upon request or at the Securities and Exchange Commission (the SEC) website at www.sec.gov. In addition, the financial statements of the Fidelity Central Funds, which are not covered by the Fund's Report of Independent Registered Public Accounting Firm, are available on the SEC website or upon request.
3. Significant Accounting Policies.
The financial statements have been prepared in conformity with accounting principles generally accepted in the United States of America (GAAP), which require management to make certain estimates and assumptions at the date of the financial statements. Actual results could differ from those estimates. Subsequent events, if any, through the date that the financial statements were issued have been evaluated in the preparation of the financial statements. The following summarizes the significant accounting policies of the Fund:
Investment Valuation. Investments are valued as of 4:00 p.m. Eastern time on the last calendar day of the period. The Board of Trustees (the Board) has delegated the day to day responsibility for the valuation of the Fund's investments to the Fidelity Management & Research Company (FMR) Fair Value Committee (the Committee). In accordance with valuation policies and procedures approved by the Board, the Fund attempts to obtain prices from one or more third party pricing vendors or brokers to value its investments. When current market prices, quotations or currency exchange rates are not readily available or reliable, investments will be fair valued in good faith by the Committee, in accordance with procedures adopted by the Board. Factors used in determining fair value vary by investment type and may include market or investment specific events, changes in interest rates and credit quality. The frequency with which these procedures are used cannot be predicted and they may be utilized to a significant extent. The Committee oversees the Fund's valuation policies and procedures and reports to the Board on the Committee's activities and fair value determinations. The Board monitors the appropriateness of the procedures used in valuing the Fund's investments and ratifies the fair value determinations of the Committee.
The Fund categorizes the inputs to valuation techniques used to value its investments into a disclosure hierarchy consisting of three levels as shown below:
- Level 1 – quoted prices in active markets for identical investments
- Level 2 – other significant observable inputs (including quoted prices for similar investments, interest rates, prepayment speeds, etc.)
- Level 3 – unobservable inputs (including the Fund's own assumptions based on the best information available)
Valuation techniques used to value the Fund's investments by major category are as follows:
Equity securities, including restricted securities, for which market quotations are readily available, are valued at the last reported sale price or official closing price as reported by a third party pricing vendor on the primary market or exchange on which they are traded and are categorized as Level 1 in the hierarchy. In the event there were no sales during the day or closing prices are not available, securities are valued at the last quoted bid price or may be valued using the last available price and are generally categorized as Level 2 in the hierarchy. For foreign equity securities, when market or security specific events arise, comparisons to the valuation of American Depositary Receipts (ADRs), futures contracts, Exchange-Traded Funds (ETFs) and certain indexes as well as quoted prices for similar securities may be used and would be categorized as Level 2 in the hierarchy. Utilizing these techniques may result in transfers between Level 1 and Level 2. For equity securities, including restricted securities, where observable inputs are limited, assumptions about market activity and risk are used and these securities may be categorized as Level 3 in the hierarchy.
Debt securities, including restricted securities, are valued based on evaluated prices received from third party pricing vendors or from brokers who make markets in such securities. Corporate bonds are valued by pricing vendors who utilize matrix pricing which considers yield or price of bonds of comparable quality, coupon, maturity and type or by broker-supplied prices. When independent prices are unavailable or unreliable, debt securities may be valued utilizing pricing methodologies which consider similar factors that would be used by third party pricing vendors. Debt securities are generally categorized as Level 2 in the hierarchy but may be Level 3 depending on the circumstances.
Investments in open-end mutual funds, including the Fidelity Central Funds, are valued at their closing net asset value (NAV) each business day and are categorized as Level 1 in the hierarchy.
Changes in valuation techniques may result in transfers in or out of an assigned level within the disclosure hierarchy. The aggregate value of investments by input level as of October 31, 2015 is included at the end of the Fund's Schedule of Investments.
Foreign Currency. The Fund may use foreign currency contracts to facilitate transactions in foreign-denominated securities. Gains and losses from these transactions may arise from changes in the value of the foreign currency or if the counterparties do not perform under the contracts' terms.
Foreign-denominated assets, including investment securities, and liabilities are translated into U.S. dollars at the exchange rates at period end. Purchases and sales of investment securities, income and dividends received and expenses denominated in foreign currencies are translated into U.S. dollars at the exchange rate in effect on the transaction date.
The effects of exchange rate fluctuations on investments are included with the net realized and unrealized gain (loss) on investment securities. Other foreign currency transactions resulting in realized and unrealized gain (loss) are disclosed separately.
Investment Transactions and Income. For financial reporting purposes, the Fund's investment holdings and NAV include trades executed through the end of the last business day of the period. The NAV per share for processing shareholder transactions is calculated as of the close of business of the New York Stock Exchange (NYSE), normally 4:00 p.m. Eastern time and includes trades executed through the end of the prior business day. Gains and losses on securities sold are determined on the basis of identified cost. Dividend income is recorded on the ex-dividend date, except for certain dividends from foreign securities where the ex-dividend date may have passed, which are recorded as soon as the Fund is informed of the ex-dividend date. Non-cash dividends included in dividend income, if any, are recorded at the fair market value of the securities received. Income and capital gain distributions from Fidelity Central Funds, if any, are recorded on the ex-dividend date. Distributions received on securities that represent a return of capital or capital gain are recorded as a reduction of cost of investments and/or as a realized gain. Subsequent to ex-dividend date the Fund determines the components of these distributions, based upon receipt of tax filings or other correspondence relating to the underlying investment. Interest income is accrued as earned and includes coupon interest and amortization of premium and accretion of discount on debt securities as applicable. Investment income is recorded net of foreign taxes withheld where recovery of such taxes is uncertain.
Class Allocations and Expenses. Investment income, realized and unrealized capital gains and losses, common expenses of the Fund, and certain fund-level expense reductions, if any, are allocated daily on a pro-rata basis to each class based on the relative net assets of each class to the total net assets of the Fund. Each class differs with respect to transfer agent and distribution and service plan fees incurred. Certain expense reductions may also differ by class. For the reporting period, the allocated portion of income and expenses to each class as a percent of its average net assets may vary due to the timing of recording these transactions in relation to fluctuating net assets of the classes. Expenses directly attributable to a fund are charged to that fund. Expenses attributable to more than one fund are allocated among the respective funds on the basis of relative net assets or other appropriate methods. Expense estimates are accrued in the period to which they relate and adjustments are made when actual amounts are known.
Income Tax Information and Distributions to Shareholders. Each year, the Fund intends to qualify as a regulated investment company under Subchapter M of the Internal Revenue Code, including distributing substantially all of its taxable income and realized gains. As a result, no provision for U.S. Federal income taxes is required. As of October 31, 2015, the Fund did not have any unrecognized tax benefits in the financial statements; nor is the Fund aware of any tax positions for which it is reasonably possible that the total amounts of unrecognized tax benefits will significantly change in the next twelve months. The Fund files a U.S. federal tax return, in addition to state and local tax returns as required. The Fund's federal income tax returns are subject to examination by the Internal Revenue Service (IRS) for a period of three fiscal years after they are filed. State and local tax returns may be subject to examination for an additional fiscal year depending on the jurisdiction. Foreign taxes are provided for based on the Fund's understanding of the tax rules and rates that exist in the foreign markets in which it invests.
Distributions are declared and recorded on the ex-dividend date. Income dividends and capital gain distributions are declared separately for each class. Income and capital gain distributions are determined in accordance with income tax regulations, which may differ from GAAP. In addition, the Fund claimed a portion of the payment made to redeeming shareholders as a distribution for income tax purposes.
Capital accounts within the financial statements are adjusted for permanent book-tax differences. These adjustments have no impact on net assets or the results of operations. Capital accounts are not adjusted for temporary book-tax differences which will reverse in a subsequent period.
Book-tax differences are primarily due to foreign currency transactions, passive foreign investment companies (PFIC), partnerships, and losses deferred due to wash sales.
The federal tax cost of investment securities and unrealized appreciation (depreciation) as of period end were as follows:
| Gross unrealized appreciation | $1,205,766 |
| Gross unrealized depreciation | (490,189) |
| Net unrealized appreciation (depreciation) on securities | $715,577 |
| Tax Cost | $10,762,886 |
The tax-based components of distributable earnings as of period end were as follows:
| Undistributed ordinary income | $10,220 |
| Undistributed long-term capital gain | $150,625 |
| Net unrealized appreciation (depreciation) on securities and other investments | $715,104 |
The tax character of distributions paid was as follows:
| | October 31, 2015 | October 31, 2014 |
| Ordinary Income | $238,473 | $ 169,657 |
| Long-term Capital Gains | 415,433 | 71,624 |
| Total | $653,906 | $ 241,281 |
4. Purchases and Sales of Investments.
Purchases and sales of securities, other than short-term securities, aggregated $9,830,677 and $9,068,215, respectively.
5. Fees and Other Transactions with Affiliates.
Management Fee. Fidelity Management & Research Company (the investment adviser) and its affiliates provide the Fund with investment management related services for which the Fund pays a monthly management fee. The management fee is the sum of an individual fund fee rate that is based on an annual rate of .45% of the Fund's average net assets and an annualized group fee rate that averaged .25% during the period. The group fee rate is based upon the average net assets of all the mutual funds advised by the investment adviser, including any mutual funds previously advised by the investment adviser that are currently advised by Fidelity SelectCo, LLC, an affiliate of the investment adviser. The group fee rate decreases as assets under management increase and increases as assets under management decrease. For the reporting period, the total annual management fee rate was .70% of the Fund's average net assets.
Distribution and Service Plan Fees. In accordance with Rule 12b-1 of the 1940 Act, the Fund has adopted separate Distribution and Service Plans for each class of shares. Certain classes pay Fidelity Distributors Corporation (FDC), an affiliate of the investment adviser, separate Distribution and Service Fees, each of which is based on an annual percentage of each class' average net assets. In addition, FDC may pay financial intermediaries for selling shares of the Fund and providing shareholder support services. For the period, the Distribution and Service Fee rates, total fees and amounts retained by FDC were as follows:
| | Distribution
Fee | Service
Fee | Total Fees | Retained
by FDC |
| Class A | -% | .25% | $10,490 | $1,367 |
| Class T | .25% | .25% | 11,314 | 2,413 |
| Class C | .75% | .25% | 32,552 | 32,552 |
| | | | $54,356 | $36,332 |
Sales Load. FDC may receive a front-end sales charge of up to 5.75% for selling Class A shares and 3.50% for selling Class T shares, some of which is paid to financial intermediaries for selling shares of the Fund. Depending on the holding period, FDC may receive contingent deferred sales charges levied on Class A, Class T, and Class C redemptions. The deferred sales charges range from 1.00% for Class C shares, 1.00% for certain purchases of Class A shares and .25% for certain purchases of Class T shares.
For the period, sales charge amounts retained by FDC were as follows:
| | Retained
by FDC |
| Class A | $6,457 |
| Class T | 1,919 |
| Class C(a) | 242 |
| | $8,618 |
(a) When Class C shares are initially sold, FDC pays commissions from its own resources to financial intermediaries through which the sales are made.
Transfer Agent Fees. Fidelity Investments Institutional Operations Company, Inc., (FIIOC), an affiliate of the investment adviser, is the transfer, dividend disbursing and shareholder servicing agent for each class of the Fund. FIIOC receives account fees and asset-based fees that vary according to the account size and type of account of the shareholders of the respective classes of the Fund. FIIOC pays for typesetting, printing and mailing of shareholder reports, except proxy statements.
For the period, transfer agent fees for each class were as follows:
| | Amount | % of
Class-Level Average
Net Assets |
| Class A | $10,876 | .26 |
| Class T | 6,908 | .30 |
| Class C | 9,791 | .30 |
| Class I | 1,641 | .13 |
| | $ 29,216 | |
Accounting Fees. Fidelity Service Company, Inc. (FSC), an affiliate of the investment adviser, maintains the Fund's accounting records. The fee is based on the level of average net assets for each month.
Brokerage Commissions. The Fund placed a portion of its portfolio transactions with brokerage firms which are affiliates of the investment adviser. Brokerage commissions are included in net realized gain (loss) and change in net unrealized appreciation (depreciation) in the Statement of Operations. The commissions paid to these affiliated firms were $79 for the period.
6. Committed Line of Credit.
The Fund participates with other funds managed by the investment adviser or an affiliate in a $4.25 billion credit facility (the "line of credit") to be utilized for temporary or emergency purposes to fund shareholder redemptions or for other short-term liquidity purposes. The Fund has agreed to pay commitment fees on its pro-rata portion of the line of credit, which amounted to $16 and is reflected in Miscellaneous expenses on the Statement of Operations. During the period, the Fund did not borrow on this line of credit.
7. Expense Reductions.
The investment adviser contractually agreed to reimburse each class to the extent annual operating expenses exceeded certain levels of average net assets as noted in the table below. This reimbursement will remain in place through December 31, 2016. Some expenses, for example interest expense, including commitment fees, are excluded from this reimbursement.
The following classes were in reimbursement during the period:
| | Expense
Limitations | Reimbursement |
| Class A | 1.45% | $40,955 |
| Class T | 1.70% | 23,369 |
| Class C | 2.20% | 33,631 |
| Class I | 1.20% | 11,535 |
| | | $109,490 |
Commissions paid to certain brokers with whom the investment adviser, or its affiliates, places trades on behalf of the Fund include an amount in addition to trade execution, which may be rebated back to the Fund to offset certain expenses. This amount totaled $945 for the period. In addition, through arrangements with the Fund's custodian, credits realized as a result of certain uninvested cash balances were used to reduce the Fund's expenses. During the period, these credits reduced the Fund's expenses by $10.
In addition, during the period the investment adviser reimbursed and/or waived a portion of fund-level operating expenses in the amount of $46 and a portion of class-level operating expenses as follows:
| | Amount |
| Class A | $68 |
| Class T | 38 |
| Class C | 54 |
| Class I | 29 |
| | $189 |
8. Distributions to Shareholders.
Distributions to shareholders of each class were as follows:
| Years ended October 31, | 2015 | 2014 |
| From net investment income | | |
| Class A | $37,903 | $59,134 |
| Class T | 15,415 | 28,554 |
| Class C | 12,164 | 29,949 |
| Class I | 14,278 | 25,909 |
| Total | $79,760 | $143,546 |
| From net realized gain | | |
| Class A | $222,759 | $37,020 |
| Class T | 109,345 | 20,549 |
| Class C | 168,198 | 22,043 |
| Class I | 73,844 | 18,123 |
| Total | $574,146 | $97,735 |
9. Share Transactions.
Share transactions for each class were as follows and may contain automatic conversions between classes or exchanges between funds:
| | Shares | Shares | Dollars | Dollars |
| Years ended October 31, | 2015 | 2014 | 2015 | 2014 |
| Class A | | | | |
| Shares sold | 172,016 | 196,535 | $2,191,371 | $2,476,199 |
| Reinvestment of distributions | 19,779 | 7,392 | 247,241 | 92,391 |
| Shares redeemed | (138,207) | (66,552) | (1,716,684) | (854,492) |
| Net increase (decrease) | 53,588 | 137,375 | $721,928 | $1,714,098 |
| Class T | | | | |
| Shares sold | 93,137 | 95,686 | $1,178,554 | $1,188,546 |
| Reinvestment of distributions | 9,968 | 3,827 | 124,661 | 47,754 |
| Shares redeemed | (59,695) | (48,139) | (748,248) | (610,330) |
| Net increase (decrease) | 43,410 | 51,374 | $554,967 | $625,970 |
| Class C | | | | |
| Shares sold | 120,269 | 179,385 | $1,517,646 | $2,234,467 |
| Reinvestment of distributions | 14,053 | 3,965 | 175,518 | 49,411 |
| Shares redeemed | (120,843) | (56,526) | (1,499,976) | (715,924) |
| Net increase (decrease) | 13,479 | 126,824 | $193,188 | $1,567,954 |
| Class I | | | | |
| Shares sold | 25,924 | 9,677 | $328,076 | $123,415 |
| Reinvestment of distributions | 6,890 | 3,513 | 86,194 | 43,809 |
| Shares redeemed | (42,440) | (11,104) | (533,556) | (142,306) |
| Net increase (decrease) | (9,626) | 2,086 | $(119,286) | $24,918 |
10. Other.
The Fund's organizational documents provide former and current trustees and officers with a limited indemnification against liabilities arising in connection with the performance of their duties to the Fund. In the normal course of business, the Fund may also enter into contracts that provide general indemnifications. The Fund's maximum exposure under these arrangements is unknown as this would be dependent on future claims that may be made against the Fund. The risk of material loss from such claims is considered remote.
Report of Independent Registered Public Accounting Firm
To the Trustees of Fidelity Advisor Series VIII and Shareholders of Fidelity Advisor® Global Equity Income Fund:
In our opinion, the accompanying statement of assets and liabilities, including the schedule of investments, and the related statements of operations and of changes in net assets and the financial highlights present fairly, in all material respects, the financial position of Fidelity Advisor® Global Equity Income Fund (a fund of Fidelity Advisor Series VIII) at October 31, 2015, the results of its operations for the year then ended, the changes in its net assets for each of the two years in the period then ended and the financial highlights for each of the periods indicated, in conformity with accounting principles generally accepted in the United States of America. These financial statements and financial highlights (hereafter referred to as “financial statements”) are the responsibility of the Fidelity Advisor® Global Equity Income Fund’s management. Our responsibility is to express an opinion on these financial statements based on our audits. We conducted our audits of these financial statements in accordance with the standards of the Public Company Accounting Oversight Board (United States). Those standards require that we plan and perform the audit to obtain reasonable assurance about whether the financial statements are free of material misstatement. An audit includes examining, on a test basis, evidence supporting the amounts and disclosures in the financial statements, assessing the accounting principles used and significant estimates made by management, and evaluating the overall financial statement presentation. We believe that our audits, which included confirmation of securities at October 31, 2015 by correspondence with the custodian and brokers, provide a reasonable basis for our opinion.
PricewaterhouseCoopers LLP
Boston, Massachusetts
December 21, 2015
Trustees and Officers
The Trustees, Members of the Advisory Board (if any), and officers of the trust and fund, as applicable, are listed below. The Board of Trustees governs the fund and is responsible for protecting the interests of shareholders. The Trustees are experienced executives who meet periodically throughout the year to oversee the fund's activities, review contractual arrangements with companies that provide services to the fund, oversee management of the risks associated with such activities and contractual arrangements, and review the fund's performance. Each of the Trustees oversees 170 funds.
The Trustees hold office without limit in time except that (a) any Trustee may resign; (b) any Trustee may be removed by written instrument, signed by at least two-thirds of the number of Trustees prior to such removal; (c) any Trustee who requests to be retired or who has become incapacitated by illness or injury may be retired by written instrument signed by a majority of the other Trustees; and (d) any Trustee may be removed at any special meeting of shareholders by a two-thirds vote of the outstanding voting securities of the trust. Each Trustee who is not an interested person (as defined in the 1940 Act) of the trust and the fund is referred to herein as an Independent Trustee. Each Independent Trustee shall retire not later than the last day of the calendar year in which his or her 75th birthday occurs. The Independent Trustees may waive this mandatory retirement age policy with respect to individual Trustees. Officers and Advisory Board Members hold office without limit in time, except that any officer or Advisory Board Member may resign or may be removed by a vote of a majority of the Trustees at any regular meeting or any special meeting of the Trustees. Except as indicated, each individual has held the office shown or other offices in the same company for the past five years.
The fund’s Statement of Additional Information (SAI) includes more information about the Trustees. To request a free copy, call Fidelity at 1-877-208-0098.
Experience, Skills, Attributes, and Qualifications of the Trustees. The Governance and Nominating Committee has adopted a statement of policy that describes the experience, qualifications, attributes, and skills that are necessary and desirable for potential Independent Trustee candidates (Statement of Policy). The Board believes that each Trustee satisfied at the time he or she was initially elected or appointed a Trustee, and continues to satisfy, the standards contemplated by the Statement of Policy. The Governance and Nominating Committee also engages professional search firms to help identify potential Independent Trustee candidates who have the experience, qualifications, attributes, and skills consistent with the Statement of Policy. From time to time, additional criteria based on the composition and skills of the current Independent Trustees, as well as experience or skills that may be appropriate in light of future changes to board composition, business conditions, and regulatory or other developments, have also been considered by the professional search firms and the Governance and Nominating Committee. In addition, the Board takes into account the Trustees' commitment and participation in Board and committee meetings, as well as their leadership of standing and ad hoc committees throughout their tenure.
In determining that a particular Trustee was and continues to be qualified to serve as a Trustee, the Board has considered a variety of criteria, none of which, in isolation, was controlling. The Board believes that, collectively, the Trustees have balanced and diverse experience, qualifications, attributes, and skills, which allow the Board to operate effectively in governing the fund and protecting the interests of shareholders. Information about the specific experience, skills, attributes, and qualifications of each Trustee, which in each case led to the Board's conclusion that the Trustee should serve (or continue to serve) as a trustee of the fund, is provided below.
Board Structure and Oversight Function. James C. Curvey is an interested person and currently serves as Chairman. The Trustees have determined that an interested Chairman is appropriate and benefits shareholders because an interested Chairman has a personal and professional stake in the quality and continuity of services provided to the fund. Independent Trustees exercise their informed business judgment to appoint an individual of their choosing to serve as Chairman, regardless of whether the Trustee happens to be independent or a member of management. The Independent Trustees have determined that they can act independently and effectively without having an Independent Trustee serve as Chairman and that a key structural component for assuring that they are in a position to do so is for the Independent Trustees to constitute a substantial majority for the Board. The Independent Trustees also regularly meet in executive session. Ned C. Lautenbach serves as Chairman of the Independent Trustees and as such (i) acts as a liaison between the Independent Trustees and management with respect to matters important to the Independent Trustees and (ii) with management prepares agendas for Board meetings.
Fidelity® funds are overseen by different Boards of Trustees. The fund's Board oversees Fidelity's high income and certain equity funds, and other Boards oversee Fidelity's investment-grade bond, money market, asset allocation, and sector funds. The asset allocation funds may invest in Fidelity® funds overseen by the fund's Board. The use of separate Boards, each with its own committee structure, allows the Trustees of each group of Fidelity® funds to focus on the unique issues of the funds they oversee, including common research, investment, and operational issues. On occasion, the separate Boards establish joint committees to address issues of overlapping consequences for the Fidelity® funds overseen by each Board.
The Trustees operate using a system of committees to facilitate the timely and efficient consideration of all matters of importance to the Trustees, the fund, and fund shareholders and to facilitate compliance with legal and regulatory requirements and oversight of the fund's activities and associated risks. The Board, acting through its committees, has charged FMR and its affiliates with (i) identifying events or circumstances the occurrence of which could have demonstrably adverse effects on the fund's business and/or reputation; (ii) implementing processes and controls to lessen the possibility that such events or circumstances occur or to mitigate the effects of such events or circumstances if they do occur; and (iii) creating and maintaining a system designed to evaluate continuously business and market conditions in order to facilitate the identification and implementation processes described in (i) and (ii) above. Because the day-to-day operations and activities of the fund are carried out by or through FMR, its affiliates, and other service providers, the fund's exposure to risks is mitigated but not eliminated by the processes overseen by the Trustees. While each of the Board's committees has responsibility for overseeing different aspects of the fund's activities, oversight is exercised primarily through the Operations, Audit, and Compliance Committees. In addition, the Independent Trustees have worked with FMR to enhance the Board's oversight of investment and financial risks, legal and regulatory risks, technology risks, and operational risks, including the development of additional risk reporting to the Board. For example, a working group comprised of Independent Trustees and FMR has worked and continues to work to review the Fidelity® funds' valuation-related activities, reporting and risk management. Appropriate personnel, including but not limited to the fund's Chief Compliance Officer (CCO), FMR's internal auditor, the independent accountants, the fund's Treasurer and portfolio management personnel, make periodic reports to the Board's committees, as appropriate, including an annual review of Fidelity's risk management program for the Fidelity® funds. The responsibilities of each standing committee, including their oversight responsibilities, are described further under "Standing Committees of the Trustees."
Interested Trustees*:
Correspondence intended for a Trustee who is an interested person may be sent to Fidelity Investments, 245 Summer Street, Boston, Massachusetts 02210.
Name, Year of Birth; Principal Occupations and Other Relevant Experience+
James C. Curvey (1935)
Year of Election or Appointment: 2007
Trustee
Chairman of the Board of Trustees
Mr. Curvey also serves as Trustee of other Fidelity® funds. Mr. Curvey is a Director of Fidelity Research & Analysis Co. (investment adviser firm, 2009-present), and Vice Chairman (2007-present) and Director of FMR LLC (diversified financial services company). In addition, Mr. Curvey serves as an Overseer for the Boston Symphony Orchestra and a member of the board of Artis-Naples, Naples, Florida, and as a Trustee for Brewster Academy, Wolfeboro, New Hampshire. Previously, Mr. Curvey served as a Director of Fidelity Investments Money Management, Inc. (investment adviser firm, 2009-2014) and a Director of FMR and FMR Co., Inc. (investment adviser firms, 2007-2014).
Charles S. Morrison (1960)
Year of Election or Appointment: 2014
Trustee
Mr. Morrison also serves as Trustee of other funds. He serves as a Director of Fidelity Investments Money Management, Inc. (FIMM) (investment adviser firm, 2014-present), Director of Fidelity SelectCo, LLC (investment adviser firm, 2014-present), President, Asset Management (2014-present), and is an employee of Fidelity Investments. Previously, Mr. Morrison served as Vice President of Fidelity's Fixed Income and Asset Allocation Funds (2012-2014), President, Fixed Income (2011-2014), Vice President of Fidelity's Money Market Funds (2005-2009), President, Money Market Group Leader of FMR (investment adviser firm, 2009), and Senior Vice President, Money Market Group of FMR (2004-2009). Mr. Morrison also served as Vice President of Fidelity's Bond Funds (2002-2005), certain Balanced Funds (2002-2005), and certain Asset Allocation Funds (2002-2007), and as Senior Vice President (2002-2005) of Fidelity's Bond Division.
* Determined to be an “Interested Trustee” by virtue of, among other things, his or her affiliation with the trust or various entities under common control with FMR.
+ The information includes the Trustee's principal occupation during the last five years and other information relating to the experience, attributes, and skills relevant to the Trustee's qualifications to serve as a Trustee, which led to the conclusion that the Trustee should serve as a Trustee for the fund.
Independent Trustees:
Correspondence intended for an Independent Trustee may be sent to Fidelity Investments, P.O. Box 55235, Boston, Massachusetts 02205-5235.
Name, Year of Birth; Principal Occupations and Other Relevant Experience+
Dennis J. Dirks (1948)
Year of Election or Appointment: 2005
Trustee
Mr. Dirks also serves as Trustee of other Fidelity® funds. Prior to his retirement in May 2003, Mr. Dirks was Chief Operating Officer and a member of the Board of The Depository Trust & Clearing Corporation (DTCC). He also served as President, Chief Operating Officer, and Board member of The Depository Trust Company (DTC) and President and Board member of the National Securities Clearing Corporation (NSCC). In addition, Mr. Dirks served as Chief Executive Officer and Board member of the Government Securities Clearing Corporation, Chief Executive Officer and Board member of the Mortgage-Backed Securities Clearing Corporation, as a Trustee and a member of the Finance Committee of Manhattan College (2005-2008), as a Trustee and a member of the Finance Committee of AHRC of Nassau County (2006-2008), and as a member of the Independent Directors Council (IDC) Governing Council (2010-2015). Mr. Dirks is a member of the Board of Directors for The Brookville Center for Children's Services, Inc. (2009-present).
Alan J. Lacy (1953)
Year of Election or Appointment: 2008
Trustee
Mr. Lacy also serves as Trustee of other Fidelity® funds. Mr. Lacy serves as a member of the Board of Directors of Dave & Buster's Entertainment, Inc. (restaurant and entertainment complexes, 2010-present) and Bristol-Myers Squibb Company (global pharmaceuticals, 2008-present). In addition, Mr. Lacy served as Senior Adviser (2007-2014) of Oak Hill Capital Partners, L.P. (private equity) and also served as Chief Executive Officer (2000-2005) and Vice Chairman (2005-2006) of Sears Holdings Corporation and Sears, Roebuck and Co. (retail). Mr. Lacy is a member of the Board of Trustees of The National Parks Conservation Association (2006-present). Previously, Mr. Lacy served as Chairman of the Board of Trustees of the National Parks Conservation Association (2008-2011) and as a member of the Board of Directors for The Western Union Company (global money transfer, 2006-2011), The Hillman Companies, Inc. (hardware wholesalers, 2010-2014), and Earth Fare, Inc. (retail grocery, 2010-2014).
Ned C. Lautenbach (1944)
Year of Election or Appointment: 2000
Trustee
Chairman of the Independent Trustees
Mr. Lautenbach also serves as Trustee of other Fidelity® funds. Mr. Lautenbach currently serves as the Lead Director of the Eaton Corporation Board of Directors (diversified industrial, 1997-present). Mr. Lautenbach is Chairman of the Board of Directors of Artis-Naples in Naples, Florida (2012-present), a member of the Council on Foreign Relations (1994-present), and a member of the Board of Governors, State University System of Florida (2013-present). Previously, Mr. Lautenbach was a Partner/Advisory Partner at Clayton, Dubilier & Rice, LLC (private equity investment, 1998-2010), as well as a Director of Sony Corporation (2006-2007).
Joseph Mauriello (1944)
Year of Election or Appointment: 2008
Trustee
Mr. Mauriello also serves as Trustee of other Fidelity® funds. Prior to his retirement in January 2006, Mr. Mauriello served in numerous senior management positions including Deputy Chairman and Chief Operating Officer (2004-2005), and Vice Chairman of Financial Services (2002-2004) of KPMG LLP US (professional services, 1965-2005). Mr. Mauriello currently serves as a member of the Board of Directors of XL Group plc. (global insurance and re-insurance, 2006-present) and the Independent Directors Council (IDC) Governing Council (2015-present). Previously, Mr. Mauriello served as a Director of the Hamilton Funds of the Bank of New York (2006-2007) and of Arcadia Resources Inc. (health care services and products, 2007-2012).
Robert W. Selander (1950)
Year of Election or Appointment: 2011
Trustee
Mr. Selander also serves as Trustee of other Fidelity® funds. Mr. Selander serves as a Director of The Western Union Company (global money transfer, 2014-present). Previously, Mr. Selander served as a Member of the Advisory Board of other Fidelity® funds (2011), and Executive Vice Chairman (2010), Chief Executive Officer (2009-2010), and President and Chief Executive Officer (1997-2009) of Mastercard, Inc.
Cornelia M. Small (1944)
Year of Election or Appointment: 2005
Trustee
Ms. Small also serves as Trustee of other Fidelity® funds. Ms. Small is a member of the Board of Directors (2009-present) and Chair of the Investment Committee (2010-present) of the Teagle Foundation. Ms. Small also serves on the Investment Committee of the Berkshire Taconic Community Foundation (2008-present). Previously, Ms. Small served as Chairperson (2002-2008) and a member of the Investment Committee and Chairperson (2008-2012) and a member of the Board of Trustees of Smith College. In addition, Ms. Small served as Chief Investment Officer, Director of Global Equity Investments, and a member of the Board of Directors of Scudder, Stevens & Clark and Scudder Kemper Investments.
William S. Stavropoulos (1939)
Year of Election or Appointment: 2001
Trustee
Vice Chairman of the Independent Trustees
Mr. Stavropoulos also serves as Trustee of other Fidelity® funds. Mr. Stavropoulos serves as President and Founder of the Michigan Baseball Foundation, the Great Lakes Loons (2007-present). Mr. Stavropoulos is Chairman Emeritus of the Board of Directors of The Dow Chemical Company, where he previously served in numerous senior management positions, including President, CEO (1995-2000; 2002-2004), Chairman of the Executive Committee (2000-2006), and as a member of the Board of Directors (1990-2006). Currently, Mr. Stavropoulos is Chairman of the Board of Directors of Univar Inc. (global distributor of commodity and specialty chemicals), a Director of Teradata Corporation (data warehousing and technology solutions), and Maersk Inc. (industrial conglomerate), and a member of the Advisory Board for Metalmark Capital LLC (private equity investment, 2005-present). Mr. Stavropoulos is an operating advisor to Clayton, Dubilier & Rice, LLC (private equity investment). In addition, Mr. Stavropoulos is a member of the University of Notre Dame Advisory Council for the College of Science, a Trustee of the Rollin L. Gerstacker Foundation, and a Director of the Naples Philharmonic Center for the Arts. Previously, Mr. Stavropoulos served as a Director of Chemical Financial Corporation (bank holding company, 1993-2012) and Tyco International, Ltd. (multinational manufacturing and services, 2007-2012).
David M. Thomas (1949)
Year of Election or Appointment: 2008
Trustee
Mr. Thomas also serves as Trustee of other Fidelity® funds. Mr. Thomas serves as Non-Executive Chairman of the Board of Directors of Fortune Brands Home and Security (home and security products, 2011-present), as a member of the Board of Directors (2004-present) and Presiding Director (2013-present) of Interpublic Group of Companies, Inc. (marketing communication), and as a member of the Board of Trustees of the University of Florida (2013-present). Previously, Mr. Thomas served as Executive Chairman (2005-2006) and Chairman and Chief Executive Officer (2000-2005) of IMS Health, Inc. (pharmaceutical and healthcare information solutions), and a Director of Fortune Brands, Inc. (consumer products, 2000-2011).
+ The information includes the Trustee's principal occupation during the last five years and other information relating to the experience, attributes, and skills relevant to the Trustee's qualifications to serve as a Trustee, which led to the conclusion that the Trustee should serve as a Trustee for the fund.
Advisory Board Members and Officers:
Correspondence intended for an officer or Peter S. Lynch may be sent to Fidelity Investments, 245 Summer Street, Boston, Massachusetts 02210. Officers appear below in alphabetical order.
Name, Year of Birth; Principal Occupation
Peter S. Lynch (1944)
Year of Election or Appointment: 2003
Member of the Advisory Board
Mr. Lynch also serves as Member of the Advisory Board of other Fidelity® funds. Mr. Lynch is Vice Chairman and a Director of FMR (investment adviser firm) and FMR Co., Inc. (investment adviser firm). In addition, Mr. Lynch serves as a Trustee of Boston College and as the Chairman of the Inner-City Scholarship Fund. Previously, Mr. Lynch served on the Special Olympics International Board of Directors (1997-2006).
Elizabeth Paige Baumann (1968)
Year of Election or Appointment: 2012
Anti-Money Laundering (AML) Officer
Ms. Baumann also serves as AML Officer of other funds. She is Chief AML Officer of FMR LLC (diversified financial services company, 2012-present) and is an employee of Fidelity Investments. Previously, Ms. Baumann served as Vice President and Deputy Anti-Money Laundering Officer (2007-2012).
Marc R. Bryant (1966)
Year of Election or Appointment: 2015
Secretary and Chief Legal Officer (CLO)
Mr. Bryant also serves as Secretary and CLO of other funds. Mr. Bryant serves as CLO, Secretary, and Senior Vice President of Fidelity Management & Research Company (investment adviser firm, 2015-present) and FMR Co., Inc. (investment adviser firm, 2015-present); Secretary of Fidelity SelectCo, LLC (investment adviser firm, 2015-present) and Fidelity Investments Money Management, Inc. (investment adviser firm, 2015-present); and CLO of Fidelity Management & Research (Hong Kong) Limited (investment adviser firm, 2015-present). He is Senior Vice President and Deputy General Counsel of FMR LLC (diversified financial services company). Previously, Mr. Bryant served as Secretary and Chief Legal Officer of Fidelity Rutland Square Trust II (2010-2014) and Assistant Secretary of Fidelity's Fixed Income and Asset Allocation Funds (2013-2015). Prior to joining Fidelity Investments, Mr. Bryant served as a Senior Vice President and the Head of Global Retail Legal for AllianceBernstein L.P. (2006-2010), and as the General Counsel for ProFund Advisors LLC (2001-2006).
William C. Coffey (1969)
Year of Election or Appointment: 2009
Assistant Secretary
Mr. Coffey also serves as Assistant Secretary of other funds. He is Senior Vice President and Deputy General Counsel of FMR LLC (diversified financial services company, 2010-present), and is an employee of Fidelity Investments. Previously, Mr. Coffey served as Vice President and Associate General Counsel of FMR LLC (2005-2009).
Jonathan Davis (1968)
Year of Election or Appointment: 2010
Assistant Treasurer
Mr. Davis also serves as Assistant Treasurer of other funds, and is an employee of Fidelity Investments. Previously, Mr. Davis served as Vice President and Associate General Counsel of FMR LLC (diversified financial services company, 2003-2010).
Adrien E. Deberghes (1967)
Year of Election or Appointment: 2008
Deputy Treasurer
Mr. Deberghes also serves as an officer of other funds. He is an employee of Fidelity Investments (2008-present). Prior to joining Fidelity Investments, Mr. Deberghes was Senior Vice President of Mutual Fund Administration at State Street Corporation (2007-2008), Senior Director of Mutual Fund Administration at Investors Bank & Trust (2005-2007), and Director of Finance for Dunkin' Brands (2000-2005).
Stephanie J. Dorsey (1969)
Year of Election or Appointment: 2010
Assistant Treasurer
Ms. Dorsey also serves as an officer of other funds. She is an employee of Fidelity Investments (2008-present) and has served in other fund officer roles. Prior to joining Fidelity Investments, Ms. Dorsey served as Treasurer (2004-2008) of the JPMorgan Mutual Funds and Vice President (2004-2008) of JPMorgan Chase Bank.
Howard J. Galligan III (1966)
Year of Election or Appointment: 2014
Chief Financial Officer
Mr. Galligan also serves as Chief Financial Officer of other funds. Mr. Galligan serves as President of Fidelity Pricing and Cash Management Services (FPCMS) (2014-present) and as a Director of Strategic Advisers, Inc. (investment adviser firm, 2008-present). Previously, Mr. Galligan served as Chief Administrative Officer of Asset Management (2011-2014) and Chief Operating Officer and Senior Vice President of Investment Support for Strategic Advisers, Inc. (2003-2011).
Scott C. Goebel (1968)
Year of Election or Appointment: 2015
Vice President
Mr. Goebel serves as Vice President of other funds and is an employee of Fidelity Investments (2001-present). Previously, Mr. Goebel served as Secretary of Fidelity SelectCo, LLC (investment adviser firm, 2013-2015), Fidelity Investments Money Management, Inc. (FIMM) (investment adviser firm, 2010-2015), and Fidelity Research and Analysis Company (FRAC) (investment adviser firm, 2010-2015); General Counsel, Secretary, and Senior Vice President of Fidelity Management & Research Company (investment adviser firm, 2008-2015) and FMR Co., Inc. (investment adviser firm, 2008-2015); Assistant Secretary of Fidelity Management & Research (Japan) Limited (investment adviser firm, 2008-2015) and FMR Investment Management (U.K.) Limited (investment adviser firm, 2008-2015); Chief Legal Officer (CLO) of Fidelity Management & Research (Hong Kong) Limited (investment adviser firm, 2008-2015); Secretary and CLO of certain Fidelity® funds (2008-2015); Assistant Secretary of FIMM (2008-2010), FRAC (2008-2010), and certain funds (2007-2008); and as Vice President and Secretary of Fidelity Distributors Corporation (FDC) (2005-2007).
Thomas C. Hense (1964)
Year of Election or Appointment: 2008, 2010, or 2015
Vice President
Mr. Hense serves as Vice President of Fidelity Advisor® Multi-Asset Income Fund (2015) and other funds (High Income (2008), Small Cap (2008), and Value (2010) funds), and is an employee of Fidelity Investments (1993-present). Previously, Mr. Hense served as a portfolio manager for Fidelity's Institutional Money Management Group (Pyramis) (2003-2008).
Brian B. Hogan (1964)
Year of Election or Appointment: 2009
Vice President
Mr. Hogan also serves as Trustee or Vice President of other funds. Mr. Hogan serves as a Director of Fidelity SelectCo, LLC (investment adviser firm, 2014-present) and President of the Equity Division of FMR (investment adviser firm, 2009-present). Previously, Mr. Hogan served as Senior Vice President, Equity Research of FMR (2006-2009) and as a portfolio manager.
Chris Maher (1972)
Year of Election or Appointment: 2013
Assistant Treasurer
Mr. Maher serves as Assistant Treasurer of other funds. Mr. Maher is Vice President of Valuation Oversight and is an employee of Fidelity Investments. Previously, Mr. Maher served as Vice President of Asset Management Compliance (2013), Vice President of the Program Management Group of FMR (investment adviser firm, 2010-2013), and Vice President of Valuation Oversight (2008-2010).
Kenneth B. Robins (1969)
Year of Election or Appointment: 2008
President and Treasurer
Mr. Robins also serves as an officer of other funds. Mr. Robins serves as Executive Vice President of Fidelity Investments Money Management, Inc. (FIMM) (investment adviser firm, 2013-present) and is an employee of Fidelity Investments (2004-present). Previously, Mr. Robins served in other fund officer roles.
Stacie M. Smith (1974)
Year of Election or Appointment: 2013
Deputy Treasurer
Ms. Smith also serves as an officer of other funds. She is an employee of Fidelity Investments (2009-present) and has served in other fund officer roles. Prior to joining Fidelity Investments, Ms. Smith served as Senior Audit Manager of Ernst & Young LLP (1996-2009).
Renee Stagnone (1975)
Year of Election or Appointment: 2013
Deputy Treasurer
Ms. Stagnone also serves as Deputy Treasurer of other funds. Ms. Stagnone is an employee of Fidelity Investments (1997-present).
Linda J. Wondrack (1964)
Year of Election or Appointment: 2014
Chief Compliance Officer
Ms. Wondrack also serves as Chief Compliance Officer of other funds. Ms. Wondrack is Executive Vice President and head of the Ethics Office and Asset Management Compliance for Fidelity Investments (2012-present). Ms. Wondrack also serves as Chief Compliance Officer of Fidelity SelectCo, LLC (investment adviser firm, 2014-present); Chief Compliance Officer of Impresa Management LLC (2013-present); and Chief Compliance Officer of FMR Co., Inc. (investment adviser firm), Fidelity Investments Money Management, Inc. (investment adviser firm), Fidelity Management & Research (Japan) Limited (investment adviser firm), FMR Investment Management (U.K.) Limited (investment adviser firm), Fidelity Management & Research (Hong Kong) (investment adviser firm), Fidelity Management & Research Company (investment adviser firm), FIAM LLC (investment adviser firm), and Strategic Advisers, Inc. (investment adviser firm), Ballyrock Investment Advisors LLC, and Northern Neck Investors LLC (2012-present). Previously, Ms. Wondrack served as Senior Vice President and Chief Compliance Officer for Columbia Management Investment Advisers, LLC (2005-2012); Chief Compliance Officer for certain funds within the Columbia Family of Funds (2007-2012); and Senior Vice President of Compliance Risk Management at Bank of America (2005-2010).
Joseph F. Zambello (1957)
Year of Election or Appointment: 2011
Deputy Treasurer
Mr. Zambello also serves as Deputy Treasurer of other funds. Mr. Zambello is an employee of Fidelity Investments (1991-present). Previously, Mr. Zambello served as Vice President of the Program Management Group of FMR (investment adviser firm, 2009-2011) and Vice President of the Transfer Agent Oversight Group (2005-2009).
Shareholder Expense Example
As a shareholder of the Fund, you incur two types of costs: (1) transaction costs, including sales charges (loads) on purchase payments or redemption proceeds, and (2) ongoing costs, including management fees, distribution and/or service (12b-1) fees and other Fund expenses. This Example is intended to help you understand your ongoing costs (in dollars) of investing in the Fund and to compare these costs with the ongoing costs of investing in other mutual funds.
The Example is based on an investment of $1,000 invested at the beginning of the period and held for the entire period (May 1, 2015 to October 31, 2015).
Actual Expenses
The first line of the accompanying table for each class of the Fund provides information about actual account values and actual expenses. You may use the information in this line, together with the amount you invested, to estimate the expenses that you paid over the period. Simply divide your account value by $1,000.00 (for example, an $8,600 account value divided by $1,000.00 = 8.6), then multiply the result by the number in the first line for a class of the Fund under the heading entitled "Expenses Paid During Period" to estimate the expenses you paid on your account during this period. In addition, the Fund, as a shareholder in the underlying Fidelity Central Funds, will indirectly bear its pro-rata share of the fees and expenses incurred by the underlying Fidelity Central Funds. These fees and expenses are not included in the Fund's annualized expense ratio used to calculate the expense estimate in the table below.
Hypothetical Example for Comparison Purposes
The second line of the accompanying table for each class of the Fund provides information about hypothetical account values and hypothetical expenses based on a Class' actual expense ratio and an assumed rate of return of 5% per year before expenses, which is not the Class' actual return. The hypothetical account values and expenses may not be used to estimate the actual ending account balance or expenses you paid for the period. You may use this information to compare the ongoing costs of investing in the Fund and other funds. To do so, compare this 5% hypothetical example with the 5% hypothetical examples that appear in the shareholder reports of the other funds. In addition, the Fund, as a shareholder in the underlying Fidelity Central Funds, will indirectly bear its pro-rata share of the fees and expenses incurred by the underlying Fidelity Central Funds. These fees and expenses are not included in the Fund's annualized expense ratio used to calculate the expense estimate in the table below.
Please note that the expenses shown in the table are meant to highlight your ongoing costs only and do not reflect any transaction costs. Therefore, the second line of the table is useful in comparing ongoing costs only, and will not help you determine the relative total costs of owning different funds. In addition, if these transactional costs were included, your costs would have been higher.
| | Annualized Expense Ratio-A | Beginning
Account Value
May 1, 2015 | Ending
Account Value
October 31, 2015 | Expenses Paid
During Period-B
May 1, 2015
to October 31, 2015 |
| Class A | 1.45% | | | |
| Actual | | $1,000.00 | $971.60 | $7.21 |
| Hypothetical-C | | $1,000.00 | $1,017.90 | $7.38 |
| Class T | 1.70% | | | |
| Actual | | $1,000.00 | $970.40 | $8.44 |
| Hypothetical-C | | $1,000.00 | $1,016.64 | $8.64 |
| Class C | 2.20% | | | |
| Actual | | $1,000.00 | $968.10 | $10.91 |
| Hypothetical-C | | $1,000.00 | $1,014.12 | $11.17 |
| Class I | 1.20% | | | |
| Actual | | $1,000.00 | $972.80 | $5.97 |
| Hypothetical-C | | $1,000.00 | $1,019.16 | $6.11 |
A Annualized expense ratio reflects expenses net of applicable fee waivers.
B Expenses are equal to each Class' annualized expense ratio, multiplied by the average account value over the period, multiplied by 184/365 (to reflect the one-half year period).
C 5% return per year before expenses
Distributions (Unaudited)
The Board of Trustees of Fidelity Advisor Global Equity Income Fund voted to pay to shareholders of record at the opening of business on record date, the following distributions per share derived from capital gains realized from sales of portfolio securities, and dividends derived from net investment income:
| | Pay Date | Record Date | Dividends | Capital Gains |
| Class A | 12/07/15 | 12/04/15 | $0.032 | $0.160 |
| Class T | 12/07/15 | 12/04/15 | $0.023 | $0.160 |
| Class C | 12/07/15 | 12/04/15 | $0.005 | $0.160 |
The fund hereby designates as a capital gain dividend with respect to the taxable year ended October 31, 2015, $193,931 or, if subsequently determined to be different, the net capital gain of such year.
Class A designates 85%, 100%, 100%, and 100%; Class T designates 89%, 100%, 100%, and 100%; Class C designates 97%, 100%, 100%, and 100% of dividends distributed in December 2014, April 2015, July 2015 and October 2015 respectively during the fiscal year as amounts which may be taken into account as a dividend for the purposes of the maximum rate under section 1(h)(11) of the Internal Revenue Code.
Class A designates 0%, 100%, 100%, and 100%; Class T designates 1%, 100%, 100%, and 100%; Class C designates 1%, 100%, 100%, and 100% of the dividends distributed in December 2014, April 2015, July 2015 and October 2015 respectively during the fiscal year as qualifying for the dividends-received deduction for corporate shareholders.
A total of 0.07% of the dividends distributed during the fiscal year was derived from interest on U.S. Government securities which is generally exempt from state income tax.
The amounts per share which represent income derived from sources within, and taxes paid to, foreign countries or possessions of the United States are as follows:
| | Pay Date | Income | Taxes |
| Class A | 12/08/2014 | $0.1473 | $0.0118 |
| | 04/04/2015 | $0.0420 | $0.0050 |
| | 07/04/2015 | $0.0571 | $0.0071 |
| | 10/05/2015 | $0.0160 | $0.0020 |
| Class T | 12/08/2014 | $0.1414 | $0.0118 |
| | 04/04/2015 | $0.0350 | $0.0050 |
| | 07/04/2015 | $0.0501 | $0.0071 |
| | 10/05/2015 | $0.0080 | $0.0020 |
| Class C | 12/08/2014 | $0.1296 | $0.0118 |
| | 04/04/2015 | $0.0220 | $0.0050 |
| | 07/04/2015 | $0.0361 | $0.0071 |
| | 10/05/2015 | $0.0000 | $0.0000 |
The fund will notify shareholders in January 2016 of amounts for use in preparing 2015 income tax returns.
Board Approval of Investment Advisory Contracts and Management Fees
Fidelity Advisor Global Equity Income Fund
Each year, the Board of Trustees, including the Independent Trustees (together, the Board), votes on the renewal of the management contract with Fidelity Management & Research Company (FMR) and the sub-advisory agreements (together, the Advisory Contracts) for the fund. The Board, assisted by the advice of fund counsel and Independent Trustees' counsel, requests and considers a broad range of information relevant to the renewal of the Advisory Contracts throughout the year.
The Board meets regularly and, at each of its meetings, covers an extensive agenda of topics and materials and considers factors that are relevant to its annual consideration of the renewal of the fund's Advisory Contracts, including the services and support provided to the fund and its shareholders. The Board has established various standing committees (Committees), each composed of and chaired by Independent Trustees with varying backgrounds, to which the Board has assigned specific subject matter responsibilities in order to enhance effective decision-making by the Board. The Board, acting directly and through its Committees, requests and receives information concerning the annual consideration of the renewal of the fund's Advisory Contracts. The Board also meets as needed to consider matters specifically related to the Board's annual consideration of the renewal of the Advisory Contracts. Members of the Board may also meet with trustees of other Fidelity funds through ad hoc joint committees to discuss certain matters relevant to all of the Fidelity funds.
At its July 2015 meeting, the Board unanimously determined to renew the fund's Advisory Contracts. In reaching its determination, the Board considered all factors it believed relevant, including (i) the nature, extent, and quality of the services to be provided to the fund and its shareholders (including the investment performance of the fund); (ii) the competitiveness of the fund's management fee and total expense ratio relative to peer funds; (iii) the total costs of the services to be provided by and the profits to be realized by Fidelity from its relationship with the fund; and (iv) the extent to which (if any) economies of scale exist and would be realized as the fund grows, and whether any economies of scale are appropriately shared with fund shareholders.
In considering whether to renew the Advisory Contracts for the fund, the Board reached a determination, with the assistance of fund counsel and Independent Trustees' counsel and through the exercise of its business judgment, that the renewal of the Advisory Contracts was in the best interests of the fund and its shareholders and that the compensation payable under the Advisory Contracts was fair and reasonable. The Board's decision to renew the Advisory Contracts was not based on any single factor, but rather was based on a comprehensive consideration of all the information provided to the Board at its meetings throughout the year. The Board, in reaching its determination to renew the Advisory Contracts, was aware that shareholders of the fund have a broad range of investment choices available to them, including a wide choice among funds offered by Fidelity's competitors, and that the fund's shareholders, who have the opportunity to review and weigh the disclosure provided by the fund in its prospectus and other public disclosures, have chosen to invest in this fund, which is part of the Fidelity family of funds.
Nature, Extent, and Quality of Services Provided. The Board considered Fidelity's staffing as it relates to the fund, including the backgrounds of investment personnel of Fidelity, and also considered the fund's investment objective, strategies, and related investment philosophy. The Independent Trustees also had discussions with senior management of Fidelity's investment operations and investment groups. The Board considered the structure of the portfolio manager compensation program and whether this structure provides appropriate incentives to act in the best interests of the fund. Additionally, the Board considered the portfolio managers' investments, if any, in the funds that they manage.
Resources Dedicated to Investment Management and Support Services. The Board and the Fund Oversight and Research Committees reviewed the general qualifications and capabilities of Fidelity's investment staff, including its size, education, experience, and resources, as well as Fidelity's approach to recruiting, training, managing, and compensating investment personnel. The Board noted that Fidelity has continued to increase the resources devoted to nonoffices, including expansion of Fidelity's global investment organization. The Board also noted that Fidelity's analysts have extensive resources, tools and capabilities that allow them to conduct sophisticated quantitative and fundamental analysis, as well as credit analysis of issuers, counterparties and guarantors. Further, the Board considered that Fidelity's investment professionals have sufficient access to global information and data so as to provide competitive investment results over time, and that those professionals also have access to sophisticated tools that permit them to assess portfolio construction and risk and performance attribution characteristics continuously, as well as to transmit new information and research conclusions rapidly around the world. Additionally, in its deliberations, the Board considered Fidelity's trading, risk management, and compliance capabilities and resources, which are integral parts of the investment management process.
Shareholder and Administrative Services. The Board considered (i) the nature, extent, quality, and cost of advisory, administrative, and shareholder services performed by FMR, the sub-advisers (together with FMR, the Investment Advisers), and their affiliates under the Advisory Contracts and under separate agreements covering transfer agency, pricing and bookkeeping, and securities lending services for the fund; (ii) the nature and extent of the supervision of third party service providers, principally custodians and subcustodians; and (iii) the resources devoted to, and the record of compliance with, the fund's compliance policies and procedures. The Board also reviewed the allocation of fund brokerage, including allocations to brokers affiliated with the Investment Advisers, the use of brokerage commissions to pay fund expenses, and the use of "soft" commission dollars to pay for research services.
The Board noted that the growth of fund assets over time across the complex allows Fidelity to reinvest in the development of services designed to enhance the value or convenience of the Fidelity funds as investment vehicles. These services include 24-hour access to account information and market information through telephone representatives and over the Internet, investor education materials and asset allocation tools, and the expanded availability of Fidelity Investor Centers.
In 2014, the Board formed an ad hoc Committee on Transfer Agency Fees to review the variety of transfer agency fee structures throughout the industry and Fidelity's competitive positioning with respect to industry participants.
Investment in a Large Fund Family. The Board considered the benefits to shareholders of investing in a Fidelity fund, including the benefits of investing in a fund that is part of a large family of funds offering a variety of investment disciplines and providing a large variety of mutual fund investor services. The Board noted that Fidelity had taken, or had made recommendations that resulted in the Fidelity funds taking, a number of actions over the previous year that benefited particular funds, including (i) continuing to dedicate additional resources to investment research and to the support of the senior management team that oversees asset management; (ii) continuing efforts to enhance Fidelity's global research capabilities; (iii) launching new funds and making other enhancements to meet client needs; (iv) reducing management fees and total expenses for certain index funds and diversified international funds; (v) continuing to launch dedicated lower cost underlying funds to meet portfolio construction needs related to expanding underlying fund options for Fidelity funds of funds, specifically for the Freedom Fund product lines; (vi) rationalizing product lines and gaining increased efficiencies through fund mergers; (vii) launching active fixed-income exchange-traded funds; (viii) continuing to develop, acquire and implement systems and technology to improve services to the funds and information security and to increase efficiency; (ix) implementing investment enhancements to further strengthen Fidelity's target date product line to increase investors' probability of success in achieving their goals; (x) modifying the eligibility criteria for certain share classes to accommodate roll-over assets from employer-sponsored retirement plans; (xi) launching a new Class W of the Freedom Index Funds to attract and retain Fidelity record-kept retirement plan assets; and (xii) implementing changes to Fidelity's money market product line in response to recent money market regulatory reforms.
Investment Performance. The Board considered whether the fund has operated in accordance with its investment objective, as well as its record of compliance with its investment restrictions and its performance history.
The Board took into account discussions with representatives of the Investment Advisers about fund investment performance that occur at Board meetings throughout the year. In this regard the Board noted that as part of regularly scheduled fund reviews and other reports to the Board on fund performance, the Board considers annualized return information for the fund, for different time periods, measured against a securities market index ("benchmark index") and a peer group of funds with similar objectives ("peer group"), if any. In its evaluation of fund investment performance, the Board gave particular attention to information indicating changes in performance of certain Fidelity funds for specific time periods and discussed with the Investment Advisers the reasons for any overperformance or underperformance.
In addition to reviewing absolute and relative fund performance, the Independent Trustees periodically consider the appropriateness of fund performance metrics in evaluating the results achieved. In general, the Independent Trustees believe that fund performance should be evaluated based on net performance (after fees and expenses) of both the highest performing and lowest performing fund share classes, where applicable, compared to appropriate benchmark indices, over appropriate time periods that may include full market cycles, and compared to peer groups, as applicable, over the same periods, taking into account relevant factors including the following: general market conditions; issuer-specific information; and fund cash flows and other factors.
The Independent Trustees recognize that shareholders evaluate performance on a net basis over their own holding periods, for which one-, three-, and five-year periods are often used as a proxy. For this reason, the performance information reviewed by the Board also included net cumulative calendar year total return information for the fund and an appropriate benchmark index and peer group for the most recent one-year period, as shown below. Returns are shown compared to the 25th percentile (top of box, 75% beaten) and 75th percentile (bottom of box, 25% beaten) of the peer universe. Returns of the benchmark index are "net MA,"
i.e., adjusted for tax withholding rates applicable to U.S.-based funds organized as Massachusetts business trusts.
Fidelity Advisor Global Equity Income Fund
Based on its review, the Board concluded that the nature, extent, and quality of services provided to the fund under the Advisory Contracts should benefit the shareholders of the fund.
Competitiveness of Management Fee and Total Expense Ratio. The Board considered the fund's management fee and total expense ratio compared to "mapped groups" of competitive funds and classes created for the purpose of facilitating the Trustees' competitive analysis of management fees and total expenses. Fidelity creates "mapped groups" by combining similar Lipper investment objective categories that have comparable investment mandates. Combining Lipper investment objective categories aids the Board's management fee and total expense ratio comparisons by broadening the competitive group used for comparison.
Management Fee. The Board considered two proprietary management fee comparisons for the 12-month (or shorter) periods shown in basis points (BP) in the chart below. The group of Lipper funds used by the Board for management fee comparisons is referred to below as the "Total Mapped Group." The Total Mapped Group is broader than the Lipper peer group used by the Board for performance comparisons because the Total Mapped Group combines several Lipper investment objective categories while the Lipper peer group does not. The Total Mapped Group comparison focuses on a fund's standing in terms of gross management fees before expense reimbursements or caps relative to the total universe of funds with comparable investment mandates, regardless of whether their management fee structures also are comparable. Funds with comparable investment mandates offer exposure to similar types of securities. Funds with comparable management fee structures have similar management fee contractual arrangements (
e.g., flat rate charged for advisory services, all-inclusive fee rate,
etc.). "TMG %" represents the percentage of funds in the Total Mapped Group that had management fees that were lower than the fund's. For example, a hypothetical TMG % of 20% would mean that 80% of the funds in the Total Mapped Group had higher, and 20% had lower, management fees than the fund. The fund's actual TMG %s and the number of funds in the Total Mapped Group are in the chart below. The "Asset-Size Peer Group" (ASPG) comparison focuses on a fund's standing relative to a subset of non-Fidelity funds within the Total Mapped Group that are similar in size and management fee structure without taking into account performance adjustments, if any. For example, if a fund is in the first quartile of the ASPG, the fund's management fee ranks in the least expensive or lowest 25% of funds in the ASPG. The ASPG represents at least 15% of the funds in the Total Mapped Group with comparable asset size and management fee structures, subject to a minimum of 50 funds (or all funds in the Total Mapped Group if fewer than 50). Additional information, such as the ASPG quartile in which the fund's management fee rate ranked, is also included in the chart and considered by the Board.
Fidelity Advisor Global Equity Income Fund
The Board noted that the fund's management fee rate ranked below the median of its Total Mapped Group and below the median of its ASPG for 2014.
The Board noted that, in 2014, the ad hoc Committee on Group Fee was formed by it and other Fidelity fund boards to conduct an in-depth review of the "group fee" component of the management fee of funds with such management fee structures. Committee focus included the mechanics of the group fee, the competitive landscape of group fee structures, Fidelity funds with no group fee component and investment products not included in group fee assets. The Board also considered that, for funds subject to the group fee, FMR agreed to voluntarily waive fees over a specified period of time in amounts designed to account for assets converted from certain funds to certain collective investment trusts.
The Board also noted that, in 2013, the ad hoc Committee on Management Fees was formed to conduct an in-depth review of the management fee rates of Fidelity's active equity mutual funds. The Committee focused on the following areas: (i) standard fee structures; (ii) research consumption and trading evolution; (iii) management fee competitiveness/profitability by category; and (iv) factors that drive institutional pricing.
Based on its review, the Board concluded that the fund's management fee is fair and reasonable in light of the services that the fund receives and the other factors considered.
Total Expense Ratio. In its review of each class's total expense ratio, the Board considered the fund's management fee as well as other fund or class expenses, as applicable, such as transfer agent fees, pricing and bookkeeping fees, fund-paid 12b-1 fees, and custodial, legal, and audit fees. The Board also noted that Fidelity may agree to waive fees and expenses from time to time, and the extent to which, if any, it has done so for the fund. As part of its review, the Board also considered the current and historical total expense ratios of each class of the fund compared to competitive fund median expenses. Each class of the fund is compared to those funds and classes in the Total Mapped Group (used by the Board for management fee comparisons) that have a similar sales load structure.
The Board noted that the total expense ratio of each class ranked above its competitive median for 2014. The Board considered that, in general, various factors can affect total expense ratios. The Board noted that the total expense ratio of Class T was above the competitive median primarily because of higher 12b-1 fees on Class T as compared to most competitor funds. Class T has a higher 12b-1 fee, but a lower front-end sales charge, than traditionally priced front-end sales charge classes. The Board considered that Class T is primarily sold load-waived in the retirement plan market where its 0.50% 12b-1 fee is comparable to competing no-load, higher 12b-1 fee classes designed specifically for retirement plans. The Board noted that the fund offers multiple classes, each of which has a different sales load and 12b-1 fee structure, and that the multiple structures are intended to offer a range of pricing options for the intermediary market. The Board also noted that the total expense ratios of the classes vary primarily by the level of their 12b-1 fees, although differences in transfer agent fees may also cause expenses to vary from class to class.
The Board further considered that FMR contractually agreed to reimburse Class A, Class T, Class C, and Class I of the fund to the extent that total expenses (excluding interest, certain taxes, certain securities lending costs, brokerage commissions, extraordinary expenses, and acquired fund fees and expenses, if any), as a percentage of their respective average net assets, exceed 1.45%, 1.70%, 2.20%, and 1.20% through December 31, 2015.
Fees Charged to Other Fidelity Clients. The Board also considered Fidelity fee structures and other information with respect to clients of Fidelity, such as other funds advised or subadvised by Fidelity, pension plan clients, and other institutional clients with similar mandates. The Board noted the findings of the 2013 ad hoc joint committee (created with the board of other Fidelity funds), which reviewed and compared Fidelity's institutional investment advisory business with its business of providing services to the Fidelity funds, including the differences in services provided, fees charged, and costs incurred, as well as competition in their respective marketplaces.
Based on its review of total expense ratios and fees charged to other Fidelity clients, the Board concluded that, although in all cases above the median of the universe presented for comparison, the total expense ratio of each class of the fund was reasonable in light of the services that the fund and its shareholders receive and the other factors considered.
Costs of the Services and Profitability. The Board considered the revenues earned and the expenses incurred by Fidelity in conducting the business of developing, marketing, distributing, managing, administering and servicing the fund and servicing the fund's shareholders. The Board also considered the level of Fidelity's profits in respect of all the Fidelity funds.
On an annual basis, Fidelity presents to the Board information about the profitability of its relationship with the fund. Fidelity calculates profitability information for each fund, as well as aggregate profitability information for groups of Fidelity funds and all Fidelity funds, using a series of detailed revenue and cost allocation methodologies which originate with the books and records of Fidelity on which Fidelity's audited financial statements are based. The Audit Committee of the Board reviews any significant changes from the prior year's methodologies.
PricewaterhouseCoopers LLP (PwC), independent registered public accounting firm and auditor to Fidelity and certain Fidelity funds, has been engaged annually by the Board as part of the Board's assessment of Fidelity's profitability analysis. PwC's engagement includes the review and assessment of the methodologies used by Fidelity in determining the revenues and expenses attributable to Fidelity's mutual fund business, and completion of agreed-upon procedures in respect of the mathematical accuracy of fund profitability and its conformity to established allocation methodologies. After considering PwC's reports issued under the engagement and information provided by Fidelity, the Board concluded that while other allocation methods may also be reasonable, Fidelity's profitability methodologies are reasonable in all material respects.
The Board also reviewed Fidelity's non-fund businesses and fall-out benefits related to the mutual fund business as well as cases where Fidelity's affiliates may benefit from or be related to the fund's business.
The Board considered the costs of the services provided by and the profits realized by Fidelity in connection with the operation of the fund and was satisfied that the profitability was not excessive.
Economies of Scale. The Board considered whether there have been economies of scale in respect of the management of the Fidelity funds, whether the Fidelity funds (including the fund) have appropriately benefited from any such economies of scale, and whether there is potential for realization of any further economies of scale. The Board considered the extent to which the fund will benefit from economies of scale as assets grow through increased services to the fund, through waivers or reimbursements, or through fee or expense ratio reductions. The Board also noted that in 2013, it and the boards of other Fidelity funds created an ad hoc committee (the Economies of Scale Committee) to analyze whether Fidelity attains economies of scale in respect of the management and servicing of the Fidelity funds, whether the Fidelity funds have appropriately benefited from such economies of scale, and whether there is potential for realization of any further economies of scale.
The Board recognized that the fund's management contract incorporates a "group fee" structure, which provides for lower group fee rates as total group assets increase, and for higher group fee rates as total group assets decrease (with "group assets" defined to include fund assets under FMR's management plus sector fund assets previously under FMR's management and currently managed by Fidelity SelectCo, LLC). FMR calculates the group fee rates based on a tiered asset "breakpoint" schedule that varies based on asset class. The Board considered that the group fee is designed to deliver the benefits of economies of scale to fund shareholders when total Fidelity fund assets increase, even if assets of any particular fund are unchanged or have declined, because some portion of Fidelity's costs are attributable to services provided to all Fidelity funds, and all funds benefit if those costs can be allocated among more assets. The Board concluded that, given the group fee structure, fund shareholders will benefit from lower management fees as group assets increase at the fund complex level, regardless of whether Fidelity achieves any such economies of scale.
The Board concluded, taking into account the analysis of the Economies of Scale Committee, that economies of scale, if any, are being appropriately shared between fund shareholders and Fidelity.
Additional Information Requested by the Board. In order to develop fully the factual basis for consideration of the Fidelity funds' Advisory Contracts, the Board requested and received additional information on certain topics, including: (i) fund performance trends and Fidelity's long-term strategies for certain funds; (ii) the various share classes employed by Fidelity and the attributes of each class, together with similar information on the distribution and servicing payments made by Fidelity or the funds to third-party participants in the distribution channels; (iii) fund profitability, and fund performance in relation to fund profitability; (iv) the methodology with respect to evaluating competitive fund data and peer group classifications and fee comparisons; (v) annual fund profitability margins, with particular focus on certain funds with negative margins; (vi) the realization of fall-out benefits in certain Fidelity business units;
(vii) economies of scale and the way in which they are shared with fund shareholders;(viii) Fidelity's group fee structures, including the group fee schedule of breakpoints;(ix) the impact of cost containment measures on the funds; and (x) the transfer agent fee structure.
Based on its evaluation of all of the conclusions noted above, and after considering all factors it believed relevant, the Board concluded that the advisory fee structures are fair and reasonable, and that the fund's Advisory Contracts should be renewed.
AGED-ANN-1215
1.938151.103
Fidelity Advisor® Global Equity Income Fund Class I (formerly Institutional Class)
Annual Report October 31, 2015 |
|
Contents
To view a fund's proxy voting guidelines and proxy voting record for the 12-month period ended June 30, visit http://www.fidelity.com/proxyvotingresults or visit the Securities and Exchange Commission's (SEC) web site at http://www.sec.gov.
You may also call 1-877-208-0098 to request a free copy of the proxy voting guidelines.
Standard & Poor's, S&P and S&P 500 are registered service marks of The McGraw-Hill Companies, Inc. and have been licensed for use by Fidelity Distributors Corporation.
Other third-party marks appearing herein are the property of their respective owners.
All other marks appearing herein are registered or unregistered trademarks or service marks of FMR LLC or an affiliated company. © 2015 FMR LLC. All rights reserved.
This report and the financial statements contained herein are submitted for the general information of the shareholders of the Fund. This report is not authorized for distribution to prospective investors in the Fund unless preceded or accompanied by an effective prospectus.
A fund files its complete schedule of portfolio holdings with the SEC for the first and third quarters of each fiscal year on Form N-Q. Forms N-Q are available on the SEC’s web site at http://www.sec.gov. A fund's Forms N-Q may be reviewed and copied at the SEC’s Public Reference Room in Washington, DC. Information regarding the operation of the SEC's Public Reference Room may be obtained by calling 1-800-SEC-0330.
For a complete list of a fund's portfolio holdings, view the most recent holdings listing, semiannual report, or annual report on Fidelity's web site at http://www.fidelity.com, http://www.advisor.fidelity.com, or http://www.401k.com, as applicable.
NOT FDIC INSURED •MAY LOSE VALUE •NO BANK GUARANTEE
Neither the Fund nor Fidelity Distributors Corporation is a bank.
Performance: The Bottom Line
Average annual total return reflects the change in the value of an investment, assuming reinvestment of distributions from dividend income and capital gains (the profits earned upon the sale of securities that have grown in value, if any) and assuming a constant rate of performance each year.
The hypothetical investment and the average annual total returns do not reflect the deduction of taxes that a shareholder would pay on fund distributions or the redemption of fund shares.
During periods of reimbursement by Fidelity, a fund’s total return will be greater than it would be had the reimbursement not occurred.
How a fund did yesterday is no guarantee of how it will do tomorrow.
Average Annual Total Returns
| For the periods ended October 31, 2015 | Past 1 year | Life of fundA |
| Class I | 3.09% | 10.67% |
A From May 2, 2012
$10,000 Over Life of Fund
Let's say hypothetically that $10,000 was invested in Fidelity Advisor® Global Equity Income Fund - Class I on May 2, 2012, when the fund started.
The chart shows how the value of your investment would have changed, and also shows how the MSCI ACWI (All Country World Index) Index performed over the same period.

| Period Ending Values |
| $14,260 | Fidelity Advisor® Global Equity Income Fund - Class I |
| $13,655 | MSCI ACWI (All Country World Index) Index |
Management's Discussion of Fund Performance
Market Recap: Following an August and September wherein a collapse in commodities prices hurt resources-related sectors and geographies, global equities rebounded in October to finish flat for the 12 months ending October 31, 2015. The MSCI ACWI (All Country World Index) Index returned 0.35% for the period. Commodity producers remained under pressure for much of the past year, largely related to economic deceleration in China (-1%), the world’s second-largest economy and a leading consumer of raw materials. This effect was exacerbated by the strength of the U.S. dollar relative to global currencies, which weighed on commodities priced in dollars and acutely impacted equity returns within regions most exposed to resources prices. For example, the emerging-markets group returned -15% this period. Canada, a significant energy producer, returned about -17%. Conversely, net energy consumer Japan (+9%) proved the best-performing region by far. Only about a quarter of the nearly 50 countries in the index managed a gain: Israel (+17%) and fast-growing Ireland (+12%) performed best; Greece (-56%) and Brazil (-46%), among the worst. As for sectors, energy (-22%) and materials (-12%) declined sharply, while consumer discretionary (+13%) saw a gain driven largely by demand in the United States (+5%).
Comments from Portfolio Manager Ramona Persaud: For the year, the fund’s share classes achieved modest gains (excluding sales charges, if applicable), outpacing the benchmark MSCI ACWI Index. Against an uptick in global macroeconomic volatility, investors generally favored the value- and quality-oriented investments pursued by the fund, which helped it to outperform. From a geographical perspective, positioning in emerging markets – China, Taiwan and South Africa, in particular – was a plus, as were stock picks in the United Kingdom. Stock picking in the U.S. was the biggest drag on results. Looking at individual names, a non-index stake in WH Smith was one of the biggest contributors. The U.K.-based chain of retail and online shops sells reading material, gifts and snacks to air and rail travelers on the go. The stock benefited from the firm’s growing international-travel sales and improving overall business mix. On the flip side, an overweighting in integrated-oil giant Chevron proved a large detractor. Chevron, one of the fund’s largest holdings, suffered along with the entire sector as energy prices collapsed.
The views expressed above reflect those of the portfolio manager(s) only through the end of the period as stated on the cover of this report and do not necessarily represent the views of Fidelity or any other person in the Fidelity organization. Any such views are subject to change at any time based upon market or other conditions and Fidelity disclaims any responsibility to update such views. These views may not be relied on as investment advice and, because investment decisions for a Fidelity fund are based on numerous factors, may not be relied on as an indication of trading intent on behalf of any Fidelity fund.
Investment Summary (Unaudited)
Top Five Stocks as of October 31, 2015
| | % of fund's net assets | % of fund's net assets 6 months ago |
| JPMorgan Chase & Co. (United States of America, Banks) | 2.7 | 2.0 |
| Apple, Inc. (United States of America, Technology Hardware, Storage & Peripherals) | 2.5 | 2.1 |
| Johnson & Johnson (United States of America, Pharmaceuticals) | 2.4 | 1.7 |
| General Electric Co. (United States of America, Industrial Conglomerates) | 2.4 | 0.9 |
| Accenture PLC Class A (Ireland, IT Services) | 1.9 | 1.2 |
| | 11.9 | |
Top Five Market Sectors as of October 31, 2015
| | % of fund's net assets | % of fund's net assets 6 months ago |
| Financials | 20.6 | 19.4 |
| Information Technology | 17.3 | 14.3 |
| Consumer Staples | 14.5 | 10.7 |
| Consumer Discretionary | 13.3 | 16.6 |
| Health Care | 13.2 | 14.4 |
Top Five Countries as of October 31, 2015
| (excluding cash equivalents) | % of fund's net assets | % of fund's net assets 6 months ago |
| United States of America | 41.4 | 41.1 |
| United Kingdom | 12.9 | 9.4 |
| Japan | 11.4 | 9.8 |
| Ireland | 4.1 | 4.4 |
| Israel | 3.8 | 2.5 |
Percentages are adjusted for the effect of futures contracts, if applicable.
Asset Allocation (% of fund's net assets)
| As of October 31, 2015 |
| | Stocks | 96.0% |
| | Short-Term Investments and Net Other Assets (Liabilities) | 4.0% |

| As of April 30, 2015 |
| | Stocks | 95.1% |
| | Short-Term Investments and Net Other Assets (Liabilities) | 4.9% |

Investments October 31, 2015
Showing Percentage of Net Assets
| Common Stocks - 95.8% | | | |
| | | Shares | Value |
| Australia - 0.5% | | | |
| Telstra Corp. Ltd. | | 13,889 | $53,218 |
| Bailiwick of Jersey - 2.0% | | | |
| Shire PLC | | 1,537 | 116,398 |
| Wolseley PLC | | 1,821 | 106,913 |
|
| TOTAL BAILIWICK OF JERSEY | | | 223,311 |
|
| Belgium - 0.6% | | | |
| Anheuser-Busch InBev SA NV | | 600 | 71,595 |
| Canada - 3.3% | | | |
| Constellation Software, Inc. | | 150 | 64,813 |
| Fairfax Financial Holdings Ltd. (sub. vtg.) | | 130 | 64,018 |
| Potash Corp. of Saskatchewan, Inc. | | 2,540 | 51,437 |
| PrairieSky Royalty Ltd. | | 910 | 17,906 |
| Suncor Energy, Inc. | | 6,220 | 185,087 |
|
| TOTAL CANADA | | | 383,261 |
|
| Cayman Islands - 0.3% | | | |
| SITC International Holdings Co. Ltd. | | 76,000 | 39,010 |
| Chile - 0.3% | | | |
| Vina San Pedro SA | | 4,990,928 | 39,347 |
| France - 2.9% | | | |
| Cegedim SA (a) | | 1,000 | 35,464 |
| Renault SA | | 1,097 | 103,417 |
| Sanofi SA | | 1,899 | 191,563 |
|
| TOTAL FRANCE | | | 330,444 |
|
| Germany - 1.0% | | | |
| AURELIUS AG | | 1,379 | 61,536 |
| Muenchener Rueckversicherungs AG | | 240 | 47,855 |
|
| TOTAL GERMANY | | | 109,391 |
|
| Hong Kong - 1.9% | | | |
| HKT Trust/HKT Ltd. unit | | 64,280 | 76,585 |
| Techtronic Industries Co. Ltd. | | 37,000 | 135,260 |
|
| TOTAL HONG KONG | | | 211,845 |
|
| Indonesia - 0.5% | | | |
| PT Bank Central Asia Tbk | | 60,700 | 57,023 |
| Ireland - 4.1% | | | |
| Accenture PLC Class A | | 1,985 | 212,792 |
| Greencore Group PLC | | 18,915 | 88,061 |
| Medtronic PLC | | 2,205 | 162,994 |
|
| TOTAL IRELAND | | | 463,847 |
|
| Isle of Man - 1.2% | | | |
| Optimal Payments PLC (a) | | 16,800 | 78,733 |
| Playtech Ltd. | | 4,294 | 56,664 |
|
| TOTAL ISLE OF MAN | | | 135,397 |
|
| Israel - 3.8% | | | |
| Bezeq The Israel Telecommunication Corp. Ltd. | | 42,000 | 90,304 |
| Cellcom Israel Ltd. (Israel) (a) | | 9,678 | 72,038 |
| Partner Communications Co. Ltd. (a) | | 10,250 | 46,519 |
| Rami Levi Chain Stores Hashikma Marketing 2006 Ltd. | | 900 | 42,335 |
| Teva Pharmaceutical Industries Ltd. sponsored ADR | | 3,082 | 182,424 |
|
| TOTAL ISRAEL | | | 433,620 |
|
| Italy - 0.2% | | | |
| Astaldi SpA | | 3,000 | 24,148 |
| Japan - 11.4% | | | |
| A/S One Corp. | | 1,600 | 56,795 |
| Astellas Pharma, Inc. | | 11,000 | 159,659 |
| Broadleaf Co. Ltd. | | 4,800 | 54,982 |
| Daiichikosho Co. Ltd. | | 3,100 | 103,391 |
| Daito Trust Construction Co. Ltd. | | 800 | 86,597 |
| Hoya Corp. | | 3,800 | 156,814 |
| Japan Tobacco, Inc. | | 2,000 | 69,224 |
| KDDI Corp. | | 3,400 | 82,274 |
| NEC Corp. | | 26,000 | 80,210 |
| Olympus Corp. | | 2,600 | 87,701 |
| ORIX Corp. | | 2,500 | 36,509 |
| Shinsei Bank Ltd. | | 40,000 | 83,871 |
| Sony Corp. | | 2,500 | 71,064 |
| Suzuki Motor Corp. | | 2,100 | 68,761 |
| Tsuruha Holdings, Inc. | | 700 | 55,457 |
| United Arrows Ltd. | | 1,200 | 51,697 |
|
| TOTAL JAPAN | | | 1,305,006 |
|
| Netherlands - 1.3% | | | |
| Altice NV Class A (a) | | 2,712 | 46,970 |
| LyondellBasell Industries NV Class A | | 1,100 | 102,201 |
|
| TOTAL NETHERLANDS | | | 149,171 |
|
| Singapore - 0.6% | | | |
| United Overseas Bank Ltd. | | 4,579 | 66,491 |
| South Africa - 1.2% | | | |
| Capitec Bank Holdings Ltd. | | 1,600 | 69,196 |
| EOH Holdings Ltd. | | 3,000 | 33,167 |
| Lewis Group Ltd. | | 8,900 | 38,509 |
|
| TOTAL SOUTH AFRICA | | | 140,872 |
|
| Sweden - 0.8% | | | |
| Nordea Bank AB | | 4,190 | 46,345 |
| Sandvik AB | | 5,200 | 48,631 |
|
| TOTAL SWEDEN | | | 94,976 |
|
| Switzerland - 1.8% | | | |
| ACE Ltd. | | 600 | 68,124 |
| Banque Cantonale Vaudoise (Bearer) | | 110 | 67,773 |
| Sika AG (Bearer) | | 20 | 65,638 |
|
| TOTAL SWITZERLAND | | | 201,535 |
|
| Taiwan - 1.8% | | | |
| King's Town Bank | | 20,000 | 15,956 |
| Taiwan Semiconductor Manufacturing Co. Ltd. | | 45,000 | 189,606 |
|
| TOTAL TAIWAN | | | 205,562 |
|
| United Kingdom - 12.9% | | | |
| British American Tobacco PLC (United Kingdom) | | 2,773 | 164,743 |
| Hilton Food Group PLC | | 11,081 | 79,433 |
| Howden Joinery Group PLC | | 3,700 | 26,443 |
| Imperial Tobacco Group PLC | | 2,764 | 149,092 |
| ITV PLC | | 34,031 | 132,415 |
| Lloyds Banking Group PLC | | 139,368 | 158,184 |
| Micro Focus International PLC | | 7,831 | 151,628 |
| Reckitt Benckiser Group PLC | | 885 | 86,368 |
| SABMiller PLC | | 1,000 | 61,587 |
| St. James's Place Capital PLC | | 4,312 | 64,114 |
| Standard Chartered PLC (United Kingdom) | | 27 | 300 |
| Tesco PLC | | 14,540 | 41,007 |
| The Restaurant Group PLC | | 2,600 | 28,739 |
| Vodafone Group PLC | | 994 | 3,271 |
| WH Smith PLC | | 7,498 | 197,080 |
| Whitbread PLC | | 829 | 63,465 |
| William Hill PLC | | 14,705 | 71,750 |
|
| TOTAL UNITED KINGDOM | | | 1,479,619 |
|
| United States of America - 41.4% | | | |
| American Tower Corp. | | 1,092 | 111,635 |
| Amgen, Inc. | | 532 | 84,152 |
| Apple, Inc. | | 2,419 | 289,071 |
| Bank of America Corp. | | 9,393 | 157,615 |
| BWX Technologies, Inc. | | 3,635 | 102,871 |
| Chevron Corp. | | 2,259 | 205,298 |
| Comcast Corp. Class A | | 1,654 | 103,573 |
| CVB Financial Corp. | | 4,276 | 74,616 |
| CVS Health Corp. | | 2,063 | 203,783 |
| Danaher Corp. | | 1,130 | 105,440 |
| Deere & Co. | | 702 | 54,756 |
| Diamond Hill Investment Group, Inc. | | 411 | 82,221 |
| Dr. Pepper Snapple Group, Inc. | | 1,039 | 92,855 |
| EMC Corp. | | 3,740 | 98,063 |
| Exxon Mobil Corp. | | 2,169 | 179,463 |
| First NBC Bank Holding Co. (a) | | 400 | 14,876 |
| General Electric Co. | | 9,552 | 276,244 |
| HP, Inc. | | 2,600 | 70,096 |
| IBM Corp. | | 1,043 | 146,103 |
| Johnson & Johnson | | 2,756 | 278,439 |
| JPMorgan Chase & Co. | | 4,806 | 308,783 |
| Lakeland Financial Corp. | | 1,435 | 64,475 |
| McGraw Hill Financial, Inc. | | 970 | 89,861 |
| Microsoft Corp. | | 3,960 | 208,454 |
| Oracle Corp. | | 4,117 | 159,904 |
| PepsiCo, Inc. | | 1,393 | 142,351 |
| PJT Partners, Inc. (a) | | 37 | 796 |
| Procter & Gamble Co. | | 2,012 | 153,677 |
| SunTrust Banks, Inc. | | 2,126 | 88,272 |
| Target Corp. | | 2,634 | 203,292 |
| The Coca-Cola Co. | | 2,959 | 125,314 |
| U.S. Bancorp | | 3,310 | 139,616 |
| VF Corp. | | 684 | 46,184 |
| Wells Fargo & Co. | | 3,746 | 202,808 |
| Western Digital Corp. | | 1,071 | 71,564 |
|
| TOTAL UNITED STATES OF AMERICA | | | 4,736,521 |
|
| TOTAL COMMON STOCKS | | | |
| (Cost $10,168,662) | | | 10,955,210 |
|
| Nonconvertible Preferred Stocks - 0.2% | | | |
| Germany - 0.2% | | | |
| Volkswagen AG | | | |
| (Cost $29,103) | | 200 | 24,007 |
| | | Principal Amount(b) | Value |
|
| Nonconvertible Bonds - 0.0% | | | |
| Canada - 0.0% | | | |
| Constellation Software, Inc. 8.5% 3/31/40(c) | CAD | 500 | 440 |
| TOTAL NONCOVERTIBLE BONDS | | | |
| (Cost $429) | | | 440 |
| | | Shares | Value |
|
| Money Market Funds - 4.4% | | | |
| Fidelity Cash Central Fund, 0.18% (d) | | | |
| (Cost $498,806) | | 498,806 | 498,806 |
| TOTAL INVESTMENT PORTFOLIO - 100.4% | | | |
| (Cost $10,697,000) | | | 11,478,463 |
| NET OTHER ASSETS (LIABILITIES) - (0.4)% | | | (50,066) |
| NET ASSETS - 100% | | | $11,428,397 |
Currency Abbreviations
CAD – Canadian dollar
Categorizations in the Schedule of Investments are based on country or territory of incorporation.
Legend
(a) Non-income producing
(b) Amount is stated in United States dollars unless otherwise noted.
(c) Coupon rates for floating and adjustable rate securities reflect the rates in effect at period end.
(d) Affiliated fund that is generally available only to investment companies and other accounts managed by Fidelity Investments. The rate quoted is the annualized seven-day yield of the fund at period end. A complete unaudited listing of the fund's holdings as of its most recent quarter end is available upon request. In addition, each Fidelity Central Fund's financial statements, which are not covered by the Fund's Report of Independent Registered Public Accounting Firm, are available on the SEC's website or upon request.
Affiliated Central Funds
Information regarding fiscal year to date income earned by the Fund from investments in Fidelity Central Funds is as follows:
| Fund | Income earned |
| Fidelity Cash Central Fund | $736 |
Investment Valuation
The following is a summary of the inputs used, as of October 31, 2015, involving the Fund's assets and liabilities carried at fair value. The inputs or methodology used for valuing securities may not be an indication of the risk associated with investing in those securities. For more information on valuation inputs, and their aggregation into the levels used in the table below, please refer to the Investment Valuation section in the accompanying Notes to Financial Statements.
| | Valuation Inputs at Reporting Date: |
| Description | Total | Level 1 | Level 2 | Level 3 |
| Investments in Securities: | | | | |
| Equities: | | | | |
| Consumer Discretionary | $1,516,017 | $990,087 | $525,930 | $-- |
| Consumer Staples | 1,666,229 | 1,177,835 | 488,394 | -- |
| Energy | 587,754 | 587,754 | -- | -- |
| Financials | 2,329,466 | 1,792,936 | 536,530 | -- |
| Health Care | 1,512,403 | 743,473 | 768,930 | -- |
| Industrials | 758,013 | 612,090 | 145,923 | -- |
| Information Technology | 1,965,850 | 1,641,052 | 324,798 | -- |
| Materials | 219,276 | 219,276 | -- | -- |
| Telecommunication Services | 424,209 | 208,861 | 215,348 | -- |
| Corporate Bonds | 440 | -- | 440 | -- |
| Money Market Funds | 498,806 | 498,806 | -- | -- |
| Total Investments in Securities: | $11,478,463 | $8,472,170 | $3,006,293 | $-- |
See accompanying notes which are an integral part of the financial statements.
Financial Statements
Statement of Assets and Liabilities
| | | October 31, 2015 |
| Assets | | |
Investment in securities, at value — See accompanying schedule:
Unaffiliated issuers (cost $10,198,194) | $10,979,657 | |
| Fidelity Central Funds (cost $498,806) | 498,806 | |
| Total Investments (cost $10,697,000) | | $11,478,463 |
| Foreign currency held at value (cost $1,972) | | 1,924 |
| Receivable for investments sold | | 2,482 |
| Receivable for fund shares sold | | 16,737 |
| Dividends receivable | | 25,063 |
| Interest receivable | | 3 |
| Distributions receivable from Fidelity Central Funds | | 33 |
| Prepaid expenses | | 31 |
| Receivable from investment adviser for expense reductions | | 3,177 |
| Other receivables | | 623 |
| Total assets | | 11,528,536 |
| Liabilities | | |
| Payable for fund shares redeemed | $34,510 | |
| Accrued management fee | 6,595 | |
| Distribution and service plan fees payable | 4,690 | |
| Other affiliated payables | 2,942 | |
| Audit fee payable | 46,030 | |
| Other payables and accrued expenses | 5,372 | |
| Total liabilities | | 100,139 |
| Net Assets | | $11,428,397 |
| Net Assets consist of: | | |
| Paid in capital | | $10,552,446 |
| Undistributed net investment income | | 10,220 |
| Accumulated undistributed net realized gain (loss) on investments and foreign currency transactions | | 84,741 |
| Net unrealized appreciation (depreciation) on investments and assets and liabilities in foreign currencies | | 780,990 |
| Net Assets | | $11,428,397 |
| Calculation of Maximum Offering Price | | |
| Class A: | | |
| Net Asset Value and redemption price per share ($4,552,013 ÷ 364,268 shares) | | $12.50 |
| Maximum offering price per share (100/94.25 of $12.50) | | $13.26 |
| Class T: | | |
| Net Asset Value and redemption price per share ($2,484,397 ÷ 198,914 shares) | | $12.49 |
| Maximum offering price per share (100/96.50 of $12.49) | | $12.94 |
| Class C: | | |
| Net Asset Value and offering price per share ($3,225,384 ÷ 258,950 shares)(a) | | $12.46 |
| Class I: | | |
| Net Asset Value, offering price and redemption price per share ($1,166,603 ÷ 93,230 shares) | | $12.51 |
(a) Redemption price per share is equal to net asset value less any applicable contingent deferred sales charge.
See accompanying notes which are an integral part of the financial statements.
Statement of Operations
| | | Year ended October 31, 2015 |
| Investment Income | | |
| Dividends | | $277,638 |
| Interest | | 167 |
| Income from Fidelity Central Funds | | 736 |
| Income before foreign taxes withheld | | 278,541 |
| Less foreign taxes withheld | | (15,665) |
| Total income | | 262,876 |
| Expenses | | |
| Management fee | $76,732 | |
| Transfer agent fees | 29,216 | |
| Distribution and service plan fees | 54,356 | |
| Accounting fees and expenses | 5,687 | |
| Custodian fees and expenses | 17,080 | |
| Independent trustees' compensation | 46 | |
| Registration fees | 48,984 | |
| Audit | 63,388 | |
| Legal | 27 | |
| Miscellaneous | 302 | |
| Total expenses before reductions | 295,818 | |
| Expense reductions | (110,680) | 185,138 |
| Net investment income (loss) | | 77,738 |
| Realized and Unrealized Gain (Loss) | | |
| Net realized gain (loss) on: | | |
| Investment securities: | | |
| Unaffiliated issuers | 173,432 | |
| Foreign currency transactions | (2,254) | |
| Total net realized gain (loss) | | 171,178 |
Change in net unrealized appreciation (depreciation) on:
Investment securities | (62,909) | |
| Assets and liabilities in foreign currencies | (682) | |
| Total change in net unrealized appreciation (depreciation) | | (63,591) |
| Net gain (loss) | | 107,587 |
| Net increase (decrease) in net assets resulting from operations | | $185,325 |
See accompanying notes which are an integral part of the financial statements.
Statement of Changes in Net Assets
| | Year ended October 31, 2015 | Year ended October 31, 2014 |
| Increase (Decrease) in Net Assets | | |
| Operations | | |
| Net investment income (loss) | $77,738 | $159,837 |
| Net realized gain (loss) | 171,178 | 565,745 |
| Change in net unrealized appreciation (depreciation) | (63,591) | 67,098 |
| Net increase (decrease) in net assets resulting from operations | 185,325 | 792,680 |
| Distributions to shareholders from net investment income | (79,760) | (143,546) |
| Distributions to shareholders from net realized gain | (574,146) | (97,735) |
| Total distributions | (653,906) | (241,281) |
| Share transactions - net increase (decrease) | 1,350,797 | 3,932,940 |
| Total increase (decrease) in net assets | 882,216 | 4,484,339 |
| Net Assets | | |
| Beginning of period | 10,546,181 | 6,061,842 |
| End of period (including undistributed net investment income of $10,220 and undistributed net investment income of $4,288, respectively) | $11,428,397 | $10,546,181 |
See accompanying notes which are an integral part of the financial statements.
Fidelity Advisor Global Equity Income Fund Class A
| Years ended October 31, | 2015 | 2014 | 2013 | 2012 A |
| Selected Per–Share Data | | | | |
| Net asset value, beginning of period | $12.96 | $12.20 | $10.15 | $10.00 |
| Income from Investment Operations | | | | |
| Net investment income (loss)B | .12 | .25C | .19 | .09 |
| Net realized and unrealized gain (loss) | .24 | .91 | 2.05 | .16 |
| Total from investment operations | .36 | 1.16 | 2.24 | .25 |
| Distributions from net investment income | (.11) | (.22) | (.18) | (.10) |
| Distributions from net realized gain | (.71) | (.18) | (.01) | – |
| Total distributions | (.82) | (.40) | (.19) | (.10) |
| Net asset value, end of period | $12.50 | $12.96 | $12.20 | $10.15 |
| Total ReturnD,E,F | 2.85% | 9.70% | 22.28% | 2.51% |
| Ratios to Average Net AssetsG,H | | | | |
| Expenses before reductions | 2.42% | 2.63% | 4.37% | 7.41%I |
| Expenses net of fee waivers, if any | 1.45% | 1.45% | 1.45% | 1.45%I |
| Expenses net of all reductions | 1.44% | 1.45% | 1.43% | 1.44%I |
| Net investment income (loss) | .95% | 1.95%C | 1.66% | 1.89%I |
| Supplemental Data | | | | |
| Net assets, end of period (000 omitted) | $4,552 | $4,025 | $2,115 | $756 |
| Portfolio turnover rateJ | 87% | 112% | 78% | 36%K |
A For the period May 2, 2012 (commencement of operations) to October 31, 2012.
B Calculated based on average shares outstanding during the period.
C Investment income per share reflects a large, non-recurring dividend which amounted to $.09 per share. Excluding this non-recurring dividend, the ratio of net investment income (loss) to average net assets would have been 1.25%.
D Total returns for periods of less than one year are not annualized.
E Total returns would have been lower if certain expenses had not been reduced during the applicable periods shown.
F Total returns do not include the effect of the sales charges.
G Fees and expenses of any underlying Fidelity Central Funds are not included in the Fund's expense ratio. The Fund indirectly bears its proportionate share of the expenses of any underlying Fidelity Central Funds.
H Expense ratios reflect operating expenses of the class. Expenses before reductions do not reflect amounts reimbursed by the investment adviser or reductions from brokerage service arrangements or reductions from other expense offset arrangements and do not represent the amount paid by the class during periods when reimbursements or reductions occur. Expense ratios before reductions for start-up periods may not be representative of longer-term operating periods. Expenses net of fee waivers reflect expenses after reimbursement by the investment adviser but prior to reductions from brokerage service arrangements or other expense offset arrangements. Expenses net of all reductions represent the net expenses paid by the class.
I Annualized
J Amount does not include the portfolio activity of any underlying Fidelity Central Funds.
K Amount not annualized.
See accompanying notes which are an integral part of the financial statements.
Fidelity Advisor Global Equity Income Fund Class T
| Years ended October 31, | 2015 | 2014 | 2013 | 2012 A |
| Selected Per–Share Data | | | | |
| Net asset value, beginning of period | $12.95 | $12.20 | $10.14 | $10.00 |
| Income from Investment Operations | | | | |
| Net investment income (loss)B | .09 | .21C | .16 | .08 |
| Net realized and unrealized gain (loss) | .24 | .91 | 2.06 | .15 |
| Total from investment operations | .33 | 1.12 | 2.22 | .23 |
| Distributions from net investment income | (.08) | (.19) | (.15) | (.09) |
| Distributions from net realized gain | (.71) | (.18) | (.01) | – |
| Total distributions | (.79) | (.37) | (.16) | (.09) |
| Net asset value, end of period | $12.49 | $12.95 | $12.20 | $10.14 |
| Total ReturnD,E,F | 2.59% | 9.34% | 22.11% | 2.31% |
| Ratios to Average Net AssetsG,H | | | | |
| Expenses before reductions | 2.73% | 2.96% | 4.80% | 7.68%I |
| Expenses net of fee waivers, if any | 1.70% | 1.70% | 1.70% | 1.70%I |
| Expenses net of all reductions | 1.69% | 1.70% | 1.68% | 1.69%I |
| Net investment income (loss) | .70% | 1.70%C | 1.41% | 1.64%I |
| Supplemental Data | | | | |
| Net assets, end of period (000 omitted) | $2,484 | $2,014 | $1,270 | $714 |
| Portfolio turnover rateJ | 87% | 112% | 78% | 36%K |
A For the period May 2, 2012 (commencement of operations) to October 31, 2012.
B Calculated based on average shares outstanding during the period.
C Investment income per share reflects a large, non-recurring dividend which amounted to $.09 per share. Excluding this non-recurring dividend, the ratio of net investment income (loss) to average net assets would have been 1.00%.
D Total returns for periods of less than one year are not annualized.
E Total returns would have been lower if certain expenses had not been reduced during the applicable periods shown.
F Total returns do not include the effect of the sales charges.
G Fees and expenses of any underlying Fidelity Central Funds are not included in the Fund's expense ratio. The Fund indirectly bears its proportionate share of the expenses of any underlying Fidelity Central Funds.
H Expense ratios reflect operating expenses of the class. Expenses before reductions do not reflect amounts reimbursed by the investment adviser or reductions from brokerage service arrangements or reductions from other expense offset arrangements and do not represent the amount paid by the class during periods when reimbursements or reductions occur. Expense ratios before reductions for start-up periods may not be representative of longer-term operating periods. Expenses net of fee waivers reflect expenses after reimbursement by the investment adviser but prior to reductions from brokerage service arrangements or other expense offset arrangements. Expenses net of all reductions represent the net expenses paid by the class.
I Annualized
J Amount does not include the portfolio activity of any underlying Fidelity Central Funds.
K Amount not annualized.
See accompanying notes which are an integral part of the financial statements.
Fidelity Advisor Global Equity Income Fund Class C
| Years ended October 31, | 2015 | 2014 | 2013 | 2012 A |
| Selected Per–Share Data | | | | |
| Net asset value, beginning of period | $12.93 | $12.18 | $10.14 | $10.00 |
| Income from Investment Operations | | | | |
| Net investment income (loss)B | .03 | .15C | .10 | .06 |
| Net realized and unrealized gain (loss) | .24 | .91 | 2.06 | .15 |
| Total from investment operations | .27 | 1.06 | 2.16 | .21 |
| Distributions from net investment income | (.05) | (.14) | (.11) | (.07) |
| Distributions from net realized gain | (.70) | (.17) | (.01) | – |
| Total distributions | (.74)D | (.31) | (.12) | (.07) |
| Net asset value, end of period | $12.46 | $12.93 | $12.18 | $10.14 |
| Total ReturnE,F,G | 2.10% | 8.83% | 21.40% | 2.12% |
| Ratios to Average Net AssetsH,I | | | | |
| Expenses before reductions | 3.23% | 3.43% | 5.26% | 8.19%J |
| Expenses net of fee waivers, if any | 2.20% | 2.20% | 2.20% | 2.20%J |
| Expenses net of all reductions | 2.19% | 2.20% | 2.18% | 2.19%J |
| Net investment income (loss) | .20% | 1.20%C | .91% | 1.14%J |
| Supplemental Data | | | | |
| Net assets, end of period (000 omitted) | $3,225 | $3,173 | $1,445 | $666 |
| Portfolio turnover rateK | 87% | 112% | 78% | 36%L |
A For the period May 2, 2012 (commencement of operations) to October 31, 2012.
B Calculated based on average shares outstanding during the period.
C Investment income per share reflects a large, non-recurring dividend which amounted to $.09 per share. Excluding this non-recurring dividend, the ratio of net investment income (loss) to average net assets would have been .50%.
D Total distributions of $.74 per share is comprised of distributions from net investment income of $.046 and distributions from net realized gain of $.695 per share.
E Total returns for periods of less than one year are not annualized.
F Total returns would have been lower if certain expenses had not been reduced during the applicable periods shown.
G Total returns do not include the effect of the contingent deferred sales charge.
H Fees and expenses of any underlying Fidelity Central Funds are not included in the Fund's expense ratio. The Fund indirectly bears its proportionate share of the expenses of any underlying Fidelity Central Funds.
I Expense ratios reflect operating expenses of the class. Expenses before reductions do not reflect amounts reimbursed by the investment adviser or reductions from brokerage service arrangements or reductions from other expense offset arrangements and do not represent the amount paid by the class during periods when reimbursements or reductions occur. Expense ratios before reductions for start-up periods may not be representative of longer-term operating periods. Expenses net of fee waivers reflect expenses after reimbursement by the investment adviser but prior to reductions from brokerage service arrangements or other expense offset arrangements. Expenses net of all reductions represent the net expenses paid by the class.
J Annualized
K Amount does not include the portfolio activity of any underlying Fidelity Central Funds.
L Amount not annualized.
See accompanying notes which are an integral part of the financial statements.
Fidelity Advisor Global Equity Income Fund Class I
| Years ended October 31, | 2015 | 2014 | 2013 | 2012 A |
| Selected Per–Share Data | | | | |
| Net asset value, beginning of period | $12.97 | $12.22 | $10.15 | $10.00 |
| Income from Investment Operations | | | | |
| Net investment income (loss)B | .15 | .28C | .21 | .10 |
| Net realized and unrealized gain (loss) | .24 | .90 | 2.07 | .16 |
| Total from investment operations | .39 | 1.18 | 2.28 | .26 |
| Distributions from net investment income | (.14) | (.25) | (.20) | (.11) |
| Distributions from net realized gain | (.71) | (.18) | (.01) | – |
| Total distributions | (.85) | (.43) | (.21) | (.11) |
| Net asset value, end of period | $12.51 | $12.97 | $12.22 | $10.15 |
| Total ReturnD,E | 3.09% | 9.86% | 22.71% | 2.61% |
| Ratios to Average Net AssetsF,G | | | | |
| Expenses before reductions | 2.11% | 2.35% | 4.46% | 7.23%H |
| Expenses net of fee waivers, if any | 1.20% | 1.20% | 1.20% | 1.20%H |
| Expenses net of all reductions | 1.19% | 1.20% | 1.18% | 1.19%H |
| Net investment income (loss) | 1.20% | 2.20%C | 1.91% | 2.14%H |
| Supplemental Data | | | | |
| Net assets, end of period (000 omitted) | $1,167 | $1,334 | $1,231 | $939 |
| Portfolio turnover rateI | 87% | 112% | 78% | 36%J |
A For the period May 2, 2012 (commencement of operations) to October 31, 2012.
B Calculated based on average shares outstanding during the period.
C Investment income per share reflects a large, non-recurring dividend which amounted to $.09 per share. Excluding this non-recurring dividend, the ratio of net investment income (loss) to average net assets would have been 1.50%.
D Total returns for periods of less than one year are not annualized.
E Total returns would have been lower if certain expenses had not been reduced during the applicable periods shown.
F Fees and expenses of any underlying Fidelity Central Funds are not included in the Fund's expense ratio. The Fund indirectly bears its proportionate share of the expenses of any underlying Fidelity Central Funds.
G Expense ratios reflect operating expenses of the class. Expenses before reductions do not reflect amounts reimbursed by the investment adviser or reductions from brokerage service arrangements or reductions from other expense offset arrangements and do not represent the amount paid by the class during periods when reimbursements or reductions occur. Expense ratios before reductions for start-up periods may not be representative of longer-term operating periods. Expenses net of fee waivers reflect expenses after reimbursement by the investment adviser but prior to reductions from brokerage service arrangements or other expense offset arrangements. Expenses net of all reductions represent the net expenses paid by the class.
H Annualized
I Amount does not include the portfolio activity of any underlying Fidelity Central Funds.
J Amount not annualized.
See accompanying notes which are an integral part of the financial statements.
Notes to Financial Statements
For the period ended October 31, 2015
1. Organization.
Fidelity Advisor Global Equity Income Fund (the Fund) is a fund of Fidelity Advisor Series VIII (the Trust) and is authorized to issue an unlimited number of shares. The Trust is registered under the Investment Company Act of 1940, as amended (the 1940 Act), as an open-end management investment company organized as a Massachusetts business trust. The Fund offers Class A, Class T, Class C and Class I (formerly Institutional Class) shares, each of which has equal rights as to assets and voting privileges. Each class has exclusive voting rights with respect to matters that affect that class.
2. Investments in Fidelity Central Funds.
The Fund invests in Fidelity Central Funds, which are open-end investment companies generally available only to other investment companies and accounts managed by the investment adviser and its affiliates. The Fund's Schedule of Investments lists each of the Fidelity Central Funds held as of period end, if any, as an investment of the Fund, but does not include the underlying holdings of each Fidelity Central Fund. As an Investing Fund, the Fund indirectly bears its proportionate share of the expenses of the underlying Fidelity Central Funds.
The Money Market Central Funds seek preservation of capital and current income and are managed by Fidelity Investments Money Management, Inc. (FIMM), an affiliate of the investment adviser. Annualized expenses of the Money Market Central Funds as of their most recent shareholder report date are less than .005%.
A complete unaudited list of holdings for each Fidelity Central Fund is available upon request or at the Securities and Exchange Commission (the SEC) website at www.sec.gov. In addition, the financial statements of the Fidelity Central Funds, which are not covered by the Fund's Report of Independent Registered Public Accounting Firm, are available on the SEC website or upon request.
3. Significant Accounting Policies.
The financial statements have been prepared in conformity with accounting principles generally accepted in the United States of America (GAAP), which require management to make certain estimates and assumptions at the date of the financial statements. Actual results could differ from those estimates. Subsequent events, if any, through the date that the financial statements were issued have been evaluated in the preparation of the financial statements. The following summarizes the significant accounting policies of the Fund:
Investment Valuation. Investments are valued as of 4:00 p.m. Eastern time on the last calendar day of the period. The Board of Trustees (the Board) has delegated the day to day responsibility for the valuation of the Fund's investments to the Fidelity Management & Research Company (FMR) Fair Value Committee (the Committee). In accordance with valuation policies and procedures approved by the Board, the Fund attempts to obtain prices from one or more third party pricing vendors or brokers to value its investments. When current market prices, quotations or currency exchange rates are not readily available or reliable, investments will be fair valued in good faith by the Committee, in accordance with procedures adopted by the Board. Factors used in determining fair value vary by investment type and may include market or investment specific events, changes in interest rates and credit quality. The frequency with which these procedures are used cannot be predicted and they may be utilized to a significant extent. The Committee oversees the Fund's valuation policies and procedures and reports to the Board on the Committee's activities and fair value determinations. The Board monitors the appropriateness of the procedures used in valuing the Fund's investments and ratifies the fair value determinations of the Committee.
The Fund categorizes the inputs to valuation techniques used to value its investments into a disclosure hierarchy consisting of three levels as shown below:
- Level 1 – quoted prices in active markets for identical investments
- Level 2 – other significant observable inputs (including quoted prices for similar investments, interest rates, prepayment speeds, etc.)
- Level 3 – unobservable inputs (including the Fund's own assumptions based on the best information available)
Valuation techniques used to value the Fund's investments by major category are as follows:
Equity securities, including restricted securities, for which market quotations are readily available, are valued at the last reported sale price or official closing price as reported by a third party pricing vendor on the primary market or exchange on which they are traded and are categorized as Level 1 in the hierarchy. In the event there were no sales during the day or closing prices are not available, securities are valued at the last quoted bid price or may be valued using the last available price and are generally categorized as Level 2 in the hierarchy. For foreign equity securities, when market or security specific events arise, comparisons to the valuation of American Depositary Receipts (ADRs), futures contracts, Exchange-Traded Funds (ETFs) and certain indexes as well as quoted prices for similar securities may be used and would be categorized as Level 2 in the hierarchy. Utilizing these techniques may result in transfers between Level 1 and Level 2. For equity securities, including restricted securities, where observable inputs are limited, assumptions about market activity and risk are used and these securities may be categorized as Level 3 in the hierarchy.
Debt securities, including restricted securities, are valued based on evaluated prices received from third party pricing vendors or from brokers who make markets in such securities. Corporate bonds are valued by pricing vendors who utilize matrix pricing which considers yield or price of bonds of comparable quality, coupon, maturity and type or by broker-supplied prices. When independent prices are unavailable or unreliable, debt securities may be valued utilizing pricing methodologies which consider similar factors that would be used by third party pricing vendors. Debt securities are generally categorized as Level 2 in the hierarchy but may be Level 3 depending on the circumstances.
Investments in open-end mutual funds, including the Fidelity Central Funds, are valued at their closing net asset value (NAV) each business day and are categorized as Level 1 in the hierarchy.
Changes in valuation techniques may result in transfers in or out of an assigned level within the disclosure hierarchy. The aggregate value of investments by input level as of October 31, 2015 is included at the end of the Fund's Schedule of Investments.
Foreign Currency. The Fund may use foreign currency contracts to facilitate transactions in foreign-denominated securities. Gains and losses from these transactions may arise from changes in the value of the foreign currency or if the counterparties do not perform under the contracts' terms.
Foreign-denominated assets, including investment securities, and liabilities are translated into U.S. dollars at the exchange rates at period end. Purchases and sales of investment securities, income and dividends received and expenses denominated in foreign currencies are translated into U.S. dollars at the exchange rate in effect on the transaction date.
The effects of exchange rate fluctuations on investments are included with the net realized and unrealized gain (loss) on investment securities. Other foreign currency transactions resulting in realized and unrealized gain (loss) are disclosed separately.
Investment Transactions and Income. For financial reporting purposes, the Fund's investment holdings and NAV include trades executed through the end of the last business day of the period. The NAV per share for processing shareholder transactions is calculated as of the close of business of the New York Stock Exchange (NYSE), normally 4:00 p.m. Eastern time and includes trades executed through the end of the prior business day. Gains and losses on securities sold are determined on the basis of identified cost. Dividend income is recorded on the ex-dividend date, except for certain dividends from foreign securities where the ex-dividend date may have passed, which are recorded as soon as the Fund is informed of the ex-dividend date. Non-cash dividends included in dividend income, if any, are recorded at the fair market value of the securities received. Income and capital gain distributions from Fidelity Central Funds, if any, are recorded on the ex-dividend date. Distributions received on securities that represent a return of capital or capital gain are recorded as a reduction of cost of investments and/or as a realized gain. Subsequent to ex-dividend date the Fund determines the components of these distributions, based upon receipt of tax filings or other correspondence relating to the underlying investment. Interest income is accrued as earned and includes coupon interest and amortization of premium and accretion of discount on debt securities as applicable. Investment income is recorded net of foreign taxes withheld where recovery of such taxes is uncertain.
Class Allocations and Expenses. Investment income, realized and unrealized capital gains and losses, common expenses of the Fund, and certain fund-level expense reductions, if any, are allocated daily on a pro-rata basis to each class based on the relative net assets of each class to the total net assets of the Fund. Each class differs with respect to transfer agent and distribution and service plan fees incurred. Certain expense reductions may also differ by class. For the reporting period, the allocated portion of income and expenses to each class as a percent of its average net assets may vary due to the timing of recording these transactions in relation to fluctuating net assets of the classes. Expenses directly attributable to a fund are charged to that fund. Expenses attributable to more than one fund are allocated among the respective funds on the basis of relative net assets or other appropriate methods. Expense estimates are accrued in the period to which they relate and adjustments are made when actual amounts are known.
Income Tax Information and Distributions to Shareholders. Each year, the Fund intends to qualify as a regulated investment company under Subchapter M of the Internal Revenue Code, including distributing substantially all of its taxable income and realized gains. As a result, no provision for U.S. Federal income taxes is required. As of October 31, 2015, the Fund did not have any unrecognized tax benefits in the financial statements; nor is the Fund aware of any tax positions for which it is reasonably possible that the total amounts of unrecognized tax benefits will significantly change in the next twelve months. The Fund files a U.S. federal tax return, in addition to state and local tax returns as required. The Fund's federal income tax returns are subject to examination by the Internal Revenue Service (IRS) for a period of three fiscal years after they are filed. State and local tax returns may be subject to examination for an additional fiscal year depending on the jurisdiction. Foreign taxes are provided for based on the Fund's understanding of the tax rules and rates that exist in the foreign markets in which it invests.
Distributions are declared and recorded on the ex-dividend date. Income dividends and capital gain distributions are declared separately for each class. Income and capital gain distributions are determined in accordance with income tax regulations, which may differ from GAAP. In addition, the Fund claimed a portion of the payment made to redeeming shareholders as a distribution for income tax purposes.
Capital accounts within the financial statements are adjusted for permanent book-tax differences. These adjustments have no impact on net assets or the results of operations. Capital accounts are not adjusted for temporary book-tax differences which will reverse in a subsequent period.
Book-tax differences are primarily due to foreign currency transactions, passive foreign investment companies (PFIC), partnerships, and losses deferred due to wash sales.
The federal tax cost of investment securities and unrealized appreciation (depreciation) as of period end were as follows:
| Gross unrealized appreciation | $1,205,766 |
| Gross unrealized depreciation | (490,189) |
| Net unrealized appreciation (depreciation) on securities | $715,577 |
| Tax Cost | $10,762,886 |
The tax-based components of distributable earnings as of period end were as follows:
| Undistributed ordinary income | $10,220 |
| Undistributed long-term capital gain | $150,625 |
| Net unrealized appreciation (depreciation) on securities and other investments | $715,104 |
The tax character of distributions paid was as follows:
| | October 31, 2015 | October 31, 2014 |
| Ordinary Income | $238,473 | $ 169,657 |
| Long-term Capital Gains | 415,433 | 71,624 |
| Total | $653,906 | $ 241,281 |
4. Purchases and Sales of Investments.
Purchases and sales of securities, other than short-term securities, aggregated $9,830,677 and $9,068,215, respectively.
5. Fees and Other Transactions with Affiliates.
Management Fee. Fidelity Management & Research Company (the investment adviser) and its affiliates provide the Fund with investment management related services for which the Fund pays a monthly management fee. The management fee is the sum of an individual fund fee rate that is based on an annual rate of .45% of the Fund's average net assets and an annualized group fee rate that averaged .25% during the period. The group fee rate is based upon the average net assets of all the mutual funds advised by the investment adviser, including any mutual funds previously advised by the investment adviser that are currently advised by Fidelity SelectCo, LLC, an affiliate of the investment adviser. The group fee rate decreases as assets under management increase and increases as assets under management decrease. For the reporting period, the total annual management fee rate was .70% of the Fund's average net assets.
Distribution and Service Plan Fees. In accordance with Rule 12b-1 of the 1940 Act, the Fund has adopted separate Distribution and Service Plans for each class of shares. Certain classes pay Fidelity Distributors Corporation (FDC), an affiliate of the investment adviser, separate Distribution and Service Fees, each of which is based on an annual percentage of each class' average net assets. In addition, FDC may pay financial intermediaries for selling shares of the Fund and providing shareholder support services. For the period, the Distribution and Service Fee rates, total fees and amounts retained by FDC were as follows:
| | Distribution
Fee | Service
Fee | Total Fees | Retained
by FDC |
| Class A | -% | .25% | $10,490 | $1,367 |
| Class T | .25% | .25% | 11,314 | 2,413 |
| Class C | .75% | .25% | 32,552 | 32,552 |
| | | | $54,356 | $36,332 |
Sales Load. FDC may receive a front-end sales charge of up to 5.75% for selling Class A shares and 3.50% for selling Class T shares, some of which is paid to financial intermediaries for selling shares of the Fund. Depending on the holding period, FDC may receive contingent deferred sales charges levied on Class A, Class T, and Class C redemptions. The deferred sales charges range from 1.00% for Class C shares, 1.00% for certain purchases of Class A shares and .25% for certain purchases of Class T shares.
For the period, sales charge amounts retained by FDC were as follows:
| | Retained
by FDC |
| Class A | $6,457 |
| Class T | 1,919 |
| Class C(a) | 242 |
| | $8,618 |
(a) When Class C shares are initially sold, FDC pays commissions from its own resources to financial intermediaries through which the sales are made.
Transfer Agent Fees. Fidelity Investments Institutional Operations Company, Inc., (FIIOC), an affiliate of the investment adviser, is the transfer, dividend disbursing and shareholder servicing agent for each class of the Fund. FIIOC receives account fees and asset-based fees that vary according to the account size and type of account of the shareholders of the respective classes of the Fund. FIIOC pays for typesetting, printing and mailing of shareholder reports, except proxy statements.
For the period, transfer agent fees for each class were as follows:
| | Amount | % of
Class-Level Average
Net Assets |
| Class A | $10,876 | .26 |
| Class T | 6,908 | .30 |
| Class C | 9,791 | .30 |
| Class I | 1,641 | .13 |
| | $ 29,216 | |
Accounting Fees. Fidelity Service Company, Inc. (FSC), an affiliate of the investment adviser, maintains the Fund's accounting records. The fee is based on the level of average net assets for each month.
Brokerage Commissions. The Fund placed a portion of its portfolio transactions with brokerage firms which are affiliates of the investment adviser. Brokerage commissions are included in net realized gain (loss) and change in net unrealized appreciation (depreciation) in the Statement of Operations. The commissions paid to these affiliated firms were $79 for the period.
6. Committed Line of Credit.
The Fund participates with other funds managed by the investment adviser or an affiliate in a $4.25 billion credit facility (the "line of credit") to be utilized for temporary or emergency purposes to fund shareholder redemptions or for other short-term liquidity purposes. The Fund has agreed to pay commitment fees on its pro-rata portion of the line of credit, which amounted to $16 and is reflected in Miscellaneous expenses on the Statement of Operations. During the period, the Fund did not borrow on this line of credit.
7. Expense Reductions.
The investment adviser contractually agreed to reimburse each class to the extent annual operating expenses exceeded certain levels of average net assets as noted in the table below. This reimbursement will remain in place through December 31, 2016. Some expenses, for example interest expense, including commitment fees, are excluded from this reimbursement.
The following classes were in reimbursement during the period:
| | Expense
Limitations | Reimbursement |
| Class A | 1.45% | $40,955 |
| Class T | 1.70% | 23,369 |
| Class C | 2.20% | 33,631 |
| Class I | 1.20% | 11,535 |
| | | $109,490 |
Commissions paid to certain brokers with whom the investment adviser, or its affiliates, places trades on behalf of the Fund include an amount in addition to trade execution, which may be rebated back to the Fund to offset certain expenses. This amount totaled $945 for the period. In addition, through arrangements with the Fund's custodian, credits realized as a result of certain uninvested cash balances were used to reduce the Fund's expenses. During the period, these credits reduced the Fund's expenses by $10.
In addition, during the period the investment adviser reimbursed and/or waived a portion of fund-level operating expenses in the amount of $46 and a portion of class-level operating expenses as follows:
| | Amount |
| Class A | $68 |
| Class T | 38 |
| Class C | 54 |
| Class I | 29 |
| | $189 |
8. Distributions to Shareholders.
Distributions to shareholders of each class were as follows:
| Years ended October 31, | 2015 | 2014 |
| From net investment income | | |
| Class A | $37,903 | $59,134 |
| Class T | 15,415 | 28,554 |
| Class C | 12,164 | 29,949 |
| Class I | 14,278 | 25,909 |
| Total | $79,760 | $143,546 |
| From net realized gain | | |
| Class A | $222,759 | $37,020 |
| Class T | 109,345 | 20,549 |
| Class C | 168,198 | 22,043 |
| Class I | 73,844 | 18,123 |
| Total | $574,146 | $97,735 |
9. Share Transactions.
Share transactions for each class were as follows and may contain automatic conversions between classes or exchanges between funds:
| | Shares | Shares | Dollars | Dollars |
| Years ended October 31, | 2015 | 2014 | 2015 | 2014 |
| Class A | | | | |
| Shares sold | 172,016 | 196,535 | $2,191,371 | $2,476,199 |
| Reinvestment of distributions | 19,779 | 7,392 | 247,241 | 92,391 |
| Shares redeemed | (138,207) | (66,552) | (1,716,684) | (854,492) |
| Net increase (decrease) | 53,588 | 137,375 | $721,928 | $1,714,098 |
| Class T | | | | |
| Shares sold | 93,137 | 95,686 | $1,178,554 | $1,188,546 |
| Reinvestment of distributions | 9,968 | 3,827 | 124,661 | 47,754 |
| Shares redeemed | (59,695) | (48,139) | (748,248) | (610,330) |
| Net increase (decrease) | 43,410 | 51,374 | $554,967 | $625,970 |
| Class C | | | | |
| Shares sold | 120,269 | 179,385 | $1,517,646 | $2,234,467 |
| Reinvestment of distributions | 14,053 | 3,965 | 175,518 | 49,411 |
| Shares redeemed | (120,843) | (56,526) | (1,499,976) | (715,924) |
| Net increase (decrease) | 13,479 | 126,824 | $193,188 | $1,567,954 |
| Class I | | | | |
| Shares sold | 25,924 | 9,677 | $328,076 | $123,415 |
| Reinvestment of distributions | 6,890 | 3,513 | 86,194 | 43,809 |
| Shares redeemed | (42,440) | (11,104) | (533,556) | (142,306) |
| Net increase (decrease) | (9,626) | 2,086 | $(119,286) | $24,918 |
10. Other.
The Fund's organizational documents provide former and current trustees and officers with a limited indemnification against liabilities arising in connection with the performance of their duties to the Fund. In the normal course of business, the Fund may also enter into contracts that provide general indemnifications. The Fund's maximum exposure under these arrangements is unknown as this would be dependent on future claims that may be made against the Fund. The risk of material loss from such claims is considered remote.
Report of Independent Registered Public Accounting Firm
To the Trustees of Fidelity Advisor Series VIII and Shareholders of Fidelity Advisor® Global Equity Income Fund:
In our opinion, the accompanying statement of assets and liabilities, including the schedule of investments, and the related statements of operations and of changes in net assets and the financial highlights present fairly, in all material respects, the financial position of Fidelity Advisor® Global Equity Income Fund (a fund of Fidelity Advisor Series VIII) at October 31, 2015, the results of its operations for the year then ended, the changes in its net assets for each of the two years in the period then ended and the financial highlights for each of the periods indicated, in conformity with accounting principles generally accepted in the United States of America. These financial statements and financial highlights (hereafter referred to as “financial statements”) are the responsibility of the Fidelity Advisor® Global Equity Income Fund’s management. Our responsibility is to express an opinion on these financial statements based on our audits. We conducted our audits of these financial statements in accordance with the standards of the Public Company Accounting Oversight Board (United States). Those standards require that we plan and perform the audit to obtain reasonable assurance about whether the financial statements are free of material misstatement. An audit includes examining, on a test basis, evidence supporting the amounts and disclosures in the financial statements, assessing the accounting principles used and significant estimates made by management, and evaluating the overall financial statement presentation. We believe that our audits, which included confirmation of securities at October 31, 2015 by correspondence with the custodian and brokers, provide a reasonable basis for our opinion.
PricewaterhouseCoopers LLP
Boston, Massachusetts
December 21, 2015
Trustees and Officers
The Trustees, Members of the Advisory Board (if any), and officers of the trust and fund, as applicable, are listed below. The Board of Trustees governs the fund and is responsible for protecting the interests of shareholders. The Trustees are experienced executives who meet periodically throughout the year to oversee the fund's activities, review contractual arrangements with companies that provide services to the fund, oversee management of the risks associated with such activities and contractual arrangements, and review the fund's performance. Each of the Trustees oversees 170 funds.
The Trustees hold office without limit in time except that (a) any Trustee may resign; (b) any Trustee may be removed by written instrument, signed by at least two-thirds of the number of Trustees prior to such removal; (c) any Trustee who requests to be retired or who has become incapacitated by illness or injury may be retired by written instrument signed by a majority of the other Trustees; and (d) any Trustee may be removed at any special meeting of shareholders by a two-thirds vote of the outstanding voting securities of the trust. Each Trustee who is not an interested person (as defined in the 1940 Act) of the trust and the fund is referred to herein as an Independent Trustee. Each Independent Trustee shall retire not later than the last day of the calendar year in which his or her 75th birthday occurs. The Independent Trustees may waive this mandatory retirement age policy with respect to individual Trustees. Officers and Advisory Board Members hold office without limit in time, except that any officer or Advisory Board Member may resign or may be removed by a vote of a majority of the Trustees at any regular meeting or any special meeting of the Trustees. Except as indicated, each individual has held the office shown or other offices in the same company for the past five years.
The fund’s Statement of Additional Information (SAI) includes more information about the Trustees. To request a free copy, call Fidelity at 1-877-208-0098.
Experience, Skills, Attributes, and Qualifications of the Trustees. The Governance and Nominating Committee has adopted a statement of policy that describes the experience, qualifications, attributes, and skills that are necessary and desirable for potential Independent Trustee candidates (Statement of Policy). The Board believes that each Trustee satisfied at the time he or she was initially elected or appointed a Trustee, and continues to satisfy, the standards contemplated by the Statement of Policy. The Governance and Nominating Committee also engages professional search firms to help identify potential Independent Trustee candidates who have the experience, qualifications, attributes, and skills consistent with the Statement of Policy. From time to time, additional criteria based on the composition and skills of the current Independent Trustees, as well as experience or skills that may be appropriate in light of future changes to board composition, business conditions, and regulatory or other developments, have also been considered by the professional search firms and the Governance and Nominating Committee. In addition, the Board takes into account the Trustees' commitment and participation in Board and committee meetings, as well as their leadership of standing and ad hoc committees throughout their tenure.
In determining that a particular Trustee was and continues to be qualified to serve as a Trustee, the Board has considered a variety of criteria, none of which, in isolation, was controlling. The Board believes that, collectively, the Trustees have balanced and diverse experience, qualifications, attributes, and skills, which allow the Board to operate effectively in governing the fund and protecting the interests of shareholders. Information about the specific experience, skills, attributes, and qualifications of each Trustee, which in each case led to the Board's conclusion that the Trustee should serve (or continue to serve) as a trustee of the fund, is provided below.
Board Structure and Oversight Function. James C. Curvey is an interested person and currently serves as Chairman. The Trustees have determined that an interested Chairman is appropriate and benefits shareholders because an interested Chairman has a personal and professional stake in the quality and continuity of services provided to the fund. Independent Trustees exercise their informed business judgment to appoint an individual of their choosing to serve as Chairman, regardless of whether the Trustee happens to be independent or a member of management. The Independent Trustees have determined that they can act independently and effectively without having an Independent Trustee serve as Chairman and that a key structural component for assuring that they are in a position to do so is for the Independent Trustees to constitute a substantial majority for the Board. The Independent Trustees also regularly meet in executive session. Ned C. Lautenbach serves as Chairman of the Independent Trustees and as such (i) acts as a liaison between the Independent Trustees and management with respect to matters important to the Independent Trustees and (ii) with management prepares agendas for Board meetings.
Fidelity® funds are overseen by different Boards of Trustees. The fund's Board oversees Fidelity's high income and certain equity funds, and other Boards oversee Fidelity's investment-grade bond, money market, asset allocation, and sector funds. The asset allocation funds may invest in Fidelity® funds overseen by the fund's Board. The use of separate Boards, each with its own committee structure, allows the Trustees of each group of Fidelity® funds to focus on the unique issues of the funds they oversee, including common research, investment, and operational issues. On occasion, the separate Boards establish joint committees to address issues of overlapping consequences for the Fidelity® funds overseen by each Board.
The Trustees operate using a system of committees to facilitate the timely and efficient consideration of all matters of importance to the Trustees, the fund, and fund shareholders and to facilitate compliance with legal and regulatory requirements and oversight of the fund's activities and associated risks. The Board, acting through its committees, has charged FMR and its affiliates with (i) identifying events or circumstances the occurrence of which could have demonstrably adverse effects on the fund's business and/or reputation; (ii) implementing processes and controls to lessen the possibility that such events or circumstances occur or to mitigate the effects of such events or circumstances if they do occur; and (iii) creating and maintaining a system designed to evaluate continuously business and market conditions in order to facilitate the identification and implementation processes described in (i) and (ii) above. Because the day-to-day operations and activities of the fund are carried out by or through FMR, its affiliates, and other service providers, the fund's exposure to risks is mitigated but not eliminated by the processes overseen by the Trustees. While each of the Board's committees has responsibility for overseeing different aspects of the fund's activities, oversight is exercised primarily through the Operations, Audit, and Compliance Committees. In addition, the Independent Trustees have worked with FMR to enhance the Board's oversight of investment and financial risks, legal and regulatory risks, technology risks, and operational risks, including the development of additional risk reporting to the Board. For example, a working group comprised of Independent Trustees and FMR has worked and continues to work to review the Fidelity® funds' valuation-related activities, reporting and risk management. Appropriate personnel, including but not limited to the fund's Chief Compliance Officer (CCO), FMR's internal auditor, the independent accountants, the fund's Treasurer and portfolio management personnel, make periodic reports to the Board's committees, as appropriate, including an annual review of Fidelity's risk management program for the Fidelity® funds. The responsibilities of each standing committee, including their oversight responsibilities, are described further under "Standing Committees of the Trustees."
Interested Trustees*:
Correspondence intended for a Trustee who is an interested person may be sent to Fidelity Investments, 245 Summer Street, Boston, Massachusetts 02210.
Name, Year of Birth; Principal Occupations and Other Relevant Experience+
James C. Curvey (1935)
Year of Election or Appointment: 2007
Trustee
Chairman of the Board of Trustees
Mr. Curvey also serves as Trustee of other Fidelity® funds. Mr. Curvey is a Director of Fidelity Research & Analysis Co. (investment adviser firm, 2009-present), and Vice Chairman (2007-present) and Director of FMR LLC (diversified financial services company). In addition, Mr. Curvey serves as an Overseer for the Boston Symphony Orchestra and a member of the board of Artis-Naples, Naples, Florida, and as a Trustee for Brewster Academy, Wolfeboro, New Hampshire. Previously, Mr. Curvey served as a Director of Fidelity Investments Money Management, Inc. (investment adviser firm, 2009-2014) and a Director of FMR and FMR Co., Inc. (investment adviser firms, 2007-2014).
Charles S. Morrison (1960)
Year of Election or Appointment: 2014
Trustee
Mr. Morrison also serves as Trustee of other funds. He serves as a Director of Fidelity Investments Money Management, Inc. (FIMM) (investment adviser firm, 2014-present), Director of Fidelity SelectCo, LLC (investment adviser firm, 2014-present), President, Asset Management (2014-present), and is an employee of Fidelity Investments. Previously, Mr. Morrison served as Vice President of Fidelity's Fixed Income and Asset Allocation Funds (2012-2014), President, Fixed Income (2011-2014), Vice President of Fidelity's Money Market Funds (2005-2009), President, Money Market Group Leader of FMR (investment adviser firm, 2009), and Senior Vice President, Money Market Group of FMR (2004-2009). Mr. Morrison also served as Vice President of Fidelity's Bond Funds (2002-2005), certain Balanced Funds (2002-2005), and certain Asset Allocation Funds (2002-2007), and as Senior Vice President (2002-2005) of Fidelity's Bond Division.
* Determined to be an “Interested Trustee” by virtue of, among other things, his or her affiliation with the trust or various entities under common control with FMR.
+ The information includes the Trustee's principal occupation during the last five years and other information relating to the experience, attributes, and skills relevant to the Trustee's qualifications to serve as a Trustee, which led to the conclusion that the Trustee should serve as a Trustee for the fund.
Independent Trustees:
Correspondence intended for an Independent Trustee may be sent to Fidelity Investments, P.O. Box 55235, Boston, Massachusetts 02205-5235.
Name, Year of Birth; Principal Occupations and Other Relevant Experience+
Dennis J. Dirks (1948)
Year of Election or Appointment: 2005
Trustee
Mr. Dirks also serves as Trustee of other Fidelity® funds. Prior to his retirement in May 2003, Mr. Dirks was Chief Operating Officer and a member of the Board of The Depository Trust & Clearing Corporation (DTCC). He also served as President, Chief Operating Officer, and Board member of The Depository Trust Company (DTC) and President and Board member of the National Securities Clearing Corporation (NSCC). In addition, Mr. Dirks served as Chief Executive Officer and Board member of the Government Securities Clearing Corporation, Chief Executive Officer and Board member of the Mortgage-Backed Securities Clearing Corporation, as a Trustee and a member of the Finance Committee of Manhattan College (2005-2008), as a Trustee and a member of the Finance Committee of AHRC of Nassau County (2006-2008), and as a member of the Independent Directors Council (IDC) Governing Council (2010-2015). Mr. Dirks is a member of the Board of Directors for The Brookville Center for Children's Services, Inc. (2009-present).
Alan J. Lacy (1953)
Year of Election or Appointment: 2008
Trustee
Mr. Lacy also serves as Trustee of other Fidelity® funds. Mr. Lacy serves as a member of the Board of Directors of Dave & Buster's Entertainment, Inc. (restaurant and entertainment complexes, 2010-present) and Bristol-Myers Squibb Company (global pharmaceuticals, 2008-present). In addition, Mr. Lacy served as Senior Adviser (2007-2014) of Oak Hill Capital Partners, L.P. (private equity) and also served as Chief Executive Officer (2000-2005) and Vice Chairman (2005-2006) of Sears Holdings Corporation and Sears, Roebuck and Co. (retail). Mr. Lacy is a member of the Board of Trustees of The National Parks Conservation Association (2006-present). Previously, Mr. Lacy served as Chairman of the Board of Trustees of the National Parks Conservation Association (2008-2011) and as a member of the Board of Directors for The Western Union Company (global money transfer, 2006-2011), The Hillman Companies, Inc. (hardware wholesalers, 2010-2014), and Earth Fare, Inc. (retail grocery, 2010-2014).
Ned C. Lautenbach (1944)
Year of Election or Appointment: 2000
Trustee
Chairman of the Independent Trustees
Mr. Lautenbach also serves as Trustee of other Fidelity® funds. Mr. Lautenbach currently serves as the Lead Director of the Eaton Corporation Board of Directors (diversified industrial, 1997-present). Mr. Lautenbach is Chairman of the Board of Directors of Artis-Naples in Naples, Florida (2012-present), a member of the Council on Foreign Relations (1994-present), and a member of the Board of Governors, State University System of Florida (2013-present). Previously, Mr. Lautenbach was a Partner/Advisory Partner at Clayton, Dubilier & Rice, LLC (private equity investment, 1998-2010), as well as a Director of Sony Corporation (2006-2007).
Joseph Mauriello (1944)
Year of Election or Appointment: 2008
Trustee
Mr. Mauriello also serves as Trustee of other Fidelity® funds. Prior to his retirement in January 2006, Mr. Mauriello served in numerous senior management positions including Deputy Chairman and Chief Operating Officer (2004-2005), and Vice Chairman of Financial Services (2002-2004) of KPMG LLP US (professional services, 1965-2005). Mr. Mauriello currently serves as a member of the Board of Directors of XL Group plc. (global insurance and re-insurance, 2006-present) and the Independent Directors Council (IDC) Governing Council (2015-present). Previously, Mr. Mauriello served as a Director of the Hamilton Funds of the Bank of New York (2006-2007) and of Arcadia Resources Inc. (health care services and products, 2007-2012).
Robert W. Selander (1950)
Year of Election or Appointment: 2011
Trustee
Mr. Selander also serves as Trustee of other Fidelity® funds. Mr. Selander serves as a Director of The Western Union Company (global money transfer, 2014-present). Previously, Mr. Selander served as a Member of the Advisory Board of other Fidelity® funds (2011), and Executive Vice Chairman (2010), Chief Executive Officer (2009-2010), and President and Chief Executive Officer (1997-2009) of Mastercard, Inc.
Cornelia M. Small (1944)
Year of Election or Appointment: 2005
Trustee
Ms. Small also serves as Trustee of other Fidelity® funds. Ms. Small is a member of the Board of Directors (2009-present) and Chair of the Investment Committee (2010-present) of the Teagle Foundation. Ms. Small also serves on the Investment Committee of the Berkshire Taconic Community Foundation (2008-present). Previously, Ms. Small served as Chairperson (2002-2008) and a member of the Investment Committee and Chairperson (2008-2012) and a member of the Board of Trustees of Smith College. In addition, Ms. Small served as Chief Investment Officer, Director of Global Equity Investments, and a member of the Board of Directors of Scudder, Stevens & Clark and Scudder Kemper Investments.
William S. Stavropoulos (1939)
Year of Election or Appointment: 2001
Trustee
Vice Chairman of the Independent Trustees
Mr. Stavropoulos also serves as Trustee of other Fidelity® funds. Mr. Stavropoulos serves as President and Founder of the Michigan Baseball Foundation, the Great Lakes Loons (2007-present). Mr. Stavropoulos is Chairman Emeritus of the Board of Directors of The Dow Chemical Company, where he previously served in numerous senior management positions, including President, CEO (1995-2000; 2002-2004), Chairman of the Executive Committee (2000-2006), and as a member of the Board of Directors (1990-2006). Currently, Mr. Stavropoulos is Chairman of the Board of Directors of Univar Inc. (global distributor of commodity and specialty chemicals), a Director of Teradata Corporation (data warehousing and technology solutions), and Maersk Inc. (industrial conglomerate), and a member of the Advisory Board for Metalmark Capital LLC (private equity investment, 2005-present). Mr. Stavropoulos is an operating advisor to Clayton, Dubilier & Rice, LLC (private equity investment). In addition, Mr. Stavropoulos is a member of the University of Notre Dame Advisory Council for the College of Science, a Trustee of the Rollin L. Gerstacker Foundation, and a Director of the Naples Philharmonic Center for the Arts. Previously, Mr. Stavropoulos served as a Director of Chemical Financial Corporation (bank holding company, 1993-2012) and Tyco International, Ltd. (multinational manufacturing and services, 2007-2012).
David M. Thomas (1949)
Year of Election or Appointment: 2008
Trustee
Mr. Thomas also serves as Trustee of other Fidelity® funds. Mr. Thomas serves as Non-Executive Chairman of the Board of Directors of Fortune Brands Home and Security (home and security products, 2011-present), as a member of the Board of Directors (2004-present) and Presiding Director (2013-present) of Interpublic Group of Companies, Inc. (marketing communication), and as a member of the Board of Trustees of the University of Florida (2013-present). Previously, Mr. Thomas served as Executive Chairman (2005-2006) and Chairman and Chief Executive Officer (2000-2005) of IMS Health, Inc. (pharmaceutical and healthcare information solutions), and a Director of Fortune Brands, Inc. (consumer products, 2000-2011).
+ The information includes the Trustee's principal occupation during the last five years and other information relating to the experience, attributes, and skills relevant to the Trustee's qualifications to serve as a Trustee, which led to the conclusion that the Trustee should serve as a Trustee for the fund.
Advisory Board Members and Officers:
Correspondence intended for an officer or Peter S. Lynch may be sent to Fidelity Investments, 245 Summer Street, Boston, Massachusetts 02210. Officers appear below in alphabetical order.
Name, Year of Birth; Principal Occupation
Peter S. Lynch (1944)
Year of Election or Appointment: 2003
Member of the Advisory Board
Mr. Lynch also serves as Member of the Advisory Board of other Fidelity® funds. Mr. Lynch is Vice Chairman and a Director of FMR (investment adviser firm) and FMR Co., Inc. (investment adviser firm). In addition, Mr. Lynch serves as a Trustee of Boston College and as the Chairman of the Inner-City Scholarship Fund. Previously, Mr. Lynch served on the Special Olympics International Board of Directors (1997-2006).
Elizabeth Paige Baumann (1968)
Year of Election or Appointment: 2012
Anti-Money Laundering (AML) Officer
Ms. Baumann also serves as AML Officer of other funds. She is Chief AML Officer of FMR LLC (diversified financial services company, 2012-present) and is an employee of Fidelity Investments. Previously, Ms. Baumann served as Vice President and Deputy Anti-Money Laundering Officer (2007-2012).
Marc R. Bryant (1966)
Year of Election or Appointment: 2015
Secretary and Chief Legal Officer (CLO)
Mr. Bryant also serves as Secretary and CLO of other funds. Mr. Bryant serves as CLO, Secretary, and Senior Vice President of Fidelity Management & Research Company (investment adviser firm, 2015-present) and FMR Co., Inc. (investment adviser firm, 2015-present); Secretary of Fidelity SelectCo, LLC (investment adviser firm, 2015-present) and Fidelity Investments Money Management, Inc. (investment adviser firm, 2015-present); and CLO of Fidelity Management & Research (Hong Kong) Limited (investment adviser firm, 2015-present). He is Senior Vice President and Deputy General Counsel of FMR LLC (diversified financial services company). Previously, Mr. Bryant served as Secretary and Chief Legal Officer of Fidelity Rutland Square Trust II (2010-2014) and Assistant Secretary of Fidelity's Fixed Income and Asset Allocation Funds (2013-2015). Prior to joining Fidelity Investments, Mr. Bryant served as a Senior Vice President and the Head of Global Retail Legal for AllianceBernstein L.P. (2006-2010), and as the General Counsel for ProFund Advisors LLC (2001-2006).
William C. Coffey (1969)
Year of Election or Appointment: 2009
Assistant Secretary
Mr. Coffey also serves as Assistant Secretary of other funds. He is Senior Vice President and Deputy General Counsel of FMR LLC (diversified financial services company, 2010-present), and is an employee of Fidelity Investments. Previously, Mr. Coffey served as Vice President and Associate General Counsel of FMR LLC (2005-2009).
Jonathan Davis (1968)
Year of Election or Appointment: 2010
Assistant Treasurer
Mr. Davis also serves as Assistant Treasurer of other funds, and is an employee of Fidelity Investments. Previously, Mr. Davis served as Vice President and Associate General Counsel of FMR LLC (diversified financial services company, 2003-2010).
Adrien E. Deberghes (1967)
Year of Election or Appointment: 2008
Deputy Treasurer
Mr. Deberghes also serves as an officer of other funds. He is an employee of Fidelity Investments (2008-present). Prior to joining Fidelity Investments, Mr. Deberghes was Senior Vice President of Mutual Fund Administration at State Street Corporation (2007-2008), Senior Director of Mutual Fund Administration at Investors Bank & Trust (2005-2007), and Director of Finance for Dunkin' Brands (2000-2005).
Stephanie J. Dorsey (1969)
Year of Election or Appointment: 2010
Assistant Treasurer
Ms. Dorsey also serves as an officer of other funds. She is an employee of Fidelity Investments (2008-present) and has served in other fund officer roles. Prior to joining Fidelity Investments, Ms. Dorsey served as Treasurer (2004-2008) of the JPMorgan Mutual Funds and Vice President (2004-2008) of JPMorgan Chase Bank.
Howard J. Galligan III (1966)
Year of Election or Appointment: 2014
Chief Financial Officer
Mr. Galligan also serves as Chief Financial Officer of other funds. Mr. Galligan serves as President of Fidelity Pricing and Cash Management Services (FPCMS) (2014-present) and as a Director of Strategic Advisers, Inc. (investment adviser firm, 2008-present). Previously, Mr. Galligan served as Chief Administrative Officer of Asset Management (2011-2014) and Chief Operating Officer and Senior Vice President of Investment Support for Strategic Advisers, Inc. (2003-2011).
Scott C. Goebel (1968)
Year of Election or Appointment: 2015
Vice President
Mr. Goebel serves as Vice President of other funds and is an employee of Fidelity Investments (2001-present). Previously, Mr. Goebel served as Secretary of Fidelity SelectCo, LLC (investment adviser firm, 2013-2015), Fidelity Investments Money Management, Inc. (FIMM) (investment adviser firm, 2010-2015), and Fidelity Research and Analysis Company (FRAC) (investment adviser firm, 2010-2015); General Counsel, Secretary, and Senior Vice President of Fidelity Management & Research Company (investment adviser firm, 2008-2015) and FMR Co., Inc. (investment adviser firm, 2008-2015); Assistant Secretary of Fidelity Management & Research (Japan) Limited (investment adviser firm, 2008-2015) and FMR Investment Management (U.K.) Limited (investment adviser firm, 2008-2015); Chief Legal Officer (CLO) of Fidelity Management & Research (Hong Kong) Limited (investment adviser firm, 2008-2015); Secretary and CLO of certain Fidelity® funds (2008-2015); Assistant Secretary of FIMM (2008-2010), FRAC (2008-2010), and certain funds (2007-2008); and as Vice President and Secretary of Fidelity Distributors Corporation (FDC) (2005-2007).
Thomas C. Hense (1964)
Year of Election or Appointment: 2008, 2010, or 2015
Vice President
Mr. Hense serves as Vice President of Fidelity Advisor® Multi-Asset Income Fund (2015) and other funds (High Income (2008), Small Cap (2008), and Value (2010) funds), and is an employee of Fidelity Investments (1993-present). Previously, Mr. Hense served as a portfolio manager for Fidelity's Institutional Money Management Group (Pyramis) (2003-2008).
Brian B. Hogan (1964)
Year of Election or Appointment: 2009
Vice President
Mr. Hogan also serves as Trustee or Vice President of other funds. Mr. Hogan serves as a Director of Fidelity SelectCo, LLC (investment adviser firm, 2014-present) and President of the Equity Division of FMR (investment adviser firm, 2009-present). Previously, Mr. Hogan served as Senior Vice President, Equity Research of FMR (2006-2009) and as a portfolio manager.
Chris Maher (1972)
Year of Election or Appointment: 2013
Assistant Treasurer
Mr. Maher serves as Assistant Treasurer of other funds. Mr. Maher is Vice President of Valuation Oversight and is an employee of Fidelity Investments. Previously, Mr. Maher served as Vice President of Asset Management Compliance (2013), Vice President of the Program Management Group of FMR (investment adviser firm, 2010-2013), and Vice President of Valuation Oversight (2008-2010).
Kenneth B. Robins (1969)
Year of Election or Appointment: 2008
President and Treasurer
Mr. Robins also serves as an officer of other funds. Mr. Robins serves as Executive Vice President of Fidelity Investments Money Management, Inc. (FIMM) (investment adviser firm, 2013-present) and is an employee of Fidelity Investments (2004-present). Previously, Mr. Robins served in other fund officer roles.
Stacie M. Smith (1974)
Year of Election or Appointment: 2013
Deputy Treasurer
Ms. Smith also serves as an officer of other funds. She is an employee of Fidelity Investments (2009-present) and has served in other fund officer roles. Prior to joining Fidelity Investments, Ms. Smith served as Senior Audit Manager of Ernst & Young LLP (1996-2009).
Renee Stagnone (1975)
Year of Election or Appointment: 2013
Deputy Treasurer
Ms. Stagnone also serves as Deputy Treasurer of other funds. Ms. Stagnone is an employee of Fidelity Investments (1997-present).
Linda J. Wondrack (1964)
Year of Election or Appointment: 2014
Chief Compliance Officer
Ms. Wondrack also serves as Chief Compliance Officer of other funds. Ms. Wondrack is Executive Vice President and head of the Ethics Office and Asset Management Compliance for Fidelity Investments (2012-present). Ms. Wondrack also serves as Chief Compliance Officer of Fidelity SelectCo, LLC (investment adviser firm, 2014-present); Chief Compliance Officer of Impresa Management LLC (2013-present); and Chief Compliance Officer of FMR Co., Inc. (investment adviser firm), Fidelity Investments Money Management, Inc. (investment adviser firm), Fidelity Management & Research (Japan) Limited (investment adviser firm), FMR Investment Management (U.K.) Limited (investment adviser firm), Fidelity Management & Research (Hong Kong) (investment adviser firm), Fidelity Management & Research Company (investment adviser firm), FIAM LLC (investment adviser firm), and Strategic Advisers, Inc. (investment adviser firm), Ballyrock Investment Advisors LLC, and Northern Neck Investors LLC (2012-present). Previously, Ms. Wondrack served as Senior Vice President and Chief Compliance Officer for Columbia Management Investment Advisers, LLC (2005-2012); Chief Compliance Officer for certain funds within the Columbia Family of Funds (2007-2012); and Senior Vice President of Compliance Risk Management at Bank of America (2005-2010).
Joseph F. Zambello (1957)
Year of Election or Appointment: 2011
Deputy Treasurer
Mr. Zambello also serves as Deputy Treasurer of other funds. Mr. Zambello is an employee of Fidelity Investments (1991-present). Previously, Mr. Zambello served as Vice President of the Program Management Group of FMR (investment adviser firm, 2009-2011) and Vice President of the Transfer Agent Oversight Group (2005-2009).
Shareholder Expense Example
As a shareholder of the Fund, you incur two types of costs: (1) transaction costs, including sales charges (loads) on purchase payments or redemption proceeds, and (2) ongoing costs, including management fees, distribution and/or service (12b-1) fees and other Fund expenses. This Example is intended to help you understand your ongoing costs (in dollars) of investing in the Fund and to compare these costs with the ongoing costs of investing in other mutual funds.
The Example is based on an investment of $1,000 invested at the beginning of the period and held for the entire period (May 1, 2015 to October 31, 2015).
Actual Expenses
The first line of the accompanying table for each class of the Fund provides information about actual account values and actual expenses. You may use the information in this line, together with the amount you invested, to estimate the expenses that you paid over the period. Simply divide your account value by $1,000.00 (for example, an $8,600 account value divided by $1,000.00 = 8.6), then multiply the result by the number in the first line for a class of the Fund under the heading entitled "Expenses Paid During Period" to estimate the expenses you paid on your account during this period. In addition, the Fund, as a shareholder in the underlying Fidelity Central Funds, will indirectly bear its pro-rata share of the fees and expenses incurred by the underlying Fidelity Central Funds. These fees and expenses are not included in the Fund's annualized expense ratio used to calculate the expense estimate in the table below.
Hypothetical Example for Comparison Purposes
The second line of the accompanying table for each class of the Fund provides information about hypothetical account values and hypothetical expenses based on a Class' actual expense ratio and an assumed rate of return of 5% per year before expenses, which is not the Class' actual return. The hypothetical account values and expenses may not be used to estimate the actual ending account balance or expenses you paid for the period. You may use this information to compare the ongoing costs of investing in the Fund and other funds. To do so, compare this 5% hypothetical example with the 5% hypothetical examples that appear in the shareholder reports of the other funds. In addition, the Fund, as a shareholder in the underlying Fidelity Central Funds, will indirectly bear its pro-rata share of the fees and expenses incurred by the underlying Fidelity Central Funds. These fees and expenses are not included in the Fund's annualized expense ratio used to calculate the expense estimate in the table below.
Please note that the expenses shown in the table are meant to highlight your ongoing costs only and do not reflect any transaction costs. Therefore, the second line of the table is useful in comparing ongoing costs only, and will not help you determine the relative total costs of owning different funds. In addition, if these transactional costs were included, your costs would have been higher.
| | Annualized Expense Ratio-A | Beginning
Account Value
May 1, 2015 | Ending
Account Value
October 31, 2015 | Expenses Paid
During Period-B
May 1, 2015
to October 31, 2015 |
| Class A | 1.45% | | | |
| Actual | | $1,000.00 | $971.60 | $7.21 |
| Hypothetical-C | | $1,000.00 | $1,017.90 | $7.38 |
| Class T | 1.70% | | | |
| Actual | | $1,000.00 | $970.40 | $8.44 |
| Hypothetical-C | | $1,000.00 | $1,016.64 | $8.64 |
| Class C | 2.20% | | | |
| Actual | | $1,000.00 | $968.10 | $10.91 |
| Hypothetical-C | | $1,000.00 | $1,014.12 | $11.17 |
| Class I | 1.20% | | | |
| Actual | | $1,000.00 | $972.80 | $5.97 |
| Hypothetical-C | | $1,000.00 | $1,019.16 | $6.11 |
A Annualized expense ratio reflects expenses net of applicable fee waivers.
B Expenses are equal to each Class' annualized expense ratio, multiplied by the average account value over the period, multiplied by 184/365 (to reflect the one-half year period).
C 5% return per year before expenses
Distributions (Unaudited)
The Board of Trustees of Fidelity Advisor Global Equity Income Fund voted to pay to shareholders of record at the opening of business on record date, the following distributions per share derived from capital gains realized from sales of portfolio securities, and dividends derived from net investment income:
| | Pay Date | Record Date | Dividends | Capital Gains |
| Class I | 12/07/15 | 12/04/15 | $0.041 | $0.160 |
The fund hereby designates as a capital gain dividend with respect to the taxable year ended October 31, 2015, $193,931 or, if subsequently determined to be different, the net capital gain of such year.
Class I designates 82%, 100%, 100%, and 100%; of dividends distributed in December 2014, April 2015, July 2015 and October 2015 respectively during the fiscal year as amounts which may be taken into account as a dividend for the purposes of the maximum rate under section 1(h)(11) of the Internal Revenue Code.
Class I designates 0%, 100%, 100%, and 100%; of the dividends distributed in December 2014, April 2015, July 2015 and October 2015 respectively during the fiscal year as qualifying for the dividends-received deduction for corporate shareholders.
A total of 0.07% of the dividends distributed during the fiscal year was derived from interest on U.S. Government securities which is generally exempt from state income tax.
The amounts per share which represent income derived from sources within, and taxes paid to, foreign countries or possessions of the United States are as follows:
| | Pay Date | Income | Taxes |
| Class I | 12/08/2014 | $0.1533 | $0.0118 |
| | 04/04/2015 | $0.0490 | $0.0050 |
| | 07/04/2015 | $0.0641 | $0.0071 |
| | 10/05/2015 | $0.0230 | $0.0020 |
|
The fund will notify shareholders in January 2016 of amounts for use in preparing 2015 income tax returns.
Board Approval of Investment Advisory Contracts and Management Fees
Fidelity Advisor Global Equity Income Fund
Each year, the Board of Trustees, including the Independent Trustees (together, the Board), votes on the renewal of the management contract with Fidelity Management & Research Company (FMR) and the sub-advisory agreements (together, the Advisory Contracts) for the fund. The Board, assisted by the advice of fund counsel and Independent Trustees' counsel, requests and considers a broad range of information relevant to the renewal of the Advisory Contracts throughout the year.
The Board meets regularly and, at each of its meetings, covers an extensive agenda of topics and materials and considers factors that are relevant to its annual consideration of the renewal of the fund's Advisory Contracts, including the services and support provided to the fund and its shareholders. The Board has established various standing committees (Committees), each composed of and chaired by Independent Trustees with varying backgrounds, to which the Board has assigned specific subject matter responsibilities in order to enhance effective decision-making by the Board. The Board, acting directly and through its Committees, requests and receives information concerning the annual consideration of the renewal of the fund's Advisory Contracts. The Board also meets as needed to consider matters specifically related to the Board's annual consideration of the renewal of the Advisory Contracts. Members of the Board may also meet with trustees of other Fidelity funds through ad hoc joint committees to discuss certain matters relevant to all of the Fidelity funds.
At its July 2015 meeting, the Board unanimously determined to renew the fund's Advisory Contracts. In reaching its determination, the Board considered all factors it believed relevant, including (i) the nature, extent, and quality of the services to be provided to the fund and its shareholders (including the investment performance of the fund); (ii) the competitiveness of the fund's management fee and total expense ratio relative to peer funds; (iii) the total costs of the services to be provided by and the profits to be realized by Fidelity from its relationship with the fund; and (iv) the extent to which (if any) economies of scale exist and would be realized as the fund grows, and whether any economies of scale are appropriately shared with fund shareholders.
In considering whether to renew the Advisory Contracts for the fund, the Board reached a determination, with the assistance of fund counsel and Independent Trustees' counsel and through the exercise of its business judgment, that the renewal of the Advisory Contracts was in the best interests of the fund and its shareholders and that the compensation payable under the Advisory Contracts was fair and reasonable. The Board's decision to renew the Advisory Contracts was not based on any single factor, but rather was based on a comprehensive consideration of all the information provided to the Board at its meetings throughout the year. The Board, in reaching its determination to renew the Advisory Contracts, was aware that shareholders of the fund have a broad range of investment choices available to them, including a wide choice among funds offered by Fidelity's competitors, and that the fund's shareholders, who have the opportunity to review and weigh the disclosure provided by the fund in its prospectus and other public disclosures, have chosen to invest in this fund, which is part of the Fidelity family of funds.
Nature, Extent, and Quality of Services Provided. The Board considered Fidelity's staffing as it relates to the fund, including the backgrounds of investment personnel of Fidelity, and also considered the fund's investment objective, strategies, and related investment philosophy. The Independent Trustees also had discussions with senior management of Fidelity's investment operations and investment groups. The Board considered the structure of the portfolio manager compensation program and whether this structure provides appropriate incentives to act in the best interests of the fund. Additionally, the Board considered the portfolio managers' investments, if any, in the funds that they manage.
Resources Dedicated to Investment Management and Support Services. The Board and the Fund Oversight and Research Committees reviewed the general qualifications and capabilities of Fidelity's investment staff, including its size, education, experience, and resources, as well as Fidelity's approach to recruiting, training, managing, and compensating investment personnel. The Board noted that Fidelity has continued to increase the resources devoted to nonoffices, including expansion of Fidelity's global investment organization. The Board also noted that Fidelity's analysts have extensive resources, tools and capabilities that allow them to conduct sophisticated quantitative and fundamental analysis, as well as credit analysis of issuers, counterparties and guarantors. Further, the Board considered that Fidelity's investment professionals have sufficient access to global information and data so as to provide competitive investment results over time, and that those professionals also have access to sophisticated tools that permit them to assess portfolio construction and risk and performance attribution characteristics continuously, as well as to transmit new information and research conclusions rapidly around the world. Additionally, in its deliberations, the Board considered Fidelity's trading, risk management, and compliance capabilities and resources, which are integral parts of the investment management process.
Shareholder and Administrative Services. The Board considered (i) the nature, extent, quality, and cost of advisory, administrative, and shareholder services performed by FMR, the sub-advisers (together with FMR, the Investment Advisers), and their affiliates under the Advisory Contracts and under separate agreements covering transfer agency, pricing and bookkeeping, and securities lending services for the fund; (ii) the nature and extent of the supervision of third party service providers, principally custodians and subcustodians; and (iii) the resources devoted to, and the record of compliance with, the fund's compliance policies and procedures. The Board also reviewed the allocation of fund brokerage, including allocations to brokers affiliated with the Investment Advisers, the use of brokerage commissions to pay fund expenses, and the use of "soft" commission dollars to pay for research services.
The Board noted that the growth of fund assets over time across the complex allows Fidelity to reinvest in the development of services designed to enhance the value or convenience of the Fidelity funds as investment vehicles. These services include 24-hour access to account information and market information through telephone representatives and over the Internet, investor education materials and asset allocation tools, and the expanded availability of Fidelity Investor Centers.
In 2014, the Board formed an ad hoc Committee on Transfer Agency Fees to review the variety of transfer agency fee structures throughout the industry and Fidelity's competitive positioning with respect to industry participants.
Investment in a Large Fund Family. The Board considered the benefits to shareholders of investing in a Fidelity fund, including the benefits of investing in a fund that is part of a large family of funds offering a variety of investment disciplines and providing a large variety of mutual fund investor services. The Board noted that Fidelity had taken, or had made recommendations that resulted in the Fidelity funds taking, a number of actions over the previous year that benefited particular funds, including (i) continuing to dedicate additional resources to investment research and to the support of the senior management team that oversees asset management; (ii) continuing efforts to enhance Fidelity's global research capabilities; (iii) launching new funds and making other enhancements to meet client needs; (iv) reducing management fees and total expenses for certain index funds and diversified international funds; (v) continuing to launch dedicated lower cost underlying funds to meet portfolio construction needs related to expanding underlying fund options for Fidelity funds of funds, specifically for the Freedom Fund product lines; (vi) rationalizing product lines and gaining increased efficiencies through fund mergers; (vii) launching active fixed-income exchange-traded funds; (viii) continuing to develop, acquire and implement systems and technology to improve services to the funds and information security and to increase efficiency; (ix) implementing investment enhancements to further strengthen Fidelity's target date product line to increase investors' probability of success in achieving their goals; (x) modifying the eligibility criteria for certain share classes to accommodate roll-over assets from employer-sponsored retirement plans; (xi) launching a new Class W of the Freedom Index Funds to attract and retain Fidelity record-kept retirement plan assets; and (xii) implementing changes to Fidelity's money market product line in response to recent money market regulatory reforms.
Investment Performance. The Board considered whether the fund has operated in accordance with its investment objective, as well as its record of compliance with its investment restrictions and its performance history.
The Board took into account discussions with representatives of the Investment Advisers about fund investment performance that occur at Board meetings throughout the year. In this regard the Board noted that as part of regularly scheduled fund reviews and other reports to the Board on fund performance, the Board considers annualized return information for the fund, for different time periods, measured against a securities market index ("benchmark index") and a peer group of funds with similar objectives ("peer group"), if any. In its evaluation of fund investment performance, the Board gave particular attention to information indicating changes in performance of certain Fidelity funds for specific time periods and discussed with the Investment Advisers the reasons for any overperformance or underperformance.
In addition to reviewing absolute and relative fund performance, the Independent Trustees periodically consider the appropriateness of fund performance metrics in evaluating the results achieved. In general, the Independent Trustees believe that fund performance should be evaluated based on net performance (after fees and expenses) of both the highest performing and lowest performing fund share classes, where applicable, compared to appropriate benchmark indices, over appropriate time periods that may include full market cycles, and compared to peer groups, as applicable, over the same periods, taking into account relevant factors including the following: general market conditions; issuer-specific information; and fund cash flows and other factors.
The Independent Trustees recognize that shareholders evaluate performance on a net basis over their own holding periods, for which one-, three-, and five-year periods are often used as a proxy. For this reason, the performance information reviewed by the Board also included net cumulative calendar year total return information for the fund and an appropriate benchmark index and peer group for the most recent one-year period, as shown below. Returns are shown compared to the 25th percentile (top of box, 75% beaten) and 75th percentile (bottom of box, 25% beaten) of the peer universe. Returns of the benchmark index are "net MA,"
i.e., adjusted for tax withholding rates applicable to U.S.-based funds organized as Massachusetts business trusts.
Fidelity Advisor Global Equity Income Fund
Based on its review, the Board concluded that the nature, extent, and quality of services provided to the fund under the Advisory Contracts should benefit the shareholders of the fund.
Competitiveness of Management Fee and Total Expense Ratio. The Board considered the fund's management fee and total expense ratio compared to "mapped groups" of competitive funds and classes created for the purpose of facilitating the Trustees' competitive analysis of management fees and total expenses. Fidelity creates "mapped groups" by combining similar Lipper investment objective categories that have comparable investment mandates. Combining Lipper investment objective categories aids the Board's management fee and total expense ratio comparisons by broadening the competitive group used for comparison.
Management Fee. The Board considered two proprietary management fee comparisons for the 12-month (or shorter) periods shown in basis points (BP) in the chart below. The group of Lipper funds used by the Board for management fee comparisons is referred to below as the "Total Mapped Group." The Total Mapped Group is broader than the Lipper peer group used by the Board for performance comparisons because the Total Mapped Group combines several Lipper investment objective categories while the Lipper peer group does not. The Total Mapped Group comparison focuses on a fund's standing in terms of gross management fees before expense reimbursements or caps relative to the total universe of funds with comparable investment mandates, regardless of whether their management fee structures also are comparable. Funds with comparable investment mandates offer exposure to similar types of securities. Funds with comparable management fee structures have similar management fee contractual arrangements (
e.g., flat rate charged for advisory services, all-inclusive fee rate,
etc.). "TMG %" represents the percentage of funds in the Total Mapped Group that had management fees that were lower than the fund's. For example, a hypothetical TMG % of 20% would mean that 80% of the funds in the Total Mapped Group had higher, and 20% had lower, management fees than the fund. The fund's actual TMG %s and the number of funds in the Total Mapped Group are in the chart below. The "Asset-Size Peer Group" (ASPG) comparison focuses on a fund's standing relative to a subset of non-Fidelity funds within the Total Mapped Group that are similar in size and management fee structure without taking into account performance adjustments, if any. For example, if a fund is in the first quartile of the ASPG, the fund's management fee ranks in the least expensive or lowest 25% of funds in the ASPG. The ASPG represents at least 15% of the funds in the Total Mapped Group with comparable asset size and management fee structures, subject to a minimum of 50 funds (or all funds in the Total Mapped Group if fewer than 50). Additional information, such as the ASPG quartile in which the fund's management fee rate ranked, is also included in the chart and considered by the Board.
Fidelity Advisor Global Equity Income Fund
The Board noted that the fund's management fee rate ranked below the median of its Total Mapped Group and below the median of its ASPG for 2014.
The Board noted that, in 2014, the ad hoc Committee on Group Fee was formed by it and other Fidelity fund boards to conduct an in-depth review of the "group fee" component of the management fee of funds with such management fee structures. Committee focus included the mechanics of the group fee, the competitive landscape of group fee structures, Fidelity funds with no group fee component and investment products not included in group fee assets. The Board also considered that, for funds subject to the group fee, FMR agreed to voluntarily waive fees over a specified period of time in amounts designed to account for assets converted from certain funds to certain collective investment trusts.
The Board also noted that, in 2013, the ad hoc Committee on Management Fees was formed to conduct an in-depth review of the management fee rates of Fidelity's active equity mutual funds. The Committee focused on the following areas: (i) standard fee structures; (ii) research consumption and trading evolution; (iii) management fee competitiveness/profitability by category; and (iv) factors that drive institutional pricing.
Based on its review, the Board concluded that the fund's management fee is fair and reasonable in light of the services that the fund receives and the other factors considered.
Total Expense Ratio. In its review of each class's total expense ratio, the Board considered the fund's management fee as well as other fund or class expenses, as applicable, such as transfer agent fees, pricing and bookkeeping fees, fund-paid 12b-1 fees, and custodial, legal, and audit fees. The Board also noted that Fidelity may agree to waive fees and expenses from time to time, and the extent to which, if any, it has done so for the fund. As part of its review, the Board also considered the current and historical total expense ratios of each class of the fund compared to competitive fund median expenses. Each class of the fund is compared to those funds and classes in the Total Mapped Group (used by the Board for management fee comparisons) that have a similar sales load structure.
The Board noted that the total expense ratio of each class ranked above its competitive median for 2014. The Board considered that, in general, various factors can affect total expense ratios. The Board noted that the total expense ratio of Class T was above the competitive median primarily because of higher 12b-1 fees on Class T as compared to most competitor funds. Class T has a higher 12b-1 fee, but a lower front-end sales charge, than traditionally priced front-end sales charge classes. The Board considered that Class T is primarily sold load-waived in the retirement plan market where its 0.50% 12b-1 fee is comparable to competing no-load, higher 12b-1 fee classes designed specifically for retirement plans. The Board noted that the fund offers multiple classes, each of which has a different sales load and 12b-1 fee structure, and that the multiple structures are intended to offer a range of pricing options for the intermediary market. The Board also noted that the total expense ratios of the classes vary primarily by the level of their 12b-1 fees, although differences in transfer agent fees may also cause expenses to vary from class to class.
The Board further considered that FMR contractually agreed to reimburse Class A, Class T, Class C, and Class I of the fund to the extent that total expenses (excluding interest, certain taxes, certain securities lending costs, brokerage commissions, extraordinary expenses, and acquired fund fees and expenses, if any), as a percentage of their respective average net assets, exceed 1.45%, 1.70%, 2.20%, and 1.20% through December 31, 2015.
Fees Charged to Other Fidelity Clients. The Board also considered Fidelity fee structures and other information with respect to clients of Fidelity, such as other funds advised or subadvised by Fidelity, pension plan clients, and other institutional clients with similar mandates. The Board noted the findings of the 2013 ad hoc joint committee (created with the board of other Fidelity funds), which reviewed and compared Fidelity's institutional investment advisory business with its business of providing services to the Fidelity funds, including the differences in services provided, fees charged, and costs incurred, as well as competition in their respective marketplaces.
Based on its review of total expense ratios and fees charged to other Fidelity clients, the Board concluded that, although in all cases above the median of the universe presented for comparison, the total expense ratio of each class of the fund was reasonable in light of the services that the fund and its shareholders receive and the other factors considered.
Costs of the Services and Profitability. The Board considered the revenues earned and the expenses incurred by Fidelity in conducting the business of developing, marketing, distributing, managing, administering and servicing the fund and servicing the fund's shareholders. The Board also considered the level of Fidelity's profits in respect of all the Fidelity funds.
On an annual basis, Fidelity presents to the Board information about the profitability of its relationship with the fund. Fidelity calculates profitability information for each fund, as well as aggregate profitability information for groups of Fidelity funds and all Fidelity funds, using a series of detailed revenue and cost allocation methodologies which originate with the books and records of Fidelity on which Fidelity's audited financial statements are based. The Audit Committee of the Board reviews any significant changes from the prior year's methodologies.
PricewaterhouseCoopers LLP (PwC), independent registered public accounting firm and auditor to Fidelity and certain Fidelity funds, has been engaged annually by the Board as part of the Board's assessment of Fidelity's profitability analysis. PwC's engagement includes the review and assessment of the methodologies used by Fidelity in determining the revenues and expenses attributable to Fidelity's mutual fund business, and completion of agreed-upon procedures in respect of the mathematical accuracy of fund profitability and its conformity to established allocation methodologies. After considering PwC's reports issued under the engagement and information provided by Fidelity, the Board concluded that while other allocation methods may also be reasonable, Fidelity's profitability methodologies are reasonable in all material respects.
The Board also reviewed Fidelity's non-fund businesses and fall-out benefits related to the mutual fund business as well as cases where Fidelity's affiliates may benefit from or be related to the fund's business.
The Board considered the costs of the services provided by and the profits realized by Fidelity in connection with the operation of the fund and was satisfied that the profitability was not excessive.
Economies of Scale. The Board considered whether there have been economies of scale in respect of the management of the Fidelity funds, whether the Fidelity funds (including the fund) have appropriately benefited from any such economies of scale, and whether there is potential for realization of any further economies of scale. The Board considered the extent to which the fund will benefit from economies of scale as assets grow through increased services to the fund, through waivers or reimbursements, or through fee or expense ratio reductions. The Board also noted that in 2013, it and the boards of other Fidelity funds created an ad hoc committee (the Economies of Scale Committee) to analyze whether Fidelity attains economies of scale in respect of the management and servicing of the Fidelity funds, whether the Fidelity funds have appropriately benefited from such economies of scale, and whether there is potential for realization of any further economies of scale.
The Board recognized that the fund's management contract incorporates a "group fee" structure, which provides for lower group fee rates as total group assets increase, and for higher group fee rates as total group assets decrease (with "group assets" defined to include fund assets under FMR's management plus sector fund assets previously under FMR's management and currently managed by Fidelity SelectCo, LLC). FMR calculates the group fee rates based on a tiered asset "breakpoint" schedule that varies based on asset class. The Board considered that the group fee is designed to deliver the benefits of economies of scale to fund shareholders when total Fidelity fund assets increase, even if assets of any particular fund are unchanged or have declined, because some portion of Fidelity's costs are attributable to services provided to all Fidelity funds, and all funds benefit if those costs can be allocated among more assets. The Board concluded that, given the group fee structure, fund shareholders will benefit from lower management fees as group assets increase at the fund complex level, regardless of whether Fidelity achieves any such economies of scale.
The Board concluded, taking into account the analysis of the Economies of Scale Committee, that economies of scale, if any, are being appropriately shared between fund shareholders and Fidelity.
Additional Information Requested by the Board. In order to develop fully the factual basis for consideration of the Fidelity funds' Advisory Contracts, the Board requested and received additional information on certain topics, including: (i) fund performance trends and Fidelity's long-term strategies for certain funds; (ii) the various share classes employed by Fidelity and the attributes of each class, together with similar information on the distribution and servicing payments made by Fidelity or the funds to third-party participants in the distribution channels; (iii) fund profitability, and fund performance in relation to fund profitability; (iv) the methodology with respect to evaluating competitive fund data and peer group classifications and fee comparisons; (v) annual fund profitability margins, with particular focus on certain funds with negative margins; (vi) the realization of fall-out benefits in certain Fidelity business units;
(vii) economies of scale and the way in which they are shared with fund shareholders;(viii) Fidelity's group fee structures, including the group fee schedule of breakpoints;(ix) the impact of cost containment measures on the funds; and (x) the transfer agent fee structure.
Based on its evaluation of all of the conclusions noted above, and after considering all factors it believed relevant, the Board concluded that the advisory fee structures are fair and reasonable, and that the fund's Advisory Contracts should be renewed.
AGEDI-ANN-1215
1.938142.103
Fidelity Advisor® International Capital Appreciation Fund Class A, Class T, Class B and Class C
Annual Report October 31, 2015 |
|
Contents
To view a fund's proxy voting guidelines and proxy voting record for the 12-month period ended June 30, visit http://www.fidelity.com/proxyvotingresults or visit the Securities and Exchange Commission's (SEC) web site at http://www.sec.gov.
You may also call 1-877-208-0098 to request a free copy of the proxy voting guidelines.
Standard & Poor's, S&P and S&P 500 are registered service marks of The McGraw-Hill Companies, Inc. and have been licensed for use by Fidelity Distributors Corporation.
Other third-party marks appearing herein are the property of their respective owners.
All other marks appearing herein are registered or unregistered trademarks or service marks of FMR LLC or an affiliated company. © 2015 FMR LLC. All rights reserved.
This report and the financial statements contained herein are submitted for the general information of the shareholders of the Fund. This report is not authorized for distribution to prospective investors in the Fund unless preceded or accompanied by an effective prospectus.
A fund files its complete schedule of portfolio holdings with the SEC for the first and third quarters of each fiscal year on Form N-Q. Forms N-Q are available on the SEC’s web site at http://www.sec.gov. A fund's Forms N-Q may be reviewed and copied at the SEC’s Public Reference Room in Washington, DC. Information regarding the operation of the SEC's Public Reference Room may be obtained by calling 1-800-SEC-0330.
For a complete list of a fund's portfolio holdings, view the most recent holdings listing, semiannual report, or annual report on Fidelity's web site at http://www.fidelity.com, http://www.advisor.fidelity.com, or http://www.401k.com, as applicable.
NOT FDIC INSURED •MAY LOSE VALUE •NO BANK GUARANTEE
Neither the Fund nor Fidelity Distributors Corporation is a bank.
Performance: The Bottom Line
Average annual total return reflects the change in the value of an investment, assuming reinvestment of distributions from dividend income and capital gains (the profits earned upon the sale of securities that have grown in value, if any) and assuming a constant rate of performance each year.
The hypothetical investment and the average annual total returns do not reflect the deduction of taxes that a shareholder would pay on fund distributions or the redemption of fund shares.
During periods of reimbursement by Fidelity, a fund’s total return will be greater than it would be had the reimbursement not occurred.
How a fund did yesterday is no guarantee of how it will do tomorrow.
Returns reflect the conversion of Class B shares to Class A shares after a maximum of seven years.
Average Annual Total Returns
| For the periods ended October 31, 2015 | Past 1 year | Past 5 years | Past 10 years |
| Class A (incl. 5.75% sales charge) | (2.49)% | 6.65% | 4.58% |
| Class T (incl. 3.50% sales charge) | (0.37)% | 6.89% | 4.57% |
| Class B (incl. contingent deferred sales charge) | (2.23)% | 6.82% | 4.63% |
| Class C (incl. contingent deferred sales charge) | 1.70% | 7.11% | 4.42% |
Class B shares' contingent deferred sales charges included in the past one year, past five years and past ten years total return figures are 5%, 2% and 0%, respectively.
Class C shares' contingent deferred sales charges included in the past one year, past five years and past ten years total return figures are 1%, 0% and 0%, respectively.
$10,000 Over 10 Years
Let's say hypothetically that $10,000 was invested in Fidelity Advisor® International Capital Appreciation Fund - Class A on October 31, 2005, and the current 5.75% sales charge was paid.
The chart shows how the value of your investment would have changed, and also shows how the MSCI ACWI (All Country World Index) ex USA Index performed over the same period.
| Period Ending Values |
| $15,642 | Fidelity Advisor® International Capital Appreciation Fund - Class A |
| $15,246 | MSCI ACWI (All Country World Index) ex USA Index |
Management's Discussion of Fund Performance
Market Recap: International equities suffered a moderate setback for the 12 months ending October 31, 2015, held back by a collapse in commodities prices that hurt resources-related sectors and geographies. The MSCI ACWI (All Country World Index) ex USA Index returned -4.55% for the period, affected also by concerns about global economic growth. Commodity producers remained under pressure for much of the past year, largely related to economic deceleration in China (-1%), the world’s second-largest economy and a leading consumer of raw materials. This effect was exacerbated by U.S. dollar strength relative to global currencies, which weighed on commodities priced in dollars and acutely impacted equity returns within regions most exposed to resources prices. The emerging-markets group, for example, returned about -15% this period. Canada, a significant energy producer, returned roughly -17%. Net energy consumer Japan (+9%) was the best-performing region by far. Only about a quarter of the nearly 50 index countries managed a gain this period: Ireland (+19%) – the EU’s fastest-growing economy – and Israel (+17%) proved top performers; Greece (-56%) and Brazil (-46%), among the worst. As for sectors, energy (-25%) and materials (-16%) declined sharply, whereas the two consumer sectors each gained about 6%.
Comments from Portfolio Manager Sammy Simnegar: For the year, the fund’s share classes (excluding sales charges, if applicable) recorded modest single-digit gains and handily topped the benchmark MSCI ACWI (All Country World Index) ex USA Index. Stock selection in materials and consumer discretionary was especially beneficial to performance versus the benchmark, along with a sizable underweighting in energy. Geographically, out-of-benchmark exposure to the U.S. and stock selection in the U.K. and Germany meaningfully contributed. Sartorius, a Germany-based provider of laboratory technology and equipment for the biotechnology market, was our largest contributor. Also bolstering relative performance were OBIC, a Japan-based provider of software to small and mid-sized businesses; and Rightmove, which operates a real estate Internet portal in the United Kingdom. Conversely, a large underweighting in Japan dampened relative performance, as did our picks in Ireland, Brazil and China. Among sectors, consumer staples and telecommunication services detracted. At the stock level, the biggest detractor was our overweighting in Brazil-based Kroton Educacional, the world’s largest for-profit operator of colleges. I liquidated this position. Brazilian health insurer Qualicorp – also sold – further weighed on performance.
The views expressed above reflect those of the portfolio manager(s) only through the end of the period as stated on the cover of this report and do not necessarily represent the views of Fidelity or any other person in the Fidelity organization. Any such views are subject to change at any time based upon market or other conditions and Fidelity disclaims any responsibility to update such views. These views may not be relied on as investment advice and, because investment decisions for a Fidelity fund are based on numerous factors, may not be relied on as an indication of trading intent on behalf of any Fidelity fund.
Investment Summary (Unaudited)
Top Five Stocks as of October 31, 2015
| | % of fund's net assets | % of fund's net assets 6 months ago |
| Novartis AG sponsored ADR (Switzerland, Pharmaceuticals) | 1.6 | 1.5 |
| Bayer AG (Germany, Pharmaceuticals) | 1.1 | 1.0 |
| Novo Nordisk A/S Series B sponsored ADR (Denmark, Pharmaceuticals) | 1.1 | 0.9 |
| Taiwan Semiconductor Manufacturing Co. Ltd. sponsored ADR (Taiwan, Semiconductors & Semiconductor Equipment) | 1.0 | 1.0 |
| Tencent Holdings Ltd. (Cayman Islands, Internet Software & Services) | 1.0 | 0.8 |
| | 5.8 | |
Top Five Market Sectors as of October 31, 2015
| | % of fund's net assets | % of fund's net assets 6 months ago |
| Consumer Discretionary | 23.4 | 18.1 |
| Industrials | 17.5 | 20.9 |
| Information Technology | 17.2 | 14.8 |
| Health Care | 16.9 | 14.8 |
| Financials | 11.8 | 14.0 |
Top Five Countries as of October 31, 2015
| (excluding cash equivalents) | % of fund's net assets | % of fund's net assets 6 months ago |
| United States of America | 18.4 | 18.6 |
| United Kingdom | 17.2 | 16.3 |
| France | 7.4 | 6.3 |
| Japan | 6.5 | 3.2 |
| Germany | 6.4 | 4.1 |
Percentages are adjusted for the effect of futures contracts, if applicable.
Asset Allocation (% of fund's net assets)
| As of October 31, 2015 |
| | Stocks | 98.7% |
| | Short-Term Investments and Net Other Assets (Liabilities) | 1.3% |

| As of April 30, 2015 |
| | Stocks | 98.4% |
| | Short-Term Investments and Net Other Assets (Liabilities) | 1.6% |

Investments October 31, 2015
Showing Percentage of Net Assets
| Common Stocks - 98.3% | | | |
| | | Shares | Value |
| Australia - 3.0% | | | |
| Amcor Ltd. | | 132,873 | $1,283,395 |
| CSL Ltd. | | 23,438 | 1,557,931 |
| Ramsay Health Care Ltd. | | 26,985 | 1,186,197 |
| realestate.com.au Ltd. | | 35,135 | 1,194,093 |
| Sydney Airport unit | | 263,085 | 1,202,327 |
| Transurban Group unit | | 172,559 | 1,278,670 |
|
| TOTAL AUSTRALIA | | | 7,702,613 |
|
| Bailiwick of Jersey - 2.3% | | | |
| Delphi Automotive PLC | | 14,000 | 1,164,660 |
| Shire PLC | | 25,030 | 1,895,544 |
| Wolseley PLC | | 23,112 | 1,356,936 |
| WPP PLC | | 68,500 | 1,535,553 |
|
| TOTAL BAILIWICK OF JERSEY | | | 5,952,693 |
|
| Bermuda - 0.4% | | | |
| Signet Jewelers Ltd. | | 7,280 | 1,098,843 |
| Brazil - 0.9% | | | |
| BB Seguridade Participacoes SA | | 169,100 | 1,166,343 |
| Cielo SA | | 121,744 | 1,155,709 |
|
| TOTAL BRAZIL | | | 2,322,052 |
|
| Canada - 2.2% | | | |
| Alimentation Couche-Tard, Inc. Class B (sub. vtg.) | | 31,350 | 1,348,606 |
| Canadian National Railway Co. | | 30,290 | 1,850,155 |
| Canadian Pacific Railway Ltd. | | 9,950 | 1,398,220 |
| Constellation Software, Inc. | | 2,760 | 1,192,567 |
|
| TOTAL CANADA | | | 5,789,548 |
|
| Cayman Islands - 2.4% | | | |
| Alibaba Group Holding Ltd. sponsored ADR (a) | | 15,660 | 1,312,778 |
| TAL Education Group ADR (a) | | 29,960 | 1,151,962 |
| Tencent Holdings Ltd. | | 139,300 | 2,625,718 |
| Vipshop Holdings Ltd. ADR (a) | | 52,300 | 1,073,196 |
|
| TOTAL CAYMAN ISLANDS | | | 6,163,654 |
|
| Denmark - 2.0% | | | |
| Coloplast A/S Series B | | 15,830 | 1,135,724 |
| Novo Nordisk A/S Series B sponsored ADR | | 50,770 | 2,699,949 |
| Pandora A/S | | 10,920 | 1,259,873 |
|
| TOTAL DENMARK | | | 5,095,546 |
|
| Finland - 0.5% | | | |
| Sampo Oyj (A Shares) | | 28,700 | 1,403,787 |
| France - 7.4% | | | |
| Bureau Veritas SA | | 50,594 | 1,144,426 |
| Capgemini SA | | 14,800 | 1,318,749 |
| Christian Dior SA | | 6,300 | 1,240,768 |
| Dassault Systemes SA | | 17,100 | 1,350,880 |
| Essilor International SA | | 11,417 | 1,501,543 |
| Hermes International SCA | | 3,410 | 1,313,745 |
| Ingenico SA | | 9,868 | 1,165,435 |
| Korian | | 27,713 | 1,048,479 |
| L'Oreal SA | | 9,800 | 1,789,449 |
| Natixis SA | | 207,700 | 1,274,457 |
| Orpea | | 13,500 | 1,083,705 |
| Publicis Groupe SA | | 19,530 | 1,268,382 |
| Safran SA | | 17,830 | 1,354,261 |
| Sodexo SA | | 13,660 | 1,216,268 |
| SRP Groupe SA (a)(b) | | 58,300 | 1,129,611 |
|
| TOTAL FRANCE | | | 19,200,158 |
|
| Germany - 6.0% | | | |
| Bayer AG | | 21,420 | 2,858,339 |
| Continental AG | | 6,720 | 1,616,116 |
| CTS Eventim AG | | 26,811 | 1,049,732 |
| Fresenius Medical Care AG & Co. KGaA | | 15,600 | 1,404,118 |
| Fresenius SE & Co. KGaA | | 21,200 | 1,557,827 |
| Gerresheimer AG | | 13,570 | 1,059,032 |
| Henkel AG & Co. KGaA | | 15,393 | 1,422,030 |
| ProSiebenSat.1 Media AG | | 24,190 | 1,308,480 |
| Scout24 Holding GmbH | | 31,800 | 1,066,551 |
| Symrise AG | | 18,600 | 1,225,164 |
| Wirecard AG (c) | | 22,000 | 1,137,159 |
|
| TOTAL GERMANY | | | 15,704,548 |
|
| Hong Kong - 1.3% | | | |
| AIA Group Ltd. | | 379,400 | 2,224,548 |
| Techtronic Industries Co. Ltd. | | 296,500 | 1,083,908 |
|
| TOTAL HONG KONG | | | 3,308,456 |
|
| India - 3.6% | | | |
| Adani Ports & Special Economic Zone (a) | | 256,860 | 1,159,745 |
| Amara Raja Batteries Ltd. (a) | | 72,900 | 1,005,027 |
| Asian Paints India Ltd. | | 83,041 | 1,052,384 |
| HDFC Bank Ltd. (a) | | 47,898 | 960,675 |
| Housing Development Finance Corp. Ltd. | | 83,385 | 1,597,247 |
| Sun Pharmaceutical Industries Ltd. | | 90,537 | 1,230,317 |
| Tata Consultancy Services Ltd. | | 34,449 | 1,312,505 |
| Titan Co. Ltd. (a) | | 190,888 | 1,035,560 |
|
| TOTAL INDIA | | | 9,353,460 |
|
| Ireland - 4.2% | | | |
| Accenture PLC Class A | | 10,740 | 1,151,328 |
| Allegion PLC | | 17,000 | 1,107,890 |
| CRH PLC | | 54,800 | 1,499,921 |
| Fleetmatics Group PLC (a) | | 20,000 | 1,113,200 |
| Kerry Group PLC Class A | | 15,190 | 1,235,237 |
| Kingspan Group PLC (Ireland) | | 49,760 | 1,205,450 |
| Medtronic PLC | | 16,130 | 1,192,330 |
| Paddy Power PLC (Ireland) | | 10,100 | 1,168,400 |
| Ryanair Holdings PLC sponsored ADR | | 14,849 | 1,161,043 |
|
| TOTAL IRELAND | | | 10,834,799 |
|
| Isle of Man - 0.5% | | | |
| Playtech Ltd. | | 94,310 | 1,244,524 |
| Israel - 1.6% | | | |
| Check Point Software Technologies Ltd. (a) | | 13,990 | 1,188,311 |
| Frutarom Industries Ltd. | | 28,400 | 1,227,267 |
| Teva Pharmaceutical Industries Ltd. sponsored ADR | | 31,940 | 1,890,529 |
|
| TOTAL ISRAEL | | | 4,306,107 |
|
| Italy - 1.4% | | | |
| Azimut Holding SpA | | 51,000 | 1,227,638 |
| Mediolanum SpA | | 141,900 | 1,157,039 |
| Mediolanum SpA rights | | 141,900 | 9 |
| Recordati SpA | | 48,721 | 1,211,354 |
|
| TOTAL ITALY | | | 3,596,040 |
|
| Japan - 6.5% | | | |
| Astellas Pharma, Inc. | | 112,400 | 1,631,428 |
| Dentsu, Inc. | | 23,400 | 1,315,504 |
| Hoya Corp. | | 36,500 | 1,506,237 |
| Kansai Paint Co. Ltd. | | 79,300 | 1,208,833 |
| Keyence Corp. | | 3,237 | 1,685,210 |
| Misumi Group, Inc. | | 98,200 | 1,278,770 |
| Nitori Holdings Co. Ltd. | | 14,400 | 1,122,897 |
| OBIC Co. Ltd. | | 23,200 | 1,224,426 |
| Olympus Corp. | | 37,600 | 1,268,298 |
| SHIMANO, Inc. | | 8,500 | 1,339,333 |
| SK Kaken Co. Ltd. | | 11,130 | 1,084,007 |
| Sundrug Co. Ltd. | | 21,200 | 1,116,805 |
| Tsuruha Holdings, Inc. | | 13,900 | 1,101,214 |
|
| TOTAL JAPAN | | | 16,882,962 |
|
| Luxembourg - 0.9% | | | |
| Eurofins Scientific SA | | 3,500 | 1,267,209 |
| Grand City Properties SA | | 54,896 | 1,096,254 |
|
| TOTAL LUXEMBOURG | | | 2,363,463 |
|
| Mexico - 1.7% | | | |
| Grupo Aeroportuario del Pacifico SA de CV Series B | | 116,200 | 1,046,572 |
| Grupo Aeroportuario del Sureste SA de CV Series B | | 69,010 | 1,068,795 |
| Grupo Aeroportuario Norte S.A.B. de CV | | 208,700 | 1,073,457 |
| Megacable Holdings S.A.B. de CV unit | | 299,400 | 1,141,025 |
|
| TOTAL MEXICO | | | 4,329,849 |
|
| Netherlands - 1.5% | | | |
| IMCD Group BV | | 28,500 | 1,066,188 |
| LyondellBasell Industries NV Class A | | 11,930 | 1,108,416 |
| RELX NV | | 94,709 | 1,619,482 |
|
| TOTAL NETHERLANDS | | | 3,794,086 |
|
| Norway - 0.4% | | | |
| Schibsted ASA (A Shares) | | 34,460 | 1,155,865 |
| Philippines - 1.8% | | | |
| Ayala Corp. | | 71,080 | 1,183,762 |
| International Container Terminal Services, Inc. | | 621,370 | 1,095,516 |
| SM Investments Corp. | | 60,035 | 1,120,801 |
| SM Prime Holdings, Inc. | | 2,547,900 | 1,173,183 |
|
| TOTAL PHILIPPINES | | | 4,573,262 |
|
| South Africa - 1.2% | | | |
| Discovery Ltd. | | 107,700 | 1,151,788 |
| Naspers Ltd. Class N | | 13,880 | 2,033,005 |
|
| TOTAL SOUTH AFRICA | | | 3,184,793 |
|
| Spain - 1.4% | | | |
| Aena SA | | 10,330 | 1,152,978 |
| Amadeus IT Holding SA Class A | | 30,060 | 1,281,230 |
| Grifols SA ADR | | 34,840 | 1,212,780 |
|
| TOTAL SPAIN | | | 3,646,988 |
|
| Sweden - 1.1% | | | |
| ASSA ABLOY AB (B Shares) | | 71,418 | 1,420,724 |
| Hexagon AB (B Shares) | | 38,500 | 1,337,477 |
|
| TOTAL SWEDEN | | | 2,758,201 |
|
| Switzerland - 3.7% | | | |
| Compagnie Financiere Richemont SA Series A | | 20,892 | 1,791,438 |
| Givaudan SA | | 765 | 1,369,872 |
| Novartis AG sponsored ADR | | 46,900 | 4,241,172 |
| Partners Group Holding AG | | 3,270 | 1,184,339 |
| Sika AG (Bearer) | | 354 | 1,161,795 |
|
| TOTAL SWITZERLAND | | | 9,748,616 |
|
| Taiwan - 1.5% | | | |
| Largan Precision Co. Ltd. | | 16,000 | 1,249,345 |
| Taiwan Semiconductor Manufacturing Co. Ltd. sponsored ADR | | 120,000 | 2,635,200 |
|
| TOTAL TAIWAN | | | 3,884,545 |
|
| Thailand - 0.5% | | | |
| Airports of Thailand PCL (For. Reg.) | | 142,600 | 1,192,000 |
| Turkey - 0.4% | | | |
| TAV Havalimanlari Holding A/S | | 147,800 | 1,160,945 |
| United Arab Emirates - 0.4% | | | |
| DP World Ltd. | | 57,491 | 1,161,893 |
| United Kingdom - 17.2% | | | |
| Aon PLC | | 12,620 | 1,177,572 |
| Ashtead Group PLC | | 82,340 | 1,269,353 |
| Auto Trader Group PLC | | 193,200 | 1,158,586 |
| Berkeley Group Holdings PLC | | 22,530 | 1,152,416 |
| Bunzl PLC | | 45,700 | 1,309,686 |
| Capita Group PLC | | 64,700 | 1,271,704 |
| Close Brothers Group PLC | | 50,300 | 1,135,222 |
| Compass Group PLC | | 89,141 | 1,532,414 |
| Dignity PLC | | 32,167 | 1,205,500 |
| Diploma PLC | | 116,690 | 1,153,990 |
| easyJet PLC | | 44,000 | 1,187,032 |
| EMIS Group PLC | | 66,100 | 1,093,384 |
| Essentra PLC | | 89,400 | 1,160,436 |
| Halma PLC | | 93,300 | 1,098,152 |
| Hargreaves Lansdown PLC | | 53,500 | 1,190,948 |
| Hikma Pharmaceuticals PLC | | 35,628 | 1,188,558 |
| Howden Joinery Group PLC | | 175,403 | 1,253,580 |
| Inchcape PLC | | 96,000 | 1,183,209 |
| InterContinental Hotel Group PLC | | 33,000 | 1,318,662 |
| Intertek Group PLC | | 28,330 | 1,146,430 |
| ITV PLC | | 358,400 | 1,394,534 |
| JUST EAT Ltd. (a) | | 172,196 | 1,130,848 |
| London Stock Exchange Group PLC | | 34,163 | 1,340,342 |
| Mondi PLC | | 55,600 | 1,289,123 |
| Moneysupermarket.com Group PLC | | 210,600 | 1,085,017 |
| Persimmon PLC | | 39,400 | 1,211,136 |
| Prudential PLC | | 90,308 | 2,109,278 |
| Reckitt Benckiser Group PLC | | 19,930 | 1,944,979 |
| Rightmove PLC | | 19,930 | 1,179,498 |
| Schroders PLC | | 28,000 | 1,287,606 |
| St. James's Place Capital PLC | | 90,019 | 1,338,468 |
| Standard Life PLC | | 215,755 | 1,399,947 |
| Taylor Wimpey PLC | | 398,000 | 1,214,842 |
| The Restaurant Group PLC | | 98,215 | 1,085,597 |
| Whitbread PLC | | 19,455 | 1,489,394 |
|
| TOTAL UNITED KINGDOM | | | 44,687,443 |
|
| United States of America - 18.4% | | | |
| A.O. Smith Corp. | | 14,777 | 1,135,169 |
| Acuity Brands, Inc. | | 5,340 | 1,167,324 |
| Alphabet, Inc. Class C | | 1,530 | 1,087,539 |
| Amphenol Corp. Class A | | 20,108 | 1,090,256 |
| Apple, Inc. | | 9,550 | 1,141,225 |
| AutoZone, Inc. (a) | | 1,341 | 1,051,894 |
| Cerner Corp. (a) | | 17,480 | 1,158,749 |
| Cognizant Technology Solutions Corp. Class A (a) | | 16,120 | 1,097,933 |
| Danaher Corp. | | 11,900 | 1,110,389 |
| Domino's Pizza, Inc. | | 10,610 | 1,131,769 |
| Ecolab, Inc. | | 9,250 | 1,113,238 |
| Facebook, Inc. Class A (a) | | 10,970 | 1,118,611 |
| FactSet Research Systems, Inc. | | 6,200 | 1,085,744 |
| Fidelity National Information Services, Inc. | | 14,750 | 1,075,570 |
| Fiserv, Inc. (a) | | 11,679 | 1,127,140 |
| FleetCor Technologies, Inc. (a) | | 7,980 | 1,155,983 |
| Gartner, Inc. Class A (a) | | 12,460 | 1,129,748 |
| Henry Schein, Inc. (a) | | 7,230 | 1,096,863 |
| Home Depot, Inc. | | 8,590 | 1,062,068 |
| IMS Health Holdings, Inc. (a) | | 44,500 | 1,211,290 |
| International Flavors & Fragrances, Inc. | | 10,050 | 1,166,403 |
| L Brands, Inc. | | 11,220 | 1,076,896 |
| MasterCard, Inc. Class A | | 10,900 | 1,078,991 |
| McGraw Hill Financial, Inc. | | 12,214 | 1,131,505 |
| Mettler-Toledo International, Inc. (a) | | 4,000 | 1,243,960 |
| Middleby Corp. (a) | | 9,350 | 1,093,389 |
| Moody's Corp. | | 11,720 | 1,126,995 |
| MSCI, Inc. Class A | | 8,000 | 536,000 |
| NIKE, Inc. Class B | | 8,270 | 1,083,618 |
| O'Reilly Automotive, Inc. (a) | | 4,230 | 1,168,580 |
| PPG Industries, Inc. | | 11,890 | 1,239,651 |
| Priceline Group, Inc. (a) | | 796 | 1,157,575 |
| ServiceMaster Global Holdings, Inc. (a) | | 33,000 | 1,176,450 |
| Sherwin-Williams Co. | | 4,640 | 1,238,091 |
| Starbucks Corp. | | 17,600 | 1,101,232 |
| The Hain Celestial Group, Inc. (a) | | 22,100 | 1,101,685 |
| The Walt Disney Co. | | 9,943 | 1,130,917 |
| TJX Companies, Inc. | | 15,600 | 1,141,764 |
| TransDigm Group, Inc. (a) | | 5,070 | 1,114,640 |
| Union Pacific Corp. | | 12,040 | 1,075,774 |
| Verisk Analytics, Inc. (a) | | 16,250 | 1,163,663 |
| Visa, Inc. Class A | | 14,140 | 1,096,981 |
| Wabtec Corp. | | 13,694 | 1,134,822 |
|
| TOTAL UNITED STATES OF AMERICA | | | 47,928,084 |
|
| TOTAL COMMON STOCKS | | | |
| (Cost $241,632,009) | | | 255,529,823 |
|
| Nonconvertible Preferred Stocks - 0.4% | | | |
| Germany - 0.4% | | | |
| Sartorius AG (non-vtg.) | | | |
| (Cost $667,892) | | 4,957 | 1,121,809 |
|
| Money Market Funds - 1.7% | | | |
| Fidelity Cash Central Fund, 0.18% (d) | | 3,983,113 | 3,983,113 |
| Fidelity Securities Lending Cash Central Fund, 0.19% (d)(e) | | 318,800 | 318,800 |
| TOTAL MONEY MARKET FUNDS | | | |
| (Cost $4,301,913) | | | 4,301,913 |
| TOTAL INVESTMENT PORTFOLIO - 100.4% | | | |
| (Cost $246,601,814) | | | 260,953,545 |
| NET OTHER ASSETS (LIABILITIES) - (0.4)% | | | (934,337) |
| NET ASSETS - 100% | | | $260,019,208 |
Categorizations in the Schedule of Investments are based on country or territory of incorporation.
Legend
(a) Non-income producing
(b) Security exempt from registration under Rule 144A of the Securities Act of 1933. These securities may be resold in transactions exempt from registration, normally to qualified institutional buyers. At the end of the period, the value of these securities amounted to $1,129,611 or 0.4% of net assets.
(c) Security or a portion of the security is on loan at period end.
(d) Affiliated fund that is generally available only to investment companies and other accounts managed by Fidelity Investments. The rate quoted is the annualized seven-day yield of the fund at period end. A complete unaudited listing of the fund's holdings as of its most recent quarter end is available upon request. In addition, each Fidelity Central Fund's financial statements, which are not covered by the Fund's Report of Independent Registered Public Accounting Firm, are available on the SEC's website or upon request.
(e) Investment made with cash collateral received from securities on loan.
Affiliated Central Funds
Information regarding fiscal year to date income earned by the Fund from investments in Fidelity Central Funds is as follows:
| Fund | Income earned |
| Fidelity Cash Central Fund | $4,929 |
| Fidelity Securities Lending Cash Central Fund | 24,549 |
| Total | $29,478 |
Investment Valuation
The following is a summary of the inputs used, as of October 31, 2015, involving the Fund's assets and liabilities carried at fair value. The inputs or methodology used for valuing securities may not be an indication of the risk associated with investing in those securities. For more information on valuation inputs, and their aggregation into the levels used below, please refer to the Investment Valuation section in the accompanying Notes to Financial Statements.
| | Valuation Inputs at Reporting Date: |
| Description | Total | Level 1 | Level 2 | Level 3 |
| Investments in Securities: | | | | |
| Equities: | | | | |
| Consumer Discretionary | $59,801,633 | $46,532,271 | $13,269,362 | $-- |
| Consumer Staples | 11,060,005 | 6,897,007 | 4,162,998 | -- |
| Financials | 30,574,952 | 21,326,250 | 9,248,702 | -- |
| Health Care | 43,754,655 | 30,516,758 | 13,237,897 | -- |
| Industrials | 46,525,765 | 33,060,988 | 13,464,777 | -- |
| Information Technology | 45,506,626 | 38,658,767 | 6,847,859 | -- |
| Materials | 19,427,996 | 13,299,456 | 6,128,540 | -- |
| Money Market Funds | 4,301,913 | 4,301,913 | -- | -- |
| Total Investments in Securities: | $260,953,545 | $194,593,410 | $66,360,135 | $-- |
The following is a summary of transfers between Level 1 and Level 2 for the period ended October 31, 2015. Transfers are assumed to have occurred at the beginning of the period, and are primarily attributable to the valuation techniques used for foreign equity securities, as discussed in the accompanying Notes to Financial Statements:
| Transfers | Total |
| Level 1 to Level 2 | $4,691,453 |
| Level 2 to Level 1 | $0 |
See accompanying notes which are an integral part of the financial statements.
Financial Statements
Statement of Assets and Liabilities
| | | October 31, 2015 |
| Assets | | |
Investment in securities, at value (including securities loaned of $309,468) — See accompanying schedule:
Unaffiliated issuers (cost $242,299,901) | $256,651,632 | |
| Fidelity Central Funds (cost $4,301,913) | 4,301,913 | |
| Total Investments (cost $246,601,814) | | $260,953,545 |
| Foreign currency held at value (cost $259,034) | | 259,344 |
| Receivable for investments sold | | 6,131,704 |
| Receivable for fund shares sold | | 761,785 |
| Dividends receivable | | 327,758 |
| Distributions receivable from Fidelity Central Funds | | 564 |
| Prepaid expenses | | 656 |
| Other receivables | | 266,008 |
| Total assets | | 268,701,364 |
| Liabilities | | |
| Payable for investments purchased | $7,774,342 | |
| Payable for fund shares redeemed | 189,689 | |
| Accrued management fee | 179,653 | |
| Distribution and service plan fees payable | 73,830 | |
| Other affiliated payables | 57,383 | |
| Other payables and accrued expenses | 88,459 | |
| Collateral on securities loaned, at value | 318,800 | |
| Total liabilities | | 8,682,156 |
| Net Assets | | $260,019,208 |
| Net Assets consist of: | | |
| Paid in capital | | $311,032,741 |
| Undistributed net investment income | | 218,436 |
| Accumulated undistributed net realized gain (loss) on investments and foreign currency transactions | | (65,473,731) |
| Net unrealized appreciation (depreciation) on investments and assets and liabilities in foreign currencies | | 14,241,762 |
| Net Assets | | $260,019,208 |
| Calculation of Maximum Offering Price | | |
| Class A: | | |
| Net Asset Value and redemption price per share ($89,753,029 ÷ 5,884,115 shares) | | $15.25 |
| Maximum offering price per share (100/94.25 of $15.25) | | $16.18 |
| Class T: | | |
| Net Asset Value and redemption price per share ($60,293,235 ÷ 4,035,684 shares) | | $14.94 |
| Maximum offering price per share (100/96.50 of $14.94) | | $15.48 |
| Class B: | | |
| Net Asset Value and offering price per share ($1,060,778 ÷ 77,172 shares)(a) | | $13.75 |
| Class C: | | |
| Net Asset Value and offering price per share ($36,491,269 ÷ 2,665,083 shares)(a) | | $13.69 |
| Class I: | | |
| Net Asset Value, offering price and redemption price per share ($72,420,897 ÷ 4,449,454 shares) | | $16.28 |
(a) Redemption price per share is equal to net asset value less any applicable contingent deferred sales charge.
See accompanying notes which are an integral part of the financial statements.
Statement of Operations
| | | Year ended October 31, 2015 |
| Investment Income | | |
| Dividends | | $3,976,431 |
| Income from Fidelity Central Funds | | 29,478 |
| Income before foreign taxes withheld | | 4,005,909 |
| Less foreign taxes withheld | | (253,127) |
| Total income | | 3,752,782 |
| Expenses | | |
| Management fee | | |
| Basic fee | $1,514,810 | |
| Performance adjustment | 290,902 | |
| Transfer agent fees | 501,343 | |
| Distribution and service plan fees | 788,433 | |
| Accounting and security lending fees | 112,620 | |
| Custodian fees and expenses | 295,235 | |
| Independent trustees' compensation | 882 | |
| Registration fees | 79,209 | |
| Audit | 90,184 | |
| Legal | 676 | |
| Miscellaneous | 1,534 | |
| Total expenses before reductions | 3,675,828 | |
| Expense reductions | (327,325) | 3,348,503 |
| Net investment income (loss) | | 404,279 |
| Realized and Unrealized Gain (Loss) | | |
| Net realized gain (loss) on: | | |
| Investment securities: | | |
| Unaffiliated issuers (net of foreign taxes of $46,248) | 3,704,653 | |
| Foreign currency transactions | (125,449) | |
| Total net realized gain (loss) | | 3,579,204 |
Change in net unrealized appreciation (depreciation) on:
Investment securities (net of decrease in deferred foreign taxes of $96,847) | 761,197 | |
| Assets and liabilities in foreign currencies | (17,330) | |
| Total change in net unrealized appreciation (depreciation) | | 743,867 |
| Net gain (loss) | | 4,323,071 |
| Net increase (decrease) in net assets resulting from operations | | $4,727,350 |
See accompanying notes which are an integral part of the financial statements.
Statement of Changes in Net Assets
| | Year ended October 31, 2015 | Year ended October 31, 2014 |
| Increase (Decrease) in Net Assets | | |
| Operations | | |
| Net investment income (loss) | $404,279 | $313,539 |
| Net realized gain (loss) | 3,579,204 | 17,397,899 |
| Change in net unrealized appreciation (depreciation) | 743,867 | (9,394,840) |
| Net increase (decrease) in net assets resulting from operations | 4,727,350 | 8,316,598 |
| Distributions to shareholders from net investment income | (176,462) | (450,291) |
| Share transactions - net increase (decrease) | 104,495,853 | 1,810,485 |
| Redemption fees | 14,747 | 1,603 |
| Total increase (decrease) in net assets | 109,061,488 | 9,678,395 |
| Net Assets | | |
| Beginning of period | 150,957,720 | 141,279,325 |
| End of period (including undistributed net investment income of $218,436 and undistributed net investment income of $157,952, respectively) | $260,019,208 | $150,957,720 |
See accompanying notes which are an integral part of the financial statements.
Financial Highlights — Fidelity Advisor International Capital Appreciation Fund Class A
| Years ended October 31, | 2015 | 2014 | 2013 | 2012 | 2011 |
| Selected Per–Share Data | | | | | |
| Net asset value, beginning of period | $14.77 | $13.96 | $11.25 | $10.21 | $10.85 |
| Income from Investment Operations | | | | | |
| Net investment income (loss)A | .05 | .06 | .07 | .08 | .08B |
| Net realized and unrealized gain (loss) | .46 | .82 | 2.73 | 1.05 | (.53) |
| Total from investment operations | .51 | .88 | 2.80 | 1.13 | (.45) |
| Distributions from net investment income | (.03) | (.07) | (.09) | (.09) | (.08) |
| Distributions from net realized gain | – | – | – | (.01) | (.12) |
| Total distributions | (.03) | (.07) | (.09) | (.09)C | (.19)D |
| Redemption fees added to paid in capitalA,E | – | – | – | – | – |
| Net asset value, end of period | $15.25 | $14.77 | $13.96 | $11.25 | $10.21 |
| Total ReturnF,G | 3.46% | 6.31% | 24.99% | 11.19% | (4.25)% |
| Ratios to Average Net AssetsH,I | | | | | |
| Expenses before reductions | 1.58% | 1.73% | 1.74% | 1.78% | 1.64% |
| Expenses net of fee waivers, if any | 1.45% | 1.45% | 1.45% | 1.45% | 1.45% |
| Expenses net of all reductions | 1.42% | 1.44% | 1.39% | 1.41% | 1.38% |
| Net investment income (loss) | .30% | .42% | .58% | .73% | .74%B |
| Supplemental Data | | | | | |
| Net assets, end of period (000 omitted) | $89,753 | $51,567 | $49,797 | $40,624 | $40,364 |
| Portfolio turnover rateJ | 176% | 197% | 138% | 142% | 254% |
A Calculated based on average shares outstanding during the period.
B Investment income per share reflects a large, non-recurring dividend which amounted to $.03 per share. Excluding this non-recurring dividend, the ratio of net investment income (loss) to average net assets would have been .49%.
C Total distributions of $.09 per share is comprised of distributions from net investment income of $.085 and distributions from net realized gain of $.005 per share.
D Total distributions of $.19 per share is comprised of distributions from net investment income of $.077 and distributions from net realized gain of $.116 per share.
E Amount represents less than $.005 per share.
F Total returns would have been lower if certain expenses had not been reduced during the applicable periods shown.
G Total returns do not include the effect of the sales charges.
H Fees and expenses of any underlying Fidelity Central Funds are not included in the Fund's expense ratio. The Fund indirectly bears its proportionate share of the expenses of any underlying Fidelity Central Funds.
I Expense ratios reflect operating expenses of the class. Expenses before reductions do not reflect amounts reimbursed by the investment adviser or reductions from brokerage service arrangements or reductions from other expense offset arrangements and do not represent the amount paid by the class during periods when reimbursements or reductions occur. Expenses net of fee waivers reflect expenses after reimbursement by the investment adviser but prior to reductions from brokerage service arrangements or other expense offset arrangements. Expenses net of all reductions represent the net expenses paid by the class.
J Amount does not include the portfolio activity of any underlying Fidelity Central Funds.
See accompanying notes which are an integral part of the financial statements.
Financial Highlights — Fidelity Advisor International Capital Appreciation Fund Class T
| Years ended October 31, | 2015 | 2014 | 2013 | 2012 | 2011 |
| Selected Per–Share Data | | | | | |
| Net asset value, beginning of period | $14.47 | $13.68 | $11.03 | $10.00 | $10.63 |
| Income from Investment Operations | | | | | |
| Net investment income (loss)A | .01 | .02 | .04 | .05 | .05B |
| Net realized and unrealized gain (loss) | .46 | .81 | 2.66 | 1.04 | (.52) |
| Total from investment operations | .47 | .83 | 2.70 | 1.09 | (.47) |
| Distributions from net investment income | – | (.04) | (.05) | (.06) | (.05) |
| Distributions from net realized gain | – | – | – | (.01) | (.12) |
| Total distributions | – | (.04) | (.05) | (.06)C | (.16)D |
| Redemption fees added to paid in capitalA,E | – | – | – | – | – |
| Net asset value, end of period | $14.94 | $14.47 | $13.68 | $11.03 | $10.00 |
| Total ReturnF,G | 3.25% | 6.07% | 24.57% | 10.99% | (4.51)% |
| Ratios to Average Net AssetsH,I | | | | | |
| Expenses before reductions | 1.86% | 1.94% | 1.96% | 2.03% | 1.88% |
| Expenses net of fee waivers, if any | 1.70% | 1.70% | 1.70% | 1.70% | 1.70% |
| Expenses net of all reductions | 1.67% | 1.69% | 1.64% | 1.66% | 1.62% |
| Net investment income (loss) | .05% | .17% | .33% | .48% | .49%B |
| Supplemental Data | | | | | |
| Net assets, end of period (000 omitted) | $60,293 | $58,454 | $60,152 | $53,835 | $59,914 |
| Portfolio turnover rateJ | 176% | 197% | 138% | 142% | 254% |
A Calculated based on average shares outstanding during the period.
B Investment income per share reflects a large, non-recurring dividend which amounted to $.03 per share. Excluding this non-recurring dividend, the ratio of net investment income (loss) to average net assets would have been .24%.
C Total distributions of $.06 per share is comprised of distributions from net investment income of $.056 and distributions from net realized gain of $.005 per share.
D Total distributions of $.16 per share is comprised of distributions from net investment income of $.047 and distributions from net realized gain of $.116 per share.
E Amount represents less than $.005 per share.
F Total returns would have been lower if certain expenses had not been reduced during the applicable periods shown.
G Total returns do not include the effect of the sales charges.
H Fees and expenses of any underlying Fidelity Central Funds are not included in the Fund's expense ratio. The Fund indirectly bears its proportionate share of the expenses of any underlying Fidelity Central Funds.
I Expense ratios reflect operating expenses of the class. Expenses before reductions do not reflect amounts reimbursed by the investment adviser or reductions from brokerage service arrangements or reductions from other expense offset arrangements and do not represent the amount paid by the class during periods when reimbursements or reductions occur. Expenses net of fee waivers reflect expenses after reimbursement by the investment adviser but prior to reductions from brokerage service arrangements or other expense offset arrangements. Expenses net of all reductions represent the net expenses paid by the class.
J Amount does not include the portfolio activity of any underlying Fidelity Central Funds.
See accompanying notes which are an integral part of the financial statements.
Financial Highlights — Fidelity Advisor International Capital Appreciation Fund Class B
| Years ended October 31, | 2015 | 2014 | 2013 | 2012 | 2011 |
| Selected Per–Share Data | | | | | |
| Net asset value, beginning of period | $13.38 | $12.68 | $10.22 | $9.26 | $9.84 |
| Income from Investment Operations | | | | | |
| Net investment income (loss)A | (.06) | (.04) | (.02) | –B | –B,C |
| Net realized and unrealized gain (loss) | .43 | .74 | 2.48 | .96 | (.48) |
| Total from investment operations | .37 | .70 | 2.46 | .96 | (.48) |
| Distributions from net investment income | – | – | – | – | (.01) |
| Distributions from net realized gain | – | – | – | – | (.09) |
| Total distributions | – | – | – | – | (.10) |
| Redemption fees added to paid in capitalA,B | – | – | – | – | – |
| Net asset value, end of period | $13.75 | $13.38 | $12.68 | $10.22 | $9.26 |
| Total ReturnD,E | 2.77% | 5.52% | 24.07% | 10.37% | (4.99)% |
| Ratios to Average Net AssetsF,G | | | | | |
| Expenses before reductions | 2.44% | 2.50% | 2.51% | 2.54% | 2.39% |
| Expenses net of fee waivers, if any | 2.20% | 2.20% | 2.20% | 2.20% | 2.20% |
| Expenses net of all reductions | 2.18% | 2.19% | 2.15% | 2.16% | 2.13% |
| Net investment income (loss) | (.46)% | (.33)% | (.17)% | (.02)% | (.01)%C |
| Supplemental Data | | | | | |
| Net assets, end of period (000 omitted) | $1,061 | $1,577 | $2,228 | $2,745 | $4,241 |
| Portfolio turnover rateH | 176% | 197% | 138% | 142% | 254% |
A Calculated based on average shares outstanding during the period.
B Amount represents less than $.005 per share.
C Investment income per share reflects a large, non-recurring dividend which amounted to $.03 per share. Excluding this non-recurring dividend, the ratio of net investment income (loss) to average net assets would have been (.26) %.
D Total returns would have been lower if certain expenses had not been reduced during the applicable periods shown.
E Total returns do not include the effect of the contingent deferred sales charge.
F Fees and expenses of any underlying Fidelity Central Funds are not included in the Fund's expense ratio. The Fund indirectly bears its proportionate share of the expenses of any underlying Fidelity Central Funds.
G Expense ratios reflect operating expenses of the class. Expenses before reductions do not reflect amounts reimbursed by the investment adviser or reductions from brokerage service arrangements or reductions from other expense offset arrangements and do not represent the amount paid by the class during periods when reimbursements or reductions occur. Expenses net of fee waivers reflect expenses after reimbursement by the investment adviser but prior to reductions from brokerage service arrangements or other expense offset arrangements. Expenses net of all reductions represent the net expenses paid by the class.
H Amount does not include the portfolio activity of any underlying Fidelity Central Funds.
See accompanying notes which are an integral part of the financial statements.
Financial Highlights — Fidelity Advisor International Capital Appreciation Fund Class C
| Years ended October 31, | 2015 | 2014 | 2013 | 2012 | 2011 |
| Selected Per–Share Data | | | | | |
| Net asset value, beginning of period | $13.33 | $12.63 | $10.18 | $9.23 | $9.84 |
| Income from Investment Operations | | | | | |
| Net investment income (loss)A | (.06) | (.04) | (.02) | –B | –B,C |
| Net realized and unrealized gain (loss) | .42 | .74 | 2.47 | .96 | (.49) |
| Total from investment operations | .36 | .70 | 2.45 | .96 | (.49) |
| Distributions from net investment income | – | – | – | (.01) | (.01) |
| Distributions from net realized gain | – | – | – | (.01) | (.11) |
| Total distributions | – | – | – | (.01)D | (.12) |
| Redemption fees added to paid in capitalA,B | – | – | – | – | – |
| Net asset value, end of period | $13.69 | $13.33 | $12.63 | $10.18 | $9.23 |
| Total ReturnE,F | 2.70% | 5.54% | 24.07% | 10.41% | (5.07)% |
| Ratios to Average Net AssetsG,H | | | | | |
| Expenses before reductions | 2.33% | 2.47% | 2.49% | 2.53% | 2.39% |
| Expenses net of fee waivers, if any | 2.20% | 2.20% | 2.20% | 2.20% | 2.20% |
| Expenses net of all reductions | 2.17% | 2.19% | 2.14% | 2.16% | 2.13% |
| Net investment income (loss) | (.45)% | (.33)% | (.17)% | (.02)% | (.01)%C |
| Supplemental Data | | | | | |
| Net assets, end of period (000 omitted) | $36,491 | $20,910 | $21,334 | $18,090 | $19,619 |
| Portfolio turnover rateI | 176% | 197% | 138% | 142% | 254% |
A Calculated based on average shares outstanding during the period.
B Amount represents less than $.005 per share.
C Investment income per share reflects a large, non-recurring dividend which amounted to $.03 per share. Excluding this non-recurring dividend, the ratio of net investment income (loss) to average net assets would have been (.26) %.
D Total distributions of $.01 per share is comprised of distributions from net investment income of $.005 and distributions from net realized gain of $.005 per share.
E Total returns would have been lower if certain expenses had not been reduced during the applicable periods shown.
F Total returns do not include the effect of the contingent deferred sales charge.
G Fees and expenses of any underlying Fidelity Central Funds are not included in the Fund's expense ratio. The Fund indirectly bears its proportionate share of the expenses of any underlying Fidelity Central Funds.
H Expense ratios reflect operating expenses of the class. Expenses before reductions do not reflect amounts reimbursed by the investment adviser or reductions from brokerage service arrangements or reductions from other expense offset arrangements and do not represent the amount paid by the class during periods when reimbursements or reductions occur. Expenses net of fee waivers reflect expenses after reimbursement by the investment adviser but prior to reductions from brokerage service arrangements or other expense offset arrangements. Expenses net of all reductions represent the net expenses paid by the class.
I Amount does not include the portfolio activity of any underlying Fidelity Central Funds.
See accompanying notes which are an integral part of the financial statements.
Financial Highlights — Fidelity Advisor International Capital Appreciation Fund Class I
| Years ended October 31, | 2015 | 2014 | 2013 | 2012 | 2011 |
| Selected Per–Share Data | | | | | |
| Net asset value, beginning of period | $15.75 | $14.87 | $11.99 | $10.87 | $11.54 |
| Income from Investment Operations | | | | | |
| Net investment income (loss)A | .09 | .10 | .11 | .11 | .12B |
| Net realized and unrealized gain (loss) | .51 | .87 | 2.89 | 1.13 | (.57) |
| Total from investment operations | .60 | .97 | 3.00 | 1.24 | (.45) |
| Distributions from net investment income | (.07) | (.09) | (.12) | (.12) | (.11) |
| Distributions from net realized gain | – | – | – | (.01) | (.12) |
| Total distributions | (.07) | (.09) | (.12) | (.12)C | (.22)D |
| Redemption fees added to paid in capitalA,E | – | – | – | – | – |
| Net asset value, end of period | $16.28 | $15.75 | $14.87 | $11.99 | $10.87 |
| Total ReturnF | 3.80% | 6.58% | 25.20% | 11.56% | (4.01)% |
| Ratios to Average Net AssetsG,H | | | | | |
| Expenses before reductions | 1.27% | 1.38% | 1.39% | 1.48% | 1.35% |
| Expenses net of fee waivers, if any | 1.20% | 1.20% | 1.20% | 1.20% | 1.20% |
| Expenses net of all reductions | 1.17% | 1.20% | 1.14% | 1.16% | 1.12% |
| Net investment income (loss) | .55% | .67% | .83% | .98% | 1.00%B |
| Supplemental Data | | | | | |
| Net assets, end of period (000 omitted) | $72,421 | $18,449 | $7,768 | $4,568 | $4,335 |
| Portfolio turnover rateI | 176% | 197% | 138% | 142% | 254% |
A Calculated based on average shares outstanding during the period.
B Investment income per share reflects a large, non-recurring dividend which amounted to $.03 per share. Excluding this non-recurring dividend, the ratio of net investment income (loss) to average net assets would have been .74%.
C Total distributions of $.12 per share is comprised of distributions from net investment income of $.115 and distributions from net realized gain of $.005 per share.
D Total distributions of $.22 per share is comprised of distributions from net investment income of $.107 and distributions from net realized gain of $.116 per share.
E Amount represents less than $.005 per share.
F Total returns would have been lower if certain expenses had not been reduced during the applicable periods shown.
G Fees and expenses of any underlying Fidelity Central Funds are not included in the Fund's expense ratio. The Fund indirectly bears its proportionate share of the expenses of any underlying Fidelity Central Funds.
H Expense ratios reflect operating expenses of the class. Expenses before reductions do not reflect amounts reimbursed by the investment adviser or reductions from brokerage service arrangements or reductions from other expense offset arrangements and do not represent the amount paid by the class during periods when reimbursements or reductions occur. Expenses net of fee waivers reflect expenses after reimbursement by the investment adviser but prior to reductions from brokerage service arrangements or other expense offset arrangements. Expenses net of all reductions represent the net expenses paid by the class.
I Amount does not include the portfolio activity of any underlying Fidelity Central Funds.
See accompanying notes which are an integral part of the financial statements.
Notes to Financial Statements
For the period ended October 31, 2015
1. Organization.
Fidelity Advisor International Capital Appreciation Fund (the Fund) is a fund of Fidelity Advisor Series VIII (the Trust) and is authorized to issue an unlimited number of shares. The Trust is registered under the Investment Company Act of 1940, as amended (the 1940 Act), as an open-end management investment company organized as a Massachusetts business trust. The Fund offers Class A, Class T, Class C and Class I (formerly Institutional Class) shares, each of which, along with Class B shares, has equal rights as to assets and voting privileges. Class B shares are closed to new accounts and additional purchases, except for exchanges and reinvestments. Each class has exclusive voting rights with respect to matters that affect that class. Class B shares will automatically convert to Class A shares after a holding period of seven years from the initial date of purchase. The Fund's investments in emerging markets can be subject to social, economic, regulatory, and political uncertainties and can be extremely volatile.
2. Investments in Fidelity Central Funds.
The Fund invests in Fidelity Central Funds, which are open-end investment companies generally available only to other investment companies and accounts managed by the investment adviser and its affiliates. The Fund's Schedule of Investments lists each of the Fidelity Central Funds held as of period end, if any, as an investment of the Fund, but does not include the underlying holdings of each Fidelity Central Fund. As an Investing Fund, the Fund indirectly bears its proportionate share of the expenses of the underlying Fidelity Central Funds.
The Money Market Central Funds seek preservation of capital and current income and are managed by Fidelity Investments Money Management, Inc. (FIMM), an affiliate of the investment adviser. Annualized expenses of the Money Market Central Funds as of their most recent shareholder report date are less than .005%.
A complete unaudited list of holdings for each Fidelity Central Fund is available upon request or at the Securities and Exchange Commission (the SEC) website at www.sec.gov. In addition, the financial statements of the Fidelity Central Funds, which are not covered by the Fund's Report of Independent Registered Public Accounting Firm, are available on the SEC website or upon request.
3. Significant Accounting Policies.
The financial statements have been prepared in conformity with accounting principles generally accepted in the United States of America (GAAP), which require management to make certain estimates and assumptions at the date of the financial statements. Actual results could differ from those estimates. Subsequent events, if any, through the date that the financial statements were issued have been evaluated in the preparation of the financial statements. The following summarizes the significant accounting policies of the Fund:
Investment Valuation. Investments are valued as of 4:00 p.m. Eastern time on the last calendar day of the period. The Board of Trustees (the Board) has delegated the day to day responsibility for the valuation of the Fund's investments to the Fidelity Management & Research Company (FMR) Fair Value Committee (the Committee). In accordance with valuation policies and procedures approved by the Board, the Fund attempts to obtain prices from one or more third party pricing vendors or brokers to value its investments. When current market prices, quotations or currency exchange rates are not readily available or reliable, investments will be fair valued in good faith by the Committee, in accordance with procedures adopted by the Board. Factors used in determining fair value vary by investment type and may include market or investment specific events. The frequency with which these procedures are used cannot be predicted and they may be utilized to a significant extent. The Committee oversees the Fund's valuation policies and procedures and reports to the Board on the Committee's activities and fair value determinations. The Board monitors the appropriateness of the procedures used in valuing the Fund's investments and ratifies the fair value determinations of the Committee.
The Fund categorizes the inputs to valuation techniques used to value its investments into a disclosure hierarchy consisting of three levels as shown below:
- Level 1 – quoted prices in active markets for identical investments
- Level 2 – other significant observable inputs (including quoted prices for similar investments, interest rates, prepayment speeds, etc.)
- Level 3 – unobservable inputs (including the Fund's own assumptions based on the best information available)
Valuation techniques used to value the Fund's investments by major category are as follows:
Equity securities, including restricted securities, for which market quotations are readily available, are valued at the last reported sale price or official closing price as reported by a third party pricing vendor on the primary market or exchange on which they are traded and are categorized as Level 1 in the hierarchy. In the event there were no sales during the day or closing prices are not available, securities are valued at the last quoted bid price or may be valued using the last available price and are generally categorized as Level 2 in the hierarchy. For foreign equity securities, when market or security specific events arise, comparisons to the valuation of American Depositary Receipts (ADRs), futures contracts, Exchange-Traded Funds (ETFs) and certain indexes as well as quoted prices for similar securities may be used and would be categorized as Level 2 in the hierarchy. Utilizing these techniques may result in transfers between Level 1 and Level 2. For equity securities, including restricted securities, where observable inputs are limited, assumptions about market activity and risk are used and these securities may be categorized as Level 3 in the hierarchy.
Investments in open-end mutual funds, including the Fidelity Central Funds, are valued at their closing net asset value (NAV) each business day and are categorized as Level 1 in the hierarchy.
Changes in valuation techniques may result in transfers in or out of an assigned level within the disclosure hierarchy. The aggregate value of investments by input level as of October 31, 2015, including information on transfers between Levels 1 and 2 is included at the end of the Fund's Schedule of Investments.
Foreign Currency. The Fund may use foreign currency contracts to facilitate transactions in foreign-denominated securities. Gains and losses from these transactions may arise from changes in the value of the foreign currency or if the counterparties do not perform under the contracts' terms.
Foreign-denominated assets, including investment securities, and liabilities are translated into U.S. dollars at the exchange rates at period end. Purchases and sales of investment securities, income and dividends received and expenses denominated in foreign currencies are translated into U.S. dollars at the exchange rate in effect on the transaction date.
The effects of exchange rate fluctuations on investments are included with the net realized and unrealized gain (loss) on investment securities. Other foreign currency transactions resulting in realized and unrealized gain (loss) are disclosed separately.
Investment Transactions and Income. For financial reporting purposes, the Fund's investment holdings and NAV include trades executed through the end of the last business day of the period. The NAV per share for processing shareholder transactions is calculated as of the close of business of the New York Stock Exchange (NYSE), normally 4:00 p.m. Eastern time and includes trades executed through the end of the prior business day. Gains and losses on securities sold are determined on the basis of identified cost and may include proceeds received from litigation. Dividend income is recorded on the ex-dividend date, except for certain dividends from foreign securities where the ex-dividend date may have passed, which are recorded as soon as the Fund is informed of the ex-dividend date. Non-cash dividends included in dividend income, if any, are recorded at the fair market value of the securities received. Income and capital gain distributions from Fidelity Central Funds, if any, are recorded on the ex-dividend date. Distributions received on securities that represent a return of capital or capital gain are recorded as a reduction of cost of investments and/or as a realized gain. Subsequent to ex-dividend date the Fund determines the components of these distributions, based upon receipt of tax filings or other correspondence relating to the underlying investment. Investment income is recorded net of foreign taxes withheld where recovery of such taxes is uncertain.
Class Allocations and Expenses. Investment income, realized and unrealized capital gains and losses, common expenses of the Fund, and certain fund-level expense reductions, if any, are allocated daily on a pro-rata basis to each class based on the relative net assets of each class to the total net assets of the Fund. Each class differs with respect to transfer agent and distribution and service plan fees incurred. Certain expense reductions may also differ by class. For the reporting period, the allocated portion of income and expenses to each class as a percent of its average net assets may vary due to the timing of recording these transactions in relation to fluctuating net assets of the classes. Expenses directly attributable to a fund are charged to that fund. Expenses attributable to more than one fund are allocated among the respective funds on the basis of relative net assets or other appropriate methods. Expense estimates are accrued in the period to which they relate and adjustments are made when actual amounts are known.
Income Tax Information and Distributions to Shareholders. Each year, the Fund intends to qualify as a regulated investment company under Subchapter M of the Internal Revenue Code, including distributing substantially all of its taxable income and realized gains. As a result, no provision for U.S. Federal income taxes is required. As of October 31, 2015, the Fund did not have any unrecognized tax benefits in the financial statements; nor is the Fund aware of any tax positions for which it is reasonably possible that the total amounts of unrecognized tax benefits will significantly change in the next twelve months. The Fund files a U.S. federal tax return, in addition to state and local tax returns as required. The Fund's federal income tax returns are subject to examination by the Internal Revenue Service (IRS) for a period of three fiscal years after they are filed. State and local tax returns may be subject to examination for an additional fiscal year depending on the jurisdiction. Foreign taxes are provided for based on the Fund's understanding of the tax rules and rates that exist in the foreign markets in which it invests. The Fund is subject to a tax imposed on capital gains by certain countries in which it invests.
Distributions are declared and recorded on the ex-dividend date. Income dividends and capital gain distributions are declared separately for each class. Income and capital gain distributions are determined in accordance with income tax regulations, which may differ from GAAP.
Capital accounts within the financial statements are adjusted for permanent book-tax differences. These adjustments have no impact on net assets or the results of operations. Capital accounts are not adjusted for temporary book-tax differences which will reverse in a subsequent period.
Book-tax differences are primarily due to foreign currency transactions, certain foreign taxes, passive foreign investment companies (PFIC), capital loss carryforwards and losses deferred due to wash sales.
The federal tax cost of investment securities and unrealized appreciation (depreciation) as of period end were as follows:
| Gross unrealized appreciation | $21,219,634 |
| Gross unrealized depreciation | (7,497,134) |
| Net unrealized appreciation (depreciation) on securities | $ 13,722,500 |
| Tax Cost | $247,231,045 |
The tax-based components of distributable earnings as of period end were as follows:
| Undistributed ordinary income | $221,581 |
| Capital loss carryforward | $(64,844,500) |
| Net unrealized appreciation (depreciation) on securities and other investments | $13,603,609 |
Capital loss carryforwards are only available to offset future capital gains of the Fund to the extent provided by regulations and may be limited. Under the Regulated Investment Company Modernization Act of 2010 (the Act), the Fund is permitted to carry forward capital losses incurred in taxable years beginning after December 22, 2010 for an unlimited period and such capital losses are required to be used prior to any losses that expire. The capital loss carryforward information presented below, including any applicable limitation, is estimated as of fiscal period end and is subject to adjustment.
| Fiscal year of expiration | |
| 2016 | $(40,876,628) |
| 2017 | (23,967,872) |
| Total capital loss carryforward | $(64,844,500) |
The tax character of distributions paid was as follows:
| | October 31, 2015 | October 31, 2014 |
| Ordinary Income | $176,462 | $ 450,291 |
Short-Term Trading (Redemption) Fees. During the period, shares held by investors in the Fund less than 30 days may have been subject to a redemption fee equal to 1.00% of the NAV of shares redeemed. All redemption fees, which reduce the proceeds of the shareholder redemption, are retained by the Fund and accounted for as an addition to paid in capital.
Restricted Securities. The Fund may invest in securities that are subject to legal or contractual restrictions on resale. These securities generally may be resold in transactions exempt from registration or to the public if the securities are registered. Disposal of these securities may involve time-consuming negotiations and expense, and prompt sale at an acceptable price may be difficult. Information regarding restricted securities is included at the end of the Fund's Schedule of Investments.
4. Purchases and Sales of Investments.
Purchases and sales of securities , other than short-term securities, aggregated $478,091,318 and $375,109,987, respectively.
5. Fees and Other Transactions with Affiliates.
Management Fee. Fidelity Management & Research Company (the investment adviser) and its affiliates provide the Fund with investment management related services for which the Fund pays a monthly management fee. The management fee is the sum of an individual fund fee rate that is based on an annual rate of .45% of the Fund's average net assets and an annualized group fee rate that averaged .25% during the period. The group fee rate is based upon the average net assets of all the mutual funds advised by the investment adviser, including any mutual funds previously advised by the investment adviser that are currently advised by Fidelity SelectCo, LLC, an affiliate of the investment adviser. The group fee rate decreases as assets under management increase and increases as assets under management decrease. In addition, the management fee is subject to a performance adjustment (up to a maximum of +/- .20% of the Fund's average net assets over a 36 month performance period). The upward or downward adjustment to the management fee is based on the relative investment performance of Class I of the Fund as compared to its benchmark index, the MSCI All Country World ex USA Index, over the same 36 month performance period. For the reporting period, the total annual management fee rate, including the performance adjustment, was .83% of the Fund's average net assets. The performance adjustment included in the management fee rate may be higher or lower than the maximum performance adjustment rate due to the difference between the average net assets for the reporting and performance periods.
Distribution and Service Plan Fees. In accordance with Rule 12b-1 of the 1940 Act, the Fund has adopted separate Distribution and Service Plans for each class of shares. Certain classes pay Fidelity Distributors Corporation (FDC), an affiliate of the investment adviser, separate Distribution and Service Fees, each of which is based on an annual percentage of each class' average net assets. In addition, FDC may pay financial intermediaries for selling shares of the Fund and providing shareholder support services. For the period, the Distribution and Service Fee rates, total fees and amounts retained by FDC were as follows:
| | Distribution
Fee | Service
Fee | Total Fees | Retained
by FDC |
| Class A | -% | .25% | $180,407 | $4,819 |
| Class T | .25% | .25% | 300,938 | 1,184 |
| Class B | .75% | .25% | 13,315 | 10,101 |
| Class C | .75% | .25% | 293,773 | 82,942 |
| | | | $788,433 | $99,046 |
Sales Load. FDC may receive a front-end sales charge of up to 5.75% for selling Class A shares and 3.50% for selling Class T shares, some of which is paid to financial intermediaries for selling shares of the Fund. Depending on the holding period, FDC may receive contingent deferred sales charges levied on Class A, Class T, Class B and Class C redemptions. The deferred sales charges range from 5.00% to 1.00% for Class B shares, 1.00% for Class C shares, 1.00% for certain purchases of Class A shares and .25% for certain purchases of Class T shares.
For the period, sales charge amounts retained by FDC were as follows:
| | Retained
by FDC |
| Class A | $63,823 |
| Class T | 8,800 |
| Class B(a) | 525 |
| Class C(a) | 3,660 |
| | $76,808 |
(a) When Class B and Class C shares are initially sold, FDC pays commissions from its own resources to financial intermediaries through which the sales are made.
Transfer Agent Fees. Fidelity Investments Institutional Operations Company, Inc., (FIIOC), an affiliate of the investment adviser, is the transfer, dividend disbursing and shareholder servicing agent for each class of the Fund. FIIOC receives account fees and asset-based fees that vary according to the account size and type of account of the shareholders of the respective classes of the Fund. FIIOC pays for typesetting, printing and mailing of shareholder reports, except proxy statements.
For the period, transfer agent fees for each class were as follows:
| | Amount | % of
Class-Level Average
Net Assets |
| Class A | $174,476 | .24 |
| Class T | 143,834 | .24 |
| Class B | 3,977 | .30 |
| Class C | 72,515 | .25 |
| Class I | 106,541 | .20 |
| | $ 501,343 | |
Accounting and Security Lending Fees. Fidelity Service Company, Inc. (FSC), an affiliate of the investment adviser, maintains the Fund's accounting records. The accounting fee is based on the level of average net assets for each month. Under a separate contract, FSC administers the security lending program. The security lending fee is based on the number and duration of lending transactions.
Brokerage Commissions. The Fund placed a portion of its portfolio transactions with brokerage firms which are affiliates of the investment adviser. Brokerage commissions are included in net realized gain (loss) and change in net unrealized appreciation (depreciation) in the Statement of Operations. The commissions paid to these affiliated firms were $2,071 for the period.
Other. During the period, the investment adviser reimbursed the Fund for certain losses in the amount of $25,348.
6. Committed Line of Credit.
The Fund participates with other funds managed by the investment adviser or an affiliate in a $4.25 billion credit facility (the "line of credit") to be utilized for temporary or emergency purposes to fund shareholder redemptions or for other short-term liquidity purposes. The Fund has agreed to pay commitment fees on its pro-rata portion of the line of credit, which amounted to $292 and is reflected in Miscellaneous expenses on the Statement of Operations. During the period, the Fund did not borrow on this line of credit.
7. Security Lending.
The Fund lends portfolio securities through a lending agent from time to time in order to earn additional income. For equity securities, a lending agent is used and may loan securities to certain qualified borrowers, including Fidelity Capital Markets (FCM), a broker-dealer affiliated with the Fund. On the settlement date of the loan, the Fund receives collateral (in the form of U.S. Treasury obligations, letters of credit and/or cash) against the loaned securities and maintains collateral in an amount not less than 100% of the market value of the loaned securities during the period of the loan. The market value of the loaned securities is determined at the close of business of the Fund and any additional required collateral is delivered to the Fund on the next business day. The Fund or borrower may terminate the loan at any time, and if the borrower defaults on its obligation to return the securities loaned because of insolvency or other reasons, the Fund may apply collateral received from the borrower against the obligation. The Fund may experience delays and costs in recovering the securities loaned. Any cash collateral received is invested in the Fidelity Securities Lending Cash Central Fund. The value of loaned securities and cash collateral at period end are disclosed on the Fund's Statement of Assets and Liabilities. Security lending income represents the income earned on investing cash collateral, less rebates paid to borrowers and any lending agent fees associated with the loan, plus any premium payments received for lending certain types of securities. Security lending income is presented in the Statement of Operations as a component of income from Fidelity Central Funds. Total security lending income during the period amounted to $24,549. During the period, there were no securities loaned to FCM.
8. Expense Reductions.
The investment adviser voluntarily agreed to reimburse each class to the extent annual operating expenses exceeded certain levels of average net assets as noted in the table below. Some expenses, for example interest expense, including commitment fees, are excluded from this reimbursement.
| | Expense
Limitations | Reimbursement |
| Class A | 1.45% | $97,320 |
| Class T | 1.70% | 94,679 |
| Class B | 2.20% | 3,131 |
| Class C | 2.20% | 39,690 |
| Class I | 1.20% | 38,765 |
| | | $273,585 |
Commissions paid to certain brokers with whom the investment adviser, or its affiliates, places trades on behalf of the Fund include an amount in addition to trade execution, which may be rebated back to the Fund to offset certain expenses. This amount totaled $49,718 for the period.
In addition, during the period the investment adviser reimbursed and/or waived a portion of fund-level operating expenses in the amount of $989 and a portion of class-level operating expenses as follows:
| | | Amount |
| Class A | | $900 |
| Class T | | 1,350 |
| Class B | | 3 |
| Class C | | 379 |
| Class I | | 401 |
| | | $3,033 |
9. Distributions to Shareholders.
Distributions to shareholders of each class were as follows:
| Years ended October 31, | 2015 | 2014 |
| From net investment income | | |
| Class A | $109,241 | $236,147 |
| Class T | – | 164,337 |
| Class I | 67,221 | 49,807 |
| Total | $176,462 | $450,291 |
10. Share Transactions.
Share transactions for each class were as follows and may contain automatic conversions between classes or exchanges between funds:
| | Shares | Shares | Dollars | Dollars |
| Years ended October 31, | 2015 | 2014 | 2015 | 2014 |
| Class A | | | | |
| Shares sold | 3,444,443 | 642,209 | $53,081,260 | $9,254,741 |
| Reinvestment of distributions | 6,822 | 15,568 | 102,609 | 216,240 |
| Shares redeemed | (1,059,333) | (733,015) | (16,101,792) | (10,574,352) |
| Net increase (decrease) | 2,391,932 | (75,238) | $37,082,077 | $(1,103,371) |
| Class T | | | | |
| Shares sold | 689,717 | 398,294 | $10,301,883 | $5,642,426 |
| Reinvestment of distributions | – | 11,818 | – | 161,195 |
| Shares redeemed | (694,037) | (765,657) | (10,349,650) | (10,811,536) |
| Net increase (decrease) | (4,320) | (355,545) | $(47,767) | $(5,007,915) |
| Class B | | | | |
| Shares sold | 10,699 | 922 | $149,278 | $12,411 |
| Shares redeemed | (51,403) | (58,773) | (707,021) | (768,373) |
| Net increase (decrease) | (40,704) | (57,851) | $(557,743) | $(755,962) |
| Class C | | | | |
| Shares sold | 1,456,550 | 194,612 | $20,251,093 | $2,542,538 |
| Shares redeemed | (360,397) | (314,314) | (4,903,804) | (4,057,639) |
| Net increase (decrease) | 1,096,153 | (119,702) | $15,347,289 | $(1,515,101) |
| Class I | | | | |
| Shares sold | 5,123,102 | 801,555 | $82,769,872 | $12,565,571 |
| Reinvestment of distributions | 3,912 | 2,539 | 62,664 | 37,521 |
| Shares redeemed | (1,848,914) | (154,955) | (30,160,539) | (2,410,258) |
| Net increase (decrease) | 3,278,100 | 649,139 | $52,671,997 | $10,192,834 |
11. Other.
The Fund's organizational documents provide former and current trustees and officers with a limited indemnification against liabilities arising in connection with the performance of their duties to the Fund. In the normal course of business, the Fund may also enter into contracts that provide general indemnifications. The Fund's maximum exposure under these arrangements is unknown as this would be dependent on future claims that may be made against the Fund. The risk of material loss from such claims is considered remote.
Report of Independent Registered Public Accounting Firm
To the Trustees of Fidelity Advisor Series VIII and Shareholders of Fidelity Advisor® International Capital Appreciation Fund:
We have audited the accompanying statement of assets and liabilities of Fidelity Advisor® International Capital Appreciation Fund (the Fund), a fund of Fidelity Advisor Series VIII, including the schedule of investments, as of October 31, 2015, and the related statement of operations for the year then ended, the statement of changes in net assets for each of the two years in the period then ended, and the financial highlights for each of the five years in the period then ended. These financial statements and financial highlights are the responsibility of the Fund's management. Our responsibility is to express an opinion on these financial statements and financial highlights based on our audits.
We conducted our audits in accordance with the standards of the Public Company Accounting Oversight Board (United States). Those standards require that we plan and perform the audit to obtain reasonable assurance about whether the financial statements and financial highlights are free of material misstatement. The Fund is not required to have, nor were we engaged to perform, an audit of its internal control over financial reporting. Our audits included consideration of internal control over financial reporting as a basis for designing audit procedures that are appropriate in the circumstances, but not for the purpose of expressing an opinion on the effectiveness of the Fund's internal control over financial reporting. Accordingly, we express no such opinion. An audit also includes examining, on a test basis, evidence supporting the amounts and disclosures in the financial statements, assessing the accounting principles used and significant estimates made by management, as well as evaluating the overall financial statement presentation. Our procedures included confirmation of securities owned as of October 31, 2015, by correspondence with the custodians and brokers; when replies were not received from brokers, we performed other auditing procedures. We believe that our audits provide a reasonable basis for our opinion.
In our opinion, such financial statements and financial highlights referred to above present fairly, in all material respects, the financial position of Fidelity Advisor® International Capital Appreciation Fund as of October 31, 2015, the results of its operations for the year then ended, the changes in its net assets for each of the two years in the period then ended, and the financial highlights for each of the five years in the period then ended, in conformity with accounting principles generally accepted in the United States of America.
DELOITTE & TOUCHE LLP
Boston, Massachusetts
December 17, 2015
Trustees and Officers
The Trustees, Members of the Advisory Board (if any), and officers of the trust and fund, as applicable, are listed below. The Board of Trustees governs the fund and is responsible for protecting the interests of shareholders. The Trustees are experienced executives who meet periodically throughout the year to oversee the fund's activities, review contractual arrangements with companies that provide services to the fund, oversee management of the risks associated with such activities and contractual arrangements, and review the fund's performance. Each of the Trustees oversees 170 funds.
The Trustees hold office without limit in time except that (a) any Trustee may resign; (b) any Trustee may be removed by written instrument, signed by at least two-thirds of the number of Trustees prior to such removal; (c) any Trustee who requests to be retired or who has become incapacitated by illness or injury may be retired by written instrument signed by a majority of the other Trustees; and (d) any Trustee may be removed at any special meeting of shareholders by a two-thirds vote of the outstanding voting securities of the trust. Each Trustee who is not an interested person (as defined in the 1940 Act) of the trust and the fund is referred to herein as an Independent Trustee. Each Independent Trustee shall retire not later than the last day of the calendar year in which his or her 75th birthday occurs. The Independent Trustees may waive this mandatory retirement age policy with respect to individual Trustees. Officers and Advisory Board Members hold office without limit in time, except that any officer or Advisory Board Member may resign or may be removed by a vote of a majority of the Trustees at any regular meeting or any special meeting of the Trustees. Except as indicated, each individual has held the office shown or other offices in the same company for the past five years.
The fund’s Statement of Additional Information (SAI) includes more information about the Trustees. To request a free copy, call Fidelity at 1-877-208-0098.
Experience, Skills, Attributes, and Qualifications of the Trustees. The Governance and Nominating Committee has adopted a statement of policy that describes the experience, qualifications, attributes, and skills that are necessary and desirable for potential Independent Trustee candidates (Statement of Policy). The Board believes that each Trustee satisfied at the time he or she was initially elected or appointed a Trustee, and continues to satisfy, the standards contemplated by the Statement of Policy. The Governance and Nominating Committee also engages professional search firms to help identify potential Independent Trustee candidates who have the experience, qualifications, attributes, and skills consistent with the Statement of Policy. From time to time, additional criteria based on the composition and skills of the current Independent Trustees, as well as experience or skills that may be appropriate in light of future changes to board composition, business conditions, and regulatory or other developments, have also been considered by the professional search firms and the Governance and Nominating Committee. In addition, the Board takes into account the Trustees' commitment and participation in Board and committee meetings, as well as their leadership of standing and ad hoc committees throughout their tenure.
In determining that a particular Trustee was and continues to be qualified to serve as a Trustee, the Board has considered a variety of criteria, none of which, in isolation, was controlling. The Board believes that, collectively, the Trustees have balanced and diverse experience, qualifications, attributes, and skills, which allow the Board to operate effectively in governing the fund and protecting the interests of shareholders. Information about the specific experience, skills, attributes, and qualifications of each Trustee, which in each case led to the Board's conclusion that the Trustee should serve (or continue to serve) as a trustee of the fund, is provided below.
Board Structure and Oversight Function. James C. Curvey is an interested person and currently serves as Chairman. The Trustees have determined that an interested Chairman is appropriate and benefits shareholders because an interested Chairman has a personal and professional stake in the quality and continuity of services provided to the fund. Independent Trustees exercise their informed business judgment to appoint an individual of their choosing to serve as Chairman, regardless of whether the Trustee happens to be independent or a member of management. The Independent Trustees have determined that they can act independently and effectively without having an Independent Trustee serve as Chairman and that a key structural component for assuring that they are in a position to do so is for the Independent Trustees to constitute a substantial majority for the Board. The Independent Trustees also regularly meet in executive session. Ned C. Lautenbach serves as Chairman of the Independent Trustees and as such (i) acts as a liaison between the Independent Trustees and management with respect to matters important to the Independent Trustees and (ii) with management prepares agendas for Board meetings.
Fidelity® funds are overseen by different Boards of Trustees. The fund's Board oversees Fidelity's high income and certain equity funds, and other Boards oversee Fidelity's investment-grade bond, money market, asset allocation, and sector funds. The asset allocation funds may invest in Fidelity® funds overseen by the fund's Board. The use of separate Boards, each with its own committee structure, allows the Trustees of each group of Fidelity® funds to focus on the unique issues of the funds they oversee, including common research, investment, and operational issues. On occasion, the separate Boards establish joint committees to address issues of overlapping consequences for the Fidelity® funds overseen by each Board.
The Trustees operate using a system of committees to facilitate the timely and efficient consideration of all matters of importance to the Trustees, the fund, and fund shareholders and to facilitate compliance with legal and regulatory requirements and oversight of the fund's activities and associated risks. The Board, acting through its committees, has charged FMR and its affiliates with (i) identifying events or circumstances the occurrence of which could have demonstrably adverse effects on the fund's business and/or reputation; (ii) implementing processes and controls to lessen the possibility that such events or circumstances occur or to mitigate the effects of such events or circumstances if they do occur; and (iii) creating and maintaining a system designed to evaluate continuously business and market conditions in order to facilitate the identification and implementation processes described in (i) and (ii) above. Because the day-to-day operations and activities of the fund are carried out by or through FMR, its affiliates, and other service providers, the fund's exposure to risks is mitigated but not eliminated by the processes overseen by the Trustees. While each of the Board's committees has responsibility for overseeing different aspects of the fund's activities, oversight is exercised primarily through the Operations, Audit, and Compliance Committees. In addition, the Independent Trustees have worked with FMR to enhance the Board's oversight of investment and financial risks, legal and regulatory risks, technology risks, and operational risks, including the development of additional risk reporting to the Board. For example, a working group comprised of Independent Trustees and FMR has worked and continues to work to review the Fidelity® funds' valuation-related activities, reporting and risk management. Appropriate personnel, including but not limited to the fund's Chief Compliance Officer (CCO), FMR's internal auditor, the independent accountants, the fund's Treasurer and portfolio management personnel, make periodic reports to the Board's committees, as appropriate, including an annual review of Fidelity's risk management program for the Fidelity® funds. The responsibilities of each standing committee, including their oversight responsibilities, are described further under "Standing Committees of the Trustees."
Interested Trustees*:
Correspondence intended for a Trustee who is an interested person may be sent to Fidelity Investments, 245 Summer Street, Boston, Massachusetts 02210.
Name, Year of Birth; Principal Occupations and Other Relevant Experience+
James C. Curvey (1935)
Year of Election or Appointment: 2007
Trustee
Chairman of the Board of Trustees
Mr. Curvey also serves as Trustee of other Fidelity® funds. Mr. Curvey is a Director of Fidelity Research & Analysis Co. (investment adviser firm, 2009-present), and Vice Chairman (2007-present) and Director of FMR LLC (diversified financial services company). In addition, Mr. Curvey serves as an Overseer for the Boston Symphony Orchestra and a member of the board of Artis-Naples, Naples, Florida, and as a Trustee for Brewster Academy, Wolfeboro, New Hampshire. Previously, Mr. Curvey served as a Director of Fidelity Investments Money Management, Inc. (investment adviser firm, 2009-2014) and a Director of FMR and FMR Co., Inc. (investment adviser firms, 2007-2014).
Charles S. Morrison (1960)
Year of Election or Appointment: 2014
Trustee
Mr. Morrison also serves as Trustee of other funds. He serves as a Director of Fidelity Investments Money Management, Inc. (FIMM) (investment adviser firm, 2014-present), Director of Fidelity SelectCo, LLC (investment adviser firm, 2014-present), President, Asset Management (2014-present), and is an employee of Fidelity Investments. Previously, Mr. Morrison served as Vice President of Fidelity's Fixed Income and Asset Allocation Funds (2012-2014), President, Fixed Income (2011-2014), Vice President of Fidelity's Money Market Funds (2005-2009), President, Money Market Group Leader of FMR (investment adviser firm, 2009), and Senior Vice President, Money Market Group of FMR (2004-2009). Mr. Morrison also served as Vice President of Fidelity's Bond Funds (2002-2005), certain Balanced Funds (2002-2005), and certain Asset Allocation Funds (2002-2007), and as Senior Vice President (2002-2005) of Fidelity's Bond Division.
* Determined to be an “Interested Trustee” by virtue of, among other things, his or her affiliation with the trust or various entities under common control with FMR.
+ The information includes the Trustee's principal occupation during the last five years and other information relating to the experience, attributes, and skills relevant to the Trustee's qualifications to serve as a Trustee, which led to the conclusion that the Trustee should serve as a Trustee for the fund.
Independent Trustees:
Correspondence intended for an Independent Trustee may be sent to Fidelity Investments, P.O. Box 55235, Boston, Massachusetts 02205-5235.
Name, Year of Birth; Principal Occupations and Other Relevant Experience+
Dennis J. Dirks (1948)
Year of Election or Appointment: 2005
Trustee
Mr. Dirks also serves as Trustee of other Fidelity® funds. Prior to his retirement in May 2003, Mr. Dirks was Chief Operating Officer and a member of the Board of The Depository Trust & Clearing Corporation (DTCC). He also served as President, Chief Operating Officer, and Board member of The Depository Trust Company (DTC) and President and Board member of the National Securities Clearing Corporation (NSCC). In addition, Mr. Dirks served as Chief Executive Officer and Board member of the Government Securities Clearing Corporation, Chief Executive Officer and Board member of the Mortgage-Backed Securities Clearing Corporation, as a Trustee and a member of the Finance Committee of Manhattan College (2005-2008), as a Trustee and a member of the Finance Committee of AHRC of Nassau County (2006-2008), and as a member of the Independent Directors Council (IDC) Governing Council (2010-2015). Mr. Dirks is a member of the Board of Directors for The Brookville Center for Children's Services, Inc. (2009-present).
Alan J. Lacy (1953)
Year of Election or Appointment: 2008
Trustee
Mr. Lacy also serves as Trustee of other Fidelity® funds. Mr. Lacy serves as a member of the Board of Directors of Dave & Buster's Entertainment, Inc. (restaurant and entertainment complexes, 2010-present) and Bristol-Myers Squibb Company (global pharmaceuticals, 2008-present). In addition, Mr. Lacy served as Senior Adviser (2007-2014) of Oak Hill Capital Partners, L.P. (private equity) and also served as Chief Executive Officer (2000-2005) and Vice Chairman (2005-2006) of Sears Holdings Corporation and Sears, Roebuck and Co. (retail). Mr. Lacy is a member of the Board of Trustees of The National Parks Conservation Association (2006-present). Previously, Mr. Lacy served as Chairman of the Board of Trustees of the National Parks Conservation Association (2008-2011) and as a member of the Board of Directors for The Western Union Company (global money transfer, 2006-2011), The Hillman Companies, Inc. (hardware wholesalers, 2010-2014), and Earth Fare, Inc. (retail grocery, 2010-2014).
Ned C. Lautenbach (1944)
Year of Election or Appointment: 2000
Trustee
Chairman of the Independent Trustees
Mr. Lautenbach also serves as Trustee of other Fidelity® funds. Mr. Lautenbach currently serves as the Lead Director of the Eaton Corporation Board of Directors (diversified industrial, 1997-present). Mr. Lautenbach is Chairman of the Board of Directors of Artis-Naples in Naples, Florida (2012-present), a member of the Council on Foreign Relations (1994-present), and a member of the Board of Governors, State University System of Florida (2013-present). Previously, Mr. Lautenbach was a Partner/Advisory Partner at Clayton, Dubilier & Rice, LLC (private equity investment, 1998-2010), as well as a Director of Sony Corporation (2006-2007).
Joseph Mauriello (1944)
Year of Election or Appointment: 2008
Trustee
Mr. Mauriello also serves as Trustee of other Fidelity® funds. Prior to his retirement in January 2006, Mr. Mauriello served in numerous senior management positions including Deputy Chairman and Chief Operating Officer (2004-2005), and Vice Chairman of Financial Services (2002-2004) of KPMG LLP US (professional services, 1965-2005). Mr. Mauriello currently serves as a member of the Board of Directors of XL Group plc. (global insurance and re-insurance, 2006-present) and the Independent Directors Council (IDC) Governing Council (2015-present). Previously, Mr. Mauriello served as a Director of the Hamilton Funds of the Bank of New York (2006-2007) and of Arcadia Resources Inc. (health care services and products, 2007-2012).
Robert W. Selander (1950)
Year of Election or Appointment: 2011
Trustee
Mr. Selander also serves as Trustee of other Fidelity® funds. Mr. Selander serves as a Director of The Western Union Company (global money transfer, 2014-present). Previously, Mr. Selander served as a Member of the Advisory Board of other Fidelity® funds (2011), and Executive Vice Chairman (2010), Chief Executive Officer (2009-2010), and President and Chief Executive Officer (1997-2009) of Mastercard, Inc.
Cornelia M. Small (1944)
Year of Election or Appointment: 2005
Trustee
Ms. Small also serves as Trustee of other Fidelity® funds. Ms. Small is a member of the Board of Directors (2009-present) and Chair of the Investment Committee (2010-present) of the Teagle Foundation. Ms. Small also serves on the Investment Committee of the Berkshire Taconic Community Foundation (2008-present). Previously, Ms. Small served as Chairperson (2002-2008) and a member of the Investment Committee and Chairperson (2008-2012) and a member of the Board of Trustees of Smith College. In addition, Ms. Small served as Chief Investment Officer, Director of Global Equity Investments, and a member of the Board of Directors of Scudder, Stevens & Clark and Scudder Kemper Investments.
William S. Stavropoulos (1939)
Year of Election or Appointment: 2001
Trustee
Vice Chairman of the Independent Trustees
Mr. Stavropoulos also serves as Trustee of other Fidelity® funds. Mr. Stavropoulos serves as President and Founder of the Michigan Baseball Foundation, the Great Lakes Loons (2007-present). Mr. Stavropoulos is Chairman Emeritus of the Board of Directors of The Dow Chemical Company, where he previously served in numerous senior management positions, including President, CEO (1995-2000; 2002-2004), Chairman of the Executive Committee (2000-2006), and as a member of the Board of Directors (1990-2006). Currently, Mr. Stavropoulos is Chairman of the Board of Directors of Univar Inc. (global distributor of commodity and specialty chemicals), a Director of Teradata Corporation (data warehousing and technology solutions), and Maersk Inc. (industrial conglomerate), and a member of the Advisory Board for Metalmark Capital LLC (private equity investment, 2005-present). Mr. Stavropoulos is an operating advisor to Clayton, Dubilier & Rice, LLC (private equity investment). In addition, Mr. Stavropoulos is a member of the University of Notre Dame Advisory Council for the College of Science, a Trustee of the Rollin L. Gerstacker Foundation, and a Director of the Naples Philharmonic Center for the Arts. Previously, Mr. Stavropoulos served as a Director of Chemical Financial Corporation (bank holding company, 1993-2012) and Tyco International, Ltd. (multinational manufacturing and services, 2007-2012).
David M. Thomas (1949)
Year of Election or Appointment: 2008
Trustee
Mr. Thomas also serves as Trustee of other Fidelity® funds. Mr. Thomas serves as Non-Executive Chairman of the Board of Directors of Fortune Brands Home and Security (home and security products, 2011-present), as a member of the Board of Directors (2004-present) and Presiding Director (2013-present) of Interpublic Group of Companies, Inc. (marketing communication), and as a member of the Board of Trustees of the University of Florida (2013-present). Previously, Mr. Thomas served as Executive Chairman (2005-2006) and Chairman and Chief Executive Officer (2000-2005) of IMS Health, Inc. (pharmaceutical and healthcare information solutions), and a Director of Fortune Brands, Inc. (consumer products, 2000-2011).
+ The information includes the Trustee's principal occupation during the last five years and other information relating to the experience, attributes, and skills relevant to the Trustee's qualifications to serve as a Trustee, which led to the conclusion that the Trustee should serve as a Trustee for the fund.
Advisory Board Members and Officers:
Correspondence intended for an officer or Peter S. Lynch may be sent to Fidelity Investments, 245 Summer Street, Boston, Massachusetts 02210. Officers appear below in alphabetical order.
Name, Year of Birth; Principal Occupation
Peter S. Lynch (1944)
Year of Election or Appointment: 2003
Member of the Advisory Board
Mr. Lynch also serves as Member of the Advisory Board of other Fidelity® funds. Mr. Lynch is Vice Chairman and a Director of FMR (investment adviser firm) and FMR Co., Inc. (investment adviser firm). In addition, Mr. Lynch serves as a Trustee of Boston College and as the Chairman of the Inner-City Scholarship Fund. Previously, Mr. Lynch served on the Special Olympics International Board of Directors (1997-2006).
Elizabeth Paige Baumann (1968)
Year of Election or Appointment: 2012
Anti-Money Laundering (AML) Officer
Ms. Baumann also serves as AML Officer of other funds. She is Chief AML Officer of FMR LLC (diversified financial services company, 2012-present) and is an employee of Fidelity Investments. Previously, Ms. Baumann served as Vice President and Deputy Anti-Money Laundering Officer (2007-2012).
Marc R. Bryant (1966)
Year of Election or Appointment: 2015
Secretary and Chief Legal Officer (CLO)
Mr. Bryant also serves as Secretary and CLO of other funds. Mr. Bryant serves as CLO, Secretary, and Senior Vice President of Fidelity Management & Research Company (investment adviser firm, 2015-present) and FMR Co., Inc. (investment adviser firm, 2015-present); Secretary of Fidelity SelectCo, LLC (investment adviser firm, 2015-present) and Fidelity Investments Money Management, Inc. (investment adviser firm, 2015-present); and CLO of Fidelity Management & Research (Hong Kong) Limited (investment adviser firm, 2015-present). He is Senior Vice President and Deputy General Counsel of FMR LLC (diversified financial services company). Previously, Mr. Bryant served as Secretary and Chief Legal Officer of Fidelity Rutland Square Trust II (2010-2014) and Assistant Secretary of Fidelity's Fixed Income and Asset Allocation Funds (2013-2015). Prior to joining Fidelity Investments, Mr. Bryant served as a Senior Vice President and the Head of Global Retail Legal for AllianceBernstein L.P. (2006-2010), and as the General Counsel for ProFund Advisors LLC (2001-2006).
Timothy M. Cohen (1969)
Year of Election or Appointment: 2014
Vice President of certain Equity Funds
Mr. Cohen also serves as Vice President of other funds. Mr. Cohen serves as Chief Compliance Officer of FMR Investment Management (U.K.) Limited (investment adviser firm, 2013-present) and is an employee of Fidelity Investments. Previously, Mr. Cohen served as a Director of FMR Investment Management (U.K.) Limited (2013-2015).
William C. Coffey (1969)
Year of Election or Appointment: 2009
Assistant Secretary
Mr. Coffey also serves as Assistant Secretary of other funds. He is Senior Vice President and Deputy General Counsel of FMR LLC (diversified financial services company, 2010-present), and is an employee of Fidelity Investments. Previously, Mr. Coffey served as Vice President and Associate General Counsel of FMR LLC (2005-2009).
Jonathan Davis (1968)
Year of Election or Appointment: 2010
Assistant Treasurer
Mr. Davis also serves as Assistant Treasurer of other funds, and is an employee of Fidelity Investments. Previously, Mr. Davis served as Vice President and Associate General Counsel of FMR LLC (diversified financial services company, 2003-2010).
Adrien E. Deberghes (1967)
Year of Election or Appointment: 2008
Deputy Treasurer
Mr. Deberghes also serves as an officer of other funds. He is an employee of Fidelity Investments (2008-present). Prior to joining Fidelity Investments, Mr. Deberghes was Senior Vice President of Mutual Fund Administration at State Street Corporation (2007-2008), Senior Director of Mutual Fund Administration at Investors Bank & Trust (2005-2007), and Director of Finance for Dunkin' Brands (2000-2005).
Stephanie J. Dorsey (1969)
Year of Election or Appointment: 2010
Assistant Treasurer
Ms. Dorsey also serves as an officer of other funds. She is an employee of Fidelity Investments (2008-present) and has served in other fund officer roles. Prior to joining Fidelity Investments, Ms. Dorsey served as Treasurer (2004-2008) of the JPMorgan Mutual Funds and Vice President (2004-2008) of JPMorgan Chase Bank.
Howard J. Galligan III (1966)
Year of Election or Appointment: 2014
Chief Financial Officer
Mr. Galligan also serves as Chief Financial Officer of other funds. Mr. Galligan serves as President of Fidelity Pricing and Cash Management Services (FPCMS) (2014-present) and as a Director of Strategic Advisers, Inc. (investment adviser firm, 2008-present). Previously, Mr. Galligan served as Chief Administrative Officer of Asset Management (2011-2014) and Chief Operating Officer and Senior Vice President of Investment Support for Strategic Advisers, Inc. (2003-2011).
Scott C. Goebel (1968)
Year of Election or Appointment: 2015
Vice President
Mr. Goebel serves as Vice President of other funds and is an employee of Fidelity Investments (2001-present). Previously, Mr. Goebel served as Secretary of Fidelity SelectCo, LLC (investment adviser firm, 2013-2015), Fidelity Investments Money Management, Inc. (FIMM) (investment adviser firm, 2010-2015), and Fidelity Research and Analysis Company (FRAC) (investment adviser firm, 2010-2015); General Counsel, Secretary, and Senior Vice President of Fidelity Management & Research Company (investment adviser firm, 2008-2015) and FMR Co., Inc. (investment adviser firm, 2008-2015); Assistant Secretary of Fidelity Management & Research (Japan) Limited (investment adviser firm, 2008-2015) and FMR Investment Management (U.K.) Limited (investment adviser firm, 2008-2015); Chief Legal Officer (CLO) of Fidelity Management & Research (Hong Kong) Limited (investment adviser firm, 2008-2015); Secretary and CLO of certain Fidelity® funds (2008-2015); Assistant Secretary of FIMM (2008-2010), FRAC (2008-2010), and certain funds (2007-2008); and as Vice President and Secretary of Fidelity Distributors Corporation (FDC) (2005-2007).
Brian B. Hogan (1964)
Year of Election or Appointment: 2009
Vice President
Mr. Hogan also serves as Trustee or Vice President of other funds. Mr. Hogan serves as a Director of Fidelity SelectCo, LLC (investment adviser firm, 2014-present) and President of the Equity Division of FMR (investment adviser firm, 2009-present). Previously, Mr. Hogan served as Senior Vice President, Equity Research of FMR (2006-2009) and as a portfolio manager.
Chris Maher (1972)
Year of Election or Appointment: 2013
Assistant Treasurer
Mr. Maher serves as Assistant Treasurer of other funds. Mr. Maher is Vice President of Valuation Oversight and is an employee of Fidelity Investments. Previously, Mr. Maher served as Vice President of Asset Management Compliance (2013), Vice President of the Program Management Group of FMR (investment adviser firm, 2010-2013), and Vice President of Valuation Oversight (2008-2010).
Kenneth B. Robins (1969)
Year of Election or Appointment: 2008
President and Treasurer
Mr. Robins also serves as an officer of other funds. Mr. Robins serves as Executive Vice President of Fidelity Investments Money Management, Inc. (FIMM) (investment adviser firm, 2013-present) and is an employee of Fidelity Investments (2004-present). Previously, Mr. Robins served in other fund officer roles.
Stacie M. Smith (1974)
Year of Election or Appointment: 2013
Deputy Treasurer
Ms. Smith also serves as an officer of other funds. She is an employee of Fidelity Investments (2009-present) and has served in other fund officer roles. Prior to joining Fidelity Investments, Ms. Smith served as Senior Audit Manager of Ernst & Young LLP (1996-2009).
Renee Stagnone (1975)
Year of Election or Appointment: 2013
Deputy Treasurer
Ms. Stagnone also serves as Deputy Treasurer of other funds. Ms. Stagnone is an employee of Fidelity Investments (1997-present).
Linda J. Wondrack (1964)
Year of Election or Appointment: 2014
Chief Compliance Officer
Ms. Wondrack also serves as Chief Compliance Officer of other funds. Ms. Wondrack is Executive Vice President and head of the Ethics Office and Asset Management Compliance for Fidelity Investments (2012-present). Ms. Wondrack also serves as Chief Compliance Officer of Fidelity SelectCo, LLC (investment adviser firm, 2014-present); Chief Compliance Officer of Impresa Management LLC (2013-present); and Chief Compliance Officer of FMR Co., Inc. (investment adviser firm), Fidelity Investments Money Management, Inc. (investment adviser firm), Fidelity Management & Research (Japan) Limited (investment adviser firm), FMR Investment Management (U.K.) Limited (investment adviser firm), Fidelity Management & Research (Hong Kong) (investment adviser firm), Fidelity Management & Research Company (investment adviser firm), FIAM LLC (investment adviser firm), and Strategic Advisers, Inc. (investment adviser firm), Ballyrock Investment Advisors LLC, and Northern Neck Investors LLC (2012-present). Previously, Ms. Wondrack served as Senior Vice President and Chief Compliance Officer for Columbia Management Investment Advisers, LLC (2005-2012); Chief Compliance Officer for certain funds within the Columbia Family of Funds (2007-2012); and Senior Vice President of Compliance Risk Management at Bank of America (2005-2010).
Joseph F. Zambello (1957)
Year of Election or Appointment: 2011
Deputy Treasurer
Mr. Zambello also serves as Deputy Treasurer of other funds. Mr. Zambello is an employee of Fidelity Investments (1991-present). Previously, Mr. Zambello served as Vice President of the Program Management Group of FMR (investment adviser firm, 2009-2011) and Vice President of the Transfer Agent Oversight Group (2005-2009).
Shareholder Expense Example
As a shareholder of the Fund, you incur two types of costs: (1) transaction costs, including sales charges (loads) on purchase payments or redemption proceeds, redemption fees and (2) ongoing costs, including management fees, distribution and/or service (12b-1) fees and other Fund expenses. This Example is intended to help you understand your ongoing costs (in dollars) of investing in the Fund and to compare these costs with the ongoing costs of investing in other mutual funds.
The Example is based on an investment of $1,000 invested at the beginning of the period and held for the entire period (May 1, 2015 to October 31, 2015).
Actual Expenses
The first line of the accompanying table for each class of the Fund provides information about actual account values and actual expenses. You may use the information in this line, together with the amount you invested, to estimate the expenses that you paid over the period. Simply divide your account value by $1,000.00 (for example, an $8,600 account value divided by $1,000.00 = 8.6), then multiply the result by the number in the first line for a class of the Fund under the heading entitled "Expenses Paid During Period" to estimate the expenses you paid on your account during this period. In addition, the Fund, as a shareholder in the underlying Fidelity Central Funds, will indirectly bear its pro-rata share of the fees and expenses incurred by the underlying Fidelity Central Funds. These fees and expenses are not included in the Fund's annualized expense ratio used to calculate the expense estimate in the table below.
Hypothetical Example for Comparison Purposes
The second line of the accompanying table for each class of the Fund provides information about hypothetical account values and hypothetical expenses based on a Class' actual expense ratio and an assumed rate of return of 5% per year before expenses, which is not the Class' actual return. The hypothetical account values and expenses may not be used to estimate the actual ending account balance or expenses you paid for the period. You may use this information to compare the ongoing costs of investing in the Fund and other funds. To do so, compare this 5% hypothetical example with the 5% hypothetical examples that appear in the shareholder reports of the other funds. In addition, the Fund, as a shareholder in the underlying Fidelity Central Funds, will indirectly bear its pro-rata share of the fees and expenses incurred by the underlying Fidelity Central Funds. These fees and expenses are not included in the Fund's annualized expense ratio used to calculate the expense estimate in the table below.
Please note that the expenses shown in the table are meant to highlight your ongoing costs only and do not reflect any transaction costs. Therefore, the second line of the table is useful in comparing ongoing costs only, and will not help you determine the relative total costs of owning different funds. In addition, if these transactional costs were included, your costs would have been higher.
| | Annualized Expense Ratio-A | Beginning
Account Value
May 1, 2015 | Ending
Account Value
October 31, 2015 | Expenses Paid
During Period-B
May 1, 2015
to October 31, 2015 |
| Class A | 1.45% | | | |
| Actual | | $1,000.00 | $978.80 | $7.23 |
| Hypothetical-C | | $1,000.00 | $1,017.90 | $7.38 |
| Class T | 1.70% | | | |
| Actual | | $1,000.00 | $978.40 | $8.48 |
| Hypothetical-C | | $1,000.00 | $1,016.64 | $8.64 |
| Class B | 2.20% | | | |
| Actual | | $1,000.00 | $975.90 | $10.96 |
| Hypothetical-C | | $1,000.00 | $1,014.12 | $11.17 |
| Class C | 2.20% | | | |
| Actual | | $1,000.00 | $975.10 | $10.95 |
| Hypothetical-C | | $1,000.00 | $1,014.12 | $11.17 |
| Class I | 1.20% | | | |
| Actual | | $1,000.00 | $980.70 | $5.99 |
| Hypothetical-C | | $1,000.00 | $1,019.16 | $6.11 |
A Annualized expense ratio reflects expenses net of applicable fee waivers.
B Expenses are equal to each Class' annualized expense ratio, multiplied by the average account value over the period, multiplied by 184/365 (to reflect the one-half year period).
C 5% return per year before expenses
Distributions (Unaudited)
Class A designates 73% of the dividend during the fiscal year as qualifying for the dividends–received deduction for corporate shareholders.
Class A designates 100% of the dividends distributed during the fiscal year as amounts which may be taken into account as a dividend for purposes of the maximum rate under section 1(h)(11) of the Internal Revenue Code.
The amounts per share which represent income derived from sources within, and taxes paid to, foreign countries or possessions of the United States are as follows:
| | Pay Date | Income | Taxes | |
| Class A | 12/08/14 | $0.0865 | $0.0555 | |
| | | | | |
| Class T | 12/08/14 | $0.0000 | $0.0000 | |
| | | | | |
| Class B | 12/08/14 | $0.0000 | $0.0000 | |
| | | | | |
| Class C | 12/08/14 | $0.0000 | $0.0000 | |
| | | | | |
The fund will notify shareholders in January 2016 of amounts for use in preparing 2015 income tax returns.
Board Approval of Investment Advisory Contracts and Management Fees
Fidelity Advisor International Capital Appreciation Fund
Each year, the Board of Trustees, including the Independent Trustees (together, the Board), votes on the renewal of the management contract with Fidelity Management & Research Company (FMR) and the sub-advisory agreements (together, the Advisory Contracts) for the fund. The Board, assisted by the advice of fund counsel and Independent Trustees' counsel, requests and considers a broad range of information relevant to the renewal of the Advisory Contracts throughout the year.
The Board meets regularly and, at each of its meetings, covers an extensive agenda of topics and materials and considers factors that are relevant to its annual consideration of the renewal of the fund's Advisory Contracts, including the services and support provided to the fund and its shareholders. The Board has established various standing committees (Committees), each composed of and chaired by Independent Trustees with varying backgrounds, to which the Board has assigned specific subject matter responsibilities in order to enhance effective decision-making by the Board. The Board, acting directly and through its Committees, requests and receives information concerning the annual consideration of the renewal of the fund's Advisory Contracts. The Board also meets as needed to consider matters specifically related to the Board's annual consideration of the renewal of the Advisory Contracts. Members of the Board may also meet with trustees of other Fidelity funds through ad hoc joint committees to discuss certain matters relevant to all of the Fidelity funds.
At its July 2015 meeting, the Board unanimously determined to renew the fund's Advisory Contracts. In reaching its determination, the Board considered all factors it believed relevant, including (i) the nature, extent, and quality of the services to be provided to the fund and its shareholders (including the investment performance of the fund); (ii) the competitiveness of the fund's management fee and total expense ratio relative to peer funds; (iii) the total costs of the services to be provided by and the profits to be realized by Fidelity from its relationship with the fund; and (iv) the extent to which (if any) economies of scale exist and would be realized as the fund grows, and whether any economies of scale are appropriately shared with fund shareholders.
In considering whether to renew the Advisory Contracts for the fund, the Board reached a determination, with the assistance of fund counsel and Independent Trustees' counsel and through the exercise of its business judgment, that the renewal of the Advisory Contracts was in the best interests of the fund and its shareholders and that the compensation payable under the Advisory Contracts was fair and reasonable. The Board's decision to renew the Advisory Contracts was not based on any single factor, but rather was based on a comprehensive consideration of all the information provided to the Board at its meetings throughout the year. The Board, in reaching its determination to renew the Advisory Contracts, was aware that shareholders of the fund have a broad range of investment choices available to them, including a wide choice among funds offered by Fidelity's competitors, and that the fund's shareholders, who have the opportunity to review and weigh the disclosure provided by the fund in its prospectus and other public disclosures, have chosen to invest in this fund, which is part of the Fidelity family of funds.
Nature, Extent, and Quality of Services Provided. The Board considered Fidelity's staffing as it relates to the fund, including the backgrounds of investment personnel of Fidelity, and also considered the fund's investment objective, strategies, and related investment philosophy. The Independent Trustees also had discussions with senior management of Fidelity's investment operations and investment groups. The Board considered the structure of the portfolio manager compensation program and whether this structure provides appropriate incentives to act in the best interests of the fund. Additionally, the Board considered the portfolio managers' investments, if any, in the funds that they manage.
Resources Dedicated to Investment Management and Support Services. The Board and the Fund Oversight and Research Committees reviewed the general qualifications and capabilities of Fidelity's investment staff, including its size, education, experience, and resources, as well as Fidelity's approach to recruiting, training, managing, and compensating investment personnel. The Board noted that Fidelity has continued to increase the resources devoted to non-U.S. offices, including expansion of Fidelity's global investment organization. The Board also noted that Fidelity's analysts have extensive resources, tools and capabilities that allow them to conduct sophisticated quantitative and fundamental analysis, as well as credit analysis of issuers, counterparties and guarantors. Further, the Board considered that Fidelity's investment professionals have sufficient access to global information and data so as to provide competitive investment results over time, and that those professionals also have access to sophisticated tools that permit them to assess portfolio construction and risk and performance attribution characteristics continuously, as well as to transmit new information and research conclusions rapidly around the world. Additionally, in its deliberations, the Board considered Fidelity's trading, risk management, and compliance capabilities and resources, which are integral parts of the investment management process.
Shareholder and Administrative Services. The Board considered (i) the nature, extent, quality, and cost of advisory, administrative, and shareholder services performed by FMR, the sub-advisers (together with FMR, the Investment Advisers), and their affiliates under the Advisory Contracts and under separate agreements covering transfer agency, pricing and bookkeeping, and securities lending services for the fund; (ii) the nature and extent of the supervision of third party service providers, principally custodians and subcustodians; and (iii) the resources devoted to, and the record of compliance with, the fund's compliance policies and procedures. The Board also reviewed the allocation of fund brokerage, including allocations to brokers affiliated with the Investment Advisers, the use of brokerage commissions to pay fund expenses, and the use of "soft" commission dollars to pay for research services.
The Board noted that the growth of fund assets over time across the complex allows Fidelity to reinvest in the development of services designed to enhance the value or convenience of the Fidelity funds as investment vehicles. These services include 24-hour access to account information and market information through telephone representatives and over the Internet, investor education materials and asset allocation tools, and the expanded availability of Fidelity Investor Centers.
In 2014, the Board formed an ad hoc Committee on Transfer Agency Fees to review the variety of transfer agency fee structures throughout the industry and Fidelity's competitive positioning with respect to industry participants.
Investment in a Large Fund Family. The Board considered the benefits to shareholders of investing in a Fidelity fund, including the benefits of investing in a fund that is part of a large family of funds offering a variety of investment disciplines and providing a large variety of mutual fund investor services. The Board noted that Fidelity had taken, or had made recommendations that resulted in the Fidelity funds taking, a number of actions over the previous year that benefited particular funds, including (i) continuing to dedicate additional resources to investment research and to the support of the senior management team that oversees asset management; (ii) continuing efforts to enhance Fidelity's global research capabilities; (iii) launching new funds and making other enhancements to meet client needs; (iv) reducing management fees and total expenses for certain index funds and diversified international funds; (v) continuing to launch dedicated lower cost underlying funds to meet portfolio construction needs related to expanding underlying fund options for Fidelity funds of funds, specifically for the Freedom Fund product lines; (vi) rationalizing product lines and gaining increased efficiencies through fund mergers; (vii) launching active fixed-income exchange-traded funds; (viii) continuing to develop, acquire and implement systems and technology to improve services to the funds and information security and to increase efficiency; (ix) implementing investment enhancements to further strengthen Fidelity's target date product line to increase investors' probability of success in achieving their goals; (x) modifying the eligibility criteria for certain share classes to accommodate roll-over assets from employer-sponsored retirement plans; (xi) launching a new Class W of the Freedom Index Funds to attract and retain Fidelity record-kept retirement plan assets; and (xii) implementing changes to Fidelity's money market product line in response to recent money market regulatory reforms.
Investment Performance. The Board considered whether the fund has operated in accordance with its investment objective, as well as its record of compliance with its investment restrictions and its performance history.
The Board took into account discussions with representatives of the Investment Advisers about fund investment performance that occur at Board meetings throughout the year. In this regard the Board noted that as part of regularly scheduled fund reviews and other reports to the Board on fund performance, the Board considers annualized return information for the fund, for different time periods, measured against a securities market index ("benchmark index") and a peer group of funds with similar objectives ("peer group"), if any. In its evaluation of fund investment performance, the Board gave particular attention to information indicating changes in performance of certain Fidelity funds for specific time periods and discussed with the Investment Advisers the reasons for any overperformance or underperformance.
In addition to reviewing absolute and relative fund performance, the Independent Trustees periodically consider the appropriateness of fund performance metrics in evaluating the results achieved. In general, the Independent Trustees believe that fund performance should be evaluated based on net performance (after fees and expenses) of both the highest performing and lowest performing fund share classes, where applicable, compared to appropriate benchmark indices, over appropriate time periods that may include full market cycles, and compared to peer groups, as applicable, over the same periods, taking into account relevant factors including the following: general market conditions; issuer-specific information; and fund cash flows and other factors.
The Independent Trustees recognize that shareholders evaluate performance on a net basis over their own holding periods, for which one-, three-, and five-year periods are often used as a proxy. For this reason, the performance information reviewed by the Board also included net cumulative calendar year total return information for the fund and an appropriate benchmark index and peer group for the most recent one-, three-, and five-year periods, as shown below. Returns are shown compared to the 25th percentile (top of box, 75% beaten) and 75th percentile (bottom of box, 25% beaten) of the peer universe. Returns of the benchmark index are "net MA,"
i.e., adjusted for tax withholding rates applicable to U.S.-based funds organized as Massachusetts business trusts.
Fidelity Advisor International Capital Appreciation Fund
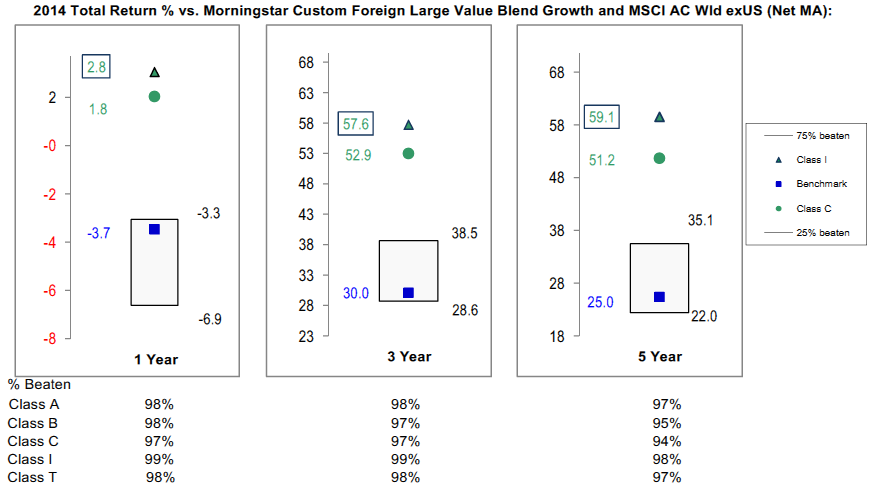
The Board also considered that the fund's management fee is subject to upward or downward adjustment depending upon whether, and to what extent, the fund's investment performance for the performance period exceeds, or is exceeded by, a securities index, thus leading to a performance adjustment for the same period. The Board noted that the performance adjustment provides FMR with a strong economic incentive to seek to achieve superior performance for the fund's shareholders and helps to more closely align the interests of FMR and the shareholders of the fund.
Based on its review, the Board concluded that the nature, extent, and quality of services provided to the fund under the Advisory Contracts should benefit the shareholders of the fund.
Competitiveness of Management Fee and Total Expense Ratio. The Board considered the fund's management fee and total expense ratio compared to "mapped groups" of competitive funds and classes created for the purpose of facilitating the Trustees' competitive analysis of management fees and total expenses. Fidelity creates "mapped groups" by combining similar Lipper investment objective categories that have comparable investment mandates. Combining Lipper investment objective categories aids the Board's management fee and total expense ratio comparisons by broadening the competitive group used for comparison.
Management Fee. The Board considered two proprietary management fee comparisons for the 12-month periods shown in basis points (BP) in the chart below. The group of Lipper funds used by the Board for management fee comparisons is referred to below as the "Total Mapped Group." The Total Mapped Group comparison focuses on a fund's standing in terms of gross management fees before expense reimbursements or caps, and without giving effect to the fund's performance adjustment, relative to the total universe of funds with comparable investment mandates, regardless of whether their management fee structures also are comparable. Funds with comparable investment mandates offer exposure to similar types of securities. Funds with comparable management fee structures have similar management fee contractual arrangements (
e.g., flat rate charged for advisory services, all-inclusive fee rate,
etc.). "TMG %" represents the percentage of funds in the Total Mapped Group that had management fees that were lower than the fund's. For example, a hypothetical TMG % of 20% would mean that 80% of the funds in the Total Mapped Group had higher, and 20% had lower, management fees than the fund. The fund's actual TMG %s and the number of funds in the Total Mapped Group are in the chart below. The "Asset-Size Peer Group" (ASPG) comparison focuses on a fund's standing relative to a subset of non-Fidelity funds within the Total Mapped Group that are similar in size and management fee structure without taking into account performance adjustments, if any. For example, if a fund is in the first quartile of the ASPG, the fund's management fee ranks in the least expensive or lowest 25% of funds in the ASPG. The ASPG represents at least 15% of the funds in the Total Mapped Group with comparable asset size and management fee structures, subject to a minimum of 50 funds (or all funds in the Total Mapped Group if fewer than 50). Additional information, such as the ASPG quartile in which the fund's management fee rate ranked and the impact of the fund's performance adjustment, is also included in the chart and considered by the Board.
Fidelity Advisor International Capital Appreciation Fund
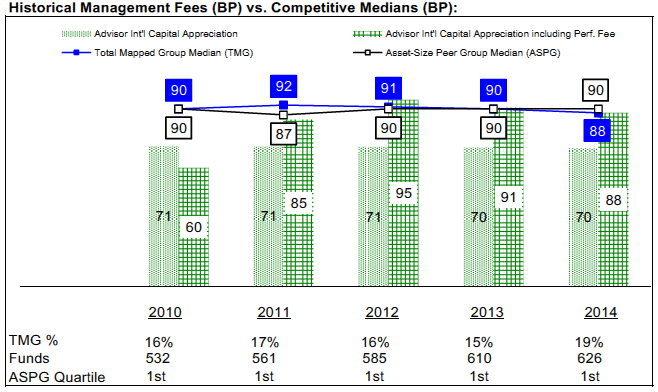
The Board noted that the fund's management fee rate ranked below the median of its Total Mapped Group and below the median of its ASPG for 2014. The Board also noted the effect of the fund's performance adjustment, if any, on the fund's management fee ranking.
The Board noted that, in 2014, the ad hoc Committee on Group Fee was formed by it and other Fidelity fund boards to conduct an in-depth review of the "group fee" component of the management fee of funds with such management fee structures. Committee focus included the mechanics of the group fee, the competitive landscape of group fee structures, Fidelity funds with no group fee component and investment products not included in group fee assets. The Board also considered that, for funds subject to the group fee, FMR agreed to voluntarily waive fees over a specified period of time in amounts designed to account for assets converted from certain funds to certain collective investment trusts.
The Board also noted that, in 2013, the ad hoc Committee on Management Fees was formed to conduct an in-depth review of the management fee rates of Fidelity's active equity mutual funds. The Committee focused on the following areas: (i) standard fee structures; (ii) research consumption and trading evolution; (iii) management fee competitiveness/profitability by category; and (iv) factors that drive institutional pricing.
Based on its review, the Board concluded that the fund's management fee is fair and reasonable in light of the services that the fund receives and the other factors considered.
Total Expense Ratio. In its review of each class's total expense ratio, the Board considered the fund's management fee as well as other fund or class expenses, as applicable, such as transfer agent fees, pricing and bookkeeping fees, fund-paid 12b-1 fees, and custodial, legal, and audit fees. The Board noted the impact of the fund's performance adjustment. The Board also noted that Fidelity may agree to waive fees and expenses from time to time, and the extent to which, if any, it has done so for the fund. As part of its review, the Board also considered the current and historical total expense ratios of each class of the fund compared to competitive fund median expenses. Each class of the fund is compared to those funds and classes in the Total Mapped Group (used by the Board for management fee comparisons) that have a similar sales load structure.
The Board noted that the total expense ratio of each class ranked above its competitive median for 2014. The Board considered that, in general, various factors can affect total expense ratios. The Board noted that the total expense ratio of each class of the fund was above the competitive median because of a significant positive performance fee adjustment in 2014. The Board noted that the total expense ratio of Class T was also above the competitive median because of higher 12b-1 fees on Class T as compared to most competitor funds. Class T has a higher 12b-1 fee, but a lower front-end sales charge, than traditionally priced front-end sales charge classes. The Board considered that Class T is primarily sold load-waived in the retirement plan market where its 0.50% 12b-1 fee is comparable to competing no-load, higher 12b-1 fee classes designed specifically for retirement plans. The Board noted that the fund offers multiple classes, each of which has a different sales load and 12b-1 fee structure, and that the multiple structures are intended to offer a range of pricing options for the intermediary market. The Board also noted that the total expense ratios of the classes vary primarily by the level of their 12b-1 fees, although differences in transfer agent fees may also cause expenses to vary from class to class.
Fees Charged to Other Fidelity Clients. The Board also considered Fidelity fee structures and other information with respect to clients of Fidelity, such as other funds advised or subadvised by Fidelity, pension plan clients, and other institutional clients with similar mandates. The Board noted the findings of the 2013 ad hoc joint committee (created with the board of other Fidelity funds), which reviewed and compared Fidelity's institutional investment advisory business with its business of providing services to the Fidelity funds, including the differences in services provided, fees charged, and costs incurred, as well as competition in their respective marketplaces.
Based on its review of total expense ratios and fees charged to other Fidelity clients, the Board concluded that, although in all cases above the median of the universe presented for comparison, the total expense ratio of each class of the fund was reasonable in light of the services that the fund and its shareholders receive and the other factors considered.
Costs of the Services and Profitability. The Board considered the revenues earned and the expenses incurred by Fidelity in conducting the business of developing, marketing, distributing, managing, administering and servicing the fund and servicing the fund's shareholders. The Board also considered the level of Fidelity's profits in respect of all the Fidelity funds.
On an annual basis, Fidelity presents to the Board information about the profitability of its relationship with the fund. Fidelity calculates profitability information for each fund, as well as aggregate profitability information for groups of Fidelity funds and all Fidelity funds, using a series of detailed revenue and cost allocation methodologies which originate with the books and records of Fidelity on which Fidelity's audited financial statements are based. The Audit Committee of the Board reviews any significant changes from the prior year's methodologies.
PricewaterhouseCoopers LLP (PwC), independent registered public accounting firm and auditor to Fidelity and certain Fidelity funds, has been engaged annually by the Board as part of the Board's assessment of Fidelity's profitability analysis. PwC's engagement includes the review and assessment of the methodologies used by Fidelity in determining the revenues and expenses attributable to Fidelity's mutual fund business, and completion of agreed-upon procedures in respect of the mathematical accuracy of fund profitability and its conformity to established allocation methodologies. After considering PwC's reports issued under the engagement and information provided by Fidelity, the Board concluded that while other allocation methods may also be reasonable, Fidelity's profitability methodologies are reasonable in all material respects.
The Board also reviewed Fidelity's non-fund businesses and fall-out benefits related to the mutual fund business as well as cases where Fidelity's affiliates may benefit from or be related to the fund's business.
The Board considered the costs of the services provided by and the profits realized by Fidelity in connection with the operation of the fund and was satisfied that the profitability was not excessive.
Economies of Scale. The Board considered whether there have been economies of scale in respect of the management of the Fidelity funds, whether the Fidelity funds (including the fund) have appropriately benefited from any such economies of scale, and whether there is potential for realization of any further economies of scale. The Board considered the extent to which the fund will benefit from economies of scale as assets grow through increased services to the fund, through waivers or reimbursements, or through fee or expense ratio reductions. The Board also noted that in 2013, it and the boards of other Fidelity funds created an ad hoc committee (the Economies of Scale Committee) to analyze whether Fidelity attains economies of scale in respect of the management and servicing of the Fidelity funds, whether the Fidelity funds have appropriately benefited from such economies of scale, and whether there is potential for realization of any further economies of scale.
The Board recognized that the fund's management contract incorporates a "group fee" structure, which provides for lower group fee rates as total group assets increase, and for higher group fee rates as total group assets decrease (with "group assets" defined to include fund assets under FMR's management plus sector fund assets previously under FMR's management and currently managed by Fidelity SelectCo, LLC). FMR calculates the group fee rates based on a tiered asset "breakpoint" schedule that varies based on asset class. The Board considered that the group fee is designed to deliver the benefits of economies of scale to fund shareholders when total Fidelity fund assets increase, even if assets of any particular fund are unchanged or have declined, because some portion of Fidelity's costs are attributable to services provided to all Fidelity funds, and all funds benefit if those costs can be allocated among more assets. The Board concluded that, given the group fee structure, fund shareholders will benefit from lower management fees as group assets increase at the fund complex level, regardless of whether Fidelity achieves any such economies of scale.
The Board concluded, taking into account the analysis of the Economies of Scale Committee, that economies of scale, if any, are being appropriately shared between fund shareholders and Fidelity.
Additional Information Requested by the Board. In order to develop fully the factual basis for consideration of the Fidelity funds' Advisory Contracts, the Board requested and received additional information on certain topics, including: (i) fund performance trends and Fidelity's long-term strategies for certain funds; (ii) the various share classes employed by Fidelity and the attributes of each class, together with similar information on the distribution and servicing payments made by Fidelity or the funds to third-party participants in the distribution channels; (iii) fund profitability, and fund performance in relation to fund profitability; (iv) the methodology with respect to evaluating competitive fund data and peer group classifications and fee comparisons; (v) annual fund profitability margins, with particular focus on certain funds with negative margins; (vi) the realization of fall-out benefits in certain Fidelity business units;
(vii) economies of scale and the way in which they are shared with fund shareholders;(viii) Fidelity's group fee structures, including the group fee schedule of breakpoints;(ix) the impact of cost containment measures on the funds; and (x) the transfer agent fee structure.
Based on its evaluation of all of the conclusions noted above, and after considering all factors it believed relevant, the Board concluded that the advisory fee structures are fair and reasonable, and that the fund's Advisory Contracts should be renewed.
AICAP-ANN-1215
1.711985.117
Fidelity Advisor® International Capital Appreciation Fund Class I (formerly Institutional Class)
Annual Report October 31, 2015 |
|
Contents
To view a fund's proxy voting guidelines and proxy voting record for the 12-month period ended June 30, visit http://www.fidelity.com/proxyvotingresults or visit the Securities and Exchange Commission's (SEC) web site at http://www.sec.gov.
You may also call 1-877-208-0098 to request a free copy of the proxy voting guidelines.
Standard & Poor's, S&P and S&P 500 are registered service marks of The McGraw-Hill Companies, Inc. and have been licensed for use by Fidelity Distributors Corporation.
Other third-party marks appearing herein are the property of their respective owners.
All other marks appearing herein are registered or unregistered trademarks or service marks of FMR LLC or an affiliated company. © 2015 FMR LLC. All rights reserved.
This report and the financial statements contained herein are submitted for the general information of the shareholders of the Fund. This report is not authorized for distribution to prospective investors in the Fund unless preceded or accompanied by an effective prospectus.
A fund files its complete schedule of portfolio holdings with the SEC for the first and third quarters of each fiscal year on Form N-Q. Forms N-Q are available on the SEC’s web site at http://www.sec.gov. A fund's Forms N-Q may be reviewed and copied at the SEC’s Public Reference Room in Washington, DC. Information regarding the operation of the SEC's Public Reference Room may be obtained by calling 1-800-SEC-0330.
For a complete list of a fund's portfolio holdings, view the most recent holdings listing, semiannual report, or annual report on Fidelity's web site at http://www.fidelity.com, http://www.advisor.fidelity.com, or http://www.401k.com, as applicable.
NOT FDIC INSURED •MAY LOSE VALUE •NO BANK GUARANTEE
Neither the Fund nor Fidelity Distributors Corporation is a bank.
Performance: The Bottom Line
Average annual total return reflects the change in the value of an investment, assuming reinvestment of distributions from dividend income and capital gains (the profits earned upon the sale of securities that have grown in value, if any) and assuming a constant rate of performance each year.
The hypothetical investment and the average annual total returns do not reflect the deduction of taxes that a shareholder would pay on fund distributions or the redemption of fund shares.
During periods of reimbursement by Fidelity, a fund’s total return will be greater than it would be had the reimbursement not occurred.
How a fund did yesterday is no guarantee of how it will do tomorrow.
Average Annual Total Returns
| For the periods ended October 31, 2015 | Past 1 year | Past 5 years | Past 10 years |
| Class I | 3.80% | 8.20% | 5.50% |
$10,000 Over 10 Years
Let's say hypothetically that $10,000 was invested in Fidelity Advisor® International Capital Appreciation Fund - Class I on October 31, 2005.
The chart shows how the value of your investment would have changed, and also shows how the MSCI ACWI (All Country World Index) ex USA Index performed over the same period.
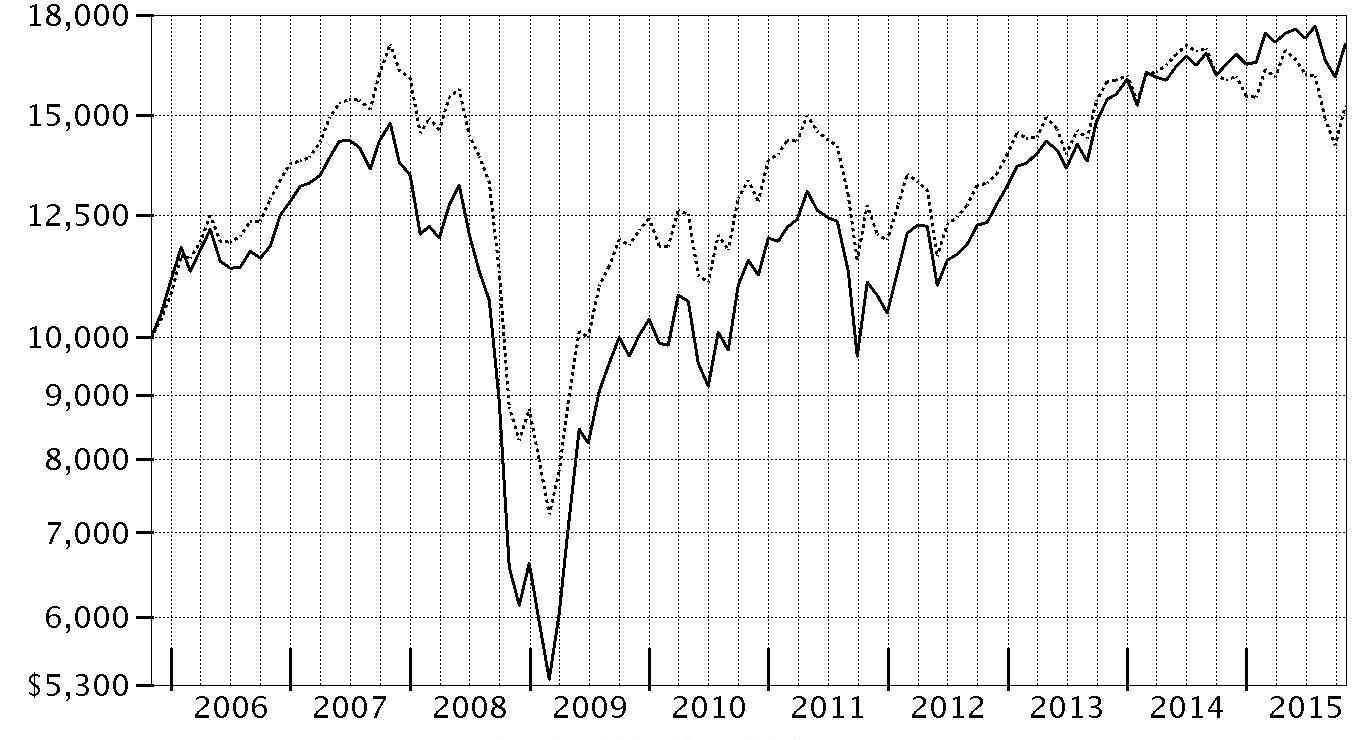
| Period Ending Values |
| $17,076 | Fidelity Advisor® International Capital Appreciation Fund - Class I |
| $15,246 | MSCI ACWI (All Country World Index) ex USA Index |
Management's Discussion of Fund Performance
Market Recap: International equities suffered a moderate setback for the 12 months ending October 31, 2015, held back by a collapse in commodities prices that hurt resources-related sectors and geographies. The MSCI ACWI (All Country World Index) ex USA Index returned -4.55% for the period, affected also by concerns about global economic growth. Commodity producers remained under pressure for much of the past year, largely related to economic deceleration in China (-1%), the world’s second-largest economy and a leading consumer of raw materials. This effect was exacerbated by U.S. dollar strength relative to global currencies, which weighed on commodities priced in dollars and acutely impacted equity returns within regions most exposed to resources prices. The emerging-markets group, for example, returned about -15% this period. Canada, a significant energy producer, returned roughly -17%. Net energy consumer Japan (+9%) was the best-performing region by far. Only about a quarter of the nearly 50 index countries managed a gain this period: Ireland (+19%) – the EU’s fastest-growing economy – and Israel (+17%) proved top performers; Greece (-56%) and Brazil (-46%), among the worst. As for sectors, energy (-25%) and materials (-16%) declined sharply, whereas the two consumer sectors each gained about 6%.
Comments from Portfolio Manager Sammy Simnegar: For the year, the fund’s share classes (excluding sales charges, if applicable) recorded modest single-digit gains and handily topped the benchmark MSCI ACWI (All Country World Index) ex USA Index. Stock selection in materials and consumer discretionary was especially beneficial to performance versus the benchmark, along with a sizable underweighting in energy. Geographically, out-of-benchmark exposure to the U.S. and stock selection in the U.K. and Germany meaningfully contributed. Sartorius, a Germany-based provider of laboratory technology and equipment for the biotechnology market, was our largest contributor. Also bolstering relative performance were OBIC, a Japan-based provider of software to small and mid-sized businesses; and Rightmove, which operates a real estate Internet portal in the United Kingdom. Conversely, a large underweighting in Japan dampened relative performance, as did our picks in Ireland, Brazil and China. Among sectors, consumer staples and telecommunication services detracted. At the stock level, the biggest detractor was our overweighting in Brazil-based Kroton Educacional, the world’s largest for-profit operator of colleges. I liquidated this position. Brazilian health insurer Qualicorp – also sold – further weighed on performance.
The views expressed above reflect those of the portfolio manager(s) only through the end of the period as stated on the cover of this report and do not necessarily represent the views of Fidelity or any other person in the Fidelity organization. Any such views are subject to change at any time based upon market or other conditions and Fidelity disclaims any responsibility to update such views. These views may not be relied on as investment advice and, because investment decisions for a Fidelity fund are based on numerous factors, may not be relied on as an indication of trading intent on behalf of any Fidelity fund.
Investment Summary (Unaudited)
Top Five Stocks as of October 31, 2015
| | % of fund's net assets | % of fund's net assets 6 months ago |
| Novartis AG sponsored ADR (Switzerland, Pharmaceuticals) | 1.6 | 1.5 |
| Bayer AG (Germany, Pharmaceuticals) | 1.1 | 1.0 |
| Novo Nordisk A/S Series B sponsored ADR (Denmark, Pharmaceuticals) | 1.1 | 0.9 |
| Taiwan Semiconductor Manufacturing Co. Ltd. sponsored ADR (Taiwan, Semiconductors & Semiconductor Equipment) | 1.0 | 1.0 |
| Tencent Holdings Ltd. (Cayman Islands, Internet Software & Services) | 1.0 | 0.8 |
| | 5.8 | |
Top Five Market Sectors as of October 31, 2015
| | % of fund's net assets | % of fund's net assets 6 months ago |
| Consumer Discretionary | 23.4 | 18.1 |
| Industrials | 17.5 | 20.9 |
| Information Technology | 17.2 | 14.8 |
| Health Care | 16.9 | 14.8 |
| Financials | 11.8 | 14.0 |
Top Five Countries as of October 31, 2015
| (excluding cash equivalents) | % of fund's net assets | % of fund's net assets 6 months ago |
| United States of America | 18.4 | 18.6 |
| United Kingdom | 17.2 | 16.3 |
| France | 7.4 | 6.3 |
| Japan | 6.5 | 3.2 |
| Germany | 6.4 | 4.1 |
Percentages are adjusted for the effect of futures contracts, if applicable.
Asset Allocation (% of fund's net assets)
| As of October 31, 2015 |
| | Stocks | 98.7% |
| | Short-Term Investments and Net Other Assets (Liabilities) | 1.3% |

| As of April 30, 2015 |
| | Stocks | 98.4% |
| | Short-Term Investments and Net Other Assets (Liabilities) | 1.6% |

Investments October 31, 2015
Showing Percentage of Net Assets
| Common Stocks - 98.3% | | | |
| | | Shares | Value |
| Australia - 3.0% | | | |
| Amcor Ltd. | | 132,873 | $1,283,395 |
| CSL Ltd. | | 23,438 | 1,557,931 |
| Ramsay Health Care Ltd. | | 26,985 | 1,186,197 |
| realestate.com.au Ltd. | | 35,135 | 1,194,093 |
| Sydney Airport unit | | 263,085 | 1,202,327 |
| Transurban Group unit | | 172,559 | 1,278,670 |
|
| TOTAL AUSTRALIA | | | 7,702,613 |
|
| Bailiwick of Jersey - 2.3% | | | |
| Delphi Automotive PLC | | 14,000 | 1,164,660 |
| Shire PLC | | 25,030 | 1,895,544 |
| Wolseley PLC | | 23,112 | 1,356,936 |
| WPP PLC | | 68,500 | 1,535,553 |
|
| TOTAL BAILIWICK OF JERSEY | | | 5,952,693 |
|
| Bermuda - 0.4% | | | |
| Signet Jewelers Ltd. | | 7,280 | 1,098,843 |
| Brazil - 0.9% | | | |
| BB Seguridade Participacoes SA | | 169,100 | 1,166,343 |
| Cielo SA | | 121,744 | 1,155,709 |
|
| TOTAL BRAZIL | | | 2,322,052 |
|
| Canada - 2.2% | | | |
| Alimentation Couche-Tard, Inc. Class B (sub. vtg.) | | 31,350 | 1,348,606 |
| Canadian National Railway Co. | | 30,290 | 1,850,155 |
| Canadian Pacific Railway Ltd. | | 9,950 | 1,398,220 |
| Constellation Software, Inc. | | 2,760 | 1,192,567 |
|
| TOTAL CANADA | | | 5,789,548 |
|
| Cayman Islands - 2.4% | | | |
| Alibaba Group Holding Ltd. sponsored ADR (a) | | 15,660 | 1,312,778 |
| TAL Education Group ADR (a) | | 29,960 | 1,151,962 |
| Tencent Holdings Ltd. | | 139,300 | 2,625,718 |
| Vipshop Holdings Ltd. ADR (a) | | 52,300 | 1,073,196 |
|
| TOTAL CAYMAN ISLANDS | | | 6,163,654 |
|
| Denmark - 2.0% | | | |
| Coloplast A/S Series B | | 15,830 | 1,135,724 |
| Novo Nordisk A/S Series B sponsored ADR | | 50,770 | 2,699,949 |
| Pandora A/S | | 10,920 | 1,259,873 |
|
| TOTAL DENMARK | | | 5,095,546 |
|
| Finland - 0.5% | | | |
| Sampo Oyj (A Shares) | | 28,700 | 1,403,787 |
| France - 7.4% | | | |
| Bureau Veritas SA | | 50,594 | 1,144,426 |
| Capgemini SA | | 14,800 | 1,318,749 |
| Christian Dior SA | | 6,300 | 1,240,768 |
| Dassault Systemes SA | | 17,100 | 1,350,880 |
| Essilor International SA | | 11,417 | 1,501,543 |
| Hermes International SCA | | 3,410 | 1,313,745 |
| Ingenico SA | | 9,868 | 1,165,435 |
| Korian | | 27,713 | 1,048,479 |
| L'Oreal SA | | 9,800 | 1,789,449 |
| Natixis SA | | 207,700 | 1,274,457 |
| Orpea | | 13,500 | 1,083,705 |
| Publicis Groupe SA | | 19,530 | 1,268,382 |
| Safran SA | | 17,830 | 1,354,261 |
| Sodexo SA | | 13,660 | 1,216,268 |
| SRP Groupe SA (a)(b) | | 58,300 | 1,129,611 |
|
| TOTAL FRANCE | | | 19,200,158 |
|
| Germany - 6.0% | | | |
| Bayer AG | | 21,420 | 2,858,339 |
| Continental AG | | 6,720 | 1,616,116 |
| CTS Eventim AG | | 26,811 | 1,049,732 |
| Fresenius Medical Care AG & Co. KGaA | | 15,600 | 1,404,118 |
| Fresenius SE & Co. KGaA | | 21,200 | 1,557,827 |
| Gerresheimer AG | | 13,570 | 1,059,032 |
| Henkel AG & Co. KGaA | | 15,393 | 1,422,030 |
| ProSiebenSat.1 Media AG | | 24,190 | 1,308,480 |
| Scout24 Holding GmbH | | 31,800 | 1,066,551 |
| Symrise AG | | 18,600 | 1,225,164 |
| Wirecard AG (c) | | 22,000 | 1,137,159 |
|
| TOTAL GERMANY | | | 15,704,548 |
|
| Hong Kong - 1.3% | | | |
| AIA Group Ltd. | | 379,400 | 2,224,548 |
| Techtronic Industries Co. Ltd. | | 296,500 | 1,083,908 |
|
| TOTAL HONG KONG | | | 3,308,456 |
|
| India - 3.6% | | | |
| Adani Ports & Special Economic Zone (a) | | 256,860 | 1,159,745 |
| Amara Raja Batteries Ltd. (a) | | 72,900 | 1,005,027 |
| Asian Paints India Ltd. | | 83,041 | 1,052,384 |
| HDFC Bank Ltd. (a) | | 47,898 | 960,675 |
| Housing Development Finance Corp. Ltd. | | 83,385 | 1,597,247 |
| Sun Pharmaceutical Industries Ltd. | | 90,537 | 1,230,317 |
| Tata Consultancy Services Ltd. | | 34,449 | 1,312,505 |
| Titan Co. Ltd. (a) | | 190,888 | 1,035,560 |
|
| TOTAL INDIA | | | 9,353,460 |
|
| Ireland - 4.2% | | | |
| Accenture PLC Class A | | 10,740 | 1,151,328 |
| Allegion PLC | | 17,000 | 1,107,890 |
| CRH PLC | | 54,800 | 1,499,921 |
| Fleetmatics Group PLC (a) | | 20,000 | 1,113,200 |
| Kerry Group PLC Class A | | 15,190 | 1,235,237 |
| Kingspan Group PLC (Ireland) | | 49,760 | 1,205,450 |
| Medtronic PLC | | 16,130 | 1,192,330 |
| Paddy Power PLC (Ireland) | | 10,100 | 1,168,400 |
| Ryanair Holdings PLC sponsored ADR | | 14,849 | 1,161,043 |
|
| TOTAL IRELAND | | | 10,834,799 |
|
| Isle of Man - 0.5% | | | |
| Playtech Ltd. | | 94,310 | 1,244,524 |
| Israel - 1.6% | | | |
| Check Point Software Technologies Ltd. (a) | | 13,990 | 1,188,311 |
| Frutarom Industries Ltd. | | 28,400 | 1,227,267 |
| Teva Pharmaceutical Industries Ltd. sponsored ADR | | 31,940 | 1,890,529 |
|
| TOTAL ISRAEL | | | 4,306,107 |
|
| Italy - 1.4% | | | |
| Azimut Holding SpA | | 51,000 | 1,227,638 |
| Mediolanum SpA | | 141,900 | 1,157,039 |
| Mediolanum SpA rights | | 141,900 | 9 |
| Recordati SpA | | 48,721 | 1,211,354 |
|
| TOTAL ITALY | | | 3,596,040 |
|
| Japan - 6.5% | | | |
| Astellas Pharma, Inc. | | 112,400 | 1,631,428 |
| Dentsu, Inc. | | 23,400 | 1,315,504 |
| Hoya Corp. | | 36,500 | 1,506,237 |
| Kansai Paint Co. Ltd. | | 79,300 | 1,208,833 |
| Keyence Corp. | | 3,237 | 1,685,210 |
| Misumi Group, Inc. | | 98,200 | 1,278,770 |
| Nitori Holdings Co. Ltd. | | 14,400 | 1,122,897 |
| OBIC Co. Ltd. | | 23,200 | 1,224,426 |
| Olympus Corp. | | 37,600 | 1,268,298 |
| SHIMANO, Inc. | | 8,500 | 1,339,333 |
| SK Kaken Co. Ltd. | | 11,130 | 1,084,007 |
| Sundrug Co. Ltd. | | 21,200 | 1,116,805 |
| Tsuruha Holdings, Inc. | | 13,900 | 1,101,214 |
|
| TOTAL JAPAN | | | 16,882,962 |
|
| Luxembourg - 0.9% | | | |
| Eurofins Scientific SA | | 3,500 | 1,267,209 |
| Grand City Properties SA | | 54,896 | 1,096,254 |
|
| TOTAL LUXEMBOURG | | | 2,363,463 |
|
| Mexico - 1.7% | | | |
| Grupo Aeroportuario del Pacifico SA de CV Series B | | 116,200 | 1,046,572 |
| Grupo Aeroportuario del Sureste SA de CV Series B | | 69,010 | 1,068,795 |
| Grupo Aeroportuario Norte S.A.B. de CV | | 208,700 | 1,073,457 |
| Megacable Holdings S.A.B. de CV unit | | 299,400 | 1,141,025 |
|
| TOTAL MEXICO | | | 4,329,849 |
|
| Netherlands - 1.5% | | | |
| IMCD Group BV | | 28,500 | 1,066,188 |
| LyondellBasell Industries NV Class A | | 11,930 | 1,108,416 |
| RELX NV | | 94,709 | 1,619,482 |
|
| TOTAL NETHERLANDS | | | 3,794,086 |
|
| Norway - 0.4% | | | |
| Schibsted ASA (A Shares) | | 34,460 | 1,155,865 |
| Philippines - 1.8% | | | |
| Ayala Corp. | | 71,080 | 1,183,762 |
| International Container Terminal Services, Inc. | | 621,370 | 1,095,516 |
| SM Investments Corp. | | 60,035 | 1,120,801 |
| SM Prime Holdings, Inc. | | 2,547,900 | 1,173,183 |
|
| TOTAL PHILIPPINES | | | 4,573,262 |
|
| South Africa - 1.2% | | | |
| Discovery Ltd. | | 107,700 | 1,151,788 |
| Naspers Ltd. Class N | | 13,880 | 2,033,005 |
|
| TOTAL SOUTH AFRICA | | | 3,184,793 |
|
| Spain - 1.4% | | | |
| Aena SA | | 10,330 | 1,152,978 |
| Amadeus IT Holding SA Class A | | 30,060 | 1,281,230 |
| Grifols SA ADR | | 34,840 | 1,212,780 |
|
| TOTAL SPAIN | | | 3,646,988 |
|
| Sweden - 1.1% | | | |
| ASSA ABLOY AB (B Shares) | | 71,418 | 1,420,724 |
| Hexagon AB (B Shares) | | 38,500 | 1,337,477 |
|
| TOTAL SWEDEN | | | 2,758,201 |
|
| Switzerland - 3.7% | | | |
| Compagnie Financiere Richemont SA Series A | | 20,892 | 1,791,438 |
| Givaudan SA | | 765 | 1,369,872 |
| Novartis AG sponsored ADR | | 46,900 | 4,241,172 |
| Partners Group Holding AG | | 3,270 | 1,184,339 |
| Sika AG (Bearer) | | 354 | 1,161,795 |
|
| TOTAL SWITZERLAND | | | 9,748,616 |
|
| Taiwan - 1.5% | | | |
| Largan Precision Co. Ltd. | | 16,000 | 1,249,345 |
| Taiwan Semiconductor Manufacturing Co. Ltd. sponsored ADR | | 120,000 | 2,635,200 |
|
| TOTAL TAIWAN | | | 3,884,545 |
|
| Thailand - 0.5% | | | |
| Airports of Thailand PCL (For. Reg.) | | 142,600 | 1,192,000 |
| Turkey - 0.4% | | | |
| TAV Havalimanlari Holding A/S | | 147,800 | 1,160,945 |
| United Arab Emirates - 0.4% | | | |
| DP World Ltd. | | 57,491 | 1,161,893 |
| United Kingdom - 17.2% | | | |
| Aon PLC | | 12,620 | 1,177,572 |
| Ashtead Group PLC | | 82,340 | 1,269,353 |
| Auto Trader Group PLC | | 193,200 | 1,158,586 |
| Berkeley Group Holdings PLC | | 22,530 | 1,152,416 |
| Bunzl PLC | | 45,700 | 1,309,686 |
| Capita Group PLC | | 64,700 | 1,271,704 |
| Close Brothers Group PLC | | 50,300 | 1,135,222 |
| Compass Group PLC | | 89,141 | 1,532,414 |
| Dignity PLC | | 32,167 | 1,205,500 |
| Diploma PLC | | 116,690 | 1,153,990 |
| easyJet PLC | | 44,000 | 1,187,032 |
| EMIS Group PLC | | 66,100 | 1,093,384 |
| Essentra PLC | | 89,400 | 1,160,436 |
| Halma PLC | | 93,300 | 1,098,152 |
| Hargreaves Lansdown PLC | | 53,500 | 1,190,948 |
| Hikma Pharmaceuticals PLC | | 35,628 | 1,188,558 |
| Howden Joinery Group PLC | | 175,403 | 1,253,580 |
| Inchcape PLC | | 96,000 | 1,183,209 |
| InterContinental Hotel Group PLC | | 33,000 | 1,318,662 |
| Intertek Group PLC | | 28,330 | 1,146,430 |
| ITV PLC | | 358,400 | 1,394,534 |
| JUST EAT Ltd. (a) | | 172,196 | 1,130,848 |
| London Stock Exchange Group PLC | | 34,163 | 1,340,342 |
| Mondi PLC | | 55,600 | 1,289,123 |
| Moneysupermarket.com Group PLC | | 210,600 | 1,085,017 |
| Persimmon PLC | | 39,400 | 1,211,136 |
| Prudential PLC | | 90,308 | 2,109,278 |
| Reckitt Benckiser Group PLC | | 19,930 | 1,944,979 |
| Rightmove PLC | | 19,930 | 1,179,498 |
| Schroders PLC | | 28,000 | 1,287,606 |
| St. James's Place Capital PLC | | 90,019 | 1,338,468 |
| Standard Life PLC | | 215,755 | 1,399,947 |
| Taylor Wimpey PLC | | 398,000 | 1,214,842 |
| The Restaurant Group PLC | | 98,215 | 1,085,597 |
| Whitbread PLC | | 19,455 | 1,489,394 |
|
| TOTAL UNITED KINGDOM | | | 44,687,443 |
|
| United States of America - 18.4% | | | |
| A.O. Smith Corp. | | 14,777 | 1,135,169 |
| Acuity Brands, Inc. | | 5,340 | 1,167,324 |
| Alphabet, Inc. Class C | | 1,530 | 1,087,539 |
| Amphenol Corp. Class A | | 20,108 | 1,090,256 |
| Apple, Inc. | | 9,550 | 1,141,225 |
| AutoZone, Inc. (a) | | 1,341 | 1,051,894 |
| Cerner Corp. (a) | | 17,480 | 1,158,749 |
| Cognizant Technology Solutions Corp. Class A (a) | | 16,120 | 1,097,933 |
| Danaher Corp. | | 11,900 | 1,110,389 |
| Domino's Pizza, Inc. | | 10,610 | 1,131,769 |
| Ecolab, Inc. | | 9,250 | 1,113,238 |
| Facebook, Inc. Class A (a) | | 10,970 | 1,118,611 |
| FactSet Research Systems, Inc. | | 6,200 | 1,085,744 |
| Fidelity National Information Services, Inc. | | 14,750 | 1,075,570 |
| Fiserv, Inc. (a) | | 11,679 | 1,127,140 |
| FleetCor Technologies, Inc. (a) | | 7,980 | 1,155,983 |
| Gartner, Inc. Class A (a) | | 12,460 | 1,129,748 |
| Henry Schein, Inc. (a) | | 7,230 | 1,096,863 |
| Home Depot, Inc. | | 8,590 | 1,062,068 |
| IMS Health Holdings, Inc. (a) | | 44,500 | 1,211,290 |
| International Flavors & Fragrances, Inc. | | 10,050 | 1,166,403 |
| L Brands, Inc. | | 11,220 | 1,076,896 |
| MasterCard, Inc. Class A | | 10,900 | 1,078,991 |
| McGraw Hill Financial, Inc. | | 12,214 | 1,131,505 |
| Mettler-Toledo International, Inc. (a) | | 4,000 | 1,243,960 |
| Middleby Corp. (a) | | 9,350 | 1,093,389 |
| Moody's Corp. | | 11,720 | 1,126,995 |
| MSCI, Inc. Class A | | 8,000 | 536,000 |
| NIKE, Inc. Class B | | 8,270 | 1,083,618 |
| O'Reilly Automotive, Inc. (a) | | 4,230 | 1,168,580 |
| PPG Industries, Inc. | | 11,890 | 1,239,651 |
| Priceline Group, Inc. (a) | | 796 | 1,157,575 |
| ServiceMaster Global Holdings, Inc. (a) | | 33,000 | 1,176,450 |
| Sherwin-Williams Co. | | 4,640 | 1,238,091 |
| Starbucks Corp. | | 17,600 | 1,101,232 |
| The Hain Celestial Group, Inc. (a) | | 22,100 | 1,101,685 |
| The Walt Disney Co. | | 9,943 | 1,130,917 |
| TJX Companies, Inc. | | 15,600 | 1,141,764 |
| TransDigm Group, Inc. (a) | | 5,070 | 1,114,640 |
| Union Pacific Corp. | | 12,040 | 1,075,774 |
| Verisk Analytics, Inc. (a) | | 16,250 | 1,163,663 |
| Visa, Inc. Class A | | 14,140 | 1,096,981 |
| Wabtec Corp. | | 13,694 | 1,134,822 |
|
| TOTAL UNITED STATES OF AMERICA | | | 47,928,084 |
|
| TOTAL COMMON STOCKS | | | |
| (Cost $241,632,009) | | | 255,529,823 |
|
| Nonconvertible Preferred Stocks - 0.4% | | | |
| Germany - 0.4% | | | |
| Sartorius AG (non-vtg.) | | | |
| (Cost $667,892) | | 4,957 | 1,121,809 |
|
| Money Market Funds - 1.7% | | | |
| Fidelity Cash Central Fund, 0.18% (d) | | 3,983,113 | 3,983,113 |
| Fidelity Securities Lending Cash Central Fund, 0.19% (d)(e) | | 318,800 | 318,800 |
| TOTAL MONEY MARKET FUNDS | | | |
| (Cost $4,301,913) | | | 4,301,913 |
| TOTAL INVESTMENT PORTFOLIO - 100.4% | | | |
| (Cost $246,601,814) | | | 260,953,545 |
| NET OTHER ASSETS (LIABILITIES) - (0.4)% | | | (934,337) |
| NET ASSETS - 100% | | | $260,019,208 |
Categorizations in the Schedule of Investments are based on country or territory of incorporation.
Legend
(a) Non-income producing
(b) Security exempt from registration under Rule 144A of the Securities Act of 1933. These securities may be resold in transactions exempt from registration, normally to qualified institutional buyers. At the end of the period, the value of these securities amounted to $1,129,611 or 0.4% of net assets.
(c) Security or a portion of the security is on loan at period end.
(d) Affiliated fund that is generally available only to investment companies and other accounts managed by Fidelity Investments. The rate quoted is the annualized seven-day yield of the fund at period end. A complete unaudited listing of the fund's holdings as of its most recent quarter end is available upon request. In addition, each Fidelity Central Fund's financial statements, which are not covered by the Fund's Report of Independent Registered Public Accounting Firm, are available on the SEC's website or upon request.
(e) Investment made with cash collateral received from securities on loan.
Affiliated Central Funds
Information regarding fiscal year to date income earned by the Fund from investments in Fidelity Central Funds is as follows:
| Fund | Income earned |
| Fidelity Cash Central Fund | $4,929 |
| Fidelity Securities Lending Cash Central Fund | 24,549 |
| Total | $29,478 |
Investment Valuation
The following is a summary of the inputs used, as of October 31, 2015, involving the Fund's assets and liabilities carried at fair value. The inputs or methodology used for valuing securities may not be an indication of the risk associated with investing in those securities. For more information on valuation inputs, and their aggregation into the levels used below, please refer to the Investment Valuation section in the accompanying Notes to Financial Statements.
| | Valuation Inputs at Reporting Date: |
| Description | Total | Level 1 | Level 2 | Level 3 |
| Investments in Securities: | | | | |
| Equities: | | | | |
| Consumer Discretionary | $59,801,633 | $46,532,271 | $13,269,362 | $-- |
| Consumer Staples | 11,060,005 | 6,897,007 | 4,162,998 | -- |
| Financials | 30,574,952 | 21,326,250 | 9,248,702 | -- |
| Health Care | 43,754,655 | 30,516,758 | 13,237,897 | -- |
| Industrials | 46,525,765 | 33,060,988 | 13,464,777 | -- |
| Information Technology | 45,506,626 | 38,658,767 | 6,847,859 | -- |
| Materials | 19,427,996 | 13,299,456 | 6,128,540 | -- |
| Money Market Funds | 4,301,913 | 4,301,913 | -- | -- |
| Total Investments in Securities: | $260,953,545 | $194,593,410 | $66,360,135 | $-- |
The following is a summary of transfers between Level 1 and Level 2 for the period ended October 31, 2015. Transfers are assumed to have occurred at the beginning of the period, and are primarily attributable to the valuation techniques used for foreign equity securities, as discussed in the accompanying Notes to Financial Statements:
| Transfers | Total |
| Level 1 to Level 2 | $4,691,453 |
| Level 2 to Level 1 | $0 |
See accompanying notes which are an integral part of the financial statements.
Financial Statements
Statement of Assets and Liabilities
| | | October 31, 2015 |
| Assets | | |
Investment in securities, at value (including securities loaned of $309,468) — See accompanying schedule:
Unaffiliated issuers (cost $242,299,901) | $256,651,632 | |
| Fidelity Central Funds (cost $4,301,913) | 4,301,913 | |
| Total Investments (cost $246,601,814) | | $260,953,545 |
| Foreign currency held at value (cost $259,034) | | 259,344 |
| Receivable for investments sold | | 6,131,704 |
| Receivable for fund shares sold | | 761,785 |
| Dividends receivable | | 327,758 |
| Distributions receivable from Fidelity Central Funds | | 564 |
| Prepaid expenses | | 656 |
| Other receivables | | 266,008 |
| Total assets | | 268,701,364 |
| Liabilities | | |
| Payable for investments purchased | $7,774,342 | |
| Payable for fund shares redeemed | 189,689 | |
| Accrued management fee | 179,653 | |
| Distribution and service plan fees payable | 73,830 | |
| Other affiliated payables | 57,383 | |
| Other payables and accrued expenses | 88,459 | |
| Collateral on securities loaned, at value | 318,800 | |
| Total liabilities | | 8,682,156 |
| Net Assets | | $260,019,208 |
| Net Assets consist of: | | |
| Paid in capital | | $311,032,741 |
| Undistributed net investment income | | 218,436 |
| Accumulated undistributed net realized gain (loss) on investments and foreign currency transactions | | (65,473,731) |
| Net unrealized appreciation (depreciation) on investments and assets and liabilities in foreign currencies | | 14,241,762 |
| Net Assets | | $260,019,208 |
| Calculation of Maximum Offering Price | | |
| Class A: | | |
| Net Asset Value and redemption price per share ($89,753,029 ÷ 5,884,115 shares) | | $15.25 |
| Maximum offering price per share (100/94.25 of $15.25) | | $16.18 |
| Class T: | | |
| Net Asset Value and redemption price per share ($60,293,235 ÷ 4,035,684 shares) | | $14.94 |
| Maximum offering price per share (100/96.50 of $14.94) | | $15.48 |
| Class B: | | |
| Net Asset Value and offering price per share ($1,060,778 ÷ 77,172 shares)(a) | | $13.75 |
| Class C: | | |
| Net Asset Value and offering price per share ($36,491,269 ÷ 2,665,083 shares)(a) | | $13.69 |
| Class I: | | |
| Net Asset Value, offering price and redemption price per share ($72,420,897 ÷ 4,449,454 shares) | | $16.28 |
(a) Redemption price per share is equal to net asset value less any applicable contingent deferred sales charge.
See accompanying notes which are an integral part of the financial statements.
Statement of Operations
| | | Year ended October 31, 2015 |
| Investment Income | | |
| Dividends | | $3,976,431 |
| Income from Fidelity Central Funds | | 29,478 |
| Income before foreign taxes withheld | | 4,005,909 |
| Less foreign taxes withheld | | (253,127) |
| Total income | | 3,752,782 |
| Expenses | | |
| Management fee | | |
| Basic fee | $1,514,810 | |
| Performance adjustment | 290,902 | |
| Transfer agent fees | 501,343 | |
| Distribution and service plan fees | 788,433 | |
| Accounting and security lending fees | 112,620 | |
| Custodian fees and expenses | 295,235 | |
| Independent trustees' compensation | 882 | |
| Registration fees | 79,209 | |
| Audit | 90,184 | |
| Legal | 676 | |
| Miscellaneous | 1,534 | |
| Total expenses before reductions | 3,675,828 | |
| Expense reductions | (327,325) | 3,348,503 |
| Net investment income (loss) | | 404,279 |
| Realized and Unrealized Gain (Loss) | | |
| Net realized gain (loss) on: | | |
| Investment securities: | | |
| Unaffiliated issuers (net of foreign taxes of $46,248) | 3,704,653 | |
| Foreign currency transactions | (125,449) | |
| Total net realized gain (loss) | | 3,579,204 |
Change in net unrealized appreciation (depreciation) on:
Investment securities (net of decrease in deferred foreign taxes of $96,847) | 761,197 | |
| Assets and liabilities in foreign currencies | (17,330) | |
| Total change in net unrealized appreciation (depreciation) | | 743,867 |
| Net gain (loss) | | 4,323,071 |
| Net increase (decrease) in net assets resulting from operations | | $4,727,350 |
See accompanying notes which are an integral part of the financial statements.
Statement of Changes in Net Assets
| | Year ended October 31, 2015 | Year ended October 31, 2014 |
| Increase (Decrease) in Net Assets | | |
| Operations | | |
| Net investment income (loss) | $404,279 | $313,539 |
| Net realized gain (loss) | 3,579,204 | 17,397,899 |
| Change in net unrealized appreciation (depreciation) | 743,867 | (9,394,840) |
| Net increase (decrease) in net assets resulting from operations | 4,727,350 | 8,316,598 |
| Distributions to shareholders from net investment income | (176,462) | (450,291) |
| Share transactions - net increase (decrease) | 104,495,853 | 1,810,485 |
| Redemption fees | 14,747 | 1,603 |
| Total increase (decrease) in net assets | 109,061,488 | 9,678,395 |
| Net Assets | | |
| Beginning of period | 150,957,720 | 141,279,325 |
| End of period (including undistributed net investment income of $218,436 and undistributed net investment income of $157,952, respectively) | $260,019,208 | $150,957,720 |
See accompanying notes which are an integral part of the financial statements.
Financial Highlights — Fidelity Advisor International Capital Appreciation Fund Class A
| Years ended October 31, | 2015 | 2014 | 2013 | 2012 | 2011 |
| Selected Per–Share Data | | | | | |
| Net asset value, beginning of period | $14.77 | $13.96 | $11.25 | $10.21 | $10.85 |
| Income from Investment Operations | | | | | |
| Net investment income (loss)A | .05 | .06 | .07 | .08 | .08B |
| Net realized and unrealized gain (loss) | .46 | .82 | 2.73 | 1.05 | (.53) |
| Total from investment operations | .51 | .88 | 2.80 | 1.13 | (.45) |
| Distributions from net investment income | (.03) | (.07) | (.09) | (.09) | (.08) |
| Distributions from net realized gain | – | – | – | (.01) | (.12) |
| Total distributions | (.03) | (.07) | (.09) | (.09)C | (.19)D |
| Redemption fees added to paid in capitalA,E | – | – | – | – | – |
| Net asset value, end of period | $15.25 | $14.77 | $13.96 | $11.25 | $10.21 |
| Total ReturnF,G | 3.46% | 6.31% | 24.99% | 11.19% | (4.25)% |
| Ratios to Average Net AssetsH,I | | | | | |
| Expenses before reductions | 1.58% | 1.73% | 1.74% | 1.78% | 1.64% |
| Expenses net of fee waivers, if any | 1.45% | 1.45% | 1.45% | 1.45% | 1.45% |
| Expenses net of all reductions | 1.42% | 1.44% | 1.39% | 1.41% | 1.38% |
| Net investment income (loss) | .30% | .42% | .58% | .73% | .74%B |
| Supplemental Data | | | | | |
| Net assets, end of period (000 omitted) | $89,753 | $51,567 | $49,797 | $40,624 | $40,364 |
| Portfolio turnover rateJ | 176% | 197% | 138% | 142% | 254% |
A Calculated based on average shares outstanding during the period.
B Investment income per share reflects a large, non-recurring dividend which amounted to $.03 per share. Excluding this non-recurring dividend, the ratio of net investment income (loss) to average net assets would have been .49%.
C Total distributions of $.09 per share is comprised of distributions from net investment income of $.085 and distributions from net realized gain of $.005 per share.
D Total distributions of $.19 per share is comprised of distributions from net investment income of $.077 and distributions from net realized gain of $.116 per share.
E Amount represents less than $.005 per share.
F Total returns would have been lower if certain expenses had not been reduced during the applicable periods shown.
G Total returns do not include the effect of the sales charges.
H Fees and expenses of any underlying Fidelity Central Funds are not included in the Fund's expense ratio. The Fund indirectly bears its proportionate share of the expenses of any underlying Fidelity Central Funds.
I Expense ratios reflect operating expenses of the class. Expenses before reductions do not reflect amounts reimbursed by the investment adviser or reductions from brokerage service arrangements or reductions from other expense offset arrangements and do not represent the amount paid by the class during periods when reimbursements or reductions occur. Expenses net of fee waivers reflect expenses after reimbursement by the investment adviser but prior to reductions from brokerage service arrangements or other expense offset arrangements. Expenses net of all reductions represent the net expenses paid by the class.
J Amount does not include the portfolio activity of any underlying Fidelity Central Funds.
See accompanying notes which are an integral part of the financial statements.
Financial Highlights — Fidelity Advisor International Capital Appreciation Fund Class T
| Years ended October 31, | 2015 | 2014 | 2013 | 2012 | 2011 |
| Selected Per–Share Data | | | | | |
| Net asset value, beginning of period | $14.47 | $13.68 | $11.03 | $10.00 | $10.63 |
| Income from Investment Operations | | | | | |
| Net investment income (loss)A | .01 | .02 | .04 | .05 | .05B |
| Net realized and unrealized gain (loss) | .46 | .81 | 2.66 | 1.04 | (.52) |
| Total from investment operations | .47 | .83 | 2.70 | 1.09 | (.47) |
| Distributions from net investment income | – | (.04) | (.05) | (.06) | (.05) |
| Distributions from net realized gain | – | – | – | (.01) | (.12) |
| Total distributions | – | (.04) | (.05) | (.06)C | (.16)D |
| Redemption fees added to paid in capitalA,E | – | – | – | – | – |
| Net asset value, end of period | $14.94 | $14.47 | $13.68 | $11.03 | $10.00 |
| Total ReturnF,G | 3.25% | 6.07% | 24.57% | 10.99% | (4.51)% |
| Ratios to Average Net AssetsH,I | | | | | |
| Expenses before reductions | 1.86% | 1.94% | 1.96% | 2.03% | 1.88% |
| Expenses net of fee waivers, if any | 1.70% | 1.70% | 1.70% | 1.70% | 1.70% |
| Expenses net of all reductions | 1.67% | 1.69% | 1.64% | 1.66% | 1.62% |
| Net investment income (loss) | .05% | .17% | .33% | .48% | .49%B |
| Supplemental Data | | | | | |
| Net assets, end of period (000 omitted) | $60,293 | $58,454 | $60,152 | $53,835 | $59,914 |
| Portfolio turnover rateJ | 176% | 197% | 138% | 142% | 254% |
A Calculated based on average shares outstanding during the period.
B Investment income per share reflects a large, non-recurring dividend which amounted to $.03 per share. Excluding this non-recurring dividend, the ratio of net investment income (loss) to average net assets would have been .24%.
C Total distributions of $.06 per share is comprised of distributions from net investment income of $.056 and distributions from net realized gain of $.005 per share.
D Total distributions of $.16 per share is comprised of distributions from net investment income of $.047 and distributions from net realized gain of $.116 per share.
E Amount represents less than $.005 per share.
F Total returns would have been lower if certain expenses had not been reduced during the applicable periods shown.
G Total returns do not include the effect of the sales charges.
H Fees and expenses of any underlying Fidelity Central Funds are not included in the Fund's expense ratio. The Fund indirectly bears its proportionate share of the expenses of any underlying Fidelity Central Funds.
I Expense ratios reflect operating expenses of the class. Expenses before reductions do not reflect amounts reimbursed by the investment adviser or reductions from brokerage service arrangements or reductions from other expense offset arrangements and do not represent the amount paid by the class during periods when reimbursements or reductions occur. Expenses net of fee waivers reflect expenses after reimbursement by the investment adviser but prior to reductions from brokerage service arrangements or other expense offset arrangements. Expenses net of all reductions represent the net expenses paid by the class.
J Amount does not include the portfolio activity of any underlying Fidelity Central Funds.
See accompanying notes which are an integral part of the financial statements.
Financial Highlights — Fidelity Advisor International Capital Appreciation Fund Class B
| Years ended October 31, | 2015 | 2014 | 2013 | 2012 | 2011 |
| Selected Per–Share Data | | | | | |
| Net asset value, beginning of period | $13.38 | $12.68 | $10.22 | $9.26 | $9.84 |
| Income from Investment Operations | | | | | |
| Net investment income (loss)A | (.06) | (.04) | (.02) | –B | –B,C |
| Net realized and unrealized gain (loss) | .43 | .74 | 2.48 | .96 | (.48) |
| Total from investment operations | .37 | .70 | 2.46 | .96 | (.48) |
| Distributions from net investment income | – | – | – | – | (.01) |
| Distributions from net realized gain | – | – | – | – | (.09) |
| Total distributions | – | – | – | – | (.10) |
| Redemption fees added to paid in capitalA,B | – | – | – | – | – |
| Net asset value, end of period | $13.75 | $13.38 | $12.68 | $10.22 | $9.26 |
| Total ReturnD,E | 2.77% | 5.52% | 24.07% | 10.37% | (4.99)% |
| Ratios to Average Net AssetsF,G | | | | | |
| Expenses before reductions | 2.44% | 2.50% | 2.51% | 2.54% | 2.39% |
| Expenses net of fee waivers, if any | 2.20% | 2.20% | 2.20% | 2.20% | 2.20% |
| Expenses net of all reductions | 2.18% | 2.19% | 2.15% | 2.16% | 2.13% |
| Net investment income (loss) | (.46)% | (.33)% | (.17)% | (.02)% | (.01)%C |
| Supplemental Data | | | | | |
| Net assets, end of period (000 omitted) | $1,061 | $1,577 | $2,228 | $2,745 | $4,241 |
| Portfolio turnover rateH | 176% | 197% | 138% | 142% | 254% |
A Calculated based on average shares outstanding during the period.
B Amount represents less than $.005 per share.
C Investment income per share reflects a large, non-recurring dividend which amounted to $.03 per share. Excluding this non-recurring dividend, the ratio of net investment income (loss) to average net assets would have been (.26) %.
D Total returns would have been lower if certain expenses had not been reduced during the applicable periods shown.
E Total returns do not include the effect of the contingent deferred sales charge.
F Fees and expenses of any underlying Fidelity Central Funds are not included in the Fund's expense ratio. The Fund indirectly bears its proportionate share of the expenses of any underlying Fidelity Central Funds.
G Expense ratios reflect operating expenses of the class. Expenses before reductions do not reflect amounts reimbursed by the investment adviser or reductions from brokerage service arrangements or reductions from other expense offset arrangements and do not represent the amount paid by the class during periods when reimbursements or reductions occur. Expenses net of fee waivers reflect expenses after reimbursement by the investment adviser but prior to reductions from brokerage service arrangements or other expense offset arrangements. Expenses net of all reductions represent the net expenses paid by the class.
H Amount does not include the portfolio activity of any underlying Fidelity Central Funds.
See accompanying notes which are an integral part of the financial statements.
Financial Highlights — Fidelity Advisor International Capital Appreciation Fund Class C
| Years ended October 31, | 2015 | 2014 | 2013 | 2012 | 2011 |
| Selected Per–Share Data | | | | | |
| Net asset value, beginning of period | $13.33 | $12.63 | $10.18 | $9.23 | $9.84 |
| Income from Investment Operations | | | | | |
| Net investment income (loss)A | (.06) | (.04) | (.02) | –B | –B,C |
| Net realized and unrealized gain (loss) | .42 | .74 | 2.47 | .96 | (.49) |
| Total from investment operations | .36 | .70 | 2.45 | .96 | (.49) |
| Distributions from net investment income | – | – | – | (.01) | (.01) |
| Distributions from net realized gain | – | – | – | (.01) | (.11) |
| Total distributions | – | – | – | (.01)D | (.12) |
| Redemption fees added to paid in capitalA,B | – | – | – | – | – |
| Net asset value, end of period | $13.69 | $13.33 | $12.63 | $10.18 | $9.23 |
| Total ReturnE,F | 2.70% | 5.54% | 24.07% | 10.41% | (5.07)% |
| Ratios to Average Net AssetsG,H | | | | | |
| Expenses before reductions | 2.33% | 2.47% | 2.49% | 2.53% | 2.39% |
| Expenses net of fee waivers, if any | 2.20% | 2.20% | 2.20% | 2.20% | 2.20% |
| Expenses net of all reductions | 2.17% | 2.19% | 2.14% | 2.16% | 2.13% |
| Net investment income (loss) | (.45)% | (.33)% | (.17)% | (.02)% | (.01)%C |
| Supplemental Data | | | | | |
| Net assets, end of period (000 omitted) | $36,491 | $20,910 | $21,334 | $18,090 | $19,619 |
| Portfolio turnover rateI | 176% | 197% | 138% | 142% | 254% |
A Calculated based on average shares outstanding during the period.
B Amount represents less than $.005 per share.
C Investment income per share reflects a large, non-recurring dividend which amounted to $.03 per share. Excluding this non-recurring dividend, the ratio of net investment income (loss) to average net assets would have been (.26) %.
D Total distributions of $.01 per share is comprised of distributions from net investment income of $.005 and distributions from net realized gain of $.005 per share.
E Total returns would have been lower if certain expenses had not been reduced during the applicable periods shown.
F Total returns do not include the effect of the contingent deferred sales charge.
G Fees and expenses of any underlying Fidelity Central Funds are not included in the Fund's expense ratio. The Fund indirectly bears its proportionate share of the expenses of any underlying Fidelity Central Funds.
H Expense ratios reflect operating expenses of the class. Expenses before reductions do not reflect amounts reimbursed by the investment adviser or reductions from brokerage service arrangements or reductions from other expense offset arrangements and do not represent the amount paid by the class during periods when reimbursements or reductions occur. Expenses net of fee waivers reflect expenses after reimbursement by the investment adviser but prior to reductions from brokerage service arrangements or other expense offset arrangements. Expenses net of all reductions represent the net expenses paid by the class.
I Amount does not include the portfolio activity of any underlying Fidelity Central Funds.
See accompanying notes which are an integral part of the financial statements.
Financial Highlights — Fidelity Advisor International Capital Appreciation Fund Class I
| Years ended October 31, | 2015 | 2014 | 2013 | 2012 | 2011 |
| Selected Per–Share Data | | | | | |
| Net asset value, beginning of period | $15.75 | $14.87 | $11.99 | $10.87 | $11.54 |
| Income from Investment Operations | | | | | |
| Net investment income (loss)A | .09 | .10 | .11 | .11 | .12B |
| Net realized and unrealized gain (loss) | .51 | .87 | 2.89 | 1.13 | (.57) |
| Total from investment operations | .60 | .97 | 3.00 | 1.24 | (.45) |
| Distributions from net investment income | (.07) | (.09) | (.12) | (.12) | (.11) |
| Distributions from net realized gain | – | – | – | (.01) | (.12) |
| Total distributions | (.07) | (.09) | (.12) | (.12)C | (.22)D |
| Redemption fees added to paid in capitalA,E | – | – | – | – | – |
| Net asset value, end of period | $16.28 | $15.75 | $14.87 | $11.99 | $10.87 |
| Total ReturnF | 3.80% | 6.58% | 25.20% | 11.56% | (4.01)% |
| Ratios to Average Net AssetsG,H | | | | | |
| Expenses before reductions | 1.27% | 1.38% | 1.39% | 1.48% | 1.35% |
| Expenses net of fee waivers, if any | 1.20% | 1.20% | 1.20% | 1.20% | 1.20% |
| Expenses net of all reductions | 1.17% | 1.20% | 1.14% | 1.16% | 1.12% |
| Net investment income (loss) | .55% | .67% | .83% | .98% | 1.00%B |
| Supplemental Data | | | | | |
| Net assets, end of period (000 omitted) | $72,421 | $18,449 | $7,768 | $4,568 | $4,335 |
| Portfolio turnover rateI | 176% | 197% | 138% | 142% | 254% |
A Calculated based on average shares outstanding during the period.
B Investment income per share reflects a large, non-recurring dividend which amounted to $.03 per share. Excluding this non-recurring dividend, the ratio of net investment income (loss) to average net assets would have been .74%.
C Total distributions of $.12 per share is comprised of distributions from net investment income of $.115 and distributions from net realized gain of $.005 per share.
D Total distributions of $.22 per share is comprised of distributions from net investment income of $.107 and distributions from net realized gain of $.116 per share.
E Amount represents less than $.005 per share.
F Total returns would have been lower if certain expenses had not been reduced during the applicable periods shown.
G Fees and expenses of any underlying Fidelity Central Funds are not included in the Fund's expense ratio. The Fund indirectly bears its proportionate share of the expenses of any underlying Fidelity Central Funds.
H Expense ratios reflect operating expenses of the class. Expenses before reductions do not reflect amounts reimbursed by the investment adviser or reductions from brokerage service arrangements or reductions from other expense offset arrangements and do not represent the amount paid by the class during periods when reimbursements or reductions occur. Expenses net of fee waivers reflect expenses after reimbursement by the investment adviser but prior to reductions from brokerage service arrangements or other expense offset arrangements. Expenses net of all reductions represent the net expenses paid by the class.
I Amount does not include the portfolio activity of any underlying Fidelity Central Funds.
See accompanying notes which are an integral part of the financial statements.
Notes to Financial Statements
For the period ended October 31, 2015
1. Organization.
Fidelity Advisor International Capital Appreciation Fund (the Fund) is a fund of Fidelity Advisor Series VIII (the Trust) and is authorized to issue an unlimited number of shares. The Trust is registered under the Investment Company Act of 1940, as amended (the 1940 Act), as an open-end management investment company organized as a Massachusetts business trust. The Fund offers Class A, Class T, Class C and Class I (formerly Institutional Class) shares, each of which, along with Class B shares, has equal rights as to assets and voting privileges. Class B shares are closed to new accounts and additional purchases, except for exchanges and reinvestments. Each class has exclusive voting rights with respect to matters that affect that class. Class B shares will automatically convert to Class A shares after a holding period of seven years from the initial date of purchase. The Fund's investments in emerging markets can be subject to social, economic, regulatory, and political uncertainties and can be extremely volatile.
2. Investments in Fidelity Central Funds.
The Fund invests in Fidelity Central Funds, which are open-end investment companies generally available only to other investment companies and accounts managed by the investment adviser and its affiliates. The Fund's Schedule of Investments lists each of the Fidelity Central Funds held as of period end, if any, as an investment of the Fund, but does not include the underlying holdings of each Fidelity Central Fund. As an Investing Fund, the Fund indirectly bears its proportionate share of the expenses of the underlying Fidelity Central Funds.
The Money Market Central Funds seek preservation of capital and current income and are managed by Fidelity Investments Money Management, Inc. (FIMM), an affiliate of the investment adviser. Annualized expenses of the Money Market Central Funds as of their most recent shareholder report date are less than .005%.
A complete unaudited list of holdings for each Fidelity Central Fund is available upon request or at the Securities and Exchange Commission (the SEC) website at www.sec.gov. In addition, the financial statements of the Fidelity Central Funds, which are not covered by the Fund's Report of Independent Registered Public Accounting Firm, are available on the SEC website or upon request.
3. Significant Accounting Policies.
The financial statements have been prepared in conformity with accounting principles generally accepted in the United States of America (GAAP), which require management to make certain estimates and assumptions at the date of the financial statements. Actual results could differ from those estimates. Subsequent events, if any, through the date that the financial statements were issued have been evaluated in the preparation of the financial statements. The following summarizes the significant accounting policies of the Fund:
Investment Valuation. Investments are valued as of 4:00 p.m. Eastern time on the last calendar day of the period. The Board of Trustees (the Board) has delegated the day to day responsibility for the valuation of the Fund's investments to the Fidelity Management & Research Company (FMR) Fair Value Committee (the Committee). In accordance with valuation policies and procedures approved by the Board, the Fund attempts to obtain prices from one or more third party pricing vendors or brokers to value its investments. When current market prices, quotations or currency exchange rates are not readily available or reliable, investments will be fair valued in good faith by the Committee, in accordance with procedures adopted by the Board. Factors used in determining fair value vary by investment type and may include market or investment specific events. The frequency with which these procedures are used cannot be predicted and they may be utilized to a significant extent. The Committee oversees the Fund's valuation policies and procedures and reports to the Board on the Committee's activities and fair value determinations. The Board monitors the appropriateness of the procedures used in valuing the Fund's investments and ratifies the fair value determinations of the Committee.
The Fund categorizes the inputs to valuation techniques used to value its investments into a disclosure hierarchy consisting of three levels as shown below:
- Level 1 – quoted prices in active markets for identical investments
- Level 2 – other significant observable inputs (including quoted prices for similar investments, interest rates, prepayment speeds, etc.)
- Level 3 – unobservable inputs (including the Fund's own assumptions based on the best information available)
Valuation techniques used to value the Fund's investments by major category are as follows:
Equity securities, including restricted securities, for which market quotations are readily available, are valued at the last reported sale price or official closing price as reported by a third party pricing vendor on the primary market or exchange on which they are traded and are categorized as Level 1 in the hierarchy. In the event there were no sales during the day or closing prices are not available, securities are valued at the last quoted bid price or may be valued using the last available price and are generally categorized as Level 2 in the hierarchy. For foreign equity securities, when market or security specific events arise, comparisons to the valuation of American Depositary Receipts (ADRs), futures contracts, Exchange-Traded Funds (ETFs) and certain indexes as well as quoted prices for similar securities may be used and would be categorized as Level 2 in the hierarchy. Utilizing these techniques may result in transfers between Level 1 and Level 2. For equity securities, including restricted securities, where observable inputs are limited, assumptions about market activity and risk are used and these securities may be categorized as Level 3 in the hierarchy.
Investments in open-end mutual funds, including the Fidelity Central Funds, are valued at their closing net asset value (NAV) each business day and are categorized as Level 1 in the hierarchy.
Changes in valuation techniques may result in transfers in or out of an assigned level within the disclosure hierarchy. The aggregate value of investments by input level as of October 31, 2015, including information on transfers between Levels 1 and 2 is included at the end of the Fund's Schedule of Investments.
Foreign Currency. The Fund may use foreign currency contracts to facilitate transactions in foreign-denominated securities. Gains and losses from these transactions may arise from changes in the value of the foreign currency or if the counterparties do not perform under the contracts' terms.
Foreign-denominated assets, including investment securities, and liabilities are translated into U.S. dollars at the exchange rates at period end. Purchases and sales of investment securities, income and dividends received and expenses denominated in foreign currencies are translated into U.S. dollars at the exchange rate in effect on the transaction date.
The effects of exchange rate fluctuations on investments are included with the net realized and unrealized gain (loss) on investment securities. Other foreign currency transactions resulting in realized and unrealized gain (loss) are disclosed separately.
Investment Transactions and Income. For financial reporting purposes, the Fund's investment holdings and NAV include trades executed through the end of the last business day of the period. The NAV per share for processing shareholder transactions is calculated as of the close of business of the New York Stock Exchange (NYSE), normally 4:00 p.m. Eastern time and includes trades executed through the end of the prior business day. Gains and losses on securities sold are determined on the basis of identified cost and may include proceeds received from litigation. Dividend income is recorded on the ex-dividend date, except for certain dividends from foreign securities where the ex-dividend date may have passed, which are recorded as soon as the Fund is informed of the ex-dividend date. Non-cash dividends included in dividend income, if any, are recorded at the fair market value of the securities received. Income and capital gain distributions from Fidelity Central Funds, if any, are recorded on the ex-dividend date. Distributions received on securities that represent a return of capital or capital gain are recorded as a reduction of cost of investments and/or as a realized gain. Subsequent to ex-dividend date the Fund determines the components of these distributions, based upon receipt of tax filings or other correspondence relating to the underlying investment. Investment income is recorded net of foreign taxes withheld where recovery of such taxes is uncertain.
Class Allocations and Expenses. Investment income, realized and unrealized capital gains and losses, common expenses of the Fund, and certain fund-level expense reductions, if any, are allocated daily on a pro-rata basis to each class based on the relative net assets of each class to the total net assets of the Fund. Each class differs with respect to transfer agent and distribution and service plan fees incurred. Certain expense reductions may also differ by class. For the reporting period, the allocated portion of income and expenses to each class as a percent of its average net assets may vary due to the timing of recording these transactions in relation to fluctuating net assets of the classes. Expenses directly attributable to a fund are charged to that fund. Expenses attributable to more than one fund are allocated among the respective funds on the basis of relative net assets or other appropriate methods. Expense estimates are accrued in the period to which they relate and adjustments are made when actual amounts are known.
Income Tax Information and Distributions to Shareholders. Each year, the Fund intends to qualify as a regulated investment company under Subchapter M of the Internal Revenue Code, including distributing substantially all of its taxable income and realized gains. As a result, no provision for U.S. Federal income taxes is required. As of October 31, 2015, the Fund did not have any unrecognized tax benefits in the financial statements; nor is the Fund aware of any tax positions for which it is reasonably possible that the total amounts of unrecognized tax benefits will significantly change in the next twelve months. The Fund files a U.S. federal tax return, in addition to state and local tax returns as required. The Fund's federal income tax returns are subject to examination by the Internal Revenue Service (IRS) for a period of three fiscal years after they are filed. State and local tax returns may be subject to examination for an additional fiscal year depending on the jurisdiction. Foreign taxes are provided for based on the Fund's understanding of the tax rules and rates that exist in the foreign markets in which it invests. The Fund is subject to a tax imposed on capital gains by certain countries in which it invests.
Distributions are declared and recorded on the ex-dividend date. Income dividends and capital gain distributions are declared separately for each class. Income and capital gain distributions are determined in accordance with income tax regulations, which may differ from GAAP.
Capital accounts within the financial statements are adjusted for permanent book-tax differences. These adjustments have no impact on net assets or the results of operations. Capital accounts are not adjusted for temporary book-tax differences which will reverse in a subsequent period.
Book-tax differences are primarily due to foreign currency transactions, certain foreign taxes, passive foreign investment companies (PFIC), capital loss carryforwards and losses deferred due to wash sales.
The federal tax cost of investment securities and unrealized appreciation (depreciation) as of period end were as follows:
| Gross unrealized appreciation | $21,219,634 |
| Gross unrealized depreciation | (7,497,134) |
| Net unrealized appreciation (depreciation) on securities | $ 13,722,500 |
| Tax Cost | $247,231,045 |
The tax-based components of distributable earnings as of period end were as follows:
| Undistributed ordinary income | $221,581 |
| Capital loss carryforward | $(64,844,500) |
| Net unrealized appreciation (depreciation) on securities and other investments | $13,603,609 |
Capital loss carryforwards are only available to offset future capital gains of the Fund to the extent provided by regulations and may be limited. Under the Regulated Investment Company Modernization Act of 2010 (the Act), the Fund is permitted to carry forward capital losses incurred in taxable years beginning after December 22, 2010 for an unlimited period and such capital losses are required to be used prior to any losses that expire. The capital loss carryforward information presented below, including any applicable limitation, is estimated as of fiscal period end and is subject to adjustment.
| Fiscal year of expiration | |
| 2016 | $(40,876,628) |
| 2017 | (23,967,872) |
| Total capital loss carryforward | $(64,844,500) |
The tax character of distributions paid was as follows:
| | October 31, 2015 | October 31, 2014 |
| Ordinary Income | $176,462 | $ 450,291 |
Short-Term Trading (Redemption) Fees. During the period, shares held by investors in the Fund less than 30 days may have been subject to a redemption fee equal to 1.00% of the NAV of shares redeemed. All redemption fees, which reduce the proceeds of the shareholder redemption, are retained by the Fund and accounted for as an addition to paid in capital.
Restricted Securities. The Fund may invest in securities that are subject to legal or contractual restrictions on resale. These securities generally may be resold in transactions exempt from registration or to the public if the securities are registered. Disposal of these securities may involve time-consuming negotiations and expense, and prompt sale at an acceptable price may be difficult. Information regarding restricted securities is included at the end of the Fund's Schedule of Investments.
4. Purchases and Sales of Investments.
Purchases and sales of securities , other than short-term securities, aggregated $478,091,318 and $375,109,987, respectively.
5. Fees and Other Transactions with Affiliates.
Management Fee. Fidelity Management & Research Company (the investment adviser) and its affiliates provide the Fund with investment management related services for which the Fund pays a monthly management fee. The management fee is the sum of an individual fund fee rate that is based on an annual rate of .45% of the Fund's average net assets and an annualized group fee rate that averaged .25% during the period. The group fee rate is based upon the average net assets of all the mutual funds advised by the investment adviser, including any mutual funds previously advised by the investment adviser that are currently advised by Fidelity SelectCo, LLC, an affiliate of the investment adviser. The group fee rate decreases as assets under management increase and increases as assets under management decrease. In addition, the management fee is subject to a performance adjustment (up to a maximum of +/- .20% of the Fund's average net assets over a 36 month performance period). The upward or downward adjustment to the management fee is based on the relative investment performance of Class I of the Fund as compared to its benchmark index, the MSCI All Country World ex USA Index, over the same 36 month performance period. For the reporting period, the total annual management fee rate, including the performance adjustment, was .83% of the Fund's average net assets. The performance adjustment included in the management fee rate may be higher or lower than the maximum performance adjustment rate due to the difference between the average net assets for the reporting and performance periods.
Distribution and Service Plan Fees. In accordance with Rule 12b-1 of the 1940 Act, the Fund has adopted separate Distribution and Service Plans for each class of shares. Certain classes pay Fidelity Distributors Corporation (FDC), an affiliate of the investment adviser, separate Distribution and Service Fees, each of which is based on an annual percentage of each class' average net assets. In addition, FDC may pay financial intermediaries for selling shares of the Fund and providing shareholder support services. For the period, the Distribution and Service Fee rates, total fees and amounts retained by FDC were as follows:
| | Distribution
Fee | Service
Fee | Total Fees | Retained
by FDC |
| Class A | -% | .25% | $180,407 | $4,819 |
| Class T | .25% | .25% | 300,938 | 1,184 |
| Class B | .75% | .25% | 13,315 | 10,101 |
| Class C | .75% | .25% | 293,773 | 82,942 |
| | | | $788,433 | $99,046 |
Sales Load. FDC may receive a front-end sales charge of up to 5.75% for selling Class A shares and 3.50% for selling Class T shares, some of which is paid to financial intermediaries for selling shares of the Fund. Depending on the holding period, FDC may receive contingent deferred sales charges levied on Class A, Class T, Class B and Class C redemptions. The deferred sales charges range from 5.00% to 1.00% for Class B shares, 1.00% for Class C shares, 1.00% for certain purchases of Class A shares and .25% for certain purchases of Class T shares.
For the period, sales charge amounts retained by FDC were as follows:
| | Retained
by FDC |
| Class A | $63,823 |
| Class T | 8,800 |
| Class B(a) | 525 |
| Class C(a) | 3,660 |
| | $76,808 |
(a) When Class B and Class C shares are initially sold, FDC pays commissions from its own resources to financial intermediaries through which the sales are made.
Transfer Agent Fees. Fidelity Investments Institutional Operations Company, Inc., (FIIOC), an affiliate of the investment adviser, is the transfer, dividend disbursing and shareholder servicing agent for each class of the Fund. FIIOC receives account fees and asset-based fees that vary according to the account size and type of account of the shareholders of the respective classes of the Fund. FIIOC pays for typesetting, printing and mailing of shareholder reports, except proxy statements.
For the period, transfer agent fees for each class were as follows:
| | Amount | % of
Class-Level Average
Net Assets |
| Class A | $174,476 | .24 |
| Class T | 143,834 | .24 |
| Class B | 3,977 | .30 |
| Class C | 72,515 | .25 |
| Class I | 106,541 | .20 |
| | $ 501,343 | |
Accounting and Security Lending Fees. Fidelity Service Company, Inc. (FSC), an affiliate of the investment adviser, maintains the Fund's accounting records. The accounting fee is based on the level of average net assets for each month. Under a separate contract, FSC administers the security lending program. The security lending fee is based on the number and duration of lending transactions.
Brokerage Commissions. The Fund placed a portion of its portfolio transactions with brokerage firms which are affiliates of the investment adviser. Brokerage commissions are included in net realized gain (loss) and change in net unrealized appreciation (depreciation) in the Statement of Operations. The commissions paid to these affiliated firms were $2,071 for the period.
Other. During the period, the investment adviser reimbursed the Fund for certain losses in the amount of $25,348.
6. Committed Line of Credit.
The Fund participates with other funds managed by the investment adviser or an affiliate in a $4.25 billion credit facility (the "line of credit") to be utilized for temporary or emergency purposes to fund shareholder redemptions or for other short-term liquidity purposes. The Fund has agreed to pay commitment fees on its pro-rata portion of the line of credit, which amounted to $292 and is reflected in Miscellaneous expenses on the Statement of Operations. During the period, the Fund did not borrow on this line of credit.
7. Security Lending.
The Fund lends portfolio securities through a lending agent from time to time in order to earn additional income. For equity securities, a lending agent is used and may loan securities to certain qualified borrowers, including Fidelity Capital Markets (FCM), a broker-dealer affiliated with the Fund. On the settlement date of the loan, the Fund receives collateral (in the form of U.S. Treasury obligations, letters of credit and/or cash) against the loaned securities and maintains collateral in an amount not less than 100% of the market value of the loaned securities during the period of the loan. The market value of the loaned securities is determined at the close of business of the Fund and any additional required collateral is delivered to the Fund on the next business day. The Fund or borrower may terminate the loan at any time, and if the borrower defaults on its obligation to return the securities loaned because of insolvency or other reasons, the Fund may apply collateral received from the borrower against the obligation. The Fund may experience delays and costs in recovering the securities loaned. Any cash collateral received is invested in the Fidelity Securities Lending Cash Central Fund. The value of loaned securities and cash collateral at period end are disclosed on the Fund's Statement of Assets and Liabilities. Security lending income represents the income earned on investing cash collateral, less rebates paid to borrowers and any lending agent fees associated with the loan, plus any premium payments received for lending certain types of securities. Security lending income is presented in the Statement of Operations as a component of income from Fidelity Central Funds. Total security lending income during the period amounted to $24,549. During the period, there were no securities loaned to FCM.
8. Expense Reductions.
The investment adviser voluntarily agreed to reimburse each class to the extent annual operating expenses exceeded certain levels of average net assets as noted in the table below. Some expenses, for example interest expense, including commitment fees, are excluded from this reimbursement.
| | Expense
Limitations | Reimbursement |
| Class A | 1.45% | $97,320 |
| Class T | 1.70% | 94,679 |
| Class B | 2.20% | 3,131 |
| Class C | 2.20% | 39,690 |
| Class I | 1.20% | 38,765 |
| | | $273,585 |
Commissions paid to certain brokers with whom the investment adviser, or its affiliates, places trades on behalf of the Fund include an amount in addition to trade execution, which may be rebated back to the Fund to offset certain expenses. This amount totaled $49,718 for the period.
In addition, during the period the investment adviser reimbursed and/or waived a portion of fund-level operating expenses in the amount of $989 and a portion of class-level operating expenses as follows:
| | | Amount |
| Class A | | $900 |
| Class T | | 1,350 |
| Class B | | 3 |
| Class C | | 379 |
| Class I | | 401 |
| | | $3,033 |
9. Distributions to Shareholders.
Distributions to shareholders of each class were as follows:
| Years ended October 31, | 2015 | 2014 |
| From net investment income | | |
| Class A | $109,241 | $236,147 |
| Class T | – | 164,337 |
| Class I | 67,221 | 49,807 |
| Total | $176,462 | $450,291 |
10. Share Transactions.
Share transactions for each class were as follows and may contain automatic conversions between classes or exchanges between funds:
| | Shares | Shares | Dollars | Dollars |
| Years ended October 31, | 2015 | 2014 | 2015 | 2014 |
| Class A | | | | |
| Shares sold | 3,444,443 | 642,209 | $53,081,260 | $9,254,741 |
| Reinvestment of distributions | 6,822 | 15,568 | 102,609 | 216,240 |
| Shares redeemed | (1,059,333) | (733,015) | (16,101,792) | (10,574,352) |
| Net increase (decrease) | 2,391,932 | (75,238) | $37,082,077 | $(1,103,371) |
| Class T | | | | |
| Shares sold | 689,717 | 398,294 | $10,301,883 | $5,642,426 |
| Reinvestment of distributions | – | 11,818 | – | 161,195 |
| Shares redeemed | (694,037) | (765,657) | (10,349,650) | (10,811,536) |
| Net increase (decrease) | (4,320) | (355,545) | $(47,767) | $(5,007,915) |
| Class B | | | | |
| Shares sold | 10,699 | 922 | $149,278 | $12,411 |
| Shares redeemed | (51,403) | (58,773) | (707,021) | (768,373) |
| Net increase (decrease) | (40,704) | (57,851) | $(557,743) | $(755,962) |
| Class C | | | | |
| Shares sold | 1,456,550 | 194,612 | $20,251,093 | $2,542,538 |
| Shares redeemed | (360,397) | (314,314) | (4,903,804) | (4,057,639) |
| Net increase (decrease) | 1,096,153 | (119,702) | $15,347,289 | $(1,515,101) |
| Class I | | | | |
| Shares sold | 5,123,102 | 801,555 | $82,769,872 | $12,565,571 |
| Reinvestment of distributions | 3,912 | 2,539 | 62,664 | 37,521 |
| Shares redeemed | (1,848,914) | (154,955) | (30,160,539) | (2,410,258) |
| Net increase (decrease) | 3,278,100 | 649,139 | $52,671,997 | $10,192,834 |
11. Other.
The Fund's organizational documents provide former and current trustees and officers with a limited indemnification against liabilities arising in connection with the performance of their duties to the Fund. In the normal course of business, the Fund may also enter into contracts that provide general indemnifications. The Fund's maximum exposure under these arrangements is unknown as this would be dependent on future claims that may be made against the Fund. The risk of material loss from such claims is considered remote.
Report of Independent Registered Public Accounting Firm
To the Trustees of Fidelity Advisor Series VIII and Shareholders of Fidelity Advisor® International Capital Appreciation Fund:
We have audited the accompanying statement of assets and liabilities of Fidelity Advisor® International Capital Appreciation Fund (the Fund), a fund of Fidelity Advisor Series VIII, including the schedule of investments, as of October 31, 2015, and the related statement of operations for the year then ended, the statement of changes in net assets for each of the two years in the period then ended, and the financial highlights for each of the five years in the period then ended. These financial statements and financial highlights are the responsibility of the Fund's management. Our responsibility is to express an opinion on these financial statements and financial highlights based on our audits.
We conducted our audits in accordance with the standards of the Public Company Accounting Oversight Board (United States). Those standards require that we plan and perform the audit to obtain reasonable assurance about whether the financial statements and financial highlights are free of material misstatement. The Fund is not required to have, nor were we engaged to perform, an audit of its internal control over financial reporting. Our audits included consideration of internal control over financial reporting as a basis for designing audit procedures that are appropriate in the circumstances, but not for the purpose of expressing an opinion on the effectiveness of the Fund's internal control over financial reporting. Accordingly, we express no such opinion. An audit also includes examining, on a test basis, evidence supporting the amounts and disclosures in the financial statements, assessing the accounting principles used and significant estimates made by management, as well as evaluating the overall financial statement presentation. Our procedures included confirmation of securities owned as of October 31, 2015, by correspondence with the custodians and brokers; when replies were not received from brokers, we performed other auditing procedures. We believe that our audits provide a reasonable basis for our opinion.
In our opinion, such financial statements and financial highlights referred to above present fairly, in all material respects, the financial position of Fidelity Advisor® International Capital Appreciation Fund as of October 31, 2015, the results of its operations for the year then ended, the changes in its net assets for each of the two years in the period then ended, and the financial highlights for each of the five years in the period then ended, in conformity with accounting principles generally accepted in the United States of America.
DELOITTE & TOUCHE LLP
Boston, Massachusetts
December 17, 2015
Trustees and Officers
The Trustees, Members of the Advisory Board (if any), and officers of the trust and fund, as applicable, are listed below. The Board of Trustees governs the fund and is responsible for protecting the interests of shareholders. The Trustees are experienced executives who meet periodically throughout the year to oversee the fund's activities, review contractual arrangements with companies that provide services to the fund, oversee management of the risks associated with such activities and contractual arrangements, and review the fund's performance. Each of the Trustees oversees 170 funds.
The Trustees hold office without limit in time except that (a) any Trustee may resign; (b) any Trustee may be removed by written instrument, signed by at least two-thirds of the number of Trustees prior to such removal; (c) any Trustee who requests to be retired or who has become incapacitated by illness or injury may be retired by written instrument signed by a majority of the other Trustees; and (d) any Trustee may be removed at any special meeting of shareholders by a two-thirds vote of the outstanding voting securities of the trust. Each Trustee who is not an interested person (as defined in the 1940 Act) of the trust and the fund is referred to herein as an Independent Trustee. Each Independent Trustee shall retire not later than the last day of the calendar year in which his or her 75th birthday occurs. The Independent Trustees may waive this mandatory retirement age policy with respect to individual Trustees. Officers and Advisory Board Members hold office without limit in time, except that any officer or Advisory Board Member may resign or may be removed by a vote of a majority of the Trustees at any regular meeting or any special meeting of the Trustees. Except as indicated, each individual has held the office shown or other offices in the same company for the past five years.
The fund’s Statement of Additional Information (SAI) includes more information about the Trustees. To request a free copy, call Fidelity at 1-877-208-0098.
Experience, Skills, Attributes, and Qualifications of the Trustees. The Governance and Nominating Committee has adopted a statement of policy that describes the experience, qualifications, attributes, and skills that are necessary and desirable for potential Independent Trustee candidates (Statement of Policy). The Board believes that each Trustee satisfied at the time he or she was initially elected or appointed a Trustee, and continues to satisfy, the standards contemplated by the Statement of Policy. The Governance and Nominating Committee also engages professional search firms to help identify potential Independent Trustee candidates who have the experience, qualifications, attributes, and skills consistent with the Statement of Policy. From time to time, additional criteria based on the composition and skills of the current Independent Trustees, as well as experience or skills that may be appropriate in light of future changes to board composition, business conditions, and regulatory or other developments, have also been considered by the professional search firms and the Governance and Nominating Committee. In addition, the Board takes into account the Trustees' commitment and participation in Board and committee meetings, as well as their leadership of standing and ad hoc committees throughout their tenure.
In determining that a particular Trustee was and continues to be qualified to serve as a Trustee, the Board has considered a variety of criteria, none of which, in isolation, was controlling. The Board believes that, collectively, the Trustees have balanced and diverse experience, qualifications, attributes, and skills, which allow the Board to operate effectively in governing the fund and protecting the interests of shareholders. Information about the specific experience, skills, attributes, and qualifications of each Trustee, which in each case led to the Board's conclusion that the Trustee should serve (or continue to serve) as a trustee of the fund, is provided below.
Board Structure and Oversight Function. James C. Curvey is an interested person and currently serves as Chairman. The Trustees have determined that an interested Chairman is appropriate and benefits shareholders because an interested Chairman has a personal and professional stake in the quality and continuity of services provided to the fund. Independent Trustees exercise their informed business judgment to appoint an individual of their choosing to serve as Chairman, regardless of whether the Trustee happens to be independent or a member of management. The Independent Trustees have determined that they can act independently and effectively without having an Independent Trustee serve as Chairman and that a key structural component for assuring that they are in a position to do so is for the Independent Trustees to constitute a substantial majority for the Board. The Independent Trustees also regularly meet in executive session. Ned C. Lautenbach serves as Chairman of the Independent Trustees and as such (i) acts as a liaison between the Independent Trustees and management with respect to matters important to the Independent Trustees and (ii) with management prepares agendas for Board meetings.
Fidelity® funds are overseen by different Boards of Trustees. The fund's Board oversees Fidelity's high income and certain equity funds, and other Boards oversee Fidelity's investment-grade bond, money market, asset allocation, and sector funds. The asset allocation funds may invest in Fidelity® funds overseen by the fund's Board. The use of separate Boards, each with its own committee structure, allows the Trustees of each group of Fidelity® funds to focus on the unique issues of the funds they oversee, including common research, investment, and operational issues. On occasion, the separate Boards establish joint committees to address issues of overlapping consequences for the Fidelity® funds overseen by each Board.
The Trustees operate using a system of committees to facilitate the timely and efficient consideration of all matters of importance to the Trustees, the fund, and fund shareholders and to facilitate compliance with legal and regulatory requirements and oversight of the fund's activities and associated risks. The Board, acting through its committees, has charged FMR and its affiliates with (i) identifying events or circumstances the occurrence of which could have demonstrably adverse effects on the fund's business and/or reputation; (ii) implementing processes and controls to lessen the possibility that such events or circumstances occur or to mitigate the effects of such events or circumstances if they do occur; and (iii) creating and maintaining a system designed to evaluate continuously business and market conditions in order to facilitate the identification and implementation processes described in (i) and (ii) above. Because the day-to-day operations and activities of the fund are carried out by or through FMR, its affiliates, and other service providers, the fund's exposure to risks is mitigated but not eliminated by the processes overseen by the Trustees. While each of the Board's committees has responsibility for overseeing different aspects of the fund's activities, oversight is exercised primarily through the Operations, Audit, and Compliance Committees. In addition, the Independent Trustees have worked with FMR to enhance the Board's oversight of investment and financial risks, legal and regulatory risks, technology risks, and operational risks, including the development of additional risk reporting to the Board. For example, a working group comprised of Independent Trustees and FMR has worked and continues to work to review the Fidelity® funds' valuation-related activities, reporting and risk management. Appropriate personnel, including but not limited to the fund's Chief Compliance Officer (CCO), FMR's internal auditor, the independent accountants, the fund's Treasurer and portfolio management personnel, make periodic reports to the Board's committees, as appropriate, including an annual review of Fidelity's risk management program for the Fidelity® funds. The responsibilities of each standing committee, including their oversight responsibilities, are described further under "Standing Committees of the Trustees."
Interested Trustees*:
Correspondence intended for a Trustee who is an interested person may be sent to Fidelity Investments, 245 Summer Street, Boston, Massachusetts 02210.
Name, Year of Birth; Principal Occupations and Other Relevant Experience+
James C. Curvey (1935)
Year of Election or Appointment: 2007
Trustee
Chairman of the Board of Trustees
Mr. Curvey also serves as Trustee of other Fidelity® funds. Mr. Curvey is a Director of Fidelity Research & Analysis Co. (investment adviser firm, 2009-present), and Vice Chairman (2007-present) and Director of FMR LLC (diversified financial services company). In addition, Mr. Curvey serves as an Overseer for the Boston Symphony Orchestra and a member of the board of Artis-Naples, Naples, Florida, and as a Trustee for Brewster Academy, Wolfeboro, New Hampshire. Previously, Mr. Curvey served as a Director of Fidelity Investments Money Management, Inc. (investment adviser firm, 2009-2014) and a Director of FMR and FMR Co., Inc. (investment adviser firms, 2007-2014).
Charles S. Morrison (1960)
Year of Election or Appointment: 2014
Trustee
Mr. Morrison also serves as Trustee of other funds. He serves as a Director of Fidelity Investments Money Management, Inc. (FIMM) (investment adviser firm, 2014-present), Director of Fidelity SelectCo, LLC (investment adviser firm, 2014-present), President, Asset Management (2014-present), and is an employee of Fidelity Investments. Previously, Mr. Morrison served as Vice President of Fidelity's Fixed Income and Asset Allocation Funds (2012-2014), President, Fixed Income (2011-2014), Vice President of Fidelity's Money Market Funds (2005-2009), President, Money Market Group Leader of FMR (investment adviser firm, 2009), and Senior Vice President, Money Market Group of FMR (2004-2009). Mr. Morrison also served as Vice President of Fidelity's Bond Funds (2002-2005), certain Balanced Funds (2002-2005), and certain Asset Allocation Funds (2002-2007), and as Senior Vice President (2002-2005) of Fidelity's Bond Division.
* Determined to be an “Interested Trustee” by virtue of, among other things, his or her affiliation with the trust or various entities under common control with FMR.
+ The information includes the Trustee's principal occupation during the last five years and other information relating to the experience, attributes, and skills relevant to the Trustee's qualifications to serve as a Trustee, which led to the conclusion that the Trustee should serve as a Trustee for the fund.
Independent Trustees:
Correspondence intended for an Independent Trustee may be sent to Fidelity Investments, P.O. Box 55235, Boston, Massachusetts 02205-5235.
Name, Year of Birth; Principal Occupations and Other Relevant Experience+
Dennis J. Dirks (1948)
Year of Election or Appointment: 2005
Trustee
Mr. Dirks also serves as Trustee of other Fidelity® funds. Prior to his retirement in May 2003, Mr. Dirks was Chief Operating Officer and a member of the Board of The Depository Trust & Clearing Corporation (DTCC). He also served as President, Chief Operating Officer, and Board member of The Depository Trust Company (DTC) and President and Board member of the National Securities Clearing Corporation (NSCC). In addition, Mr. Dirks served as Chief Executive Officer and Board member of the Government Securities Clearing Corporation, Chief Executive Officer and Board member of the Mortgage-Backed Securities Clearing Corporation, as a Trustee and a member of the Finance Committee of Manhattan College (2005-2008), as a Trustee and a member of the Finance Committee of AHRC of Nassau County (2006-2008), and as a member of the Independent Directors Council (IDC) Governing Council (2010-2015). Mr. Dirks is a member of the Board of Directors for The Brookville Center for Children's Services, Inc. (2009-present).
Alan J. Lacy (1953)
Year of Election or Appointment: 2008
Trustee
Mr. Lacy also serves as Trustee of other Fidelity® funds. Mr. Lacy serves as a member of the Board of Directors of Dave & Buster's Entertainment, Inc. (restaurant and entertainment complexes, 2010-present) and Bristol-Myers Squibb Company (global pharmaceuticals, 2008-present). In addition, Mr. Lacy served as Senior Adviser (2007-2014) of Oak Hill Capital Partners, L.P. (private equity) and also served as Chief Executive Officer (2000-2005) and Vice Chairman (2005-2006) of Sears Holdings Corporation and Sears, Roebuck and Co. (retail). Mr. Lacy is a member of the Board of Trustees of The National Parks Conservation Association (2006-present). Previously, Mr. Lacy served as Chairman of the Board of Trustees of the National Parks Conservation Association (2008-2011) and as a member of the Board of Directors for The Western Union Company (global money transfer, 2006-2011), The Hillman Companies, Inc. (hardware wholesalers, 2010-2014), and Earth Fare, Inc. (retail grocery, 2010-2014).
Ned C. Lautenbach (1944)
Year of Election or Appointment: 2000
Trustee
Chairman of the Independent Trustees
Mr. Lautenbach also serves as Trustee of other Fidelity® funds. Mr. Lautenbach currently serves as the Lead Director of the Eaton Corporation Board of Directors (diversified industrial, 1997-present). Mr. Lautenbach is Chairman of the Board of Directors of Artis-Naples in Naples, Florida (2012-present), a member of the Council on Foreign Relations (1994-present), and a member of the Board of Governors, State University System of Florida (2013-present). Previously, Mr. Lautenbach was a Partner/Advisory Partner at Clayton, Dubilier & Rice, LLC (private equity investment, 1998-2010), as well as a Director of Sony Corporation (2006-2007).
Joseph Mauriello (1944)
Year of Election or Appointment: 2008
Trustee
Mr. Mauriello also serves as Trustee of other Fidelity® funds. Prior to his retirement in January 2006, Mr. Mauriello served in numerous senior management positions including Deputy Chairman and Chief Operating Officer (2004-2005), and Vice Chairman of Financial Services (2002-2004) of KPMG LLP US (professional services, 1965-2005). Mr. Mauriello currently serves as a member of the Board of Directors of XL Group plc. (global insurance and re-insurance, 2006-present) and the Independent Directors Council (IDC) Governing Council (2015-present). Previously, Mr. Mauriello served as a Director of the Hamilton Funds of the Bank of New York (2006-2007) and of Arcadia Resources Inc. (health care services and products, 2007-2012).
Robert W. Selander (1950)
Year of Election or Appointment: 2011
Trustee
Mr. Selander also serves as Trustee of other Fidelity® funds. Mr. Selander serves as a Director of The Western Union Company (global money transfer, 2014-present). Previously, Mr. Selander served as a Member of the Advisory Board of other Fidelity® funds (2011), and Executive Vice Chairman (2010), Chief Executive Officer (2009-2010), and President and Chief Executive Officer (1997-2009) of Mastercard, Inc.
Cornelia M. Small (1944)
Year of Election or Appointment: 2005
Trustee
Ms. Small also serves as Trustee of other Fidelity® funds. Ms. Small is a member of the Board of Directors (2009-present) and Chair of the Investment Committee (2010-present) of the Teagle Foundation. Ms. Small also serves on the Investment Committee of the Berkshire Taconic Community Foundation (2008-present). Previously, Ms. Small served as Chairperson (2002-2008) and a member of the Investment Committee and Chairperson (2008-2012) and a member of the Board of Trustees of Smith College. In addition, Ms. Small served as Chief Investment Officer, Director of Global Equity Investments, and a member of the Board of Directors of Scudder, Stevens & Clark and Scudder Kemper Investments.
William S. Stavropoulos (1939)
Year of Election or Appointment: 2001
Trustee
Vice Chairman of the Independent Trustees
Mr. Stavropoulos also serves as Trustee of other Fidelity® funds. Mr. Stavropoulos serves as President and Founder of the Michigan Baseball Foundation, the Great Lakes Loons (2007-present). Mr. Stavropoulos is Chairman Emeritus of the Board of Directors of The Dow Chemical Company, where he previously served in numerous senior management positions, including President, CEO (1995-2000; 2002-2004), Chairman of the Executive Committee (2000-2006), and as a member of the Board of Directors (1990-2006). Currently, Mr. Stavropoulos is Chairman of the Board of Directors of Univar Inc. (global distributor of commodity and specialty chemicals), a Director of Teradata Corporation (data warehousing and technology solutions), and Maersk Inc. (industrial conglomerate), and a member of the Advisory Board for Metalmark Capital LLC (private equity investment, 2005-present). Mr. Stavropoulos is an operating advisor to Clayton, Dubilier & Rice, LLC (private equity investment). In addition, Mr. Stavropoulos is a member of the University of Notre Dame Advisory Council for the College of Science, a Trustee of the Rollin L. Gerstacker Foundation, and a Director of the Naples Philharmonic Center for the Arts. Previously, Mr. Stavropoulos served as a Director of Chemical Financial Corporation (bank holding company, 1993-2012) and Tyco International, Ltd. (multinational manufacturing and services, 2007-2012).
David M. Thomas (1949)
Year of Election or Appointment: 2008
Trustee
Mr. Thomas also serves as Trustee of other Fidelity® funds. Mr. Thomas serves as Non-Executive Chairman of the Board of Directors of Fortune Brands Home and Security (home and security products, 2011-present), as a member of the Board of Directors (2004-present) and Presiding Director (2013-present) of Interpublic Group of Companies, Inc. (marketing communication), and as a member of the Board of Trustees of the University of Florida (2013-present). Previously, Mr. Thomas served as Executive Chairman (2005-2006) and Chairman and Chief Executive Officer (2000-2005) of IMS Health, Inc. (pharmaceutical and healthcare information solutions), and a Director of Fortune Brands, Inc. (consumer products, 2000-2011).
+ The information includes the Trustee's principal occupation during the last five years and other information relating to the experience, attributes, and skills relevant to the Trustee's qualifications to serve as a Trustee, which led to the conclusion that the Trustee should serve as a Trustee for the fund.
Advisory Board Members and Officers:
Correspondence intended for an officer or Peter S. Lynch may be sent to Fidelity Investments, 245 Summer Street, Boston, Massachusetts 02210. Officers appear below in alphabetical order.
Name, Year of Birth; Principal Occupation
Peter S. Lynch (1944)
Year of Election or Appointment: 2003
Member of the Advisory Board
Mr. Lynch also serves as Member of the Advisory Board of other Fidelity® funds. Mr. Lynch is Vice Chairman and a Director of FMR (investment adviser firm) and FMR Co., Inc. (investment adviser firm). In addition, Mr. Lynch serves as a Trustee of Boston College and as the Chairman of the Inner-City Scholarship Fund. Previously, Mr. Lynch served on the Special Olympics International Board of Directors (1997-2006).
Elizabeth Paige Baumann (1968)
Year of Election or Appointment: 2012
Anti-Money Laundering (AML) Officer
Ms. Baumann also serves as AML Officer of other funds. She is Chief AML Officer of FMR LLC (diversified financial services company, 2012-present) and is an employee of Fidelity Investments. Previously, Ms. Baumann served as Vice President and Deputy Anti-Money Laundering Officer (2007-2012).
Marc R. Bryant (1966)
Year of Election or Appointment: 2015
Secretary and Chief Legal Officer (CLO)
Mr. Bryant also serves as Secretary and CLO of other funds. Mr. Bryant serves as CLO, Secretary, and Senior Vice President of Fidelity Management & Research Company (investment adviser firm, 2015-present) and FMR Co., Inc. (investment adviser firm, 2015-present); Secretary of Fidelity SelectCo, LLC (investment adviser firm, 2015-present) and Fidelity Investments Money Management, Inc. (investment adviser firm, 2015-present); and CLO of Fidelity Management & Research (Hong Kong) Limited (investment adviser firm, 2015-present). He is Senior Vice President and Deputy General Counsel of FMR LLC (diversified financial services company). Previously, Mr. Bryant served as Secretary and Chief Legal Officer of Fidelity Rutland Square Trust II (2010-2014) and Assistant Secretary of Fidelity's Fixed Income and Asset Allocation Funds (2013-2015). Prior to joining Fidelity Investments, Mr. Bryant served as a Senior Vice President and the Head of Global Retail Legal for AllianceBernstein L.P. (2006-2010), and as the General Counsel for ProFund Advisors LLC (2001-2006).
Timothy M. Cohen (1969)
Year of Election or Appointment: 2014
Vice President of certain Equity Funds
Mr. Cohen also serves as Vice President of other funds. Mr. Cohen serves as Chief Compliance Officer of FMR Investment Management (U.K.) Limited (investment adviser firm, 2013-present) and is an employee of Fidelity Investments. Previously, Mr. Cohen served as a Director of FMR Investment Management (U.K.) Limited (2013-2015).
William C. Coffey (1969)
Year of Election or Appointment: 2009
Assistant Secretary
Mr. Coffey also serves as Assistant Secretary of other funds. He is Senior Vice President and Deputy General Counsel of FMR LLC (diversified financial services company, 2010-present), and is an employee of Fidelity Investments. Previously, Mr. Coffey served as Vice President and Associate General Counsel of FMR LLC (2005-2009).
Jonathan Davis (1968)
Year of Election or Appointment: 2010
Assistant Treasurer
Mr. Davis also serves as Assistant Treasurer of other funds, and is an employee of Fidelity Investments. Previously, Mr. Davis served as Vice President and Associate General Counsel of FMR LLC (diversified financial services company, 2003-2010).
Adrien E. Deberghes (1967)
Year of Election or Appointment: 2008
Deputy Treasurer
Mr. Deberghes also serves as an officer of other funds. He is an employee of Fidelity Investments (2008-present). Prior to joining Fidelity Investments, Mr. Deberghes was Senior Vice President of Mutual Fund Administration at State Street Corporation (2007-2008), Senior Director of Mutual Fund Administration at Investors Bank & Trust (2005-2007), and Director of Finance for Dunkin' Brands (2000-2005).
Stephanie J. Dorsey (1969)
Year of Election or Appointment: 2010
Assistant Treasurer
Ms. Dorsey also serves as an officer of other funds. She is an employee of Fidelity Investments (2008-present) and has served in other fund officer roles. Prior to joining Fidelity Investments, Ms. Dorsey served as Treasurer (2004-2008) of the JPMorgan Mutual Funds and Vice President (2004-2008) of JPMorgan Chase Bank.
Howard J. Galligan III (1966)
Year of Election or Appointment: 2014
Chief Financial Officer
Mr. Galligan also serves as Chief Financial Officer of other funds. Mr. Galligan serves as President of Fidelity Pricing and Cash Management Services (FPCMS) (2014-present) and as a Director of Strategic Advisers, Inc. (investment adviser firm, 2008-present). Previously, Mr. Galligan served as Chief Administrative Officer of Asset Management (2011-2014) and Chief Operating Officer and Senior Vice President of Investment Support for Strategic Advisers, Inc. (2003-2011).
Scott C. Goebel (1968)
Year of Election or Appointment: 2015
Vice President
Mr. Goebel serves as Vice President of other funds and is an employee of Fidelity Investments (2001-present). Previously, Mr. Goebel served as Secretary of Fidelity SelectCo, LLC (investment adviser firm, 2013-2015), Fidelity Investments Money Management, Inc. (FIMM) (investment adviser firm, 2010-2015), and Fidelity Research and Analysis Company (FRAC) (investment adviser firm, 2010-2015); General Counsel, Secretary, and Senior Vice President of Fidelity Management & Research Company (investment adviser firm, 2008-2015) and FMR Co., Inc. (investment adviser firm, 2008-2015); Assistant Secretary of Fidelity Management & Research (Japan) Limited (investment adviser firm, 2008-2015) and FMR Investment Management (U.K.) Limited (investment adviser firm, 2008-2015); Chief Legal Officer (CLO) of Fidelity Management & Research (Hong Kong) Limited (investment adviser firm, 2008-2015); Secretary and CLO of certain Fidelity® funds (2008-2015); Assistant Secretary of FIMM (2008-2010), FRAC (2008-2010), and certain funds (2007-2008); and as Vice President and Secretary of Fidelity Distributors Corporation (FDC) (2005-2007).
Brian B. Hogan (1964)
Year of Election or Appointment: 2009
Vice President
Mr. Hogan also serves as Trustee or Vice President of other funds. Mr. Hogan serves as a Director of Fidelity SelectCo, LLC (investment adviser firm, 2014-present) and President of the Equity Division of FMR (investment adviser firm, 2009-present). Previously, Mr. Hogan served as Senior Vice President, Equity Research of FMR (2006-2009) and as a portfolio manager.
Chris Maher (1972)
Year of Election or Appointment: 2013
Assistant Treasurer
Mr. Maher serves as Assistant Treasurer of other funds. Mr. Maher is Vice President of Valuation Oversight and is an employee of Fidelity Investments. Previously, Mr. Maher served as Vice President of Asset Management Compliance (2013), Vice President of the Program Management Group of FMR (investment adviser firm, 2010-2013), and Vice President of Valuation Oversight (2008-2010).
Kenneth B. Robins (1969)
Year of Election or Appointment: 2008
President and Treasurer
Mr. Robins also serves as an officer of other funds. Mr. Robins serves as Executive Vice President of Fidelity Investments Money Management, Inc. (FIMM) (investment adviser firm, 2013-present) and is an employee of Fidelity Investments (2004-present). Previously, Mr. Robins served in other fund officer roles.
Stacie M. Smith (1974)
Year of Election or Appointment: 2013
Deputy Treasurer
Ms. Smith also serves as an officer of other funds. She is an employee of Fidelity Investments (2009-present) and has served in other fund officer roles. Prior to joining Fidelity Investments, Ms. Smith served as Senior Audit Manager of Ernst & Young LLP (1996-2009).
Renee Stagnone (1975)
Year of Election or Appointment: 2013
Deputy Treasurer
Ms. Stagnone also serves as Deputy Treasurer of other funds. Ms. Stagnone is an employee of Fidelity Investments (1997-present).
Linda J. Wondrack (1964)
Year of Election or Appointment: 2014
Chief Compliance Officer
Ms. Wondrack also serves as Chief Compliance Officer of other funds. Ms. Wondrack is Executive Vice President and head of the Ethics Office and Asset Management Compliance for Fidelity Investments (2012-present). Ms. Wondrack also serves as Chief Compliance Officer of Fidelity SelectCo, LLC (investment adviser firm, 2014-present); Chief Compliance Officer of Impresa Management LLC (2013-present); and Chief Compliance Officer of FMR Co., Inc. (investment adviser firm), Fidelity Investments Money Management, Inc. (investment adviser firm), Fidelity Management & Research (Japan) Limited (investment adviser firm), FMR Investment Management (U.K.) Limited (investment adviser firm), Fidelity Management & Research (Hong Kong) (investment adviser firm), Fidelity Management & Research Company (investment adviser firm), FIAM LLC (investment adviser firm), and Strategic Advisers, Inc. (investment adviser firm), Ballyrock Investment Advisors LLC, and Northern Neck Investors LLC (2012-present). Previously, Ms. Wondrack served as Senior Vice President and Chief Compliance Officer for Columbia Management Investment Advisers, LLC (2005-2012); Chief Compliance Officer for certain funds within the Columbia Family of Funds (2007-2012); and Senior Vice President of Compliance Risk Management at Bank of America (2005-2010).
Joseph F. Zambello (1957)
Year of Election or Appointment: 2011
Deputy Treasurer
Mr. Zambello also serves as Deputy Treasurer of other funds. Mr. Zambello is an employee of Fidelity Investments (1991-present). Previously, Mr. Zambello served as Vice President of the Program Management Group of FMR (investment adviser firm, 2009-2011) and Vice President of the Transfer Agent Oversight Group (2005-2009).
Shareholder Expense Example
As a shareholder of the Fund, you incur two types of costs: (1) transaction costs, including sales charges (loads) on purchase payments or redemption proceeds, redemption fees and (2) ongoing costs, including management fees, distribution and/or service (12b-1) fees and other Fund expenses. This Example is intended to help you understand your ongoing costs (in dollars) of investing in the Fund and to compare these costs with the ongoing costs of investing in other mutual funds.
The Example is based on an investment of $1,000 invested at the beginning of the period and held for the entire period (May 1, 2015 to October 31, 2015).
Actual Expenses
The first line of the accompanying table for each class of the Fund provides information about actual account values and actual expenses. You may use the information in this line, together with the amount you invested, to estimate the expenses that you paid over the period. Simply divide your account value by $1,000.00 (for example, an $8,600 account value divided by $1,000.00 = 8.6), then multiply the result by the number in the first line for a class of the Fund under the heading entitled "Expenses Paid During Period" to estimate the expenses you paid on your account during this period. In addition, the Fund, as a shareholder in the underlying Fidelity Central Funds, will indirectly bear its pro-rata share of the fees and expenses incurred by the underlying Fidelity Central Funds. These fees and expenses are not included in the Fund's annualized expense ratio used to calculate the expense estimate in the table below.
Hypothetical Example for Comparison Purposes
The second line of the accompanying table for each class of the Fund provides information about hypothetical account values and hypothetical expenses based on a Class' actual expense ratio and an assumed rate of return of 5% per year before expenses, which is not the Class' actual return. The hypothetical account values and expenses may not be used to estimate the actual ending account balance or expenses you paid for the period. You may use this information to compare the ongoing costs of investing in the Fund and other funds. To do so, compare this 5% hypothetical example with the 5% hypothetical examples that appear in the shareholder reports of the other funds. In addition, the Fund, as a shareholder in the underlying Fidelity Central Funds, will indirectly bear its pro-rata share of the fees and expenses incurred by the underlying Fidelity Central Funds. These fees and expenses are not included in the Fund's annualized expense ratio used to calculate the expense estimate in the table below.
Please note that the expenses shown in the table are meant to highlight your ongoing costs only and do not reflect any transaction costs. Therefore, the second line of the table is useful in comparing ongoing costs only, and will not help you determine the relative total costs of owning different funds. In addition, if these transactional costs were included, your costs would have been higher.
| | Annualized Expense Ratio-A | Beginning
Account Value
May 1, 2015 | Ending
Account Value
October 31, 2015 | Expenses Paid
During Period-B
May 1, 2015
to October 31, 2015 |
| Class A | 1.45% | | | |
| Actual | | $1,000.00 | $978.80 | $7.23 |
| Hypothetical-C | | $1,000.00 | $1,017.90 | $7.38 |
| Class T | 1.70% | | | |
| Actual | | $1,000.00 | $978.40 | $8.48 |
| Hypothetical-C | | $1,000.00 | $1,016.64 | $8.64 |
| Class B | 2.20% | | | |
| Actual | | $1,000.00 | $975.90 | $10.96 |
| Hypothetical-C | | $1,000.00 | $1,014.12 | $11.17 |
| Class C | 2.20% | | | |
| Actual | | $1,000.00 | $975.10 | $10.95 |
| Hypothetical-C | | $1,000.00 | $1,014.12 | $11.17 |
| Class I | 1.20% | | | |
| Actual | | $1,000.00 | $980.70 | $5.99 |
| Hypothetical-C | | $1,000.00 | $1,019.16 | $6.11 |
A Annualized expense ratio reflects expenses net of applicable fee waivers.
B Expenses are equal to each Class' annualized expense ratio, multiplied by the average account value over the period, multiplied by 184/365 (to reflect the one-half year period).
C 5% return per year before expenses
Distributions (Unaudited)
Class I designates 51% of the dividends distributed during the fiscal year as qualifying for the dividends–received deduction for corporate shareholders.
Class I designates 100% of the dividend distributed during the fiscal year as amounts which may be taken into account as a dividend for purposes of the maximum rate under section 1(h)(11) of the Internal Revenue Code.
The amounts per share which represent income derived from sources within, and taxes paid to, foreign countries or possessions of the United States are as follows:
| | Pay Date | Income | Taxes |
| Class I | 12/08/14 | $0.1225 | $0.0555 |
The fund will notify shareholders in January 2016 of amounts for use in preparing 2015 income tax returns.
Board Approval of Investment Advisory Contracts and Management Fees
Fidelity Advisor International Capital Appreciation Fund
Each year, the Board of Trustees, including the Independent Trustees (together, the Board), votes on the renewal of the management contract with Fidelity Management & Research Company (FMR) and the sub-advisory agreements (together, the Advisory Contracts) for the fund. The Board, assisted by the advice of fund counsel and Independent Trustees' counsel, requests and considers a broad range of information relevant to the renewal of the Advisory Contracts throughout the year.
The Board meets regularly and, at each of its meetings, covers an extensive agenda of topics and materials and considers factors that are relevant to its annual consideration of the renewal of the fund's Advisory Contracts, including the services and support provided to the fund and its shareholders. The Board has established various standing committees (Committees), each composed of and chaired by Independent Trustees with varying backgrounds, to which the Board has assigned specific subject matter responsibilities in order to enhance effective decision-making by the Board. The Board, acting directly and through its Committees, requests and receives information concerning the annual consideration of the renewal of the fund's Advisory Contracts. The Board also meets as needed to consider matters specifically related to the Board's annual consideration of the renewal of the Advisory Contracts. Members of the Board may also meet with trustees of other Fidelity funds through ad hoc joint committees to discuss certain matters relevant to all of the Fidelity funds.
At its July 2015 meeting, the Board unanimously determined to renew the fund's Advisory Contracts. In reaching its determination, the Board considered all factors it believed relevant, including (i) the nature, extent, and quality of the services to be provided to the fund and its shareholders (including the investment performance of the fund); (ii) the competitiveness of the fund's management fee and total expense ratio relative to peer funds; (iii) the total costs of the services to be provided by and the profits to be realized by Fidelity from its relationship with the fund; and (iv) the extent to which (if any) economies of scale exist and would be realized as the fund grows, and whether any economies of scale are appropriately shared with fund shareholders.
In considering whether to renew the Advisory Contracts for the fund, the Board reached a determination, with the assistance of fund counsel and Independent Trustees' counsel and through the exercise of its business judgment, that the renewal of the Advisory Contracts was in the best interests of the fund and its shareholders and that the compensation payable under the Advisory Contracts was fair and reasonable. The Board's decision to renew the Advisory Contracts was not based on any single factor, but rather was based on a comprehensive consideration of all the information provided to the Board at its meetings throughout the year. The Board, in reaching its determination to renew the Advisory Contracts, was aware that shareholders of the fund have a broad range of investment choices available to them, including a wide choice among funds offered by Fidelity's competitors, and that the fund's shareholders, who have the opportunity to review and weigh the disclosure provided by the fund in its prospectus and other public disclosures, have chosen to invest in this fund, which is part of the Fidelity family of funds.
Nature, Extent, and Quality of Services Provided. The Board considered Fidelity's staffing as it relates to the fund, including the backgrounds of investment personnel of Fidelity, and also considered the fund's investment objective, strategies, and related investment philosophy. The Independent Trustees also had discussions with senior management of Fidelity's investment operations and investment groups. The Board considered the structure of the portfolio manager compensation program and whether this structure provides appropriate incentives to act in the best interests of the fund. Additionally, the Board considered the portfolio managers' investments, if any, in the funds that they manage.
Resources Dedicated to Investment Management and Support Services. The Board and the Fund Oversight and Research Committees reviewed the general qualifications and capabilities of Fidelity's investment staff, including its size, education, experience, and resources, as well as Fidelity's approach to recruiting, training, managing, and compensating investment personnel. The Board noted that Fidelity has continued to increase the resources devoted to non-U.S. offices, including expansion of Fidelity's global investment organization. The Board also noted that Fidelity's analysts have extensive resources, tools and capabilities that allow them to conduct sophisticated quantitative and fundamental analysis, as well as credit analysis of issuers, counterparties and guarantors. Further, the Board considered that Fidelity's investment professionals have sufficient access to global information and data so as to provide competitive investment results over time, and that those professionals also have access to sophisticated tools that permit them to assess portfolio construction and risk and performance attribution characteristics continuously, as well as to transmit new information and research conclusions rapidly around the world. Additionally, in its deliberations, the Board considered Fidelity's trading, risk management, and compliance capabilities and resources, which are integral parts of the investment management process.
Shareholder and Administrative Services. The Board considered (i) the nature, extent, quality, and cost of advisory, administrative, and shareholder services performed by FMR, the sub-advisers (together with FMR, the Investment Advisers), and their affiliates under the Advisory Contracts and under separate agreements covering transfer agency, pricing and bookkeeping, and securities lending services for the fund; (ii) the nature and extent of the supervision of third party service providers, principally custodians and subcustodians; and (iii) the resources devoted to, and the record of compliance with, the fund's compliance policies and procedures. The Board also reviewed the allocation of fund brokerage, including allocations to brokers affiliated with the Investment Advisers, the use of brokerage commissions to pay fund expenses, and the use of "soft" commission dollars to pay for research services.
The Board noted that the growth of fund assets over time across the complex allows Fidelity to reinvest in the development of services designed to enhance the value or convenience of the Fidelity funds as investment vehicles. These services include 24-hour access to account information and market information through telephone representatives and over the Internet, investor education materials and asset allocation tools, and the expanded availability of Fidelity Investor Centers.
In 2014, the Board formed an ad hoc Committee on Transfer Agency Fees to review the variety of transfer agency fee structures throughout the industry and Fidelity's competitive positioning with respect to industry participants.
Investment in a Large Fund Family. The Board considered the benefits to shareholders of investing in a Fidelity fund, including the benefits of investing in a fund that is part of a large family of funds offering a variety of investment disciplines and providing a large variety of mutual fund investor services. The Board noted that Fidelity had taken, or had made recommendations that resulted in the Fidelity funds taking, a number of actions over the previous year that benefited particular funds, including (i) continuing to dedicate additional resources to investment research and to the support of the senior management team that oversees asset management; (ii) continuing efforts to enhance Fidelity's global research capabilities; (iii) launching new funds and making other enhancements to meet client needs; (iv) reducing management fees and total expenses for certain index funds and diversified international funds; (v) continuing to launch dedicated lower cost underlying funds to meet portfolio construction needs related to expanding underlying fund options for Fidelity funds of funds, specifically for the Freedom Fund product lines; (vi) rationalizing product lines and gaining increased efficiencies through fund mergers; (vii) launching active fixed-income exchange-traded funds; (viii) continuing to develop, acquire and implement systems and technology to improve services to the funds and information security and to increase efficiency; (ix) implementing investment enhancements to further strengthen Fidelity's target date product line to increase investors' probability of success in achieving their goals; (x) modifying the eligibility criteria for certain share classes to accommodate roll-over assets from employer-sponsored retirement plans; (xi) launching a new Class W of the Freedom Index Funds to attract and retain Fidelity record-kept retirement plan assets; and (xii) implementing changes to Fidelity's money market product line in response to recent money market regulatory reforms.
Investment Performance. The Board considered whether the fund has operated in accordance with its investment objective, as well as its record of compliance with its investment restrictions and its performance history.
The Board took into account discussions with representatives of the Investment Advisers about fund investment performance that occur at Board meetings throughout the year. In this regard the Board noted that as part of regularly scheduled fund reviews and other reports to the Board on fund performance, the Board considers annualized return information for the fund, for different time periods, measured against a securities market index ("benchmark index") and a peer group of funds with similar objectives ("peer group"), if any. In its evaluation of fund investment performance, the Board gave particular attention to information indicating changes in performance of certain Fidelity funds for specific time periods and discussed with the Investment Advisers the reasons for any overperformance or underperformance.
In addition to reviewing absolute and relative fund performance, the Independent Trustees periodically consider the appropriateness of fund performance metrics in evaluating the results achieved. In general, the Independent Trustees believe that fund performance should be evaluated based on net performance (after fees and expenses) of both the highest performing and lowest performing fund share classes, where applicable, compared to appropriate benchmark indices, over appropriate time periods that may include full market cycles, and compared to peer groups, as applicable, over the same periods, taking into account relevant factors including the following: general market conditions; issuer-specific information; and fund cash flows and other factors.
The Independent Trustees recognize that shareholders evaluate performance on a net basis over their own holding periods, for which one-, three-, and five-year periods are often used as a proxy. For this reason, the performance information reviewed by the Board also included net cumulative calendar year total return information for the fund and an appropriate benchmark index and peer group for the most recent one-, three-, and five-year periods, as shown below. Returns are shown compared to the 25th percentile (top of box, 75% beaten) and 75th percentile (bottom of box, 25% beaten) of the peer universe. Returns of the benchmark index are "net MA,"
i.e., adjusted for tax withholding rates applicable to U.S.-based funds organized as Massachusetts business trusts.
Fidelity Advisor International Capital Appreciation Fund
The Board also considered that the fund's management fee is subject to upward or downward adjustment depending upon whether, and to what extent, the fund's investment performance for the performance period exceeds, or is exceeded by, a securities index, thus leading to a performance adjustment for the same period. The Board noted that the performance adjustment provides FMR with a strong economic incentive to seek to achieve superior performance for the fund's shareholders and helps to more closely align the interests of FMR and the shareholders of the fund.
Based on its review, the Board concluded that the nature, extent, and quality of services provided to the fund under the Advisory Contracts should benefit the shareholders of the fund.
Competitiveness of Management Fee and Total Expense Ratio. The Board considered the fund's management fee and total expense ratio compared to "mapped groups" of competitive funds and classes created for the purpose of facilitating the Trustees' competitive analysis of management fees and total expenses. Fidelity creates "mapped groups" by combining similar Lipper investment objective categories that have comparable investment mandates. Combining Lipper investment objective categories aids the Board's management fee and total expense ratio comparisons by broadening the competitive group used for comparison.
Management Fee. The Board considered two proprietary management fee comparisons for the 12-month periods shown in basis points (BP) in the chart below. The group of Lipper funds used by the Board for management fee comparisons is referred to below as the "Total Mapped Group." The Total Mapped Group comparison focuses on a fund's standing in terms of gross management fees before expense reimbursements or caps, and without giving effect to the fund's performance adjustment, relative to the total universe of funds with comparable investment mandates, regardless of whether their management fee structures also are comparable. Funds with comparable investment mandates offer exposure to similar types of securities. Funds with comparable management fee structures have similar management fee contractual arrangements (
e.g., flat rate charged for advisory services, all-inclusive fee rate,
etc.). "TMG %" represents the percentage of funds in the Total Mapped Group that had management fees that were lower than the fund's. For example, a hypothetical TMG % of 20% would mean that 80% of the funds in the Total Mapped Group had higher, and 20% had lower, management fees than the fund. The fund's actual TMG %s and the number of funds in the Total Mapped Group are in the chart below. The "Asset-Size Peer Group" (ASPG) comparison focuses on a fund's standing relative to a subset of non-Fidelity funds within the Total Mapped Group that are similar in size and management fee structure without taking into account performance adjustments, if any. For example, if a fund is in the first quartile of the ASPG, the fund's management fee ranks in the least expensive or lowest 25% of funds in the ASPG. The ASPG represents at least 15% of the funds in the Total Mapped Group with comparable asset size and management fee structures, subject to a minimum of 50 funds (or all funds in the Total Mapped Group if fewer than 50). Additional information, such as the ASPG quartile in which the fund's management fee rate ranked and the impact of the fund's performance adjustment, is also included in the chart and considered by the Board.
Fidelity Advisor International Capital Appreciation Fund
The Board noted that the fund's management fee rate ranked below the median of its Total Mapped Group and below the median of its ASPG for 2014. The Board also noted the effect of the fund's performance adjustment, if any, on the fund's management fee ranking.
The Board noted that, in 2014, the ad hoc Committee on Group Fee was formed by it and other Fidelity fund boards to conduct an in-depth review of the "group fee" component of the management fee of funds with such management fee structures. Committee focus included the mechanics of the group fee, the competitive landscape of group fee structures, Fidelity funds with no group fee component and investment products not included in group fee assets. The Board also considered that, for funds subject to the group fee, FMR agreed to voluntarily waive fees over a specified period of time in amounts designed to account for assets converted from certain funds to certain collective investment trusts.
The Board also noted that, in 2013, the ad hoc Committee on Management Fees was formed to conduct an in-depth review of the management fee rates of Fidelity's active equity mutual funds. The Committee focused on the following areas: (i) standard fee structures; (ii) research consumption and trading evolution; (iii) management fee competitiveness/profitability by category; and (iv) factors that drive institutional pricing.
Based on its review, the Board concluded that the fund's management fee is fair and reasonable in light of the services that the fund receives and the other factors considered.
Total Expense Ratio. In its review of each class's total expense ratio, the Board considered the fund's management fee as well as other fund or class expenses, as applicable, such as transfer agent fees, pricing and bookkeeping fees, fund-paid 12b-1 fees, and custodial, legal, and audit fees. The Board noted the impact of the fund's performance adjustment. The Board also noted that Fidelity may agree to waive fees and expenses from time to time, and the extent to which, if any, it has done so for the fund. As part of its review, the Board also considered the current and historical total expense ratios of each class of the fund compared to competitive fund median expenses. Each class of the fund is compared to those funds and classes in the Total Mapped Group (used by the Board for management fee comparisons) that have a similar sales load structure.
The Board noted that the total expense ratio of each class ranked above its competitive median for 2014. The Board considered that, in general, various factors can affect total expense ratios. The Board noted that the total expense ratio of each class of the fund was above the competitive median because of a significant positive performance fee adjustment in 2014. The Board noted that the total expense ratio of Class T was also above the competitive median because of higher 12b-1 fees on Class T as compared to most competitor funds. Class T has a higher 12b-1 fee, but a lower front-end sales charge, than traditionally priced front-end sales charge classes. The Board considered that Class T is primarily sold load-waived in the retirement plan market where its 0.50% 12b-1 fee is comparable to competing no-load, higher 12b-1 fee classes designed specifically for retirement plans. The Board noted that the fund offers multiple classes, each of which has a different sales load and 12b-1 fee structure, and that the multiple structures are intended to offer a range of pricing options for the intermediary market. The Board also noted that the total expense ratios of the classes vary primarily by the level of their 12b-1 fees, although differences in transfer agent fees may also cause expenses to vary from class to class.
Fees Charged to Other Fidelity Clients. The Board also considered Fidelity fee structures and other information with respect to clients of Fidelity, such as other funds advised or subadvised by Fidelity, pension plan clients, and other institutional clients with similar mandates. The Board noted the findings of the 2013 ad hoc joint committee (created with the board of other Fidelity funds), which reviewed and compared Fidelity's institutional investment advisory business with its business of providing services to the Fidelity funds, including the differences in services provided, fees charged, and costs incurred, as well as competition in their respective marketplaces.
Based on its review of total expense ratios and fees charged to other Fidelity clients, the Board concluded that, although in all cases above the median of the universe presented for comparison, the total expense ratio of each class of the fund was reasonable in light of the services that the fund and its shareholders receive and the other factors considered.
Costs of the Services and Profitability. The Board considered the revenues earned and the expenses incurred by Fidelity in conducting the business of developing, marketing, distributing, managing, administering and servicing the fund and servicing the fund's shareholders. The Board also considered the level of Fidelity's profits in respect of all the Fidelity funds.
On an annual basis, Fidelity presents to the Board information about the profitability of its relationship with the fund. Fidelity calculates profitability information for each fund, as well as aggregate profitability information for groups of Fidelity funds and all Fidelity funds, using a series of detailed revenue and cost allocation methodologies which originate with the books and records of Fidelity on which Fidelity's audited financial statements are based. The Audit Committee of the Board reviews any significant changes from the prior year's methodologies.
PricewaterhouseCoopers LLP (PwC), independent registered public accounting firm and auditor to Fidelity and certain Fidelity funds, has been engaged annually by the Board as part of the Board's assessment of Fidelity's profitability analysis. PwC's engagement includes the review and assessment of the methodologies used by Fidelity in determining the revenues and expenses attributable to Fidelity's mutual fund business, and completion of agreed-upon procedures in respect of the mathematical accuracy of fund profitability and its conformity to established allocation methodologies. After considering PwC's reports issued under the engagement and information provided by Fidelity, the Board concluded that while other allocation methods may also be reasonable, Fidelity's profitability methodologies are reasonable in all material respects.
The Board also reviewed Fidelity's non-fund businesses and fall-out benefits related to the mutual fund business as well as cases where Fidelity's affiliates may benefit from or be related to the fund's business.
The Board considered the costs of the services provided by and the profits realized by Fidelity in connection with the operation of the fund and was satisfied that the profitability was not excessive.
Economies of Scale. The Board considered whether there have been economies of scale in respect of the management of the Fidelity funds, whether the Fidelity funds (including the fund) have appropriately benefited from any such economies of scale, and whether there is potential for realization of any further economies of scale. The Board considered the extent to which the fund will benefit from economies of scale as assets grow through increased services to the fund, through waivers or reimbursements, or through fee or expense ratio reductions. The Board also noted that in 2013, it and the boards of other Fidelity funds created an ad hoc committee (the Economies of Scale Committee) to analyze whether Fidelity attains economies of scale in respect of the management and servicing of the Fidelity funds, whether the Fidelity funds have appropriately benefited from such economies of scale, and whether there is potential for realization of any further economies of scale.
The Board recognized that the fund's management contract incorporates a "group fee" structure, which provides for lower group fee rates as total group assets increase, and for higher group fee rates as total group assets decrease (with "group assets" defined to include fund assets under FMR's management plus sector fund assets previously under FMR's management and currently managed by Fidelity SelectCo, LLC). FMR calculates the group fee rates based on a tiered asset "breakpoint" schedule that varies based on asset class. The Board considered that the group fee is designed to deliver the benefits of economies of scale to fund shareholders when total Fidelity fund assets increase, even if assets of any particular fund are unchanged or have declined, because some portion of Fidelity's costs are attributable to services provided to all Fidelity funds, and all funds benefit if those costs can be allocated among more assets. The Board concluded that, given the group fee structure, fund shareholders will benefit from lower management fees as group assets increase at the fund complex level, regardless of whether Fidelity achieves any such economies of scale.
The Board concluded, taking into account the analysis of the Economies of Scale Committee, that economies of scale, if any, are being appropriately shared between fund shareholders and Fidelity.
Additional Information Requested by the Board. In order to develop fully the factual basis for consideration of the Fidelity funds' Advisory Contracts, the Board requested and received additional information on certain topics, including: (i) fund performance trends and Fidelity's long-term strategies for certain funds; (ii) the various share classes employed by Fidelity and the attributes of each class, together with similar information on the distribution and servicing payments made by Fidelity or the funds to third-party participants in the distribution channels; (iii) fund profitability, and fund performance in relation to fund profitability; (iv) the methodology with respect to evaluating competitive fund data and peer group classifications and fee comparisons; (v) annual fund profitability margins, with particular focus on certain funds with negative margins; (vi) the realization of fall-out benefits in certain Fidelity business units;
(vii) economies of scale and the way in which they are shared with fund shareholders;(viii) Fidelity's group fee structures, including the group fee schedule of breakpoints;(ix) the impact of cost containment measures on the funds; and (x) the transfer agent fee structure.
Based on its evaluation of all of the conclusions noted above, and after considering all factors it believed relevant, the Board concluded that the advisory fee structures are fair and reasonable, and that the fund's Advisory Contracts should be renewed.
AICAPI-ANN-1215
1.711986.117
Fidelity Advisor® Overseas Fund Class A, Class T, Class B and Class C
Annual Report October 31, 2015 |
|
Contents
To view a fund's proxy voting guidelines and proxy voting record for the 12-month period ended June 30, visit http://www.fidelity.com/proxyvotingresults or visit the Securities and Exchange Commission's (SEC) web site at http://www.sec.gov.
You may also call 1-877-208-0098 to request a free copy of the proxy voting guidelines.
Standard & Poor's, S&P and S&P 500 are registered service marks of The McGraw-Hill Companies, Inc. and have been licensed for use by Fidelity Distributors Corporation.
Other third-party marks appearing herein are the property of their respective owners.
All other marks appearing herein are registered or unregistered trademarks or service marks of FMR LLC or an affiliated company. © 2015 FMR LLC. All rights reserved.
This report and the financial statements contained herein are submitted for the general information of the shareholders of the Fund. This report is not authorized for distribution to prospective investors in the Fund unless preceded or accompanied by an effective prospectus.
A fund files its complete schedule of portfolio holdings with the SEC for the first and third quarters of each fiscal year on Form N-Q. Forms N-Q are available on the SEC’s web site at http://www.sec.gov. A fund's Forms N-Q may be reviewed and copied at the SEC’s Public Reference Room in Washington, DC. Information regarding the operation of the SEC's Public Reference Room may be obtained by calling 1-800-SEC-0330.
For a complete list of a fund's portfolio holdings, view the most recent holdings listing, semiannual report, or annual report on Fidelity's web site at http://www.fidelity.com, http://www.advisor.fidelity.com, or http://www.401k.com, as applicable.
NOT FDIC INSURED •MAY LOSE VALUE •NO BANK GUARANTEE
Neither the Fund nor Fidelity Distributors Corporation is a bank.
Performance: The Bottom Line
Average annual total return reflects the change in the value of an investment, assuming reinvestment of distributions from dividend income and capital gains (the profits earned upon the sale of securities that have grown in value, if any) and assuming a constant rate of performance each year.
The hypothetical investment and the average annual total returns do not reflect the deduction of taxes that a shareholder would pay on fund distributions or the redemption of fund shares.
During periods of reimbursement by Fidelity, a fund’s total return will be greater than it would be had the reimbursement not occurred.
How a fund did yesterday is no guarantee of how it will do tomorrow.
Returns reflect the conversion of Class B shares to Class A shares after a maximum of seven years.
Average Annual Total Returns
| For the periods ended October 31, 2015 | Past 1 year | Past 5 years | Past 10 years |
| Class A (incl. 5.75% sales charge) | (3.43)% | 3.97% | 3.72% |
| Class T (incl. 3.50% sales charge) | (1.31)% | 4.26% | 3.78% |
| Class B (incl. contingent deferred sales charge) | (3.39)% | 4.05% | 3.78% |
| Class C (incl. contingent deferred sales charge) | 0.70% | 4.41% | 3.55% |
Class B shares' contingent deferred sales charges included in the past one year, past five years and past ten years total return figures are 5%, 2% and 0%, respectively.
Class C shares' contingent deferred sales charges included in the past one year, past five years and past ten years total return figures are 1%, 0% and 0%, respectively.
$10,000 Over 10 Years
Let's say hypothetically that $10,000 was invested in Fidelity Advisor® Overseas Fund - Class A on October 31, 2005, and the current 5.75% sales charge was paid.
The chart shows how the value of your investment would have changed, and also shows how the MSCI EAFE Index performed over the same period.
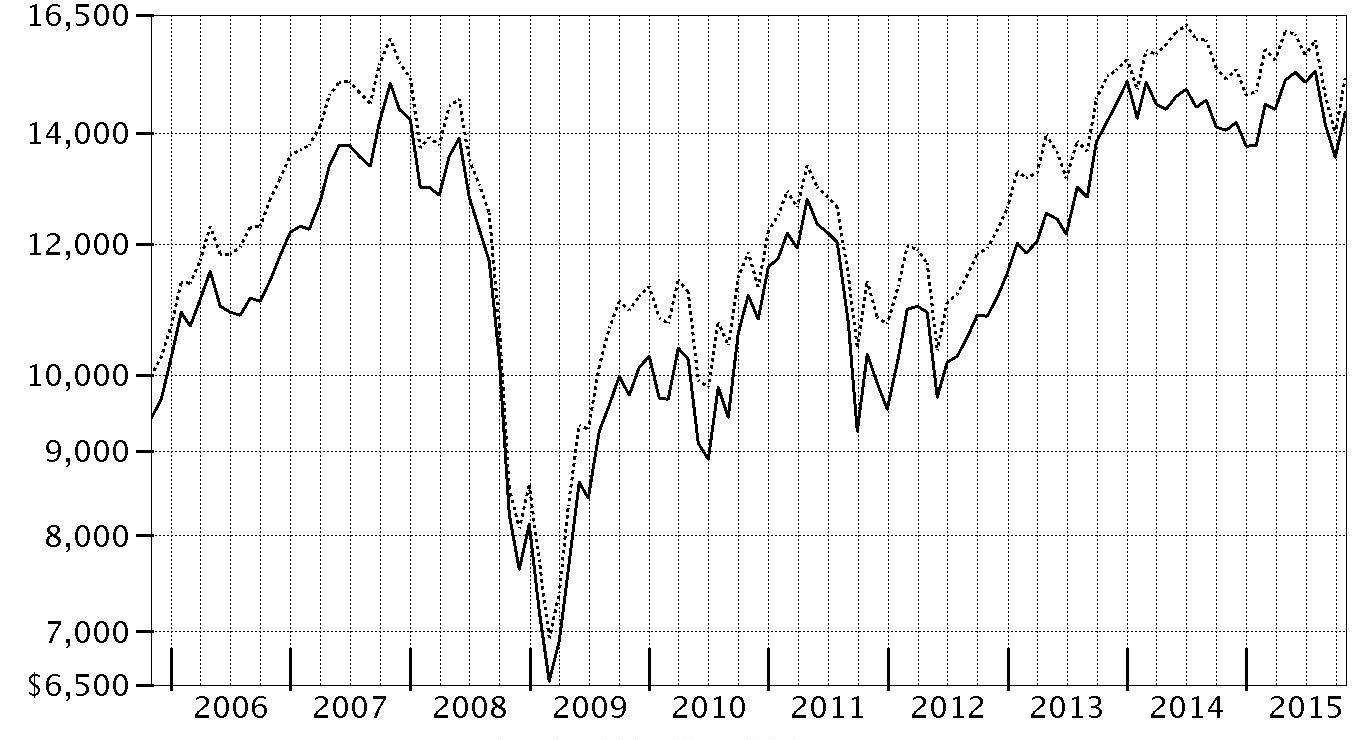
| Period Ending Values |
| $14,410 | Fidelity Advisor® Overseas Fund - Class A |
| $15,102 | MSCI EAFE Index |
Management's Discussion of Fund Performance
Market Recap: International equities suffered a moderate setback for the 12 months ending October 31, 2015, held back by a collapse in commodities prices that hurt resources-related sectors and geographies. The MSCI ACWI (All Country World Index) ex USA Index returned -4.55% for the period, affected also by concerns about global economic growth. Commodity producers remained under pressure for much of the past year, largely related to economic deceleration in China (-1%), the world’s second-largest economy and a leading consumer of raw materials. This effect was exacerbated by U.S. dollar strength relative to global currencies, which weighed on commodities priced in dollars and acutely impacted equity returns within regions most exposed to resources prices. The emerging-markets group, for example, returned about -15% this period. Canada, a significant energy producer, returned roughly -17%. Net energy consumer Japan (+9%) was the best-performing region by far. Only about a quarter of the nearly 50 index countries managed a gain this period: Ireland (+19%) – the EU’s fastest-growing economy – and Israel (+17%) proved top performers; Greece (-56%) and Brazil (-46%), among the worst. As for sectors, energy (-25%) and materials (-16%) declined sharply, whereas the two consumer sectors each gained about 6%.
Comments from Portfolio Manager Graeme Rockett: For the year, the fund’s share classes (excluding sales charges, if applicable) solidly outpaced the 0.08% return of the MSCI EAFE Index. Strong stock selection and market positioning in media and banks provided a boost to the fund’s relative performance. In media, two individual positions were especially helpful: online real estate portals Rightmove in the U.K. and NEXT in Japan, both out-of-index positions, I increased my position in Rightmove, the fund’s No. 1 individual contributor, in late 2014 and 2015 during a period of stock weakness, mainly due to concerns of a new competitor. I believed the new entrant would gain little traction and have limited impact on Rightmove. Fortunately, my views were vindicated and the stock moved up substantially as market concerns proved unfounded. I later reduced the position to lock in a portion of gains. On the downside, stock selection in the software & services segment was detrimental, but an overweighting in this strong-performing segment more than offset the negative impact. Relative results also were affected by a downward fair-value pricing adjustment of 0.77 percentage points. Individual detractors included Melco Crown Philippines Resort in Manila, an out-of-index holding, and German auto manufacturer Volkswagen AG.
The views expressed above reflect those of the portfolio manager(s) only through the end of the period as stated on the cover of this report and do not necessarily represent the views of Fidelity or any other person in the Fidelity organization. Any such views are subject to change at any time based upon market or other conditions and Fidelity disclaims any responsibility to update such views. These views may not be relied on as investment advice and, because investment decisions for a Fidelity fund are based on numerous factors, may not be relied on as an indication of trading intent on behalf of any Fidelity fund.
Investment Summary (Unaudited)
Top Five Stocks as of October 31, 2015
| | % of fund's net assets | % of fund's net assets 6 months ago |
| Nestle SA (Switzerland, Food Products) | 2.4 | 2.3 |
| Sanofi SA (France, Pharmaceuticals) | 2.0 | 1.5 |
| Novo Nordisk A/S Series B (Denmark, Pharmaceuticals) | 1.9 | 1.9 |
| Howden Joinery Group PLC (United Kingdom, Specialty Retail) | 1.8 | 1.3 |
| Wolseley PLC (Bailiwick of Jersey, Trading Companies & Distributors) | 1.8 | 1.4 |
| | 9.9 | |
Top Five Market Sectors as of October 31, 2015
| | % of fund's net assets | % of fund's net assets 6 months ago |
| Consumer Discretionary | 29.7 | 28.8 |
| Financials | 16.5 | 17.8 |
| Health Care | 13.4 | 10.8 |
| Information Technology | 12.9 | 13.5 |
| Consumer Staples | 10.4 | 10.1 |
Top Five Countries as of October 31, 2015
| (excluding cash equivalents) | % of fund's net assets | % of fund's net assets 6 months ago |
| United Kingdom | 22.9 | 22.2 |
| Japan | 17.9 | 18.6 |
| United States of America | 9.5 | 8.4 |
| France | 9.2 | 6.9 |
| Switzerland | 6.1 | 5.7 |
Percentages are adjusted for the effect of futures contracts, if applicable.
Asset Allocation (% of fund's net assets)
| As of October 31, 2015 |
| | Stocks | 99.4% |
| | Short-Term Investments and Net Other Assets (Liabilities) | 0.6% |

| As of April 30, 2015 |
| | Stocks | 98.2% |
| | Short-Term Investments and Net Other Assets (Liabilities) | 1.8% |

Investments October 31, 2015
Showing Percentage of Net Assets
| Common Stocks - 98.6% | | | |
| | | Shares | Value (000s) |
| Australia - 1.7% | | | |
| AMP Ltd. | | 186,173 | $755 |
| BHP Billiton Ltd. | | 146,394 | 2,401 |
| iSelect Ltd. (a) | | 2,540,749 | 2,718 |
| Macquarie Group Ltd. | | 39,016 | 2,362 |
| McMillan Shakespeare Ltd. | | 264,254 | 2,354 |
| WorleyParsons Ltd. | | 273,644 | 1,262 |
|
| TOTAL AUSTRALIA | | | 11,852 |
|
| Austria - 0.7% | | | |
| Wienerberger AG | | 266,700 | 4,917 |
| Bailiwick of Jersey - 2.7% | | | |
| Glencore Xstrata PLC | | 448,172 | 777 |
| Integrated Diagnostics Holdings PLC (a) | | 95,400 | 526 |
| Shire PLC | | 66,000 | 4,998 |
| Wolseley PLC | | 208,312 | 12,230 |
|
| TOTAL BAILIWICK OF JERSEY | | | 18,531 |
|
| Belgium - 0.8% | | | |
| Ageas | | 35,290 | 1,559 |
| KBC Groep NV | | 25,776 | 1,570 |
| UCB SA | | 25,400 | 2,199 |
|
| TOTAL BELGIUM | | | 5,328 |
|
| Bermuda - 0.5% | | | |
| Clear Media Ltd. | | 641,000 | 644 |
| Oriental Watch Holdings Ltd. | | 2,992,000 | 407 |
| Signet Jewelers Ltd. | | 17,300 | 2,611 |
|
| TOTAL BERMUDA | | | 3,662 |
|
| Brazil - 0.7% | | | |
| BB Seguridade Participacoes SA | | 279,900 | 1,931 |
| Cielo SA | | 283,872 | 2,695 |
|
| TOTAL BRAZIL | | | 4,626 |
|
| Canada - 0.6% | | | |
| Entertainment One Ltd. | | 1,061,377 | 3,595 |
| Performance Sports Group Ltd. (a) | | 23,000 | 264 |
|
| TOTAL CANADA | | | 3,859 |
|
| Cayman Islands - 4.1% | | | |
| 58.com, Inc. ADR (a)(b) | | 67,600 | 3,548 |
| Alibaba Group Holding Ltd. sponsored ADR (a) | | 79,400 | 6,656 |
| Autohome, Inc. ADR Class A (a)(b) | | 37,000 | 1,337 |
| Bitauto Holdings Ltd. ADR (a) | | 18,300 | 584 |
| Ctrip.com International Ltd. sponsored ADR (a)(b) | | 47,600 | 4,425 |
| Fu Shou Yuan International Group Ltd. | | 2,729,000 | 1,861 |
| Qunar Cayman Islands Ltd. sponsored ADR (a)(b) | | 37,200 | 1,806 |
| Tencent Holdings Ltd. | | 392,600 | 7,400 |
|
| TOTAL CAYMAN ISLANDS | | | 27,617 |
|
| China - 0.7% | | | |
| Kweichow Moutai Co. Ltd. | | 106,810 | 3,606 |
| TravelSky Technology Ltd. (H Shares) | | 925,000 | 1,365 |
|
| TOTAL CHINA | | | 4,971 |
|
| Denmark - 2.1% | | | |
| Danske Bank A/S | | 51,111 | 1,405 |
| Novo Nordisk A/S: | | | |
| Series B | | 18,115 | 962 |
| Series B sponsored ADR | | 229,400 | 12,199 |
|
| TOTAL DENMARK | | | 14,566 |
|
| France - 9.2% | | | |
| AXA SA | | 49,558 | 1,323 |
| AXA SA sponsored ADR | | 59,100 | 1,578 |
| BNP Paribas SA | | 79,616 | 4,838 |
| Edenred SA | | 51,086 | 940 |
| GameLoft SE (a) | | 238,800 | 1,366 |
| Havas SA | | 589,900 | 5,118 |
| Iliad SA | | 6,166 | 1,297 |
| Ipsen SA | | 77,700 | 4,906 |
| Orange SA | | 400,000 | 7,053 |
| Pernod Ricard SA | | 33,900 | 3,996 |
| Safran SA | | 36,800 | 2,795 |
| Sanofi SA | | 105,913 | 10,684 |
| Sanofi SA sponsored ADR | | 54,500 | 2,744 |
| Societe Generale Series A | | 25,062 | 1,164 |
| Total SA (b) | | 144,390 | 6,983 |
| Ubisoft Entertainment SA (a) | | 93,324 | 2,799 |
| Vivendi SA | | 139,700 | 3,361 |
|
| TOTAL FRANCE | | | 62,945 |
|
| Germany - 3.4% | | | |
| Allianz SE | | 13,848 | 2,424 |
| Axel Springer Verlag AG | | 57,700 | 3,245 |
| Bayer AG | | 61,340 | 8,185 |
| CTS Eventim AG | | 116,482 | 4,561 |
| Deutsche Bank AG | | 31,560 | 884 |
| Deutsche Boerse AG | | 39,269 | 3,617 |
|
| TOTAL GERMANY | | | 22,916 |
|
| Hong Kong - 0.9% | | | |
| AIA Group Ltd. | | 594,800 | 3,488 |
| Television Broadcasts Ltd. | | 644,200 | 2,348 |
|
| TOTAL HONG KONG | | | 5,836 |
|
| India - 0.4% | | | |
| Info Edge India Ltd. | | 214,247 | 2,470 |
| Just Dial Ltd. (a) | | 25,947 | 317 |
|
| TOTAL INDIA | | | 2,787 |
|
| Ireland - 1.1% | | | |
| Glanbia PLC | | 133,000 | 2,580 |
| Kingspan Group PLC (United Kingdom) | | 64,100 | 1,551 |
| Paddy Power PLC (Ireland) | | 28,170 | 3,259 |
|
| TOTAL IRELAND | | | 7,390 |
|
| Isle of Man - 0.8% | | | |
| Playtech Ltd. | | 390,218 | 5,149 |
| Italy - 2.5% | | | |
| Brunello Cucinelli SpA | | 4,900 | 89 |
| DiaSorin S.p.A. | | 43,100 | 1,931 |
| Eni SpA | | 60,300 | 985 |
| Eni SpA sponsored ADR | | 22,300 | 727 |
| Intesa Sanpaolo SpA | | 2,043,400 | 7,119 |
| Mediaset SpA | | 1,057,700 | 5,374 |
| Tod's SpA (b) | | 11,938 | 1,001 |
|
| TOTAL ITALY | | | 17,226 |
|
| Japan - 17.9% | | | |
| Arcland Service Co. Ltd. | | 152,700 | 6,093 |
| Astellas Pharma, Inc. | | 698,000 | 10,131 |
| Daiwa Securities Group, Inc. | | 208,000 | 1,422 |
| Dentsu, Inc. | | 142,100 | 7,989 |
| Fuji Media Holdings, Inc. | | 68,900 | 820 |
| Fukuda Denshi Co. Ltd. | | 14,400 | 703 |
| Hitachi Ltd. | | 703,000 | 4,055 |
| Honda Motor Co. Ltd. | | 97,800 | 3,235 |
| Hoya Corp. | | 127,000 | 5,241 |
| Infomart Corp. (b) | | 46,400 | 438 |
| Japan Tobacco, Inc. | | 138,600 | 4,797 |
| Kakaku.com, Inc. | | 38,700 | 722 |
| Keyence Corp. | | 9,600 | 4,998 |
| Misumi Group, Inc. | | 588,700 | 7,666 |
| Mitsubishi UFJ Financial Group, Inc. | | 883,900 | 5,717 |
| MS&AD Insurance Group Holdings, Inc. | | 65,400 | 1,928 |
| Nakanishi, Inc. | | 17,900 | 610 |
| NEXT Co. Ltd. | | 965,000 | 7,163 |
| Nomura Holdings, Inc. | | 204,200 | 1,284 |
| Olympus Corp. | | 80,900 | 2,729 |
| ORIX Corp. | | 489,000 | 7,141 |
| Proto Corp. | | 36,500 | 474 |
| Rakuten, Inc. | | 468,200 | 6,486 |
| Recruit Holdings Co. Ltd. | | 153,300 | 4,927 |
| SoftBank Corp. | | 18,800 | 1,053 |
| Sony Corp. | | 13,200 | 375 |
| Sony Corp. sponsored ADR | | 64,700 | 1,837 |
| Sumitomo Mitsui Financial Group, Inc. | | 92,300 | 3,682 |
| Sundrug Co. Ltd. | | 17,300 | 911 |
| Suzuki Motor Corp. | | 54,400 | 1,781 |
| Tokio Marine Holdings, Inc. | | 59,300 | 2,285 |
| Toyota Motor Corp. | | 81,200 | 4,975 |
| Welcia Holdings Co. Ltd. (b) | | 174,600 | 8,605 |
|
| TOTAL JAPAN | | | 122,273 |
|
| Korea (South) - 0.9% | | | |
| LG Household & Health Care Ltd. | | 1,675 | 1,389 |
| Medy-Tox, Inc. | | 3,602 | 1,536 |
| NAVER Corp. | | 6,321 | 3,322 |
|
| TOTAL KOREA (SOUTH) | | | 6,247 |
|
| Malta - 0.7% | | | |
| Kambi Group PLC (a) | | 228,400 | 1,504 |
| Unibet Group PLC unit | | 40,100 | 3,534 |
|
| TOTAL MALTA | | | 5,038 |
|
| Mauritius - 0.1% | | | |
| MakeMyTrip Ltd. (a) | | 55,400 | 884 |
| Netherlands - 0.8% | | | |
| AEGON NV | | 109,900 | 674 |
| ASML Holding NV | | 13,857 | 1,286 |
| ING Groep NV: | | | |
| (Certificaten Van Aandelen) | | 181,810 | 2,646 |
| sponsored ADR | | 59,300 | 858 |
|
| TOTAL NETHERLANDS | | | 5,464 |
|
| New Zealand - 0.3% | | | |
| EBOS Group Ltd. | | 99,154 | 916 |
| Ryman Healthcare Group Ltd. | | 237,031 | 1,266 |
|
| TOTAL NEW ZEALAND | | | 2,182 |
|
| Norway - 1.3% | | | |
| Schibsted ASA: | | | |
| (A Shares) | | 78,500 | 2,633 |
| (B Shares) (a) | | 78,500 | 2,448 |
| Statoil ASA sponsored ADR (b) | | 224,000 | 3,620 |
|
| TOTAL NORWAY | | | 8,701 |
|
| Philippines - 0.1% | | | |
| Melco Crown Philippines Resort (a) | | 7,218,600 | 567 |
| South Africa - 1.7% | | | |
| Distell Group Ltd. | | 50,004 | 644 |
| Naspers Ltd. Class N | | 73,400 | 10,751 |
|
| TOTAL SOUTH AFRICA | | | 11,395 |
|
| Spain - 1.9% | | | |
| Atresmedia Corporacion de Medios de Comunicacion SA | | 293,000 | 3,760 |
| Banco Bilbao Vizcaya Argentaria SA | | 118,084 | 1,016 |
| Banco Santander SA: | | | |
| rights 11/3/15 | | 182,829 | 10 |
| (Spain) | | 182,829 | 1,021 |
| Mediaset Espana Comunicacion SA | | 279,417 | 3,397 |
| Melia Hotels International SA (b) | | 265,600 | 3,844 |
|
| TOTAL SPAIN | | | 13,048 |
|
| Sweden - 1.5% | | | |
| Arcam AB (a) | | 25,600 | 481 |
| Getinge AB (B Shares) | | 99,300 | 2,486 |
| Nordea Bank AB | | 187,800 | 2,077 |
| Svenska Cellulosa AB (SCA) (B Shares) | | 145,100 | 4,274 |
| Swedbank AB (A Shares) | | 51,612 | 1,185 |
|
| TOTAL SWEDEN | | | 10,503 |
|
| Switzerland - 6.1% | | | |
| Compagnie Financiere Richemont SA Series A | | 56,683 | 4,860 |
| Credit Suisse Group AG | | 153,908 | 3,839 |
| Nestle SA | | 213,520 | 16,306 |
| Roche Holding AG (participation certificate) | | 12,818 | 3,480 |
| Syngenta AG (Switzerland) | | 20,768 | 6,977 |
| UBS Group AG | | 208,359 | 4,169 |
| UBS Group AG | | 79,777 | 1,598 |
|
| TOTAL SWITZERLAND | | | 41,229 |
|
| United Kingdom - 22.9% | | | |
| Amec Foster Wheeler PLC | | 172,960 | 1,896 |
| AstraZeneca PLC (United Kingdom) | | 98,550 | 6,281 |
| Aviva PLC | | 184,200 | 1,377 |
| B&M European Value Retail S.A. | | 566,690 | 2,913 |
| Barclays PLC | | 1,310,549 | 4,669 |
| Barclays PLC sponsored ADR | | 53,073 | 755 |
| BG Group PLC | | 111,318 | 1,759 |
| BHP Billiton PLC | | 88,741 | 1,418 |
| BP PLC | | 322,200 | 1,915 |
| BP PLC sponsored ADR | | 49,166 | 1,755 |
| Brammer PLC (b) | | 234,232 | 831 |
| Burberry Group PLC | | 59,600 | 1,220 |
| Dechra Pharmaceuticals PLC | | 73,200 | 1,094 |
| Diageo PLC | | 231,700 | 6,680 |
| Dunelm Group PLC | | 167,200 | 2,441 |
| Foxtons Group PLC | | 470,700 | 1,451 |
| Howden Joinery Group PLC | | 1,740,900 | 12,442 |
| HSBC Holdings PLC: | | | |
| (United Kingdom) | | 150,500 | 1,176 |
| sponsored ADR | | 140,191 | 5,477 |
| ITV PLC | | 1,909,400 | 7,429 |
| Johnson Matthey PLC | | 82,919 | 3,304 |
| JUST EAT Ltd. (a) | | 361,914 | 2,377 |
| LivaNova PLC (a) | | 19,842 | 1,315 |
| Lloyds Banking Group PLC | | 6,238,299 | 7,081 |
| M&C Saatchi PLC | | 887,505 | 4,491 |
| Micro Focus International PLC | | 20,400 | 395 |
| Moneysupermarket.com Group PLC | | 565,100 | 2,911 |
| Nahl Group PCL | | 106,110 | 671 |
| Poundland Group PLC | | 167,361 | 710 |
| Prudential PLC | | 85,416 | 1,995 |
| Rightmove PLC | | 136,700 | 8,090 |
| Rio Tinto PLC | | 38,132 | 1,390 |
| Rolls-Royce Group PLC | | 196,674 | 2,080 |
| Royal Bank of Scotland Group PLC (a) | | 120,080 | 587 |
| Royal Dutch Shell PLC: | | | |
| Class A (United Kingdom) | | 233,928 | 6,107 |
| Class B (United Kingdom) | | 156,090 | 4,087 |
| SABMiller PLC | | 133,700 | 8,234 |
| Shawbrook Group Ltd. | | 409,600 | 2,142 |
| Sports Direct International PLC (a) | | 234,300 | 2,518 |
| SThree PLC | | 190,600 | 1,058 |
| Taylor Wimpey PLC | | 715,100 | 2,183 |
| Ted Baker PLC | | 57,800 | 2,697 |
| Tesco PLC | | 824,300 | 2,325 |
| Thomas Cook Group PLC (a) | | 489,700 | 928 |
| Travis Perkins PLC | | 81,800 | 2,416 |
| Virgin Money Holdings Uk PLC | | 622,500 | 3,722 |
| Vodafone Group PLC | | 2,915,800 | 9,596 |
| William Hill PLC | | 638,566 | 3,116 |
| Zoopla Property Group PLC (b) | | 629,300 | 2,355 |
|
| TOTAL UNITED KINGDOM | | | 155,860 |
|
| United States of America - 9.5% | | | |
| Alphabet, Inc.: | | | |
| Class A (a) | | 7,400 | 5,457 |
| Class C | | 4,014 | 2,853 |
| BlackRock, Inc. Class A | | 15,200 | 5,350 |
| China Biologic Products, Inc. (a) | | 12,300 | 1,401 |
| Chipotle Mexican Grill, Inc. (a) | | 2,700 | 1,729 |
| Dunkin' Brands Group, Inc. (b) | | 41,100 | 1,702 |
| eBay, Inc. (a) | | 44,700 | 1,247 |
| Facebook, Inc. Class A (a) | | 58,700 | 5,986 |
| Monsanto Co. | | 26,700 | 2,489 |
| Monster Beverage Corp. (a) | | 26,200 | 3,572 |
| PayPal Holdings, Inc. (a) | | 59,900 | 2,157 |
| Priceline Group, Inc. (a) | | 5,700 | 8,289 |
| Sprouts Farmers Market LLC (a) | | 181,700 | 3,703 |
| Tiffany & Co., Inc. | | 43,000 | 3,545 |
| TripAdvisor, Inc. (a) | | 17,900 | 1,500 |
| Visa, Inc. Class A | | 112,500 | 8,728 |
| World Wrestling Entertainment, Inc. Class A (b) | | 135,200 | 2,411 |
| Zillow Group, Inc. (a)(b) | | 36,400 | 1,121 |
| Zillow Group, Inc. Class C (a)(b) | | 52,000 | 1,440 |
|
| TOTAL UNITED STATES OF AMERICA | | | 64,680 |
|
| TOTAL COMMON STOCKS | | | |
| (Cost $604,390) | | | 672,249 |
|
| Nonconvertible Preferred Stocks - 0.8% | | | |
| Germany - 0.8% | | | |
| Sartorius AG (non-vtg.) | | 16,700 | 3,779 |
| Volkswagen AG | | 17,100 | 2,053 |
|
| TOTAL GERMANY | | | 5,832 |
|
| United Kingdom - 0.0% | | | |
| Rolls-Royce Group PLC | | 18,231,679 | 28 |
| TOTAL NONCONVERTIBLE PREFERRED STOCKS | | | |
| (Cost $5,373) | | | 5,860 |
|
| Money Market Funds - 4.8% | | | |
| Fidelity Cash Central Fund, 0.18% (c) | | 8,502,973 | 8,503 |
| Fidelity Securities Lending Cash Central Fund, 0.19% (c)(d) | | 24,107,293 | 24,107 |
| TOTAL MONEY MARKET FUNDS | | | |
| (Cost $32,610) | | | 32,610 |
| TOTAL INVESTMENT PORTFOLIO - 104.2% | | | |
| (Cost $642,373) | | | 710,719 |
| NET OTHER ASSETS (LIABILITIES) - (4.2)% | | | (28,836) |
| NET ASSETS - 100% | | | $681,883 |
Categorizations in the Schedule of Investments are based on country or territory of incorporation.
Legend
(a) Non-income producing
(b) Security or a portion of the security is on loan at period end.
(c) Affiliated fund that is generally available only to investment companies and other accounts managed by Fidelity Investments. The rate quoted is the annualized seven-day yield of the fund at period end. A complete unaudited listing of the fund's holdings as of its most recent quarter end is available upon request. In addition, each Fidelity Central Fund's financial statements, which are not covered by the Fund's Report of Independent Registered Public Accounting Firm, are available on the SEC's website or upon request.
(d) Investment made with cash collateral received from securities on loan.
Affiliated Central Funds
Information regarding fiscal year to date income earned by the Fund from investments in Fidelity Central Funds is as follows:
| Fund | Income earned |
| | (Amounts in thousands) |
| Fidelity Cash Central Fund | $12 |
| Fidelity Securities Lending Cash Central Fund | 347 |
| Total | $359 |
Investment Valuation
The following is a summary of the inputs used, as of October 31, 2015, involving the Fund's assets and liabilities carried at fair value. The inputs or methodology used for valuing securities may not be an indication of the risk associated with investing in those securities. For more information on valuation inputs, and their aggregation into the levels used below, please refer to the Investment Valuation section in the accompanying Notes to Financial Statements.
| | Valuation Inputs at Reporting Date: |
| Description | Total | Level 1 | Level 2 | Level 3 |
| (Amounts in thousands) | | | | |
| Investments in Securities: | | | | |
| Equities: | | | | |
| Consumer Discretionary | $199,175 | $137,849 | $61,326 | $-- |
| Consumer Staples | 71,622 | 24,118 | 47,504 | -- |
| Energy | 31,096 | 7,998 | 23,098 | -- |
| Financials | 114,351 | 55,941 | 58,410 | -- |
| Health Care | 92,302 | 46,483 | 45,819 | -- |
| Industrials | 44,274 | 12,222 | 32,052 | -- |
| Information Technology | 87,534 | 65,769 | 21,765 | -- |
| Materials | 18,756 | 6,570 | 12,186 | -- |
| Telecommunication Services | 18,999 | 1,297 | 17,702 | -- |
| Money Market Funds | 32,610 | 32,610 | -- | -- |
| Total Investments in Securities: | $710,719 | $390,857 | $319,862 | $-- |
The following is a summary of transfers between Level 1 and Level 2 for the period ended October 31, 2015. Transfers are assumed to have occurred at the beginning of the period, and are primarily attributable to the valuation techniques used for foreign equity securities, as discussed in the accompanying Notes to Financial Statements:
| Transfers | Total (000s) |
| Level 1 to Level 2 | $29,875 |
| Level 2 to Level 1 | $8,917 |
See accompanying notes which are an integral part of the financial statements.
Financial Statements
Statement of Assets and Liabilities
| Amounts in thousands (except per-share amounts) | | October 31, 2015 |
| Assets | | |
Investment in securities, at value (including securities loaned of $23,703) — See accompanying schedule:
Unaffiliated issuers (cost $609,763) | $678,109 | |
| Fidelity Central Funds (cost $32,610) | 32,610 | |
| Total Investments (cost $642,373) | | $710,719 |
| Receivable for investments sold | | 2,821 |
| Receivable for fund shares sold | | 612 |
| Dividends receivable | | 2,081 |
| Distributions receivable from Fidelity Central Funds | | 37 |
| Prepaid expenses | | 2 |
| Other receivables | | 69 |
| Total assets | | 716,341 |
| Liabilities | | |
| Payable to custodian bank | $5 | |
| Payable for investments purchased | 2,689 | |
| Payable for fund shares redeemed | 6,828 | |
| Accrued management fee | 465 | |
| Distribution and service plan fees payable | 151 | |
| Other affiliated payables | 137 | |
| Other payables and accrued expenses | 76 | |
| Collateral on securities loaned, at value | 24,107 | |
| Total liabilities | | 34,458 |
| Net Assets | | $681,883 |
| Net Assets consist of: | | |
| Paid in capital | | $638,469 |
| Undistributed net investment income | | 2,334 |
| Accumulated undistributed net realized gain (loss) on investments and foreign currency transactions | | (27,174) |
| Net unrealized appreciation (depreciation) on investments and assets and liabilities in foreign currencies | | 68,254 |
| Net Assets | | $681,883 |
| Calculation of Maximum Offering Price | | |
| Class A: | | |
| Net Asset Value and redemption price per share ($78,401 ÷ 3,631.68 shares) | | $21.59 |
| Maximum offering price per share (100/94.25 of $21.59) | | $22.91 |
| Class T: | | |
| Net Asset Value and redemption price per share ($285,258 ÷ 12,902.54 shares) | | $22.11 |
| Maximum offering price per share (100/96.50 of $22.11) | | $22.91 |
| Class B: | | |
| Net Asset Value and offering price per share ($1,633 ÷ 78.54 shares)(a) | | $20.79 |
| Class C: | | |
| Net Asset Value and offering price per share ($18,734 ÷ 893.14 shares)(a) | | $20.98 |
| Class I: | | |
| Net Asset Value, offering price and redemption price per share ($297,857 ÷ 13,503.03 shares) | | $22.06 |
(a) Redemption price per share is equal to net asset value less any applicable contingent deferred sales charge.
See accompanying notes which are an integral part of the financial statements.
Statement of Operations
| Amounts in thousands | | Year ended October 31, 2015 |
| Investment Income | | |
| Dividends | | $16,383 |
| Income from Fidelity Central Funds | | 359 |
| Income before foreign taxes withheld | | 16,742 |
| Less foreign taxes withheld | | (998) |
| Total income | | 15,744 |
| Expenses | | |
| Management fee | | |
| Basic fee | $4,736 | |
| Performance adjustment | 616 | |
| Transfer agent fees | 1,383 | |
| Distribution and service plan fees | 1,838 | |
| Accounting and security lending fees | 347 | |
| Custodian fees and expenses | 111 | |
| Independent trustees' compensation | 3 | |
| Registration fees | 68 | |
| Audit | 106 | |
| Legal | 4 | |
| Miscellaneous | 16 | |
| Total expenses before reductions | 9,228 | |
| Expense reductions | (43) | 9,185 |
| Net investment income (loss) | | 6,559 |
| Realized and Unrealized Gain (Loss) | | |
| Net realized gain (loss) on: | | |
| Investment securities: | | |
| Unaffiliated issuers | 26,041 | |
| Foreign currency transactions | (250) | |
| Total net realized gain (loss) | | 25,791 |
Change in net unrealized appreciation (depreciation) on:
Investment securities | (15,386) | |
| Assets and liabilities in foreign currencies | (4) | |
| Total change in net unrealized appreciation (depreciation) | | (15,390) |
| Net gain (loss) | | 10,401 |
| Net increase (decrease) in net assets resulting from operations | | $16,960 |
See accompanying notes which are an integral part of the financial statements.
Statement of Changes in Net Assets
| Amounts in thousands | Year ended October 31, 2015 | Year ended October 31, 2014 |
| Increase (Decrease) in Net Assets | | |
| Operations | | |
| Net investment income (loss) | $6,559 | $8,670 |
| Net realized gain (loss) | 25,791 | 57,938 |
| Change in net unrealized appreciation (depreciation) | (15,390) | (75,525) |
| Net increase (decrease) in net assets resulting from operations | 16,960 | (8,917) |
| Distributions to shareholders from net investment income | (1,529) | (6,228) |
| Distributions to shareholders from net realized gain | – | (2,640) |
| Total distributions | (1,529) | (8,868) |
| Share transactions - net increase (decrease) | (42,896) | (1,301) |
| Redemption fees | 9 | 19 |
| Total increase (decrease) in net assets | (27,456) | (19,067) |
| Net Assets | | |
| Beginning of period | 709,339 | 728,406 |
| End of period (including undistributed net investment income of $2,334 and undistributed net investment income of $1,479, respectively) | $681,883 | $709,339 |
See accompanying notes which are an integral part of the financial statements.
Financial Highlights — Fidelity Advisor Overseas Fund Class A
| | | October 31, | | | |
| Years ended October 31, | 2015 | 2014 | 2013 | 2012 | 2011 |
| Selected Per–Share Data | | | | | |
| Net asset value, beginning of period | $21.09 | $21.61 | $16.76 | $16.13 | $17.77 |
| Income from Investment Operations | | | | | |
| Net investment income (loss)A | .19 | .24 | .17 | .23 | .16 |
| Net realized and unrealized gain (loss) | .33 | (.50) | 4.97 | .64 | (1.54) |
| Total from investment operations | .52 | (.26) | 5.14 | .87 | (1.38) |
| Distributions from net investment income | (.02) | (.18) | (.25) | (.24) | (.21) |
| Distributions from net realized gain | – | (.08) | (.04) | – | (.05) |
| Total distributions | (.02) | (.26) | (.29) | (.24) | (.26) |
| Redemption fees added to paid in capitalA,B | – | – | – | – | – |
| Net asset value, end of period | $21.59 | $21.09 | $21.61 | $16.76 | $16.13 |
| Total ReturnC,D | 2.46% | (1.24)% | 31.13% | 5.51% | (7.95)% |
| Ratios to Average Net AssetsE,F | | | | | |
| Expenses before reductions | 1.35% | 1.30% | 1.37% | 1.33% | 1.34% |
| Expenses net of fee waivers, if any | 1.35% | 1.30% | 1.37% | 1.33% | 1.34% |
| Expenses net of all reductions | 1.34% | 1.30% | 1.36% | 1.32% | 1.32% |
| Net investment income (loss) | .89% | 1.10% | .91% | 1.43% | .90% |
| Supplemental Data | | | | | |
| Net assets, end of period (in millions) | $78 | $65 | $69 | $60 | $60 |
| Portfolio turnover rateG | 29% | 39% | 37% | 36% | 44% |
A Calculated based on average shares outstanding during the period.
B Amount represents less than $.005 per share.
C Total returns would have been lower if certain expenses had not been reduced during the applicable periods shown.
D Total returns do not include the effect of the sales charges.
E Fees and expenses of any underlying Fidelity Central Funds are not included in the Fund's expense ratio. The Fund indirectly bears its proportionate share of the expenses of any underlying Fidelity Central Funds.
F Expense ratios reflect operating expenses of the class. Expenses before reductions do not reflect amounts reimbursed by the investment adviser or reductions from brokerage service arrangements or reductions from other expense offset arrangements and do not represent the amount paid by the class during periods when reimbursements or reductions occur. Expenses net of fee waivers reflect expenses after reimbursement by the investment adviser but prior to reductions from brokerage service arrangements or other expense offset arrangements. Expenses net of all reductions represent the net expenses paid by the class.
G Amount does not include the portfolio activity of any underlying Fidelity Central Funds.
See accompanying notes which are an integral part of the financial statements.
Financial Highlights — Fidelity Advisor Overseas Fund Class T
| | | October 31, | | | |
| Years ended October 31, | 2015 | 2014 | 2013 | 2012 | 2011 |
| Selected Per–Share Data | | | | | |
| Net asset value, beginning of period | $21.62 | $22.16 | $17.16 | $16.50 | $18.18 |
| Income from Investment Operations | | | | | |
| Net investment income (loss)A | .15 | .21 | .14 | .20 | .13 |
| Net realized and unrealized gain (loss) | .34 | (.52) | 5.11 | .66 | (1.59) |
| Total from investment operations | .49 | (.31) | 5.25 | .86 | (1.46) |
| Distributions from net investment income | – | (.15) | (.21) | (.20) | (.17) |
| Distributions from net realized gain | – | (.08) | (.04) | – | (.05) |
| Total distributions | – | (.23) | (.25) | (.20) | (.22) |
| Redemption fees added to paid in capitalA,B | – | – | – | – | – |
| Net asset value, end of period | $22.11 | $21.62 | $22.16 | $17.16 | $16.50 |
| Total ReturnC,D | 2.27% | (1.42)% | 30.96% | 5.32% | (8.17)% |
| Ratios to Average Net AssetsE,F | | | | | |
| Expenses before reductions | 1.55% | 1.48% | 1.53% | 1.51% | 1.52% |
| Expenses net of fee waivers, if any | 1.55% | 1.48% | 1.53% | 1.51% | 1.51% |
| Expenses net of all reductions | 1.55% | 1.48% | 1.52% | 1.50% | 1.49% |
| Net investment income (loss) | .69% | .92% | .74% | 1.25% | .73% |
| Supplemental Data | | | | | |
| Net assets, end of period (in millions) | $285 | $293 | $329 | $271 | $305 |
| Portfolio turnover rateG | 29% | 39% | 37% | 36% | 44% |
A Calculated based on average shares outstanding during the period.
B Amount represents less than $.005 per share.
C Total returns would have been lower if certain expenses had not been reduced during the applicable periods shown.
D Total returns do not include the effect of the sales charges.
E Fees and expenses of any underlying Fidelity Central Funds are not included in the Fund's expense ratio. The Fund indirectly bears its proportionate share of the expenses of any underlying Fidelity Central Funds.
F Expense ratios reflect operating expenses of the class. Expenses before reductions do not reflect amounts reimbursed by the investment adviser or reductions from brokerage service arrangements or reductions from other expense offset arrangements and do not represent the amount paid by the class during periods when reimbursements or reductions occur. Expenses net of fee waivers reflect expenses after reimbursement by the investment adviser but prior to reductions from brokerage service arrangements or other expense offset arrangements. Expenses net of all reductions represent the net expenses paid by the class.
G Amount does not include the portfolio activity of any underlying Fidelity Central Funds.
See accompanying notes which are an integral part of the financial statements.
Financial Highlights — Fidelity Advisor Overseas Fund Class B
| | | October 31, | | | |
| Years ended October 31, | 2015 | 2014 | 2013 | 2012 | 2011 |
| Selected Per–Share Data | | | | | |
| Net asset value, beginning of period | $20.46 | $21.02 | $16.25 | $15.58 | $17.18 |
| Income from Investment Operations | | | | | |
| Net investment income (loss)A | .02 | .07 | .03 | .10 | .03 |
| Net realized and unrealized gain (loss) | .31 | (.49) | 4.85 | .63 | (1.51) |
| Total from investment operations | .33 | (.42) | 4.88 | .73 | (1.48) |
| Distributions from net investment income | – | (.06) | (.07) | (.06) | (.08) |
| Distributions from net realized gain | – | (.08) | (.04) | – | (.05) |
| Total distributions | – | (.14) | (.11) | (.06) | (.12)B |
| Redemption fees added to paid in capitalA,C | – | – | – | – | – |
| Net asset value, end of period | $20.79 | $20.46 | $21.02 | $16.25 | $15.58 |
| Total ReturnD,E | 1.61% | (2.03)% | 30.21% | 4.72% | (8.67)% |
| Ratios to Average Net AssetsF,G | | | | | |
| Expenses before reductions | 2.16% | 2.09% | 2.12% | 2.09% | 2.10% |
| Expenses net of fee waivers, if any | 2.15% | 2.09% | 2.12% | 2.09% | 2.09% |
| Expenses net of all reductions | 2.15% | 2.09% | 2.11% | 2.07% | 2.07% |
| Net investment income (loss) | .09% | .31% | .16% | .67% | .15% |
| Supplemental Data | | | | | |
| Net assets, end of period (in millions) | $2 | $2 | $3 | $3 | $4 |
| Portfolio turnover rateH | 29% | 39% | 37% | 36% | 44% |
A Calculated based on average shares outstanding during the period.
B Total distributions of $.12 per share is comprised of distributions from net investment income of $.079 and distributions from net realized gain of $.045 per share.
C Amount represents less than $.005 per share.
D Total returns would have been lower if certain expenses had not been reduced during the applicable periods shown.
E Total returns do not include the effect of the contingent deferred sales charge.
F Fees and expenses of any underlying Fidelity Central Funds are not included in the Fund's expense ratio. The Fund indirectly bears its proportionate share of the expenses of any underlying Fidelity Central Funds.
G Expense ratios reflect operating expenses of the class. Expenses before reductions do not reflect amounts reimbursed by the investment adviser or reductions from brokerage service arrangements or reductions from other expense offset arrangements and do not represent the amount paid by the class during periods when reimbursements or reductions occur. Expenses net of fee waivers reflect expenses after reimbursement by the investment adviser but prior to reductions from brokerage service arrangements or other expense offset arrangements. Expenses net of all reductions represent the net expenses paid by the class.
H Amount does not include the portfolio activity of any underlying Fidelity Central Funds.
See accompanying notes which are an integral part of the financial statements.
Financial Highlights — Fidelity Advisor Overseas Fund Class C
| | | October 31, | | | |
| Years ended October 31, | 2015 | 2014 | 2013 | 2012 | 2011 |
| Selected Per–Share Data | | | | | |
| Net asset value, beginning of period | $20.63 | $21.21 | $16.43 | $15.78 | $17.39 |
| Income from Investment Operations | | | | | |
| Net investment income (loss)A | .02 | .07 | .03 | .11 | .03 |
| Net realized and unrealized gain (loss) | .33 | (.50) | 4.89 | .64 | (1.52) |
| Total from investment operations | .35 | (.43) | 4.92 | .75 | (1.49) |
| Distributions from net investment income | – | (.07) | (.10) | (.10) | (.07) |
| Distributions from net realized gain | – | (.08) | (.04) | – | (.05) |
| Total distributions | – | (.15) | (.14) | (.10) | (.12) |
| Redemption fees added to paid in capitalA,B | – | – | – | – | – |
| Net asset value, end of period | $20.98 | $20.63 | $21.21 | $16.43 | $15.78 |
| Total ReturnC,D | 1.70% | (2.06)% | 30.16% | 4.78% | (8.67)% |
| Ratios to Average Net AssetsE,F | | | | | |
| Expenses before reductions | 2.15% | 2.08% | 2.12% | 2.09% | 2.09% |
| Expenses net of fee waivers, if any | 2.15% | 2.08% | 2.12% | 2.09% | 2.09% |
| Expenses net of all reductions | 2.14% | 2.08% | 2.10% | 2.07% | 2.07% |
| Net investment income (loss) | .09% | .32% | .16% | .67% | .15% |
| Supplemental Data | | | | | |
| Net assets, end of period (in millions) | $19 | $19 | $21 | $16 | $19 |
| Portfolio turnover rateG | 29% | 39% | 37% | 36% | 44% |
A Calculated based on average shares outstanding during the period.
B Amount represents less than $.005 per share.
C Total returns would have been lower if certain expenses had not been reduced during the applicable periods shown.
D Total returns do not include the effect of the contingent deferred sales charge.
E Fees and expenses of any underlying Fidelity Central Funds are not included in the Fund's expense ratio. The Fund indirectly bears its proportionate share of the expenses of any underlying Fidelity Central Funds.
F Expense ratios reflect operating expenses of the class. Expenses before reductions do not reflect amounts reimbursed by the investment adviser or reductions from brokerage service arrangements or reductions from other expense offset arrangements and do not represent the amount paid by the class during periods when reimbursements or reductions occur. Expenses net of fee waivers reflect expenses after reimbursement by the investment adviser but prior to reductions from brokerage service arrangements or other expense offset arrangements. Expenses net of all reductions represent the net expenses paid by the class.
G Amount does not include the portfolio activity of any underlying Fidelity Central Funds.
See accompanying notes which are an integral part of the financial statements.
Financial Highlights — Fidelity Advisor Overseas Fund Class I
| | | October 31, | | | |
| Years ended October 31, | 2015 | 2014 | 2013 | 2012 | 2011 |
| Selected Per–Share Data | | | | | |
| Net asset value, beginning of period | $21.55 | $22.07 | $17.11 | $16.45 | $18.10 |
| Income from Investment Operations | | | | | |
| Net investment income (loss)A | .27 | .32 | .24 | .29 | .23 |
| Net realized and unrealized gain (loss) | .34 | (.52) | 5.08�� | .65 | (1.59) |
| Total from investment operations | .61 | (.20) | 5.32 | .94 | (1.36) |
| Distributions from net investment income | (.10) | (.24) | (.31) | (.28) | (.24) |
| Distributions from net realized gain | – | (.08) | (.04) | – | (.05) |
| Total distributions | (.10) | (.32) | (.36)B | (.28) | (.29) |
| Redemption fees added to paid in capitalA,C | – | – | – | – | – |
| Net asset value, end of period | $22.06 | $21.55 | $22.07 | $17.11 | $16.45 |
| Total ReturnD | 2.82% | (.95)% | 31.63% | 5.91% | (7.70)% |
| Ratios to Average Net AssetsE,F | | | | | |
| Expenses before reductions | 1.03% | .96% | 1.02% | .99% | 1.00% |
| Expenses net of fee waivers, if any | 1.03% | .96% | 1.02% | .99% | .99% |
| Expenses net of all reductions | 1.02% | .96% | 1.01% | .97% | .97% |
| Net investment income (loss) | 1.21% | 1.44% | 1.26% | 1.77% | 1.25% |
| Supplemental Data | | | | | |
| Net assets, end of period (in millions) | $298 | $330 | $307 | $257 | $349 |
| Portfolio turnover rateG | 29% | 39% | 37% | 36% | 44% |
A Calculated based on average shares outstanding during the period.
B Total distributions of $.36 per share is comprised of distributions from net investment income of $.314 and distributions from net realized gain of $.041 per share.
C Amount represents less than $.005 per share.
D Total returns would have been lower if certain expenses had not been reduced during the applicable periods shown.
E Fees and expenses of any underlying Fidelity Central Funds are not included in the Fund's expense ratio. The Fund indirectly bears its proportionate share of the expenses of any underlying Fidelity Central Funds.
F Expense ratios reflect operating expenses of the class. Expenses before reductions do not reflect amounts reimbursed by the investment adviser or reductions from brokerage service arrangements or reductions from other expense offset arrangements and do not represent the amount paid by the class during periods when reimbursements or reductions occur. Expenses net of fee waivers reflect expenses after reimbursement by the investment adviser but prior to reductions from brokerage service arrangements or other expense offset arrangements. Expenses net of all reductions represent the net expenses paid by the class.
G Amount does not include the portfolio activity of any underlying Fidelity Central Funds.
See accompanying notes which are an integral part of the financial statements.
Notes to Financial Statements
For the period ended October 31, 2015
(Amounts in thousands except percentages)
1. Organization.
Fidelity Advisor Overseas Fund (the Fund) is a fund of Fidelity Advisor Series VIII (the Trust) and is authorized to issue an unlimited number of shares. The Trust is registered under the Investment Company Act of 1940, as amended (the 1940 Act), as an open-end management investment company organized as a Massachusetts business trust. The Fund offers Class A, Class T, Class C and Class I (formerly Institutional Class) shares, each of which, along with Class B shares, has equal rights as to assets and voting privileges. Class B shares are closed to new accounts and additional purchases, except for exchanges and reinvestments. Each class has exclusive voting rights with respect to matters that affect that class. Class B shares will automatically convert to Class A shares after a holding period of seven years from the initial date of purchase.
2. Investments in Fidelity Central Funds.
The Fund invests in Fidelity Central Funds, which are open-end investment companies generally available only to other investment companies and accounts managed by the investment adviser and its affiliates. The Fund's Schedule of Investments lists each of the Fidelity Central Funds held as of period end, if any, as an investment of the Fund, but does not include the underlying holdings of each Fidelity Central Fund. As an Investing Fund, the Fund indirectly bears its proportionate share of the expenses of the underlying Fidelity Central Funds.
The Money Market Central Funds seek preservation of capital and current income and are managed by Fidelity Investments Money Management, Inc. (FIMM), an affiliate of the investment adviser. Annualized expenses of the Money Market Central Funds as of their most recent shareholder report date are less than .005%.
A complete unaudited list of holdings for each Fidelity Central Fund is available upon request or at the Securities and Exchange Commission (the SEC) website at www.sec.gov. In addition, the financial statements of the Fidelity Central Funds, which are not covered by the Fund's Report of Independent Registered Public Accounting Firm, are available on the SEC website or upon request.
3. Significant Accounting Policies.
The financial statements have been prepared in conformity with accounting principles generally accepted in the United States of America (GAAP), which require management to make certain estimates and assumptions at the date of the financial statements. Actual results could differ from those estimates. Subsequent events, if any, through the date that the financial statements were issued have been evaluated in the preparation of the financial statements. The following summarizes the significant accounting policies of the Fund:
Investment Valuation. Investments are valued as of 4:00 p.m. Eastern time on the last calendar day of the period. The Board of Trustees (the Board) has delegated the day to day responsibility for the valuation of the Fund's investments to the Fidelity Management & Research Company (FMR) Fair Value Committee (the Committee). In accordance with valuation policies and procedures approved by the Board, the Fund attempts to obtain prices from one or more third party pricing vendors or brokers to value its investments. When current market prices, quotations or currency exchange rates are not readily available or reliable, investments will be fair valued in good faith by the Committee, in accordance with procedures adopted by the Board. Factors used in determining fair value vary by investment type and may include market or investment specific events. The frequency with which these procedures are used cannot be predicted and they may be utilized to a significant extent. The Committee oversees the Fund's valuation policies and procedures and reports to the Board on the Committee's activities and fair value determinations. The Board monitors the appropriateness of the procedures used in valuing the Fund's investments and ratifies the fair value determinations of the Committee.
The Fund categorizes the inputs to valuation techniques used to value its investments into a disclosure hierarchy consisting of three levels as shown below:
- Level 1 – quoted prices in active markets for identical investments
- Level 2 – other significant observable inputs (including quoted prices for similar investments, interest rates, prepayment speeds, etc.)
- Level 3 – unobservable inputs (including the Fund's own assumptions based on the best information available)
Valuation techniques used to value the Fund's investments by major category are as follows:
Equity securities, including restricted securities, for which market quotations are readily available, are valued at the last reported sale price or official closing price as reported by a third party pricing vendor on the primary market or exchange on which they are traded and are categorized as Level 1 in the hierarchy. In the event there were no sales during the day or closing prices are not available, securities are valued at the last quoted bid price or may be valued using the last available price and are generally categorized as Level 2 in the hierarchy. For foreign equity securities, when market or security specific events arise, comparisons to the valuation of American Depositary Receipts (ADRs), futures contracts, Exchange-Traded Funds (ETFs) and certain indexes as well as quoted prices for similar securities may be used and would be categorized as Level 2 in the hierarchy. Utilizing these techniques may result in transfers between Level 1 and Level 2. For equity securities, including restricted securities, where observable inputs are limited, assumptions about market activity and risk are used and these securities may be categorized as Level 3 in the hierarchy.
Investments in open-end mutual funds, including the Fidelity Central Funds, are valued at their closing net asset value (NAV) each business day and are categorized as Level 1 in the hierarchy.
Changes in valuation techniques may result in transfers in or out of an assigned level within the disclosure hierarchy. The aggregate value of investments by input level, as of October 31, 2015, including information on transfers between Levels 1 and 2, is included at the end of the Fund's Schedule of Investments.
Foreign Currency. The Fund may use foreign currency contracts to facilitate transactions in foreign-denominated securities. Gains and losses from these transactions may arise from changes in the value of the foreign currency or if the counterparties do not perform under the contracts' terms.
Foreign-denominated assets, including investment securities, and liabilities are translated into U.S. dollars at the exchange rates at period end. Purchases and sales of investment securities, income and dividends received and expenses denominated in foreign currencies are translated into U.S. dollars at the exchange rate in effect on the transaction date.
The effects of exchange rate fluctuations on investments are included with the net realized and unrealized gain (loss) on investment securities. Other foreign currency transactions resulting in realized and unrealized gain (loss) are disclosed separately.
Investment Transactions and Income. For financial reporting purposes, the Fund's investment holdings and NAV include trades executed through the end of the last business day of the period. The NAV per share for processing shareholder transactions is calculated as of the close of business of the New York Stock Exchange (NYSE), normally 4:00 p.m. Eastern time and includes trades executed through the end of the prior business day. Gains and losses on securities sold are determined on the basis of identified cost and may include proceeds received from litigation. Dividend income is recorded on the ex-dividend date, except for certain dividends from foreign securities where the ex-dividend date may have passed, which are recorded as soon as the Fund is informed of the ex-dividend date. Non-cash dividends included in dividend income, if any, are recorded at the fair market value of the securities received. Income and capital gain distributions from Fidelity Central Funds, if any, are recorded on the ex-dividend date. Investment income is recorded net of foreign taxes withheld where recovery of such taxes is uncertain.
Class Allocations and Expenses. Investment income, realized and unrealized capital gains and losses, common expenses of the Fund, and certain fund-level expense reductions, if any, are allocated daily on a pro-rata basis to each class based on the relative net assets of each class to the total net assets of the Fund. Each class differs with respect to transfer agent and distribution and service plan fees incurred. Certain expense reductions may also differ by class. For the reporting period, the allocated portion of income and expenses to each class as a percent of its average net assets may vary due to the timing of recording these transactions in relation to fluctuating net assets of the classes. Expenses directly attributable to a fund are charged to that fund. Expenses attributable to more than one fund are allocated among the respective funds on the basis of relative net assets or other appropriate methods. Expense estimates are accrued in the period to which they relate and adjustments are made when actual amounts are known.
Income Tax Information and Distributions to Shareholders. Each year, the Fund intends to qualify as a regulated investment company under Subchapter M of the Internal Revenue Code, including distributing substantially all of its taxable income and realized gains. As a result, no provision for U.S. Federal income taxes is required. As of October 31, 2015, the Fund did not have any unrecognized tax benefits in the financial statements; nor is the Fund aware of any tax positions for which it is reasonably possible that the total amounts of unrecognized tax benefits will significantly change in the next twelve months. The Fund files a U.S. federal tax return, in addition to state and local tax returns as required. The Fund's federal income tax returns are subject to examination by the Internal Revenue Service (IRS) for a period of three fiscal years after they are filed. State and local tax returns may be subject to examination for an additional fiscal year depending on the jurisdiction. Foreign taxes are provided for based on the Fund's understanding of the tax rules and rates that exist in the foreign markets in which it invests.
Distributions are declared and recorded on the ex-dividend date. Income dividends and capital gain distributions are declared separately for each class. Income and capital gain distributions are determined in accordance with income tax regulations, which may differ from GAAP. In addition, the Fund claimed a portion of the payment made to redeeming shareholders as a distribution for income tax purposes.
Capital accounts within the financial statements are adjusted for permanent book-tax differences. These adjustments have no impact on net assets or the results of operations. Capital accounts are not adjusted for temporary book-tax differences which will reverse in a subsequent period.
Book-tax differences are primarily due to foreign currency transactions, passive foreign investment companies (PFIC), deferred trustees compensation, capital loss carryforwards and losses deferred due to wash sales.
The federal tax cost of investment securities and unrealized appreciation (depreciation) as of period end were as follows:
| Gross unrealized appreciation | $127,077 |
| Gross unrealized depreciation | (69,164) |
| Net unrealized appreciation (depreciation) on securities | $57,913 |
| Tax Cost | $652,806 |
The tax-based components of distributable earnings as of period end were as follows:
| Undistributed ordinary income | $2,332 |
| Capital loss carryforward | $(16,742) |
| Net unrealized appreciation (depreciation) on securities and other investments | $57,821 |
Capital loss carryforwards are only available to offset future capital gains of the Fund to the extent provided by regulations and may be limited. Under the Regulated Investment Company Modernization Act of 2010 (the Act), the Fund is permitted to carry forward capital losses incurred in taxable years beginning after December 22, 2010 for an unlimited period and such capital losses are required to be used prior to any losses that expire. The capital loss carryforward information presented below, including any applicable limitation, is estimated as of fiscal period end and is subject to adjustment.
| Fiscal year of expiration | |
The tax character of distributions paid was as follows:
| | October 31, 2015 | October 31, 2014 |
| Ordinary Income | $1,529 | $ 8,868 |
Short-Term Trading (Redemption) Fees. Shares held by investors in the Fund less than 30 days may have been subject to a redemption fee equal to 1.00% of the NAV of shares redeemed. All redemption fees, which reduce the proceeds of the shareholder redemption, are retained by the Fund and accounted for as an addition to paid in capital.
4. Purchases and Sales of Investments.
Purchases and sales of securities, other than short-term securities, aggregated $198,751 and $234,991, respectively.
5. Fees and Other Transactions with Affiliates.
Management Fee. Fidelity Management & Research Company (the investment adviser) and its affiliates provide the Fund with investment management related services for which the Fund pays a monthly management fee. The management fee is the sum of an individual fund fee rate that is based on an annual rate of .424% of the Fund's average net assets and an annualized group fee rate that averaged .25% during the period. The group fee rate is based upon the average net assets of all the mutual funds advised by the investment adviser, including any mutual funds previously advised by the investment adviser that are currently advised by Fidelity SelectCo, LLC, an affiliate of the investment adviser. The group fee rate decreases as assets under management increase and increases as assets under management decrease. In addition, the management fee is subject to a performance adjustment (up to a maximum of +/- .20% of the Fund's average net assets over a 36 month performance period). The upward or downward adjustment to the management fee is based on the investment performance of the asset-weighted return of all classes as compared to its benchmark index, the MSCI EAFE Index, over the same 36 month performance period. For the reporting period, the total annual management fee rate, including the performance adjustment, was .76% of the Fund's average net assets. The performance adjustment included in the management fee rate may be higher or lower than the maximum performance adjustment rate due to the difference between the average net assets for the reporting and performance periods.
Distribution and Service Plan Fees. In accordance with Rule 12b-1 of the 1940 Act, the Fund has adopted separate Distribution and Service Plans for each class of shares. Certain classes pay Fidelity Distributors Corporation (FDC), an affiliate of the investment adviser, separate Distribution and Service Fees, each of which is based on an annual percentage of each class' average net assets. In addition, FDC may pay financial intermediaries for selling shares of the Fund and providing shareholder support services. For the period, the Distribution and Service Fee rates, total fees and amounts retained by FDC were as follows:
| | Distribution
Fee | Service
Fee | Total Fees | Retained
by FDC |
| Class A | -% | .25% | $177 | $1 |
| Class T | .25% | .25% | 1,453 | 3 |
| Class B | .75% | .25% | 19 | 14 |
| Class C | .75% | .25% | 189 | 15 |
| | | | $1,838 | $33 |
Sales Load. FDC may receive a front-end sales charge of up to 5.75% for selling Class A shares and 3.50% for selling Class T shares, some of which is paid to financial intermediaries for selling shares of the Fund. Depending on the holding period, FDC may receive contingent deferred sales charges levied on Class A, Class T, Class B, and Class C redemptions. The deferred sales charges range from 5.00% to 1.00% for Class B shares, 1.00% for Class C shares, 1.00% for certain purchases of Class A shares and .25% for certain purchases of Class T shares.
For the period, sales charge amounts retained by FDC were as follows:
| | Retained
by FDC |
| Class A | $8 |
| Class T | 4 |
| Class B(a) | 2 |
| Class C(a) | 2 |
| | $16 |
(a) When Class B and Class C shares are initially sold, FDC pays commissions from its own resources to financial intermediaries through which the sales are made.
Transfer Agent Fees. Fidelity Investments Institutional Operations Company, Inc., (FIIOC), an affiliate of the investment adviser, is the transfer, dividend disbursing and shareholder servicing agent for each class of the Fund. FIIOC receives account fees and asset-based fees that vary according to the account size and type of account of the shareholders of the respective classes of the Fund. FIIOC pays for typesetting, printing and mailing of shareholder reports, except proxy statements.
For the period, transfer agent fees for each class were as follows:
| | Amount | % of
Class-Level Average
Net Assets |
| Class A | $175 | .25 |
| Class T | 579 | .20 |
| Class B | 6 | .30 |
| Class C | 56 | .30 |
| Class I | 567 | .18 |
| | $ 1,383 | |
Accounting and Security Lending Fees. Fidelity Service Company, Inc. (FSC), an affiliate of the investment adviser, maintains the Fund's accounting records. The accounting fee is based on the level of average net assets for each month. Under a separate contract, FSC administers the security lending program. The security lending fee is based on the number and duration of lending transactions.
Brokerage Commissions. The Fund placed a portion of its portfolio transactions with brokerage firms which are affiliates of the investment adviser. Brokerage commissions are included in net realized gain (loss) and change in net unrealized appreciation (depreciation) in the Statement of Operations. The commissions paid to these affiliated firms were $1 for the period.
6. Committed Line of Credit.
The Fund participates with other funds managed by the investment adviser or an affiliate in a $4.25 billion credit facility (the "line of credit") to be utilized for temporary or emergency purposes to fund shareholder redemptions or for other short-term liquidity purposes. The Fund has agreed to pay commitment fees on its pro-rata portion of the line of credit, which amounted to $1 and is reflected in Miscellaneous expenses on the Statement of Operations. During the period, the Fund did not borrow on this line of credit.
7. Security Lending.
The Fund lends portfolio securities through a lending agent from time to time in order to earn additional income. For equity securities, a lending agent is used and may loan securities to certain qualified borrowers, including Fidelity Capital Markets (FCM), a broker-dealer affiliated with the Fund. On the settlement date of the loan, the Fund receives collateral (in the form of U.S. Treasury obligations, letters of credit and/or cash) against the loaned securities and maintains collateral in an amount not less than 100% of the market value of the loaned securities during the period of the loan. The market value of the loaned securities is determined at the close of business of the Fund and any additional required collateral is delivered to the Fund on the next business day. The Fund or borrower may terminate the loan at any time, and if the borrower defaults on its obligation to return the securities loaned because of insolvency or other reasons, the Fund may apply collateral received from the borrower against the obligation. The Fund may experience delays and costs in recovering the securities loaned. Any cash collateral received is invested in the Fidelity Securities Lending Cash Central Fund. The value of loaned securities and cash collateral at period end are disclosed on the Fund's Statement of Assets and Liabilities. The value of securities loaned to FCM at period end was $19. Security lending income represents the income earned on investing cash collateral, less rebates paid to borrowers and any lending agent fees associated with the loan, plus any premium payments received for lending certain types of securities. Security lending income is presented in the Statement of Operations as a component of income from Fidelity Central Funds. Total security lending income during the period amounted to $347, including $6 from securities loaned to FCM.
8. Expense Reductions.
Commissions paid to certain brokers with whom the investment adviser, or its affiliates, places trades on behalf of the Fund include an amount in addition to trade execution, which may be rebated back to the Fund to offset certain expenses. This amount totaled $25 for the period
In addition, during the period the investment adviser reimbursed and/or waived a portion of fund-level operating expenses in the amount of $3 and a portion of class-level operating expenses as follows:
| | Amount |
| Class A | $1 |
| Class T | 7 |
| Class B | –(a) |
| Class C | –(a) |
| Class I | 7 |
| | $15 |
(a) In the amount of less than five hundred dollars.
9. Distributions to Shareholders.
Distributions to shareholders of each class were as follows:
| Years ended October 31, | 2015 | 2014 |
| From net investment income | | |
| Class A | $59 | $576 |
| Class T | – | 2,245 |
| Class B | – | 8 |
| Class C | – | 65 |
| Class I | 1,470 | 3,334 |
| Total | $1,529 | $6,228 |
| From net realized gain | | |
| Class A | $– | $256 |
| Class T | – | 1,182 |
| Class B | – | 11 |
| Class C | – | 75 |
| Class I | – | 1,116 |
| Total | $– | $2,640 |
10. Share Transactions.
Share transactions for each class were as follows and may contain automatic conversions between classes or exchanges between funds:
| | Shares | Shares | Dollars | Dollars |
| Years ended October 31, | 2015 | 2014 | 2015 | 2014 |
| Class A | | | | |
| Shares sold | 1,338 | 618 | $29,635 | $13,534 |
| Reinvestment of distributions | 3 | 36 | 56 | 778 |
| Shares redeemed | (804) | (735) | (17,607) | (16,018) |
| Net increase (decrease) | 537 | (81) | $12,084 | $(1,706) |
| Class T | | | | |
| Shares sold | 2,579 | 2,184 | $57,864 | $48,970 |
| Reinvestment of distributions | – | 150 | – | 3,346 |
| Shares redeemed | (3,247) | (3,597) | (71,824) | (80,489) |
| Net increase (decrease) | (668) | (1,263) | $(13,960) | $(28,173) |
| Class B | | | | |
| Shares sold | 32 | 6 | $692 | $128 |
| Reinvestment of distributions | – | 1 | – | 17 |
| Shares redeemed | (54) | (46) | (1,123) | (989) |
| Net increase (decrease) | (22) | (39) | $(431) | $(844) |
| Class C | | | | |
| Shares sold | 204 | 158 | $4,420 | $3,399 |
| Reinvestment of distributions | – | 6 | – | 124 |
| Shares redeemed | (230) | (224) | (4,851) | (4,777) |
| Net increase (decrease) | (26) | (60) | $(431) | $(1,254) |
| Class I | | | | |
| Shares sold | 1,548 | 3,011 | $33,691 | $67,092 |
| Reinvestment of distributions | 67 | 198 | 1,452 | 4,371 |
| Shares redeemed | (3,406) | (1,838) | (75,301) | (40,787) |
| Net increase (decrease) | (1,791) | 1,371 | $(40,158) | $30,676 |
11. Other.
The Fund's organizational documents provide former and current trustees and officers with a limited indemnification against liabilities arising in connection with the performance of their duties to the Fund. In the normal course of business, the Fund may also enter into contracts that provide general indemnifications. The Fund's maximum exposure under these arrangements is unknown as this would be dependent on future claims that may be made against the Fund. The risk of material loss from such claims is considered remote.
At the end of the period, Strategic Advisers International II Fund was the owner of record of approximately 18% of the total outstanding shares of the Fund.
Report of Independent Registered Public Accounting Firm
To the Trustees of Fidelity Advisor Series VIII and Shareholders of Fidelity Advisor® Overseas Fund:
In our opinion, the accompanying statement of assets and liabilities, including the schedule of investments, and the related statements of operations and of changes in net assets and the financial highlights present fairly, in all material respects, the financial position of Fidelity Advisor® Overseas Fund (a fund of Fidelity Advisor Series VIII) at October 31, 2015, the results of its operations for the year then ended, the changes in its net assets for each of the two years in the period then ended and the financial highlights for each of the five years in the period then ended, in conformity with accounting principles generally accepted in the United States of America. These financial statements and financial highlights (hereafter referred to as “financial statements”) are the responsibility of the Fidelity Advisor® Overseas Fund’s management. Our responsibility is to express an opinion on these financial statements based on our audits. We conducted our audits of these financial statements in accordance with the standards of the Public Company Accounting Oversight Board (United States). Those standards require that we plan and perform the audit to obtain reasonable assurance about whether the financial statements are free of material misstatement. An audit includes examining, on a test basis, evidence supporting the amounts and disclosures in the financial statements, assessing the accounting principles used and significant estimates made by management, and evaluating the overall financial statement presentation. We believe that our audits, which included confirmation of securities at October 31, 2015 by correspondence with the custodian and brokers, provide a reasonable basis for our opinion.
PricewaterhouseCoopers LLP
Boston, Massachusetts
December 15, 2015
Trustees and Officers
The Trustees, Members of the Advisory Board (if any), and officers of the trust and fund, as applicable, are listed below. The Board of Trustees governs the fund and is responsible for protecting the interests of shareholders. The Trustees are experienced executives who meet periodically throughout the year to oversee the fund's activities, review contractual arrangements with companies that provide services to the fund, oversee management of the risks associated with such activities and contractual arrangements, and review the fund's performance. Each of the Trustees oversees 170 funds.
The Trustees hold office without limit in time except that (a) any Trustee may resign; (b) any Trustee may be removed by written instrument, signed by at least two-thirds of the number of Trustees prior to such removal; (c) any Trustee who requests to be retired or who has become incapacitated by illness or injury may be retired by written instrument signed by a majority of the other Trustees; and (d) any Trustee may be removed at any special meeting of shareholders by a two-thirds vote of the outstanding voting securities of the trust. Each Trustee who is not an interested person (as defined in the 1940 Act) of the trust and the fund is referred to herein as an Independent Trustee. Each Independent Trustee shall retire not later than the last day of the calendar year in which his or her 75th birthday occurs. The Independent Trustees may waive this mandatory retirement age policy with respect to individual Trustees. Officers and Advisory Board Members hold office without limit in time, except that any officer or Advisory Board Member may resign or may be removed by a vote of a majority of the Trustees at any regular meeting or any special meeting of the Trustees. Except as indicated, each individual has held the office shown or other offices in the same company for the past five years.
The fund’s Statement of Additional Information (SAI) includes more information about the Trustees. To request a free copy, call Fidelity at 1-877-208-0098.
Experience, Skills, Attributes, and Qualifications of the Trustees. The Governance and Nominating Committee has adopted a statement of policy that describes the experience, qualifications, attributes, and skills that are necessary and desirable for potential Independent Trustee candidates (Statement of Policy). The Board believes that each Trustee satisfied at the time he or she was initially elected or appointed a Trustee, and continues to satisfy, the standards contemplated by the Statement of Policy. The Governance and Nominating Committee also engages professional search firms to help identify potential Independent Trustee candidates who have the experience, qualifications, attributes, and skills consistent with the Statement of Policy. From time to time, additional criteria based on the composition and skills of the current Independent Trustees, as well as experience or skills that may be appropriate in light of future changes to board composition, business conditions, and regulatory or other developments, have also been considered by the professional search firms and the Governance and Nominating Committee. In addition, the Board takes into account the Trustees' commitment and participation in Board and committee meetings, as well as their leadership of standing and ad hoc committees throughout their tenure.
In determining that a particular Trustee was and continues to be qualified to serve as a Trustee, the Board has considered a variety of criteria, none of which, in isolation, was controlling. The Board believes that, collectively, the Trustees have balanced and diverse experience, qualifications, attributes, and skills, which allow the Board to operate effectively in governing the fund and protecting the interests of shareholders. Information about the specific experience, skills, attributes, and qualifications of each Trustee, which in each case led to the Board's conclusion that the Trustee should serve (or continue to serve) as a trustee of the fund, is provided below.
Board Structure and Oversight Function. James C. Curvey is an interested person and currently serves as Chairman. The Trustees have determined that an interested Chairman is appropriate and benefits shareholders because an interested Chairman has a personal and professional stake in the quality and continuity of services provided to the fund. Independent Trustees exercise their informed business judgment to appoint an individual of their choosing to serve as Chairman, regardless of whether the Trustee happens to be independent or a member of management. The Independent Trustees have determined that they can act independently and effectively without having an Independent Trustee serve as Chairman and that a key structural component for assuring that they are in a position to do so is for the Independent Trustees to constitute a substantial majority for the Board. The Independent Trustees also regularly meet in executive session. Ned C. Lautenbach serves as Chairman of the Independent Trustees and as such (i) acts as a liaison between the Independent Trustees and management with respect to matters important to the Independent Trustees and (ii) with management prepares agendas for Board meetings.
Fidelity® funds are overseen by different Boards of Trustees. The fund's Board oversees Fidelity's high income and certain equity funds, and other Boards oversee Fidelity's investment-grade bond, money market, asset allocation, and sector funds. The asset allocation funds may invest in Fidelity® funds overseen by the fund's Board. The use of separate Boards, each with its own committee structure, allows the Trustees of each group of Fidelity® funds to focus on the unique issues of the funds they oversee, including common research, investment, and operational issues. On occasion, the separate Boards establish joint committees to address issues of overlapping consequences for the Fidelity® funds overseen by each Board.
The Trustees operate using a system of committees to facilitate the timely and efficient consideration of all matters of importance to the Trustees, the fund, and fund shareholders and to facilitate compliance with legal and regulatory requirements and oversight of the fund's activities and associated risks. The Board, acting through its committees, has charged FMR and its affiliates with (i) identifying events or circumstances the occurrence of which could have demonstrably adverse effects on the fund's business and/or reputation; (ii) implementing processes and controls to lessen the possibility that such events or circumstances occur or to mitigate the effects of such events or circumstances if they do occur; and (iii) creating and maintaining a system designed to evaluate continuously business and market conditions in order to facilitate the identification and implementation processes described in (i) and (ii) above. Because the day-to-day operations and activities of the fund are carried out by or through FMR, its affiliates, and other service providers, the fund's exposure to risks is mitigated but not eliminated by the processes overseen by the Trustees. While each of the Board's committees has responsibility for overseeing different aspects of the fund's activities, oversight is exercised primarily through the Operations, Audit, and Compliance Committees. In addition, the Independent Trustees have worked with FMR to enhance the Board's oversight of investment and financial risks, legal and regulatory risks, technology risks, and operational risks, including the development of additional risk reporting to the Board. For example, a working group comprised of Independent Trustees and FMR has worked and continues to work to review the Fidelity® funds' valuation-related activities, reporting and risk management. Appropriate personnel, including but not limited to the fund's Chief Compliance Officer (CCO), FMR's internal auditor, the independent accountants, the fund's Treasurer and portfolio management personnel, make periodic reports to the Board's committees, as appropriate, including an annual review of Fidelity's risk management program for the Fidelity® funds. The responsibilities of each standing committee, including their oversight responsibilities, are described further under "Standing Committees of the Trustees."
Interested Trustees*:
Correspondence intended for a Trustee who is an interested person may be sent to Fidelity Investments, 245 Summer Street, Boston, Massachusetts 02210.
Name, Year of Birth; Principal Occupations and Other Relevant Experience+
James C. Curvey (1935)
Year of Election or Appointment: 2007
Trustee
Chairman of the Board of Trustees
Mr. Curvey also serves as Trustee of other Fidelity® funds. Mr. Curvey is a Director of Fidelity Research & Analysis Co. (investment adviser firm, 2009-present), and Vice Chairman (2007-present) and Director of FMR LLC (diversified financial services company). In addition, Mr. Curvey serves as an Overseer for the Boston Symphony Orchestra and a member of the board of Artis-Naples, Naples, Florida, and as a Trustee for Brewster Academy, Wolfeboro, New Hampshire. Previously, Mr. Curvey served as a Director of Fidelity Investments Money Management, Inc. (investment adviser firm, 2009-2014) and a Director of FMR and FMR Co., Inc. (investment adviser firms, 2007-2014).
Charles S. Morrison (1960)
Year of Election or Appointment: 2014
Trustee
Mr. Morrison also serves as Trustee of other funds. He serves as a Director of Fidelity Investments Money Management, Inc. (FIMM) (investment adviser firm, 2014-present), Director of Fidelity SelectCo, LLC (investment adviser firm, 2014-present), President, Asset Management (2014-present), and is an employee of Fidelity Investments. Previously, Mr. Morrison served as Vice President of Fidelity's Fixed Income and Asset Allocation Funds (2012-2014), President, Fixed Income (2011-2014), Vice President of Fidelity's Money Market Funds (2005-2009), President, Money Market Group Leader of FMR (investment adviser firm, 2009), and Senior Vice President, Money Market Group of FMR (2004-2009). Mr. Morrison also served as Vice President of Fidelity's Bond Funds (2002-2005), certain Balanced Funds (2002-2005), and certain Asset Allocation Funds (2002-2007), and as Senior Vice President (2002-2005) of Fidelity's Bond Division.
* Determined to be an “Interested Trustee” by virtue of, among other things, his or her affiliation with the trust or various entities under common control with FMR.
+ The information includes the Trustee's principal occupation during the last five years and other information relating to the experience, attributes, and skills relevant to the Trustee's qualifications to serve as a Trustee, which led to the conclusion that the Trustee should serve as a Trustee for the fund.
Independent Trustees:
Correspondence intended for an Independent Trustee may be sent to Fidelity Investments, P.O. Box 55235, Boston, Massachusetts 02205-5235.
Name, Year of Birth; Principal Occupations and Other Relevant Experience+
Dennis J. Dirks (1948)
Year of Election or Appointment: 2005
Trustee
Mr. Dirks also serves as Trustee of other Fidelity® funds. Prior to his retirement in May 2003, Mr. Dirks was Chief Operating Officer and a member of the Board of The Depository Trust & Clearing Corporation (DTCC). He also served as President, Chief Operating Officer, and Board member of The Depository Trust Company (DTC) and President and Board member of the National Securities Clearing Corporation (NSCC). In addition, Mr. Dirks served as Chief Executive Officer and Board member of the Government Securities Clearing Corporation, Chief Executive Officer and Board member of the Mortgage-Backed Securities Clearing Corporation, as a Trustee and a member of the Finance Committee of Manhattan College (2005-2008), as a Trustee and a member of the Finance Committee of AHRC of Nassau County (2006-2008), and as a member of the Independent Directors Council (IDC) Governing Council (2010-2015). Mr. Dirks is a member of the Board of Directors for The Brookville Center for Children's Services, Inc. (2009-present).
Alan J. Lacy (1953)
Year of Election or Appointment: 2008
Trustee
Mr. Lacy also serves as Trustee of other Fidelity® funds. Mr. Lacy serves as a member of the Board of Directors of Dave & Buster's Entertainment, Inc. (restaurant and entertainment complexes, 2010-present) and Bristol-Myers Squibb Company (global pharmaceuticals, 2008-present). In addition, Mr. Lacy served as Senior Adviser (2007-2014) of Oak Hill Capital Partners, L.P. (private equity) and also served as Chief Executive Officer (2000-2005) and Vice Chairman (2005-2006) of Sears Holdings Corporation and Sears, Roebuck and Co. (retail). Mr. Lacy is a member of the Board of Trustees of The National Parks Conservation Association (2006-present). Previously, Mr. Lacy served as Chairman of the Board of Trustees of the National Parks Conservation Association (2008-2011) and as a member of the Board of Directors for The Western Union Company (global money transfer, 2006-2011), The Hillman Companies, Inc. (hardware wholesalers, 2010-2014), and Earth Fare, Inc. (retail grocery, 2010-2014).
Ned C. Lautenbach (1944)
Year of Election or Appointment: 2000
Trustee
Chairman of the Independent Trustees
Mr. Lautenbach also serves as Trustee of other Fidelity® funds. Mr. Lautenbach currently serves as the Lead Director of the Eaton Corporation Board of Directors (diversified industrial, 1997-present). Mr. Lautenbach is Chairman of the Board of Directors of Artis-Naples in Naples, Florida (2012-present), a member of the Council on Foreign Relations (1994-present), and a member of the Board of Governors, State University System of Florida (2013-present). Previously, Mr. Lautenbach was a Partner/Advisory Partner at Clayton, Dubilier & Rice, LLC (private equity investment, 1998-2010), as well as a Director of Sony Corporation (2006-2007).
Joseph Mauriello (1944)
Year of Election or Appointment: 2008
Trustee
Mr. Mauriello also serves as Trustee of other Fidelity® funds. Prior to his retirement in January 2006, Mr. Mauriello served in numerous senior management positions including Deputy Chairman and Chief Operating Officer (2004-2005), and Vice Chairman of Financial Services (2002-2004) of KPMG LLP US (professional services, 1965-2005). Mr. Mauriello currently serves as a member of the Board of Directors of XL Group plc. (global insurance and re-insurance, 2006-present) and the Independent Directors Council (IDC) Governing Council (2015-present). Previously, Mr. Mauriello served as a Director of the Hamilton Funds of the Bank of New York (2006-2007) and of Arcadia Resources Inc. (health care services and products, 2007-2012).
Robert W. Selander (1950)
Year of Election or Appointment: 2011
Trustee
Mr. Selander also serves as Trustee of other Fidelity® funds. Mr. Selander serves as a Director of The Western Union Company (global money transfer, 2014-present). Previously, Mr. Selander served as a Member of the Advisory Board of other Fidelity® funds (2011), and Executive Vice Chairman (2010), Chief Executive Officer (2009-2010), and President and Chief Executive Officer (1997-2009) of Mastercard, Inc.
Cornelia M. Small (1944)
Year of Election or Appointment: 2005
Trustee
Ms. Small also serves as Trustee of other Fidelity® funds. Ms. Small is a member of the Board of Directors (2009-present) and Chair of the Investment Committee (2010-present) of the Teagle Foundation. Ms. Small also serves on the Investment Committee of the Berkshire Taconic Community Foundation (2008-present). Previously, Ms. Small served as Chairperson (2002-2008) and a member of the Investment Committee and Chairperson (2008-2012) and a member of the Board of Trustees of Smith College. In addition, Ms. Small served as Chief Investment Officer, Director of Global Equity Investments, and a member of the Board of Directors of Scudder, Stevens & Clark and Scudder Kemper Investments.
William S. Stavropoulos (1939)
Year of Election or Appointment: 2001
Trustee
Vice Chairman of the Independent Trustees
Mr. Stavropoulos also serves as Trustee of other Fidelity® funds. Mr. Stavropoulos serves as President and Founder of the Michigan Baseball Foundation, the Great Lakes Loons (2007-present). Mr. Stavropoulos is Chairman Emeritus of the Board of Directors of The Dow Chemical Company, where he previously served in numerous senior management positions, including President, CEO (1995-2000; 2002-2004), Chairman of the Executive Committee (2000-2006), and as a member of the Board of Directors (1990-2006). Currently, Mr. Stavropoulos is Chairman of the Board of Directors of Univar Inc. (global distributor of commodity and specialty chemicals), a Director of Teradata Corporation (data warehousing and technology solutions), and Maersk Inc. (industrial conglomerate), and a member of the Advisory Board for Metalmark Capital LLC (private equity investment, 2005-present). Mr. Stavropoulos is an operating advisor to Clayton, Dubilier & Rice, LLC (private equity investment). In addition, Mr. Stavropoulos is a member of the University of Notre Dame Advisory Council for the College of Science, a Trustee of the Rollin L. Gerstacker Foundation, and a Director of the Naples Philharmonic Center for the Arts. Previously, Mr. Stavropoulos served as a Director of Chemical Financial Corporation (bank holding company, 1993-2012) and Tyco International, Ltd. (multinational manufacturing and services, 2007-2012).
David M. Thomas (1949)
Year of Election or Appointment: 2008
Trustee
Mr. Thomas also serves as Trustee of other Fidelity® funds. Mr. Thomas serves as Non-Executive Chairman of the Board of Directors of Fortune Brands Home and Security (home and security products, 2011-present), as a member of the Board of Directors (2004-present) and Presiding Director (2013-present) of Interpublic Group of Companies, Inc. (marketing communication), and as a member of the Board of Trustees of the University of Florida (2013-present). Previously, Mr. Thomas served as Executive Chairman (2005-2006) and Chairman and Chief Executive Officer (2000-2005) of IMS Health, Inc. (pharmaceutical and healthcare information solutions), and a Director of Fortune Brands, Inc. (consumer products, 2000-2011).
+ The information includes the Trustee's principal occupation during the last five years and other information relating to the experience, attributes, and skills relevant to the Trustee's qualifications to serve as a Trustee, which led to the conclusion that the Trustee should serve as a Trustee for the fund.
Advisory Board Members and Officers:
Correspondence intended for an officer or Peter S. Lynch may be sent to Fidelity Investments, 245 Summer Street, Boston, Massachusetts 02210. Officers appear below in alphabetical order.
Name, Year of Birth; Principal Occupation
Peter S. Lynch (1944)
Year of Election or Appointment: 2003
Member of the Advisory Board
Mr. Lynch also serves as Member of the Advisory Board of other Fidelity® funds. Mr. Lynch is Vice Chairman and a Director of FMR (investment adviser firm) and FMR Co., Inc. (investment adviser firm). In addition, Mr. Lynch serves as a Trustee of Boston College and as the Chairman of the Inner-City Scholarship Fund. Previously, Mr. Lynch served on the Special Olympics International Board of Directors (1997-2006).
Elizabeth Paige Baumann (1968)
Year of Election or Appointment: 2012
Anti-Money Laundering (AML) Officer
Ms. Baumann also serves as AML Officer of other funds. She is Chief AML Officer of FMR LLC (diversified financial services company, 2012-present) and is an employee of Fidelity Investments. Previously, Ms. Baumann served as Vice President and Deputy Anti-Money Laundering Officer (2007-2012).
Marc R. Bryant (1966)
Year of Election or Appointment: 2015
Secretary and Chief Legal Officer (CLO)
Mr. Bryant also serves as Secretary and CLO of other funds. Mr. Bryant serves as CLO, Secretary, and Senior Vice President of Fidelity Management & Research Company (investment adviser firm, 2015-present) and FMR Co., Inc. (investment adviser firm, 2015-present); Secretary of Fidelity SelectCo, LLC (investment adviser firm, 2015-present) and Fidelity Investments Money Management, Inc. (investment adviser firm, 2015-present); and CLO of Fidelity Management & Research (Hong Kong) Limited (investment adviser firm, 2015-present). He is Senior Vice President and Deputy General Counsel of FMR LLC (diversified financial services company). Previously, Mr. Bryant served as Secretary and Chief Legal Officer of Fidelity Rutland Square Trust II (2010-2014) and Assistant Secretary of Fidelity's Fixed Income and Asset Allocation Funds (2013-2015). Prior to joining Fidelity Investments, Mr. Bryant served as a Senior Vice President and the Head of Global Retail Legal for AllianceBernstein L.P. (2006-2010), and as the General Counsel for ProFund Advisors LLC (2001-2006).
Timothy M. Cohen (1969)
Year of Election or Appointment: 2014
Vice President of certain Equity Funds
Mr. Cohen also serves as Vice President of other funds. Mr. Cohen serves as Chief Compliance Officer of FMR Investment Management (U.K.) Limited (investment adviser firm, 2013-present) and is an employee of Fidelity Investments. Previously, Mr. Cohen served as a Director of FMR Investment Management (U.K.) Limited (2013-2015).
William C. Coffey (1969)
Year of Election or Appointment: 2009
Assistant Secretary
Mr. Coffey also serves as Assistant Secretary of other funds. He is Senior Vice President and Deputy General Counsel of FMR LLC (diversified financial services company, 2010-present), and is an employee of Fidelity Investments. Previously, Mr. Coffey served as Vice President and Associate General Counsel of FMR LLC (2005-2009).
Jonathan Davis (1968)
Year of Election or Appointment: 2010
Assistant Treasurer
Mr. Davis also serves as Assistant Treasurer of other funds, and is an employee of Fidelity Investments. Previously, Mr. Davis served as Vice President and Associate General Counsel of FMR LLC (diversified financial services company, 2003-2010).
Adrien E. Deberghes (1967)
Year of Election or Appointment: 2008
Deputy Treasurer
Mr. Deberghes also serves as an officer of other funds. He is an employee of Fidelity Investments (2008-present). Prior to joining Fidelity Investments, Mr. Deberghes was Senior Vice President of Mutual Fund Administration at State Street Corporation (2007-2008), Senior Director of Mutual Fund Administration at Investors Bank & Trust (2005-2007), and Director of Finance for Dunkin' Brands (2000-2005).
Stephanie J. Dorsey (1969)
Year of Election or Appointment: 2010
Assistant Treasurer
Ms. Dorsey also serves as an officer of other funds. She is an employee of Fidelity Investments (2008-present) and has served in other fund officer roles. Prior to joining Fidelity Investments, Ms. Dorsey served as Treasurer (2004-2008) of the JPMorgan Mutual Funds and Vice President (2004-2008) of JPMorgan Chase Bank.
Howard J. Galligan III (1966)
Year of Election or Appointment: 2014
Chief Financial Officer
Mr. Galligan also serves as Chief Financial Officer of other funds. Mr. Galligan serves as President of Fidelity Pricing and Cash Management Services (FPCMS) (2014-present) and as a Director of Strategic Advisers, Inc. (investment adviser firm, 2008-present). Previously, Mr. Galligan served as Chief Administrative Officer of Asset Management (2011-2014) and Chief Operating Officer and Senior Vice President of Investment Support for Strategic Advisers, Inc. (2003-2011).
Scott C. Goebel (1968)
Year of Election or Appointment: 2015
Vice President
Mr. Goebel serves as Vice President of other funds and is an employee of Fidelity Investments (2001-present). Previously, Mr. Goebel served as Secretary of Fidelity SelectCo, LLC (investment adviser firm, 2013-2015), Fidelity Investments Money Management, Inc. (FIMM) (investment adviser firm, 2010-2015), and Fidelity Research and Analysis Company (FRAC) (investment adviser firm, 2010-2015); General Counsel, Secretary, and Senior Vice President of Fidelity Management & Research Company (investment adviser firm, 2008-2015) and FMR Co., Inc. (investment adviser firm, 2008-2015); Assistant Secretary of Fidelity Management & Research (Japan) Limited (investment adviser firm, 2008-2015) and FMR Investment Management (U.K.) Limited (investment adviser firm, 2008-2015); Chief Legal Officer (CLO) of Fidelity Management & Research (Hong Kong) Limited (investment adviser firm, 2008-2015); Secretary and CLO of certain Fidelity® funds (2008-2015); Assistant Secretary of FIMM (2008-2010), FRAC (2008-2010), and certain funds (2007-2008); and as Vice President and Secretary of Fidelity Distributors Corporation (FDC) (2005-2007).
Brian B. Hogan (1964)
Year of Election or Appointment: 2009
Vice President
Mr. Hogan also serves as Trustee or Vice President of other funds. Mr. Hogan serves as a Director of Fidelity SelectCo, LLC (investment adviser firm, 2014-present) and President of the Equity Division of FMR (investment adviser firm, 2009-present). Previously, Mr. Hogan served as Senior Vice President, Equity Research of FMR (2006-2009) and as a portfolio manager.
Chris Maher (1972)
Year of Election or Appointment: 2013
Assistant Treasurer
Mr. Maher serves as Assistant Treasurer of other funds. Mr. Maher is Vice President of Valuation Oversight and is an employee of Fidelity Investments. Previously, Mr. Maher served as Vice President of Asset Management Compliance (2013), Vice President of the Program Management Group of FMR (investment adviser firm, 2010-2013), and Vice President of Valuation Oversight (2008-2010).
Kenneth B. Robins (1969)
Year of Election or Appointment: 2008
President and Treasurer
Mr. Robins also serves as an officer of other funds. Mr. Robins serves as Executive Vice President of Fidelity Investments Money Management, Inc. (FIMM) (investment adviser firm, 2013-present) and is an employee of Fidelity Investments (2004-present). Previously, Mr. Robins served in other fund officer roles.
Stacie M. Smith (1974)
Year of Election or Appointment: 2013
Deputy Treasurer
Ms. Smith also serves as an officer of other funds. She is an employee of Fidelity Investments (2009-present) and has served in other fund officer roles. Prior to joining Fidelity Investments, Ms. Smith served as Senior Audit Manager of Ernst & Young LLP (1996-2009).
Renee Stagnone (1975)
Year of Election or Appointment: 2013
Deputy Treasurer
Ms. Stagnone also serves as Deputy Treasurer of other funds. Ms. Stagnone is an employee of Fidelity Investments (1997-present).
Linda J. Wondrack (1964)
Year of Election or Appointment: 2014
Chief Compliance Officer
Ms. Wondrack also serves as Chief Compliance Officer of other funds. Ms. Wondrack is Executive Vice President and head of the Ethics Office and Asset Management Compliance for Fidelity Investments (2012-present). Ms. Wondrack also serves as Chief Compliance Officer of Fidelity SelectCo, LLC (investment adviser firm, 2014-present); Chief Compliance Officer of Impresa Management LLC (2013-present); and Chief Compliance Officer of FMR Co., Inc. (investment adviser firm), Fidelity Investments Money Management, Inc. (investment adviser firm), Fidelity Management & Research (Japan) Limited (investment adviser firm), FMR Investment Management (U.K.) Limited (investment adviser firm), Fidelity Management & Research (Hong Kong) (investment adviser firm), Fidelity Management & Research Company (investment adviser firm), FIAM LLC (investment adviser firm), and Strategic Advisers, Inc. (investment adviser firm), Ballyrock Investment Advisors LLC, and Northern Neck Investors LLC (2012-present). Previously, Ms. Wondrack served as Senior Vice President and Chief Compliance Officer for Columbia Management Investment Advisers, LLC (2005-2012); Chief Compliance Officer for certain funds within the Columbia Family of Funds (2007-2012); and Senior Vice President of Compliance Risk Management at Bank of America (2005-2010).
Joseph F. Zambello (1957)
Year of Election or Appointment: 2011
Deputy Treasurer
Mr. Zambello also serves as Deputy Treasurer of other funds. Mr. Zambello is an employee of Fidelity Investments (1991-present). Previously, Mr. Zambello served as Vice President of the Program Management Group of FMR (investment adviser firm, 2009-2011) and Vice President of the Transfer Agent Oversight Group (2005-2009).
Shareholder Expense Example
As a shareholder of the Fund, you incur two types of costs: (1) transaction costs, including sales charges (loads) on purchase payments or redemption proceeds, redemption fees and (2) ongoing costs, including management fees, distribution and/or service (12b-1) fees and other Fund expenses. This Example is intended to help you understand your ongoing costs (in dollars) of investing in the Fund and to compare these costs with the ongoing costs of investing in other mutual funds.
The Example is based on an investment of $1,000 invested at the beginning of the period and held for the entire period (May 1, 2015 to October 31, 2015).
Actual Expenses
The first line of the accompanying table for each class of the Fund provides information about actual account values and actual expenses. You may use the information in this line, together with the amount you invested, to estimate the expenses that you paid over the period. Simply divide your account value by $1,000.00 (for example, an $8,600 account value divided by $1,000.00 = 8.6), then multiply the result by the number in the first line for a class of the Fund under the heading entitled "Expenses Paid During Period" to estimate the expenses you paid on your account during this period. In addition, the Fund, as a shareholder in the underlying Fidelity Central Funds, will indirectly bear its pro-rata share of the fees and expenses incurred by the underlying Fidelity Central Funds. These fees and expenses are not included in the Fund's annualized expense ratio used to calculate the expense estimate in the table below.
Hypothetical Example for Comparison Purposes
The second line of the accompanying table for each class of the Fund provides information about hypothetical account values and hypothetical expenses based on a Class' actual expense ratio and an assumed rate of return of 5% per year before expenses, which is not the Class' actual return. The hypothetical account values and expenses may not be used to estimate the actual ending account balance or expenses you paid for the period. You may use this information to compare the ongoing costs of investing in the Fund and other funds. To do so, compare this 5% hypothetical example with the 5% hypothetical examples that appear in the shareholder reports of the other funds. In addition, the Fund, as a shareholder in the underlying Fidelity Central Funds, will indirectly bear its pro-rata share of the fees and expenses incurred by the underlying Fidelity Central Funds. These fees and expenses are not included in the Fund's annualized expense ratio used to calculate the expense estimate in the table below.
Please note that the expenses shown in the table are meant to highlight your ongoing costs only and do not reflect any transaction costs. Therefore, the second line of the table is useful in comparing ongoing costs only, and will not help you determine the relative total costs of owning different funds. In addition, if these transactional costs were included, your costs would have been higher.
| | Annualized Expense Ratio-A | Beginning
Account Value
May 1, 2015 | Ending
Account Value
October 31, 2015 | Expenses Paid
During Period-B
May 1, 2015
to October 31, 2015 |
| Class A | 1.36% | | | |
| Actual | | $1,000.00 | $956.60 | $6.71 |
| Hypothetical-C | | $1,000.00 | $1,018.35 | $6.92 |
| Class T | 1.57% | | | |
| Actual | | $1,000.00 | $955.50 | $7.74 |
| Hypothetical-C | | $1,000.00 | $1,017.29 | $7.98 |
| Class B | 2.18% | | | |
| Actual | | $1,000.00 | $952.40 | $10.73 |
| Hypothetical-C | | $1,000.00 | $1,014.22 | $11.07 |
| Class C | 2.17% | | | |
| Actual | | $1,000.00 | $952.80 | $10.68 |
| Hypothetical-C | | $1,000.00 | $1,014.27 | $11.02 |
| Class I | 1.05% | | | |
| Actual | | $1,000.00 | $958.30 | $5.18 |
| Hypothetical-C | | $1,000.00 | $1,019.91 | $5.35 |
A Annualized expense ratio reflects expenses net of applicable fee waivers.
B Expenses are equal to each Class' annualized expense ratio, multiplied by the average account value over the period, multiplied by 184/365 (to reflect the one-half year period).
C 5% return per year before expenses
Distributions (Unaudited)
Class A designates 31%, Class T designates 0%, Class B designates 0%, and Class C designates 0% of the dividends distributed during the fiscal year as qualifying for the dividends-received deduction for corporate shareholders.
Class A designates 100%, Class T designates 0%, Class B designates 0%, and Class C designates 0% of the dividends distributed during the fiscal year as amounts which may be taken into account as a dividend for purposes of the maximum rate under section 1(h)(11) of the Internal Revenue Code.
The amounts per share which represent income derived from sources within, and taxes paid to, foreign countries or possessions of the United States are as follows:
| | Pay Date | Income | Taxes | |
| Class A | 12/08/14 | $ 0.0611 | $ 0.0421 | |
| Class T | 12/08/14 | $ 0.0000 | $ 0.0000 | |
| Class B | 12/08/14 | $ 0.0000 | $ 0.0000 | |
| Class C | 12/08/14 | $ 0.0000 | $ 0.0000 | |
The fund will notify shareholders in January 2016 of amounts for use in preparing 2015 income tax returns.
Board Approval of Investment Advisory Contracts and Management Fees
Fidelity Advisor Overseas Fund
Each year, the Board of Trustees, including the Independent Trustees (together, the Board), votes on the renewal of the management contract with Fidelity Management & Research Company (FMR) and the sub-advisory agreements (together, the Advisory Contracts) for the fund. The Board, assisted by the advice of fund counsel and Independent Trustees' counsel, requests and considers a broad range of information relevant to the renewal of the Advisory Contracts throughout the year.
The Board meets regularly and, at each of its meetings, covers an extensive agenda of topics and materials and considers factors that are relevant to its annual consideration of the renewal of the fund's Advisory Contracts, including the services and support provided to the fund and its shareholders. The Board has established various standing committees (Committees), each composed of and chaired by Independent Trustees with varying backgrounds, to which the Board has assigned specific subject matter responsibilities in order to enhance effective decision-making by the Board. The Board, acting directly and through its Committees, requests and receives information concerning the annual consideration of the renewal of the fund's Advisory Contracts. The Board also meets as needed to consider matters specifically related to the Board's annual consideration of the renewal of the Advisory Contracts. Members of the Board may also meet with trustees of other Fidelity funds through ad hoc joint committees to discuss certain matters relevant to all of the Fidelity funds.
At its July 2015 meeting, the Board unanimously determined to renew the fund's Advisory Contracts. In reaching its determination, the Board considered all factors it believed relevant, including (i) the nature, extent, and quality of the services to be provided to the fund and its shareholders (including the investment performance of the fund); (ii) the competitiveness of the fund's management fee and total expense ratio relative to peer funds; (iii) the total costs of the services to be provided by and the profits to be realized by Fidelity from its relationship with the fund; and (iv) the extent to which (if any) economies of scale exist and would be realized as the fund grows, and whether any economies of scale are appropriately shared with fund shareholders.
In considering whether to renew the Advisory Contracts for the fund, the Board reached a determination, with the assistance of fund counsel and Independent Trustees' counsel and through the exercise of its business judgment, that the renewal of the Advisory Contracts was in the best interests of the fund and its shareholders and that the compensation payable under the Advisory Contracts was fair and reasonable. The Board's decision to renew the Advisory Contracts was not based on any single factor, but rather was based on a comprehensive consideration of all the information provided to the Board at its meetings throughout the year. The Board, in reaching its determination to renew the Advisory Contracts, was aware that shareholders of the fund have a broad range of investment choices available to them, including a wide choice among funds offered by Fidelity's competitors, and that the fund's shareholders, who have the opportunity to review and weigh the disclosure provided by the fund in its prospectus and other public disclosures, have chosen to invest in this fund, which is part of the Fidelity family of funds.
Nature, Extent, and Quality of Services Provided. The Board considered Fidelity's staffing as it relates to the fund, including the backgrounds of investment personnel of Fidelity, and also considered the fund's investment objective, strategies, and related investment philosophy. The Independent Trustees also had discussions with senior management of Fidelity's investment operations and investment groups. The Board considered the structure of the portfolio manager compensation program and whether this structure provides appropriate incentives to act in the best interests of the fund. Additionally, the Board considered the portfolio managers' investments, if any, in the funds that they manage.
Resources Dedicated to Investment Management and Support Services. The Board and the Fund Oversight and Research Committees reviewed the general qualifications and capabilities of Fidelity's investment staff, including its size, education, experience, and resources, as well as Fidelity's approach to recruiting, training, managing, and compensating investment personnel. The Board noted that Fidelity has continued to increase the resources devoted to non-U.S. offices, including expansion of Fidelity's global investment organization. The Board also noted that Fidelity's analysts have extensive resources, tools and capabilities that allow them to conduct sophisticated quantitative and fundamental analysis, as well as credit analysis of issuers, counterparties and guarantors. Further, the Board considered that Fidelity's investment professionals have sufficient access to global information and data so as to provide competitive investment results over time, and that those professionals also have access to sophisticated tools that permit them to assess portfolio construction and risk and performance attribution characteristics continuously, as well as to transmit new information and research conclusions rapidly around the world. Additionally, in its deliberations, the Board considered Fidelity's trading, risk management, and compliance capabilities and resources, which are integral parts of the investment management process.
Shareholder and Administrative Services. The Board considered (i) the nature, extent, quality, and cost of advisory, administrative, and shareholder services performed by FMR, the sub-advisers (together with FMR, the Investment Advisers), and their affiliates under the Advisory Contracts and under separate agreements covering transfer agency, pricing and bookkeeping, and securities lending services for the fund; (ii) the nature and extent of the supervision of third party service providers, principally custodians and subcustodians; and (iii) the resources devoted to, and the record of compliance with, the fund's compliance policies and procedures. The Board also reviewed the allocation of fund brokerage, including allocations to brokers affiliated with the Investment Advisers, the use of brokerage commissions to pay fund expenses, and the use of "soft" commission dollars to pay for research services.
The Board noted that the growth of fund assets over time across the complex allows Fidelity to reinvest in the development of services designed to enhance the value or convenience of the Fidelity funds as investment vehicles. These services include 24-hour access to account information and market information through telephone representatives and over the Internet, investor education materials and asset allocation tools, and the expanded availability of Fidelity Investor Centers.
In 2014, the Board formed an ad hoc Committee on Transfer Agency Fees to review the variety of transfer agency fee structures throughout the industry and Fidelity's competitive positioning with respect to industry participants.
Investment in a Large Fund Family. The Board considered the benefits to shareholders of investing in a Fidelity fund, including the benefits of investing in a fund that is part of a large family of funds offering a variety of investment disciplines and providing a large variety of mutual fund investor services. The Board noted that Fidelity had taken, or had made recommendations that resulted in the Fidelity funds taking, a number of actions over the previous year that benefited particular funds, including (i) continuing to dedicate additional resources to investment research and to the support of the senior management team that oversees asset management; (ii) continuing efforts to enhance Fidelity's global research capabilities; (iii) launching new funds and making other enhancements to meet client needs; (iv) reducing management fees and total expenses for certain index funds and diversified international funds; (v) continuing to launch dedicated lower cost underlying funds to meet portfolio construction needs related to expanding underlying fund options for Fidelity funds of funds, specifically for the Freedom Fund product lines; (vi) rationalizing product lines and gaining increased efficiencies through fund mergers; (vii) launching active fixed-income exchange-traded funds; (viii) continuing to develop, acquire and implement systems and technology to improve services to the funds and information security and to increase efficiency; (ix) implementing investment enhancements to further strengthen Fidelity's target date product line to increase investors' probability of success in achieving their goals; (x) modifying the eligibility criteria for certain share classes to accommodate roll-over assets from employer-sponsored retirement plans; (xi) launching a new Class W of the Freedom Index Funds to attract and retain Fidelity record-kept retirement plan assets; and (xii) implementing changes to Fidelity's money market product line in response to recent money market regulatory reforms.
Investment Performance. The Board considered whether the fund has operated in accordance with its investment objective, as well as its record of compliance with its investment restrictions and its performance history.
The Board took into account discussions with representatives of the Investment Advisers about fund investment performance that occur at Board meetings throughout the year. In this regard the Board noted that as part of regularly scheduled fund reviews and other reports to the Board on fund performance, the Board considers annualized return information for the fund, for different time periods, measured against a securities market index ("benchmark index") and a peer group of funds with similar objectives ("peer group"), if any. In its evaluation of fund investment performance, the Board gave particular attention to information indicating changes in performance of certain Fidelity funds for specific time periods and discussed with the Investment Advisers the reasons for any overperformance or underperformance.
In addition to reviewing absolute and relative fund performance, the Independent Trustees periodically consider the appropriateness of fund performance metrics in evaluating the results achieved. In general, the Independent Trustees believe that fund performance should be evaluated based on net performance (after fees and expenses) of both the highest performing and lowest performing fund share classes, where applicable, compared to appropriate benchmark indices, over appropriate time periods that may include full market cycles, and compared to peer groups, as applicable, over the same periods, taking into account relevant factors including the following: general market conditions; issuer-specific information; and fund cash flows and other factors.
The Independent Trustees recognize that shareholders evaluate performance on a net basis over their own holding periods, for which one-, three-, and five-year periods are often used as a proxy. For this reason, the performance information reviewed by the Board also included net cumulative calendar year total return information for the fund and an appropriate benchmark index and peer group for the most recent one-, three-, and five-year periods, as shown below. Returns are shown compared to the 25th percentile (top of box, 75% beaten) and 75th percentile (bottom of box, 25% beaten) of the peer universe. Returns of the benchmark index are "net MA,"
i.e., adjusted for tax withholding rates applicable to U.S.-based funds organized as Massachusetts business trusts.
Fidelity Advisor Overseas Fund

The Board also considered that the fund's management fee is subject to upward or downward adjustment depending upon whether, and to what extent, the fund's investment performance for the performance period exceeds, or is exceeded by, a securities index, thus leading to a performance adjustment for the same period. The Board noted that the performance adjustment provides FMR with a strong economic incentive to seek to achieve superior performance for the fund's shareholders and helps to more closely align the interests of FMR and the shareholders of the fund.
Based on its review, the Board concluded that the nature, extent, and quality of services provided to the fund under the Advisory Contracts should benefit the shareholders of the fund.
Competitiveness of Management Fee and Total Expense Ratio. The Board considered the fund's management fee and total expense ratio compared to "mapped groups" of competitive funds and classes created for the purpose of facilitating the Trustees' competitive analysis of management fees and total expenses. Fidelity creates "mapped groups" by combining similar Lipper investment objective categories that have comparable investment mandates. Combining Lipper investment objective categories aids the Board's management fee and total expense ratio comparisons by broadening the competitive group used for comparison.
Management Fee. The Board considered two proprietary management fee comparisons for the 12-month periods shown in basis points (BP) in the chart below. The group of Lipper funds used by the Board for management fee comparisons is referred to below as the "Total Mapped Group." The Total Mapped Group comparison focuses on a fund's standing in terms of gross management fees before expense reimbursements or caps, and without giving effect to the fund's performance adjustment, relative to the total universe of funds with comparable investment mandates, regardless of whether their management fee structures also are comparable. Funds with comparable investment mandates offer exposure to similar types of securities. Funds with comparable management fee structures have similar management fee contractual arrangements (
e.g., flat rate charged for advisory services, all-inclusive fee rate,
etc.). "TMG %" represents the percentage of funds in the Total Mapped Group that had management fees that were lower than the fund's. For example, a hypothetical TMG % of 20% would mean that 80% of the funds in the Total Mapped Group had higher, and 20% had lower, management fees than the fund. The fund's actual TMG %s and the number of funds in the Total Mapped Group are in the chart below. The "Asset-Size Peer Group" (ASPG) comparison focuses on a fund's standing relative to a subset of non-Fidelity funds within the Total Mapped Group that are similar in size and management fee structure without taking into account performance adjustments, if any. For example, if a fund is in the first quartile of the ASPG, the fund's management fee ranks in the least expensive or lowest 25% of funds in the ASPG. The ASPG represents at least 15% of the funds in the Total Mapped Group with comparable asset size and management fee structures, subject to a minimum of 50 funds (or all funds in the Total Mapped Group if fewer than 50). Additional information, such as the ASPG quartile in which the fund's management fee rate ranked and the impact of the fund's performance adjustment, is also included in the chart and considered by the Board.
Fidelity Advisor Overseas Fund
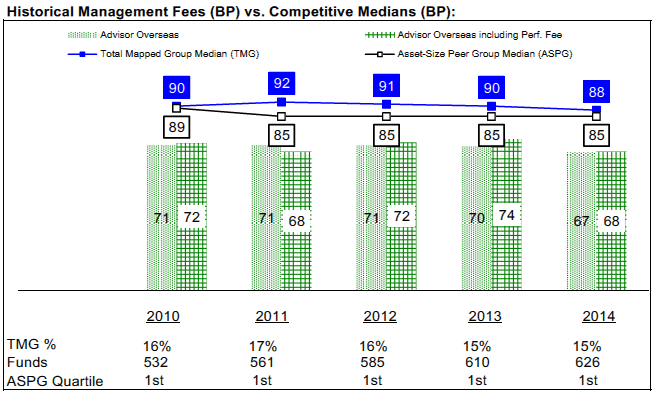
The Board noted that the fund's management fee rate ranked below the median of its Total Mapped Group and below the median of its ASPG for 2014. The Board also noted the effect of the fund's performance adjustment, if any, on the fund's management fee ranking.
Furthermore, the Board considered that it had approved a reduction (effective August 1, 2014) in the individual fund fee rate component of the management fee rate for the fund from 0.450% to 0.424%. The Board considered that the chart reflects the fund's lower management fee for 2014, as if the lower fee were in effect for the entire year.
The Board noted that, in 2014, the ad hoc Committee on Group Fee was formed by it and other Fidelity fund boards to conduct an in-depth review of the "group fee" component of the management fee of funds with such management fee structures. Committee focus included the mechanics of the group fee, the competitive landscape of group fee structures, Fidelity funds with no group fee component and investment products not included in group fee assets. The Board also considered that, for funds subject to the group fee, FMR agreed to voluntarily waive fees over a specified period of time in amounts designed to account for assets converted from certain funds to certain collective investment trusts.
The Board also noted that, in 2013, the ad hoc Committee on Management Fees was formed to conduct an in-depth review of the management fee rates of Fidelity's active equity mutual funds. The Committee focused on the following areas: (i) standard fee structures; (ii) research consumption and trading evolution; (iii) management fee competitiveness/profitability by category; and (iv) factors that drive institutional pricing.
Based on its review, the Board concluded that the fund's management fee is fair and reasonable in light of the services that the fund receives and the other factors considered.
Total Expense Ratio. In its review of each class's total expense ratio, the Board considered the fund's management fee as well as other fund or class expenses, as applicable, such as transfer agent fees, pricing and bookkeeping fees, fund-paid 12b-1 fees, and custodial, legal, and audit fees. The Board noted the impact of the fund's performance adjustment. The Board also noted that Fidelity may agree to waive fees and expenses from time to time, and the extent to which, if any, it has done so for the fund. As part of its review, the Board also considered the current and historical total expense ratios of each class of the fund compared to competitive fund median expenses. Each class of the fund is compared to those funds and classes in the Total Mapped Group (used by the Board for management fee comparisons) that have a similar sales load structure.
The Board noted that the total expense ratio of each of Class A, Class B, and Class I ranked below its competitive median for 2014, the total expense ratio of Class C ranked equal to its competitive median for 2014, and the total expense ratio of Class T ranked above its competitive median for 2014. The Board considered that, in general, various factors can affect total expense ratios. The Board noted that the total expense ratio of Class T was above the competitive median primarily because of higher 12b-1 fees on Class T as compared to most competitor funds. Class T has a higher 12b-1 fee, but a lower front-end sales charge, than traditionally priced front-end sales charge classes. The Board considered that Class T is primarily sold load-waived in the retirement plan market where its 0.50% 12b-1 fee is comparable to competing no-load, higher 12b-1 fee classes designed specifically for retirement plans. The Board noted that the fund offers multiple classes, each of which has a different sales load and 12b-1 fee structure, and that the multiple structures are intended to offer a range of pricing options for the intermediary market. The Board also noted that the total expense ratios of the classes vary primarily by the level of their 12b-1 fees, although differences in transfer agent fees may also cause expenses to vary from class to class.
Fees Charged to Other Fidelity Clients. The Board also considered Fidelity fee structures and other information with respect to clients of Fidelity, such as other funds advised or subadvised by Fidelity, pension plan clients, and other institutional clients with similar mandates. The Board noted the findings of the 2013 ad hoc joint committee (created with the board of other Fidelity funds), which reviewed and compared Fidelity's institutional investment advisory business with its business of providing services to the Fidelity funds, including the differences in services provided, fees charged, and costs incurred, as well as competition in their respective marketplaces.
Based on its review of total expense ratios and fees charged to other Fidelity clients, the Board concluded that, although Class T was above the median of the universe presented for comparison, the total expense ratio of each class of the fund was reasonable in light of the services that the fund and its shareholders receive and the other factors considered.
Costs of the Services and Profitability. The Board considered the revenues earned and the expenses incurred by Fidelity in conducting the business of developing, marketing, distributing, managing, administering and servicing the fund and servicing the fund's shareholders. The Board also considered the level of Fidelity's profits in respect of all the Fidelity funds.
On an annual basis, Fidelity presents to the Board information about the profitability of its relationship with the fund. Fidelity calculates profitability information for each fund, as well as aggregate profitability information for groups of Fidelity funds and all Fidelity funds, using a series of detailed revenue and cost allocation methodologies which originate with the books and records of Fidelity on which Fidelity's audited financial statements are based. The Audit Committee of the Board reviews any significant changes from the prior year's methodologies.
PricewaterhouseCoopers LLP (PwC), independent registered public accounting firm and auditor to Fidelity and certain Fidelity funds, has been engaged annually by the Board as part of the Board's assessment of Fidelity's profitability analysis. PwC's engagement includes the review and assessment of the methodologies used by Fidelity in determining the revenues and expenses attributable to Fidelity's mutual fund business, and completion of agreed-upon procedures in respect of the mathematical accuracy of fund profitability and its conformity to established allocation methodologies. After considering PwC's reports issued under the engagement and information provided by Fidelity, the Board concluded that while other allocation methods may also be reasonable, Fidelity's profitability methodologies are reasonable in all material respects.
The Board also reviewed Fidelity's non-fund businesses and fall-out benefits related to the mutual fund business as well as cases where Fidelity's affiliates may benefit from or be related to the fund's business.
The Board considered the costs of the services provided by and the profits realized by Fidelity in connection with the operation of the fund and was satisfied that the profitability was not excessive.
Economies of Scale. The Board considered whether there have been economies of scale in respect of the management of the Fidelity funds, whether the Fidelity funds (including the fund) have appropriately benefited from any such economies of scale, and whether there is potential for realization of any further economies of scale. The Board considered the extent to which the fund will benefit from economies of scale as assets grow through increased services to the fund, through waivers or reimbursements, or through fee or expense ratio reductions. The Board also noted that in 2013, it and the boards of other Fidelity funds created an ad hoc committee (the Economies of Scale Committee) to analyze whether Fidelity attains economies of scale in respect of the management and servicing of the Fidelity funds, whether the Fidelity funds have appropriately benefited from such economies of scale, and whether there is potential for realization of any further economies of scale.
The Board recognized that the fund's management contract incorporates a "group fee" structure, which provides for lower group fee rates as total group assets increase, and for higher group fee rates as total group assets decrease (with "group assets" defined to include fund assets under FMR's management plus sector fund assets previously under FMR's management and currently managed by Fidelity SelectCo, LLC). FMR calculates the group fee rates based on a tiered asset "breakpoint" schedule that varies based on asset class. The Board considered that the group fee is designed to deliver the benefits of economies of scale to fund shareholders when total Fidelity fund assets increase, even if assets of any particular fund are unchanged or have declined, because some portion of Fidelity's costs are attributable to services provided to all Fidelity funds, and all funds benefit if those costs can be allocated among more assets. The Board concluded that, given the group fee structure, fund shareholders will benefit from lower management fees as group assets increase at the fund complex level, regardless of whether Fidelity achieves any such economies of scale.
The Board concluded, taking into account the analysis of the Economies of Scale Committee, that economies of scale, if any, are being appropriately shared between fund shareholders and Fidelity.
Additional Information Requested by the Board. In order to develop fully the factual basis for consideration of the Fidelity funds' Advisory Contracts, the Board requested and received additional information on certain topics, including: (i) fund performance trends and Fidelity's long-term strategies for certain funds; (ii) the various share classes employed by Fidelity and the attributes of each class, together with similar information on the distribution and servicing payments made by Fidelity or the funds to third-party participants in the distribution channels; (iii) fund profitability, and fund performance in relation to fund profitability; (iv) the methodology with respect to evaluating competitive fund data and peer group classifications and fee comparisons; (v) annual fund profitability margins, with particular focus on certain funds with negative margins; (vi) the realization of fall-out benefits in certain Fidelity business units;
(vii) economies of scale and the way in which they are shared with fund shareholders;(viii) Fidelity's group fee structures, including the group fee schedule of breakpoints;(ix) the impact of cost containment measures on the funds; and (x) the transfer agent fee structure.
Based on its evaluation of all of the conclusions noted above, and after considering all factors it believed relevant, the Board concluded that the advisory fee structures are fair and reasonable, and that the fund's Advisory Contracts should be renewed.
OS-ANN-1215
1.538536.118
Fidelity Advisor® Overseas Fund Class I (formerly Institutional Class)
Annual Report October 31, 2015 |
|
Contents
To view a fund's proxy voting guidelines and proxy voting record for the 12-month period ended June 30, visit http://www.fidelity.com/proxyvotingresults or visit the Securities and Exchange Commission's (SEC) web site at http://www.sec.gov.
You may also call 1-877-208-0098 to request a free copy of the proxy voting guidelines.
Standard & Poor's, S&P and S&P 500 are registered service marks of The McGraw-Hill Companies, Inc. and have been licensed for use by Fidelity Distributors Corporation.
Other third-party marks appearing herein are the property of their respective owners.
All other marks appearing herein are registered or unregistered trademarks or service marks of FMR LLC or an affiliated company. © 2015 FMR LLC. All rights reserved.
This report and the financial statements contained herein are submitted for the general information of the shareholders of the Fund. This report is not authorized for distribution to prospective investors in the Fund unless preceded or accompanied by an effective prospectus.
A fund files its complete schedule of portfolio holdings with the SEC for the first and third quarters of each fiscal year on Form N-Q. Forms N-Q are available on the SEC’s web site at http://www.sec.gov. A fund's Forms N-Q may be reviewed and copied at the SEC’s Public Reference Room in Washington, DC. Information regarding the operation of the SEC's Public Reference Room may be obtained by calling 1-800-SEC-0330.
For a complete list of a fund's portfolio holdings, view the most recent holdings listing, semiannual report, or annual report on Fidelity's web site at http://www.fidelity.com, http://www.advisor.fidelity.com, or http://www.401k.com, as applicable.
NOT FDIC INSURED •MAY LOSE VALUE •NO BANK GUARANTEE
Neither the Fund nor Fidelity Distributors Corporation is a bank.
Performance: The Bottom Line
Average annual total return reflects the change in the value of an investment, assuming reinvestment of distributions from dividend income and capital gains (the profits earned upon the sale of securities that have grown in value, if any) and assuming a constant rate of performance each year.
The hypothetical investment and the average annual total returns do not reflect the deduction of taxes that a shareholder would pay on fund distributions or the redemption of fund shares.
During periods of reimbursement by Fidelity, a fund’s total return will be greater than it would be had the reimbursement not occurred.
How a fund did yesterday is no guarantee of how it will do tomorrow.
Average Annual Total Returns
| For the periods ended October 31, 2015 | Past 1 year | Past 5 years | Past 10 years |
| Class I | 2.82% | 5.56% | 4.69% |
$10,000 Over 10 Years
Let's say hypothetically that $10,000 was invested in Fidelity Advisor® Overseas Fund - Class I on October 31, 2005.
The chart shows how the value of your investment would have changed, and also shows how the MSCI EAFE Index performed over the same period.
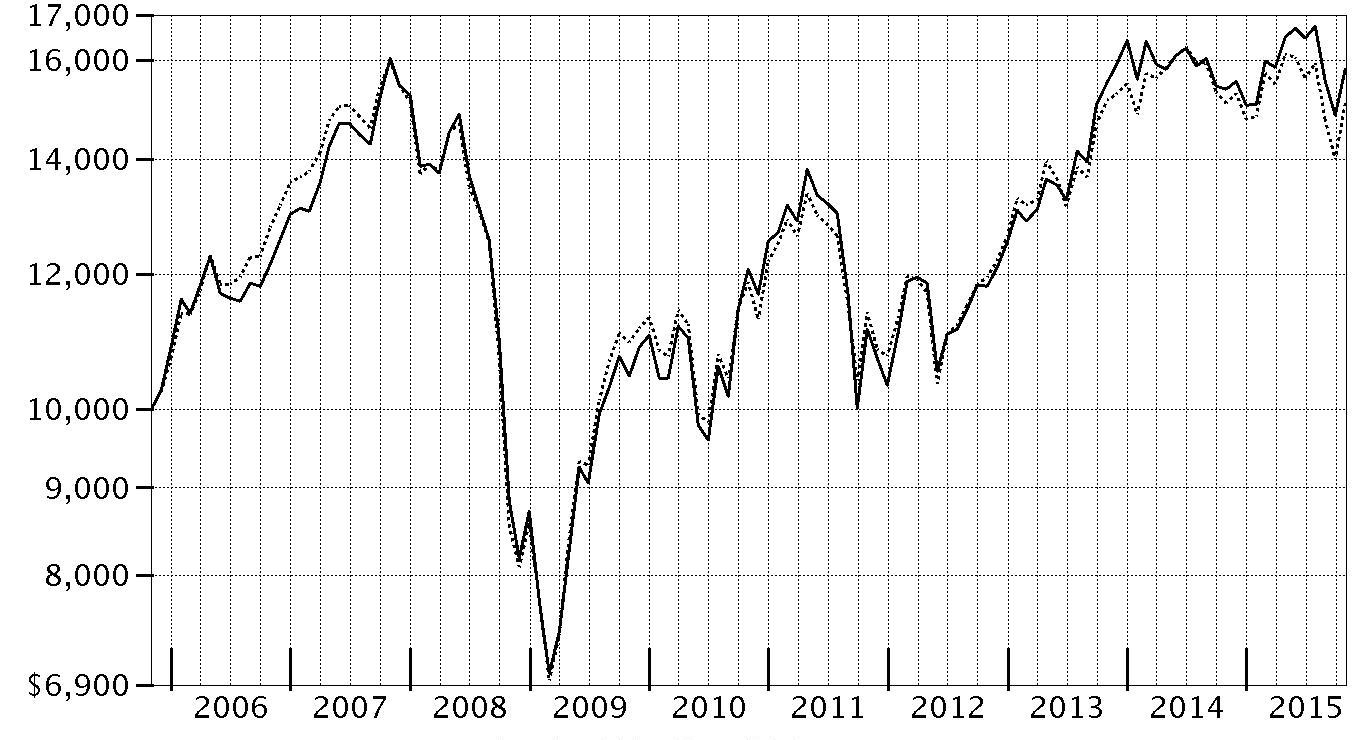
| Period Ending Values |
| $15,813 | Fidelity Advisor® Overseas Fund - Class I |
| $15,102 | MSCI EAFE Index |
Management's Discussion of Fund Performance
Market Recap: International equities suffered a moderate setback for the 12 months ending October 31, 2015, held back by a collapse in commodities prices that hurt resources-related sectors and geographies. The MSCI ACWI (All Country World Index) ex USA Index returned -4.55% for the period, affected also by concerns about global economic growth. Commodity producers remained under pressure for much of the past year, largely related to economic deceleration in China (-1%), the world’s second-largest economy and a leading consumer of raw materials. This effect was exacerbated by U.S. dollar strength relative to global currencies, which weighed on commodities priced in dollars and acutely impacted equity returns within regions most exposed to resources prices. The emerging-markets group, for example, returned about -15% this period. Canada, a significant energy producer, returned roughly -17%. Net energy consumer Japan (+9%) was the best-performing region by far. Only about a quarter of the nearly 50 index countries managed a gain this period: Ireland (+19%) – the EU’s fastest-growing economy – and Israel (+17%) proved top performers; Greece (-56%) and Brazil (-46%), among the worst. As for sectors, energy (-25%) and materials (-16%) declined sharply, whereas the two consumer sectors each gained about 6%.
Comments from Portfolio Manager Graeme Rockett: For the year, the fund’s share classes (excluding sales charges, if applicable) solidly outpaced the 0.08% return of the MSCI EAFE Index. Strong stock selection and market positioning in media and banks provided a boost to the fund’s relative performance. In media, two individual positions were especially helpful: online real estate portals Rightmove in the U.K. and NEXT in Japan, both out-of-index positions, I increased my position in Rightmove, the fund’s No. 1 individual contributor, in late 2014 and 2015 during a period of stock weakness, mainly due to concerns of a new competitor. I believed the new entrant would gain little traction and have limited impact on Rightmove. Fortunately, my views were vindicated and the stock moved up substantially as market concerns proved unfounded. I later reduced the position to lock in a portion of gains. On the downside, stock selection in the software & services segment was detrimental, but an overweighting in this strong-performing segment more than offset the negative impact. Relative results also were affected by a downward fair-value pricing adjustment of 0.77 percentage points. Individual detractors included Melco Crown Philippines Resort in Manila, an out-of-index holding, and German auto manufacturer Volkswagen AG.
The views expressed above reflect those of the portfolio manager(s) only through the end of the period as stated on the cover of this report and do not necessarily represent the views of Fidelity or any other person in the Fidelity organization. Any such views are subject to change at any time based upon market or other conditions and Fidelity disclaims any responsibility to update such views. These views may not be relied on as investment advice and, because investment decisions for a Fidelity fund are based on numerous factors, may not be relied on as an indication of trading intent on behalf of any Fidelity fund.
Investment Summary (Unaudited)
Top Five Stocks as of October 31, 2015
| | % of fund's net assets | % of fund's net assets 6 months ago |
| Nestle SA (Switzerland, Food Products) | 2.4 | 2.3 |
| Sanofi SA (France, Pharmaceuticals) | 2.0 | 1.5 |
| Novo Nordisk A/S Series B (Denmark, Pharmaceuticals) | 1.9 | 1.9 |
| Howden Joinery Group PLC (United Kingdom, Specialty Retail) | 1.8 | 1.3 |
| Wolseley PLC (Bailiwick of Jersey, Trading Companies & Distributors) | 1.8 | 1.4 |
| | 9.9 | |
Top Five Market Sectors as of October 31, 2015
| | % of fund's net assets | % of fund's net assets 6 months ago |
| Consumer Discretionary | 29.7 | 28.8 |
| Financials | 16.5 | 17.8 |
| Health Care | 13.4 | 10.8 |
| Information Technology | 12.9 | 13.5 |
| Consumer Staples | 10.4 | 10.1 |
Top Five Countries as of October 31, 2015
| (excluding cash equivalents) | % of fund's net assets | % of fund's net assets 6 months ago |
| United Kingdom | 22.9 | 22.2 |
| Japan | 17.9 | 18.6 |
| United States of America | 9.5 | 8.4 |
| France | 9.2 | 6.9 |
| Switzerland | 6.1 | 5.7 |
Percentages are adjusted for the effect of futures contracts, if applicable.
Asset Allocation (% of fund's net assets)
| As of October 31, 2015 |
| | Stocks | 99.4% |
| | Short-Term Investments and Net Other Assets (Liabilities) | 0.6% |

| As of April 30, 2015 |
| | Stocks | 98.2% |
| | Short-Term Investments and Net Other Assets (Liabilities) | 1.8% |

Investments October 31, 2015
Showing Percentage of Net Assets
| Common Stocks - 98.6% | | | |
| | | Shares | Value (000s) |
| Australia - 1.7% | | | |
| AMP Ltd. | | 186,173 | $755 |
| BHP Billiton Ltd. | | 146,394 | 2,401 |
| iSelect Ltd. (a) | | 2,540,749 | 2,718 |
| Macquarie Group Ltd. | | 39,016 | 2,362 |
| McMillan Shakespeare Ltd. | | 264,254 | 2,354 |
| WorleyParsons Ltd. | | 273,644 | 1,262 |
|
| TOTAL AUSTRALIA | | | 11,852 |
|
| Austria - 0.7% | | | |
| Wienerberger AG | | 266,700 | 4,917 |
| Bailiwick of Jersey - 2.7% | | | |
| Glencore Xstrata PLC | | 448,172 | 777 |
| Integrated Diagnostics Holdings PLC (a) | | 95,400 | 526 |
| Shire PLC | | 66,000 | 4,998 |
| Wolseley PLC | | 208,312 | 12,230 |
|
| TOTAL BAILIWICK OF JERSEY | | | 18,531 |
|
| Belgium - 0.8% | | | |
| Ageas | | 35,290 | 1,559 |
| KBC Groep NV | | 25,776 | 1,570 |
| UCB SA | | 25,400 | 2,199 |
|
| TOTAL BELGIUM | | | 5,328 |
|
| Bermuda - 0.5% | | | |
| Clear Media Ltd. | | 641,000 | 644 |
| Oriental Watch Holdings Ltd. | | 2,992,000 | 407 |
| Signet Jewelers Ltd. | | 17,300 | 2,611 |
|
| TOTAL BERMUDA | | | 3,662 |
|
| Brazil - 0.7% | | | |
| BB Seguridade Participacoes SA | | 279,900 | 1,931 |
| Cielo SA | | 283,872 | 2,695 |
|
| TOTAL BRAZIL | | | 4,626 |
|
| Canada - 0.6% | | | |
| Entertainment One Ltd. | | 1,061,377 | 3,595 |
| Performance Sports Group Ltd. (a) | | 23,000 | 264 |
|
| TOTAL CANADA | | | 3,859 |
|
| Cayman Islands - 4.1% | | | |
| 58.com, Inc. ADR (a)(b) | | 67,600 | 3,548 |
| Alibaba Group Holding Ltd. sponsored ADR (a) | | 79,400 | 6,656 |
| Autohome, Inc. ADR Class A (a)(b) | | 37,000 | 1,337 |
| Bitauto Holdings Ltd. ADR (a) | | 18,300 | 584 |
| Ctrip.com International Ltd. sponsored ADR (a)(b) | | 47,600 | 4,425 |
| Fu Shou Yuan International Group Ltd. | | 2,729,000 | 1,861 |
| Qunar Cayman Islands Ltd. sponsored ADR (a)(b) | | 37,200 | 1,806 |
| Tencent Holdings Ltd. | | 392,600 | 7,400 |
|
| TOTAL CAYMAN ISLANDS | | | 27,617 |
|
| China - 0.7% | | | |
| Kweichow Moutai Co. Ltd. | | 106,810 | 3,606 |
| TravelSky Technology Ltd. (H Shares) | | 925,000 | 1,365 |
|
| TOTAL CHINA | | | 4,971 |
|
| Denmark - 2.1% | | | |
| Danske Bank A/S | | 51,111 | 1,405 |
| Novo Nordisk A/S: | | | |
| Series B | | 18,115 | 962 |
| Series B sponsored ADR | | 229,400 | 12,199 |
|
| TOTAL DENMARK | | | 14,566 |
|
| France - 9.2% | | | |
| AXA SA | | 49,558 | 1,323 |
| AXA SA sponsored ADR | | 59,100 | 1,578 |
| BNP Paribas SA | | 79,616 | 4,838 |
| Edenred SA | | 51,086 | 940 |
| GameLoft SE (a) | | 238,800 | 1,366 |
| Havas SA | | 589,900 | 5,118 |
| Iliad SA | | 6,166 | 1,297 |
| Ipsen SA | | 77,700 | 4,906 |
| Orange SA | | 400,000 | 7,053 |
| Pernod Ricard SA | | 33,900 | 3,996 |
| Safran SA | | 36,800 | 2,795 |
| Sanofi SA | | 105,913 | 10,684 |
| Sanofi SA sponsored ADR | | 54,500 | 2,744 |
| Societe Generale Series A | | 25,062 | 1,164 |
| Total SA (b) | | 144,390 | 6,983 |
| Ubisoft Entertainment SA (a) | | 93,324 | 2,799 |
| Vivendi SA | | 139,700 | 3,361 |
|
| TOTAL FRANCE | | | 62,945 |
|
| Germany - 3.4% | | | |
| Allianz SE | | 13,848 | 2,424 |
| Axel Springer Verlag AG | | 57,700 | 3,245 |
| Bayer AG | | 61,340 | 8,185 |
| CTS Eventim AG | | 116,482 | 4,561 |
| Deutsche Bank AG | | 31,560 | 884 |
| Deutsche Boerse AG | | 39,269 | 3,617 |
|
| TOTAL GERMANY | | | 22,916 |
|
| Hong Kong - 0.9% | | | |
| AIA Group Ltd. | | 594,800 | 3,488 |
| Television Broadcasts Ltd. | | 644,200 | 2,348 |
|
| TOTAL HONG KONG | | | 5,836 |
|
| India - 0.4% | | | |
| Info Edge India Ltd. | | 214,247 | 2,470 |
| Just Dial Ltd. (a) | | 25,947 | 317 |
|
| TOTAL INDIA | | | 2,787 |
|
| Ireland - 1.1% | | | |
| Glanbia PLC | | 133,000 | 2,580 |
| Kingspan Group PLC (United Kingdom) | | 64,100 | 1,551 |
| Paddy Power PLC (Ireland) | | 28,170 | 3,259 |
|
| TOTAL IRELAND | | | 7,390 |
|
| Isle of Man - 0.8% | | | |
| Playtech Ltd. | | 390,218 | 5,149 |
| Italy - 2.5% | | | |
| Brunello Cucinelli SpA | | 4,900 | 89 |
| DiaSorin S.p.A. | | 43,100 | 1,931 |
| Eni SpA | | 60,300 | 985 |
| Eni SpA sponsored ADR | | 22,300 | 727 |
| Intesa Sanpaolo SpA | | 2,043,400 | 7,119 |
| Mediaset SpA | | 1,057,700 | 5,374 |
| Tod's SpA (b) | | 11,938 | 1,001 |
|
| TOTAL ITALY | | | 17,226 |
|
| Japan - 17.9% | | | |
| Arcland Service Co. Ltd. | | 152,700 | 6,093 |
| Astellas Pharma, Inc. | | 698,000 | 10,131 |
| Daiwa Securities Group, Inc. | | 208,000 | 1,422 |
| Dentsu, Inc. | | 142,100 | 7,989 |
| Fuji Media Holdings, Inc. | | 68,900 | 820 |
| Fukuda Denshi Co. Ltd. | | 14,400 | 703 |
| Hitachi Ltd. | | 703,000 | 4,055 |
| Honda Motor Co. Ltd. | | 97,800 | 3,235 |
| Hoya Corp. | | 127,000 | 5,241 |
| Infomart Corp. (b) | | 46,400 | 438 |
| Japan Tobacco, Inc. | | 138,600 | 4,797 |
| Kakaku.com, Inc. | | 38,700 | 722 |
| Keyence Corp. | | 9,600 | 4,998 |
| Misumi Group, Inc. | | 588,700 | 7,666 |
| Mitsubishi UFJ Financial Group, Inc. | | 883,900 | 5,717 |
| MS&AD Insurance Group Holdings, Inc. | | 65,400 | 1,928 |
| Nakanishi, Inc. | | 17,900 | 610 |
| NEXT Co. Ltd. | | 965,000 | 7,163 |
| Nomura Holdings, Inc. | | 204,200 | 1,284 |
| Olympus Corp. | | 80,900 | 2,729 |
| ORIX Corp. | | 489,000 | 7,141 |
| Proto Corp. | | 36,500 | 474 |
| Rakuten, Inc. | | 468,200 | 6,486 |
| Recruit Holdings Co. Ltd. | | 153,300 | 4,927 |
| SoftBank Corp. | | 18,800 | 1,053 |
| Sony Corp. | | 13,200 | 375 |
| Sony Corp. sponsored ADR | | 64,700 | 1,837 |
| Sumitomo Mitsui Financial Group, Inc. | | 92,300 | 3,682 |
| Sundrug Co. Ltd. | | 17,300 | 911 |
| Suzuki Motor Corp. | | 54,400 | 1,781 |
| Tokio Marine Holdings, Inc. | | 59,300 | 2,285 |
| Toyota Motor Corp. | | 81,200 | 4,975 |
| Welcia Holdings Co. Ltd. (b) | | 174,600 | 8,605 |
|
| TOTAL JAPAN | | | 122,273 |
|
| Korea (South) - 0.9% | | | |
| LG Household & Health Care Ltd. | | 1,675 | 1,389 |
| Medy-Tox, Inc. | | 3,602 | 1,536 |
| NAVER Corp. | | 6,321 | 3,322 |
|
| TOTAL KOREA (SOUTH) | | | 6,247 |
|
| Malta - 0.7% | | | |
| Kambi Group PLC (a) | | 228,400 | 1,504 |
| Unibet Group PLC unit | | 40,100 | 3,534 |
|
| TOTAL MALTA | | | 5,038 |
|
| Mauritius - 0.1% | | | |
| MakeMyTrip Ltd. (a) | | 55,400 | 884 |
| Netherlands - 0.8% | | | |
| AEGON NV | | 109,900 | 674 |
| ASML Holding NV | | 13,857 | 1,286 |
| ING Groep NV: | | | |
| (Certificaten Van Aandelen) | | 181,810 | 2,646 |
| sponsored ADR | | 59,300 | 858 |
|
| TOTAL NETHERLANDS | | | 5,464 |
|
| New Zealand - 0.3% | | | |
| EBOS Group Ltd. | | 99,154 | 916 |
| Ryman Healthcare Group Ltd. | | 237,031 | 1,266 |
|
| TOTAL NEW ZEALAND | | | 2,182 |
|
| Norway - 1.3% | | | |
| Schibsted ASA: | | | |
| (A Shares) | | 78,500 | 2,633 |
| (B Shares) (a) | | 78,500 | 2,448 |
| Statoil ASA sponsored ADR (b) | | 224,000 | 3,620 |
|
| TOTAL NORWAY | | | 8,701 |
|
| Philippines - 0.1% | | | |
| Melco Crown Philippines Resort (a) | | 7,218,600 | 567 |
| South Africa - 1.7% | | | |
| Distell Group Ltd. | | 50,004 | 644 |
| Naspers Ltd. Class N | | 73,400 | 10,751 |
|
| TOTAL SOUTH AFRICA | | | 11,395 |
|
| Spain - 1.9% | | | |
| Atresmedia Corporacion de Medios de Comunicacion SA | | 293,000 | 3,760 |
| Banco Bilbao Vizcaya Argentaria SA | | 118,084 | 1,016 |
| Banco Santander SA: | | | |
| rights 11/3/15 | | 182,829 | 10 |
| (Spain) | | 182,829 | 1,021 |
| Mediaset Espana Comunicacion SA | | 279,417 | 3,397 |
| Melia Hotels International SA (b) | | 265,600 | 3,844 |
|
| TOTAL SPAIN | | | 13,048 |
|
| Sweden - 1.5% | | | |
| Arcam AB (a) | | 25,600 | 481 |
| Getinge AB (B Shares) | | 99,300 | 2,486 |
| Nordea Bank AB | | 187,800 | 2,077 |
| Svenska Cellulosa AB (SCA) (B Shares) | | 145,100 | 4,274 |
| Swedbank AB (A Shares) | | 51,612 | 1,185 |
|
| TOTAL SWEDEN | | | 10,503 |
|
| Switzerland - 6.1% | | | |
| Compagnie Financiere Richemont SA Series A | | 56,683 | 4,860 |
| Credit Suisse Group AG | | 153,908 | 3,839 |
| Nestle SA | | 213,520 | 16,306 |
| Roche Holding AG (participation certificate) | | 12,818 | 3,480 |
| Syngenta AG (Switzerland) | | 20,768 | 6,977 |
| UBS Group AG | | 208,359 | 4,169 |
| UBS Group AG | | 79,777 | 1,598 |
|
| TOTAL SWITZERLAND | | | 41,229 |
|
| United Kingdom - 22.9% | | | |
| Amec Foster Wheeler PLC | | 172,960 | 1,896 |
| AstraZeneca PLC (United Kingdom) | | 98,550 | 6,281 |
| Aviva PLC | | 184,200 | 1,377 |
| B&M European Value Retail S.A. | | 566,690 | 2,913 |
| Barclays PLC | | 1,310,549 | 4,669 |
| Barclays PLC sponsored ADR | | 53,073 | 755 |
| BG Group PLC | | 111,318 | 1,759 |
| BHP Billiton PLC | | 88,741 | 1,418 |
| BP PLC | | 322,200 | 1,915 |
| BP PLC sponsored ADR | | 49,166 | 1,755 |
| Brammer PLC (b) | | 234,232 | 831 |
| Burberry Group PLC | | 59,600 | 1,220 |
| Dechra Pharmaceuticals PLC | | 73,200 | 1,094 |
| Diageo PLC | | 231,700 | 6,680 |
| Dunelm Group PLC | | 167,200 | 2,441 |
| Foxtons Group PLC | | 470,700 | 1,451 |
| Howden Joinery Group PLC | | 1,740,900 | 12,442 |
| HSBC Holdings PLC: | | | |
| (United Kingdom) | | 150,500 | 1,176 |
| sponsored ADR | | 140,191 | 5,477 |
| ITV PLC | | 1,909,400 | 7,429 |
| Johnson Matthey PLC | | 82,919 | 3,304 |
| JUST EAT Ltd. (a) | | 361,914 | 2,377 |
| LivaNova PLC (a) | | 19,842 | 1,315 |
| Lloyds Banking Group PLC | | 6,238,299 | 7,081 |
| M&C Saatchi PLC | | 887,505 | 4,491 |
| Micro Focus International PLC | | 20,400 | 395 |
| Moneysupermarket.com Group PLC | | 565,100 | 2,911 |
| Nahl Group PCL | | 106,110 | 671 |
| Poundland Group PLC | | 167,361 | 710 |
| Prudential PLC | | 85,416 | 1,995 |
| Rightmove PLC | | 136,700 | 8,090 |
| Rio Tinto PLC | | 38,132 | 1,390 |
| Rolls-Royce Group PLC | | 196,674 | 2,080 |
| Royal Bank of Scotland Group PLC (a) | | 120,080 | 587 |
| Royal Dutch Shell PLC: | | | |
| Class A (United Kingdom) | | 233,928 | 6,107 |
| Class B (United Kingdom) | | 156,090 | 4,087 |
| SABMiller PLC | | 133,700 | 8,234 |
| Shawbrook Group Ltd. | | 409,600 | 2,142 |
| Sports Direct International PLC (a) | | 234,300 | 2,518 |
| SThree PLC | | 190,600 | 1,058 |
| Taylor Wimpey PLC | | 715,100 | 2,183 |
| Ted Baker PLC | | 57,800 | 2,697 |
| Tesco PLC | | 824,300 | 2,325 |
| Thomas Cook Group PLC (a) | | 489,700 | 928 |
| Travis Perkins PLC | | 81,800 | 2,416 |
| Virgin Money Holdings Uk PLC | | 622,500 | 3,722 |
| Vodafone Group PLC | | 2,915,800 | 9,596 |
| William Hill PLC | | 638,566 | 3,116 |
| Zoopla Property Group PLC (b) | | 629,300 | 2,355 |
|
| TOTAL UNITED KINGDOM | | | 155,860 |
|
| United States of America - 9.5% | | | |
| Alphabet, Inc.: | | | |
| Class A (a) | | 7,400 | 5,457 |
| Class C | | 4,014 | 2,853 |
| BlackRock, Inc. Class A | | 15,200 | 5,350 |
| China Biologic Products, Inc. (a) | | 12,300 | 1,401 |
| Chipotle Mexican Grill, Inc. (a) | | 2,700 | 1,729 |
| Dunkin' Brands Group, Inc. (b) | | 41,100 | 1,702 |
| eBay, Inc. (a) | | 44,700 | 1,247 |
| Facebook, Inc. Class A (a) | | 58,700 | 5,986 |
| Monsanto Co. | | 26,700 | 2,489 |
| Monster Beverage Corp. (a) | | 26,200 | 3,572 |
| PayPal Holdings, Inc. (a) | | 59,900 | 2,157 |
| Priceline Group, Inc. (a) | | 5,700 | 8,289 |
| Sprouts Farmers Market LLC (a) | | 181,700 | 3,703 |
| Tiffany & Co., Inc. | | 43,000 | 3,545 |
| TripAdvisor, Inc. (a) | | 17,900 | 1,500 |
| Visa, Inc. Class A | | 112,500 | 8,728 |
| World Wrestling Entertainment, Inc. Class A (b) | | 135,200 | 2,411 |
| Zillow Group, Inc. (a)(b) | | 36,400 | 1,121 |
| Zillow Group, Inc. Class C (a)(b) | | 52,000 | 1,440 |
|
| TOTAL UNITED STATES OF AMERICA | | | 64,680 |
|
| TOTAL COMMON STOCKS | | | |
| (Cost $604,390) | | | 672,249 |
|
| Nonconvertible Preferred Stocks - 0.8% | | | |
| Germany - 0.8% | | | |
| Sartorius AG (non-vtg.) | | 16,700 | 3,779 |
| Volkswagen AG | | 17,100 | 2,053 |
|
| TOTAL GERMANY | | | 5,832 |
|
| United Kingdom - 0.0% | | | |
| Rolls-Royce Group PLC | | 18,231,679 | 28 |
| TOTAL NONCONVERTIBLE PREFERRED STOCKS | | | |
| (Cost $5,373) | | | 5,860 |
|
| Money Market Funds - 4.8% | | | |
| Fidelity Cash Central Fund, 0.18% (c) | | 8,502,973 | 8,503 |
| Fidelity Securities Lending Cash Central Fund, 0.19% (c)(d) | | 24,107,293 | 24,107 |
| TOTAL MONEY MARKET FUNDS | | | |
| (Cost $32,610) | | | 32,610 |
| TOTAL INVESTMENT PORTFOLIO - 104.2% | | | |
| (Cost $642,373) | | | 710,719 |
| NET OTHER ASSETS (LIABILITIES) - (4.2)% | | | (28,836) |
| NET ASSETS - 100% | | | $681,883 |
Categorizations in the Schedule of Investments are based on country or territory of incorporation.
Legend
(a) Non-income producing
(b) Security or a portion of the security is on loan at period end.
(c) Affiliated fund that is generally available only to investment companies and other accounts managed by Fidelity Investments. The rate quoted is the annualized seven-day yield of the fund at period end. A complete unaudited listing of the fund's holdings as of its most recent quarter end is available upon request. In addition, each Fidelity Central Fund's financial statements , which are not covered by the Fund's Report of Independent Registered Public Accounting Firm, are available on the SEC's website or upon request.
(d) Investment made with cash collateral received from securities on loan.
Affiliated Central Funds
Information regarding fiscal year to date income earned by the Fund from investments in Fidelity Central Funds is as follows:
| Fund | Income earned |
| | (Amounts in thousands) |
| Fidelity Cash Central Fund | $12 |
| Fidelity Securities Lending Cash Central Fund | 347 |
| Total | $359 |
Investment Valuation
The following is a summary of the inputs used, as of October 31, 2015, involving the Fund's assets and liabilities carried at fair value. The inputs or methodology used for valuing securities may not be an indication of the risk associated with investing in those securities. For more information on valuation inputs, and their aggregation into the levels used below, please refer to the Investment Valuation section in the accompanying Notes to Financial Statements.
| | Valuation Inputs at Reporting Date: |
| Description | Total | Level 1 | Level 2 | Level 3 |
| (Amounts in thousands) | | | | |
| Investments in Securities: | | | | |
| Equities: | | | | |
| Consumer Discretionary | $199,175 | $137,849 | $61,326 | $-- |
| Consumer Staples | 71,622 | 24,118 | 47,504 | -- |
| Energy | 31,096 | 7,998 | 23,098 | -- |
| Financials | 114,351 | 55,941 | 58,410 | -- |
| Health Care | 92,302 | 46,483 | 45,819 | -- |
| Industrials | 44,274 | 12,222 | 32,052 | -- |
| Information Technology | 87,534 | 65,769 | 21,765 | -- |
| Materials | 18,756 | 6,570 | 12,186 | -- |
| Telecommunication Services | 18,999 | 1,297 | 17,702 | -- |
| Money Market Funds | 32,610 | 32,610 | -- | -- |
| Total Investments in Securities: | $710,719 | $390,857 | $319,862 | $-- |
The following is a summary of transfers between Level 1 and Level 2 for the period ended October 31, 2015. Transfers are assumed to have occurred at the beginning of the period, and are primarily attributable to the valuation techniques used for foreign equity securities, as discussed in the accompanying Notes to Financial Statements:
| Transfers | Total (000s) |
| Level 1 to Level 2 | $29,875 |
| Level 2 to Level 1 | $8,917 |
See accompanying notes which are an integral part of the financial statements.
Financial Statements
Statement of Assets and Liabilities
| Amounts in thousands (except per-share amounts) | | October 31, 2015 |
| Assets | | |
Investment in securities, at value (including securities loaned of $23,703) — See accompanying schedule:
Unaffiliated issuers (cost $609,763) | $678,109 | |
| Fidelity Central Funds (cost $32,610) | 32,610 | |
| Total Investments (cost $642,373) | | $710,719 |
| Receivable for investments sold | | 2,821 |
| Receivable for fund shares sold | | 612 |
| Dividends receivable | | 2,081 |
| Distributions receivable from Fidelity Central Funds | | 37 |
| Prepaid expenses | | 2 |
| Other receivables | | 69 |
| Total assets | | 716,341 |
| Liabilities | | |
| Payable to custodian bank | $5 | |
| Payable for investments purchased | 2,689 | |
| Payable for fund shares redeemed | 6,828 | |
| Accrued management fee | 465 | |
| Distribution and service plan fees payable | 151 | |
| Other affiliated payables | 137 | |
| Other payables and accrued expenses | 76 | |
| Collateral on securities loaned, at value | 24,107 | |
| Total liabilities | | 34,458 |
| Net Assets | | $681,883 |
| Net Assets consist of: | | |
| Paid in capital | | $638,469 |
| Undistributed net investment income | | 2,334 |
| Accumulated undistributed net realized gain (loss) on investments and foreign currency transactions | | (27,174) |
| Net unrealized appreciation (depreciation) on investments and assets and liabilities in foreign currencies | | 68,254 |
| Net Assets | | $681,883 |
| Calculation of Maximum Offering Price | | |
| Class A: | | |
| Net Asset Value and redemption price per share ($78,401 ÷ 3,631.68 shares) | | $21.59 |
| Maximum offering price per share (100/94.25 of $21.59) | | $22.91 |
| Class T: | | |
| Net Asset Value and redemption price per share ($285,258 ÷ 12,902.54 shares) | | $22.11 |
| Maximum offering price per share (100/96.50 of $22.11) | | $22.91 |
| Class B: | | |
| Net Asset Value and offering price per share ($1,633 ÷ 78.54 shares)(a) | | $20.79 |
| Class C: | | |
| Net Asset Value and offering price per share ($18,734 ÷ 893.14 shares)(a) | | $20.98 |
| Class I: | | |
| Net Asset Value, offering price and redemption price per share ($297,857 ÷ 13,503.03 shares) | | $22.06 |
(a) Redemption price per share is equal to net asset value less any applicable contingent deferred sales charge.
See accompanying notes which are an integral part of the financial statements.
Statement of Operations
| Amounts in thousands | | Year ended October 31, 2015 |
| Investment Income | | |
| Dividends | | $16,383 |
| Income from Fidelity Central Funds | | 359 |
| Income before foreign taxes withheld | | 16,742 |
| Less foreign taxes withheld | | (998) |
| Total income | | 15,744 |
| Expenses | | |
| Management fee | | |
| Basic fee | $4,736 | |
| Performance adjustment | 616 | |
| Transfer agent fees | 1,383 | |
| Distribution and service plan fees | 1,838 | |
| Accounting and security lending fees | 347 | |
| Custodian fees and expenses | 111 | |
| Independent trustees' compensation | 3 | |
| Registration fees | 68 | |
| Audit | 106 | |
| Legal | 4 | |
| Miscellaneous | 16 | |
| Total expenses before reductions | 9,228 | |
| Expense reductions | (43) | 9,185 |
| Net investment income (loss) | | 6,559 |
| Realized and Unrealized Gain (Loss) | | |
| Net realized gain (loss) on: | | |
| Investment securities: | | |
| Unaffiliated issuers | 26,041 | |
| Foreign currency transactions | (250) | |
| Total net realized gain (loss) | | 25,791 |
Change in net unrealized appreciation (depreciation) on:
Investment securities | (15,386) | |
| Assets and liabilities in foreign currencies | (4) | |
| Total change in net unrealized appreciation (depreciation) | | (15,390) |
| Net gain (loss) | | 10,401 |
| Net increase (decrease) in net assets resulting from operations | | $16,960 |
See accompanying notes which are an integral part of the financial statements.
Statement of Changes in Net Assets
| Amounts in thousands | Year ended October 31, 2015 | Year ended October 31, 2014 |
| Increase (Decrease) in Net Assets | | |
| Operations | | |
| Net investment income (loss) | $6,559 | $8,670 |
| Net realized gain (loss) | 25,791 | 57,938 |
| Change in net unrealized appreciation (depreciation) | (15,390) | (75,525) |
| Net increase (decrease) in net assets resulting from operations | 16,960 | (8,917) |
| Distributions to shareholders from net investment income | (1,529) | (6,228) |
| Distributions to shareholders from net realized gain | – | (2,640) |
| Total distributions | (1,529) | (8,868) |
| Share transactions - net increase (decrease) | (42,896) | (1,301) |
| Redemption fees | 9 | 19 |
| Total increase (decrease) in net assets | (27,456) | (19,067) |
| Net Assets | | |
| Beginning of period | 709,339 | 728,406 |
| End of period (including undistributed net investment income of $2,334 and undistributed net investment income of $1,479, respectively) | $681,883 | $709,339 |
See accompanying notes which are an integral part of the financial statements.
Financial Highlights — Fidelity Advisor Overseas Fund Class A
| | | October 31, | | | |
| Years ended October 31, | 2015 | 2014 | 2013 | 2012 | 2011 |
| Selected Per–Share Data | | | | | |
| Net asset value, beginning of period | $21.09 | $21.61 | $16.76 | $16.13 | $17.77 |
| Income from Investment Operations | | | | | |
| Net investment income (loss)A | .19 | .24 | .17 | .23 | .16 |
| Net realized and unrealized gain (loss) | .33 | (.50) | 4.97 | .64 | (1.54) |
| Total from investment operations | .52 | (.26) | 5.14 | .87 | (1.38) |
| Distributions from net investment income | (.02) | (.18) | (.25) | (.24) | (.21) |
| Distributions from net realized gain | – | (.08) | (.04) | – | (.05) |
| Total distributions | (.02) | (.26) | (.29) | (.24) | (.26) |
| Redemption fees added to paid in capitalA,B | – | – | – | – | – |
| Net asset value, end of period | $21.59 | $21.09 | $21.61 | $16.76 | $16.13 |
| Total ReturnC,D | 2.46% | (1.24)% | 31.13% | 5.51% | (7.95)% |
| Ratios to Average Net AssetsE,F | | | | | |
| Expenses before reductions | 1.35% | 1.30% | 1.37% | 1.33% | 1.34% |
| Expenses net of fee waivers, if any | 1.35% | 1.30% | 1.37% | 1.33% | 1.34% |
| Expenses net of all reductions | 1.34% | 1.30% | 1.36% | 1.32% | 1.32% |
| Net investment income (loss) | .89% | 1.10% | .91% | 1.43% | .90% |
| Supplemental Data | | | | | |
| Net assets, end of period (in millions) | $78 | $65 | $69 | $60 | $60 |
| Portfolio turnover rateG | 29% | 39% | 37% | 36% | 44% |
A Calculated based on average shares outstanding during the period.
B Amount represents less than $.005 per share.
C Total returns would have been lower if certain expenses had not been reduced during the applicable periods shown.
D Total returns do not include the effect of the sales charges.
E Fees and expenses of any underlying Fidelity Central Funds are not included in the Fund's expense ratio. The Fund indirectly bears its proportionate share of the expenses of any underlying Fidelity Central Funds.
F Expense ratios reflect operating expenses of the class. Expenses before reductions do not reflect amounts reimbursed by the investment adviser or reductions from brokerage service arrangements or reductions from other expense offset arrangements and do not represent the amount paid by the class during periods when reimbursements or reductions occur. Expenses net of fee waivers reflect expenses after reimbursement by the investment adviser but prior to reductions from brokerage service arrangements or other expense offset arrangements. Expenses net of all reductions represent the net expenses paid by the class.
G Amount does not include the portfolio activity of any underlying Fidelity Central Funds.
See accompanying notes which are an integral part of the financial statements.
Financial Highlights — Fidelity Advisor Overseas Fund Class T
| | | October 31, | | | |
| Years ended October 31, | 2015 | 2014 | 2013 | 2012 | 2011 |
| Selected Per–Share Data | | | | | |
| Net asset value, beginning of period | $21.62 | $22.16 | $17.16 | $16.50 | $18.18 |
| Income from Investment Operations | | | | | |
| Net investment income (loss)A | .15 | .21 | .14 | .20 | .13 |
| Net realized and unrealized gain (loss) | .34 | (.52) | 5.11 | .66 | (1.59) |
| Total from investment operations | .49 | (.31) | 5.25 | .86 | (1.46) |
| Distributions from net investment income | – | (.15) | (.21) | (.20) | (.17) |
| Distributions from net realized gain | – | (.08) | (.04) | – | (.05) |
| Total distributions | – | (.23) | (.25) | (.20) | (.22) |
| Redemption fees added to paid in capitalA,B | – | – | – | – | – |
| Net asset value, end of period | $22.11 | $21.62 | $22.16 | $17.16 | $16.50 |
| Total ReturnC,D | 2.27% | (1.42)% | 30.96% | 5.32% | (8.17)% |
| Ratios to Average Net AssetsE,F | | | | | |
| Expenses before reductions | 1.55% | 1.48% | 1.53% | 1.51% | 1.52% |
| Expenses net of fee waivers, if any | 1.55% | 1.48% | 1.53% | 1.51% | 1.51% |
| Expenses net of all reductions | 1.55% | 1.48% | 1.52% | 1.50% | 1.49% |
| Net investment income (loss) | .69% | .92% | .74% | 1.25% | .73% |
| Supplemental Data | | | | | |
| Net assets, end of period (in millions) | $285 | $293 | $329 | $271 | $305 |
| Portfolio turnover rateG | 29% | 39% | 37% | 36% | 44% |
A Calculated based on average shares outstanding during the period.
B Amount represents less than $.005 per share.
C Total returns would have been lower if certain expenses had not been reduced during the applicable periods shown.
D Total returns do not include the effect of the sales charges.
E Fees and expenses of any underlying Fidelity Central Funds are not included in the Fund's expense ratio. The Fund indirectly bears its proportionate share of the expenses of any underlying Fidelity Central Funds.
F Expense ratios reflect operating expenses of the class. Expenses before reductions do not reflect amounts reimbursed by the investment adviser or reductions from brokerage service arrangements or reductions from other expense offset arrangements and do not represent the amount paid by the class during periods when reimbursements or reductions occur. Expenses net of fee waivers reflect expenses after reimbursement by the investment adviser but prior to reductions from brokerage service arrangements or other expense offset arrangements. Expenses net of all reductions represent the net expenses paid by the class.
G Amount does not include the portfolio activity of any underlying Fidelity Central Funds.
See accompanying notes which are an integral part of the financial statements.
Financial Highlights — Fidelity Advisor Overseas Fund Class B
| | | October 31, | | | |
| Years ended October 31, | 2015 | 2014 | 2013 | 2012 | 2011 |
| Selected Per–Share Data | | | | | |
| Net asset value, beginning of period | $20.46 | $21.02 | $16.25 | $15.58 | $17.18 |
| Income from Investment Operations | | | | | |
| Net investment income (loss)A | .02 | .07 | .03 | .10 | .03 |
| Net realized and unrealized gain (loss) | .31 | (.49) | 4.85 | .63 | (1.51) |
| Total from investment operations | .33 | (.42) | 4.88 | .73 | (1.48) |
| Distributions from net investment income | – | (.06) | (.07) | (.06) | (.08) |
| Distributions from net realized gain | – | (.08) | (.04) | – | (.05) |
| Total distributions | – | (.14) | (.11) | (.06) | (.12)B |
| Redemption fees added to paid in capitalA,C | – | – | – | – | – |
| Net asset value, end of period | $20.79 | $20.46 | $21.02 | $16.25 | $15.58 |
| Total ReturnD,E | 1.61% | (2.03)% | 30.21% | 4.72% | (8.67)% |
| Ratios to Average Net AssetsF,G | | | | | |
| Expenses before reductions | 2.16% | 2.09% | 2.12% | 2.09% | 2.10% |
| Expenses net of fee waivers, if any | 2.15% | 2.09% | 2.12% | 2.09% | 2.09% |
| Expenses net of all reductions | 2.15% | 2.09% | 2.11% | 2.07% | 2.07% |
| Net investment income (loss) | .09% | .31% | .16% | .67% | .15% |
| Supplemental Data | | | | | |
| Net assets, end of period (in millions) | $2 | $2 | $3 | $3 | $4 |
| Portfolio turnover rateH | 29% | 39% | 37% | 36% | 44% |
A Calculated based on average shares outstanding during the period.
B Total distributions of $.12 per share is comprised of distributions from net investment income of $.079 and distributions from net realized gain of $.045 per share.
C Amount represents less than $.005 per share.
D Total returns would have been lower if certain expenses had not been reduced during the applicable periods shown.
E Total returns do not include the effect of the contingent deferred sales charge.
F Fees and expenses of any underlying Fidelity Central Funds are not included in the Fund's expense ratio. The Fund indirectly bears its proportionate share of the expenses of any underlying Fidelity Central Funds.
G Expense ratios reflect operating expenses of the class. Expenses before reductions do not reflect amounts reimbursed by the investment adviser or reductions from brokerage service arrangements or reductions from other expense offset arrangements and do not represent the amount paid by the class during periods when reimbursements or reductions occur. Expenses net of fee waivers reflect expenses after reimbursement by the investment adviser but prior to reductions from brokerage service arrangements or other expense offset arrangements. Expenses net of all reductions represent the net expenses paid by the class.
H Amount does not include the portfolio activity of any underlying Fidelity Central Funds.
See accompanying notes which are an integral part of the financial statements.
Financial Highlights — Fidelity Advisor Overseas Fund Class C
| | | October 31, | | | |
| Years ended October 31, | 2015 | 2014 | 2013 | 2012 | 2011 |
| Selected Per–Share Data | | | | | |
| Net asset value, beginning of period | $20.63 | $21.21 | $16.43 | $15.78 | $17.39 |
| Income from Investment Operations | | | | | |
| Net investment income (loss)A | .02 | .07 | .03 | .11 | .03 |
| Net realized and unrealized gain (loss) | .33 | (.50) | 4.89 | .64 | (1.52) |
| Total from investment operations | .35 | (.43) | 4.92 | .75 | (1.49) |
| Distributions from net investment income | – | (.07) | (.10) | (.10) | (.07) |
| Distributions from net realized gain | – | (.08) | (.04) | – | (.05) |
| Total distributions | – | (.15) | (.14) | (.10) | (.12) |
| Redemption fees added to paid in capitalA,B | – | – | – | – | – |
| Net asset value, end of period | $20.98 | $20.63 | $21.21 | $16.43 | $15.78 |
| Total ReturnC,D | 1.70% | (2.06)% | 30.16% | 4.78% | (8.67)% |
| Ratios to Average Net AssetsE,F | | | | | |
| Expenses before reductions | 2.15% | 2.08% | 2.12% | 2.09% | 2.09% |
| Expenses net of fee waivers, if any | 2.15% | 2.08% | 2.12% | 2.09% | 2.09% |
| Expenses net of all reductions | 2.14% | 2.08% | 2.10% | 2.07% | 2.07% |
| Net investment income (loss) | .09% | .32% | .16% | .67% | .15% |
| Supplemental Data | | | | | |
| Net assets, end of period (in millions) | $19 | $19 | $21 | $16 | $19 |
| Portfolio turnover rateG | 29% | 39% | 37% | 36% | 44% |
A Calculated based on average shares outstanding during the period.
B Amount represents less than $.005 per share.
C Total returns would have been lower if certain expenses had not been reduced during the applicable periods shown.
D Total returns do not include the effect of the contingent deferred sales charge.
E Fees and expenses of any underlying Fidelity Central Funds are not included in the Fund's expense ratio. The Fund indirectly bears its proportionate share of the expenses of any underlying Fidelity Central Funds.
F Expense ratios reflect operating expenses of the class. Expenses before reductions do not reflect amounts reimbursed by the investment adviser or reductions from brokerage service arrangements or reductions from other expense offset arrangements and do not represent the amount paid by the class during periods when reimbursements or reductions occur. Expenses net of fee waivers reflect expenses after reimbursement by the investment adviser but prior to reductions from brokerage service arrangements or other expense offset arrangements. Expenses net of all reductions represent the net expenses paid by the class.
G Amount does not include the portfolio activity of any underlying Fidelity Central Funds.
See accompanying notes which are an integral part of the financial statements.
Financial Highlights — Fidelity Advisor Overseas Fund Class I
| | | October 31, | | | |
| Years ended October 31, | 2015 | 2014 | 2013 | 2012 | 2011 |
| Selected Per–Share Data | | | | | |
| Net asset value, beginning of period | $21.55 | $22.07 | $17.11 | $16.45 | $18.10 |
| Income from Investment Operations | | | | | |
| Net investment income (loss)A | .27 | .32 | .24 | .29 | .23 |
| Net realized and unrealized gain (loss) | .34 | (.52) | 5.08 | .65 | (1.59) |
| Total from investment operations | .61 | (.20) | 5.32 | .94 | (1.36) |
| Distributions from net investment income | (.10) | (.24) | (.31) | (.28) | (.24) |
| Distributions from net realized gain | – | (.08) | (.04) | – | (.05) |
| Total distributions | (.10) | (.32) | (.36)B | (.28) | (.29) |
| Redemption fees added to paid in capitalA,C | – | – | – | – | – |
| Net asset value, end of period | $22.06 | $21.55 | $22.07 | $17.11 | $16.45 |
| Total ReturnD | 2.82% | (.95)% | 31.63% | 5.91% | (7.70)% |
| Ratios to Average Net AssetsE,F | | | | | |
| Expenses before reductions | 1.03% | .96% | 1.02% | .99% | 1.00% |
| Expenses net of fee waivers, if any | 1.03% | .96% | 1.02% | .99% | .99% |
| Expenses net of all reductions | 1.02% | .96% | 1.01% | .97% | .97% |
| Net investment income (loss) | 1.21% | 1.44% | 1.26% | 1.77% | 1.25% |
| Supplemental Data | | | | | |
| Net assets, end of period (in millions) | $298 | $330 | $307 | $257 | $349 |
| Portfolio turnover rateG | 29% | 39% | 37% | 36% | 44% |
A Calculated based on average shares outstanding during the period.
B Total distributions of $.36 per share is comprised of distributions from net investment income of $.314 and distributions from net realized gain of $.041 per share.
C Amount represents less than $.005 per share.
D Total returns would have been lower if certain expenses had not been reduced during the applicable periods shown.
E Fees and expenses of any underlying Fidelity Central Funds are not included in the Fund's expense ratio. The Fund indirectly bears its proportionate share of the expenses of any underlying Fidelity Central Funds.
F Expense ratios reflect operating expenses of the class. Expenses before reductions do not reflect amounts reimbursed by the investment adviser or reductions from brokerage service arrangements or reductions from other expense offset arrangements and do not represent the amount paid by the class during periods when reimbursements or reductions occur. Expenses net of fee waivers reflect expenses after reimbursement by the investment adviser but prior to reductions from brokerage service arrangements or other expense offset arrangements. Expenses net of all reductions represent the net expenses paid by the class.
G Amount does not include the portfolio activity of any underlying Fidelity Central Funds.
See accompanying notes which are an integral part of the financial statements.
Notes to Financial Statements
For the period ended October 31, 2015
(Amounts in thousands except percentages)
1. Organization.
Fidelity Advisor Overseas Fund (the Fund) is a fund of Fidelity Advisor Series VIII (the Trust) and is authorized to issue an unlimited number of shares. The Trust is registered under the Investment Company Act of 1940, as amended (the 1940 Act), as an open-end management investment company organized as a Massachusetts business trust. The Fund offers Class A, Class T, Class C and Class I (formerly Institutional Class) shares, each of which, along with Class B shares, has equal rights as to assets and voting privileges. Class B shares are closed to new accounts and additional purchases, except for exchanges and reinvestments. Each class has exclusive voting rights with respect to matters that affect that class. Class B shares will automatically convert to Class A shares after a holding period of seven years from the initial date of purchase.
2. Investments in Fidelity Central Funds.
The Fund invests in Fidelity Central Funds, which are open-end investment companies generally available only to other investment companies and accounts managed by the investment adviser and its affiliates. The Fund's Schedule of Investments lists each of the Fidelity Central Funds held as of period end, if any, as an investment of the Fund, but does not include the underlying holdings of each Fidelity Central Fund. As an Investing Fund, the Fund indirectly bears its proportionate share of the expenses of the underlying Fidelity Central Funds.
The Money Market Central Funds seek preservation of capital and current income and are managed by Fidelity Investments Money Management, Inc. (FIMM), an affiliate of the investment adviser. Annualized expenses of the Money Market Central Funds as of their most recent shareholder report date are less than .005%.
A complete unaudited list of holdings for each Fidelity Central Fund is available upon request or at the Securities and Exchange Commission (the SEC) website at www.sec.gov. In addition, the financial statements of the Fidelity Central Funds, which are not covered by the Fund's Report of Independent Registered Public Accounting Firm, are available on the SEC website or upon request.
3. Significant Accounting Policies.
The financial statements have been prepared in conformity with accounting principles generally accepted in the United States of America (GAAP), which require management to make certain estimates and assumptions at the date of the financial statements. Actual results could differ from those estimates. Subsequent events, if any, through the date that the financial statements were issued have been evaluated in the preparation of the financial statements. The following summarizes the significant accounting policies of the Fund:
Investment Valuation. Investments are valued as of 4:00 p.m. Eastern time on the last calendar day of the period. The Board of Trustees (the Board) has delegated the day to day responsibility for the valuation of the Fund's investments to the Fidelity Management & Research Company (FMR) Fair Value Committee (the Committee). In accordance with valuation policies and procedures approved by the Board, the Fund attempts to obtain prices from one or more third party pricing vendors or brokers to value its investments. When current market prices, quotations or currency exchange rates are not readily available or reliable, investments will be fair valued in good faith by the Committee, in accordance with procedures adopted by the Board. Factors used in determining fair value vary by investment type and may include market or investment specific events. The frequency with which these procedures are used cannot be predicted and they may be utilized to a significant extent. The Committee oversees the Fund's valuation policies and procedures and reports to the Board on the Committee's activities and fair value determinations. The Board monitors the appropriateness of the procedures used in valuing the Fund's investments and ratifies the fair value determinations of the Committee.
The Fund categorizes the inputs to valuation techniques used to value its investments into a disclosure hierarchy consisting of three levels as shown below:
- Level 1 – quoted prices in active markets for identical investments
- Level 2 – other significant observable inputs (including quoted prices for similar investments, interest rates, prepayment speeds, etc.)
- Level 3 – unobservable inputs (including the Fund's own assumptions based on the best information available)
Valuation techniques used to value the Fund's investments by major category are as follows:
Equity securities, including restricted securities, for which market quotations are readily available, are valued at the last reported sale price or official closing price as reported by a third party pricing vendor on the primary market or exchange on which they are traded and are categorized as Level 1 in the hierarchy. In the event there were no sales during the day or closing prices are not available, securities are valued at the last quoted bid price or may be valued using the last available price and are generally categorized as Level 2 in the hierarchy. For foreign equity securities, when market or security specific events arise, comparisons to the valuation of American Depositary Receipts (ADRs), futures contracts, Exchange-Traded Funds (ETFs) and certain indexes as well as quoted prices for similar securities may be used and would be categorized as Level 2 in the hierarchy. Utilizing these techniques may result in transfers between Level 1 and Level 2. For equity securities, including restricted securities, where observable inputs are limited, assumptions about market activity and risk are used and these securities may be categorized as Level 3 in the hierarchy.
Investments in open-end mutual funds, including the Fidelity Central Funds, are valued at their closing net asset value (NAV) each business day and are categorized as Level 1 in the hierarchy.
Changes in valuation techniques may result in transfers in or out of an assigned level within the disclosure hierarchy. The aggregate value of investments by input level, as of October 31, 2015, including information on transfers between Levels 1 and 2, is included at the end of the Fund's Schedule of Investments.
Foreign Currency. The Fund may use foreign currency contracts to facilitate transactions in foreign-denominated securities. Gains and losses from these transactions may arise from changes in the value of the foreign currency or if the counterparties do not perform under the contracts' terms.
Foreign-denominated assets, including investment securities, and liabilities are translated into U.S. dollars at the exchange rates at period end. Purchases and sales of investment securities, income and dividends received and expenses denominated in foreign currencies are translated into U.S. dollars at the exchange rate in effect on the transaction date.
The effects of exchange rate fluctuations on investments are included with the net realized and unrealized gain (loss) on investment securities. Other foreign currency transactions resulting in realized and unrealized gain (loss) are disclosed separately.
Investment Transactions and Income. For financial reporting purposes, the Fund's investment holdings and NAV include trades executed through the end of the last business day of the period. The NAV per share for processing shareholder transactions is calculated as of the close of business of the New York Stock Exchange (NYSE), normally 4:00 p.m. Eastern time and includes trades executed through the end of the prior business day. Gains and losses on securities sold are determined on the basis of identified cost and may include proceeds received from litigation. Dividend income is recorded on the ex-dividend date, except for certain dividends from foreign securities where the ex-dividend date may have passed, which are recorded as soon as the Fund is informed of the ex-dividend date. Non-cash dividends included in dividend income, if any, are recorded at the fair market value of the securities received. Income and capital gain distributions from Fidelity Central Funds, if any, are recorded on the ex-dividend date. Investment income is recorded net of foreign taxes withheld where recovery of such taxes is uncertain.
Class Allocations and Expenses. Investment income, realized and unrealized capital gains and losses, common expenses of the Fund, and certain fund-level expense reductions, if any, are allocated daily on a pro-rata basis to each class based on the relative net assets of each class to the total net assets of the Fund. Each class differs with respect to transfer agent and distribution and service plan fees incurred. Certain expense reductions may also differ by class. For the reporting period, the allocated portion of income and expenses to each class as a percent of its average net assets may vary due to the timing of recording these transactions in relation to fluctuating net assets of the classes. Expenses directly attributable to a fund are charged to that fund. Expenses attributable to more than one fund are allocated among the respective funds on the basis of relative net assets or other appropriate methods. Expense estimates are accrued in the period to which they relate and adjustments are made when actual amounts are known.
Income Tax Information and Distributions to Shareholders. Each year, the Fund intends to qualify as a regulated investment company under Subchapter M of the Internal Revenue Code, including distributing substantially all of its taxable income and realized gains. As a result, no provision for U.S. Federal income taxes is required. As of October 31, 2015, the Fund did not have any unrecognized tax benefits in the financial statements; nor is the Fund aware of any tax positions for which it is reasonably possible that the total amounts of unrecognized tax benefits will significantly change in the next twelve months. The Fund files a U.S. federal tax return, in addition to state and local tax returns as required. The Fund's federal income tax returns are subject to examination by the Internal Revenue Service (IRS) for a period of three fiscal years after they are filed. State and local tax returns may be subject to examination for an additional fiscal year depending on the jurisdiction. Foreign taxes are provided for based on the Fund's understanding of the tax rules and rates that exist in the foreign markets in which it invests.
Distributions are declared and recorded on the ex-dividend date. Income dividends and capital gain distributions are declared separately for each class. Income and capital gain distributions are determined in accordance with income tax regulations, which may differ from GAAP. In addition, the Fund claimed a portion of the payment made to redeeming shareholders as a distribution for income tax purposes.
Capital accounts within the financial statements are adjusted for permanent book-tax differences. These adjustments have no impact on net assets or the results of operations. Capital accounts are not adjusted for temporary book-tax differences which will reverse in a subsequent period.
Book-tax differences are primarily due to foreign currency transactions, passive foreign investment companies (PFIC), deferred trustees compensation, capital loss carryforwards and losses deferred due to wash sales.
The federal tax cost of investment securities and unrealized appreciation (depreciation) as of period end were as follows:
| Gross unrealized appreciation | $127,077 |
| Gross unrealized depreciation | (69,164) |
| Net unrealized appreciation (depreciation) on securities | $57,913 |
| Tax Cost | $652,806 |
The tax-based components of distributable earnings as of period end were as follows:
| Undistributed ordinary income | $2,332 |
| Capital loss carryforward | $(16,742) |
| Net unrealized appreciation (depreciation) on securities and other investments | $57,821 |
Capital loss carryforwards are only available to offset future capital gains of the Fund to the extent provided by regulations and may be limited. Under the Regulated Investment Company Modernization Act of 2010 (the Act), the Fund is permitted to carry forward capital losses incurred in taxable years beginning after December 22, 2010 for an unlimited period and such capital losses are required to be used prior to any losses that expire. The capital loss carryforward information presented below, including any applicable limitation, is estimated as of fiscal period end and is subject to adjustment.
| Fiscal year of expiration | |
The tax character of distributions paid was as follows:
| | October 31, 2015 | October 31, 2014 |
| Ordinary Income | $1,529 | $ 8,868 |
Short-Term Trading (Redemption) Fees. Shares held by investors in the Fund less than 30 days may have been subject to a redemption fee equal to 1.00% of the NAV of shares redeemed. All redemption fees, which reduce the proceeds of the shareholder redemption, are retained by the Fund and accounted for as an addition to paid in capital.
4. Purchases and Sales of Investments.
Purchases and sales of securities, other than short-term securities, aggregated $198,751 and $234,991, respectively.
5. Fees and Other Transactions with Affiliates.
Management Fee. Fidelity Management & Research Company (the investment adviser) and its affiliates provide the Fund with investment management related services for which the Fund pays a monthly management fee. The management fee is the sum of an individual fund fee rate that is based on an annual rate of .424% of the Fund's average net assets and an annualized group fee rate that averaged .25% during the period. The group fee rate is based upon the average net assets of all the mutual funds advised by the investment adviser, including any mutual funds previously advised by the investment adviser that are currently advised by Fidelity SelectCo, LLC, an affiliate of the investment adviser. The group fee rate decreases as assets under management increase and increases as assets under management decrease. In addition, the management fee is subject to a performance adjustment (up to a maximum of +/- .20% of the Fund's average net assets over a 36 month performance period). The upward or downward adjustment to the management fee is based on the investment performance of the asset-weighted return of all classes as compared to its benchmark index, the MSCI EAFE Index, over the same 36 month performance period. For the reporting period, the total annual management fee rate, including the performance adjustment, was .76% of the Fund's average net assets. The performance adjustment included in the management fee rate may be higher or lower than the maximum performance adjustment rate due to the difference between the average net assets for the reporting and performance periods.
Distribution and Service Plan Fees. In accordance with Rule 12b-1 of the 1940 Act, the Fund has adopted separate Distribution and Service Plans for each class of shares. Certain classes pay Fidelity Distributors Corporation (FDC), an affiliate of the investment adviser, separate Distribution and Service Fees, each of which is based on an annual percentage of each class' average net assets. In addition, FDC may pay financial intermediaries for selling shares of the Fund and providing shareholder support services. For the period, the Distribution and Service Fee rates, total fees and amounts retained by FDC were as follows:
| | Distribution
Fee | Service
Fee | Total Fees | Retained
by FDC |
| Class A | -% | .25% | $177 | $1 |
| Class T | .25% | .25% | 1,453 | 3 |
| Class B | .75% | .25% | 19 | 14 |
| Class C | .75% | .25% | 189 | 15 |
| | | | $1,838 | $33 |
Sales Load. FDC may receive a front-end sales charge of up to 5.75% for selling Class A shares and 3.50% for selling Class T shares, some of which is paid to financial intermediaries for selling shares of the Fund. Depending on the holding period, FDC may receive contingent deferred sales charges levied on Class A, Class T, Class B, and Class C redemptions. The deferred sales charges range from 5.00% to 1.00% for Class B shares, 1.00% for Class C shares, 1.00% for certain purchases of Class A shares and .25% for certain purchases of Class T shares.
For the period, sales charge amounts retained by FDC were as follows:
| | Retained
by FDC |
| Class A | $8 |
| Class T | 4 |
| Class B(a) | 2 |
| Class C(a) | 2 |
| | $16 |
(a) When Class B and Class C shares are initially sold, FDC pays commissions from its own resources to financial intermediaries through which the sales are made.
Transfer Agent Fees. Fidelity Investments Institutional Operations Company, Inc., (FIIOC), an affiliate of the investment adviser, is the transfer, dividend disbursing and shareholder servicing agent for each class of the Fund. FIIOC receives account fees and asset-based fees that vary according to the account size and type of account of the shareholders of the respective classes of the Fund. FIIOC pays for typesetting, printing and mailing of shareholder reports, except proxy statements.
For the period, transfer agent fees for each class were as follows:
| | Amount | % of
Class-Level Average
Net Assets |
| Class A | $175 | .25 |
| Class T | 579 | .20 |
| Class B | 6 | .30 |
| Class C | 56 | .30 |
| Class I | 567 | .18 |
| | $ 1,383 | |
Accounting and Security Lending Fees. Fidelity Service Company, Inc. (FSC), an affiliate of the investment adviser, maintains the Fund's accounting records. The accounting fee is based on the level of average net assets for each month. Under a separate contract, FSC administers the security lending program. The security lending fee is based on the number and duration of lending transactions.
Brokerage Commissions. The Fund placed a portion of its portfolio transactions with brokerage firms which are affiliates of the investment adviser. Brokerage commissions are included in net realized gain (loss) and change in net unrealized appreciation (depreciation) in the Statement of Operations. The commissions paid to these affiliated firms were $1 for the period.
6. Committed Line of Credit.
The Fund participates with other funds managed by the investment adviser or an affiliate in a $4.25 billion credit facility (the "line of credit") to be utilized for temporary or emergency purposes to fund shareholder redemptions or for other short-term liquidity purposes. The Fund has agreed to pay commitment fees on its pro-rata portion of the line of credit, which amounted to $1 and is reflected in Miscellaneous expenses on the Statement of Operations. During the period, the Fund did not borrow on this line of credit.
7. Security Lending.
The Fund lends portfolio securities through a lending agent from time to time in order to earn additional income. For equity securities, a lending agent is used and may loan securities to certain qualified borrowers, including Fidelity Capital Markets (FCM), a broker-dealer affiliated with the Fund. On the settlement date of the loan, the Fund receives collateral (in the form of U.S. Treasury obligations, letters of credit and/or cash) against the loaned securities and maintains collateral in an amount not less than 100% of the market value of the loaned securities during the period of the loan. The market value of the loaned securities is determined at the close of business of the Fund and any additional required collateral is delivered to the Fund on the next business day. The Fund or borrower may terminate the loan at any time, and if the borrower defaults on its obligation to return the securities loaned because of insolvency or other reasons, the Fund may apply collateral received from the borrower against the obligation. The Fund may experience delays and costs in recovering the securities loaned. Any cash collateral received is invested in the Fidelity Securities Lending Cash Central Fund. The value of loaned securities and cash collateral at period end are disclosed on the Fund's Statement of Assets and Liabilities. The value of securities loaned to FCM at period end was $19. Security lending income represents the income earned on investing cash collateral, less rebates paid to borrowers and any lending agent fees associated with the loan, plus any premium payments received for lending certain types of securities. Security lending income is presented in the Statement of Operations as a component of income from Fidelity Central Funds. Total security lending income during the period amounted to $347, including $6 from securities loaned to FCM.
8. Expense Reductions.
Commissions paid to certain brokers with whom the investment adviser, or its affiliates, places trades on behalf of the Fund include an amount in addition to trade execution, which may be rebated back to the Fund to offset certain expenses. This amount totaled $25 for the period
In addition, during the period the investment adviser reimbursed and/or waived a portion of fund-level operating expenses in the amount of $3 and a portion of class-level operating expenses as follows:
| | Amount |
| Class A | $1 |
| Class T | 7 |
| Class B | –(a) |
| Class C | –(a) |
| Class I | 7 |
| | $15 |
(a) In the amount of less than five hundred dollars.
9. Distributions to Shareholders.
Distributions to shareholders of each class were as follows:
| Years ended October 31, | 2015 | 2014 |
| From net investment income | | |
| Class A | $59 | $576 |
| Class T | – | 2,245 |
| Class B | – | 8 |
| Class C | – | 65 |
| Class I | 1,470 | 3,334 |
| Total | $1,529 | $6,228 |
| From net realized gain | | |
| Class A | $– | $256 |
| Class T | – | 1,182 |
| Class B | – | 11 |
| Class C | – | 75 |
| Class I | – | 1,116 |
| Total | $– | $2,640 |
10. Share Transactions.
Share transactions for each class were as follows and may contain automatic conversions between classes or exchanges between funds:
| | Shares | Shares | Dollars | Dollars |
| Years ended October 31, | 2015 | 2014 | 2015 | 2014 |
| Class A | | | | |
| Shares sold | 1,338 | 618 | $29,635 | $13,534 |
| Reinvestment of distributions | 3 | 36 | 56 | 778 |
| Shares redeemed | (804) | (735) | (17,607) | (16,018) |
| Net increase (decrease) | 537 | (81) | $12,084 | $(1,706) |
| Class T | | | | |
| Shares sold | 2,579 | 2,184 | $57,864 | $48,970 |
| Reinvestment of distributions | – | 150 | – | 3,346 |
| Shares redeemed | (3,247) | (3,597) | (71,824) | (80,489) |
| Net increase (decrease) | (668) | (1,263) | $(13,960) | $(28,173) |
| Class B | | | | |
| Shares sold | 32 | 6 | $692 | $128 |
| Reinvestment of distributions | – | 1 | – | 17 |
| Shares redeemed | (54) | (46) | (1,123) | (989) |
| Net increase (decrease) | (22) | (39) | $(431) | $(844) |
| Class C | | | | |
| Shares sold | 204 | 158 | $4,420 | $3,399 |
| Reinvestment of distributions | – | 6 | – | 124 |
| Shares redeemed | (230) | (224) | (4,851) | (4,777) |
| Net increase (decrease) | (26) | (60) | $(431) | $(1,254) |
| Class I | | | | |
| Shares sold | 1,548 | 3,011 | $33,691 | $67,092 |
| Reinvestment of distributions | 67 | 198 | 1,452 | 4,371 |
| Shares redeemed | (3,406) | (1,838) | (75,301) | (40,787) |
| Net increase (decrease) | (1,791) | 1,371 | $(40,158) | $30,676 |
11. Other.
The Fund's organizational documents provide former and current trustees and officers with a limited indemnification against liabilities arising in connection with the performance of their duties to the Fund. In the normal course of business, the Fund may also enter into contracts that provide general indemnifications. The Fund's maximum exposure under these arrangements is unknown as this would be dependent on future claims that may be made against the Fund. The risk of material loss from such claims is considered remote.
At the end of the period, Strategic Advisers International II Fund was the owner of record of approximately 18% of the total outstanding shares of the Fund.
Report of Independent Registered Public Accounting Firm
To the Trustees of Fidelity Advisor Series VIII and Shareholders of Fidelity Advisor® Overseas Fund:
In our opinion, the accompanying statement of assets and liabilities, including the schedule of investments, and the related statements of operations and of changes in net assets and the financial highlights present fairly, in all material respects, the financial position of Fidelity Advisor® Overseas Fund (a fund of Fidelity Advisor Series VIII) at October 31, 2015, the results of its operations for the year then ended, the changes in its net assets for each of the two years in the period then ended and the financial highlights for each of the five years in the period then ended, in conformity with accounting principles generally accepted in the United States of America. These financial statements and financial highlights (hereafter referred to as “financial statements”) are the responsibility of the Fidelity Advisor® Overseas Fund’s management. Our responsibility is to express an opinion on these financial statements based on our audits. We conducted our audits of these financial statements in accordance with the standards of the Public Company Accounting Oversight Board (United States). Those standards require that we plan and perform the audit to obtain reasonable assurance about whether the financial statements are free of material misstatement. An audit includes examining, on a test basis, evidence supporting the amounts and disclosures in the financial statements, assessing the accounting principles used and significant estimates made by management, and evaluating the overall financial statement presentation. We believe that our audits, which included confirmation of securities at October 31, 2015 by correspondence with the custodian and brokers, provide a reasonable basis for our opinion.
PricewaterhouseCoopers LLP
Boston, Massachusetts
December 15, 2015
Trustees and Officers
The Trustees, Members of the Advisory Board (if any), and officers of the trust and fund, as applicable, are listed below. The Board of Trustees governs the fund and is responsible for protecting the interests of shareholders. The Trustees are experienced executives who meet periodically throughout the year to oversee the fund's activities, review contractual arrangements with companies that provide services to the fund, oversee management of the risks associated with such activities and contractual arrangements, and review the fund's performance. Each of the Trustees oversees 170 funds.
The Trustees hold office without limit in time except that (a) any Trustee may resign; (b) any Trustee may be removed by written instrument, signed by at least two-thirds of the number of Trustees prior to such removal; (c) any Trustee who requests to be retired or who has become incapacitated by illness or injury may be retired by written instrument signed by a majority of the other Trustees; and (d) any Trustee may be removed at any special meeting of shareholders by a two-thirds vote of the outstanding voting securities of the trust. Each Trustee who is not an interested person (as defined in the 1940 Act) of the trust and the fund is referred to herein as an Independent Trustee. Each Independent Trustee shall retire not later than the last day of the calendar year in which his or her 75th birthday occurs. The Independent Trustees may waive this mandatory retirement age policy with respect to individual Trustees. Officers and Advisory Board Members hold office without limit in time, except that any officer or Advisory Board Member may resign or may be removed by a vote of a majority of the Trustees at any regular meeting or any special meeting of the Trustees. Except as indicated, each individual has held the office shown or other offices in the same company for the past five years.
The fund’s Statement of Additional Information (SAI) includes more information about the Trustees. To request a free copy, call Fidelity at 1-877-208-0098.
Experience, Skills, Attributes, and Qualifications of the Trustees. The Governance and Nominating Committee has adopted a statement of policy that describes the experience, qualifications, attributes, and skills that are necessary and desirable for potential Independent Trustee candidates (Statement of Policy). The Board believes that each Trustee satisfied at the time he or she was initially elected or appointed a Trustee, and continues to satisfy, the standards contemplated by the Statement of Policy. The Governance and Nominating Committee also engages professional search firms to help identify potential Independent Trustee candidates who have the experience, qualifications, attributes, and skills consistent with the Statement of Policy. From time to time, additional criteria based on the composition and skills of the current Independent Trustees, as well as experience or skills that may be appropriate in light of future changes to board composition, business conditions, and regulatory or other developments, have also been considered by the professional search firms and the Governance and Nominating Committee. In addition, the Board takes into account the Trustees' commitment and participation in Board and committee meetings, as well as their leadership of standing and ad hoc committees throughout their tenure.
In determining that a particular Trustee was and continues to be qualified to serve as a Trustee, the Board has considered a variety of criteria, none of which, in isolation, was controlling. The Board believes that, collectively, the Trustees have balanced and diverse experience, qualifications, attributes, and skills, which allow the Board to operate effectively in governing the fund and protecting the interests of shareholders. Information about the specific experience, skills, attributes, and qualifications of each Trustee, which in each case led to the Board's conclusion that the Trustee should serve (or continue to serve) as a trustee of the fund, is provided below.
Board Structure and Oversight Function. James C. Curvey is an interested person and currently serves as Chairman. The Trustees have determined that an interested Chairman is appropriate and benefits shareholders because an interested Chairman has a personal and professional stake in the quality and continuity of services provided to the fund. Independent Trustees exercise their informed business judgment to appoint an individual of their choosing to serve as Chairman, regardless of whether the Trustee happens to be independent or a member of management. The Independent Trustees have determined that they can act independently and effectively without having an Independent Trustee serve as Chairman and that a key structural component for assuring that they are in a position to do so is for the Independent Trustees to constitute a substantial majority for the Board. The Independent Trustees also regularly meet in executive session. Ned C. Lautenbach serves as Chairman of the Independent Trustees and as such (i) acts as a liaison between the Independent Trustees and management with respect to matters important to the Independent Trustees and (ii) with management prepares agendas for Board meetings.
Fidelity® funds are overseen by different Boards of Trustees. The fund's Board oversees Fidelity's high income and certain equity funds, and other Boards oversee Fidelity's investment-grade bond, money market, asset allocation, and sector funds. The asset allocation funds may invest in Fidelity® funds overseen by the fund's Board. The use of separate Boards, each with its own committee structure, allows the Trustees of each group of Fidelity® funds to focus on the unique issues of the funds they oversee, including common research, investment, and operational issues. On occasion, the separate Boards establish joint committees to address issues of overlapping consequences for the Fidelity® funds overseen by each Board.
The Trustees operate using a system of committees to facilitate the timely and efficient consideration of all matters of importance to the Trustees, the fund, and fund shareholders and to facilitate compliance with legal and regulatory requirements and oversight of the fund's activities and associated risks. The Board, acting through its committees, has charged FMR and its affiliates with (i) identifying events or circumstances the occurrence of which could have demonstrably adverse effects on the fund's business and/or reputation; (ii) implementing processes and controls to lessen the possibility that such events or circumstances occur or to mitigate the effects of such events or circumstances if they do occur; and (iii) creating and maintaining a system designed to evaluate continuously business and market conditions in order to facilitate the identification and implementation processes described in (i) and (ii) above. Because the day-to-day operations and activities of the fund are carried out by or through FMR, its affiliates, and other service providers, the fund's exposure to risks is mitigated but not eliminated by the processes overseen by the Trustees. While each of the Board's committees has responsibility for overseeing different aspects of the fund's activities, oversight is exercised primarily through the Operations, Audit, and Compliance Committees. In addition, the Independent Trustees have worked with FMR to enhance the Board's oversight of investment and financial risks, legal and regulatory risks, technology risks, and operational risks, including the development of additional risk reporting to the Board. For example, a working group comprised of Independent Trustees and FMR has worked and continues to work to review the Fidelity® funds' valuation-related activities, reporting and risk management. Appropriate personnel, including but not limited to the fund's Chief Compliance Officer (CCO), FMR's internal auditor, the independent accountants, the fund's Treasurer and portfolio management personnel, make periodic reports to the Board's committees, as appropriate, including an annual review of Fidelity's risk management program for the Fidelity® funds. The responsibilities of each standing committee, including their oversight responsibilities, are described further under "Standing Committees of the Trustees."
Interested Trustees*:
Correspondence intended for a Trustee who is an interested person may be sent to Fidelity Investments, 245 Summer Street, Boston, Massachusetts 02210.
Name, Year of Birth; Principal Occupations and Other Relevant Experience+
James C. Curvey (1935)
Year of Election or Appointment: 2007
Trustee
Chairman of the Board of Trustees
Mr. Curvey also serves as Trustee of other Fidelity® funds. Mr. Curvey is a Director of Fidelity Research & Analysis Co. (investment adviser firm, 2009-present), and Vice Chairman (2007-present) and Director of FMR LLC (diversified financial services company). In addition, Mr. Curvey serves as an Overseer for the Boston Symphony Orchestra and a member of the board of Artis-Naples, Naples, Florida, and as a Trustee for Brewster Academy, Wolfeboro, New Hampshire. Previously, Mr. Curvey served as a Director of Fidelity Investments Money Management, Inc. (investment adviser firm, 2009-2014) and a Director of FMR and FMR Co., Inc. (investment adviser firms, 2007-2014).
Charles S. Morrison (1960)
Year of Election or Appointment: 2014
Trustee
Mr. Morrison also serves as Trustee of other funds. He serves as a Director of Fidelity Investments Money Management, Inc. (FIMM) (investment adviser firm, 2014-present), Director of Fidelity SelectCo, LLC (investment adviser firm, 2014-present), President, Asset Management (2014-present), and is an employee of Fidelity Investments. Previously, Mr. Morrison served as Vice President of Fidelity's Fixed Income and Asset Allocation Funds (2012-2014), President, Fixed Income (2011-2014), Vice President of Fidelity's Money Market Funds (2005-2009), President, Money Market Group Leader of FMR (investment adviser firm, 2009), and Senior Vice President, Money Market Group of FMR (2004-2009). Mr. Morrison also served as Vice President of Fidelity's Bond Funds (2002-2005), certain Balanced Funds (2002-2005), and certain Asset Allocation Funds (2002-2007), and as Senior Vice President (2002-2005) of Fidelity's Bond Division.
* Determined to be an “Interested Trustee” by virtue of, among other things, his or her affiliation with the trust or various entities under common control with FMR.
+ The information includes the Trustee's principal occupation during the last five years and other information relating to the experience, attributes, and skills relevant to the Trustee's qualifications to serve as a Trustee, which led to the conclusion that the Trustee should serve as a Trustee for the fund.
Independent Trustees:
Correspondence intended for an Independent Trustee may be sent to Fidelity Investments, P.O. Box 55235, Boston, Massachusetts 02205-5235.
Name, Year of Birth; Principal Occupations and Other Relevant Experience+
Dennis J. Dirks (1948)
Year of Election or Appointment: 2005
Trustee
Mr. Dirks also serves as Trustee of other Fidelity® funds. Prior to his retirement in May 2003, Mr. Dirks was Chief Operating Officer and a member of the Board of The Depository Trust & Clearing Corporation (DTCC). He also served as President, Chief Operating Officer, and Board member of The Depository Trust Company (DTC) and President and Board member of the National Securities Clearing Corporation (NSCC). In addition, Mr. Dirks served as Chief Executive Officer and Board member of the Government Securities Clearing Corporation, Chief Executive Officer and Board member of the Mortgage-Backed Securities Clearing Corporation, as a Trustee and a member of the Finance Committee of Manhattan College (2005-2008), as a Trustee and a member of the Finance Committee of AHRC of Nassau County (2006-2008), and as a member of the Independent Directors Council (IDC) Governing Council (2010-2015). Mr. Dirks is a member of the Board of Directors for The Brookville Center for Children's Services, Inc. (2009-present).
Alan J. Lacy (1953)
Year of Election or Appointment: 2008
Trustee
Mr. Lacy also serves as Trustee of other Fidelity® funds. Mr. Lacy serves as a member of the Board of Directors of Dave & Buster's Entertainment, Inc. (restaurant and entertainment complexes, 2010-present) and Bristol-Myers Squibb Company (global pharmaceuticals, 2008-present). In addition, Mr. Lacy served as Senior Adviser (2007-2014) of Oak Hill Capital Partners, L.P. (private equity) and also served as Chief Executive Officer (2000-2005) and Vice Chairman (2005-2006) of Sears Holdings Corporation and Sears, Roebuck and Co. (retail). Mr. Lacy is a member of the Board of Trustees of The National Parks Conservation Association (2006-present). Previously, Mr. Lacy served as Chairman of the Board of Trustees of the National Parks Conservation Association (2008-2011) and as a member of the Board of Directors for The Western Union Company (global money transfer, 2006-2011), The Hillman Companies, Inc. (hardware wholesalers, 2010-2014), and Earth Fare, Inc. (retail grocery, 2010-2014).
Ned C. Lautenbach (1944)
Year of Election or Appointment: 2000
Trustee
Chairman of the Independent Trustees
Mr. Lautenbach also serves as Trustee of other Fidelity® funds. Mr. Lautenbach currently serves as the Lead Director of the Eaton Corporation Board of Directors (diversified industrial, 1997-present). Mr. Lautenbach is Chairman of the Board of Directors of Artis-Naples in Naples, Florida (2012-present), a member of the Council on Foreign Relations (1994-present), and a member of the Board of Governors, State University System of Florida (2013-present). Previously, Mr. Lautenbach was a Partner/Advisory Partner at Clayton, Dubilier & Rice, LLC (private equity investment, 1998-2010), as well as a Director of Sony Corporation (2006-2007).
Joseph Mauriello (1944)
Year of Election or Appointment: 2008
Trustee
Mr. Mauriello also serves as Trustee of other Fidelity® funds. Prior to his retirement in January 2006, Mr. Mauriello served in numerous senior management positions including Deputy Chairman and Chief Operating Officer (2004-2005), and Vice Chairman of Financial Services (2002-2004) of KPMG LLP US (professional services, 1965-2005). Mr. Mauriello currently serves as a member of the Board of Directors of XL Group plc. (global insurance and re-insurance, 2006-present) and the Independent Directors Council (IDC) Governing Council (2015-present). Previously, Mr. Mauriello served as a Director of the Hamilton Funds of the Bank of New York (2006-2007) and of Arcadia Resources Inc. (health care services and products, 2007-2012).
Robert W. Selander (1950)
Year of Election or Appointment: 2011
Trustee
Mr. Selander also serves as Trustee of other Fidelity® funds. Mr. Selander serves as a Director of The Western Union Company (global money transfer, 2014-present). Previously, Mr. Selander served as a Member of the Advisory Board of other Fidelity® funds (2011), and Executive Vice Chairman (2010), Chief Executive Officer (2009-2010), and President and Chief Executive Officer (1997-2009) of Mastercard, Inc.
Cornelia M. Small (1944)
Year of Election or Appointment: 2005
Trustee
Ms. Small also serves as Trustee of other Fidelity® funds. Ms. Small is a member of the Board of Directors (2009-present) and Chair of the Investment Committee (2010-present) of the Teagle Foundation. Ms. Small also serves on the Investment Committee of the Berkshire Taconic Community Foundation (2008-present). Previously, Ms. Small served as Chairperson (2002-2008) and a member of the Investment Committee and Chairperson (2008-2012) and a member of the Board of Trustees of Smith College. In addition, Ms. Small served as Chief Investment Officer, Director of Global Equity Investments, and a member of the Board of Directors of Scudder, Stevens & Clark and Scudder Kemper Investments.
William S. Stavropoulos (1939)
Year of Election or Appointment: 2001
Trustee
Vice Chairman of the Independent Trustees
Mr. Stavropoulos also serves as Trustee of other Fidelity® funds. Mr. Stavropoulos serves as President and Founder of the Michigan Baseball Foundation, the Great Lakes Loons (2007-present). Mr. Stavropoulos is Chairman Emeritus of the Board of Directors of The Dow Chemical Company, where he previously served in numerous senior management positions, including President, CEO (1995-2000; 2002-2004), Chairman of the Executive Committee (2000-2006), and as a member of the Board of Directors (1990-2006). Currently, Mr. Stavropoulos is Chairman of the Board of Directors of Univar Inc. (global distributor of commodity and specialty chemicals), a Director of Teradata Corporation (data warehousing and technology solutions), and Maersk Inc. (industrial conglomerate), and a member of the Advisory Board for Metalmark Capital LLC (private equity investment, 2005-present). Mr. Stavropoulos is an operating advisor to Clayton, Dubilier & Rice, LLC (private equity investment). In addition, Mr. Stavropoulos is a member of the University of Notre Dame Advisory Council for the College of Science, a Trustee of the Rollin L. Gerstacker Foundation, and a Director of the Naples Philharmonic Center for the Arts. Previously, Mr. Stavropoulos served as a Director of Chemical Financial Corporation (bank holding company, 1993-2012) and Tyco International, Ltd. (multinational manufacturing and services, 2007-2012).
David M. Thomas (1949)
Year of Election or Appointment: 2008
Trustee
Mr. Thomas also serves as Trustee of other Fidelity® funds. Mr. Thomas serves as Non-Executive Chairman of the Board of Directors of Fortune Brands Home and Security (home and security products, 2011-present), as a member of the Board of Directors (2004-present) and Presiding Director (2013-present) of Interpublic Group of Companies, Inc. (marketing communication), and as a member of the Board of Trustees of the University of Florida (2013-present). Previously, Mr. Thomas served as Executive Chairman (2005-2006) and Chairman and Chief Executive Officer (2000-2005) of IMS Health, Inc. (pharmaceutical and healthcare information solutions), and a Director of Fortune Brands, Inc. (consumer products, 2000-2011).
+ The information includes the Trustee's principal occupation during the last five years and other information relating to the experience, attributes, and skills relevant to the Trustee's qualifications to serve as a Trustee, which led to the conclusion that the Trustee should serve as a Trustee for the fund.
Advisory Board Members and Officers:
Correspondence intended for an officer or Peter S. Lynch may be sent to Fidelity Investments, 245 Summer Street, Boston, Massachusetts 02210. Officers appear below in alphabetical order.
Name, Year of Birth; Principal Occupation
Peter S. Lynch (1944)
Year of Election or Appointment: 2003
Member of the Advisory Board
Mr. Lynch also serves as Member of the Advisory Board of other Fidelity® funds. Mr. Lynch is Vice Chairman and a Director of FMR (investment adviser firm) and FMR Co., Inc. (investment adviser firm). In addition, Mr. Lynch serves as a Trustee of Boston College and as the Chairman of the Inner-City Scholarship Fund. Previously, Mr. Lynch served on the Special Olympics International Board of Directors (1997-2006).
Elizabeth Paige Baumann (1968)
Year of Election or Appointment: 2012
Anti-Money Laundering (AML) Officer
Ms. Baumann also serves as AML Officer of other funds. She is Chief AML Officer of FMR LLC (diversified financial services company, 2012-present) and is an employee of Fidelity Investments. Previously, Ms. Baumann served as Vice President and Deputy Anti-Money Laundering Officer (2007-2012).
Marc R. Bryant (1966)
Year of Election or Appointment: 2015
Secretary and Chief Legal Officer (CLO)
Mr. Bryant also serves as Secretary and CLO of other funds. Mr. Bryant serves as CLO, Secretary, and Senior Vice President of Fidelity Management & Research Company (investment adviser firm, 2015-present) and FMR Co., Inc. (investment adviser firm, 2015-present); Secretary of Fidelity SelectCo, LLC (investment adviser firm, 2015-present) and Fidelity Investments Money Management, Inc. (investment adviser firm, 2015-present); and CLO of Fidelity Management & Research (Hong Kong) Limited (investment adviser firm, 2015-present). He is Senior Vice President and Deputy General Counsel of FMR LLC (diversified financial services company). Previously, Mr. Bryant served as Secretary and Chief Legal Officer of Fidelity Rutland Square Trust II (2010-2014) and Assistant Secretary of Fidelity's Fixed Income and Asset Allocation Funds (2013-2015). Prior to joining Fidelity Investments, Mr. Bryant served as a Senior Vice President and the Head of Global Retail Legal for AllianceBernstein L.P. (2006-2010), and as the General Counsel for ProFund Advisors LLC (2001-2006).
Timothy M. Cohen (1969)
Year of Election or Appointment: 2014
Vice President of certain Equity Funds
Mr. Cohen also serves as Vice President of other funds. Mr. Cohen serves as Chief Compliance Officer of FMR Investment Management (U.K.) Limited (investment adviser firm, 2013-present) and is an employee of Fidelity Investments. Previously, Mr. Cohen served as a Director of FMR Investment Management (U.K.) Limited (2013-2015).
William C. Coffey (1969)
Year of Election or Appointment: 2009
Assistant Secretary
Mr. Coffey also serves as Assistant Secretary of other funds. He is Senior Vice President and Deputy General Counsel of FMR LLC (diversified financial services company, 2010-present), and is an employee of Fidelity Investments. Previously, Mr. Coffey served as Vice President and Associate General Counsel of FMR LLC (2005-2009).
Jonathan Davis (1968)
Year of Election or Appointment: 2010
Assistant Treasurer
Mr. Davis also serves as Assistant Treasurer of other funds, and is an employee of Fidelity Investments. Previously, Mr. Davis served as Vice President and Associate General Counsel of FMR LLC (diversified financial services company, 2003-2010).
Adrien E. Deberghes (1967)
Year of Election or Appointment: 2008
Deputy Treasurer
Mr. Deberghes also serves as an officer of other funds. He is an employee of Fidelity Investments (2008-present). Prior to joining Fidelity Investments, Mr. Deberghes was Senior Vice President of Mutual Fund Administration at State Street Corporation (2007-2008), Senior Director of Mutual Fund Administration at Investors Bank & Trust (2005-2007), and Director of Finance for Dunkin' Brands (2000-2005).
Stephanie J. Dorsey (1969)
Year of Election or Appointment: 2010
Assistant Treasurer
Ms. Dorsey also serves as an officer of other funds. She is an employee of Fidelity Investments (2008-present) and has served in other fund officer roles. Prior to joining Fidelity Investments, Ms. Dorsey served as Treasurer (2004-2008) of the JPMorgan Mutual Funds and Vice President (2004-2008) of JPMorgan Chase Bank.
Howard J. Galligan III (1966)
Year of Election or Appointment: 2014
Chief Financial Officer
Mr. Galligan also serves as Chief Financial Officer of other funds. Mr. Galligan serves as President of Fidelity Pricing and Cash Management Services (FPCMS) (2014-present) and as a Director of Strategic Advisers, Inc. (investment adviser firm, 2008-present). Previously, Mr. Galligan served as Chief Administrative Officer of Asset Management (2011-2014) and Chief Operating Officer and Senior Vice President of Investment Support for Strategic Advisers, Inc. (2003-2011).
Scott C. Goebel (1968)
Year of Election or Appointment: 2015
Vice President
Mr. Goebel serves as Vice President of other funds and is an employee of Fidelity Investments (2001-present). Previously, Mr. Goebel served as Secretary of Fidelity SelectCo, LLC (investment adviser firm, 2013-2015), Fidelity Investments Money Management, Inc. (FIMM) (investment adviser firm, 2010-2015), and Fidelity Research and Analysis Company (FRAC) (investment adviser firm, 2010-2015); General Counsel, Secretary, and Senior Vice President of Fidelity Management & Research Company (investment adviser firm, 2008-2015) and FMR Co., Inc. (investment adviser firm, 2008-2015); Assistant Secretary of Fidelity Management & Research (Japan) Limited (investment adviser firm, 2008-2015) and FMR Investment Management (U.K.) Limited (investment adviser firm, 2008-2015); Chief Legal Officer (CLO) of Fidelity Management & Research (Hong Kong) Limited (investment adviser firm, 2008-2015); Secretary and CLO of certain Fidelity® funds (2008-2015); Assistant Secretary of FIMM (2008-2010), FRAC (2008-2010), and certain funds (2007-2008); and as Vice President and Secretary of Fidelity Distributors Corporation (FDC) (2005-2007).
Brian B. Hogan (1964)
Year of Election or Appointment: 2009
Vice President
Mr. Hogan also serves as Trustee or Vice President of other funds. Mr. Hogan serves as a Director of Fidelity SelectCo, LLC (investment adviser firm, 2014-present) and President of the Equity Division of FMR (investment adviser firm, 2009-present). Previously, Mr. Hogan served as Senior Vice President, Equity Research of FMR (2006-2009) and as a portfolio manager.
Chris Maher (1972)
Year of Election or Appointment: 2013
Assistant Treasurer
Mr. Maher serves as Assistant Treasurer of other funds. Mr. Maher is Vice President of Valuation Oversight and is an employee of Fidelity Investments. Previously, Mr. Maher served as Vice President of Asset Management Compliance (2013), Vice President of the Program Management Group of FMR (investment adviser firm, 2010-2013), and Vice President of Valuation Oversight (2008-2010).
Kenneth B. Robins (1969)
Year of Election or Appointment: 2008
President and Treasurer
Mr. Robins also serves as an officer of other funds. Mr. Robins serves as Executive Vice President of Fidelity Investments Money Management, Inc. (FIMM) (investment adviser firm, 2013-present) and is an employee of Fidelity Investments (2004-present). Previously, Mr. Robins served in other fund officer roles.
Stacie M. Smith (1974)
Year of Election or Appointment: 2013
Deputy Treasurer
Ms. Smith also serves as an officer of other funds. She is an employee of Fidelity Investments (2009-present) and has served in other fund officer roles. Prior to joining Fidelity Investments, Ms. Smith served as Senior Audit Manager of Ernst & Young LLP (1996-2009).
Renee Stagnone (1975)
Year of Election or Appointment: 2013
Deputy Treasurer
Ms. Stagnone also serves as Deputy Treasurer of other funds. Ms. Stagnone is an employee of Fidelity Investments (1997-present).
Linda J. Wondrack (1964)
Year of Election or Appointment: 2014
Chief Compliance Officer
Ms. Wondrack also serves as Chief Compliance Officer of other funds. Ms. Wondrack is Executive Vice President and head of the Ethics Office and Asset Management Compliance for Fidelity Investments (2012-present). Ms. Wondrack also serves as Chief Compliance Officer of Fidelity SelectCo, LLC (investment adviser firm, 2014-present); Chief Compliance Officer of Impresa Management LLC (2013-present); and Chief Compliance Officer of FMR Co., Inc. (investment adviser firm), Fidelity Investments Money Management, Inc. (investment adviser firm), Fidelity Management & Research (Japan) Limited (investment adviser firm), FMR Investment Management (U.K.) Limited (investment adviser firm), Fidelity Management & Research (Hong Kong) (investment adviser firm), Fidelity Management & Research Company (investment adviser firm), FIAM LLC (investment adviser firm), and Strategic Advisers, Inc. (investment adviser firm), Ballyrock Investment Advisors LLC, and Northern Neck Investors LLC (2012-present). Previously, Ms. Wondrack served as Senior Vice President and Chief Compliance Officer for Columbia Management Investment Advisers, LLC (2005-2012); Chief Compliance Officer for certain funds within the Columbia Family of Funds (2007-2012); and Senior Vice President of Compliance Risk Management at Bank of America (2005-2010).
Joseph F. Zambello (1957)
Year of Election or Appointment: 2011
Deputy Treasurer
Mr. Zambello also serves as Deputy Treasurer of other funds. Mr. Zambello is an employee of Fidelity Investments (1991-present). Previously, Mr. Zambello served as Vice President of the Program Management Group of FMR (investment adviser firm, 2009-2011) and Vice President of the Transfer Agent Oversight Group (2005-2009).
Shareholder Expense Example
As a shareholder of the Fund, you incur two types of costs: (1) transaction costs, including sales charges (loads) on purchase payments or redemption proceeds, redemption fees and (2) ongoing costs, including management fees, distribution and/or service (12b-1) fees and other Fund expenses. This Example is intended to help you understand your ongoing costs (in dollars) of investing in the Fund and to compare these costs with the ongoing costs of investing in other mutual funds.
The Example is based on an investment of $1,000 invested at the beginning of the period and held for the entire period (May 1, 2015 to October 31, 2015).
Actual Expenses
The first line of the accompanying table for each class of the Fund provides information about actual account values and actual expenses. You may use the information in this line, together with the amount you invested, to estimate the expenses that you paid over the period. Simply divide your account value by $1,000.00 (for example, an $8,600 account value divided by $1,000.00 = 8.6), then multiply the result by the number in the first line for a class of the Fund under the heading entitled "Expenses Paid During Period" to estimate the expenses you paid on your account during this period. In addition, the Fund, as a shareholder in the underlying Fidelity Central Funds, will indirectly bear its pro-rata share of the fees and expenses incurred by the underlying Fidelity Central Funds. These fees and expenses are not included in the Fund's annualized expense ratio used to calculate the expense estimate in the table below.
Hypothetical Example for Comparison Purposes
The second line of the accompanying table for each class of the Fund provides information about hypothetical account values and hypothetical expenses based on a Class' actual expense ratio and an assumed rate of return of 5% per year before expenses, which is not the Class' actual return. The hypothetical account values and expenses may not be used to estimate the actual ending account balance or expenses you paid for the period. You may use this information to compare the ongoing costs of investing in the Fund and other funds. To do so, compare this 5% hypothetical example with the 5% hypothetical examples that appear in the shareholder reports of the other funds. In addition, the Fund, as a shareholder in the underlying Fidelity Central Funds, will indirectly bear its pro-rata share of the fees and expenses incurred by the underlying Fidelity Central Funds. These fees and expenses are not included in the Fund's annualized expense ratio used to calculate the expense estimate in the table below.
Please note that the expenses shown in the table are meant to highlight your ongoing costs only and do not reflect any transaction costs. Therefore, the second line of the table is useful in comparing ongoing costs only, and will not help you determine the relative total costs of owning different funds. In addition, if these transactional costs were included, your costs would have been higher.
| | Annualized Expense Ratio-A | Beginning
Account Value
May 1, 2015 | Ending
Account Value
October 31, 2015 | Expenses Paid
During Period-B
May 1, 2015
to October 31, 2015 |
| Class A | 1.36% | | | |
| Actual | | $1,000.00 | $956.60 | $6.71 |
| Hypothetical-C | | $1,000.00 | $1,018.35�� | $6.92 |
| Class T | 1.57% | | | |
| Actual | | $1,000.00 | $955.50 | $7.74 |
| Hypothetical-C | | $1,000.00 | $1,017.29 | $7.98 |
| Class B | 2.18% | | | |
| Actual | | $1,000.00 | $952.40 | $10.73 |
| Hypothetical-C | | $1,000.00 | $1,014.22 | $11.07 |
| Class C | 2.17% | | | |
| Actual | | $1,000.00 | $952.80 | $10.68 |
| Hypothetical-C | | $1,000.00 | $1,014.27 | $11.02 |
| Class I | 1.05% | | | |
| Actual | | $1,000.00 | $958.30 | $5.18 |
| Hypothetical-C | | $1,000.00 | $1,019.91 | $5.35 |
A Annualized expense ratio reflects expenses net of applicable fee waivers.
B Expenses are equal to each Class' annualized expense ratio, multiplied by the average account value over the period, multiplied by 184/365 (to reflect the one-half year period).
C 5% return per year before expenses
Distributions (Unaudited)
Class I designates 14% of the dividends distributed during the fiscal year as qualifying for the dividends-received deduction for corporate shareholders.
Class I designates 100% of the dividend distributed during the fiscal year as amounts which may be taken into account as a dividend for purposes of the maximum rate under section 1(h)(11) of the Internal Revenue Code.
The amounts per share which represent income derived from sources within, and taxes paid to, foreign countries or possessions of the United States are as follows:
| | Pay Date | Income | Taxes | |
| Class I | 12/08/14 | $ 0.1381 | $ 0.0421 | |
The fund will notify shareholders in January 2016 of amounts for use in preparing 2015 income tax returns.
Board Approval of Investment Advisory Contracts and Management Fees
Fidelity Advisor Overseas Fund
Each year, the Board of Trustees, including the Independent Trustees (together, the Board), votes on the renewal of the management contract with Fidelity Management & Research Company (FMR) and the sub-advisory agreements (together, the Advisory Contracts) for the fund. The Board, assisted by the advice of fund counsel and Independent Trustees' counsel, requests and considers a broad range of information relevant to the renewal of the Advisory Contracts throughout the year.
The Board meets regularly and, at each of its meetings, covers an extensive agenda of topics and materials and considers factors that are relevant to its annual consideration of the renewal of the fund's Advisory Contracts, including the services and support provided to the fund and its shareholders. The Board has established various standing committees (Committees), each composed of and chaired by Independent Trustees with varying backgrounds, to which the Board has assigned specific subject matter responsibilities in order to enhance effective decision-making by the Board. The Board, acting directly and through its Committees, requests and receives information concerning the annual consideration of the renewal of the fund's Advisory Contracts. The Board also meets as needed to consider matters specifically related to the Board's annual consideration of the renewal of the Advisory Contracts. Members of the Board may also meet with trustees of other Fidelity funds through ad hoc joint committees to discuss certain matters relevant to all of the Fidelity funds.
At its July 2015 meeting, the Board unanimously determined to renew the fund's Advisory Contracts. In reaching its determination, the Board considered all factors it believed relevant, including (i) the nature, extent, and quality of the services to be provided to the fund and its shareholders (including the investment performance of the fund); (ii) the competitiveness of the fund's management fee and total expense ratio relative to peer funds; (iii) the total costs of the services to be provided by and the profits to be realized by Fidelity from its relationship with the fund; and (iv) the extent to which (if any) economies of scale exist and would be realized as the fund grows, and whether any economies of scale are appropriately shared with fund shareholders.
In considering whether to renew the Advisory Contracts for the fund, the Board reached a determination, with the assistance of fund counsel and Independent Trustees' counsel and through the exercise of its business judgment, that the renewal of the Advisory Contracts was in the best interests of the fund and its shareholders and that the compensation payable under the Advisory Contracts was fair and reasonable. The Board's decision to renew the Advisory Contracts was not based on any single factor, but rather was based on a comprehensive consideration of all the information provided to the Board at its meetings throughout the year. The Board, in reaching its determination to renew the Advisory Contracts, was aware that shareholders of the fund have a broad range of investment choices available to them, including a wide choice among funds offered by Fidelity's competitors, and that the fund's shareholders, who have the opportunity to review and weigh the disclosure provided by the fund in its prospectus and other public disclosures, have chosen to invest in this fund, which is part of the Fidelity family of funds.
Nature, Extent, and Quality of Services Provided. The Board considered Fidelity's staffing as it relates to the fund, including the backgrounds of investment personnel of Fidelity, and also considered the fund's investment objective, strategies, and related investment philosophy. The Independent Trustees also had discussions with senior management of Fidelity's investment operations and investment groups. The Board considered the structure of the portfolio manager compensation program and whether this structure provides appropriate incentives to act in the best interests of the fund. Additionally, the Board considered the portfolio managers' investments, if any, in the funds that they manage.
Resources Dedicated to Investment Management and Support Services. The Board and the Fund Oversight and Research Committees reviewed the general qualifications and capabilities of Fidelity's investment staff, including its size, education, experience, and resources, as well as Fidelity's approach to recruiting, training, managing, and compensating investment personnel. The Board noted that Fidelity has continued to increase the resources devoted to non-U.S. offices, including expansion of Fidelity's global investment organization. The Board also noted that Fidelity's analysts have extensive resources, tools and capabilities that allow them to conduct sophisticated quantitative and fundamental analysis, as well as credit analysis of issuers, counterparties and guarantors. Further, the Board considered that Fidelity's investment professionals have sufficient access to global information and data so as to provide competitive investment results over time, and that those professionals also have access to sophisticated tools that permit them to assess portfolio construction and risk and performance attribution characteristics continuously, as well as to transmit new information and research conclusions rapidly around the world. Additionally, in its deliberations, the Board considered Fidelity's trading, risk management, and compliance capabilities and resources, which are integral parts of the investment management process.
Shareholder and Administrative Services. The Board considered (i) the nature, extent, quality, and cost of advisory, administrative, and shareholder services performed by FMR, the sub-advisers (together with FMR, the Investment Advisers), and their affiliates under the Advisory Contracts and under separate agreements covering transfer agency, pricing and bookkeeping, and securities lending services for the fund; (ii) the nature and extent of the supervision of third party service providers, principally custodians and subcustodians; and (iii) the resources devoted to, and the record of compliance with, the fund's compliance policies and procedures. The Board also reviewed the allocation of fund brokerage, including allocations to brokers affiliated with the Investment Advisers, the use of brokerage commissions to pay fund expenses, and the use of "soft" commission dollars to pay for research services.
The Board noted that the growth of fund assets over time across the complex allows Fidelity to reinvest in the development of services designed to enhance the value or convenience of the Fidelity funds as investment vehicles. These services include 24-hour access to account information and market information through telephone representatives and over the Internet, investor education materials and asset allocation tools, and the expanded availability of Fidelity Investor Centers.
In 2014, the Board formed an ad hoc Committee on Transfer Agency Fees to review the variety of transfer agency fee structures throughout the industry and Fidelity's competitive positioning with respect to industry participants.
Investment in a Large Fund Family. The Board considered the benefits to shareholders of investing in a Fidelity fund, including the benefits of investing in a fund that is part of a large family of funds offering a variety of investment disciplines and providing a large variety of mutual fund investor services. The Board noted that Fidelity had taken, or had made recommendations that resulted in the Fidelity funds taking, a number of actions over the previous year that benefited particular funds, including (i) continuing to dedicate additional resources to investment research and to the support of the senior management team that oversees asset management; (ii) continuing efforts to enhance Fidelity's global research capabilities; (iii) launching new funds and making other enhancements to meet client needs; (iv) reducing management fees and total expenses for certain index funds and diversified international funds; (v) continuing to launch dedicated lower cost underlying funds to meet portfolio construction needs related to expanding underlying fund options for Fidelity funds of funds, specifically for the Freedom Fund product lines; (vi) rationalizing product lines and gaining increased efficiencies through fund mergers; (vii) launching active fixed-income exchange-traded funds; (viii) continuing to develop, acquire and implement systems and technology to improve services to the funds and information security and to increase efficiency; (ix) implementing investment enhancements to further strengthen Fidelity's target date product line to increase investors' probability of success in achieving their goals; (x) modifying the eligibility criteria for certain share classes to accommodate roll-over assets from employer-sponsored retirement plans; (xi) launching a new Class W of the Freedom Index Funds to attract and retain Fidelity record-kept retirement plan assets; and (xii) implementing changes to Fidelity's money market product line in response to recent money market regulatory reforms.
Investment Performance. The Board considered whether the fund has operated in accordance with its investment objective, as well as its record of compliance with its investment restrictions and its performance history.
The Board took into account discussions with representatives of the Investment Advisers about fund investment performance that occur at Board meetings throughout the year. In this regard the Board noted that as part of regularly scheduled fund reviews and other reports to the Board on fund performance, the Board considers annualized return information for the fund, for different time periods, measured against a securities market index ("benchmark index") and a peer group of funds with similar objectives ("peer group"), if any. In its evaluation of fund investment performance, the Board gave particular attention to information indicating changes in performance of certain Fidelity funds for specific time periods and discussed with the Investment Advisers the reasons for any overperformance or underperformance.
In addition to reviewing absolute and relative fund performance, the Independent Trustees periodically consider the appropriateness of fund performance metrics in evaluating the results achieved. In general, the Independent Trustees believe that fund performance should be evaluated based on net performance (after fees and expenses) of both the highest performing and lowest performing fund share classes, where applicable, compared to appropriate benchmark indices, over appropriate time periods that may include full market cycles, and compared to peer groups, as applicable, over the same periods, taking into account relevant factors including the following: general market conditions; issuer-specific information; and fund cash flows and other factors.
The Independent Trustees recognize that shareholders evaluate performance on a net basis over their own holding periods, for which one-, three-, and five-year periods are often used as a proxy. For this reason, the performance information reviewed by the Board also included net cumulative calendar year total return information for the fund and an appropriate benchmark index and peer group for the most recent one-, three-, and five-year periods, as shown below. Returns are shown compared to the 25th percentile (top of box, 75% beaten) and 75th percentile (bottom of box, 25% beaten) of the peer universe. Returns of the benchmark index are "net MA,"
i.e., adjusted for tax withholding rates applicable to U.S.-based funds organized as Massachusetts business trusts.
Fidelity Advisor Overseas Fund
The Board also considered that the fund's management fee is subject to upward or downward adjustment depending upon whether, and to what extent, the fund's investment performance for the performance period exceeds, or is exceeded by, a securities index, thus leading to a performance adjustment for the same period. The Board noted that the performance adjustment provides FMR with a strong economic incentive to seek to achieve superior performance for the fund's shareholders and helps to more closely align the interests of FMR and the shareholders of the fund.
Based on its review, the Board concluded that the nature, extent, and quality of services provided to the fund under the Advisory Contracts should benefit the shareholders of the fund.
Competitiveness of Management Fee and Total Expense Ratio. The Board considered the fund's management fee and total expense ratio compared to "mapped groups" of competitive funds and classes created for the purpose of facilitating the Trustees' competitive analysis of management fees and total expenses. Fidelity creates "mapped groups" by combining similar Lipper investment objective categories that have comparable investment mandates. Combining Lipper investment objective categories aids the Board's management fee and total expense ratio comparisons by broadening the competitive group used for comparison.
Management Fee. The Board considered two proprietary management fee comparisons for the 12-month periods shown in basis points (BP) in the chart below. The group of Lipper funds used by the Board for management fee comparisons is referred to below as the "Total Mapped Group." The Total Mapped Group comparison focuses on a fund's standing in terms of gross management fees before expense reimbursements or caps, and without giving effect to the fund's performance adjustment, relative to the total universe of funds with comparable investment mandates, regardless of whether their management fee structures also are comparable. Funds with comparable investment mandates offer exposure to similar types of securities. Funds with comparable management fee structures have similar management fee contractual arrangements (
e.g., flat rate charged for advisory services, all-inclusive fee rate,
etc.). "TMG %" represents the percentage of funds in the Total Mapped Group that had management fees that were lower than the fund's. For example, a hypothetical TMG % of 20% would mean that 80% of the funds in the Total Mapped Group had higher, and 20% had lower, management fees than the fund. The fund's actual TMG %s and the number of funds in the Total Mapped Group are in the chart below. The "Asset-Size Peer Group" (ASPG) comparison focuses on a fund's standing relative to a subset of non-Fidelity funds within the Total Mapped Group that are similar in size and management fee structure without taking into account performance adjustments, if any. For example, if a fund is in the first quartile of the ASPG, the fund's management fee ranks in the least expensive or lowest 25% of funds in the ASPG. The ASPG represents at least 15% of the funds in the Total Mapped Group with comparable asset size and management fee structures, subject to a minimum of 50 funds (or all funds in the Total Mapped Group if fewer than 50). Additional information, such as the ASPG quartile in which the fund's management fee rate ranked and the impact of the fund's performance adjustment, is also included in the chart and considered by the Board.
Fidelity Advisor Overseas Fund
The Board noted that the fund's management fee rate ranked below the median of its Total Mapped Group and below the median of its ASPG for 2014. The Board also noted the effect of the fund's performance adjustment, if any, on the fund's management fee ranking.
Furthermore, the Board considered that it had approved a reduction (effective August 1, 2014) in the individual fund fee rate component of the management fee rate for the fund from 0.450% to 0.424%. The Board considered that the chart reflects the fund's lower management fee for 2014, as if the lower fee were in effect for the entire year.
The Board noted that, in 2014, the ad hoc Committee on Group Fee was formed by it and other Fidelity fund boards to conduct an in-depth review of the "group fee" component of the management fee of funds with such management fee structures. Committee focus included the mechanics of the group fee, the competitive landscape of group fee structures, Fidelity funds with no group fee component and investment products not included in group fee assets. The Board also considered that, for funds subject to the group fee, FMR agreed to voluntarily waive fees over a specified period of time in amounts designed to account for assets converted from certain funds to certain collective investment trusts.
The Board also noted that, in 2013, the ad hoc Committee on Management Fees was formed to conduct an in-depth review of the management fee rates of Fidelity's active equity mutual funds. The Committee focused on the following areas: (i) standard fee structures; (ii) research consumption and trading evolution; (iii) management fee competitiveness/profitability by category; and (iv) factors that drive institutional pricing.
Based on its review, the Board concluded that the fund's management fee is fair and reasonable in light of the services that the fund receives and the other factors considered.
Total Expense Ratio. In its review of each class's total expense ratio, the Board considered the fund's management fee as well as other fund or class expenses, as applicable, such as transfer agent fees, pricing and bookkeeping fees, fund-paid 12b-1 fees, and custodial, legal, and audit fees. The Board noted the impact of the fund's performance adjustment. The Board also noted that Fidelity may agree to waive fees and expenses from time to time, and the extent to which, if any, it has done so for the fund. As part of its review, the Board also considered the current and historical total expense ratios of each class of the fund compared to competitive fund median expenses. Each class of the fund is compared to those funds and classes in the Total Mapped Group (used by the Board for management fee comparisons) that have a similar sales load structure.
The Board noted that the total expense ratio of each of Class A, Class B, and Class I ranked below its competitive median for 2014, the total expense ratio of Class C ranked equal to its competitive median for 2014, and the total expense ratio of Class T ranked above its competitive median for 2014. The Board considered that, in general, various factors can affect total expense ratios. The Board noted that the total expense ratio of Class T was above the competitive median primarily because of higher 12b-1 fees on Class T as compared to most competitor funds. Class T has a higher 12b-1 fee, but a lower front-end sales charge, than traditionally priced front-end sales charge classes. The Board considered that Class T is primarily sold load-waived in the retirement plan market where its 0.50% 12b-1 fee is comparable to competing no-load, higher 12b-1 fee classes designed specifically for retirement plans. The Board noted that the fund offers multiple classes, each of which has a different sales load and 12b-1 fee structure, and that the multiple structures are intended to offer a range of pricing options for the intermediary market. The Board also noted that the total expense ratios of the classes vary primarily by the level of their 12b-1 fees, although differences in transfer agent fees may also cause expenses to vary from class to class.
Fees Charged to Other Fidelity Clients. The Board also considered Fidelity fee structures and other information with respect to clients of Fidelity, such as other funds advised or subadvised by Fidelity, pension plan clients, and other institutional clients with similar mandates. The Board noted the findings of the 2013 ad hoc joint committee (created with the board of other Fidelity funds), which reviewed and compared Fidelity's institutional investment advisory business with its business of providing services to the Fidelity funds, including the differences in services provided, fees charged, and costs incurred, as well as competition in their respective marketplaces.
Based on its review of total expense ratios and fees charged to other Fidelity clients, the Board concluded that, although Class T was above the median of the universe presented for comparison, the total expense ratio of each class of the fund was reasonable in light of the services that the fund and its shareholders receive and the other factors considered.
Costs of the Services and Profitability. The Board considered the revenues earned and the expenses incurred by Fidelity in conducting the business of developing, marketing, distributing, managing, administering and servicing the fund and servicing the fund's shareholders. The Board also considered the level of Fidelity's profits in respect of all the Fidelity funds.
On an annual basis, Fidelity presents to the Board information about the profitability of its relationship with the fund. Fidelity calculates profitability information for each fund, as well as aggregate profitability information for groups of Fidelity funds and all Fidelity funds, using a series of detailed revenue and cost allocation methodologies which originate with the books and records of Fidelity on which Fidelity's audited financial statements are based. The Audit Committee of the Board reviews any significant changes from the prior year's methodologies.
PricewaterhouseCoopers LLP (PwC), independent registered public accounting firm and auditor to Fidelity and certain Fidelity funds, has been engaged annually by the Board as part of the Board's assessment of Fidelity's profitability analysis. PwC's engagement includes the review and assessment of the methodologies used by Fidelity in determining the revenues and expenses attributable to Fidelity's mutual fund business, and completion of agreed-upon procedures in respect of the mathematical accuracy of fund profitability and its conformity to established allocation methodologies. After considering PwC's reports issued under the engagement and information provided by Fidelity, the Board concluded that while other allocation methods may also be reasonable, Fidelity's profitability methodologies are reasonable in all material respects.
The Board also reviewed Fidelity's non-fund businesses and fall-out benefits related to the mutual fund business as well as cases where Fidelity's affiliates may benefit from or be related to the fund's business.
The Board considered the costs of the services provided by and the profits realized by Fidelity in connection with the operation of the fund and was satisfied that the profitability was not excessive.
Economies of Scale. The Board considered whether there have been economies of scale in respect of the management of the Fidelity funds, whether the Fidelity funds (including the fund) have appropriately benefited from any such economies of scale, and whether there is potential for realization of any further economies of scale. The Board considered the extent to which the fund will benefit from economies of scale as assets grow through increased services to the fund, through waivers or reimbursements, or through fee or expense ratio reductions. The Board also noted that in 2013, it and the boards of other Fidelity funds created an ad hoc committee (the Economies of Scale Committee) to analyze whether Fidelity attains economies of scale in respect of the management and servicing of the Fidelity funds, whether the Fidelity funds have appropriately benefited from such economies of scale, and whether there is potential for realization of any further economies of scale.
The Board recognized that the fund's management contract incorporates a "group fee" structure, which provides for lower group fee rates as total group assets increase, and for higher group fee rates as total group assets decrease (with "group assets" defined to include fund assets under FMR's management plus sector fund assets previously under FMR's management and currently managed by Fidelity SelectCo, LLC). FMR calculates the group fee rates based on a tiered asset "breakpoint" schedule that varies based on asset class. The Board considered that the group fee is designed to deliver the benefits of economies of scale to fund shareholders when total Fidelity fund assets increase, even if assets of any particular fund are unchanged or have declined, because some portion of Fidelity's costs are attributable to services provided to all Fidelity funds, and all funds benefit if those costs can be allocated among more assets. The Board concluded that, given the group fee structure, fund shareholders will benefit from lower management fees as group assets increase at the fund complex level, regardless of whether Fidelity achieves any such economies of scale.
The Board concluded, taking into account the analysis of the Economies of Scale Committee, that economies of scale, if any, are being appropriately shared between fund shareholders and Fidelity.
Additional Information Requested by the Board. In order to develop fully the factual basis for consideration of the Fidelity funds' Advisory Contracts, the Board requested and received additional information on certain topics, including: (i) fund performance trends and Fidelity's long-term strategies for certain funds; (ii) the various share classes employed by Fidelity and the attributes of each class, together with similar information on the distribution and servicing payments made by Fidelity or the funds to third-party participants in the distribution channels; (iii) fund profitability, and fund performance in relation to fund profitability; (iv) the methodology with respect to evaluating competitive fund data and peer group classifications and fee comparisons; (v) annual fund profitability margins, with particular focus on certain funds with negative margins; (vi) the realization of fall-out benefits in certain Fidelity business units;
(vii) economies of scale and the way in which they are shared with fund shareholders;(viii) Fidelity's group fee structures, including the group fee schedule of breakpoints;(ix) the impact of cost containment measures on the funds; and (x) the transfer agent fee structure.
Based on its evaluation of all of the conclusions noted above, and after considering all factors it believed relevant, the Board concluded that the advisory fee structures are fair and reasonable, and that the fund's Advisory Contracts should be renewed.
OSI-ANN-1215
1.538538.118
Fidelity Advisor® Value Leaders Fund Class A, Class T, Class B and Class C
Annual Report October 31, 2015 |
|
Contents
To view a fund's proxy voting guidelines and proxy voting record for the 12-month period ended June 30, visit http://www.fidelity.com/proxyvotingresults or visit the Securities and Exchange Commission's (SEC) web site at http://www.sec.gov.
You may also call 1-877-208-0098 to request a free copy of the proxy voting guidelines.
Standard & Poor's, S&P and S&P 500 are registered service marks of The McGraw-Hill Companies, Inc. and have been licensed for use by Fidelity Distributors Corporation.
Other third-party marks appearing herein are the property of their respective owners.
All other marks appearing herein are registered or unregistered trademarks or service marks of FMR LLC or an affiliated company. © 2015 FMR LLC. All rights reserved.
This report and the financial statements contained herein are submitted for the general information of the shareholders of the Fund. This report is not authorized for distribution to prospective investors in the Fund unless preceded or accompanied by an effective prospectus.
A fund files its complete schedule of portfolio holdings with the SEC for the first and third quarters of each fiscal year on Form N-Q. Forms N-Q are available on the SEC’s web site at http://www.sec.gov. A fund's Forms N-Q may be reviewed and copied at the SEC’s Public Reference Room in Washington, DC. Information regarding the operation of the SEC's Public Reference Room may be obtained by calling 1-800-SEC-0330.
For a complete list of a fund's portfolio holdings, view the most recent holdings listing, semiannual report, or annual report on Fidelity's web site at http://www.fidelity.com, http://www.advisor.fidelity.com, or http://www.401k.com, as applicable.
NOT FDIC INSURED •MAY LOSE VALUE •NO BANK GUARANTEE
Neither the Fund nor Fidelity Distributors Corporation is a bank.
Performance: The Bottom Line
Average annual total return reflects the change in the value of an investment, assuming reinvestment of distributions from dividend income and capital gains (the profits earned upon the sale of securities that have grown in value, if any) and assuming a constant rate of performance each year.
The hypothetical investment and the average annual total returns do not reflect the deduction of taxes that a shareholder would pay on fund distributions or the redemption of fund shares.
During periods of reimbursement by Fidelity, a fund’s total return will be greater than it would be had the reimbursement not occurred.
How a fund did yesterday is no guarantee of how it will do tomorrow.
Returns reflect the conversion of Class B shares to Class A shares after a maximum of seven years.
Average Annual Total Returns
| For the periods ended October 31, 2015 | Past 1 year | Past 5 years | Past 10 years |
| Class A (incl. 5.75% sales charge) | (1.68)% | 9.87% | 3.76% |
| Class T (incl. 3.50% sales charge) | 0.40% | 10.12% | 3.75% |
| Class B (incl. contingent deferred sales charge) | (1.44)% | 10.09% | 3.83% |
| Class C (incl. contingent deferred sales charge) | 2.54% | 10.36% | 3.60% |
Class B shares' contingent deferred sales charges included in the past one year, past five years and past ten years total return figures are 5%, 2% and 0%, respectively.
Class C shares' contingent deferred sales charges included in the past one year, past five years and past ten years total return figures are 1%, 0% and 0%, respectively.
$10,000 Over 10 Years
Let's say hypothetically that $10,000 was invested in Fidelity Advisor® Value Leaders Fund - Class A on October 31, 2005, and the current 5.75% sales charge was paid.
The chart shows how the value of your investment would have changed, and also shows how the Russell 1000® Value Index performed over the same period.
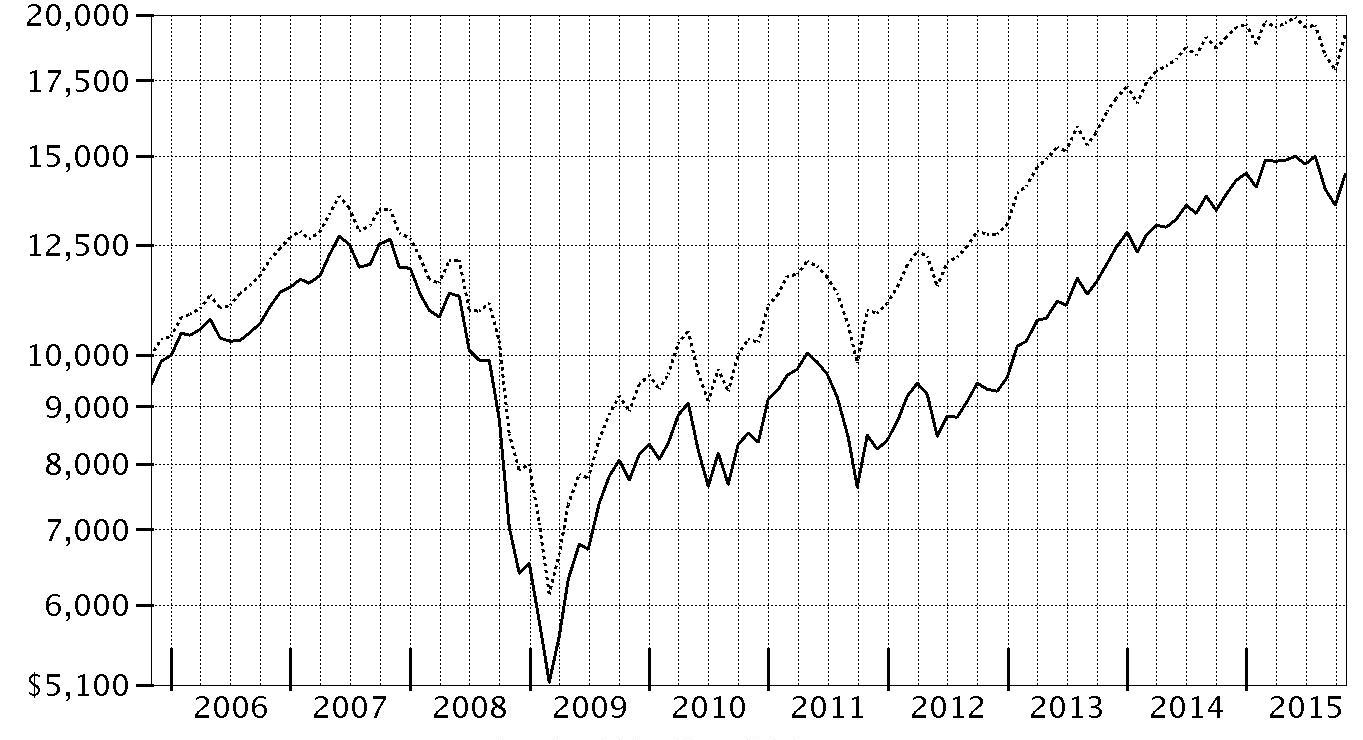
| Period Ending Values |
| $14,467 | Fidelity Advisor® Value Leaders Fund - Class A |
| $19,225 | Russell 1000® Value Index |
Management's Discussion of Fund Performance
Market Recap: U.S. stocks gained moderately for the 12 months ending October 31, 2015, helped by a strong October that largely erased a steep decline in August and September on concern about slowing global economic growth emanating from China. Stocks benefited late in the period amid waning expectations for a near-term interest-rate hike by the U.S. Federal Reserve, additional economic stimulus in Europe and an interest-rate cut in China. The large-cap S&P 500
® index advanced 5.20% for the period, with growth stocks in the index significantly outpacing value stocks, as investors continued to seek growth in a subpar economic environment. The growth-oriented Nasdaq Composite Index
® also benefited, gaining 10.39%, while the small-cap Russell 2000
® Index lost its edge, returning only 0.34%, as risk appetites waned. Among sectors in the widely followed S&P 500
®, consumer discretionary (+21%) led the way, benefiting from a combination of rising personal income and still-benign inflation. Technology (+11%) and consumer staples (+9%) also outpaced the index. Conversely, energy (-19%) performed worst, in an environment of depressed commodity prices that also hit materials (-4%). At period end, investors remained focused on the potential global implications of a relatively stronger U.S. dollar and how China’s transition toward a consumption-led economy may affect corporate earnings.
Comments from Portfolio Manager Sean Gavin: For the year, the fund’s share classes (excluding sales charges, if applicable) produced moderate gains, significantly outpacing the 0.53% advance of the benchmark Russell 1000
® Value Index. Versus the benchmark, the fund benefited most from strong security selection in the health care, information technology and, to a lesser extent, materials groups. In contrast, the fund was hurt by weak stock picking in financials and consumer discretionary, although an overweighting in the latter category offset some of the negative impact. The fund’s top relative contributor was auto parts retailer Autozone, which issued good financial data this period. I sold the fund’s stake close to period end, after the stock exceeded my target price. Another big contributor was Google, the Internet search provider that recently changed its name to Alphabet. A position in health insurance provider Cigna also added value, as the company agreed to be acquired for a substantial premium. In contrast, various energy holdings struggled, especially BW Offshore, a supplier of equipment to offshore oil drillers, and Suncor, a Canadian oil sands company, both of which experienced substantial share-price declines. Another meaningful detractor was media company Viacom, which faced a number of business challenges. The fund’s foreign exposure helped performance despite the headwind of a stronger U.S. dollar. Of all the stocks I’ve mentioned, only Cigna was in our benchmark.
The views expressed above reflect those of the portfolio manager(s) only through the end of the period as stated on the cover of this report and do not necessarily represent the views of Fidelity or any other person in the Fidelity organization. Any such views are subject to change at any time based upon market or other conditions and Fidelity disclaims any responsibility to update such views. These views may not be relied on as investment advice and, because investment decisions for a Fidelity fund are based on numerous factors, may not be relied on as an indication of trading intent on behalf of any Fidelity fund.
Investment Summary (Unaudited)
Top Ten Stocks as of October 31, 2015
| | % of fund's net assets | % of fund's net assets 6 months ago |
| Teva Pharmaceutical Industries Ltd. sponsored ADR | 4.3 | 3.6 |
| JPMorgan Chase & Co. | 3.7 | 3.5 |
| Johnson & Johnson | 3.6 | 2.4 |
| Oracle Corp. | 3.4 | 3.5 |
| Wells Fargo & Co. | 3.4 | 3.5 |
| Berkshire Hathaway, Inc. Class B | 3.2 | 3.3 |
| Alphabet, Inc. Class A | 3.2 | 3.0 |
| Viacom, Inc. Class B (non-vtg.) | 3.1 | 2.6 |
| Samsung Electronics Co. Ltd. | 3.0 | 3.3 |
| EMC Corp. | 2.8 | 2.9 |
| | 33.7 | |
Top Five Market Sectors as of October 31, 2015
| | % of fund's net assets | % of fund's net assets 6 months ago |
| Financials | 27.8 | 27.5 |
| Information Technology | 20.6 | 20.2 |
| Health Care | 17.0 | 18.2 |
| Consumer Discretionary | 10.4 | 12.3 |
| Energy | 8.6 | 7.0 |
Asset Allocation (% of fund's net assets)
| As of October 31, 2015 * |
| | Stocks | 98.7% |
| | Short-Term Investments and Net Other Assets (Liabilities) | 1.3% |

* Foreign investments - 19.9%
| As of April 30, 2015* |
| | Stocks | 94.9% |
| | Short-Term Investments and Net Other Assets (Liabilities) | 5.1% |

* Foreign investments - 22.6%
Investments October 31, 2015
Showing Percentage of Net Assets
| Common Stocks - 98.7% | | | |
| | | Shares | Value |
| CONSUMER DISCRETIONARY - 10.4% | | | |
| Automobiles - 0.7% | | | |
| Harley-Davidson, Inc. | | 4,800 | $237,360 |
| Media - 8.0% | | | |
| CBS Corp. Class B | | 13,500 | 628,020 |
| Starz Series A (a) | | 12,100 | 405,471 |
| Twenty-First Century Fox, Inc. Class A | | 22,900 | 702,801 |
| Viacom, Inc. Class B (non-vtg.) | | 21,700 | 1,070,027 |
| | | | 2,806,319 |
| Specialty Retail - 1.7% | | | |
| Bed Bath & Beyond, Inc. (a) | | 3,900 | 232,557 |
| GNC Holdings, Inc. | | 11,700 | 348,075 |
| | | | 580,632 |
|
| TOTAL CONSUMER DISCRETIONARY | | | 3,624,311 |
|
| CONSUMER STAPLES - 4.1% | | | |
| Beverages - 1.9% | | | |
| C&C Group PLC | | 164,726 | 657,542 |
| Food & Staples Retailing - 2.2% | | | |
| Safeway, Inc.: | | | |
| rights | | 4,300 | 0 |
| rights | | 4,300 | 774 |
| Tesco PLC | | 69,500 | 196,011 |
| Wal-Mart Stores, Inc. | | 10,200 | 583,848 |
| | | | 780,633 |
|
| TOTAL CONSUMER STAPLES | | | 1,438,175 |
|
| ENERGY - 8.6% | | | |
| Energy Equipment & Services - 0.7% | | | |
| BW Offshore Ltd. | | 546,700 | 227,772 |
| Oil, Gas & Consumable Fuels - 7.9% | | | |
| Chevron Corp. | | 10,125 | 920,160 |
| Exxon Mobil Corp. | | 4,300 | 355,782 |
| Marathon Petroleum Corp. | | 16,200 | 839,160 |
| Suncor Energy, Inc. | | 21,900 | 651,674 |
| | | | 2,766,776 |
|
| TOTAL ENERGY | | | 2,994,548 |
|
| FINANCIALS - 27.8% | | | |
| Banks - 9.0% | | | |
| JPMorgan Chase & Co. | | 20,025 | 1,286,606 |
| U.S. Bancorp | | 16,171 | 682,093 |
| Wells Fargo & Co. | | 21,626 | 1,170,832 |
| | | | 3,139,531 |
| Capital Markets - 1.5% | | | |
| Fortress Investment Group LLC | | 42,400 | 237,864 |
| The Blackstone Group LP | | 8,800 | 290,928 |
| | | | 528,792 |
| Consumer Finance - 3.2% | | | |
| Capital One Financial Corp. | | 7,400 | 583,860 |
| Discover Financial Services | | 9,500 | 534,090 |
| | | | 1,117,950 |
| Diversified Financial Services - 3.2% | | | |
| Berkshire Hathaway, Inc. Class B (a) | | 8,200 | 1,115,364 |
| Insurance - 7.7% | | | |
| ACE Ltd. | | 5,400 | 613,116 |
| Allstate Corp. | | 8,740 | 540,831 |
| Prudential PLC | | 33,200 | 775,436 |
| The Travelers Companies, Inc. | | 6,500 | 733,785 |
| | | | 2,663,168 |
| Real Estate Investment Trusts - 3.2% | | | |
| American Capital Agency Corp. | | 23,100 | 411,873 |
| Annaly Capital Management, Inc. | | 70,800 | 704,460 |
| | | | 1,116,333 |
|
| TOTAL FINANCIALS | | | 9,681,138 |
|
| HEALTH CARE - 17.0% | | | |
| Biotechnology - 2.3% | | | |
| Amgen, Inc. | | 5,100 | 806,718 |
| Health Care Providers & Services - 4.8% | | | |
| Cigna Corp. | | 4,100 | 549,564 |
| Express Scripts Holding Co. (a) | | 6,300 | 544,194 |
| Laboratory Corp. of America Holdings (a) | | 4,800 | 589,152 |
| | | | 1,682,910 |
| Pharmaceuticals - 9.9% | | | |
| Johnson & Johnson | | 12,400 | 1,252,772 |
| Sanofi SA sponsored ADR | | 14,100 | 709,794 |
| Teva Pharmaceutical Industries Ltd. sponsored ADR | | 25,000 | 1,479,750 |
| | | | 3,442,316 |
|
| TOTAL HEALTH CARE | | | 5,931,944 |
|
| INDUSTRIALS - 4.7% | | | |
| Aerospace & Defense - 1.2% | | | |
| United Technologies Corp. | | 4,100 | 403,481 |
| Machinery - 2.2% | | | |
| Deere & Co. (b) | | 9,800 | 764,400 |
| Professional Services - 1.3% | | | |
| Dun & Bradstreet Corp. | | 4,100 | 466,867 |
|
| TOTAL INDUSTRIALS | | | 1,634,748 |
|
| INFORMATION TECHNOLOGY - 20.6% | | | |
| Communications Equipment - 3.9% | | | |
| Cisco Systems, Inc. | | 25,964 | 749,061 |
| Harris Corp. | | 7,900 | 625,127 |
| | | | 1,374,188 |
| Internet Software & Services - 3.2% | | | |
| Alphabet, Inc. Class A (a) | | 1,500 | 1,106,085 |
| IT Services - 2.8% | | | |
| IBM Corp. | | 2,500 | 350,200 |
| The Western Union Co. | | 31,900 | 614,075 |
| | | | 964,275 |
| Software - 3.4% | | | |
| Oracle Corp. | | 31,000 | 1,204,040 |
| Technology Hardware, Storage & Peripherals - 7.3% | | | |
| Apple, Inc. | | 4,400 | 525,800 |
| EMC Corp. | | 36,800 | 964,896 |
| Samsung Electronics Co. Ltd. | | 876 | 1,052,639 |
| | | | 2,543,335 |
|
| TOTAL INFORMATION TECHNOLOGY | | | 7,191,923 |
|
| MATERIALS - 3.5% | | | |
| Chemicals - 3.5% | | | |
| CF Industries Holdings, Inc. | | 12,700 | 644,779 |
| LyondellBasell Industries NV Class A | | 6,000 | 557,460 |
| | | | 1,202,239 |
| UTILITIES - 2.0% | | | |
| Electric Utilities - 2.0% | | | |
| Exelon Corp. | | 25,500 | 711,960 |
| TOTAL COMMON STOCKS | | | |
| (Cost $34,241,783) | | | 34,410,986 |
|
| Money Market Funds - 2.9% | | | |
| Fidelity Cash Central Fund, 0.18% (c) | | 229,248 | 229,248 |
| Fidelity Securities Lending Cash Central Fund, 0.19% (c)(d) | | 776,000 | 776,000 |
| TOTAL MONEY MARKET FUNDS | | | |
| (Cost $1,005,248) | | | 1,005,248 |
| TOTAL INVESTMENT PORTFOLIO - 101.6% | | | |
| (Cost $35,247,031) | | | 35,416,234 |
| NET OTHER ASSETS (LIABILITIES) - (1.6)% | | | (545,018) |
| NET ASSETS - 100% | | | $34,871,216 |
Legend
(a) Non-income producing
(b) Security or a portion of the security is on loan at period end.
(c) Affiliated fund that is generally available only to investment companies and other accounts managed by Fidelity Investments. The rate quoted is the annualized seven-day yield of the fund at period end. A complete unaudited listing of the fund's holdings as of its most recent quarter end is available upon request. In addition, each Fidelity Central Fund's financial statements, which are not covered by the Fund's Report of Independent Registered Public Accounting Firm, are available on the SEC's website or upon request.
(d) Investment made with cash collateral received from securities on loan.
Affiliated Central Funds
Information regarding fiscal year to date income earned by the Fund from investments in Fidelity Central Funds is as follows:
| Fund | Income earned |
| Fidelity Cash Central Fund | $2,498 |
| Fidelity Securities Lending Cash Central Fund | 1,479 |
| Total | $3,977 |
Investment Valuation
The following is a summary of the inputs used, as of October 31, 2015, involving the Fund's assets and liabilities carried at fair value. The inputs or methodology used for valuing securities may not be an indication of the risk associated with investing in those securities. For more information on valuation inputs, and their aggregation into the levels used below, please refer to the Investment Valuation section in the accompanying Notes to Financial Statements.
| | Valuation Inputs at Reporting Date: |
| Description | Total | Level 1 | Level 2 | Level 3 |
| Investments in Securities: | | | | |
| Equities: | | | | |
| Consumer Discretionary | $3,624,311 | $3,624,311 | $-- | $-- |
| Consumer Staples | 1,438,175 | 1,241,390 | 196,011 | 774 |
| Energy | 2,994,548 | 2,994,548 | -- | -- |
| Financials | 9,681,138 | 8,905,702 | 775,436 | -- |
| Health Care | 5,931,944 | 5,931,944 | -- | -- |
| Industrials | 1,634,748 | 1,634,748 | -- | -- |
| Information Technology | 7,191,923 | 7,191,923 | -- | -- |
| Materials | 1,202,239 | 1,202,239 | -- | -- |
| Utilities | 711,960 | 711,960 | -- | -- |
| Money Market Funds | 1,005,248 | 1,005,248 | -- | -- |
| Total Investments in Securities: | $35,416,234 | $34,444,013 | $971,447 | $774 |
Other Information
Distribution of investments by country or territory of incorporation, as a percentage of Total Net Assets, is as follows (Unaudited):
| United States of America | 80.1% |
| Israel | 4.3% |
| Korea (South) | 3.0% |
| United Kingdom | 2.7% |
| France | 2.0% |
| Ireland | 1.9% |
| Canada | 1.9% |
| Switzerland | 1.8% |
| Netherlands | 1.6% |
| Others (Individually Less Than 1%) | 0.7% |
| | 100.0% |
See accompanying notes which are an integral part of the financial statements.
Financial Statements
Statement of Assets and Liabilities
| | | October 31, 2015 |
| Assets | | |
Investment in securities, at value (including securities loaned of $756,600) — See accompanying schedule:
Unaffiliated issuers (cost $34,241,783) | $34,410,986 | |
| Fidelity Central Funds (cost $1,005,248) | 1,005,248 | |
| Total Investments (cost $35,247,031) | | $35,416,234 |
| Receivable for investments sold | | 475,368 |
| Receivable for fund shares sold | | 21,980 |
| Dividends receivable | | 24,704 |
| Distributions receivable from Fidelity Central Funds | | 222 |
| Prepaid expenses | | 93 |
| Receivable from investment adviser for expense reductions | | 1,863 |
| Other receivables | | 1,099 |
| Total assets | | 35,941,563 |
| Liabilities | | |
| Payable for investments purchased | $192,529 | |
| Payable for fund shares redeemed | 22,925 | |
| Accrued management fee | 18,980 | |
| Distribution and service plan fees payable | 11,806 | |
| Other affiliated payables | 7,986 | |
| Other payables and accrued expenses | 40,121 | |
| Collateral on securities loaned, at value | 776,000 | |
| Total liabilities | | 1,070,347 |
| Net Assets | | $34,871,216 |
| Net Assets consist of: | | |
| Paid in capital | | $58,948,986 |
| Undistributed net investment income | | 398,370 |
| Accumulated undistributed net realized gain (loss) on investments and foreign currency transactions | | (24,645,342) |
| Net unrealized appreciation (depreciation) on investments and assets and liabilities in foreign currencies | | 169,202 |
| Net Assets | | $34,871,216 |
| Calculation of Maximum Offering Price | | |
| Class A: | | |
| Net Asset Value and redemption price per share ($18,237,159 ÷ 1,116,069 shares) | | $16.34 |
| Maximum offering price per share (100/94.25 of $16.34) | | $17.34 |
| Class T: | | |
| Net Asset Value and redemption price per share ($7,672,418 ÷ 469,811 shares) | | $16.33 |
| Maximum offering price per share (100/96.50 of $16.33) | | $16.92 |
| Class B: | | |
| Net Asset Value and offering price per share ($247,124 ÷ 15,380 shares)(a) | | $16.07 |
| Class C: | | |
| Net Asset Value and offering price per share ($5,662,423 ÷ 356,680 shares)(a) | | $15.88 |
| Class I: | | |
| Net Asset Value, offering price and redemption price per share ($3,052,092 ÷ 185,211 shares) | | $16.48 |
(a) Redemption price per share is equal to net asset value less any applicable contingent deferred sales charge.
See accompanying notes which are an integral part of the financial statements.
Statement of Operations
| | | Year ended October 31, 2015 |
| Investment Income | | |
| Dividends | | $1,000,167 |
| Interest | | 4 |
| Income from Fidelity Central Funds | | 3,977 |
| Total income | | 1,004,148 |
| Expenses | | |
| Management fee | | |
| Basic fee | $181,742 | |
| Performance adjustment | 17,182 | |
| Transfer agent fees | 81,560 | |
| Distribution and service plan fees | 138,566 | |
| Accounting and security lending fees | 12,915 | |
| Custodian fees and expenses | 7,329 | |
| Independent trustees' compensation | 138 | |
| Registration fees | 62,934 | |
| Audit | 51,473 | |
| Legal | 195 | |
| Miscellaneous | 421 | |
| Total expenses before reductions | 554,455 | |
| Expense reductions | (85,356) | 469,099 |
| Net investment income (loss) | | 535,049 |
| Realized and Unrealized Gain (Loss) | | |
| Net realized gain (loss) on: | | |
| Investment securities: | | |
| Unaffiliated issuers | 1,933,301 | |
| Foreign currency transactions | (946) | |
| Futures contracts | (42,168) | |
| Total net realized gain (loss) | | 1,890,187 |
Change in net unrealized appreciation (depreciation) on:
Investment securities | (1,350,223) | |
| Assets and liabilities in foreign currencies | (1) | |
| Total change in net unrealized appreciation (depreciation) | | (1,350,224) |
| Net gain (loss) | | 539,963 |
| Net increase (decrease) in net assets resulting from operations | | $1,075,012 |
See accompanying notes which are an integral part of the financial statements.
Statement of Changes in Net Assets
| | Year ended October 31, 2015 | Year ended October 31, 2014 |
| Increase (Decrease) in Net Assets | | |
| Operations | | |
| Net investment income (loss) | $535,049 | $187,571 |
| Net realized gain (loss) | 1,890,187 | 4,921,564 |
| Change in net unrealized appreciation (depreciation) | (1,350,224) | (908,952) |
| Net increase (decrease) in net assets resulting from operations | 1,075,012 | 4,200,183 |
| Distributions to shareholders from net investment income | (169,686) | – |
| Distributions to shareholders from net realized gain | (24,958) | – |
| Total distributions | (194,644) | – |
| Share transactions - net increase (decrease) | 4,980,098 | (3,923,371) |
| Total increase (decrease) in net assets | 5,860,466 | 276,812 |
| Net Assets | | |
| Beginning of period | 29,010,750 | 28,733,938 |
| End of period (including undistributed net investment income of $398,370 and undistributed net investment income of $124,802, respectively) | $34,871,216 | $29,010,750 |
See accompanying notes which are an integral part of the financial statements.
Financial Highlights — Fidelity Advisor Value Leaders Fund Class A
| | | | | | |
| Years ended October 31, | 2015 | 2014 | 2013 | 2012 | 2011 |
| Selected Per–Share Data | | | | | |
| Net asset value, beginning of period | $15.79 | $13.73 | $10.82 | $9.96 | $10.12 |
| Income from Investment Operations | | | | | |
| Net investment income (loss)A | .29 | .12 | .10 | .13 | .10 |
| Net realized and unrealized gain (loss) | .39B | 1.94 | 3.01 | .85 | (.14) |
| Total from investment operations | .68 | 2.06 | 3.11 | .98 | (.04) |
| Distributions from net investment income | (.12) | – | (.20) | (.12) | (.11) |
| Distributions from net realized gain | (.01) | – | – | –C | (.01) |
| Total distributions | (.13) | – | (.20) | (.12) | (.12) |
| Net asset value, end of period | $16.34 | $15.79 | $13.73 | $10.82 | $9.96 |
| Total ReturnD,E | 4.32%B | 15.00% | 29.24% | 10.00% | (.40)% |
| Ratios to Average Net AssetsF,G | | | | | |
| Expenses before reductions | 1.49% | 1.30% | 1.33% | 1.28% | 1.24% |
| Expenses net of fee waivers, if any | 1.25% | 1.25% | 1.25% | 1.25% | 1.24% |
| Expenses net of all reductions | 1.25% | 1.25% | 1.23% | 1.24% | 1.23% |
| Net investment income (loss) | 1.78% | .78% | .82% | 1.26% | .91% |
| Supplemental Data | | | | | |
| Net assets, end of period (000 omitted) | $18,237 | $15,067 | $15,339 | $14,705 | $15,484 |
| Portfolio turnover rateH | 54% | 182% | 87% | 94% | 161% |
A Calculated based on average shares outstanding during the period.
B Net realized and unrealized gain (loss) per share reflects proceeds received from litigation which amounted to $.05 per share. Excluding these litigation proceeds, the total return would have been 4.01%.
C Amount represents less than $.005 per share.
D Total returns would have been lower if certain expenses had not been reduced during the applicable periods shown.
E Total returns do not include the effect of the sales charges.
F Fees and expenses of any underlying Fidelity Central Funds are not included in the Fund's expense ratio. The Fund indirectly bears its proportionate share of the expenses of any underlying Fidelity Central Funds.
G Expense ratios reflect operating expenses of the class. Expenses before reductions do not reflect amounts reimbursed by the investment adviser or reductions from brokerage service arrangements or reductions from other expense offset arrangements and do not represent the amount paid by the class during periods when reimbursements or reductions occur. Expenses net of fee waivers reflect expenses after reimbursement by the investment adviser but prior to reductions from brokerage service arrangements or other expense offset arrangements. Expenses net of all reductions represent the net expenses paid by the class.
H Amount does not include the portfolio activity of any underlying Fidelity Central Funds.
See accompanying notes which are an integral part of the financial statements.
Financial Highlights — Fidelity Advisor Value Leaders Fund Class T
| | | | | | |
| Years ended October 31, | 2015 | 2014 | 2013 | 2012 | 2011 |
| Selected Per–Share Data | | | | | |
| Net asset value, beginning of period | $15.78 | $13.75 | $10.82 | $9.96 | $10.08 |
| Income from Investment Operations | | | | | |
| Net investment income (loss)A | .25 | .08 | .07 | .10 | .07 |
| Net realized and unrealized gain (loss) | .39B | 1.95 | 3.02 | .85 | (.13) |
| Total from investment operations | .64 | 2.03 | 3.09 | .95 | (.06) |
| Distributions from net investment income | (.08) | – | (.16) | (.09) | (.05) |
| Distributions from net realized gain | (.01) | – | – | –C | (.01) |
| Total distributions | (.09) | – | (.16) | (.09) | (.06) |
| Net asset value, end of period | $16.33 | $15.78 | $13.75 | $10.82 | $9.96 |
| Total ReturnD,E | 4.04%B | 14.76% | 28.97% | 9.68% | (.64)% |
| Ratios to Average Net AssetsF,G | | | | | |
| Expenses before reductions | 1.78% | 1.58% | 1.60% | 1.55% | 1.49% |
| Expenses net of fee waivers, if any | 1.50% | 1.50% | 1.50% | 1.50% | 1.49% |
| Expenses net of all reductions | 1.50% | 1.50% | 1.48% | 1.49% | 1.48% |
| Net investment income (loss) | 1.53% | .53% | .57% | 1.01% | .67% |
| Supplemental Data | | | | | |
| Net assets, end of period (000 omitted) | $7,672 | $7,819 | $6,569 | $6,145 | $8,254 |
| Portfolio turnover rateH | 54% | 182% | 87% | 94% | 161% |
A Calculated based on average shares outstanding during the period.
B Net realized and unrealized gain (loss) per share reflects proceeds received from litigation which amounted to $.05 per share. Excluding these litigation proceeds, the total return would have been 3.73%.
C Amount represents less than $.005 per share.
D Total returns would have been lower if certain expenses had not been reduced during the applicable periods shown.
E Total returns do not include the effect of the sales charges.
F Fees and expenses of any underlying Fidelity Central Funds are not included in the Fund's expense ratio. The Fund indirectly bears its proportionate share of the expenses of any underlying Fidelity Central Funds.
G Expense ratios reflect operating expenses of the class. Expenses before reductions do not reflect amounts reimbursed by the investment adviser or reductions from brokerage service arrangements or reductions from other expense offset arrangements and do not represent the amount paid by the class during periods when reimbursements or reductions occur. Expenses net of fee waivers reflect expenses after reimbursement by the investment adviser but prior to reductions from brokerage service arrangements or other expense offset arrangements. Expenses net of all reductions represent the net expenses paid by the class.
H Amount does not include the portfolio activity of any underlying Fidelity Central Funds.
See accompanying notes which are an integral part of the financial statements.
Financial Highlights — Fidelity Advisor Value Leaders Fund Class B
| | | | | | |
| Years ended October 31, | 2015 | 2014 | 2013 | 2012 | 2011 |
| Selected Per–Share Data | | | | | |
| Net asset value, beginning of period | $15.53 | $13.60 | $10.70 | $9.84 | $9.99 |
| Income from Investment Operations | | | | | |
| Net investment income (loss)A | .17 | –B | .01 | .05 | .02 |
| Net realized and unrealized gain (loss) | .38C | 1.93 | 2.99 | .85 | (.13) |
| Total from investment operations | .55 | 1.93 | 3.00 | .90 | (.11) |
| Distributions from net investment income | – | – | (.10) | (.03) | (.03) |
| Distributions from net realized gain | (.01) | – | – | –B | (.01) |
| Total distributions | (.01) | – | (.10) | (.04)D | (.04) |
| Net asset value, end of period | $16.07 | $15.53 | $13.60 | $10.70 | $9.84 |
| Total ReturnE,F | 3.56%C | 14.19% | 28.31% | 9.14% | (1.14)% |
| Ratios to Average Net AssetsG,H | | | | | |
| Expenses before reductions | 2.33% | 2.12% | 2.10% | 2.04% | 1.99% |
| Expenses net of fee waivers, if any | 2.00% | 2.00% | 2.00% | 2.00% | 1.99% |
| Expenses net of all reductions | 2.00% | 2.00% | 1.98% | 1.99% | 1.98% |
| Net investment income (loss) | 1.03% | .03% | .07% | .51% | .16% |
| Supplemental Data | | | | | |
| Net assets, end of period (000 omitted) | $247 | $406 | $719 | $895 | $1,110 |
| Portfolio turnover rateI | 54% | 182% | 87% | 94% | 161% |
A Calculated based on average shares outstanding during the period.
B Amount represents less than $.005 per share.
C Net realized and unrealized gain (loss) per share reflects proceeds received from litigation which amounted to $.05 per share. Excluding these litigation proceeds, the total return would have been 3.25%.
D Total distributions of $.04 per share is comprised of distributions from net investment income of $.031 and distributions from net realized gain of $.004 per share.
E Total returns would have been lower if certain expenses had not been reduced during the applicable periods shown.
F Total returns do not include the effect of the contingent deferred sales charge.
G Fees and expenses of any underlying Fidelity Central Funds are not included in the Fund's expense ratio. The Fund indirectly bears its proportionate share of the expenses of any underlying Fidelity Central Funds.
H Expense ratios reflect operating expenses of the class. Expenses before reductions do not reflect amounts reimbursed by the investment adviser or reductions from brokerage service arrangements or reductions from other expense offset arrangements and do not represent the amount paid by the class during periods when reimbursements or reductions occur. Expenses net of fee waivers reflect expenses after reimbursement by the investment adviser but prior to reductions from brokerage service arrangements or other expense offset arrangements. Expenses net of all reductions represent the net expenses paid by the class.
I Amount does not include the portfolio activity of any underlying Fidelity Central Funds.
See accompanying notes which are an integral part of the financial statements.
Financial Highlights — Fidelity Advisor Value Leaders Fund Class C
| | | | | | |
| Years ended October 31, | 2015 | 2014 | 2013 | 2012 | 2011 |
| Selected Per–Share Data | | | | | |
| Net asset value, beginning of period | $15.35 | $13.44 | $10.59 | $9.75 | $9.92 |
| Income from Investment Operations | | | | | |
| Net investment income (loss)A | .17 | –B | .01 | .05 | .02 |
| Net realized and unrealized gain (loss) | .37C | 1.91 | 2.95 | .84 | (.13) |
| Total from investment operations | .54 | 1.91 | 2.96 | .89 | (.11) |
| Distributions from net investment income | – | – | (.11) | (.05) | (.05) |
| Distributions from net realized gain | (.01) | – | – | –B | (.01) |
| Total distributions | (.01) | – | (.11) | (.05) | (.06) |
| Net asset value, end of period | $15.88 | $15.35 | $13.44 | $10.59 | $9.75 |
| Total ReturnD,E | 3.54%C | 14.21% | 28.27% | 9.21% | (1.18)% |
| Ratios to Average Net AssetsF,G | | | | | |
| Expenses before reductions | 2.29% | 2.09% | 2.08% | 2.04% | 2.00% |
| Expenses net of fee waivers, if any | 2.00% | 2.00% | 2.00% | 2.00% | 2.00% |
| Expenses net of all reductions | 2.00% | 2.00% | 1.97% | 1.99% | 1.98% |
| Net investment income (loss) | 1.03% | .03% | .07% | .51% | .16% |
| Supplemental Data | | | | | |
| Net assets, end of period (000 omitted) | $5,662 | $4,458 | $4,340 | $3,299 | $3,775 |
| Portfolio turnover rateH | 54% | 182% | 87% | 94% | 161% |
A Calculated based on average shares outstanding during the period.
B Amount represents less than $.005 per share.
C Net realized and unrealized gain (loss) per share reflects proceeds received from litigation which amounted to $.05 per share. Excluding these litigation proceeds, the total return would have been 3.23%.
D Total returns would have been lower if certain expenses had not been reduced during the applicable periods shown.
E Total returns do not include the effect of the contingent deferred sales charge.
F Fees and expenses of any underlying Fidelity Central Funds are not included in the Fund's expense ratio. The Fund indirectly bears its proportionate share of the expenses of any underlying Fidelity Central Funds.
G Expense ratios reflect operating expenses of the class. Expenses before reductions do not reflect amounts reimbursed by the investment adviser or reductions from brokerage service arrangements or reductions from other expense offset arrangements and do not represent the amount paid by the class during periods when reimbursements or reductions occur. Expenses net of fee waivers reflect expenses after reimbursement by the investment adviser but prior to reductions from brokerage service arrangements or other expense offset arrangements. Expenses net of all reductions represent the net expenses paid by the class.
H Amount does not include the portfolio activity of any underlying Fidelity Central Funds.
See accompanying notes which are an integral part of the financial statements.
Financial Highlights — Fidelity Advisor Value Leaders Fund Class I
| | | | | | |
| Years ended October 31, | 2015 | 2014 | 2013 | 2012 | 2011 |
| Selected Per–Share Data | | | | | |
| Net asset value, beginning of period | $15.93 | $13.81 | $10.89 | $10.04 | $10.19 |
| Income from Investment Operations | | | | | |
| Net investment income (loss)A | .34 | .15 | .14 | .18 | .14 |
| Net realized and unrealized gain (loss) | .39B | 1.97 | 3.02 | .83 | (.15) |
| Total from investment operations | .73 | 2.12 | 3.16 | 1.01 | (.01) |
| Distributions from net investment income | (.17) | – | (.24) | (.16) | (.13) |
| Distributions from net realized gain | (.01) | – | – | –C | (.01) |
| Total distributions | (.18) | – | (.24) | (.16) | (.14) |
| Net asset value, end of period | $16.48 | $15.93 | $13.81 | $10.89 | $10.04 |
| Total ReturnD | 4.58%B | 15.35% | 29.65% | 10.30% | (.11)% |
| Ratios to Average Net AssetsE,F | | | | | |
| Expenses before reductions | 1.18% | 1.01% | .94% | .83% | .89% |
| Expenses net of fee waivers, if any | 1.00% | 1.00% | .94% | .83% | .89% |
| Expenses net of all reductions | 1.00% | 1.00% | .92% | .82% | .88% |
| Net investment income (loss) | 2.03% | 1.03% | 1.13% | 1.68% | 1.27% |
| Supplemental Data | | | | | |
| Net assets, end of period (000 omitted) | $3,052 | $1,261 | $1,767 | $1,195 | $523 |
| Portfolio turnover rateG | 54% | 182% | 87% | 94% | 161% |
A Calculated based on average shares outstanding during the period.
B Net realized and unrealized gain (loss) per share reflects proceeds received from litigation which amounted to $.05 per share. Excluding these litigation proceeds, the total return would have been 4.27%.
C Amount represents less than $.005 per share.
D Total returns would have been lower if certain expenses had not been reduced during the applicable periods shown.
E Fees and expenses of any underlying Fidelity Central Funds are not included in the Fund's expense ratio. The Fund indirectly bears its proportionate share of the expenses of any underlying Fidelity Central Funds.
F Expense ratios reflect operating expenses of the class. Expenses before reductions do not reflect amounts reimbursed by the investment adviser or reductions from brokerage service arrangements or reductions from other expense offset arrangements and do not represent the amount paid by the class during periods when reimbursements or reductions occur. Expenses net of fee waivers reflect expenses after reimbursement by the investment adviser but prior to reductions from brokerage service arrangements or other expense offset arrangements. Expenses net of all reductions represent the net expenses paid by the class.
G Amount does not include the portfolio activity of any underlying Fidelity Central Funds.
See accompanying notes which are an integral part of the financial statements.
Notes to Financial Statements
For the period ended October 31, 2015
1. Organization.
Fidelity Advisor Value Leaders Fund (the Fund) is a fund of Fidelity Advisor Series VIII (the Trust) and is authorized to issue an unlimited number of shares. The Trust is registered under the Investment Company Act of 1940, as amended (the 1940 Act), as an open-end management investment company organized as a Massachusetts business trust. The Fund offers Class A, Class T, Class C and Class I (formerly Institutional Class) shares, each of which, along with Class B shares, has equal rights as to assets and voting privileges. Class B shares are closed to new accounts and additional purchases, except for exchanges and reinvestments. Each class has exclusive voting rights with respect to matters that affect that class. Class B shares will automatically convert to Class A shares after a holding period of seven years from the initial date of purchase.
2. Investments in Fidelity Central Funds.
The Fund invests in Fidelity Central Funds, which are open-end investment companies generally available only to other investment companies and accounts managed by the investment adviser and its affiliates. The Fund's Schedule of Investments lists each of the Fidelity Central Funds held as of period end, if any, as an investment of the Fund, but does not include the underlying holdings of each Fidelity Central Fund. As an Investing Fund, the Fund indirectly bears its proportionate share of the expenses of the underlying Fidelity Central Funds.
The Money Market Central Funds seek preservation of capital and current income and are managed by Fidelity Investments Money Management, Inc. (FIMM), an affiliate of the investment adviser. Annualized expenses of the Money Market Central Funds as of their most recent shareholder report date are less than .005%.
A complete unaudited list of holdings for each Fidelity Central Fund is available upon request or at the Securities and Exchange Commission (the SEC) website at www.sec.gov. In addition, the financial statements of the Fidelity Central Funds, which are not covered by the Fund's Report of Independent Registered Public Accounting Firm, are available on the SEC website or upon request.
3. Significant Accounting Policies.
The financial statements have been prepared in conformity with accounting principles generally accepted in the United States of America (GAAP), which require management to make certain estimates and assumptions at the date of the financial statements. Actual results could differ from those estimates. Subsequent events, if any, through the date that the financial statements were issued have been evaluated in the preparation of the financial statements. The following summarizes the significant accounting policies of the Fund:
Investment Valuation. Investments are valued as of 4:00 p.m. Eastern time on the last calendar day of the period. The Board of Trustees (the Board) has delegated the day to day responsibility for the valuation of the Fund's investments to the Fidelity Management & Research Company (FMR) Fair Value Committee (the Committee). In accordance with valuation policies and procedures approved by the Board, the Fund attempts to obtain prices from one or more third party pricing vendors or brokers to value its investments. When current market prices, quotations or currency exchange rates are not readily available or reliable, investments will be fair valued in good faith by the Committee, in accordance with procedures adopted by the Board. Factors used in determining fair value vary by investment type and may include market or investment specific events. The frequency with which these procedures are used cannot be predicted and they may be utilized to a significant extent. The Committee oversees the Fund's valuation policies and procedures and reports to the Board on the Committee's activities and fair value determinations. The Board monitors the appropriateness of the procedures used in valuing the Fund's investments and ratifies the fair value determinations of the Committee.
The Fund categorizes the inputs to valuation techniques used to value its investments into a disclosure hierarchy consisting of three levels as shown below:
- Level 1 – quoted prices in active markets for identical investments
- Level 2 – other significant observable inputs (including quoted prices for similar investments, interest rates, prepayment speeds, etc.)
- Level 3 – unobservable inputs (including the Fund's own assumptions based on the best information available)
Valuation techniques used to value the Fund's investments by major category are as follows:
Equity securities, including restricted securities, for which market quotations are readily available, are valued at the last reported sale price or official closing price as reported by a third party pricing vendor on the primary market or exchange on which they are traded and are categorized as Level 1 in the hierarchy. In the event there were no sales during the day or closing prices are not available, securities are valued at the last quoted bid price or may be valued using the last available price and are generally categorized as Level 2 in the hierarchy. For foreign equity securities, when market or security specific events arise, comparisons to the valuation of American Depositary Receipts (ADRs), futures contracts, Exchange-Traded Funds (ETFs) and certain indexes as well as quoted prices for similar securities may be used and would be categorized as Level 2 in the hierarchy. Utilizing these techniques may result in transfers between Level 1 and Level 2. For equity securities, including restricted securities, where observable inputs are limited, assumptions about market activity and risk are used and these securities may be categorized as Level 3 in the hierarchy.
Investments in open-end mutual funds, including the Fidelity Central Funds, are valued at their closing net asset value (NAV) each business day and are categorized as Level 1 in the hierarchy.
Changes in valuation techniques may result in transfers in or out of an assigned level within the disclosure hierarchy. The aggregate value of investments by input level as of October 31, 2015, is included at the end of the Fund's Schedule of Investments.
Foreign Currency. The Fund may use foreign currency contracts to facilitate transactions in foreign-denominated securities. Gains and losses from these transactions may arise from changes in the value of the foreign currency or if the counterparties do not perform under the contracts' terms.
Foreign-denominated assets, including investment securities, and liabilities are translated into U.S. dollars at the exchange rates at period end. Purchases and sales of investment securities, income and dividends received and expenses denominated in foreign currencies are translated into U.S. dollars at the exchange rate in effect on the transaction date.
The effects of exchange rate fluctuations on investments are included with the net realized and unrealized gain (loss) on investment securities. Other foreign currency transactions resulting in realized and unrealized gain (loss) are disclosed separately.
Investment Transactions and Income. For financial reporting purposes, the Fund's investment holdings and NAV include trades executed through the end of the last business day of the period. The NAV per share for processing shareholder transactions is calculated as of the close of business of the New York Stock Exchange (NYSE), normally 4:00 p.m. Eastern time and includes trades executed through the end of the prior business day. Gains and losses on securities sold are determined on the basis of identified cost and may include proceeds received from litigation. Dividend income is recorded on the ex-dividend date, except for certain dividends from foreign securities where the ex-dividend date may have passed, which are recorded as soon as the Fund is informed of the ex-dividend date. Non-cash dividends included in dividend income, if any, are recorded at the fair market value of the securities received. Income and capital gain distributions from Fidelity Central Funds, if any, are recorded on the ex-dividend date. Distributions received on securities that represent a return of capital or capital gain are recorded as a reduction of cost of investments and/or as a realized gain. Subsequent to ex-dividend date the Fund determines the components of these distributions, based upon receipt of tax filings or other correspondence relating to the underlying investment. Interest income is accrued as earned and includes coupon interest and amortization of premium and accretion of discount on debt securities as applicable. Investment income is recorded net of foreign taxes withheld where recovery of such taxes is uncertain.
Class Allocations and Expenses. Investment income, realized and unrealized capital gains and losses, common expenses of the Fund, and certain fund-level expense reductions, if any, are allocated daily on a pro-rata basis to each class based on the relative net assets of each class to the total net assets of the Fund. Each class differs with respect to transfer agent and distribution and service plan fees incurred. Certain expense reductions may also differ by class. For the reporting period, the allocated portion of income and expenses to each class as a percent of its average net assets may vary due to the timing of recording these transactions in relation to fluctuating net assets of the classes. Expenses directly attributable to a fund are charged to that fund. Expenses attributable to more than one fund are allocated among the respective funds on the basis of relative net assets or other appropriate methods. Expense estimates are accrued in the period to which they relate and adjustments are made when actual amounts are known.
Income Tax Information and Distributions to Shareholders. Each year, the Fund intends to qualify as a regulated investment company under Subchapter M of the Internal Revenue Code, including distributing substantially all of its taxable income and realized gains. As a result, no provision for U.S. Federal income taxes is required. As of October 31, 2015, the Fund did not have any unrecognized tax benefits in the financial statements; nor is the Fund aware of any tax positions for which it is reasonably possible that the total amounts of unrecognized tax benefits will significantly change in the next twelve months. The Fund files a U.S. federal tax return, in addition to state and local tax returns as required. The Fund's federal income tax returns are subject to examination by the Internal Revenue Service (IRS) for a period of three fiscal years after they are filed. State and local tax returns may be subject to examination for an additional fiscal year depending on the jurisdiction. Foreign taxes are provided for based on the Fund's understanding of the tax rules and rates that exist in the foreign markets in which it invests.
Distributions are declared and recorded on the ex-dividend date. Income dividends and capital gain distributions are declared separately for each class. Income and capital gain distributions are determined in accordance with income tax regulations, which may differ from GAAP.
Capital accounts within the financial statements are adjusted for permanent book-tax differences. These adjustments have no impact on net assets or the results of operations. Capital accounts are not adjusted for temporary book-tax differences which will reverse in a subsequent period.
Book-tax differences are primarily due to futures contracts, foreign currency transactions, partnerships, capital loss carryforwards and losses deferred due to wash sales.
The federal tax cost of investment securities and unrealized appreciation (depreciation) as of period end were as follows:
| Gross unrealized appreciation | $2,210,764 |
| Gross unrealized depreciation | (2,213,123) |
| Net unrealized appreciation (depreciation) on securities | $(2,359) |
| Tax Cost | $35,418,593 |
The tax-based components of distributable earnings as of period end were as follows:
| Undistributed ordinary income | $398,369 |
| Capital loss carryforward | $(24,473,780) |
| Net unrealized appreciation (depreciation) on securities and other investments | $(2,360) |
Capital loss carryforwards are only available to offset future capital gains of the Fund to the extent provided by regulations and may be limited. Under the Regulated Investment Company Modernization Act of 2010 (the Act), the Fund is permitted to carry forward capital losses incurred in taxable years beginning after December 22, 2010 for an unlimited period and such capital losses are required to be used prior to any losses that expire. The capital loss carryforward information presented below, including any applicable limitation, is estimated as of fiscal period end and is subject to adjustment.
| Fiscal year of expiration | |
| 2016 | $(9,484,911) |
| 2017 | (14,819,668) |
| 2019 | (169,201) |
| Total capital loss carryforward | $(24,473,780) |
The tax character of distributions paid was as follows:
| | October 31, 2015 | October 31, 2014 |
| Ordinary Income | $194,644 | $– |
4. Derivative Instruments.
Risk Exposures and the Use of Derivative Instruments. The Fund's investment objective allows the Fund to enter into various types of derivative contracts, including futures contracts. Derivatives are investments whose value is primarily derived from underlying assets, indices or reference rates and may be transacted on an exchange or over-the-counter (OTC). Derivatives may involve a future commitment to buy or sell a specified asset based on specified terms, to exchange future cash flows at periodic intervals based on a notional principal amount, or for one party to make one or more payments upon the occurrence of specified events in exchange for periodic payments from the other party.
The Fund used derivatives to increase returns and to manage exposure to certain risks as defined below. The success of any strategy involving derivatives depends on analysis of numerous economic factors, and if the strategies for investment do not work as intended, the Fund may not achieve its objectives.
The Fund's use of derivatives increased or decreased its exposure to the following risk:
| Equity Risk | Equity risk relates to the fluctuations in the value of financial instruments as a result of changes in market prices (other than those arising from interest rate risk or foreign exchange risk), whether caused by factors specific to an individual investment, its issuer, or all factors affecting all instruments traded in a market or market segment. |
The Fund is also exposed to additional risks from investing in derivatives, such as liquidity risk and counterparty credit risk. Liquidity risk is the risk that the Fund will be unable to close out the derivative in the open market in a timely manner. Counterparty credit risk is the risk that the counterparty will not be able to fulfill its obligation to the Fund. Counterparty credit risk related to exchange-traded futures contracts may be mitigated by the protection provided by the exchange on which they trade.
Investing in derivatives may involve greater risks than investing in the underlying assets directly and, to varying degrees, may involve risk of loss in excess of any initial investment and collateral received and amounts recognized in the Statement of Assets and Liabilities. In addition, there may be the risk that the change in value of the derivative contract does not correspond to the change in value of the underlying instrument.
Futures Contracts. A futures contract is an agreement between two parties to buy or sell a specified underlying instrument for a fixed price at a specified future date. The Fund used futures contracts to manage its exposure to the stock market.
Upon entering into a futures contract, a fund is required to deposit either cash or securities (initial margin) with a clearing broker in an amount equal to a certain percentage of the face value of the contract. Futures contracts are marked-to-market daily and subsequent daily payments (variation margin) are made or received by a fund depending on the daily fluctuations in the value of the futures contracts and are recorded as unrealized appreciation or (depreciation). This receivable and/or payable, if any, is included in daily variation margin for derivative instruments in the Statement of Assets and Liabilities. Realized gain or (loss) is recorded upon the expiration or closing of a futures contract.
Any open futures contracts at period end are presented in the Schedule of Investments under the caption "Futures Contracts". The underlying face amount at value reflects each contract's exposure to the underlying instrument or index at period end.
During the period the Fund recognized net realized gain (loss) of $(42,168) related to its investment in futures contracts. This amount is included in the Statement of Operations.
5. Purchases and Sales of Investments.
Purchases and sales of securities, other than short-term securities, aggregated $22,267,921 and $16,890,411, respectively.
6. Fees and Other Transactions with Affiliates.
Management Fee. Fidelity Management & Research Company (the investment adviser) and its affiliates provide the Fund with investment management related services for which the Fund pays a monthly management fee. The management fee is the sum of an individual fund fee rate that is based on an annual rate of .30% of the Fund's average net assets and an annualized group fee rate that averaged .25% during the period. The group fee rate is based upon the average net assets of all the mutual funds advised by the investment adviser, including any mutual funds previously advised by the investment adviser that are currently advised by Fidelity SelectCo, LLC, an affiliate of the investment adviser. The group fee rate decreases as assets under management increase and increases as assets under management decrease. In addition, the management fee is subject to a performance adjustment (up to a maximum of +/- .20% of the Fund's average net assets over a 36 month performance period). The upward or downward adjustment to the management fee is based on the relative investment performance of Class I of the Fund as compared to its benchmark index, the Russell 1000 Value Index, over the same 36 month performance period. For the reporting period, the total annual management fee rate, including the performance adjustment, was .60% of the Fund's average net assets. The performance adjustment included in the management fee rate may be higher or lower than the maximum performance adjustment rate due to the difference between the average net assets for the reporting and performance periods.
Distribution and Service Plan Fees. In accordance with Rule 12b-1 of the 1940 Act, the Fund has adopted separate Distribution and Service Plans for each class of shares, except for the Class I. Certain classes pay Fidelity Distributors Corporation (FDC), an affiliate of the investment adviser, separate Distribution and Service Fees, each of which is based on an annual percentage of each class' average net assets. In addition, FDC may pay financial intermediaries for selling shares of the Fund and providing shareholder support services. For the period, the Distribution and Service Fee rates, total fees and amounts retained by FDC were as follows:
| | Distribution
Fee | Service
Fee | Total Fees | Retained
by FDC |
| Class A | -% | .25% | $42,547 | $2,598 |
| Class T | .25% | .25% | 40,414 | 25 |
| Class B | .75% | .25% | 3,476 | 2,610 |
| Class C | .75% | .25% | 52,129 | 7,348 |
| | | | $138,566 | $12,581 |
Sales Load. FDC may receive a front-end sales charge of up to 5.75% for selling Class A shares and 3.50% for selling Class T shares, some of which is paid to financial intermediaries for selling shares of the Fund. Depending on the holding period, FDC may receive contingent deferred sales charges levied on Class A, Class T, Class B, and Class C redemptions. The deferred sales charges range from 5.00% to 1.00% for Class B shares, 1.00% for Class C shares, 1.00% for certain purchases of Class A shares and .25% for certain purchases of Class T shares.
For the period, sales charge amounts retained by FDC were as follows:
| | Retained
by FDC |
| Class A | $6,016 |
| Class T | 986 |
| Class B(a) | 124 |
| Class C(a) | 655 |
| | $7,781 |
(a) When Class B and Class C shares are initially sold, FDC pays commissions from its own resources to financial intermediaries through which the sales are made.
Transfer Agent Fees. Fidelity Investments Institutional Operations Company, Inc., (FIIOC), an affiliate of the investment adviser, is the transfer, dividend disbursing and shareholder servicing agent for each class of the Fund. FIIOC receives account fees and asset-based fees that vary according to the account size and type of account of the shareholders of the respective classes of the Fund. FIIOC pays for typesetting, printing and mailing of shareholder reports, except proxy statements.
For the period, transfer agent fees for each class were as follows:
| | Amount | % of
Class-Level Average
Net Assets |
| Class A | $39,761 | .23 |
| Class T | 20,960 | .26 |
| Class B | 1,043 | .30 |
| Class C | 14,720 | .28 |
| Class I | 5,076 | .21 |
| | $81,560 | |
Accounting and Security Lending Fees. Fidelity Service Company, Inc. (FSC), an affiliate of the investment adviser, maintains the Fund's accounting records. The accounting fee is based on the level of average net assets for each month. Under a separate contract, FSC administers the security lending program. The security lending fee is based on the number and duration of lending transactions.
Brokerage Commissions. The Fund placed a portion of its portfolio transactions with brokerage firms which are affiliates of the investment adviser. Brokerage commissions are included in net realized gain (loss) and change in net unrealized appreciation (depreciation) in the Statement of Operations. The commissions paid to these affiliated firms were $214 for the period.
7. Committed Line of Credit.
The Fund participates with other funds managed by the investment adviser or an affiliate in a $4.25 billion credit facility (the "line of credit") to be utilized for temporary or emergency purposes to fund shareholder redemptions or for other short-term liquidity purposes. The Fund has agreed to pay commitment fees on its pro-rata portion of the line of credit, which amounted to $47 and is reflected in Miscellaneous expenses on the Statement of Operations. During the period, the Fund did not borrow on this line of credit.
8. Security Lending.
The Fund lends portfolio securities through a lending agent from time to time in order to earn additional income. For equity securities, a lending agent is used and may loan securities to certain qualified borrowers, including Fidelity Capital Markets (FCM), a broker-dealer affiliated with the Fund. On the settlement date of the loan, the Fund receives collateral (in the form of U.S. Treasury obligations, letters of credit and/or cash) against the loaned securities and maintains collateral in an amount not less than 100% of the market value of the loaned securities during the period of the loan. The market value of the loaned securities is determined at the close of business of the Fund and any additional required collateral is delivered to the Fund on the next business day. The Fund or borrower may terminate the loan at any time, and if the borrower defaults on its obligation to return the securities loaned because of insolvency or other reasons, the Fund may apply collateral received from the borrower against the obligation. The Fund may experience delays and costs in recovering the securities loaned. Any cash collateral received is invested in the Fidelity Securities Lending Cash Central Fund. The value of loaned securities and cash collateral at period end are disclosed on the Fund's Statement of Assets and Liabilities. Security lending income represents the income earned on investing cash collateral, less rebates paid to borrowers, and any lending agent fees associated with the loan, plus any premium payments received for lending certain types of securities. Security lending income is presented in the Statement of Operations as a component of income from Fidelity Central Funds. Total security lending income during the period amounted to $1,479. During the period, there were no securities loaned to FCM.
9. Expense Reductions.
The investment adviser voluntarily agreed to reimburse each class to the extent annual operating expenses exceeded certain levels of average net assets as noted in the table below. Some expenses, for example interest expense, including commitment fees, are excluded from this reimbursement.
The following classes were in reimbursement during the period:
| | Expense
Limitations | Reimbursement | |
| Class A | 1.25% | $41,382 | |
| Class T | 1.50% | 22,205 | |
| Class B | 2.00% | 1,118 | |
| Class C | 2.00% | 15,104 | |
| Class I | 1.00% | 4,373 | |
| | | $84,182 | |
| | | | |
Commissions paid to certain brokers with whom the investment adviser, or its affiliates, places trades on behalf of the Fund include an amount in addition to trade execution, which may be rebated back to the Fund to offset certain expenses. This amount totaled $434 for the period. In addition, through arrangements with the Fund's custodian, credits realized as a result of certain uninvested cash balances were used to reduce the Fund's expenses. During the period, these credits reduced the Fund's custody expenses by $19.
In addition, during the period the investment adviser reimbursed and/or waived a portion of fund-level operating expenses in the amount of $138 and a portion of class-level operating expenses as follows:
| | Amount |
| Class A | $344 |
| Class T | 122 |
| Class B | 1 |
| Class C | 75 |
| Class I | 41 |
| | $583 |
10. Distributions to Shareholders.
Distributions to shareholders of each class were as follows:
| Years ended October 31, | 2015 | 2014 |
| From net investment income | | |
| Class A | $114,891 | $– |
| Class T | 37,662 | – |
| Class I | 17,133 | – |
| Total | $169,686 | $– |
| From net realized gain | | |
| Class A | $12,739 | $– |
| Class T | 6,567 | – |
| Class B | 311 | – |
| Class C | 3,946 | – |
| Class I | 1,395 | – |
| Total | $24,958 | $– |
11. Share Transactions.
Share transactions for each class were as follows and may contain automatic conversions between classes or exchanges between funds:
| | Shares | Shares | Dollars | Dollars |
| Years ended October 31, | 2015 | 2014 | 2015 | 2014 |
| Class A | | | | |
| Shares sold | 347,210 | 138,015 | $5,762,966 | $2,028,107 |
| Reinvestment of distributions | 7,654 | – | 124,714 | – |
| Shares redeemed | (192,743) | (301,611) | (3,168,130) | (4,564,426) |
| Net increase (decrease) | 162,121 | (163,596) | $2,719,550 | $(2,536,319) |
| Class T | | | | |
| Shares sold | 61,595 | 118,612 | $1,008,225 | $1,713,933 |
| Reinvestment of distributions | 2,644 | – | 43,169 | – |
| Shares redeemed | (89,859) | (100,942) | (1,479,942) | (1,483,209) |
| Net increase (decrease) | (25,620) | 17,670 | $(428,548) | $230,724 |
| Class B | | | | |
| Shares sold | 507 | – | $8,265 | $– |
| Reinvestment of distributions | 18 | – | 292 | – |
| Shares redeemed | (11,295) | (26,732) | (181,334) | (388,717) |
| Net increase (decrease) | (10,770) | (26,732) | $(172,777) | $(388,717) |
| Class C | | | | |
| Shares sold | 112,671 | 65,526 | $1,824,580 | $939,665 |
| Reinvestment of distributions | 239 | – | 3,850 | – |
| Shares redeemed | (46,657) | (98,027) | (741,831) | (1,427,472) |
| Net increase (decrease) | 66,253 | (32,501) | $1,086,599 | $(487,807) |
| Class I | | | | |
| Shares sold | 213,391 | 129,227 | $3,568,936 | $1,917,221 |
| Reinvestment of distributions | 1,111 | – | 18,206 | – |
| Shares redeemed | (108,443) | (178,032) | (1,811,868) | (2,658,473) |
| Net increase (decrease) | 106,059 | (48,805) | $1,775,274 | $(741,252) |
12. Other.
The Fund's organizational documents provide former and current trustees and officers with a limited indemnification against liabilities arising in connection with the performance of their duties to the Fund. In the normal course of business, the Fund may also enter into contracts that provide general indemnifications. The Fund's maximum exposure under these arrangements is unknown as this would be dependent on future claims that may be made against the Fund. The risk of material loss from such claims is considered remote.
Report of Independent Registered Public Accounting Firm
To the Trustees of Fidelity Advisor Series VIII and Shareholders of Fidelity Advisor® Value Leaders Fund:
In our opinion, the accompanying statement of assets and liabilities, including the schedule of investments, and the related statements of operations and of changes in net assets and the financial highlights present fairly, in all material respects, the financial position of Fidelity Advisor® Value Leaders Fund (a fund of Fidelity Advisor Series VIII) at October 31, 2015, the results of its operations for the year then ended, the changes in its net assets for each of the two years in the period then ended and the financial highlights for each of the five years in the period then ended, in conformity with accounting principles generally accepted in the United States of America. These financial statements and financial highlights (hereafter referred to as “financial statements”) are the responsibility of the Fidelity Advisor® Value Leaders Fund’s management. Our responsibility is to express an opinion on these financial statements based on our audits. We conducted our audits of these financial statements in accordance with the standards of the Public Company Accounting Oversight Board (United States). Those standards require that we plan and perform the audit to obtain reasonable assurance about whether the financial statements are free of material misstatement. An audit includes examining, on a test basis, evidence supporting the amounts and disclosures in the financial statements, assessing the accounting principles used and significant estimates made by management, and evaluating the overall financial statement presentation. We believe that our audits, which included confirmation of securities at October 31, 2015 by correspondence with the custodian and brokers, provide a reasonable basis for our opinion.
PricewaterhouseCoopers LLP
Boston, Massachusetts
December 16, 2015
Trustees and Officers
The Trustees, Members of the Advisory Board (if any), and officers of the trust and fund, as applicable, are listed below. The Board of Trustees governs the fund and is responsible for protecting the interests of shareholders. The Trustees are experienced executives who meet periodically throughout the year to oversee the fund's activities, review contractual arrangements with companies that provide services to the fund, oversee management of the risks associated with such activities and contractual arrangements, and review the fund's performance. Each of the Trustees oversees 170 funds.
The Trustees hold office without limit in time except that (a) any Trustee may resign; (b) any Trustee may be removed by written instrument, signed by at least two-thirds of the number of Trustees prior to such removal; (c) any Trustee who requests to be retired or who has become incapacitated by illness or injury may be retired by written instrument signed by a majority of the other Trustees; and (d) any Trustee may be removed at any special meeting of shareholders by a two-thirds vote of the outstanding voting securities of the trust. Each Trustee who is not an interested person (as defined in the 1940 Act) of the trust and the fund is referred to herein as an Independent Trustee. Each Independent Trustee shall retire not later than the last day of the calendar year in which his or her 75th birthday occurs. The Independent Trustees may waive this mandatory retirement age policy with respect to individual Trustees. Officers and Advisory Board Members hold office without limit in time, except that any officer or Advisory Board Member may resign or may be removed by a vote of a majority of the Trustees at any regular meeting or any special meeting of the Trustees. Except as indicated, each individual has held the office shown or other offices in the same company for the past five years.
The fund’s Statement of Additional Information (SAI) includes more information about the Trustees. To request a free copy, call Fidelity at 1-877-208-0098.
Experience, Skills, Attributes, and Qualifications of the Trustees. The Governance and Nominating Committee has adopted a statement of policy that describes the experience, qualifications, attributes, and skills that are necessary and desirable for potential Independent Trustee candidates (Statement of Policy). The Board believes that each Trustee satisfied at the time he or she was initially elected or appointed a Trustee, and continues to satisfy, the standards contemplated by the Statement of Policy. The Governance and Nominating Committee also engages professional search firms to help identify potential Independent Trustee candidates who have the experience, qualifications, attributes, and skills consistent with the Statement of Policy. From time to time, additional criteria based on the composition and skills of the current Independent Trustees, as well as experience or skills that may be appropriate in light of future changes to board composition, business conditions, and regulatory or other developments, have also been considered by the professional search firms and the Governance and Nominating Committee. In addition, the Board takes into account the Trustees' commitment and participation in Board and committee meetings, as well as their leadership of standing and ad hoc committees throughout their tenure.
In determining that a particular Trustee was and continues to be qualified to serve as a Trustee, the Board has considered a variety of criteria, none of which, in isolation, was controlling. The Board believes that, collectively, the Trustees have balanced and diverse experience, qualifications, attributes, and skills, which allow the Board to operate effectively in governing the fund and protecting the interests of shareholders. Information about the specific experience, skills, attributes, and qualifications of each Trustee, which in each case led to the Board's conclusion that the Trustee should serve (or continue to serve) as a trustee of the fund, is provided below.
Board Structure and Oversight Function. James C. Curvey is an interested person and currently serves as Chairman. The Trustees have determined that an interested Chairman is appropriate and benefits shareholders because an interested Chairman has a personal and professional stake in the quality and continuity of services provided to the fund. Independent Trustees exercise their informed business judgment to appoint an individual of their choosing to serve as Chairman, regardless of whether the Trustee happens to be independent or a member of management. The Independent Trustees have determined that they can act independently and effectively without having an Independent Trustee serve as Chairman and that a key structural component for assuring that they are in a position to do so is for the Independent Trustees to constitute a substantial majority for the Board. The Independent Trustees also regularly meet in executive session. Ned C. Lautenbach serves as Chairman of the Independent Trustees and as such (i) acts as a liaison between the Independent Trustees and management with respect to matters important to the Independent Trustees and (ii) with management prepares agendas for Board meetings.
Fidelity® funds are overseen by different Boards of Trustees. The fund's Board oversees Fidelity's high income and certain equity funds, and other Boards oversee Fidelity's investment-grade bond, money market, asset allocation, and sector funds. The asset allocation funds may invest in Fidelity® funds overseen by the fund's Board. The use of separate Boards, each with its own committee structure, allows the Trustees of each group of Fidelity® funds to focus on the unique issues of the funds they oversee, including common research, investment, and operational issues. On occasion, the separate Boards establish joint committees to address issues of overlapping consequences for the Fidelity® funds overseen by each Board.
The Trustees operate using a system of committees to facilitate the timely and efficient consideration of all matters of importance to the Trustees, the fund, and fund shareholders and to facilitate compliance with legal and regulatory requirements and oversight of the fund's activities and associated risks. The Board, acting through its committees, has charged FMR and its affiliates with (i) identifying events or circumstances the occurrence of which could have demonstrably adverse effects on the fund's business and/or reputation; (ii) implementing processes and controls to lessen the possibility that such events or circumstances occur or to mitigate the effects of such events or circumstances if they do occur; and (iii) creating and maintaining a system designed to evaluate continuously business and market conditions in order to facilitate the identification and implementation processes described in (i) and (ii) above. Because the day-to-day operations and activities of the fund are carried out by or through FMR, its affiliates, and other service providers, the fund's exposure to risks is mitigated but not eliminated by the processes overseen by the Trustees. While each of the Board's committees has responsibility for overseeing different aspects of the fund's activities, oversight is exercised primarily through the Operations, Audit, and Compliance Committees. In addition, the Independent Trustees have worked with FMR to enhance the Board's oversight of investment and financial risks, legal and regulatory risks, technology risks, and operational risks, including the development of additional risk reporting to the Board. For example, a working group comprised of Independent Trustees and FMR has worked and continues to work to review the Fidelity® funds' valuation-related activities, reporting and risk management. Appropriate personnel, including but not limited to the fund's Chief Compliance Officer (CCO), FMR's internal auditor, the independent accountants, the fund's Treasurer and portfolio management personnel, make periodic reports to the Board's committees, as appropriate, including an annual review of Fidelity's risk management program for the Fidelity® funds. The responsibilities of each standing committee, including their oversight responsibilities, are described further under "Standing Committees of the Trustees."
Interested Trustees*:
Correspondence intended for a Trustee who is an interested person may be sent to Fidelity Investments, 245 Summer Street, Boston, Massachusetts 02210.
Name, Year of Birth; Principal Occupations and Other Relevant Experience+
James C. Curvey (1935)
Year of Election or Appointment: 2007
Trustee
Chairman of the Board of Trustees
Mr. Curvey also serves as Trustee of other Fidelity® funds. Mr. Curvey is a Director of Fidelity Research & Analysis Co. (investment adviser firm, 2009-present), and Vice Chairman (2007-present) and Director of FMR LLC (diversified financial services company). In addition, Mr. Curvey serves as an Overseer for the Boston Symphony Orchestra and a member of the board of Artis-Naples, Naples, Florida, and as a Trustee for Brewster Academy, Wolfeboro, New Hampshire. Previously, Mr. Curvey served as a Director of Fidelity Investments Money Management, Inc. (investment adviser firm, 2009-2014) and a Director of FMR and FMR Co., Inc. (investment adviser firms, 2007-2014).
Charles S. Morrison (1960)
Year of Election or Appointment: 2014
Trustee
Mr. Morrison also serves as Trustee of other funds. He serves as a Director of Fidelity Investments Money Management, Inc. (FIMM) (investment adviser firm, 2014-present), Director of Fidelity SelectCo, LLC (investment adviser firm, 2014-present), President, Asset Management (2014-present), and is an employee of Fidelity Investments. Previously, Mr. Morrison served as Vice President of Fidelity's Fixed Income and Asset Allocation Funds (2012-2014), President, Fixed Income (2011-2014), Vice President of Fidelity's Money Market Funds (2005-2009), President, Money Market Group Leader of FMR (investment adviser firm, 2009), and Senior Vice President, Money Market Group of FMR (2004-2009). Mr. Morrison also served as Vice President of Fidelity's Bond Funds (2002-2005), certain Balanced Funds (2002-2005), and certain Asset Allocation Funds (2002-2007), and as Senior Vice President (2002-2005) of Fidelity's Bond Division.
* Determined to be an “Interested Trustee” by virtue of, among other things, his or her affiliation with the trust or various entities under common control with FMR.
+ The information includes the Trustee's principal occupation during the last five years and other information relating to the experience, attributes, and skills relevant to the Trustee's qualifications to serve as a Trustee, which led to the conclusion that the Trustee should serve as a Trustee for the fund.
Independent Trustees:
Correspondence intended for an Independent Trustee may be sent to Fidelity Investments, P.O. Box 55235, Boston, Massachusetts 02205-5235.
Name, Year of Birth; Principal Occupations and Other Relevant Experience+
Dennis J. Dirks (1948)
Year of Election or Appointment: 2005
Trustee
Mr. Dirks also serves as Trustee of other Fidelity® funds. Prior to his retirement in May 2003, Mr. Dirks was Chief Operating Officer and a member of the Board of The Depository Trust & Clearing Corporation (DTCC). He also served as President, Chief Operating Officer, and Board member of The Depository Trust Company (DTC) and President and Board member of the National Securities Clearing Corporation (NSCC). In addition, Mr. Dirks served as Chief Executive Officer and Board member of the Government Securities Clearing Corporation, Chief Executive Officer and Board member of the Mortgage-Backed Securities Clearing Corporation, as a Trustee and a member of the Finance Committee of Manhattan College (2005-2008), as a Trustee and a member of the Finance Committee of AHRC of Nassau County (2006-2008), and as a member of the Independent Directors Council (IDC) Governing Council (2010-2015). Mr. Dirks is a member of the Board of Directors for The Brookville Center for Children's Services, Inc. (2009-present).
Alan J. Lacy (1953)
Year of Election or Appointment: 2008
Trustee
Mr. Lacy also serves as Trustee of other Fidelity® funds. Mr. Lacy serves as a member of the Board of Directors of Dave & Buster's Entertainment, Inc. (restaurant and entertainment complexes, 2010-present) and Bristol-Myers Squibb Company (global pharmaceuticals, 2008-present). In addition, Mr. Lacy served as Senior Adviser (2007-2014) of Oak Hill Capital Partners, L.P. (private equity) and also served as Chief Executive Officer (2000-2005) and Vice Chairman (2005-2006) of Sears Holdings Corporation and Sears, Roebuck and Co. (retail). Mr. Lacy is a member of the Board of Trustees of The National Parks Conservation Association (2006-present). Previously, Mr. Lacy served as Chairman of the Board of Trustees of the National Parks Conservation Association (2008-2011) and as a member of the Board of Directors for The Western Union Company (global money transfer, 2006-2011), The Hillman Companies, Inc. (hardware wholesalers, 2010-2014), and Earth Fare, Inc. (retail grocery, 2010-2014).
Ned C. Lautenbach (1944)
Year of Election or Appointment: 2000
Trustee
Chairman of the Independent Trustees
Mr. Lautenbach also serves as Trustee of other Fidelity® funds. Mr. Lautenbach currently serves as the Lead Director of the Eaton Corporation Board of Directors (diversified industrial, 1997-present). Mr. Lautenbach is Chairman of the Board of Directors of Artis-Naples in Naples, Florida (2012-present), a member of the Council on Foreign Relations (1994-present), and a member of the Board of Governors, State University System of Florida (2013-present). Previously, Mr. Lautenbach was a Partner/Advisory Partner at Clayton, Dubilier & Rice, LLC (private equity investment, 1998-2010), as well as a Director of Sony Corporation (2006-2007).
Joseph Mauriello (1944)
Year of Election or Appointment: 2008
Trustee
Mr. Mauriello also serves as Trustee of other Fidelity® funds. Prior to his retirement in January 2006, Mr. Mauriello served in numerous senior management positions including Deputy Chairman and Chief Operating Officer (2004-2005), and Vice Chairman of Financial Services (2002-2004) of KPMG LLP US (professional services, 1965-2005). Mr. Mauriello currently serves as a member of the Board of Directors of XL Group plc. (global insurance and re-insurance, 2006-present) and the Independent Directors Council (IDC) Governing Council (2015-present). Previously, Mr. Mauriello served as a Director of the Hamilton Funds of the Bank of New York (2006-2007) and of Arcadia Resources Inc. (health care services and products, 2007-2012).
Robert W. Selander (1950)
Year of Election or Appointment: 2011
Trustee
Mr. Selander also serves as Trustee of other Fidelity® funds. Mr. Selander serves as a Director of The Western Union Company (global money transfer, 2014-present). Previously, Mr. Selander served as a Member of the Advisory Board of other Fidelity® funds (2011), and Executive Vice Chairman (2010), Chief Executive Officer (2009-2010), and President and Chief Executive Officer (1997-2009) of Mastercard, Inc.
Cornelia M. Small (1944)
Year of Election or Appointment: 2005
Trustee
Ms. Small also serves as Trustee of other Fidelity® funds. Ms. Small is a member of the Board of Directors (2009-present) and Chair of the Investment Committee (2010-present) of the Teagle Foundation. Ms. Small also serves on the Investment Committee of the Berkshire Taconic Community Foundation (2008-present). Previously, Ms. Small served as Chairperson (2002-2008) and a member of the Investment Committee and Chairperson (2008-2012) and a member of the Board of Trustees of Smith College. In addition, Ms. Small served as Chief Investment Officer, Director of Global Equity Investments, and a member of the Board of Directors of Scudder, Stevens & Clark and Scudder Kemper Investments.
William S. Stavropoulos (1939)
Year of Election or Appointment: 2001
Trustee
Vice Chairman of the Independent Trustees
Mr. Stavropoulos also serves as Trustee of other Fidelity® funds. Mr. Stavropoulos serves as President and Founder of the Michigan Baseball Foundation, the Great Lakes Loons (2007-present). Mr. Stavropoulos is Chairman Emeritus of the Board of Directors of The Dow Chemical Company, where he previously served in numerous senior management positions, including President, CEO (1995-2000; 2002-2004), Chairman of the Executive Committee (2000-2006), and as a member of the Board of Directors (1990-2006). Currently, Mr. Stavropoulos is Chairman of the Board of Directors of Univar Inc. (global distributor of commodity and specialty chemicals), a Director of Teradata Corporation (data warehousing and technology solutions), and Maersk Inc. (industrial conglomerate), and a member of the Advisory Board for Metalmark Capital LLC (private equity investment, 2005-present). Mr. Stavropoulos is an operating advisor to Clayton, Dubilier & Rice, LLC (private equity investment). In addition, Mr. Stavropoulos is a member of the University of Notre Dame Advisory Council for the College of Science, a Trustee of the Rollin L. Gerstacker Foundation, and a Director of the Naples Philharmonic Center for the Arts. Previously, Mr. Stavropoulos served as a Director of Chemical Financial Corporation (bank holding company, 1993-2012) and Tyco International, Ltd. (multinational manufacturing and services, 2007-2012).
David M. Thomas (1949)
Year of Election or Appointment: 2008
Trustee
Mr. Thomas also serves as Trustee of other Fidelity® funds. Mr. Thomas serves as Non-Executive Chairman of the Board of Directors of Fortune Brands Home and Security (home and security products, 2011-present), as a member of the Board of Directors (2004-present) and Presiding Director (2013-present) of Interpublic Group of Companies, Inc. (marketing communication), and as a member of the Board of Trustees of the University of Florida (2013-present). Previously, Mr. Thomas served as Executive Chairman (2005-2006) and Chairman and Chief Executive Officer (2000-2005) of IMS Health, Inc. (pharmaceutical and healthcare information solutions), and a Director of Fortune Brands, Inc. (consumer products, 2000-2011).
+ The information includes the Trustee's principal occupation during the last five years and other information relating to the experience, attributes, and skills relevant to the Trustee's qualifications to serve as a Trustee, which led to the conclusion that the Trustee should serve as a Trustee for the fund.
Advisory Board Members and Officers:
Correspondence intended for an officer or Peter S. Lynch may be sent to Fidelity Investments, 245 Summer Street, Boston, Massachusetts 02210. Officers appear below in alphabetical order.
Name, Year of Birth; Principal Occupation
Peter S. Lynch (1944)
Year of Election or Appointment: 2003
Member of the Advisory Board
Mr. Lynch also serves as Member of the Advisory Board of other Fidelity® funds. Mr. Lynch is Vice Chairman and a Director of FMR (investment adviser firm) and FMR Co., Inc. (investment adviser firm). In addition, Mr. Lynch serves as a Trustee of Boston College and as the Chairman of the Inner-City Scholarship Fund. Previously, Mr. Lynch served on the Special Olympics International Board of Directors (1997-2006).
Elizabeth Paige Baumann (1968)
Year of Election or Appointment: 2012
Anti-Money Laundering (AML) Officer
Ms. Baumann also serves as AML Officer of other funds. She is Chief AML Officer of FMR LLC (diversified financial services company, 2012-present) and is an employee of Fidelity Investments. Previously, Ms. Baumann served as Vice President and Deputy Anti-Money Laundering Officer (2007-2012).
Marc R. Bryant (1966)
Year of Election or Appointment: 2015
Secretary and Chief Legal Officer (CLO)
Mr. Bryant also serves as Secretary and CLO of other funds. Mr. Bryant serves as CLO, Secretary, and Senior Vice President of Fidelity Management & Research Company (investment adviser firm, 2015-present) and FMR Co., Inc. (investment adviser firm, 2015-present); Secretary of Fidelity SelectCo, LLC (investment adviser firm, 2015-present) and Fidelity Investments Money Management, Inc. (investment adviser firm, 2015-present); and CLO of Fidelity Management & Research (Hong Kong) Limited (investment adviser firm, 2015-present). He is Senior Vice President and Deputy General Counsel of FMR LLC (diversified financial services company). Previously, Mr. Bryant served as Secretary and Chief Legal Officer of Fidelity Rutland Square Trust II (2010-2014) and Assistant Secretary of Fidelity's Fixed Income and Asset Allocation Funds (2013-2015). Prior to joining Fidelity Investments, Mr. Bryant served as a Senior Vice President and the Head of Global Retail Legal for AllianceBernstein L.P. (2006-2010), and as the General Counsel for ProFund Advisors LLC (2001-2006).
William C. Coffey (1969)
Year of Election or Appointment: 2009
Assistant Secretary
Mr. Coffey also serves as Assistant Secretary of other funds. He is Senior Vice President and Deputy General Counsel of FMR LLC (diversified financial services company, 2010-present), and is an employee of Fidelity Investments. Previously, Mr. Coffey served as Vice President and Associate General Counsel of FMR LLC (2005-2009).
Jonathan Davis (1968)
Year of Election or Appointment: 2010
Assistant Treasurer
Mr. Davis also serves as Assistant Treasurer of other funds, and is an employee of Fidelity Investments. Previously, Mr. Davis served as Vice President and Associate General Counsel of FMR LLC (diversified financial services company, 2003-2010).
Adrien E. Deberghes (1967)
Year of Election or Appointment: 2008
Deputy Treasurer
Mr. Deberghes also serves as an officer of other funds. He is an employee of Fidelity Investments (2008-present). Prior to joining Fidelity Investments, Mr. Deberghes was Senior Vice President of Mutual Fund Administration at State Street Corporation (2007-2008), Senior Director of Mutual Fund Administration at Investors Bank & Trust (2005-2007), and Director of Finance for Dunkin' Brands (2000-2005).
Stephanie J. Dorsey (1969)
Year of Election or Appointment: 2010
Assistant Treasurer
Ms. Dorsey also serves as an officer of other funds. She is an employee of Fidelity Investments (2008-present) and has served in other fund officer roles. Prior to joining Fidelity Investments, Ms. Dorsey served as Treasurer (2004-2008) of the JPMorgan Mutual Funds and Vice President (2004-2008) of JPMorgan Chase Bank.
Howard J. Galligan III (1966)
Year of Election or Appointment: 2014
Chief Financial Officer
Mr. Galligan also serves as Chief Financial Officer of other funds. Mr. Galligan serves as President of Fidelity Pricing and Cash Management Services (FPCMS) (2014-present) and as a Director of Strategic Advisers, Inc. (investment adviser firm, 2008-present). Previously, Mr. Galligan served as Chief Administrative Officer of Asset Management (2011-2014) and Chief Operating Officer and Senior Vice President of Investment Support for Strategic Advisers, Inc. (2003-2011).
Scott C. Goebel (1968)
Year of Election or Appointment: 2015
Vice President
Mr. Goebel serves as Vice President of other funds and is an employee of Fidelity Investments (2001-present). Previously, Mr. Goebel served as Secretary of Fidelity SelectCo, LLC (investment adviser firm, 2013-2015), Fidelity Investments Money Management, Inc. (FIMM) (investment adviser firm, 2010-2015), and Fidelity Research and Analysis Company (FRAC) (investment adviser firm, 2010-2015); General Counsel, Secretary, and Senior Vice President of Fidelity Management & Research Company (investment adviser firm, 2008-2015) and FMR Co., Inc. (investment adviser firm, 2008-2015); Assistant Secretary of Fidelity Management & Research (Japan) Limited (investment adviser firm, 2008-2015) and FMR Investment Management (U.K.) Limited (investment adviser firm, 2008-2015); Chief Legal Officer (CLO) of Fidelity Management & Research (Hong Kong) Limited (investment adviser firm, 2008-2015); Secretary and CLO of certain Fidelity® funds (2008-2015); Assistant Secretary of FIMM (2008-2010), FRAC (2008-2010), and certain funds (2007-2008); and as Vice President and Secretary of Fidelity Distributors Corporation (FDC) (2005-2007).
Thomas C. Hense (1964)
Year of Election or Appointment: 2008, 2010, or 2015
Vice President
Mr. Hense serves as Vice President of Fidelity Advisor® Multi-Asset Income Fund (2015) and other funds (High Income (2008), Small Cap (2008), and Value (2010) funds), and is an employee of Fidelity Investments (1993-present). Previously, Mr. Hense served as a portfolio manager for Fidelity's Institutional Money Management Group (Pyramis) (2003-2008).
Brian B. Hogan (1964)
Year of Election or Appointment: 2009
Vice President
Mr. Hogan also serves as Trustee or Vice President of other funds. Mr. Hogan serves as a Director of Fidelity SelectCo, LLC (investment adviser firm, 2014-present) and President of the Equity Division of FMR (investment adviser firm, 2009-present). Previously, Mr. Hogan served as Senior Vice President, Equity Research of FMR (2006-2009) and as a portfolio manager.
Chris Maher (1972)
Year of Election or Appointment: 2013
Assistant Treasurer
Mr. Maher serves as Assistant Treasurer of other funds. Mr. Maher is Vice President of Valuation Oversight and is an employee of Fidelity Investments. Previously, Mr. Maher served as Vice President of Asset Management Compliance (2013), Vice President of the Program Management Group of FMR (investment adviser firm, 2010-2013), and Vice President of Valuation Oversight (2008-2010).
Kenneth B. Robins (1969)
Year of Election or Appointment: 2008
President and Treasurer
Mr. Robins also serves as an officer of other funds. Mr. Robins serves as Executive Vice President of Fidelity Investments Money Management, Inc. (FIMM) (investment adviser firm, 2013-present) and is an employee of Fidelity Investments (2004-present). Previously, Mr. Robins served in other fund officer roles.
Stacie M. Smith (1974)
Year of Election or Appointment: 2013
Deputy Treasurer
Ms. Smith also serves as an officer of other funds. She is an employee of Fidelity Investments (2009-present) and has served in other fund officer roles. Prior to joining Fidelity Investments, Ms. Smith served as Senior Audit Manager of Ernst & Young LLP (1996-2009).
Renee Stagnone (1975)
Year of Election or Appointment: 2013
Deputy Treasurer
Ms. Stagnone also serves as Deputy Treasurer of other funds. Ms. Stagnone is an employee of Fidelity Investments (1997-present).
Linda J. Wondrack (1964)
Year of Election or Appointment: 2014
Chief Compliance Officer
Ms. Wondrack also serves as Chief Compliance Officer of other funds. Ms. Wondrack is Executive Vice President and head of the Ethics Office and Asset Management Compliance for Fidelity Investments (2012-present). Ms. Wondrack also serves as Chief Compliance Officer of Fidelity SelectCo, LLC (investment adviser firm, 2014-present); Chief Compliance Officer of Impresa Management LLC (2013-present); and Chief Compliance Officer of FMR Co., Inc. (investment adviser firm), Fidelity Investments Money Management, Inc. (investment adviser firm), Fidelity Management & Research (Japan) Limited (investment adviser firm), FMR Investment Management (U.K.) Limited (investment adviser firm), Fidelity Management & Research (Hong Kong) (investment adviser firm), Fidelity Management & Research Company (investment adviser firm), FIAM LLC (investment adviser firm), and Strategic Advisers, Inc. (investment adviser firm), Ballyrock Investment Advisors LLC, and Northern Neck Investors LLC (2012-present). Previously, Ms. Wondrack served as Senior Vice President and Chief Compliance Officer for Columbia Management Investment Advisers, LLC (2005-2012); Chief Compliance Officer for certain funds within the Columbia Family of Funds (2007-2012); and Senior Vice President of Compliance Risk Management at Bank of America (2005-2010).
Joseph F. Zambello (1957)
Year of Election or Appointment: 2011
Deputy Treasurer
Mr. Zambello also serves as Deputy Treasurer of other funds. Mr. Zambello is an employee of Fidelity Investments (1991-present). Previously, Mr. Zambello served as Vice President of the Program Management Group of FMR (investment adviser firm, 2009-2011) and Vice President of the Transfer Agent Oversight Group (2005-2009).
Shareholder Expense Example
As a shareholder of the Fund, you incur two types of costs: (1) transaction costs, including sales charges (loads) on purchase payments or redemption proceeds, and (2) ongoing costs, including management fees, distribution and/or service (12b-1) fees and other Fund expenses. This Example is intended to help you understand your ongoing costs (in dollars) of investing in the Fund and to compare these costs with the ongoing costs of investing in other mutual funds.
The Example is based on an investment of $1,000 invested at the beginning of the period and held for the entire period (May 1, 2015 to October 31, 2015).
Actual Expenses
The first line of the accompanying table for each class of the Fund provides information about actual account values and actual expenses. You may use the information in this line, together with the amount you invested, to estimate the expenses that you paid over the period. Simply divide your account value by $1,000.00 (for example, an $8,600 account value divided by $1,000.00 = 8.6), then multiply the result by the number in the first line for a class of the Fund under the heading entitled "Expenses Paid During Period" to estimate the expenses you paid on your account during this period. In addition, the Fund, as a shareholder in the underlying Fidelity Central Funds, will indirectly bear its pro-rata share of the fees and expenses incurred by the underlying Fidelity Central Funds. These fees and expenses are not included in the Fund's annualized expense ratio used to calculate the expense estimate in the table below.
Hypothetical Example for Comparison Purposes
The second line of the accompanying table for each class of the Fund provides information about hypothetical account values and hypothetical expenses based on a Class' actual expense ratio and an assumed rate of return of 5% per year before expenses, which is not the Class' actual return. The hypothetical account values and expenses may not be used to estimate the actual ending account balance or expenses you paid for the period. You may use this information to compare the ongoing costs of investing in the Fund and other funds. To do so, compare this 5% hypothetical example with the 5% hypothetical examples that appear in the shareholder reports of the other funds. In addition, the Fund, as a shareholder in the underlying Fidelity Central Funds, will indirectly bear its pro-rata share of the fees and expenses incurred by the underlying Fidelity Central Funds. These fees and expenses are not included in the Fund's annualized expense ratio used to calculate the expense estimate in the table below.
Please note that the expenses shown in the table are meant to highlight your ongoing costs only and do not reflect any transaction costs. Therefore, the second line of the table is useful in comparing ongoing costs only, and will not help you determine the relative total costs of owning different funds. In addition, if these transactional costs were included, your costs would have been higher.
| | Annualized Expense Ratio-A | Beginning
Account Value
May 1, 2015 | Ending
Account Value
October 31, 2015 | Expenses Paid
During Period-B
May 1, 2015
to October 31, 2015 |
| Class A | 1.25% | | | |
| Actual | | $1,000.00 | $972.60 | $6.22 |
| Hypothetical-C | | $1,000.00 | $1,018.90 | $6.36 |
| Class T | 1.50% | | | |
| Actual | | $1,000.00 | $971.40 | $7.45 |
| Hypothetical-C | | $1,000.00 | $1,017.64 | $7.63 |
| Class B | 2.00% | | | |
| Actual | | $1,000.00 | $969.20 | $9.93 |
| Hypothetical-C | | $1,000.00 | $1,015.12 | $10.16 |
| Class C | 2.00% | | | |
| Actual | | $1,000.00 | $969.50 | $9.93 |
| Hypothetical-C | | $1,000.00 | $1,015.12 | $10.16 |
| Class I | 1.00% | | | |
| Actual | | $1,000.00 | $974.00 | $4.98 |
| Hypothetical-C | | $1,000.00 | $1,020.16 | $5.09 |
A Annualized expense ratio reflects expenses net of applicable fee waivers.
B Expenses are equal to each Class' annualized expense ratio, multiplied by the average account value over the period, multiplied by 184/365 (to reflect the one-half year period).
C 5% return per year before expenses
Distributions (Unaudited)
The Board of Trustees of Fidelity Advisor Value Leaders Fund voted to pay to shareholders of record at the opening of business on record date, the following distributions per share derived from capital gains realized from sales of portfolio securities, and dividends derived from net investment income:
| | Pay Date | Record Date | Dividends | Capital Gains |
| Class A | 12/07/15 | 12/04/15 | $0.265 | $0.017 |
| Class T | 12/07/15 | 12/04/15 | $0.195 | $0.017 |
| Class B | 12/07/15 | 12/04/15 | $0.023 | $0.017 |
| Class C | 12/07/15 | 12/04/15 | $0.147 | $0.017 |
Class A, Class T, Class B and Class C designate 100% of the dividends distributed during the fiscal year as qualifying for the dividends-received deduction for corporate shareholders.
Class A, Class T, Class B and Class C designate 100% of the dividends distributed during the fiscal year as amounts which may be taken into account as a dividend for purposes of the maximum rate under section 1(h)(11) of the Internal Revenue Code.
The fund will notify shareholders in January 2016 of amounts for use in preparing 2015 income tax returns.
Board Approval of Investment Advisory Contracts and Management Fees
Fidelity Advisor Value Leaders Fund
Each year, the Board of Trustees, including the Independent Trustees (together, the Board), votes on the renewal of the management contract with Fidelity Management & Research Company (FMR) and the sub-advisory agreements (together, the Advisory Contracts) for the fund. The Board, assisted by the advice of fund counsel and Independent Trustees' counsel, requests and considers a broad range of information relevant to the renewal of the Advisory Contracts throughout the year.
The Board meets regularly and, at each of its meetings, covers an extensive agenda of topics and materials and considers factors that are relevant to its annual consideration of the renewal of the fund's Advisory Contracts, including the services and support provided to the fund and its shareholders. The Board has established various standing committees (Committees), each composed of and chaired by Independent Trustees with varying backgrounds, to which the Board has assigned specific subject matter responsibilities in order to enhance effective decision-making by the Board. The Board, acting directly and through its Committees, requests and receives information concerning the annual consideration of the renewal of the fund's Advisory Contracts. The Board also meets as needed to consider matters specifically related to the Board's annual consideration of the renewal of the Advisory Contracts. Members of the Board may also meet with trustees of other Fidelity funds through ad hoc joint committees to discuss certain matters relevant to all of the Fidelity funds.
At its July 2015 meeting, the Board unanimously determined to renew the fund's Advisory Contracts. In reaching its determination, the Board considered all factors it believed relevant, including (i) the nature, extent, and quality of the services to be provided to the fund and its shareholders (including the investment performance of the fund); (ii) the competitiveness of the fund's management fee and total expense ratio relative to peer funds; (iii) the total costs of the services to be provided by and the profits to be realized by Fidelity from its relationship with the fund; and (iv) the extent to which (if any) economies of scale exist and would be realized as the fund grows, and whether any economies of scale are appropriately shared with fund shareholders.
In considering whether to renew the Advisory Contracts for the fund, the Board reached a determination, with the assistance of fund counsel and Independent Trustees' counsel and through the exercise of its business judgment, that the renewal of the Advisory Contracts was in the best interests of the fund and its shareholders and that the compensation payable under the Advisory Contracts was fair and reasonable. The Board's decision to renew the Advisory Contracts was not based on any single factor, but rather was based on a comprehensive consideration of all the information provided to the Board at its meetings throughout the year. The Board, in reaching its determination to renew the Advisory Contracts, was aware that shareholders of the fund have a broad range of investment choices available to them, including a wide choice among funds offered by Fidelity's competitors, and that the fund's shareholders, who have the opportunity to review and weigh the disclosure provided by the fund in its prospectus and other public disclosures, have chosen to invest in this fund, which is part of the Fidelity family of funds.
Nature, Extent, and Quality of Services Provided. The Board considered Fidelity's staffing as it relates to the fund, including the backgrounds of investment personnel of Fidelity, and also considered the fund's investment objective, strategies, and related investment philosophy. The Independent Trustees also had discussions with senior management of Fidelity's investment operations and investment groups. The Board considered the structure of the portfolio manager compensation program and whether this structure provides appropriate incentives to act in the best interests of the fund. Additionally, the Board considered the portfolio managers' investments, if any, in the funds that they manage.
Resources Dedicated to Investment Management and Support Services. The Board and the Fund Oversight and Research Committees reviewed the general qualifications and capabilities of Fidelity's investment staff, including its size, education, experience, and resources, as well as Fidelity's approach to recruiting, training, managing, and compensating investment personnel. The Board noted that Fidelity has continued to increase the resources devoted to non-U.S. offices, including expansion of Fidelity's global investment organization. The Board also noted that Fidelity's analysts have extensive resources, tools and capabilities that allow them to conduct sophisticated quantitative and fundamental analysis, as well as credit analysis of issuers, counterparties and guarantors. Further, the Board considered that Fidelity's investment professionals have sufficient access to global information and data so as to provide competitive investment results over time, and that those professionals also have access to sophisticated tools that permit them to assess portfolio construction and risk and performance attribution characteristics continuously, as well as to transmit new information and research conclusions rapidly around the world. Additionally, in its deliberations, the Board considered Fidelity's trading, risk management, and compliance capabilities and resources, which are integral parts of the investment management process.
Shareholder and Administrative Services. The Board considered (i) the nature, extent, quality, and cost of advisory, administrative, and shareholder services performed by FMR, the sub-advisers (together with FMR, the Investment Advisers), and their affiliates under the Advisory Contracts and under separate agreements covering transfer agency, pricing and bookkeeping, and securities lending services for the fund; (ii) the nature and extent of the supervision of third party service providers, principally custodians and subcustodians; and (iii) the resources devoted to, and the record of compliance with, the fund's compliance policies and procedures. The Board also reviewed the allocation of fund brokerage, including allocations to brokers affiliated with the Investment Advisers, the use of brokerage commissions to pay fund expenses, and the use of "soft" commission dollars to pay for research services.
The Board noted that the growth of fund assets over time across the complex allows Fidelity to reinvest in the development of services designed to enhance the value or convenience of the Fidelity funds as investment vehicles. These services include 24-hour access to account information and market information through telephone representatives and over the Internet, investor education materials and asset allocation tools, and the expanded availability of Fidelity Investor Centers.
In 2014, the Board formed an ad hoc Committee on Transfer Agency Fees to review the variety of transfer agency fee structures throughout the industry and Fidelity's competitive positioning with respect to industry participants.
Investment in a Large Fund Family. The Board considered the benefits to shareholders of investing in a Fidelity fund, including the benefits of investing in a fund that is part of a large family of funds offering a variety of investment disciplines and providing a large variety of mutual fund investor services. The Board noted that Fidelity had taken, or had made recommendations that resulted in the Fidelity funds taking, a number of actions over the previous year that benefited particular funds, including (i) continuing to dedicate additional resources to investment research and to the support of the senior management team that oversees asset management; (ii) continuing efforts to enhance Fidelity's global research capabilities; (iii) launching new funds and making other enhancements to meet client needs; (iv) reducing management fees and total expenses for certain index funds and diversified international funds; (v) continuing to launch dedicated lower cost underlying funds to meet portfolio construction needs related to expanding underlying fund options for Fidelity funds of funds, specifically for the Freedom Fund product lines; (vi) rationalizing product lines and gaining increased efficiencies through fund mergers; (vii) launching active fixed-income exchange-traded funds; (viii) continuing to develop, acquire and implement systems and technology to improve services to the funds and information security and to increase efficiency; (ix) implementing investment enhancements to further strengthen Fidelity's target date product line to increase investors' probability of success in achieving their goals; (x) modifying the eligibility criteria for certain share classes to accommodate roll-over assets from employer-sponsored retirement plans; (xi) launching a new Class W of the Freedom Index Funds to attract and retain Fidelity record-kept retirement plan assets; and (xii) implementing changes to Fidelity's money market product line in response to recent money market regulatory reforms.
Investment Performance. The Board considered whether the fund has operated in accordance with its investment objective, as well as its record of compliance with its investment restrictions and its performance history. The Board noted that there was a portfolio management change for the fund in September 2014.
The Board took into account discussions with representatives of the Investment Advisers about fund investment performance that occur at Board meetings throughout the year. In this regard the Board noted that as part of regularly scheduled fund reviews and other reports to the Board on fund performance, the Board considers annualized return information for the fund, for different time periods, measured against a securities market index ("benchmark index") and a peer group of funds with similar objectives ("peer group"), if any. In its evaluation of fund investment performance, the Board gave particular attention to information indicating changes in performance of certain Fidelity funds for specific time periods and discussed with the Investment Advisers the reasons for any overperformance or underperformance.
In addition to reviewing absolute and relative fund performance, the Independent Trustees periodically consider the appropriateness of fund performance metrics in evaluating the results achieved. In general, the Independent Trustees believe that fund performance should be evaluated based on net performance (after fees and expenses) of both the highest performing and lowest performing fund share classes, where applicable, compared to appropriate benchmark indices, over appropriate time periods that may include full market cycles, and compared to peer groups, as applicable, over the same periods, taking into account relevant factors including the following: general market conditions; issuer-specific information; and fund cash flows and other factors.
The Independent Trustees recognize that shareholders evaluate performance on a net basis over their own holding periods, for which one-, three-, and five-year periods are often used as a proxy. For this reason, the performance information reviewed by the Board also included net cumulative calendar year total return information for the fund and an appropriate benchmark index and peer group for the most recent one-, three-, and five-year periods, as shown below. Returns are shown compared to the 25th percentile (top of box, 75% beaten) and 75th percentile (bottom of box, 25% beaten) of the peer universe.
Fidelity Advisor Value Leaders Fund
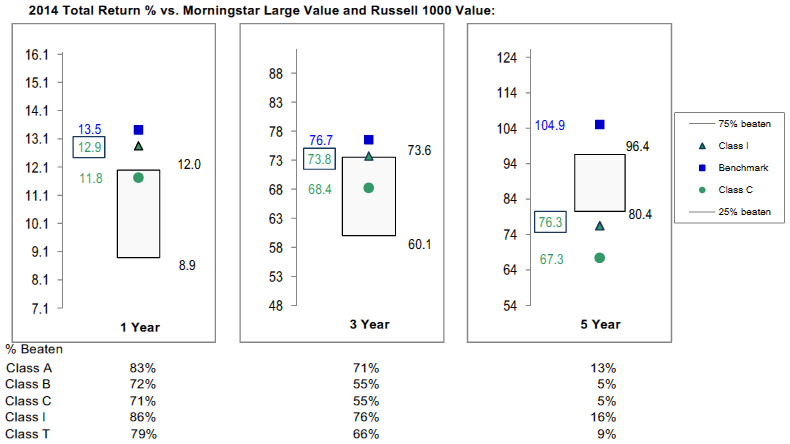
The Board also considered that the fund's management fee is subject to upward or downward adjustment depending upon whether, and to what extent, the fund's investment performance for the performance period exceeds, or is exceeded by, a securities index, thus leading to a performance adjustment for the same period. The Board noted that the performance adjustment provides FMR with a strong economic incentive to seek to achieve superior performance for the fund's shareholders and helps to more closely align the interests of FMR and the shareholders of the fund.
Based on its review, the Board concluded that the nature, extent, and quality of services provided to the fund under the Advisory Contracts should benefit the shareholders of the fund.
Competitiveness of Management Fee and Total Expense Ratio. The Board considered the fund's management fee and total expense ratio compared to "mapped groups" of competitive funds and classes created for the purpose of facilitating the Trustees' competitive analysis of management fees and total expenses. Fidelity creates "mapped groups" by combining similar Lipper investment objective categories that have comparable investment mandates. Combining Lipper investment objective categories aids the Board's management fee and total expense ratio comparisons by broadening the competitive group used for comparison.
Management Fee. The Board considered two proprietary management fee comparisons for the 12-month periods shown in basis points (BP) in the chart below. The group of Lipper funds used by the Board for management fee comparisons is referred to below as the "Total Mapped Group." The Total Mapped Group comparison focuses on a fund's standing in terms of gross management fees before expense reimbursements or caps, and without giving effect to the fund's performance adjustment, relative to the total universe of funds with comparable investment mandates, regardless of whether their management fee structures also are comparable. Funds with comparable investment mandates offer exposure to similar types of securities. Funds with comparable management fee structures have similar management fee contractual arrangements (
e.g., flat rate charged for advisory services, all-inclusive fee rate,
etc.). "TMG %" represents the percentage of funds in the Total Mapped Group that had management fees that were lower than the fund's. For example, a hypothetical TMG % of 20% would mean that 80% of the funds in the Total Mapped Group had higher, and 20% had lower, management fees than the fund. The fund's actual TMG %s and the number of funds in the Total Mapped Group are in the chart below. The "Asset-Size Peer Group" (ASPG) comparison focuses on a fund's standing relative to a subset of non-Fidelity funds within the Total Mapped Group that are similar in size and management fee structure without taking into account performance adjustments, if any. For example, if a fund is in the first quartile of the ASPG, the fund's management fee ranks in the least expensive or lowest 25% of funds in the ASPG. The ASPG represents at least 15% of the funds in the Total Mapped Group with comparable asset size and management fee structures, subject to a minimum of 50 funds (or all funds in the Total Mapped Group if fewer than 50). Additional information, such as the ASPG quartile in which the fund's management fee rate ranked and the impact of the fund's performance adjustment, is also included in the chart and considered by the Board.
Fidelity Advisor Value Leaders Fund
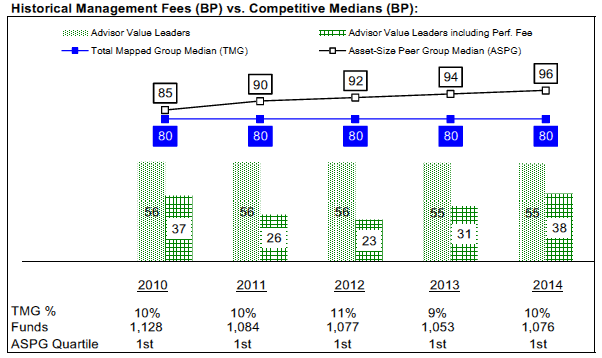
The Board noted that the fund's management fee rate ranked below the median of its Total Mapped Group and below the median of its ASPG for 2014. The Board also noted the effect of the fund's performance adjustment, if any, on the fund's management fee ranking.
The Board noted that, in 2014, the ad hoc Committee on Group Fee was formed by it and other Fidelity fund boards to conduct an in-depth review of the "group fee" component of the management fee of funds with such management fee structures. Committee focus included the mechanics of the group fee, the competitive landscape of group fee structures, Fidelity funds with no group fee component and investment products not included in group fee assets. The Board also considered that, for funds subject to the group fee, FMR agreed to voluntarily waive fees over a specified period of time in amounts designed to account for assets converted from certain funds to certain collective investment trusts.
The Board also noted that, in 2013, the ad hoc Committee on Management Fees was formed to conduct an in-depth review of the management fee rates of Fidelity's active equity mutual funds. The Committee focused on the following areas: (i) standard fee structures; (ii) research consumption and trading evolution; (iii) management fee competitiveness/profitability by category; and (iv) factors that drive institutional pricing.
Based on its review, the Board concluded that the fund's management fee is fair and reasonable in light of the services that the fund receives and the other factors considered.
Total Expense Ratio. In its review of each class's total expense ratio, the Board considered the fund's management fee as well as other fund or class expenses, as applicable, such as transfer agent fees, pricing and bookkeeping fees, fund-paid 12b-1 fees, and custodial, legal, and audit fees. The Board noted the impact of the fund's performance adjustment. The Board also noted that Fidelity may agree to waive fees and expenses from time to time, and the extent to which, if any, it has done so for the fund. As part of its review, the Board also considered the current and historical total expense ratios of each class of the fund compared to competitive fund median expenses. Each class of the fund is compared to those funds and classes in the Total Mapped Group (used by the Board for management fee comparisons) that have a similar sales load structure.
The Board noted that the total expense ratio of each class ranked above its competitive median for 2014. The Board considered that, in general, various factors can affect total expense ratios. The Board noted that the total expense ratio of Class T was above the competitive median primarily because of higher 12b-1 fees on Class T as compared to most competitor funds. Class T has a higher 12b-1 fee, but a lower front-end sales charge, than traditionally priced front-end sales charge classes. The Board considered that Class T is primarily sold load-waived in the retirement plan market where its 0.50% 12bfee is comparable to competing no-load, higher 12b1 fee classes designed specifically for retirement plans. The Board noted that the fund offers multiple classes, each of which has a different sales load and 12b-1 fee structure, and that the multiple structures are intended to offer a range of pricing options for the intermediary market. The Board also noted that the total expense ratios of the classes vary primarily by the level of their 12b-1 fees, although differences in transfer agent fees may also cause expenses to vary from class to class.
Fees Charged to Other Fidelity Clients. The Board also considered Fidelity fee structures and other information with respect to clients of Fidelity, such as other funds advised or subadvised by Fidelity, pension plan clients, and other institutional clients with similar mandates. The Board noted the findings of the 2013 ad hoc joint committee (created with the board of other Fidelity funds), which reviewed and compared Fidelity's institutional investment advisory business with its business of providing services to the Fidelity funds, including the differences in services provided, fees charged, and costs incurred, as well as competition in their respective marketplaces.
Based on its review of total expense ratios and fees charged to other Fidelity clients, the Board concluded that, although in all cases above the median of the universe presented for comparison, the total expense ratio of each class of the fund was reasonable in light of the services that the fund and its shareholders receive and the other factors considered.
Costs of the Services and Profitability. The Board considered the revenues earned and the expenses incurred by Fidelity in conducting the business of developing, marketing, distributing, managing, administering and servicing the fund and servicing the fund's shareholders. The Board also considered the level of Fidelity's profits in respect of all the Fidelity funds.
On an annual basis, Fidelity presents to the Board information about the profitability of its relationship with the fund. Fidelity calculates profitability information for each fund, as well as aggregate profitability information for groups of Fidelity funds and all Fidelity funds, using a series of detailed revenue and cost allocation methodologies which originate with the books and records of Fidelity on which Fidelity's audited financial statements are based. The Audit Committee of the Board reviews any significant changes from the prior year's methodologies.
PricewaterhouseCoopers LLP (PwC), independent registered public accounting firm and auditor to Fidelity and certain Fidelity funds, has been engaged annually by the Board as part of the Board's assessment of Fidelity's profitability analysis. PwC's engagement includes the review and assessment of the methodologies used by Fidelity in determining the revenues and expenses attributable to Fidelity's mutual fund business, and completion of agreed-upon procedures in respect of the mathematical accuracy of fund profitability and its conformity to established allocation methodologies. After considering PwC's reports issued under the engagement and information provided by Fidelity, the Board concluded that while other allocation methods may also be reasonable, Fidelity's profitability methodologies are reasonable in all material respects.
The Board also reviewed Fidelity's non-fund businesses and fall-out benefits related to the mutual fund business as well as cases where Fidelity's affiliates may benefit from or be related to the fund's business.
The Board considered the costs of the services provided by and the profits realized by Fidelity in connection with the operation of the fund and was satisfied that the profitability was not excessive.
Economies of Scale. The Board considered whether there have been economies of scale in respect of the management of the Fidelity funds, whether the Fidelity funds (including the fund) have appropriately benefited from any such economies of scale, and whether there is potential for realization of any further economies of scale. The Board considered the extent to which the fund will benefit from economies of scale as assets grow through increased services to the fund, through waivers or reimbursements, or through fee or expense ratio reductions. The Board also noted that in 2013, it and the boards of other Fidelity funds created an ad hoc committee (the Economies of Scale Committee) to analyze whether Fidelity attains economies of scale in respect of the management and servicing of the Fidelity funds, whether the Fidelity funds have appropriately benefited from such economies of scale, and whether there is potential for realization of any further economies of scale.
The Board recognized that the fund's management contract incorporates a "group fee" structure, which provides for lower group fee rates as total group assets increase, and for higher group fee rates as total group assets decrease (with "group assets" defined to include fund assets under FMR's management plus sector fund assets previously under FMR's management and currently managed by Fidelity SelectCo, LLC). FMR calculates the group fee rates based on a tiered asset "breakpoint" schedule that varies based on asset class. The Board considered that the group fee is designed to deliver the benefits of economies of scale to fund shareholders when total Fidelity fund assets increase, even if assets of any particular fund are unchanged or have declined, because some portion of Fidelity's costs are attributable to services provided to all Fidelity funds, and all funds benefit if those costs can be allocated among more assets. The Board concluded that, given the group fee structure, fund shareholders will benefit from lower management fees as group assets increase at the fund complex level, regardless of whether Fidelity achieves any such economies of scale.
The Board concluded, taking into account the analysis of the Economies of Scale Committee, that economies of scale, if any, are being appropriately shared between fund shareholders and Fidelity.
Additional Information Requested by the Board. In order to develop fully the factual basis for consideration of the Fidelity funds' Advisory Contracts, the Board requested and received additional information on certain topics, including: (i) fund performance trends and Fidelity's long-term strategies for certain funds; (ii) the various share classes employed by Fidelity and the attributes of each class, together with similar information on the distribution and servicing payments made by Fidelity or the funds to third-party participants in the distribution channels; (iii) fund profitability, and fund performance in relation to fund profitability; (iv) the methodology with respect to evaluating competitive fund data and peer group classifications and fee comparisons; (v) annual fund profitability margins, with particular focus on certain funds with negative margins; (vi) the realization of fall-out benefits in certain Fidelity business units;
(vii) economies of scale and the way in which they are shared with fund shareholders;(viii) Fidelity's group fee structures, including the group fee schedule of breakpoints;(ix) the impact of cost containment measures on the funds; and (x) the transfer agent fee structure.
Based on its evaluation of all of the conclusions noted above, and after considering all factors it believed relevant, the Board concluded that the advisory fee structures are fair and reasonable, and that the fund's Advisory Contracts should be renewed.
AVLF-ANN-1215
1.793577.112
Fidelity Advisor® Value Leaders Fund Class I (formerly Institutional Class)
Annual Report October 31, 2015 |
|
Contents
To view a fund's proxy voting guidelines and proxy voting record for the 12-month period ended June 30, visit http://www.fidelity.com/proxyvotingresults or visit the Securities and Exchange Commission's (SEC) web site at http://www.sec.gov.
You may also call 1-877-208-0098 to request a free copy of the proxy voting guidelines.
Standard & Poor's, S&P and S&P 500 are registered service marks of The McGraw-Hill Companies, Inc. and have been licensed for use by Fidelity Distributors Corporation.
Other third-party marks appearing herein are the property of their respective owners.
All other marks appearing herein are registered or unregistered trademarks or service marks of FMR LLC or an affiliated company. © 2015 FMR LLC. All rights reserved.
This report and the financial statements contained herein are submitted for the general information of the shareholders of the Fund. This report is not authorized for distribution to prospective investors in the Fund unless preceded or accompanied by an effective prospectus.
A fund files its complete schedule of portfolio holdings with the SEC for the first and third quarters of each fiscal year on Form N-Q. Forms N-Q are available on the SEC’s web site at http://www.sec.gov. A fund's Forms N-Q may be reviewed and copied at the SEC’s Public Reference Room in Washington, DC. Information regarding the operation of the SEC's Public Reference Room may be obtained by calling 1-800-SEC-0330.
For a complete list of a fund's portfolio holdings, view the most recent holdings listing, semiannual report, or annual report on Fidelity's web site at http://www.fidelity.com, http://www.advisor.fidelity.com, or http://www.401k.com, as applicable.
NOT FDIC INSURED •MAY LOSE VALUE •NO BANK GUARANTEE
Neither the Fund nor Fidelity Distributors Corporation is a bank.
Performance: The Bottom Line
Average annual total return reflects the change in the value of an investment, assuming reinvestment of distributions from dividend income and capital gains (the profits earned upon the sale of securities that have grown in value, if any) and assuming a constant rate of performance each year.
The hypothetical investment and the average annual total returns do not reflect the deduction of taxes that a shareholder would pay on fund distributions or the redemption of fund shares.
During periods of reimbursement by Fidelity, a fund’s total return will be greater than it would be had the reimbursement not occurred.
How a fund did yesterday is no guarantee of how it will do tomorrow.
Average Annual Total Returns
| For the periods ended October 31, 2015 | Past 1 year | Past 5 years | Past 10 years |
| Class I | 4.58% | 11.50% | 4.67% |
$10,000 Over 10 Years
Let's say hypothetically that $10,000 was invested in Fidelity Advisor® Value Leaders Fund - Class I on October 31, 2005.
The chart shows how the value of your investment would have changed, and also shows how the Russell 1000® Value Index performed over the same period.
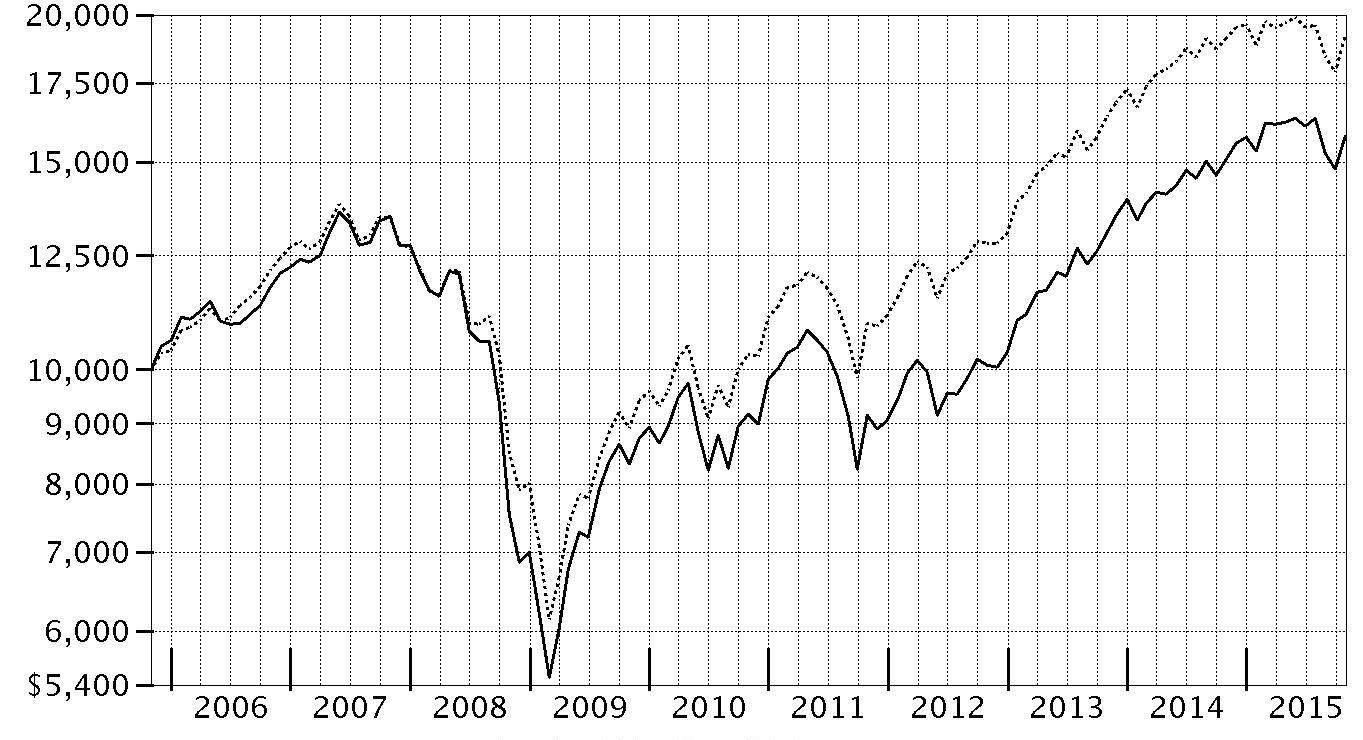
| Period Ending Values |
| $15,786 | Fidelity Advisor® Value Leaders Fund - Class I |
| $19,225 | Russell 1000® Value Index |
Management's Discussion of Fund Performance
Market Recap: U.S. stocks gained moderately for the 12 months ending October 31, 2015, helped by a strong October that largely erased a steep decline in August and September on concern about slowing global economic growth emanating from China. Stocks benefited late in the period amid waning expectations for a near-term interest-rate hike by the U.S. Federal Reserve, additional economic stimulus in Europe and an interest-rate cut in China. The large-cap S&P 500
® index advanced 5.20% for the period, with growth stocks in the index significantly outpacing value stocks, as investors continued to seek growth in a subpar economic environment. The growth-oriented Nasdaq Composite Index
® also benefited, gaining 10.39%, while the small-cap Russell 2000
® Index lost its edge, returning only 0.34%, as risk appetites waned. Among sectors in the widely followed S&P 500
®, consumer discretionary (+21%) led the way, benefiting from a combination of rising personal income and still-benign inflation. Technology (+11%) and consumer staples (+9%) also outpaced the index. Conversely, energy (-19%) performed worst, in an environment of depressed commodity prices that also hit materials (-4%). At period end, investors remained focused on the potential global implications of a relatively stronger U.S. dollar and how China’s transition toward a consumption-led economy may affect corporate earnings.
Comments from Portfolio Manager Sean Gavin: For the year, the fund’s share classes (excluding sales charges, if applicable) produced moderate gains, significantly outpacing the 0.53% advance of the benchmark Russell 1000
® Value Index. Versus the benchmark, the fund benefited most from strong security selection in the health care, information technology and, to a lesser extent, materials groups. In contrast, the fund was hurt by weak stock picking in financials and consumer discretionary, although an overweighting in the latter category offset some of the negative impact. The fund’s top relative contributor was auto parts retailer Autozone, which issued good financial data this period. I sold the fund’s stake close to period end, after the stock exceeded my target price. Another big contributor was Google, the Internet search provider that recently changed its name to Alphabet. A position in health insurance provider Cigna also added value, as the company agreed to be acquired for a substantial premium. In contrast, various energy holdings struggled, especially BW Offshore, a supplier of equipment to offshore oil drillers, and Suncor, a Canadian oil sands company, both of which experienced substantial share-price declines. Another meaningful detractor was media company Viacom, which faced a number of business challenges. The fund’s foreign exposure helped performance despite the headwind of a stronger U.S. dollar. Of all the stocks I’ve mentioned, only Cigna was in our benchmark.
The views expressed above reflect those of the portfolio manager(s) only through the end of the period as stated on the cover of this report and do not necessarily represent the views of Fidelity or any other person in the Fidelity organization. Any such views are subject to change at any time based upon market or other conditions and Fidelity disclaims any responsibility to update such views. These views may not be relied on as investment advice and, because investment decisions for a Fidelity fund are based on numerous factors, may not be relied on as an indication of trading intent on behalf of any Fidelity fund.
Investment Summary (Unaudited)
Top Ten Stocks as of October 31, 2015
| | % of fund's net assets | % of fund's net assets 6 months ago |
| Teva Pharmaceutical Industries Ltd. sponsored ADR | 4.3 | 3.6 |
| JPMorgan Chase & Co. | 3.7 | 3.5 |
| Johnson & Johnson | 3.6 | 2.4 |
| Oracle Corp. | 3.4 | 3.5 |
| Wells Fargo & Co. | 3.4 | 3.5 |
| Berkshire Hathaway, Inc. Class B | 3.2 | 3.3 |
| Alphabet, Inc. Class A | 3.2 | 3.0 |
| Viacom, Inc. Class B (non-vtg.) | 3.1 | 2.6 |
| Samsung Electronics Co. Ltd. | 3.0 | 3.3 |
| EMC Corp. | 2.8 | 2.9 |
| | 33.7 | |
Top Five Market Sectors as of October 31, 2015
| | % of fund's net assets | % of fund's net assets 6 months ago |
| Financials | 27.8 | 27.5 |
| Information Technology | 20.6 | 20.2 |
| Health Care | 17.0 | 18.2 |
| Consumer Discretionary | 10.4 | 12.3 |
| Energy | 8.6 | 7.0 |
Asset Allocation (% of fund's net assets)
| As of October 31, 2015* |
| | Stocks | 98.7% |
| | Short-Term Investments and Net Other Assets (Liabilities) | 1.3% |

* Foreign investments - 19.9%
| As of April 30, 2015* |
| | Stocks | 94.9% |
| | Short-Term Investments and Net Other Assets (Liabilities) | 5.1% |

* Foreign investments - 22.6%
Investments October 31, 2015
Showing Percentage of Net Assets
| Common Stocks - 98.7% | | | |
| | | Shares | Value |
| CONSUMER DISCRETIONARY - 10.4% | | | |
| Automobiles - 0.7% | | | |
| Harley-Davidson, Inc. | | 4,800 | $237,360 |
| Media - 8.0% | | | |
| CBS Corp. Class B | | 13,500 | 628,020 |
| Starz Series A (a) | | 12,100 | 405,471 |
| Twenty-First Century Fox, Inc. Class A | | 22,900 | 702,801 |
| Viacom, Inc. Class B (non-vtg.) | | 21,700 | 1,070,027 |
| | | | 2,806,319 |
| Specialty Retail - 1.7% | | | |
| Bed Bath & Beyond, Inc. (a) | | 3,900 | 232,557 |
| GNC Holdings, Inc. | | 11,700 | 348,075 |
| | | | 580,632 |
|
| TOTAL CONSUMER DISCRETIONARY | | | 3,624,311 |
|
| CONSUMER STAPLES - 4.1% | | | |
| Beverages - 1.9% | | | |
| C&C Group PLC | | 164,726 | 657,542 |
| Food & Staples Retailing - 2.2% | | | |
| Safeway, Inc.: | | | |
| rights | | 4,300 | 0 |
| rights | | 4,300 | 774 |
| Tesco PLC | | 69,500 | 196,011 |
| Wal-Mart Stores, Inc. | | 10,200 | 583,848 |
| | | | 780,633 |
|
| TOTAL CONSUMER STAPLES | | | 1,438,175 |
|
| ENERGY - 8.6% | | | |
| Energy Equipment & Services - 0.7% | | | |
| BW Offshore Ltd. | | 546,700 | 227,772 |
| Oil, Gas & Consumable Fuels - 7.9% | | | |
| Chevron Corp. | | 10,125 | 920,160 |
| Exxon Mobil Corp. | | 4,300 | 355,782 |
| Marathon Petroleum Corp. | | 16,200 | 839,160 |
| Suncor Energy, Inc. | | 21,900 | 651,674 |
| | | | 2,766,776 |
|
| TOTAL ENERGY | | | 2,994,548 |
|
| FINANCIALS - 27.8% | | | |
| Banks - 9.0% | | | |
| JPMorgan Chase & Co. | | 20,025 | 1,286,606 |
| U.S. Bancorp | | 16,171 | 682,093 |
| Wells Fargo & Co. | | 21,626 | 1,170,832 |
| | | | 3,139,531 |
| Capital Markets - 1.5% | | | |
| Fortress Investment Group LLC | | 42,400 | 237,864 |
| The Blackstone Group LP | | 8,800 | 290,928 |
| | | | 528,792 |
| Consumer Finance - 3.2% | | | |
| Capital One Financial Corp. | | 7,400 | 583,860 |
| Discover Financial Services | | 9,500 | 534,090 |
| | | | 1,117,950 |
| Diversified Financial Services - 3.2% | | | |
| Berkshire Hathaway, Inc. Class B (a) | | 8,200 | 1,115,364 |
| Insurance - 7.7% | | | |
| ACE Ltd. | | 5,400 | 613,116 |
| Allstate Corp. | | 8,740 | 540,831 |
| Prudential PLC | | 33,200 | 775,436 |
| The Travelers Companies, Inc. | | 6,500 | 733,785 |
| | | | 2,663,168 |
| Real Estate Investment Trusts - 3.2% | | | |
| American Capital Agency Corp. | | 23,100 | 411,873 |
| Annaly Capital Management, Inc. | | 70,800 | 704,460 |
| | | | 1,116,333 |
|
| TOTAL FINANCIALS | | | 9,681,138 |
|
| HEALTH CARE - 17.0% | | | |
| Biotechnology - 2.3% | | | |
| Amgen, Inc. | | 5,100 | 806,718 |
| Health Care Providers & Services - 4.8% | | | |
| Cigna Corp. | | 4,100 | 549,564 |
| Express Scripts Holding Co. (a) | | 6,300 | 544,194 |
| Laboratory Corp. of America Holdings (a) | | 4,800 | 589,152 |
| | | | 1,682,910 |
| Pharmaceuticals - 9.9% | | | |
| Johnson & Johnson | | 12,400 | 1,252,772 |
| Sanofi SA sponsored ADR | | 14,100 | 709,794 |
| Teva Pharmaceutical Industries Ltd. sponsored ADR | | 25,000 | 1,479,750 |
| | | | 3,442,316 |
|
| TOTAL HEALTH CARE | | | 5,931,944 |
|
| INDUSTRIALS - 4.7% | | | |
| Aerospace & Defense - 1.2% | | | |
| United Technologies Corp. | | 4,100 | 403,481 |
| Machinery - 2.2% | | | |
| Deere & Co. (b) | | 9,800 | 764,400 |
| Professional Services - 1.3% | | | |
| Dun & Bradstreet Corp. | | 4,100 | 466,867 |
|
| TOTAL INDUSTRIALS | | | 1,634,748 |
|
| INFORMATION TECHNOLOGY - 20.6% | | | |
| Communications Equipment - 3.9% | | | |
| Cisco Systems, Inc. | | 25,964 | 749,061 |
| Harris Corp. | | 7,900 | 625,127 |
| | | | 1,374,188 |
| Internet Software & Services - 3.2% | | | |
| Alphabet, Inc. Class A (a) | | 1,500 | 1,106,085 |
| IT Services - 2.8% | | | |
| IBM Corp. | | 2,500 | 350,200 |
| The Western Union Co. | | 31,900 | 614,075 |
| | | | 964,275 |
| Software - 3.4% | | | |
| Oracle Corp. | | 31,000 | 1,204,040 |
| Technology Hardware, Storage & Peripherals - 7.3% | | | |
| Apple, Inc. | | 4,400 | 525,800 |
| EMC Corp. | | 36,800 | 964,896 |
| Samsung Electronics Co. Ltd. | | 876 | 1,052,639 |
| | | | 2,543,335 |
|
| TOTAL INFORMATION TECHNOLOGY | | | 7,191,923 |
|
| MATERIALS - 3.5% | | | |
| Chemicals - 3.5% | | | |
| CF Industries Holdings, Inc. | | 12,700 | 644,779 |
| LyondellBasell Industries NV Class A | | 6,000 | 557,460 |
| | | | 1,202,239 |
| UTILITIES - 2.0% | | | |
| Electric Utilities - 2.0% | | | |
| Exelon Corp. | | 25,500 | 711,960 |
| TOTAL COMMON STOCKS | | | |
| (Cost $34,241,783) | | | 34,410,986 |
|
| Money Market Funds - 2.9% | | | |
| Fidelity Cash Central Fund, 0.18% (c) | | 229,248 | 229,248 |
| Fidelity Securities Lending Cash Central Fund, 0.19% (c)(d) | | 776,000 | 776,000 |
| TOTAL MONEY MARKET FUNDS | | | |
| (Cost $1,005,248) | | | 1,005,248 |
| TOTAL INVESTMENT PORTFOLIO - 101.6% | | | |
| (Cost $35,247,031) | | | 35,416,234 |
| NET OTHER ASSETS (LIABILITIES) - (1.6)% | | | (545,018) |
| NET ASSETS - 100% | | | $34,871,216 |
Legend
(a) Non-income producing
(b) Security or a portion of the security is on loan at period end.
(c) Affiliated fund that is generally available only to investment companies and other accounts managed by Fidelity Investments. The rate quoted is the annualized seven-day yield of the fund at period end. A complete unaudited listing of the fund's holdings as of its most recent quarter end is available upon request. In addition, each Fidelity Central Fund's financial statements, which are not covered by the Fund's Report of Independent Registered Public Accounting Firm, are available on the SEC's website or upon request.
(d) Investment made with cash collateral received from securities on loan.
Affiliated Central Funds
Information regarding fiscal year to date income earned by the Fund from investments in Fidelity Central Funds is as follows:
| Fund | Income earned |
| Fidelity Cash Central Fund | $2,498 |
| Fidelity Securities Lending Cash Central Fund | 1,479 |
| Total | $3,977 |
Investment Valuation
The following is a summary of the inputs used, as of October 31, 2015, involving the Fund's assets and liabilities carried at fair value. The inputs or methodology used for valuing securities may not be an indication of the risk associated with investing in those securities. For more information on valuation inputs, and their aggregation into the levels used below, please refer to the Investment Valuation section in the accompanying Notes to Financial Statements.
| | Valuation Inputs at Reporting Date: |
| Description | Total | Level 1 | Level 2 | Level 3 |
| Investments in Securities: | | | | |
| Equities: | | | | |
| Consumer Discretionary | $3,624,311 | $3,624,311 | $-- | $-- |
| Consumer Staples | 1,438,175 | 1,241,390 | 196,011 | 774 |
| Energy | 2,994,548 | 2,994,548 | -- | -- |
| Financials | 9,681,138 | 8,905,702 | 775,436 | -- |
| Health Care | 5,931,944 | 5,931,944 | -- | -- |
| Industrials | 1,634,748 | 1,634,748 | -- | -- |
| Information Technology | 7,191,923 | 7,191,923 | -- | -- |
| Materials | 1,202,239 | 1,202,239 | -- | -- |
| Utilities | 711,960 | 711,960 | -- | -- |
| Money Market Funds | 1,005,248 | 1,005,248 | -- | -- |
| Total Investments in Securities: | $35,416,234 | $34,444,013 | $971,447 | $774 |
Other Information
Distribution of investments by country or territory of incorporation, as a percentage of Total Net Assets, is as follows (Unaudited):
| United States of America | 80.1% |
| Israel | 4.3% |
| Korea (South) | 3.0% |
| United Kingdom | 2.7% |
| France | 2.0% |
| Ireland | 1.9% |
| Canada | 1.9% |
| Switzerland | 1.8% |
| Netherlands | 1.6% |
| Others (Individually Less Than 1%) | 0.7% |
| | 100.0% |
See accompanying notes which are an integral part of the financial statements.
Financial Statements
Statement of Assets and Liabilities
| | | October 31, 2015 |
| Assets | | |
Investment in securities, at value (including securities loaned of $756,600) — See accompanying schedule:
Unaffiliated issuers (cost $34,241,783) | $34,410,986 | |
| Fidelity Central Funds (cost $1,005,248) | 1,005,248 | |
| Total Investments (cost $35,247,031) | | $35,416,234 |
| Receivable for investments sold | | 475,368 |
| Receivable for fund shares sold | | 21,980 |
| Dividends receivable | | 24,704 |
| Distributions receivable from Fidelity Central Funds | | 222 |
| Prepaid expenses | | 93 |
| Receivable from investment adviser for expense reductions | | 1,863 |
| Other receivables | | 1,099 |
| Total assets | | 35,941,563 |
| Liabilities | | |
| Payable for investments purchased | $192,529 | |
| Payable for fund shares redeemed | 22,925 | |
| Accrued management fee | 18,980 | |
| Distribution and service plan fees payable | 11,806 | |
| Other affiliated payables | 7,986 | |
| Other payables and accrued expenses | 40,121 | |
| Collateral on securities loaned, at value | 776,000 | |
| Total liabilities | | 1,070,347 |
| Net Assets | | $34,871,216 |
| Net Assets consist of: | | |
| Paid in capital | | $58,948,986 |
| Undistributed net investment income | | 398,370 |
| Accumulated undistributed net realized gain (loss) on investments and foreign currency transactions | | (24,645,342) |
| Net unrealized appreciation (depreciation) on investments and assets and liabilities in foreign currencies | | 169,202 |
| Net Assets | | $34,871,216 |
| Calculation of Maximum Offering Price | | |
| Class A: | | |
| Net Asset Value and redemption price per share ($18,237,159 ÷ 1,116,069 shares) | | $16.34 |
| Maximum offering price per share (100/94.25 of $16.34) | | $17.34 |
| Class T: | | |
| Net Asset Value and redemption price per share ($7,672,418 ÷ 469,811 shares) | | $16.33 |
| Maximum offering price per share (100/96.50 of $16.33) | | $16.92 |
| Class B: | | |
| Net Asset Value and offering price per share ($247,124 ÷ 15,380 shares)(a) | | $16.07 |
| Class C: | | |
| Net Asset Value and offering price per share ($5,662,423 ÷ 356,680 shares)(a) | | $15.88 |
| Class I: | | |
| Net Asset Value, offering price and redemption price per share ($3,052,092 ÷ 185,211 shares) | | $16.48 |
(a) Redemption price per share is equal to net asset value less any applicable contingent deferred sales charge.
See accompanying notes which are an integral part of the financial statements.
Statement of Operations
| | | Year ended October 31, 2015 |
| Investment Income | | |
| Dividends | | $1,000,167 |
| Interest | | 4 |
| Income from Fidelity Central Funds | | 3,977 |
| Total income | | 1,004,148 |
| Expenses | | |
| Management fee | | |
| Basic fee | $181,742 | |
| Performance adjustment | 17,182 | |
| Transfer agent fees | 81,560 | |
| Distribution and service plan fees | 138,566 | |
| Accounting and security lending fees | 12,915 | |
| Custodian fees and expenses | 7,329 | |
| Independent trustees' compensation | 138 | |
| Registration fees | 62,934 | |
| Audit | 51,473 | |
| Legal | 195 | |
| Miscellaneous | 421 | |
| Total expenses before reductions | 554,455 | |
| Expense reductions | (85,356) | 469,099 |
| Net investment income (loss) | | 535,049 |
| Realized and Unrealized Gain (Loss) | | |
| Net realized gain (loss) on: | | |
| Investment securities: | | |
| Unaffiliated issuers | 1,933,301 | |
| Foreign currency transactions | (946) | |
| Futures contracts | (42,168) | |
| Total net realized gain (loss) | | 1,890,187 |
Change in net unrealized appreciation (depreciation) on:
Investment securities | (1,350,223) | |
| Assets and liabilities in foreign currencies | (1) | |
| Total change in net unrealized appreciation (depreciation) | | (1,350,224) |
| Net gain (loss) | | 539,963 |
| Net increase (decrease) in net assets resulting from operations | | $1,075,012 |
See accompanying notes which are an integral part of the financial statements.
Statement of Changes in Net Assets
| | Year ended October 31, 2015 | Year ended October 31, 2014 |
| Increase (Decrease) in Net Assets | | |
| Operations | | |
| Net investment income (loss) | $535,049 | $187,571 |
| Net realized gain (loss) | 1,890,187 | 4,921,564 |
| Change in net unrealized appreciation (depreciation) | (1,350,224) | (908,952) |
| Net increase (decrease) in net assets resulting from operations | 1,075,012 | 4,200,183 |
| Distributions to shareholders from net investment income | (169,686) | – |
| Distributions to shareholders from net realized gain | (24,958) | – |
| Total distributions | (194,644) | – |
| Share transactions - net increase (decrease) | 4,980,098 | (3,923,371) |
| Total increase (decrease) in net assets | 5,860,466 | 276,812 |
| Net Assets | | |
| Beginning of period | 29,010,750 | 28,733,938 |
| End of period (including undistributed net investment income of $398,370 and undistributed net investment income of $124,802, respectively) | $34,871,216 | $29,010,750 |
See accompanying notes which are an integral part of the financial statements.
Financial Highlights — Fidelity Advisor Value Leaders Fund Class A
| | | | | | |
| Years ended October 31, | 2015 | 2014 | 2013 | 2012 | 2011 |
| Selected Per–Share Data | | | | | |
| Net asset value, beginning of period | $15.79 | $13.73 | $10.82 | $9.96 | $10.12 |
| Income from Investment Operations | | | | | |
| Net investment income (loss)A | .29 | .12 | .10 | .13 | .10 |
| Net realized and unrealized gain (loss) | .39B | 1.94 | 3.01 | .85 | (.14) |
| Total from investment operations | .68 | 2.06 | 3.11 | .98 | (.04) |
| Distributions from net investment income | (.12) | – | (.20) | (.12) | (.11) |
| Distributions from net realized gain | (.01) | – | – | –C | (.01) |
| Total distributions | (.13) | – | (.20) | (.12) | (.12) |
| Net asset value, end of period | $16.34 | $15.79 | $13.73 | $10.82 | $9.96 |
| Total ReturnD,E | 4.32%B | 15.00% | 29.24% | 10.00% | (.40)% |
| Ratios to Average Net AssetsF,G | | | | | |
| Expenses before reductions | 1.49% | 1.30% | 1.33% | 1.28% | 1.24% |
| Expenses net of fee waivers, if any | 1.25% | 1.25% | 1.25% | 1.25% | 1.24% |
| Expenses net of all reductions | 1.25% | 1.25% | 1.23% | 1.24% | 1.23% |
| Net investment income (loss) | 1.78% | .78% | .82% | 1.26% | .91% |
| Supplemental Data | | | | | |
| Net assets, end of period (000 omitted) | $18,237 | $15,067 | $15,339 | $14,705 | $15,484 |
| Portfolio turnover rateH | 54% | 182% | 87% | 94% | 161% |
A Calculated based on average shares outstanding during the period.
B Net realized and unrealized gain (loss) per share reflects proceeds received from litigation which amounted to $.05 per share. Excluding these litigation proceeds, the total return would have been 4.01%.
C Amount represents less than $.005 per share.
D Total returns would have been lower if certain expenses had not been reduced during the applicable periods shown.
E Total returns do not include the effect of the sales charges.
F Fees and expenses of any underlying Fidelity Central Funds are not included in the Fund's expense ratio. The Fund indirectly bears its proportionate share of the expenses of any underlying Fidelity Central Funds.
G Expense ratios reflect operating expenses of the class. Expenses before reductions do not reflect amounts reimbursed by the investment adviser or reductions from brokerage service arrangements or reductions from other expense offset arrangements and do not represent the amount paid by the class during periods when reimbursements or reductions occur. Expenses net of fee waivers reflect expenses after reimbursement by the investment adviser but prior to reductions from brokerage service arrangements or other expense offset arrangements. Expenses net of all reductions represent the net expenses paid by the class.
H Amount does not include the portfolio activity of any underlying Fidelity Central Funds.
See accompanying notes which are an integral part of the financial statements.
Financial Highlights — Fidelity Advisor Value Leaders Fund Class T
| | | | | | |
| Years ended October 31, | 2015 | 2014 | 2013 | 2012 | 2011 |
| Selected Per–Share Data | | | | | |
| Net asset value, beginning of period | $15.78 | $13.75 | $10.82 | $9.96 | $10.08 |
| Income from Investment Operations | | | | | |
| Net investment income (loss)A | .25 | .08 | .07 | .10 | .07 |
| Net realized and unrealized gain (loss) | .39B | 1.95 | 3.02 | .85 | (.13) |
| Total from investment operations | .64 | 2.03 | 3.09 | .95 | (.06) |
| Distributions from net investment income | (.08) | – | (.16) | (.09) | (.05) |
| Distributions from net realized gain | (.01) | – | – | –C | (.01) |
| Total distributions | (.09) | – | (.16) | (.09) | (.06) |
| Net asset value, end of period | $16.33 | $15.78 | $13.75 | $10.82 | $9.96 |
| Total ReturnD,E | 4.04%B | 14.76% | 28.97% | 9.68% | (.64)% |
| Ratios to Average Net AssetsF,G | | | | | |
| Expenses before reductions | 1.78% | 1.58% | 1.60% | 1.55% | 1.49% |
| Expenses net of fee waivers, if any | 1.50% | 1.50% | 1.50% | 1.50% | 1.49% |
| Expenses net of all reductions | 1.50% | 1.50% | 1.48% | 1.49% | 1.48% |
| Net investment income (loss) | 1.53% | .53% | .57% | 1.01% | .67% |
| Supplemental Data | | | | | |
| Net assets, end of period (000 omitted) | $7,672 | $7,819 | $6,569 | $6,145 | $8,254 |
| Portfolio turnover rateH | 54% | 182% | 87% | 94% | 161% |
A Calculated based on average shares outstanding during the period.
B Net realized and unrealized gain (loss) per share reflects proceeds received from litigation which amounted to $.05 per share. Excluding these litigation proceeds, the total return would have been 3.73%.
C Amount represents less than $.005 per share.
D Total returns would have been lower if certain expenses had not been reduced during the applicable periods shown.
E Total returns do not include the effect of the sales charges.
F Fees and expenses of any underlying Fidelity Central Funds are not included in the Fund's expense ratio. The Fund indirectly bears its proportionate share of the expenses of any underlying Fidelity Central Funds.
G Expense ratios reflect operating expenses of the class. Expenses before reductions do not reflect amounts reimbursed by the investment adviser or reductions from brokerage service arrangements or reductions from other expense offset arrangements and do not represent the amount paid by the class during periods when reimbursements or reductions occur. Expenses net of fee waivers reflect expenses after reimbursement by the investment adviser but prior to reductions from brokerage service arrangements or other expense offset arrangements. Expenses net of all reductions represent the net expenses paid by the class.
H Amount does not include the portfolio activity of any underlying Fidelity Central Funds.
See accompanying notes which are an integral part of the financial statements.
Financial Highlights — Fidelity Advisor Value Leaders Fund Class B
| | | | | | |
| Years ended October 31, | 2015 | 2014 | 2013 | 2012 | 2011 |
| Selected Per��Share Data | | | | | |
| Net asset value, beginning of period | $15.53 | $13.60 | $10.70 | $9.84 | $9.99 |
| Income from Investment Operations | | | | | |
| Net investment income (loss)A | .17 | –B | .01 | .05 | .02 |
| Net realized and unrealized gain (loss) | .38C | 1.93 | 2.99 | .85 | (.13) |
| Total from investment operations | .55 | 1.93 | 3.00 | .90 | (.11) |
| Distributions from net investment income | – | – | (.10) | (.03) | (.03) |
| Distributions from net realized gain | (.01) | – | – | –B | (.01) |
| Total distributions | (.01) | – | (.10) | (.04)D | (.04) |
| Net asset value, end of period | $16.07 | $15.53 | $13.60 | $10.70 | $9.84 |
| Total ReturnE,F | 3.56%C | 14.19% | 28.31% | 9.14% | (1.14)% |
| Ratios to Average Net AssetsG,H | | | | | |
| Expenses before reductions | 2.33% | 2.12% | 2.10% | 2.04% | 1.99% |
| Expenses net of fee waivers, if any | 2.00% | 2.00% | 2.00% | 2.00% | 1.99% |
| Expenses net of all reductions | 2.00% | 2.00% | 1.98% | 1.99% | 1.98% |
| Net investment income (loss) | 1.03% | .03% | .07% | .51% | .16% |
| Supplemental Data | | | | | |
| Net assets, end of period (000 omitted) | $247 | $406 | $719 | $895 | $1,110 |
| Portfolio turnover rateI | 54% | 182% | 87% | 94% | 161% |
A Calculated based on average shares outstanding during the period.
B Amount represents less than $.005 per share.
C Net realized and unrealized gain (loss) per share reflects proceeds received from litigation which amounted to $.05 per share. Excluding these litigation proceeds, the total return would have been 3.25%.
D Total distributions of $.04 per share is comprised of distributions from net investment income of $.031 and distributions from net realized gain of $.004 per share.
E Total returns would have been lower if certain expenses had not been reduced during the applicable periods shown.
F Total returns do not include the effect of the contingent deferred sales charge.
G Fees and expenses of any underlying Fidelity Central Funds are not included in the Fund's expense ratio. The Fund indirectly bears its proportionate share of the expenses of any underlying Fidelity Central Funds.
H Expense ratios reflect operating expenses of the class. Expenses before reductions do not reflect amounts reimbursed by the investment adviser or reductions from brokerage service arrangements or reductions from other expense offset arrangements and do not represent the amount paid by the class during periods when reimbursements or reductions occur. Expenses net of fee waivers reflect expenses after reimbursement by the investment adviser but prior to reductions from brokerage service arrangements or other expense offset arrangements. Expenses net of all reductions represent the net expenses paid by the class.
I Amount does not include the portfolio activity of any underlying Fidelity Central Funds.
See accompanying notes which are an integral part of the financial statements.
Financial Highlights — Fidelity Advisor Value Leaders Fund Class C
| | | | | | |
| Years ended October 31, | 2015 | 2014 | 2013 | 2012 | 2011 |
| Selected Per–Share Data | | | | | |
| Net asset value, beginning of period | $15.35 | $13.44 | $10.59 | $9.75 | $9.92 |
| Income from Investment Operations | | | | | |
| Net investment income (loss)A | .17 | –B | .01 | .05 | .02 |
| Net realized and unrealized gain (loss) | .37C | 1.91 | 2.95 | .84 | (.13) |
| Total from investment operations | .54 | 1.91 | 2.96 | .89 | (.11) |
| Distributions from net investment income | – | – | (.11) | (.05) | (.05) |
| Distributions from net realized gain | (.01) | – | – | –B | (.01) |
| Total distributions | (.01) | – | (.11) | (.05) | (.06) |
| Net asset value, end of period | $15.88 | $15.35 | $13.44 | $10.59 | $9.75 |
| Total ReturnD,E | 3.54%C | 14.21% | 28.27% | 9.21% | (1.18)% |
| Ratios to Average Net AssetsF,G | | | | | |
| Expenses before reductions | 2.29% | 2.09% | 2.08% | 2.04% | 2.00% |
| Expenses net of fee waivers, if any | 2.00% | 2.00% | 2.00% | 2.00% | 2.00% |
| Expenses net of all reductions | 2.00% | 2.00% | 1.97% | 1.99% | 1.98% |
| Net investment income (loss) | 1.03% | .03% | .07% | .51% | .16% |
| Supplemental Data | | | | | |
| Net assets, end of period (000 omitted) | $5,662 | $4,458 | $4,340 | $3,299 | $3,775 |
| Portfolio turnover rateH | 54% | 182% | 87% | 94% | 161% |
A Calculated based on average shares outstanding during the period.
B Amount represents less than $.005 per share.
C Net realized and unrealized gain (loss) per share reflects proceeds received from litigation which amounted to $.05 per share. Excluding these litigation proceeds, the total return would have been 3.23%.
D Total returns would have been lower if certain expenses had not been reduced during the applicable periods shown.
E Total returns do not include the effect of the contingent deferred sales charge.
F Fees and expenses of any underlying Fidelity Central Funds are not included in the Fund's expense ratio. The Fund indirectly bears its proportionate share of the expenses of any underlying Fidelity Central Funds.
G Expense ratios reflect operating expenses of the class. Expenses before reductions do not reflect amounts reimbursed by the investment adviser or reductions from brokerage service arrangements or reductions from other expense offset arrangements and do not represent the amount paid by the class during periods when reimbursements or reductions occur. Expenses net of fee waivers reflect expenses after reimbursement by the investment adviser but prior to reductions from brokerage service arrangements or other expense offset arrangements. Expenses net of all reductions represent the net expenses paid by the class.
H Amount does not include the portfolio activity of any underlying Fidelity Central Funds.
See accompanying notes which are an integral part of the financial statements.
Financial Highlights — Fidelity Advisor Value Leaders Fund Class I
| | | | | | |
| Years ended October 31, | 2015 | 2014 | 2013 | 2012 | 2011 |
| Selected Per–Share Data | | | | | |
| Net asset value, beginning of period | $15.93 | $13.81 | $10.89 | $10.04 | $10.19 |
| Income from Investment Operations | | | | | |
| Net investment income (loss)A | .34 | .15 | .14 | .18 | .14 |
| Net realized and unrealized gain (loss) | .39B | 1.97 | 3.02 | .83 | (.15) |
| Total from investment operations | .73 | 2.12 | 3.16 | 1.01 | (.01) |
| Distributions from net investment income | (.17) | – | (.24) | (.16) | (.13) |
| Distributions from net realized gain | (.01) | – | – | –C | (.01) |
| Total distributions | (.18) | – | (.24) | (.16) | (.14) |
| Net asset value, end of period | $16.48 | $15.93 | $13.81 | $10.89 | $10.04 |
| Total ReturnD | 4.58%B | 15.35% | 29.65% | 10.30% | (.11)% |
| Ratios to Average Net AssetsE,F | | | | | |
| Expenses before reductions | 1.18% | 1.01% | .94% | .83% | .89% |
| Expenses net of fee waivers, if any | 1.00% | 1.00% | .94% | .83% | .89% |
| Expenses net of all reductions | 1.00% | 1.00% | .92% | .82% | .88% |
| Net investment income (loss) | 2.03% | 1.03% | 1.13% | 1.68% | 1.27% |
| Supplemental Data | | | | | |
| Net assets, end of period (000 omitted) | $3,052 | $1,261 | $1,767 | $1,195 | $523 |
| Portfolio turnover rateG | 54% | 182% | 87% | 94% | 161% |
A Calculated based on average shares outstanding during the period.
B Net realized and unrealized gain (loss) per share reflects proceeds received from litigation which amounted to $.05 per share. Excluding these litigation proceeds, the total return would have been 4.27%.
C Amount represents less than $.005 per share.
D Total returns would have been lower if certain expenses had not been reduced during the applicable periods shown.
E Fees and expenses of any underlying Fidelity Central Funds are not included in the Fund's expense ratio. The Fund indirectly bears its proportionate share of the expenses of any underlying Fidelity Central Funds.
F Expense ratios reflect operating expenses of the class. Expenses before reductions do not reflect amounts reimbursed by the investment adviser or reductions from brokerage service arrangements or reductions from other expense offset arrangements and do not represent the amount paid by the class during periods when reimbursements or reductions occur. Expenses net of fee waivers reflect expenses after reimbursement by the investment adviser but prior to reductions from brokerage service arrangements or other expense offset arrangements. Expenses net of all reductions represent the net expenses paid by the class.
G Amount does not include the portfolio activity of any underlying Fidelity Central Funds.
See accompanying notes which are an integral part of the financial statements.
Notes to Financial Statements
For the period ended October 31, 2015
1. Organization.
Fidelity Advisor Value Leaders Fund (the Fund) is a fund of Fidelity Advisor Series VIII (the Trust) and is authorized to issue an unlimited number of shares. The Trust is registered under the Investment Company Act of 1940, as amended (the 1940 Act), as an open-end management investment company organized as a Massachusetts business trust. The Fund offers Class A, Class T, Class C and Class I (formerly Institutional Class) shares, each of which, along with Class B shares, has equal rights as to assets and voting privileges. Class B shares are closed to new accounts and additional purchases, except for exchanges and reinvestments. Each class has exclusive voting rights with respect to matters that affect that class. Class B shares will automatically convert to Class A shares after a holding period of seven years from the initial date of purchase.
2. Investments in Fidelity Central Funds.
The Fund invests in Fidelity Central Funds, which are open-end investment companies generally available only to other investment companies and accounts managed by the investment adviser and its affiliates. The Fund's Schedule of Investments lists each of the Fidelity Central Funds held as of period end, if any, as an investment of the Fund, but does not include the underlying holdings of each Fidelity Central Fund. As an Investing Fund, the Fund indirectly bears its proportionate share of the expenses of the underlying Fidelity Central Funds.
The Money Market Central Funds seek preservation of capital and current income and are managed by Fidelity Investments Money Management, Inc. (FIMM), an affiliate of the investment adviser. Annualized expenses of the Money Market Central Funds as of their most recent shareholder report date are less than .005%.
A complete unaudited list of holdings for each Fidelity Central Fund is available upon request or at the Securities and Exchange Commission (the SEC) website at www.sec.gov. In addition, the financial statements of the Fidelity Central Funds, which are not covered by the Fund's Report of Independent Registered Public Accounting Firm, are available on the SEC website or upon request.
3. Significant Accounting Policies.
The financial statements have been prepared in conformity with accounting principles generally accepted in the United States of America (GAAP), which require management to make certain estimates and assumptions at the date of the financial statements. Actual results could differ from those estimates. Subsequent events, if any, through the date that the financial statements were issued have been evaluated in the preparation of the financial statements. The following summarizes the significant accounting policies of the Fund:
Investment Valuation. Investments are valued as of 4:00 p.m. Eastern time on the last calendar day of the period. The Board of Trustees (the Board) has delegated the day to day responsibility for the valuation of the Fund's investments to the Fidelity Management & Research Company (FMR) Fair Value Committee (the Committee). In accordance with valuation policies and procedures approved by the Board, the Fund attempts to obtain prices from one or more third party pricing vendors or brokers to value its investments. When current market prices, quotations or currency exchange rates are not readily available or reliable, investments will be fair valued in good faith by the Committee, in accordance with procedures adopted by the Board. Factors used in determining fair value vary by investment type and may include market or investment specific events. The frequency with which these procedures are used cannot be predicted and they may be utilized to a significant extent. The Committee oversees the Fund's valuation policies and procedures and reports to the Board on the Committee's activities and fair value determinations. The Board monitors the appropriateness of the procedures used in valuing the Fund's investments and ratifies the fair value determinations of the Committee.
The Fund categorizes the inputs to valuation techniques used to value its investments into a disclosure hierarchy consisting of three levels as shown below:
- Level 1 – quoted prices in active markets for identical investments
- Level 2 – other significant observable inputs (including quoted prices for similar investments, interest rates, prepayment speeds, etc.)
- Level 3 – unobservable inputs (including the Fund's own assumptions based on the best information available)
Valuation techniques used to value the Fund's investments by major category are as follows:
Equity securities, including restricted securities, for which market quotations are readily available, are valued at the last reported sale price or official closing price as reported by a third party pricing vendor on the primary market or exchange on which they are traded and are categorized as Level 1 in the hierarchy. In the event there were no sales during the day or closing prices are not available, securities are valued at the last quoted bid price or may be valued using the last available price and are generally categorized as Level 2 in the hierarchy. For foreign equity securities, when market or security specific events arise, comparisons to the valuation of American Depositary Receipts (ADRs), futures contracts, Exchange-Traded Funds (ETFs) and certain indexes as well as quoted prices for similar securities may be used and would be categorized as Level 2 in the hierarchy. Utilizing these techniques may result in transfers between Level 1 and Level 2. For equity securities, including restricted securities, where observable inputs are limited, assumptions about market activity and risk are used and these securities may be categorized as Level 3 in the hierarchy.
Investments in open-end mutual funds, including the Fidelity Central Funds, are valued at their closing net asset value (NAV) each business day and are categorized as Level 1 in the hierarchy.
Changes in valuation techniques may result in transfers in or out of an assigned level within the disclosure hierarchy. The aggregate value of investments by input level as of October 31, 2015, is included at the end of the Fund's Schedule of Investments.
Foreign Currency. The Fund may use foreign currency contracts to facilitate transactions in foreign-denominated securities. Gains and losses from these transactions may arise from changes in the value of the foreign currency or if the counterparties do not perform under the contracts' terms.
Foreign-denominated assets, including investment securities, and liabilities are translated into U.S. dollars at the exchange rates at period end. Purchases and sales of investment securities, income and dividends received and expenses denominated in foreign currencies are translated into U.S. dollars at the exchange rate in effect on the transaction date.
The effects of exchange rate fluctuations on investments are included with the net realized and unrealized gain (loss) on investment securities. Other foreign currency transactions resulting in realized and unrealized gain (loss) are disclosed separately.
Investment Transactions and Income. For financial reporting purposes, the Fund's investment holdings and NAV include trades executed through the end of the last business day of the period. The NAV per share for processing shareholder transactions is calculated as of the close of business of the New York Stock Exchange (NYSE), normally 4:00 p.m. Eastern time and includes trades executed through the end of the prior business day. Gains and losses on securities sold are determined on the basis of identified cost and may include proceeds received from litigation. Dividend income is recorded on the ex-dividend date, except for certain dividends from foreign securities where the ex-dividend date may have passed, which are recorded as soon as the Fund is informed of the ex-dividend date. Non-cash dividends included in dividend income, if any, are recorded at the fair market value of the securities received. Income and capital gain distributions from Fidelity Central Funds, if any, are recorded on the ex-dividend date. Distributions received on securities that represent a return of capital or capital gain are recorded as a reduction of cost of investments and/or as a realized gain. Subsequent to ex-dividend date the Fund determines the components of these distributions, based upon receipt of tax filings or other correspondence relating to the underlying investment. Interest income is accrued as earned and includes coupon interest and amortization of premium and accretion of discount on debt securities as applicable. Investment income is recorded net of foreign taxes withheld where recovery of such taxes is uncertain.
Class Allocations and Expenses. Investment income, realized and unrealized capital gains and losses, common expenses of the Fund, and certain fund-level expense reductions, if any, are allocated daily on a pro-rata basis to each class based on the relative net assets of each class to the total net assets of the Fund. Each class differs with respect to transfer agent and distribution and service plan fees incurred. Certain expense reductions may also differ by class. For the reporting period, the allocated portion of income and expenses to each class as a percent of its average net assets may vary due to the timing of recording these transactions in relation to fluctuating net assets of the classes. Expenses directly attributable to a fund are charged to that fund. Expenses attributable to more than one fund are allocated among the respective funds on the basis of relative net assets or other appropriate methods. Expense estimates are accrued in the period to which they relate and adjustments are made when actual amounts are known.
Income Tax Information and Distributions to Shareholders. Each year, the Fund intends to qualify as a regulated investment company under Subchapter M of the Internal Revenue Code, including distributing substantially all of its taxable income and realized gains. As a result, no provision for U.S. Federal income taxes is required. As of October 31, 2015, the Fund did not have any unrecognized tax benefits in the financial statements; nor is the Fund aware of any tax positions for which it is reasonably possible that the total amounts of unrecognized tax benefits will significantly change in the next twelve months. The Fund files a U.S. federal tax return, in addition to state and local tax returns as required. The Fund's federal income tax returns are subject to examination by the Internal Revenue Service (IRS) for a period of three fiscal years after they are filed. State and local tax returns may be subject to examination for an additional fiscal year depending on the jurisdiction. Foreign taxes are provided for based on the Fund's understanding of the tax rules and rates that exist in the foreign markets in which it invests.
Distributions are declared and recorded on the ex-dividend date. Income dividends and capital gain distributions are declared separately for each class. Income and capital gain distributions are determined in accordance with income tax regulations, which may differ from GAAP.
Capital accounts within the financial statements are adjusted for permanent book-tax differences. These adjustments have no impact on net assets or the results of operations. Capital accounts are not adjusted for temporary book-tax differences which will reverse in a subsequent period.
Book-tax differences are primarily due to futures contracts, foreign currency transactions, partnerships, capital loss carryforwards and losses deferred due to wash sales.
The federal tax cost of investment securities and unrealized appreciation (depreciation) as of period end were as follows:
| Gross unrealized appreciation | $2,210,764 |
| Gross unrealized depreciation | (2,213,123) |
| Net unrealized appreciation (depreciation) on securities | $(2,359) |
| Tax Cost | $35,418,593 |
The tax-based components of distributable earnings as of period end were as follows:
| Undistributed ordinary income | $398,369 |
| Capital loss carryforward | $(24,473,780) |
| Net unrealized appreciation (depreciation) on securities and other investments | $(2,360) |
Capital loss carryforwards are only available to offset future capital gains of the Fund to the extent provided by regulations and may be limited. Under the Regulated Investment Company Modernization Act of 2010 (the Act), the Fund is permitted to carry forward capital losses incurred in taxable years beginning after December 22, 2010 for an unlimited period and such capital losses are required to be used prior to any losses that expire. The capital loss carryforward information presented below, including any applicable limitation, is estimated as of fiscal period end and is subject to adjustment.
| Fiscal year of expiration | |
| 2016 | $(9,484,911) |
| 2017 | (14,819,668) |
| 2019 | (169,201) |
| Total capital loss carryforward | $(24,473,780) |
The tax character of distributions paid was as follows:
| | October 31, 2015 | October 31, 2014 |
| Ordinary Income | $194,644 | $– |
4. Derivative Instruments.
Risk Exposures and the Use of Derivative Instruments. The Fund's investment objective allows the Fund to enter into various types of derivative contracts, including futures contracts. Derivatives are investments whose value is primarily derived from underlying assets, indices or reference rates and may be transacted on an exchange or over-the-counter (OTC). Derivatives may involve a future commitment to buy or sell a specified asset based on specified terms, to exchange future cash flows at periodic intervals based on a notional principal amount, or for one party to make one or more payments upon the occurrence of specified events in exchange for periodic payments from the other party.
The Fund used derivatives to increase returns and to manage exposure to certain risks as defined below. The success of any strategy involving derivatives depends on analysis of numerous economic factors, and if the strategies for investment do not work as intended, the Fund may not achieve its objectives.
The Fund's use of derivatives increased or decreased its exposure to the following risk:
| Equity Risk | Equity risk relates to the fluctuations in the value of financial instruments as a result of changes in market prices (other than those arising from interest rate risk or foreign exchange risk), whether caused by factors specific to an individual investment, its issuer, or all factors affecting all instruments traded in a market or market segment. |
The Fund is also exposed to additional risks from investing in derivatives, such as liquidity risk and counterparty credit risk. Liquidity risk is the risk that the Fund will be unable to close out the derivative in the open market in a timely manner. Counterparty credit risk is the risk that the counterparty will not be able to fulfill its obligation to the Fund. Counterparty credit risk related to exchange-traded futures contracts may be mitigated by the protection provided by the exchange on which they trade.
Investing in derivatives may involve greater risks than investing in the underlying assets directly and, to varying degrees, may involve risk of loss in excess of any initial investment and collateral received and amounts recognized in the Statement of Assets and Liabilities. In addition, there may be the risk that the change in value of the derivative contract does not correspond to the change in value of the underlying instrument.
Futures Contracts. A futures contract is an agreement between two parties to buy or sell a specified underlying instrument for a fixed price at a specified future date. The Fund used futures contracts to manage its exposure to the stock market.
Upon entering into a futures contract, a fund is required to deposit either cash or securities (initial margin) with a clearing broker in an amount equal to a certain percentage of the face value of the contract. Futures contracts are marked-to-market daily and subsequent daily payments (variation margin) are made or received by a fund depending on the daily fluctuations in the value of the futures contracts and are recorded as unrealized appreciation or (depreciation). This receivable and/or payable, if any, is included in daily variation margin for derivative instruments in the Statement of Assets and Liabilities. Realized gain or (loss) is recorded upon the expiration or closing of a futures contract.
Any open futures contracts at period end are presented in the Schedule of Investments under the caption "Futures Contracts". The underlying face amount at value reflects each contract's exposure to the underlying instrument or index at period end.
During the period the Fund recognized net realized gain (loss) of $(42,168) related to its investment in futures contracts. This amount is included in the Statement of Operations.
5. Purchases and Sales of Investments.
Purchases and sales of securities, other than short-term securities, aggregated $22,267,921 and $16,890,411, respectively.
6. Fees and Other Transactions with Affiliates.
Management Fee. Fidelity Management & Research Company (the investment adviser) and its affiliates provide the Fund with investment management related services for which the Fund pays a monthly management fee. The management fee is the sum of an individual fund fee rate that is based on an annual rate of .30% of the Fund's average net assets and an annualized group fee rate that averaged .25% during the period. The group fee rate is based upon the average net assets of all the mutual funds advised by the investment adviser, including any mutual funds previously advised by the investment adviser that are currently advised by Fidelity SelectCo, LLC, an affiliate of the investment adviser. The group fee rate decreases as assets under management increase and increases as assets under management decrease. In addition, the management fee is subject to a performance adjustment (up to a maximum of +/- .20% of the Fund's average net assets over a 36 month performance period). The upward or downward adjustment to the management fee is based on the relative investment performance of Class I of the Fund as compared to its benchmark index, the Russell 1000 Value Index, over the same 36 month performance period. For the reporting period, the total annual management fee rate, including the performance adjustment, was .60% of the Fund's average net assets. The performance adjustment included in the management fee rate may be higher or lower than the maximum performance adjustment rate due to the difference between the average net assets for the reporting and performance periods.
Distribution and Service Plan Fees. In accordance with Rule 12b-1 of the 1940 Act, the Fund has adopted separate Distribution and Service Plans for each class of shares, except for the Class I. Certain classes pay Fidelity Distributors Corporation (FDC), an affiliate of the investment adviser, separate Distribution and Service Fees, each of which is based on an annual percentage of each class' average net assets. In addition, FDC may pay financial intermediaries for selling shares of the Fund and providing shareholder support services. For the period, the Distribution and Service Fee rates, total fees and amounts retained by FDC were as follows:
| | Distribution
Fee | Service
Fee | Total Fees | Retained
by FDC |
| Class A | -% | .25% | $42,547 | $2,598 |
| Class T | .25% | .25% | 40,414 | 25 |
| Class B | .75% | .25% | 3,476 | 2,610 |
| Class C | .75% | .25% | 52,129 | 7,348 |
| | | | $138,566 | $12,581 |
Sales Load. FDC may receive a front-end sales charge of up to 5.75% for selling Class A shares and 3.50% for selling Class T shares, some of which is paid to financial intermediaries for selling shares of the Fund. Depending on the holding period, FDC may receive contingent deferred sales charges levied on Class A, Class T, Class B, and Class C redemptions. The deferred sales charges range from 5.00% to 1.00% for Class B shares, 1.00% for Class C shares, 1.00% for certain purchases of Class A shares and .25% for certain purchases of Class T shares.
For the period, sales charge amounts retained by FDC were as follows:
| | Retained
by FDC |
| Class A | $6,016 |
| Class T | 986 |
| Class B(a) | 124 |
| Class C(a) | 655 |
| | $7,781 |
(a) When Class B and Class C shares are initially sold, FDC pays commissions from its own resources to financial intermediaries through which the sales are made.
Transfer Agent Fees. Fidelity Investments Institutional Operations Company, Inc., (FIIOC), an affiliate of the investment adviser, is the transfer, dividend disbursing and shareholder servicing agent for each class of the Fund. FIIOC receives account fees and asset-based fees that vary according to the account size and type of account of the shareholders of the respective classes of the Fund. FIIOC pays for typesetting, printing and mailing of shareholder reports, except proxy statements.
For the period, transfer agent fees for each class were as follows:
| | Amount | % of
Class-Level Average
Net Assets |
| Class A | $39,761 | .23 |
| Class T | 20,960 | .26 |
| Class B | 1,043 | .30 |
| Class C | 14,720 | .28 |
| Class I | 5,076 | .21 |
| | $ 81,560 | |
Accounting and Security Lending Fees. Fidelity Service Company, Inc. (FSC), an affiliate of the investment adviser, maintains the Fund's accounting records. The accounting fee is based on the level of average net assets for each month. Under a separate contract, FSC administers the security lending program. The security lending fee is based on the number and duration of lending transactions.
Brokerage Commissions. The Fund placed a portion of its portfolio transactions with brokerage firms which are affiliates of the investment adviser. Brokerage commissions are included in net realized gain (loss) and change in net unrealized appreciation (depreciation) in the Statement of Operations. The commissions paid to these affiliated firms were $214 for the period.
7. Committed Line of Credit.
The Fund participates with other funds managed by the investment adviser or an affiliate in a $4.25 billion credit facility (the "line of credit") to be utilized for temporary or emergency purposes to fund shareholder redemptions or for other short-term liquidity purposes. The Fund has agreed to pay commitment fees on its pro-rata portion of the line of credit, which amounted to $47 and is reflected in Miscellaneous expenses on the Statement of Operations. During the period, the Fund did not borrow on this line of credit.
8. Security Lending.
The Fund lends portfolio securities through a lending agent from time to time in order to earn additional income. For equity securities, a lending agent is used and may loan securities to certain qualified borrowers, including Fidelity Capital Markets (FCM), a broker-dealer affiliated with the Fund. On the settlement date of the loan, the Fund receives collateral (in the form of U.S. Treasury obligations, letters of credit and/or cash) against the loaned securities and maintains collateral in an amount not less than 100% of the market value of the loaned securities during the period of the loan. The market value of the loaned securities is determined at the close of business of the Fund and any additional required collateral is delivered to the Fund on the next business day. The Fund or borrower may terminate the loan at any time, and if the borrower defaults on its obligation to return the securities loaned because of insolvency or other reasons, the Fund may apply collateral received from the borrower against the obligation. The Fund may experience delays and costs in recovering the securities loaned. Any cash collateral received is invested in the Fidelity Securities Lending Cash Central Fund. The value of loaned securities and cash collateral at period end are disclosed on the Fund's Statement of Assets and Liabilities. Security lending income represents the income earned on investing cash collateral, less rebates paid to borrowers, and any lending agent fees associated with the loan, plus any premium payments received for lending certain types of securities. Security lending income is presented in the Statement of Operations as a component of income from Fidelity Central Funds. Total security lending income during the period amounted to $1,479. During the period, there were no securities loaned to FCM.
9. Expense Reductions.
The investment adviser voluntarily agreed to reimburse each class to the extent annual operating expenses exceeded certain levels of average net assets as noted in the table below. Some expenses, for example interest expense, including commitment fees, are excluded from this reimbursement.
The following classes were in reimbursement during the period:
| | Expense
Limitations | Reimbursement |
| Class A | 1.25% | $41,382 |
| Class T | 1.50% | 22,205 |
| Class B | 2.00% | 1,118 |
| Class C | 2.00% | 15,104 |
| Class I | 1.00% | 4,373 |
| | | $84,182 |
Commissions paid to certain brokers with whom the investment adviser, or its affiliates, places trades on behalf of the Fund include an amount in addition to trade execution, which may be rebated back to the Fund to offset certain expenses. This amount totaled $434 for the period. In addition, through arrangements with the Fund's custodian, credits realized as a result of certain uninvested cash balances were used to reduce the Fund's expenses. During the period, these credits reduced the Fund's custody expenses by $19.
In addition, during the period the investment adviser reimbursed and/or waived a portion of fund-level operating expenses in the amount of $138 and a portion of class-level operating expenses as follows:
| | Amount |
| Class A | $344 |
| Class T | 122 |
| Class B | 1 |
| Class C | 75 |
| Class I | 41 |
| | $583 |
10. Distributions to Shareholders.
Distributions to shareholders of each class were as follows:
| Years ended October 31, | 2015 | 2014 |
| From net investment income | | |
| Class A | $114,891 | $– |
| Class T | 37,662 | – |
| Class I | 17,133 | – |
| Total | $169,686 | $– |
| From net realized gain | | |
| Class A | $12,739 | $– |
| Class T | 6,567 | – |
| Class B | 311 | – |
| Class C | 3,946 | – |
| Class I | 1,395 | – |
| Total | $24,958 | $– |
11. Share Transactions.
Share transactions for each class were as follows and may contain automatic conversions between classes or exchanges between funds:
| | Shares | Shares | Dollars | Dollars |
| Years ended October 31, | 2015 | 2014 | 2015 | 2014 |
| Class A | | | | |
| Shares sold | 347,210 | 138,015 | $5,762,966 | $2,028,107 |
| Reinvestment of distributions | 7,654 | – | 124,714 | – |
| Shares redeemed | (192,743) | (301,611) | (3,168,130) | (4,564,426) |
| Net increase (decrease) | 162,121 | (163,596) | $2,719,550 | $(2,536,319) |
| Class T | | | | |
| Shares sold | 61,595 | 118,612 | $1,008,225 | $1,713,933 |
| Reinvestment of distributions | 2,644 | – | 43,169 | – |
| Shares redeemed | (89,859) | (100,942) | (1,479,942) | (1,483,209) |
| Net increase (decrease) | (25,620) | 17,670 | $(428,548) | $230,724 |
| Class B | | | | |
| Shares sold | 507 | – | $8,265 | $– |
| Reinvestment of distributions | 18 | – | 292 | – |
| Shares redeemed | (11,295) | (26,732) | (181,334) | (388,717) |
| Net increase (decrease) | (10,770) | (26,732) | $(172,777) | $(388,717) |
| Class C | | | | |
| Shares sold | 112,671 | 65,526 | $1,824,580 | $939,665 |
| Reinvestment of distributions | 239 | – | 3,850 | – |
| Shares redeemed | (46,657) | (98,027) | (741,831) | (1,427,472) |
| Net increase (decrease) | 66,253 | (32,501) | $1,086,599 | $(487,807) |
| Class I | | | | |
| Shares sold | 213,391 | 129,227 | $3,568,936 | $1,917,221 |
| Reinvestment of distributions | 1,111 | – | 18,206 | – |
| Shares redeemed | (108,443) | (178,032) | (1,811,868) | (2,658,473) |
| Net increase (decrease) | 106,059 | (48,805) | $1,775,274 | $(741,252) |
12. Other.
The Fund's organizational documents provide former and current trustees and officers with a limited indemnification against liabilities arising in connection with the performance of their duties to the Fund. In the normal course of business, the Fund may also enter into contracts that provide general indemnifications. The Fund's maximum exposure under these arrangements is unknown as this would be dependent on future claims that may be made against the Fund. The risk of material loss from such claims is considered remote.
Report of Independent Registered Public Accounting Firm
To the Trustees of Fidelity Advisor Series VIII and Shareholders of Fidelity Advisor® Value Leaders Fund:
In our opinion, the accompanying statement of assets and liabilities, including the schedule of investments, and the related statements of operations and of changes in net assets and the financial highlights present fairly, in all material respects, the financial position of Fidelity Advisor® Value Leaders Fund (a fund of Fidelity Advisor Series VIII) at October 31, 2015, the results of its operations for the year then ended, the changes in its net assets for each of the two years in the period then ended and the financial highlights for each of the five years in the period then ended, in conformity with accounting principles generally accepted in the United States of America. These financial statements and financial highlights (hereafter referred to as “financial statements”) are the responsibility of the Fidelity Advisor® Value Leaders Fund’s management. Our responsibility is to express an opinion on these financial statements based on our audits. We conducted our audits of these financial statements in accordance with the standards of the Public Company Accounting Oversight Board (United States). Those standards require that we plan and perform the audit to obtain reasonable assurance about whether the financial statements are free of material misstatement. An audit includes examining, on a test basis, evidence supporting the amounts and disclosures in the financial statements, assessing the accounting principles used and significant estimates made by management, and evaluating the overall financial statement presentation. We believe that our audits, which included confirmation of securities at October 31, 2015 by correspondence with the custodian and brokers, provide a reasonable basis for our opinion.
PricewaterhouseCoopers LLP
Boston, Massachusetts
December 16, 2015
Trustees and Officers
The Trustees, Members of the Advisory Board (if any), and officers of the trust and fund, as applicable, are listed below. The Board of Trustees governs the fund and is responsible for protecting the interests of shareholders. The Trustees are experienced executives who meet periodically throughout the year to oversee the fund's activities, review contractual arrangements with companies that provide services to the fund, oversee management of the risks associated with such activities and contractual arrangements, and review the fund's performance. Each of the Trustees oversees 170 funds.
The Trustees hold office without limit in time except that (a) any Trustee may resign; (b) any Trustee may be removed by written instrument, signed by at least two-thirds of the number of Trustees prior to such removal; (c) any Trustee who requests to be retired or who has become incapacitated by illness or injury may be retired by written instrument signed by a majority of the other Trustees; and (d) any Trustee may be removed at any special meeting of shareholders by a two-thirds vote of the outstanding voting securities of the trust. Each Trustee who is not an interested person (as defined in the 1940 Act) of the trust and the fund is referred to herein as an Independent Trustee. Each Independent Trustee shall retire not later than the last day of the calendar year in which his or her 75th birthday occurs. The Independent Trustees may waive this mandatory retirement age policy with respect to individual Trustees. Officers and Advisory Board Members hold office without limit in time, except that any officer or Advisory Board Member may resign or may be removed by a vote of a majority of the Trustees at any regular meeting or any special meeting of the Trustees. Except as indicated, each individual has held the office shown or other offices in the same company for the past five years.
The fund’s Statement of Additional Information (SAI) includes more information about the Trustees. To request a free copy, call Fidelity at 1-877-208-0098.
Experience, Skills, Attributes, and Qualifications of the Trustees. The Governance and Nominating Committee has adopted a statement of policy that describes the experience, qualifications, attributes, and skills that are necessary and desirable for potential Independent Trustee candidates (Statement of Policy). The Board believes that each Trustee satisfied at the time he or she was initially elected or appointed a Trustee, and continues to satisfy, the standards contemplated by the Statement of Policy. The Governance and Nominating Committee also engages professional search firms to help identify potential Independent Trustee candidates who have the experience, qualifications, attributes, and skills consistent with the Statement of Policy. From time to time, additional criteria based on the composition and skills of the current Independent Trustees, as well as experience or skills that may be appropriate in light of future changes to board composition, business conditions, and regulatory or other developments, have also been considered by the professional search firms and the Governance and Nominating Committee. In addition, the Board takes into account the Trustees' commitment and participation in Board and committee meetings, as well as their leadership of standing and ad hoc committees throughout their tenure.
In determining that a particular Trustee was and continues to be qualified to serve as a Trustee, the Board has considered a variety of criteria, none of which, in isolation, was controlling. The Board believes that, collectively, the Trustees have balanced and diverse experience, qualifications, attributes, and skills, which allow the Board to operate effectively in governing the fund and protecting the interests of shareholders. Information about the specific experience, skills, attributes, and qualifications of each Trustee, which in each case led to the Board's conclusion that the Trustee should serve (or continue to serve) as a trustee of the fund, is provided below.
Board Structure and Oversight Function. James C. Curvey is an interested person and currently serves as Chairman. The Trustees have determined that an interested Chairman is appropriate and benefits shareholders because an interested Chairman has a personal and professional stake in the quality and continuity of services provided to the fund. Independent Trustees exercise their informed business judgment to appoint an individual of their choosing to serve as Chairman, regardless of whether the Trustee happens to be independent or a member of management. The Independent Trustees have determined that they can act independently and effectively without having an Independent Trustee serve as Chairman and that a key structural component for assuring that they are in a position to do so is for the Independent Trustees to constitute a substantial majority for the Board. The Independent Trustees also regularly meet in executive session. Ned C. Lautenbach serves as Chairman of the Independent Trustees and as such (i) acts as a liaison between the Independent Trustees and management with respect to matters important to the Independent Trustees and (ii) with management prepares agendas for Board meetings.
Fidelity® funds are overseen by different Boards of Trustees. The fund's Board oversees Fidelity's high income and certain equity funds, and other Boards oversee Fidelity's investment-grade bond, money market, asset allocation, and sector funds. The asset allocation funds may invest in Fidelity® funds overseen by the fund's Board. The use of separate Boards, each with its own committee structure, allows the Trustees of each group of Fidelity® funds to focus on the unique issues of the funds they oversee, including common research, investment, and operational issues. On occasion, the separate Boards establish joint committees to address issues of overlapping consequences for the Fidelity® funds overseen by each Board.
The Trustees operate using a system of committees to facilitate the timely and efficient consideration of all matters of importance to the Trustees, the fund, and fund shareholders and to facilitate compliance with legal and regulatory requirements and oversight of the fund's activities and associated risks. The Board, acting through its committees, has charged FMR and its affiliates with (i) identifying events or circumstances the occurrence of which could have demonstrably adverse effects on the fund's business and/or reputation; (ii) implementing processes and controls to lessen the possibility that such events or circumstances occur or to mitigate the effects of such events or circumstances if they do occur; and (iii) creating and maintaining a system designed to evaluate continuously business and market conditions in order to facilitate the identification and implementation processes described in (i) and (ii) above. Because the day-to-day operations and activities of the fund are carried out by or through FMR, its affiliates, and other service providers, the fund's exposure to risks is mitigated but not eliminated by the processes overseen by the Trustees. While each of the Board's committees has responsibility for overseeing different aspects of the fund's activities, oversight is exercised primarily through the Operations, Audit, and Compliance Committees. In addition, the Independent Trustees have worked with FMR to enhance the Board's oversight of investment and financial risks, legal and regulatory risks, technology risks, and operational risks, including the development of additional risk reporting to the Board. For example, a working group comprised of Independent Trustees and FMR has worked and continues to work to review the Fidelity® funds' valuation-related activities, reporting and risk management. Appropriate personnel, including but not limited to the fund's Chief Compliance Officer (CCO), FMR's internal auditor, the independent accountants, the fund's Treasurer and portfolio management personnel, make periodic reports to the Board's committees, as appropriate, including an annual review of Fidelity's risk management program for the Fidelity® funds. The responsibilities of each standing committee, including their oversight responsibilities, are described further under "Standing Committees of the Trustees."
Interested Trustees*:
Correspondence intended for a Trustee who is an interested person may be sent to Fidelity Investments, 245 Summer Street, Boston, Massachusetts 02210.
Name, Year of Birth; Principal Occupations and Other Relevant Experience+
James C. Curvey (1935)
Year of Election or Appointment: 2007
Trustee
Chairman of the Board of Trustees
Mr. Curvey also serves as Trustee of other Fidelity® funds. Mr. Curvey is a Director of Fidelity Research & Analysis Co. (investment adviser firm, 2009-present), and Vice Chairman (2007-present) and Director of FMR LLC (diversified financial services company). In addition, Mr. Curvey serves as an Overseer for the Boston Symphony Orchestra and a member of the board of Artis-Naples, Naples, Florida, and as a Trustee for Brewster Academy, Wolfeboro, New Hampshire. Previously, Mr. Curvey served as a Director of Fidelity Investments Money Management, Inc. (investment adviser firm, 2009-2014) and a Director of FMR and FMR Co., Inc. (investment adviser firms, 2007-2014).
Charles S. Morrison (1960)
Year of Election or Appointment: 2014
Trustee
Mr. Morrison also serves as Trustee of other funds. He serves as a Director of Fidelity Investments Money Management, Inc. (FIMM) (investment adviser firm, 2014-present), Director of Fidelity SelectCo, LLC (investment adviser firm, 2014-present), President, Asset Management (2014-present), and is an employee of Fidelity Investments. Previously, Mr. Morrison served as Vice President of Fidelity's Fixed Income and Asset Allocation Funds (2012-2014), President, Fixed Income (2011-2014), Vice President of Fidelity's Money Market Funds (2005-2009), President, Money Market Group Leader of FMR (investment adviser firm, 2009), and Senior Vice President, Money Market Group of FMR (2004-2009). Mr. Morrison also served as Vice President of Fidelity's Bond Funds (2002-2005), certain Balanced Funds (2002-2005), and certain Asset Allocation Funds (2002-2007), and as Senior Vice President (2002-2005) of Fidelity's Bond Division.
* Determined to be an “Interested Trustee” by virtue of, among other things, his or her affiliation with the trust or various entities under common control with FMR.
+ The information includes the Trustee's principal occupation during the last five years and other information relating to the experience, attributes, and skills relevant to the Trustee's qualifications to serve as a Trustee, which led to the conclusion that the Trustee should serve as a Trustee for the fund.
Independent Trustees:
Correspondence intended for an Independent Trustee may be sent to Fidelity Investments, P.O. Box 55235, Boston, Massachusetts 02205-5235.
Name, Year of Birth; Principal Occupations and Other Relevant Experience+
Dennis J. Dirks (1948)
Year of Election or Appointment: 2005
Trustee
Mr. Dirks also serves as Trustee of other Fidelity® funds. Prior to his retirement in May 2003, Mr. Dirks was Chief Operating Officer and a member of the Board of The Depository Trust & Clearing Corporation (DTCC). He also served as President, Chief Operating Officer, and Board member of The Depository Trust Company (DTC) and President and Board member of the National Securities Clearing Corporation (NSCC). In addition, Mr. Dirks served as Chief Executive Officer and Board member of the Government Securities Clearing Corporation, Chief Executive Officer and Board member of the Mortgage-Backed Securities Clearing Corporation, as a Trustee and a member of the Finance Committee of Manhattan College (2005-2008), as a Trustee and a member of the Finance Committee of AHRC of Nassau County (2006-2008), and as a member of the Independent Directors Council (IDC) Governing Council (2010-2015). Mr. Dirks is a member of the Board of Directors for The Brookville Center for Children's Services, Inc. (2009-present).
Alan J. Lacy (1953)
Year of Election or Appointment: 2008
Trustee
Mr. Lacy also serves as Trustee of other Fidelity® funds. Mr. Lacy serves as a member of the Board of Directors of Dave & Buster's Entertainment, Inc. (restaurant and entertainment complexes, 2010-present) and Bristol-Myers Squibb Company (global pharmaceuticals, 2008-present). In addition, Mr. Lacy served as Senior Adviser (2007-2014) of Oak Hill Capital Partners, L.P. (private equity) and also served as Chief Executive Officer (2000-2005) and Vice Chairman (2005-2006) of Sears Holdings Corporation and Sears, Roebuck and Co. (retail). Mr. Lacy is a member of the Board of Trustees of The National Parks Conservation Association (2006-present). Previously, Mr. Lacy served as Chairman of the Board of Trustees of the National Parks Conservation Association (2008-2011) and as a member of the Board of Directors for The Western Union Company (global money transfer, 2006-2011), The Hillman Companies, Inc. (hardware wholesalers, 2010-2014), and Earth Fare, Inc. (retail grocery, 2010-2014).
Ned C. Lautenbach (1944)
Year of Election or Appointment: 2000
Trustee
Chairman of the Independent Trustees
Mr. Lautenbach also serves as Trustee of other Fidelity® funds. Mr. Lautenbach currently serves as the Lead Director of the Eaton Corporation Board of Directors (diversified industrial, 1997-present). Mr. Lautenbach is Chairman of the Board of Directors of Artis-Naples in Naples, Florida (2012-present), a member of the Council on Foreign Relations (1994-present), and a member of the Board of Governors, State University System of Florida (2013-present). Previously, Mr. Lautenbach was a Partner/Advisory Partner at Clayton, Dubilier & Rice, LLC (private equity investment, 1998-2010), as well as a Director of Sony Corporation (2006-2007).
Joseph Mauriello (1944)
Year of Election or Appointment: 2008
Trustee
Mr. Mauriello also serves as Trustee of other Fidelity® funds. Prior to his retirement in January 2006, Mr. Mauriello served in numerous senior management positions including Deputy Chairman and Chief Operating Officer (2004-2005), and Vice Chairman of Financial Services (2002-2004) of KPMG LLP US (professional services, 1965-2005). Mr. Mauriello currently serves as a member of the Board of Directors of XL Group plc. (global insurance and re-insurance, 2006-present) and the Independent Directors Council (IDC) Governing Council (2015-present). Previously, Mr. Mauriello served as a Director of the Hamilton Funds of the Bank of New York (2006-2007) and of Arcadia Resources Inc. (health care services and products, 2007-2012).
Robert W. Selander (1950)
Year of Election or Appointment: 2011
Trustee
Mr. Selander also serves as Trustee of other Fidelity® funds. Mr. Selander serves as a Director of The Western Union Company (global money transfer, 2014-present). Previously, Mr. Selander served as a Member of the Advisory Board of other Fidelity® funds (2011), and Executive Vice Chairman (2010), Chief Executive Officer (2009-2010), and President and Chief Executive Officer (1997-2009) of Mastercard, Inc.
Cornelia M. Small (1944)
Year of Election or Appointment: 2005
Trustee
Ms. Small also serves as Trustee of other Fidelity® funds. Ms. Small is a member of the Board of Directors (2009-present) and Chair of the Investment Committee (2010-present) of the Teagle Foundation. Ms. Small also serves on the Investment Committee of the Berkshire Taconic Community Foundation (2008-present). Previously, Ms. Small served as Chairperson (2002-2008) and a member of the Investment Committee and Chairperson (2008-2012) and a member of the Board of Trustees of Smith College. In addition, Ms. Small served as Chief Investment Officer, Director of Global Equity Investments, and a member of the Board of Directors of Scudder, Stevens & Clark and Scudder Kemper Investments.
William S. Stavropoulos (1939)
Year of Election or Appointment: 2001
Trustee
Vice Chairman of the Independent Trustees
Mr. Stavropoulos also serves as Trustee of other Fidelity® funds. Mr. Stavropoulos serves as President and Founder of the Michigan Baseball Foundation, the Great Lakes Loons (2007-present). Mr. Stavropoulos is Chairman Emeritus of the Board of Directors of The Dow Chemical Company, where he previously served in numerous senior management positions, including President, CEO (1995-2000; 2002-2004), Chairman of the Executive Committee (2000-2006), and as a member of the Board of Directors (1990-2006). Currently, Mr. Stavropoulos is Chairman of the Board of Directors of Univar Inc. (global distributor of commodity and specialty chemicals), a Director of Teradata Corporation (data warehousing and technology solutions), and Maersk Inc. (industrial conglomerate), and a member of the Advisory Board for Metalmark Capital LLC (private equity investment, 2005-present). Mr. Stavropoulos is an operating advisor to Clayton, Dubilier & Rice, LLC (private equity investment). In addition, Mr. Stavropoulos is a member of the University of Notre Dame Advisory Council for the College of Science, a Trustee of the Rollin L. Gerstacker Foundation, and a Director of the Naples Philharmonic Center for the Arts. Previously, Mr. Stavropoulos served as a Director of Chemical Financial Corporation (bank holding company, 1993-2012) and Tyco International, Ltd. (multinational manufacturing and services, 2007-2012).
David M. Thomas (1949)
Year of Election or Appointment: 2008
Trustee
Mr. Thomas also serves as Trustee of other Fidelity® funds. Mr. Thomas serves as Non-Executive Chairman of the Board of Directors of Fortune Brands Home and Security (home and security products, 2011-present), as a member of the Board of Directors (2004-present) and Presiding Director (2013-present) of Interpublic Group of Companies, Inc. (marketing communication), and as a member of the Board of Trustees of the University of Florida (2013-present). Previously, Mr. Thomas served as Executive Chairman (2005-2006) and Chairman and Chief Executive Officer (2000-2005) of IMS Health, Inc. (pharmaceutical and healthcare information solutions), and a Director of Fortune Brands, Inc. (consumer products, 2000-2011).
+ The information includes the Trustee's principal occupation during the last five years and other information relating to the experience, attributes, and skills relevant to the Trustee's qualifications to serve as a Trustee, which led to the conclusion that the Trustee should serve as a Trustee for the fund.
Advisory Board Members and Officers:
Correspondence intended for an officer or Peter S. Lynch may be sent to Fidelity Investments, 245 Summer Street, Boston, Massachusetts 02210. Officers appear below in alphabetical order.
Name, Year of Birth; Principal Occupation
Peter S. Lynch (1944)
Year of Election or Appointment: 2003
Member of the Advisory Board
Mr. Lynch also serves as Member of the Advisory Board of other Fidelity® funds. Mr. Lynch is Vice Chairman and a Director of FMR (investment adviser firm) and FMR Co., Inc. (investment adviser firm). In addition, Mr. Lynch serves as a Trustee of Boston College and as the Chairman of the Inner-City Scholarship Fund. Previously, Mr. Lynch served on the Special Olympics International Board of Directors (1997-2006).
Elizabeth Paige Baumann (1968)
Year of Election or Appointment: 2012
Anti-Money Laundering (AML) Officer
Ms. Baumann also serves as AML Officer of other funds. She is Chief AML Officer of FMR LLC (diversified financial services company, 2012-present) and is an employee of Fidelity Investments. Previously, Ms. Baumann served as Vice President and Deputy Anti-Money Laundering Officer (2007-2012).
Marc R. Bryant (1966)
Year of Election or Appointment: 2015
Secretary and Chief Legal Officer (CLO)
Mr. Bryant also serves as Secretary and CLO of other funds. Mr. Bryant serves as CLO, Secretary, and Senior Vice President of Fidelity Management & Research Company (investment adviser firm, 2015-present) and FMR Co., Inc. (investment adviser firm, 2015-present); Secretary of Fidelity SelectCo, LLC (investment adviser firm, 2015-present) and Fidelity Investments Money Management, Inc. (investment adviser firm, 2015-present); and CLO of Fidelity Management & Research (Hong Kong) Limited (investment adviser firm, 2015-present). He is Senior Vice President and Deputy General Counsel of FMR LLC (diversified financial services company). Previously, Mr. Bryant served as Secretary and Chief Legal Officer of Fidelity Rutland Square Trust II (2010-2014) and Assistant Secretary of Fidelity's Fixed Income and Asset Allocation Funds (2013-2015). Prior to joining Fidelity Investments, Mr. Bryant served as a Senior Vice President and the Head of Global Retail Legal for AllianceBernstein L.P. (2006-2010), and as the General Counsel for ProFund Advisors LLC (2001-2006).
William C. Coffey (1969)
Year of Election or Appointment: 2009
Assistant Secretary
Mr. Coffey also serves as Assistant Secretary of other funds. He is Senior Vice President and Deputy General Counsel of FMR LLC (diversified financial services company, 2010-present), and is an employee of Fidelity Investments. Previously, Mr. Coffey served as Vice President and Associate General Counsel of FMR LLC (2005-2009).
Jonathan Davis (1968)
Year of Election or Appointment: 2010
Assistant Treasurer
Mr. Davis also serves as Assistant Treasurer of other funds, and is an employee of Fidelity Investments. Previously, Mr. Davis served as Vice President and Associate General Counsel of FMR LLC (diversified financial services company, 2003-2010).
Adrien E. Deberghes (1967)
Year of Election or Appointment: 2008
Deputy Treasurer
Mr. Deberghes also serves as an officer of other funds. He is an employee of Fidelity Investments (2008-present). Prior to joining Fidelity Investments, Mr. Deberghes was Senior Vice President of Mutual Fund Administration at State Street Corporation (2007-2008), Senior Director of Mutual Fund Administration at Investors Bank & Trust (2005-2007), and Director of Finance for Dunkin' Brands (2000-2005).
Stephanie J. Dorsey (1969)
Year of Election or Appointment: 2010
Assistant Treasurer
Ms. Dorsey also serves as an officer of other funds. She is an employee of Fidelity Investments (2008-present) and has served in other fund officer roles. Prior to joining Fidelity Investments, Ms. Dorsey served as Treasurer (2004-2008) of the JPMorgan Mutual Funds and Vice President (2004-2008) of JPMorgan Chase Bank.
Howard J. Galligan III (1966)
Year of Election or Appointment: 2014
Chief Financial Officer
Mr. Galligan also serves as Chief Financial Officer of other funds. Mr. Galligan serves as President of Fidelity Pricing and Cash Management Services (FPCMS) (2014-present) and as a Director of Strategic Advisers, Inc. (investment adviser firm, 2008-present). Previously, Mr. Galligan served as Chief Administrative Officer of Asset Management (2011-2014) and Chief Operating Officer and Senior Vice President of Investment Support for Strategic Advisers, Inc. (2003-2011).
Scott C. Goebel (1968)
Year of Election or Appointment: 2015
Vice President
Mr. Goebel serves as Vice President of other funds and is an employee of Fidelity Investments (2001-present). Previously, Mr. Goebel served as Secretary of Fidelity SelectCo, LLC (investment adviser firm, 2013-2015), Fidelity Investments Money Management, Inc. (FIMM) (investment adviser firm, 2010-2015), and Fidelity Research and Analysis Company (FRAC) (investment adviser firm, 2010-2015); General Counsel, Secretary, and Senior Vice President of Fidelity Management & Research Company (investment adviser firm, 2008-2015) and FMR Co., Inc. (investment adviser firm, 2008-2015); Assistant Secretary of Fidelity Management & Research (Japan) Limited (investment adviser firm, 2008-2015) and FMR Investment Management (U.K.) Limited (investment adviser firm, 2008-2015); Chief Legal Officer (CLO) of Fidelity Management & Research (Hong Kong) Limited (investment adviser firm, 2008-2015); Secretary and CLO of certain Fidelity® funds (2008-2015); Assistant Secretary of FIMM (2008-2010), FRAC (2008-2010), and certain funds (2007-2008); and as Vice President and Secretary of Fidelity Distributors Corporation (FDC) (2005-2007).
Thomas C. Hense (1964)
Year of Election or Appointment: 2008, 2010, or 2015
Vice President
Mr. Hense serves as Vice President of Fidelity Advisor® Multi-Asset Income Fund (2015) and other funds (High Income (2008), Small Cap (2008), and Value (2010) funds), and is an employee of Fidelity Investments (1993-present). Previously, Mr. Hense served as a portfolio manager for Fidelity's Institutional Money Management Group (Pyramis) (2003-2008).
Brian B. Hogan (1964)
Year of Election or Appointment: 2009
Vice President
Mr. Hogan also serves as Trustee or Vice President of other funds. Mr. Hogan serves as a Director of Fidelity SelectCo, LLC (investment adviser firm, 2014-present) and President of the Equity Division of FMR (investment adviser firm, 2009-present). Previously, Mr. Hogan served as Senior Vice President, Equity Research of FMR (2006-2009) and as a portfolio manager.
Chris Maher (1972)
Year of Election or Appointment: 2013
Assistant Treasurer
Mr. Maher serves as Assistant Treasurer of other funds. Mr. Maher is Vice President of Valuation Oversight and is an employee of Fidelity Investments. Previously, Mr. Maher served as Vice President of Asset Management Compliance (2013), Vice President of the Program Management Group of FMR (investment adviser firm, 2010-2013), and Vice President of Valuation Oversight (2008-2010).
Kenneth B. Robins (1969)
Year of Election or Appointment: 2008
President and Treasurer
Mr. Robins also serves as an officer of other funds. Mr. Robins serves as Executive Vice President of Fidelity Investments Money Management, Inc. (FIMM) (investment adviser firm, 2013-present) and is an employee of Fidelity Investments (2004-present). Previously, Mr. Robins served in other fund officer roles.
Stacie M. Smith (1974)
Year of Election or Appointment: 2013
Deputy Treasurer
Ms. Smith also serves as an officer of other funds. She is an employee of Fidelity Investments (2009-present) and has served in other fund officer roles. Prior to joining Fidelity Investments, Ms. Smith served as Senior Audit Manager of Ernst & Young LLP (1996-2009).
Renee Stagnone (1975)
Year of Election or Appointment: 2013
Deputy Treasurer
Ms. Stagnone also serves as Deputy Treasurer of other funds. Ms. Stagnone is an employee of Fidelity Investments (1997-present).
Linda J. Wondrack (1964)
Year of Election or Appointment: 2014
Chief Compliance Officer
Ms. Wondrack also serves as Chief Compliance Officer of other funds. Ms. Wondrack is Executive Vice President and head of the Ethics Office and Asset Management Compliance for Fidelity Investments (2012-present). Ms. Wondrack also serves as Chief Compliance Officer of Fidelity SelectCo, LLC (investment adviser firm, 2014-present); Chief Compliance Officer of Impresa Management LLC (2013-present); and Chief Compliance Officer of FMR Co., Inc. (investment adviser firm), Fidelity Investments Money Management, Inc. (investment adviser firm), Fidelity Management & Research (Japan) Limited (investment adviser firm), FMR Investment Management (U.K.) Limited (investment adviser firm), Fidelity Management & Research (Hong Kong) (investment adviser firm), Fidelity Management & Research Company (investment adviser firm), FIAM LLC (investment adviser firm), and Strategic Advisers, Inc. (investment adviser firm), Ballyrock Investment Advisors LLC, and Northern Neck Investors LLC (2012-present). Previously, Ms. Wondrack served as Senior Vice President and Chief Compliance Officer for Columbia Management Investment Advisers, LLC (2005-2012); Chief Compliance Officer for certain funds within the Columbia Family of Funds (2007-2012); and Senior Vice President of Compliance Risk Management at Bank of America (2005-2010).
Joseph F. Zambello (1957)
Year of Election or Appointment: 2011
Deputy Treasurer
Mr. Zambello also serves as Deputy Treasurer of other funds. Mr. Zambello is an employee of Fidelity Investments (1991-present). Previously, Mr. Zambello served as Vice President of the Program Management Group of FMR (investment adviser firm, 2009-2011) and Vice President of the Transfer Agent Oversight Group (2005-2009).
Shareholder Expense Example
As a shareholder of the Fund, you incur two types of costs: (1) transaction costs, including sales charges (loads) on purchase payments or redemption proceeds, and (2) ongoing costs, including management fees, distribution and/or service (12b-1) fees and other Fund expenses. This Example is intended to help you understand your ongoing costs (in dollars) of investing in the Fund and to compare these costs with the ongoing costs of investing in other mutual funds.
The Example is based on an investment of $1,000 invested at the beginning of the period and held for the entire period (May 1, 2015 to October 31, 2015).
Actual Expenses
The first line of the accompanying table for each class of the Fund provides information about actual account values and actual expenses. You may use the information in this line, together with the amount you invested, to estimate the expenses that you paid over the period. Simply divide your account value by $1,000.00 (for example, an $8,600 account value divided by $1,000.00 = 8.6), then multiply the result by the number in the first line for a class of the Fund under the heading entitled "Expenses Paid During Period" to estimate the expenses you paid on your account during this period. In addition, the Fund, as a shareholder in the underlying Fidelity Central Funds, will indirectly bear its pro-rata share of the fees and expenses incurred by the underlying Fidelity Central Funds. These fees and expenses are not included in the Fund's annualized expense ratio used to calculate the expense estimate in the table below.
Hypothetical Example for Comparison Purposes
The second line of the accompanying table for each class of the Fund provides information about hypothetical account values and hypothetical expenses based on a Class' actual expense ratio and an assumed rate of return of 5% per year before expenses, which is not the Class' actual return. The hypothetical account values and expenses may not be used to estimate the actual ending account balance or expenses you paid for the period. You may use this information to compare the ongoing costs of investing in the Fund and other funds. To do so, compare this 5% hypothetical example with the 5% hypothetical examples that appear in the shareholder reports of the other funds. In addition, the Fund, as a shareholder in the underlying Fidelity Central Funds, will indirectly bear its pro-rata share of the fees and expenses incurred by the underlying Fidelity Central Funds. These fees and expenses are not included in the Fund's annualized expense ratio used to calculate the expense estimate in the table below.
Please note that the expenses shown in the table are meant to highlight your ongoing costs only and do not reflect any transaction costs. Therefore, the second line of the table is useful in comparing ongoing costs only, and will not help you determine the relative total costs of owning different funds. In addition, if these transactional costs were included, your costs would have been higher.
| | Annualized Expense Ratio-A | Beginning
Account Value
May 1, 2015 | Ending
Account Value
October 31, 2015 | Expenses Paid
During Period-B
May 1, 2015
to October 31, 2015 |
| Class A | 1.25% | | | |
| Actual | | $1,000.00 | $972.60 | $6.22 |
| Hypothetical-C | | $1,000.00 | $1,018.90 | $6.36 |
| Class T | 1.50% | | | |
| Actual | | $1,000.00 | $971.40 | $7.45 |
| Hypothetical-C | | $1,000.00 | $1,017.64 | $7.63 |
| Class B | 2.00% | | | |
| Actual | | $1,000.00 | $969.20 | $9.93 |
| Hypothetical-C | | $1,000.00 | $1,015.12 | $10.16 |
| Class C | 2.00% | | | |
| Actual | | $1,000.00 | $969.50 | $9.93 |
| Hypothetical-C | | $1,000.00 | $1,015.12 | $10.16 |
| Class I | 1.00% | | | |
| Actual | | $1,000.00 | $974.00 | $4.98 |
| Hypothetical-C | | $1,000.00 | $1,020.16 | $5.09 |
A Annualized expense ratio reflects expenses net of applicable fee waivers.
B Expenses are equal to each Class' annualized expense ratio, multiplied by the average account value over the period, multiplied by 184/365 (to reflect the one-half year period).
C 5% return per year before expenses
Distributions (Unaudited)
The Board of Trustees of Fidelity Advisor Value Leaders Fund voted to pay to shareholders of record at the opening of business on record date, the following distributions per share derived from capital gains realized from sales of portfolio securities, and dividends derived from net investment income:
| | Pay Date | Record Date | Dividends | Capital Gains |
| Class I | 12/07/15 | 12/04/15 | $0.309 | $0.017 |
Class I designates 100% of the dividends distributed during the fiscal year as qualifying for the dividends-received deduction for corporate shareholders.
Class I designates 100% of the dividends distributed during the fiscal year as amounts which may be taken into account as a dividend for the purposes of the maximum rate under section 1(h)(11) of the Internal Revenue Code.
The fund will notify shareholders in January 2016 of amounts for use in preparing 2015 income tax returns.
Board Approval of Investment Advisory Contracts and Management Fees
Fidelity Advisor Value Leaders Fund
Each year, the Board of Trustees, including the Independent Trustees (together, the Board), votes on the renewal of the management contract with Fidelity Management & Research Company (FMR) and the sub-advisory agreements (together, the Advisory Contracts) for the fund. The Board, assisted by the advice of fund counsel and Independent Trustees' counsel, requests and considers a broad range of information relevant to the renewal of the Advisory Contracts throughout the year.
The Board meets regularly and, at each of its meetings, covers an extensive agenda of topics and materials and considers factors that are relevant to its annual consideration of the renewal of the fund's Advisory Contracts, including the services and support provided to the fund and its shareholders. The Board has established various standing committees (Committees), each composed of and chaired by Independent Trustees with varying backgrounds, to which the Board has assigned specific subject matter responsibilities in order to enhance effective decision-making by the Board. The Board, acting directly and through its Committees, requests and receives information concerning the annual consideration of the renewal of the fund's Advisory Contracts. The Board also meets as needed to consider matters specifically related to the Board's annual consideration of the renewal of the Advisory Contracts. Members of the Board may also meet with trustees of other Fidelity funds through ad hoc joint committees to discuss certain matters relevant to all of the Fidelity funds.
At its July 2015 meeting, the Board unanimously determined to renew the fund's Advisory Contracts. In reaching its determination, the Board considered all factors it believed relevant, including (i) the nature, extent, and quality of the services to be provided to the fund and its shareholders (including the investment performance of the fund); (ii) the competitiveness of the fund's management fee and total expense ratio relative to peer funds; (iii) the total costs of the services to be provided by and the profits to be realized by Fidelity from its relationship with the fund; and (iv) the extent to which (if any) economies of scale exist and would be realized as the fund grows, and whether any economies of scale are appropriately shared with fund shareholders.
In considering whether to renew the Advisory Contracts for the fund, the Board reached a determination, with the assistance of fund counsel and Independent Trustees' counsel and through the exercise of its business judgment, that the renewal of the Advisory Contracts was in the best interests of the fund and its shareholders and that the compensation payable under the Advisory Contracts was fair and reasonable. The Board's decision to renew the Advisory Contracts was not based on any single factor, but rather was based on a comprehensive consideration of all the information provided to the Board at its meetings throughout the year. The Board, in reaching its determination to renew the Advisory Contracts, was aware that shareholders of the fund have a broad range of investment choices available to them, including a wide choice among funds offered by Fidelity's competitors, and that the fund's shareholders, who have the opportunity to review and weigh the disclosure provided by the fund in its prospectus and other public disclosures, have chosen to invest in this fund, which is part of the Fidelity family of funds.
Nature, Extent, and Quality of Services Provided. The Board considered Fidelity's staffing as it relates to the fund, including the backgrounds of investment personnel of Fidelity, and also considered the fund's investment objective, strategies, and related investment philosophy. The Independent Trustees also had discussions with senior management of Fidelity's investment operations and investment groups. The Board considered the structure of the portfolio manager compensation program and whether this structure provides appropriate incentives to act in the best interests of the fund. Additionally, the Board considered the portfolio managers' investments, if any, in the funds that they manage.
Resources Dedicated to Investment Management and Support Services. The Board and the Fund Oversight and Research Committees reviewed the general qualifications and capabilities of Fidelity's investment staff, including its size, education, experience, and resources, as well as Fidelity's approach to recruiting, training, managing, and compensating investment personnel. The Board noted that Fidelity has continued to increase the resources devoted to non-U.S. offices, including expansion of Fidelity's global investment organization. The Board also noted that Fidelity's analysts have extensive resources, tools and capabilities that allow them to conduct sophisticated quantitative and fundamental analysis, as well as credit analysis of issuers, counterparties and guarantors. Further, the Board considered that Fidelity's investment professionals have sufficient access to global information and data so as to provide competitive investment results over time, and that those professionals also have access to sophisticated tools that permit them to assess portfolio construction and risk and performance attribution characteristics continuously, as well as to transmit new information and research conclusions rapidly around the world. Additionally, in its deliberations, the Board considered Fidelity's trading, risk management, and compliance capabilities and resources, which are integral parts of the investment management process.
Shareholder and Administrative Services. The Board considered (i) the nature, extent, quality, and cost of advisory, administrative, and shareholder services performed by FMR, the sub-advisers (together with FMR, the Investment Advisers), and their affiliates under the Advisory Contracts and under separate agreements covering transfer agency, pricing and bookkeeping, and securities lending services for the fund; (ii) the nature and extent of the supervision of third party service providers, principally custodians and subcustodians; and (iii) the resources devoted to, and the record of compliance with, the fund's compliance policies and procedures. The Board also reviewed the allocation of fund brokerage, including allocations to brokers affiliated with the Investment Advisers, the use of brokerage commissions to pay fund expenses, and the use of "soft" commission dollars to pay for research services.
The Board noted that the growth of fund assets over time across the complex allows Fidelity to reinvest in the development of services designed to enhance the value or convenience of the Fidelity funds as investment vehicles. These services include 24-hour access to account information and market information through telephone representatives and over the Internet, investor education materials and asset allocation tools, and the expanded availability of Fidelity Investor Centers.
In 2014, the Board formed an ad hoc Committee on Transfer Agency Fees to review the variety of transfer agency fee structures throughout the industry and Fidelity's competitive positioning with respect to industry participants.
Investment in a Large Fund Family. The Board considered the benefits to shareholders of investing in a Fidelity fund, including the benefits of investing in a fund that is part of a large family of funds offering a variety of investment disciplines and providing a large variety of mutual fund investor services. The Board noted that Fidelity had taken, or had made recommendations that resulted in the Fidelity funds taking, a number of actions over the previous year that benefited particular funds, including (i) continuing to dedicate additional resources to investment research and to the support of the senior management team that oversees asset management; (ii) continuing efforts to enhance Fidelity's global research capabilities; (iii) launching new funds and making other enhancements to meet client needs; (iv) reducing management fees and total expenses for certain index funds and diversified international funds; (v) continuing to launch dedicated lower cost underlying funds to meet portfolio construction needs related to expanding underlying fund options for Fidelity funds of funds, specifically for the Freedom Fund product lines; (vi) rationalizing product lines and gaining increased efficiencies through fund mergers; (vii) launching active fixed-income exchange-traded funds; (viii) continuing to develop, acquire and implement systems and technology to improve services to the funds and information security and to increase efficiency; (ix) implementing investment enhancements to further strengthen Fidelity's target date product line to increase investors' probability of success in achieving their goals; (x) modifying the eligibility criteria for certain share classes to accommodate roll-over assets from employer-sponsored retirement plans; (xi) launching a new Class W of the Freedom Index Funds to attract and retain Fidelity record-kept retirement plan assets; and (xii) implementing changes to Fidelity's money market product line in response to recent money market regulatory reforms.
Investment Performance. The Board considered whether the fund has operated in accordance with its investment objective, as well as its record of compliance with its investment restrictions and its performance history. The Board noted that there was a portfolio management change for the fund in September 2014.
The Board took into account discussions with representatives of the Investment Advisers about fund investment performance that occur at Board meetings throughout the year. In this regard the Board noted that as part of regularly scheduled fund reviews and other reports to the Board on fund performance, the Board considers annualized return information for the fund, for different time periods, measured against a securities market index ("benchmark index") and a peer group of funds with similar objectives ("peer group"), if any. In its evaluation of fund investment performance, the Board gave particular attention to information indicating changes in performance of certain Fidelity funds for specific time periods and discussed with the Investment Advisers the reasons for any overperformance or underperformance.
In addition to reviewing absolute and relative fund performance, the Independent Trustees periodically consider the appropriateness of fund performance metrics in evaluating the results achieved. In general, the Independent Trustees believe that fund performance should be evaluated based on net performance (after fees and expenses) of both the highest performing and lowest performing fund share classes, where applicable, compared to appropriate benchmark indices, over appropriate time periods that may include full market cycles, and compared to peer groups, as applicable, over the same periods, taking into account relevant factors including the following: general market conditions; issuer-specific information; and fund cash flows and other factors.
The Independent Trustees recognize that shareholders evaluate performance on a net basis over their own holding periods, for which one-, three-, and five-year periods are often used as a proxy. For this reason, the performance information reviewed by the Board also included net cumulative calendar year total return information for the fund and an appropriate benchmark index and peer group for the most recent one-, three-, and five-year periods, as shown below. Returns are shown compared to the 25th percentile (top of box, 75% beaten) and 75th percentile (bottom of box, 25% beaten) of the peer universe.
Fidelity Advisor Value Leaders Fund
The Board also considered that the fund's management fee is subject to upward or downward adjustment depending upon whether, and to what extent, the fund's investment performance for the performance period exceeds, or is exceeded by, a securities index, thus leading to a performance adjustment for the same period. The Board noted that the performance adjustment provides FMR with a strong economic incentive to seek to achieve superior performance for the fund's shareholders and helps to more closely align the interests of FMR and the shareholders of the fund.
Based on its review, the Board concluded that the nature, extent, and quality of services provided to the fund under the Advisory Contracts should benefit the shareholders of the fund.
Competitiveness of Management Fee and Total Expense Ratio. The Board considered the fund's management fee and total expense ratio compared to "mapped groups" of competitive funds and classes created for the purpose of facilitating the Trustees' competitive analysis of management fees and total expenses. Fidelity creates "mapped groups" by combining similar Lipper investment objective categories that have comparable investment mandates. Combining Lipper investment objective categories aids the Board's management fee and total expense ratio comparisons by broadening the competitive group used for comparison.
Management Fee. The Board considered two proprietary management fee comparisons for the 12-month periods shown in basis points (BP) in the chart below. The group of Lipper funds used by the Board for management fee comparisons is referred to below as the "Total Mapped Group." The Total Mapped Group comparison focuses on a fund's standing in terms of gross management fees before expense reimbursements or caps, and without giving effect to the fund's performance adjustment, relative to the total universe of funds with comparable investment mandates, regardless of whether their management fee structures also are comparable. Funds with comparable investment mandates offer exposure to similar types of securities. Funds with comparable management fee structures have similar management fee contractual arrangements (
e.g., flat rate charged for advisory services, all-inclusive fee rate,
etc.). "TMG %" represents the percentage of funds in the Total Mapped Group that had management fees that were lower than the fund's. For example, a hypothetical TMG % of 20% would mean that 80% of the funds in the Total Mapped Group had higher, and 20% had lower, management fees than the fund. The fund's actual TMG %s and the number of funds in the Total Mapped Group are in the chart below. The "Asset-Size Peer Group" (ASPG) comparison focuses on a fund's standing relative to a subset of non-Fidelity funds within the Total Mapped Group that are similar in size and management fee structure without taking into account performance adjustments, if any. For example, if a fund is in the first quartile of the ASPG, the fund's management fee ranks in the least expensive or lowest 25% of funds in the ASPG. The ASPG represents at least 15% of the funds in the Total Mapped Group with comparable asset size and management fee structures, subject to a minimum of 50 funds (or all funds in the Total Mapped Group if fewer than 50). Additional information, such as the ASPG quartile in which the fund's management fee rate ranked and the impact of the fund's performance adjustment, is also included in the chart and considered by the Board.
Fidelity Advisor Value Leaders Fund
The Board noted that the fund's management fee rate ranked below the median of its Total Mapped Group and below the median of its ASPG for 2014. The Board also noted the effect of the fund's performance adjustment, if any, on the fund's management fee ranking.
The Board noted that, in 2014, the ad hoc Committee on Group Fee was formed by it and other Fidelity fund boards to conduct an in-depth review of the "group fee" component of the management fee of funds with such management fee structures. Committee focus included the mechanics of the group fee, the competitive landscape of group fee structures, Fidelity funds with no group fee component and investment products not included in group fee assets. The Board also considered that, for funds subject to the group fee, FMR agreed to voluntarily waive fees over a specified period of time in amounts designed to account for assets converted from certain funds to certain collective investment trusts.
The Board also noted that, in 2013, the ad hoc Committee on Management Fees was formed to conduct an in-depth review of the management fee rates of Fidelity's active equity mutual funds. The Committee focused on the following areas: (i) standard fee structures; (ii) research consumption and trading evolution; (iii) management fee competitiveness/profitability by category; and (iv) factors that drive institutional pricing.
Based on its review, the Board concluded that the fund's management fee is fair and reasonable in light of the services that the fund receives and the other factors considered.
Total Expense Ratio. In its review of each class's total expense ratio, the Board considered the fund's management fee as well as other fund or class expenses, as applicable, such as transfer agent fees, pricing and bookkeeping fees, fund-paid 12b-1 fees, and custodial, legal, and audit fees. The Board noted the impact of the fund's performance adjustment. The Board also noted that Fidelity may agree to waive fees and expenses from time to time, and the extent to which, if any, it has done so for the fund. As part of its review, the Board also considered the current and historical total expense ratios of each class of the fund compared to competitive fund median expenses. Each class of the fund is compared to those funds and classes in the Total Mapped Group (used by the Board for management fee comparisons) that have a similar sales load structure.
The Board noted that the total expense ratio of each class ranked above its competitive median for 2014. The Board considered that, in general, various factors can affect total expense ratios. The Board noted that the total expense ratio of Class T was above the competitive median primarily because of higher 12b-1 fees on Class T as compared to most competitor funds. Class T has a higher 12b-1 fee, but a lower front-end sales charge, than traditionally priced front-end sales charge classes. The Board considered that Class T is primarily sold load-waived in the retirement plan market where its 0.50% 12bfee is comparable to competing no-load, higher 12b1 fee classes designed specifically for retirement plans. The Board noted that the fund offers multiple classes, each of which has a different sales load and 12b-1 fee structure, and that the multiple structures are intended to offer a range of pricing options for the intermediary market. The Board also noted that the total expense ratios of the classes vary primarily by the level of their 12b-1 fees, although differences in transfer agent fees may also cause expenses to vary from class to class.
Fees Charged to Other Fidelity Clients. The Board also considered Fidelity fee structures and other information with respect to clients of Fidelity, such as other funds advised or subadvised by Fidelity, pension plan clients, and other institutional clients with similar mandates. The Board noted the findings of the 2013 ad hoc joint committee (created with the board of other Fidelity funds), which reviewed and compared Fidelity's institutional investment advisory business with its business of providing services to the Fidelity funds, including the differences in services provided, fees charged, and costs incurred, as well as competition in their respective marketplaces.
Based on its review of total expense ratios and fees charged to other Fidelity clients, the Board concluded that, although in all cases above the median of the universe presented for comparison, the total expense ratio of each class of the fund was reasonable in light of the services that the fund and its shareholders receive and the other factors considered.
Costs of the Services and Profitability. The Board considered the revenues earned and the expenses incurred by Fidelity in conducting the business of developing, marketing, distributing, managing, administering and servicing the fund and servicing the fund's shareholders. The Board also considered the level of Fidelity's profits in respect of all the Fidelity funds.
On an annual basis, Fidelity presents to the Board information about the profitability of its relationship with the fund. Fidelity calculates profitability information for each fund, as well as aggregate profitability information for groups of Fidelity funds and all Fidelity funds, using a series of detailed revenue and cost allocation methodologies which originate with the books and records of Fidelity on which Fidelity's audited financial statements are based. The Audit Committee of the Board reviews any significant changes from the prior year's methodologies.
PricewaterhouseCoopers LLP (PwC), independent registered public accounting firm and auditor to Fidelity and certain Fidelity funds, has been engaged annually by the Board as part of the Board's assessment of Fidelity's profitability analysis. PwC's engagement includes the review and assessment of the methodologies used by Fidelity in determining the revenues and expenses attributable to Fidelity's mutual fund business, and completion of agreed-upon procedures in respect of the mathematical accuracy of fund profitability and its conformity to established allocation methodologies. After considering PwC's reports issued under the engagement and information provided by Fidelity, the Board concluded that while other allocation methods may also be reasonable, Fidelity's profitability methodologies are reasonable in all material respects.
The Board also reviewed Fidelity's non-fund businesses and fall-out benefits related to the mutual fund business as well as cases where Fidelity's affiliates may benefit from or be related to the fund's business.
The Board considered the costs of the services provided by and the profits realized by Fidelity in connection with the operation of the fund and was satisfied that the profitability was not excessive.
Economies of Scale. The Board considered whether there have been economies of scale in respect of the management of the Fidelity funds, whether the Fidelity funds (including the fund) have appropriately benefited from any such economies of scale, and whether there is potential for realization of any further economies of scale. The Board considered the extent to which the fund will benefit from economies of scale as assets grow through increased services to the fund, through waivers or reimbursements, or through fee or expense ratio reductions. The Board also noted that in 2013, it and the boards of other Fidelity funds created an ad hoc committee (the Economies of Scale Committee) to analyze whether Fidelity attains economies of scale in respect of the management and servicing of the Fidelity funds, whether the Fidelity funds have appropriately benefited from such economies of scale, and whether there is potential for realization of any further economies of scale.
The Board recognized that the fund's management contract incorporates a "group fee" structure, which provides for lower group fee rates as total group assets increase, and for higher group fee rates as total group assets decrease (with "group assets" defined to include fund assets under FMR's management plus sector fund assets previously under FMR's management and currently managed by Fidelity SelectCo, LLC). FMR calculates the group fee rates based on a tiered asset "breakpoint" schedule that varies based on asset class. The Board considered that the group fee is designed to deliver the benefits of economies of scale to fund shareholders when total Fidelity fund assets increase, even if assets of any particular fund are unchanged or have declined, because some portion of Fidelity's costs are attributable to services provided to all Fidelity funds, and all funds benefit if those costs can be allocated among more assets. The Board concluded that, given the group fee structure, fund shareholders will benefit from lower management fees as group assets increase at the fund complex level, regardless of whether Fidelity achieves any such economies of scale.
The Board concluded, taking into account the analysis of the Economies of Scale Committee, that economies of scale, if any, are being appropriately shared between fund shareholders and Fidelity.
Additional Information Requested by the Board. In order to develop fully the factual basis for consideration of the Fidelity funds' Advisory Contracts, the Board requested and received additional information on certain topics, including: (i) fund performance trends and Fidelity's long-term strategies for certain funds; (ii) the various share classes employed by Fidelity and the attributes of each class, together with similar information on the distribution and servicing payments made by Fidelity or the funds to third-party participants in the distribution channels; (iii) fund profitability, and fund performance in relation to fund profitability; (iv) the methodology with respect to evaluating competitive fund data and peer group classifications and fee comparisons; (v) annual fund profitability margins, with particular focus on certain funds with negative margins; (vi) the realization of fall-out benefits in certain Fidelity business units;
(vii) economies of scale and the way in which they are shared with fund shareholders;(viii) Fidelity's group fee structures, including the group fee schedule of breakpoints;(ix) the impact of cost containment measures on the funds; and (x) the transfer agent fee structure.
Based on its evaluation of all of the conclusions noted above, and after considering all factors it believed relevant, the Board concluded that the advisory fee structures are fair and reasonable, and that the fund's Advisory Contracts should be renewed.
AVLFI-ANN-1215
1.793581.112
Item 2.
Code of Ethics
As of the end of the period, October 31, 2015, Fidelity Advisor Series VIII (the trust) has adopted a code of ethics, as defined in Item 2 of Form N-CSR, that applies to its President and Treasurer and its Chief Financial Officer. A copy of the code of ethics is filed as an exhibit to this Form N-CSR.
Item 3.
Audit Committee Financial Expert
The Board of Trustees of the trust has determined that Joseph Mauriello is an audit committee financial expert, as defined in Item 3 of Form N-CSR. Mr. Mauriello is independent for purposes of Item 3 of Form N-CSR.
Item 4.
Principal Accountant Fees and Services
Fees and Services
The following table presents fees billed by Deloitte & Touche LLP, the member firms of Deloitte Touche Tohmatsu, and their respective affiliates (collectively, “Deloitte Entities”) in each of the last two fiscal years for services rendered to Fidelity Advisor Emerging Markets Fund and Fidelity Advisor International Capital Appreciation Fund (the “Funds”):
Services Billed by Deloitte Entities
October 31, 2015 FeesA
| | | | |
| Audit Fees | Audit-Related Fees | Tax Fees | All Other Fees |
Fidelity Advisor Emerging Markets Fund | $46,000 | $- | $6,900 | $700 |
Fidelity Advisor International Capital Appreciation Fund | $53,000 | $- | $7,400 | $700 |
| | | | |
| Audit Fees | Audit-Related Fees | Tax Fees | All Other Fees |
Fidelity Advisor Emerging Markets Fund | $44,000 | $- | $6,900 | $700 |
Fidelity Advisor International Capital Appreciation Fund | $50,000 | $- | $6,900 | $600 |
A Amounts may reflect rounding.
The following table presents fees billed by PricewaterhouseCoopers LLP (“PwC”) in each of the last two fiscal years for services rendered to Fidelity Advisor Diversified International Fund, Fidelity Advisor Emerging Asia Fund, Fidelity Advisor Global Capital Appreciation Fund, Fidelity Advisor Global Equity Income Fund, Fidelity Advisor Overseas Fund, and Fidelity Advisor Value Leaders Fund (the “Funds”):
Services Billed by PwC
October 31, 2015 FeesA
| | | | |
| Audit Fees | Audit-Related Fees | Tax Fees | All Other Fees |
Fidelity Advisor Diversified International Fund | $60,000 | $- | $19,000 | $2,400 |
Fidelity Advisor Emerging Asia Fund | $67,000 | $- | $5,200 | $1,900 |
Fidelity Advisor Global Capital Appreciation Fund | $59,000 | $- | $5,700 | $1,800 |
Fidelity Advisor Global Equity Income Fund | $51,000 | $- | $5,400 | $1,700 |
Fidelity Advisor Overseas Fund | $67,000 | $- | $28,400 | $2,000 |
Fidelity Advisor Value Leaders Fund | $46,000 | $- | $4,400 | $1,800 |
| | | | |
| Audit Fees | Audit-Related Fees | Tax Fees | All Other Fees |
Fidelity Advisor Diversified International Fund | $57,000 | $- | $9,000 | $2,300 |
Fidelity Advisor Emerging Asia Fund | $64,000 | $- | $5,300 | $1,800 |
Fidelity Advisor Global Capital Appreciation Fund | $56,000 | $- | $5,600 | $1,700 |
Fidelity Advisor Global Equity Income Fund | $48,000 | $- | $6,100 | $1,200 |
Fidelity Advisor Overseas Fund | $65,000 | $- | $6,300 | $1,900 |
Fidelity Advisor Value Leaders Fund | $43,000 | $- | $4,500 | $1,700 |
A Amounts may reflect rounding.
The following table presents fees billed by PwC and Deloitte Entities that were required to be approved by the Audit Committee for services that relate directly to the operations and financial reporting of the Funds and that are rendered on behalf of Fidelity Management & Research Company (“FMR”) and entities controlling, controlled by, or under common control with FMR (not including any sub-adviser whose role is primarily portfolio management and is subcontracted with or overseen by another investment adviser) that provide ongoing services to the Funds (“Fund Service Providers”):
Services Billed by Deloitte Entities
| | |
| October 31, 2015A | October 31, 2014A |
Audit-Related Fees | $- | $150,000 |
Tax Fees | $10,000 | $- |
All Other Fees | $60,000 | $590,000 |
A Amounts may reflect rounding.
Services Billed by PwC
| | |
| October 31, 2015A | October 31, 2014A |
Audit-Related Fees | $3,465,000 | $4,430,000 |
Tax Fees | $- | $- |
All Other Fees | $- | $- |
A Amounts may reflect rounding.
“Audit-Related Fees” represent fees billed for assurance and related services that are reasonably related to the performance of the fund audit or the review of the fund's financial statements and that are not reported under Audit Fees.
“Tax Fees” represent fees billed for tax compliance, tax advice or tax planning that relate directly to the operations and financial reporting of the fund.
“All Other Fees” represent fees billed for services provided to the fund or Fund Service Provider, a significant portion of which are assurance related, that relate directly to the operations and financial reporting of the fund, excluding those services that are reported under Audit Fees, Audit-Related Fees or Tax Fees.
Assurance services must be performed by an independent public accountant.
* * *
The aggregate non-audit fees billed by PwC and Deloitte Entities for services rendered to the Funds, FMR (not including any sub-adviser whose role is primarily portfolio management and is subcontracted with or overseen by another investment adviser), and any Fund Service Provider for each of the last two fiscal years of the Funds are as follows:
| | |
Billed By | October 31, 2015 A | October 31, 2014 A |
PwC | $4,845,000 | $5,690,000 |
Deloitte Entities | $185,000 | $1,840,000 |
A Amounts may reflect rounding.
The trust's Audit Committee has considered non-audit services that were not pre-approved that were provided by PwC and Deloitte Entities to Fund Service Providers to be compatible with maintaining the independence of PwC and Deloitte Entities in their audits of the Funds, taking into account representations from PwC and Deloitte Entities, in accordance with Public Company Accounting Oversight Board rules, regarding their independence from the Funds and their related entities and FMR’s review of the appropriateness and permissibility under applicable law of such non-audit services prior to their provision to the Fund Service Providers.
Audit Committee Pre-Approval Policies and Procedures
The trust’s Audit Committee must pre-approve all audit and non-audit services provided by a fund’s independent registered public accounting firm relating to the operations or financial reporting of the fund. Prior to the commencement of any audit or non-audit services to a fund, the Audit Committee reviews the services to determine whether they are appropriate and permissible under applicable law.
The Audit Committee has adopted policies and procedures to, among other purposes, provide a framework for the Committee’s consideration of non-audit services by the audit firms that audit the Fidelity funds. The policies and procedures require that any non-audit service provided by a fund audit firm to a Fidelity fund and any non-audit service provided by a fund auditor to a Fund Service Provider that relates directly to the operations and financial reporting of a Fidelity fund (“Covered Service”) are subject to approval by the Audit Committee before such service is provided.
All Covered Services must be approved in advance of provision of the service either: (i) by formal resolution of the Audit Committee, or (ii) by oral or written approval of the service by the Chair of the Audit Committee (or if the Chair is unavailable, such other member of the Audit Committee as may be designated by the Chair to act in the Chair’s absence). The approval contemplated by (ii) above is permitted where the Treasurer determines that action on such an engagement is necessary before the next meeting of the Audit Committee.
Non-audit services provided by a fund audit firm to a Fund Service Provider that do not relate directly to the operations and financial reporting of a Fidelity fund are reported to the Audit Committee on a periodic basis.
Non-Audit Services Approved Pursuant to Rule 2-01(c)(7)(i)(C) and (ii) of Regulation S-X (“De Minimis Exception”)
There were no non-audit services approved or required to be approved by the Audit Committee pursuant to the De Minimis Exception during the Funds’ last two fiscal years relating to services provided to (i) the Funds or (ii) any Fund Service Provider that relate directly to the operations and financial reporting of the Funds.
Item 5.
Audit Committee of Listed Registrants
Not applicable.
Item 6.
Investments
(a)
Not applicable.
(b)
Not applicable
Item 7.
Disclosure of Proxy Voting Policies and Procedures for Closed-End Management Investment Companies
Not applicable.
Item 8.
Portfolio Managers of Closed-End Management Investment Companies
Not applicable.
Item 9.
Purchase of Equity Securities by Closed-End Management Investment Company and Affiliated Purchasers
Not applicable.
Item 10.
Submission of Matters to a Vote of Security Holders
There were no material changes to the procedures by which shareholders may recommend nominees to the trust’s Board of Trustees.
Item 11.
Controls and Procedures
(a)(i) The President and Treasurer and the Chief Financial Officer have concluded that the trust’s disclosure controls and procedures (as defined in Rule 30a-3(c) under the Investment Company Act) provide reasonable assurances that material information relating to the trust is made known to them by the appropriate persons, based on their evaluation of these controls and procedures as of a date within 90 days of the filing date of this report.
(a)(ii) There was no change in the trust’s internal control over financial reporting (as defined in Rule 30a-3(d) under the Investment Company Act) that occurred during the second fiscal quarter of the period covered by this report that has materially affected, or is reasonably likely to materially affect, the trust’s internal control over financial reporting.
Item 12.
Exhibits
| | |
(a) | (1) | Code of Ethics pursuant to Item 2 of Form N-CSR is filed and attached hereto as EX-99.CODE ETH. |
(a) | (2) | Certification pursuant to Rule 30a-2(a) under the Investment Company Act of 1940 (17 CFR 270.30a-2(a)) is filed and attached hereto as Exhibit 99.CERT. |
(a) | (3) | Not applicable. |
(b) | | Certification pursuant to Rule 30a-2(b) under the Investment Company Act of 1940 (17 CFR 270.30a-2(b)) is furnished and attached hereto as Exhibit 99.906CERT. |
SIGNATURES
Pursuant to the requirements of the Securities Exchange Act of 1934 and the Investment Company Act of 1940, the registrant has duly caused this report to be signed on its behalf by the undersigned, thereunto duly authorized.
Fidelity Advisor Series VIII
| |
By: | /s/Kenneth B. Robins |
| Kenneth B. Robins |
| President and Treasurer |
| |
Date: | December 28, 2015 |
Pursuant to the requirements of the Securities Exchange Act of 1934 and the Investment Company Act of 1940, this report has been signed below by the following persons on behalf of the registrant and in the capacities and on the dates indicated.
| |
By: | /s/Kenneth B. Robins |
| Kenneth B. Robins |
| President and Treasurer |
| |
Date: | December 28, 2015 |
| |
By: | /s/Howard J. Galligan III |
| Howard J. Galligan III |
| Chief Financial Officer |
| |
Date: | December 28, 2015 |