Exhibit 99.6

THOR INVESTOR DAY 2019 | NORTH AMERICAN RV MARKET Bad Waldsee , 14 October 2019
10 - 14 - 2019 THOR INVESTOR DAY 2019 2 Forward Looking Statements This presentation includes certain statements that are “forward looking” statements within the meaning of the U . S . Private Securities Litigation Reform Act of 1995 , Section 27 A of the Securities Act of 1933 , as amended, and Section 21 E of the Securities Exchange Act of 1934 , as amended . These forward looking statements are made based on management’s current expectations and beliefs regarding future and anticipated developments and their effects upon Thor, and inherently involve uncertainties and risks . These forward looking statements are not a guarantee of future performance . We cannot assure you that actual results will not differ materially from our expectations . Factors which could cause materially different results include, among others, raw material and commodity price fluctuations ; raw material, commodity or chassis supply restrictions ; the impact of tariffs on material or other input costs ; the level and magnitude of warranty claims incurred ; legislative, regulatory and tax law and/or policy developments including their potential impact on our dealers and their retail customers or on our suppliers ; the costs of compliance with governmental regulation ; legal and compliance issues including those that may arise in conjunction with recently completed transactions ; lower consumer confidence and the level of discretionary consumer spending ; interest rate fluctuations ; the potential impact of interest rate fluctuations on the general economy and specifically on our dealers and consumers ; restrictive lending practices ; management changes ; the success of new and existing products and services ; consumer preferences ; the ability to efficiently utilize production facilities ; the pace of acquisitions and the successful closing, integration and financial impact thereof ; the potential loss of existing customers of acquisitions ; our ability to retain key management personnel of acquired companies ; a shortage of necessary personnel for production ; the loss or reduction of sales to key dealers ; disruption of the delivery of units to dealers ; increasing costs for freight and transportation ; asset impairment charges ; cost structure changes ; competition ; the impact of potential losses under repurchase or financed receivable agreements ; the potential impact of the strength of the U . S . dollar on international demand for products priced in U . S . dollars ; general economic, market and political conditions ; the impact of changing emissions standards in the various jurisdictions in which our products are sold ; and changes to investment and capital allocation strategies or other facets of our strategic plan . Additional risks and uncertainties surrounding the acquisition of EHG include risks regarding the potential benefits of the acquisition and the anticipated operating value creation, the integration of the business, the impact of exchange rate fluctuations and unknown or understated liabilities related to the acquisition and EHG's business . These and other risks and uncertainties are discussed more fully in Item 1 A of our Annual Report on Form 10 - K for the year ended July 31 , 2019 . We disclaim any obligation or undertaking to disseminate any updates or revisions to any forward looking statements contained in this presentation or to reflect any change in our expectations after the date hereof or any change in events, conditions or circumstances on which any statement is based, except as required by law .
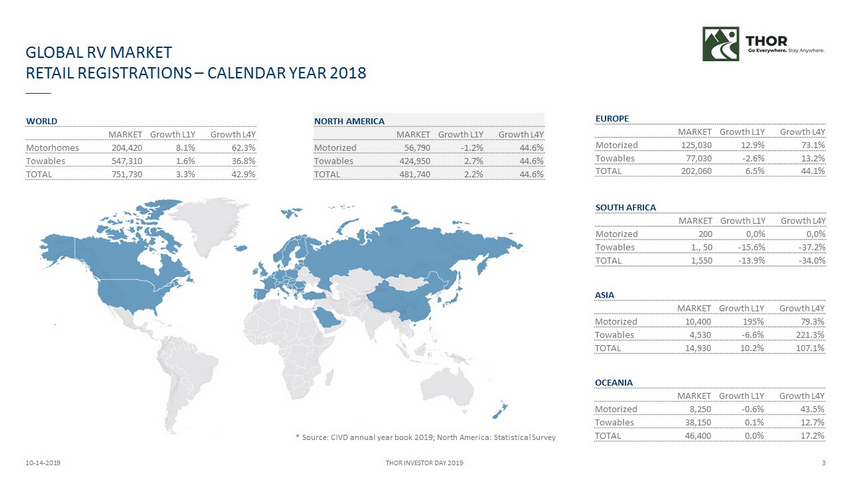
GLOBAL RV MARKET RETAIL REGISTRATIONS – CALENDAR YEAR 20 18 10 - 14 - 2019 THOR INVESTOR DAY 2019 3 EUROPE MARKET Growth L1Y Growth L4Y Motorized 125,030 12.9 % 73.1 % Towables 77,030 - 2.6 % 13.2 % TOTAL 202,060 6.5 % 44.1 % ASIA MARKET Growth L1Y Growth L4Y Motorized 10,400 195 % 79.3% Towables 4,530 - 6.6 % 221.3 % TOTAL 14,930 10.2 % 107.1 % OCEANIA MARKET Growth L1Y Growth L4Y Motorized 8,250 - 0.6 % 43.5% Towables 38,150 0.1 % 12.7 % TOTAL 46,400 0.0 % 17.2 % SOUTH AFRICA MARKET Growth L1Y Growth L4Y Motorized 200 0,0% 0,0% Towables 1 ., 50 - 15.6 % - 37.2 % TOTAL 1,550 - 13.9 % - 34.0 % WORLD MARKET Growth L1Y Growth L4Y Motorhomes 204,420 8.1 % 62.3 % Towables 547,310 1.6 % 36.8 % TOTAL 751,730 3.3 % 42.9% NORTH AMERICA MARKET Growth L1Y Growth L4Y Motorized 56,790 - 1.2% 44.6% Towables 424,950 2.7 % 44.6% TOTAL 481,740 2.2 % 44.6 % * Source: CIVD annual year book 2019; North America : Statistical Survey

GLOBAL RV MARKET PRODUCT SEGMENTS NORTH AMERICA & EUROPE* 10 - 14 - 2019 THOR INVESTOR DAY 2019 4 Fifth wheeler: 90,000 units Travel trailer: 324,000 units Class A: 21,000 units Class C: 30,000 units Class B: 6,000 units Travel t railer: 77,000 units Class A+C: 85,000 units Class B: 40,000 units Fifth wheeler: --- GVWR: < 3,500 kg < 7,000 lbs. GVWR: < 2,300 kg < 5,000 lbs. Other: 11,000 units North America Europe Between 1,500 and 6,800 kg 15,500 to 16,000 kg 5,500 to 9,000 kg 1,800 to 6,400 kg * Source: CIVD annual year book 2019; North America : Statistical Survey (3,300 – 15,000 lbs.) (34,000 - 35,000 lbs.) (12,000 – 20,000 lbs.) (4,000 – 14,000 lbs.)

NORTH AMERICAN MARKET - OVERALL COMPETITIVE SCENARIO 10 - 14 - 2019 THOR INVESTOR DAY 2019 5 OVERALL MARKET SHARES (rounded) ** North America * YTD August I ** Source: Statistical Survey Thor: Industry - leading market share in all main RV product categories 48% 33% 5% 9% Gulfstream Coach Thor Industries Grand Design Forest River 1% Winnebago (Newmar) 3% 1% REV Group All Others Calendar Year 2018 Calendar 2019* Calendar 2018 Calendar 2017 Thor Industries 155,293 232,382 225,792 Forest River 122,621 161,782 160,437 Grand Design 21,600 25,526 18,573 Winnebago ( Newmar ) 11,531 15,661 15,104 REV Group 4,177 3,717 4,012 Gulfstream Coach 3,830 5,533 5,661 All others 25,738 43,292 41,521 Total 344,790 487,893 471,100 UNITS by year

NORTH AMERICAN MARKET – TOWABLES COMPETITIVE SCENARIO 10 - 14 - 2019 THOR INVESTOR DAY 2019 6 TOWABLE MARKET SHARES (rounded) ** North America * YTD August I ** Source: Statistical Survey Thor: Industry - leading market share in Towables 48% 35% 6% 8% Thor Industries Winnebago (Newmar) Forest River 2% 0% REV Group 1% Gulfstream Coach Grand Design All Others Calendar Year 2018 Calendar 2019* Calendar 2018 Calendar 2017 Thor Industries 141,243 209,740 203,333 Forest River 114,177 149,270 147,587 Grand Design 21,600 25,526 18,573 Winnebago (Newmar) 4,429 6,694 5,770 REV Group 1,599 1 0 Gulfstream Coach 3,522 5,071 5,321 All others 20,688 34,039 33,018 Total 307,258 430,341 413,602 UNITS by year

NORTH AMERICAN MARKET - OVERALL COMPETITIVE SCENARIO 10 - 14 - 2019 THOR INVESTOR DAY 2019 7 MOTORIZED MARKET SHARES (rounded) ** North America * YTD August I ** Source: Statistical Survey Thor: Industry - leading market share in Motorized 39% 22% 16% 6% 16% All Others Thor Industries Forest River 1% Winnebago (Newmar) REV Group Gulfstream Coach Calendar Year 2018 Calendar 2019* Calendar 2018 Calendar 2017 Thor Industries 14,050 22,642 22,459 Forest River 8,444 12,512 12,850 Winnebago ( Newmar ) 7,102 8,967 9,334 REV Group 2,578 3,716 4,012 Gulfstream Coach 308 462 340 All others 5,050 9,253 8,503 Total 37,532 57,552 57,498 Units by year
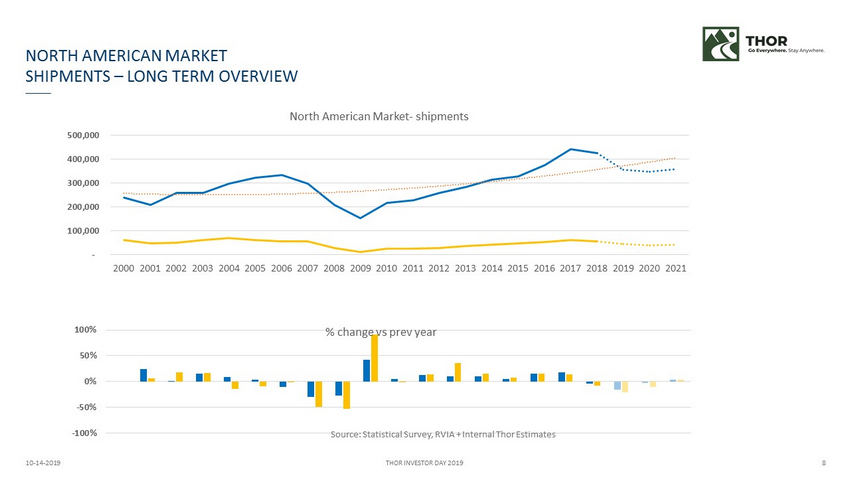
10 - 14 - 2019 THOR INVESTOR DAY 2019 8 - 100,000 200,000 300,000 400,000 500,000 2000 2001 2002 2003 2004 2005 2006 2007 2008 2009 2010 2011 2012 2013 2014 2015 2016 2017 2018 2019 2020 2021 North American Market - shipments -100% -50% 0% 50% 100% % change vs prev year NORTH AMERICAN MARKET SHIPMENTS – LONG TERM OVERVIEW Source: Statistical Survey, RVIA + Internal Thor Estimates
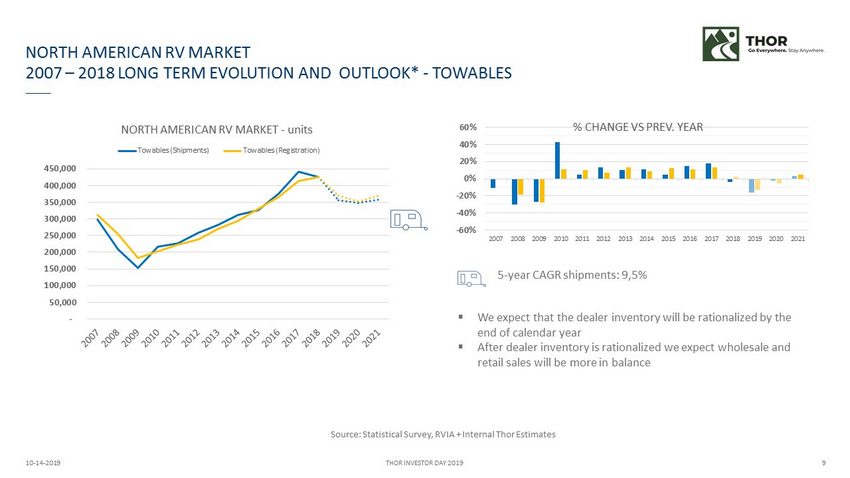
NORT H AMERICAN RV MARKET 2007 – 2018 LONG TERM EVOLUTION AND OUTLOOK* - TOWABLES 10 - 14 - 2019 THOR INVESTOR DAY 2019 9 - 50,000 100,000 150,000 200,000 250,000 300,000 350,000 400,000 450,000 NORTH AMERICAN RV MARKET - units Towables (Shipments) Towables (Registration) 5 - year CAGR shipments : 9,5% ▪ We expect that the dealer inventory will be rationalized by the end of calendar year ▪ After dealer inventory is rationalized we expect wholesale and retail sales will be more in balance -60% -40% -20% 0% 20% 40% 60% 2007 2008 2009 2010 2011 2012 2013 2014 2015 2016 2017 2018 2019 2020 2021 % CHANGE VS PREV. YEAR Source: Statistical Survey, RVIA + Internal Thor Estimates

NORT H AMERICAN RV MARKET 2007 – 2018 LONG TERM EVOLUTION AND OUTLOOK* - MOTORIZED 10 - 14 - 2019 THOR INVESTOR DAY 2019 10 - 10,000 20,000 30,000 40,000 50,000 60,000 70,000 80,000 90,000 100,000 NORTH AMERICAN RV MARKET - units Motorhomes (Shipments) Motorhomes (Registration) 5 - year CAGR shipments : 11,2% ▪ We expect growth in the Class B market and we are expanding our Class B product line . ▪ We have added two new products to meet market requirements , and will be bringing EHG products to North America -60% -40% -20% 0% 20% 40% 60% 2007 2008 2009 2010 2011 2012 2013 2014 2015 2016 2017 2018 2019 2020 2021 % CHANGE VS PREV. YEAR Source: Statistical Survey, RVIA + Internal Thor Estimates
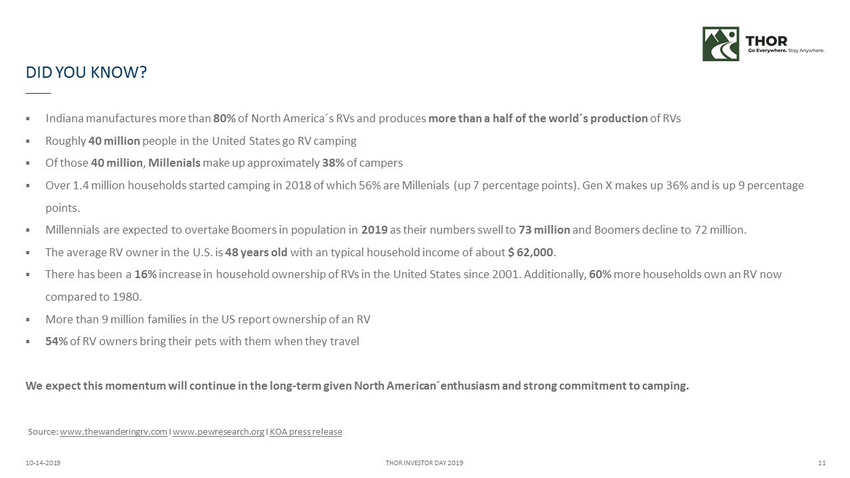
DID YOU KNOW ? 10 - 14 - 2019 THOR INVESTOR DAY 2019 11 ▪ Indiana manufactures more than 80% of North America ´ s RVs and produces more than a half of the world ´ s production of RVs ▪ Roughly 40 million people in the United States go RV camping ▪ Of those 40 million , Millenials make up approximately 38% of campers ▪ Over 1.4 million households started camping in 2018 of which 56% are Millenials ( up 7 percentage points ). Gen X makes up 36% and is up 9 percentage points . ▪ Millennials are expected to overtake Boomers in population in 2019 as their numbers swell to 73 million and Boomers decline to 72 million. ▪ The average RV owner in the U.S. is 48 years old with an typical household income of about $ 62,000 . ▪ There has been a 16% increase in household ownership of RVs in the United States since 2001. Additionally , 60% more households own an RV now compared to 1980. ▪ More than 9 million families in the US report ownership of an RV ▪ 54% of RV owners bring their pets with them when they travel We expect this momentum will continue in the long - term given North American ´ enthusiasm and strong commitment to camping . Source: www.thewanderingrv.com I www.pewresearch.org I KOA press release

THOR INVESTOR DAY | NORTH AMERICAN RV MARKET Bad Waldsee , 14 October 2019