UNITED STATES
SECURITIES AND EXCHANGE COMMISSION
Washington, D.C. 20549
FORM N-CSR
CERTIFIED SHAREHOLDER REPORT OF REGISTERED
MANAGEMENT INVESTMENT COMPANIES
Investment Company Act file number | 811–3896 | ||||||||
| |||||||||
FPA PERENNIAL FUND, INC. | |||||||||
(Exact name of registrant as specified in charter) | |||||||||
| |||||||||
11400 WEST OLYMPIC BLVD., SUITE 1200, LOS ANGELES, CALIFORNIA |
| 90064 | |||||||
(Address of principal executive offices) |
| (Zip code) | |||||||
| |||||||||
J. RICHARD ATWOOD, 11400 WEST OLYMPIC BLVD., SUITE 1200, LOS ANGELES, CALIFORNIA 90064 | |||||||||
(Name and address of agent for service) | |||||||||
| |||||||||
Registrant’s telephone number, including area code: | 310-473-0225 |
| |||||||
| |||||||||
Date of fiscal year end: | DECEMBER 31 |
| |||||||
| |||||||||
Date of reporting period: | DECEMBER 31, 2006 |
| |||||||
Item 1. Report to Stockholders.
Annual Report

Distributor:
FPA FUND DISTRIBUTORS, INC.
11400 West Olympic Boulevard, Suite 1200
Los Angeles, California 90064
48002
FPA Perennial Fund, Inc.
December 31, 2006
LETTER TO SHAREHOLDERS
The stock market advanced broadly in 2006, with both small- and large-cap indexes gaining over 15%. Value stocks dramatically outperformed growth stocks, by 10-12 points for most indexes.
Perennial's performance, a gain of 4.1%, was very much a reversal of 2005, when Perennial outperformed most indexes by 5-10 points. This is reminiscent of the situation in 2003, when an extremely strong absolute performance year (up 38%) followed an especially weak year (2002 — down 11%).
Over longer time periods these fluctuations have tended to even out and both absolute and relative performance has been very respectable. The table below shows performance for Perennial and its benchmark Russell 2500, in addition to the leading large- and small-cap indexes for 2006, as well as 3, 5, and 10 years.
| 2006 | 3 Years* | 5 Years* | 10 Years* | ||||||||||||||||
| Perennial | 4.1 | % | 10.9 | % | 11.0 | % | 14.0 | % | |||||||||||
| Russell 2500 | 16.2 | % | 14.1 | % | 12.2 | % | 11.3 | % | |||||||||||
| S&P 500 | 15.8 | % | 10.4 | % | 6.2 | % | 8.4 | % | |||||||||||
| Russell 2000 | 18.4 | % | 13.6 | % | 11.4 | % | 9.4 | % | |||||||||||
| Nasdaq | 9.5 | % | 6.4 | % | 4.4 | % | 6.5 | % | |||||||||||
*Annualized Return
The following table shows Perennial's returns for each of the past five years, as well as those of the benchmark Russell 2500.
| 2002 | 2003 | 2004 | 2005 | 2006 | Five Years* | ||||||||||||||||||||||
| Perennial | (10.6 | )% | 37.9 | % | 16.3 | % | 12.8 | % | 4.1 | % | 11.0 | % | |||||||||||||||
| Russell 2500 | (17.8 | )% | 45.5 | % | 18.3 | % | 8.1 | % | 16.2 | % | 12.2 | % | |||||||||||||||
*Annualized
While we have had our share of outperfoming stocks this year (Bio-Rad, CarMax, and Manpower), significant price declines in a number of portfolio stocks contributed to Perennial's underperformance.
Headset manufacturer Plantronics is down as it has struggled with a transition to wireless equipment, with the consolidation of a large acquisition, and with starting up a new plant in China. Briggs & Stratton declined as poor weather hurt both its lawnmower engine and portable generator business, resulting in excess inventories and production cutbacks. Zebra Technologies is down because of weakness in sales to retailers and slow development of RFID (video frequency identification) technology. Lincare is also down, driven by concerns about the extent of Medicare reimbursement cuts for home oxygen equipment and service.
We think it noteworthy that, in the case of many of the portfolio stocks which declined most, we took advantage of the lower prices and significantly increased position sizes. These names include Knight Transportation, Maxim, Polaris, HNI, and Zebra. We expect these increased investments to significantly benefit Perennial shareholders over time.
Our reaction was different in the case of Briggs & Stratton, where we liquidated the position. We now believe that we misjudged the strength of Briggs' business model in the face of important changes in industry structure.
We have also tried to determine if there were exogenous issues involved that may have stymied our performance in 2006. Long-term shareholders will undoubtedly have noted that we typically devote relatively little space to dissecting recent performance and a great deal to talking about companies in the portfolio. We believe that the primary purpose of the shareholder letter is to shed light on our investment process, which is focused on long-term business strategy and profitability, and not on forecasting short-term price fluctuations, which are often no more than market "noise." We believe that in-depth discussion of selected portfolio companies is the best way of illustrating our investment philosophy and decision making process and we intend to continue this practice. However, for this letter we would first like to take a big picture approach and talk about what we believe was one of several market factors that drove the outperformance of the Russell 2500.
For a number of years, institutional investors have been increasingly attracted to "alternative" investments, meaning anything but domestic stocks and bonds. Some examples would be foreign securities, hedge funds, venture capital, and real estate.
1
One of the most popular of these alternative asset classes is private equity, or PE.
Private equity, which in its less respectable past was referred to as LBOs, or leveraged buy-outs, is the business of buying public companies, using as much debt and as little equity as possible, and taking those companies private. Ideally, they are then run much more efficiently, as well as financially restructured, and eventually returned to the public market via an IPO, or are resold to a new buyer, hopefully at a large profit.
When well executed, many past LBOs have proven to be very successful. The result, not surprisingly, has been a large increase in investor interest in this area. In fact, huge amounts of new capital have been raised by PE firms in recent years. We believe that the effect of this increased pool of capital looking for deals was significant in 2006 and negative for Perennial performance.
The private equity funds took their recently raised money and bought companies. The result was not only that the prices of these companies rose, but also the prices of potential targets. Because a good part of the profit potential for PE buyers is improving operations, they tend to prefer low- and medium-quality businesses being run at well below potential efficiency. Thus the stock market effect of the PE funds was disproportionately on the low end of the market. High-quality, efficiently operated companies are rarely PE targets, and their stock prices therefore were not inflated by the PE boom.
An analysis of actual stock market returns in 2006 supports this thesis. The market performance of low-growth, low price-earnings ratio companies (generally with ho-hum business records) far exceeded that of high-growth and higher price-earnings ratio companies (generally with dynamic and successful records). Since Perennial has always preferred to own high-quality, efficiently managed, high return on capital companies, we were in exactly that part of the market that performed the worst.
It is clear that the more money invested in PE firms, the lower the investors' returns will be. Most likely, recent PE investments will return far less than those in the past when the area was less popular. Similarly, the more the stock prices of potential PE target companies increase, the lower the return on buying the companies is going to be.
As a result, we believe that private equity "excess" will be a self-correcting phenomenon and we will not indefinitely see increasingly large amounts of capital chasing increasingly poor investments. Of course, when this stops is much harder to predict. We will wait patiently and continue to emphasize the same kind of high-quality businesses for the Perennial portfolio that we have in the past.
In managing the Perennial portfolio, we have always made earning a high return on capital an important stock selection criterion. Although it is fairly straightforward to assess what past returns on capital have been, projecting future returns is more complex. One element of this is to appraise a company's ability to reinvest its cash flows. For many of our portfolio names, much of this cash flow is spent on acquisitions.
We use several criteria to judge acquisitions made by our portfolio companies:
• They must be in areas well understood by management
• They must be at a reasonable price
• They must not significantly change the company's risk profile
The past four months have seen a flurry of important deals announced by companies in Perennial's portfolio. Most of these we like – they meet our acquisition criteria, and we expect they will add significant value – but in one case our enthusiasm is muted and we are much less enthusiastic.
On October 3, IDEX completed the acquisition of Banjo Corporation. At $183 million, this was the largest purchase in Idex history (which has included many others). As a manufacturer of highly engineered pumps, valves, and fittings, it is clearly in management's area of expertise. Banjo's products utilize glass-reinforced plastic for severe duty applications mostly in agriculture, enabling Idex to expand both its product line and customer base.
At a cost of $183 million for $44 million of revenue, Banjo appears on the surface to be quite
2
expensive, but given its very high operating margins, good growth prospects, and strong market position, we find the price not excessive. It is also well within Idex's balance sheet capacity to finance.
Unlike Idex, CDW has emphasized internal growth and has made very few acquisitions in its history thus, CDW's doing a large deal is an unusual and noteworthy event. As the reader may recall, CDW is a marketer of IT (information technology) hardware and software from a wide range of vendors directly to end users, mostly small- and medium-size business customers.
On October 11, CDW completed the acquisition of Berbee Information Network, a large independent IT solutions provider, for $184 million. Berbee will enhance CDW's offerings of advanced technology products which address customers' more complex business requirements. Its areas of expertise include network infrastructure, complex communications systems, storage, and security.
Berbee is an excellent fit with CDW's business. It has a similar customer base, though with only modest actual overlap. Berbee's products are similar, but higher end, and it complements CDW's sales and service capabilities, yet with much more of a field-based organization.
Berbee's revenues in the past year were $390 million, with strong EBITDA (earnings before interest, taxes, depreciation, and amortization) margins of 6%. It has a history of double-digit revenue growth, which CDW expects to continue, both organically and through small acquisitions of similar businesses. Since Berbee currently operates in only six midwestern states, there is considerable room for growth. Accretion of 5 cents per share is forecast for 2007. With almost $600 million of balance sheet cash prior to the deal, the $184 million cost is clearly well within CDW's financial capabilities.
All in all, we believe the acquisition is both financially and strategically attractive for CDW.
On January 11, Zebra Technologies announced that it had agreed to purchase WhereNet, a leading provider of active radio frequency identification (RFID) systems for $126 million.
Zebra, a manufacturer of bar-code printers, expanded into passive RFID products several years ago, and we believe WhereNet represents a logical extension of Zebra's core business. It is similar to Zebra's large past acquisitions, when it expanded into adjacent product areas with Eltron (1998), a manufacturer of desk top printers, and Comtec, a maker of mobile wireless printers (2000).
WhereNet is a provider of Real Time Locating Systems (RTLS). These track high-value physical assets (containers, vehicles, equipment) across large areas, like freight yards, factories, or hospitals. It has 150 customer installations and sales of $36 million in 2006.
The acquisition is clearly strategically attractive to Zebra. It is a logical product line extension, giving Zebra a more comprehensive product offering, improving its growth prospects, and offering attractive cross-selling opportunities. Financially, however, the attractiveness of the acquisition is less clear. Zebra is investing for the long term, as WhereNet has only recently turned profitable and a meaningful earnings contribution is probably several years ahead. Zebra will want to continue to invest in product development and sales so as to maintain WhereNet's rapid revenue growth (projected at 40% in 2007). If it is also successful in significantly improving its profitability, hopefully close to Zebra's 20%+ operating margin, then the acquisition could become a financial success.
As for Zebra's financial capacity to undertake an acquisition of this size, it is not a problem. The $126 million cost will use up about one-quarter of Zebra's $550 million of balance sheet cash. The entire purchase price can be restored by one year's free cash flow.
On October 16, Oshkosh Truck announced its intention to purchase JLG for $3.2 billion in cash. Oshkosh, a very successful investment for Perennial shareholders, is a manufacturer of specialty trucks, notably for military, fire and rescue, and concrete markets. JLG is a leading producer of aerial work platforms and telehandlers (telescoping truck-mounted fork-lifts) for construction applications, mostly non-residential.
Oshkosh argued that the purchase would enable it to diversify away from military trucks, benefit from several more years of strong non-residential
3
construction, and implement significant cost savings. The deal closed on December 6.
We have a number of differences with Oshkosh's strategic rationale for the acquisition:
• We like the military truck business. If Oshkosh is "dependent" on it, it is because it has been so successful, what we like to call "good trouble."
• Oshkosh's past business model of buying and improving specialty truck business in the $100 million range has been well executed. We see no need to depart from it.
• JLG stock was up approximately threefold in the two years before the deal. This suggests that much of the potential for cyclical upside and cost savings was already reflected in the valuation.
In addition to these strategic arguments, we also have financial objections to the acquisition. The $3.2 billion cash price was 100% debt financed, a substantial sum compared to Oshkosh's $1 billion of book equity. Its debt-to-capital ratio thus goes from 10% to 75%. The income statement is also transformed, with annual interest expense increasing from $5 million to $250 million.
We have never been big fans of risk, and Oshkosh has taken on financial and operational risk we do not need in the Perennial portfolio. We have been opportunistically reducing our position.
Respectfully submitted,

Eric S. Ende
President and Portfolio Manager
January 29, 2007
The discussion of Fund investments represents the views of the Fund's managers at the time of this report and are subject to change without notice. References to individual securities are for informational purposes only and should not be construed as recommendations to purchase or sell individual securities. While the Fund's managers believe that the Fund's holdings are value stocks, there can be no assurance that others will consider them as such. Further, investing in value stocks presents the risk that value stocks may fall out of favor with investors and underperform growth stocks during given periods.
The Russell 2000 Index is an unmanaged index comprised of the 2,000 smallest companies in the Russell 3000 Index. The Russell 2500 Index is an unmanaged index comprised of the 2,500 smallest companies in the Russell 3000 Index. The Russell 3000 Index measures the performance of the 3,000 largest U.S. companies based on total market capitalization. The S&P 500 Index is an index of 500 companies with large market capitalization. The Dow Jones Industrial Average (DJIA) covers 30 major companies. The Nasdaq Composite Index is a market capitalization index comprised of over 3,000 stocks.
FORWARD LOOKING STATEMENT DISCLOSURE
As fund managers, one of our responsibilities is to communicate with shareholders in an open and direct manner. Insofar as some of our opinions and comments in our letters to shareholders are based on current management expectations, they are considered "forward-looking statements" which may or may not be accurate over the long term. While we believe we have a reasonable basis for our comments and we have confidence in our opinions, actual results may differ materially from those we anticipate. You can identify forward-looking statements by words such as "believe," "expect," "may," "anticipate," and other similar expressions when discussing prospects for particular portfolio holdings and/or the markets, generally. We cannot, however, assure future results and disclaim any obligation to update or alter any forward-looking statements, whether as a result of new information, future events, or otherwise. Further, information provided in this rep ort should not be construed as a recommendation to purchase or sell any particular security.
4
HISTORICAL PERFORMANCE
Change in Value of a $10,000 Investment in FPA Perennial Fund, Inc. vs. Russell 2500 Index and Lipper Mid-Cap Core Fund Average from January 1, 1996 to December 31, 2006
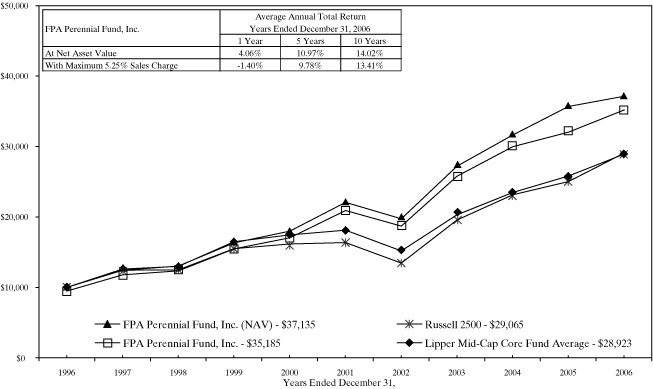
Past performance is not indicative of future performance. The Russell 2500 Index consists of the 2,500 smallest companies in the Russell 3000 total capitalization universe. This index is considered a measure of small to medium capitalization stock performance. This index does not reflect any commissions or fees which would be incurred by an investor purchasing the stocks it represents. The Lipper Mid-Cap Core Fund Average provides an additional comparison of how your Fund performed in relation to other mutual funds with similar objectives. The Lipper data does not include sales charges. The performance shown for FPA Perennial Fund, Inc., with an ending value of $35,185 reflects deduction of the current maximum sales charge of 5.25% of the offering price. In addition, since investors purchase shares of the Fund with varying sales charges depending primarily on volume purchased, the Fund's performance at net asset value (NAV) is also shown, as reflected by the ending value of $37,135. The performance of the Fund and of the Averages is computed on a total return basis which includes reinvestment of all distributions.
5
PORTFOLIO SUMMARY
December 31, 2006
(Unaudited)
| Common Stocks | 88.1 | % | |||||
| Business Services & Supplies | 24.5 | % | |||||
| Producer Durable Goods | 13.3 | % | |||||
| Technology | 11.5 | % | |||||
| Retailing | 9.2 | % | |||||
| Energy | 9.0 | % | |||||
| Health Care | 8.6 | % | |||||
| Transportation | 5.5 | % | |||||
| Financial | 4.2 | % | |||||
| Consumer Durable Goods | 2.3 | % | |||||
| Short-Term Investments | 12.8 | % | |||||
| Other Assets and Liabilities, net | (0.9 | )% | |||||
| Total Net Assets | 100.0 | % | |||||
MAJOR PORTFOLIO CHANGES
Six Months Ended December 31, 2006
(Unaudited)
| Shares | |||||||
| NET PURCHASES | |||||||
| Common Stocks | |||||||
| AmSurg Corporation | 60,000 | ||||||
| Brady Corporation | 90,400 | ||||||
| Charles River Laboratories International, Inc. | 46,800 | ||||||
| CLARCOR, Inc. | 50,000 | ||||||
| Cognex Corporation | 75,000 | ||||||
| Franklin Electric Co., Inc. | 86,900 | ||||||
| Heartland Express, Inc. | 291,667 | ||||||
| IDEX Corporation | 47,700 | ||||||
| Knight Transportation, Inc. | 280,000 | ||||||
| Maxim Integrated Products, Inc. (1) | 205,000 | ||||||
| O'Reilly Automotive, Inc. | 55,000 | ||||||
| Plantronics, Inc. | 98,600 | ||||||
| Zebra Technologies Corporation (Class A) | 46,800 | ||||||
| NET SALES | |||||||
| Common Stocks | |||||||
| Briggs & Stratton Corporation (2) | 285,000 | ||||||
| CEC Entertainment Inc. (2) | 105,000 | ||||||
| Arthur J. Gallagher & Co. (2) | 265,000 | ||||||
| Health Management Associates, Inc. | 240,000 | ||||||
| North Fork Bancorporation, Inc. (2) | 115,000 | ||||||
(1) Indicates new commitment to portfolio
(2) Indicates elimination from portfolio
6
PORTFOLIO OF INVESTMENTS
December 31, 2006
| COMMON STOCKS | Shares | Value | |||||||||
| BUSINESS SERVICES & SUPPLIES — 24.5% | |||||||||||
| Brady Corporation | 479,500 | $ | 17,875,760 | ||||||||
| CDW Corporation | 405,100 | 28,486,632 | |||||||||
| Charles River Laboratories International, Inc.* | 520,000 | 22,490,000 | |||||||||
| CLARCOR, Inc. | 365,000 | 12,340,650 | |||||||||
| Copart, Inc.* | 210,000 | 6,300,000 | |||||||||
| Invitrogen Corporation* | 295,000 | 16,694,050 | |||||||||
| Landauer, Inc. | 10,000 | 524,700 | |||||||||
| Manpower Inc. | 145,100 | 10,872,343 | |||||||||
| ScanSource, Inc.* | 660,000 | 20,064,000 | |||||||||
| $ | 135,648,135 | ||||||||||
| PRODUCER DURABLE GOODS — 13.3% | |||||||||||
| Franklin Electric Co., Inc. | 91,200 | $ | 4,686,768 | ||||||||
| Graco Inc. | 290,000 | 11,489,800 | |||||||||
| HNI Corporation | 392,200 | 17,417,602 | |||||||||
| IDEX Corporation | 287,700 | 13,639,857 | |||||||||
| Oshkosh Truck Corporation | 170,000 | 8,231,400 | |||||||||
| Zebra Technologies Corporation (Class A)* | 525,000 | 18,264,750 | |||||||||
| $ | 73,730,177 | ||||||||||
| TECHNOLOGY — 11.5% | |||||||||||
| Cognex Corporation | 815,000 | $ | 19,413,300 | ||||||||
| Maxim Integrated Products, Inc. | 205,000 | 6,277,100 | |||||||||
| Microchip Technology Incorporated | 375,000 | 12,262,500 | |||||||||
| Plantronics, Inc. | 846,000 | 17,935,200 | |||||||||
| SanDisk Corporation* | 185,000 | 7,960,550 | |||||||||
| $ | 63,848,650 | ||||||||||
| RETAILING — 9.2% | |||||||||||
| CarMax, Inc.* | 550,000 | $ | 29,496,500 | ||||||||
| O'Reilly Automotive, Inc.* | 680,000 | 21,800,800 | |||||||||
| $ | 51,297,300 | ||||||||||
| ENERGY — 9.0% | |||||||||||
| Helix Energy Solutions Group, Inc.* | 620,000 | $ | 19,449,400 | ||||||||
| Noble Corporation | 290,000 | 22,083,500 | |||||||||
| Tidewater Inc. | 170,000 | 8,221,200 | |||||||||
| $ | 49,754,100 | ||||||||||
| HEALTH CARE — 8.6% | |||||||||||
| Amsurg Corporation* | 365,000 | $ | 8,395,000 | ||||||||
| Bio-Rad Laboratories, Inc.* | 136,700 | 11,280,484 | |||||||||
| Health Management Associates, Inc. | 295,000 | 6,227,450 | |||||||||
| Lincare Holdings Inc.* | 550,000 | 21,912,000 | |||||||||
| $ | 47,814,934 | ||||||||||
7
PORTFOLIO OF INVESTMENTS
December 31, 2006
| COMMON STOCKS — Continued | Shares or Principal Amount | Value | |||||||||
| TRANSPORTATION — 5.5% | |||||||||||
| Heartland Express, Inc. | 1,125,000 | $ | 16,897,500 | ||||||||
| Knight Transportation, Inc. | 785,000 | 13,384,250 | |||||||||
| $ | 30,281,750 | ||||||||||
| FINANCIAL — 4.2% | |||||||||||
| Brown & Brown, Inc. | 455,000 | $ | 12,835,550 | ||||||||
| First American Corporation | 260,000 | 10,576,800 | |||||||||
| $ | 23,412,350 | ||||||||||
| CONSUMER DURABLE GOODS — 2.3% | |||||||||||
| Polaris Industries Inc. | 270,000 | $ | 12,644,100 | ||||||||
| TOTAL COMMON STOCKS — 88.1% (Cost $385,317,057) | $ | 488,431,496 | |||||||||
| SHORT-TERM INVESTMENTS — 12.8% | |||||||||||
| Rabobank USA Financial Corporation — 5.27% 01/02/07 | $ | 19,842,000 | $ | 19,839,095 | |||||||
| Bank of Montreal — 5.23% 01/03/07 | 15,000,000 | 14,995,642 | |||||||||
| General Electric Company — 5.23% 01/16/07 | 15,000,000 | 14,967,313 | |||||||||
| AIG Funding, Inc. — 5.23% 01/17/07 | 7,985,000 | 7,966,439 | |||||||||
| ChevronTexaco Funding Corporation — 5.22% 01/17/07 | 13,343,000 | 13,312,044 | |||||||||
| TOTAL SHORT-TERM INVESTMENTS (Cost $71,080,533) | $ | 71,080,533 | |||||||||
| TOTAL INVESTMENTS — 100.9% (Cost $456,397,590) | $ | 559,512,029 | |||||||||
| Other assets less liabilities, net — (0.9)% | (5,207,347 | ) | |||||||||
| TOTAL NET ASSETS — 100% | $ | 554,304,682 | |||||||||
*Non-income producing securities
See notes to financial statements.
8
STATEMENT OF ASSETS AND LIABILITIES
December 31, 2006
| ASSETS | |||||||||||
| Investments at value: | |||||||||||
| Investment securities — at market value (cost $385,317,057) | $ | 488,431,496 | |||||||||
| Short-term investments — at amortized cost (maturities 60 days or less) | 71,080,533 | $ | 559,512,029 | ||||||||
| Cash | 694 | ||||||||||
| Receivable for: | |||||||||||
| Capital Stock sold | $ | 874,149 | |||||||||
| Dividends and accrued interest | 74,050 | 948,199 | |||||||||
| $ | 560,460,922 | ||||||||||
| LIABILITIES | |||||||||||
| Payable for: | |||||||||||
| Capital Stock repurchased | $ | 5,731,673 | |||||||||
| Advisory fees and financial services | 358,587 | ||||||||||
| Accrued expenses | 65,980 | 6,156,240 | |||||||||
| NET ASSETS | $ | 554,304,682 | |||||||||
| SUMMARY OF SHAREHOLDERS' EQUITY | |||||||||||
| Capital Stock — par value $0.01 per share; authorized 25,000,000 shares; 16,002,087 outstanding shares | $ | 160,021 | |||||||||
| Additional paid-in capital | 450,653,936 | ||||||||||
| Undistributed net realized gain on investments | 180,217 | ||||||||||
| Undistributed net investment income | 196,069 | ||||||||||
| Unrealized appreciation of investments | 103,114,439 | ||||||||||
| NET ASSETS | $ | 554,304,682 | |||||||||
| NET ASSET VALUE, REDEMPTION PRICE AND MAXIMUM OFFERING PRICE PER SHARE | |||||||||||
| Net asset value and redemption price per share (net assets divided by shares outstanding) | $ | 34.64 | |||||||||
| Maximum offering price per share (100/94.75 of per share net asset value) | $ | 36.56 | |||||||||
See notes to financial statements.
9
STATEMENT OF OPERATIONS
December 31, 2006
| INVESTMENT INCOME | |||||||||||
| Interest | $ | 6,230,437 | |||||||||
| Dividends | 3,298,141 | ||||||||||
| $ | 9,528,578 | ||||||||||
| EXPENSES | |||||||||||
| Advisory fees | $ | 3,753,149 | |||||||||
| Transfer agent fees and expenses | 588,952 | ||||||||||
| Financial services | 569,715 | ||||||||||
| Reports to shareholders | 81,739 | ||||||||||
| Registration fees | 72,176 | ||||||||||
| Custodian fees and expenses | 56,391 | ||||||||||
| Audit fees | 36,050 | ||||||||||
| Directors' fees and expenses | 24,716 | ||||||||||
| Insurance | 19,894 | ||||||||||
| Legal fees | 9,397 | ||||||||||
| Other expenses | 15,699 | 5,227,878 | |||||||||
| Net investment income | $ | 4,300,700 | |||||||||
| NET REALIZED AND UNREALIZED GAIN ON INVESTMENTS | |||||||||||
| Net realized gain on investments: | |||||||||||
| Proceed from sales of investment securities | $ | 69,637,943 | |||||||||
| Cost of investment securities sold | 57,195,625 | ||||||||||
| Net realized gain on investments | $ | 12,442,318 | |||||||||
| Unrealized appreciation of investments: | |||||||||||
| Unrealized appreciation at beginning of year | $ | 101,512,143 | |||||||||
| Unrealized appreciation at end of year | 103,114,439 | ||||||||||
| Increase in unrealized appreciation of investments | 1,602,296 | ||||||||||
| Net realized und unrealized gain on investments | $ | 14,044,614 | |||||||||
| NET INCREASE IN NET ASSETS RESULTING FROM OPERATIONS | $ | 18,345,314 | |||||||||
See notes to financial statements.
10
STATEMENT OF CHANGES IN NET ASSETS
| For the Year Ended December 31, | |||||||||||||||||||
| 2006 | 2005 | ||||||||||||||||||
| INCREASE IN NET ASSETS | |||||||||||||||||||
| Operations: | |||||||||||||||||||
| Net investment income | $ | 4,300,700 | $ | 1,405,813 | |||||||||||||||
| Net realized gain on investments | 12,442,318 | 9,860,035 | |||||||||||||||||
| Increase in unrealized appreciation of investments | 1,602,296 | 35,734,469 | |||||||||||||||||
| Increase in net assets resulting from operations | $ | 18,345,314 | $ | 47,000,317 | |||||||||||||||
| Distributions to shareholders from: | |||||||||||||||||||
| Net investment income | $ | (4,136,313 | ) | $ | (1,374,131 | ) | |||||||||||||
| Net realized capital gains | (14,272,338 | ) | (18,408,651 | ) | (8,655,646 | ) | (10,029,777 | ) | |||||||||||
| Capital Stock transactions: | |||||||||||||||||||
| Proceeds from Capital Stock sold | $ | 189,772,388 | $ | 229,311,176 | |||||||||||||||
| Proceeds from shares issued to shareholders upon reinvestment of dividends and distributions | 15,519,731 | 8,640,434 | |||||||||||||||||
| Cost of Capital Stock repurchased* | (141,333,791 | ) | 63,958,328 | (50,609,102 | ) | 187,342,508 | |||||||||||||
| Total increase in net assets | $ | 63,894,991 | $ | 224,313,048 | |||||||||||||||
| NET ASSETS | |||||||||||||||||||
| Beginning of year | 490,409,691 | 266,096,643 | |||||||||||||||||
| End of year, including undistributed net investment income of $196,069 and $31,682 at December 31, 2006 and 2005, respectively | $ | 554,304,682 | $ | 490,409,691 | |||||||||||||||
| CHANGE IN CAPITAL STOCK OUTSTANDING | |||||||||||||||||||
| Shares of Capital Stock sold | 5,375,128 | 7,018,973 | |||||||||||||||||
| Shares issued to shareholders upon reinvestment of dividends and distributions | 448,065 | 250,574 | |||||||||||||||||
| Shares of Capital Stock repurchased | (4,081,095 | ) | (1,555,730 | ) | |||||||||||||||
| Increase in Capital Stock outstanding | 1,742,098 | 5,713,817 | |||||||||||||||||
* Net of redemption fees of $47,100 and $14,143 for the years ended December 31, 2006 and 2005, respectively.
See notes to financial statements.
11
FINANCIAL HIGHLIGHTS
Selected Data for Each Share of Capital Stock Outstanding Throughout Each Year
| Year Ended December 31, | |||||||||||||||||||||||
| 2006 | 2005 | 2004 | 2003 | 2002 | |||||||||||||||||||
| Per share operating performance: | |||||||||||||||||||||||
| Net asset value at beginning of year | $ | 34.39 | $ | 31.14 | $ | 27.05 | $ | 20.41 | $ | 23.15 | |||||||||||||
| Income from investment operations: | |||||||||||||||||||||||
| Net investment income (loss) | $ | 0.26 | $ | 0.10 | $ | (0.02 | ) | $ | (0.06 | ) | $ | (0.04 | ) | ||||||||||
| Net realized and unrealized gain (loss) on investment securities | 1.13 | 3.89 | 4.41 | 7.77 | (2.39 | ) | |||||||||||||||||
| Total from investment operations | $ | 1.39 | $ | 3.99 | $ | 4.39 | $ | 7.71 | $ | (2.43 | ) | ||||||||||||
| Less distributions: | |||||||||||||||||||||||
| Dividends from net investment income | $ | (0.25 | ) | $ | (0.10 | ) | — | — | — | ||||||||||||||
| Distributions from net realized capital gains | (0.89 | ) | (0.64 | ) | $ | (0.30 | ) | $ | (1.07 | ) | $ | (0.31 | ) | ||||||||||
| Total distributions | $ | (1.14 | ) | $ | (0.74 | ) | $ | (0.30 | ) | $ | (1.07 | ) | $ | (0.31 | ) | ||||||||
| Redemption fees | — | * | — | * | — | * | — | * | — | ||||||||||||||
| Net asset value at end of year | $ | 34.64 | $ | 34.39 | $ | 31.14 | $ | 27.05 | $ | 20.41 | |||||||||||||
| Total investment return** | 4.06 | % | 12.81 | % | 16.25 | % | 37.89 | % | (10.59 | )% | |||||||||||||
| Ratios/supplemental data: | |||||||||||||||||||||||
| Net assets at end of year (in thousands) | $ | 554,305 | $ | 490,410 | $ | 266,097 | $ | 168,880 | $ | 91,779 | |||||||||||||
| Ratio of expenses to average net assets | 0.91 | % | 0.90 | % | 0.97 | % | 1.05 | % | 1.15 | % | |||||||||||||
| Ratio of net investment income (loss) to average net assets | 0.75 | % | 0.37 | % | (0.07 | )% | (0.36 | )% | (0.25 | )% | |||||||||||||
| Portfolio turnover rate | 16 | % | 10 | % | 16 | % | 23 | % | 6 | % | |||||||||||||
* Rounds to less than $0.01 per share.
** Return is based on net asset value per share, adjusted for reinvestment of distributions, and does not reflect deduction of the sales charge.
See notes to financial statements.
12
NOTES TO FINANCIAL STATEMENTS
December 31, 2006
NOTE 1 — Significant Accounting Policies
FPA Perennial Fund, Inc. (the "Fund") is registered under the Investment Company Act of 1940 as a diversified, open-end, management investment company. The Fund's primary investment objective is long-term growth of capital. Current income is a secondary consideration. The following is a summary of significant accounting policies consistently followed by the Fund in the preparation of its financial statements.
A. Security Valuation
Securities listed or traded on a national securities exchange are valued at the last sale price. If there was not a sale that day, these securities are valued at the last bid price. Securities traded on the NASDAQ National Market System are valued at the NASDAQ Official Closing Price. Securities which are unlisted are valued at the most recent bid price. Short-term investments with maturities of 60 days or less are valued at amortized cost which approximates market value.
B. Securities Transactions and Related
Investment Income
Securities transactions are accounted for on the date the securities are purchased or sold. Dividend income and distributions to shareholders are recorded on the ex-dividend date. Interest income and expenses are recorded on an accrual basis.
C. Use of Estimates
The preparation of the financial statements in accordance with accounting principles generally accepted in the United States requires management to make estimates and assumptions that affect the amounts reported. Actual results could differ from those estimates.
NOTE 2 — Federal Income Tax
No provision for federal income tax is required because the Fund has elected to be taxed as a "regulated investment company" under the Internal Revenue Code and intends to maintain this qualification and to distribute each year to its shareholders, in accordance with the minimum distribution requirements of the Code, all of its taxable net investment income and taxable net realized gains on investments.
Distributions paid to shareholders are based on net investment income and net realized gains determined on a tax reporting basis, which may differ from financial reporting. For federal income tax purposes, the components of distributable earnings at December 31, 2006, were as follows:
| Undistributed Net Investment Income | $ | 196,069 | |||||
| Undistributed Net Realized Gains | $ | 180,217 | |||||
The tax status of distributions paid during the last two fiscal years ended December 31 were as follows:
| 2006 | 2005 | ||||||||||
| Dividends from Ordinary Income | $ | 4,465,046 | $ | 4,246,233 | |||||||
| Distributions from Long-term Capital Gains | $ | 13,943,605 | $ | 5,783,544 | |||||||
The cost of purchases of investment securities (excluding short-term investments with maturities of 60 days or less) aggregated $172,186,432 during the year ended December 31, 2006. Realized gains or losses are based on the specific identification method.
All of the amounts reported in the financial statements at December 31, 2006 were the same for federal income tax and financial reporting purposes. Gross unrealized appreciation and depreciation for all investments at December 31, 2006 for federal income tax and financial reporting purposes was $111,568,188 and $8,453,749, respectively, resulting in net unrealized appreciation of $103,114,439. The Financial Accounting Standards Board ("FASB") has recently issued Interpretation No. 48, "Accounting for Uncertainty in Income Taxes — an Interpretation of FASB Statement No. 109 (the "Interpretation"), which applies to all registered investment companies, clarifies the accounting for uncertain tax positions. The Interpretation is effective for financial statements for fiscal years beginning after December 15, 2006.
13
NOTES TO FINANCIAL STATEMENTS
Continued
Management of the Fund completed their analysis of the Interpretation and estimates the adoption will have no significant impact on the financial statements.
NOTE 3 — Advisory Fees and Other Affiliated Transactions
Pursuant to an Investment Advisory Agreement, advisory fees were paid by the Fund to First Pacific Advisors, LLC (the "Adviser"). Under the terms of this Agreement, the Fund pays the Adviser a monthly fee calculated at the annual rate of 0.75% of the first $50 million of the Fund's average daily net assets and 0.65% of the average daily net assets in excess of $50 million. In addition, the Fund pays the Adviser an amount equal to 0.10% of the average daily net assets for each fiscal year in reimbursement for the provision of financial services to the Fund. The Agreement obligates the Adviser to reduce its fee to the extent necessary to reimburse the Fund for any annual expenses (exclusive of interest, taxes, the cost of any supplemental statistical and research information, and extraordinary expenses such as litigation) in excess of 11/2% of the first $30 million and 1% of the remaining average net assets of the Fund for the year. The Adviser commenced providing investment advisory services on October 1, 2006, under a new investment advisory agreement approved by shareholders on May 2, 2006. This Adviser is a new investment advisory firm owned entirely by the former principals and key investment professionals of the Fund's prior adviser. The terms of the new investment advisory agreement are identical to the prior investment advisory agreement.
For the year ended December 31, 2006, the Fund paid aggregate fees of $24,500 to all Directors who are not affiliated persons of the Adviser. Certain officers of the Fund are also officers of the Adviser and FPA Fund Distributors, Inc.
NOTE 4 — Redemption Fee
A redemption fee of 2% applies to redemptions within 90 days of purchase for certain purchases made by persons eligible to purchase shares without an initial sales charge. For the year ended December 31, 2006, the Fund collected $47,100 in redemption fees. The impact of these fees is less than $0.01 per share.
NOTE 5 — Distributor
For the year ended December 31, 2006, FPA Fund Distributors, Inc. ("Distributor"), wholly owned subsidiary of the Adviser, received $161,577 in net Fund share sales commissions after reallowance to other dealers. The Distributor pays its own overhead and general administrative expenses, the cost of supplemental sales literature, promotion and advertising.
14
REPORT OF INDEPENDENT REGISTERED
PUBLIC ACCOUNTING FIRM
TO THE SHAREHOLDERS AND
BOARD OF DIRECTORS OF FPA PERENNIAL FUND, INC.
We have audited the accompanying statement of assets and liabilities of FPA Perennial Fund, Inc. (the "Fund"), including the portfolio of investments, as of December 31, 2006, the related statement of operations for the year then ended, the statements of changes in net assets for each of the two years in the period then ended, and the financial highlights for each of the five years in the period then ended. These financial statements and financial highlights are the responsibility of the Fund's management. Our responsibility is to express an opinion on these financial statements and financial highlights based on our audits.
We conducted our audits in accordance with standards of the Public Company Accounting Oversight Board (United States). Those standards require that we plan and perform the audit to obtain reasonable assurance about whether the financial statements and financial highlights are free of material misstatement. The Fund is not required to have, nor were we engaged to perform, an audit of its internal control over financial reporting. Our audits included consideration of internal control over financial reporting as a basis for designing audit procedures that are appropriate in the circumstances, but not for the purpose of expressing an opinion on the effectiveness of the Fund's internal control over financial reporting. Accordingly, we express no such opinion. An audit also includes examining, on a test basis, evidence supporting the amounts and disclosures in the financial statements, assessing the accounting principles used and significant estim ates made by management, as well as evaluating the overall financial statement presentation. Our procedures included confirmation of securities owned as of December 31, 2006, by correspondence with the custodian. We believe that our audits provide a reasonable basis for our opinion.
In our opinion, the 2006 financial statements and financial highlights referred to above present fairly, in all material respects, the financial position of FPA Perennial Fund, Inc. as of December 31, 2006, the results of its operations for the year then ended, the changes in its net assets for each of the two years in the period then ended, and the financial highlights for each of the five years in the period then ended in conformity with accounting principles generally accepted in the United States of America.

Los Angeles, California
February 6, 2007
15
SHAREHOLDER EXPENSE EXAMPLE
December 31, 2006 (unaudited)
Fund Expenses
As a shareholder of the Fund, you incur two types of costs: (1) transaction costs, and (2) ongoing costs, including advisory and administrative fees; shareholder service fees; and other Fund expenses. The Example is intended to help you understand your ongoing costs (in dollars) of investing in the Fund and to compare these costs with the ongoing costs of investing in other mutual funds. The Example is based on an investment of $1,000 invested at the beginning of the year and held for the entire year.
Actual Expenses
The information in the table under the heading "Actual Performance" provides information about actual account values and actual expenses. You may use the information in this column, together with the amount you invested, to estimate the expenses that you paid over the period. Simply divide your account value by $1,000 (for example, an $8,600 account value divided by $1,000= 8.6), then multiply the result by the number in the first column in the row entitled "Expenses Paid During Period" to estimate the expenses you paid on your account during this period.
Hypothetical Example for Comparison Purposes
The information in the table under the heading "Hypothetical Performance (5% return before expenses)" provides information about hypothetical account values and hypothetical expenses based on the Fund's actual expense ratio and an assumed rate of return of 5% per year before expenses, which is not the Fund's actual return. The hypothetical account values and expenses may not be used to estimate the actual ending account balance or expenses you paid for the period. You may use this information to compare the ongoing costs of investing in the Fund and other funds. To do so, compare this 5% hypothetical example with the 5% hypothetical examples that appear in the shareholder reports of other funds.
Please note that the expenses shown in the table are meant to highlight your ongoing costs only and do not reflect any transactional costs. Therefore, the information under the heading "Hypothetical Performance (5% return before expenses)" is useful in comparing ongoing costs only, and will not help you determine the relative total costs of owning different funds. In addition, if these transactional costs were included, your costs would have been higher.
| Actual Performance | Hypothetical Performance (5% return before expenses) | ||||||||||
| Beginning Account Value June 30, 2006 | $ | 1,000.00 | $ | 1,000.00 | |||||||
| Ending Account Value December 31, 2006 | $ | 1,032.50 | $ | 1,020.36 | |||||||
| Expenses Paid During Period* | $ | 4.66 | $ | 4.64 | |||||||
* Expenses are equal to the Fund's annualized expense ratio of 0.91%, multiplied by the average account value over the period and prorated for the six-months ended December 31, 2006 (184/365 days).
APPROVAL OF INVESTMENT ADVISORY AGREEMENT
The investment advisory agreement provides that it may be renewed from year to year by (i) the Board of Directors of the Fund or by the vote of a majority (as defined in the Investment Company Act of 1940) of the outstanding voting securities of the Fund, and (ii) by the vote of a majority of Directors who are not interested persons (as defined in the 1940 Act) of the Fund or of the Adviser cast in person at a meeting called for the purpose of voting on such approval. At a meeting of the Board of Directors held on February 7, 2006, the continuance of the advisory agreement through April 30, 2007, was approved by the Board of Directors and by a majority of the Directors who are not interested persons of the Fund or of the Adviser. A new investment advisory agreement between the Fund and Resolute, LLC ("Resolute") was also approved at the same meeting by the Board of Directors and by a majority of the Directors who are not interested persons o f the Fund, the Adviser or Resolute. Resolute was created by the principals and key investment professionals of the Fund's Adviser. Resolute exercised its option to purchase, among other things, the operating assets and name of the Adviser. The purchase was effected on September 30, 2006, and the new investment advisory agreement took effect on October 1, 2006. The terms of this new investment advisory agreement are identical to the Fund's prior investment advisory agreement. This new agreement has an initial term of two years expiring October 1, 2008. At a special meeting of shareholders held on May 2, 2006, the shareholders of the Fund approved the new investment advisory agreement. Finally, on October 1, 2006, Resolute changed its name to First Pacific Advisors, LLC.
In determining whether to approve the advisory agreements, those Fund Directors who were not interested persons of the Adviser met separately to evaluate information provided by the Adviser in accordance with the 1940 Act and to determine their recommendation to the full Board of Directors. The Directors considered a variety of factors, including the quality of advisory, management and accounting services provided to the Fund, the fees and expenses borne by the Fund, the profitability of the Adviser and the investment performance of the Fund both on an absolute basis and as compared with a peer group of mutual funds. The Fund's advisory fee and expense ratio were also considered in light of the advisory fees and expense ratios of a peer group of mutual funds. The Directors noted the quality and depth of experience of the Adviser and its investment and administrative personnel. Based upon its consideration of these and other relevant factors , the Directors concluded that the advisory fees and other expenses paid by the Fund are fair and that shareholders have received reasonable value in return for such fees and expenses.
16
DIRECTOR AND OFFICER INFORMATION
(unaudited)
| Name & Address | Position(s) With Company | Principal Occupation(s) During the Past 5 Years | Portfolios in Fund Complex Overseen | Other Directorships | |||||||||||||||
| Willard H. Altman, Jr. – (71)* | Director† Years Served: 9 | Retired. Formerly, until 1995, Partner of Ernst & Young LLP, a public accounting firm. | 6 | ||||||||||||||||
| A. Robert Pisano – (63)* | Director† Years Served: 2 | President and Chief Operating Officer of the Motion Picture Association of America, Inc. since October 2005. Formerly, until 2005, National Executive Director and Chief Executive Officer of the Screen Actors Guild. | 5 | State Net, Resources Global Professionals, and the Motion Picture and Television Fund. | |||||||||||||||
| Lawrence J. Sheehan – (74)* | Director & Chairman† Years Served: 16 | Retired. Formerly Partner (1969 to 1994) and of counsel employee (1994 to 2002) of the law firm of O'Melveny & Myers LLP. | 6 | ||||||||||||||||
| Eric S. Ende – (62) | Director†, President & Portfolio Manager Years Served: 7 | Partner of the Adviser since 2006. Formerly Senior Vice President of First Pacific Advisors, Inc. from 1984 to 2006. | 3 | ||||||||||||||||
| Steven R. Geist – (53) | Executive Vice President & Portfolio Manager Years Served: 11 | Partner of the Adviser since 2006. Formerly Vice President of First Pacific Advisors, Inc. from 1992 to 2006. | |||||||||||||||||
| J. Richard Atwood – (46) | Treasurer Years Served: 10 | Chief Operating Officer of the Adviser. President of FPA Fund Distributors, Inc. | FPA Fund Distributors, Inc. | ||||||||||||||||
| Sherry Sasaki – (52) | Secretary Years Served: 24 | Assistant Vice President and Secretary of the Adviser and Secretary of FPA Fund Distributors, Inc. | |||||||||||||||||
| Christopher H. Thomas – (49) | Chief Compliance Officer Years Served: 2 | Vice President and Chief Compliance Officer of the Adviser. Vice President of FPA Fund Distributors, Inc. | FPA Fund Distributors, Inc. | ||||||||||||||||
| E. Lake Setzler – (39) | Assistant Treasurer Years Served: 1 | Vice President and Controller of the Adviser since 2005. Formerly Chief Operating Officer of Inflective Asset Management, LLC (2004-2005) and Vice President of Transamerica Investment Management, LLC (2000-2004). | |||||||||||||||||
† Directors serve until their resignation, removal or retirement.
* Audit Commitee Member
Additional information on the Directors is available in the Statement of Additional Information. Each of the above listed individuals can be contacted at 11400 W. Olympic Blvd., Suite 1200, Los Angeles, CA, 90064.
17
FPA PERENNIAL FUND, INC.
INVESTMENT ADVISER
First Pacific Advisors, LLC
11400 West Olympic Boulevard, Suite 1200
Los Angeles, CA 90064
SHAREHOLDER SERVICE AGENT
Boston Financial Data Services, Inc.
P.O. Box 8115
Boston, Massachusetts 02266-8115
(800) 638-3060
(617) 483-5000
CUSTODIAN & TRANSFER AGENT
State Street Bank and Trust Company
Boston, Massachusetts
TICKER SYMBOL: FPPFX
CUSIP: 302548102
DISTRIBUTOR
FPA Fund Distributors, Inc.
11400 West Olympic Boulevard, Suite 1200
Los Angeles, California 90064
COUNSEL
O'Melveny & Myers LLP
Los Angeles, California
INDEPENDENT REGISTERED PUBLIC
ACCOUNTING FIRM
Deloitte & Touche LLP
Los Angeles, California
This report has been prepared for the information of shareholders of FPA Perennial Fund, Inc., and is not authorized for distribution to prospective investors unless preceded or accompanied by an effective prospectus.
The Fund's complete proxy voting record for the 12 months ended June 30, 2006 is available without charge, upon request, by calling (800) 982-4372 and on the SEC's website at www.sec.gov.
The Fund's schedule of portfolio holdings, filed the first and third quarter on Form N-Q with the SEC, is available on the SEC's website at www.sec.gov. Form N-Q is available at the SEC's Public Reference Room in Washington, D.C., and information on the operations of the Public Reference Room may be obtained by calling 1-202-942-8090. To obtain information on Form N-Q from the Fund, shareholders can call 1-800-982-4372.
Additional information about the Fund is available online at www.fpafunds.com. This information includes, among other things, holdings, top sectors and performance, and is updated on or about the 15th business day after the end of the quarter.
Item 2. Code of Ethics.
(a) The registrant has adopted a code of ethics that applies to the registrant’s senior executive and financial officers.
(b) Not Applicable
(c) During the period covered by this report, there were not any amendments to the provisions of the code of ethics adopted in 2(a) above.
(d) During the period covered by this report, there were not any implicit or explicit waivers to the provisions of the code of ethics adopted in 2(a).
(e) Not Applicable
(f) A copy of the registrant’s code of ethics is filed as an exhibit to this Form N-CSR. Upon request, any person may obtain a copy of this code of ethics, without charge, by calling (800) 982-4372.
Item 3. Audit Committee Financial Expert.
The registrant’s board of directors has determined that Willard H. Altman, Jr., a member of the registrant’s audit committee and board of directors, is an “audit committee financial expert” and is “independent,” as those terms are defined in this Item. This designation will not increase the designee’s duties, obligations or liability as compared to his duties, obligations and liability as a member of the audit committee and of the board of directors. This designation does not affect the duties, obligations or liability of any other member of the audit committee or the board of directors.
Item 4. Principal Accountant Fees and Services.
|
|
| 2005 |
| 2006 |
| |||
|
| 30,000 |
| $ | 32,000 |
| |||
(b) |
| Audit Related Fees |
| -0- |
| -0- |
| ||
(c) |
| Tax Fees |
| $ | 6,050 |
| $ | 6,300 |
|
(d) |
| All Other Fees |
| -0- |
| -0- |
| ||
(e)(1) Disclose the audit committee’s pre-approval policies and procedures described in paragraph (c)(7) of Rule 2-01 of Regulation S-X. The audit committee shall pre-approve all audit and permissible non-audit services that the committee considers compatible with maintaining the independent auditors’ independence. The pre-approval requirement will extend to all non-audit services provided to the registrant, the adviser, and any entity controlling, controlled by, or under common control with the adviser that provides ongoing services to the registrant, if the engagement relates directly to the operations and financial
reporting of the registrant; provided, however, that an engagement of the registrant’s independent auditors to perform attest services for the registrant, the adviser or its affiliates required by generally accepted auditing standards to complete the examination of the registrant’s financial statements (such as an examination conducted in accordance with Statement on Auditing Standards Number 70 issued by the American Institute of Certified Public Accountants), will be deem pre-approved if: (i) the registrant’s independent auditors inform the audit committee of the engagement, (ii) the registrant’s independent auditors advise the audit committee at least annually that the performance of this engagement will not impair the independent auditor’s independence with respect to the registrant, and (iii) the audit committee receives a copy of the independent auditor’s report prepared in connection with such services. The committee may delegate to one or more committee members the authority to review and pre-approve audit and permissible non-audit services. Actions taken under any such delegation will be reported to the full committee at its next meeting.
(e)(2) Disclose the percentage of services described in each of paragraphs (b) – (d) of this Item that were approved by the audit committee pursuant to paragraph (c)(7)(i)(C) of Rule 2-01 of Regulation S-X. 100% of the services provided to the registrant described in paragraphs (b) – (d) of this Item were pre-approved by the audit committee pursuant to paragraph (e)(1) of this Item. There were no services provided to the investment adviser or any entity controlling, controlled by or under common control with the adviser described in paragraphs (b) – (d) of this Item that were required to be pre-approved by the audit committee.
(f) If greater than 50%, disclose the percentage of hours expended on the principal accountant’s engagement to audit the registrant’s financial statements for the most recent fiscal year that were attributed to work performed by persons other than the principal accountant’s full-time, permanent employees. All services performed on the engagement to audit the registrant’s financial statements for the most recent fiscal year end were performed by the principal accountant’s full-time, permanent employees.
(g) Disclose the aggregate non-audit fees billed by the registrant’s accountant for services rendered to the registrant, and rendered to the registrant’s investment adviser (not including any sub-adviser whose role is primarily portfolio management and is subcontracted with or overseen by another investment adviser), and any entity controlling, controlled by, or under common control with the adviser that provides ongoing services to the registrant for each of the last two fiscal years of the registrant. None.
(h) Disclose whether the registrant’s audit committee of the board of directors has considered whether the provision of non-audit services that were rendered to the registrant’s investment adviser (not including any sub-adviser whose role is primarily portfolio management and is subcontracted with or overseen by another investment adviser), and any entity controlling, controlled by, or under common control with the investment adviser that provides ongoing services to the registrant that were not pre-approved pursuant to paragraph (c)(7)(ii) of Rule 2-01 of Regulation S-X is compatible with maintaining the principal accountant’s independence. Not Applicable.
Item 5. Audit Committee of Listed Registrants. Not Applicable.
Item 6. Schedule of Investments. The schedule of investments is included as part of the report to stockholders filed under Item 1 of this Form.
Item 7. Disclosure of Proxy Voting Policies and Procedures for Closed-End Management Investment Companies. Not Applicable.
Item 8. Portfolio Managers of Closed-End Management Investment Companies. Not Applicable.
Item 9. Purchases of Equity Securities by Closed-End Management Investment Company and Affiliated Purchasers. Not Applicable.
Item 10. Submission of Matters to a Vote of Security Holders. There has been no material change to the procedures by which shareholders may recommend nominees to the registrant’s board of directors.
Item 11. Controls and Procedures.
(a) The principal executive officer and principal financial officer of the registrant have concluded that the registrant’s disclosure controls and procedures (as defined in Rule 30a-3(c) under the Investment Company Act of 1940) are effective based on their evaluation of the disclosure controls and procedures as of a date within 90 days of the filing date of this report.
(b) There have been no significant changes in the registrant’s internal controls over financial reporting (as defined in Rule 30a-3(d) under the Investment Company Act of 1940) that occurred during the second fiscal quarter of the period covered by this report that have materially affected, or is reasonably likely to materially affect, the registrant’s internal controls over financial reporting.
Item 12. | Exhibits. |
(a)(1) Code of ethics as applies to the registrant’s officers and directors, as required to be disclosed under Item 2 of Form N-CSR. Attached hereto as Ex.99.CODE.ETH.
(a)(2) Separate certification for the registrant’s principal executive officer and principal financial officer, as required by Rule 30a-2(a) under the Investment Company Act of 1940. Attached hereto.
(a)(3) Not Applicable
(b) Separate certification for the registrant’s principal executive officer and principal financial officer, as required by Rule 30a-2(b) under the Investment Company Act of 1940. Attached hereto.
SIGNATURES
Pursuant to the requirements of the Securities Exchange Act of 1934 and the Investment Company Act of 1940, the registrant has duly caused this report to be signed on its behalf by the undersigned, thereunto duly authorized.
FPA PERENNIAL FUND, INC. | ||||
| ||||
|
| |||
By: | /s/ ERIC S. ENDE |
| ||
| Eric S. Ende, President | |||
| (Principal Executive Officer) | |||
| ||||
Date: | February 22, 2007 | |||
Pursuant to the requirements of the Securities Exchange Act of 1934 and the Investment Company Act of 1940, this report has been signed below by the following persons on behalf of the registrant and in the capacities and on the dates indicated.
FPA PERENNIAL FUND, INC. | |||||||
|
| ||||||
|
| ||||||
By: | /s/ ERIC S. ENDE |
| |||||
| Eric S. Ende, President | ||||||
| (Principal Executive Officer) | ||||||
| |||||||
Date: | February 22, 2007 | ||||||
|
| ||||||
|
| ||||||
By: | /s/ J. RICHARD ATWOOD |
| |||||
| J. Richard Atwood, Treasurer | ||||||
| (Principal Financial Officer) | ||||||
| |||||||
Date: | February 22, 2007 | ||||||