UNITED STATES
SECURITIES AND EXCHANGE COMMISSION
Washington, D.C. 20549
FORM N-CSR
CERTIFIED SHAREHOLDER REPORT OF REGISTERED
MANAGEMENT INVESTMENT COMPANIES
Investment Company Act file number | 811-3896 | ||||||||
| |||||||||
FPA PERENNIAL FUND, INC. | |||||||||
(Exact name of registrant as specified in charter) | |||||||||
| |||||||||
11400 WEST OLYMPIC BLVD., SUITE 1200, LOS ANGELES, CALIFORNIA |
| 90064 | |||||||
(Address of principal executive offices) |
| (Zip code) | |||||||
| |||||||||
J. RICHARD ATWOOD, 11400 WEST OLYMPIC BLVD., SUITE 1200, LOS ANGELES, CALIFORNIA 90064 | |||||||||
(Name and address of agent for service) | |||||||||
| |||||||||
Registrant’s telephone number, including area code: | 310-473-0225 |
| |||||||
| |||||||||
Date of fiscal year end: | DECEMBER 31 |
| |||||||
| |||||||||
Date of reporting period: | DECEMBER 31, 2008 |
| |||||||
Item 1. Report to Stockholders.
Annual Report

Distributor:
FPA FUND DISTRIBUTORS, INC.
11400 West Olympic Boulevard, Suite 1200
Los Angeles, California 90064
51501
FPA Perennial Fund, Inc.
December 31, 2008
LETTER TO SHAREHOLDERS
After a "mere" 15-20% decline in the first nine months, the market seriously swooned in the fourth quarter with losses of 20-25% for the major indexes. This brought the full year 2008 drop to 35-40%. If combined with the initial stages of the bear market during the last quarter of 2007, the total decline (so far) is roughly comparable to the 1973-74 market, which was arguably the worst since the Great Depression.
At this writing it is unclear whether the market bottomed during the fourth quarter, or this is still ahead of us. The S&P reached about 750 in late November, but closed the year 20% above this. January of 2009 has seen a market retreat however.
We believe that the market has concluded that the initial recapitalization of the banking system was inadequate given the increasing scope of its losses, now moving beyond exotic securities to more traditional assets like commercial real estate and leveraged buyout loans. Beyond financial concerns, the world economy appeared to be in free fall during the fourth quarter.
It is also an open question how effective the expected massive fiscal stimulus will be, given the offsetting dramatic increase in the personal savings rate — a reaction to both economic uncertainty and to the very large capital losses suffered in household real estate and equity holdings.
Perennial's performance for 2008, a full-year decline of 38%, was the worst in its history, though comparable to the market averages. We were disappointed by this result, both as managers and as fellow shareholders.
We can assure our shareholders that we have and will continue to adhere to the investment philosophy of owning high-quality businesses, which we expect will outperform their competitors over a multi-year time horizon. They have leading market shares, superior returns on capital, and strong balance sheets.
At year-end the portfolio's historical earnings per share (EPS) growth rate was 15%, its return on virtually unleveraged equity was 16%, and net debt as a percent of capital was 17%. All this for a PE of just 10x. In contrast, the market's returns, growth, and leverage are all inferior, but the PE is 14x. These are extremely favorable metrics which auger well for future performance. We continue to believe that owning much better than average companies at below market valuation is the key to strong portfolio performance over the long run.
Perennial was down about 29% in the fourth quarter. The best performers were companies perceived as beneficiaries of lower oil prices — retailer O'Reilly Automotive (+15%), truckload carriers Heartland (+2%) and Knight (down 5%). Other stocks doing relatively well included Brown & Brown, Lincare, and CLARCOR.
On the negative side, the worst-performing portfolio companies were oil service companies —Noble and Helix — (down 50-70%) and firms providing products and services supporting life sciences research — Charles River Labs, and Life Technologies — which declined 40-50%. Unlike the oil service decline, which though overdone is understandable, the drop in the healthcare related companies appears to be unjustified by either actual or prospective business performance. Both are market leaders with extremely high operating margins and stable markets. At their November lows, each was selling at about 8x earnings. We added to positions in both oil service and life sciences research during the quarter.
For the year, the stock performance story is similar. The best performers were Heartland, Knight, and O'Reilly, while the worst were oil services and life sciences research support companies.
1
The table below shows performance for both Perennial and the benchmark Russell 2500, as well as the leading large cap indexes. Returns for the longer 5- and 10-year periods have been more competitive than more recent periods. The investor who purchased equal amounts of Perennial, the S&P 500, and the Nasdaq ten years ago would find that his Perennial investment is worth twice the S&P and two and a half times the Nasdaq results.
| Fourth Quarter | 2008 | 3 Years* | 5 Years* | 10 Years* | |||||||||||||||||||
| FPA Perennial** | (28.9 | )% | (37.8 | )% | (11.5 | )% | (1.9 | )% | 6.6 | % | |||||||||||||
| Russell 2500 | (26.3 | )% | (36.8 | )% | (9.4 | )% | (1.0 | )% | 4.1 | % | |||||||||||||
| S&P 500 | (21.9 | )% | (37.0 | )% | (8.4 | )% | (2.2 | )% | (1.4 | )% | |||||||||||||
| Nasdaq | (24.6 | )% | (40.5 | )% | (10.6 | )% | (4.7 | )% | (3.2 | )% | |||||||||||||
*Annualized
**Does not reflect deduction of the sales charge which, if reflected, would reduce the performance shown
As we mentioned above, we have responded to the price declines in energy companies by adding to our positions. But we have taken a focused, not a shotgun approach. Specifically we have emphasized oil service companies with a significant portion of their business in deep water offshore.
Although the modern oil industry dates back to the well drilled by Colonel Drake in Titusville, Pennsylvania in 1858, it is only much more recently, after World War II, that the industry first ventured offshore.
There are significant technical challenges associated with both exploring and developing discoveries offshore, and especially in deeper waters. It has been accomplished only with the help of an impressive stream of technical innovations, which continue to this day.
Initially offshore activity required that both drilling rigs and production platforms be attached to the sea floor. This limited drilling to about 400 feet of water. Permanent production platforms ultimately went deeper than this, but became uneconomic at water depths greater than 1,000 feet.
More recently, petroleum engineers have succeeded in developing techniques to drill commercially at ever increasing depths, currently exceeding two miles, as well as methods to develop and produce a successful discovery.
Operations in deep water have both significant barriers to entry as well as strong growth prospects. Because it is so technically demanding, only a small number of companies have the expertise to operate safely and efficiently in this environment. Very expensive equipment is required. On the drilling side, a semi-submersible or drill ship costs $500-750 million, and a fleet of several vessels currently is the minimum needed to be viewed as a credible operator.
Because the industry's ability to deal with deep-water challenges is extremely recent, much of the prospective geology in deep water is still relatively unexplored. Interest levels have been high, there have been numerous large discoveries, and current growth is being constrained by limited drilling capacity.
There has been considerable concern that depressed oil prices will reduce industry investment, including deep water. While there is no question that deep water is an expensive place to operate, and is not especially helped by current price levels, there are several mitigating factors.
First, although deep-water activity is expensive, the basins are so lightly explored that discoveries tend to be very large, thus, cost per recoverable barrel is often not much different than in shallow water or on land.
Second, exploring and developing deep-water discoveries is a very long-term activity and the large national oil companies and super majors managing most of the projects have very long time horizons. They aim to prevent short-term oil price volatility from disrupting multi-decade projects.
In addition, we believe the recent profound decline in oil prices, driven by reduced levels of economic activity worldwide, is as unsustainable as the huge price spike which preceded it. Lower oil prices will be met by a supply response (lower
2
investment and production), amplified by the natural decline curve of many aging fields. Eventually, when economic activity revives and boosts demand, prices will move to higher and more sustainable levels. As patient investors, we are quite prepared to wait for this return to market equilibrium.
And beyond this cyclically-driven medium-term improvement in the oil markets, secular longer-term trends remain very attractive. Demand, driven by developing nations like India and China, will grow faster than supply, which may in fact be close to a peak, boosting prices and supporting the technically challenging and more expensive exploration and development in deeper waters.
Perennial holds shares in four companies with a significant part of their business driven by deep-water activities. Combined they are about 8% of the portfolio, with Noble being the largest position. Average PE is under 6x, return on equity is 33%, and net debt as a percent of capital is a low 19%. The stock prices on December 31 represented an average 68% decline from the year 2008 highs.
Along with Transocean and Diamond Offshore, Noble is one of the leading offshore drilling contractors. Although it continues to operate jackups in relatively shallow waters (up to 400 feet), Noble's expansion focus has been on deep water, and the equipment it has been adding to the fleet is primarily semi-submersibles and drill ships capable of drilling at 10,000-foot depths.
Noble has historically earned better returns on capital than its peers through well-timed fleet additions, delivered on budget and on schedule, and by securing long-term contracts prior to committing to new orders.
Its operations are well diversified, avoiding the volatile shallow U.S. Gulf of Mexico, with a special focus on Brazil, West Africa, the North Sea, the Middle East and the deeper waters of the Gulf of Mexico. Noble has a relatively low cost structure, yet not at the expense of safety or operating efficiency.
Noble has a significant backlog of long-term contracts with financially strong customers, mostly national oil companies (Petrobras, Pemex, etc.) or large integrated majors (Shell, Exxon, Chevron, etc.). At $12 billion, its backlog alone is the equivalent of over three years of future revenue.
Our second deep-water company is FMC Technologies. FMC, along with Cameron International, is the leader in subsea production systems, consisting of trees, controls, manifolds, and related equipment. Placed at the well head on the sea floor, these components regulate oil and gas flows, control pressure, and permit safe access to the well for maintenance.
FMC is expanding its market through some new subsea technologies it has developed, including oil-water separation and water reinjection, as well as gas-liquids separation and gas compression. The key point is that these processes, which were traditionally performed on production platforms, can now be done on the sea floor. This reduces the need for expensive platform "real estate" and improves the economics of many offshore projects.
Helix Energy is primarily involved in deep water construction activities, including pipelay, equipment installation, diving, well intervention, and inspection and maintenance activities. Originally only a domestic operator, it has steadily increased its international activities.
Actuant, a relatively recent purchase, is a diversified industrial company with a substantial and increasing portion of its sales going to oil and gas markets. Historically most of its sales in this area have been high-force hydraulic tools for maintenance and repair applications, and joint integrity products, for pipeline maintenance. Actuant has moved more aggressively into offshore and deep-water markets with its recent Cortland acquisition, whose cables, rope, and umbilicals support exploration, development, and production applications. In total, we estimate that about $250 million or 15-20% of Actuant's annual sales is to oil and gas markets.
3
Despite the challenges posed by the world-wide economic slowdown and the accompanying dramatic decline in oil prices, we believe that our ownership of high-quality competitively-strong oil service companies will produce an attractive return to Perennial shareholders over the long term.
Respectfully submitted,

Eric S. Ende
President and Portfolio Manager
February 2, 2009
The discussion of Fund investments represents the views of the Fund's managers at the time of this report and are subject to change without notice. References to individual securities are for informational purposes only and should not be construed as recommendations to purchase or sell individual securities. While the Fund's managers believe that the Fund's holdings are value stocks, there can be no assurance that others will consider them as such. Further, investing in value stocks presents the risk that value stocks may fall out of favor with investors and underperform growth stocks during given periods.
The Russell 2000 Index is an unmanaged index comprised of the 2,000 smallest companies in the Russell 3000 Index. The Russell 2500 Index is an unmanaged index comprised of the 2,500 smallest companies in the Russell 3000 Index. The Russell 3000 Index measures the performance of the 3,000 largest U.S. companies based on total market capitalization. The S&P 500 Index is an index of 500 companies with large market capitalization. The Nasdaq Composite Index is a market capitalization index comprised of over 3,000 stocks.
FORWARD LOOKING STATEMENT DISCLOSURE
As fund managers, one of our responsibilities is to communicate with shareholders in an open and direct manner. Insofar as some of our opinions and comments in our letters to shareholders are based on current management expectations, they are considered "forward-looking statements" which may or may not be accurate over the long term. While we believe we have a reasonable basis for our comments and we have confidence in our opinions, actual results may differ materially from those we anticipate. You can identify forward-looking statements by words such as "believe," "expect," "may," "anticipate," and other similar expressions when discussing prospects for particular portfolio holdings and/or the markets, generally. We cannot, however, assure future results and disclaim any obligation to update or alter any forward-looking statements, whether as a result of new information, future events, or otherwise. Further, information provided in this rep ort should not be construed as a recommendation to purchase or sell any particular security.
4
HISTORICAL PERFORMANCE
Change in Value of a $10,000 Investment in FPA Perennial Fund, Inc. vs. Russell 2500 Index and Lipper Mid-Cap Core Fund Average for the Ten Years Ended December 31, 2008
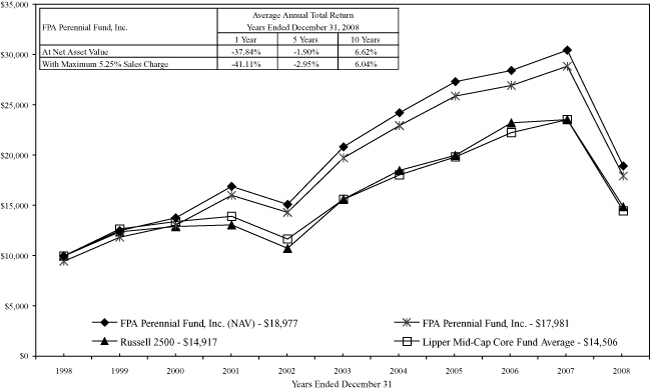
Past performance is not indicative of future performance. The Russell 2500 Index consists of the 2,500 smallest companies in the Russell 3000 total capitalization universe. This index is considered a measure of small to medium capitalization stock performance. This index does not reflect any commissions or fees which would be incurred by an investor purchasing the stocks it represents. The Lipper Mid-Cap Core Fund Average provides an additional comparison of how your Fund performed in relation to other mutual funds with similar objectives. The Lipper data does not include sales charges. The performance shown for FPA Perennial Fund, Inc., with an ending value of $17,981 reflects deduction of the current maximum sales charge of 5.25% of the offering price. In addition, since investors purchase shares of the Fund with varying sales charges depending primarily on volume purchased, the Fund's performance at net asset value (NAV) is also shown, as reflected by the ending value of $18,977. The performance of the Fund and of the Averages is computed on a total return basis which includes reinvestment of all distributions.
5
PORTFOLIO SUMMARY
December 31, 2008
(Unaudited)
| Common Stocks | 92.9 | % | |||||||||
| Business Services & Supplies | 27.3 | % | |||||||||
| Producer Durable Goods | 18.3 | % | |||||||||
| Retailing | 11.7 | % | |||||||||
| Transportation | 10.4 | % | |||||||||
| Health Care | 8.9 | % | |||||||||
| Energy | 7.1 | % | |||||||||
| Technology | 5.2 | % | |||||||||
| Financial | 4.0 | % | |||||||||
| Short-Term Investments | 7.5 | % | |||||||||
| Other Assets and Liabilities, net | (0.4 | )% | |||||||||
| Net Assets | 100.0 | % | |||||
MAJOR PORTFOLIO CHANGES
Six Months Ended December 31, 2008
(Unaudited)
| Shares | |||||||
| NET PURCHASES | |||||||
| Common Stocks | |||||||
| Actuant Corporation (Class A) (1) | 100,000 | ||||||
| FMC Technologies, Inc. (1) | 135,000 | ||||||
| Signet Jewelers Ltd. | 73,700 | ||||||
| VCA Antech, Inc. (1) | 145,000 | ||||||
| WABCO Holdings, Inc. | 271,500 | ||||||
| NET SALES | |||||||
| Common Stocks | |||||||
| AmSurg Corporation (2) | 234,200 | ||||||
| Brady Corporation | 76,100 | ||||||
| Brown & Brown, Inc. | 114,800 | ||||||
| CarMax , Inc. | 98,200 | ||||||
| CLARCOR, Inc. | 61,700 | ||||||
| Cognex Corporation | 439,800 | ||||||
| Franklin Electric Co., Inc. | 34,900 | ||||||
| HNI Corporation | 14,200 | ||||||
| Heartland Express, Inc. | 94,300 | ||||||
| Helix Energy Solutions Group, Inc. | 43,000 | ||||||
| IDEX Corporation | 104,400 | ||||||
| Knight Transportation, Inc. | 87,400 | ||||||
| Lincare Holdings, Inc. | 65,700 | ||||||
| Maxim Integrated Products, Inc. | 35,400 | ||||||
| Microchip Technology, Incorporated | 43,200 | ||||||
| O'Reilly Automotive, Inc. | 50,600 | ||||||
| Plantronics, Inc. (2) | 568,600 | ||||||
| SanDisk Corporation (2) | 121,700 | ||||||
| ScanSource, Inc. | 78,443 | ||||||
| Zebra Technologies Corporation | 44,100 | ||||||
(1) Indicates new commitment to portfolio
(2) Indicates elimination from portfolio
6
PORTFOLIO OF INVESTMENTS
December 31, 2008
| COMMON STOCKS | Shares | Value | |||||||||
| BUSINESS SERVICES & SUPPLIES — 27.3% | |||||||||||
| Brady Corporation | 261,500 | $ | 6,262,925 | ||||||||
| Charles River Laboratories International, Inc.* | 307,500 | 8,056,500 | |||||||||
| CLARCOR, Inc. | 186,700 | 6,194,706 | |||||||||
| Copart, Inc.* | 201,700 | 5,484,223 | |||||||||
| Landauer, Inc. | 9,200 | 674,360 | |||||||||
| Life Technologies Corporation* | 335,000 | 7,808,850 | |||||||||
| Manpower Inc. | 180,000 | 6,118,200 | |||||||||
| ScanSource, Inc.* | 530,401 | 10,220,827 | |||||||||
| $ | 50,820,591 | ||||||||||
| PRODUCER DURABLE GOODS — 18.3% | |||||||||||
| Actuant Corporation (Class A) | 100,000 | $ | 1,902,000 | ||||||||
| Franklin Electric Co., Inc. | 170,900 | 4,803,999 | |||||||||
| Graco Inc. | 226,200 | 5,367,726 | |||||||||
| HNI Corporation | 373,300 | 5,913,072 | |||||||||
| IDEX Corporation | 215,050 | 5,193,458 | |||||||||
| WABCO Holdings, Inc. | 311,500 | 4,918,585 | |||||||||
| Zebra Technologies Corporation (Class A)* | 300,600 | 6,090,156 | |||||||||
| $ | 34,188,996 | ||||||||||
| RETAILING — 11.7% | |||||||||||
| CarMax, Inc.* | 654,700 | $ | 5,159,036 | ||||||||
| O'Reilly Automotive, Inc.* | 404,800 | 12,443,552 | |||||||||
| Signet Jewelers Ltd. | 488,700 | 4,237,029 | |||||||||
| $ | 21,839,617 | ||||||||||
| TRANSPORTATION — 10.4% | |||||||||||
| Heartland Express, Inc. | 636,500 | $ | 10,031,240 | ||||||||
| Knight Transportation, Inc. | 583,200 | 9,401,184 | |||||||||
| $ | 19,432,424 | ||||||||||
| HEALTH CARE — 8.9% | |||||||||||
| Bio-Rad Laboratories, Inc.* | 85,000 | $ | 6,401,350 | ||||||||
| Lincare Holdings Inc.* | 268,100 | 7,219,933 | |||||||||
| VCA Antech, Inc.* | 145,000 | 2,882,600 | |||||||||
| $ | 16,503,883 | ||||||||||
| ENERGY — 7.1% | |||||||||||
| FMC Technologies, Inc.* | 135,000 | $ | 3,217,050 | ||||||||
| Helix Energy Solutions Group, Inc.* | 366,800 | 2,655,632 | |||||||||
| Noble Corporation | 335,000 | 7,400,150 | |||||||||
| $ | 13,272,832 | ||||||||||
7
PORTFOLIO OF INVESTMENTS
December 31, 2008
| COMMON STOCKS — Continued | Shares or Principal Amount | Value | |||||||||
| TECHNOLOGY — 5.2% | |||||||||||
| Cognex Corporation | 85,900 | $ | 1,271,320 | ||||||||
| Maxim Integrated Products, Inc. | 240,900 | 2,751,078 | |||||||||
| Microchip Technologies, Inc. | 294,000 | 5,741,820 | |||||||||
| $ | 9,764,218 | ||||||||||
| FINANCIAL — 4.0% | |||||||||||
| Brown & Brown, Inc. | 355,300 | $ | 7,425,770 | ||||||||
| TOTAL COMMON STOCKS — 92.9% (Cost $191,034,847) | $ | 173,248,331 | |||||||||
| SHORT-TERM INVESTMENTS — 7.5% (Cost $14,034,953) | |||||||||||
| State Street Bank Repurchase Agreement — 0.01% 1/02/09 | $ | 5,535,000 | $ | 5,535,000 | |||||||
| (Collateralized by U.S. Treasury Bond — 4.75% 2037) | |||||||||||
| Chevron Funding Corporation — 0.05% 1/05/09 | 8,500,000 | 8,499,953 | |||||||||
| TOTAL SHORT-TERM INVESTMENTS | $ | 14,034,953 | |||||||||
| TOTAL INVESTMENTS — 100.4% (Cost $205,069,800) | $ | 187,283,284 | |||||||||
| Other assets and liabilities, net — (0.4)% | (769,296 | ) | |||||||||
| NET ASSETS — 100% | $ | 186,513,988 | |||||||||
*Non-income producing securities
See notes to financial statements.
8
STATEMENT OF ASSETS AND LIABILITIES
December 31, 2008
| ASSETS | |||||||||||
| Investments at value: | |||||||||||
| Investment securities — at market value (identified cost $191,034,847) | $ | 173,248,331 | |||||||||
| Short-term investments — at amortized cost (maturities 60 days or less) | 14,034,953 | $ | 187,283,284 | ||||||||
| Cash | 300 | ||||||||||
| Receivable for: | |||||||||||
| Capital stock sold | $ | 173,824 | |||||||||
| Dividends | 4,830 | 178,654 | |||||||||
| $ | 187,462,238 | ||||||||||
| LIABILITIES | |||||||||||
| Payable for: | |||||||||||
| Capital stock repurchased | $ | 766,694 | |||||||||
| Advisory fees and financial services | 116,196 | ||||||||||
| Accrued expenses | 65,360 | 948,250 | |||||||||
| NET ASSETS | $ | 186,513,988 | |||||||||
| SUMMARY OF SHAREHOLDERS' EQUITY | |||||||||||
| Capital stock — par value $0.01 per share; authorized 25,000,000 shares; 8,913,200 outstanding shares | $ | 89,132 | |||||||||
| Additional paid-in capital | 212,163,506 | ||||||||||
| Undistributed net investment income | 10,367 | ||||||||||
| Accumulated net realized loss on investments | (7,962,501 | ) | |||||||||
| Unrealized depreciation of investments | (17,786,516 | ) | |||||||||
| NET ASSETS | $ | 186,513,988 | |||||||||
| NET ASSET VALUE, REDEMPTION PRICE AND MAXIMUM OFFERING PRICE PER SHARE | |||||||||||
| Net asset value and redemption price per share (net assets divided by shares outstanding) | $ | 20.93 | |||||||||
| Maximum offering price per share (100/94.75 of per share net asset value) | $ | 22.09 | |||||||||
See notes to financial statements.
9
STATEMENT OF OPERATIONS
December 31, 2008
| INVESTMENT INCOME | |||||||||||
| Interest | $ | 259,258 | |||||||||
| Dividends | 3,384,654 | ||||||||||
| $ | 3,643,912 | ||||||||||
| EXPENSES: | |||||||||||
| Advisory fees | $ | 1,991,599 | |||||||||
| Transfer agent fees and expenses | 460,736 | ||||||||||
| Financial services | 298,707 | ||||||||||
| Reports to shareholders | 62,325 | ||||||||||
| Custodian fees and expenses | 47,313 | ||||||||||
| Audit fees | 40,050 | ||||||||||
| Registration fees | 34,817 | ||||||||||
| Directors fees and expenses | 26,000 | ||||||||||
| Legal fees | 14,688 | ||||||||||
| Insurance | 11,654 | ||||||||||
| Other fees and expenses | 9,497 | 2,997,386 | |||||||||
| Net investment income | $ | 646,526 | |||||||||
| NET REALIZED AND UNREALIZED LOSS ON INVESTMENTS | |||||||||||
| Net realized loss on investments: | |||||||||||
| Proceeds from sales of investment securities | $ | 109,780,706 | |||||||||
| Cost of investment securities sold | 115,896,521 | ||||||||||
| Net realized loss on investments | $ | (6,115,815 | ) | ||||||||
| Change in unrealized appreciation of investments: | |||||||||||
| Unrealized appreciation at beginning of year | $ | 105,360,660 | |||||||||
| Unrealized depreciation at end of year | (17,786,516 | ) | |||||||||
| Change in unrealized appreciation of investments | (123,147,176 | ) | |||||||||
| Net realized and unrealized loss on investments | $ | (129,262,991 | ) | ||||||||
| NET CHANGE IN NET ASSETS RESULTING FROM OPERATIONS | $ | (128,616,465 | ) | ||||||||
See notes to financial statements.
10
STATEMENT OF CHANGES IN NET ASSETS
| For the Year Ended December 31, | |||||||||||||||||||
| 2008 | 2007 | ||||||||||||||||||
| CHANGE IN NET ASSETS | |||||||||||||||||||
| Operations: | |||||||||||||||||||
| Net investment income | $ | 646,526 | $ | 1,743,666 | |||||||||||||||
| Net realized gain (loss) on investments | (6,115,815 | ) | 31,507,032 | ||||||||||||||||
| Change in unrealized appreciation of investments | (123,147,176 | ) | 2,246,221 | ||||||||||||||||
| Change in net assets resulting from operations | $ | (128,616,465 | ) | $ | 35,496,919 | ||||||||||||||
| Distributions to shareholders from: | |||||||||||||||||||
| Net investment income | $ | (636,159 | ) | $ | (1,939,735 | ) | |||||||||||||
| Net realized capital gains | (3,241,015 | ) | (3,877,174 | ) | (29,489,583 | ) | (31,429,318 | ) | |||||||||||
| Capital Stock transactions: | |||||||||||||||||||
| Proceeds from Capital Stock sold | $ | 31,997,877 | $ | 47,407,160 | |||||||||||||||
| Proceeds from shares issued to shareholders upon reinvestment of dividends and distributions | 3,186,307 | 25,973,536 | |||||||||||||||||
| Cost of Capital Stock repurchased* | (107,421,688 | ) | (72,237,504 | ) | (240,507,848 | ) | (167,127,152 | ) | |||||||||||
| Total change in net assets | $ | (204,731,143 | ) | $ | (163,059,551 | ) | |||||||||||||
| NET ASSETS | |||||||||||||||||||
| Beginning of year, including undistributed net investment income of zero and $196,069 at December 31, 2007 and 2006, respectively | 391,245,131 | 554,304,682 | |||||||||||||||||
| End of year, including undistributed net investment income of $10,367 and zero at December 31, 2008 and 2007, respectively | $ | 186,513,988 | $ | 391,245,131 | |||||||||||||||
| CHANGE IN CAPITAL STOCK OUTSTANDING | |||||||||||||||||||
| Shares of Capital Stock sold | 1,140,407 | 1,321,032 | |||||||||||||||||
| Shares issued to shareholders upon reinvestment of dividends and distributions | 112,235 | 768,748 | |||||||||||||||||
| Shares of Capital Stock repurchased | (3,801,067 | ) | (6,630,242 | ) | |||||||||||||||
| Change in Capital Stock outstanding | (2,548,425 | ) | (4,540,462 | ) | |||||||||||||||
* Net of redemption fees of $68,196 and $15,304 collected for the years ended December 31, 2008 and 2007, respectively.
See notes to financial statements.
11
FINANCIAL HIGHLIGHTS
Selected Data for Each Share of Capital Stock Outstanding Throughout Each Year
| Year Ended December 31, | |||||||||||||||||||||||
| 2008 | 2007 | 2006 | 2005 | 2004 | |||||||||||||||||||
| Per share operating performance: | |||||||||||||||||||||||
| Net asset value at beginning of year | $ | 34.14 | $ | 34.64 | $ | 34.39 | $ | 31.14 | $ | 27.05 | |||||||||||||
| Income from investment operations: | |||||||||||||||||||||||
| Net investment income (loss) | $ | 0.07 | $ | 0.15 | $ | 0.26 | $ | 0.10 | $ | (0.02 | ) | ||||||||||||
| Net realized and unrealized gain (loss) on investment securities | (12.89 | ) | 2.26 | 1.13 | 3.89 | 4.41 | |||||||||||||||||
| Total from investment operations | $ | (12.82 | ) | $ | 2.41 | $ | 1.39 | $ | 3.99 | $ | 4.39 | ||||||||||||
| Less distributions: | |||||||||||||||||||||||
| Dividends from net investment income | $ | (0.07 | ) | $ | (0.16 | ) | $ | (0.25 | ) | $ | (0.10 | ) | — | ||||||||||
| Distributions from net realized capital gains | (0.32 | ) | (2.75 | ) | (0.89 | ) | (0.64 | ) | $ | (0.30 | ) | ||||||||||||
| Total distributions | $ | (0.39 | ) | $ | (2.91 | ) | $ | (1.14 | ) | $ | (0.74 | ) | $ | (0.30 | ) | ||||||||
| Redemption fees | — | * | — | * | — | * | — | * | — | * | |||||||||||||
| Net asset value at end of year | $ | 20.93 | $ | 34.14 | $ | 34.64 | $ | 34.39 | $ | 31.14 | |||||||||||||
| Total investment return** | (37.84 | )% | 7.10 | % | 4.06 | % | 12.81 | % | 16.25 | % | |||||||||||||
| Ratios/supplemental data: | |||||||||||||||||||||||
| Net assets at end of year (in thousands) | $ | 186,514 | $ | 391,245 | $ | 554,305 | $ | 490,410 | $ | 266,097 | |||||||||||||
| Ratio of expenses to average net assets | 1.02 | % | 0.96 | % | 0.91 | % | 0.90 | % | 0.97 | % | |||||||||||||
| Ratio of net investment income (loss) to average net assets | 0.22 | % | 0.37 | % | 0.75 | % | 0.37 | % | (0.07 | )% | |||||||||||||
| Portfolio turnover rate | 11 | % | 10 | % | 16 | % | 10 | % | 16 | % | |||||||||||||
* Less than $0.01 per share.
** Return is based on net asset value per share, adjusted for reinvestment of distributions, and does not reflect deduction of the sales charge.
See notes to financial statements.
12
NOTES TO FINANCIAL STATEMENTS
December 31, 2008
NOTE 1 — Significant Accounting Policies
FPA Perennial Fund, Inc. (the "Fund") is registered under the Investment Company Act of 1940 as a diversified, open-end, management investment company. The Fund's primary investment objective is long-term growth of capital. Current income is a secondary consideration. The following is a summary of significant accounting policies consistently followed by the Fund in the preparation of its financial statements.
A. Security Valuation
Securities listed or traded on a national securities exchange are valued at the last sale price. If there was not a sale that day, these securities are valued at the last bid price. Securities traded on the NASDAQ National Market System are valued at the NASDAQ Official Closing Price. Securities which are unlisted are valued at the most recent bid price. Short-term investments with maturities of 60 days or less are valued at amortized cost which approximates market value.
B. Securities Transactions and Related Investment Income
Securities transactions are accounted for on the date the securities are purchased or sold. Dividend income and distributions to shareholders are recorded on the ex-dividend date. Interest income and expenses are recorded on an accrual basis.
C. Use of Estimates
The preparation of the financial statements in accordance with accounting principles generally accepted in the United States requires management to make estimates and assumptions that affect the amounts reported. Actual results could differ from those estimates.
NOTE 2 — Federal Income Tax
No provision for federal income tax is required because the Fund has elected to be taxed as a "regulated investment company" under the Internal Revenue Code and intends to maintain this qualification and to distribute each year to its shareholders, in accordance with the minimum distribution requirements of the Code, its taxable net investment income and taxable net realized gains on investments.
Distributions paid to shareholders are based on net investment income and net realized gains determined on a tax reporting basis, which may differ from financial reporting. In addition, the Fund may designate a portion of the amount paid to redeeming shareholders as a distribution for tax purposes. For federal income tax purposes, the components of distributable earnings at December 31, 2008, were as follows:
| Undistributed ordinary income | $ | 10,367 | |||||
| Undistributed net realized gains | — | ||||||
The tax status of distributions paid during the last two fiscal years ended December 31 were as follows:
| 2008 | 2007 | ||||||||||
| Dividends from ordinary income | $ | 1,236,125 | $ | 4,860,392 | |||||||
| Distributions from long-term capital gains | $ | 3,444,385 | $ | 26,568,926 | |||||||
The cost of purchases of investment securities (excluding short-term investments with maturities of 60 days or less) aggregated $32,636,559 during the year ended December 31, 2008. Realized gains or losses are based on the specific identification method.
The cost of investment securities held at December 31, 2008, for federal income tax purposes was $192,509,271. Gross unrealized appreciation and depreciation for all investments at December 31, 2008 for federal income tax purposes was $21,436,714 and $40,697,654, respectively, resulting in net unrealized depreciation of $(19,260,940). The Fund adopted the provisions of Financial Accounting Standards Board Interpretation No. 48 ("FIN 48"), Accounting for Uncertainty in Income Taxes, on January 1, 2007. The implementation of FIN 48 resulted in no liability for unrecognized tax benefits and no change to the beginning net asset value of the Fund. As of and during the year ended December 31, 2008, the Fund did not have any liability for unrecognized tax
13
NOTES TO FINANCIAL STATEMENTS
Continued
benefits. The Fund recognizes interest and penalties, if any, related to unrecognized tax benefits as income tax expense in the Statement of Operations. During the period, the Fund did not incur any interest or penalties. The Fund is not subject to examination by U.S. federal tax authorities for years ended on or before December 31, 2004 or by state tax authorities for years ended on or before December 31, 2003.
During the year ended December 31, 2008, the Fund reclassified $803,337 from undistributed net realized gains to additional paid-in capital to align financial reporting with tax reporting relating to the portion of the amounts paid to redeeming shareholders that was designated as a distribution for tax purposes.
NOTE 3 — Advisory Fees and Other Affiliated Transactions
Pursuant to an Investment Advisory Agreement, advisory fees were paid by the Fund to First Pacific Advisors, LLC (the "Adviser"). Under the terms of this Agreement, the Fund pays the Adviser a monthly fee calculated at the annual rate of 0.75% of the first $50 million of the Fund's average daily net assets and 0.65% of the average daily net assets in excess of $50 million. In addition, the Fund pays the Adviser an amount equal to 0.10% of the average daily net assets for each fiscal year in reimbursement for the provision of financial services to the Fund. The Agreement obligates the Adviser to reduce its fee to the extent necessary to reimburse the Fund for any annual expenses (exclusive of interest, taxes, the cost of any supplemental statistical and research information, and extraordinary expenses such as litigation) in excess of 11/2% of the first $30 million and 1% of the remaining average net assets of the Fund for the year.
For the year ended December 31, 2008, the Fund paid aggregate fees of $26,000 to all Directors who are not affiliated persons of the Adviser. Certain officers of the Fund are also officers of the Adviser and FPA Fund Distributors, Inc.
NOTE 4 — Redemption Fee
A redemption fee of 2% applies to redemptions within 90 days of purchase for certain purchases made by persons eligible to purchase shares without an initial sales charge. For the year ended December 31, 2008, the Fund collected $68,196 in redemption fees. The impact of these fees is less than $0.01 per share.
NOTE 5 — Distributor
For the year ended December 31, 2008, FPA Fund Distributors, Inc. ("Distributor"), wholly owned subsidiary of the Adviser, received $13,373 in net Fund share sales commissions after reallowance to other dealers. The Distributor pays its own overhead and general administrative expenses, the cost of supplemental sales literature, promotion and advertising.
NOTE 6 — Disclosure of Fair Value Measurements
The Fund adopted Statement of Financal Accounting Standards No. 157 ("FAS 157"), Fair Value Measurements, on January 1, 2008. FAS 157 requires the Fund to classify its assets based on valuation method, using three levels. Level 1 investment securities are valued based on quoted market prices in active markets for identical assets. Level 2 investment securities are valued based on significant observable market inputs, such as quoted prices for similar assets and quoted prices in inactive markets or other market observable inputs. Level 3 investment securities are valued using significant unobservable inputs that reflect the Fund's determination of assumptions that market participants might reasonably use in valuing the assets. The valuation levels are not necessarily an indication of the risk a ssociated with investing in those securities. The following table presents the valuation levels of the Fund's investments as of December 31, 2008:
| Level 1 — Quoted prices | $ | 173,248,331 | |||||
| Level 2 — Other significant observable inputs | 14,034,953 | * | |||||
| Level 3 — Significant unobservable inputs | — | ||||||
| Total investments | $ | 187,283,284 | |||||
* Comprised solely of short-term investments with maturities of 60 days or less that are valued at amortized cost.
14
REPORT OF INDEPENDENT REGISTERED
PUBLIC ACCOUNTING FIRM
TO THE SHAREHOLDERS AND
BOARD OF DIRECTORS OF FPA PERENNIAL FUND, INC.
We have audited the accompanying statement of assets and liabilities of FPA Perennial Fund, Inc. (the "Fund"), including the portfolio of investments, as of December 31, 2008, the related statement of operations for the year then ended, the statements of changes in net assets for each of the two years in the period then ended, and the financial highlights for each of the five years in the period then ended. These financial statements and financial highlights are the responsibility of the Fund's management. Our responsibility is to express an opinion on these financial statements and financial highlights based on our audits.
We conducted our audits in accordance with standards of the Public Company Accounting Oversight Board (United States). Those standards require that we plan and perform the audit to obtain reasonable assurance about whether the financial statements and financial highlights are free of material misstatement. The Fund is not required to have, nor were we engaged to perform, an audit of its internal control over financial reporting. Our audits included consideration of internal control over financial reporting as a basis for designing audit procedures that are appropriate in the circumstances, but not for the purpose of expressing an opinion on the effectiveness of the Fund's internal control over financial reporting. Accordingly, we express no such opinion. An audit also includes examining, on a test basis, evidence supporting the amounts and disclosures in the financial statements, assessing the accounting principles used and significant estim ates made by management, as well as evaluating the overall financial statement presentation. Our procedures included confirmation of securities owned as of December 31, 2008, by correspondence with the custodian. We believe that our audits provide a reasonable basis for our opinion.
In our opinion, the 2008 financial statements and financial highlights referred to above present fairly, in all material respects, the financial position of FPA Perennial Fund, Inc. as of December 31, 2008, the results of its operations for the year then ended, the changes in its net assets for each of the two years in the period then ended, and the financial highlights for each of the five years in the period then ended in conformity with accounting principles generally accepted in the United States of America.

Los Angeles, California
February 2, 2009
RENEWAL OF INVESTMENT ADVISORY AGREEMENT
The following paragraphs summarize the material information and factors considered by the Board of Directors at a meeting held August 4, 2008 as well as their conclusions relative to such factors.
Nature, Extent and Quality of Services. The Board considered information regarding the Adviser and its staffing in connection with the Fund, including the Fund's portfolio managers, the addition of a senior analyst to their team, the scope of accounting, administrative, shareholder and other services supervised and provided by the Adviser, and the absence of any significant service problems reported to the Board. The Board noted the experience, length of service and the outstanding reputation of the Fund's Portfolio managers, Eric Ende and Steven Geist, who have managed the Fund since 1995. The Directors concluded that the nature, extent and quality of services provided by the Adviser have benefited and should continue to benefit the Fund and its shareholders.
Investment Performance. The Directors reviewed the overall investment performance of the Fund. They
15
RENEWAL OF INVESTMENT ADVISORY AGREEMENT
Continued
also received information from an independent consultant, Lipper Analytical Services, Inc. ("Lipper"), regarding the Fund's performance relative to a peer group of mid-cap core funds selected by Lipper (the "Peer Group"). The Directors noted the Fund's competitive longer-term investment performance since the current portfolio managers assumed management of the Fund when compared to the Peer Group. They further concluded that the Adviser's continued management of the Fund should benefit the Fund and its shareholders.
Advisory Fees and Fund Expenses; Adviser Profitability; Economies of Scale and Sharing of Economies of Scale. The Directors were provided information by the Adviser to enable consideration of the Fund's advisory fees and total expense levels, as well as the overall profitability of the Adviser, the benefits to the Adviser from its relationship to the Fund, the extent to which economies of scale with respect to the management of the Fund, if any, would be realized, and whether the Fund is sharing, or will share, in those economies.
The Directors reviewed comparative information relative to fees and expenses for the mutual fund industry generally and for the Peer Group. The Directors noted that the Fund's fees and expenses were at the lower end of the range for the Peer Group. The Directors noted that the overall expense ratio of the Fund was also at the lower end of the range when compared to the Peer Group. The Directors noted that the fee rate charged to the Fund is currently lower than the fee rate charged by the Adviser on the other products managed in a similar style by the portfolio manager. The Directors concluded that the overall fee rate was reasonable and fair to the Fund and its shareholders in light of the nature and quality of the services provided by the Adviser.
The Directors considered whether there have been economies of scale with respect to the management of the Fund, whether the Fund has appropriately benefited from any economies of scale, and whether the fee rate is reasonable in relation to the Fund's assets and any economies of scale that may exist. The Directors expressed concern that the fee rate does not have any additional breakpoints. The mutual fund industry has trended toward funds having breakpoints in the advisory fee structure as a means by which to share in economies of scale as a fund's assets grow; however, not all funds have breakpoints in their fee structures. The Adviser indicated its belief that additional breakpoints currently were not appropriate for the Fund and that no meaningful income and expense forecasts for its business could be prepared given uncertainties regarding the direction of the economy, rising inflation, increasing costs for personnel and systems, and grow th (or not) in the Fund's assets, all of which could negatively impact the Adviser. The Directors noted that the Adviser had not increased the fee rate charged to the Fund despite the Adviser's claims of increases in the Adviser's internal costs of providing investment management services to the Fund, in part due to administrative burdens and expenses resulting from recent legislative and regulatory actions such as Sarbanes-Oxley. According to the Adviser, such increased costs have included a significant investment in a new analyst who assists with the management of the Fund, additions to administrative personnel and systems that enhance the quality of services provided to the Fund and the establishment of a full-time Chief Compliance Officer and his assistant. The Directors also noted that asset levels of the Fund are currently lower than they were three years ago, yet the Adviser has continued to make investments in personnel servicing the Fund.
Conclusions. The Directors determined that the Fund continues to benefit from the services of a highly experienced portfolio management team that has produced competitive long-term returns. In addition, the Directors agreed that the Fund continues to receive high quality accounting, administrative, shareholder and other ancillary services from the Adviser. The Directors acknowledged that there is no uniform industry methodology to measure or apply economies of scale. The Directors determined that the Fund's expense ratio, the overall profitability of the Adviser, and the sharing of economies of scale with the Fund are fair and reasonable under the current circumstances. In reaching their conclusions, the Directors acknowledged that the fees and expenses of the Fund are clearly disclosed in the Fund's prospectus, in all reports to Fund shareholders and in industry research databases such as those maintained by Lipper and Morningstar, and that the Fund's shareholders have ready access to other funds with different strategies, fees and expenses and can redeem at any time if they feel the Adviser does not add fair value for the fees and expenses charged. The Directors also stated their intention to continue monitoring the factors relevant to the Adviser's compensation, such as changes in the Fund's asset levels, changes in portfolio management personnel and the cost and quality of the services provided by the Adviser to the Fund. On the basis of the foregoing, and without assigning particular weight to any single factor, the Directors determined to approve the continuation of the current advisory agreement for another one-year period ending September 30, 2009.
16
SHAREHOLDER EXPENSE EXAMPLE
December 31, 2008 (unaudited)
Fund Expenses
As a shareholder of the Fund, you incur two types of costs: (1) transaction costs, and (2) ongoing costs, including advisory and administrative fees; shareholder service fees; and other Fund expenses. The Example is intended to help you understand your ongoing costs (in dollars) of investing in the Fund and to compare these costs with the ongoing costs of investing in other mutual funds. The Example is based on an investment of $1,000 invested at the beginning of the year and held for the entire year.
Actual Expenses
The information in the table under the heading "Actual Performance" provides information about actual account values and actual expenses. You may use the information in this column, together with the amount you invested, to estimate the expenses that you paid over the period. Simply divide your account value by $1,000 (for example, an $8,600 account value divided by $1,000= 8.6), then multiply the result by the number in the first column in the row entitled "Expenses Paid During Period" to estimate the expenses you paid on your account during this period.
Hypothetical Example for Comparison Purposes
The information in the table under the heading "Hypothetical Performance (5% return before expenses)" provides information about hypothetical account values and hypothetical expenses based on the Fund's actual expense ratio and an assumed rate of return of 5% per year before expenses, which is not the Fund's actual return. The hypothetical account values and expenses may not be used to estimate the actual ending account balance or expenses you paid for the period. You may use this information to compare the ongoing costs of investing in the Fund and other funds. To do so, compare this 5% hypothetical example with the 5% hypothetical examples that appear in the shareholder reports of other funds.
Please note that the expenses shown in the table are meant to highlight your ongoing costs only and do not reflect any transactional costs. Therefore, the information under the heading "Hypothetical Performance (5% return before expenses)" is useful in comparing ongoing costs only, and will not help you determine the relative total costs of owning different funds. In addition, if these transactional costs were included, your costs would have been higher.
| Actual Performance | Hypothetical Performance (5% return before expenses) | ||||||||||
| Beginning Account Value June 30, 2008 | $ | 1,000.00 | $ | 1,000.00 | |||||||
| Ending Account Value December 31, 2008 | $ | 680.78 | $ | 1,019.86 | |||||||
| Expenses Paid During Period* | $ | 4.27 | $ | 5.14 | |||||||
* Expenses are equal to the Fund's annualized expense ratio of 1.01%, multiplied by the average account value over the period and prorated for the six-months ended December 31, 2008 (184/366 days).
17
DIRECTOR AND OFFICER INFORMATION
| Name & Address | Position(s) With Company | Principal Occupation(s) During the Past 5 Years | Portfolios in Fund Complex Overseen | Other Directorships | |||||||||||||||
| Willard H. Altman, Jr. – (73)* | Director† Years Served: 11 | Retired. Formerly, until 1995, Partner of Ernst & Young LLP, a public accounting firm. | 6 | ||||||||||||||||
| Thomas P. Merrick – (71)* | Director† Years Served: <1 | Private consultant. President of Strategic Planning Consultants for more than the past five years. Former Executive Committee member and Vice President of Fluor Corporation, responsible for strategic planning, from 1984 to 1998. | 3 | ||||||||||||||||
| Lawrence J. Sheehan – (76)* | Director & Chairman† Years Served: 18 | Retired. Formerly Partner (1969 to 1994) and of counsel employee (1994 to 2002) of the law firm of O'Melveny & Myers LLP. | 6 | ||||||||||||||||
| Eric S. Ende – (64) | Director†, President & Portfolio Manager Years Served: 25 | Partner of the Adviser since 2006. Formerly Senior Vice President of First Pacific Advisors, Inc. from 1984 to 2006. | 3 | ||||||||||||||||
| Steven R. Geist – (55) | Executive Vice President & Portfolio Manager Years Served: 13 | Partner of the Adviser since 2006. Formerly Vice President of First Pacific Advisors, Inc. from 1992 to 2006. | |||||||||||||||||
| J. Richard Atwood – (48) | Treasurer Years Served: 12 | Chief Operating Officer of the Adviser. President of FPA Fund Distributors, Inc. | FPA Fund Distributors, Inc. | ||||||||||||||||
| Sherry Sasaki – (54) | Secretary Years Served: 26 | Assistant Vice President and Secretary of the Adviser and Secretary of FPA Fund Distributors, Inc. | |||||||||||||||||
| Christopher H. Thomas – (51) | Chief Compliance Officer Years Served: 14 | Vice President and Chief Compliance Officer of the Adviser. Vice President of FPA Fund Distributors, Inc. | FPA Fund Distributors, Inc. | ||||||||||||||||
| E. Lake Setzler – (41) | Assistant Treasurer Years Served: 3 | Vice President and Controller of the Adviser since 2005. Formerly Chief Operating Officer of Inflective Asset Management, LLC (2004-2005) and Vice President of Transamerica Investment Management, LLC (2000-2004). | |||||||||||||||||
† Directors serve until their resignation, removal or retirement.
* Audit Commitee Member
Additional information on the Directors is available in the Statement of Additional Information. Each of the above listed individuals can be contacted at 11400 W. Olympic Blvd., Suite 1200, Los Angeles, CA, 90064.
18
FPA PERENNIAL FUND, INC.
INVESTMENT ADVISER
First Pacific Advisors, LLC
11400 West Olympic Boulevard, Suite 1200
Los Angeles, CA 90064
SHAREHOLDER SERVICE AGENT
Boston Financial Data Services, Inc.
P.O. Box 8115
Boston, Massachusetts 02266-8115
30 Dan Road
Canton, MA 02021-2809
(800) 638-3060
(617) 483-5000
CUSTODIAN & TRANSFER AGENT
State Street Bank and Trust Company
Boston, Massachusetts
TICKER SYMBOL: FPPFX
CUSIP: 302548102
DISTRIBUTOR
FPA Fund Distributors, Inc.
11400 West Olympic Boulevard, Suite 1200
Los Angeles, California 90064
LEGAL COUNSEL
O'Melveny & Myers LLP
Los Angeles, California
INDEPENDENT REGISTERED PUBLIC
ACCOUNTING FIRM
Deloitte & Touche LLP
Los Angeles, California
This report has been prepared for the information of shareholders of FPA Perennial Fund, Inc., and is not authorized for distribution to prospective investors unless preceded or accompanied by an effective prospectus.
The Fund's complete proxy voting record for the 12 months ended June 30, 2008 is available without charge, upon request, by calling (800) 982-4372 and on the SEC's website at www.sec.gov.
The Fund's schedule of portfolio holdings, filed the first and third quarter on Form N-Q with the SEC, is available on the SEC's website at www.sec.gov. Form N-Q is available at the SEC's Public Reference Room in Washington, D.C., and information on the operations of the Public Reference Room may be obtained by calling 1-202-942-8090. To obtain information on Form N-Q from the Fund, shareholders can call 1-800-982-4372.
Additional information about the Fund is available online at www.fpafunds.com. This information includes, among other things, holdings, top sectors and performance, and is updated on or about the 15th business day after the end of the quarter.
Item 2. Code of Ethics.
(a) The registrant has adopted a code of ethics that applies to the registrant’s principal executive and financial officers.
(b) Not Applicable
(c) During the period covered by this report, there were not any amendments to the provisions of the code of ethics adopted in 2(a) above.
(d) During the period covered by this report, there were not any implicit or explicit waivers to the provisions of the code of ethics adopted in 2(a).
(e) Not Applicable
(f) A copy of the registrant’s code of ethics is filed as an exhibit to this Form N-CSR. Upon request, any person may obtain a copy of this code of ethics, without charge, by calling (800) 982-4372.
Item 3. Audit Committee Financial Expert.
The registrant’s board of directors has determined that Willard H. Altman, Jr., a member of the registrant’s audit committee and board of directors, is an “audit committee financial expert” and is “independent,” as those terms are defined in this Item. This designation will not increase the designee’s duties, obligations or liability as compared to his duties, obligations and liability as a member of the audit committee and of the board of directors. This designation does not affect the duties, obligations or liability of any other member of the audit committee or the board of directors.
Item 4. Principal Accountant Fees and Services.
|
|
|
| 2007 |
| 2008 |
| ||
(a) |
| Audit Fees |
| $ | 33,600 |
| $ | 35,300 |
|
(b) |
| Audit Related Fees |
| -0- |
| -0- |
| ||
(c) |
| Tax Fees |
| $ | 6,550 |
| $ | 6,875 |
|
(d) |
| All Other Fees |
| -0- |
| -0- |
| ||
|
|
|
|
|
|
|
| ||
(e)(1) | Disclose the audit committee’s pre-approval policies and procedures described in paragraph (c)(7) of Rule 2-01 of Regulation S-X. The audit committee shall pre-approve all audit and permissible non-audit services that the committee considers compatible with maintaining the independent auditors’ independence. The pre-approval requirement will extend to all non-audit services provided to the registrant, the adviser, and any entity controlling, controlled by, or under common control with the adviser that provides ongoing services to the registrant, if the engagement relates directly to the operations and financial | ||||||||
reporting of the registrant; provided, however, that an engagement of the registrant’s independent auditors to perform attest services for the registrant, the adviser or its affiliates required by generally accepted auditing standards to complete the examination of the registrant’s financial statements (such as an examination conducted in accordance with Statement on Auditing Standards Number 70 issued by the American Institute of Certified Public Accountants), will be deem pre-approved if: (i) the registrant’s independent auditors inform the audit committee of the engagement, (ii) the registrant’s independent auditors advise the audit committee at least annually that the performance of this engagement will not impair the independent auditor’s independence with respect to the registrant, and (iii) the audit committee receives a copy of the independent auditor’s report prepared in connection with such services. The committee may delegate to one or more committee members the authority to review and pre-approve audit and permissible non-audit services. Actions taken under any such delegation will be reported to the full committee at its next meeting.
(e)(2) Disclose the percentage of services described in each of paragraphs (b) — (d) of this Item that were approved by the audit committee pursuant to paragraph (c)(7)(i)(C) of Rule 2-01 of Regulation S-X. 100% of the services provided to the registrant described in paragraphs (b) — (d) of this Item were pre-approved by the audit committee pursuant to paragraph (e)(1) of this Item. There were no services provided to the investment adviser or any entity controlling, controlled by or under common control with the adviser described in paragraphs (b) — (d) of this Item that were required to be pre-approved by the audit committee.
(f) If greater than 50%, disclose the percentage of hours expended on the principal accountant’s engagement to audit the registrant’s financial statements for the most recent fiscal year that were attributed to work performed by persons other than the principal accountant’s full-time, permanent employees. All services performed on the engagement to audit the registrant’s financial statements for the most recent fiscal year end were performed by the principal accountant’s full-time, permanent employees.
(g) Disclose the aggregate non-audit fees billed by the registrant’s accountant for services rendered to the registrant, and rendered to the registrant’s investment adviser (not including any sub-adviser whose role is primarily portfolio management and is subcontracted with or overseen by another investment adviser), and any entity controlling, controlled by, or under common control with the adviser that provides ongoing services to the registrant for each of the last two fiscal years of the registrant. None.
(h) Disclose whether the registrant’s audit committee of the board of directors has considered whether the provision of non-audit services that were rendered to the registrant’s investment adviser (not including any sub-adviser whose role is primarily portfolio management and is subcontracted with or overseen by another investment adviser), and any entity controlling, controlled by, or under common control with the investment adviser that provides ongoing services to the registrant that were not pre-approved pursuant to paragraph (c)(7)(ii) of Rule 2-01 of Regulation S-X is compatible with maintaining the principal accountant’s independence. Not Applicable.
Item 5. Audit Committee of Listed Registrants. Not Applicable.
Item 6. Schedule of Investments. The schedule of investments is included as part of the report to stockholders filed under Item 1 of this Form.
Item 7. Disclosure of Proxy Voting Policies and Procedures for Closed-End Management Investment Companies. Not Applicable.
Item 8. Portfolio Managers of Closed-End Management Investment Companies. Not Applicable.
Item 9. Purchases of Equity Securities by Closed-End Management Investment Company and Affiliated Purchasers. Not Applicable.
Item 10. Submission of Matters to a Vote of Security Holders. There has been no material change to the procedures by which shareholders may recommend nominees to the registrant’s board of directors.
Item 11. Controls and Procedures.
(a) The principal executive officer and principal financial officer of the registrant have concluded that the registrant’s disclosure controls and procedures (as defined in Rule 30a-3(c) under the Investment Company Act of 1940) are effective based on their evaluation of the disclosure controls and procedures as of a date within 90 days of the filing date of this report.
(b) There have been no significant changes in the registrant’s internal controls over financial reporting (as defined in Rule 30a-3(d) under the Investment Company Act of 1940) that occurred during the second fiscal quarter of the period covered by this report that have materially affected, or is reasonably likely to materially affect, the registrant’s internal controls over financial reporting.
Item 12. Exhibits.
(a)(1) Code of ethics as applies to the registrant’s officers and directors, as required to be disclosed under Item 2 of Form N-CSR. Attached hereto as Ex.99.CODE.ETH.
(a)(2) Separate certification for the registrant’s principal executive officer and principal financial officer, as required by Rule 30a-2(a) under the Investment Company Act of 1940. Attached hereto.
(a)(3) Not Applicable
(b) Separate certification for the registrant’s principal executive officer and principal financial officer, as required by Rule 30a-2(b) under the Investment Company Act of 1940. Attached hereto.
SIGNATURES
Pursuant to the requirements of the Securities Exchange Act of 1934 and the Investment Company Act of 1940, the registrant has duly caused this report to be signed on its behalf by the undersigned, thereunto duly authorized.
FPA PERENNIAL FUND, INC. |
| |
|
| |
|
| |
By: | /s/ ERIC S. ENDE |
|
| Eric S. Ende, President |
|
| (Principal Executive Officer) |
|
|
| |
Date: February 23, 2009 |
| |
Pursuant to the requirements of the Securities Exchange Act of 1934 and the Investment Company Act of 1940, this report has been signed below by the following persons on behalf of the registrant and in the capacities and on the dates indicated.
FPA PERENNIAL FUND, INC. |
| |
|
| |
|
| |
By: | /s/ ERIC S. ENDE |
|
| Eric S. Ende, President |
|
| (Principal Executive Officer) |
|
|
| |
Date: February 23, 2009 |
| |
|
| |
|
| |
By: | /s/ J. RICHARD ATWOOD |
|
| J. Richard Atwood, Treasurer |
|
| (Principal Financial Officer) |
|
|
|
|
Date: February 23, 2009 |
| |