UNITED STATES
SECURITIES AND EXCHANGE COMMISSION
Washington, D.C. 20549
FORM N-CSR
CERTIFIED SHAREHOLDER REPORT OF REGISTERED
MANAGEMENT INVESTMENT COMPANIES
Investment Company Act file number | 811-3896 | |||||||
| ||||||||
FPA PERENNIAL FUND, INC. | ||||||||
(Exact name of registrant as specified in charter) | ||||||||
| ||||||||
11400 WEST OLYMPIC BLVD., SUITE 1200, LOS ANGELES, CALIFORNIA |
| 90064 | ||||||
(Address of principal executive offices) |
| (Zip code) | ||||||
| ||||||||
J. RICHARD ATWOOD, | ||||||||
(Name and address of agent for service) | ||||||||
| ||||||||
Registrant’s telephone number, including area code: | 310-473-0225 |
| ||||||
| ||||||||
Date of fiscal year end: | DECEMBER 31 |
| ||||||
| ||||||||
Date of reporting period: | DECEMBER 31, 2011 |
| ||||||
Item 1. Report to Stockholders.
Annual Report

Distributor:
FPA FUND DISTRIBUTORS, INC.
11400 West Olympic Boulevard, Suite 1200
Los Angeles, California 90064
IMPORTANT REMINDER:
Effective as of the close of business on November 4, 2011, UMB Fund Services, Inc. (UMBFS) officially replaced Boston Financial Data Services as the transfer agent for the FPA Funds. While many of the services UMBFS provides take place behind the scenes, we believe that changing providers will result in lower overall costs to the Funds while providing greater reporting and online capabilities. We hope that this change further enhances your experience with the FPA Funds. Please refer to the back cover of this report for the new contact information.
FPA Perennial Fund, Inc.
December 31, 2011
LETTER TO SHAREHOLDERS
Commentary
"Politics in the Driver's Seat"
At the start of 2012, the investment backdrop is little changed. Developed-country consumers, financial companies and governments over the last decade accumulated too much debt. The reduction of those borrowings is underway by the first two groups, but government debt continues to expand in most developed countries as economic growth and the accompanying tax receipts remain below trend. Significant challenges await in Europe and the U.S. in the year ahead. The outcome is largely in the hands of the politicians and central bankers. It would be an understatement to say their past records provide little comfort. We view the quality of the businesses in our portfolio as a form of protection against these uncertainties.
EU Reckoning Postponed, but Not Forgotten
Europe's leaders sought to deal with the crisis in 2011 by pushing for greater fiscal (tax and spending) integration and oversight. They believe that countries overseen by a proposed EU fiscal authority would be unable to undertake excess borrowing, which they think should provide comfort to the markets about future deficits. From our perspective, this idea offers no such assurance. Provisions in the Maastricht Treaty clearly limited government debt accumulation. Germany and France both violated them, and most of the other countries followed. No matter what enforcement mechanism is offered this time, we see no reason to expect a different outcome.
On top of failing to convince us that sovereign (government) debt problems cannot recur in the future, this anticipated EU fiscal compact will introduce the first major political hurdle of 2012, for its ratification will require popular votes in some countries. Practically, the voters in Ireland and potentially several other countries will face a referendum on the EU and the concept of further integration.1 EU history is littered with public rejections of initiatives increasing central authority at the expense of national sovereignty. A 'no' vote this time would likely cause markets to question the viability of the EU.
In the near term, pressure on EU politicians was eased by the European Central Bank's (ECB) extension of credit to Europe's banks in December and again in February 2012. These three-year loans served two purposes. First, they signaled that the ECB would not permit the undercapitalized banking system to collapse.2 Second, the capital infusion allowed the banks to buy short-dated government bonds, reducing interest rates and thereby market concerns about the cost of government financing. The ECB's actions postponed the reckoning for EU banks and governments yet did not resolve Europe's fundamental issue.3 Beyond these loan facilities, it is unclear what additional actions the ECB will take in 2012.
In addition to popular votes specifically held on the fiscal treaty change, the first round of French Presidential elections is scheduled for April. This will provide voters an indirect way of expressing their views on this proposal. A vote for Sarkozy will be seen as support for the plan. If another candidate is favored, the markets might question France's commitment to the plan's existing terms.
Attention Will Eventually Return to the U.S.
The U.S. has its own debt overhang issues. At the end of 2011, the gross government debt was 100% of GDP. We've written many times in the past that the
1 An Irish popular referendum is legally required for any change to the constitution. There will be pressure in France also to offer a referendum. In Germany, the 2011 constitutional court ruling will force parliamentary action or a public referendum. The Netherlands has a history of voting against EU expansion and will likely face popular demands for a vote.
2 To assist banks further, the ECB has continued to increase the range of acceptable assets that banks can pledge as collateral. From just under 30,000 in early December, the number of eligible assets was recently increased to over 37,000.
3 This issue is the enormous amount of variation in competitiveness among Europe's economies, which leads to large trade surpluses (Germany) and deficits (southern Europe). Without the possibility of currency adjustment, it will be nearly impossible for a deficit country to balance its budget when its banks and consumers are reducing their financial leverage. Markets have already signaled that government debt levels in Portugal, Italy and Spain are not acceptable in the long run. Until the deficits of these countries are structurally reduced, Europe's fundamental issue will be unresolved.
1
practice of annually running outsized deficits that cause ballooning government debt levels has reached a critical stage. The European experience of 2011 clearly shows what happens when the markets will not lend money to governments on affordable terms. Once that point is reached, efforts to cut spending and raise taxes slow the economy, which makes the debt seem even less affordable. We are in very dangerous territory and need an immediate correction in course in order not to repeat Europe's recent experience on these shores.
Unfortunately, few in Washington, D.C., seem willing to act for the long-term good of the country. The election year makes it less likely that substantive reforms will occur. That means the choices made in the 2012 elections will have a significant impact on whether the necessary actions are taken. Negative market reaction is a real possibility if candidates opposed to improving our fiscal position are winners.
Against a backdrop of too much debt in the developed world, politics takes center stage in 2012. We cannot predict all the actions of politicians, central bankers and voters. But the combination of excess borrowings and their decisions is likely to produce significant market volatility.
Our Portfolio
As it is every year, our mantra is company quality. In ebullient markets we hope our companies' leadership positions are recognized, but when market sentiment darkens, we count on their high levels of profitability and modestly levered balance sheets to hold up better than most. As we begin 2012, these quality characteristics are evident when compared to the portfolio's Russell 2500 (R2500) benchmark. According to data from BNY Mellon, at the end of 2011, the Perennial portfolio had an ROE of 17.5% (compared to 12.5% for the R2500), gross debt (not including cash) of 58% of equity (94% for the R2500) and sold at a trailing P/E (price/earnings) ratio of 17x (compared to 20x for the R2500). We believe this combination of better quality at lower prices is a recipe for potential continued long-term outperformance versus the index.
Performance
For the fourth quarter Perennial was up 17%, a dramatic reversal of its 23% decline in the third quarter, but a continuation of the volatile environment we have seen for some time. The Perennial gain exceeded the benchmark Russell 2500 by two points and the S&P 500 by five points.
For the full year 2011, relative performance was more of a challenge. Perennial was down 4%, over a point worse than the two and a half point decline in the benchmark Russell 2500. The leaders during the year were definitely larger-cap companies. The S&P 500 was up 2%, six points ahead of the small-cap Russell 2000. The Dow Jones Industrials, an index long deserted by sophisticated investors, and dominated by big companies paying healthy dividends, provided a return of over 8%, almost 13 points better than the Russell 2000.
The table below shows performance for both Perennial and the benchmark Russell 2500 as well as leading large-cap indexes. Perennial return comparisons measured over longer periods remain strong.
| Periods Ended December 31, 2011 | |||||||||||||||||||||||||||
| Fourth Quarter | One Year | Three Years* | Five Years* | Ten Years* | Fifteen Years* | ||||||||||||||||||||||
| Perennial** | 17.0 | % | (3.8 | )% | 20.3 | % | 3.0 | % | 6.9 | % | 10.2 | % | |||||||||||||||
| Russell 2500 | 14.5 | % | (2.5 | )% | 18.4 | % | 1.2 | % | 6.6 | % | 7.8 | % | |||||||||||||||
| S & P 500 | 11.8 | % | 2.1 | % | 14.1 | % | (0.2 | )% | 2.9 | % | 5.5 | % | |||||||||||||||
| Nasdaq | 8.2 | % | (0.8 | )% | 19.4 | % | 2.4 | % | 3.7 | % | 5.4 | % | |||||||||||||||
* Annualized
** The returns shown are at net asset value and do not reflect deduction of the maximum sales charge of 5.25% which, if reflected, would reduce the performance shown.
Company Discussion
We believe it useful to look at the portfolio's full year 2011 best and worst performers in greater-than-usual detail, both as a way of better understanding how we did last year as well as providing insight into the portfolio management process.
2
Starting with the winners, the following portfolio companies had the greatest percentage gains over the course of the year.
| O'Reilly Automotive | +32% | ||||||
| Aggreko | 32 | ||||||
| Copart | 28 | ||||||
| Clarcor | 17 | ||||||
| FMC Technologies | 17 | ||||||
| Scan Source | 13 | ||||||
| Franklin Electric | 12 | ||||||
| Maxim Integrated Products | 10 | ||||||
Looking at the big picture, what themes were most successful in 2011? Several ideas stand out.
• First, size. Bigger was better, as we might have concluded from the strong performance of the Dow Jones average noted above. Three of the year's biggest winners (O'Reilly, Aggreko, and FMC) where among the four biggest market cap companies in the portfolio.
• Next, relatively low exposure to the economic cycle was often rewarded, as the market continued to worry about the extent and speed of the recovery. Of the five biggest portfolio price increases, three companies have minimal cyclical exposure (O'Reilly, Copart, and FMC) while Aggreko and Clarcor were only moderately exposed to the cycle.
O'Reilly Automotive is one of the country's three leading auto parts retailers, along with Auto Zone and Advanced Auto.
O'Reilly was up 32% last year, and is Perennial's largest portfolio position at 7%. Most of the stock was purchased over a decade ago at an average price of $7.50 a share. The price at year end was $80.
From a fundamental business standpoint O'Reilly is a relatively low risk investment, with only modest exposure to the economic cycle. Although car usage occasionally declines, driven by either recession or high fuel prices, past impacts have not been severe. People need to use their cars, and they need to maintain them, to O'Reilly's benefit.
In addition to its nominal economic risk, as well as zero exposure to Europe, O'Reilly benefited from several company-specific factors. One, it continued to see sales and margin gains driven by its highly successful acquisition of CSK three years ago. And two, it has had significant increases in cash flow, driven by modestly slower store expansion, steadily improving working capital management, and modified store leasing practices, with the funds used for share repurchase.
We have sold O'Reilly shares periodically, mostly to trim position size. Mid-teens returns on equity and excellent reinvestment opportunities within the business have supported past earnings growth of close to 20%.
Aggreko operates two closely related businesses. First is short-term rental of power generating equipment, generally to meet temporary industrial needs. Second is the sale of power to supplement inadequate supply. This sometimes results from natural disasters (hurricane, earthquake) or special events (Olympics, World Cup), or, most important, endemic shortages in developing countries, the consequence of underinvestment in generating capacity.
Aggreko was first purchased about a year ago, at prices 30% lower than now. Though we are quite comfortable with our current 1% position, we will patiently await opportunities to increase it at lower price levels.
Although Aggreko's short-term rental business, generally located in economically developed regions, certainly has some cyclical risk, it has become the less important of the two businesses, while International Power Projects (IPP) is now dominant.
IPP is highly unusual in its tilt toward the poor but developing world for most of its business. Typical customers are in South Asia, Latin America, and Africa. In many of these countries relatively small but steady increases in demand for electric power (for cell phones, lighting, TV, refrigeration) meet with static supply, generally the result of inadequate investment. The root cause is selling power at prices that are too low or in diverting whatever cash flows there are to alternative uses.
Unfilled demand for alternative power has grown significantly over time, with ability to pay the
3
true constraint on the market. Despite this, Aggreko has steadily increased its generating capacity and has grown earnings at rates approaching 20% annually for many years. Returns on capital have been very high.
We expect future investment opportunities for Aggreko to continue to be relatively unrestrained by the economic cycle.
Copart is one of the two leading operators of auctions for salvage vehicles — those crash-damaged beyond the point of economic repair.
Copart's stock price was up 28% last year. Over time, with both rising earnings and a modestly higher multiple, Copart's position, purchased in 2006, has grown to 4% of the portfolio.
Our view of Copart's secure competitive position, improving reinvestment opportunities, and its relative imperviousness to the economic cycle, keeps us comfortable with its sizeable portfolio position.
The key aspect of the Copart story is the improving reinvestment opportunities the company is seeing in its business. It has increased the flow of vehicles going to its auctions, both by winning an exclusive contract with Allstate, and by convincing dealers, car lessors, etc., to send their high mileage but drivable vehicles to Copart, supplementing its normal diet of salvage vehicles.
Entering the U.K. market a few years ago with an acquisition, Copart added some additional assets, and now is the market leader. This raises the hope that Copart eventually could expand to markets on the European continent as well, potentially doubling the size of its U.S.-only business.
Copart did a very large and highly accretive share repurchase about a year ago, reducing shares outstanding by 20% though at the cost of some balance sheet leverage. We take a positive view of this more aggressive balance sheet management.
FMC Technologies is the leading worldwide manufacturer of subsea trees, equipment that controls the flow of oil and gas from offshore wells.
FMC's stock price was up 17% last year and is currently about a 4.5% portfolio position. Our initial purchase was in 2008 at about $12 per share (current price = $50).
The company has improved its market share to over 50% in recent years, in part from its success in developing equipment that can perform tasks underwater, mostly oil-water and oil-gas separations, which previously could only be done at the surface. These technology advances have greatly improved the economics of many offshore projects.
The oil and gas industry has seen a steady increase in subsea activity over past decades, driven by worldwide economic growth and improving technology, permitting oil companies to develop resources not economically accessible in the past.
Although oil and gas exploration and production are influenced strongly by economic activity, in the short and medium term there may be little linkage, as large multi-year projects will often continue regardless of current oil prices or level of demand.
Turning now to the down stocks, the following portfolio companies had the largest percentage stock price declines over the course of the year.
| Dolby | (54 | )% | |||||
| Manpower | (43 | ) | |||||
| Life Technologies | (30 | ) | |||||
| Wabco | (29 | ) | |||||
| Carnival | (29 | ) | |||||
| L'Occitane | (27 | ) | |||||
| Bio Merieux | (25 | ) | |||||
| Sonova | (19 | ) | |||||
In the case of four of these companies, (Dolby, L'Occitane, Bio Merieux and Sonova) our first purchase was during the course of 2011. Despite the very broad price decline these companies had during the year, by patiently waiting for buying opportunities at attractive prices, we were able to initiate and enlarge our positions in two of the four companies at lower average costs than year-end prices.
Moving to some of the larger positions, Life Technologies is a major provider of supplies and equipment for biotech research. At year-end 2011 it was Perennial's eighth largest position, at 4% of the equity portfolio. It declined 30% last year. Because of
4
our already full position we did not add to our shares post decline.
The lower stock price was driven largely by concern about pressures on government-funded spending for life science research. In addition, the fiscal stimulus program was winding down, and the long-term malaise in new drug development continued.
We held a more sanguine view. Life's core business has been high margin and very stable. It has substantial cash flows and a low correlation with overall economic activity. Finally, it has demonstrated the ability to profit from research breakthroughs.
These positives became more evident in January. Early in the month it announced some very aggressive new products in its next-generation sequencing business. This improved its market position relative to its major competitor, Illumina. Then a few weeks later, Illumina became the target of a hostile tender offer from Roche, demonstrating the value of a next-generation franchise. The consequence of this improvement in sentiment was a strong gain in Life's stock price, up 10 points, or 24%, for the month of January and erasing 60% of its year 2011 decline.
Wabco is a worldwide leader in heavy truck components with an emphasis on safer braking systems. At year-end 2011, Wabco was Perennial's fifth largest position at 4.7%. It declined 29% last year. As was the case with Life Technologies, our relatively full position made us reluctant to add to our shares.
The market's concern was centered on Europe, Wabco's largest market. Also at issue was a possible slowing in the growth rate in some rapidly growing truck markets, especially China, India, and Brazil.
We continue to be enthusiastic about Wabco and its prospects. It has the leading market share in an oligopolistic industry. It combines both cyclical (U.S., Europe) and secular growth opportunities (BRIC countries — Brazil, Russia, India and China). Wabco strongly benefits from tighter government regulations, especially in safety. And finally, the company has been dramatically improving its operating margins.
Sentiment has improved in January, as Europe now appears likely to avoid a worst case outcome (at least for now). Wabco's stock is up about eight points or 20% for the month, erasing half of its year 2011 decline.
In the past, reader feedback to shareholder letters came in written form or over the telephone. While those methods are still welcome, we are now pleased to also receive comments at the email address, perennial@firstpacad.com.
Thank you for your continued support and trust.

Eric S. Ende
President and Portfolio Manager
February 6, 2012
The discussion of Fund investments represents the views of the Fund's managers at the time of this report and are subject to change without notice. References to individual securities are for informational purposes only and should not be construed as recommendations to purchase or sell individual securities. While the Fund's managers believe the Fund's holdings are value stocks, there can be no assurance that others will consider them as such. Further, investing in value stocks presents the risk that value stocks may fall out of favor with investors and underperform growth stocks during given periods.
5
FORWARD LOOKING STATEMENT DISCLOSURE
As mutual fund managers, one of our responsibilities is to communicate with shareholders in an open and direct manner. Insofar as some of our opinions and comments in our letters to shareholders are based on current management expectations, they are considered "forward-looking statements" which may or may not be accurate over the long term. While we believe we have a reasonable basis for our comments and we have confidence in our opinions, actual results may differ materially from those we anticipate. You can identify forward-looking statements by words such as "believe," "expect," "may," "anticipate," and other similar expressions when discussing prospects for particular portfolio holdings and/or the markets, generally. We cannot, however, assure future results and disclaim any obligation to update or alter any forward-looking statements, whether as a result of new information, future events, or otherwise. Further, information provided in this report should not be construed as a recommendation to purchase or sell any particular security.
HISTORICAL PERFORMANCE
Change in Value of a $10,000 Investment in FPA Perennial Fund, Inc. vs. Russell 2500 Index and Lipper Mid-Cap Core Fund Average from January 1, 2002 to December 31, 2011
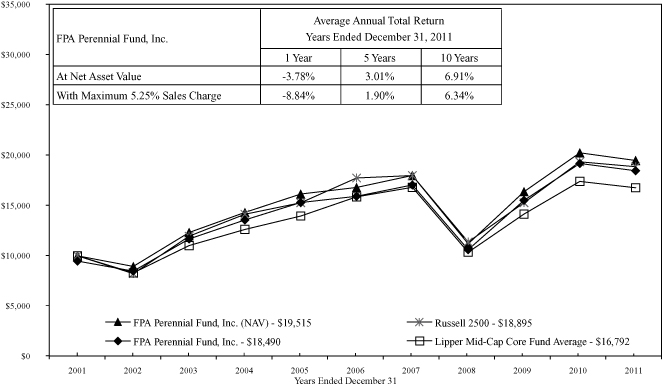
Past performance is not indicative of future performance. The Russell 2500 Index consists of the 2,500 smallest companies in the Russell 3000 total capitalization universe. This index is considered a measure of small to medium capitalization stock performance. This index does not reflect any commissions or fees which would be incurred by an investor purchasing the stocks it represents. The Lipper Mid-Cap Core Fund Average provides an additional comparison of how your Fund performed in relation to other mutual funds with similar objectives. The Lipper data does not include sales charges. The performance shown for FPA Perennial Fund, Inc., with an ending value of $18,490 reflects deduction of the current maximum sales charge of 5.25% of the offering price. In addition, since investors purchase shares of the Fund with varying sales charges depending primarily on volume purchased, the Fund's performance at net asset value (NAV) is also shown, as reflected by the ending value of $19,515. The performance of the Fund and of the Averages is computed on a total return basis which includes reinvestment of all distributions.
6
PORTFOLIO SUMMARY
December 31, 2011
(Unaudited)
| Common Stocks | 94.4 | % | |||||||||
| Producer Durable Goods | 21.2 | % | |||||||||
| Business Services & Supplies | 20.1 | % | |||||||||
| Retailing | 18.6 | % | |||||||||
| Health Care | 14.8 | % | |||||||||
| Energy | 7.7 | % | |||||||||
| Technology | 6.4 | % | |||||||||
| Transportation | 5.6 | % | |||||||||
| Short-Term Investments | 5.9 | % | |||||||||
| Other Assets and Liabilities, net | (0.3 | )% | |||||||||
| Total Net Assets | 100.0 | % | |||||||||
MAJOR PORTFOLIO CHANGES
Six Months Ended December 31, 2011
(Unaudited)
| Shares | |||||||
| NET PURCHASES | |||||||
| Common Stocks | |||||||
| bioMérieux S.A. (1) | 16,200 | ||||||
| Dolby Laboratories, Inc. (Class A) | 27,500 | ||||||
| Halma plc (1) | 265,200 | ||||||
| L'Occitane International S.A. (1) | 490,000 | ||||||
| Rotork plc (1) | 6,400 | ||||||
| Sonova Holding AG (1) | 14,000 | ||||||
| Spirax-Sarco Engineering plc | 17,300 | ||||||
| NET SALES | |||||||
| Common Stocks | |||||||
| Helix Energy Solutions Group, Inc. (2) | 120,000 | ||||||
(1) Indicates new commitment to portfolio
(2) Indicates elimination from portfolio
7
PORTFOLIO OF INVESTMENTS
December 31, 2011
| COMMON STOCKS | Shares | Value | |||||||||
| PRODUCER DURABLE GOODS — 21.2% | |||||||||||
| Actuant Corporation (Class A) | 200,500 | $ | 4,549,345 | ||||||||
| Franklin Electric Co., Inc | 128,800 | 5,610,528 | |||||||||
| Graco Inc | 172,800 | 7,065,792 | |||||||||
| HNI Corporation | 320,800 | 8,372,880 | |||||||||
| IDEX Corporation | 161,650 | 5,998,832 | |||||||||
| Rotork plc | 6,400 | 192,036 | |||||||||
| WABCO Holdings, Inc.* | 225,800 | 9,799,720 | |||||||||
| Zebra Technologies Corporation (Class A)* | 225,800 | 8,079,124 | |||||||||
| $ | 49,668,257 | ||||||||||
| BUSINESS SERVICES & SUPPLIES — 20.1% | |||||||||||
| Aggreko plc | 76,434 | $ | 2,396,840 | ||||||||
| Brady Corporation (Class A) | 169,100 | 5,338,487 | |||||||||
| CLARCOR, Inc | 139,100 | 6,953,609 | |||||||||
| Copart, Inc.* | 203,200 | 9,731,248 | |||||||||
| Halma plc | 265,200 | 1,362,253 | |||||||||
| Landauer, Inc. | 9,100 | 468,650 | |||||||||
| Manpower Inc. | 135,500 | 4,844,125 | |||||||||
| ScanSource, Inc.* | 381,501 | 13,734,036 | |||||||||
| Spirax-Sarco Engineering plc | 75,000 | 2,183,962 | |||||||||
| $ | 47,013,210 | ||||||||||
| RETAILING — 18.6% | |||||||||||
| CarMax, Inc.* | 442,300 | $ | 13,481,304 | ||||||||
| L'Occitane International S.A. | 490,000 | 984,018 | |||||||||
| O'Reilly Automotive, Inc.* | 205,400 | 16,421,730 | |||||||||
| Signet Jewelers Limited | 288,600 | 12,686,856 | |||||||||
| $ | 43,573,908 | ||||||||||
| HEALTH CARE — 14.8% | |||||||||||
| Bio-Rad Laboratories, Inc. (Class A)* | 77,200 | $ | 7,414,288 | ||||||||
| bioMérieux S.A. | 16,200 | 1,159,058 | |||||||||
| Life Technologies Corporation* | 247,700 | 9,638,007 | |||||||||
| Lincare Holdings Inc. | 337,750 | 8,683,553 | |||||||||
| Sonova Holding AG | 14,000 | 1,466,262 | |||||||||
| Varian Medical Systems, Inc.* | 24,000 | 1,611,120 | |||||||||
| VCA Antech, Inc.* | 236,200 | 4,664,950 | |||||||||
| $ | 34,637,238 | ||||||||||
| ENERGY — 7.7% | |||||||||||
| FMC Technologies, Inc.* | 201,800 | $ | 10,540,014 | ||||||||
| Noble Corporation | 251,600 | 7,603,352 | |||||||||
| $ | 18,143,366 | ||||||||||
8
PORTFOLIO OF INVESTMENTS
December 31, 2011
| COMMON STOCKS — Continued | Shares or Principal Amount | Value | |||||||||
| TECHNOLOGY — 6.4% | |||||||||||
| Dolby Laboratories, Inc. (Class A)* | 69,200 | $ | 2,111,292 | ||||||||
| Maxim Integrated Products, Inc. | 181,100 | 4,715,844 | |||||||||
| Microchip Technology Incorporated | 221,000 | 8,095,230 | |||||||||
| $ | 14,922,366 | ||||||||||
| TRANSPORTATION — 5.6% | |||||||||||
| Heartland Express, Inc. | 469,800 | $ | 6,713,442 | ||||||||
| Knight Transportation, Inc. | 416,600 | 6,515,624 | |||||||||
| $ | 13,229,066 | ||||||||||
| TOTAL COMMON STOCKS — 94.4% (Cost $128,234,204) | $ | 221,187,411 | |||||||||
| SHORT-TERM INVESTMENTS — 5.9% (Cost $13,929,992) | |||||||||||
| State Street Bank Repurchase Agreement—0.01% 01/03/12 (Collateralized by $4,145,000 Principal Amount U.S. Treasury Note — 1.5% 2016, Market Value $4,310,800) | $ | 4,224,000 | $ | 4,224,003 | |||||||
| Chevron Funding Corporation — 0.02% 01/03/12 | 9,706,000 | 9,705,989 | |||||||||
| TOTAL SHORT-TERM INVESTMENTS | $ | 13,929,992 | |||||||||
| TOTAL INVESTMENTS — 100.3% (Cost $142,164,196) | $ | 235,117,403 | |||||||||
| Other assets less liabilities, net — (0.3)% | (739,783 | ) | |||||||||
| TOTAL NET ASSETS — 100% | $ | 234,377,620 | |||||||||
*Non-income producing securities
See notes to financial statements.
9
STATEMENT OF ASSETS AND LIABILITIES
December 31, 2011
| ASSETS | |||||||||||
| Investments at value: | |||||||||||
| Investment securities — at market value (identified cost $128,234,204) | $ | 221,187,411 | |||||||||
| Short-term investments — at amortized cost (maturities 60 days or less) | 13,929,992 | $ | 235,117,403 | ||||||||
| Cash | 138 | ||||||||||
| Receivable for: | |||||||||||
| Capital stock sold | $ | 113,089 | |||||||||
| Dividends | 5,005 | 118,094 | |||||||||
| $ | 235,235,635 | ||||||||||
| LIABILITIES | |||||||||||
| Payable for: | |||||||||||
| Capital stock repurchased | $ | 659,885 | |||||||||
| Advisory fees and financial services | 150,510 | ||||||||||
| Accrued expenses | 47,620 | 858,015 | |||||||||
| NET ASSETS | $ | 234,377,620 | |||||||||
| SUMMARY OF SHAREHOLDERS' EQUITY | |||||||||||
| Capital stock — par value $0.01 per share; authorized 25,000,000 shares; 6,445,996 outstanding shares | $ | 64,460 | |||||||||
| Additional paid-in capital | 140,024,023 | ||||||||||
| Accumulated net realized gain on investments | 1,335,930 | ||||||||||
| Unrealized appreciation of investments | 92,953,207 | ||||||||||
| NET ASSETS | $ | 234,377,620 | |||||||||
| NET ASSET VALUE, REDEMPTION PRICE AND MAXIMUM OFFERING PRICE PER SHARE | |||||||||||
| Net asset value and redemption price per share (net assets divided by shares outstanding) | $ | 36.36 | |||||||||
| Maximum offering price per share (100/94.75 of per share net asset value) | $ | 38.37 | |||||||||
See notes to financial statements.
10
STATEMENT OF OPERATIONS
For the Year Ended December 31, 2011
| INVESTMENT INCOME | |||||||||||
| Dividends | $ | 5,198 | |||||||||
| Interest | 2,292,457 | ||||||||||
| $ | 2,297,655 | ||||||||||
| EXPENSES: | |||||||||||
| Advisory fees | $ | 1,720,627 | |||||||||
| Transfer agent fees and expenses | 335,234 | ||||||||||
| Financial services | 257,020 | ||||||||||
| Reports to shareholders | 55,599 | ||||||||||
| Audit and tax services | 43,850 | ||||||||||
| Directors fees and expenses | 38,779 | ||||||||||
| Line of credit | 38,021 | ||||||||||
| Custodian fees and expenses | 37,338 | ||||||||||
| Registration fees | 33,336 | ||||||||||
| Legal fees | 14,690 | ||||||||||
| Other fees and expenses | 12,516 | 2,587,010 | |||||||||
| Net investment loss | $ | (289,355 | ) | ||||||||
| NET REALIZED AND UNREALIZED GAIN (LOSS) ON INVESTMENTS | |||||||||||
| Net realized gain on investments: | |||||||||||
| Proceeds from sales of investment securities | $ | 41,672,564 | |||||||||
| Cost of investment securities sold | 30,721,850 | ||||||||||
| Net realized gain on investments | $ | 10,950,714 | |||||||||
| Change in unrealized appreciation of investments: | |||||||||||
| Unrealized appreciation at beginning of year | $ | 114,086,702 | |||||||||
| Unrealized appreciation at end of year | 92,953,207 | ||||||||||
| Change in unrealized appreciation of investments | (21,133,495 | ) | |||||||||
| Net realized and unrealized loss on investments | $ | (10,182,781 | ) | ||||||||
| CHANGE IN NET ASSETS RESULTING FROM OPERATIONS | $ | (10,472,136 | ) | ||||||||
See notes to financial statements.
11
STATEMENT OF CHANGES IN NET ASSETS
| For the Year Ended December 31, | |||||||||||||||||||
| 2011 | 2010 | ||||||||||||||||||
| CHANGES IN NET ASSETS | |||||||||||||||||||
| Operations: | |||||||||||||||||||
| Net investment income (loss) | $ | (289,355 | ) | $ | 760,454 | ||||||||||||||
| Net realized gain on investments | 10,950,714 | 1,734,713 | |||||||||||||||||
| Change in unrealized appreciation of investments | (21,133,495 | ) | 50,217,303 | ||||||||||||||||
| Change in net assets resulting from operations | $ | (10,472,136 | ) | $ | 52,712,470 | ||||||||||||||
| Distributions to shareholders from: | |||||||||||||||||||
| Net investment income | — | (772,433 | ) | ||||||||||||||||
| Capital Stock transactions: | |||||||||||||||||||
| Proceeds from Capital Stock sold | $ | 28,812,125 | $ | 30,238,745 | |||||||||||||||
| Proceeds from shares issued to shareholders upon reinvestment of dividends and distributions | — | 647,486 | |||||||||||||||||
| Cost of Capital Stock repurchased* | (53,098,751 | ) | (24,286,626 | ) | (53,033,878 | ) | (22,147,647 | ) | |||||||||||
| Total change in net assets | $ | (34,758,762 | ) | $ | 29,792,390 | ||||||||||||||
| NET ASSETS | |||||||||||||||||||
| Beginning of year | 269,136,382 | 239,343,992 | |||||||||||||||||
| End of year | $ | 234,377,620 | $ | 269,136,382 | |||||||||||||||
| CHANGE IN CAPITAL STOCK OUTSTANDING | |||||||||||||||||||
| Shares of Capital Stock sold | 767,131 | 945,334 | |||||||||||||||||
| Shares issued to shareholders upon reinvestment of dividends and distributions | — | 17,211 | |||||||||||||||||
| Shares of Capital Stock repurchased | (1,442,599 | ) | (1,652,000 | ) | |||||||||||||||
| Change in Capital Stock outstanding | (675,468 | ) | (689,455 | ) | |||||||||||||||
* Net of redemption fees of $9,874 and $18,091 collected for the years ended December 31, 2011 and December 31, 2010, respectively.
See notes to financial statements.
12
FINANCIAL HIGHLIGHTS
Selected Data for Each Share of Capital Stock Outstanding Throughout Each Year
| Year Ended December 31, | |||||||||||||||||||||||
| 2011 | 2010 | 2009 | 2008 | 2007 | |||||||||||||||||||
| Per share operating performance: | |||||||||||||||||||||||
| Net asset value at beginning of year | $ | 37.79 | $ | 30.64 | $ | 20.93 | $ | 34.14 | $ | 34.64 | |||||||||||||
| Income from investment operations: | |||||||||||||||||||||||
| Net investment income (loss) | $ | (0.04 | ) | $ | 0.11 | $ | (0.03 | ) | $ | 0.07 | $ | 0.15 | |||||||||||
| Net realized and unrealized gain (loss) on investment securities | (1.39 | ) | 7.15 | 9.74 | (12.89 | ) | 2.26 | ||||||||||||||||
| Total from investment operations | $ | (1.43 | ) | $ | 7.26 | $ | 9.71 | $ | (12.82 | ) | $ | 2.41 | |||||||||||
| Less distributions: | |||||||||||||||||||||||
| Dividends from net investment income | — | $ | (0.11 | ) | $ | — | * | $ | (0.07 | ) | $ | (0.16 | ) | ||||||||||
| Distributions from net realized capital gains | — | — | — | (0.32 | ) | (2.75 | ) | ||||||||||||||||
| Total distributions | — | $ | (0.11 | ) | $ | — | * | $ | (0.39 | ) | $ | (2.91 | ) | ||||||||||
| Redemption fees | — | * | — | * | — | * | — | * | — | * | |||||||||||||
| Net asset value at end of year | $ | 36.36 | $ | 37.79 | $ | 30.64 | $ | 20.93 | $ | 34.14 | |||||||||||||
| Total investment return** | (3.78 | )% | 23.69 | % | 46.40 | % | (37.84 | )% | 7.10 | % | |||||||||||||
| Ratios/supplemental data: | |||||||||||||||||||||||
| Net assets at end of year (in $000's) | $ | 234,378 | $ | 269,136 | $ | 239,344 | $ | 186,514 | $ | 391,245 | |||||||||||||
| Ratio of expenses to average net assets: | |||||||||||||||||||||||
| Before reimbursement from Adviser | 1.00 | % | 1.02 | % | 1.09 | % | 1.02 | % | 0.96 | % | |||||||||||||
| After reimbursement from Adviser | 1.00 | % | 1.02 | % | 1.07 | % | 1.02 | % | 0.96 | % | |||||||||||||
| Ratio of net investment income (loss) to average assets: | |||||||||||||||||||||||
| Before reimbursement from Adviser | (0.11 | )% | 0.31 | % | (0.14 | )% | 0.22 | % | 0.37 | % | |||||||||||||
| After reimbursement from Adviser | (0.11 | )% | 0.31 | % | (0.12 | )% | 0.22 | % | 0.37 | % | |||||||||||||
| Portfolio turnover rate | 5 | % | 3 | % | 3 | % | 11 | % | 10 | % | |||||||||||||
* Rounds to less than $0.01 per share.
** Return is based on net asset value per share, adjusted for reinvestment of distributions, and does not reflect deduction of the sales charge.
See notes to financial statements.
13
NOTES TO FINANCIAL STATEMENTS
December 31, 2011
NOTE 1 — Significant Accounting Policies
FPA Perennial Fund, Inc. (the "Fund") is registered under the Investment Company Act of 1940, as a diversified, open-end management investment company. The Fund's primary investment objective is long-term growth of capital. Current income is a secondary consideration. The following is a summary of significant accounting policies consistently followed by the Fund in the preparation of its financial statements.
A. Security Valuation
The Fund's investments are reported at fair value as defined by accounting principles generally accepted in the United States of America. The Fund generally determines its net asset value as of approximately 4:00 p.m. New York time each day the New York Stock Exchange is open. Further discussion of valuation methods, inputs and classifications can be found under Note 8.
B. Securities Transactions and Related Investment Income
Securities transactions are accounted for on the date the securities are purchased or sold. Dividend income and distributions to shareholders are recorded on the ex-dividend date. Interest income and expenses are recorded on an accrual basis.
C. Use of Estimates
The preparation of the financial statements in accordance with accounting principles generally accepted in the United States of America requires management to make estimates and assumptions that affect the amounts reported. Actual results could differ from those estimates.
NOTE 2 — Risk Considerations
Investing in the Fund may involve certain risks including, but not limited to, those described below.
Market Risk: Because the values of the Fund's investments will fluctuate with market conditions, so will the value of your investment in the Fund. You could lose money on your investment in the Fund or the Fund could underperform other investments.
Common Stocks and Other Securities: The prices of common stocks and other securities held by the Fund may decline in response to certain events taking place around the world, including those directly involving companies whose securities are owned by the Fund; conditions affecting the general economy; overall market changes; local, regional or global political, social or economic instability; and currency, interest rate and commodity price fluctuations. In addition, the Adviser's emphasis on a value-oriented investment approach generally results in the Fund's portfolio being invested primarily in medium or smaller sized companies. Smaller companies may be subject to a greater degree of change in earnings and business prospects than larger, more established companies and smaller companies are often more reliant on key products or personnel than larger companies. Also, securities of smaller companies are traded in lower volumes than those issued by larger companies and may be more volatile than those of larger companies. The Company's foreign investments are subject to additional risks such as, foreign markets could go down or prices of the Company's foreign investments could go down because of unfavorable changes in foreign currency exchange rates, foreign government actions, social, economic or political instability or other factors that can adversely affect investments in foreign countries. These factors can also make foreign securities less liquid, more volatile and harder to value than U.S. securities. In light of these characteristics of smaller companies and their securities, the Fund may be subjected to greater risk than that assumed when investing in the equity securities of larger companies.
NOTE 3 — Purchases of Investment Securities
Cost of purchases of investment securities (excluding short-term investments with maturities of 60 days or less at the time of purchase) aggregated $11,943,874 for the year ended December 31, 2011. Realized gains or losses are based on the specific identification method.
NOTE 4 — Federal Income Tax
No provision for federal income tax is required because the Fund has elected to be taxed as a "regulated investment company" under the Internal Revenue Code and intends to maintain this qualification and to distribute each year to its shareholders, in accordance with the minimum distribution requirements of the Code, its taxable net investment income and taxable net realized gains on investments.
Distributions paid to shareholders are based on net investment income and net realized gains determined on a tax reporting basis, which may differ from financial reporting. For federal income tax purposes,
14
NOTES TO FINANCIAL STATEMENTS
Continued
the Fund had no distributable earnings at December 31, 2011.
The tax status of distributions paid during the fiscal years ended December 31, 2011 and 2010 were as follows:
| 2011 | 2010 | ||||||||||
| Dividends from ordinary income | $ | — | $ | 772,433 | |||||||
The cost of investment securities held at December 31, 2011, was $130,860,388 for federal income tax purposes. Gross unrealized appreciation and depreciation for all investments at December 31, 2011, for federal income tax purposes was $93,125,145 and $2,798,122, respectively resulting in net unrealized depreciation of $90,327,023. As of and during the year ended December 31, 2011, the Fund did not have any liability for unrecognized tax benefits. The Fund recognizes interest and penalties, if any, related to unrecognized tax benefits as income tax expense in the Statement of Operations. During the year, the Fund did not incur any interest or penalties. The Fund is not subject to examination by U.S. federal tax authorities for years ended on or before December 31, 2008 or by state tax authorities for years ended on or before December 31, 2007.
During the year ended December 31, 2011, the Fund reclassified $301,334 of net investment losses from Accumulated Net Investment Loss to Additional Paid-in Capital to align financial reporting with tax reporting.
NOTE 5 — Advisory Fees and Other Affiliated Transactions
Pursuant to an Investment Advisory Agreement, advisory fees were paid by the Fund to First Pacific Advisors, LLC (the "Adviser"). Under the terms of this Agreement, the Fund pays the Adviser a monthly fee calculated at the annual rate of 0.75% of the first $50 million of the Fund's average daily net assets and 0.65% of the average daily net assets in excess of $50 million. In addition, the Fund pays the Adviser an amount equal to 0.10% of the average daily net assets for each fiscal year in reimbursement for the provision of financial services to the Fund. The Agreement obligates the Adviser to reduce its fee to the extent necessary to reimburse the Fund for any annual expenses (exclusive of interest, taxes, the cost of brokerage and research services, and extraordinary expenses such as litigation) in excess of 11/2% of the first $30 million and 1% of the remaining average net assets of the Fund for the year.
For the year ended December 31, 2011, the Fund paid aggregate fees of $38,250 to all Directors who are not affiliated persons of the Adviser. Certain officers of the Fund are also officers of the Adviser and FPA Fund Distributors, Inc.
NOTE 6 — Redemption Fees
A redemption fee of 2% applies to redemptions within 90 days of purchase for certain purchases made by persons eligible to purchase shares without an initial sales charge. For the year ended December 31, 2011, the Fund collected $9,874 in redemption fees. The impact of these fees is less than $0.01 per share.
NOTE 7 — Distributor
For the year ended December 31, 2011, FPA Fund Distributors, Inc. ("Distributor"), a wholly owned subsidiary of the Adviser, received $20,551 in net Fund share sales commissions after reallowance to other dealers. The Distributor pays its own overhead and general administrative expenses, the cost of supplemental sales literature, promotion and advertising.
NOTE 8 — Disclosure of Fair Value
Measurements
The Fund uses the following methods and inputs to establish the fair value of its assets and liabilities. Use of particular methods and inputs may vary over time based on availability and relevance as market and economic conditions evolve.
Equity securities are generally valued at the official closing price of, or the last reported sale price on, the exchange or market on which such securities are traded, as of the close of business on the day the securities are being valued or, lacking any sales, at the last available bid price. Prices for each security are taken from the principal exchange or market in which the security trades. Securities that are unlisted and fixed-income and convertible securities listed on a national securities exchange for which the over-the-counter market more accurately reflects the securities' value in the judgment of the Fund's officers, are valued at the most recent bid price. Short-term corporate notes with maturities of 60 days or less are valued at amortized cost, which approximates market value.
15
NOTES TO FINANCIAL STATEMENTS
Continued
Securities for which representative market quotations are not readily available or are considered unreliable by the Adviser are valued as determined in good faith under guidelines adopted by the authority of the Fund's Board of Directors. Various inputs may be reviewed in order to make a good faith determination of a security's value. These inputs include, but are not limited to, the type and cost of the security; contractual or legal restrictions on resale of the security; relevant financial or business developments of the issuer; actively traded similar or related securities; conversion or exchange rights on the security; related corporate actions; significant events occurring after the close of trading in the security; and changes in overall market conditions. Fair valuations and valuations of investments that are not actively trading involve judgment and may differ materially from valuations of investments that would have been used had greater market activity occurred.
The Fund classifies its assets based on three valuation methodologies. Level 1 values are based on quoted market prices in active markets for identical assets. Level 2 values are based on significant observable market inputs, such as quoted prices for similar assets and quoted prices in inactive markets or other market observable inputs. Level 3 values are based on significant unobservable inputs that reflect the Fund's determination of assumptions that market participants might reasonably use in valuing the assets. The valuation levels are not necessarily an indication of the risk associated with investing in those securities. The following table presents the valuation levels of the Fund's investments as of December 31, 2011:
| Level 1 — Quoted Prices | $ | 221,187,411 | (1)(3) | ||||
| Level 2 — Other significant observable inputs | 13,929,992 | (2)(3) | |||||
| Level 3 — Significant unobservable inputs | — | (3) | |||||
| Total investments | $ | 235,117,403 | |||||
(1) All common stocks are classified under Level 1. The Portfolio of Investments provides further information on major security types.
(2) Comprised solely of short-term investments with maturities of 60 days or less that are valued at amortized cost.
(3) Transfers of investments between different levels of the fair value hierarchy are recorded at market value as of the end of the reporting period. There were no transfers between Levels 1, 2, or 3 during the year ended December 31, 2011.
NOTE 9 — Line of Credit
The Fund, along with FPA Paramount, Inc., has collectively entered into an agreement that enables them to participate in a $50 million unsecured line of credit with State Street Bank and Trust. Borrowings will be made solely to temporarily finance the repurchase of Capital Stock. Interest is charged to each Fund based on its borrowings at a rate per annum equal to the higher of the Federal Funds Rate or the Overnight LIBOR Rate plus 1.25%. In addition, the Fund and FPA Paramount Fund, Inc. pay a commitment fee of 0.15% per annum on any unused portion of the line of credit. During the year ended December 31, 2011, the Fund had no borrowings under the agreement.
NOTE 10 — New Accounting Pronouncements
In April 2011, the Financial Accounting Standards Board (FASB) issued Accounting Standards Update (ASU) No. 2011-03 "Transfers and Servicing (Topic 860): Reconsideration of Effective Control for Repurchase Agreements." The ASU 2011-03 is intended to improve financial reporting of repurchase agreements and other agreements that both entitle and obligate a transferor to repurchase or redeem the financial assets before their maturity. In May 2011, the FASB issued ASU No. 2011-04 "Amendments to Achieve Common Fair Value Measurement and Disclosure Requirements in U.S. GAAP and IFRS". ASU 2011-04 includes common requirements for measurement of and disclosure about fair value between U.S. GAAP and IFRS. ASU 2011-04 will require reporting entities to disclose quantitative information about the unobservable inputs used in the fair value measurements categorized within Level 3 of the fair value hierarchy. In addition, ASU 2011-04 will require reporting entities to make disclosures about amounts and reasons for all transfers in and out of Level 1 and Level 2 fair value measurements. These new pronouncements are effective for interim and annual reporting periods beginning after December 15, 2011. Management is currently evaluating the impact these pronouncements may have on the Fund's financial statements.
16
REPORT OF INDEPENDENT REGISTERED
PUBLIC ACCOUNTING FIRM
TO THE SHAREHOLDERS AND
BOARD OF DIRECTORS OF FPA PERENNIAL FUND, INC.
We have audited the accompanying statement of assets and liabilities of FPA Perennial Fund, Inc. (the "Fund"), including the portfolio of investments, as of December 31, 2011, the related statement of operations for the year then ended, the statements of changes in net assets for each of the two years in the period then ended, and the financial highlights for each of the five years in the period then ended. These financial statements and financial highlights are the responsibility of the Fund's management. Our responsibility is to express an opinion on these financial statements and financial highlights based on our audits.
We conducted our audits in accordance with standards of the Public Company Accounting Oversight Board (United States). Those standards require that we plan and perform the audit to obtain reasonable assurance about whether the financial statements and financial highlights are free of material misstatement. The Fund is not required to have, nor were we engaged to perform, an audit of its internal control over financial reporting. Our audits included consideration of internal control over financial reporting as a basis for designing audit procedures that are appropriate in the circumstances, but not for the purpose of expressing an opinion on the effectiveness of the Fund's internal control over financial reporting. Accordingly, we express no such opinion. An audit also includes examining, on a test basis, evidence supporting the amounts and disclosures in the financial statements, assessing the accounting principles used and significant estimates made by management, as well as evaluating the overall financial statement presentation. Our procedures included confirmation of securities owned as of December 31, 2011, by correspondence with the custodian. We believe that our audits provide a reasonable basis for our opinion.
In our opinion, the financial statements and financial highlights referred to above present fairly, in all material respects, the financial position of FPA Perennial Fund, Inc. as of December 31, 2011, the results of its operations for the year then ended and the changes in its net assets for each of the two years in the period then ended, and the financial highlights for each of the five years in the period then ended in conformity with accounting principles generally accepted in the United States of America.

Los Angeles, California
February 10, 2012
17
RENEWAL OF INVESTMENT ADVISORY AGREEMENT (Unaudited)
Approval of the Advisory Agreement. At a meeting of the Board of Directors held on August 1, 2011, the Directors approved the continuation of the advisory agreement between the Fund and the Adviser for an additional one-year period through September 30, 2012, on the recommendation of the Independent Directors who met in executive session on August 1, 2011 prior to the Board meeting to review and discuss the proposed continuation of the advisory agreement. The following paragraphs summarize the material information and factors considered by the Board and the Independent Directors as well as the Directors' conclusions relative to such factors.
Nature, Extent and Quality of Services. The Board and the Independent Directors considered information regarding the Adviser and its staffing in connection with the Fund, including the Fund's portfolio managers and the senior analyst on their team, the scope of accounting, administrative, shareholder and other services supervised and provided by the Adviser, and the absence of any significant service problems reported to the Board. The Board and the Independent Directors especially noted the experience, length of service and the outstanding reputation of the Fund's portfolio managers, Eric Ende and Steven Geist, who have managed the Fund since 1995, and Gregory A. Herr, who joined the Adviser as an analyst in 2007. The Board and the Independent Directors concluded that the nature, extent and quality of services provided by the Adviser have benefited and should continue to benefit the Fund and its shareholders.
Investment Performance. The Board and the Independent Directors reviewed the overall investment performance of the Fund. The Directors also received information from an independent consultant, Lipper, a Thomson Reuters Company ("Lipper"), regarding the Fund's performance relative to a peer group of mid-cap core funds selected by Lipper (the "Peer Group"). The Board and the Independent Directors noted the Fund's competitive longer-term investment performance of the Fund when compared to the Peer Group. They further concluded that the Adviser's continued management of the Fund should benefit the Fund and its shareholders.
Advisory Fees and Fund Expenses; Adviser Profitability; Economies of Scale and Sharing of Economies of Scale. The Board and the Independent Directors were provided information by the Adviser to enable consideration of the Fund's advisory fees and total expense levels, as well as the overall profitability of the Adviser, the benefits to the Adviser from its relationship to the Fund, the extent to which economies of scale with respect to the management of the Fund, if any, would be realized, and whether the Fund is sharing, or will share, in those economies.
The Board and the Independent Directors reviewed comparative information relative to fees and expenses for the mutual fund industry generally and for the Peer Group. The Board and the Independent Directors noted that the Fund's fees and expenses were at the lowest end of the range for the Peer Group. The Board and the Independent Directors noted that the overall expense ratio of the Fund was also the lowest when compared to the Peer Group. The Board and the Independent Directors noted that the fee rate charged to the Fund is currently lower than the fee rate charged by the Adviser on the other products managed in a similar style by the portfolio managers. The Board and the Independent Directors concluded that the overall fee rate was reasonable and fair to the Fund and its shareholders in light of the nature and quality of the services provided by the Adviser.
The Board and the Independent Directors considered whether there have been economies of scale with respect to the management of the Fund, whether the Fund has appropriately benefited from any economies of scale, and whether the fee rate is reasonable in relation to the Fund's assets and any economies of scale that may exist. The Independent Directors discussed the fact that the fee rate does not have any additional breakpoints. The mutual fund industry has trended toward funds having breakpoints in the advisory fee structure as a means by which to share in economies of scale as a fund's assets grow; however, not all funds have breakpoints in their fee structures. The Adviser indicated its belief that additional breakpoints currently were not appropriate for the Fund and that no meaningful income and expense forecasts for its business could be prepared given uncertainties regarding the direction of the economy, rising inflation, increasing costs for personnel and systems, and growth (or not) in the Fund's assets, all of which could negatively impact the Adviser. The Board and the Independent Directors noted that the Adviser had not increased the fee rate charged to the Fund despite the Adviser's claims of increases in the Adviser's internal costs of providing investment management services to
18
RENEWAL OF INVESTMENT ADVISORY AGREEMENT
Continued
the Fund, in part due to administrative burdens and expenses resulting from recent legislative and regulatory actions such as Sarbanes-Oxley. According to the Adviser, such increased costs have included additions to administrative personnel and systems that enhance the quality of services provided to the Fund and the establishment of a full-time Chief Compliance Officer and his assistant. The Board and the Independent Directors also noted that asset levels of the Fund are currently lower than they have been for the past several years, yet the Adviser has continued to make investments in personnel servicing the Fund.
Conclusions. The Board and the Independent Directors determined that the Fund continues to benefit from the services of a highly experienced portfolio management team that has produced competitive long-term returns. In addition, the Board and the Independent Directors agreed that the Fund continues to receive high quality accounting, administrative, shareholder and other ancillary services from the Adviser. The Board and the Independent Directors also determined that while there is no uniform industry methodology to measure or apply economies of scale, the Fund's expense ratio, the overall profitability of the Adviser, and the sharing of economies of scale with the Fund are fair and reasonable under the current circumstances. The Board and the Independent Directors also stated their intention to continue monitoring the factors relevant to the Adviser's compensation, such as changes in the Fund's asset levels, changes in portfolio management personnel and the cost and quality of the services provided by the Adviser to the Fund. On the basis of the foregoing, and without assigning particular weight to any single factor, the Board and the Independent Directors determined to approve the continuation of the current Advisory Agreement for another one-year period through September 30, 2012.
19
SHAREHOLDER EXPENSE EXAMPLE
December 31, 2011 (unaudited)
Fund Expenses
As a shareholder of the Fund, you incur two types of costs: (1) transaction costs, and (2) ongoing costs, including advisory and administrative fees; shareholder service fees; and other Fund expenses. The Example is intended to help you understand your ongoing costs (in dollars) of investing in the Fund and to compare these costs with the ongoing costs of investing in other mutual funds. The Example is based on an investment of $1,000 invested at the beginning of the year and held for the entire year.
Actual Expenses
The information in the table under the heading "Actual Performance" provides information about actual account values and actual expenses. You may use the information in this column, together with the amount you invested, to estimate the expenses that you paid over the period. Simply divide your account value by $1,000 (for example, an $8,600 account value divided by $1,000= 8.6), then multiply the result by the number in the first column in the row entitled "Expenses Paid During Period" to estimate the expenses you paid on your account during this period.
Hypothetical Example for Comparison Purposes
The information in the table under the heading "Hypothetical Performance (5% return before expenses)" provides information about hypothetical account values and hypothetical expenses based on the Fund's actual expense ratio and an assumed rate of return of 5% per year before expenses, which is not the Fund's actual return. The hypothetical account values and expenses may not be used to estimate the actual ending account balance or expenses you paid for the period. You may use this information to compare the ongoing costs of investing in the Fund and other funds. To do so, compare this 5% hypothetical example with the 5% hypothetical examples that appear in the shareholder reports of other funds.
Please note that the expenses shown in the table are meant to highlight your ongoing costs only and do not reflect any transactional costs. Therefore, the information under the heading "Hypothetical Performance (5% return before expenses)" is useful in comparing ongoing costs only, and will not help you determine the relative total costs of owning different funds. In addition, if these transactional costs were included, your costs would have been higher.
| Actual Performance | Hypothetical Performance (5% return before expenses) | ||||||||||
| Beginning Account Value June 30, 2011 | $ | 1,000.00 | $ | 1,000.00 | |||||||
| Ending Account Value December 31, 2011 | $ | 905.15 | $ | 1,019.90 | |||||||
| Expenses Paid During Period* | $ | 4.80 | $ | 5.10 | |||||||
* Expenses are equal to the Fund's annualized expense ratio of 1.00%, multiplied by the average account value over the period and prorated for the six-months ended December 31, 2011 (184/365 days).
20
DIRECTOR AND OFFICER INFORMATION
| Name, Age & Address | Positions(s) With Fund/ Years Served | Principal Occupation(s) During the Past 5 Years | Portfolios in Fund Complex Overseen | Other Directorships | |||||||||||||||
| Willard H. Altman, Jr. – (76)† | Director & Chairman* Years Served: 13 | Retired, Formerly, until 1995, Partner of Ernst & Young LLP, a public accounting firm. | 7 | ||||||||||||||||
| Thomas P. Merrick – (74)† | Director* Years Served: 3 | Private consultant. President of Strategic Planning Consultants for more than the past five years. Former Executive Committee member and Vice President of Fluor Corporation, responsible for strategic planning, from 1993 to 1998. | 7 | ||||||||||||||||
| Lawrence J. Sheehan – (79)† | Director* Years Served: 21 | Retired. Formerly Partner (1969 to 1994) and of counsel employee (1994 to 2002) of the law firm of O'Melveny & Myers LLP. | 2 | ||||||||||||||||
| Eric S. Ende – (67) | Director* President & Portfolio Manager Years Served: 28 | Partner of the Adviser since 2006. Formerly Senior Vice President of First Pacific Advisers, Inc. from 1984 to 2006. | 3 | ||||||||||||||||
| Steven R. Geist (58) | Executive Vice President & Portfolio Manager Year Served: 16 | Partner of the Adviser since 2006. Formerly Vice President of First Pacific Advisers, Inc. from 1992 to 2006. | |||||||||||||||||
| J. Richard Atwood – (51) | Treasurer Years Served: 15 | Chief Operating Officer of the Adviser. President and Chief Executive Officer of FPA Fund Distributors, Inc. | FPA Fund Distributors, Inc. | ||||||||||||||||
| Christopher H. Thomas – (54) | Chief Compliance Officer Years Served: 17 | Vice President and Chief Compliance Officer of the Adviser and Vice President of FPA Fund Distributors, Inc. | FPA Fund Distributors, Inc. | ||||||||||||||||
| Sherry Sasaki – (57) | Secretary Years Served: 29 | Assistant Vice President and Secretary of the Adviser and of FPA Fund Distributors, Inc. | |||||||||||||||||
| E. Lake Setzler – (44) | Assistant Treasurer Years Served: 6 | Vice President and Controller of the Adviser. | |||||||||||||||||
* Directors serve until their resignation, removal or retirement.
† Audit Committee member
Additional information on the Directors is available in the Statement of Additional Information. Each of the above individuals can be contacted at 11400 W. Olympic Blvd,. Suite 1200, Los Angeles, CA 90064.
21
FPA PERENNIAL FUND, INC.
INVESTMENT ADVISER
First Pacific Advisors, LLC
11400 West Olympic Boulevard, Suite 1200
Los Angeles, CA 90064
DISTRIBUTOR
FPA Fund Distributors, Inc.
11400 West Olympic Boulevard, Suite 1200
Los Angeles, California 90064
COUNSEL
K&L Gates LLP
San Francisco, California
TICKER SYMBOL: FPPFX
CUSIP: 302548102
INDEPENDENT REGISTERED PUBLIC ACCOUNTING FIRM
Deloitte & Touche LLP
Los Angeles, California
CUSTODIAN
State Street Bank and Trust Company
Boston, Massachusetts
TRANSFER & SHAREHOLDER SERVICE AGENT
UMB Fund Services, Inc.
P.O. Box 2175
Milwaukee, WI 53201-2175
or
803 W. Michigan St., Ste. A
Milwaukee, WI 53233-2301
(800) 638-3060
This report has been prepared for the information of shareholders of FPA Perennial Fund, Inc., and is not authorized for distribution to prospective investors unless preceded or accompanied by an effective prospectus.
The Fund's complete proxy voting record for the 12 months ended June 30, 2011 is available without charge, upon request by calling (800) 982-4372 and on the SEC's website at www.sec.gov.
The Fund's schedule of portfolio holdings, filed the first and third quarter of the Fund's fiscal year on Form N-Q with the SEC, is available on the SEC's website at www.sec.gov. Form N-Q is available at the SEC's Public Reference Room in Washington, D.C., and information on the operations of the Public Reference Room may be obtained by calling (202) 942-8090. To obtain Form N-Q from the Fund, shareholders can call (800) 982-4372.
Additional information about the Fund is available online at www.fpafunds.com. This information includes, among other things, holdings, top sectors, and performance, and is updated on or about the 15th business day after the end of each quarter.
Item 2. Code of Ethics.
(a) The registrant has adopted a code of ethics that applies to the registrant’s principal executive and financial officers.
(b) Not Applicable
(c) During the period covered by this report, there were not any amendments to the provisions of the code of ethics adopted in 2(a) above.
(d) During the period covered by this report, there were not any implicit or explicit waivers to the provisions of the code of ethics adopted in 2(a).
(e) Not Applicable
(f) A copy of the registrant’s code of ethics is filed as an exhibit to this Form N-CSR. Upon request, any person may obtain a copy of this code of ethics, without charge, by calling (800) 982-4372.
Item 3. Audit Committee Financial Expert.
The registrant’s board of directors has determined that Willard H. Altman, Jr., a member of the registrant’s audit committee and board of directors, is an “audit committee financial expert” and is “independent,” as those terms are defined in this Item. This designation will not increase the designee’s duties, obligations or liability as compared to his duties, obligations and liability as a member of the audit committee and of the board of directors. This designation does not affect the duties, obligations or liability of any other member of the audit committee or the board of directors.
Item 4. Principal Accountant Fees and Services.
|
|
| 2010 |
| 2011 |
| ||
(a) | Audit Fees |
| $ | 36,700 |
| $ | 37,500 |
|
(b) | Audit Related Fees |
| -0- |
| -0- |
| ||
(c) | Tax Fees |
| $ | 7,150 |
| $ | 7,300 |
|
(d) | All Other Fees |
| -0- |
| -0- |
| ||
|
| |||||||
(e)(1) | Disclose the audit committee’s pre-approval policies and procedures described in paragraph (c)(7) of Rule 2-01 of Regulation S-X. The audit committee shall pre-approve all audit and permissible non-audit services that the committee considers compatible with maintaining the independent auditors’ independence. The pre-approval requirement will extend to all non-audit services provided to the registrant, the adviser, and any entity controlling, controlled by, or under common control with the adviser that provides ongoing services to the registrant, if the engagement relates directly to the operations and financial | |||||||
| reporting of the registrant; provided, however, that an engagement of the registrant’s independent auditors to perform attest services for the registrant, the adviser or its affiliates required by generally accepted auditing standards to complete the examination of the registrant’s financial statements (such as an examination conducted in accordance with Statement on Auditing Standards Number 70 issued by the American Institute of Certified Public Accountants), will be deem pre-approved if: (i) the registrant’s independent auditors inform the audit committee of the engagement, (ii) the registrant’s independent auditors advise the audit committee at least annually that the performance of this engagement will not impair the independent auditor’s independence with respect to the registrant, and (iii) the audit committee receives a copy of the independent auditor’s report prepared in connection with such services. The committee may delegate to one or more committee members the authority to review and pre-approve audit and permissible non-audit services. Actions taken under any such delegation will be reported to the full committee at its next meeting. |
|
|
(e)(2) | Disclose the percentage of services described in each of paragraphs (b) — (d) of this Item that were approved by the audit committee pursuant to paragraph (c)(7)(i)(C) of Rule 2-01 of Regulation S-X. 100% of the services provided to the registrant described in paragraphs (b) — (d) of this Item were pre-approved by the audit committee pursuant to paragraph (e)(1) of this Item. There were no services provided to the investment adviser or any entity controlling, controlled by or under common control with the adviser described in paragraphs (b) — (d) of this Item that were required to be pre-approved by the audit committee. |
|
|
(f) | If greater than 50%, disclose the percentage of hours expended on the principal accountant’s engagement to audit the registrant’s financial statements for the most recent fiscal year that were attributed to work performed by persons other than the principal accountant’s full-time, permanent employees. All services performed on the engagement to audit the registrant’s financial statements for the most recent fiscal year end were performed by the principal accountant’s full-time, permanent employees. |
|
|
(g) | Disclose the aggregate non-audit fees billed by the registrant’s accountant for services rendered to the registrant, and rendered to the registrant’s investment adviser (not including any sub-adviser whose role is primarily portfolio management and is subcontracted with or overseen by another investment adviser), and any entity controlling, controlled by, or under common control with the adviser that provides ongoing services to the registrant for each of the last two fiscal years of the registrant. None. |
(h) | Disclose whether the registrant’s audit committee of the board of directors has considered whether the provision of non-audit services that were rendered to the registrant’s investment adviser (not including any sub-adviser whose role is primarily portfolio management and is subcontracted with or overseen by another investment adviser), and any entity controlling, controlled by, or under common control with the investment adviser that provides ongoing services to the registrant that were not pre-approved pursuant to paragraph (c)(7)(ii) of Rule 2-01 of Regulation S-X is compatible with maintaining the principal accountant’s independence. Not Applicable. |
Item 5. Audit Committee of Listed Registrants. Not Applicable.
Item 6. Schedule of Investments. The schedule of investments is included as part of the report to stockholders filed under Item 1 of this Form.
Item 7. Disclosure of Proxy Voting Policies and Procedures for Closed-End Management Investment Companies. Not Applicable.
Item 8. Portfolio Managers of Closed-End Management Investment Companies. Not Applicable.
Item 9. Purchases of Equity Securities by Closed-End Management Investment Company and Affiliated Purchasers. Not Applicable.
Item 10. Submission of Matters to a Vote of Security Holders. There has been no material change to the procedures by which shareholders may recommend nominees to the registrant’s board of directors.
Item 11. Controls and Procedures.
(a) The principal executive officer and principal financial officer of the registrant have concluded that the registrant’s disclosure controls and procedures (as defined in Rule 30a-3(c) under the Investment Company Act of 1940) are effective based on their evaluation of the disclosure controls and procedures as of a date within 90 days of the filing date of this report.
(b) There have been no significant changes in the registrant’s internal controls over financial reporting (as defined in Rule 30a-3(d) under the Investment Company Act of 1940) that occurred during the second fiscal quarter of the period covered by this report that have materially affected, or is reasonably likely to materially affect, the registrant’s internal controls over financial reporting.
Item 12. Exhibits.
(a)(1) Code of ethics as applies to the registrant’s officers and directors, as required to be disclosed under Item 2 of Form N-CSR. Attached hereto as Ex.99.CODE.ETH.
(a)(2) Separate certification for the registrant’s principal executive officer and principal financial officer, as required by Rule 30a-2(a) under the Investment Company Act of 1940. Attached hereto.
(a)(3) Not Applicable
(b) Separate certification for the registrant’s principal executive officer and principal financial officer, as required by Rule 30a-2(b) under the Investment Company Act of 1940. Attached hereto.
SIGNATURES
Pursuant to the requirements of the Securities Exchange Act of 1934 and the Investment Company Act of 1940, the registrant has duly caused this report to be signed on its behalf by the undersigned, thereunto duly authorized.
FPA PERENNIAL FUND, INC. |
| |
|
|
|
|
|
|
By: | /s/ ERIC S. ENDE |
|
Eric S. Ende, President |
| |
(Principal Executive Officer) |
| |
|
| |
Date: February 17, 2012 |
| |
Pursuant to the requirements of the Securities Exchange Act of 1934 and the Investment Company Act of 1940, this report has been signed below by the following persons on behalf of the registrant and in the capacities and on the dates indicated.
FPA PERENNIAL FUND, INC. |
| |
|
|
|
|
|
|
By: | /s/ ERIC S. ENDE |
|
Eric S. Ende, President |
| |
(Principal Executive Officer) |
| |
|
| |
Date: February 17, 2012 |
| |
|
|
|
|
|
|
By: | /s/ J. RICHARD ATWOOD |
|
J. Richard Atwood, Treasurer |
| |
(Principal Financial Officer) |
| |
|
| |
Date: February 17, 2012 |
| |