UNITED STATES
SECURITIES AND EXCHANGE COMMISSION
Washington, D.C. 20549
FORM N-CSR
CERTIFIED SHAREHOLDER REPORT OF REGISTERED
MANAGEMENT INVESTMENT COMPANIES
Investment Company Act file number | 811-3896 | |||||||
| ||||||||
FPA PERENNIAL FUND, INC. | ||||||||
(Exact name of registrant as specified in charter) | ||||||||
| ||||||||
11400 WEST OLYMPIC BLVD., SUITE 1200, LOS ANGELES, CALIFORNIA |
| 90064 | ||||||
(Address of principal executive offices) |
| (Zip code) | ||||||
| ||||||||
J. RICHARD ATWOOD, 11400 WEST OLYMPIC BLVD., SUITE 1200, LOS ANGELES, CALIFORNIA 90064 | ||||||||
(Name and address of agent for service) | ||||||||
| ||||||||
Registrant’s telephone number, including area code: | 310-473-0225 |
| ||||||
| ||||||||
Date of fiscal year end: | DECEMBER 31 |
| ||||||
| ||||||||
Date of reporting period: | DECEMBER 31, 2009 |
| ||||||
Item 1. Report to Stockholders.
Annual Report

Distributor:
FPA FUND DISTRIBUTORS, INC.
11400 West Olympic Boulevard, Suite 1200
Los Angeles, California 90064
52722
FPA Perennial Fund, Inc.
December 31, 2009
LETTER TO SHAREHOLDERS
What about "too big to fail?"
As 2009 drew to a close, many market participants (most disconcertingly regulators) appeared to collectively exhale in relief. We worry that observing nine months of equity gains and narrowed credit spreads along with substantial debt issuance has led investors to conclude that government intervention solved the problems confronting the financial sector. During the markets' liquidity crisis this time last year, when seemingly every participant was fearful and hoarding cash, the commitments from the Federal Reserve and Treasury did provide a welcome benefit. In this stabilized period, we believe it is now time to tackle the gaping issue of institutions deemed too big to fail. While this issue doesn't directly affect any of the investments in our portfolio (none is a big financial company), we discuss it because we believe it is terribly important. Current government intervention, as well as any required future actions if changes are no t made, will worsen the country's fiscal position, likely dampening economic growth.
By too big to fail, we mean that regulators consider such a company so important to the financial system that its failure would be catastrophic. Over the last twenty years, governments have repeatedly intervened to offset financial crises. While admirable in their intent, these actions have created what economists call moral hazard. That means market participants increasingly have come to expect governments to bail out risky behavior. After the collapse of Lehman Brothers, this attitude was clearly on display in the enormous criticism directed toward the Treasury and Federal Reserve. This situation leaves it hard to believe any government would allow a similar event to happen in the future. We are still in the midst of this phenomenon. As recently as mid-December, the European Central Bank coordinated a bailout of Hypo Group Alpe Adria, the sixth largest bank in Austria. The increased size of financial institutions over the last two decades has convinced governments of their too-big-to-fail status, and made regulators unwilling to skip each requested bail out. Of the 8,300 banks in the U.S., in 2008 the top ten (ranked by assets) controlled 75% of the industry assets compared to 25% two decades earlier. Globally, the picture looks the same. According to a recent presentation by economists from the Bank of England (BOE), the assets of the top five global banks as a percentage of the top 1,000 global banks have doubled over the last ten years. We are not suggesting that governments shouldn't have intervened in 2008 – 09. Failure to do so because of built-up excesses would have been extremely dangerous. Due to the actions of the past eighteen months, however, the banking system has consolidated further, concentrating even more systemic importance into fewer hands. We are arguing that today we must reform the structure in order to break this cycle in the future.
Why does the structure need to change?
Looking back at bank industry trends over the past six decades, the returns on capital earned by the largest banks in recent history increased substantially compared to prior decades. For smaller banks the improvement in returns was much more gradual. How did the big banks do it? We're generalizing, but two factors were major contributors. Over time, but particularly in the last five years, they produced a substantial increase in balance sheet leverage (required capital compared to assets held). Specifically, according to a Bernstein Research report, from 1998 to 2006 the largest banks averaged just over a 5% ratio of common equity to assets compared to a ratio of almost 8% at all U.S. commercial banks. Leverage magnifies returns. When markets were stable, returns were significantly enhanced, but over the last two years, as some investments performed poorly and many positions had to be liquidated at distressed prices, returns were significan tly depressed. Another area of emphasis was the increase of assets in the large banks' trading portfolios. Many of these assets were not actively traded, which permits discretion in their valuation. While perfectly allowable under accounting rules, this led to an extended period of increased valuations for those assets. However, according to the BOE economists, banks worldwide took $900 billion in markdowns of these trading assets through the third quarter of 2009.
The tactics employed by the large banks make sense in most economic environments. The higher returns on larger capital bases meant greater profit streams for the firms. Markets responded enthusiastically. In this scenario, shareholders and
1
bank employees (compensation captured up to half of revenues) had unlimited upside. Greater leverage/assets created greater wealth. Turning to the downside, however, employees who retained their jobs faced limited consequences, and shareholders could only lose their investment. When it came time to pay guarantees to depositors, inject additional capital or provide wholesale funding for the entire market, then it was up to the government to write the check. Economists call the potential for unlimited rewards and limited liability, asymmetric incentives. That was certainly the case here.
Beyond a theoretical discussion of bank economics and executive incentives, this issue has spillover impact into U.S. fiscal policy and the burden it places on each of us. Historically, funding for bank bailouts has come from increased taxes. This time will be no different. According to the same BOE presentation, total global government commitments in response to this crisis are $14 trillion, or almost 25% of global GDP. Since those commitments were provided during the economic recession, and were funded by greater governmental borrowings, countries have experienced sharp increases in the amount of their outstanding debt compared to the size of their economies (debt to GDP ratios). A recent study from the International Monetary Fund (IMF) predicts that ten years of higher taxes and net reductions in spending by developed countries will be necessary to return to the levels of government indebtedness that existed two years ago. For the U.S. sp ecifically to return to its pre-crisis level (gross debt at 66% of GDP) by 2030, the IMF believes will require taxes to increase or spending to fall by a combined 8.8% of GDP from 2010 to 2020. Based on 2008 GDP, that implies a change of about $1.3 trillion. To put that amount into perspective, in fiscal 2009 personal income taxes collected were $900 billion and corporate income taxes paid were about $125 billion. Federal on-budget government expenditures in fiscal 2009 were about $3.1 trillion. This projection also assumes no rapid upward shift in interest rates (which would increase interest expense on government debt), nor does it include the price tag (fancifully put at less than $1 trillion over the next decade) of the proposed health care legislation. Even over a ten-year period, as California's current difficulties illustrate, finding this amount of spending cuts or revenue increases will be very difficult.
What should we expect from reforms?
Given the severity of this crisis, it is reasonable to ask how radical the cure should be. Without any doubt we need a global commercial banking system because it runs our system of payments. Banks also collect deposits and make loans to small and mid-sized companies and even some large ones. All of these functions are essential to the global economy. In their current forms, however, the institutions considered too big to fail by the Federal Reserve perform many functions like proprietary trading, prime brokerage, structured products and merchant banking that are superfluous to the basic activities we just described. We believe a division of these companies into their "utility" and "risk taking" activities is the most sensible response. Mervyn King, governor of the BOE, justified separation during a speech in October when he said, "Anyone who proposed giving government guarantees to depositors and creditors, and then suggested that such fund ing could be used to finance highly risky and speculative activities, would be thought rather unworldly. But that is where we are now." Unfortunately, "where we are now" is where we are likely to remain as the separation outcome appears unlikely to occur. Despite our belief in its virtues, it collides with two realities. First, as Paul Volker recently described, bank industry lobbyists are fighting hard in Washington to promote "reform light." Along with several Fed Governors, they argue that criteria are too ambiguous for determining which firms should be broken up. We completely disagree, and believe size (assets) is the relevant metric. As a second issue, these are global companies, and other countries are not eager to dismantle what they often consider "national champions." Because the banking system touches all countries, the necessary cooperation for reform will be very challenging. Watching the drama at recent G-20 summits and the Copenhagen climate conference reveals the difficulty in achieving coord inated results. We believe differences among global regulators would also doom the effectiveness of "living wills," documents that would provide explicit details to wind down each of a bank's global subsidiaries in the event
2
of failure. Regardless of whether or not foreign governments are willing to make changes, the U.S. must begin the process of shoring up our companies. Short of our preferred method of dismantling the largest banks, in the next section we describe practical steps that can significantly limit the need for future government assistance.
Necessary reforms:
In an ideal world, regulatory standards would change counter-cyclically as needed. Within fixed ranges, capital and margin requirements would increase and loan to value ratios (size of loan compared to value of asset) of residential and commercial mortgages would decrease during ebullient markets and move in the opposite direction in times of distress. Implementation of such timing requires sound judgment and sufficient courage to take contrarian positions. Unfortunately, those qualities are rare, and distinct from intelligence. Consistently finding the right individuals possessing them would be a major challenge. Even worse, the lack of political independence of most regulators makes such a dynamic program nearly impossible to execute.
Also falling under the ideal category would be regulation that makes highly compensated employees and all directors personally liable for the amount of cumulative compensation received. That compensation would be paid traditionally, but in the event of a loss of the bank's equity, creditors (or rescuer in the government's case) could claw back all the payments these employees cumulatively received. While this regulation is unlikely to pass, nothing focuses attention like personal liability.
Sticking to what is practical, the following are the reforms we consider essential.
• Leverage ratios must be capped at lower levels. Balance sheets of the largest U.S. banks should never again be permitted to hold assets at 20x tangible equity. We see no reason that a limit of assets at 13x equity shouldn't be phased in over time. Banks functioned more than adequately with that amount of leverage over most of the last fifty years. This higher level of equity will offer more cushion during difficult periods, a worthwhile condition even if it depresses bank profitability.
• Regulatory capital should be strictly defined as tangible equity. The rules were sufficiently watered down over the last fifteen years with the Tier 1 definition to allow hybrid securities. Including those in the calculation did little to appease the market during the downturn. Encouragingly, the recent pronouncements in Basel from the Bank of International Settlements, which sets global rules, appear to be moving toward this stricter definition.
• Liquidity is another area that must be addressed. Lehman Brothers collapsed because so much of its funding (borrowings) came from very short-term wholesale sources. When these lenders started a "run on the bank," Lehman was unable to shrink its balance sheet quickly enough to accommodate the demands for immediate repayment. The issue was one of illiquidity more than insolvency. According to a report from broker CLSA, deposits (whether "overnight" demand or savings) provided 60% of bank funding in 1992 compared to only 44% in 2008. Though this change is partly due to disintermediation by money market funds, it is nevertheless concerning. We are unsure what to specify about regulatory liquidity, but less dependence on the wholesale market would be clearly beneficial.
• Banks' capital structures should include a fixed amount of their debt that automatically converts to equity during periods of distress (when existing equity has been eliminated). Credit investors will be leery about this type of bond. The likely cost of borrowing for these bonds would be substantially higher because of the conversion risk. That potentially reduces profitability for banks, but it would provide another cushion for balance sheets before government funds were necessary.
• Proprietary trading assets at banks should have a significant capital charge placed
3
against them. If this drives prop trading out to the world of hedge funds, so be it. That's where it belongs.
For readers interested in more detail on this subject, we highly recommend the previously mentioned presentation by the Bank of England economists (details below).1 Its authors do a terrific job explaining why governments repeatedly bail out their banks.
Lastly on this subject, to which we attach great importance, it is painful to observe the amount of strenuous lobbying by our financial companies to maintain the status quo. How could it make sense to permit the same structural failures to compromise the system again? We conclude that readers might wish to consider contacting their elected representatives to express concern about this issue.
Performance
The following table shows the average annual total return for several periods ended on that date for the Fund and comparative indices of securities prices. The data quoted represents past performance, and an investment in the Fund may fluctuate so that an investor's shares when redeemed may be worth more or less than their original cost.
| Years Ended December 31, 2009 Average Annual Total Return | |||||||||||||||
| 1 Year | 5 Years | 10 Years | |||||||||||||
| FPA Perennial Fund, Inc. (NAV)* | 46.40 | % | 2.73 | % | 8.29 | % | |||||||||
| FPA Perennial Fund, Inc. (Net of Sales Charge)** | 38.72 | % | 1.63 | % | 7.71 | % | |||||||||
| Russell 2500 Index | 34.39 | % | 1.58 | % | 4.91 | % | |||||||||
| Lipper Mid-Cap Core Fund Average | 36.58 | % | 1.57 | % | 3.98 | % | |||||||||
* Does not reflect deduction of the sales charge which, if reflected, would reduce the performance shown.
** Reflects deduction of the maximum sales charge of 5.25% of the offering price.
For the fourth quarter Perennial gained 6%, in line with the market, and following double-digit quarterly performance in the two prior quarters. The strongest group in the portfolio was producer durables, driven by the prospect of economic recovery. Wabco rose 23%, while HNI, Actuant, Idex, and Zebra were up 10-15%. Several healthcare names, led by Lincare (+19%), were strong, as were Life Technologies and Varian Medical, each up 10-12%. In technology, Maxim and Microchip were up 10-12%. Other large gainers, harder to categorize, included CarMax (+16%), Knight Transportation (+15%), FMC (+11%), and Copart (+10%).
Not surprisingly, there were few significant losers in the quarter. Those that stand out are Helix (-22%), Charles River Labs (-9%), and ScanSource (-6%).
For the year, Perennial was up 46%. Retailers were especially strong, with CarMax (+208%), and Signet Jewelers (+185%). Also notable was oil service — FMC (+143%), Noble Corp. (+84%), and Helix (+62%). Manufacturers of integrated circuits Maxim (+78%) and Microchip (+49%) also did well. Other strong performers include Life Technologies (+124%), HNI (+74%), Wabco (+63%), and Manpower (+61%).
With 80% of the portfolio companies up 20% or more for the year, there is not much to discuss on the downside. The biggest loser was Brown & Brown (-14%). Also relatively weak were truckload carriers Heartland Express (-3%), and Knight Transportation (+20%).
The table below shows performance as of December 31, 2009, for both Perennial and the benchmark Russell 2500, as well as leading large-cap indexes. Returns for both recent and longer periods have been very strong.
| Fourth Quarter | One Year | Three Years* | Five Years* | Ten Years* | |||||||||||||||||||
| FPA Perennial (NAV) | 6.1 | % | 46.4 | % | (0.9 | )% | 2.7 | % | 8.3 | % | |||||||||||||
| Russell 2500 | 5.1 | % | 34.4 | % | (4.9 | )% | 1.6 | % | 4.9 | % | |||||||||||||
| S&P 500 | 6.0 | % | 26.5 | % | (5.6 | )% | 0.4 | % | (1.0 | )% | |||||||||||||
| Nasdaq | 7.2 | % | 45.4 | % | (1.2 | )% | 1.7 | % | (5.1 | )% | |||||||||||||
* Annualized Returns
1 "Banking On The State", Alessandri and Haldane, Nov. 2009.
http://www.bankofengland.co.uk/publications/speeches/2009/speech409.pdf
4
A Look at Very Long-Term Market Returns
The Wall Street Journal ran an interesting article in mid-December that we think is worth bringing to the attention of Perennial shareholders ("Investors Hope the 10s Beat the 00s"). The Journal provided market returns by decade since 1830 (based on a New York Stock Exchange database), illustrating that the most recent decade (2000 – 2009) tied the 1930s as the worst on record, each with annual returns of between zero and minus 1%. We would like to highlight some additional conclusions.
First, the average annual return for U.S. equities over the past 180 years has been about 9%, though with a good deal of decade-to-decade and year-to-year volatility. Interestingly, returns in the post-war period (1945-Present) were higher (at +11% annually) than in the preceding 110 years (+7%). The post-war period included the three best U.S. stock market decades on record, the 1950s, 1980s and 1990s with returns of 17-18% annually.
During more recent periods, the 1980s and 1990s, the market had only three modest down years, and rose more than 20% half the time.
Perhaps it is not surprising, if only because of the reversion to the mean, that the decade of the 2000s was difficult for most investors, with four substantial down years and only two big up years. All in all, performance for the past 10 years was very comparable to the 1930s, the decade of the Great Depression, when 10-year returns were slightly below zero.
From a fundamental standpoint, the 2000s had two major bear markets, with the tech collapse at the start of the decade, and a severe recession at the end. Even with the market recovering for much of 2009, the 10-year return is still slightly negative. From a more technical standpoint, returns for any period are heavily influenced by stock price levels at the starting point. With stocks up nearly 25 fold over 1980 – 1999, it is likely that both corporate profitability and stock price valuations were at unusually elevated levels in January 2000, with weak stock performance over an extended period a reasonable expectation for the future. Similarly, the stoc k market of the 1930s followed a very positive performance in the 1920s, the best decade up to that point.
Investment returns for the Perennial shareholder over the past fourteen years (current managers' tenure), though heavily influenced by the overall market, were nevertheless notably different. After trailing during the strong bull market of the late 1990s, Perennial outperformed by an average of 9 points a year during the most recent decade. As a result its 14-year annual average return of 11.1% compared very favorably with 6.2% for the market as a whole, using the same NYSE database cited in The Wall Street Journal article for consistency. This difference is more than it may seem. One dollar invested in Perennial fourteen years ago has grown to $4.35, while a dollar invested in the stock market is worth barely half that, or $2.30.
FPA Perennial — 14 Year Returns*
| 1996- 1999 | 2000- 2009 | 14 Years | Value of $1.00 Invested January 1996 | ||||||||||||||||
| FPA Perennial (NAV) | 18.4 | % | 8.3 | % | 11.1 | % | $ | 4.35 | |||||||||||
| NY Stock Exchange | 24.8 | % | (0.4 | )% | 6.2 | % | $ | 2.30 | |||||||||||
* Annualized Returns
Data source: Yale International Center for Finance Database of the New York Stock Exchange
Perennial Investment Philosophy
We occasionally have provided Perennial shareholders with a discussion of our investment philosophy and process. We will take this opportunity to do that again now.
We concentrate on ownership of high-quality businesses. By this we mean firms with histories of earning high returns on capital, and with modest debt levels. These companies have leading market shares and strong managers who have demonstrable track records of wise reinvestment of the businesses' cash flows.
Although company quality is our principal investment test, the valuation of investments is also an important part of the stock selection process. Our primary measure of value is the price/earnings ratio. We seek out companies undervalued relative to their long-term earnings power or to others of similar
5
quality, but we will not overpay for even the best companies. We expect that our portfolio will comprise much better than average companies selling at valuations similar to or below the market.
Minimizing risk, especially in treacherous economic or stock market environments, is an important element of our investment process. We do this by emphasizing companies with relatively unleveraged balance sheets, operating in more predictable, less volatile sectors of the economy, with business models we can understand. Our companies' leading market shares and high operating margins reduce the volatility of their earnings. Diversified portfolios and modest relative valuations, typically lower than the market, also contribute to a less risky portfolio.
We believe the most important contributor to the long-term investment performance of the companies we own is growth in earnings, not changes in valuation (price/earnings ratio). Because growth is driven by earning high returns on capital and successful reinvestment of cash flow, it is necessary to own most of our portfolio securities for an extended period in order for this process to come to fruition. Accordingly, annual portfolio turnover has been very low, averaging about 15% over the past five years.
We recognize that there can be a conflict between our very long investment time horizon and a strong value discipline in managing the portfolio. We are willing to hold portfolio securities at valuations higher than we require for an initial purchase. Naturally, if a position becomes significantly overvalued we do not hesitate to trim or eliminate the stock. Our aim is to reduce turnover with its concomitant costs and to focus manager attention on the long-term business fundamentals of the portfolio companies.
Perennial invests primarily in the common stocks of U.S. companies in a variety of industries and market segments. Our investment process is fundamental and bottom-up, evaluating each company on its own merits. We are not driven by macroeconomic analysis, though we appreciate that changes in the economic environment can be important to most companies' prospects. Our portfolio has been well diversified, with holdings in many industries. In the past this portfolio has been moderately concentrated, with 30-40 positions. Most of these companies have been small to medium market capitalization (up to $10 billion). Cash is the residual of the investment process and normally will be a small percent of fund assets.
We believe that international diversification can yield valuable benefits to Perennial shareholders by providing exposure to faster-growing economies than the U.S. and by offsetting the negative impact of a possible secular decline in the dollar. We expect that much of this exposure to foreign business activity will come from purchasing U.S.-based companies with strong worldwide franchises. However, we will also purchase foreign-domiciled companies that meet our usual investment criteria and where differences in accounting, disclosure, culture, management accessibility and trading do not put us at a competitive disadvantage.
O'Reilly Automotive Progress Report
We first purchased O'Reilly Automotive in 1997 and have owned a full position since 2000. We believe it has been managed with skill and integrity and that its shareholders, as well as customers and employees, have been well served. As a reminder to readers, O'Reilly operates retail auto-parts stores, and is headquartered in Springfield, Missouri.
In July of 2008, O'Reilly closed a major acquisition — its purchase of competitor CSK at a cost of $1 billion. As much as we are wary of acquisitions described as once-in-a-lifetime strategic opportunities, this clearly is an accurate depiction of O'Reilly Automotive's transformative purchase of CSK. The combination catapults O'Reilly from a distant third among retail auto-parts chains to a second place tie with Advance Auto, trailing only industry leader AutoZone.
One of the objectives of this discussion is to illuminate the very long-term view of the business taken by O'Reilly management. At the time the merger was completed, the country was sliding into a severe recession of uncertain depth and duration. Despite a challenging economic environment, O'Reilly had both the ability and the will to take on this major, multi-year project.
What does CSK bring to O'Reilly?
• Entry into western U.S., a region where O'Reilly had few stores, and where competitor Advance Auto is largely unrepresented.
6
• An opportunity to increase margins dramatically by transforming the haphazardly merchandised and capital-starved 1,300 stores acquired.
• Entry into the commercial hard-parts business for CSK stores, supported by a major capital investment program and a virtual rewriting of the business model.
How is the integration progressing?
• Stores — Proceeding with rebranding and resetting displays. Have largely completed remerchandising, adding higher-quality hard-parts lines and banishing non-automotive products. Have cut prices to support an everyday-low-price strategy, supplanting the promotional price approach employed previously. Committed capital, rationed by prior management, to stock stores with optimum inventories.
• Commercial program — Requires adding five large and expensive distribution centers in the West to support daily delivery to stores (previously weekly) in order to improve parts availability sufficiently to support a commercial business. First warehouse opened in Seattle in the fourth quarter. Others scheduled for 2010. Additional changes in progress include upgrading merchandise, increasing store SKUs, training store employees, and adding an outbound sales force, delivery, and credit.
Though this has been, and continues to be a very significant effort, with a major commitment of capital and other resources, we believe O'Reilly's experience, management focus, and financial strength make success highly likely. Quarterly improvements in sales and earnings support that view.
We would like to thank Greg Herr, a member of our FPA Perennial management team, for contributing the "too big to fail" discussion at the beginning of this letter's commentary.
In the past, reader feedback to shareholder letters came in written form or over the telephone. While those methods are still welcome, we are now pleased to also receive comments at the email address, Perennial@firstpacad.com.
Respectfully submitted,

Eric S. Ende
President and Portfolio Manager
January 25, 2010
The discussion of Fund investments represents the views of the Fund's managers at the time of this report and are subject to change without notice. References to individual securities are for informational purposes only and should not be construed as recommendations to purchase or sell individual securities. While the Fund's managers believe the Fund's holdings are value stocks, there can be no assurance that others will consider them as such. Further, investing in value stocks presents the risk that value stocks may fall out of favor with investors and underperform growth stocks during given periods.
The Russell 2000 Index is an unmanaged index comprised of the 2,000 smallest companies in the Russell 3000 Index. The Russell 2500 Index is an unmanaged index comprised of the 2,500 smallest companies in the Russell 3000 Index. The Russell 3000 Index measures the performance of the 3,000 largest U.S. companies based on total market capitalization. The S&P 500 Index is an index of 500 companies with large market capitalization. The Nasdaq Composite Index is a market capitalization index comprised of over 3,000 stocks.
FORWARD LOOKING STATEMENT DISCLOSURE
As fund managers, one of our responsibilities is to communicate with shareholders in an open and direct manner. Insofar as some of our opinions and comments in our letters to shareholders are based on current management expectations, they are considered "forward-looking statements" which may or may not be accurate
7
over the long term. While we believe we have a reasonable basis for our comments and we have confidence in our opinions, actual results may differ materially from those we anticipate. You can identify forward-looking statements by words such as "believe," "expect," "may," "anticipate," and other similar expressions when discussing prospects for particular portfolio holdings and/or the markets, generally. We cannot, however, assure future results and disclaim any obligation to update or alter any forward-looking statements, whether as a result of new information, future events, or otherwise. Further, information provided in this report should not be construed as a recommendation to purchase or sell any particular security.
HISTORICAL PERFORMANCE
Change in Value of a $10,000 Investment in FPA Perennial Fund, Inc. vs. Russell 2500 Index and Lipper Mid-Cap Core Fund Average for the Ten Years Ended December 31, 2009
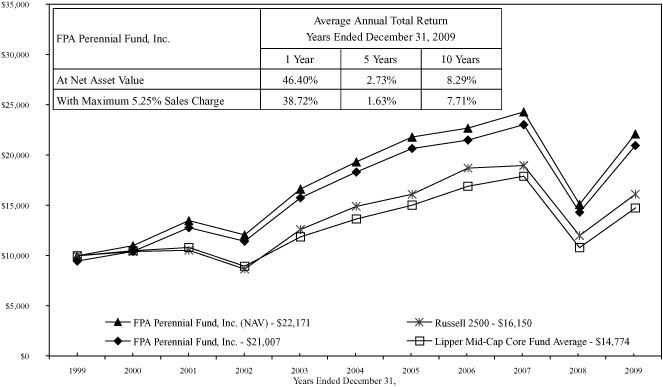
Past performance is not indicative of future performance. The Russell 2500 Index consists of the 2,500 smallest companies in the Russell 3000 total capitalization universe. This index is considered a measure of small to medium capitalization stock performance. This index does not reflect any commissions or fees which would be incurred by an investor purchasing the stocks it represents. The Lipper Mid-Cap Core Fund Average provides an additional comparison of how your Fund performed in relation to other mutual funds with similar objectives. The Lipper data does not include sales charges. The performance shown for FPA Perennial Fund, Inc., with an ending value of $21,007 reflects deduction of the current maximum sales charge of 5.25% of the offering price. In addition, since investors purchase shares of the Fund with varying sales charges depending primarily on volume purchased, the Fund's performance at net asset value (NAV) is also shown, as reflected by the ending value of $22,171. The performance of the Fund and of the Averages is computed on a total return basis which includes reinvestment of all distributions.
8
PORTFOLIO SUMMARY
December 31, 2009
(unaudited)
| Common Stocks | 95.4 | % | |||||||||
| Business Services & Supplies | 27.1 | % | |||||||||
| Producer Durable Goods | 20.0 | % | |||||||||
| Retailing | 14.3 | % | |||||||||
| Health Care | 9.7 | % | |||||||||
| Energy | 9.2 | % | |||||||||
| Transportation | 7.7 | % | |||||||||
| Technology | 5.0 | % | |||||||||
| Financial | 2.4 | % | |||||||||
| Short-Term Investments | 4.1 | % | |||||||||
| Other Assets and Liabilities, net | 0.5 | % | |||||||||
| Net Assets | 100.0 | % | |||||||||
MAJOR PORTFOLIO CHANGES
Six Months Ended December 31, 2009
(unaudited)
| Shares | |||||||
| NET PURCHASES | |||||||
| Common Stocks | |||||||
| Varian Medical Systems, Inc. | 2,100 | ||||||
| VCA Antech, Inc. | 25,600 | ||||||
| NET SALES | |||||||
| Common Stocks | |||||||
| Actuant Corporation (Class A) | 11,900 | ||||||
| Bio-Rad Laboratories, Inc. | 4,300 | ||||||
| Brady Corporation | 11,800 | ||||||
| Brown & Brown, Inc. | 15,600 | ||||||
| CarMax, Inc. | 28,800 | ||||||
| Charles River Laboratories International, Inc. | 13,600 | ||||||
| CLARCOR, Inc. | 8,300 | ||||||
| Copart, Inc. | 9,000 | ||||||
| FMC Technologies, Inc. | 6,300 | ||||||
| Franklin Electric Co., Inc. | 7,700 | ||||||
| Graco Inc. | 9,800 | ||||||
| HNI Corporation | 17,800 | ||||||
| Heartland Express, Inc. | 28,300 | ||||||
| Helix Energy Solutions Group, Inc. | 91,400 | ||||||
| IDEX Corporation | 9,000 | ||||||
| Knight Transportation, Inc. | 25,500 | ||||||
| Life Technologies Corporation | 18,900 | ||||||
| Lincare Holdings, Inc. | 12,700 | ||||||
| Manpower Inc. | 7,600 | ||||||
| Maxim Integrated Products, Inc. | 10,200 | ||||||
| Microchip Technology, Incorporated | 12,400 | ||||||
| Noble Corporation | 14,300 | ||||||
| O'Reilly Automotive, Inc. | 21,500 | ||||||
| ScanSource, Inc. | 41,300 | ||||||
| Signet Jewelers Ltd. | 47,300 | ||||||
| WABCO Holdings, Inc. | 14,800 | ||||||
| Zebra Technologies Corporation (Class A) | 12,800 | ||||||
9
PORTFOLIO OF INVESTMENTS
December 31, 2009
| COMMON STOCKS | Shares | Value | |||||||||
| BUSINESS SERVICES & SUPPLIES — 27.1% | |||||||||||
| Brady Corporation | 234,100 | $ | 7,025,341 | ||||||||
| Charles River Laboratories International, Inc.* | 272,700 | 9,187,263 | |||||||||
| CLARCOR, Inc. | 165,300 | 5,362,332 | |||||||||
| Copart, Inc.* | 178,700 | 6,545,781 | |||||||||
| Landauer, Inc. | 9,200 | 564,880 | |||||||||
| Life Technologies Corporation* | 293,700 | 15,339,951 | |||||||||
| Manpower Inc. | 160,500 | 8,760,090 | |||||||||
| ScanSource, Inc.* | 452,801 | 12,089,787 | |||||||||
| $ | 64,875,425 | ||||||||||
| PRODUCER DURABLE GOODS — 20.0% | |||||||||||
| Actuant Corporation (Class A) | 238,100 | $ | 4,411,993 | ||||||||
| Franklin Electric Co., Inc. | 152,900 | 4,446,332 | |||||||||
| Graco Inc. | 201,000 | 5,742,570 | |||||||||
| HNI Corporation | 367,900 | 10,165,077 | |||||||||
| IDEX Corporation | 191,650 | 5,969,897 | |||||||||
| WABCO Holdings, Inc. | 370,200 | 9,547,458 | |||||||||
| Zebra Technologies Corporation (Class A)* | 267,700 | 7,591,972 | |||||||||
| $ | 47,875,299 | ||||||||||
| RETAILING — 14.3% | |||||||||||
| CarMax, Inc.* | 580,700 | $ | 14,081,975 | ||||||||
| O'Reilly Automotive, Inc.* | 243,500 | 9,282,220 | |||||||||
| Signet Jewelers Ltd.* | 408,000 | 10,901,760 | |||||||||
| $ | 34,265,955 | ||||||||||
| HEALTH CARE — 9.7% | |||||||||||
| Bio-Rad Laboratories, Inc.* | 79,300 | $ | 7,649,278 | ||||||||
| Lincare Holdings Inc.* | 267,300 | 9,922,176 | |||||||||
| Varian Medical Systems, Inc.* | 28,100 | 1,316,485 | |||||||||
| VCA Antech, Inc.* | 169,400 | 4,221,448 | |||||||||
| $ | 23,109,387 | ||||||||||
| ENERGY — 9.2% | |||||||||||
| FMC Technologies, Inc.* | 119,200 | $ | 6,894,528 | ||||||||
| Helix Energy Solutions Group, Inc.* | 253,500 | 2,978,625 | |||||||||
| Noble Corporation | 298,300 | 12,140,810 | |||||||||
| $ | 22,013,963 | ||||||||||
| TRANSPORTATION — 7.7% | |||||||||||
| Heartland Express, Inc. | 558,200 | $ | 8,523,714 | ||||||||
| Knight Transportation, Inc. | 517,600 | 9,984,504 | |||||||||
| $ | 18,508,218 | ||||||||||
10
PORTFOLIO OF INVESTMENTS
December 31, 2009
| COMMON STOCKS — Continued | Shares or Principal Amount | Value | |||||||||
| TECHNOLOGY — 5.0% | |||||||||||
| Maxim Integrated Products, Inc. | 214,700 | $ | 4,358,410 | ||||||||
| Microchip Technology, Incorporated | 262,000 | 7,613,720 | |||||||||
| $ | 11,972,130 | ||||||||||
| FINANCIAL — 2.4% | |||||||||||
| Brown & Brown, Inc. | 315,200 | $ | 5,664,144 | ||||||||
| TOTAL COMMON STOCKS — 95.4% (Cost $164,415,122) | $ | 228,284,521 | |||||||||
| SHORT-TERM INVESTMENTS — 4.1% (Cost $9,744,965) | |||||||||||
| State Street Bank Repurchase Agreement — 0.005% 1/04/2010 (Collateralized by U.S. Treasury Note — 3.25% 2016) | $ | 4,745,000 | $ | 4,745,000 | |||||||
| Chevron Funding Corporation — 0.05% 01/06/2010 | 5,000,000 | 4,999,965 | |||||||||
| $ | 9,744,965 | ||||||||||
| TOTAL INVESTMENTS — 99.5% (Cost $174,160,087) | $ | 238,029,486 | |||||||||
| Other assets and liabilities, net — 0.5% | 1,314,506 | ||||||||||
| NET ASSETS — 100% | $ | 239,343,992 | |||||||||
*Non-income producing securities
See notes to financial statements.
11
STATEMENT OF ASSETS AND LIABILITIES
December 31, 2009
| ASSETS | |||||||||||
| Investments at value: | |||||||||||
| Investment securities — at market value (identified cost $164,415,122) | $ | 228,284,521 | |||||||||
| Short-term investments — at amortized cost (maturities 60 days or less) | 9,744,965 | $ | 238,029,486 | ||||||||
| Cash | 420 | ||||||||||
| Receivable for: | |||||||||||
| Investment securities sold | $ | 1,701,978 | |||||||||
| Capital stock sold | 440,204 | ||||||||||
| Dividends | 4,945 | 2,147,127 | |||||||||
| $ | 240,177,033 | ||||||||||
| LIABILITIES | |||||||||||
| Payable for: | |||||||||||
| Capital stock repurchased | $ | 634,829 | |||||||||
| Advisory fees and financial services | 152,399 | ||||||||||
| Accrued expenses | 45,813 | 833,041 | |||||||||
| NET ASSETS | $ | 239,343,992 | |||||||||
| SUMMARY OF SHAREHOLDERS' EQUITY | |||||||||||
| Capital stock — par value $0.01 per share; authorized 25,000,000 shares; 7,810,919 outstanding shares | $ | 78,109 | |||||||||
| Additional paid-in capital | 186,996,651 | ||||||||||
| Accumulated net realized loss on investments | (11,349,497 | ) | |||||||||
| Accumulated net investment loss | (250,670 | ) | |||||||||
| Unrealized appreciation of investments | 63,869,399 | ||||||||||
| NET ASSETS | $ | 239,343,992 | |||||||||
| NET ASSET VALUE, REDEMPTION PRICE AND MAXIMUM OFFERING PRICE PER SHARE | |||||||||||
| Net asset value and redemption price per share (net assets divided by shares outstanding) | $ | 30.64 | |||||||||
| Maximum offering price per share (100/94.75 of per share net asset value) | $ | 32.34 | |||||||||
See notes to financial statements.
12
STATEMENT OF OPERATIONS
December 31, 2009
| INVESTMENT INCOME | |||||||||||
| Dividends | $ | 1,947,926 | |||||||||
| Interest | 13,162 | ||||||||||
| $ | 1,961,088 | ||||||||||
| EXPENSES: | |||||||||||
| Advisory fees | $ | 1,386,176 | |||||||||
| Transfer agent fees and expenses | 362,710 | ||||||||||
| Financial services | 205,566 | ||||||||||
| Reports to shareholders | 55,843 | ||||||||||
| Registration fees | 47,413 | ||||||||||
| Legal fees | 44,848 | ||||||||||
| Audit fees | 42,175 | ||||||||||
| Custodian fees and expenses | 34,248 | ||||||||||
| Line of credit | 31,250 | ||||||||||
| Directors fees and expenses | 27,000 | ||||||||||
| Insurance | 6,826 | ||||||||||
| Other fees and expenses | 8,366 | ||||||||||
| Expenses before reimbursement from Adviser | $ | 2,252,421 | |||||||||
| Reimbursement from Adviser | (46,766 | ) | |||||||||
| Net expenses | 2,205,655 | ||||||||||
| Net investment loss | $ | (244,567 | ) | ||||||||
| NET REALIZED AND UNREALIZED GAIN ON INVESTMENTS | |||||||||||
| Net realized loss on investments: | |||||||||||
| Proceeds from sales of investment securities | $ | 28,959,888 | |||||||||
| Cost of investment securities sold | 32,346,884 | ||||||||||
| Net realized loss on investments | $ | (3,386,996 | ) | ||||||||
| Change in unrealized appreciation of investments: | |||||||||||
| Unrealized depreciation at beginning of year | $ | (17,786,516 | ) | ||||||||
| Unrealized appreciation at end of year | 63,869,399 | ||||||||||
| Change in unrealized appreciation of investments | 81,655,915 | ||||||||||
| Net realized and unrealized gain on investments | $ | 78,268,919 | |||||||||
| CHANGE IN NET ASSETS RESULTING FROM OPERATIONS | $ | 78,024,352 | |||||||||
See notes to financial statements.
13
STATEMENT OF CHANGES IN NET ASSETS
| For the Year Ended December 31, | |||||||||||||||||||
| 2009 | 2008 | ||||||||||||||||||
| CHANGES IN NET ASSETS | |||||||||||||||||||
| Operations: | |||||||||||||||||||
| Net investment income (loss) | $ | (244,567 | ) | $ | 646,526 | ||||||||||||||
| Net realized gain (loss) on investments | (3,386,996 | ) | (6,115,815 | ) | |||||||||||||||
| Change in unrealized appreciation (depreciation) of investments | 81,655,915 | (123,147,176 | ) | ||||||||||||||||
| Change in net assets resulting from operations | $ | 78,024,352 | $ | (128,616,465 | ) | ||||||||||||||
| Distributions to shareholders from: | |||||||||||||||||||
| Net investment income | $ | (16,470 | ) | $ | (636,159 | ) | |||||||||||||
| Net realized capital gains | — | (3,241,015 | ) | ||||||||||||||||
| Change in net assets resulting from distributions to shareholders | (16,470 | ) | (3,877,174 | ) | |||||||||||||||
| Capital Stock transactions: | |||||||||||||||||||
| Proceeds from Capital Stock sold | $ | 24,795,364 | $ | 31,997,877 | |||||||||||||||
| Proceeds from shares issued to shareholders upon reinvestment of dividends and distributions | 14,147 | 3,186,307 | |||||||||||||||||
| Cost of Capital Stock repurchased* | (49,987,389 | ) | (107,421,688 | ) | |||||||||||||||
| Change in net assets resulting from Capital Stock transactions | (25,177,878 | ) | (72,237,504 | ) | |||||||||||||||
| Total change in net assets | $ | 53,633,340 | $ | (204,731,143 | ) | ||||||||||||||
| NET ASSETS | |||||||||||||||||||
| Beginning of year | 186,513,988 | 391,245,131 | |||||||||||||||||
| End of year | $ | 239,343,992 | $ | 186,513,988 | |||||||||||||||
| CHANGE IN CAPITAL STOCK OUTSTANDING | |||||||||||||||||||
| Shares of Capital Stock sold | 984,673 | 1,140,407 | |||||||||||||||||
| Shares issued to shareholders upon reinvestment of dividends and distributions | 561 | 112,235 | |||||||||||||||||
| Shares of Capital Stock repurchased | (2,087,515 | ) | (3,801,067 | ) | |||||||||||||||
| Change in Capital Stock outstanding | (1,102,281 | ) | (2,548,425 | ) | |||||||||||||||
* Net of redemption fees of $11,969 and $68,196 collected for the years ended December 31, 2009 and December 31, 2008, respectively.
See notes to financial statements.
14
FINANCIAL HIGHLIGHTS
Selected Data for Each Share of Capital Stock Outstanding Throughout Each Year
| Year Ended December 31, | |||||||||||||||||||||||
| 2009 | 2008 | 2007 | 2006 | 2005 | |||||||||||||||||||
| Per share operating performance: | |||||||||||||||||||||||
| Net asset value at beginning of year | $ | 20.93 | $ | 34.14 | $ | 34.64 | $ | 34.39 | $ | 31.14 | |||||||||||||
| Income from investment operations: | |||||||||||||||||||||||
| Net investment income (loss) | $ | (0.03 | ) | $ | 0.07 | $ | 0.15 | $ | 0.26 | $ | 0.10 | ||||||||||||
| Net realized and unrealized gain (loss) on investment securities | 9.74 | (12.89 | ) | 2.26 | 1.13 | 3.89 | |||||||||||||||||
| Total from investment operations | $ | 9.71 | $ | (12.82 | ) | $ | 2.41 | $ | 1.39 | $ | 3.99 | ||||||||||||
| Less distributions: | |||||||||||||||||||||||
| Dividends from net investment income | — | * | $ | (0.07 | ) | $ | (0.16 | ) | $ | (0.25 | ) | $ | (0.10 | ) | |||||||||
| Distributions from net realized capital gains | — | (0.32 | ) | (2.75 | ) | (0.89 | ) | (0.64 | ) | ||||||||||||||
| Total distributions | — | * | $ | (0.39 | ) | $ | (2.91 | ) | $ | (1.14 | ) | $ | (0.74 | ) | |||||||||
| Redemption fees | — | * | — | * | — | * | — | * | — | * | |||||||||||||
| Net asset value at end of year | $ | 30.64 | $ | 20.93 | $ | 34.14 | $ | 34.64 | $ | 34.39 | |||||||||||||
| Total investment return** | 46.40 | % | (37.84 | )% | 7.10 | % | 4.06 | % | 12.81 | % | |||||||||||||
| Ratios/supplemental data: | |||||||||||||||||||||||
| Net assets at end of period (in $000's) | $ | 239,344 | $ | 186,514 | $ | 391,245 | $ | 554,305 | $ | 490,410 | |||||||||||||
| Ratio of expenses to average net assets: | |||||||||||||||||||||||
| Before reimbursement from Adviser | 1.09 | % | 1.02 | % | 0.96 | % | 0.91 | % | 0.90 | % | |||||||||||||
| After reimbursement from Adviser | 1.07 | % | 1.02 | % | 0.96 | % | 0.91 | % | 0.90 | % | |||||||||||||
| Ratio of net investment income (loss) to average assets: | |||||||||||||||||||||||
| Before reimbursement from Adviser | (0.14 | )% | 0.22 | % | 0.37 | % | 0.75 | % | 0.37 | % | |||||||||||||
| After reimbursement from Adviser | (0.12 | )% | 0.22 | % | 0.37 | % | 0.75 | % | 0.37 | % | |||||||||||||
| Portfolio turnover rate | 3 | % | 11 | % | 10 | % | 16 | % | 10 | % | |||||||||||||
* Rounds to less than $0.01 per share.
** Return is based on net asset value per share, adjusted for reinvestment of distributions, and does not reflect deduction of the sales charge.
See notes to financial statements.
15
NOTES TO FINANCIAL STATEMENTS
December 31, 2009
NOTE 1 — Significant Accounting Policies
FPA Perennial Fund, Inc. (the "Fund") is registered under the Investment Company Act of 1940 as a diversified, open-end, management investment company. The Fund's primary investment objective is long-term growth of capital. Current income is a secondary consideration. The following is a summary of significant accounting policies consistently followed by the Fund in the preparation of its financial statements.
A. Security Valuation
The Fund values securities pursuant to policies and procedures approved by the Board of Directors. Securities listed or traded on a national securities exchange are valued at the last sale price on the last business day of the year, or if there was not a sale that day, at the last bid price. Securities traded on the NASDAQ National Market System are valued at the NASDAQ Official Closing Price on the last business day of the year, or if there was not a sale that day, at the last bid price. Unlisted securities are valued at the most recent bid price. Short-term investments with maturities of 60 days or less are valued at amortized cost which approximates market value. Securities for which market quotations are not readily available from the sources above are valued at fair value as determined in good faith by, or under the direction of, the Board of Directors
B. Securities Transactions and Related Investment Income
Securities transactions are accounted for on the date the securities are purchased or sold. Dividend income and distributions to shareholders are recorded on the ex-dividend date. Interest income and expenses are recorded on an accrual basis.
C. Use of Estimates
The preparation of the financial statements in accordance with accounting principles generally accepted in the United States requires management to make estimates and assumptions that affect the amounts reported. Actual results could differ from those estimates.
NOTE 2 — Risk Considerations
Investing in the Fund may involve certain risks including, but not limited to, those described below.
Market Risk: Because the values of the Fund's investments will fluctuate with market conditions, so will the value of your investment in the Fund. You could lose money on your investment in the Fund or the Fund could underperform other investments.
Common Stocks and Other Securities: The prices of common stocks and other securities held by the Fund may decline in response to certain events taking place around the world, including those directly involving companies whose securities are owned by the Fund; conditions affecting the general economy; overall market changes; local, regional or global political, social or economic instability; and currency, interest rate and commodity price fluctuations. In addition, the Adviser's emphasis on a value-oriented investment approach generally results in the Fund's portfolio being invested primarily in medium or smaller sized companies. Smaller companies may be subject to a greater degree of change in earnings and business prospects than larger, more established companies. Also, securities of smaller companies are traded in lower volumes than those issued by larger companies and may be more volatile than those of larger companies. In light of these characteristics of smaller companies and their securities, the Fund may be subjected to greater risk than that assumed when investing in the equity securities of larger companies.
NOTE 3 — Purchases of Investment Securities
Cost of purchases of investment securities (excluding short-term investments with maturities of 60 days or less at the time of purchase) aggregated $5,727,159 for the year ended December 31, 2009. Realized gains or losses are based on the specific identification method.
NOTE 4 — Federal Income Tax
No provision for federal income tax is required because the Fund has elected to be taxed as a "regulated investment company" under the Internal Revenue Code and intends to maintain this qualification and to distribute each year to its shareholders, in accordance with the minimum
16
NOTES TO FINANCIAL STATEMENTS
Continued
distribution requirements of the Code, its taxable net investment income and taxable net realized gains on investments.
Distributions paid to shareholders are based on net investment income and net realized gains determined on a tax reporting basis, which may differ from financial reporting. In addition, the Fund may designate a portion of the amount paid to redeeming shareholders as a distribution for tax purposes. The Fund had no distributable earnings at December 31, 2009.
The tax status of distributions paid during the last two fiscal years ended December 31 were as follows:
| 2009 | 2008 | ||||||||||
| Dividends from ordinary income | $ | 16,470 | $ | 1,236,125 | |||||||
| Distributions from long-term capital gains | — | $ | 3,444,385 | ||||||||
The cost of investment securities held at December 31, 2009, for federal income tax purposes was $167,116,926. Gross unrealized appreciation and depreciation for all investments at December 31, 2009 for federal income tax purposes was $66,997,198 and $5,829,603, respectively, resulting in net unrealized appreciation of $61,167,595. As of and during the year ended December 31, 2009, the Fund did not have any liability for unrecognized tax benefits. The Fund recognizes interest and penalties, if any, related to unrecognized tax benefits as income tax expense in the Statement of Operations. During the year, the Fund did not incur any interest or penalties. The Fund is not subject to examination by U.S. federal tax authorities for years ended on or before December 31, 2005 or by state tax authorities for years ended on or before December 31, 2004.
NOTE 5 — Advisory Fees and Other Affiliated Transactions
Pursuant to an Investment Advisory Agreement, advisory fees were paid by the Fund to First Pacific Advisors, LLC (the "Adviser"). Under the terms of this Agreement, the Fund pays the Adviser a monthly fee calculated at the annual rate of 0.75% of the first $50 million of the Fund's average daily net assets and 0.65% of the average daily net assets in excess of $50 million. In addition, the Fund pays the Adviser an amount equal to 0.10% of the average daily net assets for each fiscal year in reimbursement for the provision of financial services to the Fund. The Agreement obligates the Adviser to reduce its fee to the extent necessary to reimburse the Fund for any annual expenses (exclusive of interest, taxes, the cost of any supplemental statistical and research information, and extraordinary expenses such as litigation) in excess of 11/2% of the first $30 million and 1% of the remaining average net assets of the Fund for the year.
For the year ended December 31, 2009, the Fund paid aggregate fees of $27,000 to all Directors who are not affiliated persons of the Adviser. Certain officers of the Fund are also officers of the Adviser and FPA Fund Distributors, Inc.
NOTE 6 — Redemption Fee
A redemption fee of 2% applies to redemptions within 90 days of purchase for certain purchases made by persons eligible to purchase shares without an initial sales charge. For the year ended December 31, 2009, the Fund collected $11,969 in redemption fees. The impact of these fees is less than $0.01 per share.
NOTE 7 — Distributor
For the year ended December 31, 2009, FPA Fund Distributors, Inc. ("Distributor"), wholly owned subsidiary of the Adviser, received $14,915 in net Fund share sales commissions after reallowance to other dealers. The Distributor pays its own overhead and general administrative expenses, the cost of supplemental sales literature, promotion and advertising.
NOTE 8 — Disclosure of Fair Value Measurements
The Fund classifies its assets based on three valuation methodologies. Level 1 investment securities are valued based on quoted market prices in active markets for identical assets. Level 2 investment securities are valued based on significant observable market inputs, such as quoted prices for similar assets and quoted prices in inactive markets or other market observable inputs. Level 3 investment securities are
17
NOTES TO FINANCIAL STATEMENTS
Continued
valued using significant unobservable inputs that reflect the Fund's determination of assumptions that market participants might reasonably use in valuing the assets. The valuation levels are not necessarily an indication of the risk associated with investing in those securities. The following table presents the valuation levels of the Fund's investments as of December 31, 2009:
| Level 1 — Quoted prices | $ | 228,284,521 | * | ||||
| Level 2 — Other significant observable inputs | 9,744,965 | ** | |||||
| Level 3 — Significant unobservable inputs | — | ||||||
| Total investments | $ | 238,029,486 | |||||
* All common stocks are classified under Level 1. The Portfolio of Investments provides further information on major security types.
** Comprised solely of short-term investments with maturities of 60 days or less that are valued at amortized cost.
NOTE 9 — Line of Credit
On February 27, 2009, the Fund, along with FPA Paramount Fund, Inc., collectively entered into an agreement that enables them to participate in a $50 million unsecured line of credit with State Street Bank and Trust. The line of credit is renewable annually. Borrowings will be made solely to temporarily finance the repurchase of Capital Stock. Interest is charged to each Fund based on its borrowings at a rate per annum equal to the higher of the Federal Funds Rate or the Overnight LIBOR Rate plus 0.625%. In addition, the Fund and FPA Paramount Fund, Inc. pay a commitment fee of 0.125% per annum on any unused portion of the line of credit. During the period ended December 31, 2009, the Fund had no borrowings under the agreement.
Note 10 — Subsequent Events
As of February 5, 2010, the date the financial statements were available to be issued, no subsequent events or transactions had occurred that would have materially impacted the financial statements as presented.
18
REPORT OF INDEPENDENT REGISTERED
PUBLIC ACCOUNTING FIRM
TO THE SHAREHOLDERS AND
BOARD OF DIRECTORS OF FPA PERENNIAL FUND, INC.
We have audited the accompanying statement of assets and liabilities of FPA Perennial Fund, Inc. (the "Fund"), including the portfolio of investments, as of December 31, 2009, the related statement of operations for the year then ended, the statements of changes in net assets for each of the two years in the period then ended, and the financial highlights for each of the five years in the period then ended. These financial statements and financial highlights are the responsibility of the Fund's management. Our responsibility is to express an opinion on these financial statements and financial highlights based on our audits.
We conducted our audits in accordance with standards of the Public Company Accounting Oversight Board (United States). Those standards require that we plan and perform the audit to obtain reasonable assurance about whether the financial statements and financial highlights are free of material misstatement. The Fund is not required to have, nor were we engaged to perform, an audit of its internal control over financial reporting. Our audits included consideration of internal control over financial reporting as a basis for designing audit procedures that are appropriate in the circumstances, but not for the purpose of expressing an opinion on the effectiveness of the Fund's internal control over financial reporting. Accordingly, we express no such opinion. An audit also includes examining, on a test basis, evidence supporting the amounts and disclosures in the financial statements, assessing the accounting principles used and significant estim ates made by management, as well as evaluating the overall financial statement presentation. Our procedures included confirmation of securities owned as of December 31, 2009, by correspondence with the custodian and brokers. We believe that our audits provide a reasonable basis for our opinion.
In our opinion, the 2009 financial statements and financial highlights referred to above present fairly, in all material respects, the financial position of FPA Perennial Fund, Inc. as of December 31, 2009, the results of its operations for the year then ended, the changes in its net assets for each of the two years in the period then ended, and the financial highlights for each of the five years in the period then ended in conformity with accounting principles generally accepted in the United States of America.

Los Angeles, California
February 5, 2010
RENEWAL OF INVESTMENT ADVISORY AGREEMENT
The following paragraphs summarize the material information and factors considered by the Board of Directors at a meeting held August 3, 2009 as well as their conclusions relative to such factors.
Nature, Extent and Quality of Services. The Board considered information regarding the Adviser and its staffing in connection with the Fund, including the Fund's portfolio managers, the addition of a senior analyst to their team, the scope of accounting, administrative, shareholder and other services supervised and provided by the Adviser, and the absence of any significant service problems reported to the Board. The Board noted the experience, length of service and the outstanding reputation of the Fund's Portfolio managers, Eric Ende and Steven Geist, who have managed the Fund since 1995. The Directors concluded that the nature, extent and quality of services provided by the Adviser have benefited and should continue to benefit the Fund and its shareholders.
Investment Performance. The Directors reviewed the overall investment performance of the Fund. They
19
RENEWAL OF INVESTMENT ADVISORY AGREEMENT
Continued
also received information from an independent consultant, Lipper Analytical Services, Inc. ("Lipper"), regarding the Fund's performance relative to a peer group of mid-cap core funds selected by Lipper (the "Peer Group"). The Directors noted the Fund's competitive longer-term investment performance of the Fund when compared to the Peer Group. They further concluded that the Adviser's continued management of the Fund should benefit the Fund and its shareholders.
Advisory Fees and Fund Expenses; Adviser Profitability; Economies of Scale and Sharing of Economies of Scale. The Directors were provided information by the Adviser to enable consideration of the Fund's advisory fees and total expense levels, as well as the overall profitability of the Adviser, the benefits to the Adviser from its relationship to the Fund, the extent to which economies of scale with respect to the management of the Fund, if any, would be realized, and whether the Fund is sharing, or will share, in those economies.
The Directors reviewed comparative information relative to fees and expenses for the mutual fund industry generally and for the Peer Group. The Directors noted that the Fund's fees and expenses were at the lower end of the range for the Peer Group. The Directors noted that the overall expense ratio of the Fund was also at the lower end of the range when compared to the Peer Group. The Directors noted that the fee rate charged to the Fund is currently lower than the fee rate charged by the Adviser on the other products managed in a similar style by the portfolio manager. The Directors concluded that the overall fee rate was reasonable and fair to the Fund and its shareholders in light of the nature and quality of the services provided by the Adviser.
The Directors considered whether there have been economies of scale with respect to the management of the Fund, whether the Fund has appropriately benefited from any economies of scale, and whether the fee rate is reasonable in relation to the Fund's assets and any economies of scale that may exist. The Directors discussed the fact that the fee structure does not have any additional breakpoints. The mutual fund industry has trended toward funds having breakpoints in the advisory fee structure as a means by which to share in economies of scale as a fund's assets grow; however, not all funds have breakpoints in their fee structures. The Adviser indicated its belief that additional breakpoints currently were not appropriate for the Fund and that no meaningful income and expense forecasts for its business could be prepared given uncertainties regarding the direction of the economy, rising inflation, increasing costs for personnel and systems, an d growth (or not) in the Fund's assets, all of which could negatively impact the Adviser. The Directors noted that the Adviser had not increased the fee rate charged to the Fund despite the Adviser's claims of increases in the Adviser's internal costs of providing investment management services to the Fund, in part due to administrative burdens and expenses resulting from recent legislative and regulatory actions such as Sarbanes-Oxley. According to the Adviser, such increased costs have included a significant investment in a new analyst who assists with the management of the Fund, additions to administrative personnel and systems that enhance the quality of services provided to the Fund and the establishment of a full-time Chief Compliance Officer and his assistant. The Directors also noted that asset levels of the Fund are currently lower than they were three years ago, yet the Adviser has continued to make investments in personnel servicing the Fund.
Conclusions. The Directors determined that the Fund continues to benefit from the services of a highly experienced portfolio management team that has produced competitive long-term returns. In addition, the Directors agreed that the Fund continues to receive high quality accounting, administrative, shareholder and other ancillary services from the Adviser. The Directors acknowledged that there is no uniform industry methodology to measure or apply economies of scale. The Directors determined that the Fund's expense ratio, the overall profitability of the Adviser, and the sharing of economies of scale with the Fund are fair and reasonable under the current circumstances. In reaching their conclusions, the Directors acknowledged that the fees and expenses of the Fund are clearly disclosed in the Fund's prospectus, in all reports to Fund shareholders and in industry research databases such as those maintained by Lipper and Morningstar, and that the Fund's shareholders have ready access to other funds with different strategies, fees and expenses and can redeem at any time if they feel the Adviser's services do not provide adequate value for the fees and expenses charged. The Directors also stated their intention to continue monitoring the factors relevant to the Adviser's compensation, such as changes in the Fund's asset levels, changes in portfolio management personnel and the cost and quality of the services provided by the Adviser to the Fund. On the basis of the foregoing, and without assigning particular weight to any single factor, the Directors determined to approve the continuation of the current advisory agreement for another one-year period ending September 30, 2010.
20
SHAREHOLDER EXPENSE EXAMPLE
December 31, 2009 (unaudited)
Fund Expenses
As a shareholder of the Fund, you incur two types of costs: (1) transaction costs, and (2) ongoing costs, including advisory and administrative fees; shareholder service fees; and other Fund expenses. The Example is intended to help you understand your ongoing costs (in dollars) of investing in the Fund and to compare these costs with the ongoing costs of investing in other mutual funds. The Example is based on an investment of $1,000 invested at the beginning of the year and held for the entire year.
Actual Expenses
The information in the table under the heading "Actual Performance" provides information about actual account values and actual expenses. You may use the information in this column, together with the amount you invested, to estimate the expenses that you paid over the period. Simply divide your account value by $1,000 (for example, an $8,600 account value divided by $1,000= 8.6), then multiply the result by the number in the first column in the row entitled "Expenses Paid During Period" to estimate the expenses you paid on your account during this period.
Hypothetical Example for Comparison Purposes
The information in the table under the heading "Hypothetical Performance (5% return before expenses)" provides information about hypothetical account values and hypothetical expenses based on the Fund's actual expense ratio and an assumed rate of return of 5% per year before expenses, which is not the Fund's actual return. The hypothetical account values and expenses may not be used to estimate the actual ending account balance or expenses you paid for the period. You may use this information to compare the ongoing costs of investing in the Fund and other funds. To do so, compare this 5% hypothetical example with the 5% hypothetical examples that appear in the shareholder reports of other funds.
Please note that the expenses shown in the table are meant to highlight your ongoing costs only and do not reflect any transactional costs. Therefore, the information under the heading "Hypothetical Performance (5% return before expenses)" is useful in comparing ongoing costs only, and will not help you determine the relative total costs of owning different funds. In addition, if these transactional costs were included, your costs would have been higher.
| Actual Performance | Hypothetical Performance (5% return before expenses) | ||||||||||
| Beginning Account Value June 30, 2009 | $ | 1,000.00 | $ | 1,000.00 | |||||||
| Ending Account Value December 31, 2009 | $ | 1,224.23 | $ | 1,019.59 | |||||||
| Expenses Paid During Period* | $ | 5.94 | $ | 5.41 | |||||||
* Expenses are equal to the Fund's annualized expense ratio of 1.06%, multiplied by the average account value over the period and prorated for the six-months ended December 31, 2009 (184/365 days).
21
DIRECTOR AND OFFICER INFORMATION
| Name & Address | Position(s) With Company | Principal Occupation(s) During the Past 5 Years | Portfolios in Fund Complex Overseen | Other Directorships | |||||||||||||||
| Willard H. Altman, Jr. – (74)* | Director & Chairman† Years Served: 11 | Retired. Formerly, until 1995, Partner of Ernst & Young LLP, a public accounting firm. | 6 | ||||||||||||||||
| Thomas P. Merrick – (72)* | Director† Years Served: 1 | Private consultant. President of Strategic Planning Consultants for more than the past five years. Former Executive Committee member and Vice President of Fluor Corporation, responsible for strategic planning, from 1984 to 1998. | 6 | ||||||||||||||||
| Lawrence J. Sheehan – (77)* | Director† Years Served: 19 | Retired. Formerly Partner (1969 to 1994) and of counsel employee (1994 to 2002) of the law firm of O'Melveny & Myers LLP. | 6 | ||||||||||||||||
| Eric S. Ende – (65) | Director†, President & Portfolio Manager Years Served: 26 | Partner of the Adviser since 2006. Formerly Senior Vice President of First Pacific Advisors, Inc. from 1984 to 2006. | 3 | ||||||||||||||||
| Steven R. Geist – (56) | Executive Vice President & Portfolio Manager Years Served: 14 | Partner of the Adviser since 2006. Formerly Vice President of First Pacific Advisors, Inc. from 1992 to 2006. | |||||||||||||||||
| J. Richard Atwood – (49) | Treasurer Years Served: 13 | Chief Operating Officer of the Adviser. President of FPA Fund Distributors, Inc. | FPA Fund Distributors, Inc. | ||||||||||||||||
| Sherry Sasaki – (55) | Secretary Years Served: 27 | Assistant Vice President and Secretary of the Adviser and Secretary of FPA Fund Distributors, Inc. | |||||||||||||||||
| Christopher H. Thomas – (52) | Chief Compliance Officer Years Served: 15 | Vice President and Chief Compliance Officer of the Adviser. Vice President of FPA Fund Distributors, Inc. | FPA Fund Distributors, Inc. | ||||||||||||||||
| E. Lake Setzler – (42) | Assistant Treasurer Years Served: 4 | Vice President and Controller of the Adviser since 2005. Formerly Chief Operating Officer of Inflective Asset Management, LLC (2004-2005) and Vice President of Transamerica Investment Management, LLC (2000-2004). | |||||||||||||||||
† Directors serve until their resignation, removal or retirement.
* Audit Commitee Member
Additional information on the Directors is available in the Statement of Additional Information. Each of the above listed individuals can be contacted at 11400 W. Olympic Blvd., Suite 1200, Los Angeles, CA, 90064.
22
FPA PERENNIAL FUND, INC.
INVESTMENT ADVISER
First Pacific Advisors, LLC
11400 West Olympic Boulevard, Suite 1200
Los Angeles, CA 90064
SHAREHOLDER SERVICE AGENT
Boston Financial Data Services, Inc.
P.O. Box 8115
Boston, Massachusetts 02266-8115
30 Dan Road
Canton, MA 02021-2809
(800) 638-3060
(617) 483-5000
CUSTODIAN & TRANSFER AGENT
State Street Bank and Trust Company
Boston, Massachusetts
TICKER SYMBOL: FPPFX
CUSIP: 302548102
DISTRIBUTOR
FPA Fund Distributors, Inc.
11400 West Olympic Boulevard, Suite 1200
Los Angeles, California 90064
LEGAL COUNSEL
O'Melveny & Myers LLP
Los Angeles, California
INDEPENDENT REGISTERED PUBLIC
ACCOUNTING FIRM
Deloitte & Touche LLP
Los Angeles, California
This report has been prepared for the information of shareholders of FPA Perennial Fund, Inc., and is not authorized for distribution to prospective investors unless preceded or accompanied by an effective prospectus.
The Fund's complete proxy voting record for the 12 months ended June 30, 2009 is available without charge, upon request, by calling (800) 982-4372 and on the SEC's website at www.sec.gov.
The Fund's schedule of portfolio holdings, filed the first and third quarter on Form N-Q with the SEC, is available on the SEC's website at www.sec.gov. Form N-Q is available at the SEC's Public Reference Room in Washington, D.C., and information on the operations of the Public Reference Room may be obtained by calling 1-202-942-8090. To obtain information on Form N-Q from the Fund, shareholders can call 1-800-982-4372.
Additional information about the Fund is available online at www.fpafunds.com. This information includes, among other things, holdings, top sectors and performance, and is updated on or about the 15th business day after the end of the quarter.
Item 2. Code of Ethics.
(a) The registrant has adopted a code of ethics that applies to the registrant’s principal executive and financial officers.
(b) Not Applicable
(c) During the period covered by this report, there were not any amendments to the provisions of the code of ethics adopted in 2(a) above.
(d) During the period covered by this report, there were not any implicit or explicit waivers to the provisions of the code of ethics adopted in 2(a).
(e) Not Applicable
(f) A copy of the registrant’s code of ethics is filed as an exhibit to this Form N-CSR. Upon request, any person may obtain a copy of this code of ethics, without charge, by calling (800) 982-4372.
Item 3. Audit Committee Financial Expert.
The registrant’s board of directors has determined that Willard H. Altman, Jr., a member of the registrant’s audit committee and board of directors, is an “audit committee financial expert” and is “independent,” as those terms are defined in this Item. This designation will not increase the designee’s duties, obligations or liability as compared to his duties, obligations and liability as a member of the audit committee and of the board of directors. This designation does not affect the duties, obligations or liability of any other member of the audit committee or the board of directors.
Item 4. Principal Accountant Fees and Services.
|
|
|
| 2008 |
| 2009 |
|
| ||
(a) |
| Audit Fees |
| $ | 35,300 |
| $ | 36,700 |
|
|
(b) |
| Audit Related Fees |
| -0- |
| -0- |
|
| ||
(c) |
| Tax Fees |
| $ | 6,875 |
| $ | 7,150 |
|
|
(d) |
| All Other Fees |
| -0- |
| -0- |
|
| ||
|
| |||||||||
(e)(1) | Disclose the audit committee’s pre-approval policies and procedures described in paragraph (c)(7) of Rule 2-01 of Regulation S-X. The audit committee shall pre-approve all audit and permissible non-audit services that the committee considers compatible with maintaining the independent auditors’ independence. The pre-approval requirement will extend to all non-audit services provided to the registrant, the adviser, and any entity controlling, controlled by, or under common control with the adviser that provides ongoing services to the registrant, if the engagement relates directly to the operations and financial | |||||||||
reporting of the registrant; provided, however, that an engagement of the registrant’s independent auditors to perform attest services for the registrant, the adviser or its affiliates required by generally accepted auditing standards to complete the examination of the registrant’s financial statements (such as an examination conducted in accordance with Statement on Auditing Standards Number 70 issued by the American Institute of Certified Public Accountants), will be deem pre-approved if: (i) the registrant’s independent auditors inform the audit committee of the engagement, (ii) the registrant’s independent auditors advise the audit committee at least annually that the performance of this engagement will not impair the independent auditor’s independence with respect to the registrant, and (iii) the audit committee receives a copy of the independent auditor’s report prepared in connection with such services. The committee may delegate to one or more committee members the authority to review and pre-approve audit and permissible non-audit services. Actions taken under any such delegation will be reported to the full committee at its next meeting.
(e)(2) Disclose the percentage of services described in each of paragraphs (b) — (d) of this Item that were approved by the audit committee pursuant to paragraph (c)(7)(i)(C) of Rule 2-01 of Regulation S-X. 100% of the services provided to the registrant described in paragraphs (b) — (d) of this Item were pre-approved by the audit committee pursuant to paragraph (e)(1) of this Item. There were no services provided to the investment adviser or any entity controlling, controlled by or under common control with the adviser described in paragraphs (b) — (d) of this Item that were required to be pre-approved by the audit committee.
(f) If greater than 50%, disclose the percentage of hours expended on the principal accountant’s engagement to audit the registrant’s financial statements for the most recent fiscal year that were attributed to work performed by persons other than the principal accountant’s full-time, permanent employees. All services performed on the engagement to audit the registrant’s financial statements for the most recent fiscal year end were performed by the principal accountant’s full-time, permanent employees.
(g) Disclose the aggregate non-audit fees billed by the registrant’s accountant for services rendered to the registrant, and rendered to the registrant’s investment adviser (not including any sub-adviser whose role is primarily portfolio management and is subcontracted with or overseen by another investment adviser), and any entity controlling, controlled by, or under common control with the adviser that provides ongoing services to the registrant for each of the last two fiscal years of the registrant. None.
(h) Disclose whether the registrant’s audit committee of the board of directors has considered whether the provision of non-audit services that were rendered to the registrant’s investment adviser (not including any sub-adviser whose role is primarily portfolio management and is subcontracted with or overseen by another investment adviser), and any entity controlling, controlled by, or under common control with the investment adviser that provides ongoing services to the registrant that were not pre-approved pursuant to paragraph (c)(7)(ii) of Rule 2-01 of Regulation S-X is compatible with maintaining the principal accountant’s independence. Not Applicable.
Item 5. Audit Committee of Listed Registrants. Not Applicable.
Item 6. Schedule of Investments. The schedule of investments is included as part of the report to stockholders filed under Item 1 of this Form.
Item 7. Disclosure of Proxy Voting Policies and Procedures for Closed-End Management Investment Companies. Not Applicable.
Item 8. Portfolio Managers of Closed-End Management Investment Companies. Not Applicable.
Item 9. Purchases of Equity Securities by Closed-End Management Investment Company and Affiliated Purchasers. Not Applicable.
Item 10. Submission of Matters to a Vote of Security Holders. There has been no material change to the procedures by which shareholders may recommend nominees to the registrant’s board of directors.
Item 11. Controls and Procedures.
(a) The principal executive officer and principal financial officer of the registrant have concluded that the registrant’s disclosure controls and procedures (as defined in Rule 30a-3(c) under the Investment Company Act of 1940) are effective based on their evaluation of the disclosure controls and procedures as of a date within 90 days of the filing date of this report.
(b) There have been no significant changes in the registrant’s internal controls over financial reporting (as defined in Rule 30a-3(d) under the Investment Company Act of 1940) that occurred during the second fiscal quarter of the period covered by this report that have materially affected, or is reasonably likely to materially affect, the registrant’s internal controls over financial reporting.
Item 12. Exhibits.
(a)(1) Code of ethics as applies to the registrant’s officers and directors, as required to be disclosed under Item 2 of Form N-CSR. Attached hereto as Ex.99.CODE.ETH.
(a)(2) Separate certification for the registrant’s principal executive officer and principal financial officer, as required by Rule 30a-2(a) under the Investment Company Act of 1940. Attached hereto.
(a)(3) Not Applicable
(b) Separate certification for the registrant’s principal executive officer and principal financial officer, as required by Rule 30a-2(b) under the Investment Company Act of 1940. Attached hereto.
SIGNATURES
Pursuant to the requirements of the Securities Exchange Act of 1934 and the Investment Company Act of 1940, the registrant has duly caused this report to be signed on its behalf by the undersigned, thereunto duly authorized.
FPA PERENNIAL FUND, INC. |
| |
|
|
|
|
|
|
By: | /s/ ERIC S. ENDE |
|
Eric S. Ende, President |
| |
(Principal Executive Officer) |
| |
|
| |
Date: February 19, 2010 |
| |
Pursuant to the requirements of the Securities Exchange Act of 1934 and the Investment Company Act of 1940, this report has been signed below by the following persons on behalf of the registrant and in the capacities and on the dates indicated.
FPA PERENNIAL FUND, INC. |
| |
|
|
|
|
|
|
By: | /s/ ERIC S. ENDE |
|
Eric S. Ende, President |
| |
(Principal Executive Officer) |
| |
|
| |
Date: February 19, 2010 |
| |
|
|
|
|
|
|
By: | /s/ J. RICHARD ATWOOD |
|
J. Richard Atwood, Treasurer |
| |
(Principal Financial Officer) |
| |
|
| |
Date: February 19, 2010 |
| |