Item 1. Report to Stockholders:
-------------------------------------------
The following is a copy of the report transmitted to stockholders pursuant
to Rule 30e-1 under the Investment Company Act of 1940:

What makes Putnam different?

In 1830, Massachusetts Supreme Judicial Court Justice Samuel Putnam established The Prudent Man Rule, a legal foundation for responsible money management.
THE PRUDENT MAN RULE
All that can be required of a trustee to invest is that he shall conduct himself faithfully and exercise a sound discretion. He is to observe how men of prudence, discretion, and intelligence manage their own affairs, not in regard to speculation, but in regard to the permanent disposition of their funds, considering the probable income, as well as the probable safety of the capital to be invested.

A time-honored tradition in money management
Since 1937, our values have been rooted in a profound sense of responsibility for the money entrusted to us.
A prudent approach to investing
We use a research-driven team approach to seek consistent, dependable, superior investment results over time, although there is no guarantee a fund will meet its objectives.
Funds for every investment goal
We offer a broad range of mutual funds and other financial products so investors and their advisors can build diversified portfolios.
A commitment to doing what’s right for investors
We have below-average expenses and stringent investor protections, and provide a wealth of information about the Putnam funds.
Industry-leading service
We help investors, along with their financial advisors, make informed investment decisions with confidence.
| Putnam | |
| |
| U.S. Government | |
| |
| Income Trust | |
| |
| |
| 9 | 30 | 05 | |
| Annual Report | |
| |
| Message from the Trustees | 2 |
| About the fund | 4 |
| Report from the fund managers | 7 |
| Performance | 12 |
| Expenses | 15 |
| Portfolio turnover | 17 |
| Risk | 18 |
| Your fund’s management | 19 |
| Terms and definitions | 22 |
| Trustee approval of management contract | 24 |
| Other information for shareholders | 29 |
| Financial statements | 30 |
| Federal tax information | 58 |
| About the Trustees | 59 |
| Officers | 65 |
Cover photograph: © Richard H. Johnson
Message from the Trustees
|
Dear Fellow Shareholder
During the period ended September 30, 2005, domestic stock and bond markets advanced modestly while major markets outside the United States showed far greater strength. The Federal Reserve Board’s program of interest-rate increases and higher energy prices put pressure on U.S. consumer spending, and the impact of an unusually active hurricane season on the U.S. economy introduced a new cause of concern for financial markets. We believe that amid the uncertainties of this economic and market environment, the professional research, diversification, and active management that mutual funds provide continue to make them an intelligent choice for investors.
We also want you to know that Putnam Investments’ management team, under the leadership of Chief Executive Officer Ed Haldeman, continues to focus on investment performance and remains committed to putting the interests of shareholders first. In keeping with these goals, we have redesigned and expanded our shareholder reports to make it easier for you to learn more about your fund. Furthermore, on page 24 we provide information about the 2005 approval by the Trustees of your fund’s management contract with Putnam.
We would also like to take this opportunity to announce the retirement of one of your fund’s Trustees, Ronald J. Jackson, who has been an independent Trustee of the Putnam funds since 1996. We thank him for his service.
2
In the following pages, members of your fund’s management team discuss the fund’s performance and strategies, and their outlook for the months ahead. As always, we thank you for your support of the Putnam funds.
Putnam U.S. Government Income Trust: seeking opportunities through mortgage-backed securities

Homeownership is the most common way to invest in the real estate market, but it is not the only way. It is also possible for individuals to invest in the mortgages used to finance homes and businesses through instruments called mortgage-backed securities (MBSs).
Since 1984, Putnam U.S. Government Income Trust has invested in MBSs with the goal of maximizing income from some of the highest-quality bonds. However, investing in MBSs carries certain risks compared with the safest U.S. Treasury bonds. As a result, your fund’s team of experienced analysts uses proprietary models to seek out investment opportunities, while striving to maintain an appropriate amount of risk for the fund.
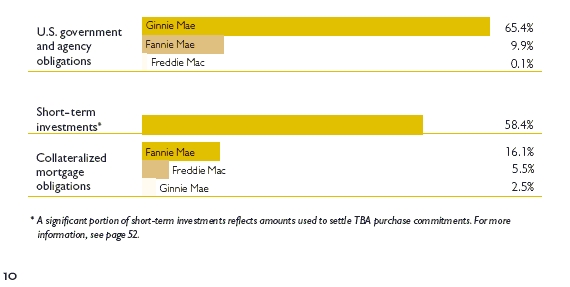
MBSs are essentially securities that represent a stake in the principal from and interest paid on a collection of mortgages. Most MBSs are created when government agencies, including Fannie Mae, Ginnie Mae, and Freddie Mac, buy mortgages from financial institutions, such as banks or credit unions, and package them together by the thousands. These pools of mortgages act as collateral for the MBSs that government agencies sell to different investors, including Putnam U.S. Government Income Trust, which currently holds a significant percentage of its assets in MBSs.
With the exception of Ginnie Mae securities, MBSs are not guaranteed directly by the U.S. government. Therefore, they carry a higher degree of risk than investments like Treasury bonds, while offering the potential for higher returns. These non-Ginnie Mae securities are backed by a pool of borrowers and are typically
Mortgage-backed securities have historically delivered solid returns, with fewer ups and downs than stocks along the way.
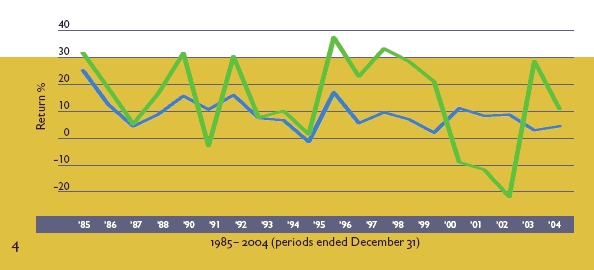
guaranteed by the agencies that offer them. By seeking opportunities among MBSs, your fund’s management team seeks higher returns than Treasuries can typically offer, but with less volatility than stocks.
Mutual funds that invest in government securities are not guaranteed. Mortgage-backed securities are subject to prepayment risk. Mutual funds that invest in bonds are subject to certain risks, including interest-rate risk, credit risk, and inflation risk. As interest rates rise, the prices of bonds fall. Long-term bonds are more exposed to interest-rate risk than short-term bonds. Unlike bonds, bond funds have ongoing fees and expenses.

The ABCs of MBSs
MBSs (Mortgage-backed securities): MBSs are pools of mortgages used as collateral for issuing a security. These securities represent claims on the principal and interest payments made by the borrowers whose loans are in the pool.
Fannie Mae (Federal National Mortgage Association): Fannie Mae is a public company established by the U.S. government in 1938 to help make mortgage funds available to buyers. Fannie Mae does business with primary mortgage lenders (savings and loans, commercial banks, credit unions, and housing finance agencies).
Freddie Mac (Federal Home Loan Mortgage Corporation): Freddie Mac is another public company chartered by Congress to increase the funds available to mortgage financiers. Freddie Mac buys mortgages from primary lenders and develops MBSs that offer a guarantee on the payment of principal and interest.
Ginnie Mae (Government National Mortgage Association): Ginnie Mae is a government-owned corporation established in 1968 whose mortgage securities are backed by the full faith and credit of the U.S. government.
Data is historical. Past performance is not a guarantee of future results.
Indexes are unmanaged and are not available for direct investment. Standard & Poor’s 500 Index is an unmanaged index of common stock performance. The Lehman GNMA Index is an unmanaged index of Government National Mortgage Association bonds.
5
Putnam U.S. Government Income Trust seeks as high a level of
current income as we believe is consistent with preservation of capital. The fund attempts to achieve its objective primarily by investing in obligations of the U.S. government and its agencies and instrumentalities, such as Government National Mortgage Association certificates (Ginnie Maes), Federal National Mortgage Association certificates (Fannie Maes), Federal Home Loan Mortgage Corporation certificates (Freddie Macs), and U.S. Treasury securities. Ginnie Maes, Fannie Maes, and Freddie Macs are generally high quality and typically provide higher yields than Treasury securities of similar maturities. The fund is designed primarily for investors seeking income, but it can also lower volatility in a well-diversified portfolio.
Highlights
* For the 12 months ended September 30, 2005, Putnam U.S. Government Income Trust’s class A shares returned 2.43% without sales charges.
* The fund’s benchmark, the Lehman GNMA Index, returned 3.38% .
* The average return for the fund’s Lipper category, GNMA Funds, was 2.29% .
* Additional fund performance, comparative performance, and Lipper data can be found in the performance section beginning on page 12.
| Performance | | | | |
| Total return for class A shares for periods ended 9/30/05 | | |
| |
| Since the fund's inception (2/8/84), average annual return is 7.33% at NAV and 7.10% at POP. | |
|
| | Average annual return Cumulative return |
| | NAV | POP | NAV | POP |
| 10 years | 5.44% | 4.96% | 69.87% | 62.23% |
|
| 5 years | 4.93 | 3.97 | 27.22 | 21.51 |
|
| 1 year | 2.43 | –2.15 | 2.43 | –2.15 |
|
Data is historical. Past performance does not guarantee future results. More recent returns may be less or more than those shown. Investment return and principal value will fluctuate, and you may have a gain or a loss when you sell your shares. Performance assumes reinvestment of distributions and does not account for taxes. Returns at NAV do not reflect a sales charge of 4.50% . For the most recent month-end performance, visit www.putnam.com. A short-term trading fee of up to 2% may apply.
6
Report from the fund managers
The year in review
For the annual period, the fund posted a modest gain, based on results at net asset value (NAV, or without sales charges). The fund’s return lagged that of its benchmark index, the Lehman GNMA Index, because the index had greater exposure to sectors of the market that were subject to the greatest demand and delivered the strongest performance. The fund slightly outperformed the average for its peer group, the Lipper GNMA Funds category. We believe this reflects the fund’s greater exposure to strong-performing 5% and 5.5% coupon mortgages, Federal Housing Administration (FHA) and Veteran’s Administration (VA) supported “reperforming mortgages,” and interest-only and principal-only collateralized mortgage obligations, which are discussed in more detail on the following pages.
Market overview
Between October 1, 2004, and September 30, 2005, yields on 2-year Treasury notes increased about 160 basis points (a basis point is one hundredth of a percent) while yields on 10-year Treasury bonds increased by only 21 basis points -- far less than many investors had expected. As a result of this uneven rise in rates, the yield curve (a graphical representation of the difference in yield between short-term and long-term securities) flattened dramatically. Yet, the Federal Reserve Board’s (the Fed’s) measured approach to raising the federal funds rate generally helped maintain order in the bond markets, and volatility was low.
Corporate bonds offered little in the way of excess returns over Treasuries. In other words, income investors were not rewarded for taking on the additional credit risk associated with corporate bonds. (Treasuries, which are backed by the full faith and credit of the U.S. government, are considered to be free of credit risk.) Mortgage-backed securities (MBSs) and agency bonds outperformed Treasuries of comparable maturities. Domestic banks and Asian retail
7
investors maintained their strong demand for MBSs, particularly Fannie Mae 30-year fixed mortgages paying 5%. The extreme demand for these securities made them scarce and drove values higher. Agency bonds performed well despite news stories that Fannie Mae and Freddie Mac were growing too fast and speculation that they would be made to adopt more stringent regulations designed to curb their growth. While this news had a negative impact on the stock of these agencies, bond investors viewed it as a positive. If the agencies were forced to shrink, their portfolios of mortgages would become smaller and less leveraged, rendering the bonds less risky.
Strategy overview
There are six key strategy decisions that we make in managing the fund. The first is called term structure and reflects our views of the direction of interest rates based on factors such as economic indicators, Fed statements and strategy, and market sentiment. We also analyze the shape of the yield curve and strive to position your fund’s portfolio to benefit from expected shifts in the curve. Our second strategic decision involves sector allocation. We seek to determine the relative attractiveness of the different fixed-income sectors in which your fund can invest -- Treasuries, agencies, and MBSs -- and then position its portfolio to take advantage of our sector preferences. We also weigh the relative attractiveness of the various programs in the MBS
Market sector performance
These indexes provide an overview of performance in different market sectors for the 12 months ended 9/30/05.
| Bonds | |
| Lehman GNMA Index (Government National Mortgage Association bonds) | 3.38% |
|
| Lehman Aggregate Bond Index (broad bond market) | 2.80% |
|
| Lehman Municipal Bond Index (tax-exempt bonds) | 4.05% |
|
| JP Morgan Global High Yield Index (global high-yield corporate bonds) | 6.75% |
|
| Equities | |
| S&P 500 Index (broad stock market) | 12.25% |
|
| Russell 1000 Growth Index (large-company growth stocks) | 11.60% |
|
| Russell 1000 Value Index (large-company value stocks) | 16.69% |
|
8
market: Government National Mortgage Association certificates (Ginnie Maes), Federal National Mortgage Association certificates (Fannie Maes), and Federal Home Loan Mortgage Corporation certificates (Freddie Macs). We make three other strategic decisions related to MBSs: We seek to determine which maturity is most attractive (e.g., 30-year, 15-year, or adjustable-rate); we assess which coupon level (e.g., 5.5%, 6.5%, 7%, etc.) or what combination of coupons provides the best risk/return tradeoff; and we consider the “seasoning” of mortgages. An older or more seasoned mortgage is typically less likely to be prepaid. Prepayment would interrupt the income stream and require investors to reinvest principal at current lower rates.
Our sixth strategic decision concerns out-of-benchmark exposure: we consider the relative attractiveness of securities that are not in the fund’s primary benchmark but are allowed under the fund’s investment guidelines.
Your fund’s holdings
We believed that interest rates would move higher during the period as the Fed continued its tightening campaign. Consequently, we maintained the fund’s relatively short portfolio duration, which limited its sensitivity to these incremental rate increases. Although rates rose, they did not rise as much as we had anticipated, and the fund’s duration had a neutral effect on portfolio returns. Our security
| Comparison of the fund’s maturity and duration |
| This chart compares changes in the fund’s duration (a measure of its sensitivity to interest-rate |
| changes) and its average effective maturity (a weighted average of the holdings’ maturities). |

9
selection, particularly with regard to coupons, was more beneficial to returns. The portfolio had a significant position in Ginnie Mae mortgages with 5% coupons. When market demand for Fannie Mae 5% mortgages spiked, the value of the fund’s 5% Ginnie Mae mortgages rose in tandem. We sold this position on strength and purchased Ginnie Mae mortgages with 5.5% coupons. These, too, outperformed mortgages with higher coupons. Our emphasis on mortgage-backed securities (MBSs) boosted returns, as these outperformed Treasuries. Within the mortgage sectors, we favored Fannie Mae securities over Ginnie Maes and Freddie Macs, believing that they offered better valuations and greater liquidity. More recently, however, we have begun to see greater value opportunities among Freddie Mac securities.
In terms of maturities, the fund emphasized 30-year mortgages, which had a beneficial effect on returns. Although longer-maturity mortgages generally carry greater prepayment risk, prepayment activity typically lessens in periods of rising interest rates. Prepayment risk is the risk that mortgage loans will be paid in full and terminated prematurely, reducing an investor’s expected interest income, and necessitating reinvestment of principal at prevailing market rates, which could be lower.
We increased the fund’s exposure to reperforming mortgages. These are formerly delinquent mortgages that are pooled together and given credit
| Portfolio composition |
| This table shows the fund's portfolio composition as of 9/30/05. Weightings are shown as a |
| percentage of net assets and are net of TBA sales positions outstanding. Holdings will vary |
| over time. |
protection from the Federal Housing Administration (FHA), the Veteran’s Administration (VA), and Fannie Mae. We like the limited credit risk of these securities, and the fact their level of prepayment risk is relatively stable. With regard to seasoning, the fund sought exposure to older, more seasoned mortgages, which have been in short supply in recent years. However, through reperforming mortgages we can gain exposure to mortgages that are typically 3 to 5 years old.
Mortgages can be split into derivative securities, whereby one investor receives mortgage interest only (IO), and another receives mortgage principal payments only. We added to the fund’s IO exposure, as these derivative securities were attractively valued and offered potentially higher yields. Later in the period, we purchased principal-only (PO) securities to partially hedge the IO positions. The fund’s exposure to these derivative securities is quite small; nevertheless, it has made a valuable contribution to performance.
Please note that all holdings discussed in this report are subject to review in accordance with the fund’s investment strategy and may vary in the future.
The outlook for your fund
|
The following commentary reflects anticipated developments that could affect your fund over the next six months, as well as your management team’s plans for responding to them.While six months ago it appeared possible that the Fed would stop increasing interest rates when the federal funds rate reached 3.75%, we now believe that the tightening may continue until rates reach 4.25% or 4.5% . Commentary from the Fed suggests that global influences are holding down our longer-term interest rates and reducing the effect of each Fed rate hike, necessitating further rate increases. Demand for U.S. government bonds remains strong; furthermore, pension reform worldwide has led to increased demand for long-term debt. As a result, there has been a large flow of funds away from shorter-duration to longer-duration assets. We anticipate that these forces may cause the yield curve to invert -- a situation in which yields of short-term debt are higher than yields of longer-term debt. Historically, interest rates have fallen after a yield curve inversion, causing the yield curve to regain its normal upward slope. We are monitoring the situation and, when appropriate, will begin to position the fund for a steepening of the yield curve. As always, we strive to position the fund to take advantage of attractive opportunities without assuming undue risk.
The views expressed in this report are exclusively those of Putnam Management. They are not meant as investment advice.
Mutual funds that invest in government securities are not guaranteed. Mortgage-backed securities are subject to prepayment risk. Mutual funds that invest in bonds are subject to certain risks, including interest-rate risk, credit risk, and inflation risk. As interest rates rise, the prices of bonds fall. Long-term bonds are more exposed to interest-rate risk than short-term bonds. Unlike bonds, bond funds have ongoing fees and expenses.
11
Your fund’s performance
This section shows your fund’s performance during its fiscal year, which ended September 30, 2005. Performance should always be considered in light of a fund’s investment strategy. Data represents past performance. Past performance does not guarantee future results. More recent returns may be less or more than those shown. Investment return and principal value will fluctuate, and you may have a gain or a loss when you sell your shares. For the most recent month-end performance, please visit www.putnam.com or call Putnam at 1-800-225-1581. Class Y shares are generally only available to corporate clients that, for example, maintain large balances on behalf of retirement plan participants. See the Terms and Definitions section in this report for definitions of the share classes offered by your fund.
| Fund performance | | | | | | | | |
| Total return for periods ended 9/30/05 | | | | | | | |
|
| |
| | Class A | | Class B | | Class C | | Class M | | Class R | Class Y |
| (inception dates) | (2/8/84) | | (4/27/92) | | (7/26/99) | | (2/6/95) | | (1/21/03) | (4/11/94) |
|
| | NAV | POP | NAV | CDSC | NAV | CDSC | NAV | POP | NAV | NAV |
|
| Annual average | | | | | | | | | | |
| (life of fund) | 7.33% | 7.10% | 6.44% | 6.44% | 6.52% | 6.52% | 6.98% | 6.82% | 7.06% | 7.47% |
|
| 10 years | 69.87 | 62.23 | 57.45 | 57.45 | 57.67 | 57.67 | 65.23 | 59.81 | 65.74 | 73.77 |
| Annual average | 5.44 | 4.96 | 4.64 | 4.64 | 4.66 | 4.66 | 5.15 | 4.80 | 5.18 | 5.68 |
|
| 5 years | 27.22 | 21.51 | 22.54 | 20.54 | 22.60 | 22.60 | 25.66 | 21.57 | 25.64 | 28.80 |
| Annual average | 4.93 | 3.97 | 4.15 | 3.81 | 4.16 | 4.16 | 4.67 | 3.98 | 4.67 | 5.19 |
|
| 1 year | 2.43 | –2.15 | 1.64 | –3.32 | 1.64 | 0.64 | 2.08 | –1.21 | 2.14 | 2.64 |
|
Performance assumes reinvestment of distributions and does not account for taxes. Returns at public offering price (POP) for class A and M shares reflect a sales charge of 4.50% and 3.25%, respectively (which for class A shares does not reflect a reduction in sales charges that went into effect on April 1, 2005; if this reduction had been in place for all periods indicated, returns would have been higher). Class B share returns reflect the applicable contingent deferred sales charge (CDSC), which is 5% in the first year, declining to 1% in the sixth year, and is eliminated thereafter. Class C shares reflect a 1% CDSC the first year that is eliminated thereafter. Class R and Y shares have no initial sales charge or CDSC. Performance for class B, C, M, R, and Y shares before their inception is derived from the historical performance of class A shares, adjusted for the applicable sales charge (or CDSC) and, except for class Y shares, the higher operating expenses for such shares.
A 2% short-term trading fee may be applied to shares exchanged or sold within 5 days of purchase.
12
Change in the value of a $10,000 investment ($9,550 after sales charge)
Cumulative total return from 9/30/95 to 9/30/05
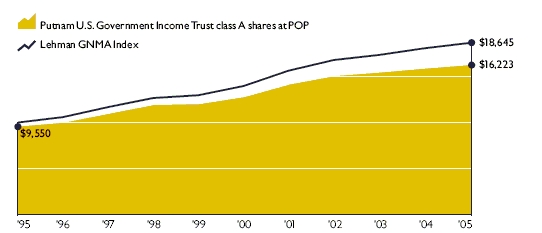
Past performance does not indicate future results. At the end of the same time period, a $10,000 investment in the fund’s class B and class C shares would have been valued at $15,745 and $15,767, respectively, and no contingent deferred sales charges would apply. A $10,000 investment in the fund’s class M shares would have been valued at $16,523 ($15,981 at public offering price). A $10,000 investment in the fund’s class R and class Y shares would have been valued at $16,574 and $17,377, respectively. See first page of performance section for performance calculation method.
| Comparative index returns | | |
| For periods ended 9/30/05 | | |
|
| |
| | Lehman | Lipper GNMA Funds |
|
| | GNMA Index | category average* |
| Annual average | | |
| (life of fund) | 8.92% | 7.87% |
|
| 10 years | 86.45 | 71.74 |
| Annual average | 6.43 | 5.55 |
|
| 5 years | 33.61 | 29.00 |
| Annual average | 5.97 | 5.22 |
|
| 1 year | 3.38 | 2.29 |
|
Index and Lipper results should be compared to fund performance at net asset value.
* Over the 1-, 5-, and 10-year periods ended 9/30/05, there were 61, 45, and 30 funds, respectively, in this Lipper category.

| Fund price and distribution information | | | |
| For the 12-month period ended 9/30/05 | | | | | |
|
| |
| | Class A | | Class B | Class C | Class M | | Class R | Class Y |
|
| Distributions | | | | | | | | |
| (number) | 12 | 12 | 12 | 12 | | 12 | 12 |
|
| Income | $0.408 | $0.305 | $0.305 | $0.372 | $0.380 | $0.444 |
|
| Capital gains | -- | | -- | -- | -- | | -- | -- |
|
| Total | $0.408 | $0.305 | $0.305 | $0.372 | $0.380 | $0.444 |
|
| Share value: | NAV | POP | NAV | NAV | NAV | POP | NAV | NAV |
| 9/30/04 | $13.24 | $13.86 | $13.17 | $13.22 | $13.23 | $13.67 | $13.24 | $13.22 |
|
| 9/30/05 | 13.15 | 13.66* | 13.08 | 13.13 | 13.13 | 13.57 | 13.14 | 13.12 |
| |
| Current yield | | | | | | | | |
| (end of period) | | | | | | | | |
Current | | | | | | | | |
| dividend rate1 | 3.10% | 2.99% | 2.39% | 2.38% | 2.83% | 2.74% | 2.83% | 3.38% |
|
| Current 30-day | | | | | | | | |
| SEC yield2 | 3.04 | 2.93 | 2.29 | 2.29 | 2.79 | 2.70 | 2.79 | 3.30 |
|
| * | Reflects a reduction in sales charge that took effect on April 1, 2005. |
| |
| | 1 | Most recent distribution, excluding capital gains, annualized and divided by NAV or POP at end of period. |
| |
| | 2 | Based only on investment income, calculated using SEC guidelines. |
| |
14
Your fund’s expenses
As a mutual fund investor, you pay ongoing expenses, such as management fees, distribution fees (12b-1 fees), and other expenses. Using the information below, you can estimate how these expenses affect your investment and compare them with the expenses of other funds. You may also pay one-time transaction expenses, including sales charges (loads) and redemption fees, which are not shown in this section and would have resulted in higher total expenses. For more information, see your fund’s prospectus or talk to your financial advisor.
Review your fund’s expenses
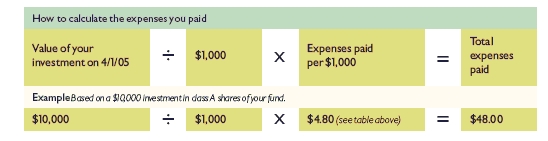
The table below shows the expenses you would have paid on a $1,000 investment in Putnam U.S. Government Income Trust from April 1, 2005, to September 30, 2005. It also shows how much a $1,000 investment would be worth at the close of the period, assuming actual returns and expenses.
| | Class A | Class B | Class C | Class M | Class R | Class Y |
|
| Expenses paid per $1,000* | $ 4.80 | $ 8.57 | $ 8.57 | $ 6.05 | $ 6.05 | $ 3.54 |
|
| Ending value (after expenses) | $1,014.00 | $1,010.20 | $1,010.10 | $1,011.90 | $1,012.10 | $1,014.60 |
|
| * | Expenses for each share class are calculated using the fund’s annualized expense ratio for each class, which represents the ongoing expenses as a percentage of net assets for the six months ended 9/30/05. The expense ratio may differ for each share class (see the table at the bottom of the next page). Expenses are calculated by multiplying the expense ratio by the average account value for the period; then multiplying the result by the number of days in the period; and then dividing that result by the number of days in the year. |
| |
Estimate the expenses you paid
To estimate the ongoing expenses you paid for the six months ended September 30, 2005, use the calculation method below. To find the value of your investment on April 1, 2005, go to www.putnam.com and log on to your account. Click on the “Transaction History” tab in your Daily Statement and enter 04/01/2005 in both the “from” and “to” fields. Alternatively, call Putnam at 1-800-225-1581.
15
Compare expenses using the SEC’s method
The Securities and Exchange Commission (SEC) has established guidelines to help investors assess fund expenses. Per these guidelines, the table below shows your fund’s expenses based on a $1,000 investment, assuming a hypothetical 5% annualized return. You can use this information to compare the ongoing expenses (but not transaction expenses or total costs) of investing in the fund with those of other funds. All mutual fund shareholder reports will provide this information to help you make this comparison. Please note that you cannot use this information to estimate your actual ending account balance and expenses paid during the period.
| | Class A | Class B | Class C | Class M | Class R | Class Y |
|
| Expenses paid per $1,000* | $ 4.81 | $ 8.59 | $ 8.59 | $ 6.07 | $ 6.07 | $ 3.55 |
|
| Ending value (after expenses) | $1,020.31 | $1,016.55 | $1,016.55 | $1,019.05 | $1,019.05 | $1,021.56 |
|
| * | Expenses for each share class are calculated using the fund’s annualized expense ratio for each class, which represents the ongoing expenses as a percentage of net assets for the six months ended 9/30/05. The expense ratio may differ for each share class (see the table at the bottom of this page). Expenses are calculated by multiplying the expense ratio by the average account value for the period; then multiplying the result by the number of days in the period; and then dividing that result by the number of days in the year. |
| |
Compare expenses using industry averages
You can also compare your fund’s expenses with the average of its peer group, as defined by Lipper, an independent fund-rating agency that ranks funds relative to others that Lipper considers to have similar investment styles or objectives. The expense ratio for each share class shown below indicates how much of your fund’s net assets have been used to pay ongoing expenses during the period.
| | Class A | Class B | Class C | Class M | Class R | Class Y |
| Your fund's annualized | | | | | | |
| expense ratio† | 0.95% | 1.70% | 1.70% | 1.20% | 1.20% | 0.70% |
|
| Average annualized expense | | | | | | |
| ratio for Lipper peer group‡ | 1.03% | 1.78% | 1.78% | 1.28% | 1.28% | 0.78% |
|
† For the fund’s most recent fiscal half year; may differ from expense ratios based on one-year data in the financial highlights.
‡ Simple average of the expenses of all front-end load funds in the fund’s Lipper peer group, calculated in accordance with Lipper’s standard method for comparing fund expenses (excluding 12b-1 fees and without giving effect to any expense offset and brokerage service arrangements that may reduce fund expenses). This average reflects each fund’s expenses for its most recent fiscal year available to Lipper as of 9/30/05. To facilitate comparison, Putnam has adjusted this average to reflect the 12b-1 fees carried by each class of shares other than class Y shares, which do not incur 12b-1 fees. The peer group may include funds that are significantly smaller or larger than the fund, which may limit the comparability of the fund’s expenses to the simple average, which typically is higher than the asset-weighted average.
16
Your fund’s
portfolio turnover
|
Putnam funds are actively managed by teams of experts who buy and sell securities based on intensive analysis of companies, industries, economies, and markets. Portfolio turnover is a measure of how often a fund’s managers buy and sell securities for your fund. A portfolio turnover of 100%, for example, means that the managers sold and replaced securities valued at 100% of a fund’s assets within a one-year period. Funds with high turnover may be more likely to generate capital gains and dividends that must be distributed to shareholders as taxable income. High turnover may also cause a fund to pay more brokerage commissions and other transaction costs, which may detract from performance.
Funds that invest in bonds or other fixed-income instruments may have higher turnover than funds that invest only in stocks. Short-term bond funds tend to have higher turnover than longer-term bond funds, because shorter-term bonds will mature or be sold more frequently than longer-term bonds. You can use the table below to compare your fund’s turnover with the average turnover for funds in its Lipper category.
| Turnover comparisons | | | | | |
| Percentage of holdings that change every year | | | |
|
| |
| | 2005 | 2004 | 2003 | 2002 | 2001 |
| Putnam U.S. Government | | | | | |
| Income Trust | 782% | 198% | 332% | 277% | 157% |
|
| Lipper GNMA | | | | | |
| Funds category average | 244% | 237% | 292% | 272% | 237% |
|
Turnover data for the fund is calculated based on the fund's fiscal-year period, which ends on September 30. Turnover data for the fund's Lipper category is calculated based on the average of the turnover of each fund in the category for its fiscal year ended during the indicated year. Fiscal years vary across funds in the Lipper category, which may limit the comparability of the fund's portfolio turnover rate to the Lipper average. Comparative data for 2005 is based on information available as of 9/30/05.
17
Your fund’s risk
This risk comparison is designed to help you understand how your fund compares with other funds. The comparison utilizes a risk measure developed by Morningstar, an independent fund-rating agency. This risk measure is referred to as the fund’s Overall Morningstar Risk.
Your fund’s Overall Morningstar® Risk
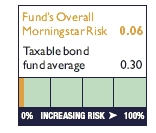
Your fund’s Overall Morningstar Risk is shown alongside that of the average fund in its broad asset class, as determined by Morningstar. The risk bar broadens the comparison by translating the fund’s Overall Morningstar Risk into a percentile, which is based on the fund’s ranking among all funds rated by Morningstar as of September 30, 2005. A higher Overall Morningstar Risk generally indicates that a fund’s monthly returns have varied more widely.
Morningstar determines a fund’s Overall Morningstar Risk by assessing variations in the fund’s monthly returns -- with an emphasis on downside variations -- over 3-, 5-, and 10-year periods, if available. Those measures are weighted and averaged to produce the fund’s Overall Morningstar Risk. The information shown is provided for the fund’s class A shares only; information for other classes may vary. Overall Morningstar Risk is based on historical data and does not indicate future results.
Morningstar does not purport to measure the risk associated with a current investment in a fund, either on an absolute basis or on a relative basis. Low Overall Morningstar Risk does not mean that you cannot lose money on an investment in a fund. Copyright 2004 Morningstar, Inc. All Rights Reserved. The information contained herein (1) is proprietary to Morningstar and/or its content providers; (2) may not be copied or distributed; and (3) is not warranted to be accurate, complete, or timely. Neither Morningstar nor its content providers are responsible for any damages or losses arising from any use of this information.
18
Your fund is managed by the members of the Putnam Core Fixed-Income Team. Kevin Cronin is the Portfolio Leader and Rob Bloemker and Daniel Choquette are Portfolio Members of your fund. The Portfolio Leader and Portfolio Members coordinate the team’s management of the fund.
For a complete listing of the members of the Putnam Core Fixed-Income Team, including those who are not Portfolio Leaders or Portfolio Members of your fund, visit Putnam’s Individual Investor Web site at www.putnam.com.
Fund ownership by the Portfolio Leader and Portfolio Members
The table below shows how much the fund’s current Portfolio Leader and Portfolio Members have invested in the fund (in dollar ranges). Information shown is as of September 30, 2005, and September 30, 2004.
| | | $1 – | $10,001 – | $50,001 – | $100,001 – | $500,001 – | $1,000,001 |
|
| | Year $0 | $10,000 | $50,000 | $100,000 | $500,000 | $1,000,000 | and over |
| Kevin Cronin | 2005 | | * | | | | |
|
|
| Portfolio Leader | 2004 * | | | | | | |
|
| Rob Bloemker | 2005 | | * | | | | |
|
|
| Portfolio Member | 2004 * | | | | | | |
|
| Daniel Choquette | 2005 * | | | | | | |
|
|
| Portfolio Member | N/A | | | | | | |
|
| |
| N/A indicates the individual was not a Portfolio Leader or Portfolio Member as of 9/30/04. | | | |
19
Fund manager compensation
|
The total 2004 fund manager compensation that is attributable to your fund is approximately $940,000. This amount includes a portion of 2004 compensation paid by Putnam Management to the fund managers listed in this section for their portfolio management responsibilities, calculated based on the fund assets they manage taken as a percentage of the total assets they manage. The compensation amount also includes a portion of the 2004 compensation paid to the Chief Investment Officer of the team and the Group Chief Investment Officer of the fund’s broader investment category for their oversight responsibilities, calculated based on the fund assets they oversee taken as a percentage of the total assets they oversee. This amount does not include compensation of other personnel involved in research, trading, administration, systems, compliance, or fund operations; nor does it include non-compensation costs. These percentages are determined as of the fund’s fiscal period-end. For personnel who joined Putnam Management during or after 2004, the calculation reflects annualized 2004 compensation or an estimate of 2005 compensation, as applicable.
Other Putnam funds managed by the Portfolio Leader and Portfolio Members
Kevin Cronin is also a Portfolio Leader of Putnam American Government Income Fund, Putnam Global Income Trust, Putnam Income Fund, and Putnam Limited Duration Government Income Fund. He is also a Portfolio Member of The George Putnam Fund of Boston and Putnam Equity Income Fund.
Rob Bloemker is also a Portfolio Member of Putnam American Government Income Fund, Putnam Diversified Income Trust, Putnam Income Fund, Putnam Limited Duration Government Income Fund, Putnam Master Intermediate Income Trust, and Putnam Premier Income Trust.
Daniel Choquette is also a Portfolio Member of Putnam American Government Income Fund and Putnam Limited Duration Government Income Fund.
Kevin Cronin, Rob Bloemker, and Daniel Choquette may also manage other accounts and variable trust funds advised by Putnam Management or an affiliate.
Changes in your fund’s Portfolio Leader and Portfolio Members
During the year ended September 30, 2005, Portfolio Member Daniel Choquette joined your fund’s management team.
20
Fund ownership by Putnam’s Executive Board
The table below shows how much the members of Putnam’s Executive Board have invested in the fund (in dollar ranges). Information shown is as of September 30, 2005, and September 30, 2004.
| | | | | $1 – | $10,001 – | $50,001– | $100,001 |
| | Year | $0 | | $10,000 | $50,000 | $100,000 | and over |
|
| Philippe Bibi | 2005 | * | | | | | |
|
|
Chief Technology Officer | 2004 | * | | | | | |
|
| Joshua Brooks | 2005 | * | | | | | |
|
|
| Deputy Head of Investments | N/A | | | | | | |
|
| William Connolly | 2005 | * | | | | | |
|
|
| Head of Retail Management | N/A | | | | | | |
|
| Kevin Cronin | 2005 | | | | * | | |
|
|
| Head of Investments | 2004 | * | | | | | |
|
| Charles Haldeman, Jr. | 2005 | | | | * | | |
|
|
| President and CEO | 2004 | | | | * | | |
|
| Amrit Kanwal | 2005 | * | | | | | |
|
|
| Chief Financial Officer | 2004 | * | | | | | |
|
| Steven Krichmar | 2005 | * | | | | | |
|
|
| Chief of Operations | 2004 | * | | | | | |
|
| Francis McNamara, III | 2005 | | | * | | | |
|
|
| General Counsel | 2004 | * | | | | | |
|
| Richard Robie, III | 2005 | * | | | | | |
|
|
| Chief Administrative Officer | 2004 | * | | | | | |
|
| Edward Shadek | 2005 | * | | | | | |
|
|
| Deputy Head of Investments | N/A | | | | | | |
|
| Sandra Whiston | 2005 | * | | | | | |
|
|
| Head of Institutional Management | N/A | | | | | | |
|
N/A indicates the individual was not a member of Putnam's Executive Board as of 9/30/04.
21
Total return shows how the value of the fund’s shares changed over time, assuming you held the shares through the entire period and reinvested all distributions in the fund.
Net asset value (NAV) is the price, or value, of one share of a mutual fund, without a sales charge. NAVs fluctuate with market conditions. NAV is calculated by dividing the net assets of each class of shares by the number of outstanding shares in the class.
Public offering price (POP) is the price of a mutual fund share plus the maximum sales charge levied at the time of purchase. POP performance figures shown here assume the 4.50% maximum sales charge for class A shares (since reduced to 3.75%) and 3.25% for class M shares.
Contingent deferred sales charge (CDSC) is a charge applied at the time of the redemption of class B or C shares and assumes redemption at the end of the period. Your fund’s class B CDSC declines from a 5% maximum during the first year to 1% during the sixth year. After the sixth year, the CDSC no longer applies. The CDSC for class C shares is 1% for one year after purchase.
Class A shares are generally subject to an initial sales charge and no sales charge on redemption (except on certain redemptions of shares bought without an initial sales charge).Class B shares may be subject to a sales charge upon redemption.
Class C shares are not subject to an initial sales charge and are subject to a contingent deferred sales charge only if the shares are redeemed during the first year.
Class M shares have a lower initial sales charge and a higher 12b-1 fee than class A shares and no sales charge on redemption (except on certain redemptions of shares bought without an initial sales charge).
Class R shares are not subject to an initial sales charge or CDSC and are available only to certain defined contribution plans.
Class Y shares are not subject to an initial sales charge or CDSC, and carry no 12b-1 fee. They are only available to eligible purchasers, including eligible defined contribution plans or corporate IRAs.
22
JP Morgan Global High Yield Index is an unmanaged index of global high-yield fixed-income securities.
Lehman Aggregate Bond Index is an unmanaged index of U.S. investment-grade fixed-income securities.
Lehman GNMA Index is an unmanaged index of Government National Mortgage Association bonds.
Lehman Municipal Bond Index is an unmanaged index of long-term fixed-rate investment-grade tax-exempt bonds.
Russell 1000 Growth Index is an unmanaged index of those companies in the large-cap Russell 1000 Index chosen for their growth orientation.
Russell 1000 Value Index is an unmanaged index of those companies in the large-cap Russell 1000 Index chosen for their value orientation.
S&P 500 Index is an unmanaged index of common stock performance.
Indexes assume reinvestment of all distributions and do not account for fees. Securities and performance of a fund and an index will differ. You cannot invest directly in an index.
Lipper is a third-party industry ranking entity that ranks funds (without sales charges) with similar current investment styles or objectives as determined by Lipper. Lipper category averages reflect performance trends for funds within a category and are based on total return at net asset value.
23
Trustee approval of
management contract
|
The Board of Trustees of the Putnam funds oversees the management of each fund and, as required by law, determines annually whether to approve the continuance of your fund’s management contract with Putnam Management. In this regard, the Board of Trustees, with the assistance of its Contract Committee consisting solely of Trustees who are not “interested persons” (as such term is defined in the Investment Company Act of 1940, as amended) of the Putnam funds (the “Independent Trustees”), requests and evaluates all information it deems reasonably necessary under the circumstances. Over the course of several months beginning in March and ending in June 2005, the Contract Committee met five times to consider the information provided by Putnam Management and other information developed with the assistance of the Board’s independent counsel and independent staff. The Contract Committee reviewed and discussed key aspects of this information with all of the Independent Trustees. Upon completion of this review, the Contract Committee recommended and the Independent Trustees approved the continuance of your fund’s management contract, effective July 1, 2005. This approval was based on the following conclusions:
- That the fee schedule currently in effect for your fund represents reasonable compensation in light of the nature and quality of the services being provided to the fund, the fees paid by competitive funds and the costs incurred by Putnam Management in providing such services, and
- That such fee schedule represents an appropriate sharing between fund shareholders and Putnam Management of such economies of scale as may exist in the management of the fund at current asset levels.
These conclusions were based on a comprehensive consideration of all information provided to the Trustees and were not the result of any single factor. Some of the factors that figured particularly in the Trustees’ deliberations and how the Trustees considered these factors are described below, although individual Trustees may have evaluated the information presented differently, giving different weights to various factors. It is also important to recognize that the fee arrangements for your fund and the other Putnam funds are the result of many years of review and discussion between the Independent Trustees and Putnam Management, that certain aspects of such arrangements may receive greater scrutiny in some years than others, and that the Trustees’ conclusions may be based, in part, on their consideration of these same arrangements in prior years.
Model fee schedules and categories; total expenses
The Trustees’ review of the management fees and total expenses of the Putnam funds focused on three major themes:
- Consistency. The Trustees, working in cooperation with Putnam Management, have developed and implemented a series of model fee schedules for the Putnam funds designed to ensure that
24
each fund’s management fee is consistent with the fees for similar funds in the Putnam family of funds and compares favorably with fees paid by competitive funds sponsored by other invest- ment advisors. Under this approach, each Putnam fund is assigned to one of several fee categories based on a combination of factors, including competitive fees and perceived difficulty of management, and a common fee schedule is implemented for all funds in a given fee cate- gory. The Trustees reviewed the model fee schedule currently in effect for your fund, including fee levels and breakpoints, and the assignment of the fund to a particular fee category under this structure. (“Breakpoints” refer to reductions in fee rates that apply to additional assets once specified asset levels are reached.) The Trustees concluded that no changes should be made in the fund’s current fee schedule at this time.
- Competitiveness. The Trustees also reviewed comparative fee and expense information for competitive funds, which indicated that, in a custom peer group of competitive funds selected by Lipper Inc., your fund ranked in the 50th percentile in management fees and in the 40th percentile in total expenses (less any applicable 12b-1 fees) as of December 31, 2004 (the first percentile being the least expensive funds and the 100th percentile being the most expensive funds). (Because the fund’s custom peer group is smaller than the fund’s broad Lipper Inc. peer group, this expense comparison may differ from the Lipper peer expense information found elsewhere in this report.) The Trustees noted that expense ratios for a number of Putnam funds, which show the percentage of fund assets used to pay for management and administrative services, distribution (12b-1) fees and other expenses, had been increasing recently as a result of declining net assets and the natural operation of fee breakpoints. They noted that such expense ratio increases were currently being controlled by expense limita- tions implemented in January 2004 and which Putnam Management, in consultation with the Contract Committee, has committed to maintain at least through 2006. The Trustees expressed their intention to monitor this information closely to ensure that fees and expenses of the Putnam funds continue to meet evolving competitive standards.
- Economies of scale. The Trustees concluded that the fee schedule currently in effect for your fund represents an appropriate sharing of economies of scale at current asset levels. Your fund currently has the benefit of breakpoints in its management fee that provide shareholders with significant economies of scale, which means that the effective management fee rate of a fund (as a percentage of fund assets) declines as a fund grows in size and crosses specified asset thresholds. The Trustees examined the existing breakpoint structure of the Putnam funds’ management fees in light of competitive industry practices. The Trustees considered various possible modifications to the Putnam funds’ current breakpoint structure, but ulti- mately concluded that the current breakpoint structure continues to serve the interests of fund shareholders. Accordingly, the Trustees continue to believe that the fee schedules currently in effect for the funds represent an appropriate sharing of economies of scale at
25
current asset levels. The Trustees noted that significant redemptions in many Putnam funds, together with significant changes in the cost structure of Putnam Management, have altered the economics of Putnam Management’s business in significant ways. In view of these changes, the Trustees intend to consider whether a greater sharing of the economies of scale by fund shareholders would be appropriate if and when aggregate assets in the Putnam funds begin to experience meaningful growth.
In connection with their review of the management fees and total expenses of the Putnam funds, the Trustees also reviewed the costs of the services to be provided and profits to be realized by Putnam Management and its affiliates from the relationship with the funds. This information included trends in revenues, expenses and profitability of Putnam Management and its affiliates relating to the investment management and distribution services provided to the funds. In this regard, the Trustees also reviewed an analysis of Putnam Management’s revenues, expenses and profitability with respect to the funds’ management contracts, allocated on a fund-by-fund basis.
The quality of the investment process provided by Putnam Management represented a major factor in the Trustees’ evaluation of the quality of services provided by Putnam Management under your fund’s management contract. The Trustees were assisted in their review of the funds’ investment process and performance by the work of the Investment Oversight Committees of the Trustees, which meet on a regular monthly basis with the funds’ portfolio teams throughout the year. The Trustees concluded that Putnam Management generally provides a high-quality investment process -- as measured by the experience and skills of the individuals assigned to the management of fund portfolios, the resources made available to such personnel, and in general the ability of Putnam Management to attract and retain high-quality personnel -- but also recognize that this does not guarantee favorable investment results for every fund in every time period. The Trustees considered the investment performance of each fund over multiple time periods and considered information comparing the fund’s performance with various benchmarks and with the performance of competitive funds. The Trustees noted the satisfactory investment performance of many Putnam funds. They also noted the disappointing investment performance of certain funds in recent years and continued to discuss with senior management of Putnam Management the factors contributing to such underperformance and actions being taken to improve performance. The Trustees recognized that, in recent years, Putnam Management has made significant changes in its investment personnel and processes and in the fund product line to address areas of underperformance. The Trustees indicated their intention to continue to monitor performance trends to assess the effectiveness of these changes and to evaluate whether additional remedial changes are warranted.
26
In the case of your fund, the Trustees considered that your fund’s class A share performance at net asset value was in the following percentiles of its Lipper Inc. peer group for the one-, three-and five-year periods ended December 31, 2004 (the first percentile being the best-performing funds and the 100th percentile being the worst-performing funds):
| One-year period | Three-year period | Five-year period |
|
| 51st | 61st | 66th |
(Because of the passage of time, these performance results may differ from the performance results for more recent periods shown elsewhere in this report.)
As a general matter, the Trustees believe that cooperative efforts between the Trustees and Putnam Management represent the most effective way to address investment performance problems. The Trustees believe that investors in the Putnam funds have, in effect, placed their trust in the Putnam organization, under the oversight of the funds’ Trustees, to make appropriate decisions regarding the management of the funds. Based on the responsiveness of Putnam Management in the recent past to Trustee concerns about investment performance, the Trustees believe that it is preferable to seek change within Putnam Management to address performance shortcomings. In the Trustees’ view, the alternative of terminating a management contract and engaging a new investment advisor for an underperforming fund would entail significant disruptions and would not provide any greater assurance of improved investment performance.
Brokerage and soft-dollar allocations; other benefits
The Trustees considered various potential benefits that Putnam Management may receive in connection with the services it provides under the management contract with your fund. These include principally benefits related to brokerage and soft-dollar allocations, whereby a portion of the commissions paid by a fund for brokerage is earmarked to pay for research services that may be utilized by a fund’s investment advisor. The Trustees believe that soft-dollar credits and other potential benefits associated with the allocation of fund brokerage, which pertains mainly to funds investing in equity securities, represent assets of the funds that should be used for the benefit of fund shareholders. This area has been marked by significant change in recent years. In July 2003, acting upon the Contract Committee’s recommendation, the Trustees directed that allocations of brokerage to reward firms that sell fund shares be discontinued no later than December 31, 2003. In addition, commencing in 2004, the allocation of brokerage commissions by Putnam Management to acquire research services from third-party service providers has been significantly reduced, and continues at a modest level only to acquire research that is customarily not available for cash. The Trustees will continue to monitor the allocation of the funds’ brokerage to ensure that the principle of “best price and execution” remains paramount in the portfolio trading process.
27
The Trustees’ annual review of your fund’s management contract also included the review of its distributor’s contract and distribution plan with Putnam Retail Management Limited Partnership and the custodian agreement and investor servicing agreement with Putnam Fiduciary Trust Company, all of which provide benefits to affiliates of Putnam Management.
Comparison of retail and institutional fee schedules
The information examined by the Trustees as part of their annual contract review has included for many years information regarding fees charged by Putnam Management and its affiliates to institutional clients such as defined benefit pension plans, college endowments, etc. This information included comparison of such fees with fees charged to the funds, as well as a detailed assessment of the differences in the services provided to these two types of clients. The Trustees observed, in this regard, that the differences in fee rates between institutional clients and the mutual funds are by no means uniform when examined by individual asset sectors, suggesting that differences in the pricing of investment management services to these types of clients reflect to a substantial degree historical competitive forces operating in separate market places. The Trustees considered the fact that fee rates across all asset sectors are higher on average for mutual funds than for institutional clients, as well as the differences between the services that Putnam Management provides to the Putnam funds and those that it provides to institutional clients of the firm, but have not relied on such comparisons to any significant extent in concluding that the management fees paid by your fund are reasonable.
28
Other information
for shareholders
|
Putnam’s policy on confidentiality
|
In order to conduct business with our shareholders, we must obtain certain personal information such as account holders’ addresses, telephone numbers, Social Security numbers, and the names of their financial advisors. We use this information to assign an account number and to help us maintain accurate records of transactions and account balances. It is our policy to protect the confidentiality of your information, whether or not you currently own shares of our funds, and in particular, not to sell information about you or your accounts to outside marketing firms. We have safeguards in place designed to prevent unauthorized access to our computer systems and procedures to protect personal information from unauthorized use. Under certain circumstances, we share this information with outside vendors who provide services to us, such as mailing and proxy solicitation. In those cases, the service providers enter into confidentiality agreements with us, and we provide only the information necessary to process transactions and perform other services related to your account. We may also share this information with our Putnam affiliates to service your account or provide you with information about other Putnam products or services. It is also our policy to share account information with your financial advisor, if you’ve listed one on your Putnam account. If you would like clarification about our confidentiality policies or have any questions or concerns, please don’t hesitate to contact us at 1-800-225-1581, Monday through Friday, 8:30 a.m. to 7:00 p.m., or Saturdays from 9:00 a.m. to 5:00 p.m. Eastern Time.
Putnam is committed to managing our mutual funds in the best interests of our shareholders. The Putnam funds’ proxy voting guidelines and procedures, as well as information regarding how your fund voted proxies relating to portfolio securities during the 12-month period ended June 30, 2005, are available on the Putnam Individual Investor Web site, www.putnam.com/individual, and on the SEC’s Web site, www.sec.gov. If you have questions about finding forms on the SEC’s Web site, you may call the SEC at 1-800-SEC-0330. You may also obtain the Putnam funds’ proxy voting guidelines and procedures at no charge by calling Putnam’s Shareholder Services at 1-800-225-1581.
The fund will file a complete schedule of its portfolio holdings with the SEC for the first and third quarters of each fiscal year on Form N-Q. Shareholders may obtain the fund’s Forms N-Q on the SEC’s Web site at www.sec.gov. In addition, the fund’s Forms N-Q may be reviewed and copied at the SEC’s public reference room in Washington, D.C. You may call the SEC at 1-800-SEC-0330 for information about the SEC’s Web site or the operation of the public reference room.
29
A guide to financial statements
|
These sections of the report, as well as the accompanying Notes, preceded by the Report of Independent Registered Public Accounting Firm, constitute the fund’s financial statements.
The fund’s portfolio lists all the fund's investments and their values as of the last day of the reporting period. Holdings are organized by asset type and industry sector, country, or state to show areas of concentration and diversification.
Statement of assets and liabilities shows how the fund’s net assets and share price are determined. All investment and noninvestment assets are added together. Any unpaid expenses and other liabilities are subtracted from this total. The result is divided by the number of shares to determine the net asset value per share, which is calculated separately for each class of shares. (For funds with preferred shares, the amount subtracted from total assets includes the net assets allocated to remarketed preferred shares.)
Statement of operations shows the fund’s net investment gain or loss. This is done by first adding up all the fund’s earnings -- from dividends and interest income - -- and subtracting its operating expenses to determine net investment income (or loss). Then, any net gain or loss the fund realized on the sales of its holdings - -- as well as any unrealized gains or losses over the period -- is added to or subtracted from the net investment result to determine the fund’s net gain or loss for the fiscal year.
Statement of changes in net assets shows how the fund’s net assets were affected by the fund’s net investment gain or loss, by distributions to shareholders, and by changes in the number of the fund’s shares. It lists distributions and their sources (net investment income or realized capital gains) over the current reporting period and the most recent fiscal year-end. The distributions listed here may not match the sources listed in the Statement of operations because the distributions are determined on a tax basis and may be paid in a different period from the one in which they were earned.
Financial highlights provide an overview of the fund’s investment results, per-share distributions, expense ratios, net investment income ratios, and portfolio turnover in one summary table, reflecting the five most recent reporting periods. In a semiannual report, the highlight table also includes the current reporting period. For open-end funds, a separate table is provided for each share class.
30
Report of Independent Registered Public Accounting Firm
The Board of Trustees and Shareholders
Putnam U.S. Government Income Trust:
|
We have audited the accompanying statement of assets and liabilities of Putnam U.S. Government Income Trust, including the fund’s portfolio, as of September 30, 2005, and the related statement of operations for the year then ended, the statements of changes in net assets for each of the two years in the period then ended and the financial highlights for each of the five years or periods in the period then ended. These financial statements and financial highlights are the responsibility of the Fund’s management. Our responsibility is to express an opinion on these financial statements and financial highlights based on our audits.
We conducted our audits in accordance with the standards of the Public Company Accounting Oversight Board (United States). Those standards require that we plan and perform our audit to obtain reasonable assurance about whether the financial statements and financial highlights are free of material misstatement. An audit includes examining, on a test basis, evidence supporting the amounts and disclosures in the financial statements. Our procedures included confirmation of securities owned as of September 30, 2005 by correspondence with the custodian and brokers or by other appropriate auditing procedures. An audit also includes assessing the accounting principles used and significant estimates made by management, as well as evaluating the overall financial statement presentation. We believe that our audits provide a reasonable basis for our opinion.
In our opinion, the financial statements and financial highlights referred to above present fairly, in all material respects, the financial position of Putnam U.S. Government Income Trust as of September 30, 2005, the results of its operations for the year then ended, the changes in its net assets for each of the two years in the period then ended, and the financial highlights for each of the five years or periods in the period then ended, in conformity with U.S. generally accepted accounting principles.

31
| The fund’s portfolio 9/30/05 | | | |
|
| |
| |
| U.S. GOVERNMENT AND AGENCY MORTGAGE OBLIGATIONS (79.6%)* | | |
|
| | Principal amount | | Value |
| |
| U.S. Government Guaranteed Mortgage Obligations (68.6%) | | | |
| Government National Mortgage Association Adjustable | | | |
| Rate Mortgages 4 1/2s, August 20, 2034 | $ 30,931,410 | $ | 30,784,331 |
| Government National Mortgage Association | | | |
| Graduated Payment Mortgages | | | |
| 13 3/4s, November 20, 2014 | 7,557 | | 9,333 |
| 13 1/2s, April 15, 2011 | 24,101 | | 28,129 |
| 13 1/4s, December 20, 2014 | 18,227 | | 22,264 |
| 12 3/4s, with due dates from November 15, 2013 | | | |
| to December 20, 2014 | 46,378 | | 55,649 |
| 12 1/2s, June 15, 2010 | 11,093 | | 12,533 |
| 12 1/4s, with due dates from September 15, 2013 | | | |
| to March 15, 2014 | 94,824 | | 112,172 |
| 11 1/4s, with due dates from September 15, 2015 | | | |
| to January 15, 2016 | 166,751 | | 195,238 |
| 10 3/4s, February 15, 2016 | 11,492 | | 13,319 |
| 10s, with due dates from November 15, 2009 | | | |
| to November 15, 2009 | 45,865 | | 49,365 |
| 9 1/4s, with due dates from April 15, 2016 to May 15, 2016 | 28,678 | | 31,688 |
| Government National Mortgage Association | | | |
| Pass-Through Certificates | | | |
| 8 1/2s, with due dates from November 15, 2005 | | | |
| to December 15, 2019 | 169,422 | | 171,094 |
| 8s, with due dates from May 15, 2024 to August 15, 2032 | 32,288,917 | | 34,757,539 |
| 8s, with due dates from January 15, 2008 to November 15, 2009 | 2,583,505 | | 2,703,643 |
| 7 1/2s, with due dates from October 15, 2021 | | | |
| to November 15, 2032 | 40,867,171 | | 43,668,184 |
| 7 1/2s, with due dates from March 15, 2017 to May 15, 2017 | 42,059 | | 44,703 |
| 7s, with due dates from March 15, 2022 to May 15, 2032 | 48,865,739 | | 51,823,228 |
| 7s, with due dates from October 15, 2007 to August 15, 2012 | 2,597,517 | | 2,730,197 |
| 6 1/2s, with due dates from October 15, 2023 to June 15, 2034 | 16,891,266 | | 17,646,161 |
| 6s, with due dates from November 15, 2023 to October 15, 2033 | 1,705,911 | | 1,749,826 |
| 5 1/2s, with due dates from December 15, 2032 to May 15, 2035 | 43,690,452 | | 44,182,177 |
| 5 1/2s, TBA, October 1, 2035 | 814,000,000 | | 821,504,103 |
| | | | 1,052,294,876 |
|
| |
| U.S. Government Agency Mortgage Obligations (11.0%) | | | |
| Federal Home Loan Mortgage Corporation | | | |
| Pass-Through Certificates | | | |
| 6 1/2s, with due dates from June 1, 2031 to January 1, 2035 | 1,054,624 | | 1,085,611 |
| 5 1/2s, with due dates from August 1, 2013 to May 1, 2020 | 887,010 | | 901,289 |
| 5s, with due dates from May 1, 2034 to May 1, 2034 | 808,535 | | 792,713 |
| Federal National Mortgage Association | | | |
| Pass-Through Certificates | | | |
| 7s, with due dates from September 1, 2028 to March 1, 2029 | 261,258 | | 274,504 |
| 6 1/2s, with due dates from March 1, 2024 to August 1, 2034 | 1,342,471 | | 1,383,289 |
| 6 1/2s, March 1, 2016 | 45,398 | | 46,658 |
| 6s, November 1, 2017 | 265,755 | | 273,468 |
32
| U.S. GOVERNMENT AND AGENCY MORTGAGE OBLIGATIONS (79.6%)* continued | | |
|
| | Principal amount | | Value |
| |
| U.S. Government Agency Mortgage Obligations continued | | | | |
| Federal National Mortgage Association | | | | |
| Pass-Through Certificates | | | | |
| 5 1/2s, with due dates from January 1, 2009 to June 1, 2020 | $ | 1,722,009 | $ | 1,748,965 |
| 5 1/2s, TBA, October 1, 2035 | | 153,191,000 | | 153,143,114 |
| 5s, August 1, 2033 | | 2,239 | | 2,198 |
| 4 1/2s, with due dates from January 1, 2020 to June 1, 2034 | | 8,648,368 | | 8,426,867 |
| 4s, September 1, 2020 | | 99,990 | | 96,178 |
| | | | | 168,174,854 |
|
| |
| Total U.S. government and agency mortgage obligations (cost $1,218,948,154) | $ | 1,220,469,730 |
|
| |
| |
| COLLATERALIZED MORTGAGE OBLIGATIONS (24.1%)* | | | | |
|
| | Principal amount | | Value |
| |
| Fannie Mae | | | | |
| IFB Ser. 03-130, Class SJ, 12.68s, 2034 | $ | 551,643 | $ | 604,423 |
| IFB Ser. 05-74, Class CP, 10.707s, 2035 | | 2,887,442 | | 3,152,726 |
| IFB Ser. 05-74, Class DM, 10.34s, 2035 | | 3,294,110 | | 3,544,320 |
| IFB Ser. 05-74, Class CS, 9.488s, 2035 | | 3,291,585 | | 3,508,625 |
| Ser. 00-42, Class B2, 8s, 2030 | | 85,510 | | 92,266 |
| Ser. 00-17, Class PA, 8s, 2030 | | 421,261 | | 453,340 |
| Ser. 00-18, Class PA, 8s, 2030 | | 395,505 | | 425,516 |
| Ser. 00-19, Class PA, 8s, 2030 | | 418,676 | | 450,635 |
| Ser. 00-20, Class PA, 8s, 2030 | | 237,813 | | 256,330 |
| Ser. 00-21, Class PA, 8s, 2030 | | 696,412 | | 750,166 |
| Ser. 00-22, Class PA, 8s, 2030 | | 504,456 | | 542,811 |
| Ser. 97-37, Class PB, 8s, 2027 | | 1,174,503 | | 1,272,051 |
| Ser. 97-13, Class TA, 8s, 2027 | | 169,945 | | 184,028 |
| Ser. 97-21, Class PA, 8s, 2027 | | 700,637 | | 757,914 |
| Ser. 97-22, Class PA, 8s, 2027 | | 1,325,948 | | 1,435,745 |
| Ser. 97-16, Class PE, 8s, 2027 | | 457,835 | | 495,618 |
| Ser. 97-25, Class PB, 8s, 2027 | | 435,924 | | 471,640 |
| Ser. 95-12, Class PD, 8s, 2025 | | 273,787 | | 296,047 |
| Ser. 95-5, Class A, 8s, 2025 | | 325,210 | | 352,434 |
| Ser. 95-5, Class TA, 8s, 2025 | | 78,634 | | 85,464 |
| Ser. 95-6, Class A, 8s, 2025 | | 223,639 | | 242,279 |
| Ser. 95-7, Class A, 8s, 2025 | | 280,877 | | 304,586 |
| Ser. 94-106, Class PA, 8s, 2024 | | 428,534 | | 464,837 |
| Ser. 94-95, Class A, 8s, 2024 | | 653,079 | | 708,801 |
| Ser. 02-26, Class A2, 7 1/2s, 2048 | | 633,481 | | 669,797 |
| Ser. 05-W3, Class 1A, 7 1/2s, 2045 | | 6,069,654 | | 6,461,196 |
| Ser. 04-W8, Class 3A, 7 1/2s, 2044 | | 9,046,438 | | 9,604,195 |
| Ser. 04-W11, Class 1A4, 7 1/2s, 2044 | | 3,063,842 | | 3,251,385 |
| Ser. 04-W2, Class 5A, 7 1/2s, 2044 | | 3,440,972 | | 3,652,919 |
| Ser. 04-T3, Class 1A4, 7 1/2s, 2044 | | 3,971,568 | | 4,213,189 |
| Ser. 04-W9, Class 2A3, 7 1/2s, 2044 | | 3,692,062 | | 3,914,189 |
| Ser. 04-T2, Class 1A4, 7 1/2s, 2043 | | 1,066,412 | | 1,131,058 |
| Ser. 03-W4, Class 4A, 7 1/2s, 2042 | | 1,623,806 | | 1,714,409 |
33
| COLLATERALIZED MORTGAGE OBLIGATIONS (24.1%)* continued | | | | |
|
| | Principal amount | | Value |
| |
| Fannie Mae | | | | |
| Ser. 02-T18, Class A4, 7 1/2s, 2042 | $ | 2,417,828 | $ | 2,559,222 |
| Ser. 03-W3, Class 1A3, 7 1/2s, 2042 | | 7,363,610 | | 7,793,221 |
| Ser. 02-T16, Class A3, 7 1/2s, 2042 | | 17,148 | | 18,144 |
| Ser. 03-W2, Class 1A3, 7 1/2s, 2042 | | 9,004,644 | | 9,533,640 |
| Ser. 02-W6, Class 2A, 7 1/2s, 2042 | | 26,954 | | 28,483 |
| Ser. 02-W4, Class A5, 7 1/2s, 2042 | | 2,686,991 | | 2,840,838 |
| Ser. 02-W1, Class 2A, 7 1/2s, 2042 | | 213,832 | | 224,948 |
| Ser. 02-14, Class A2, 7 1/2s, 2042 | | 796,062 | | 841,202 |
| Ser. 01-T10, Class A2, 7 1/2s, 2041 | | 5,001,477 | | 5,275,386 |
| Ser. 02-T4, Class A3, 7 1/2s, 2041 | | 355,160 | | 374,618 |
| Ser. 01-T12, Class A2, 7 1/2s, 2041 | | 509,978 | | 538,139 |
| Ser. 01-T8, Class A1, 7 1/2s, 2041 | | 1,344,213 | | 1,415,749 |
| Ser. 01-T7, Class A1, 7 1/2s, 2041 | | 16,226,174 | | 17,069,981 |
| Ser. 01-T3, Class A1, 7 1/2s, 2040 | | 1,863,919 | | 1,962,503 |
| Ser. 01-T1, Class A1, 7 1/2s, 2040 | | 5,615,839 | | 5,925,946 |
| Ser. 99-T2, Class A1, 7 1/2s, 2039 | | 2,327,581 | | 2,463,355 |
| Ser. 03-W10, Class 1A1, 7 1/2s, 2032 | | 3,329,401 | | 3,516,538 |
| Ser. 02-T1, Class A3, 7 1/2s, 2031 | | 4,996,853 | | 5,275,748 |
| Ser. 00-T6, Class A1, 7 1/2s, 2030 | | 1,403,420 | | 1,476,402 |
| Ser. 02-W7, Class A5, 7 1/2s, 2029 | | 994,514 | | 1,051,933 |
| Ser. 01-T4, Class A1, 7 1/2s, 2028 | | 5,387,432 | | 5,723,658 |
| Ser. 02-W3, Class A5, 7 1/2s, 2028 | | 1,764,550 | | 1,864,607 |
| IFB Ser. 05-66, Class PS, 7.3s, 2035 | | 2,038,622 | | 1,968,697 |
| IFB Ser. 05-57, Class MN, 7.148s, 2035 | | 2,371,782 | | 2,395,411 |
| Ser. 02-26, Class A1, 7s, 2048 | | 3,587,435 | | 3,747,054 |
| Ser. 04-W12, Class 1A3, 7s, 2044 | | 2,413,470 | | 2,530,091 |
| Ser. 04-T3, Class 1A3, 7s, 2044 | | 1,713,213 | | 1,795,132 |
| Ser. 04-T2, Class 1A3, 7s, 2043 | | 1,416,581 | | 1,484,375 |
| Ser. 03-W3, Class 1A2, 7s, 2042 | | 1,427,270 | | 1,492,248 |
| Ser. 02-T16, Class A2, 7s, 2042 | | 9,863,088 | | 10,309,183 |
| Ser. 02-T19, Class A2, 7s, 2042 | | 7,139,865 | | 7,467,688 |
| Ser. 01-T10, Class A1, 7s, 2041 | | 2,791,034 | | 2,910,282 |
| Ser. 02-T4, Class A2, 7s, 2041 | | 6,500,642 | | 6,779,896 |
| Ser. 05-45, Class OX, IO (Interest only), 7s, 2035 | | 148,480 | | 27,019 |
| Ser. 04-W1, Class 2A2, 7s, 2033 | | 9,023,220 | | 9,451,913 |
| pass-through certificates Ser. 03-W8, Class 2A, 7s, 2042 | | 14,400,994 | | 15,069,029 |
| Ser. 318, Class 2, IO, 6s, 2032 | | 773,042 | | 154,661 |
| Ser. 350, Class 2, IO, 5 1/2s, 2034 | | 25,985,709 | | 5,529,146 |
| Ser. 338, Class 2, IO, 5 1/2s, 2033 | | 39,909,607 | | 8,609,336 |
| Ser. 333, Class 2, IO, 5 1/2s, 2033 | | 11,173,724 | | 2,413,076 |
| Ser. 329, Class 2, IO, 5 1/2s, 2033 | | 60,581,723 | | 12,862,702 |
| Ser. 03-45, Class PI, IO, 5 1/2s, 2029 | | 2,695,899 | | 271,275 |
| IFB Ser. 03-66, Class SA, IO, 3.82s, 2033 | | 3,802,111 | | 292,287 |
| IFB Ser. 04-51, Class S0, IO, 3.22s, 2034 | | 970,621 | | 56,102 |
| IFB Ser. 05-65, Class KI, IO, 3.17s, 2035 | | 1,531,022 | | 95,214 |
| IFB Ser. 05-89, Class S, IO, 3.06s, 2035 | | 26,507,000 | | 1,416,468 |
| IFB Ser. 05-87, Class SG, IO, 3.03s, 2035 | | 8,915,000 | | 526,542 |
| IFB Ser. 05-92, Class SC, IO, 2.99s, 2035 | | 8,915,000 | | 573,903 |
| IFB Ser. 05-83, Class SL, IO, 2.95s, 2035 | | 18,529,000 | | 1,066,743 |
34
| COLLATERALIZED MORTGAGE OBLIGATIONS (24.1%)* continued | | | | |
|
| | | Principal amount | | Value |
| |
| Fannie Mae | | | | |
| IFB Ser. 05-72, Class WS, IO, 2.92s, 2035 | $ | 2,538,346 | $ | 199,514 |
| IFB Ser. 05-82, Class SW, IO, 2.9s, 2035 | | 14,716,830 | | 774,933 |
| IFB Ser. 05-82, Class SY, IO, 2.9s, 2035 | | 18,727,022 | | 986,095 |
| IFB Ser. 05-45, Class EW, IO, 2.89s, 2035 | | 1,094,751 | | 61,719 |
| IFB Ser. 05-47, Class SW, IO, 2.89s, 2035 | | 9,776,387 | | 510,205 |
| IFB Ser. 04-72, Class BS, IO, 2.67s, 2034 | | 2,515,858 | | 118,748 |
| IFB Ser. 03-124, Class ST, IO, 2.67s, 2034 | | 2,766,988 | | 131,432 |
| IFB Ser. 05-67, Class BS, IO, 2.32s, 2035 | | 4,728,619 | | 205,399 |
| IFB Ser. 05-87, Class SE, IO, 2.3s, 2035 | | 35,482,000 | | 1,485,809 |
| IFB Ser. 05-74, Class SE, IO, 2.27s, 2035 | | 2,026,332 | | 77,570 |
| IFB Ser. 05-82, Class SI, IO, 2.27s, 2035 | | 15,652,255 | | 616,308 |
| IFB Ser. 05-74, Class NI, IO, 2 1/4s, 2035 | | 14,544,790 | | 782,363 |
| Ser. 352, Class 1, PO (Principal only), zero %, 2034 | | 316,242 | | 247,567 |
| Ser. 02-82, Class TO, PO, zero %, 2032 | | 2,243,000 | | 1,800,008 |
| Ser. 05-38, PO, zero %, 2031 | | 325,000 | | 242,938 |
| FRB Ser. 05-79, Class FE, zero %, 2035 | | 1,566,857 | | 1,638,651 |
| FRB Ser. 05-45, Class FG, zero %, 2035 | | 997,479 | | 1,049,244 |
| FRB Ser. 05-81, Class DF, zero %, 2033 | | 496,449 | | 515,376 |
| Federal Home Loan Mortgage Corp. Structured | | | | |
| Pass-Through Securities | | | | |
| Ser. T-59, Class 1A3, 7 1/2s, 2043 | | 10,041,864 | | 10,668,444 |
| Ser. T-58, Class 4A, 7 1/2s, 2043 | | 12,539,991 | | 13,250,132 |
| Ser. T-42, Class A5, 7 1/2s, 2042 | | 142,009 | | 149,976 |
| Ser. T-41, Class 3A, 7 1/2s, 2032 | | 1,969,901 | | 2,076,426 |
| Ser. T-60, Class 1A2, 7s, 2044 | | 6,494,272 | | 6,798,461 |
| Ser. T-59, Class 1A2, 7s, 2043 | | 5,988,279 | | 6,278,748 |
| Ser. T-55, Class 1A2, 7s, 2043 | | 3,606,264 | | 3,761,544 |
| Freddie Mac | | | | |
| IFB Ser. 3012, Class GP, 7.96s, 2035 | | 1,615,355 | | 1,629,892 |
| IFB Ser. 3012, Class UP, 7.956s, 2035 | | 148,884 | | 151,642 |
| IFB Ser. 3031, Class BS, 7 3/4s, 2027 | | 2,803,000 | | 2,737,460 |
| Ser. 2229, Class PD, 7 1/2s, 2030 | | 477,912 | | 510,321 |
| Ser. 2224, Class PD, 7 1/2s, 2030 | | 489,741 | | 522,952 |
| Ser. 2217, Class PD, 7 1/2s, 2030 | | 497,416 | | 531,147 |
| Ser. 2187, Class PH, 7 1/2s, 2029 | | 1,112,764 | | 1,188,223 |
| Ser. 1989, Class C, 7 1/2s, 2027 | | 163,061 | | 174,119 |
| Ser. 1990, Class D, 7 1/2s, 2027 | | 453,471 | | 484,222 |
| Ser. 1969, Class PF, 7 1/2s, 2027 | | 392,141 | | 418,733 |
| Ser. 1975, Class E, 7 1/2s, 2027 | | 103,839 | | 110,881 |
| Ser. 1943, Class M, 7 1/2s, 2027 | | 243,428 | | 259,936 |
| Ser. 1932, Class E, 7 1/2s, 2027 | | 338,165 | | 361,097 |
| Ser. 1938, Class E, 7 1/2s, 2027 | | 141,282 | | 150,863 |
| Ser. 1941, Class E, 7 1/2s, 2027 | | 114,655 | | 122,430 |
| Ser. 1924, Class H, 7 1/2s, 2027 | | 373,275 | | 398,587 |
| Ser. 1928, Class D, 7 1/2s, 2027 | | 144,691 | | 154,503 |
| Ser. 1915, Class C, 7 1/2s, 2026 | | 328,923 | | 351,228 |
| Ser. 1923, Class D, 7 1/2s, 2026 | | 390,972 | | 417,485 |
| Ser. 1904, Class D, 7 1/2s, 2026 | | 430,949 | | 460,173 |
| Ser. 1905, Class H, 7 1/2s, 2026 | | 376,839 | | 402,393 |
35
| COLLATERALIZED MORTGAGE OBLIGATIONS (24.1%)* continued | | | | |
|
| | | Principal amount | | Value |
| |
| Freddie Mac | | | | |
| Ser. 1890, Class H, 7 1/2s, 2026 | $ | 361,314 | $ | 385,816 |
| Ser. 1895, Class C, 7 1/2s, 2026 | | 190,467 | | 203,383 |
| Ser. 2256, Class UA, 7s, 2030 | | 145,406 | | 153,290 |
| Ser. 2208, Class PG, 7s, 2030 | | 1,272,775 | | 1,341,783 |
| Ser. 2211, Class PG, 7s, 2030 | | 717,810 | | 756,729 |
| Ser. 2198, Class PH, 7s, 2029 | | 1,052,241 | | 1,109,292 |
| Ser. 2054, Class H, 7s, 2028 | | 2,661,330 | | 2,805,624 |
| Ser. 2031, Class PG, 7s, 2028 | | 290,474 | | 306,223 |
| Ser. 2020, Class E, 7s, 2028 | | 1,468,764 | | 1,548,398 |
| Ser. 1998, Class PL, 7s, 2027 | | 625,334 | | 659,239 |
| Ser. 1999, Class PG, 7s, 2027 | | 1,024,514 | | 1,080,062 |
| Ser. 2004, Class BA, 7s, 2027 | | 602,771 | | 635,452 |
| Ser. 2005, Class C, 7s, 2027 | | 474,129 | | 499,835 |
| Ser. 2005, Class CE, 7s, 2027 | | 529,395 | | 558,098 |
| Ser. 2006, Class H, 7s, 2027 | | 1,514,890 | | 1,597,025 |
| Ser. 2006, Class T, 7s, 2027 | | 968,595 | | 1,021,111 |
| Ser. 1987, Class AP, 7s, 2027 | | 313,582 | | 330,584 |
| Ser. 1987, Class PT, 7s, 2027 | | 505,074 | | 532,459 |
| Ser. 1978, Class PG, 7s, 2027 | | 904,643 | | 953,692 |
| Ser. 1973, Class PJ, 7s, 2027 | | 1,079,775 | | 1,138,319 |
| Ser. 1725, Class D, 7s, 2024 | | 207,540 | | 218,792 |
| Ser. 2008, Class G, 7s, 2023 | | 78,288 | | 82,532 |
| Ser. 1750, Class C, 7s, 2023 | | 466,050 | | 491,319 |
| Ser. 1530, Class I, 7s, 2023 | | 495,207 | | 522,056 |
| Ser. 224, IO, 6s, 2033 | | 2,285,499 | | 460,590 |
| Ser. 226, IO, 5 1/2s, 2034 | | 10,243,529 | | 2,242,603 |
| Ser. 223, IO, 5 1/2s, 2032 | | 3,026,027 | | 622,199 |
| Ser. 3045, Class DI, IO, 5s, 2035 | | 928,200 | | 48,441 |
| IFB Ser. 3031, Class BI, IO, 3.1s, 2035 | | 1,955,000 | | 162,423 |
| IFB Ser. 3033, Class SF, IO, 3.097s, 2012 | | 3,021,000 | | 200,141 |
| IFB Ser. 2981, Class AS, IO, 2.952s, 2035 | | 6,273,392 | | 329,353 |
| IFB Ser. 2981, Class BS, IO, 2.952s, 2035 | | 3,456,019 | | 179,367 |
| IFB Ser. 2981, Class CS, IO, 2.952s, 2035 | | 4,239,075 | | 222,551 |
| IFB Ser. 3012, Class UI, IO, 2.652s, 2035 | | 3,872,606 | | 209,770 |
| IFB Ser. 2937, Class SY, IO, 2.332s, 2035 | | 2,227,477 | | 83,530 |
| IFB Ser. 3012, Class IG, IO, 2.312s, 2035 | | 14,081,517 | | 710,021 |
| IFB Ser. 2957, Class SW, IO, 2.232s, 2035 | | 13,033,035 | | 468,375 |
| Ser. 3045, Class DO, PO, zero %, 2035 | | 100,000 | | 79,563 |
| FRB Ser. 3046, Class UF, zero %, 2035 | | 1,159,000 | | 1,152,798 |
| FRB Ser. 3024, Class CW, zero %, 2035 | | 492,724 | | 490,742 |
| FRB Ser. 3022, Class TC, zero %, 2035 | | 524,925 | | 572,578 |
| FRB Ser. 2958, Class FL, zero %, 2035 | | 1,451,986 | | 1,404,694 |
| FRN Ser. 3030, Class CF, zero %, 2035 | | 1,052,000 | | 1,103,285 |
| Government National Mortgage Association | | | | |
| IFB Ser. 05-68, Class SP, 8.255s, 2035 | | 27,006,000 | | 25,717,349 |
| IFB Ser. 05-68, Class DP, 7.34s, 2035 | | 7,541,999 | | 7,484,610 |
| IFB Ser. 05-7, Class NP, 6.13s, 2033 | | 809,344 | | 788,971 |
| IFB Ser. 05-68, Class SI, IO, 2.66s, 2035 | | 32,716,000 | | 1,938,965 |
36
| COLLATERALIZED MORTGAGE OBLIGATIONS (24.1%)* continued | | | |
|
| | Principal amount | | Value |
| |
| Government National Mortgage Association | | | |
| IFB Ser. 05-65, Class SI, IO, 2.554s, 2035 | $ 14,720,898 | $ | 734,859 |
| IFB Ser. 05-51, Class SJ, IO, 2.404s, 2035 | 9,957,013 | | 519,632 |
| IFB Ser. 05-68, Class S, IO, 2.404s, 2029 | 19,742,000 | | 1,036,957 |
| IFB Ser. 05-60, Class SJ, IO, 2.052s, 2034 | 15,765,000 | | 655,233 |
|
| Total collateralized mortgage obligations (cost $376,593,729) | | $ | 369,051,283 |
|
| |
| |
| SHORT-TERM INVESTMENTS (58.4%)* | | | |
|
| | Principal amount | | Value |
| |
| Interest in $481,000,000 joint tri-party repurchase agreement | | | |
| dated September 30, 2005, with UBS Securities LLC MTG, due | | | |
| October 3, 2005, with respect to various U.S. Government | | | |
| obligations -- maturity value of $31,210,114 for an effective yield | | | |
| of 3.89% (collateralized by Freddie Mac and Fannie Mae with yields | | | |
| ranging from 4.00% to 11.50% and due dates ranging from May 1, | | | |
| 2006 to October 1, 2035, valued at $490,623,006) | $ 31,200,000 | $ | 31,200,000 |
| Interest in $475,000,000 joint tri-party repurchase agreement | | | |
| dated September 30, 2005, with Bank of America Securities LLC, | | | |
| due October 3, 2005, with respect to various U.S. Government | | | |
| obligations -- maturity value of $275,689,111 for an effective yield | | | |
| of 3.88% (collateralized by Freddie Mac and Fannie Mae with yields | | | |
| ranging from 3.78% to 6.00% and due dates ranging from July 1, | | | |
| 2025 to September 1, 2035, valued at $484,500,000) | 275,600,000 | | 275,600,000 |
| U.S. Treasury Bills 3.085%, November 3, 2005 # | 967,000 | | 964,266 |
| Federal Home Loan Banks, for an effective yield of 3.65%, | | | |
| October 19, 2005 | 430,000,000 | | 429,215,250 |
| Federal Home Loan Banks, for an effective yield of 3.58%, | | | |
| October 13, 2005 | 20,000,000 | | 19,976,134 |
| Federal Home Loan Banks, for an effective yield of 3.63%, | | | |
| October 12, 2005 | 89,000,000 | | 88,901,284 |
| Freddie Mac, for an effective yield of 3.63%, | | | |
| October 11, 2005 | 50,000,000 | | 49,949,583 |
|
| |
| Total short-term investments (cost $895,806,517) | | $ | 895,806,517 |
|
| |
| |
| TOTAL INVESTMENTS | | | |
| Total investments (cost $2,491,348,400) | | $ | 2,485,327,530 |
| |
| * Percentages indicated are based on net assets of $1,532,710,970. | | | |
# This security was pledged and segregated with the custodian to cover margin requirements for futures contracts at September 30, 2005.
At September 30, 2005, liquid assets totaling $916,403,295 have been designated as collateral for open forward commitments. TBA after the name of a security represents to be announced securities (Note 1).
The rates shown on Floating Rate Bonds (FRB) and Floating Rate Notes (FRN) are the current interest rates at September 30, 2005.
Inverse Floating Rate Bonds (IFB) are securities that pay interest rates that vary inversely to changes in the market interest rates. As interest rates rise, inverse floaters produce less income. The interest rates shown are the current interest rates at September 30, 2005.
| FUTURES CONTRACTS OUTSTANDING at 9/30/05 | | | |
|
| | | | | Unrealized |
| | Number of | | Expiration | appreciation/ |
| | contracts | Value | date | (depreciation) |
| |
| U.S. Treasury Bond (Long) | 298 | $ 34,093,063 | Dec-05 | $ (373,310) |
| U.S. Treasury Note 10 yr (Short) | 1,285 | 141,249,609 | Dec-05 | 1,530,484 |
| U.S. Treasury Note 5 yr (Long) | 12 | 1,282,313 | Dec-05 | (5,085) |
| U.S. Treasury Note 2 yr (Short) | 525 | 108,092,578 | Dec-05 | 290,627 |
|
| Total | | | | $1,442,716 |
|
| |
| |
| WRITTEN OPTIONS OUTSTANDING at 9/30/05 (premiums received $3,463,733) | | |
|
| | | Contract | Expiration date/ |
| | | amount | strike price | Value |
| |
| Option on an interest rate swap with JPMorgan Chase Bank, | | | |
| N.A. for the right to pay a fixed rate of 4.55% versus the | | | |
| three month LIBOR maturing on July 5, 2017. | | 44,780,000 | Jul-17 / $4.55 | $2,283,780 |
| Option on an interest rate swap with JPMorgan Chase Bank, | | | |
| N.A. for the right to pay a fixed rate of 4.55% versus the | | | |
| three month LIBOR maturing on July 5, 2017. | | 44,780,000 | Jul-17 / $4.55 | 1,074,720 |
|
| Total | | | | $3,358,500 |
|
| |
| |
| TBA SALE COMMITMENTS OUTSTANDING at 9/30/05 (proceeds receivable $64,884,081) | |
|
| | | Principal | Settlement | |
| | | amount | date | Value |
| |
| FHLMC, 6 1/2s, October 1, 2035 | | $ 1,010,000 | 10-13-05 | $ 1,038,012 |
| FNMA, 5 1/2s, October 1, 2035 | | 13,100,000 | 10-13-05 | 13,095,906 |
| GNMA, 5 1/2s, October 1, 2035 | | 50,000,000 | 10-20-05 | 50,460,940 |
|
| Total | | | | $64,594,858 |
38
| INTEREST RATE SWAP CONTRACTS OUTSTANDING at 9/30/05 | | |
|
| | | | Unrealized |
| | Notional | Termination | appreciation/ |
| | amount | date | (depreciation) |
| |
| Agreement with Citibank, N.A. dated June 24, 2005 to | | | |
| receive semi-annually the notional amount multiplied by | | | |
| 4.335% and pay quarterly the notional amount multiplied | | | |
| by the three month USD-LIBOR-BBA. | $116,000,000 | 6/28/15 | $(2,743,661) |
| Agreement with JPMorgan Chase Bank, N.A. dated July 29, | | | |
| 2005 to pay semi-annually the notional amount multiplied | | | |
| by 4.6757% and receive quarterly the notional amount | | | |
| multiplied by the three month USD-LIBOR. | 6,078,000 | 8/2/15 | (48,554) |
| Agreement with Lehman Brothers Special Financing, Inc. | | | |
| dated June 24, 2005 to receive semi-annually the notional | | | |
| amount multiplied by 4.3275% and pay quarterly the | | | |
| notional amount multiplied by the three month | | | |
| USD-LIBOR-BBA. | 58,000,000 | 6/28/15 | (1,401,250) |
| Agreement with Lehman Brothers Special Financing, Inc. | | | |
| dated June 27, 2005 to pay semi-annually the notional | | | |
| amount multiplied by 3.9334% and receive quarterly the | | | |
| notional amount multiplied by the three month | | | |
| USD-LIBOR-BBA. | 39,900,000 | 6/29/07 | 13,749 |
| Agreement with Lehman Brothers Special Financing, Inc. | | | |
| dated June 27, 2005 to pay semi-annually the notional | | | |
| amount multiplied by 4.3059% and receive quarterly the | | | |
| notional amount multiplied by the three month | | | |
| USD-LIBOR-BBA. | 7,300,000 | 6/29/15 | 187,726 |
|
| Total | | | $(3,991,990) |
The accompanying notes are an integral part of these financial statements.
39
| Statement of assets and liabilities 9/30/05 | | |
|
| |
| ASSETS | | |
| Investments in securities, at value (identified cost $2,184,548,400) (Note 1) | $ | 2,178,527,530 |
|
| Repurchase agreements (identified cost $306,800,000) | | 306,800,000 |
|
| Cash | | 641,686 |
|
| Interest and other receivables | | 6,422,027 |
|
| Receivable for shares of the fund sold | | 356,241 |
|
| Receivable for securities sold | | 47,220,796 |
|
| Receivable for sales of delayed delivery securities (Note 1) | | 65,055,425 |
|
| Unrealized appreciation on swap contracts (Note 1) | | 201,475 |
|
| Receivable for variation margin (Note 1) | | 426,733 |
|
| Total assets | | 2,605,651,913 |
|
| |
| LIABILITIES | | |
| Payable for securities purchased | | 11,164,362 |
|
| Payable for purchases of delayed delivery securities (Note 1) | | 982,654,705 |
|
| Payable for shares of the fund repurchased | | 3,308,715 |
|
| Payable for compensation of Manager (Note 2) | | 1,922,530 |
|
| Payable for investor servicing and custodian fees (Note 2) | | 358,942 |
|
| Payable for Trustee compensation and expenses (Note 2) | | 248,581 |
|
| Payable for administrative services (Note 2) | | 5,043 |
|
| Payable for distribution fees (Note 2) | | 1,011,498 |
|
| Written options outstanding, at value (premiums received $3,463,733) (Note 1) | | 3,358,500 |
|
| Unrealized depreciation on swap contracts (Note 1) | | 4,193,465 |
|
| TBA sales commitments, at value (proceeds receivable $64,884,081) (Note 1) | | 64,594,858 |
|
| Other accrued expenses | | 119,744 |
|
| Total liabilities | | 1,072,940,943 |
|
| Net assets | $ | 1,532,710,970 |
|
| |
| REPRESENTED BY | | |
| Paid-in capital (Unlimited shares authorized) (Notes 1 and 4) | $ | 1,563,909,231 |
|
| Undistributed net investment income (Note 1) | | 12,123,249 |
|
| Accumulated net realized loss on investments (Note 1) | | (35,145,822) |
|
| Net unrealized depreciation of investments | | (8,175,688) |
|
| Total -- Representing net assets applicable to capital shares outstanding | $ | 1,532,710,970 |
| |
| (Continued on next page) | | |
40
| Statement of assets and liabilities (Continued) | |
|
| |
| COMPUTATION OF NET ASSET VALUE AND OFFERING PRICE | |
| Net asset value and redemption price per class A share | |
| ($1,255,037,893 divided by 95,452,078 shares) | $13.15 |
|
| Offering price per class A share | |
| (100/96.25 of $13.15)* | $13.66 |
|
| Net asset value and offering price per class B share | |
| ($205,274,774 divided by 15,696,243 shares)** | $13.08 |
|
| Net asset value and offering price per class C share | |
| ($19,783,675 divided by 1,507,277 shares)** | $13.13 |
|
| Net asset value and redemption price per class M share | |
| ($39,845,086 divided by 3,033,689 shares) | $13.13 |
|
| Offering price per class M share | |
| (100/96.75 of $13.13)* | $13.57 |
|
| Net asset value, offering price and redemption price per class R share | |
| ($166,189 divided by 12,648 shares) | $13.14 |
|
| Net asset value, offering price and redemption price per class Y share | |
| ($12,603,353 divided by 960,432 shares) | $13.12 |
| * | On single retail sales of less than $50,000. On sales of $50,000 or more and on group sales, the offering price is reduced. |
| |
| ** | Redemption price per share is equal to net asset value less any applicable contingent deferred sales charge. |
| |
The accompanying notes are an integral part of these financial statements.
41
| Statement of operations Year ended 9/30/05 | | |
|
| |
| INTEREST INCOME | $ | 62,861,343 |
|
| |
| EXPENSES | | |
| Compensation of Manager (Note 2) | | 8,049,862 |
|
| Investor servicing fees (Note 2) | | 2,374,064 |
|
| Custodian fees (Note 2) | | 803,336 |
|
| Trustee compensation and expenses (Note 2) | | 61,240 |
|
| Administrative services (Note 2) | | 49,850 |
|
| Distribution fees -- Class A (Note 2) | | 3,366,108 |
|
| Distribution fees -- Class B (Note 2) | | 2,489,462 |
|
| Distribution fees -- Class C (Note 2) | | 227,979 |
|
| Distribution fees -- Class M (Note 2) | | 228,646 |
|
| Distribution fees -- Class R (Note 2) | | 494 |
|
| Non-recurring costs (Notes 2 and 5) | | 20,969 |
|
| Costs assumed by Manager (Notes 2 and 5) | | (20,969) |
|
| Other | | 310,267 |
|
| Total expenses | | 17,961,308 |
|
| Expense reduction (Note 2) | | (555,153) |
|
| Net expenses | | 17,406,155 |
|
| Net investment income | | 45,455,188 |
|
| Net realized gain on investments (Notes 1 and 3) | | 31,681,805 |
|
| Net realized loss on futures contracts (Note 1) | | (3,454,534) |
|
| Net realized loss on swap contracts (Note 1) | | (1,126,843) |
|
| Net realized gain on written options (Notes 1 and 3) | | 92,506 |
|
| Net increase from payments by affiliates (Note 2) | | 209,795 |
|
| Net unrealized depreciation of investments, futures | | |
| contracts, swap contracts, written options, and TBA sale | | |
| commitments during the year | | (34,274,339) |
|
| Net loss on investments | | (6,871,610) |
|
| Net increase in net assets resulting from operations | $ | 38,583,578 |
The accompanying notes are an integral part of these financial statements.
42
| Statement of changes in net assets | |
|
| |
| DECREASE IN NET ASSETS | | |
|
| | Year ended | Year ended |
| | 9/30/05 | 9/30/04 |
| Operations: | | |
| Net investment income | $ 45,455,188 | $ 65,690,990 |
|
| Net realized gain on investments | 27,402,729 | 9,880,551 |
|
| Net unrealized depreciation of investments | (34,274,339) | (23,919,353) |
|
| Net increase in net assets resulting from operations | 38,583,578 | 51,652,188 |
|
| Distributions to shareholders: (Note 1) | | |
|
| From net investment income | | |
|
| Class A | (41,530,313) | (39,396,084) |
|
| Class B | (5,793,230) | (6,241,917) |
|
| Class C | (526,743) | (556,126) |
|
| Class M | (1,289,095) | (1,259,734) |
|
| Class R | (2,820) | (49) |
|
| Class Y | (533,749) | (1,151,865) |
|
| Redemption fees (Note 1) | 8,222 | 1,795 |
|
| Decrease from capital share transactions (Note 4) | (298,319,566) | (891,633,786) |
|
| Total decrease in net assets | (309,403,716) | (888,585,578) |
|
| |
| NET ASSETS | | |
| Beginning of year | 1,842,114,686 | 2,730,700,264 |
|
| End of year (including undistributed net investment | | |
| income of $12,123,249 and $17,470,854, respectively) | $1,532,710,970 | $1,842,114,686 |
The accompanying notes are an integral part of these financial statements.
43
Financial highlights (For a common share outstanding throughout the period)
| CLASS A | | | | | |
|
| PER-SHARE OPERATING PERFORMANCE | | | | |
|
| | | | Year ended | | |
|
| | 9/30/05 | 9/30/04 | 9/30/03 | 9/30/02 | 9/30/01 |
| Net asset value, | | | | | |
| beginning of period | $13.24 | $13.20 | $13.22 | $13.10 | $12.55 |
|
| Investment operations: | | | | | |
| Net investment income (a) | .37 | .42 | .28 | .62 | .75 |
|
| Net realized and unrealized | | | | | |
| gain (loss) on investments | (.05) | (.06) | .05 | .19 | .56 |
|
| Total from | | | | | |
| investment operations | .32 | .36 | .33 | .81 | 1.31 |
|
| Less distributions: | | | | | |
| From net investment income | (.41) | (.32) | (.35) | (.69) | (.76) |
|
| Total distributions | (.41) | (.32) | (.35) | (.69) | (.76) |
|
| Redemption fees | --(d) | --(d) | -- | -- | -- |
|
| Net asset value, | | | | | |
| end of period | $13.15 | $13.24 | $13.20 | $13.22 | $13.10 |
|
| Total return at | | | | | |
| net asset value (%)(b) | 2.43 | 2.81 | 2.52 | 6.41 | 10.74 |
|
| |
| RATIOS AND SUPPLEMENTAL DATA | | | | | |
| Net assets, end of period | | | | | |
| (in thousands) | $1,255,038 | $1,441,252 | $2,022,134 | $2,432,891 | $2,256,218 |
|
| Ratio of expenses to | | | | | |
| average net assets (%)(c) | .94 | .94 | .88 | .85 | .86 |
|
| Ratio of net investment income | | | | | |
| to average net assets (%) | 2.83 | 3.24 | 2.12 | 4.74 | 5.87 |
|
| Portfolio turnover (%) | 781.82(e) | 198.47(e) | 331.95(f ) | 277.25(f ) | 156.53(f ) |
| (a) | Per share net investment income has been determined on the basis of the weighted average number of shares outstanding during the period. |
| |
| (b) | Total return assumes dividend reinvestment and does not reflect the effect of sales charges. |
| |
| (c) | Includes amounts paid through expense offset arrangements (Note 2). |
| |
| (d) | Amount represents less than $0.01 per share. |
| |
| (e) | Portfolio turnover excludes dollar roll transactions. |
| |
| (f) | Portfolio turnover excludes certain treasury note transactions executed in connection with a short-term trading strategy. |
| |
The accompanying notes are an integral part of these financial statements.
44
Financial highlights (For a common share outstanding throughout the period)
| CLASS B | | | | | |
|
| PER-SHARE OPERATING PERFORMANCE | | | | |
|
| | | | Year ended | | |
|
| | 9/30/05 | 9/30/04 | 9/30/03 | 9/30/02 | 9/30/01 |
| Net asset value, | | | | | |
| beginning of period | $13.17 | $13.12 | $13.15 | $13.04 | $12.49 |
|
| Investment operations: | | | | | |
| Net investment income (a) | .27 | .32 | .18 | .51 | .65 |
|
| Net realized and unrealized | | | | | |
| gain (loss) on investments | (.05) | (.05) | .04 | .20 | .56 |
|
| Total from | | | | | |
| investment operations | .22 | .27 | .22 | .71 | 1.21 |
|
| Less distributions: | | | | | |
| From net investment income | (.31) | (.22) | (.25) | (.60) | (.66) |
|
| Total distributions | (.31) | (.22) | (.25) | (.60) | (.66) |
|
| Redemption fees | --(d) | --(d) | -- | -- | -- |
|
| Net asset value, | | | | | |
| end of period | $13.08 | $13.17 | $13.12 | $13.15 | $13.04 |
|
| Total return at | | | | | |
| net asset value (%)(b) | 1.64 | 2.12 | 1.67 | 5.59 | 9.98 |
|
| |
| RATIOS AND SUPPLEMENTAL DATA | | | | | |
| Net assets, end of period | | | | | |
| (in thousands) | $205,275 | $297,159 | $529,386 | $691,467 | $500,366 |
|
| Ratio of expenses to | | | | | |
| average net assets (%)(c) | 1.69 | 1.69 | 1.63 | 1.60 | 1.61 |
|
| Ratio of net investment income | | | | | |
| to average net assets (%) | 2.07 | 2.46 | 1.38 | 3.96 | 5.15 |
|
| Portfolio turnover (%) | 781.82(e) | 198.47(e) | 331.95(f ) | 277.25(f ) | 156.53(f ) |
| (a) | Per share net investment income has been determined on the basis of the weighted average number of shares outstanding during the period. |
| |
| (b) | Total return assumes dividend reinvestment and does not reflect the effect of sales charges. |
| |
| (c) | Includes amounts paid through expense offset arrangements (Note 2). |
| |
| (d) | Amount represents less than $0.01 per share. |
| |
| (e) | Portfolio turnover excludes dollar roll transactions. |
| |
| (f) | Portfolio turnover excludes certain treasury note transactions executed in connection with a short-term trading strategy. |
| |
The accompanying notes are an integral part of these financial statements.
45
Financial highlights (For a common share outstanding throughout the period)
| CLASS C | | | | | |
|
| PER-SHARE OPERATING PERFORMANCE | | | | | |
|
| | | | Year ended | | |
|
| | 9/30/05 | 9/30/04 | 9/30/03 | 9/30/02 | 9/30/01 |
| Net asset value, | | | | | |
| beginning of period | $13.22 | $13.17 | $13.20 | $13.08 | $12.53 |
|
| Investment operations: | | | | | |
| Net investment income (a) | .27 | .32 | .18 | .50 | .64 |
|
| Net realized and unrealized | | | | | |
| gain (loss) on investments | (.05) | (.05) | .04 | .21 | .58 |
|
| Total from | | | | | |
| investment operations | .22 | .27 | .22 | .71 | 1.22 |
|
| Less distributions: | | | | | |
| From net investment income | (.31) | (.22) | (.25) | (.59) | (.67) |
|
| Total distributions | (.31) | (.22) | (.25) | (.59) | (.67) |
|
| Redemption fees | --(d) | --(d) | -- | -- | -- |
|
| Net asset value, | | | | | |
| end of period | $13.13 | $13.22 | $13.17 | $13.20 | $13.08 |
|
| Total return at | | | | | |
| net asset value (%)(b) | 1.64 | 2.08 | 1.70 | 5.64 | 9.99 |
|
| |
| RATIOS AND SUPPLEMENTAL DATA | | | | | |
| Net assets, end of period | | | | | |
| (in thousands) | $19,784 | $26,181 | $53,235 | $54,880 | $27,512 |
|
| Ratio of expenses to | | | | | |
| average net assets (%)(c) | 1.69 | 1.69 | 1.63 | 1.60 | 1.61 |
|
| Ratio of net investment income | | | | | |
| to average net assets (%) | 2.08 | 2.44 | 1.34 | 3.93 | 5.07 |
|
| Portfolio turnover (%) | 781.82(e) | 198.47(e) | 331.95(f ) | 277.25(f ) | 156.53(f ) |
| (a) | Per share net investment income has been determined on the basis of the weighted average number of shares outstanding during the period. |
| |
| (b) | Total return assumes dividend reinvestment and does not reflect the effect of sales charges. |
| |
| (c) | Includes amounts paid through expense offset arrangements (Note 2). |
| |
| (d) | Amount represents less than $0.01 per share. |
| |
| (e) | Portfolio turnover excludes dollar roll transactions. |
| |
| (f) | Portfolio turnover excludes certain treasury note transactions executed in connection with a short-term trading strategy. |
| |
The accompanying notes are an integral part of these financial statements.
46
Financial highlights (For a common share outstanding throughout the period)
| CLASS M | | | | | |
|
| PER-SHARE OPERATING PERFORMANCE | | | | | |
|
| | | | Year ended | | |
|
| | 9/30/05 | 9/30/04 | 9/30/03 | 9/30/02 | 9/30/01 |
| Net asset value, | | | | | |
| beginning of period | $13.23 | $13.18 | $13.20 | $13.08 | $12.52 |
|
| Investment operations: | | | | | |
| Net investment income (a) | .34 | .39 | .27 | .57 | .71 |
|
| Net realized and unrealized | | | | | |
| gain (loss) on investments | (.07) | (.05) | .02 | .21 | .57 |
|
| Total from | | | | | |
| investment operations | .27 | .34 | .29 | .78 | 1.28 |
|
| Less distributions: | | | | | |
| From net investment income | (.37) | (.29) | (.31) | (.66) | (.72) |
|
| Total distributions | (.37) | (.29) | (.31) | (.66) | (.72) |
|
| Redemption fees | --(d) | --(d) | -- | -- | -- |
|
| Net asset value, | | | | | |
| end of period | $13.13 | $13.23 | $13.18 | $13.20 | $13.08 |
|
| Total return at | | | | | |
| net asset value (%)(b) | 2.08 | 2.61 | 2.25 | 6.14 | 10.56 |
|
| |
| RATIOS AND SUPPLEMENTAL DATA | | | | | |
| Net assets, end of period | | | | | |
| (in thousands) | $39,845 | $50,649 | $73,355 | $171,975 | $144,285 |
|
| Ratio of expenses to | | | | | |
| average net assets (%)(c) | 1.19 | 1.19 | 1.13 | 1.10 | 1.11 |
|
| Ratio of net investment income | | | | | |
| to average net assets (%) | 2.58 | 2.99 | 2.03 | 4.47 | 5.60 |
|
| Portfolio turnover (%) | 781.82(e) | 198.47(e) | 331.95(f ) | 277.25(f ) | 156.53(f ) |
| (a) | Per share net investment income has been determined on the basis of the weighted average number of shares outstanding during the period. |
| |
| (b) | Total return assumes dividend reinvestment and does not reflect the effect of sales charges. |
| |
| (c) | Includes amounts paid through expense offset arrangements (Note 2). |
| |
| (d) | Amount represents less than $0.01 per share. |
| |
| (e) | Portfolio turnover excludes dollar roll transactions. |
| |
| (f) | Portfolio turnover excludes certain treasury note transactions executed in connection with a short-term trading strategy. |
| |
The accompanying notes are an integral part of these financial statements.
47
Financial highlights (For a common share outstanding throughout the period)
| CLASS R | | | |
|
| | PER-SHARE OPERATING PERFORMANCE | | |
|
| | | Year ended | Year ended | Period |
| | | 9/30/05 | 9/30/04 | 1/21/03†-9/30/03 |
| | Net asset value, | | | |
| | beginning of period | $13.24 | $13.20 | $13.22 |
|
| | Investment operations: | | | |
| | Net investment income (a) | .35 | .39 | .18 |
|
| | Net realized and unrealized | | | |
| | loss on investments | (.07) | (.06) | (.02) |
|
| | Total from | | | |
| | investment operations | .28 | .33 | .16 |
|
| | Less distributions: | | | |
| | From net investment income | (.38) | (.29) | (.18) |
|
| | Total distributions | (.38) | (.29) | (.18) |
|
| | Redemption fees | --(d) | --(d) | -- |
|
| | Net asset value, | | | |
| | end of period | $13.14 | $13.24 | $13.20 |
|
| | Total return at | | | |
| | net asset value (%)(b) | 2.14 | 2.54 | 1.23* |
|
| |
| | RATIOS AND SUPPLEMENTAL DATA | | | |
| | Net assets, end of period | | | |
| | (in thousands) | $166 | $44 | $1 |
|
| | Ratio of expenses to | | | |
| | average net assets (%)(c) | 1.19 | 1.19 | .78* |
|
| | Ratio of net investment income | | | |
| | to average net assets (%) | 2.60 | 2.98 | 1.30* |
|
| | Portfolio turnover (%) | 781.82(e) | 198.47(e) | 331.95(f ) |
| |
| † | Commencement of operations. | | | |
| | | | |
| * | Not annualized. | | | |
| (a) | Per share net investment income has been determined on the basis of the weighted average number of shares outstanding during the period. |
| |
| (b) | Total return assumes dividend reinvestment and does not reflect the effect of sales charges. |
| |
| (c) | Includes amounts paid through expense offset arrangements (Note 2). |
| |
| (d) | Amount represents less than $0.01 per share. |
| |
| |
| (e) | Portfolio turnover excludes dollar roll transactions. |
| |
| (f) | Portfolio turnover excludes certain treasury roll transactions executed in connection with a short-term trading strategy. |
| |
The accompanying notes are an integral part of these financial statements.
48
Financial highlights (For a common share outstanding throughout the period)
| CLASS Y | | | | | |
|
| PER-SHARE OPERATING PERFORMANCE | | | | | |
|
| | | | Year ended | | |
|
| | 9/30/05 | 9/30/04 | 9/30/03 | 9/30/02 | 9/30/01 |
| Net asset value, | | | | | |
| beginning of period | $13.22 | $13.18 | $13.21 | $13.09 | $12.54 |
|
| Investment operations: | | | | | |
| Net investment income (a) | .40 | .46 | .31 | .62 | .78 |
|
| Net realized and unrealized | | | | | |
| gain (loss) on investments | (.06) | (.06) | .04 | .23 | .56 |
|
| Total from | | | | | |
| investment operations | .34 | .40 | .35 | .85 | 1.34 |
|
| Less distributions: | | | | | |
| From net investment income | (.44) | (.36) | (.38) | (.73) | (.79) |
|
| Total distributions | (.44) | (.36) | (.38) | (.73) | (.79) |
|
| Redemption fees | --(d) | --(d) | -- | -- | -- |
|
| Net asset value, | | | | | |
| end of period | $13.12 | $13.22 | $13.18 | $13.21 | $13.09 |
|
| Total return at | | | | | |
| net asset value (%)(b) | 2.64 | 3.09 | 2.73 | 6.71 | 11.05 |
|
| |
| RATIOS AND SUPPLEMENTAL DATA | | | | | |
| Net assets, end of period | | | | | |
| (in thousands) | $12,603 | $26,829 | $52,590 | $70,445 | $43,306 |
|
| Ratio of expenses to | | | | | |
| average net assets (%)(c) | .69 | .69 | .63 | .60 | .61 |
|
| Ratio of net investment income | | | | | |
| to average net assets (%) | 3.05 | 3.45 | 2.39 | 4.92 | 6.11 |
|
| Portfolio turnover (%) | 781.82(e) | 198.47(e) | 331.95(f ) | 277.25(f ) | 156.53(f ) |
| (a) | Per share net investment income has been determined on the basis of the weighted average number of shares outstanding during the period. |
| |
| (b) | Total return assumes dividend reinvestment and does not reflect the effect of sales charges. |
| |
| (c) | Includes amounts paid through expense offset arrangements (Note 2). |
| |
| (d) | Amount represents less than $0.01 per share. |
| |
| (e) | Portfolio turnover excludes dollar roll transactions. |
| |
| (f) | Portfolio turnover excludes certain treasury note transactions executed in connection with a short-term trading strategy. |
| |
The accompanying notes are an integral part of these financial statements.
49
Notes to financial statements 9/30/05
Note 1: Significant accounting policies
Putnam U.S. Government Income Trust (the “fund”), a Massachusetts business trust, which is registered under the Investment Company Act of 1940, as amended, as a diversified, open-end management investment company. The fund’s investment objective is to seek as high a level of current income as is consistent with preservation of capital by investing mainly in securities which have short to long-term maturities and are backed by the full faith and credit of the United States or by the credit of the issuing U.S. government agency.
The fund offers class A, class B, class C, class M, class R and class Y shares. Class A and class M shares are sold with a maximum front-end sales charge of 3.75% and 3.25%, respectively, and generally do not pay a contingent deferred sales charge. Prior to April 1, 2005, the maximum front-end sales charge for class A shares was 4.50% . Class B shares, which convert to class A shares after approximately eight years, do not pay a front-end sales charge and are subject to a contingent deferred sales charge, if those shares are redeemed within eight years of purchase. Class C shares are subject to the same fees as class B shares, except that class C shares have a one-year 1.00% contingent deferred sales charge and do not convert to class A shares. Class R shares, which are offered to qualified employee-benefit plans are sold without a front-end sales charge or a contingent deferred sales charge. The expenses for class A, class B, class C, class M and class R shares may differ based on the distribution fee of each class, which is identified in Note 2. Class Y shares, which are sold at net asset value, are generally subject to the same expenses as class A, class B, class C, class M and class R shares, but do not bear a distribution fee. Class Y shares are sold to certain eligible purchasers including certain defined contribution plans (including corporate IRAs), bank trust departments and trust companies.
A 2.00% redemption fee may apply to any shares that are redeemed (either by selling or exchanging into another fund) within 5 days of purchase. The redemption fee is accounted for as an addition to paid-in-capital.
Investment income, realized and unrealized gains and losses and expenses of the fund are borne pro-rata based on the relative net assets of each class to the total net assets of the fund, except that each class bears expenses unique to that class (including the distribution fees applicable to such classes). Each class votes as a class only with respect to its own distribution plan or other matters on which a class vote is required by law or determined by the Trustees. Shares of each class would receive their pro-rata share of the net assets of the fund, if the fund were liquidated. In addition, the Trustees declare separate dividends on each class of shares.
In the normal course of business, the fund enters into contracts that may include agreements to indemnify another party under given circumstances. The fund’s maximum exposure under these arrangements is unknown as this would involve future claims that may be, but have not yet been, made against the fund. However, the fund expects the risk of material loss to be remote.
The following is a summary of significant accounting policies consistently followed by the fund in the preparation of its financial statements. The preparation of financial statements is in conformity with accounting principles generally accepted in the United States of America and requires management to make estimates and assumptions that affect the reported amounts of assets and liabilities in the financial statements and the reported amounts of increases and decreases in net assets from operations during the reporting period. Actual results could differ from those estimates.
A) Security valuation Investments, including mortgage backed securities, are valued on the basis of valuations provided by an independent pricing service, approved by the Trustees. Such service providers use information with respect to transactions in bonds, quotations from bond dealers, market transactions in comparable securities and
50
various relationships between securities in determining value. Restricted securities are valued at fair value following procedures approved by the Trustees. Such valuations and procedures are reviewed periodically by the Trustees. Short-term investments having remaining maturities of 60 days or less are valued at amortized cost, which approximates fair value.
B) Joint trading account Pursuant to an exemptive order from the Securities and Exchange Commission, the fund may transfer uninvested cash balances, including cash collateral received under security lending arrangements, into a joint trading account along with the cash of other registered investment companies and certain other accounts managed by Putnam Investment Management, LLC (“Putnam Management”), the fund’s manager, an indirect wholly-owned subsidiary of Putnam, LLC. These balances may be invested in issues of high-grade short-term investments having maturities of up to 397 days for collateral received under security lending arrangements and up to 90 days for other cash investments.
C) Repurchase agreements The fund, or any joint trading account, through its custodian, receives delivery of the underlying securities, the market value of which at the time of purchase is required to be in an amount at least equal to the resale price, including accrued interest. Collateral for certain tri-party repurchase agreements is held at the counterparty’s custodian in a segregated account for the benefit of the fund and the coun-terparty. Putnam Management is responsible for determining that the value of these underlying securities is at all times at least equal to the resale price, including accrued interest.
D) Security transactions and related investment income Security transactions are recorded on the trade date (date the order to buy or sell is executed). Gains or losses on securities sold are determined on the identified cost basis. Interest income is recorded on the accrual basis. All premiums/discounts are amortized/accreted on a yield-to-maturity basis.
Securities purchased or sold on a forward commitment or delayed delivery basis may be settled a month or more after the trade date; interest income is accrued based on the terms of the securities. Losses may arise due to changes in the market value of the underlying securities or if the counterparty does not perform under the contract.
E) Stripped mortgage-backed securities The fund may invest in stripped mortgage-backed securities which represent a participation in mortgage loans and may be structured in classes with rights to receive different portions of the interest and principal. Interest-only securities receive all of the interest and principal-only securities receive all of the principal. If the interest-only securities experience greater than anticipated prepayments of principal, the fund may fail to recoup fully its initial investment in these securities. Conversely, principal-only securities increase in value if prepayments are greater than anticipated and decline if prepayments are slower than anticipated. The market value of these securities is highly sensitive to changes in interest rates.
F) Futures and options contracts The fund may use futures and options contracts to hedge against changes in the values of securities the fund owns or expects to purchase. The fund may also write options on swaps or securities it owns or in which it may invest to increase its current returns.
The potential risk to the fund is that the change in value of futures and options contracts may not correspond to the change in value of the hedged instruments. In addition, losses may arise from changes in the value of the underlying instruments, if there is an illiquid secondary market for the contracts, or if the counterparty to the contract is unable to perform. Risks may exceed amounts recognized on the statement of assets and liabilities. When the contract is closed, the fund records a realized gain or loss equal to the difference between the value of the contract at the time it was opened and the value at the time it was closed. Realized gains and losses on
51
purchased options are included in realized gains and losses on investment securities. If a written call option is exercised, the premium originally received is recorded as an addition to sales proceeds. If a written put option is exercised, the premium originally received is recorded as a reduction to the cost of investments.
Futures contracts are valued at the quoted daily settlement prices established by the exchange on which they trade. The fund and the broker agree to exchange an amount of cash equal to the daily fluctuation in the value of the futures contract. Such receipts or payments are known as “variation margin.” Exchange traded options are valued at the last sale price, or if no sales are reported, the last bid price for purchased options and the last ask price for written options. Options traded over-the-counter are valued using prices supplied by dealers. Futures and written option contracts outstanding at period end, if any, are listed after the fund’s portfolio.
G) Interest rate swap contracts The fund may enter into interest rate swap contracts, which are arrangements between two parties to exchange cash flows based on a notional principal amount, to manage the fund’s exposure to interest rates. Interest rate swap contracts are marked to market daily based upon quotations from market makers and the change, if any, is recorded as unrealized gain or loss. Payments received or made are recorded as realized gains or loss. The fund could be exposed to credit or market risk due to unfavorable changes in the fluctuation of interest rates or if the counterparty defaults on its obligation to perform. Risk of loss may exceed amounts recognized on the statement of assets and liabilities. Interest rate swap contracts outstanding at period end, if any, are listed after the fund’s portfolio.
H) TBA purchase commitments The fund may enter into “TBA” (to be announced) commitments to purchase securities for a fixed unit price at a future date beyond customary settlement time. Although the unit price has been established, the principal value has not been finalized. However, the amount of the commitments will not significantly differ from the principal amount. The fund holds, and maintains until settlement date, cash or high-grade debt obligations in an amount sufficient to meet the purchase price, or the fund may enter into offsetting contracts for the forward sale of other securities it owns. Income on the securities will not be earned until settlement date. TBA purchase commitments may be considered securities themselves, and involve a risk of loss if the value of the security to be purchased declines prior to the settlement date, which risk is in addition to the risk of decline in the value of the fund’s other assets. Unsettled TBA purchase commitments are valued at fair value of the underlying securities, according to the procedures described under “Security valuation” above. The contract is “marked-to-market” daily and the change in market value is recorded by the fund as an unrealized gain or loss.
Although the fund will generally enter into TBA purchase commitments with the intention of acquiring securities for its portfolio or for delivery pursuant to options contracts it has entered into, the fund may dispose of a commitment prior to settlement if Putnam Management deems it appropriate to do so.
I) TBA sale commitments The fund may enter into TBA sale commitments to hedge its portfolio positions or to sell mortgage-backed securities it owns under delayed delivery arrangements. Proceeds of TBA sale commitments are not received until the contractual settlement date. During the time a TBA sale commitment is outstanding, equivalent deliverable securities or an offsetting TBA purchase commitment deliverable on or before the sale commitment date, are held as “cover” for the transaction.
Unsettled TBA sale commitments are valued at fair value of the underlying securities, generally according to the procedures described under “Security valuation” above. The contract is “marked-to-market” daily and the change in market value is recorded by the fund as an unrealized gain or loss. If
52
the TBA sale commitment is closed through the acquisition of an offsetting purchase commitment, the fund realizes a gain or loss. If the fund delivers securities under the commitment, the fund realizes a gain or a loss from the sale of the securities based upon the unit price established at the date the commitment was entered into. TBA sale commitments outstanding at period end, if any, are listed after the fund’s portfolio.
J) Dollar rolls To enhance returns, the fund may enter into dollar rolls (principally using TBAs) in which the fund sells securities for delivery in the current month and simultaneously contracts to purchase similar securities on a specified future date. During the period between the sale and subsequent purchase, the fund will not be entitled to receive income and principal payments on the securities sold. The fund will, however, retain the difference between the initial sales price and the forward price for the future purchase. The fund will also be able to earn interest on the cash proceeds that are received from the initial sale. The fund may be exposed to market or credit risk if the price of the security changes unfavorably or the counterparty fails to perform under the terms of the agreement.
K) Federal taxes It is the policy of the fund to distribute all of its taxable income within the prescribed time and otherwise comply with the provisions of the Internal Revenue Code of 1986 (the “Code”) applicable to regulated investment companies. It is also the intention of the fund to distribute an amount sufficient to avoid imposition of any excise tax under Section 4982 of the Code, as amended. Therefore, no provision has been made for federal taxes on income, capital gains or unrealized appreciation on securities held nor for excise tax on income and capital gains.
At September 30, 2005, the fund had a capital loss carryover of $25,817,289 available to the extent allowed by the Code to offset future net capital gain, if any. This capital loss carryover will expire on September 30, 2009.
Pursuant to federal income tax regulations applicable to regulated investment companies, the fund has elected to defer to its fiscal year ending September 30, 2006 $7,851,681 of losses recognized during the period November 1, 2004 to September 30, 2005.
L) Distributions to shareholders Distributions to shareholders from net investment income are recorded by the fund on the ex-dividend date. Distributions from capital gains, if any, are recorded on the ex-dividend date and paid at least annually. The amount and character of income and gains to be distributed are determined in accordance with income tax regulations, which may differ from generally accepted accounting principles. These differences include temporary and permanent differences of losses on wash sale transactions, post-October loss deferrals, unrealized and realized gains and losses on certain futures contracts and income on swap contracts. Reclassifications are made to the fund’s capital accounts to reflect income and gains available for distribution (or available capital loss carryovers) under income tax regulations. For the year ended September 30, 2005, the fund reclassified $1,126,843 to decrease undistributed net investment income and a decrease to accumulated net realized losses of $1,126,843.
The tax basis components of distributable earnings and the federal tax cost as of period end were as follows:
| Unrealized appreciation | $ 8,376,790 |
| Unrealized depreciation | (14,431,722) |
| | ------------------------------ |
| Net unrealized depreciation | (6,054,932) |
| Undistributed ordinary income | 13,540,261 |
| Capital loss carryforward | (25,817,289) |
| Post-October loss | (7,851,681) |
| Cost for federal income | |
| tax purposes | $2,491,382,462 |
Note 2: Management fee, administrative services and other transactions
Putnam Management is paid for management and investment advisory services quarterly based on the average net assets of the fund. Such fee is
53
based on the following annual rates: 0.57% of the first $500 million of average net assets, 0.475% of the next $500 million, 0.4275% of the next $500 million and 0.38% thereafter.
Putnam Management has agreed to waive fees and reimburse expenses of the fund through September 30, 2006 to the extent necessary to ensure that the fund’s expenses do not exceed the simple average of the expenses of all front-end load funds viewed by Lipper Inc. as having the same investment classification or objective as the fund. The expense reimbursement is based on a comparison of the fund’s expenses with the average annualized operating expenses of the funds in its Lipper peer group for each calendar quarter during the fund’s last fiscal year, excluding 12b-1 fees and without giving effect to any expense offset and brokerage service arrangements that may reduce fund expenses. For the year ended September 30, 2005, Putnam Management did not waive any of its management fee from the fund.
During the year ended September 30, 2005, Putnam Management voluntarily reimbursed the fund $209,795 for net realized losses incurred from the sale of investment securities that violated the fund’s investment restrictions. The effect of the losses incurred and the reimbursal by Putnam Management of such losses had no effect on total return.
For the period ended September 30, 2005, Putnam Management has assumed $20,969 of legal, shareholder servicing and communication, audit and Trustee fees incurred by the fund in connection with certain legal and regulatory matters (including those described in Note 5).
The fund reimburses Putnam Management an allocated amount for the compensation and related expenses of certain officers of the fund and their staff who provide administrative services to the fund. The aggregate amount of all such reimbursements is determined annually by the Trustees.
Custodial functions for the fund’s assets are provided by Putnam Fiduciary Trust Company (“PFTC”), a subsidiary of Putnam, LLC. PFTC receives fees for custody services based on the fund’s asset level, the number of its security holdings and transaction volumes. Putnam Investor Services, a division of PFTC, provides investor servicing agent functions to the fund. Putnam Investor Services receives fees for investor servicing based on the number of shareholder accounts in the fund and the level of defined contribution plan assets in the fund. During the year ended September 30, 2005, the fund paid PFTC $3,176,365 for these services.
The fund has entered into an arrangement with PFTC whereby credits realized as a result of uninvested cash balances are used to reduce a portion of the fund’s expenses. For the year ended September 30, 2005, the fund’s expenses were reduced by $555,153 under these arrangements.
Each independent Trustee of the fund receives an annual Trustee fee, of which $497, as a quarterly retainer, has been allocated to the fund, and an additional fee for each Trustees meeting attended. Trustees receive additional fees for attendance at certain committee meetings. George Putnam III, who is not an independent Trustee, also receives the foregoing fees for his services as Trustee.
The fund has adopted a Trustee Fee Deferral Plan (the “Deferral Plan”) which allows the Trustees to defer the receipt of all or a portion of Trustees fees payable on or after July 1, 1995. The deferred fees remain invested in certain Putnam funds until distribution in accordance with the Deferral Plan. The fund has adopted an unfunded noncontribu-tory defined benefit pension plan (the “Pension Plan”) covering all Trustees of the fund who have served as a Trustee for at least five years. Benefits under the Pension Plan are equal to 50% of the Trustee’s average total retainer and meeting fees for the three years preceding retirement. Pension expense for the fund is included in Trustee compensation and expenses in the statement of operations. Accrued pension liability is included in Payable for Trustee compensation and expenses in the statement of assets and liabilities. The Trustees have terminated the Pension Plan with respect to any Trustee first elected after 2003.
54
The fund has adopted distribution plans (the “Plans”) with respect to its class A, class B, class C, class M and class R shares pursuant to Rule 12b-1 under the Investment Company Act of 1940. The purpose of the Plans is to compensate Putnam Retail Management, a wholly-owned subsidiary of Putnam, LLC and Putnam Retail Management GP, Inc., for services provided and expenses incurred in distributing shares of the fund. The Plans provide for payments by the fund to Putnam Retail Management at an annual rate of up to 0.35%, 1.00%, 1.00%, 1.00% and 1.00% of the average net assets attributable to class A, class B, class C, class M and class R shares, respectively. The Trustees have approved payment by the fund at an annual rate of 0.25%, 1.00%, 1.00%, 0.50% and 0.50% of the average net assets attributable to class A, class B, class C, class M and class R shares, respectively.
For the year ended September 30, 2005, Putnam Retail Management, acting as underwriter, received net commissions of $36,828 and $2,720 from the sale of class A and class M shares, respectively, and received $465,007 and $3,274 in contingent deferred sales charges from redemptions of class B and class C shares, respectively.
A deferred sales charge of up to 1.00% and 0.40% is assessed on certain redemptions of class A and class M shares, respectively. For the year ended September 30, 2005, Putnam Retail Management, acting as underwriter, received $5,290 and no monies on class A and class M redemptions, respectively.
Note 3: Purchases and sales of securities
During the year ended September 30, 2005, cost of purchases and proceeds from sales of U.S. government securities and agency obligations other than short-term investments and dollar roll transactions aggregated $7,100,258,889 and $7,971,656,498, respectively.
Written option transactions during the year are summarized as follows:
| | Contract | | Premiums |
| | Amounts | | Received |
| Written options | | | |
| outstanding at | | | |
| beginning of year | -- | $ | -- |
|
| Options opened | 170,000,000 | | 6,592,849 |
| Options expired | -- | | -- |
| Options closed | (80,440,000) | | (3,129,116) |
|
| Written options | | | |
| outstanding at | | | |
| end of year | 89,560,000 | | $ 3,463,733 |
Note 4: Capital shares
At September 30, 2005, there was an unlimited number of shares of beneficial interest authorized. Transactions in capital shares were as follows:
| CLASS A | Shares | Amount |
| Year ended 9/30/05: | | |
| Shares sold | 8,457,463 | $ 112,623,293 |
|
| Shares issued | | |
| in connection | | |
| with reinvestment | | |
| of distributions | 2,533,553 | 32,826,380 |
|
| | 10,991,016 | 145,449,673 |
|
| Shares | | |
| repurchased | (24,369,108) | (322,594,455) |
|
| Net decrease | (13,378,092) | $(177,144,782) |
| |
| Year ended 9/30/04: | | |
| Shares sold | 11,347,759 | $ 149,278,616 |
|
| Shares issued | | |
| in connection | | |
| with reinvestment | | |
| of distributions | 2,405,479 | 31,613,429 |
|
| | 13,753,238 | 180,892,045 |
|
| Shares | | |
| repurchased | (58,172,060) | (764,678,837) |
|
| Net decrease | (44,418,822) | $(583,786,792) |
55
| | CLASS B | Shares | Amount | CLASS M | Shares | Amount |
| | Year ended 9/30/05: | | | Year ended 9/30/05: | | |
| | Shares sold | 1,284,828 | $ 16,923,103 | Shares sold | 289,480 | $ 3,824,505 |
|
|
| | Shares issued | | | Shares issued | | |
| | in connection | | | in connection | | |
| | with reinvestment | | | with reinvestment | | |
| | of distributions | 370,827 | 4,878,078 | of distributions | 16,959 | 223,972 |
|
|
| | | 1,655,655 | 21,801,181 | | 306,439 | 4,048,477 |
|
|
| | Shares | | | Shares | | |
| | repurchased | (8,522,707) | (112,210,030) | repurchased | (1,102,106) | (14,561,966) |
|
|
| | Net decrease | (6,867,052) | $ (90,408,849) | Net decrease | (795,667) | $(10,513,489) |
| |
| | Year ended 9/30/04: | | | Year ended 9/30/04: | | |
| | Shares sold | 2,299,674 | $ 30,054,012 | Shares sold | 678,463 | $ 8,929,446 |
|
|
| | Shares issued | | | Shares issued | | |
| | in connection | | | in connection | | |
| | with reinvestment | | | with reinvestment | | |
| | of distributions | 395,617 | 5,173,173 | of distributions | 20,566 | 270,006 |
|
|
| | | 2,695,291 | 35,227,185 | | 699,029 | 9,199,452 |
|
|
| | Shares | | | Shares | | |
| | repurchased | (20,474,276) | (267,775,073) | repurchased | (2,437,251) | (32,024,627) |
|
|
| | Net decrease | (17,778,985) | $(232,547,888) | Net decrease | (1,738,222) | $(22,825,175) |
|
|
| |
| | CLASS C | Shares | Amount | CLASS R | Shares | Amount |
| | Year ended 9/30/05: | | | Year ended 9/30/05: | | |
| | Shares sold | 245,665 | $ 3,248,351 | Shares sold | 9,758 | $129,104 |
|
|
| | Shares issued | | | Shares issued | | |
| | in connection | | | in connection | | |
| | with reinvestment | | | with reinvestment | | |
| | of distributions | 32,567 | 429,944 | of distributions | 213 | 2,820 |
|
|
| | | 278,232 | 3,678,295 | | 9,971 | 131,924 |
|
|
| | Shares | | | Shares | | |
| | repurchased | (751,780) | (9,931,856) | repurchased | (654) | (8,667) |
|
|
| | Net decrease | (473,548) | $ (6,253,561) | Net increase | 9,317 | $123,257 |
| |
| | Year ended 9/30/04: | | | Year ended 9/30/04: | | |
| | Shares sold | 472,007 | $ 6,181,187 | Shares sold | 3,250 | $ 43,063 |
|
|
| | Shares issued | | | Shares issued | | |
| | in connection | | | in connection | | |
| | with reinvestment | | | with reinvestment | | |
| | of distributions | 34,343 | 450,759 | of distributions | 4 | 49 |
|
|
| | | 506,350 | 6,631,946 | | 3,254 | 43,112 |
|
|
| | Shares | | | Shares | | |
| | repurchased | (2,569,060) | (33,698,582) | repurchased | --* | (3) |
|
|
| | Net decrease | (2,062,710) | $(27,066,636) | Net increase | 3,254 | $ 43,109 |
| 56 | | | | * Amount represents less than 1 share. | |
| CLASS Y | Shares | Amount |
| Year ended 9/30/05: | | |
| Shares sold | 267,501 | $ 3,534,079 |
|
| Shares issued | | |
| in connection | | |
| with reinvestment | | |
| of distributions | 40,437 | 533,749 |
|
| | 307,938 | 4,067,828 |
|
| Shares | | |
| repurchased | (1,376,773) | (18,189,970) |
|
| Net decrease | (1,068,835) | $(14,122,142) |
| |
| Year ended 9/30/04: | | |
| Shares sold | 571,639 | $ 7,514,754 |
|
| Shares issued | | |
| in connection | | |
| with reinvestment | | |
| of distributions | 87,753 | 1,151,865 |
|
| | 659,392 | 8,666,619 |
|
| Shares | | |
| repurchased | (2,621,223) | (34,117,023) |
|
| Net decrease | (1,961,831) | $(25,450,404) |
Note 5: Regulatory matters and litigation
Putnam Management has entered into agreements with the Securities and Exchange Commission and the Massachusetts Securities Division settling charges connected with excessive short-term trading by Putnam employees and, in the case of the charges brought by the Massachusetts Securities Division, by participants in some Putnam-administered 401(k) plans. Pursuant to these settlement agreements, Putnam Management will pay a total of $193.5 million in penalties and restitution, with $153.5 million being paid to shareholders and the funds. The amount will be allocated to shareholders and funds pursuant to a plan developed by an independent consultant, and will be paid following approval of the plan by the SEC and the Massachusetts Securities Division.
The Securities and Exchange Commission’s and Massachusetts Securities Division’s allegations and related matters also serve as the general basis for numerous lawsuits, including purported class action lawsuits filed against Putnam Management and certain related parties, including certain Putnam funds. Putnam Management will bear any costs incurred by Putnam funds in connection with these lawsuits. Putnam Management believes that the likelihood that the pending private lawsuits and purported class action lawsuits will have a material adverse financial impact on the fund is remote, and the pending actions are not likely to materially affect its ability to provide investment management services to its clients, including the Putnam funds.
Putnam Investments has recorded a charge of $30 million for the estimated cost, excluding interest, that it believes will be necessary to address issues relating to the calculation of certain amounts paid by the Putnam mutual funds in previous years. The previous payments were cost reimbursements by the Putnam funds to Putnam for transfer agent services relating to defined contribution operations. Putnam currently anticipates that any payments made by Putnam related to this issue will be paid to the Putnam funds. Review of this issue is ongoing.
Putnam Management and Putnam Retail Management are named as defendants in a civil suit in which the plaintiffs allege that the management and distribution fees paid by certain Putnam funds were excessive and seek recovery under the Investment Company Act of 1940. Putnam Management and Putnam Retail Management have contested the plaintiffs’ claims and the matter is currently pending in the U.S. District Court for the District of Massachusetts. Based on currently available information, Putnam Management believes that this action is without merit and that it is unlikely to have a material effect on Putnam Management’s and Putnam Retail Management’s ability to provide services to their clients, including the fund.
57
Federal tax information
(Unaudited)
|
The Form 1099 you receive in January 2006 will show the tax status of all distributions paid to your account in calendar 2005.
58
Jameson A. Baxter (9/6/43), Trustee since 1994
|
Ms. Baxter is the President of Baxter Associates, Inc., a private investment firm that she founded in 1986.
Ms. Baxter serves as a Director of ASHTA Chemicals, Inc., Banta Corporation (a printing and digital imaging firm), Ryerson Tull, Inc. (a steel service corporation), the Mutual Fund Directors Forum, Advocate Health Care and BoardSource, formerly the National Center for Nonprofit Boards. She is Chairman Emeritus of the Board of Trustees, Mount Holyoke College, having served as Chairman for five years and as a board member for thirteen years. Until 2002, Ms. Baxter was a Director of Intermatic Corporation (a manufacturer of energy control products).
Ms. Baxter has held various positions in investment banking and corporate finance, including Vice President and Principal of the Regency Group, and Vice President of and Consultant to First Boston Corporation. She is a graduate of Mount Holyoke College.
Charles B. Curtis (4/27/40), Trustee since 2001
|
Mr. Curtis is President and Chief Operating Officer of the Nuclear Threat Initiative (a private foundation dealing with national security issues) and serves as Senior Advisor to the United Nations Foundation.
Mr. Curtis is a member of the Council on Foreign Relations and the Trustee Advisory Council of the Applied Physics Laboratory, Johns Hopkins University. Until 2003, Mr. Curtis was a member of the Electric Power Research Institute Advisory Council and the University of Chicago Board of Governors for Argonne National Laboratory. Prior to 2002, Mr. Curtis was a Member of the Board of Directors of the Gas Technology Institute and the Board of Directors of the Environment and Natural Resources Program Steering Committee, John F. Kennedy School of Government, Harvard University. Until 2001, Mr. Curtis was a member of the Department of Defense Policy Board and Director of EG&G Technical Services, Inc. (a fossil energy research and development support company).
From August 1997 to December 1999, Mr. Curtis was a Partner at Hogan & Hartson L.L.P., a Washington, D.C. law firm. Prior to May 1997, Mr. Curtis was Deputy Secretary of Energy. He served as Chairman of the Federal Energy Regulatory Commission from 1977 to 1981 and has held positions on the staff of the U.S. House of Representatives, the U.S. Treasury Department, and the SEC.
59
Myra R. Drucker (1/16/48), Trustee since 2004
|
Ms. Drucker is a Vice Chair of the Board of Trustees of Sarah Lawrence College, a Trustee of Commonfund (a not-for-profit firm specializing in asset management for educational endowments and foundations) and a member of the Investment Committee of the Kresge Foundation (a charitable trust).
Ms. Drucker is an ex-officio member of the New York Stock Exchange (NYSE) Pension Managers Advisory Committee, having served as Chair for seven years and a member of the Executive Committee of the Committee on Investment of Employee Benefit Assets. She is Chair of the Advisory Board of Hamilton Lane Advisors (an investment management firm) and a member of the Advisory Board of RCM (an investment management firm). Until August 31, 2004, Ms. Drucker was Managing Director and a member of the Board of Directors of General Motors Asset Management and Chief Investment Officer of General Motors Trust Bank. Ms. Drucker also served as a member of the NYSE Corporate Accountability and Listing Standards Committee and the NYSE/NASD IPO Advisory Committee.
Prior to joining General Motors Asset Management in 2001, Ms. Drucker held various executive positions in the investment management industry. Ms. Drucker served as Chief Investment Officer of Xerox Corporation (a technology and service company in the document industry), where she was responsible for the investment of the company’s pension assets. Ms. Drucker was also Staff Vice President and Director of Trust Investments for International Paper (a paper, paper distribution, packaging and forest products company) and previously served as Manager of Trust Investments for Xerox Corporation. Ms. Drucker received a B.A. degree in Literature and Psychology from Sarah Lawrence College and pursued graduate studies in economics, statistics and portfolio theory at Temple University.
John A. Hill (1/31/42), Trustee since 1985 and Chairman since 2000
Mr. Hill is Vice Chairman of First Reserve Corporation, a private equity buyout firm that specializes in energy investments in the diversified worldwide energy industry.
Mr. Hill is a Director of Devon Energy Corporation, TransMontaigne Oil Company and various private companies controlled by First Reserve Corporation, as well as Chairman of TH Lee, Putnam Investment Trust (a closed-end investment company advised by an affiliate of Putnam Management). He is also a Trustee of Sarah Lawrence College. Until 2005, he was a Director of Continuum Health Partners of New York.
Prior to acquiring First Reserve Corporation in 1983, Mr. Hill held executive positions in investment banking and investment management with several firms and with the federal government, including Deputy Associate Director of the Office of Management and Budget and Deputy
60
Director of the Federal Energy Administration. He is active in various business associations, including the Economic Club of New York, and lectures on energy issues in the United States and Europe. Mr. Hill holds a B.A. degree in Economics from Southern Methodist University and pursued graduate studies there as a Woodrow Wilson Fellow.
Paul L. Joskow (6/30/47), Trustee since 1997
|
Dr. Joskow is the Elizabeth and James Killian Professor of Economics and Management, and Director of the Center for Energy and Environmental Policy Research at the Massachusetts Institute of Technology.
Dr. Joskow serves as a Director of National Grid plc (a UK-based holding company with interests in electric and gas transmission and distribution and telecommunications infrastructure) and TransCanada Corporation (an energy company focused on natural gas transmission and power services). He also serves on the Board of Overseers of the Boston Symphony Orchestra. Prior to February 2005, he served on the board of the Whitehead Institute for Biomedical Research (a non-profit research institution) and has been President of the Yale University Council since 1993. Prior to February 2002, he was a Director of State Farm Indemnity Company (an automobile insurance company), and, prior to March 2000, he was a Director of New England Electric System (a public utility holding company).
Dr. Joskow has published five books and numerous articles on topics in industrial organization, government regulation of industry, and competition policy. He is active in industry restructuring, environmental, energy, competition and privatization policies -- serving as an advisor to governments and corporations worldwide. Dr. Joskow holds a Ph.D. and M. Phil from Yale University and a B.A. from Cornell University.
Elizabeth T. Kennan (2/25/38), Trustee since 1992
Dr. Kennan is a Partner of Cambus-Kenneth Farm (thoroughbred horse and cattle breeding). She is President Emeritus of Mount Holyoke College.
Dr. Kennan served as Chairman and is now Lead Director of Northeast Utilities. Until 2005, she was a Director of Talbots, Inc. She has served as Director on a number of other boards, including Bell Atlantic, Chastain Real Estate, Shawmut Bank, Berkshire Life Insurance and Kentucky Home Life Insurance. She is a Trustee of the National Trust for Historic Preservation, of Centre College and of Midway College in Midway, Kentucky. She is also a member of The Trustees of Reservations. Dr. Kennan has served on the oversight committee of the Folger Shakespeare Library, as President of Five Colleges Incorporated, as a Trustee of Notre Dame University and is active in various educational and civic associations.
61
As a member of the faculty of Catholic University for twelve years, until 1978, Dr. Kennan directed the post-doctoral program in Patristic and Medieval Studies, taught history and published numerous articles. Dr. Kennan holds a Ph.D. from the University of Washington in Seattle, an M.S. from St. Hilda’s College at Oxford University and an A.B. from Mount Holyoke College. She holds several honorary doctorates.
John H. Mullin, III (6/15/41), Trustee since 1997
|
Mr. Mullin is the Chairman and CEO of Ridgeway Farm (a limited liability company engaged in timber and farming).
Mr. Mullin serves as a Director of The Liberty Corporation (a broadcasting company), Progress Energy, Inc. (a utility company, formerly known as Carolina Power & Light) and Sonoco Products, Inc. (a packaging company). Mr. Mullin is Trustee Emeritus of The National Humanities Center and Washington & Lee University, where he served as Chairman of the Investment Committee. Prior to May 2001, he was a Director of Graphic Packaging International Corp. Prior to February 2004, he was a Director of Alex Brown Realty, Inc.
Mr. Mullin is also a past Director of Adolph Coors Company; ACX Technologies, Inc.; Crystal Brands, Inc.; Dillon, Read & Co., Inc.; Fisher-Price, Inc.; and The Ryland Group, Inc. Mr. Mullin is a graduate of Washington & Lee University and The Wharton Graduate School, University of Pennsylvania.
Robert E. Patterson (3/15/45), Trustee since 1984
Mr. Patterson is Senior Partner of Cabot Properties, L.P. and Chairman of Cabot Properties, Inc. (a private equity firm investing in commercial real estate).
Mr. Patterson serves as Chairman Emeritus and Trustee of the Joslin Diabetes Center and as a Director of Brandywine Trust Group, LLC. Prior to June 2003, he was a Trustee of Sea Education Association. Prior to December 2001, he was President and Trustee of Cabot Industrial Trust (a publicly traded real estate investment trust). Prior to February 1998, he was Executive Vice President and Director of Acquisitions of Cabot Partners Limited Partnership (a registered investment adviser involved in institutional real estate investments). Prior to 1990, he served as Executive Vice President of Cabot, Cabot & Forbes Realty Advisors, Inc. (the predecessor company of Cabot Partners).
Mr. Patterson practiced law and held various positions in state government and was the founding Executive Director of the Massachusetts Industrial Finance Agency. Mr. Patterson is a graduate of Harvard College and Harvard Law School.
62
W. Thomas Stephens (9/2/42), Trustee since 1997
Mr. Stephens is Chairman and Chief Executive Officer of Boise Cascade, L.L.C. (a paper, forest products and timberland assets company).
Mr. Stephens serves as a Director of TransCanada Pipelines Limited. Until 2004, Mr. Stephens was a Director of Xcel Energy Incorporated (a public utility company), Qwest Communications, and Norske Canada, Inc. (a paper manufacturer). Until 2003, Mr. Stephens was a Director of Mail-Well, Inc. (a diversified printing company). He served as Chairman of Mail-Well until 2001 and as CEO of MacMillan-Bloedel, Ltd. (a forest products company) until 1999.
Prior to 1996, Mr. Stephens was Chairman and Chief Executive Officer of Johns Manville Corporation. He holds B.S. and M.S. degrees from the University of Arkansas.
Richard B. Worley (11/15/45), Trustee since 2004
Mr. Worley is Managing Partner of Permit Capital LLC, an investment management firm.
Mr. Worley serves on the Executive Committee of the University of Pennsylvania Medical Center, is a Trustee of The Robert Wood Johnson Foundation (a philanthropic organization devoted to health care issues) and is a Director of The Colonial Williamsburg Foundation (a historical preservation organization). Mr. Worley also serves on the investment committees of Mount Holyoke College and World Wildlife Fund (a wildlife conservation organization).
Prior to joining Permit Capital LLC in 2002, Mr. Worley served as Chief Strategic Officer of Morgan Stanley Investment Management. He previously served as President, Chief Executive Officer and Chief Investment Officer of Morgan Stanley Dean Witter Investment Management and as a Managing Director of Morgan Stanley, a financial services firm. Mr. Worley also was the Chairman of Miller Anderson & Sherrerd, an investment management firm.
Mr. Worley holds a B.S. degree from University of Tennessee and pursued graduate studies in economics at the University of Texas.
63
| | Charles E. Haldeman, Jr.* (10/29/48), Trustee since 2004 |
| |
| | Mr. Haldeman is President and Chief Executive Officer of Putnam, LLC (“Putnam Investments”). He is a member of Putnam Investments’ Executive Board of Directors and Advisory Council. Prior to November 2003, Mr. Haldeman served as Co-Head of Putnam Investments’ Investment Division. |
| |
| | Prior to joining Putnam Investments in 2002, Mr. Haldeman held executive positions in the invest- ment management industry. He previously served as Chief Executive Officer of Delaware Investments and President & Chief Operating Officer of United Asset Management. Mr. Haldeman was also a partner and director of Cooke & Bieler, Inc. (an investment management firm). |
| |
| | Mr. Haldeman currently serves as a Trustee of Dartmouth College and is a member of the Partners HealthCare Systems Investment Committee. He is a graduate of Dartmouth College, Harvard Law School and Harvard Business School. Mr. Haldeman is also a Chartered Financial Analyst (CFA) charterholder. |
| |
| | George Putnam, III* (8/10/51), Trustee since 1984 and President since 2000 |
| |
| | Mr. Putnam is President of New Generation Research, Inc. (a publisher of financial advisory and other research services), and of New Generation Advisers, Inc. (a registered investment advisor to private funds). Mr. Putnam founded the New Generation companies in 1986. |
| |
| | Mr. Putnam is a Director of The Boston Family Office, LLC (a registered investment adviser). He is a Trustee of St. Mark’s School and Shore Country Day School, and until 2002 was a Trustee of the Sea Education Association. |
| |
| | Mr. Putnam previously worked as an attorney with the law firm of Dechert LLP (formerly known as Dechert Price & Rhoads) in Philadelphia. He is a graduate of Harvard College, Harvard Business School and Harvard Law School. |
| |
| | The address of each Trustee is One Post Office Square, Boston, MA 02109. |
| |
| | As of September 30, 2005, there were 108 Putnam Funds. All Trustees serve as Trustees of all Putnam funds. Each Trustee serves for an indefinite term, until his or her resignation, retirement at age 72, death, or removal. |
| |
| * | Trustees who are or may be deemed to be “interested persons” (as defined in the Investment Company Act of 1940) of the fund, Putnam Management, Putnam Retail Management, or Marsh & McLennan Companies, Inc., the parent company of Putnam, LLC and its affiliated companies. Messrs. Haldeman and Putnam, III are deemed “interested persons” by virtue of their positions as officers of the fund, Putnam Management or Putnam Retail Management and as shareholders of Marsh & McLennan Companies, Inc. Mr. Putnam, III is the President of your fund and each of the other Putnam funds. Mr. Haldeman is President and Chief Executive Officer of Putnam Investments. |
| |
64
Officers
In addition to George Putnam, III, the other officers of the fund are shown below:
Charles E. Porter (7/26/38)
Executive Vice President, Associate Treasurer and Principal Executive Officer
Since 1989
Jonathan S. Horwitz (6/4/55)
Senior Vice President and Treasurer
Since 2004
Prior to 2004, Managing Director,
Putnam Investments
Steven D. Krichmar (6/27/58)
Vice President and Principal Financial Officer
Since 2002
Senior Managing Director, Putnam Investments.
Prior to July 2001, Partner, PricewaterhouseCoopers LLP
Michael T. Healy (1/24/58)
Assistant Treasurer and Principal Accounting Officer
Since 2000
Managing Director, Putnam Investments
Beth S. Mazor (4/6/58)
Vice President
Since 2002
Senior Vice President, Putnam Investments
Daniel T. Gallagher (2/27/62)
Senior Vice President, Staff Counsel and Compliance Liaison
Since 2004
Prior to 2004, Associate, Ropes & Gray LLP; prior to 2000, Law Clerk,
Massachusetts Supreme Judicial Court
Francis J. McNamara, III (8/19/55)
Vice President and Chief Legal Officer
Since 2004
Senior Managing Director, Putnam Investments, Putnam Management
and Putnam Retail Management. Prior to 2004, General Counsel,
State Street Research & Management Company
James P. Pappas (2/24/53)
Vice President
Since 2004
Managing Director, Putnam Investments and Putnam Management. During 2002,
Chief Operating Officer, Atalanta/Sosnoff Management Corporation; prior to 2001,
President and Chief Executive Officer, UAM Investment Services, Inc.
Richard S. Robie, III (3/30/60)
Vice President
Since 2004
Senior Managing Director, Putnam Investments, Putnam Management and
Putnam Retail Management. Prior to 2003, Senior Vice President, United Asset
Management Corporation
Charles A. Ruys de Perez (10/17/57)
Vice President and Chief Compliance Officer
Since 2004
Managing Director, Putnam Investments
Mark C. Trenchard (6/5/62)
Vice President and BSA Compliance Officer
Since 2002
Senior Vice President, Putnam Investments
Judith Cohen (6/7/45)
Vice President, Clerk and Assistant Treasurer
Since 1993
Wanda M. McManus (1/4/47)
Vice President, Senior Associate Treasurer and Assistant Clerk
Since 2005
Nancy T. Florek (6/13/57)
Vice President, Assistant Clerk, Assistant Treasurer and Proxy Manager
Since 2005
The address of each Officer is One Post Office Square, Boston, MA 02109.
65
The Putnam family of funds
The following is a complete list of Putnam’s open-end mutual funds. Investors should carefully consider the investment objective, risks, charges, and expenses of a fund before investing. For a prospectus containing this and other information for any Putnam fund or product, call your financial advisor at 1-800-225-1581 and ask for a prospectus. Please read the prospectus carefully before investing.
Growth funds
Discovery Growth Fund
Growth Opportunities Fund
Health Sciences Trust
International New Opportunities Fund*
New Opportunities Fund
OTC & Emerging Growth Fund
Small Cap Growth Fund
Vista Fund Voyager Fund
Blend funds
Capital Appreciation Fund
Capital Opportunities Fund
Europe Equity Fund*
Global Equity Fund*
Global Natural Resources Fund*
International Capital Opportunities Fund*
International Equity Fund*
Investors Fund
Research Fund
Tax Smart Equity Fund ®
Utilities Growth and Income Fund
Value funds
Classic Equity Fund
Convertible Income-Growth Trust
Equity Income Fund
The George Putnam Fund of Boston
The Putnam Fund for Growth and Income
International Growth and Income Fund*
Mid Cap Value Fund
New Value Fund
Small Cap Value Fund†
Income funds
American Government Income Fund
Diversified Income Trust
Floating Rate Income Fund
Global Income Trust*
High Yield Advantage Fund*†
High Yield Trust*
Income Fund
Limited Duration Government Income Fund‡
Money Market Fund §
U.S. Government Income Trust
* A 1% redemption fee on total assets redeemed or exchanged between 6 and 90 days of purchase may be imposed for all share classes of these funds.
† Closed to new investors.
‡ Formerly Putnam Intermediate U.S. Government Income Fund.
§ An investment in a money market fund is not insured or guaranteed by the Federal Deposit Insurance Corporation or any other government agency. Although the fund seeks to preserve your investment at $1.00 per share, it is possible to lose money by investing in the fund.
66
Tax-free income funds
AMT-Free Insured Municipal Fund**
Tax Exempt Income Fund
Tax Exempt Money Market Fund§
Tax-Free High Yield Fund
State tax-free income funds:
Arizona, California, Florida, Massachusetts, Michigan, Minnesota, New Jersey, New York, Ohio, and Pennsylvania
Asset allocation funds
Income Strategies Fund
Putnam Asset Allocation Funds -- three investment portfolios that spread your money across a variety of stocks, bonds, and money market investments.
The three portfolios:
Asset Allocation: Balanced Portfolio
Asset Allocation: Conservative Portfolio
Asset Allocation: Growth Portfolio
Putnam RetirementReady® Funds
Putnam RetirementReady Funds -- ten investment portfolios that offer diversifica-tion among stocks, bonds, and money market instruments and adjust to become more conservative over time based on a target date for withdrawing assets.
The ten funds:
Putnam RetirementReady 2050 Fund
Putnam RetirementReady 2045 Fund
Putnam RetirementReady 2040 Fund
Putnam RetirementReady 2035 Fund
Putnam RetirementReady 2030 Fund
Putnam RetirementReady 2025 Fund
Putnam RetirementReady 2020 Fund
Putnam RetirementReady 2015 Fund
Putnam RetirementReady 2010 Fund
Putnam RetirementReady Maturity Fund
| ** | Formerly Putnam Tax-Free Insured Fund. |
| |
| | With the exception of money market funds, a 2% redemption fee may be applied to shares exchanged or sold within 5 days of purchase. |
| |
| | Check your account balances and the most recent month-end performance at www.putnam.com. |
| |

Fund information
Founded over 65 years ago, Putnam Investments was built around the concept that a balance between risk and reward is the hallmark of a well-rounded financial program. We manage over 100 mutual funds in growth, value, blend, fixed income, and international.
Investment Manager
Putnam Investment Management,
LLC One Post Office Square
Boston, MA 02109
Marketing Services
Putnam Retail Management
One Post Office Square Boston, MA 02109
Custodian
Putnam Fiduciary Trust Company
Legal Counsel
Ropes & Gray LLP
Independent Registered Public Accounting Firm
KPMG LLP
Trustees
John A. Hill, Chairman
Jameson Adkins Baxter
Charles B. Curtis
Myra R. Drucker
Charles E. Haldeman, Jr.
Paul L. Joskow
Elizabeth T. Kennan
John H. Mullin, III
Robert E. Patterson
George Putnam, III
W. Thomas Stephens
Richard B. Worley
Officers
George Putnam, III
President
Charles E. Porter
Executive Vice President, Associate
Treasurer and Principal Executive Officer
Jonathan S. Horwitz
Senior Vice President and Treasurer
Steven D. Krichmar
Vice President and Principal Financial Officer
Michael T. Healy
Assistant Treasurer and Principal Accounting Officer
Beth S. Mazor
Vice President
Daniel T. Gallagher
Senior Vice President,
Staff Counsel and Compliance Liaison
James P. Pappas
Vice President
Richard S. Robie, III
Vice President
Mark C. Trenchard
Vice President and BSA Compliance Officer
Francis J. McNamara, III
Vice President and Chief Legal Officer
Charles A. Ruys de Perez
Vice President and Chief Compliance Officer
Judith Cohen
Vice President, Clerk and Assistant Treasurer
Wanda M. McManus
Vice President, Senior Associate Treasurer
and Assistant Clerk
Nancy T. Florek
Vice President, Assistant Clerk,
Assistant Treasurer and Proxy Manager
This report is for the information of shareholders of Putnam U.S. Government Income Trust. It may also be used as sales literature when preceded or accompanied by the current prospectus, the most recent copy of Putnam’s Quarterly Performance Summary, and Putnam’s Quarterly Ranking Summary. For more recent performance, please visit www.putnam.com. Investors should carefully consider the investment objective, risks, charges, and expenses of a fund, which are described in its prospectus. For this and other information or to request a prospectus, call 1-800-225-1581 toll free. Please read the prospectus carefully before investing. The fund’s Statement of Additional Information contains additional information about the fund’s Trustees and is available without charge upon request by calling 1-800-225-1581.
68

(a) All officers of the Fund, including its principal executive, financial and accounting officers, are employees of Putnam Investment Management, LLC, the Fund's investment manager. As such they are subject to a comprehensive Code of Ethics adopted and administered by Putnam Investments which is designed to protect the interests of the firm and its clients. The Fund has adopted a Code of Ethics which incorporates the Code of Ethics of Putnam Investments with respect to all of its officers and Trustees who are employees of Putnam Investment Management, LLC. For this reason, the Fund has not adopted a separate code of ethics governing its principal executive, financial and accounting officers.
(c) In July 2004, Putnam Investment Management, LLC, the Fund's investment manager, Putnam Retail Management Limited Partnership, the Fund's principal underwriter, and Putnam Investments Limited, the sub-manager for a portion of the assets of certain funds as determined by Putnam Management from time to time, adopted several amendments to their Code of Ethics. Some of these amendments were adopted as a result of Putnam Investment Management's partial settlement order with the SEC on November 13, 2003. Insofar as such Code of Ethics applies to the Fund's principal executive officer, principal financial officer and principal accounting officer, the amendments provided for the following: (i) a 90-day blackout period for all shares of Putnam open-end funds (except for money market funds) purchased or sold (including exchanges into or out of a fund) by Putnam employees and certain family members; (ii) a one-year holding period for all access persons that operates in the same manner as the 90-day rule; (iii) delivery by Putnam employees to the Code of Ethics Administrator of both quarterly account statements for all brokerage accounts (irrespective of activity in the accounts) and account statements for any Putnam funds not held at Putnam or for any funds sub-advised by Putnam; (iv) a prohibition of Putnam employees from making more than 25 trades in individual securities in their personal accounts in any given quarter; (v) the extension of the existing prohibition of access persons from a purchase and sale or sale and purchase of an individual security within 60 days to include trading based on tax-lot election; (vi) the inclusion of trades in Marsh & McLennan Companies, Inc. (ultimate parent company of Putnam Investment Management) securities in pre-clearance and reporting requirements; (vii) a prohibition of limit and good-until-canceled orders as inconsistent with the requirements of daily pre-clearance; (viii) new limits and procedures for accounts managed by outside managers and brokers, in order for trading in such accounts to be exempt from pre-clearance requirements; (ix) a new gift and entertainment policy that imposes a reporting obligation on all meals and entertainment and new limits on non-meal entertainment; (x) a number of alternatives for the reporting of irregular activity.
In December 2004, additional amendments to the Code of Ethics were adopted. Insofar as such Code of Ethics applies to the Fund's principal executive officer, principal financial officer and principal accounting officer, the amendments provided for the following: (i) implementation of minimum monetary sanctions for violations of the Code; (ii) expansion of the definition of "access person" under the Code include all Putnam employees with access to non-public information regarding Putnam-managed mutual fund portfolio holdings; (iii) lengthening the period during which access persons are required to complete quarterly reports; (iv) reducing the maximum number of trades than can be made by Putnam employees in their personal accounts in
any calendar quarter from 25 trades to 10 trades; and (v) lengthening the required holding period for securities by access persons from 60 days to 90 days.
In March 2005, additional amendments to the Code of Ethics were adopted, that went into effect on April 1, 2005. Insofar as such Code of Ethics applies to the Fund’s principal executive officer, principal financial officer and principal accounting officer, the amendments (i) prohibit Putnam employees and their immediate family members from having any direct or indirect personal financial interest in companies that do business with Putnam (excluding investment holdings in public companies that are not material to the employee), unless such interest is disclosed and approved by the Code of Ethics Officer; (ii) prohibit Putnam employees from using Putnam assets, letterhead or other resources in making political or campaign contributions, solicitations or endorsements;(iii) require Putnam employees to obtain pre-clearance of personal political or campaign contributions or other gifts to government officials or political candidates in certain jurisdictions and to officials or candidates with whom Putnam has or is seeking to establish a business relationship and (iv) require Putnam employees to obtain pre-approval from Putnam’s Director of Government Relations prior to engaging in lobbying activities.
In July 2005, additional amendments to the Code of Ethics were adopted. Insofar as such Code of Ethics applies to the Fund's principal executive officer, principal financial officer and principal accounting officer, the amendments provided for an exception to the standard 90-day holding period (one year, in the case of employees deemed to be “access persons” under the Code) for shares of Putnam mutual funds in the case of redemptions from an employee’s account in a college savings plan qualified under Section 529 of the Internal Revenue Code. Under this exception, an employee may, without penalty under the Code, make “qualified redemptions” of shares from such an account less than 90 days (or one year, as applicable) after purchase. “Qualified redemptions” include redemptions for higher education purposes for the account beneficiary and redemptions made upon death or disability. The July 2005 amendments also provide that an employee may, for purposes of the rule limiting the number of trades per calendar quarter in an employee’s personal account to a maximum of 10, count all trades of the same security in the same direction (all buys or all sells) over a period of five consecutive business days as a single trade.
Item 3. Audit Committee Financial Expert:
The Funds' Audit and Pricing Committee is comprised solely of Trustees who are "independent" (as such term has been defined by the Securities and Exchange Commission ("SEC") in regulations implementing Section 407 of the Sarbanes-Oxley Act (the "Regulations")). The Trustees believe that each of the members of the Audit and Pricing Committee also possess a combination of knowledge and experience with respect to financial accounting matters, as well as other attributes, that qualify them for service on the Committee. In addition, the Trustees have determined that all members of the Funds' Audit and Pricing Committee meet the financial literacy requirements of the New York Stock Exchange's rules and that Mr. Patterson, Mr. Stephens and Mr. Worley qualify as "audit committee financial experts" (as such term has been defined by the Regulations) based on their review of their pertinent experience and education. Certain other Trustees, although not on the Audit and Pricing
Committee, would also qualify as "audit committee financial experts." The SEC has stated that the designation or identification of a person as an audit committee financial expert pursuant to this Item 3 of Form N-CSR does not impose on such person any duties, obligations or liability that are greater than the duties, obligations and liability imposed on such person as a member of the Audit and Pricing Committee and the Board of Trustees in the absence of such designation or identification.
Item 4. Principal Accountant Fees and Services:
|
The following table presents fees billed in each of the last two fiscal years for services rendered to the fund by the fund’s independent auditors:
| Fiscal year ended | Audit Fees | Audit-Related Fees | Tax Fees | All Other Fees |
| September 30, 2005 | $39,530 | $- | | $3,030 | $- |
| September 30, 2004 | $35,734* | $- | | $3,000 | $535 |
*Includes fees of $ 2,734 by the fund’s independent auditor to the fund for audit procedures necessitated by regulatory and litigation matters for the fiscal year ended September 30, 2004. These fees were reimbursed to the fund by Putnam.
For the fiscal years ended September 30, 2005 and September 30, 2004, the fund’s independent auditors billed aggregate non-audit fees in the amounts of $3,030 and $3,535 respectively, to the fund, Putnam Management and any entity controlling, controlled by or under common control with Putnam Management that provides ongoing services to the fund.
Audit Fees represents fees billed for the fund’s last two fiscal years.
|
Audit-Related Fees represents fees billed in the fund’s last two fiscal years for services traditionally performed by the fund’s auditor, including accounting consultation for proposed transactions or concerning financial accounting and reporting standards and other audit or attest services not required by statute or regulation.Tax Fees represent fees billed in the fund’s last two fiscal years for tax compliance, tax planning and tax advice services. Tax planning and tax advice services include assistance with tax audits, employee benefit plans and requests for rulings or technical advice from taxing authorities.
All Other Fees Fees represent fees billed for services relating to interfund trading.
Pre-Approval Policies of the Audit and Pricing Committee. The Audit and Pricing Committee of the Putnam funds has determined that, as a matter of policy, all work performed for the funds by the funds’ independent auditors will be pre-approved by the Committee and will generally not be subject to pre-approval procedures.
Under certain circumstances, the Audit and Pricing Committee believes that it may be appropriate for Putnam Investment Management, LLC (“Putnam Management”) and certain of its affiliates to engage the services of the funds’ independent auditors, but only after prior approval by the Committee. Such requests are required to be submitted in writing to the Committee and explain, among other things, the nature of the proposed engagement, the estimated fees, and why this work must be performed by that particular audit firm. The Committee will review the proposed engagement at its next meeting.
Since May 6, 2003, all work performed by the independent auditors for the funds, Putnam Management and any entity controlling, controlled by or under common control with Putnam Management that provides ongoing services to the fund was pre-approved by the Committee or a member of the Committee pursuant to the pre-approval policies discussed above. Prior to that date, the Committee had a general policy to pre-approve the independent auditor’s engagements for non-audit services with the funds, Putnam Management and any entity controlling, controlled by or under common control with Putnam Management that provides ongoing services to the fund.
The following table presents fees billed by the fund’s principal auditor for services required to be approved pursuant to paragraph (c)(7)(ii) of Rule 2-01 of Regulation S-X.
| Fiscal year ended | Audit-Related Fees | Tax Fees | All Other Fees | Total Non-Audit Fees |
| September 30, 2005 | $- | | $- | $- | $- |
| September 30, 2004 | $- | | $- | $- | $- |
Item 5. Audit Committee:
Not applicable
Item 6. Schedule of Investments: |
Item 7. Disclosure of Proxy Voting Policies and Procedures For Closed-End Management Investment Companies:
Item 8. Purchases of Equity Securities by Closed-End Management Investment Companies and Affiliated Purchasers:
Item 9. Submission of Matters to a Vote of Security Holders:
Item 10. Controls and Procedures:
|
(a) The registrant's principal executive officer and principal financial officer have concluded, based on their evaluation of the effectiveness of the design and operation of the registrant's disclosure controls and procedures as of a date within 90 days of the filing date of this report, that the design and operation of such procedures are generally effective to provide reasonable assurance that information required to be disclosed by the registrant in this report is recorded, processed, summarized and reported within the time periods specified in the Commission's rules and forms.(b) Changes in internal control over financial reporting: Not applicable
| (a) | Not applicable |
| |
| (b) | A separate certification for each principal executive officer and principal financial officer of the registrant as required by Rule 30a-2 under the Investment Company Act of 1940, as amended, and the officer |
| |
certifications as required by Section 906 of the Sarbanes-Oxley Act of 2002 are filed herewith.
Pursuant to the requirements of the Securities Exchange Act of 1934 and the Investment Company Act of 1940, the registrant has duly caused this report to be signed on its behalf by the undersigned, thereunto duly authorized.
NAME OF REGISTRANT
By (Signature and Title):
/s/ Michael T. Healy
Michael T. Healy
Principal Accounting Officer
Date: November 29, 2005
|
Pursuant to the requirements of the Securities Exchange Act of 1934 and the Investment Company Act of 1940, this report has been signed below by the following persons on behalf of the registrant and in the capacities and on the dates indicated.By (Signature and Title):
/s/ Charles E. Porter
Charles E. Porter
Principal Executive Officer
Date: November 29, 2005
By (Signature and Title):
/s/Steven D. Krichmar
Steven D. Krichmar
Principal Financial Officer
Date: November 29, 2005
|