UNITED STATES
SECURITIES AND EXCHANGE COMMISSION
Washington, D.C. 20549
|
FORM N-CSR
CERTIFIED SHAREHOLDER REPORT OF REGISTERED
MANAGEMENT INVESTMENT COMPANIES
|
Investment Company Act file number: (811- 03897 )
Exact name of registrant as specified in charter: Putnam U.S. Government Income Trust
Address of principal executive offices: One Post Office Square, Boston, Massachusetts 02109
| Name and address of agent for service: | Beth S. Mazor, Vice President |
| | One Post Office Square |
| | Boston, Massachusetts 02109 |
| |
| Copy to: | John W. Gerstmayr, Esq. |
| | Ropes & Gray LLP |
| | One International Place |
| | Boston, Massachusetts 02110 |
| |
| Registrant’s telephone number, including area code: | (617) 292-1000 |
Date of fiscal year end: September 30, 2006
Date of reporting period: October 1, 2005—March 31, 2006
|
Item 1. Report to Stockholders:
The following is a copy of the report transmitted to stockholders pursuant to Rule 30e-1 under the Investment Company Act of 1940:

What makes Putnam different?

In 1830, Massachusetts Supreme Judicial Court Justice Samuel Putnam established The Prudent Man Rule, a legal foundation for responsible money management.
THE PRUDENT MAN RULE
All that can be required of a trustee to invest is that he shall conduct himself faithfully and exercise a sound discretion. He is to observe how men of prudence, discretion, and intelligence manage their own affairs, not in regard to speculation, but in regard to the permanent disposition of their funds, considering the probable income, as well as the probable safety of the capital to be invested.

A time-honored tradition in money management
Since 1937, our values have been rooted in a profound sense of responsibility for the money entrusted to us.
A prudent approach to investing
We use a research-driven team approach to seek consistent, dependable, superior investment results over time, although there is no guarantee a fund will meet its objectives.
Funds for every investment goal
We offer a broad range of mutual funds and other financial products so investors and their financial representatives can build diversified portfolios.
A commitment to doing what’s right for investors
We have below-average expenses and stringent investor protections, and provide a wealth of information about the Putnam funds.
Industry-leading service
We help investors, along with their financial representatives, make informed investment decisions with confidence.
| Putnam | |
| U.S. Government | |
| Income Trust | |
| |
| 3 | 31 | 06 | |
| Semiannual Report | |
| |
| Message from the Trustees | 2 |
| About the fund | 4 |
| Report from the fund managers | 7 |
| Performance | 13 |
| Expenses | 16 |
| Portfolio turnover | 18 |
| Risk | 19 |
| Your fund’s management | 20 |
| Terms and definitions | 23 |
| Trustee approval of management contract | 25 |
| Other information for shareholders | 30 |
| Financial statements | 32 |
Cover photograph: © Richard H. Johnson
Message from the Trustees
Dear Fellow Shareholder
In the early months of 2006, we have seen a continuation of generally benign economic conditions in the United States. The expansion that began in late 2001 is continuing, fueled by gains in worker productivity. The stock market has advanced, driven largely by corporate profit levels that, by some measures, are near all-time highs. Inflation, which can cause problems for stock and bond markets, has remained fairly steady in recent months even as energy prices have resumed their ascent. Investors can be encouraged by these conditions, but should also be mindful of risks. Bond prices have fallen recently in response to stronger job creation. As mortgage rates have risen to higher levels, activity in the housing market has slowed. Our nation’s large trade deficit is also dampening prosperity and could cause the U.S. dollar to weaken, which might make it more difficult for U.S. stocks and bonds to attract investment from abroad.
We consider it fortunate that the Federal Reserve’s (the Fed’s) new Chairman, Ben Bernanke, like his predecessor, Alan Greenspan, regards the Fed’s role in pursuing both price stability and economic growth as essential to maintaining a healthy financial system. In its first months under the leadership of Mr. Bernanke, the Fed has continued Mr. Greenspan’s program of interest-rate increases, while offering some signals that the end of the current tightening cycle might not be far away.
The economy’s significant strengths and notable weaknesses remind us once again that a well-diversified financial program under the guidance of a professional financial representative can help many investors pursue their goals. And in our view, the professional research, diversification, and active management that mutual funds provide continue to make them an intelligent choice for investors.
2
We want you to know that Putnam Investments, under the leadership of Chief Executive Officer Ed Haldeman, continues to focus on delivering consistent, dependable, superior investment performance over time. In the following pages, members of your fund’s management team discuss the fund’s performance and strategies, and their outlook for the months ahead. We thank you for your support of the Putnam funds.
Putnam U.S. Government Income Trust: seeking
opportunities through mortgage-backed securities

Homeownership is the most common way to invest in the real estate market, but it is not the only way. It is also possible for individuals to invest in the mortgages used to finance homes and businesses through instruments called mortgage-backed securities (MBSs).
Since 1984, Putnam U.S. Government Income Trust has invested in some of the highest-quality MBSs with the goal of maximizing income. However, investing in MBSs carries certain risks. As a result, your fund’s team of experienced analysts uses proprietary models to seek out investment opportunities, while striving to maintain an appropriate amount of risk for the fund.
MBSs are essentially securities that represent a stake in the principal from and interest paid on a collection of mortgages. Most MBSs are created when government-sponsored entities, including Fannie Mae, Ginnie Mae, and Freddie Mac, buy mortgages from financial institutions, such as banks or credit unions, and package them together by the thousands. These pools of mortgages act as collateral for the MBSs that government-sponsored entities sell to different investors, including Putnam U.S. Government Income Trust, which currently holds a significant percentage of its assets in MBSs.
With the exception of Ginnie Mae securities, MBSs are not guaranteed directly by the U.S. government. Therefore, they carry a higher degree of risk than investments like Treasury bonds, while offering the potential for higher returns. These non-Ginnie Mae securities are
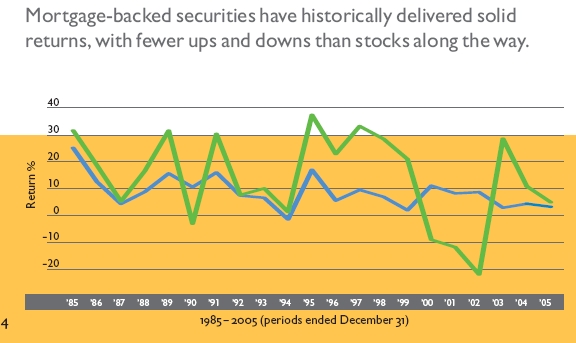
backed by a pool of borrowers and are typically guaranteed by the government-sponsored entities that offer them. By seeking opportunities among MBSs, your fund’s management team seeks higher returns than Treasuries can typically offer, but with less volatility than stocks.
Mutual funds that invest in government securities are not guaranteed. Mortgage-backed securities are subject to prepayment risk. Mutual funds that invest in bonds are subject to certain risks, including interest-rate risk, credit risk, and inflation risk. As interest rates rise, the prices of bonds fall. Long-term bonds are more exposed to interest-rate risk than short-term bonds. Unlike bonds, bond funds have ongoing fees and expenses.

The ABCs of MBSs
MBSs (Mortgage-backed securities): MBSs are pools of mortgages used as collateral for issuing a security. These securities represent claims on the principal and interest payments made by the borrowers whose loans are in the pool.
Fannie Mae (Federal National Mortgage Association): Fannie Mae is a public company established by the U.S. government in 1938 to help make mortgage funds available to buyers. Fannie Mae does business with primary mortgage lenders (savings and loans, commercial banks, credit unions, and housing finance agencies).
Freddie Mac (Federal Home Loan Mortgage Corporation): Freddie Mac is another public company chartered by Congress to increase the funds available to mortgage financiers. Freddie Mac buys mortgages from primary lenders and develops MBSs that offer a guarantee on the payment of principal and interest.
Ginnie Mae (Government National Mortgage Association): Ginnie Mae is a government-owned corporation established in 1968 whose MBSs are backed by the full faith and credit of the U.S. government.
Putnam U.S. Government Income Trust seeks as high a level of current income as we believe is consistent with preservation of capital. The fund attempts to achieve its objective by investing primarily in obligations of the U.S. government and its agencies and instrumentalities, such as Government National Mortgage Association certifi-cates (Ginnie Maes), Federal National Mortgage Association certificates (Fannie Maes), Federal Home Loan Mortgage Corporation certificates (Freddie Macs), and U.S. Treasury securities. Ginnie Maes, Fannie Maes, and Freddie Macs are generally high quality and typically provide higher yields than Treasury securities of similar maturities. The fund may also invest a portion of its assets in highly rated non-government mortgage-backed securities and other asset-backed securities. The fund is designed primarily for investors seeking income, but it can also lower volatility in a well-diversified portfolio.
Highlights
* For the six months ended March 31, 2006, Putnam U.S. Government Income Trust’s class A shares returned 0.57% without sales charges.
* The fund’s benchmark, the Lehman GNMA Index, returned 0.92% .
* The average return for the fund’s Lipper category, GNMA Funds, was 0.55% ..
* Additional fund performance, comparative performance, and Lipper data can be found in the performance section beginning on page 13.
Performance
Total return for class A shares for periods ended 3/31/06
Since the fund's inception (2/8/84), average annual return is 7.19% at NAV and 7.00% at POP.
| | Average annual return | Cumulative return |
| | NAV | POP | NAV | POP |
|
| 10 years | 5.27% | 4.87% | 67.13% | 60.85% |
|
| 5 years | 3.89 | 3.10 | 21.03 | 16.50 |
|
| 3 years | 2.23 | 0.92 | 6.83 | 2.79 |
|
| 1 year | 1.98 | –1.83 | 1.98 | –1.83 |
|
| 6 months | — | — | 0.57 | –3.19 |
|
Data is historical. Past performance does not guarantee future results. More recent returns may be less or more than those shown. Investment return and principal value will fluctuate, and you may have a gain or a loss when you sell your shares. Performance assumes reinvestment of distributions and does not account for taxes. Returns at NAV do not reflect a sales charge of 3.75% . For the most recent month-end performance, visit www.putnam.com. A short-term trading fee of up to 2% may apply.
6
Report from the fund managers
The period in review
For the semiannual period, the fund posted a modest gain, based on results at net asset value (NAV, or without sales charges). The fund lagged its benchmark, the Lehman GNMA Index, which is composed entirely of Ginnie Maes. This reflects the fact that your fund invests more broadly than the index, and consequently has exposure to other U.S. government and agency securities that did not perform as strongly as Ginnie Maes during the period. The fund performed in line with the average for its peer group, Lipper GNMA Funds. Strategies that were beneficial to the fund’s performance included our duration positioning, which shifted during the period in anticipation of changes in interest rates; our combining of interest-only and principal-only collateralized mortgage obligations; and the fund’s positions in re-performing mortgages, which are not a component of the benchmark.
Market overview
The U.S. and global economies remained stronger during the period than many had expected. In the United States, interest rates rose fairly substantially between October 1, 2005, and March 31, 2006. Because short-term rates rose significantly while longer-term rates remained relatively stable, the yield curve — a graphical representation of yields for bonds of comparable quality, plotted from the shortest to the longest maturity — flattened and actually inverted for a short period. This briefly reversed the normal risk-return relationship between short-term and long-term securities. At that point, for example, 2-year notes yielded more than 10-year bonds, which are normally considered more risky. Shortly thereafter, the yield curve resumed a slight upward slope. At the end of the reporting period, 10-year bonds were yielding only about 12 basis points more than 2-year notes — substantially less than the historical difference of about 100 basis points. A basis point is one
7
one-hundredth of a percentage point. Yields on 10-year Treasury bonds traded in a range between 4.30% and 4.70% for much of the period, then moved higher in March.
Mortgage-backed securities (MBSs) and agency bonds outperformed Treasuries of comparable maturities. Retail investors from Japan, China, and Taiwan maintained the strong demand for MBSs, particularly Ginnie Maes, which offered attractive yields in a fairly low-yield environment. Demand for Ginnie Maes contributed to price volatility and ultimately drove values higher. In contrast, the trading in other types of MBSs, such as Fannie Maes and Freddie Macs, was relatively calm during the period.
Strategy overview
There are six key strategy decisions that we make in managing the fund. The first is called term structure and reflects our views of the direction of interest rates based on factors such as economic indicators, Fed statements and strategy, and market sentiment. We also analyze the shape of the yield curve and strive to position your fund’s portfolio to benefit from expected shifts in the curve. Our second strategic decision involves sector allocation. We seek to determine the relative attractiveness of the different fixed-income sectors in which your fund can invest — Treasuries, agencies, and MBSs — and then position the portfolio to take advantage of our sector preferences. Under normal circumstances, the fund will hold at
| Market sector performance | |
| These indexes provide an overview of performance in different market sectors for the | |
| six months ended 3/31/06. | |
|
| |
| Bonds | |
| Lehman GNMA Index (Government National Mortgage Association bonds) | 0.92% |
|
| Lehman Aggregate Bond Index (broad bond market) | -0.06% |
|
| Lehman Municipal Bond Index (tax-exempt bonds) | 0.98% |
|
| JP Morgan Global High Yield Index (global high-yield corporate bonds) | 3.65% |
|
| Equities | |
| S&P 500 Index (broad stock market) | 6.38% |
|
| Russell 1000 Growth Index (large-company growth stocks) | 6.16% |
|
| Russell 1000 Value Index (large-company value stocks) | 7.27% |
|
8
least 80% of its assets in U.S. government securities, and approximately 60% in Ginnie Maes. We also weigh the relative attractiveness of the various programs in the MBS market: Ginnie Maes, Fannie Maes, and Freddie Macs. We make three other strategic decisions related to MBSs: We seek to determine which maturity is most attractive (e.g., 30-year, 15-year, or adjustable-rate); we assess which coupon level (e.g., 5.5%, 6.5%, or 7%) or what combination of coupons provides the best risk/return tradeoff; and we consider the “seasoning” of mortgages. An older or more seasoned mortgage is typically less likely to be prepaid. Prepayment interrupts the income stream and might necessitate reinvesting principal at current lower rates. Our sixth strategic decision concerns out-of-benchmark exposure: We consider the relative attractiveness of securities that are not in the fund’s primary benchmark but are allowed under the fund’s investment guidelines.
Your fund’s holdings
We believed the Fed would continue to raise short-term interest rates during the period, and we also anticipated the flattening of the yield curve. Consequently, we positioned the portfolio to take advantage of these developments. Later, we adjusted the portfolio’s duration to take advantage of a shift back to a normal-sloping yield curve. This duration strategy had a beneficial effect
Comparison of the fund's maturity and duration
This chart compares changes in the fund’s average effective maturity (a weighted average of the holdings’ maturities) and its average effective duration (a measure of its sensitivity to interest-rate changes).
| Average effective | as of 9/30/05 | 5.2 |
| maturity in years | as of 3/31/06 | 5.2 |
|
| |
| |
| Average effective | | 2.8 |
| duration in years | | 3.9 |
|
Average effective duration and average effective maturity take into account put and call features, where applicable, and reflect prepayments for mortgage-backed securities. Duration is usually shorter than maturity because it reflects interest payments on a bond prior to its maturity.
9
on the fund’s returns. During the period, the difference in returns from various coupons was negligible; thus we saw no reason prefer one coupon over another. This was not typical, as coupons generally are an important factor driving returns. Our emphasis on MBSs boosted returns, as these outperformed Treasuries. While the fund’s benchmark is composed entirely of Ginnie Mae MBSs, we believe that Fannie Maes have recently offered better valuations and greater liquidity. We consequently maintained a significant position in these securities. However, this produced a relative underweight in Ginnie Maes, which outperformed Fannie Maes during the period, and as a result, slightly detracted from relative performance.
In terms of maturities, the fund continued to emphasize 30-year mortgages. This had a slightly beneficial effect on relative returns, because 15-year mortgages, which are more prominently represented in the benchmark, lost value during the period. Although longer-maturity mortgages generally carry greater prepayment risk, prepayments typically decline in periods of rising interest rates because people are less likely to refinance their mortgages. Investors were more willing to invest in 30-year mortgages and their demand drove the value of these securities higher.
We increased the fund’s exposure to re-performing mortgages. These are formerly delinquent mortgages that are pooled together and given credit
Portfolio composition
This chart shows the fund’s portfolio composition as of 3/31/06. Weightings are shown as a percentage of net assets and are net of TBA sales positions outstanding. Holdings will vary over time.
| U.S. government | Ginnie Mae | 63.3% |
| and agency | Fannie Mae | 10.6% |
| obligations | Freddie Mac | 0.1% |
|
| |
| |
| Short-term | | |
| investments* | | 52.4% |
|
| |
| Collateralized | Fannie Mae | 17.5% |
| mortgage | Freddie Mac | 4.7% |
| obligations | Ginnie Mae | 2.3% |
|
| * | A significant portion of short-term investments reflects amounts used to settle TBA purchase commitments. For more information, see page 51. |
| |
10
protection from the Federal Housing Administration (FHA), the Veteran’s Administration (VA), and Fannie Mae. The risk of prepayment of these loans is fairly stable because mortgage borrowers who have been delinquent in the past are not able to refinance easily. By investing in re-performing mortgages, we gain exposure to mortgages that are typically 3 to 5 years old. These loans are more seasoned than most in the marketplace, following the recent wave of refinancing activity brought on by historically low interest rates.
Mortgages can be split into derivative securities, whereby one investor receives mortgage interest only (IO), and another receives mortgage principal payments only. We continued to add to the fund’s IO exposure, and we purchased principal-only (PO) securities to partially hedge the IO positions. These derivative securities represent a small portion of the portfolio but they have made a valuable contribution to performance.
Please note that the holdings discussed in this report may not have been held by the fund for the entire period. Portfolio composition is subject to review in accordance with the fund’s investment strategy and may vary in the future.
11
The outlook for your fund
The following commentary reflects anticipated developments that could affect your fund over the next six months, as well as your management team’s plans for responding to them.
A combination of factors has held down longer-term interest rates. Among them is strong foreign demand for U.S. government bonds, which still offer higher rates than are available elsewhere. Another factor is global pension reform, which has spurred demand for long-term U.S. debt. With long-term rates rising less than short-term rates, the yield curve is flatter than usual and demand for intermediate-term maturities (5 to 10 years) is lackluster. Our strategy in this environment is to emphasize shorter-term maturities, hedge the fund’s position with longer-term (30-year) maturities, and remain underweight with regard to intermediate-term maturities.
As the second half of the fiscal year began, we believed that Treasuries and agency securities were relatively expensive compared to mortgages. In our view, AAA-rated assets that are not agency-guaranteed were the most attractive of all, and we have been adding these to the portfolio in a small amount. We had been emphasizing 30-year mortgages, but we have begun to shift our emphasis to 15-year mortgages. We believe that Ginnie Maes remain too expensive compared to Fannie Maes and Freddie Macs, and so we are emphasizing the latter. We remain neutral on the question of coupons, with the exception of current 6% coupons, which we believe are trading too expensively and which we are avoiding. We continue to prefer seasoned mortgages for their lower prepayment risk. However, because these are scarce in the marketplace, we seek to take advantage of opportunities in mortgage derivatives, buying seasoned interest-only (IO) loans and combining them with newer principal-only (PO) loans to create the equivalent of mortgage pass-through securities that are more attractive than generic MBSs. Also, we still believe that FHA/VA-guaranteed re-performing mortgages are a smart way to gain exposure to seasoned loans. As always, we strive to position the fund to take advantage of attractive opportunities without assuming undue risk.
The views expressed in this report are exclusively those of Putnam Management. They are not meant as investment advice.
Mutual funds that invest in government securities are not guaranteed. Mortgage-backed securities are subject to prepayment risk. Mutual funds that invest in bonds are subject to certain risks, including interest-rate risk, credit risk, and inflation risk. As interest rates rise, the prices of bonds fall. Long-term bonds are more exposed to interest-rate risk than short-term bonds. Unlike bonds, bond funds have ongoing fees and expenses.
12
Your fund’s performance
This section shows your fund’s performance for periods ended March 31, 2006, the end of the first half of its current fiscal year. Performance should always be considered in light of a fund’s investment strategy. Data represents past performance. Past performance does not guarantee future results. More recent returns may be less or more than those shown. Investment return and principal value will fluctuate, and you may have a gain or a loss when you sell your shares. For the most recent month-end performance, please visit www.putnam.com or call Putnam at 1-800-225-1581. Class Y shares are generally only available to corporate and institutional clients. See the Terms and Definitions section in this report for definitions of the share classes offered by your fund.
| Fund performance | | | | | | | | |
| Total return for periods ended 3/31/06 | | | | | | | |
|
| |
| | Class A | | Class B | | Class C | | Class M | | Class R | Class Y |
| (inception dates) | (2/8/84) | | (4/27/92) | | (7/26/99) | | (2/6/95) | | (1/21/03) | (4/11/94) |
|
| | NAV | POP | NAV | CDSC | NAV | CDSC | NAV | POP | NAV | NAV |
| Annual average | | | | | | | | | | |
| (life of fund) | 7.19% | 7.00% | 6.30% | 6.30% | 6.38% | 6.38% | 6.84% | 6.68% | 6.92% | 7.33% |
|
| 10 years | 67.13 | 60.85 | 54.92 | 54.92 | 55.11 | 55.11 | 62.80 | 57.51 | 62.99 | 71.25 |
| Annual average | 5.27 | 4.87 | 4.47 | 4.47 | 4.49 | 4.49 | 4.99 | 4.65 | 5.01 | 5.53 |
|
| 5 years | 21.03 | 16.50 | 16.54 | 14.54 | 16.49 | 16.49 | 19.50 | 15.64 | 19.59 | 22.45 |
| Annual average | 3.89 | 3.10 | 3.11 | 2.75 | 3.10 | 3.10 | 3.63 | 2.95 | 3.64 | 4.13 |
|
| 3 years | 6.83 | 2.79 | 4.40 | 1.45 | 4.46 | 4.46 | 6.05 | 2.63 | 6.02 | 7.56 |
| Annual average | 2.23 | 0.92 | 1.45 | 0.48 | 1.47 | 1.47 | 1.98 | 0.87 | 1.97 | 2.46 |
|
| 1 year | 1.98 | –1.83 | 1.20 | –3.73 | 1.20 | 0.21 | 1.70 | –1.59 | 1.66 | 2.18 |
|
| 6 months | 0.57 | –3.19 | 0.19 | –4.76 | 0.18 | –0.81 | 0.51 | –2.75 | 0.45 | 0.71 |
|
Performance assumes reinvestment of distributions and does not account for taxes. Returns at public offering price (POP) for class A and M shares reflect a sales charge of 3.75% and 3.25%, respectively. Class B share returns reflect the applicable contingent deferred sales charge (CDSC), which is 5% in the first year, declining to 1% in the sixth year, and is eliminated thereafter. Class C shares reflect a 1% CDSC the first year that is eliminated thereafter. Class R and Y shares have no initial sales charge or CDSC. Performance for class B, C, M, R, and Y shares before their inception is derived from the historical performance of class A shares, adjusted for the applicable sales charge (or CDSC) and, except for class Y shares, the higher operating expenses for such shares.
A 2% short-term trading fee may be applied to shares exchanged or sold within 5 days of purchase.
13
| Comparative index returns | | |
| For periods ended 3/31/06 | | |
|
| |
| | | Lipper GNMA |
| | Lehman | Funds category |
| | GNMA Index | average* |
|
| Annual average | | |
| (life of fund) | 8.76% | 7.71% |
|
| 10 years | 82.74 | 68.15 |
| Annual average | 6.21 | 5.32 |
|
| 5 years | 26.73 | 22.06 |
| Annual average | 4.85 | 4.06 |
|
| 3 years | 9.73 | 6.68 |
| Annual average | 3.14 | 2.18 |
|
| 1 year | 3.03 | 2.12 |
|
| 6 months | 0.92 | 0.55 |
|
| | Index and Lipper results should be compared to fund performance at net asset value. |
| |
| * | Over the 6-month and 1-, 3-, 5-, and 10-year periods ended 3/31/06, there were 63, 62, 62, 51, and 31 funds, respectively, in this Lipper category. |
| |
14
| Fund price and distribution information | | | | |
| For the six-month period ended 3/31/06 | | | | | |
|
| |
| Distributions* | Class A | | Class B | Class C | Class M | | Class R | Class Y |
|
| Number | 6 | | 6 | 6 | 6 | | 6 | 6 |
|
| Income | $0.214 | $0.164 | $0.164 | $0.196 | $0.198 | $0.232 |
|
| Capital gains | — | | — | — | — | | — | — |
|
| Total | $0.214 | $0.164 | $0.164 | $0.196 | $0.198 | $0.232 |
|
| Share value: | NAV | POP | NAV | NAV | NAV | POP | NAV | NAV |
| 9/30/05 | $13.15 | $13.66 | $13.08 | $13.13 | $13.13 | $13.57 | $13.14 | $13.12 |
|
| 3/31/06 | 13.01 | 13.52 | 12.94 | 12.99 | 13.00 | 13.44 | 13.00 | 12.98 |
|
| Current yield | | | | | | | | |
| (end of period) | | | | | | | | |
|
| Current | | | | | | | | |
| dividend rate1 | 3.60% | 3.46% | 2.87% | 2.86% | 3.32% | 3.21% | 3.42% | 3.88% |
|
| Current 30-day | | | | | | | | |
| SEC yield2 | 4.05 | 3.89 | 3.29 | 3.29 | 3.80 | 3.67 | 3.80 | 4.30 |
|
| * | Dividend sources are estimated and may vary based on final tax calculations after the fund's fiscal year-end. |
| |
| | 1 | Most recent distribution, excluding capital gains, annualized and divided by NAV or POP at end of period. |
| | 2 | Based only on investment income, calculated using SEC guidelines. |
| |
15
Your fund’s expenses
As a mutual fund investor, you pay ongoing expenses, such as management fees, distribution fees (12b-1 fees), and other expenses. Using the information below, you can estimate how these expenses affect your investment and compare them with the expenses of other funds. You may also pay one-time transaction expenses, including sales charges (loads) and redemption fees, which are not shown in this section and would have resulted in higher total expenses. For more information, see your fund’s prospectus or talk to your financial advisor.
Review your fund’s expenses
The table below shows the expenses you would have paid on a $1,000 investment in Putnam U.S. Government Income Trust from October 1, 2005, to March 31, 2006. It also shows how much a $1,000 investment would be worth at the close of the period, assuming actual returns and expenses.
| | Class A | Class B | Class C | Class M | Class R | Class Y |
|
| Expenses paid per $1,000* | $ 4.80 | $ 8.53 | $ 8.53 | $ 6.05 | $ 6.05 | $ 3.55 |
|
| Ending value (after expenses) | $1,005.70 | $1,001.90 | $1,001.80 | $1,005.10 | $1,004.50 | $1,007.10 |
|
* Expenses for each share class are calculated using the fund’s annualized expense ratio for each class, which represents the ongoing expenses as a percentage of net assets for the six months ended 3/31/06. The expense ratio may differ for each share class (see the table at the bottom of the next page). Expenses are calculated by multiplying the expense ratio by the average account value for the period; then multiplying the result by the number of days in the period; and then dividing that result by the number of days in the year. Does not reflect the effect of a non-recurring reimbursement of certain fund expenses by Putnam. If this amount had been reflected in the table above, the fund's expenses would have been lower.
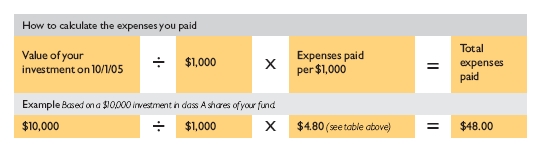
Estimate the expenses you paid
To estimate the ongoing expenses you paid for the six months ended March 31, 2006, use the calculation method below. To find the value of your investment on October 1, 2005, go to www.putnam.com and log on to your account. Click on the “Transaction History” tab in your Daily Statement and enter 10/01/05 in both the “from” and “to” fields. Alternatively, call Putnam at 1-800-225-1581.
16
Compare expenses using the SEC’s method
The Securities and Exchange Commission (SEC) has established guidelines to help investors assess fund expenses. Per these guidelines, the table below shows your fund’s expenses based on a $1,000 investment, assuming a hypothetical 5% annualized return. You can use this information to compare the ongoing expenses (but not transaction expenses or total costs) of investing in the fund with those of other funds. All mutual fund shareholder reports will provide this information to help you make this comparison. Please note that you cannot use this information to estimate your actual ending account balance and expenses paid during the period.
| | Class A | Class B | Class C | Class M | Class R | Class Y |
|
| Expenses paid per $1,000* | $ 4.84 | $ 8.60 | $ 8.60 | $ 6.09 | $ 6.09 | $ 3.58 |
|
| Ending value (after expenses) | $1,020.14 | $1,016.40 | $1,016.40 | $1,018.90 | $1,018.90 | $1,021.39 |
|
* Expenses for each share class are calculated using the fund’s annualized expense ratio for each class, which represents the ongoing expenses as a percentage of net assets for the six months ended 3/31/06. The expense ratio may differ for each share class (see the table at the bottom of this page). Expenses are calculated by multiplying the expense ratio by the average account value for the period; then multiplying the result by the number of days in the period; and then dividing that result by the number of days in the year. Does not reflect the effect of a non-recurring reimbursement of certain fund expenses by Putnam. If this amount had been reflected in the table above, the fund's expenses would have been lower.
Compare expenses using industry averages
You can also compare your fund’s expenses with the average of its peer group, as defined by Lipper, an independent fund-rating agency that ranks funds relative to others that Lipper considers to have similar investment styles or objectives. The expense ratio for each share class shown below indicates how much of your fund’s net assets have been used to pay ongoing expenses during the period.
| | Class A | Class B | Class C | Class M | Class R | Class Y |
|
| Your fund’s annualized | | | | | | |
| expense ratio* | 0.96% | 1.71% | 1.71% | 1.21% | 1.21% | 0.71% |
|
| Average annualized expense | | | | | | |
| ratio for Lipper peer group† | 1.02% | 1.77% | 1.77% | 1.27% | 1.27% | 0.77% |
|
* Does not reflect the effect of a non-recurring reimbursement of certain fund expenses by Putnam. If this amount had been
reflected in the table above, the fund's expense ratio would have been lower.
† Simple average of the expenses of all front-end load funds in the fund’s Lipper peer group, calculated in accordance with
Lipper’s standard method for comparing fund expenses (excluding 12b-1 fees and without giving effect to any expense offset
and brokerage service arrangements that may reduce fund expenses). This average reflects each fund’s expenses for its
most recent fiscal year available to Lipper as of 3/31/06. To facilitate comparison, Putnam has adjusted this average to
reflect the 12b-1 fees carried by each class of shares other than class Y shares, which do not incur 12b-1 fees. The peer group
may include funds that are significantly smaller or larger than the fund, which may limit the comparability of the fund’s
expenses to the simple average, which typically is higher than the asset-weighted average.
17
Your fund’s
portfolio turnover
Putnam funds are actively managed by teams of experts who buy and sell securities based on intensive analysis of companies, industries, economies, and markets. Portfolio turnover is a measure of how often a fund’s managers buy and sell securities for your fund. A portfolio turnover of 100%, for example, means that the managers sold and replaced securities valued at 100% of a fund’s assets within a one-year period. Funds with high turnover may be more likely to generate capital gains and dividends that must be distributed to shareholders as taxable income. High turnover may also cause a fund to pay more brokerage commissions and other transaction costs, which may detract from performance.
Funds that invest in bonds or other fixed-income instruments may have higher turnover than funds that invest only in stocks. Short-term bond funds tend to have higher turnover than longer-term bond funds, because shorter-term bonds will mature or be sold more frequently than longer-term bonds. You can use the table below to compare your fund’s turnover with the average turnover for funds in its Lipper category.
| Turnover comparisons | | | | | |
| Percentage of holdings that change every year | | | |
|
| |
| | 2005 | 2004 | 2003 | 2002 | 2001 |
| Putnam U.S. Government | | | | | |
| Income Trust | 782%* | 198%* | 332%† | 277%† | 157% |
|
| Lipper GNMA | | | | | |
| Funds category average | 315% | 286% | 383% | 313% | 259% |
|
Turnover data for the fund is calculated based on the fund's fiscal-year period, which ends on September 30. Turnover data for the fund's Lipper category is calculated based on the average of the turnover of each fund in the category for its fiscal year ended during the indicated year. Fiscal years vary across funds in the Lipper category, which may limit the comparability of the fund's portfolio turnover rate to the Lipper average. Comparative data for 2005 is based on information available as of 12/31/05.
* Excludes dollar roll transactions.
† Excludes certain Treasury note transactions executed in connection with a short-term trading strategy.
18
Your fund’s risk
This risk comparison is designed to help you understand how your fund compares with other funds. The comparison utilizes a risk measure developed by Morningstar, an independent fund-rating agency. This risk measure is referred to as the fund’s Overall Morningstar Risk.
Your fund’s Overall Morningstar® Risk
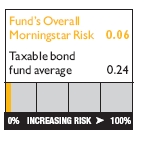
Your fund’s Overall Morningstar Risk is shown alongside that of the average fund in its broad asset class, as determined by Morningstar. The risk bar broadens the comparison by translating the fund’s Overall Morningstar Risk into a percentile, which is based on the fund’s ranking among all funds rated by Morningstar as of March 31, 2006. A higher Overall Morningstar Risk generally indicates that a fund’s monthly returns have varied more widely.
Morningstar determines a fund’s Overall Morningstar Risk by assessing variations in the fund’s monthly returns — with an emphasis on downside variations — over 3-, 5-, and 10-year periods, if available. Those measures are weighted and averaged to produce the fund’s Overall Morningstar Risk. The information shown is provided for the fund’s class A shares only; information for other classes may vary. Overall Morningstar Risk is based on historical data and does not indicate future results. Morningstar does not purport to measure the risk associated with a current investment in a fund, either on an absolute basis or on a relative basis. Low Overall Morningstar Risk does not mean that you cannot lose money on an investment in a fund. Copyright 2006 Morningstar, Inc. All Rights Reserved. The information contained herein (1) is proprietary to Morningstar and/or its content providers; (2) may not be copied or distributed; and (3) is not warranted to be accurate, complete, or timely. Neither Morningstar nor its content providers are responsible for any damages or losses arising from any use of this information.
19
Your fund’s management
Your fund is managed by the members of the Putnam Core Fixed-Income Team. Kevin Cronin is the Portfolio Leader and Rob Bloemker and Daniel Choquette are Portfolio Members of your fund. The Portfolio Leader and Portfolio Members coordinate the team’s management of the fund.
For a complete listing of the members of the Putnam Core Fixed-Income Team, including those who are not Portfolio Leaders or Portfolio Members of your fund, visit Putnam’s Individual Investor Web site at www.putnam.com.
Fund ownership by the Portfolio Leader and Portfolio Members
The table below shows how much the fund’s current Portfolio Leader and Portfolio Members have invested in the fund (in dollar ranges). Information shown is as of March 31, 2006, and March 31, 2005.
| | | | $1 – | $10,001 – | $50,001 – | $100,001 – | $500,001 – | $1,000,001 |
| | Year | $0 | $10,000 | $50,000 | $100,000 | $500,000 | $1,000,000 | and over |
|
| Kevin Cronin | 2006 | | | * | | | | |
|
|
| Portfolio Leader | 2005 | * | | | | | | |
|
| Rob Bloemker | 2006 | | | * | | | | |
|
|
| Portfolio Member | 2005 | * | | | | | | |
|
| Daniel Choquette | 2006 | * | | | | | | |
|
|
| Portfolio Member | 2005 | * | | | | | | |
|
20
Fund manager compensation
The total 2005 fund manager compensation that is attributable to your fund is approximately $1,400,000. This amount includes a portion of 2005 compensation paid by Putnam Management to the fund managers listed in this section for their portfolio management responsibilities, calculated based on the fund assets they manage taken as a percentage of the total assets they manage. The compensation amount also includes a portion of the 2005 compensation paid to the Chief Investment Officer of the team and the Group Chief Investment Officer of the fund’s broader investment category for their oversight responsibilities, calculated based on the fund assets they oversee taken as a percentage of the total assets they oversee. This amount does not include compensation of other personnel involved in research, trading, administration, systems, compliance, or fund operations; nor does it include non-compensation costs. These percentages are determined as of the fund’s fiscal period-end. For personnel who joined Putnam Management during or after 2005, the calculation reflects annualized 2005 compensation or an estimate of 2006 compensation, as applicable.
Other Putnam funds managed by the Portfolio Leader and Portfolio Members
Kevin Cronin is also a Portfolio Leader of Putnam American Government Income Fund, Putnam Global Income Trust, Putnam Income Fund, and Putnam Limited Duration Government Income Fund. He is also a Portfolio Member of Putnam Equity Income Fund.
Rob Bloemker is also a Portfolio Member of Putnam American Government Income Fund, Putnam Diversified Income Trust, Putnam Income Fund, Putnam Limited Duration Government Income Fund, Putnam Master Intermediate Income Trust, and Putnam Premier Income Trust.
Daniel Choquette is also a Portfolio Member of Putnam American Government Income Fund and Putnam Limited Duration Government Income Fund.
Kevin Cronin, Rob Bloemker, and Daniel Choquette may also manage other accounts and variable trust funds advised by Putnam Management or an affiliate.
Changes in your fund’s Portfolio Leader and Portfolio Members
Your fund’s Portfolio Leader and Portfolio Members did not change during the year ended March 31, 2006.
21
Fund ownership by Putnam’s Executive Board
The table below shows how much the members of Putnam’s Executive Board have invested in the fund (in dollar ranges). Information shown is as of March 31, 2006, and March 31, 2005.
| | | | $1 – | $10,001 – | $50,001– | $100,001 |
| | Year | $0 | $10,000 | $50,000 | $100,000 | and over |
|
| Philippe Bibi | 2006 | * | | | | |
|
|
| Chief Technology Officer | 2005 | * | | | | |
|
| Joshua Brooks | 2006 | * | | | | |
|
|
| Deputy Head of Investments | 2005 | * | | | | |
|
| William Connolly | 2006 | * | | | | |
|
|
| Head of Retail Management | N/A | | | | | |
|
| Kevin Cronin | 2006 | | | * | | |
|
|
| Head of Investments | 2005 | * | | | | |
|
| Charles Haldeman, Jr. | 2006 | | | * | | |
|
|
| President and CEO | 2005 | | | * | | |
|
| Amrit Kanwal | 2006 | * | | | | |
|
|
| Chief Financial Officer | 2005 | * | | | | |
|
| Steven Krichmar | 2006 | * | | | | |
|
|
| Chief of Operations | 2005 | * | | | | |
|
| Francis McNamara, III | 2006 | | * | | | |
|
|
| General Counsel | 2005 | | * | | | |
|
| Richard Robie, III | 2006 | * | | | | |
|
|
| Chief Administrative Officer | 2005 | * | | | | |
|
| Edward Shadek | 2006 | * | | | | |
|
|
| Deputy Head of Investments | 2005 | * | | | | |
|
| Sandra Whiston | 2006 | * | | | | |
|
|
| Head of Institutional Management | N/A | | | | | |
|
N/A indicates the individual was not a member of Putnam's Executive Board as of 3/31/05.
22
Terms and definitions
Important terms
Total return shows how the value of the fund’s shares changed over time, assuming you held the shares through the entire period and reinvested all distributions in the fund.
Net asset value (NAV) is the price, or value, of one share of a mutual fund, without a sales charge. NAVs fluctuate with market conditions. NAV is calculated by dividing the net assets of each class of shares by the number of outstanding shares in the class.
Public offering price (POP) is the price of a mutual fund share plus the maximum sales charge levied at the time of purchase. POP performance figures shown here assume the 3.75% maximum sales charge for class A shares and 3.25% for class M shares.
Contingent deferred sales charge (CDSC) is a charge applied at the time of the redemption of class B or C shares and assumes redemption at the end of the period. Your fund’s class B CDSC declines from a 5% maximum during the first year to 1% during the sixth year. After the sixth year, the CDSC no longer applies. The CDSC for class C shares is 1% for one year after purchase.
Share classes
Class A shares are generally subject to an initial sales charge and no sales charge on redemption (except on certain redemptions of shares bought without an initial sales charge).
Class B shares may be subject to a sales charge upon redemption.
Class C shares are not subject to an initial sales charge and are subject to a contingent deferred sales charge only if the shares are redeemed during the first year.
Class M shares have a lower initial sales charge and a higher 12b-1 fee than class A shares and no sales charge on redemption (except on certain redemptions of shares bought without an initial sales charge).
Class R shares are not subject to an initial sales charge or CDSC and are available only to certain defined contribution plans.
Class Y shares are not subject to an initial sales charge or CDSC, and carry no 12b-1 fee. They are only available to eligible purchasers, including eligible defined contribution plans or corporate IRAs.
23
Comparative indexes
JP Morgan Global High Yield Index is an unmanaged index of global high-yield fixed-income securities.
Lehman Aggregate Bond Index is an unmanaged index of U.S. investment-grade fixed-income securities.
Lehman GNMA Index is an unmanaged index of Government National Mortgage Association bonds.
Lehman Municipal Bond Index is an unmanaged index of long-term fixed-rate investment-grade tax-exempt bonds.
Russell 1000 Growth Index is an unmanaged index of those companies in the large-cap Russell 1000 Index chosen for their growth orientation.
Russell 1000 Value Index is an unmanaged index of those companies in the large-cap Russell 1000 Index chosen for their value orientation.
S&P 500 Index is an unmanaged index of common stock performance.
Indexes assume reinvestment of all distributions and do not account for fees. Securities and performance of a fund and an index will differ. You cannot invest directly in an index.
Lipper is a third-party industry-ranking entity that ranks mutual funds. Its rankings do not reflect sales charges. Lipper rankings are based on total return at net asset value relative to other funds that have similar current investment styles or objectives as determined by Lipper. Lipper may change a fund’s category assignment at its discretion. Lipper category averages reflect performance trends for funds within a category.
24
Trustee approval of
management contract
General conclusions
The Board of Trustees of the Putnam funds oversees the management of each fund and, as required by law, determines annually whether to approve the continuance of your fund’s management contract with Putnam Management. In this regard, the Board of Trustees, with the assistance of its Contract Committee consisting solely of Trustees who are not “interested persons” (as such term is defined in the Investment Company Act of 1940, as amended) of the Putnam funds (the “Independent Trustees”), requests and evaluates all information it deems reasonably necessary under the circumstances. Over the course of several months beginning in March and ending in June 2005, the Contract Committee met five times to consider the information provided by Putnam Management and other information developed with the assistance of the Board’s independent counsel and independent staff. The Contract Committee reviewed and discussed key aspects of this information with all of the Independent Trustees. Upon completion of this review, the Contract Committee recommended and the Independent Trustees approved the continuance of your fund’s management contract, effective July 1, 2005.
This approval was based on the following conclusions:
* That the fee schedule currently in effect for your fund represents reasonable compensation in light of the nature and quality of the services being provided to the fund, the fees paid by competitive funds and the costs incurred by Putnam Management in providing such services, and
* That such fee schedule represents an appropriate sharing between fund shareholders and Putnam Management of such economies of scale as may exist in the management of the fund at current asset levels.
These conclusions were based on a comprehensive consideration of all information provided to the Trustees and were not the result of any single factor. Some of the factors that figured particularly in the Trustees’ deliberations and how the Trustees considered these factors are described below, although individual Trustees may have evaluated the information presented differently, giving different weights to various factors. It is also important to recognize that the fee arrangements for your fund and the other Putnam funds are the result of many years of review and discussion between the Independent Trustees and Putnam Management, that certain aspects of such arrangements may receive greater scrutiny in some years than others, and that the Trustees’ conclusions may be based, in part, on their consideration of these same arrangements in prior years.
25
Model fee schedules and categories; total expenses
The Trustees’ review of the management fees and total expenses of the Putnam funds focused on three major themes:
* Consistency. The Trustees, working in cooperation with Putnam Management, have developed and implemented a series of model fee schedules for the Putnam funds designed to ensure that each fund’s management fee is consistent with the fees for similar funds in the Putnam family of funds and compares favorably with fees paid by competitive funds sponsored by other investment advisors. Under this approach, each Putnam fund is assigned to one of several fee categories based on a combination of factors, including competitive fees and perceived difficulty of management, and a common fee schedule is implemented for all funds in a given fee category. The Trustees reviewed the model fee schedule currently in effect for your fund, including fee levels and breakpoints, and the assignment of the fund to a particular fee category under this structure. (“Breakpoints” refer to reductions in fee rates that apply to additional assets once specified asset levels are reached.) The Trustees concluded that no changes should be made in the fund’s current fee schedule at this time.
* Competitiveness. The Trustees also reviewed comparative fee and expense information for competitive funds, which indicated that, in a custom peer group of competitive funds selected by Lipper Inc., your fund ranked in the 50th percentile in management fees and in the 40th percentile in total expenses (less any applicable 12b-1 fees) as of December 31, 2004 (the first percentile being the least expensive funds and the 100th percentile being the most expensive funds). (Because the fund’s custom peer group is smaller than the fund’s broad Lipper Inc. peer group, this expense comparison may differ from the Lipper peer expense information found elsewhere in this report.) The Trustees noted that expense ratios for a number of Putnam funds, which show the percentage of fund assets used to pay for management and administrative services, distribution (12b-1) fees and other expenses, had been increasing recently as a result of declining net assets and the natural operation of fee breakpoints. They noted that such expense ratio increases were currently being controlled by expense limitations implemented in January 2004 and which Putnam Management, in consultation with the Contract Committee, has committed to maintain at least through 2006. The Trustees expressed their intention to monitor this information closely to ensure that fees and expenses of the Putnam funds continue to meet evolving competitive standards.
* Economies of scale. The Trustees concluded that the fee schedule currently in effect for your fund represents an appropriate sharing of economies of scale at current asset levels. Your fund currently has the benefit of breakpoints in its management fee that provide shareholders with significant economies of scale, which means that the effective management fee rate of a fund (as a percentage of fund assets) declines as a fund grows in size and crosses specified asset thresholds. The Trustees examined the existing breakpoint structure of the Putnam funds’ management fees in light of competitive industry practices. The Trustees considered various possible modifications to the Putnam funds’ current breakpoint structure, but
26
ultimately concluded that the current breakpoint structure continues to serve the interests of fund shareholders. Accordingly, the Trustees continue to believe that the fee schedules currently in effect for the funds represent an appropriate sharing of economies of scale at current asset levels. The Trustees noted that significant redemptions in many Putnam funds, together with significant changes in the cost structure of Putnam Management, have altered the economics of Putnam Management’s business in significant ways. In view of these changes, the Trustees intend to consider whether a greater sharing of the economies of scale by fund shareholders would be appropriate if and when aggregate assets in the Putnam funds begin to experience meaningful growth.
In connection with their review of the management fees and total expenses of the Putnam funds, the Trustees also reviewed the costs of the services to be provided and profits to be realized by Putnam Management and its affiliates from the relationship with the funds. This information included trends in revenues, expenses and profitability of Putnam Management and its affiliates relating to the investment management and distribution services provided to the funds. In this regard, the Trustees also reviewed an analysis of Putnam Management’s revenues, expenses and profitability with respect to the funds’ management contracts, allocated on a fund-by-fund basis.
Investment performance
The quality of the investment process provided by Putnam Management represented a major factor in the Trustees’ evaluation of the quality of services provided by Putnam Management under your fund’s management contract. The Trustees were assisted in their review of the funds’ investment process and performance by the work of the Investment Oversight Committees of the Trustees, which meet on a regular monthly basis with the funds’ portfolio teams throughout the year. The Trustees concluded that Putnam Management generally provides a high-quality investment process — as measured by the experience and skills of the individuals assigned to the management of fund portfolios, the resources made available to such personnel, and in general the ability of Putnam Management to attract and retain high-quality personnel — but also recognize that this does not guarantee favorable investment results for every fund in every time period. The Trustees considered the investment performance of each fund over multiple time periods and considered information comparing the fund’s performance with various benchmarks and with the performance of competitive funds. The Trustees noted the satisfactory investment performance of many Putnam funds. They also noted the disappointing investment performance of certain funds in recent years and continued to discuss with senior management of Putnam Management the factors contributing to such underperformance and actions being taken to improve performance. The Trustees recognized that, in recent years, Putnam Management has made significant changes in its investment personnel and processes and in the fund product line to address areas of
27
underperformance. The Trustees indicated their intention to continue to monitor performance trends to assess the effectiveness of these changes and to evaluate whether additional remedial changes are warranted.
In the case of your fund, the Trustees considered that your fund’s class A share cumulative total return performance at net asset value was in the following percentiles of its Lipper Inc. peer group (Lipper GNMA Funds) for the one-, three- and five-year periods ended December 31, 2004 (the first percentile being the best-performing funds and the 100th percentile being the worst-performing funds):
| One-year period | Three-year period | Five-year period |
|
| 51st | 61st | 66th |
(Because of the passage of time, these performance results may differ from the performance results for more recent periods shown elsewhere in this report. Over the one-, three-, and five-year periods ended December 31, 2004, there were 64, 57, and 46 funds, respectively, in your fund’s Lipper peer group.* Past performance is no guarantee of future performance.)
As a general matter, the Trustees believe that cooperative efforts between the Trustees and Putnam Management represent the most effective way to address investment performance problems. The Trustees believe that investors in the Putnam funds have, in effect, placed their trust in the Putnam organization, under the oversight of the funds’ Trustees, to make appropriate decisions regarding the management of the funds. Based on the responsiveness of Putnam Management in the recent past to Trustee concerns about investment performance, the Trustees believe that it is preferable to seek change within Putnam Management to address performance shortcomings. In the Trustees’ view, the alternative of terminating a management contract and engaging a new investment advisor for an underperforming fund would entail significant disruptions and would not provide any greater assurance of improved investment performance.
Brokerage and soft-dollar allocations; other benefits
The Trustees considered various potential benefits that Putnam Management may receive in connection with the services it provides under the management contract with your fund. These include principally benefits related to brokerage and soft-dollar allocations, whereby a portion of the commissions paid by a fund for brokerage is earmarked to pay for research services that may be utilized by a fund’s investment advisor, subject to the obligation to seek best execution. The Trustees believe that soft-dollar credits and other potential benefits associated with the allocation of fund brokerage, which pertains mainly to funds investing in equity securities,
* The percentile rankings for your fund’s class A share annualized total return performance in the Lipper GNMA Fund category for the one-, five-, and ten-year periods ended March 31, 2006, were 59%, 60%, and 60%, respectively. Over the one-, five-, and ten-year periods ended March 31, 2006, the fund ranked 37th out of 62, 31st out of 51, and 19th out of 31 funds, respectively. Note that this more recent information was not available when the Trustees approved the continuance of your fund’s management contract.
28
represent assets of the funds that should be used for the benefit of fund shareholders. This area has been marked by significant change in recent years. In July 2003, acting upon the Contract Committee’s recommendation, the Trustees directed that allocations of brokerage to reward firms that sell fund shares be discontinued no later than December 31, 2003. In addition, commencing in 2004, the allocation of brokerage commissions by Putnam Management to acquire research services from third-party service providers has been significantly reduced, and continues at a modest level only to acquire research that is customarily not available for cash. The Trustees will continue to monitor the allocation of the funds’ brokerage to ensure that the principle of “best price and execution” remains paramount in the portfolio trading process.
The Trustees’ annual review of your fund’s management contract also included the review of its distributor’s contract and distribution plan with Putnam Retail Management Limited Partnership and the custodian agreement and investor servicing agreement with Putnam Fiduciary Trust Company, all of which provide benefits to affiliates of Putnam Management.
Comparison of retail and institutional fee schedules
The information examined by the Trustees as part of their annual contract review has included for many years information regarding fees charged by Putnam Management and its affiliates to institutional clients such as defined benefit pension plans, college endowments, etc. This information included comparison of such fees with fees charged to the funds, as well as a detailed assessment of the differences in the services provided to these two types of clients. The Trustees observed, in this regard, that the differences in fee rates between institutional clients and the mutual funds are by no means uniform when examined by individual asset sectors, suggesting that differences in the pricing of investment management services to these types of clients reflect to a substantial degree historical competitive forces operating in separate market places. The Trustees considered the fact that fee rates across all asset sectors are higher on average for mutual funds than for institutional clients, as well as the differences between the services that Putnam Management provides to the Putnam funds and those that it provides to institutional clients of the firm, but have not relied on such comparisons to any significant extent in concluding that the management fees paid by your fund are reasonable.
29
Other information
for shareholders
Important notice regarding delivery of shareholder documents
In accordance with SEC regulations, Putnam sends a single copy of annual and semiannual shareholder reports, prospectuses, and proxy statements to Putnam shareholders who share the same address. If you prefer to receive your own copy of these documents, please call Putnam at 1-800-225-1581, and Putnam will begin sending individual copies within 30 days.
Proxy voting
Putnam is committed to managing our mutual funds in the best interests of our shareholders. The Putnam funds’ proxy voting guidelines and procedures, as well as information regarding how your fund voted proxies relating to portfolio securities during the 12-month period ended June 30, 2005, are available on the Putnam Individual Investor Web site, www.putnam.com/individual, and on the SEC’s Web site, www.sec.gov. If you have questions about finding forms on the SEC’s Web site, you may call the SEC at 1-800-SEC-0330. You may also obtain the Putnam funds’ proxy voting guidelines and procedures at no charge by calling Putnam’s Shareholder Services at 1-800-225-1581.
Fund portfolio holdings
The fund will file a complete schedule of its portfolio holdings with the SEC for the first and third quarters of each fiscal year on Form N-Q. Shareholders may obtain the fund’s Forms N-Q on the SEC’s Web site at www.sec.gov. In addition, the fund’s Forms N-Q may be reviewed and copied at the SEC’s Public Reference Room in Washington, D.C. You may call the SEC at 1-800-SEC-0330 for information about the SEC’s Web site or the operation of the Public Reference Room.
30
Putnam’s policy on confidentiality
In order to conduct business with our shareholders, we must obtain certain personal information such as account holders’ addresses, telephone numbers, Social Security numbers, and the names of their financial advisors. We use this information to assign an account number and to help us maintain accurate records of transactions and account balances. It is our policy to protect the confidentiality of your information, whether or not you currently own shares of our funds, and in particular, not to sell information about you or your accounts to outside marketing firms. We have safeguards in place designed to prevent unauthorized access to our computer systems and procedures to protect personal information from unauthorized use. Under certain circumstances, we share this information with outside vendors who provide services to us, such as mailing and proxy solicitation. In those cases, the service providers enter into confidentiality agreements with us, and we provide only the information necessary to process transactions and perform other services related to your account. We may also share this information with our Putnam affiliates to service your account or provide you with information about other Putnam products or services. It is also our policy to share account information with your financial advisor, if you’ve listed one on your Putnam account. If you would like clarification about our confidentiality policies or have any questions or concerns, please don’t hesitate to contact us at 1-800-225-1581, Monday through Friday, 8:30 a.m. to 7:00 p.m., or Saturdays from 9:00 a.m. to 5:00 p.m. Eastern Time.
31
Financial statements
A guide to financial statements
These sections of the report, as well as the accompanying Notes, constitute the fund’s financial statements.
The fund’s portfolio lists all the fund’s investments and their values as of the last day of the reporting period. Holdings are organized by asset type and industry sector, country, or state to show areas of concentration and diversification.
Statement of assets and liabilities shows how the fund’s net assets and share price are determined. All investment and noninvestment assets are added together. Any unpaid expenses and other liabilities are subtracted from this total. The result is divided by the number of shares to determine the net asset value per share, which is calculated separately for each class of shares. (For funds with preferred shares, the amount subtracted from total assets includes the liquidation preference of preferred shares.)
Statement of operations shows the fund’s net investment gain or loss. This is done by first adding up all the fund’s earnings — from dividends and interest income — and subtracting its operating expenses to determine net investment income (or loss). Then, any net gain or loss the fund realized on the sales of its holdings — as well as any unrealized gains or losses over the period — is added to or subtracted from the net investment result to determine the fund’s net gain or loss for the fiscal period.
Statement of changes in net assets shows how the fund’s net assets were affected by the fund’s net investment gain or loss, by distributions to shareholders, and by changes in the number of the fund’s shares. It lists distributions and their sources (net investment income or realized capital gains) over the current reporting period and the most recent fiscal year-end. The distributions listed here may not match the sources listed in the Statement of operations because the distributions are determined on a tax basis and may be paid in a different period from the one in which they were earned. Dividend sources are estimated at the time of declaration. Actual results may vary. Any non-taxable return of capital cannot be determined until final tax calculations are completed after the end of the fund’s fiscal year.
Financial highlights provide an overview of the fund’s investment results, per-share distributions, expense ratios, net investment income ratios, and portfolio turnover in one summary table, reflecting the five most recent reporting periods. In a semiannual report, the highlight table also includes the current reporting period.
32
The fund’s portfolio 3/31/06 (Unaudited)
| U.S. GOVERNMENT AND AGENCY MORTGAGE OBLIGATIONS (126.3%)* | |
| | Principal amount | Value |
|
| U.S. Government Guaranteed Mortgage Obligations (106.9%) | | |
| Government National Mortgage Association | | |
| Adjustable Rate Mortgages | | |
| 4 1/2s, August 20, 2034 $ | 27,386,560 $ | 27,083,035 |
| 3 3/4s, January 20, 2034 | 21,444,708 | 21,083,579 |
| 3 1/2s, with due dates from January 20, 2035 | | |
| to February 20, 2035 | 73,566,685 | 72,679,098 |
| Government National Mortgage Association | | |
| Graduated Payment Mortgages | | |
| 13 3/4s, November 20, 2014 | 6,643 | 8,032 |
| 13 1/2s, April 15, 2011 | 22,556 | 25,795 |
| 13 1/4s, December 20, 2014 | 17,695 | 21,168 |
| 12 3/4s, with due dates from November 15, 2013 | | |
| to December 20, 2014 | 44,812 | 52,682 |
| 12 1/2s, June 15, 2010 | 9,982 | 11,065 |
| 12 1/4s, with due dates from September 15, 2013 | | |
| to March 15, 2014 | 79,921 | 92,678 |
| 11 1/4s, with due dates from September 15, 2015 | | |
| to January 15, 2016 | 149,853 | 172,041 |
| 10s, with due dates from November 15, 2009 | | |
| to November 15, 2009 | 36,108 | 38,249 |
| 9 1/4s, with due dates from April 15, 2016 to May 15, 2016 | 27,863 | 30,218 |
| Government National Mortgage Association | | |
| Pass-Through Certificates | | |
| 8 1/2s, with due dates from June 15, 2006 to | | |
| December 15, 2019 | 61,297 | 62,286 |
| 8s, with due dates from May 15, 2024 to August 15, 2032 | 26,680,143 | 28,329,477 |
| 8s, with due dates from January 15, 2008 to | | |
| November 15, 2009 | 2,026,503 | 2,078,596 |
| 7 1/2s, with due dates from October 15, 2021 | | |
| to November 15, 2032 | 34,697,125 | 36,478,902 |
| 7 1/2s, with due dates from March 15, 2017 to May 15, 2017 | 36,408 | 37,908 |
| 7s, with due dates from March 15, 2022 to May 15, 2032 | 40,883,875 | 42,858,598 |
| 7s, with due dates from October 15, 2007 to August 15, 2012 | 2,048,314 | 2,079,437 |
| 6 1/2s, with due dates from October 15, 2023 to | | |
| March 15, 2035 | 14,366,618 | 14,956,889 |
| 6s, with due dates from November 15, 2023 to | | |
| October 15, 2033 | 1,525,825 | 1,544,767 |
| 6s, TBA, May 1, 2036 | 124,000,000 | 125,293,283 |
| 6s, TBA, April 1, 2036 | 277,000,000 | 280,137,884 |
| 5 1/2s, with due dates from December 15, 2032 | | |
| to December 15, 2035 | 40,133,297 | 39,794,666 |
| 5 1/2s, TBA, May 1, 2036 | 107,000,000 | 105,829,688 |
| 5 1/2s, TBA, April 1, 2036 | 350,000,000 | 345,406,222 |
| 5 1/2s, TBA, April 1, 2036 | 321,000,000 | 317,739,860 |
| | | 1,463,926,103 |
33
| U.S. GOVERNMENT AND AGENCY MORTGAGE OBLIGATIONS (126.3%)* continued | | |
| | | Principal amount | | Value |
|
| U.S. Government Agency Mortgage Obligations (19.4%) | | | | |
| Federal Home Loan Mortgage Corporation | | | | |
| Pass-Through Certificates | | | | |
| 5 1/2s, with due dates from August 1, 2013 to May 1, 2020 | $ | 795,244 | $ | 790,898 |
| 5s, May 1, 2034 | | 767,916 | | 731,680 |
| Federal National Mortgage Association | | | | |
| Pass-Through Certificates | | | | |
| 7s, with due dates from September 1, 2028 to March 1, 2029 | | 227,008 | | 234,589 |
| 6 1/2s, with due dates from March 1, 2024 | | | | |
| to September 1, 2032 | | 181,438 | | 185,400 |
| 6 1/2s, March 1, 2016 | | 42,356 | | 43,017 |
| 6s, November 1, 2017 | | 235,134 | | 238,321 |
| 5 1/2s, with due dates from February 1, 2021 | | | | |
| to February 1, 2036 | | 6,405,542 | | 6,351,653 |
| 5 1/2s, with due dates from January 1, 2009 | | | | |
| to January 1, 2021 | | 36,754,253 | | 36,546,217 |
| 5 1/2s, TBA, May 1, 2036 | | 52,400,000 | | 51,090,000 |
| 5 1/2s, TBA, April 1, 2036 | | 170,982,000 | | 166,867,746 |
| 5 1/2s, TBA, April 1, 2021 | | 490,000 | | 486,899 |
| 5s, August 1, 2033 | | 2,082 | | 1,987 |
| 4 1/2s, with due dates from April 1, 2020 to June 1, 2034 | | 2,562,430 | | 2,403,171 |
| 4 1/2s, TBA, April 1, 2036 | | 100,000 | | 92,219 |
| | | | | 266,063,797 |
|
| |
| Total U.S. government and agency mortgage obligations (cost $1,732,060,017) | $ | 1,729,989,900 |
|
| |
| |
| COLLATERALIZED MORTGAGE OBLIGATIONS (24.5%)* | | | | |
| | | Principal amount | | Value |
|
| Fannie Mae | | | | |
| FRB Ser. 05-45, Class FG, 22.306s, 2035 | $ | 939,038 | $ | 1,026,139 |
| IFB Ser. 03-130, Class SJ, 8.727s, 2034 | | 526,890 | | 525,889 |
| Ser. 06-20, Class IP, IO (Interest only), 8s, 2030 | | 1,000,000 | | 205,237 |
| Ser. 02-26, Class A2, 7 1/2s, 2048 | | 553,155 | | 575,472 |
| Ser. 05-W3, Class 1A, 7 1/2s, 2045 | | 4,855,680 | | 5,079,088 |
| Ser. 04-W8, Class 3A, 7 1/2s, 2044 | | 7,793,376 | | 8,139,038 |
| Ser. 04-W11, Class 1A4, 7 1/2s, 2044 | | 2,579,201 | | 2,692,431 |
| Ser. 04-W2, Class 5A, 7 1/2s, 2044 | | 2,886,782 | | 3,014,219 |
| Ser. 04-T3, Class 1A4, 7 1/2s, 2044 | | 3,390,069 | | 3,537,577 |
| Ser. 04-W9, Class 2A3, 7 1/2s, 2044 | | 3,123,303 | | 3,257,632 |
| Ser. 04-T2, Class 1A4, 7 1/2s, 2043 | | 927,758 | | 968,087 |
| Ser. 03-W4, Class 4A, 7 1/2s, 2042 | | 1,354,730 | | 1,407,374 |
| Ser. 02-T18, Class A4, 7 1/2s, 2042 | | 2,101,069 | | 2,187,759 |
| Ser. 03-W3, Class 1A3, 7 1/2s, 2042 | | 6,246,294 | | 6,504,182 |
| Ser. 02-T16, Class A3, 7 1/2s, 2042 | | 14,766 | | 15,372 |
| Ser. 03-W2, Class 1A3, 7 1/2s, 2042 | | 7,654,357 | | 7,971,388 |
| Ser. 02-W6, Class 2A, 7 1/2s, 2042 | | 22,789 | | 23,690 |
| Ser. 02-W4, Class A5, 7 1/2s, 2042 | | 2,276,380 | | 2,367,512 |
| Ser. 02-W1, Class 2A, 7 1/2s, 2042 | | 182,421 | | 189,016 |
| Ser. 02-14, Class A2, 7 1/2s, 2042 | | 680,046 | | 706,893 |
34
| COLLATERALIZED MORTGAGE OBLIGATIONS (24.5%)* continued | | | | |
| | Principal amount | | Value |
|
| Fannie Mae continued | | | | |
| Ser. 01-T10, Class A2, 7 1/2s, 2041 | $ | 4,265,677 | $ | 4,426,893 |
| Ser. 02-T4, Class A3, 7 1/2s, 2041 | | 297,282 | | 308,593 |
| Ser. 01-T12, Class A2, 7 1/2s, 2041 | | 424,199 | | 440,242 |
| Ser. 01-T8, Class A1, 7 1/2s, 2041 | | 1,132,730 | | 1,173,831 |
| Ser. 01-T7, Class A1, 7 1/2s, 2041 | | 13,855,915 | | 14,349,363 |
| Ser. 01-T3, Class A1, 7 1/2s, 2040 | | 1,594,935 | | 1,652,876 |
| Ser. 01-T1, Class A1, 7 1/2s, 2040 | | 4,806,043 | | 4,987,806 |
| Ser. 99-T2, Class A1, 7 1/2s, 2039 | | 1,971,643 | | 2,055,645 |
| Ser. 03-W10, Class 1A1, 7 1/2s, 2032 | | 2,782,342 | | 2,891,505 |
| Ser. 02-T1, Class A3, 7 1/2s, 2031 | | 4,392,395 | | 4,562,577 |
| Ser. 00-T6, Class A1, 7 1/2s, 2030 | | 1,201,782 | | 1,244,581 |
| Ser. 02-W7, Class A5, 7 1/2s, 2029 | | 835,950 | | 869,960 |
| Ser. 01-T4, Class A1, 7 1/2s, 2028 | | 4,579,363 | | 4,786,128 |
| Ser. 02-W3, Class A5, 7 1/2s, 2028 | | 1,489,396 | | 1,548,195 |
| IFB Ser. 06-27, Class SP, 7.443s, 2036 | | 1,614,000 | | 1,595,512 |
| IFB Ser. 05-74, Class CP, 7.084s, 2035 | | 2,725,045 | | 2,712,539 |
| IFB Ser. 05-76, Class SA, 7.084s, 2034 | | 1,927,688 | | 1,893,327 |
| Ser. 02-26, Class A1, 7s, 2048 | | 3,072,573 | | 3,157,436 |
| Ser. 04-W12, Class 1A3, 7s, 2044 | | 2,042,922 | | 2,107,407 |
| Ser. 04-T3, Class 1A3, 7s, 2044 | | 1,411,485 | | 1,455,311 |
| Ser. 04-T2, Class 1A3, 7s, 2043 | | 1,233,723 | | 1,272,124 |
| Ser. 03-W8, Class 2A, 7s, 2042 | | 12,190,245 | | 12,553,021 |
| Ser. 03-W3, Class 1A2, 7s, 2042 | | 1,184,208 | | 1,218,692 |
| Ser. 02-T16, Class A2, 7s, 2042 | | 8,474,279 | | 8,719,070 |
| Ser. 02-T19, Class A2, 7s, 2042 | | 5,626,811 | | 5,791,663 |
| Ser. 01-T10, Class A1, 7s, 2041 | | 2,349,894 | | 2,412,307 |
| Ser. 02-T4, Class A2, 7s, 2041 | | 5,538,759 | | 5,687,841 |
| Ser. 04-W1, Class 2A2, 7s, 2033 | | 7,579,265 | | 7,812,329 |
| IFB Ser. 06-8, Class HP, 6.9s, 2036 | | 2,106,966 | | 2,066,695 |
| IFB Ser. 06-8, Class WK, 6.9s, 2036 | | 3,146,000 | | 3,070,562 |
| IFB Ser. 05-106, Class US, 6.9s, 2035 | | 3,316,347 | | 3,298,624 |
| IFB Ser. 05-99, Class SA, 6.9s, 2035 | | 1,610,751 | | 1,578,476 |
| IFB Ser. 05-74, Class CS, 6.77s, 2035 | | 3,106,457 | | 3,064,263 |
| IFB Ser. 05-74, Class DM, 6.717s, 2035 | | 3,117,977 | | 3,045,713 |
| IFB Ser. 05-114, Class SP, 6.33s, 2036 | | 899,501 | | 850,591 |
| IFB Ser. 05-95, Class CP, 5.576s, 2035 | | 260,424 | | 252,055 |
| Ser. 350, Class 2, IO, 5 1/2s, 2034 | | 13,761,928 | | 3,345,215 |
| Ser. 329, Class 2, IO, 5 1/2s, 2033 | | 26,537,903 | | 6,485,192 |
| IFB Ser. 05-83, Class QP, 4.867s, 2034 | | 1,024,277 | | 929,236 |
| IFB Ser. 05-93, Class AS, 4.83s, 2034 | | 917,962 | | 816,161 |
| IFB Ser. 05-57, Class MN, 4.598s, 2035 | | 2,283,647 | | 2,154,094 |
| IFB Ser. 05-56, Class TP, 3.696s, 2033 | | 588,272 | | 517,185 |
| IFB Ser. 03-66, Class SA, IO, 2.832s, 2033 | | 3,269,768 | | 227,347 |
| IFB Ser. 03-48, Class S, IO, 2.732s, 2033 | | 1,430,684 | | 99,261 |
| IFB Ser. 05-113, Class DI, IO, 2.412s, 2036 | | 808,005 | | 47,691 |
| IFB Ser. 04-51, Class S0, IO, 2.232s, 2034 | | 807,852 | | 40,393 |
| Ser. 03-W12, Class 2, IO, 2.229s, 2043 | | 41,885,679 | | 2,060,432 |
| IFB Ser. 05-65, Class KI, IO, 2.182s, 2035 | | 1,259,317 | | 70,697 |
| IFB Ser. 06-20, Class BI, IO, 2.01s, 2036 | | 30,483,000 | | 1,385,146 |
35
| COLLATERALIZED MORTGAGE OBLIGATIONS (24.5%)* continued | | | | |
| | Principal amount | | Value |
|
| Fannie Mae continued | | | | |
| IFB Ser. 05-90, Class SP, IO, 1.932s, 2035 | $ | 5,054,394 | $ | 311,856 |
| IFB Ser. 06-20, Class PI, IO, 1.93s, 2030 | | 8,430,000 | | 325,917 |
| IFB Ser. 05-82, Class SW, IO, 1.912s, 2035 | | 12,156,892 | | 537,563 |
| IFB Ser. 05-82, Class SY, IO, 1.912s, 2035 | | 15,469,526 | | 684,043 |
| IFB Ser. 05-45, Class EW, IO, 1.902s, 2035 | | 903,746 | | 44,037 |
| IFB Ser. 05-47, Class SW, IO, 1.902s, 2035 | | 7,998,268 | | 345,863 |
| IFB Ser. 05-105, Class S, IO, 1.882s, 2035 | | 2,345,586 | | 115,813 |
| IFB Ser. 05-95, Class CI, IO, 1.882s, 2035 | | 3,459,409 | | 189,492 |
| IFB Ser. 05-84, Class SG, IO, 1.882s, 2035 | | 6,107,883 | | 372,914 |
| IFB Ser. 05-87, Class SG, IO, 1.882s, 2035 | | 7,771,367 | | 390,997 |
| IFB Ser. 05-89, Class S, IO, 1.882s, 2035 | | 22,047,333 | | 963,710 |
| IFB Ser. 05-69, Class AS, IO, 1.882s, 2035 | | 1,619,581 | | 85,787 |
| IFB Ser. 05-104, Class NI, IO, 1.882s, 2035 | | 1,021,672 | | 66,008 |
| IFB Ser. 04-92, Class S, IO, 1.882s, 2034 | | 4,946,463 | | 255,831 |
| IFB Ser. 05-104, Class SI, IO, 1.882s, 2033 | | 7,719,620 | | 446,251 |
| IFB Ser. 05-83, Class QI, IO, 1.872s, 2035 | | 849,847 | | 55,458 |
| IFB Ser. 05-92, Class SC, IO, 1.862s, 2035 | | 8,150,604 | | 445,757 |
| IFB Ser. 05-83, Class SL, IO, 1.852s, 2035 | | 16,062,931 | | 813,601 |
| IFB Ser. 06-8, Class NS, IO, 1.812s, 2036 | | 9,694,374 | | 531,488 |
| IFB Ser. 05-95, Class OI, IO, 1.772s, 2035 | | 480,869 | | 31,023 |
| IFB Ser. 03-124, Class ST, IO, 1.682s, 2034 | | 2,292,669 | | 89,552 |
| IFB Ser. 03-112, Class SA, IO, 1.682s, 2028 | | 3,110,078 | | 99,687 |
| IFB Ser. 05-67, Class BS, IO, 1.332s, 2035 | | 4,146,600 | | 162,624 |
| IFB Ser. 05-73, Class ST, IO, 1.312s, 2035 | | 1,902,760 | | 64,961 |
| IFB Ser. 05-74, Class SE, IO, 1.282s, 2035 | | 1,718,024 | | 53,275 |
| IFB Ser. 05-82, Class SI, IO, 1.282s, 2035 | | 13,404,468 | | 396,898 |
| IFB Ser. 05-74, Class NI, IO, 1.262s, 2035 | | 14,176,597 | | 602,096 |
| IFB Ser. 05-87, Class SE, IO, 1.232s, 2035 | | 30,930,301 | | 1,024,566 |
| IFB Ser. 04-54, Class SW, IO, 1.182s, 2033 | | 1,890,610 | | 48,505 |
| Ser. 05-113, Class DO, PO (Principal only), zero %, 2036 | | 124,447 | | 98,066 |
| Ser. 363, Class 1, PO, zero %, 2035 | | 32,295,652 | | 22,957,332 |
| Ser. 361, Class 1, PO, zero %, 2035 | | 9,473,314 | | 7,247,315 |
| Ser. 04-38, Class AO, PO, zero %, 2034 | | 1,624,058 | | 1,149,275 |
| Ser. 342, Class 1, PO, zero %, 2033 | | 1,000,077 | | 762,621 |
| Ser. 02-82, Class TO, PO, zero %, 2032 | | 3,800,159 | | 2,892,263 |
| Ser. 04-61, Class CO, PO, zero %, 2031 | | 3,326,000 | | 2,491,382 |
| Ser. 05-38, PO, zero %, 2031 | | 325,000 | | 230,852 |
| FRB Ser. 05-117, Class GF, zero %, 2036 | | 373,745 | | 349,160 |
| FRB Ser. 05-79, Class FE, zero %, 2035 | | 1,194,404 | | 1,315,715 |
| FRB Ser. 05-81, Class DF, zero %, 2033 | | 369,375 | | 402,618 |
| Federal Home Loan Mortgage Corp. Structured | | | | |
| Pass-Through Securities | | | | |
| Ser. T-59, Class 1A3, 7 1/2s, 2043 | | 8,469,533 | | 8,852,451 |
| Ser. T-58, Class 4A, 7 1/2s, 2043 | | 10,655,981 | | 11,083,361 |
| Ser. T-42, Class A5, 7 1/2s, 2042 | | 121,009 | | 125,724 |
| Ser. T-41, Class 3A, 7 1/2s, 2032 | | 1,654,527 | | 1,717,274 |
| Ser. T-60, Class 1A2, 7s, 2044 | | 5,537,488 | | 5,706,438 |
| Ser. T-59, Class 1A2, 7s, 2043 | | 5,167,773 | | 5,332,493 |
| Ser. T-55, Class 1A2, 7s, 2043 | | 3,066,858 | | 3,142,992 |
36
| COLLATERALIZED MORTGAGE OBLIGATIONS (24.5%)* continued | | | | |
| | | Principal amount | | Value |
|
| Freddie Mac | | | | |
| IFB Ser. 2963, Class SV, 9.605s, 2034 | $ | 677,000 | $ | 693,846 |
| IFB Ser. 3081, Class DC, 7.791s, 2035 | | 1,274,040 | | 1,232,786 |
| IFB Ser. 3114, Class GK, 7.405s, 2036 | | 815,659 | | 792,612 |
| Ser. 3114, Class BL, IO, 7 1/2s, 2030 | | 385,400 | | 73,508 |
| IFB Ser. 2979, Class AS, 6.861s, 2034 | | 574,643 | | 554,710 |
| IFB Ser. 2996, Class SA, 6.741s, 2035 | | 1,119,941 | | 1,038,745 |
| IFB Ser. 3072, Class SA, 6.715s, 2035 | | 497,768 | | 460,125 |
| IFB Ser. 3072, Class SM, 6.385s, 2035 | | 792,733 | | 721,944 |
| IFB Ser. 3072, Class SB, 6.238s, 2035 | | 748,308 | | 677,424 |
| IFB Ser. 3065, Class DC, 5.614s, 2035 | | 1,953,710 | | 1,764,765 |
| IFB Ser. 3012, Class UP, 5.014s, 2035 | | 141,357 | | 134,658 |
| IFB Ser. 3050, Class SA, 5.003s, 2034 | | 1,341,899 | | 1,192,501 |
| IFB Ser. 3031, Class BS, 4.853s, 2035 | | 2,705,992 | | 2,439,456 |
| IFB Ser. 3012, Class GP, 4.583s, 2035 | | 1,516,061 | | 1,418,063 |
| IFB Ser. 2594, Class SE, IO, 2.301s, 2030 | | 4,016,725 | | 200,836 |
| IFB Ser. 2828, Class TI, IO, 2.301s, 2030 | | 1,922,820 | | 124,382 |
| IFB Ser. 3033, Class SF, IO, 2.051s, 2035 | | 2,868,213 | | 119,210 |
| IFB Ser. 3028, Class ES, IO, 2.001s, 2035 | | 9,299,293 | | 633,509 |
| IFB Ser. 3042, Class SP, IO, 2.001s, 2035 | | 2,081,759 | | 135,939 |
| IFB Ser. 3045, Class DI, IO, 1.981s, 2035 | | 801,368 | | 36,623 |
| IFB Ser. 2981, Class AS, IO, 1.971s, 2035 | | 5,188,236 | | 222,108 |
| IFB Ser. 2981, Class BS, IO, 1.971s, 2035 | | 2,695,534 | | 118,765 |
| IFB Ser. 2981, Class CS, IO, 1.971s, 2035 | | 3,551,307 | | 156,471 |
| IFB Ser. 3054, Class CS, IO, 1.951s, 2035 | | 2,142,722 | | 99,101 |
| IFB Ser. 3107, Class DC, IO, 1.951s, 2035 | | 4,587,607 | | 334,752 |
| IFB Ser. 3066, Class SI, IO, 1.951s, 2035 | | 12,572,914 | | 838,954 |
| IFB Ser. 3031, Class BI, IO, 1.941s, 2035 | | 1,827,703 | | 115,880 |
| IFB Ser. 3067, Class SI, IO, 1.901s, 2035 | | 7,270,591 | | 499,203 |
| IFB Ser. 3114, Class TS, IO, 1.901s, 2030 | | 14,683,537 | | 606,512 |
| IFB Ser. 3114, Class BI, IO, 1.901s, 2030 | | 5,781,004 | | 222,920 |
| IFB Ser. 3065, Class DI, IO, 1.871s, 2035 | | 1,420,688 | | 84,217 |
| IFB Ser. 3114, Class GI, IO, 1.851s, 2036 | | 2,029,189 | | 126,469 |
| IFB Ser. 3081, Class DI, IO, 1.731s, 2035 | | 1,761,736 | | 98,539 |
| IFB Ser. 3012, Class UI, IO, 1.671s, 2035 | | 3,577,492 | | 163,944 |
| IFB Ser. 3016, Class SP, IO, 1.361s, 2035 | | 1,874,322 | | 57,111 |
| IFB Ser. 3016, Class SQ, IO, 1.361s, 2035 | | 4,321,673 | | 133,713 |
| IFB Ser. 2937, Class SY, IO, 1.351s, 2035 | | 1,868,027 | | 49,970 |
| IFB Ser. 3012, Class IG, IO, 1.331s, 2035 | | 13,089,552 | | 524,037 |
| IFB Ser. 2957, Class SW, IO, 1.251s, 2035 | | 10,507,818 | | 305,383 |
| IFB Ser. 2815, Class S, IO, 1.251s, 2032 | | 4,347,123 | | 124,919 |
| Ser. 3045, Class DO, PO, zero %, 2035 | | 86,336 | | 65,526 |
| Ser. 231, PO, zero %, 2035 | | 2,769,484 | | 1,999,776 |
| Ser. 228, PO, zero %, 2035 | | 4,534,664 | | 3,428,801 |
| FRB Ser. 3022, Class TC, zero %, 2035 | | 403,898 | | 473,571 |
| FRB Ser. 2986, Class XT, zero %, 2035 | | 238,324 | | 262,678 |
| FRB Ser. 2958, Class FL, zero %, 2035 | | 1,028,344 | | 993,708 |
| FRB Ser. 3046, Class WF, zero %, 2035 | | 573,480 | | 567,137 |
| FRB Ser. 3054, Class XF, zero %, 2034 | | 239,197 | | 248,315 |
| FRB Ser. 3024, Class CW, zero %, 2034 | | 347,058 | | 349,049 |
37
| COLLATERALIZED MORTGAGE OBLIGATIONS (24.5%)* continued | | | | |
| | | Principal amount | | Value |
|
| Freddie Mac continued | | | | |
| FRB Ser. 3046, Class UF, zero %, 2033 | $ | 1,083,530 | $ | 1,091,345 |
| FRB Ser. 3030, Class CF, zero %, 2035 | | 944,500 | | 1,098,128 |
| Government National Mortgage Association | | | | |
| IFB Ser. 05-84, Class SB, 5.059s, 2035 | | 4,940,898 | | 4,477,611 |
| IFB Ser. 05-84, Class SL, 4.997s, 2035 | | 4,888,478 | | 4,337,604 |
| IFB Ser. 05-66, Class SP, 4.997s, 2035 | | 2,270,679 | | 2,020,581 |
| IFB Ser. 05-68, Class DP, 4.986s, 2035 | | 7,356,685 | | 6,759,253 |
| IFB Ser. 05-7, Class NP, 4.136s, 2033 | | 767,964 | | 710,645 |
| IFB Ser. 06-10, Class SM, IO, 1.62s, 2036 | | 41,649,000 | | 1,652,945 |
| IFB Ser. 05-65, Class SI, IO, 1.574s, 2035 | | 18,446,376 | | 732,737 |
| IFB Ser. 06-14, Class S, IO, 1.56s, 2036 | | 17,850,000 | | 627,539 |
| IFB Ser. 06-7, Class SB, IO, 1.544s, 2036 | | 16,952,380 | | 580,089 |
| IFB Ser. 05-82, Class KS, IO, 1.524s, 2035 | | 10,040,703 | | 392,215 |
| IFB Ser. 05-68, Class KI, IO, 1.524s, 2035 | | 83,812,105 | | 4,807,028 |
| IFB Ser. 05-68, Class SI, IO, 1.524s, 2035 | | 31,753,951 | | 1,400,080 |
| IFB Ser. 05-57, Class PS, IO, 1.474s, 2035 | | 10,587,378 | | 483,049 |
| IFB Ser. 05-51, Class SJ, IO, 1.424s, 2035 | | 9,532,854 | | 357,482 |
| IFB Ser. 05-68, Class S, IO, 1.424s, 2035 | | 18,842,570 | | 750,902 |
| IFB Ser. 04-90, Class SI, IO, 1.324s, 2034 | | 16,274,551 | | 536,572 |
| IFB Ser. 05-60, Class SJ, IO, 1.004s, 2034 | | 15,393,955 | | 428,106 |
|
| Total collateralized mortgage obligations (cost $352,551,794) | | | $ | 335,859,785 |
|
| |
| |
| SHORT-TERM INVESTMENTS (52.4%)* | | | | |
| | | Principal amount | | Value |
|
| Interest in $582,000,000 joint tri-party repurchase | | | | |
| agreement dated March 31, 2006 with UBS | | | | |
| Securities, LLC due April 3, 2006 with respect | | | | |
| to various U.S. Government obligations — maturity | | | | |
| value of $127,292,215 for an effective yield of 4.83% | | | | |
| (collateralized by Fannie Mae and Freddie Mac | | | | |
| with yields ranging from 3.50% to 12.00% and due | | | | |
| dates ranging from July 1, 2006 to April 1, 2036, | | | | |
| valued at $593,642,766) | $ | 127,241,000 | $ | 127,241,000 |
| Interest in $564,000,000 joint tri-party repurchase | | | | |
| agreement dated March 31, 2006 with Bank of America | | | | |
| Securities, LLC due April 3, 2006 with respect | | | | |
| to various U.S. Government obligations — maturity | | | | |
| value of $155,721,523 for an effective yield of 4.82% | | | | |
| (collateralized by Fannie Mae with a yield of 5.00% | | | | |
| and a due date of March 1, 2035, valued at | | | | |
| $575,280,000) | | 155,659,000 | | 155,659,000 |
| U.S. Treasury Bills 4.38%, April 13, 2006 # | | 22,000 | | 21,968 |
| U.S. Treasury Bills 4.37%, April 13, 2006 # | | 56,000 | | 55,919 |
| U.S. Treasury Bills 4.35%, April 13, 2006 # | | 147,000 | | 146,787 |
| U.S. Treasury Bills 4.28%, April 13, 2006 # | | 1,305,000 | | 1,303,140 |
38
| SHORT-TERM INVESTMENTS (52.4%)* continued | | | |
| | | Principal amount | | Value |
|
| Federal Home Loan Banks for an effective yield | | | |
| of 4.60%, April 19, 2006 | | $ 152,000,000 | $ | 151,651,920 |
| Freddie Mac for an effective yield of 4.60%, | | | | |
| April 18, 2006 | | 77,000,000 | | 76,833,466 |
| Federal Home Loan Banks for an effective yield | | | |
| of 4.60%, April 17, 2006 | | 129,406,000 | | 129,142,299 |
| Federal Home Loan Banks for an effective yield | | | |
| of 4.51%, April 7, 2006 | | 75,000,000 | | 74,943,875 |
|
| Total short-term investments (cost $716,999,374) | | $ | 716,999,374 |
|
| |
| PURCHASED OPTIONS OUTSTANDING (0.2%)* | | | |
|
| | Expiration date/ | Contract | | |
| | strike price | amount | | Value |
|
| Option on an interest rate swap with | | | | |
| JPMorgan Chase Bank, N.A. for the | | | | |
| obligation to pay a fixed rate of 5.28% | | | | |
| versus the three month USD-LIBOR- | | | | |
| BBA maturing on March 8, 2017 | Mar 07/$5.28 | 55,104,000 | $ | 1,579,275 |
| Option on an interest rate swap with | | | | |
| JPMorgan Chase Bank, N.A. for the | | | | |
| right to receive a fixed rate of 5.28% | | | | |
| versus the three month USD-LIBOR- | | | | |
| BBA maturing on March 8, 2017 | Mar 07/$5.28 | 55,104,000 | | 1,014,641 |
|
| Total purchased options outstanding (cost $2,702,852) | | $ | 2,593,916 |
|
| |
| TOTAL INVESTMENTS | | | | |
| Total investments (cost $2,804,314,037) | | | $ | 2,785,442,975 |
| |
| * Percentages indicated are based on net assets of $1,368,796,537. | | | |
# These securities were pledged and segregated with the custodian to cover margin requirements for futures contracts at March 31, 2006.
At March 31, 2006, liquid assets totaling $677,897,099 have been designated as collateral for open forward commitments.
TBA after the name of a security represents to be announced securities (Note 1).
The rates shown on Floating Rate Bonds (FRB) are the current interest rates at March 31, 2006.
Inverse Floating Rate Bonds (IFB) are securities that pay interest rates that vary inversely to changes in the market interest rates. As interest rates rise, inverse floaters produce less current income. The interest rates shown are the current interest rates at March 31, 2006.
39
| FUTURES CONTRACTS OUTSTANDING at 3/31/06 (Unaudited) | | |
|
| | | | | Unrealized |
| | Number of | | Expiration | appreciation/ |
| | contracts | Value | date | (depreciation) |
|
| Euro 90 day (Long) | 3,090 | $731,849,540 | Sep-06 | $(1,458,540) |
| Euro 90 day (Short) | 3,090 | 732,291,375 | Mar-07 | 3,004,841 |
| U.S. Treasury Bond 20 yr (Long) | 326 | 35,584,938 | Jun-06 | (697,485) |
| U.S. Treasury Note 10 yr (Long) | 1,639 | 174,374,234 | Jun-06 | (1,168,732) |
| U.S. Treasury Note 2 yr (Short) | 1,767 | 360,219,516 | Jun-06 | 279,772 |
| U.S. Treasury Note 5 yr (Short) | 3,059 | 319,474,313 | Jun-06 | 1,686,070 |
|
| Total | | | | $ 1,645,926 |
|
| |
| |
| WRITTEN OPTIONS OUTSTANDING at 3/31/06 (premiums received $15,061,636) (Unaudited) |
|
| | Contract | Expiration date/ | |
| | amount | strike price | | Value |
|
| Option on an interest rate swap with | | | | |
| JPMorgan Chase Bank, N.A. for the right | | | | |
| to receive a fixed rate of 4.55% versus | | | | |
| the three month USD-LIBOR-BBA | | | | |
| maturing on July 5, 2017. | 44,780,000 | Jul-07 / $4.55 | $ 289,825 |
| | | |
| Option on an interest rate swap with | | | | |
| Lehman Brothers Special Financing, Inc. | | | | |
| for the obligation to pay a fixed rate swap | | | | |
| of 5.085% semi-annually versus the three | | | | |
| month USD-LIBOR-BBA maturing | | | | |
| February 1, 2017. | 187,183,000 | Jan-07 / $5.085 | 6,789,876 |
| | | |
| Option on an interest rate swap with | | | | |
| Lehman Brothers Special Financing, Inc. | | | | |
| for the right to receive a fixed rate swap | | | | |
| of 5.085% semi-annually versus the three | | | | |
| month USD-LIBOR-BBA maturing | | | | |
| February 1, 2017. | 187,183,000 | Jan-07 / $5.085 | 2,202,208 |
| | | |
| Option on an interest rate swap with | | | | |
| JPMorgan Chase Bank, N.A. for the | | | | |
| obligation to pay a fixed rate of 4.55% | | | | |
| versus the three month USD-LIBOR- | | | | |
| BBA maturing on July 5, 2017. | 44,780,000 | Jul-07 / $4.55 | 3,132,231 |
| | | |
| Option on an interest rate swap with | | | | |
| Lehman Brothers International for the | | | | |
| obligation to pay a fixed rate of 5.225% | | | | |
| semi-annually versus the three month | | | | |
| USD-LIBOR-BBA maturing | | | | |
| March 5, 2018. | 24,625,000 | Mar-08 / $5.225 | 1,039,077 |
| | | |
| Option on an interest rate swap with | | | | |
| Lehman Brothers International for the | | | | |
| right to receive a fixed rate of 5.225% | | | | |
| semi-annually versus the three month | | | | |
| USD-LIBOR-BBA maturing | | | | |
| March 5, 2018. | 24,625,000 | Mar-08 / $5.225 | 640,250 |
|
| Total | | | | $14,093,467 |
40
| TBA SALE COMMITMENTS OUTSTANDING at 3/31/06 (proceeds receivable $719,282,930) (Unaudited) |
|
| | | | Principal | Settlement | |
| | | | amount | date | Value |
|
| FNMA, 5 1/2s, April 1, 2036 | | $122,400,000 | 4-12-06 | $119,454,750 |
| GNMA, 5 1/2s, April 1, 2036 | | 321,000,000 | 4-20-06 | 317,739,860 |
| GNMA, 6s, April 1, 2036 | | 277,000,000 | 4-20-06 | 280,137,884 |
|
| Total | | | | | $717,332,494 |
|
| |
| |
| INTEREST RATE SWAP CONTRACTS OUTSTANDING at 3/31/06 (Unaudited) | | |
|
| | | | Fixed payments | Unrealized |
| Swap counterparty / | Termination | Payments made by | received by | | appreciation/ |
| Notional amount | date | fund per annum | fund per annum | (depreciation) |
|
| Bank of America, N.A. | | | | | |
| $ 47,000,000 | 10/21/15 | 4.943% | 3 month USD-LIBOR-BBA | $ 920,541 |
|
| Citibank, N.A. | | | | | |
| 116,000,000 | 6/28/15 | 3 month USD-LIBOR-BBA | 4.335% | | (7,541,498) |
|
| JPMorgan Chase Bank, N.A. | | | | |
| 6,078,000 | 8/2/15 | 4.6757% | 3 month USD-LIBOR-BBA | (312,699) |
|
| 43,000,000 | 10/21/15 | 4.916% | 3 month USD-LIBOR-BBA | 933,357 |
|
| Lehman Brothers Special Financing, Inc. | | | | |
| 176,214,000 | 12/19/15 | 5.0265% | 3 month USD-LIBOR-BBA | 2,590,625 |
|
| 58,000,000 | 6/28/15 | 3 month USD-LIBOR-BBA | 4.3275% | | (3,803,191) |
|
| 39,900,000 | 6/29/07 | 3.9334% | 3 month USD-LIBOR-BBA | 260,599 |
|
| 7,300,000 | 6/29/15 | 4.3059% | 3 month USD-LIBOR-BBA | 488,876 |
|
| Total | | | | | $(6,463,390) |
The accompanying notes are an integral part of these financial statements.
41
| Statement of assets and liabilities 3/31/06 (Unaudited) | |
|
| |
| ASSETS | |
| Investments in securities, at value (Note 1): | |
| Unaffiliated issuers (identified cost $2,521,414,037) | $2,502,542,975 |
|
| Repurchase agreements (identified cost $282,900,000) (Note 1) | 282,900,000 |
|
| Interest and other receivables | 5,645,392 |
|
| Cash | 1,140,652 |
|
| Receivable for shares of the fund sold | 169,849 |
|
| Receivable for securities sold | 3,778,998 |
|
| Receivable for sales of delayed delivery securities (Note 1) | 721,297,588 |
|
| Unrealized appreciation on swap contracts (Note 1) | 5,193,998 |
|
| Total assets | 3,522,669,452 |
|
| |
| LIABILITIES | |
| Payable for variation margin (Note 1) | 97,344 |
|
| Payable for securities purchased | 3,918,146 |
|
| Payable for purchase of delayed delivery securities (Note 1) | 1,401,003,004 |
|
| Payable for shares of the fund repurchased | 2,599,732 |
|
| Payable for compensation of Manager (Note 2) | 1,724,522 |
|
| Payable for investor servicing and custodian fees (Note 2) | 147,311 |
|
| Payable for Trustee compensation and expenses (Note 2) | 253,739 |
|
| Payable for administrative services (Note 2) | 2,500 |
|
| Payable for distribution fees (Note 2) | 900,634 |
|
| Written options outstanding, at value (premiums received $15,061,636) (Note 1) | 14,093,467 |
|
| Unrealized depreciation on swap contracts (Note 1) | 11,657,388 |
|
| TBA sales commitments, at value (proceeds receivable $719,282,930) (Note 1) | 717,332,494 |
|
| Other accrued expenses | 142,634 |
|
| Total liabilities | 2,153,872,915 |
|
| Net assets | $1,368,796,537 |
|
| |
| REPRESENTED BY | |
| Paid-in capital (Unlimited shares authorized) (Notes 1 and 4) | $1,415,141,931 |
|
| Undistributed net investment income (Note 1) | 16,645,608 |
|
| Accumulated net realized loss on investments (Note 1) | (42,221,081) |
|
| Net unrealized depreciation of investments | (20,769,921) |
|
| Total — Representing net assets applicable to capital shares outstanding | $1,368,796,537 |
| |
| (Continued on next page) | |
42
Statement of assets and liabilities (Continued)
| COMPUTATION OF NET ASSET VALUE AND OFFERING PRICE | |
| Net asset value and redemption price per class A share | |
| ($1,145,814,307 divided by 88,062,817 shares) | $13.01 |
|
| Offering price per class A share | |
| (100/96.25 of $13.01)* | $13.52 |
|
| Net asset value and offering price per class B share | |
| ($165,014,444 divided by 12,750,495 shares)** | $12.94 |
|
| Net asset value and offering price per class C share | |
| ($18,194,062 divided by 1,400,669 shares)** | $12.99 |
|
| Net asset value and redemption price per class M share | |
| ($34,528,971 divided by 2,656,281 shares) | $13.00 |
|
| Offering price per class M share | |
| (100/96.75 of $13.00)*** | $13.44 |
|
| Net asset value, offering price and redemption price per class R share | |
| ($328,080 divided by 25,232 shares) | $13.00 |
|
| Net asset value, offering price and redemption price per class Y share | |
| ($4,916,673 divided by 378,683 shares) | $12.98 |
* On single retail sales of less than $100,000. On sales of $100,000 or more and on group sales, the offering price is reduced.
** Redemption price per share is equal to net asset value less any applicable contingent deferred sales charge.
*** On single retail sales of less than $50,000. On sales of $50,000 or more and on group sales, the offering price is reduced.
The accompanying notes are an integral part of these financial statements.
43
| Statement of operations Six months ended 3/31/06 (Unaudited) | |
|
| |
| |
| INTEREST INCOME | $ 33,910,164 |
|
| |
| EXPENSES | |
| Compensation of Manager (Note 2) | 3,567,700 |
|
| Investor servicing fees (Note 2) | 984,031 |
|
| Custodian fees (Note 2) | 322,257 |
|
| Trustee compensation and expenses (Note 2) | 31,573 |
|
| Administrative services (Note 2) | 21,488 |
|
| Distribution fees - Class A (Note 2) | 1,496,492 |
|
| Distribution fees - Class B (Note 2) | 927,517 |
|
| Distribution fees - Class C (Note 2) | 95,380 |
|
| Distribution fees - Class M (Note 2) | 94,964 |
|
| Distribution fees - Class R (Note 2) | 609 |
|
| Other | 193,899 |
|
| Non-recurring costs (Notes 2 and 5) | 7,144 |
|
| Costs assumed by Manager (Notes 2 and 5) | (7,144) |
|
| Fees reimbursed by Manager or affiliate (Note 5) | (325,955) |
|
| Total expenses | 7,409,955 |
|
| Expense reduction (Note 2) | (924,702) |
|
| Net expenses | 6,485,253 |
|
| Net investment income | 27,424,911 |
|
| Net realized loss on investments (Notes 1 and 3) | (12,391,005) |
|
| Net realized gain on swap contracts (Note 1) | 3,117,384 |
|
| Net realized gain on futures contracts (Note 1) | 2,198,362 |
|
| Net unrealized depreciation of investments, futures | |
| contracts, swap contracts, written options, and TBA sale | |
| commitments during the period | (12,594,233) |
|
| Net loss on investments | (19,669,492) |
|
| Net increase in net assets resulting from operations | $ 7,755,419 |
The accompanying notes are an integral part of these financial statements.
44
| Statement of changes in net assets | |
|
| |
| DECREASE IN NET ASSETS | | |
|
| | Six months ended | Year ended |
| | 3/31/06* | 9/30/05 |
|
| Operations: | | |
| Net investment income | $ 27,424,911 | $ 45,455,188 |
|
| Net realized gain (loss) on investments | (7,075,259) | 27,402,729 |
|
| Net unrealized depreciation of investments | (12,594,233) | (34,274,339) |
|
| Net increase in net assets resulting from operations | 7,755,419 | 38,583,578 |
|
| Distributions to shareholders: (Note 1) | | |
|
| From net investment income | | |
|
| Class A | (19,619,809) | (41,530,313) |
|
| Class B | (2,344,691) | (5,793,230) |
|
| Class C | (239,470) | (526,743) |
|
| Class M | (563,685) | (1,289,095) |
|
| Class R | (3,647) | (2,820) |
|
| Class Y | (131,250) | (533,749) |
|
| Redemption fees (Note 1) | 5,539 | 8,222 |
|
| Decrease from capital share transactions (Note 4) | (148,772,839) | (298,319,566) |
|
| Total decrease in net assets | (163,914,433) | (309,403,716) |
|
| |
| NET ASSETS | | |
| Beginning of period | 1,532,710,970 | 1,842,114,686 |
|
| End of period (including undistributed net investment | | |
| income of $16,645,608 and $12,123,249, respectively) | $1,368,796,537 | $1,532,710,970 |
| * Unaudited | | |
The accompanying notes are an integral part of these financial statements.
45
Financial highlights (For a common share outstanding throughout the period)
| INVESTMENT OPERATIONS: | | | | LESS DISTRIBUTIONS: | | | | RATIOS AND SUPPLEMENTAL DATA: | |
|
| | | | | Net | | | | | | Total | | | Ratio of net | |
| | | Net asset | | realized and | Total | From | | | Net asset | return | Net | Ratio of | investment | |
| | | value, | Net | unrealized | from | net | | | value, | at net | assets, | expenses to | income (loss) | Portfolio |
| | | beginning | investment | gain (loss) on | investment | investment | Total | Redemption | end | asset | end of period | average net | to average | turnover |
| Period ended | | of period | income (loss)(a) | investments | operations | income | distributions | fees | of period | value (%)(b) | (in thousands) | assets (%)(c) | net assets (%) | (%) |
|
| CLASS A | | | | | | | | | | | | | | |
| March 31, 2006** | | $13.15 | .25(d) | (.18) | .07 | (.21) | (.21) | —(e) | $13.01 | .57* | $1,145,814 | .46*(d) | 1.94*(d) | 442.62*(f ) |
| September 30, 2005 | | 13.24 | .37 | (.05) | .32 | (.41) | (.41) | —(e) | 13.15 | 2.43 | 1,255,038 | .94 | 2.83 | 781.82(f ) |
| September 30, 2004 | | 13.20 | .42 | (.06) | .36 | (.32) | (.32) | —(e) | 13.24 | 2.81 | 1,441,252 | .94 | 3.24 | 198.47(f) |
| September 30, 2003 | | 13.22 | .28 | .05 | .33 | (.35) | (.35) | — | 13.20 | 2.52 | 2,022,134 | .88 | 2.12 | 331.95(g) |
| September 30, 2002 | | 13.10 | .62 | .19 | .81 | (.69) | (.69) | — | 13.22 | 6.41 | 2,432,891 | .85 | 4.74 | 277.25(g) |
| September 30, 2001 | | 12.55 | .75 | .56 | 1.31 | (.76) | (.76) | — | 13.10 | 10.74 | 2,256,218 | .86 | 5.87 | 156.53(g) |
|
| |
| CLASS B | | | | | | | | | | | | | | |
| March 31, 2006** | | $13.08 | .20(d) | (.18) | .02 | (.16) | (.16) | —(e) | $12.94 | .19* | $165,014 | .83*(d) | 1.58*(d) | 442.62*(f ) |
| September 30, 2005 | | 13.17 | .27 | (.05) | .22 | (.31) | (.31) | —(e) | 13.08 | 1.64 | 205,275 | 1.69 | 2.07 | 781.82(f ) |
| September 30, 2004 | | 13.12 | .32 | (.05) | .27 | (.22) | (.22) | —(e) | 13.17 | 2.12 | 297,159 | 1.69 | 2.46 | 198.47(f ) |
| September 30, 2003 | | 13.15 | .18 | .04 | .22 | (.25) | (.25) | — | 13.12 | 1.67 | 529,386 | 1.63 | 1.38 | 331.95(g) |
| September 30, 2002 | | 13.04 | .51 | .20 | .71 | (.60) | (.60) | — | 13.15 | 5.59 | 691,467 | 1.60 | 3.96 | 277.25(g) |
| September 30, 2001 | | 12.49 | .65 | .56 | 1.21 | (.66) | (.66) | — | 13.04 | 9.98 | 500,366 | 1.61 | 5.15 | 156.53(g) |
|
| |
| CLASS C | | | | | | | | | | | | | | |
| March 31, 2006** | | $13.13 | .21(d) | (.19) | .02 | (.16) | (.16) | —(e) | $12.99 | .18* | $18,194 | .83*(d) | 1.57*(d) | 442.62*(f ) |
| September 30, 2005 | | 13.22 | .27 | (.05) | .22 | (.31) | (.31) | —(e) | 13.13 | 1.64 | 19,784 | 1.69 | 2.08 | 781.82(f) |
| September 30, 2004 | | 13.17 | .32 | (.05) | .27 | (.22) | (.22) | —(e) | 13.22 | 2.08 | 26,181 | 1.69 | 2.44 | 198.47(f ) |
| September 30, 2003 | | 13.20 | .18 | .04 | .22 | (.25) | (.25) | — | 13.17 | 1.70 | 53,235 | 1.63 | 1.34 | 331.95(g) |
| September 30, 2002 | | 13.08 | .50 | .21 | .71 | (.59) | (.59) | — | 13.20 | 5.64 | 54,880 | 1.60 | 3.93 | 277.25(g) |
| September 30, 2001 | | 12.53 | .64 | .58 | 1.22 | (.67) | (.67) | — | 13.08 | 9.99 | 27,512 | 1.61 | 5.07 | 156.53(g) |
|
| |
| CLASS M | | | | | | | | | | | | | | |
| March 31, 2006** | | $13.13 | .24(d) | (.17) | .07 | (.20) | (.20) | —(e) | $13.00 | .51* | $34,529 | .58*(d) | 1.82*(d) | 442.62*(f ) |
| September 30, 2005 | | 13.23 | .34 | (.07) | .27 | (.37) | (.37) | —(e) | 13.13 | 2.08 | 39,845 | 1.19 | 2.58 | 781.82(f ) |
| September 30, 2004 | | 13.18 | .39 | (.05) | .34 | (.29) | (.29) | —(e) | 13.23 | 2.61 | 50,649 | 1.19 | 2.99 | 198.47(f) |
| September 30, 2003 | | 13.20 | .27 | .02 | .29 | (.31) | (.31) | — | 13.18 | 2.25 | 73,355 | 1.13 | 2.03 | 331.95(g) |
| September 30, 2002 | | 13.08 | .57 | .21 | .78 | (.66) | (.66) | — | 13.20 | 6.14 | 171,975 | 1.10 | 4.47 | 277.25(g) |
| September 30, 2001 | | 12.52 | .71 | .57 | 1.28 | (.72) | (.72) | — | 13.08 | 10.56 | 144,285 | 1.11 | 5.60 | 156.53(g) |
|
| |
| CLASS R | | | | | | | | | | | | | | |
| March 31, 2006** | | $13.14 | .24(d) | (.18) | .06 | (.20) | (.20) | —(e) | $13.00 | .45* | $328 | .58*(d) | 1.81*(d) | 442.62*(f) |
| September 30, 2005 | | 13.24 | .35 | (.07) | .28 | (.38) | (.38) | —(e) | 13.14 | 2.14 | 166 | 1.19 | 2.60 | 781.82(f ) |
| September 30, 2004 | | 13.20 | .39 | (.06) | .33 | (.29) | (.29) | —(e) | 13.24 | 2.54 | 44 | 1.19 | 2.98 | 198.47(f ) |
| September 30,2003† | | 13.22 | .18 | (.02) | .16 | (.18) | (.18) | — | 13.20 | 1.23* | 1 | .78* | 1.30* | 331.95(g) |
|
| |
| CLASS Y | | | | | | | | | | | | | | |
| March 31, 2006** | | $13.12 | .27(d) | (.18) | .09 | (.23) | (.23) | —(e) | $12.98 | .71* | $4,917 | .33*(d) | 2.06*(d) | 442.62*(f) |
| September 30, 2005 | | 13.22 | .40 | (.06) | .34 | (.44) | (.44) | —(e) | 13.12 | 2.64 | 12,603 | .69 | 3.05 | 781.82(f) |
| September 30, 2004 | | 13.18 | .46 | (.06) | .40 | (.36) | (.36) | —(e) | 13.22 | 3.09 | 26,829 | .69 | 3.45 | 198.47(f) |
| September 30, 2003 | | 13.21 | .31 | .04 | .35 | (.38) | (.38) | — | 13.18 | 2.73 | 52,590 | .63 | 2.39 | 331.95(g) |
| September 30, 2002 | | 13.09 | .62 | .23 | .85 | (.73) | (.73) | — | 13.21 | 6.71 | 70,445 | .60 | 4.92 | 277.25(g) |
| September 30, 2001 | | 12.54 | .78 | .56 | 1.34 | (.79) | (.79) | — | 13.09 | 11.05 | 43,306 | .61 | 6.11 | 156.53(g) |
|
See notes to financial highlights at the end of this section.
The accompanying notes are an integral part of these financial statements.
Financial highlights (Continued)
* Not annualized.
** Unaudited.
† For the period January 21, 2003 (commencement of operations) to September 30, 2003.
(a) Per share net investment income (loss) has been determined on the basis of the weighted average number of shares
outstanding during the period.
(b) Total return assumes dividend reinvestment and does not reflect the effect of sales charges.
(c) Includes amounts paid through expense offset arrangements (Note 2).
(d) Reflects a non-recurring accrual related to a reimbursement to the fund from Putnam Investments relating to the calculation
of certain amounts paid by the fund to Putnam in previous years for transfer agent services, in the following amounts (Note 5):
| | | Percentage |
| | Per share | of net assets |
|
| Class A | <$0.01 | 0.02% |
|
| Class B | <0.01 | 0.02 |
|
| Class C | <0.01 | 0.02 |
|
| Class M | <0.01 | 0.02 |
|
| Class R | <0.01 | 0.02 |
|
| Class Y | <0.01 | 0.02 |
|
(e) Amount represents less than $0.01 per share.
(f) Portfolio turnover excludes dollar roll transactions.
(g) Portfolio turnover excludes certain treasury note transactions executed in connection with a short-term trading strategy.
The accompanying notes are an integral part of these financial statements.
48
Notes to financial statements 3/31/06 (Unaudited)
Note 1: Significant accounting policies
Putnam U.S. Government Income Trust (the “fund”), a Massachusetts business trust, which is registered under the Investment Company Act of 1940, as amended, as a diversified, open-end management investment company. The fund’s investment objective is to seek as high a level of current income as is consistent with preservation of capital by investing mainly in securities which have short to long-term maturities of the U.S. government, its agencies and instrumentalities. The fund may also invest in AAA-rated mortgage-backed and other asset-backed securities of non-governmental issues.
The fund offers class A, class B, class C, class M, class R and class Y shares. Class A and class M shares are sold with a maximum front-end sales charge of 3.75% and 3.25%, respectively, and generally do not pay a contingent deferred sales charge. Class B shares, which convert to class A shares after approximately eight years, do not pay a front-end sales charge and are subject to a contingent deferred sales charge, if those shares are redeemed within six years of purchase. Class C shares have a one-year 1.00% contingent deferred sales charge and do not convert to class A shares. Class R shares, which are offered to qualified employee-benefit plans are sold without a front-end sales charge or a contingent deferred sales charge. The expenses for class A, class B, class C, class M and class R shares may differ based on the distribution fee of each class, which is identified in Note 2. Class Y shares, which are sold at net asset value, are generally subject to the same expenses as class A, class B, class C, class M and class R shares, but do not bear a distribution fee. Class Y shares are sold to certain eligible purchasers including certain defined contribution plans (including corporate IRAs), bank trust departments and trust companies.
A 2.00% redemption fee may apply to any shares that are redeemed (either by selling or exchanging into another fund) within 5 days of purchase. The redemption fee is accounted for as an addition to paid-in-capital. Investment income, realized and unrealized gains and losses and expenses of the fund are borne pro-rata based on the relative net assets of each class to the total net assets of the fund, except that each class bears expenses unique to that class (including the distribution fees applicable to such classes). Each class votes as a class only with respect to its own distribution plan or other matters on which a class vote is required by law or determined by the Trustees. Shares of each class would receive their pro-rata share of the net assets of the fund, if the fund were liquidated. In addition, the Trustees declare separate dividends on each class of shares.
In the normal course of business, the fund enters into contracts that may include agreements to indemnify another party under given circumstances. The fund’s maximum exposure under these arrangements is unknown as this would involve future claims that may be, but have not yet been, made against the fund. However, the fund expects the risk of material loss to be remote.
The following is a summary of significant accounting policies consistently followed by the fund in the preparation of its financial statements. The preparation of financial statements is in conformity with accounting principles generally accepted in the United States of America and requires management to make estimates and assumptions that affect the reported amounts of assets and liabilities in the financial statements and the reported amounts of increases and decreases in net assets from operations during the reporting period. Actual results could differ from those estimates.
A) Security valuation Investments, including mortgage-backed securities, are valued on the basis of valuations provided by an independent pricing service, approved by the Trustees. Such service providers use information with respect to transactions in bonds, quotations from bond dealers, market transactions in comparable securities and various relationships between securities in determining value. Restricted securities are valued at fair value following procedures approved by the
49
Trustees. Such valuations and procedures are reviewed periodically by the Trustees.
B) Joint trading account Pursuant to an exemptive order from the Securities and Exchange Commission, the fund may transfer uninvested cash balances, including cash collateral received under security lending arrangements, into a joint trading account along with the cash of other registered investment companies and certain other accounts managed by Putnam Investment Management, LLC (“Putnam Management”), the fund’s manager, an indirect wholly-owned subsidiary of Putnam, LLC. These balances may be invested in issues of high-grade short-term investments having maturities of up to 397 days for collateral received under security lending arrangements and up to 90 days for other cash investments.
C) Repurchase agreements The fund, or any joint trading account, through its custodian, receives delivery of the underlying securities, the market value of which at the time of purchase is required to be in an amount at least equal to the resale price, including accrued interest. Collateral for certain tri-party repurchase agreements is held at the counterparty’s custodian in a segregated account for the benefit of the fund and the coun-terparty. Putnam Management is responsible for determining that the value of these underlying securities is at all times at least equal to the resale price, including accrued interest.
D) Security transactions and related investment income Security transactions are recorded on the trade date (the date the order to buy or sell is executed). Gains or losses on securities sold are determined on the identified cost basis. Interest income is recorded on the accrual basis. All premiums/discounts are amortized/accreted on a yield-to-maturity basis.
Securities purchased or sold on a delayed delivery basis may be settled a month or more after the trade date; interest income is accrued based on the terms of the securities. Losses may arise due to changes in the market value of the underlying securities or if the counterparty does not perform under the contract.
E) Stripped mortgage-backed securities The fund may invest in stripped mortgage-backed securities which represent a participation in mortgage loans and may be structured in classes with rights to receive different portions of the interest and principal. Interest-only securities receive all of the interest and principal-only securities receive all of the principal. If the interest-only securities experience greater than anticipated prepayments of principal, the fund may fail to recoup fully its initial investment in these securities. Conversely, principal-only securities increase in value if prepayments are greater than anticipated and decline if prepayments are slower than anticipated. The market value of these securities is highly sensitive to changes in interest rates.
F) Futures and options contracts The fund may use futures and options contracts to hedge against changes in the values of securities the fund owns or expects to purchase, or for other investment purposes. The fund may also write options on swaps or securities it owns or in which it may invest to increase its current returns.
The potential risk to the fund is that the change in value of futures and options contracts may not correspond to the change in value of the hedged instruments. In addition, losses may arise from changes in the value of the underlying instruments, if there is an illiquid secondary market for the contracts, or if the counterparty to the contract is unable to perform. Risks may exceed amounts recognized on the statement of assets and liabilities. When the contract is closed, the fund records a realized gain or loss equal to the difference between the value of the contract at the time it was opened and the value at the time it was closed. Realized gains and losses on purchased options are included in realized gains and losses on investment securities. If a written call option is exercised, the premium originally received is recorded as an addition to sales proceeds. If a written put option is exercised, the
50
premium originally received is recorded as a reduction to the cost of investments.
Futures contracts are valued at the quoted daily settlement prices established by the exchange on which they trade. The fund and the broker agree to exchange an amount of cash equal to the daily fluctuation in the value of the futures contract. Such receipts or payments are known as “variation margin.” Exchange traded options are valued at the last sale price, or if no sales are reported, the last bid price for purchased options and the last ask price for written options. Options traded over-the-counter are valued using prices supplied by dealers. Futures and written option contracts outstanding at period end, if any, are listed after the fund’s portfolio.
G) Interest rate swap contracts The fund may enter into interest rate swap contracts, which are arrangements between two parties to exchange cash flows based on a notional principal amount, to manage the fund’s exposure to interest rates. Interest rate swap contracts are marked to market daily based upon quotations from an independent pricing service or market makers and the change, if any, is recorded as unrealized gain or loss. Payments received or made are recorded as realized gains or loss. The fund could be exposed to credit or market risk due to unfavorable changes in the fluctuation of interest rates or if the counterparty defaults on its obligation to perform. Risk of loss may exceed amounts recognized on the statement of assets and liabilities. Interest rate swap contracts outstanding at period end, if any, are listed after the fund’s portfolio.
H) TBA purchase commitments The fund may enter into “TBA” (to be announced) commitments to purchase securities for a fixed unit price at a future date beyond customary settlement time. Although the unit price has been established, the principal value has not been finalized. However, the amount of the commitments will not significantly differ from the principal amount. The fund holds, and maintains until settlement date, cash or high-grade debt obligations in an amount sufficient to meet the purchase price, or the fund may enter into offsetting contracts for the forward sale of other securities it owns. Income on the securities will not be earned until settlement date. TBA purchase commitments may be considered securities themselves, and involve a risk of loss if the value of the security to be purchased declines prior to the settlement date, which risk is in addition to the risk of decline in the value of the fund’s other assets. Unsettled TBA purchase commitments are valued at fair value of the underlying securities, according to the procedures described under “Security valuation” above. The contract is “marked-to-market” daily and the change in market value is recorded by the fund as an unrealized gain or loss.
Although the fund will generally enter into TBA purchase commitments with the intention of acquiring securities for its portfolio or for delivery pursuant to options contracts it has entered into, the fund may dispose of a commitment prior to settlement if Putnam Management deems it appropriate to do so.
I) TBA sale commitments The fund may enter into TBA sale commitments to hedge its portfolio positions or to sell mortgage-backed securities it owns under delayed delivery arrangements. Proceeds of TBA sale commitments are not received until the contractual settlement date. During the time a TBA sale commitment is outstanding, equivalent deliverable securities or an offsetting TBA purchase commitment deliverable on or before the sale commitment date, are held as “cover” for the transaction.
Unsettled TBA sale commitments are valued at fair value of the underlying securities, generally according to the procedures described under “Security valuation” above. The contract is “marked-to-market” daily and the change in market value is recorded by the fund as an unrealized gain or loss. If the TBA sale commitment is closed through the acquisition of an offsetting purchase commitment, the fund realizes a gain or loss. If the fund delivers securities under the
51
commitment, the fund realizes a gain or a loss from the sale of the securities based upon the unit price established at the date the commitment was entered into. TBA sale commitments outstanding at period end, if any, are listed after the fund’s portfolio.
J) Dollar rolls To enhance returns, the fund may enter into dollar rolls (principally using TBAs) in which the fund sells securities for delivery in the current month and simultaneously contracts to purchase similar securities on a specified future date. During the period between the sale and subsequent purchase, the fund will not be entitled to receive income and principal payments on the securities sold. The fund will, however, retain the difference between the initial sales price and the forward price for the future purchase. The fund will also be able to earn interest on the cash proceeds that are received from the initial sale. The fund may be exposed to market or credit risk if the price of the security changes unfavorably or the counterparty fails to perform under the terms of the agreement.
K) Federal taxes It is the policy of the fund to distribute all of its taxable income within the prescribed time and otherwise comply with the provisions of the Internal Revenue Code of 1986 (the “Code”) applicable to regulated investment companies. It is also the intention of the fund to distribute an amount sufficient to avoid imposition of any excise tax under Section 4982 of the Code, as amended. Therefore, no provision has been made for federal taxes on income, capital gains or unrealized appreciation on securities held nor for excise tax on income and capital gains.
At September 30, 2005, the fund had a capital loss carryover of $25,817,289 available to the extent allowed by the Code to offset future net capital gain, if any. This capital loss carryover will expire on September 30, 2009.
The aggregate identified cost on a tax basis is $2,804,348,099, resulting in gross unrealized appreciation and depreciation of $5,641,204 and $24,546,328, respectively, or net unrealized depreciation of $18,905,124.
L) Distributions to shareholders Distributions to shareholders from net investment income are recorded by the fund on the ex-dividend date. Distributions from capital gains, if any, are recorded on the ex-dividend date and paid at least annually. The amount and character of income and gains to be distributed are determined in accordance with income tax regulations, which may differ from generally accepted accounting principles. Dividend sources are estimated at the time of declaration. Actual results may vary. Any non-taxable return of capital cannot be determined until final tax calculations are completed after the end of the fund’s fiscal year. Reclassifications are made to the fund’s capital accounts to reflect income and gains available for distribution (or available capital loss carryovers) under income tax regulations.
Note 2: Management fee, administrative services and other transactions
Putnam Management is paid for management and investment advisory services quarterly based on the average net assets of the fund. Such fee is based on the following annual rates: 0.57% of the first $500 million of average net assets, 0.475% of the next $500 million, 0.4275% of the next $500 million and 0.38% thereafter.
Putnam Management has agreed to waive fees and reimburse expenses of the fund through September 30, 2006 to the extent necessary to ensure that the fund’s expenses do not exceed the simple average of the expenses of all front-end load funds viewed by Lipper Inc. as having the same investment classification or objective as the fund. The expense reimbursement is based on a comparison of the fund’s expenses with the average annualized operating expenses of the funds in its Lipper peer group for each calendar quarter during the fund’s last fiscal year, excluding 12b-1 fees and without giving effect to any expense
52
offset and brokerage service arrangements that may reduce fund expenses. For the period ended March 31, 2006, Putnam Management did not waive any of its management fee from the fund.
For the period ended March 31, 2006, Putnam Management has assumed $7,144 of legal, shareholder servicing and communication, audit and Trustee fees incurred by the fund in connection with certain legal and regulatory matters (including those described in Note 5).
The fund reimburses Putnam Management an allocated amount for the compensation and related expenses of certain officers of the fund and their staff who provide administrative services to the fund. The aggregate amount of all such reimbursements is determined annually by the Trustees.
Custodial functions for the fund’s assets are provided by Putnam Fiduciary Trust Company (“PFTC”), a subsidiary of Putnam, LLC. PFTC receives fees for custody services based on the fund’s asset level, the number of its security holdings and transaction volumes. Putnam Investor Services, a division of PFTC, provides investor servicing agent functions to the fund. Putnam Investor Services receives fees for investor servicing based on the number of shareholder accounts in the fund and the level of defined contribution plan assets in the fund. During the period ended March 31, 2006, the fund incurred $1,306,288 for these services.
The fund has entered into an arrangement with PFTC whereby credits realized as a result of uninvested cash balances are used to reduce a portion of the fund’s expenses. For the six months ended March 31, 2006, the fund’s expenses were reduced by $924,702 under these arrangements.
Each independent Trustee of the fund receives an annual Trustee fee, of which $512, as a quarterly retainer, has been allocated to the fund, and an additional fee for each Trustees meeting attended. Trustees receive additional fees for attendance at certain committee meetings, industry seminars and for certain compliance-related matters. Trustees also are reimbursed for expenses they incur relating to their services as Trustees. George Putnam, III, who is not an independent Trustee, also receives the foregoing fees for his services as Trustee.
The fund has adopted a Trustee Fee Deferral Plan (the “Deferral Plan”) which allows the Trustees to defer the receipt of all or a portion of Trustees fees payable on or after July 1, 1995. The deferred fees remain invested in certain Putnam funds until distribution in accordance with the Deferral Plan.
The fund has adopted an unfunded noncontribu-tory defined benefit pension plan (the “Pension Plan”) covering all Trustees of the fund who have served as a Trustee for at least five years and were first elected prior to 2004. Benefits under the Pension Plan are equal to 50% of the Trustee’s average annual attendance and retainer fees for the three years ended December 31, 2005. Pension expense for the fund is included in Trustee compensation and expenses in the statement of operations. Accrued pension liability is included in Payable for Trustee compensation and expenses in the statement of assets and liabilities. The Trustees have terminated the Pension Plan with respect to any Trustee first elected after 2003.
The fund has adopted distribution plans (the “Plans”) with respect to its class A, class B, class C, class M and class R shares pursuant to Rule 12b-1 under the Investment Company Act of 1940. The purpose of the Plans is to compensate Putnam Retail Management, a wholly-owned subsidiary of Putnam, LLC and Putnam Retail Management GP, Inc., for services provided and expenses incurred in distributing shares of the fund. The Plans provide for payments by the fund to Putnam Retail Management at an annual rate of up to 0.35%, 1.00%, 1.00% ,1.00% and 1.00% of the average net assets attributable to class A, class B, class C, class M and class R shares, respectively. The Trustees have approved payment by the fund at an annual rate of 0.25%, 1.00%, 1.00%, 0.50% and 0.50% of the average net assets attributable
53
to class A, class B, class C, class M and class R shares, respectively.
For the six months ended March 31, 2006, Putnam Retail Management, acting as underwriter, received net commissions of $14,781 and $727 from the sale of class A and class M shares, respectively, and received $161,632 and $888 in contingent deferred sales charges from redemptions of class B and class C shares, respectively.
A deferred sales charge of up to 1.00% and 0.40% is assessed on certain redemptions of class A and class M shares, respectively. For the six months ended March 31, 2006, Putnam Retail Management, acting as underwriter, received $39 and no monies on class A and class M redemptions, respectively.
Note 3: Purchases and sales of securities
During the six months ended March 31, 2006, cost of purchases and proceeds from sales of U.S. government securities and agency obligations other than short-term investments aggregated $3,266,721,427 and $3,187,615,857, respectively.
Written option transactions during the period ended March 31, 2006 are summarized as follows:
| | Contract | Premiums |
| | Amounts | Received |
|
| Written options | | |
| outstanding at | | |
| beginning of period | 89,560,000 | $ 3,463,733 |
|
| Options opened | 423,616,000 | 11,597,903 |
| Options exercised | — | — |
| Options expired | — | — |
| Options closed | — | — |
|
| Written options | | |
| outstanding at | | |
| end of period | 513,176,000 | $15,061,636 |
|
Note 4: Capital shares
At March 31, 2006, there was an unlimited number of shares of beneficial interest authorized. Transactions in capital shares were as follows:
| CLASS A | Shares | | Amount |
| Six months ended 3/31/06: | | |
| Shares sold | 3,401,511 | $ | 44,541,470 |
|
| Shares issued | | | |
| in connection | | | |
| with reinvestment | | | |
| of distributions | 1,220,915 | | 15,942,605 |
|
| | 4,622,426 | | 60,484,075 |
|
| Shares | | | |
| repurchased | (12,011,687) | | (157,159,005) |
|
| Net decrease | (7,389,261) | $ | (96,674,930) |
| |
| Year ended 9/30/05: | | | |
| Shares sold | 8,457,463 | $ | 112,623,293 |
|
| Shares issued | | | |
| in connection | | | |
| with reinvestment | | | |
| of distributions | 2,533,553 | | 32,826,380 |
|
| | 10,991,016 | | 145,449,673 |
|
| Shares | | | |
| repurchased | (24,369,108) | | (322,594,455) |
|
| Net decrease | (13,378,092) | $ | (177,144,782) |
54
| CLASS B | Shares | Amount |
|
| Six months ended 3/31/06: | |
| Shares sold | 351,993 | $ 4,579,655 |
|
| Shares issued | | |
| in connection | | |
| with reinvestment | | |
| of distributions | 153,948 | 1,999,639 |
|
| | 505,941 | 6,579,294 |
|
| Shares | | |
| repurchased | (3,451,689) | (44,945,587) |
|
| Net decrease | (2,945,748) | $ (38,366,293) |
| |
| Year ended 9/30/05: | | |
| Shares sold | 1,284,828 | $ 16,923,103 |
|
| Shares issued | | |
| in connection | | |
| with reinvestment | | |
| of distributions | 370,827 | 4,878,078 |
|
| | 1,655,655 | 21,801,181 |
|
| Shares | | |
| repurchased | (8,522,707) | (112,210,030) |
|
| Net decrease | (6,867,052) | $ (90,408,849) |
| CLASS C | Shares | Amount |
|
| Six months ended 3/31/06: | |
| Shares sold | 87,279 | $ 1,140,247 |
|
| Shares issued | | |
| in connection | | |
| with reinvestment | | |
| of distributions | 14,884 | 194,068 |
|
| | 102,163 | 1,334,315 |
|
| Shares | | |
| repurchased | (208,771) | (2,724,811) |
|
| Net decrease | (106,608) | $ (1,390,496) |
| |
| Year ended 9/30/05: | | |
| Shares sold | 245,665 | $ 3,248,351 |
|
| Shares issued | | |
| in connection | | |
| with reinvestment | | |
| of distributions | 32,567 | 429,944 |
|
| | 278,232 | 3,678,295 |
|
| Shares | | |
| repurchased | (751,780) | (9,931,856) |
|
| Net decrease | (473,548) | $ (6,253,561) |
| CLASS M | Shares | | Amount |
|
| Six months ended 3/31/06: | | |
| Shares sold | 334,245 | $ | 4,366,733 |
|
| Shares issued | | | |
| in connection | | | |
| with reinvestment | | | |
| of distributions | 7,518 | | 98,083 |
|
| | 341,763 | | 4,464,816 |
|
| Shares | | | |
| repurchased | (719,171) | | (9,390,902) |
|
| Net decrease | (377,408) | $ | (4,926,086) |
| |
| Year ended 9/30/05: | | | |
| Shares sold | 289,480 | $ | 3,824,505 |
|
| Shares issued | | | |
| in connection | | | |
| with reinvestment | | | |
| of distributions | 16,959 | | 223,972 |
|
| | 306,439 | | 4,048,477 |
|
| Shares | | | |
| repurchased | (1,102,106) | | (14,561,966) |
|
| Net decrease | (795,667) | $ (10,513,489) |
| CLASS R | Shares | Amount |
|
| Six months ended 3/31/06: | | |
| Shares sold | 14,979 | $ 195,820 |
|
| Shares issued | | |
| in connection | | |
| with reinvestment | | |
| of distributions | 279 | 3,647 |
|
| | 15,258 | 199,467 |
|
| Shares | | |
| repurchased | (2,674) | (34,811) |
|
| Net increase | 12,584 | $ 164,656 |
| |
| Year ended 9/30/05: | | |
| Shares sold | 9,758 | $ 129,104 |
|
| Shares issued | | |
| in connection | | |
| with reinvestment | | |
| of distributions | 213 | 2,820 |
|
| | 9,971 | 131,924 |
|
| Shares | | |
| repurchased | (654) | (8,667) |
|
| Net increase | 9,317 | $ 123,257 |
55
| CLASS Y | Shares | | Amount |
|
| Six months ended 3/31/06: | | |
| Shares sold | 25,568 | $ | 334,187 |
|
| Shares issued | | | |
| in connection | | | |
| with reinvestment | | | |
| of distributions | 10,055 | | 130,973 |
|
| | 35,623 | | 465,160 |
|
| Shares | | | |
| repurchased | (617,372) | | (8,044,850) |
|
| Net decrease | (581,749) | $ | (7,579,690) |
| |
| Year ended 9/30/05: | | | |
| Shares sold | 267,501 | $ | 3,534,079 |
|
| Shares issued | | | |
| in connection | | | |
| with reinvestment | | | |
| of distributions | 40,437 | | 533,749 |
|
| | 307,938 | | 4,067,828 |
|
| Shares | | | |
| repurchased | (1,376,773) | | (18,189,970) |
|
| Net decrease | (1,068,835) | $ | (14,122,142) |
Note 5: Regulatory matters and litigation
Putnam Management has entered into agreements with the Securities and Exchange Commission and the Massachusetts Securities Division settling charges connected with excessive short-term trading by Putnam employees and, in the case of the charges brought by the Massachusetts Securities Division, by participants in some Putnam-administered 401(k) plans. Pursuant to these settlement agreements, Putnam Management will pay a total of $193.5 million in penalties and restitution, with $153.5 million being paid to certain open-end funds and their shareholders. The amount will be allocated to shareholders and funds pursuant to a plan developed by an independent consultant, and will be paid following approval of the plan by the SEC and the Massachusetts Securities Division.
The Securities and Exchange Commission’s and Massachusetts Securities Division’s allegations and related matters also serve as the general basis for numerous lawsuits, including purported class action lawsuits filed against Putnam Management and certain related parties, including certain Putnam funds. Putnam Management will bear any costs incurred by Putnam funds in connection with these lawsuits. Putnam Management believes that the likelihood that the pending private lawsuits and purported class action lawsuits will have a material adverse financial impact on the fund is remote, and the pending actions are not likely to materially affect its ability to provide investment management services to its clients, including the Putnam funds.
In March 2006, the fund received $325,955 from Putnam to address issues relating to the calculation of certain amounts paid by the Putnam mutual funds to Putnam for transfer agent services. This amount is included in Fees reimbursed by Manager or affiliate on the Statement of operations. Review of this matter is ongoing and the amount received by the fund may be adjusted in the future. Such adjustment is not expected to be material.
Putnam Management and Putnam Retail Management are named as defendants in a civil suit in which the plaintiffs allege that the management and distribution fees paid by certain Putnam funds were excessive and seek recovery under the Investment Company Act of 1940. Putnam Management and Putnam Retail Management have contested the plaintiffs’ claims and the matter is currently pending in the U.S. District Court for the District of Massachusetts. Based on currently available information, Putnam Management believes that this action is without merit and that it is unlikely to have a material effect on Putnam Management’s and Putnam Retail Management’s ability to provide services to their clients, including the fund.
56
Services for shareholders
Investor services
Help your investment grow Set up a program for systematic investing with as little as $25 a month from a Putnam fund or from your own savings or checking account. (Regular investing does not guarantee a profit or protect against loss in a declining market.)
Switch funds easily* You can move money from one Putnam fund to another within the same class of shares without a service charge.
Access your money easily You can have checks sent regularly or redeem shares any business day at the then-current net asset value, which may be more or less than the original cost of the shares. Class B and class C shares carry a sales charge that is applied to certain withdrawals.
How to buy additional shares You may buy shares through your financial advisor or directly from Putnam. To open an account by mail, send a check made payable to the name of the fund along with a completed fund application. To add to an existing account, complete the investment slip found at the top of your Confirmation of Activity statement and return it with a check payable to your fund.
For more information
Visit www.putnam.com A secure section of our Web site contains complete information on your account, including balances and transactions, updated daily. You may also conduct transactions, such as exchanges, additional investments, and address changes. Log on today to get your password.
Call us toll free at 1-800-225-1581 Ask a helpful Putnam representative or your financial advisor for details about any of these or other services, or see your prospectus.
*This privilege is subject to change or termination. An exchange of funds may result in a taxable event. In addition, a 2% redemption fee will be applied to shares exchanged or sold within 5 days of purchase, and certain funds have imposed a 1% redemption fee on total assets redeemed or exchanged between 6 and 90 days of purchase.
57
The Putnam
family of funds
The following is a complete list of Putnam’s open-end mutual funds. Investors should carefully consider the investment objective, risks, charges, and expenses of a fund before investing. For a prospectus containing this and other information for any Putnam fund or product, call your financial advisor at 1-800-225-1581 and ask for a prospectus. Please read the prospectus carefully before investing.
| Growth funds | Value funds |
| Discovery Growth Fund | Classic Equity Fund |
| Growth Opportunities Fund | Convertible Income-Growth Trust |
| Health Sciences Trust | Equity Income Fund |
| International New Opportunities Fund* | The George Putnam Fund of Boston |
| New Opportunities Fund | The Putnam Fund for Growth |
| OTC & Emerging Growth Fund | and Income |
| Small Cap Growth Fund | International Growth and Income Fund* |
| Vista Fund | Mid Cap Value Fund |
| Voyager Fund | New Value Fund |
| | Small Cap Value Fund† |
| |
| Blend funds | Income funds |
| Capital Appreciation Fund | American Government Income Fund |
| Capital Opportunities Fund | Diversified Income Trust |
| Europe Equity Fund* | Floating Rate Income Fund |
| Global Equity Fund* | Global Income Trust* |
| Global Natural Resources Fund* | High Yield Advantage Fund*† |
| International Capital | High Yield Trust* |
| Opportunities Fund* | Income Fund |
| International Equity Fund* | Limited Duration Government |
| Investors Fund | Income Fund‡ |
| Research Fund | Money Market Fund§ |
| Tax Smart Equity Fund® | U.S. Government Income Trust |
| Utilities Growth and Income Fund | |
* A 1% redemption fee on total assets redeemed or exchanged between 6 and 90 days of purchase may be imposed for all share classes of these funds.
† Closed to new investors.
‡ Formerly Putnam Intermediate U.S. Government Income Fund.
§ An investment in a money market fund is not insured or guaranteed by the Federal Deposit Insurance Corporation or any other government agency. Although the fund seeks to preserve your investment at $1.00 per share, it is possible to lose money by investing in the fund.
58
Tax-free income funds
AMT-Free Insured Municipal Fund**
Tax Exempt Income Fund
Tax Exempt Money Market Fund§
Tax-Free High Yield Fund
State tax-free income funds:
Arizona, California, Florida, Massachusetts, Michigan, Minnesota, New Jersey, New York, Ohio, and Pennsylvania
Asset allocation funds
Income Strategies Fund
Putnam Asset Allocation Funds — three investment portfolios that spread your money across a variety of stocks, bonds, and money market investments.
The three portfolios:
Asset Allocation: Balanced Portfolio
Asset Allocation: Conservative Portfolio
Asset Allocation: Growth Portfolio
Putnam RetirementReady® Funds
Putnam RetirementReady Funds — ten investment portfolios that offer diversifica-tion among stocks, bonds, and money market instruments and adjust to become more conservative over time based on a target date for withdrawing assets.
The ten funds:
Putnam RetirementReady 2050 Fund
Putnam RetirementReady 2045 Fund
Putnam RetirementReady 2040 Fund
Putnam RetirementReady 2035 Fund
Putnam RetirementReady 2030 Fund
Putnam RetirementReady 2025 Fund
Putnam RetirementReady 2020 Fund
Putnam RetirementReady 2015 Fund
Putnam RetirementReady 2010 Fund
Putnam RetirementReady Maturity Fund
** Formerly Putnam Tax-Free Insured Fund.
With the exception of money market funds, a 2% redemption fee may be applied to shares exchanged or sold within 5 days of purchase.
Check your account balances and the most recent month-end performance at www.putnam.com.
59
Fund information
Founded over 65 years ago, Putnam Investments was built around the concept that a balance between risk and reward is the hallmark of a well-rounded financial program. We manage over 100 mutual funds in growth, value, blend, fixed income, and international.
| Investment Manager | Officers | Francis J. McNamara, III |
| Putnam Investment | George Putnam, III | Vice President and |
| Management, LLC | President | Chief Legal Officer |
| One Post Office Square | | |
| Boston, MA 02109 | Charles E. Porter | Charles A. Ruys de Perez |
| Executive Vice President, | Vice President and |
| Marketing Services | Associate Treasurer and | Chief Compliance Officer |
| Putnam Retail Management | Principal Executive Officer | |
| One Post Office Square | | Mark C. Trenchard |
| Boston, MA 02109 | Jonathan S. Horwitz | Vice President and |
| Senior Vice President | BSA Compliance Officer |
| Custodian | and Treasurer | |
| Putnam Fiduciary | | Judith Cohen |
| Trust Company | Steven D. Krichmar | Vice President, Clerk and |
| | Vice President and | Assistant Treasurer |
| Legal Counsel | Principal Financial Officer | |
| Ropes & Gray LLP | | Wanda M. McManus |
| | Michael T. Healy | Vice President, Senior Associate |
| Trustees | Assistant Treasurer and | Treasurer and Assistant Clerk |
| John A. Hill, Chairman | Principal Accounting Officer | |
| Jameson Adkins Baxter, | | Nancy E. Florek |
| Vice Chairman | Daniel T. Gallagher | Vice President, Assistant Clerk, |
| Charles B. Curtis | Senior Vice President, | Assistant Treasurer and |
| Myra R. Drucker | Staff Counsel and | Proxy Manager |
| Charles E. Haldeman, Jr. | Compliance Liaison | |
| Paul L. Joskow | | |
| Elizabeth T. Kennan | Beth S. Mazor | |
| John H. Mullin, III | Vice President | |
| Robert E. Patterson | | |
| George Putnam, III | James P. Pappas | |
| W. Thomas Stephens | Vice President | |
| Richard B. Worley | | |
| Richard S. Robie, III | |
| Vice President | |
This report is for the information of shareholders of Putnam U.S. Government Income Trust. It may also be used as sales literature when preceded or accompanied by the current prospectus, the most recent copy of Putnam’s Quarterly Performance Summary, and Putnam’s Quarterly Ranking Summary. For more recent performance, please visit www.putnam.com. Investors should carefully consider the investment objective, risks, charges, and expenses of a fund, which are described in its prospectus. For this and other information or to request a prospectus, call 1-800-225-1581 toll free. Please read the prospectus carefully before investing. The fund’s Statement of Additional Information contains additional information about the fund’s Trustees and is available without charge upon request by calling 1-800-225-1581.
60

Item 2. Code of Ethics:
Not applicable
Item 3. Audit Committee Financial Expert:
|
Item 4. Principal Accountant Fees and Services:
|
Item 5. Audit Committee of Listed Registrants
|
Item 6. Schedule of Investments:
|
The registrant’s schedule of investments in unaffiliated issuers is included in the report to shareholders in Item 1 above.
Item 7. Disclosure of Proxy Voting Policies and Procedures For Closed-End Management Investment Companies:
Item 8. Portfolio Managers of Closed-End Investment Companies
Item 9. Purchases of Equity Securities by Closed-End Management Investment Companies and Affiliated Purchasers:
Item 10. Submission of Matters to a Vote of Security Holders:
Item 11. Controls and Procedures:
|
(a) The registrant's principal executive officer and principal financial officer have concluded, based on their evaluation of the effectiveness of the design and operation of the registrant's disclosure controls and procedures as of a date within 90 days of the filing date of this report, that the design and operation of such procedures are generally effective to provide reasonable assurance that information required to be disclosed by the registrant in this report is recorded, processed, summarized and reported within the time periods specified in the Commission's rules and forms.
(b) Changes in internal control over financial reporting: Not applicable
Item 12. Exhibits:
(a)(1) Not applicable
|
(a)(2) Separate certifications for the principal executive officer and principal financial officer of the registrant as required by Rule 30a-2(a) under the Investment Company Act of 1940, as amended, are filed herewith.
(b) The certifications required by Rule 30a-2(b) under the Investment Company Act of 1940, as amended, are filed herewith.
SIGNATURES
Pursuant to the requirements of the Securities Exchange Act of 1934 and the Investment Company Act of 1940, the registrant has duly caused this report to be signed on its behalf by the undersigned, thereunto duly authorized.
Putnam U.S. Government Income Trust
By (Signature and Title):
/s/Michael T. Healy
Michael T. Healy
Principal Accounting Officer
Date: May 26, 2006
|
Pursuant to the requirements of the Securities Exchange Act of 1934 and the Investment Company Act of 1940, this report has been signed below by the following persons on behalf of the registrant and in the capacities and on the dates indicated.
By (Signature and Title):
/s/Charles E. Porter
Charles E. Porter
Principal Executive Officer
Date: May 26, 2006
By (Signature and Title):
/s/Steven D. Krichmar
Steven D. Krichmar
Principal Financial Officer
Date: May 26, 2006
|