UNITED STATES
SECURITIES AND EXCHANGE COMMISSION
Washington, D.C. 20549
FORM N-CSR
CERTIFIED SHAREHOLDER REPORT
OF
REGISTERED MANAGEMENT INVESTMENT COMPANIES
Investment Company Act file number: | 811-3916 |
Name of Registrant: | Vanguard Specialized Funds |
Address of Registrant: | P.O. Box 2600 |
| Valley Forge, PA 19482 |
Name and address of agent for service: | Heidi Stam, Esquire |
| P.O. Box 876 |
| Valley Forge, PA 19482 |
Registrant’s telephone number, including area code: | (610) 669-1000 |
Date of fiscal year end: | January 31 |
Date of reporting period: | February 1, 2006–January 31, 2007 |
Item 1: | Reports to Shareholders |
|
|
Vanguard® Energy Fund |
|
|
> Annual Report |
|
|
|
|
|
January 31, 2007 |
|
|
> | The Investor Shares of Vanguard Energy Fund posted a modest 2.2% return for |
| the fiscal year ended January 31, 2007. |
> | While the fund’s result fell short of that of its benchmark, it surpassed the |
| average gain of peer funds. |
> | The fund’s integrated oil holdings generally fared well; many of the fund’s |
| equipment, drilling, and refining businesses, which are highly sensitive to |
| changes in energy prices, suffered losses. |
See page 28 for a Notice to Shareholders concerning the fund’s investment advisors. |
Contents | |
| |
Your Fund’s Total Returns | 1 |
Chairman’s Letter | 2 |
Advisors’ Report | 7 |
Fund Profile | 10 |
Performance Summary | 11 |
Financial Statements | 13 |
Your Fund’s After-Tax Returns | 25 |
About Your Fund’s Expenses | 26 |
Notice to Shareholders | 28 |
Glossary | 31 |
Please note: The opinions expressed in this report are just that—informed opinions. They should not be considered promises or advice. Also, please keep in mind that the information and opinions cover the period through the date on the cover of this report. Of course, the risks of investing in your fund are spelled out in the prospectus.
Your Fund’s Total Returns
Fiscal Year Ended January 31, 2007 | |
| Total |
| Returns |
Vanguard Energy Fund | |
Investor Shares | 2.2% |
Admiral™ Shares1 | 2.3 |
S&P Energy Sector Index | 4.3 |
Average Natural Resources Fund2 | 0.8 |
Dow Jones Wilshire 5000 Index | 14.1 |
Your Fund’s Performance at a Glance | | | | |
January 31, 2006–January 31, 2007 | | | | |
| | | Distributions Per Share |
| Starting | Ending | Income | Capital |
| Share Price | Share Price | Dividends | Gains |
Vanguard Energy Fund | | | | |
Investor Shares | $64.50 | $63.55 | $1.020 | $1.447 |
Admiral Shares | 121.13 | 119.35 | 2.000 | 2.717 |
1 | A lower-cost class of shares available to many longtime shareholders and to those with significant investments in the fund. |
2 | Derived from data provided by Lipper Inc. |
1

Chairman’s Letter
Dear Shareholder,
After a few years of outsized gains, the Investor Shares of Vanguard Energy Fund posted a much more modest return of 2.2% for the fiscal year ended January 31, 2007. The fund’s Admiral Shares returned 2.3%.
The fund’s performance reflected the unusual oil-price volatility produced by tension in the Middle East, atypical weather patterns, and an uncertain economic outlook. While the fund’s return fell short of that of its benchmark—the S&P Energy Sector Index—it surpassed the average return of peer funds.
If you invest in the Energy Fund through a taxable account, you may wish to review the fund’s after-tax performance on page 25.
Domestic equity markets did well; markets abroad did even better
In the first half of the fiscal year, returns from large-capitalization stocks were virtually flat, while those of small-caps lost some ground. In the second six months, both large and small stocks rebounded, with small-caps faring slightly better. For the 12 months, the broad U.S. stock market gained 14.1%. Despite the weakness in the housing sector, the economy showed remarkable resilience, and corporate profits rose at a fast clip.
Across market capitalizations, value-oriented stocks outpaced their growth-oriented counterparts. International stocks continued to outperform U.S. stocks, as overseas
2
markets—especially European and emerging markets—produced stellar returns. For U.S.-based investors, the dollar’s weakness further enhanced the results of international stocks.
Bond returns were modest as the Fed put rate hikes on hold
In the first six months of the fiscal year, the Federal Reserve Board continued its campaign to keep inflation in check, raising its target for the key federal funds rate by 0.25 percentage point on three occasions (in addition to a 0.25-percentage-point increase the day before the fiscal year began). Then, at its August meeting, the Fed left the target rate unchanged at 5.25%, where it remained through the end of the fiscal period, as inflation fears diminished.
Following the Fed’s pause, the prices of longer-maturity bonds rose faster than those of short-term bonds, reducing their yields more dramatically. Throughout the maturity spectrum, the “yield spread,” or the difference between yields of corporate securities and those of U.S. Treasury securities of comparable maturities, became even tighter. Bonds produced coupon-like returns for the period, with the broad taxable bond market returning 4.3%. Corporate bonds generally outperformed U.S. government issues. The Citigroup 3-Month Treasury Bill Index, a proxy for money market yields, returned 4.9%.
Market Barometer | | | |
| Average Annual Total Returns |
| Periods Ended January 31, 2007 |
| One Year | Three Years | Five Years |
Stocks | | | |
Russell 1000 Index (Large-caps) | 14.5% | 11.0% | 7.5% |
Russell 2000 Index (Small-caps) | 10.4 | 12.6 | 12.0 |
Dow Jones Wilshire 5000 Index (Entire market) | 14.1 | 11.5 | 8.4 |
MSCI All Country World Index ex USA (International) | 19.3 | 21.3 | 18.0 |
| | | |
| | | |
Bonds | | | |
Lehman Aggregate Bond Index (Broad taxable market) | 4.3% | 3.4% | 4.9% |
Lehman Municipal Bond Index | 4.3 | 4.0 | 5.1 |
Citigroup 3-Month Treasury Bill Index | 4.9 | 3.1 | 2.4 |
| | | |
| | | |
CPI | | | |
Consumer Price Index | 2.1% | 3.0% | 2.7% |
| | | | | |
3
Muted gains for the fund in a challenging period
Vanguard Energy Fund produced modest gains during the fiscal year, a difficult period for energy investors. Over the 12 months, oil prices were volatile. They began the period in the mid-$60s, leapt above $75 per barrel in July, then dropped to near $50 in mid-January.
Natural gas prices generally moved lower throughout the period, thanks to mild weather and increased drilling and storage capacity. In addition, a quiet hurricane season averted the kind of shocks that roiled domestic energy markets after the devastation of the Gulf Coast in 2005.
The fund’s integrated oil & gas holdings, which represented almost half of its assets on average, were a mixed bag in terms of performance. The fund earned strong returns from integrated giants such as ExxonMobil and Chevron. Because these huge companies are active in several areas—they produce, refine, and market oil—their businesses are less sensitive to movements in oil prices and investors’ concerns about the effects of an economic slowdown on the energy sector. However, the fund was less successful with smaller, international, and generally less diversified companies such as PetroCanada and Sasol.
Expense Ratios1 | | | |
Your fund compared with its peer group | | | |
| | | Average |
| | | Natural |
| Investor | Admiral | Resources |
| Shares | Shares | Fund |
Energy Fund | 0.25% | 0.18% | 1.44% |
1 | Fund expense ratio reflects the 12 months ended January 31, 2007. Peer-group expense ratio is derived from data provided by Lipper Inc. and captures information through year-end 2006. |
4
Companies involved in exploration and production, as well as those that provide services and equipment to oil and gas producers, turned in disappointing results for the period. These companies are much more vulnerable to perceived changes in global economic growth and energy demand than are the large integrated companies.
Several of the fund’s exploration companies—particularly Canadian Natural Resources, EOG Resources, and Western Oil Sands—suffered sizable losses. Among services companies, Halliburton was hurt by the loss of a multibillion-dollar contract to provide logistical support to U.S. troops worldwide. Oil refiners also had a difficult period; shares of Sunoco, the largest refiner in the northeastern United States, declined as a result of falling crude prices and warm weather.
Your fund benefits from the talents and experience of two investment managers—Wellington Management Company and Vanguard Quantitative Equity Group—that use distinct, but complementary, investment approaches. For more about the advisors’ strategies and the fund’s performance and holdings, see the Advisors’ Report, which begins on page 7.
The fund’s long-term record shows its strengths
Although the Energy Fund’s return was more modest than it has been over the past few years, the fund’s long-term results reveal its superb track record. As the table below shows, the 15.9% average annual return for the fund’s Investor Shares is well above the result
Total Returns | | |
Ten Years Ended January 31, 2007 | | |
| Average | Final Value of a $25,000 |
| Annual Return | Initial Investment |
Energy Fund Investor Shares | 15.9% | $109,139 |
S&P Energy Sector Index | 13.3 | 87,499 |
Average Natural Resources Fund1 | 11.5 | 74,225 |
Dow Jones Wilshire 5000 Index | 8.3 | 55,587 |
The figures shown represent past performance, which is not a guarantee of future results. (Current performance may be lower or higher than the performance data cited. For performance data current to the most recent month-end, visit our website at www.vanguard.com.) Note, too, that both investment returns and principal value can fluctuate widely, so an investor’s shares, when sold, could be worth more or less than their original cost.
1 | Derived from data provided by Lipper Inc. for the sector index, the average return for competing funds, and the return for the broad stock market. |
5
A hypothetical initial investment of $25,000 in the fund would have appreciated to $109,139 over the decade ended January 31. If compounded at the average return of peer funds, the same initial investment would be worth less than $75,000. It’s also nearly twice the final value of a hypothetical investment in the Dow Jones Wilshire 5000 Index.
Keep perspective on the fund’s role within your portfolio
After the Energy Fund’s stellar 63% return in its previous fiscal year, its more down-to-earth showing during the recent period may appear underwhelming. However, that contrast provides a valuable reminder of the risks investors face in this sector, which may be affected by, among other things, the weather, political turmoil, and global economic conditions.
The fund’s potential for short-term volatility illustrates the importance of understanding its role within your portfolio. If you already have a carefully assembled foundation of stocks, bonds, and cash investments tailored to your investing goals and comfort level, this fund can serve to diversify your portfolio, giving it meaningful exposure to a sector that may perform independently of other market groups.
While a modest commitment of assets to a sector fund is certainly reasonable, Vanguard discourages investors from chasing performance. All too often, cash flows into the hot sector of the moment, and when the sector cools, the cash flows right out again. That’s why we set a high initial investment amount for the fund and impose a 1% redemption fee on shares held for less than one year.
Thank you for your continuing confidence in Vanguard.
Sincerely,

John J. Brennan
Chairman and Chief Executive Officer
February 14, 2007
6
Advisors’ Report
During the 12 months ended January 31, the Investor Shares of Vanguard Energy Fund returned 2.2% and the Admiral Shares 2.3%. The performance reflected the combined efforts of your fund’s two advisors. The use of multiple advisors enhances the fund’s diversification by providing exposure to distinct, yet complementary, investment approaches.
The advisors, the percentage of fund assets each manages, and brief descriptions of their investment strategies are presented in the table below. Each advisor has also provided a discussion of the investment environment that existed during the fiscal year and of how portfolio positioning reflects this assessment.
Wellington Management Company, LLP
Portfolio Manager:
Karl E. Bandtel, Senior Vice President
The environment for energy investing was positive over the last 12 months. Historically high prices dented consumption somewhat, but demand growth remained relatively strong for much of the period. Toward the end of the fiscal year, oil prices declined as a result of mild winter weather globally. Natural gas prices also dropped, responding to both a temperate winter in the United States and a supply surplus. Natural gas inventories continue to exceed the five-year average.
Vanguard Energy Fund Investment Advisors | |
| | | |
| Fund Assets Managed | |
Investment Advisor | | % | $ Million | Investment Strategy |
Wellington Management | 90 | 9,075 | Emphasizes long-term total-return opportunities |
Company, LLP | | | from the various energy subsectors: international |
| | | oils, foreign integrated oils and foreign producers, |
| | | North American producers, oil services and |
| | | equipment, transportation and distribution, and |
Vanguard Quantitative Equity Group | 10 | 1,016 | refining and marketing. Conducts quantitative |
| | | portfolio management using models that assess |
| | | valuation, marketplace sentiment, and balance- |
| | | sheet characteristics of companies compared with |
| | | their peers. |
7
Pressure on oil and gas prices could continue. However, the Organization of Petroleum Exporting Countries (OPEC) approved production cuts in late 2006. Reduced output represents an attempt to sustain prices near current levels. Despite these efforts, the price of crude oil fell in January.
Even though oil and gas markets have loosened up somewhat, the challenge of increasing supply over the long run remains. In this environment, we favor companies that have direct access to productive capacity and that are run by management teams that demonstrate an ability to develop resources.
Our purchases over the fiscal year were driven by relative value and growth opportunities. New names included CNOOC (China National Offshore Oil Corporation) and Woodside Petroleum. We also added to existing positions in Occidental Petroleum and Weatherford International.
We eliminated holdings in Repsol and Surgutneftegaz—the former because it reached our price target and the latter because of concerns about the company’s corporate governance. We also reduced our existing positions in Peabody Energy, Chevron, and Shell Canada.
Vanguard Quantitative Equity Group
Portfolio Manager:
James D. Troyer, CFA, Principal
Our quantitative investment process evaluates a security’s attractiveness on three dimensions: valuation, sentiment, and balance-sheet characteristics. Our experience is that each of our underlying models performs well over long time frames, but that their effectiveness varies over shorter periods. Over the past year, all three components of our model enjoyed considerable success, with valuation leading the way.
A key characteristic of our strategy is that we do not maintain a “view” on the overall market for energy shares that is reflected in our portfolio. Our goal is positive performance relative to a benchmark, regardless of the overall direction of that benchmark. We apply a rigorous risk-control process to neutralize unintended exposure to market capitalization, volatility, and industry risks beyond those of the benchmark; such differences are “bets” that we feel do not add value over the long term.
8
By diversifying our model among several uncorrelated components, we further reduce the excess-return volatility that our portfolio can experience versus the benchmark. The result is a portfolio that makes many small bets on individual stocks and attempts to capture the market’s tendency to over- or underreact to new information.
During the fiscal year, energy stocks in Norway, China, and Argentina did particularly well. Norsk Hydro, Petroleum Geo-Services, China Petroleum & Chemical, and Tenaris were all successful holdings in our portfolio. Our model picked the South African company Sasol and the Australian firm Santos, both of which were poor performers for the year, but our tight risk control limited the negative effects.
9
Fund Profile
As of January 31, 2007
Portfolio Characteristics | | |
| Comparative | Broad |
| Fund | Index1 | Index2 |
Number of Stocks | 98 | 33 | 4,939 |
Median Market Cap | $39.8B | $109.6B | $30.8B |
Price/Earnings Ratio | 9.4x | 10.3x | 17.9x |
Price/Book Ratio | 2.7x | 2.7x | 2.8x |
Yield | | 1.6% | 1.7% |
Investor Shares | 1.6% | | |
Admiral Shares | 1.7% | | |
Return on Equity | 22.4% | 22.2% | 17.8% |
Earnings Growth Rate | 35.6% | 39.4% | 18.5% |
Foreign Holdings | 42.8% | 0.0% | 1.1% |
Turnover Rate | 22% | — | — |
Expense Ratio | | — | — |
Investor Shares | 0.25% | | |
Admiral Shares | 0.18% | | |
Short-Term Reserves3 | 5% | — | — |
Sector Diversification4 (% of portfolio) | |
| |
Coal & Consumable Fuels | 2% |
Integrated Oil & Gas | 50 |
Materials | 3 |
Oil & Gas Drilling | 5 |
Oil & Gas Equipment & Services | 10 |
Oil & Gas Exploration & Production | 18 |
Oil & Gas Refining & Marketing | 4 |
Oil & Gas Storage & Transportation | 1 |
Utilities | 1 |
Other | 1 |
Short-Term Reserves3 | 5% |
Volatility Measures5 | |
| Fund Versus | Fund Versus |
| Comparative Index1 | Broad Index2 |
R-Squared | 0.92 | 0.17 |
Beta | 0.93 | 0.99 |
Ten Largest Holdings6(% of total net assets) | |
| |
ExxonMobil Corp. | 6.7% |
Chevron Corp. | 4.9 |
Total SA | 4.2 |
ConocoPhillips Co. | 4.1 |
Royal Dutch Shell PLC | 3.8 |
Schlumberger Ltd. | 3.1 |
Valero Energy Corp. | 3.0 |
BHP Billiton Ltd. ADR | 3.0 |
ENI SpA | 2.9 |
BP PLC | 2.8 |
Top Ten | 38.5% |
Market Diversification (% of portfolio) | |
| |
United States | 52% |
Canada | 10 |
United Kingdom | 9 |
France | 4 |
Australia | 4 |
Norway | 4 |
Italy | 3 |
Russia | 3 |
Brazil | 2 |
China | 1 |
Netherlands | 1 |
South Africa | 1 |
Other | 1 |
Short-Term Reserves3 | 5% |
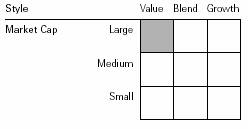
Investment Focus
1 | S&P Energy Sector Index. |
2 | Dow Jones Wilshire 5000 Index. |
3 | Short-term reserves exclude futures and currency contracts held by the fund. |
4 | Sector percentages combine U.S. and international holdings. |
5 | For an explanation of R-squared, beta, and other terms used here, see the Glossary on page 31. |
6 | “Ten Largest Holdings” excludes any temporary cash investments and equity index products. |
10
Performance Summary
All of the returns in this report represent past performance, which is not a guarantee of future results that may be achieved by the fund. (Current performance may be lower or higher than the performance data cited. For performance data current to the most recent month-end, visit our website at www.vanguard.com.) Note, too, that both investment returns and principal value can fluctuate widely, so an investor’s shares, when sold, could be worth more or less than their original cost. The returns shown do not reflect taxes that a shareholder would pay on fund distributions or on the sale of fund shares.
Cumulative Performance: January 31, 1997–January 31, 2007
Initial Investment of $25,000

| | | |
| | |
| Average Annual Total Returns | Final Value |
| Periods Ended January 31, 2007 | of a $25,000 |
| One Year | Five Years | Ten Years | Investment |
Energy Fund Investor Shares1 | 2.24% | 25.85% | 15.88% | $109,139 |
Dow Jones Wilshire 5000 Index | 14.14 | 8.35 | 8.32 | 55,587 |
S&P Energy Sector Index | 4.28 | 18.49 | 13.35 | 87,499 |
Average Natural Resources Fund2 | 0.77 | 22.10 | 11.50 | 74,225 |
| | | | | |
| | | | Final Value |
| | | Since | of a $100,000 |
| One Year | Five Years | Inception3 | Investment |
Energy Fund Admiral Shares1 | 2.32% | 25.93% | 24.85% | $318,508 |
Dow Jones Wilshire 5000 Index | 14.14 | 8.35 | 8.60 | 153,780 |
S&P Energy Sector Index | 4.28 | 18.49 | 17.37 | 230,709 |
1 | Total return figures do not reflect the 1% fee assessed on redemptions of shares held for less than one year. |
2 | Derived from data provided by Lipper Inc. |
3 | Performance for the fund and its comparative standards is calculated since share class inception: November 12, 2001. |
11
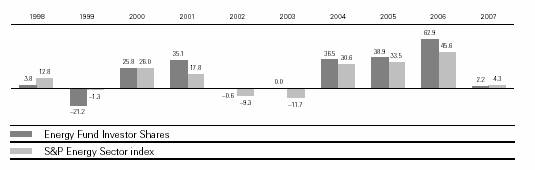
Fiscal-Year Total Returns (%): January 31, 1997–January 31, 2007
Average Annual Total Returns: Periods Ended December 31, 2006
This table presents average annual total returns through the latest calendar quarter—rather than through the end of the fiscal period. Securities and Exchange Commission rules require that we provide this information.
| Inception Date | One Year | Five Years | Ten Years |
Investor Shares1 | 5/23/1984 | 19.66% | 25.75% | 16.53% |
Admiral Shares1 | 11/12/2001 | 19.75 | 25.82 | 25.722 |
1 | Total return figures do not reflect the 1% redemption fee assessed on redemptions of shares held less than one year. |
Note: See Financial Highlights tables on pages 18 and 19 for dividend and capital gains information.
12
Financial Statements
Statement of Net Assets
As of January 31, 2007
The fund provides a complete list of its holdings four times in each fiscal year, at the quarter-ends. For the second and fourth fiscal quarters, the lists appear in the fund’s semiannual and annual reports to shareholders. For the first and third fiscal quarters, the fund files the lists with the Securities and Exchange Commission on Form N-Q. Shareholders can look up the fund’s Forms N-Q on the SEC’s website at www.sec.gov. Forms N-Q may also be reviewed and copied at the SEC’s Public Reference Room (see the back cover of this report for further information).
| | | Market |
| | | Value• |
| | Shares | ($000) |
Common Stocks (93.5%)1 | | |
United States (50.7%) | | |
Energy Equipment & Services (14.2%) | |
| Oil & Gas Drilling (5.1%) | | |
* | Transocean Inc. | 2,857,000 | 221,046 |
| GlobalSantaFe Corp. | 3,114,400 | 180,666 |
* | Nabors Industries, Inc. | 2,305,000 | 69,795 |
| ENSCO International, Inc. | 241,400 | 12,280 |
| Helmerich & Payne, Inc. | 400,300 | 10,740 |
| Patterson-UTI Energy, Inc. | 265,756 | 6,418 |
| Noble Corp. | 80,600 | 6,041 |
* | Pride International, Inc. | 137,100 | 3,950 |
| Rowan Cos., Inc. | 110,300 | 3,628 |
| | | |
| Oil & Gas Equipment & Services (9.1%) | |
| Schlumberger Ltd. | 4,975,800 | 315,914 |
* | Weatherford International Ltd. | 6,243,300 | 252,104 |
| Baker Hughes, Inc. | 2,533,100 | 174,860 |
| Halliburton Co. | 5,277,500 | 155,897 |
| BJ Services Co. | 425,900 | 11,780 |
* | SEACOR Holdings Inc. | 54,300 | 5,497 |
| | | 1,430,616 |
Gas Utilities (1.2%) | | |
| Equitable Resources, Inc. | 2,688,800 | 116,291 |
| | | |
Oil, Gas & Consumable Fuels (35.3%) | |
| Coal & Consumable Fuels (2.4%) | |
| CONSOL Energy, Inc. | 4,190,200 | 144,269 |
| Peabody Energy Corp. | 2,641,800 | 107,865 |
| | | |
| Integrated Oil & Gas (20.9%) | |
| ExxonMobil Corp. | 9,105,400 | 674,710 |
| Chevron Corp. | 6,738,028 | 491,067 |
| ConocoPhillips Co. | 6,237,618 | 414,240 |
| Marathon Oil Corp. | 2,321,600 | 209,733 |
| Occidental Petroleum Corp. | 4,360,000 | 202,130 |
| Hess Corp. | 2,083,500 | 112,488 |
| | | | | |
13
| | | Market |
| | | Value• |
| | Shares | ($000) |
| Oil & Gas Exploration & Production (7.3%) |
| Noble Energy, Inc. | 2,859,000 | 152,699 |
| EOG Resources, Inc. | 2,008,703 | 138,862 |
| Devon Energy Corp. | 1,764,300 | 123,660 |
| Cabot Oil & Gas Corp. | 1,431,300 | 92,834 |
| XTO Energy, Inc. | 1,519,800 | 76,704 |
* | Newfield Exploration Co. | 1,708,800 | 73,154 |
| Anadarko Petroleum Corp. | 373,100 | 16,323 |
| Chesapeake Energy Corp. | 481,900 | 14,269 |
| Apache Corp. | 153,400 | 11,194 |
| Cimarex Energy Co. | 284,300 | 10,656 |
| St. Mary Land & | | |
| Exploration Co. | 271,700 | 9,778 |
* | Forest Oil Corp. | 304,400 | 9,716 |
* | Denbury Resources, Inc. | 118,299 | 3,277 |
| | | |
| Oil & Gas Refining & Marketing (4.1%) | |
| Valero Energy Corp. | 5,582,644 | 303,026 |
| Sunoco, Inc. | 1,627,100 | 102,719 |
| Tesoro Petroleum Corp. | 152,900 | 12,597 |
| | | |
| Oil & Gas Storage & Transportation (0.6%) |
| Williams Cos., Inc. | 1,864,200 | 50,315 |
| El Paso Corp. | 535,000 | 8,303 |
| | | 3,566,588 |
Exchange Traded Funds (0.0%) | |
2 | Vanguard Energy ETF | 25,000 | 2,102 |
| Energy Select Sector | | |
| SPDR Fund | 6,400 | 372 |
| | | 2,474 |
Total United States | | 5,115,969 |
International (42.8%) | | |
Argentina (0.1%) | | |
| Tenaris SA ADR | 185,200 | 8,791 |
* | Petrobras Energia | | |
| Participaciones SA ADR | 370,839 | 4,246 |
| | | 13,037 |
| | | | |
13
| | | Market |
| | | Value• |
| | Shares | ($000) |
Australia (4.0%) | | |
| BHP Billiton Ltd. ADR | 7,265,500 | 297,813 |
| Woodside Petroleum Ltd. ADR | 3,144,300 | 92,442 |
| Santos Ltd. | 1,410,245 | 10,231 |
| | | 400,486 |
Brazil (2.2%) | | |
| Petroleo Brasileiro ADR | 2,018,100 | 198,339 |
| Petroleo Brasileiro SA Pfd. | 582,700 | 12,851 |
| Petroleo Brasileiro SA | 413,600 | 10,120 |
| | | 221,310 |
Canada (10.5%) | | |
| Canadian Natural Resources Ltd. (New York Shares) | 4,391,300 | 219,653 |
| Suncor Energy, Inc. (New York Shares) | 2,568,500 | 190,968 |
| EnCana Corp. (New York Shares) | 3,056,000 | 146,780 |
| Petro Canada (New York Shares) | 3,147,200 | 122,300 |
| Canadian Oil Sands Trust | 4,221,175 | 107,532 |
| Talisman Energy, Inc. | 5,745,858 | 100,908 |
* | Western Oil Sands Inc. | 3,715,635 | 99,785 |
| EnCana Corp. | 401,500 | 19,201 |
* | Petro–Canada | 409,600 | 15,882 |
| Suncor Energy, Inc. | 168,500 | 12,448 |
| Imperial Oil Ltd. | 250,500 | 8,809 |
| Shell Canada Ltd. Class A | 226,000 | 8,667 |
| Canadian Natural Resources Ltd. | 110,300 | 5,498 |
| TransCanada Corp. | 46,200 | 1,528 |
* | Nexen Inc. | 21,600 | 1,300 |
* | Cameco Corp. | 14,700 | 558 |
| | | 1,061,817 |
China (1.3%) | | |
| China Petroleum and | | |
| Chemical Corp. ADR | 1,068,500 | 89,380 |
| PetroChina Co. Ltd. | 13,508,000 | 16,637 |
| China Petroleum &Chemical Corp. | 16,168,000 | 13,500 |
| Yanzhou Coal Mining Co.Ltd. H Shares | 10,533,800 | 9,768 |
| | | 129,285 |
Denmark (0.0%) | | |
| D/S Torm A/S | 40,750 | 2,605 |
| | | |
France (4.3%) | | |
| Total SA ADR | 5,752,400 | 391,451 |
| Total SA | 495,911 | 33,607 |
| Technip SA | 173,958 | 11,158 |
| | | 436,216 |
Hong Kong (0.3%) | | |
| CNOOC Ltd. ADR | 289,800 | 24,856 |
| CNOOC Ltd. | 5,565,600 | 4,750 |
| | | 29,606 |
| | | | Market |
| | | | Value• |
| | | Shares | ($000) |
India (0.1%) | | | |
* 3 Oil & Natural Gas Corp., Ltd. | |
| Warrants Exp. 7/14/08 | | 351,450 | 7,253 |
| | | | |
Italy (2.9%) | | | |
| ENI SpA ADR | | 4,076,750 | 262,828 |
| ENI SpA | | 955,273 | 30,697 |
| | | | 293,525 |
Netherlands (0.7%) | | | |
| Fugro NV | | 1,420,607 | 67,373 |
| | | | |
Norway (3.8%) | | | |
| Norsk Hydro AS ADR | | 5,871,500 | 189,649 |
| Statoil ASA ADR | | 6,201,900 | 166,583 |
| Norsk Hydro ASA | | 334,200 | 10,847 |
* | Petroleum Geo-Services ASA | | 431,800 | 10,115 |
| Statoil ASA | | 325,665 | 8,717 |
| | | | 385,911 |
Russia (2.6%) | | | |
| Lukoil ADR | | 1,950,700 | 155,308 |
* | OAO Gazprom-Sponsored ADR | | 2,588,322 | 112,071 |
| | | | 267,379 |
South Africa (0.7%) | | | |
| Sasol Ltd. Sponsored ADR | | 1,798,600 | 61,260 |
| Sasol Ltd. | | 144,200 | 4,892 |
| | | | 66,152 |
Spain (0.2%) | | | |
| Repsol YPF SA | | 447,715 | 14,724 |
| | | | |
United Kingdom (9.1%) | | | |
| BG Group PLC | | 19,976,205 | 262,938 |
| BP PLC ADR | | 3,878,800 | 246,343 |
| Royal Dutch Shell PLC ADR Class A | | 2,611,500 | 178,235 |
| Royal Dutch Shell PLC ADR Class B | | 2,398,426 | 162,397 |
| BP PLC | | 3,217,615 | 33,906 |
| Royal Dutch Shell PLC Class A | | 576,071 | 19,370 |
| Royal Dutch Shell PLC Class B | | 457,239 | 15,307 |
| Royal Dutch Shell PLC Class A (Amsterdam Shares) | | 117,600 | 3,976 |
| | | | 922,472 |
Total International | | | 4,319,151 |
Total Common Stocks | | | |
(Cost $4,785,682) | | | 9,435,120 |
| | | | | |
14
| | | Market |
| | | Value• |
| | Shares | ($000) |
Temporary Cash Investments (5.9%)1 | |
Money Market Fund (1.0%) | | |
4 | Vanguard Market Liquidity | |
| Fund, 5.272% | 107,406,962 | 107,407 |
| | | |
| | Face | |
| | Amount | |
| | ($000) | |
U.S. Agency Obligation (0.1%) | |
5 | Federal Home Loan Bank | | |
6 | 5.207%, 4/4/07 | 9,500 | 9,416 |
Repurchase Agreement (4.8%) | |
| Deutsche Bank, 5.270%, | | |
| 2/1/07 (Dated 1/31/07, | | |
| Repurchase Value $482,771,000 | |
| collateralized by Federal | | |
| Home Loan Mortgage Corp., | |
| 4.000%–6.500%, 2/1/20–10/1/36 | |
| and Government National | | |
| Mortgage Assn., 7.000%, | | |
| 12/20/33) | 482,700 | 482,700 |
Total Temporary Cash Investments | |
(Cost $599,523) | | 599,523 |
Total Investments (99.4%) | | |
(Cost $5,385,205) | | 10,034,643 |
Other Assets and Liabilities (0.6%) | |
Other Assets—Note C | | 113,180 |
Liabilities | | (57,202) |
| | | 55,978 |
Net Assets (100%) | | 10,090,621 |
| | | | | |
At January 31, 2007, net assets consisted of:7 |
| Amount |
| ($000) |
Paid in Capital | 5,268,259 |
Overdistributed Net Investment Income | (6,604) |
Accumulated Net Realized Gains | 178,399 |
Unrealized Appreciation | |
Investment Securities | 4,649,438 |
Futures Contracts | 1,073 |
Foreign Currencies | 56 |
Net Assets | 10,090,621 |
| |
| |
Investor Shares—Net Assets | |
Applicable to 101,954,180 outstanding $.001 |
par value shares of beneficial interest | |
(unlimited authorization) | 6,478,969 |
Net Asset Value Per Share— | |
Investor Shares | $63.55 |
| |
| |
Admiral Shares—Net Assets | |
Applicable to 30,261,313 outstanding $.001 |
par value shares of beneficial interest | |
(unlimited authorization) | 3,611,652 |
Net Asset Value Per Share— | |
Admiral Shares | $119.35 |
• | See Note A in Notes to Financial Statements. |
* | Non-income-producing security. |
1 | The fund invests a portion of its cash reserves in equity markets through the use of index futures contracts. After giving effect to futures investments, the fund’s effective common stock and temporary cash investment positions represent 94.5% and 4.9%, respectively, of net assets. See Note D in Notes to Financial Statements. |
2 | Considered an affiliated company of the fund as the issuer is another member of The Vanguard Group. |
3 | Security exempt from registration under Rule 144A of the Securities Act of 1933. Such securities may be sold in transactions exempt from registration, normally to qualified institutional buyers. At January 31, 2007, the value of this security represented 0.1% of net assets. |
4 | Affiliated money market fund available only to Vanguard funds and certain trusts and accounts managed by Vanguard. Rate shown is the 7-day yield. |
5 | The issuer operates under a congressional charter; its securities are neither issued nor guaranteed by the U.S. government. If needed, access to additional funding from the U.S. Treasury (beyond the issuer’s line of credit) would require congressional action. |
6 | Securities with a value of $9,416,000 have been segregated as initial margin for open futures contracts. |
7 | See Note D in Notes to Financial Statements for the tax-basis components of net assets. |
15
Statement of Operations
| | Year Ended |
| | January 31, 2007 |
| | ($000) |
Investment Income | | |
Income | | |
Dividends1 | | 160,124 |
Interest2 | | 32,943 |
Security Lending | | 3,376 |
Total Income | | 196,443 |
Expenses | | |
Investment Advisory Fees—Note B | | 5,691 |
The Vanguard Group—Note C | | |
Management and Administrative | | |
Investor Shares | | 10,814 |
Admiral Shares | | 3,619 |
Marketing and Distribution | | |
Investor Shares | | 1,455 |
Admiral Shares | | 529 |
Custodian Fees | | 190 |
Auditing Fees | | 28 |
Shareholders’ Reports | | |
Investor Shares | | 111 |
Admiral Shares | | 11 |
Trustees’ Fees and Expenses | | 12 |
Total Expenses | | 22,460 |
Net Investment Income | | 173,983 |
Realized Net Gain (Loss) | | |
Investment Securities Sold | | 424,691 |
Futures Contracts | | 8,825 |
Foreign Currencies | | (201) |
Realized Net Gain (Loss) | | 433,315 |
Change in Unrealized Appreciation (Depreciation) | |
Investment Securities | | (449,841) |
Futures Contracts | | (1,166) |
Foreign Currencies | | 50 |
Change in Unrealized Appreciation (Depreciation) | | (450,957) |
Net Increase (Decrease) in Net Assets Resulting from Operations | 156,341 |
1 | Dividends are net of foreign withholding taxes of $10,313,000. |
2 | Interest income from an affiliated company of the fund was $9,006,000. |
16
Statement of Changes in Net Assets
| Year Ended January 31, |
| 2007 | 2006 |
| ($000) | ($000) |
Increase (Decrease) in Net Assets | | |
Operations | | |
Net Investment Income | 173,983 | 116,734 |
Realized Net Gain (Loss) | 433,315 | 179,898 |
Change in Unrealized Appreciation (Depreciation) | (450,957) | 3,268,127 |
Net Increase (Decrease) in Net Assets Resulting from Operations | 156,341 | 3,564,759 |
Distributions | | |
Net Investment Income | | |
Investor Shares | (101,187) | (72,401) |
Admiral Shares | (58,057) | (33,730) |
Realized Capital Gain1 | | |
Investor Shares | (143,716) | (103,770) |
Admiral Shares | (78,820) | (41,708) |
Total Distributions | (381,780) | (251,609) |
Capital Share Transactions—Note F | | |
Investor Shares | (88,347) | (705,544) |
Admiral Shares | 582,810 | 1,842,807 |
Net Increase (Decrease) from Capital Share Transactions | 494,463 | 1,137,263 |
Total Increase (Decrease) | 269,024 | 4,450,413 |
Net Assets | | |
Beginning of Period | 9,821,597 | 5,371,184 |
End of Period2 | 10,090,621 | 9,821,597 |
1 | Includes fiscal 2007 and 2006 short-term gain distributions totaling $6,548,000 and $3,116,000, respectively. Short-term gain distributions are treated as ordinary income dividends for tax purposes. |
2 | Net Assets–End of Period includes undistributed (overdistributed) net investment income of ($6,604,000) and ($4,667,000). |
17
Financial Highlights
Energy Fund Investor Shares | | | | | |
| | | | | |
| | | | | |
| | | Year Ended January 31, |
For a Share Outstanding Throughout Each Period | 2007 | 2006 | 2005 | 2004 | 2003 |
Net Asset Value, Beginning of Period | $64.50 | $40.85 | $29.99 | $22.85 | $24.76 |
Investment Operations | | | | | |
Net Investment Income | 1.112 | .813 | .529 | .435 | .392 |
Net Realized and Unrealized Gain (Loss) on Investments1 | .405 | 24.606 | 11.052 | 7.839 | (.349) |
Total from Investment Operations | 1.517 | 25.419 | 11.581 | 8.274 | .043 |
Distributions | | | | | |
Dividends from Net Investment Income | (1.020) | (.740) | (.524) | (.390) | (.360) |
Distributions from Realized Capital Gains | (1.447) | (1.029) | (.197) | (.744) | (1.593) |
Total Distributions | (2.467) | (1.769) | (.721) | (1.134) | (1.953) |
Net Asset Value, End of Period | $63.55 | $64.50 | $40.85 | $29.99 | $22.85 |
| | | | | |
Total Return2 | 2.24% | 62.93% | 38.90% | 36.49% | –0.02% |
| | | | | |
Ratios/Supplemental Data | | | | | |
Net Assets, End of Period (Millions) | $6,479 | $6,733 | $4,822 | $2,434 | $1,298 |
Ratio of Total Expenses to Average Net Assets | 0.25% | 0.28% | 0.32% | 0.38% | 0.40% |
Ratio of Net Investment Income to Average Net Assets | 1.71% | 1.57% | 1.67% | 1.79% | 1.56% |
Portfolio Turnover Rate3 | 22% | 10% | 1% | 26% | 23% |
| | | | | | |
1 | Includes increases from redemption fees of $.03, $.03, $.02, $.00, and $.01. |
2 | Total returns do not reflect the 1% fee assessed on redemptions of shares held for less than one year. |
3 | Excludes the value of portfolio securities received or delivered as a result of in-kind purchases or redemptions of the fund’s capital shares. |
18
Energy Fund Admiral Shares | | | | | |
| | | | | |
| | | | | |
| | | Year Ended January 31, |
For a Share Outstanding Throughout Each Period | 2007 | 2006 | 2005 | 2004 | 2003 | |
Net Asset Value, Beginning of Period | $121.13 | $76.71 | $56.30 | $42.89 | $46.48 | |
Investment Operations | | | | | | |
Net Investment Income | 2.180 | 1.561 | 1.034 | .847 | .758 | |
Net Realized and Unrealized Gain (Loss) on Investments1 | .757 | 46.217 | 20.770 | 14.721 | (.658) | |
Total from Investment Operations | 2.937 | 47.778 | 21.804 | 15.568 | .100 | |
Distributions | | | | | | |
Dividends from Net Investment Income | (2.000) | (1.425) | (1.024) | (.760) | (.698) | |
Distributions from Realized Capital Gains | (2.717) | (1.933) | (.370) | (1.398) | (2.992) | |
Total Distributions | (4.717) | (3.358) | (1.394) | (2.158) | (3.690) | |
Net Asset Value, End of Period | $119.35 | $121.13 | $76.71 | $56.30 | $42.89 | |
| | | | | | |
| | | | | | |
Total Return2 | 2.32% | 63.00% | 39.02% | 36.58% | 0.02% | |
| | | | | | |
| | | | | | |
Ratios/Supplemental Data | | | | | | |
Net Assets, End of Period (Millions) | $3,612 | $3,088 | $549 | $208 | $103 | |
Ratio of Total Expenses to Average Net Assets | 0.18% | 0.22% | 0.26% | 0.32% | 0.34% | |
Ratio of Net Investment Income to | | | | | | |
Average Net Assets | 1.78% | 1.63% | 1.70% | 1.85% | 1.59% | |
Portfolio Turnover Rate3 | 22% | 10% | 1% | 26% | 23% | |
| | | | | | | | |
1 | Includes increases from redemption fees of $.05, $.03, $.03, $.01, and $.02. |
2 | Total returns do not reflect the 1% fee assessed on redemptions of shares held for less than one year. |
3 | Excludes the value of portfolio securities received or delivered as a result of in-kind purchases or redemptions of the fund’s capital shares. |
See accompanying Notes, which are an integral part of the Financial Statements.
19
Notes to Financial Statements
Vanguard Energy Fund is registered under the Investment Company Act of 1940 as an open-end investment company, or mutual fund. The fund files reports with the SEC under the company name Vanguard Specialized Funds. The fund may invest in securities of foreign issuers, which may subject it to investment risks not normally associated with investing in securities of United States corporations. The fund offers two classes of shares, Investor Shares and Admiral Shares. Investor Shares are available to any investor who meets the fund’s minimum purchase requirements. Admiral Shares are designed for investors who meet certain administrative, service, tenure, and account-size criteria.
A. The following significant accounting policies conform to generally accepted accounting principles for U.S. mutual funds. The fund consistently follows such policies in preparing its financial statements.
1. Security Valuation: Securities are valued as of the close of trading on the New York Stock Exchange (generally 4:00 p.m. Eastern time) on the valuation date. Equity securities are valued at the latest quoted sales prices or official closing prices taken from the primary market in which each security trades; such securities not traded on the valuation date are valued at the mean of the latest quoted bid and asked prices. Securities for which market quotations are not readily available, or whose values have been affected by events occurring before the fund’s pricing time but after the close of the securities’ primary markets, are valued at their fair values calculated according to procedures adopted by the board of trustees. These procedures include obtaining quotations from an independent pricing service, monitoring news to identify significant market- or security-specific events, and evaluating changes in the values of foreign market proxies (for example, ADRs, futures contracts, or exchange-traded funds), between the time the foreign markets close and the fund’s pricing time. When fair-value pricing is employed, the prices of securities used by a fund to calculate its net asset value may differ from quoted or published prices for the same securities. Investments in Vanguard Market Liquidity Fund are valued at that fund’s net asset value. Temporary cash investments acquired over 60 days to maturity are valued using the latest bid prices or using valuations based on a matrix system (which considers such factors as security prices, yields, maturities, and ratings), both as furnished by independent pricing services. Other temporary cash investments are valued at amortized cost, which approximates market value.
2. Foreign Currency: Securities and other assets and liabilities denominated in foreign currencies are translated into U.S. dollars at the exchange rates on the valuation date as employed by Morgan Stanley Capital International (MSCI) in the calculation of its indexes. As part of the fund’s fair value procedures, exchange rates may be adjusted if they change significantly before the fund’s pricing time but after the time at which the MSCI rates are determined (generally 11:00 a.m. Eastern time).
Realized gains (losses) and unrealized appreciation (depreciation) on investment securities include the effects of changes in exchange rates since the securities were purchased, combined with the effects of changes in security prices. Fluctuations in the value of other assets and liabilities resulting from changes in exchange rates are recorded as unrealized foreign currency gains (losses) until the asset or liability is settled in cash, when they are recorded as realized foreign currency gains (losses).
3. Futures Contracts: The fund uses index futures contracts to a limited extent, with the objective of maintaining full exposure to the stock market while maintaining liquidity. The fund may purchase or sell futures contracts to achieve a desired level of investment, whether to accommodate portfolio turnover or cash flows from capital share transactions. The primary risks associated with the use of futures contracts are imperfect correlation between changes in market values of stocks held by the fund and the prices of futures contracts, and the possibility of an illiquid market.
20
Futures contracts are valued based upon their quoted daily settlement prices. The aggregate principal amounts of the contracts are not recorded in the Statement of Net Assets. Fluctuations in the value of the contracts are recorded in the Statement of Net Assets as an asset (liability) and in the Statement of Operations as unrealized appreciation (depreciation) until the contracts are closed, when they are recorded as realized futures gains (losses).
4. Repurchase Agreements: The fund may invest in repurchase agreements. Securities pledged as collateral for repurchase agreements are held by a custodian bank until the agreements mature. Each agreement requires that the market value of the collateral be sufficient to cover payments of interest and principal; however, in the event of default or bankruptcy by the other party to the agreement, retention of the collateral may be subject to legal proceedings.
5. Federal Income Taxes: The fund intends to continue to qualify as a regulated investment company and distribute all of its taxable income. Accordingly, no provision for federal income taxes is required in the financial statements.
6. Distributions: Distributions to shareholders are recorded on the ex-dividend date.
7. Security Lending: The fund may lend its securities to qualified institutional borrowers to earn additional income. Security loans are required to be secured at all times by collateral at least equal to the market value of securities loaned. The fund invests cash collateral received in Vanguard Market Liquidity Fund, and records a liability for the return of the collateral, during the period the securities are on loan. Security lending income represents the income earned on investing cash collateral, less expenses associated with the loan.
8. Other: Dividend income is recorded on the ex-dividend date. Interest income includes income distributions received from Vanguard Market Liquidity Fund and is accrued daily. Security transactions are accounted for on the date securities are bought or sold. Costs used to determine realized gains (losses) on the sale of investment securities are those of the specific securities sold. Fees assessed on redemptions of capital shares are credited to paid-in capital.
Each class of shares has equal rights as to assets and earnings, except that each class separately bears certain class-specific expenses related to maintenance of shareholder accounts (included in Management and Administrative expenses) and shareholder reporting. Marketing and distribution expenses are allocated to each class of shares based on a method approved by the board of trustees. Income, other non-class-specific expenses, and gains and losses on investments are allocated to each class of shares based on its relative net assets.
B. Wellington Management Company, LLP, provides investment advisory services to a portion of the fund for a fee calculated at an annual percentage rate of average net assets managed by the advisor.
The Vanguard Group provides investment advisory services to a portion of the fund on an at-cost basis; the fund paid Vanguard advisory fees of $448,000 for the year ended January 31, 2007.
For the year ended January 31, 2007, the aggregate investment advisory fee represented an effective annual rate of 0.06% of the fund’s average net assets.
C. The Vanguard Group furnishes at cost corporate management, administrative, marketing, and distribution services. The costs of such services are allocated to the fund under methods approved by the board of trustees. The fund has committed to provide up to 0.40% of its net assets in capital
21
contributions to Vanguard. At January 31, 2007, the fund had contributed capital of $1,001,000 to Vanguard (included in Other Assets), representing 0.01% of the fund’s net assets and 1.00% of Vanguard’s capitalization. The fund’s trustees and officers are also directors and officers of Vanguard.
D. Distributions are determined on a tax basis and may differ from net investment income and realized capital gains for financial reporting purposes. Differences may be permanent or temporary. Permanent differences are reclassified among capital accounts in the financial statements to reflect their tax character. Temporary differences arise when certain items of income, expense, gain, or loss are recognized in different periods for financial statement and tax purposes; these differences will reverse at some time in the future. Differences in classification may also result from the treatment of short-term gains as ordinary income for tax purposes.
During the year ended January 31, 2007, the fund realized net foreign currency losses of $201,000, which decreased distributable net income for tax purposes; accordingly, such losses have been reclassified from overdistributed net investment income to accumulated net realized gains. The fund used a tax accounting practice to treat a portion of the price of capital shares redeemed during the year as distributions from net investment income and realized capital gains. Accordingly, the fund has reclassified $16,475,000 from undistributed net investment income, and $40,265,000 from accumulated net realized gains, to paid-in capital.
For tax purposes, at January 31, 2007, the fund had $23,877,000 of ordinary income and $159,353,000 of long-term capital gains available for distribution.
At January 31, 2007, the cost of investment securities for tax purposes was $5,386,202,000. Net unrealized appreciation of investment securities for tax purposes was $4,648,441,000, consisting of unrealized gains of $4,669,156,000 on securities that had risen in value since their purchase and $20,715,000 in unrealized losses on securities that had fallen in value since their purchase.
At January 31, 2007, the aggregate settlement value of open futures contracts expiring in March 2007 and the related unrealized appreciation (depreciation) were:
| | | ($000) |
| Number of | Aggregate | Unrealized |
| Long | Settlement | Appreciation |
Futures Contracts | Contracts | Value | (Depreciation) |
E-mini S&P 500 Index | 800 | 57,720 | 588 |
S&P 500 Index | 120 | 43,290 | 485 |
Unrealized appreciation (depreciation) on open futures contracts is required to be treated as realized gain (loss) for tax purposes.
E. During the year ended January 31, 2007, the fund purchased $2,332,973,000 of investment securities and sold $2,080,097,000 of investment securities other than temporary cash investments.
22
F. Capital share transactions for each class of shares were:
| | | Year Ended January 31, |
| | 2007 | | 2006 |
| Amount | Shares | Amount | Shares |
| ($000) | (000) | ($000) | (000) |
Investor Shares | | | | |
Issued | 1,793,137 | 28,223 | 2,361,160 | 44,701 |
Issued in Lieu of Cash Distributions | 235,334 | 3,595 | 169,002 | 3,051 |
Redeemed1 | (2,116,818) | (34,259) | (3,235,706) | (61,397) |
Net Increase (Decrease)—Investor Shares | (88,347) | (2,441) | (705,544) | (13,645) |
Admiral Shares | | | | |
Issued | 1,261,595 | 10,675 | 2,119,452 | 21,056 |
Issued in Lieu of Cash Distributions | 124,702 | 1,014 | 68,893 | 653 |
Redeemed1 | (803,487) | (6,921) | (345,538) | (3,374) |
Net Increase (Decrease)—Admiral Shares | 582,810 | 4,768 | 1,842,807 | 18,335 |
G. In June 2006, the Financial Accounting Standards Board issued Interpretation No. 48 (“FIN 48”), “Accounting for Uncertainty in Income Taxes.” FIN 48 establishes the minimum threshold for recognizing, and a system for measuring, the benefits of tax-return positions in financial statements. FIN 48 will be effective for the fund’s fiscal year ending January 31, 2008. Management is in the process of analyzing the fund’s tax positions for purposes of implementing FIN 48; based on the analysis completed to date, management does not believe the adoption of FIN 48 will result in any material impact to the fund’s financial statements.
1 | Net of redemption fees of $3,975,000 and $3,440,000, respectively (fund totals). |
23
Report of Independent Registered Public Accounting Firm
To the Trustees of Vanguard Specialized Funds and Shareholders of Vanguard Energy Fund:
In our opinion, the accompanying statement of net assets and the related statements of operations and of changes in net assets and the financial highlights present fairly, in all material respects, the financial position of Vanguard Energy Fund (one of the funds constituting Vanguard Specialized Funds, hereafter referred to as the “Fund”) at January 31, 2007, the results of its operations for the year then ended, the changes in its net assets for each of the two years in the period then ended and the financial highlights for each of the five years in the period then ended, in conformity with accounting principles generally accepted in the United States of America. These financial statements and financial highlights (hereafter referred to as “financial statements”) are the responsibility of the Fund’s management; our responsibility is to express an opinion on these financial statements based on our audits. We conducted our audits of these financial statements in accordance with the standards of the Public Company Accounting Oversight Board (United States). Those standards require that we plan and perform the audit to obtain reasonable assurance about whether the financial statements are free of material misstatement. An audit includes examining, on a test basis, evidence supporting the amounts and disclosures in the financial statements, assessing the accounting principles used and significant estimates made by management, and evaluating the overall financial statement presentation. We believe that our audits, which included confirmation of securities at January 31, 2007 by correspondence with the custodians and brokers and by agreement to the underlying ownership records for Vanguard Market Liquidity Fund, provide a reasonable basis for our opinion.
PricewaterhouseCoopers LLP |
Philadelphia, Pennsylvania |
March 13, 2007
Special 2006 tax information (unaudited) for Vanguard Energy Fund
This information for the fiscal year ended January 31, 2007, is included pursuant to provisions of the Internal Revenue Code.
The fund distributed $254,116,000 as capital gains dividends (from net long-term capital gains) to shareholders during the fiscal year.
The fund distributed $129,202,000 of qualified dividend income to shareholders during the fiscal year.
For corporate shareholders, 33.7% of investment income (dividend income plus short-term gains, if any) qualifies for the dividends-received deduction.
24
Your Fund’s After-Tax Returns
This table presents returns for your fund both before and after taxes. The after-tax returns are shown in two ways: (1) assuming that an investor owned the fund during the entire period and paid taxes on the fund’s distributions, and (2) assuming that an investor paid taxes on the fund’s distributions and sold all shares at the end of each period.
Calculations are based on the highest individual federal income tax and capital gains tax rates in effect at the times of the distributions and the hypothetical sales. State and local taxes were not considered. After-tax returns reflect any qualified dividend income, using actual prior-year figures and estimates for 2007. (In the example, returns after the sale of fund shares may be higher than those assuming no sale. This occurs when the sale would have produced a capital loss. The calculation assumes that the investor received a tax deduction for the loss.)
The table shows returns for Investor Shares only; returns for other share classes will differ. Please note that your actual after-tax returns will depend on your tax situation and may differ from those shown. Also note that if you own the fund in a tax-deferred account, such as an individual retirement account or a 401(k) plan, this information does not apply to you. Such accounts are not subject to current taxes.
Finally, keep in mind that a fund’s performance—whether before or after taxes—does not guarantee future results.
Average Annual Total Returns: Energy Fund Investor Shares1 | | | |
Periods Ended January 31, 2007 | | | |
| One | Five | Ten |
| Year | Years | Years |
Returns Before Taxes | 2.24% | 25.85% | 15.88% |
Returns After Taxes on Distributions | 1.61 | 24.87 | 14.66 |
Returns After Taxes on Distributions and Sale of Fund Shares | 2.16 | 22.63 | 13.59 |
1 | Total return figures do not reflect the 1% fee assessed on redemptions of shares held less than one year. |
25
About Your Fund’s Expenses
As a shareholder of the fund, you incur ongoing costs, which include costs for portfolio management, administrative services, and shareholder reports (like this one), among others. Operating expenses, which are deducted from a fund’s gross income, directly reduce the investment return of the fund.
A fund’s expenses are expressed as a percentage of its average net assets. This figure is known as the expense ratio. The following examples are intended to help you understand the ongoing costs (in dollars) of investing in your fund and to compare these costs with those of other mutual funds. The examples are based on an investment of $1,000 made at the beginning of the period shown and held for the entire period.
The table below illustrates your fund’s costs in two ways:
• Based on actual fund return. This section helps you to estimate the actual expenses that you paid over the period. The “Ending Account Value” shown is derived from the fund’s actual return, and the third column shows the dollar amount that would have been paid by an investor who started with $1,000 in the fund. You may use the information here, together with the amount you invested, to estimate the expenses that you paid over the period.
To do so, simply divide your account value by $1,000 (for example, an $8,600 account value divided by $1,000 = 8.6), then multiply the result by the number given for your fund under the heading “Expenses Paid During Period.”
• Based on hypothetical 5% yearly return. This section is intended to help you compare your fund’s costs with those of other mutual funds. It assumes that the fund had a yearly return of 5% before expenses, but that the expense ratio is unchanged. In this case—because the return used is not the fund’s actual return—the results do not apply to your investment. The example is useful in making comparisons because the Securities and Exchange Commission requires all mutual funds to calculate expenses based on a 5% return. You can assess your fund’s costs by comparing this hypothetical example with the hypothetical examples that appear in shareholder reports of other funds.
Six Months Ended January 31, 2007 | | | |
| Beginning | Ending | Expenses |
| Account Value | Account Value | Paid During |
Energy Fund | 7/31/2006 | 1/31/2007 | Period1 |
Based on Actual Fund Return | | | |
Investor Shares | $1,000.00 | $994.97 | $1.21 |
Admiral Shares | 1,000.00 | 995.31 | 0.85 |
Based on Hypothetical 5% Yearly Return | | | |
Investor Shares | $1,000.00 | $1,024.00 | $1.22 |
Admiral Shares | 1,000.00 | 1,024.35 | 0.87 |
1 | These calculations are based on expenses incurred in the most recent six-month period. The fund’s annualized six-month expense ratios for that period are 0.24% for Investor Shares and 0.17% for Admiral Shares. The dollar amounts shown as “Expenses Paid” are equal to the annualized expense ratio multiplied by the average account value over the period, multiplied by the number of days in the most recent six-month period, then divided by the number of days in the most recent 12-month period. |
26
Note that the expenses shown in the table on page 26 are meant to highlight and help you compare ongoing costs only; they do not include your fund’s low-balance fee or the 1% fee on redemptions of shares held for less than one year. These fees are fully described in the prospectus. If the fees were applied to your account, your costs would be higher. Your fund does not carry a “sales load.”
The calculations assume no shares were bought or sold during the period. Your actual costs may have been higher or lower, depending on the amount of your investment and the timing of any purchases or redemptions.
You can find more information about the fund’s expenses, including annual expense ratios, in the Financial Statements section of this report. For additional information on operating expenses and other shareholder costs, please refer to the appropriate fund prospectus.
27
Notice to Shareholders
The board of trustees of Vanguard Energy Fund has adopted a new asset-based advisory fee schedule for one of the fund’s advisors Wellington Management Company, LLP (Wellington Management) effective May 1, 2007. In addition, the board has added a performance adjustment to the fee arrangement with Wellington Management in order to further align the interests of the advisor and the fund’s shareholders. The performance adjustment will increase or decrease the asset-based fee proportionately with the investment performance of the fund’s assets managed by Wellington Management (the Wellington Management Portfolio). The new advisory fee arrangement for Wellington Management is expected to raise the fund’s expense ratio to 0.28% from 0.25% for Investor Shares and to 0.21% from 0.18% for Admiral Shares. For shareholders, such an increase represents an additional $3 in costs annually on a $10,000 investment. This change will not affect the fund’s investment objective, policies, or strategies. The Vanguard Group, Inc., also provides investment advisory services to the fund.
The fund’s trustees regularly evaluate its investment advisory arrangements, focusing on factors such as the advisor’s investment process, style consistency, and performance, as well as the composition and depth of the management and research teams. In deciding to adopt the new fee arrangement, the trustees considered the fund’s performance together with a wide range of information relating to Wellington Management, which has managed the fund since its inception in 1984.
The fund has entered into a new investment advisory agreement with Wellington Management to reflect the new fee arrangement; however, other terms of the existing agreement have not changed. Under the terms of the new agreement, the fund will pay Wellington Management a fee at the end of each fiscal quarter. The fee is calculated by applying an annual percentage rate to the average daily net assets of the Wellington Management Portfolio during the quarter. The quarterly payments to Wellington Management may be increased or decreased by applying the new performance adjustment. The adjustment will be based on the Wellington Management Portfolio’s cumulative total performance over a trailing 36-month period (subject to certain transition rules that will be in place until 36 months have elapsed from the date of the new agreement) as compared with that of a composite index over the same period. The composite index is weighted 50% in the S&P Citigroup BMI World Energy Index and 50% in the S&P Energy Equal Weighted Blend Index.
For the fiscal year ended January 31, 2007, the total advisory fees paid by Vanguard Energy Fund were $5,691,000, or 0.06% of the fund’s average net assets. The Vanguard Group provides advisory services to the fund on an at-cost basis. Of the aggregate fees paid for that fiscal year, the investment advisory expenses incurred by Vanguard were $448,000 (representing an effective annual rate of less than 0.01%). If the new fee arrangement had been in place throughout the fiscal year, the advisory fees paid by the fund would have totaled $8,405,000, or 0.09% of the fund’s average net assets. The average advisory fee paid by funds in the Energy Fund’s Lipper peer group was 0.65% of assets as of December 31, 2006.
Board approval of the investment advisory agreement
Wellington Management is responsible for managing the investment and reinvestment of the Wellington Management Portfolio, which represents a portion of the Energy Fund’s assets. In managing these assets, Wellington Management is responsible for continuously reviewing, supervising, and administering the investment program. The advisor discharges its responsibilities subject to the supervision and oversight of the officers and trustees of the fund.
28
The fund’s trustees retained Wellington Management under the terms of an investment advisory agreement. The board’s decision to revise the current asset-based advisory fee schedule and add a performance adjustment schedule was based upon its most recent evaluation of the advisor’s investment staff, portfolio management process, and performance results. In considering whether to approve the new agreement, the board considered the following factors, among others:
The trustees considered the benefits to shareholders of continuing to retain Wellington Management as advisor to the fund, particularly in light of the nature, extent, and quality of services provided by Wellington Management. The board considered the quality of investment management to the fund over both the short and the long term and the organizational depth and stability of the firm. The trustees concluded that Wellington Management retains a portfolio management team that continues to execute a disciplined process of identifying attractive energy-related companies. The team has advised the fund since its inception in 1984, using a bottom-up approach in which stocks are selected based on the advisor’s estimates of fundamental investment value. Further, the board noted that the advisor’s process emphasizes company fundamentals, management track record, and security valuation. The board concluded that Wellington Management is a stable and financially sound organization. The board also concluded that Wellington Management has consistently managed the Energy Fund in accordance with its mandate.
The board decided that the fee schedule should be adjusted to reflect the fair market value of Wellington Management’s services and the firm’s need to maintain an expanded team to manage a large portfolio in this market segment. Under the new fee arrangement, Wellington Management could build on its organizational depth and stability and could enhance the portfolio management team by hiring and retaining top investment talent.
The trustees also considered the investment performance of the Wellington Management Portfolio compared with those of the fund’s peer group and a relevant market benchmark. The board concluded that short- and long-term performance has been very competitive, with the Wellington Management Portfolio outperforming both the peer group and the S&P Energy Sector Index over the last 3-, 5-, and 10-year periods.
The trustees considered the cost of services to be provided, including consideration of competitive fee rates and expense ratios, and the fact that, after the adjustment, the fund’s advisory fee is expected to remain significantly below the fees of most of its peers.
Further, the trustees considered the extent to which economies of scale would be realized as the fund grows, including a consideration of appropriate breakpoints in the fee schedule. By including asset-based breakpoints in Wellington Management’s fee schedule, the trustees ensure that, if the fund continues to grow, investors will benefit by realizing economies of scale in the form of a lower advisory fee ratio.
The trustees considered all of the circumstances and information provided by both Wellington Management and Vanguard regarding the performance of the Wellington Management Portfolio and the advisor, and concluded that approval of a new advisory fee schedule in the investment advisory agreement is in the best interest of the fund and its shareholders.
29
The advisory agreement will continue for a period of one year from its effective date and is renewable after that for successive one-year periods. The agreement will be reviewed annually by the fund’s trustees, a majority of whom are not “interested persons” of either the fund or Wellington Management as defined in federal securities laws.
Background information on Wellington Management
Wellington Management Company, LLP, a Massachusetts partnership with offices at 75 State Street, Boston, MA 02109, is an investment firm that was founded in 1928. As of December 31, 2006, the firm managed approximately $575.5 billion in assets for a variety of clients, including mutual funds, institutions, and separate accounts. The managers primarily responsible for overseeing the fund’s investments are:
• | Karl E. Bandtel, Senior Vice President of Wellington Management. He has worked in investment management with Wellington Management since 1990 and has co-managed Wellington Management’s portion of the fund since 2005. He holds a B.S. and an M.S. from the University of Wisconsin. |
• | James A. Bevilacqua, Senior Vice President of Wellington Management Company. He has worked in investment management with Wellington Management since 1994 and has co-managed Wellington Management’s portion of the fund since 2005. He holds a B.S. and an M.S. from the Massachusetts Institute of Technology and an M.B.A. from Stanford Graduate School of Business. |
Wellington Management is owned by its 99 active partners, all of whom are active members of the firm. The managing partners of the firm are Laurie A. Gabriel, Phillip H. Perelmuter, and Perry M. Traquina. Please note that the managing partners are not necessarily those with the largest economic interests in the firm.
30
Glossary
Beta. A measure of the magnitude of a fund’s past share-price fluctuations in relation to the ups and downs of a given market index. The index is assigned a beta of 1.00. Compared with a given index, a fund with a beta of 1.20 typically would have seen its share price rise or fall by 12% when the index rose or fell by 10%. A fund’s beta should be reviewed in conjunction with its R-squared (see definition below). The lower the R-squared, the less correlation there is between the fund and the index, and the less reliable beta is as an indicator of volatility.
Earnings Growth Rate. The average annual rate of growth in earnings over the past five years for the stocks now in a fund.
Expense Ratio. The percentage of a fund’s average net assets used to pay its annual administrative and advisory expenses. These expenses directly reduce returns to investors.
Foreign Holdings. The percentage of a fund represented by stocks or depositary receipts of companies based outside the United States.
Inception Date. The date on which the assets of a fund (or one of its share classes) are first invested in accordance with the fund’s investment objective. For funds with a subscription period, the inception date is the day after that period ends. Investment performance is measured from the inception date.
Median Market Cap. An indicator of the size of companies in which a fund invests; the midpoint of market capitalization (market price x shares outstanding) of a fund’s stocks, weighted by the proportion of the fund’s assets invested in each stock. Stocks representing half of the fund’s assets have market capitalizations above the median, and the rest are below it.
Price/Book Ratio. The share price of a stock divided by its net worth, or book value, per share. For a fund, the weighted average price/book ratio of the stocks it holds.
Price/Earnings Ratio. The ratio of a stock’s current price to its per-share earnings over the past year. For a fund, the weighted average P/E of the stocks it holds. P/E is an indicator of market expectations about corporate prospects; the higher the P/E, the greater the expectations for a company’s future growth.
R-Squared. A measure of how much of a fund’s past returns can be explained by the returns from the market in general, as measured by a given index. If a fund’s total returns were precisely synchronized with an index’s returns, its R-squared would be 1.00. If the fund’s returns bore no relationship to the index’s returns, its R-squared would be 0.
Return on Equity. The annual average rate of return generated by a company during the past five years for each dollar of shareholder’s equity (net income divided by shareholder’s equity). For a fund, the weighted average return on equity for the companies whose stocks it holds.
Short-Term Reserves. The percentage of a fund invested in highly liquid, short-term securities that can be readily converted to cash.
Turnover Rate. An indication of the fund’s trading activity. Funds with high turnover rates incur higher transaction costs and may be more likely to distribute capital gains (which may be taxable to investors). The turnover rate excludes in-kind transactions, which have minimal impact on costs.
Yield. A snapshot of a fund’s income from interest and dividends. The yield, expressed as a percentage of the fund’s net asset value, is based on income earned over the past 30 days and is annualized, or projected forward for the coming year. The index yield is based on the current annualized rate of income provided by securities in the index.
31
The People Who Govern Your Fund
The trustees of your mutual fund are there to see that the fund is operated and managed in your best interests since, as a shareholder, you are a part owner of the fund. Your fund’s trustees also serve on the board of directors of The Vanguard Group, Inc., which is owned by the Vanguard funds and provides services to them on an at-cost basis.
A majority of Vanguard’s board members are independent, meaning that they have no affiliation with Vanguard or the funds they oversee, apart from the sizable personal investments they have made as private individuals.
Our independent board members bring distinguished backgrounds in business, academia, and public service to their task of working with Vanguard officers to establish the policies and oversee the activities of the funds. Among board members’ responsibilities are selecting investment advisors for the funds; monitoring fund operations, performance, and costs; reviewing contracts; nominating and selecting new trustees/directors; and electing Vanguard officers.
Each trustee serves a fund until its termination; or until the trustee’s retirement, resignation, or death; or otherwise as specified in the fund’s organizational documents. Any trustee may be removed at a shareholders’ meeting by a vote representing two-thirds of the net asset value of all shares of the fund together with shares of other Vanguard funds organized within the same trust. The table on these two pages shows information for each trustee and executive officer of the fund. The mailing address of the trustees and officers is P.O. Box 876, Valley Forge, PA 19482.
Chairman of the Board, Chief Executive Officer, and Trustee |
| |
John J. Brennan1 | |
Born 1954 | Principal Occupation(s) During the Past Five Years: Chairman of the Board, Chief |
Trustee since May 1987; | Executive Officer, and Director/Trustee of The Vanguard Group, Inc., and of each |
Chairman of the Board and | of the investment companies served by The Vanguard Group. |
Chief Executive Officer | |
146 Vanguard Funds Overseen |
| |
Independent Trustees | |
| |
Charles D. Ellis | |
Born 1937 | Principal Occupation(s) During the Past Five Years: Applecore Partners (pro bono ventures |
Trustee since January 2001 | in education); Senior Advisor to Greenwich Associates (international business strategy |
146 Vanguard Funds Overseen | consulting); Successor Trustee of Yale University; Overseer of the Stern School of Business |
| at New York University; Trustee of the Whitehead Institute for Biomedical Research. |
| |
Rajiv L. Gupta | |
Born 1945 | Principal Occupation(s) During the Past Five Years: Chairman and Chief Executive Officer |
Trustee since December 20012 | of Rohm and Haas Co. (chemicals); Board Member of the American Chemistry Council; |
146 Vanguard Funds Overseen | Director of Tyco International, Ltd. (diversified manufacturing and services) (since 2005); |
| Trustee of Drexel University and of the Chemical Heritage Foundation. |
| |
Amy Gutmann | |
Born 1949 | Principal Occupation(s) During the Past Five Years: President of the University of |
Trustee since June 2006 | Pennsylvania since 2004; Professor in the School of Arts and Sciences, Annenberg School |
146 Vanguard Funds Overseen | for Communication, and Graduate School of Education of the University of Pennsylvania |
| since 2004; Provost (2001–2004) and Laurance S. Rockefeller Professor of Politics and the |
| University Center for Human Values (1990–2004), Princeton University; Director of Carnegie |
| Corporation of New York and of Philadelphia 2016 (since 2005) and of Schuylkill River |
| Development Corporation and Greater Philadelphia Chamber of Commerce (since 2004). |
JoAnn Heffernan Heisen | |
Born 1950 | Principal Occupation(s) During the Past Five Years: Corporate Vice President and Chief |
Trustee since July 1998 | Global Diversity Officer (since January 2006), Vice President and Chief Information |
146 Vanguard Funds Overseen | Officer (1997–2005), and Member of the Executive Committee of Johnson & Johnson |
| (pharmaceuticals/consumer products); Director of the University Medical Center at |
| Princeton and Women’s Research and Education Institute. |
| |
André F. Perold | |
Born 1952 | Principal Occupation(s) During the Past Five Years: George Gund Professor of Finance and |
Trustee since December 2004 | Banking, Harvard Business School (since 2000); Senior Associate Dean, Director of Faculty |
146 Vanguard Funds Overseen | Recruiting, and Chair of Finance Faculty, Harvard Business School; Director and Chairman |
| of UNX, Inc. (equities trading firm) (since 2003); Director of registered investment |
| companies advised by Merrill Lynch Investment Managers and affiliates (1985–2004), |
| Genbel Securities Limited (South African financial services firm) (1999–2003), Gensec |
| Bank (1999–2003), Sanlam, Ltd. (South African insurance company) (2001–2003), and |
| Stockback, Inc. (credit card firm) (2000–2002). |
| |
Alfred M. Rankin, Jr. | |
Born 1941 | Principal Occupation(s) During the Past Five Years: Chairman, President, Chief Executive |
Trustee since January 1993 | Officer, and Director of NACCO Industries, Inc. (forklift trucks/housewares/ lignite); |
146 Vanguard Funds Overseen | Director of Goodrich Corporation (industrial products/aircraft systems and services). |
| |
J. Lawrence Wilson | |
Born 1936 | Principal Occupation(s) During the Past Five Years: Retired Chairman and Chief Executive |
Trustee since April 1985 | Officer of Rohm and Haas Co. (chemicals); Director of Cummins Inc. (diesel engines), |
146 Vanguard Funds Overseen | MeadWestvaco Corp. (packaging products), and AmerisourceBergen Corp. (pharmaceutical |
| distribution); Trustee of Vanderbilt University and of Culver Educational Foundation. |
| |
Executive Officers1 | |
| |
Heidi Stam | |
Born 1956 | Principal Occupation(s) During the Past Five Years: Managing Director of The Vanguard |
Secretary since July 2005 | Group, Inc., since 2006; General Counsel of The Vanguard Group since 2005; Secretary |
146 Vanguard Funds Overseen | of The Vanguard Group, and each of the investment companies served by The Vanguard |
| Group, since 2005; Principal of The Vanguard Group (1997-2006). |
| |
Thomas J. Higgins | |
Born 1957 | Principal Occupation(s) During the Past Five Years: Principal of The Vanguard Group, Inc.; |
Treasurer since July 1998 | Treasurer of each of the investment companies served by The Vanguard Group. |
146 Vanguard Funds Overseen | |
| |
Vanguard Senior Management Team |
| |
R. Gregory Barton | Kathleen C. Gubanich | Michael S. Miller |
Mortimer J. Buckley | Paul A. Heller | Ralph K. Packard |
James H. Gately | F. William McNabb, III | George U. Sauter |
| |
Founder | |
| |
John C. Bogle | |
Chairman and Chief Executive Officer, 1974–1996 |
1 Officers of the funds are “interested persons” as defined in the Investment Company Act of 1940.
2 December 2002 for Vanguard Equity Income Fund, Vanguard Growth Equity Fund, the Vanguard Municipal Bond Funds, and the Vanguard State Tax-Exempt Funds.
More information about the trustees is in the Statement of Additional Information, available from The Vanguard Group.
| 
|
| P.O. Box 2600 |
| Valley Forge, PA 19482-2600 |
Connect with Vanguard™ > www.vanguard.com
Fund Information > 800-662-7447 | Vanguard, Admiral, Connect with Vanguard, and the ship |
| logo are trademarks of The Vanguard Group, Inc. |
Direct Investor Account Services > 800-662-2739 | |
| |
Institutional Investor Services > 800-523-1036 | All other marks are the exclusive property of their |
| respective owners. |
Text Telephone for the | |
Hearing Impaired > 800-952-3335 | All comparative mutual fund data are from Lipper Inc. |
| or Morningstar, Inc., unless otherwise noted. |
| |
| |
| |
This material may be used in conjunction | You can obtain a free copy of Vanguard’s proxy voting |
with the offering of shares of any Vanguard | guidelines by visiting our website, www.vanguard.com, |
fund only if preceded or accompanied by | and searching for “proxy voting guidelines,” or by calling |
the fund’s current prospectus. | Vanguard at 800-662-2739. They are also available from |
| the SEC’s website, www.sec.gov. In addition, you may |
| obtain a free report on how your fund voted the proxies for |
| securities it owned during the 12 months ended June 30. |
| To get the report, visit either www.vanguard.com |
| or www.sec.gov. |
| |
| You can review and copy information about your fund |
| at the SEC’s Public Reference Room in Washington, D.C. |
| To find out more about this public service, call the SEC |
| at 202-551-8090. Information about your fund is also |
| available on the SEC’s website, and you can receive |
| copies of this information, for a fee, by sending a |
| request in either of two ways: via e-mail addressed to |
| publicinfo@sec.gov or via regular mail addressed to the |
| Public Reference Section, Securities and Exchange |
| Commission, Washington, DC 20549-0102. |
| |
| |
| |
| |
| © 2007 The Vanguard Group, Inc. |
| All rights reserved. |
| Vanguard Marketing Corporation, Distributor. |
| |
| Q510 032007 |
|
|
Vanguard® Precious Metals |
And Mining Fund |
|
> Annual Report |
|
|
|
|
|
January 31, 2007 |
|
|
> | During the fiscal year ended January 31, 2007, Vanguard Precious Metals and |
| Mining Fund returned 17.5%, well ahead of its index benchmark and the average |
| peer fund. |
> | The broad U.S. stock market returned 14.1%, on the strength of a sustained rally |
| in the second half of the year. |
> | Concentrated holdings in platinum mining and production firms contributed |
| significantly to the fund’s strong return. |
Contents | |
| |
Your Fund’s Total Returns | 1 |
Chairman’s Letter | 2 |
Advisor’s Report | 7 |
Fund Profile | 9 |
Performance Summary | 10 |
Financial Statements | 12 |
Your Fund’s After-Tax Returns | 22 |
About Your Fund’s Expenses | 23 |
Glossary | 25 |
Please note: The opinions expressed in this report are just that—informed opinions. They should not be considered promises or advice. Also, please keep in mind that the information and opinions cover the period through the date on the cover of this report. Of course, the risks of investing in your fund are spelled out in the prospectus.
Your Fund’s Total Returns
Fiscal Year Ended January 31, 2007 | |
| Total |
| Returns |
Vanguard Precious Metals and Mining Fund | 17.5% |
S&P/Citigroup Custom Metals and Mining Index | 13.0 |
Average Gold-Oriented Fund1 | 9.6 |
Dow Jones Wilshire 5000 Index | 14.1 |
Your Fund’s Performance at a Glance: | | | | |
January 31, 2006–January 31, 2007 | | | | |
| | | Distributions Per Share |
| Starting | Ending | Income | Capital |
| Share Price | Share Price | Dividends | Gains |
Vanguard Precious Metals and Mining Fund | $27.08 | $28.64 | $0.490 | $2.537 |
1 | Derived from data provided by Lipper Inc. |
1

Chairman’s Letter
Dear Shareholder,
Vanguard Precious Metals and Mining Fund returned 17.5% during the fiscal year ended January 31, 2007. The fund outpaced its benchmark, the average return of gold-oriented funds, and the broad U.S. stock market. Prices of several metals and minerals climbed to record highs in the first half of the year, and then subsided amid concerns of slowing global economic growth.
Because of increased cash flows, the fund was closed to new investors on February 2, 2006, to ensure the advisor’s ability to manage the fund effectively. As of this writing, the fund remained closed. Existing shareholders are permitted to make additional share purchases in the fund.
Domestic equity markets did well; international markets did even better
In the first half of the fiscal year, returns from large-capitalization stocks were virtually flat, while those of small-caps lost some ground. In the second six months, both large and small stocks rebounded, with small-caps faring slightly better. For the 12 months, the broad U.S. stock market gained 14.1%. Despite the weakness in the housing sector, the economy showed remarkable resilience, and corporate profits rose at a fast clip.
2
Across market capitalizations, value-oriented stocks outpaced their growth-oriented counterparts. International stocks continued to outperform U.S. stocks, as overseas markets—especially European and emerging markets—provided stellar returns. For U.S.-based investors, the dollar’s weakness further enhanced the results of international stocks.
Bond returns were modest as the Fed put rate hikes on hold
In the first six months of the fiscal year, the Federal Reserve Board continued its campaign to keep inflation in check, raising its target for the key federal funds rate by 0.25 percentage point on three occasions (in addition to a 0.25 percentage point increase the day before the fiscal year began). Then, at its August meeting, the Fed left the target rate unchanged at 5.25%, where it remained through the end of the fiscal period, as inflation fears diminished.
Following the Fed’s pause, the prices of longer-maturity bonds rose faster than those of short-term bonds, reducing their yields more dramatically. Throughout the maturity spectrum, the “yield spread,” or the difference between yields of corporate securities and those of U.S. Treasury securities of comparable maturities, became even tighter. Bonds produced coupon-like returns for the period, with the broad taxable bond market returning 4.3%. Corporate bonds generally outperformed U.S. government issues. The Citigroup 3-Month Treasury Bill Index, a proxy for money market yields, returned 4.9%.
Market Barometer | | | |
| | Average Annual Total Returns |
| | Periods Ended January 31, 2007 |
| One Year | Three Years | Five Years |
Stocks | | | |
Russell 1000 Index (Large-caps) | 14.5% | 11.0% | 7.5% |
Russell 2000 Index (Small-caps) | 10.4 | 12.6 | 12.0 |
Dow Jones Wilshire 5000 Index (Entire market) | 14.1 | 11.5 | 8.4 |
MSCI All Country World Index ex USA (International) | 19.3 | 21.3 | 18.0 |
| | | |
| | | |
Bonds | | | |
Lehman Aggregate Bond Index (Broad taxable market) | 4.3% | 3.4% | 4.9% |
Lehman Municipal Bond Index | 4.3 | 4.0 | 5.1 |
Citigroup 3-Month Treasury Bill Index | 4.9 | 3.1 | 2.4 |
| | | |
| | | |
CPI | | | |
Consumer Price Index | 2.1% | 3.0% | 2.7% |
| | | | |
3
The fund’s platinum stocks drove solid performance
It was a volatile year in the metals and mining sector, as global prices for many commodities soared early in the period. Gold and silver prices touched 25-year highs in May, and prices for other materials such as nickel and zinc reached record levels. The Precious Metals and Mining Fund, with its exposure to a diverse collection of minerals and metals, was well-positioned to take advantage of top-performing market segments while limiting the fallout when demand for some materials retreated from peak levels.
The fund is highly concentrated—it had only about 40 stocks at the end of the period. The top-ten holdings represented more than half of the fund’s assets, on average, during the year. Performance often hinges on a few key holdings or a slight tilting of the global supply/demand scale for a particular metal or mineral.
During the year, the fund benefited from its sizable holdings in platinum mining and production companies. Like prices for other materials represented in the fund, prices for platinum hit a high point in May, and then receded in the summer. But platinum prices spiked again in November; three platinum companies, which were among the fund’s largest holdings, posted returns of greater than 40%, and combined they generated more than half of the fund’s total return. Other pockets of strength in the fund included steel producers and agricultural chemical companies.
Total Returns | | |
Ten Years Ended January 31, 2007 | | |
| Average | Final Value of a $10,000 |
| Annual Return | Initial Investment |
Precious Metals and Mining Fund | 14.9% | $39,943 |
Spliced Precious Metals and Mining Index1 | 10.0 | 25,906 |
Average Gold-Oriented Fund2 | 8.3 | 22,290 |
Dow Jones Wilshire 5000 Index | 8.3 | 22,235 |
The figures shown represent past performance, which is not a guarantee of future results. (Current performance may be lower or higher than the performance data cited. For performance data current to the most recent month-end, visit our website at www.vanguard.com.) Note, too, that both investment returns and principal value can fluctuate widely, so an investor’s shares, when sold, could be worth more or less than their original cost.
1 | S&P/Citigroup World Equity Gold Index through June 30, 2005; S&P/Citigroup Custom Metals and Mining Index thereafter. |
2 | Derived from data provided by Lipper Inc. |
4
Those investments made up for weaker-performing areas in the portfolio. The fund’s coal stocks decreased –15.3% during the year, and gold-related firms, which accounted for about 17% of the fund’s assets on average during the period, retreated –4.4%.
Over the long term, the fund has outpaced peers
Over the past decade, the Precious Metals and Mining Fund has produced an average annual return of 14.9%, outpacing the average return of gold-oriented funds, as well as the returns for its benchmark index and the broad U.S. market. A hypothetical initial investment of $10,000 in the fund ten years ago would have grown to $39,943 as of January 31. The fund’s impressive performance during that span is a credit to the careful research and skilled portfolio management of London-based M&G Investment Management, the fund’s advisor.
M&G’s task is aided by Vanguard’s low-cost structure, which enables a greater portion of the fund’s total return to go to shareholders. In addition, the fund’s investment mandate is broader than that of its benchmark and most of its peers, which place a greater emphasis on gold. This has helped M&G to achieve greater diversification within the sector and to reduce volatility in a historically volatile market segment.
Expense Ratios1 | | |
Your fund compared with its peer group | | |
| | Average |
| | Gold-Oriented |
| Fund | Fund |
Precious Metals and Mining Fund | 0.35% | 1.59% |
1 | Fund expense ratio reflects the 12 months ended January 31, 2007. Peer-group expense ratio is derived from data provided by Lipper Inc. and captures information through year-end 2006. |
5
Don’t become dazzled by the fund’s fine performance
The Precious Metals and Mining Fund has now recorded positive double-digit returns for six consecutive fiscal years, a period in which it has handily outperformed the U.S. stock market. Since January 31, 2001, the fund has posted an average annual return of 32.5%; the Dow Jones Wilshire 5000 Composite Index returned an annualized 4.0% over the same time period.
As an investor in the fund, you’ve probably enjoyed its good times. But if you are a long-time shareholder, you may also remember some rough patches of double-digit negative returns.
Our message is simple: No matter how strong performance has been, investors should not fall in love with any one investment. As a small and very volatile segment of the global market, the stocks in the Precious Metals and Mining Fund have traced a bumpy path. Markets move in unpredictable cycles. Today’s top performers can lose their luster.
With that said, we remain confident that the fund, under the prudent stewardship of M&G Investment Management, can play a valuable role in diversifying a well-balanced investment portfolio.
Thank you for investing with Vanguard.
Sincerely,

John J. Brennan
Chairman and Chief Executive Officer
February 14, 2007
6
Advisor’s Report
The Precious Metals and Mining Fund returned 17.5% during the fiscal year ended January 31, 2007. The fund outperformed the 13.0% return of its benchmark index and the 9.6% average return of gold-oriented mutual funds.
The investment environment
The price of gold bullion continued to move sharply higher in early 2006, peaking at $711 per ounce in May, before declining to end the period at $640 per ounce. A wide range of other metals and minerals, from platinum to copper and nickel, also reached record levels in May, driven both by ongoing demand for raw materials from industrializing nations such as China and India, but also by pressure from speculative investors looking for higher-returning assets. In May, fears that rising U.S. interest rates would act as a constraint on global economic demand sent the price of many metals sharply lower, although most recovered to a significant degree by the end of the fiscal year. Gold equities were broadly flat over the period as a whole, with the sector’s larger stocks lagging their smaller, more speculative counterparts due to the perception of diminished growth.
The portfolio’s performance
Against this background, our substantial holdings in platinum shares proved highly beneficial, as investors began to appreciate the scarcity of supply contrasted with strongly growing demand, particularly from the automotive industry. United Kingdom platinum producer Lonmin and South African producers Anglo Platinum and Impala Platinum Holdings made very strong contributions. Outside the traditional precious metals arena, newly established positions in German potash miner K+S and Canadian potash miner Agrium added significant value. Both are benefiting from intensifying demand for fertilizers to increase land yields as global populations grow and arable land availability declines. Our shares in Canadian diversified miner Falconbridge continued to benefit as a bidding war between rivals Xstrata and Inco pushed the company’s share price significantly higher. French nickel producer Eramet also delivered strong returns as industr i al nickel demand outpaced a tightly controlled supply. Our lack of exposure to gold industry heavyweight Newmont Mining continued to prove beneficial as the company struggled to effectively combat higher costs in the face of falling production.
On the negative side, our holdings in North American gold producers Centerra Gold and Meridian Gold had an unfavorable impact on the fund’s returns as the gold sector struggled to achieve profitability in spite of the broadly positive pricing environment. Our exposure to U.S. coal groups Peabody Energy and Arch Coal proved detrimental after natural gas prices (which have a major influence on the price of coal) fell sharply in the second half of 2006. In spite of this challenging environment, these companies have continued to deliver robust earnings and have shown an encouraging restraint in
7
their supply response. There has also been a small but welcome response from the industry towards developing technologies to reduce carbon emissions. We continue to believe in the growing attraction of coal as a cost-efficient and less politically volatile source of power production than oil and natural gas.
The fund’s positioning
We increased the fund’s exposure to metals and minerals companies with healthy cash flows and positions in strategically important materials. We added to a recently established position in U.K. platinum group Johnson Matthey, which processes the metal for use in auto-catalysts, Canadian diamond miner Aber Diamond, which is diversifying into high-quality diamond retailing, and attractively valued U.K. diversified miner Rio Tinto. Within the precious metals sector, we added to selected holdings such as Centerra Gold and Impala Platinum.
We also established a number of new positions in the fund. Among them is U.S.-based Minerals Technologies, which has a technologically advanced process to supply calcium carbonate for various industrial uses. Also, we purchased additional shares of Northam Platinum, a mid-sized producer of platinum group metals in South Africa, which has seen significant operational improvements and has compelling expansion opportunities.
We sold holdings that had performed particularly well or where the fundamentals underpinning the company had deteriorated. We disposed of Brazilian iron ore producer Companhia Vale do Rio Doce following strong contributions to fund returns. We also exited our positions in Falconbridge and Inco after bid activity left their shares fully valued.
In spite of heightened volatility during the period, the investment environment for the fund remains supportive. The appetite for raw materials from both emerging and developed nations continues to be strong, while supply for selected metals and minerals remains tightly controlled as a result of ongoing consolidation in recent years. The decision to close the fund to new accounts at the start of February 2006 reflected a desire to preserve the fund’s ability to deliver performance. We strongly believe that this, and the decision to expand the fund’s remit to include a broader range of attractively valued mining companies, has been in the best interests of existing shareholders. Looking forward, we will continue to focus on companies holding world-class, low-cost assets that deliver returns regardless of the cycle.
Graham E. French, Portfolio Manager
M&G Investment Management Ltd.
February 16, 2007
8
Fund Profile
As of January 31, 2007
Portfolio Characteristics | | |
| Comparative | Broad |
| Fund | Index1 | Index2 |
Number of Stocks | 41 | 294 | 4,939 |
Median Market Cap | $4.6B | $11.6B | $30.8B |
Price/Earnings Ratio | 22.2x | 16.4x | 17.9x |
Price/Book Ratio | 3.4x | 3.4x | 2.8x |
Return on Equity | 17.1% | 14.5% | 17.8% |
Earnings Growth Rate | 17.9% | 26.8% | 18.5% |
Foreign Holdings | 84.2% | 0.0% | 1.1% |
Turnover Rate | 24% | — | — |
Expense Ratio | 0.35% | — | — |
Short-Term Reserves | 2% | — | — |
Market Diversification (% of portfolio) | |
| |
United Kingdom | 19% |
South Africa | 18 |
Canada | 16 |
Australia | 16 |
United States | 16 |
France | 7 |
Germany | 4 |
Peru | 2 |
Short-Term Reserves | 2% |
Volatility Measures3 | |
| Fund Versus | Fund Versus |
| Comparative Index1 | Broad Index2 |
R-Squared | 0.89 | 0.32 |
Beta | 0.80 | 1.69 |
Ten Largest Holdings4 (% of total net assets) |
| |
Lonmin PLC | 10.3% |
Rio Tinto Ltd. | 7.9 |
Impala Platinum Holdings Ltd. ADR | 7.9 |
Anglo Platinum Ltd. ADR | 7.2 |
Aber Diamond Corp. | 6.3 |
Johnson Matthey PLC | 4.6 |
Centerra Gold Inc. | 4.2 |
K+S AG | 4.1 |
Eramet SLN | 3.7 |
CONSOL Energy, Inc. | 3.4 |
Top Ten | 59.6% |
1 | S&P/Citigroup Custom Metals and Mining Index. |
2 | Dow Jones Wilshire 5000 Index. |
3 | For an explanation of R-squared, beta, and other terms used here, see the Glossary on page 25. |
4 | “Ten Largest Holdings” excludes any temporary cash investments and equity index products. |
9
Performance Summary
All of the returns in this report represent past performance, which is not a guarantee of future results that may be achieved by the fund. (Current performance may be lower or higher than the performance data cited. For performance data current to the most recent month-end, visit our website at www.vanguard.com.) Note, too, that both investment returns and principal value can fluctuate widely, so an investor’s shares, when sold, could be worth more or less than their original cost. The returns shown do not reflect taxes that a shareholder would pay on fund distributions or on the sale of fund shares.
Cumulative Performance: January 31, 1997–January 31, 2007
Initial Investment of $10,000
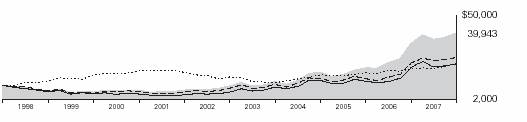
| | | |
| | |
| Average Annual Total Returns | Final Value |
| Periods Ended January 31, 2007 | of a $10,000 |
| One Year | Five Years | Ten Years | Investment |
Precious Metals and Mining Fund1 | 17.48% | 33.00% | 14.85% | $39,943 |
Dow Jones Wilshire 5000 Index | 14.14 | 8.35 | 8.32 | 22,235 |
Spliced Precious Metals and Mining Index2 | 13.03 | 25.77 | 9.99 | 25,906 |
Average Gold-Oriented Fund3 | 9.56 | 29.31 | 8.35 | 22,290 |
| | | | | |
1 | Total return figures do not reflect the 1% fee assessed on redemptions of shares held for less than one year. |
2 | S&P/Citigroup World Equity Gold Index through June 30, 2005; S&P/Citigroup Custom Metals and Mining Index thereafter. |
3 | Derived from data provided by Lipper Inc. |
10
Fiscal-Year Total Returns (%): January 31, 1997–January 31, 2007
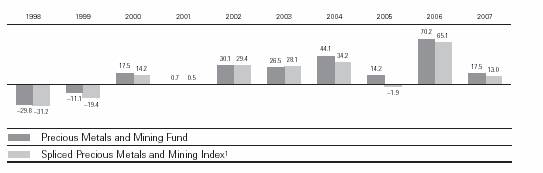
Average Annual Total Returns: Periods Ended December 31, 2006
This table presents average annual total returns through the latest calendar quarter—rather than through the end of the fiscal period. Securities and Exchange Commission rules require that we provide this information.
| Inception Date | One Year | Five Years | Ten Years |
Precious Metals and Mining Fund2 | 5/23/1984 | 34.30% | 34.72% | 13.92% |
1 | S&P/Citigroup World Equity Gold Index through June 30, 2005; S&P/Citigroup Custom Metals and Mining Index thereafter. |
2 | Total return figures do not reflect the 1% redemption fee assessed on redemptions of shares held less than one year. Note: See Financial Highlights table on page 16 for dividend and capital gains information. |
11
Financial Statements
Statement of Net Assets
As of January 31, 2007
The fund provides a complete list of its holdings four times in each fiscal year, at the quarter-ends. For the second and fourth fiscal quarters, the lists appear in the fund’s semiannual and annual reports to shareholders. For the first and third fiscal quarters, the fund files the lists with the Securities and Exchange Commission on Form N-Q. Shareholders can look up the fund’s Forms N-Q on the SEC’s website at www.sec.gov. Forms N-Q may also be reviewed and copied at the SEC’s Public Reference Room (see the back cover of this report for further information).
| | | Market |
| | | Value• |
| | Shares | ($000) |
Common Stocks (98.2%) | | |
Australia (16.3%) | | |
| Rio Tinto Ltd. | 2,950,000 | 177,106 |
| Sims Group Ltd. | 5,800,000 | 97,498 |
1 | Iluka Resources Ltd. | 17,150,000 | 83,373 |
| CSR Ltd. | 28,000,000 | 78,154 |
| BlueScope Steel Ltd. | 11,450,000 | 76,691 |
1 | Centennial Coal Co., Ltd. | 15,775,000 | 34,777 |
* | St. Barbara Ltd. | 21,800,000 | 8,572 |
| Consolidated Minerals Ltd. | 2,500,000 | 4,500 |
* | Tanami Gold NL | 18,170,000 | 1,773 |
* | Magnesium International Ltd. | 1,678,671 | 130 |
| | | 562,574 |
Canada (16.4%) | | |
1 | Aber Diamond Corp. | 5,650,000 | 217,068 |
* 1 | Centerra Gold Inc. | 12,865,000 | 143,974 |
| Agrium, Inc. | 2,850,000 | 98,388 |
| Barrick Gold Corp. | 3,200,000 | 94,395 |
| First Quantum Minerals Ltd. | 90,217 | 4,771 |
* | Claude Resources, Inc. | 2,900,000 | 4,234 |
* | SouthernEra Diamonds, Inc. | 7,022,900 | 1,845 |
| | | 564,675 |
France (6.9%) | | |
| Eramet SLN | 776,773 | 126,937 |
^ | Imerys SA | 1,160,000 | 109,876 |
| | | 236,813 |
Germany (4.1%) | | |
| K+S AG | 1,305,773 | 142,541 |
| | | |
Papua New Guinea (0.0%) | | |
* | Bougainville Copper Ltd. | 2,000,000 | 1,225 |
| | | | | | | | | |
| | | Market |
| | | Value• |
| | Shares | ($000) |
Peru (1.8%) | | |
| Compania de Minas | | |
| Buenaventura S.A.u. ADR | 2,100,000 | 60,711 |
| | | |
South Africa (17.9%) | | |
| Impala Platinum Holdings Ltd. ADR | 9,400,000 | 270,839 |
| Anglo Platinum Ltd. ADR | 1,977,400 | 248,906 |
| Northam Platinum Ltd. | 7,052,571 | 49,279 |
| Gold Fields Ltd. ADR | 2,425,000 | 40,958 |
| AngloGold Ashanti Ltd.ADR | 100,000 | 4,700 |
| | | 614,682 |
United Kingdom (19.3%) | | |
| Lonmin PLC | 6,069,413 | 353,909 |
| Johnson Matthey PLC | 5,450,000 | 158,673 |
| Rio Tinto PLC | 1,775,000 | 95,453 |
*^ | Peter Hambro Mining PLC | 2,352,368 | 51,951 |
* | Kenmare Resources PLC | 4,550,000 | 3,858 |
* | Zambezi Resources Ltd. | 4,895,833 | 1,455 |
| | | 665,299 |
United States (15.5%) | | |
| CONSOL Energy, Inc. | 3,430,000 | 118,095 |
| Peabody Energy Corp. | 2,700,000 | 110,241 |
* | Meridian Gold Inc. | 3,200,000 | 93,504 |
| FMC Corp. | 1,125,000 | 87,581 |
1 | Minerals Technologies, Inc. | 1,190,659 | 69,142 |
| Arch Coal, Inc. | 1,200,000 | 35,664 |
| AMCOL International Corp. | 650,400 | 19,551 |
| | | 533,778 |
Total Common Stocks | | |
(Cost $2,075,417) | | 3,382,298 |
12
| | Market |
| | Value• |
| Shares | ($000) |
Precious Metals (0.1%) | | |
* Platinum Bullion (In Ounces) | 2,009 | 2,363 |
Total Precious Metals | | |
(Cost $1,212) | | 2,363 |
Temporary Cash Investments (2.6%) | |
2 Vanguard Market | | |
Liquidity Fund, 5.272% | 71,776,164 | 71,776 |
2 Vanguard Market | | |
Liquidity Fund, | | |
5.272%—Note F | 17,339,730 | 17,340 |
Total Temporary Cash Investments | |
(Cost $89,116) | | 89,116 |
Total Investments (100.9%) | | |
(Cost $2,165,745) | | 3,473,777 |
Other Assets and Liabilities—Net (–0.9%) | (30,243) |
Net Assets (100%) | | |
Applicable to 120,237,076 outstanding | |
$.001 par value shares of beneficial | |
interest (unlimited authorization) | 3,443,534 |
Net Asset Value Per Share | | $28.64 |
| | |
| | |
Statement of Assets and Liabilities | |
Assets | | |
Investments in Securities, at Value | $3,473,777 |
Receivables for Accrued Income | | 4,543 |
Receivables for Capital Shares Issued | 2,441 |
Other Assets—Note C | | 16,085 |
Total Assets | | 3,496,846 |
Liabilities | | |
Payables for Investment Securities | |
Purchased | | 19,017 |
Security Lending Collateral Payable | |
to Brokers—Note F | | 17,340 |
Payables for Capital Shares Redeemed | 1,762 |
Other Liabilities | | 15,193 |
Total Liabilities | | 53,312 |
Net Assets | | $3,443,534 |
At January 31, 2007, net assets consisted of:3 |
| Amount | Per |
| ($000) | Share |
Paid-in Capital | 2,124,486 | $17.67 |
Overdistributed Net | | |
Investment Income | (27,542) | (.23) |
Accumulated Net | | |
Realized Gains | 38,500 | .32 |
Unrealized Appreciation | | |
Investment Securities | 1,308,032 | 10.88 |
Foreign Currencies | 58 | — |
Net Assets | 3,443,534 | $28.64 |
• | See Note A in Notes to Financial Statements. |
* | Non-income-producing security. |
^ | Part of security position is on loan to broker-dealers. See Note F in Notes to Financial Statements. |
1 | Considered an affiliated company of the fund as the fund owns more than 5% of the outstanding voting securities of such company. See Note H in Notes to Financial Statements. |
2 | Affiliated money market fund available only to Vanguard funds and certain trusts and accounts managed by Vanguard. Rate shown is the 7-day yield. |
3 | See Note D in Notes to Financial Statements for the tax-basis components of net assets. |
ADR—American Depositary Receipt.
13
Statement of Operations
| Year Ended |
| January 31, 2007 |
| ($000) |
Investment Income | |
Income | |
Dividends1,2 | 70,298 |
Interest2 | 4,091 |
Security Lending | 737 |
Total Income | 75,126 |
Expenses | |
Investment Advisory Fees—Note B | |
Basic Fee | 4,260 |
Performance Adjustment | 181 |
The Vanguard Group—Note C | |
Management and Administrative | 6,215 |
Marketing and Distribution | 712 |
Custodian Fees | 353 |
Auditing Fees | 20 |
Shareholders’ Reports | 79 |
Trustees’ Fees and Expenses | 4 |
Total Expenses | 11,824 |
Net Investment Income | 63,302 |
Realized Net Gain (Loss) | |
Investment Securities Sold2 | 373,627 |
Foreign Currencies | (606) |
Realized Net Gain (Loss) | 373,021 |
Change in Unrealized Appreciation (Depreciation) | |
Investment Securities | 81,037 |
Foreign Currencies | 53 |
Change in Unrealized Appreciation (Depreciation) | 81,090 |
Net Increase (Decrease) in Net Assets Resulting from Operations | 517,413 |
1 | Dividends are net of foreign withholding taxes of $2,340,000. |
2 | Dividend income, interest income, and realized net gain (loss) from affiliated companies of the fund were $8,274,000, $4,091,000, and $9,546, respectively. |
14
Statement of Changes in Net Assets
| Year Ended January 31, |
| 2007 | 2006 |
| ($000) | ($000) |
Increase (Decrease) in Net Assets | | |
Operations | | |
Net Investment Income | 63,302 | 27,914 |
Realized Net Gain (Loss) | 373,021 | 88,953 |
Change in Unrealized Appreciation (Depreciation) | 81,090 | 943,733 |
Net Increase (Decrease) in Net Assets Resulting from Operations | 517,413 | 1,060,600 |
Distributions | | |
Net Investment Income | (54,699) | (24,676) |
Realized Capital Gain1 | (284,886) | (57,268) |
Total Distributions | (339,585) | (81,944) |
Capital Share Transactions—Note G | | |
Issued | 585,297 | 1,591,746 |
Issued in Lieu of Cash Distributions | 314,309 | 75,974 |
Redeemed2 | (930,593) | (270,841) |
Net Increase (Decrease) from Capital Share Transactions | (30,987) | 1,396,879 |
Total Increase (Decrease) | 146,841 | 2,375,535 |
Net Assets | | |
Beginning of Period | 3,296,693 | 921,158 |
End of Period3 | 3,443,534 | 3,296,693 |
1 | Includes fiscal 2007 and 2006 short-term gain distributions totaling $127,033,000 and $14,086,000, respectively. Short-term gain distributions are treated as ordinary income dividends for tax purposes. |
2 | Net of redemption fees of $3,932,000 and $1,463,000. |
3 | Net Assets—End of Period includes (overdistributed) net investment income of ($27,542,000) and ($29,445,000). |
15
Financial Highlights
| | | Year Ended January 31, |
For a Share Outstanding Throughout Each Period | 2007 | 2006 | 2005 | 2004 | 2003 |
Net Asset Value, Beginning of Period | $27.08 | $16.46 | $15.29 | $11.25 | $9.31 |
Investment Operations | | | | | |
Net Investment Income | .560 | .3371 | .1851 | .194 | .25 |
Net Realized and Unrealized Gain (Loss) | | | | | |
on Investments2 | 4.027 | 11.080 | 1.988 | 4.780 | 2.18 |
Total from Investment Operations | 4.587 | 11.417 | 2.173 | 4.974 | 2.43 |
Distributions | | | | | |
Dividends from Net Investment Income | (.490) | (.240) | (.144) | (.934) | (.49) |
Distributions from Realized Capital Gains | (2.537) | (.557) | (.859) | — | — |
Total Distributions | (3.027) | (.797) | (1.003) | (.934) | (.49) |
Net Asset Value, End of Period | $28.64 | $27.08 | $16.46 | $15.29 | $11.25 |
| | | | | |
Total Return3 | 17.48% | 70.19% | 14.20% | 44.07% | 26.51% |
| | | | | |
Ratios/Supplemental Data | | | | | |
Net Assets, End of Period (Millions) | $3,444 | $3,297 | $921 | $608 | $537 |
Ratio of Total Expenses to | | | | | |
Average Net Assets | 0.35%4 | 0.40% | 0.48% | 0.55% | 0.60% |
Ratio of Net Investment Income to | | | | | |
Average Net Assets | 1.88% | 1.68% | 1.32% | 1.61% | 2.14% |
Portfolio Turnover Rate | 24% | 20% | 36% | 15% | 43% |
1 | Calculated based on average shares outstanding. |
2 | Includes increases from redemption fees of $.03, $.01, $.01, $.00, and $.02. |
3 | Total returns do not reflect the 1% fee assessed on redemptions of shares held for less than one year. |
4 | Includes performance-based investment advisory fee increase of 0.01%. |
See accompanying Notes, which are an integral part of the Financial Statements.
16
Notes to Financial Statements
Vanguard Precious Metals and Mining Fund is registered under the Investment Company Act of 1940 as an open-end investment company, or mutual fund. The fund files reports with the SEC under the company name Vanguard Specialized Funds. The fund invests in securities of foreign issuers, which may subject it to investment risks not normally associated with investing in securities of United States corporations.
A. The following significant accounting policies conform to generally accepted accounting principles for U.S. mutual funds. The fund consistently follows such policies in preparing its financial statements.
1. Security Valuation: Securities are valued as of the close of trading on the New York Stock Exchange (generally 4:00 p.m., Eastern time) on the valuation date. Equity securities are valued at the latest quoted sales prices or official closing prices taken from the primary market in which each security trades; such securities not traded on the valuation date are valued at the mean of the latest quoted bid and asked prices. Securities for which market quotations are not readily available, or whose values have been affected by events occurring before the fund’s pricing time but after the close of the securities’ primary markets, are valued at their fair values calculated according to procedures adopted by the board of trustees. These procedures include obtaining quotations from an independent pricing service, monitoring news to identify significant market- or security-specific events, and evaluating changes in the values of foreign market proxies (for example, ADRs, futures contracts, or exchange-traded funds), between the time the foreign markets close and the fund’s pricing time. When fair-value pricing is employed, the prices of securities used by a fund to calculate its net asset value may differ from quoted or published prices for the same securities. Precious metals are valued at the mean of the latest quoted bid and asked prices. Investments in Vanguard Market Liquidity Fund are valued at that fund’s net asset value.
2. Foreign Currency: Securities and other assets and liabilities denominated in foreign currencies are translated into U.S. dollars at the exchange rates on the valuation date as employed by Morgan Stanley Capital International (MSCI) in the calculation of its indexes. As part of the fund’s fair-value procedures, exchange rates may be adjusted if they change significantly before the fund’s pricing time but after the time at which the MSCI rates are determined (generally 11:00 a.m., Eastern time).
Realized gains (losses) and unrealized appreciation (depreciation) on investment securities include the effects of changes in exchange rates since the securities were purchased, combined with the effects of changes in security prices. Fluctuations in the value of other assets and liabilities resulting from changes in exchange rates are recorded as unrealized foreign currency gains (losses) until the asset or liability is settled in cash, when they are recorded as realized foreign currency gains (losses).
3. Federal Income Taxes: The fund intends to continue to qualify as a regulated investment company and distribute all of its taxable income. Accordingly, no provision for federal income taxes is required in the financial statements.
4. Distributions: Distributions to shareholders are recorded on the ex-dividend date.
5. Security Lending: The fund may lend its securities to qualified institutional borrowers to earn additional income. Security loans are required to be secured at all times by collateral at least equal to the market value of securities loaned. The fund invests cash collateral received in Vanguard Market Liquidity Fund, and records a liability for the return of the collateral, during the period the securities are on loan. Security lending income represents the income earned on investing cash collateral, less expenses associated with the loan.
17
6. Other: Dividend income is recorded on the ex-dividend date. Interest income includes income distributions received from Vanguard Market Liquidity Fund and is accrued daily. Security transactions are accounted for on the date securities are bought or sold. Costs used to determine realized gains (losses) on the sale of investment securities are those of the specific securities sold. Fees assessed on redemptions of capital shares are credited to paid-in capital.
B. M&G Investment Management Ltd. provides investment advisory services to the fund for a fee calculated at an annual percentage rate of average net assets. The basic fee is subject to quarterly adjustments based on the fund’s performance since January 31, 2006 relative to the S&P/Citigroup Custom Metals and Mining Index. For the year ended January 31, 2007, the investment advisory fee represented an effective annual basic rate of 0.13% of the fund’s average net assets before an increase of $181,000 (0.01%) based on performance.
C. The Vanguard Group furnishes at cost corporate management, administrative, marketing, and distribution services. The costs of such services are allocated to the fund under methods approved by the board of trustees. The fund has committed to provide up to 0.40% of its net assets in capital contributions to Vanguard. At January 31, 2007, the fund had contributed capital of $329,000 to Vanguard (included in Other Assets), representing 0.01% of the fund’s net assets and 0.33% of Vanguard’s capitalization. The fund’s trustees and officers are also directors and officers of Vanguard.
D. Distributions are determined on a tax basis and may differ from net investment income and realized capital gains for financial reporting purposes. Differences may be permanent or temporary. Permanent differences are reclassified among capital accounts in the financial statements to reflect their tax character. Temporary differences arise when certain items of income, expense, gain, or loss are recognized in different periods for financial statement and tax purposes; these differences will reverse at some time in the future. Differences in classification may also result from the treatment of short-term gains as ordinary income for tax purposes.
During the year ended January 31, 2007, the fund realized net foreign currency losses of $606,000, which permanently decreased distributable net income for tax purposes; accordingly, such losses have been reclassified from accumulated net realized gains to overdistributed net investment income.
Certain of the fund’s investments are in securities considered to be “passive foreign investment companies,” for which any unrealized appreciation and/or realized gains are required to be included in distributable net income for tax purposes. During the year ended January 31, 2007, the fund did not realize any gains on the sale of passive foreign investment companies. Unrealized appreciation on passive foreign investment company holdings at January 31, 2007, was $29,932,000, including $30,130,000 which has been distributed and is reflected in the balance of overdistributed net investment income.
The fund used a tax accounting practice to treat a portion of the price of capital shares redeemed during the year as distributions from net investment income and realized capital gains. Accordingly, the fund has reclassified $6,094,000 from overdistributed net investment income, and $35,349,000 from accumulated net realized gains, to paid-in capital.
18
During 2001, the fund elected to use a provision of the Taxpayer Relief Act of 1997 to mark-to-market certain appreciated securities held on January 1, 2001; such securities were treated as sold and repurchased, with unrealized gains of $46,006,000 becoming realized, for tax purposes. The mark-to-market created a difference between the cost of investments for financial statement and tax purposes, which will reverse when the securities are sold. Through January 31, 2007, the fund realized gains on the sale of these securities of $5,690,000 for financial statement purposes, which were included in prior year mark-to-market gains for tax purposes. The remaining difference of $40,316,000 is reflected in the balance of accumulated net realized gains; the corresponding difference between the securities’ cost for financial statement and tax purposes is reflected in unrealized appreciation.
For tax purposes at January 31, 2007, the fund had $5,988,000 of ordinary income and $78,219,000 of long-term capital gains available for distribution.
At January 31, 2007, the cost of investment securities for tax purposes was $2,235,993,000. Net unrealized appreciation of investment securities for tax purposes was $1,237,784,000, consisting of unrealized gains of $1,259,266,000 on securities that had risen in value since their purchase and $21,482,000 in unrealized losses on securities that had fallen in value since their purchase or since being marked-to-market for tax purposes.
E. During the year ended January 31, 2007, the fund purchased $784,407,000 of investment securities and sold $911,788,000 of investment securities other than temporary cash investments.
F. The market value of securities on loan to broker-dealers at January 31, 2007, was $16,834,000, for which the fund received cash collateral of $17,340,000.
G. Capital shares issued and redeemed were:
| Year Ended January 31, |
| 2007 | 2006 |
| Shares | Shares |
| (000) | (000) |
Issued | 20,497 | 76,073 |
Issued in Lieu of Cash Distributions | 11,406 | 3,283 |
Redeemed | (33,402) | (13,578) |
Net Increase (Decrease) in Shares Outstanding | (1,499) | 65,778 |
19
H. Certain of the fund’s investments are in companies that are considered to be affiliated companies of the fund because the fund owns more than 5% of the outstanding voting securities of the company. Transactions during the year ended January 31, 2007, in securities of these companies were as follows:
| | | Current Period Transactions | |
| Jan. 31, 2006 | | Proceeds from | | Jan. 31, 2007 |
| Market | Purchases | Securities | Dividend | Market |
| Value | at Cost | Sold | Income | Value |
| ($000) | ($000) | ($000) | ($000) | ($000) |
Aber Diamond Corp. | 159,477 | 75,362 | — | 4,339 | 217,068 |
Centennial Coal Co. Ltd. | n/a1 | 12,923 | — | 1,276 | 34,777 |
Centerra Gold Inc. | 134,269 | 26,204 | — | — | 143,974 |
Iluka Resources Ltd. | 69,268 | 34,096 | — | 2,546 | 83,373 |
Meridian Gold Inc. | 156,285 | 29,907 | 90,451 | — | n/a2 |
Minerals Technologies Inc | n/a1 | 67,040 | — | 113 | 69,142 |
Zambezi Resources Ltd. | 1,049 | — | — | — | n/a2 |
| 520,348 | | | 8,274 | 548,334 |
I. In June 2006, the Financial Accounting Standards Board issued Interpretation No. 48 (“FIN 48”), “Accounting for Uncertainty in Income Taxes.” FIN 48 establishes the minimum threshold for recognizing, and a system for measuring, the benefits of tax-return positions in financial statements. FIN 48 will be effective for the fund’s fiscal year ending January 31, 2008. Management is in the process of analyzing the fund’s tax positions for purposes of implementing FIN 48; based on the analysis completed to date, management does not believe the adoption of FIN 48 will result in any material impact to the fund’s financial statements
1 | At January 31, 2006, the issuer was not an affiliated company of the fund. |
2 | At January 31, 2007, the security is still held but the issuer is no longer an affiliated company of the fund. |
20
Report of Independent Registered Public Accounting Firm
To the Trustees of Vanguard Specialized Funds and Shareholders of Vanguard Precious Metals and Mining Fund:
In our opinion, the accompanying statements of net assets and of assets and liabilities and the related statements of operations and of changes in net assets and the financial highlights present fairly, in all material respects, the financial position of Vanguard Precious Metals and Mining Fund (one of the funds constituting Vanguard Specialized Funds, hereafter referred to as the “Fund”) at January 31, 2007, the results of its operations for the year then ended, the changes in its net assets for each of the two years in the period then ended and the financial highlights for each of the five years in the period then ended, in conformity with accounting principles generally accepted in the United States of America. These financial statements and financial highlights (hereafter referred to as “financial statements”) are the responsibility of the Fund’s management; our responsibility is to express an opinion on these financial statements based on our audits. We conducted our audits of these financial statements in accordance with the standards of the Public Company Accounting Oversight Board (United States). Those standards require that we plan and perform the audit to obtain reasonable assurance about whether the financial statements are free of material misstatement. An audit includes examining, on a test basis, evidence supporting the amounts and disclosures in the financial statements, assessing the accounting principles used and significant estimates made by management, and evaluating the overall financial statement presentation. We believe that our audits, which included confirmation of securities at January 31, 2007 by correspondence with the custodian and by agreement to the underlying ownership records for Vanguard Market Liquidity Fund, provide a reasonable basis for our opinion.
PricewaterhouseCoopers LLP
Philadelphia, Pennsylvania
March 13, 2007
Special 2006 tax information (unaudited) for Vanguard Precious Metals and Mining Fund
This information for the fiscal year ended January 31, 2007, is included pursuant to provisions of the Internal Revenue Code.
The fund distributed $182,432,000 as capital gain dividends (from net long-term capital gains) to shareholders during the fiscal year.
The fund distributed $56,973,000 of qualified dividend income to shareholders during the fiscal year.
For corporate shareholders, 1.5% of investment income (dividend income plus short-term gains, if any) qualifies for the dividends-received deduction.
The Precious Metals and Mining Fund passed through to shareholders foreign source income of $69,757,000 and foreign taxes of $2,097,000. The pass-through of foreign taxes paid will affect only shareholders on the dividend record date in December 2006. Shareholders received more detailed information along with their Form 1099-DIV in January 2007.
21
Your Fund’s After-Tax Returns
This table presents returns for your fund both before and after taxes. The after-tax returns are shown in two ways: (1) assuming that an investor owned the fund during the entire period and paid taxes on the fund’s distributions, and (2) assuming that an investor paid taxes on the fund’s distributions and sold all shares at the end of each period.
Calculations are based on the highest individual federal income tax and capital gains tax rates in effect at the times of the distributions and the hypothetical sales. State and local taxes were not considered. After-tax returns reflect any qualified dividend income, using actual prior-year figures and estimates for 2007. (In the example, returns after the sale of fund shares may be higher than those assuming no sale. This occurs when the sale would have produced a capital loss. The calculation assumes that the investor received a tax deduction for the loss.)
Please note that your actual after-tax returns will depend on your tax situation and may differ from those shown. Also note that if you own the fund in a tax-deferred account, such as an individual retirement account or a 401(k) plan, this information does not apply to you. Such accounts are not subject to current taxes.
Finally, keep in mind that a fund’s performance—whether before or after taxes—does not guarantee future results.
Average Annual Total Returns: Precious Metals and Mining Fund1 | | | |
Periods Ended January 31, 2007 | | | |
| One | Five | Ten |
| Year | Years | Years |
Returns Before Taxes | 17.48% | 33.00% | 14.85% |
Returns After Taxes on Distributions | 14.89 | 31.09 | 13.51 |
Returns After Taxes on Distributions and Sale of Fund Shares | 12.75 | 28.66 | 12.52 |
1 | Total return figures do not reflect the 1% fee assessed on redemptions of shares held for less than one year. |
22
About Your Fund’s Expenses
As a shareholder of the fund, you incur ongoing costs, which include costs for portfolio management, administrative services, and shareholder reports (like this one), among others. Operating expenses, which are deducted from a fund’s gross income, directly reduce the investment return of the fund.
A fund’s expenses are expressed as a percentage of its average net assets. This figure is known as the expense ratio. The following examples are intended to help you understand the ongoing costs (in dollars) of investing in your fund and to compare these costs with those of other mutual funds. The examples are based on an investment of $1,000 made at the beginning of the period shown and held for the entire period.
The table below illustrates your fund’s costs in two ways:
• Based on actual fund return. This section helps you to estimate the actual expenses that you paid over the period. The “Ending Account Value” shown is derived from the fund’s actual return, and the third column shows the dollar amount that would have been paid by an investor who started with $1,000 in the fund. You may use the information here, together with the amount you invested, to estimate the expenses that you paid over the period.
To do so, simply divide your account value by $1,000 (for example, an $8,600 account value divided by $1,000 = 8.6), then multiply the result by the number given for your fund under the heading “Expenses Paid During Period.”
• Based on hypothetical 5% yearly return. This section is intended to help you compare your fund’s costs with those of other mutual funds. It assumes that the fund had a yearly return of 5% before expenses, but that the expense ratio is unchanged. In this case—because the return used is not the fund’s actual return—the results do not apply to your investment. The example is useful in making comparisons because the Securities and Exchange Commission requires all mutual funds to calculate expenses based on a 5% return. You can assess your fund’s costs by comparing this hypothetical example with the hypothetical examples that appear in shareholder reports of other funds.
Six Months Ended January 31, 2007 | | | |
| Beginning | Ending | Expenses |
| Account Value | Account Value | Paid During |
Precious Metals and Mining Fund | 7/31/2006 | 1/31/2007 | Period1 |
Based on Actual Fund Return | $1,000.00 | $1,098.16 | $1.85 |
Based on Hypothetical 5% Yearly Return | 1,000.00 | 1,023.44 | 1.79 |
1 | These calculations are based on expenses incurred in the most recent six-month period. The fund’s annualized six-month expense ratios for that period is 0.35%. The dollar amounts shown as “Expenses Paid” are equal to the annualized expense ratio multiplied by the average account value over the period, multiplied by the number of days in the most recent six-month period, then divided by the number of days in the most recent 12-month period. |
23
Note that the expenses shown in the table on page 23 are meant to highlight and help you compare ongoing costs only; they do not include your fund’s low-balance fee or the 1% fee on redemptions of shares held for less than one year. These fees are fully described in the prospectus. If the fees were applied to your account, your costs would be higher. Your fund does not carry a “sales load.”
The calculations assume no shares were bought or sold during the period. Your actual costs may have been higher or lower, depending on the amount of your investment and the timing of any purchases or redemptions.
You can find more information about the fund’s expenses, including annual expense ratios, in the Financial Statements section of this report. For additional information on operating expenses and other shareholder costs, please refer to the appropriate fund prospectus.
24
Glossary
Beta. A measure of the magnitude of a fund’s past share-price fluctuations in relation to the ups and downs of a given market index. The index is assigned a beta of 1.00. Compared with a given index, a fund with a beta of 1.20 typically would have seen its share price rise or fall by 12% when the index rose or fell by 10%. A fund’s beta should be reviewed in conjunction with its R-squared (see definition below). The lower the R-squared, the less correlation there is between the fund and the index, and the less reliable beta is as an indicator of volatility.
Earnings Growth Rate. The average annual rate of growth in earnings over the past five years for the stocks now in a fund.
Expense Ratio. The percentage of a fund’s average net assets used to pay its annual administrative and advisory expenses. These expenses directly reduce returns to investors.
Foreign Holdings. The percentage of a fund represented by stocks or depositary receipts of companies based outside the United States.
Inception Date. The date on which the assets of a fund (or one of its share classes) are first invested in accordance with the fund’s investment objective. For funds with a subscription period, the inception date is the day after that period ends. Investment performance is measured from the inception date.
Median Market Cap. An indicator of the size of companies in which a fund invests; the midpoint of market capitalization (market price x shares outstanding) of a fund’s stocks, weighted by the proportion of the fund’s assets invested in each stock. Stocks representing half of the fund’s assets have market capitalizations above the median, and the rest are below it.
Price/Book Ratio. The share price of a stock divided by its net worth, or book value, per share. For a fund, the weighted average price/book ratio of the stocks it holds.
Price/Earnings Ratio. The ratio of a stock’s current price to its per-share earnings over the past year. For a fund, the weighted average P/E of the stocks it holds. P/E is an indicator of market expectations about corporate prospects; the higher the P/E, the greater the expectations for a company’s future growth.
R-Squared. A measure of how much of a fund’s past returns can be explained by the returns from the market in general, as measured by a given index. If a fund’s total returns were precisely synchronized with an index’s returns, its R-squared would be 1.00. If the fund’s returns bore no relationship to the index’s returns, its R-squared would be 0.
Return on Equity. The annual average rate of return generated by a company during the past five years for each dollar of shareholder’s equity (net income divided by shareholder’s equity). For a fund, the weighted average return on equity for the companies whose stocks it holds.
Short-Term Reserves. The percentage of a fund invested in highly liquid, short-term securities that can be readily converted to cash.
Turnover Rate. An indication of the fund’s trading activity. Funds with high turnover rates incur higher transaction costs and may be more likely to distribute capital gains (which may be taxable to investors). The turnover rate excludes in-kind transactions, which have minimal impact on costs.
25
The People Who Govern Your Fund
The trustees of your mutual fund are there to see that the fund is operated and managed in your best interests since, as a shareholder, you are a part owner of the fund. Your fund’s trustees also serve on the board of directors of The Vanguard Group, Inc., which is owned by the Vanguard funds and provides services to them on an at-cost basis.
A majority of Vanguard’s board members are independent, meaning that they have no affiliation with Vanguard or the funds they oversee, apart from the sizable personal investments they have made as private individuals.
Our independent board members bring distinguished backgrounds in business, academia, and public service to their task of working with Vanguard officers to establish the policies and oversee the activities of the funds. Among board members’ responsibilities are selecting investment advisors for the funds; monitoring fund operations, performance, and costs; reviewing contracts; nominating and selecting new trustees/directors; and electing Vanguard officers.
Each trustee serves a fund until its termination; or until the trustee’s retirement, resignation, or death; or otherwise as specified in the fund’s organizational documents. Any trustee may be removed at a shareholders’ meeting by a vote representing two-thirds of the net asset value of all shares of the fund together with shares of other Vanguard funds organized within the same trust. The table on these two pages shows information for each trustee and executive officer of the fund. The mailing address of the trustees and officers is P.O. Box 876, Valley Forge, PA 19482.
Chairman of the Board, Chief Executive Officer, and Trustee |
| |
John J. Brennan1 | |
Born 1954 | Principal Occupation(s) During the Past Five Years: Chairman of the Board, Chief |
Trustee since May 1987; | Executive Officer, and Director/Trustee of The Vanguard Group, Inc., and of each |
Chairman of the Board and | of the investment companies served by The Vanguard Group. |
Chief Executive Officer | |
146 Vanguard Funds Overseen |
| |
Independent Trustees | |
| |
Charles D. Ellis | |
Born 1937 | Principal Occupation(s) During the Past Five Years: Applecore Partners (pro bono ventures |
Trustee since January 2001 | in education); Senior Advisor to Greenwich Associates (international business strategy |
146 Vanguard Funds Overseen | consulting); Successor Trustee of Yale University; Overseer of the Stern School of Business |
| at New York University; Trustee of the Whitehead Institute for Biomedical Research. |
| |
Rajiv L. Gupta | |
Born 1945 | Principal Occupation(s) During the Past Five Years: Chairman and Chief Executive Officer |
Trustee since December 20012 | of Rohm and Haas Co. (chemicals); Board Member of the American Chemistry Council; |
146 Vanguard Funds Overseen | Director of Tyco International, Ltd. (diversified manufacturing and services) (since 2005); |
| Trustee of Drexel University and of the Chemical Heritage Foundation. |
| |
Amy Gutmann | |
Born 1949 | Principal Occupation(s) During the Past Five Years: President of the University of |
Trustee since June 2006 | Pennsylvania since 2004; Professor in the School of Arts and Sciences, Annenberg School |
146 Vanguard Funds Overseen | for Communication, and Graduate School of Education of the University of Pennsylvania |
| since 2004; Provost (2001–2004) and Laurance S. Rockefeller Professor of Politics and the |
| University Center for Human Values (1990–2004), Princeton University; Director of Carnegie |
| Corporation of New York and of Philadelphia 2016 (since 2005) and of Schuylkill River |
| Development Corporation and Greater Philadelphia Chamber of Commerce (since 2004). |
JoAnn Heffernan Heisen | |
Born 1950 | Principal Occupation(s) During the Past Five Years: Corporate Vice President and Chief |
Trustee since July 1998 | Global Diversity Officer (since January 2006), Vice President and Chief Information |
146 Vanguard Funds Overseen | Officer (1997–2005), and Member of the Executive Committee of Johnson & Johnson |
| (pharmaceuticals/consumer products); Director of the University Medical Center at |
| Princeton and Women’s Research and Education Institute. |
| |
André F. Perold | |
Born 1952 | Principal Occupation(s) During the Past Five Years: George Gund Professor of Finance and |
Trustee since December 2004 | Banking, Harvard Business School (since 2000); Senior Associate Dean, Director of Faculty |
146 Vanguard Funds Overseen | Recruiting, and Chair of Finance Faculty, Harvard Business School; Director and Chairman |
| of UNX, Inc. (equities trading firm) (since 2003); Director of registered investment |
| companies advised by Merrill Lynch Investment Managers and affiliates (1985–2004), |
| Genbel Securities Limited (South African financial services firm) (1999–2003), Gensec |
| Bank (1999–2003), Sanlam, Ltd. (South African insurance company) (2001–2003), and |
| Stockback, Inc. (credit card firm) (2000–2002). |
| |
Alfred M. Rankin, Jr. | |
Born 1941 | Principal Occupation(s) During the Past Five Years: Chairman, President, Chief Executive |
Trustee since January 1993 | Officer, and Director of NACCO Industries, Inc. (forklift trucks/housewares/ lignite); |
146 Vanguard Funds Overseen | Director of Goodrich Corporation (industrial products/aircraft systems and services). |
| |
J. Lawrence Wilson | |
Born 1936 | Principal Occupation(s) During the Past Five Years: Retired Chairman and Chief Executive |
Trustee since April 1985 | Officer of Rohm and Haas Co. (chemicals); Director of Cummins Inc. (diesel engines), |
146 Vanguard Funds Overseen | MeadWestvaco Corp. (packaging products), and AmerisourceBergen Corp. (pharmaceutical |
| distribution); Trustee of Vanderbilt University and of Culver Educational Foundation. |
| |
Executive Officers1 | |
| |
Heidi Stam | |
Born 1956 | Principal Occupation(s) During the Past Five Years: Managing Director of The Vanguard |
Secretary since July 2005 | Group, Inc., since 2006; General Counsel of The Vanguard Group since 2005; Secretary |
146 Vanguard Funds Overseen | of The Vanguard Group, and each of the investment companies served by The Vanguard |
| Group, since 2005; Principal of The Vanguard Group (1997-2006). |
| |
Thomas J. Higgins | |
Born 1957 | Principal Occupation(s) During the Past Five Years: Principal of The Vanguard Group, Inc.; |
Treasurer since July 1998 | Treasurer of each of the investment companies served by The Vanguard Group. |
146 Vanguard Funds Overseen | |
| |
Vanguard Senior Management Team |
| |
R. Gregory Barton | Kathleen C. Gubanich | Michael S. Miller |
Mortimer J. Buckley | Paul A. Heller | Ralph K. Packard |
James H. Gately | F. William McNabb, III | George U. Sauter |
| |
Founder | |
| |
John C. Bogle | |
Chairman and Chief Executive Officer, 1974–1996 |
1 Officers of the funds are “interested persons” as defined in the Investment Company Act of 1940.
2 December 2002 for Vanguard Equity Income Fund, Vanguard Growth Equity Fund, the Vanguard Municipal Bond Funds, and the Vanguard State Tax-Exempt Funds.
More information about the trustees is in the Statement of Additional Information, available from The Vanguard Group.
| 
|
| P.O. Box 2600 |
| Valley Forge, PA 19482-2600 |
Connect with Vanguard™ > www.vanguard.com
Fund Information > 800-662-7447 | Vanguard, Connect with Vanguard, and the ship logo |
| are trademarks of The Vanguard Group, Inc. |
Direct Investor Account Services > 800-662-2739 | |
| |
Institutional Investor Services > 800-523-1036 | All other marks are the exclusive property of their |
| respective owners. |
Text Telephone for the | |
Hearing Impaired > 800-952-3335 | All comparative mutual fund data are from Lipper Inc. |
| or Morningstar, Inc., unless otherwise noted. |
| |
| |
| |
This material may be used in conjunction | You can obtain a free copy of Vanguard’s proxy voting |
with the offering of shares of any Vanguard | guidelines by visiting our website, www.vanguard.com, |
fund only if preceded or accompanied by | and searching for “proxy voting guidelines,” or by calling |
the fund’s current prospectus. | Vanguard at 800-662-2739. They are also available from |
| the SEC’s website, www.sec.gov. In addition, you may |
| obtain a free report on how your fund voted the proxies for |
| securities it owned during the 12 months ended June 30. |
| To get the report, visit either www.vanguard.com |
| or www.sec.gov. |
| |
| You can review and copy information about your fund |
| at the SEC’s Public Reference Room in Washington, D.C. |
| To find out more about this public service, call the SEC |
| at 202-551-8090. Information about your fund is also |
| available on the SEC’s website, and you can receive |
| copies of this information, for a fee, by sending a |
| request in either of two ways: via e-mail addressed to |
| publicinfo@sec.gov or via regular mail addressed to the |
| Public Reference Section, Securities and Exchange |
| Commission, Washington, DC 20549-0102. |
| |
| |
| |
| |
| © 2007 The Vanguard Group, Inc. |
| All rights reserved. |
| Vanguard Marketing Corporation, Distributor. |
| |
| Q530 032007 |
Vanguard® Health Care Fund | |
| |
| |
>Annual Report | |
| |
| |
January 31, 2007 | |
| |
| |
| |
| 
|
| |
| |
| |
| |
| |
| |
| |
| |
| |
> The Investor Shares of Vanguard Health Care Fund posted a return of 10.8% for the fiscal year ended January 31, 2007.
> The fund’s return was slightly behind that of its benchmark index, but was ahead of the average return for health/biotechnology funds by a wide margin.
> During the 12-month period, the health care sector was one of the weaker performers of the stock market, and the fund’s U.S.-based biotechnology stocks in particular performed poorly.
See page 27 for a Notice to Shareholders concerning the fund’s investment advisors.
Contents | |
| |
Your Fund’s Total Returns | 1 |
Chairman’s Letter | 2 |
Advisor’s Report | 7 |
Fund Profile | 9 |
Performance Summary | 10 |
Financial Statements | 12 |
Your Fund’s After-Tax Returns | 24 |
About Your Fund’s Expenses | 25 |
Notice to Shareholders | 27 |
Glossary | 29 |
Please note: The opinions expressed in this report are just that—informed opinions. They should not be considered promises or advice. Also, please keep in mind that the information and opinions cover the period through the date on the cover of this report. Of course, the risks of investing in your fund are spelled out in the prospectus.
Your Fund’s Total Returns
Fiscal Year Ended January 31, 2007 | |
| Total |
| Returns |
Vanguard Health Care Fund | |
Investor Shares | 10.8% |
Admiral™ Shares1 | 11.0 |
S&P Health Sector Index | 11.4 |
Average Health/Biotechnology Fund2 | 4.3 |
Dow Jones Wilshire 5000 Index | 14.1 |
Your Fund’s Performance at a Glance |
January 31, 2006–January 31, 2007 |
| | | Distributions Per Share |
| Starting | Ending | Income | Capital |
| Share Price | Share Price | Dividends | Gains |
Vanguard Health Care Fund | | | | |
Investor Shares | $143.39 | $149.69 | $2.100 | $6.660 |
Admiral Shares | 60.52 | 63.19 | 0.938 | 2.811 |
1 A lower-cost class of shares available to many longtime shareholders and to those with significant investments in the fund.
2 Derived from data provided by Lipper Inc.
1

Chairman’s Letter
Dear Shareholder,
During the fiscal year ended January 31, 2007, health care stocks were one of the stock market’s weaker-performing sectors. However, with its broad diversification across health care industries and its exposure to international pharmaceutical stocks, Vanguard Health Care Fund produced a solid return, advancing 10.8%. The fund ended the year behind the broad U.S. stock market, which returned 14.1%, but its performance far outpaced the average return of 4.3% for health/ biotechnology funds.
Domestic equity markets did well; markets abroad did even better
In the first half of the fiscal year, returns from large-capitalization stocks were virtually flat, while those of small-caps lost some ground. In the second six months, both large and small stocks rebounded, with small-caps faring slightly better. For the 12 months, the broad U.S. stock market gained 14.1%. Despite the weakness in the housing sector, the economy showed remarkable resilience, and corporate profits rose at a fast clip.
Across market capitalizations, value-oriented stocks outpaced their growth-oriented counterparts. International stocks continued to outperform U.S. stocks, as overseas markets—especially European and emerging markets—produced stellar returns. For U.S.-based investors, the dollar’s weakness further enhanced the results of international stocks.
2
Bond returns were modest as the Fed put rate hikes on hold
In the first six months of the fiscal year, the Federal Reserve Board continued its campaign to keep inflation in check, raising its target for the key federal funds rate by 0.25 percentage point on three occasions (in addition to a 0.25-percentage-point increase the day before the fiscal year began). Then, at its August meeting, the Fed left the target rate unchanged at 5.25%, where it remained through the end of the fiscal period, as inflation fears diminished.
Following the Fed’s pause, the prices of longer-maturity bonds rose faster than those of short-term bonds, reducing their yields more dramatically. Throughout the maturity spectrum, the “yield spread,” or the difference between yields of corporate securities and those of U.S. Treasury securities of comparable maturities, became even tighter. Bonds produced coupon-like returns for the period, with the broad taxable bond market returning 4.3%. Corporate bonds generally outperformed U.S. government issues. The Citigroup 3-Month Treasury Bill Index, a proxy for money market yields, returned 4.9%.
A comparatively tough year for the health care sector
Following a strong 2005 performance, the stocks of many health care firms stumbled during the 2006 fiscal year. Nonetheless, Vanguard Health Care Fund closed the 12-month period with a return of 10.8%. Because this fund
Market Barometer | | | |
| Average Annual Total Returns |
| Periods Ended January 31, 2007 |
| One Year | Three Years | Five Years |
Stocks | | | |
Russell 1000 Index (Large-caps) | 14.5% | 11.0% | 7.5% |
Russell 2000 Index (Small-caps) | 10.4 | 12.6 | 12.0 |
Dow Jones Wilshire 5000 Index (Entire market) | 14.1 | 11.5 | 8.4 |
MSCI All Country World Index ex USA (International) | 19.3 | 21.3 | 18.0 |
| | | |
Bonds | | | |
Lehman Aggregate Bond Index (Broad taxable market) | 4.3% | 3.4% | 4.9% |
Lehman Municipal Bond Index | 4.3 | 4.0 | 5.1 |
Citigroup 3-Month Treasury Bill Index | 4.9 | 3.1 | 2.4 |
| | | |
CPI | | | |
Consumer Price Index | 2.1% | 3.0% | 2.7% |
3
has performed so well for such an extended period, a one-year return of 10.8% may seem comparatively modest, more so in a year when the overall stock market delivered outsized returns of 14.1%. But, the fund’s performance against its peers in a tough environment was excellent.
The fund’s customary diversification across health care industries was an important plus during the period. By spreading its investments broadly across the major health care subsectors, which include health care equipment and pharmaceuticals, the investment advisor was able to offset weaknesses among biotechnology and managed-care companies with stronger performances from the pharmaceuticals giants and drugstores, including CVS. The fund also earned strong returns from a number of nontraditional health care stocks and chemicals companies with a diversified mix of health care and industrial products.
During the fiscal year, a number of the fund’s top-ten holdings were also its strongest performers. Pharmaceutical firms Schering-Plough, Roche Holdings AG, and Forest Laboratories were all solid performers. The fund also benefited from its holdings outside of the health care sector, in materials and consumer staples. On the other hand, stocks in the managed-care and biotechnology subsectors produced small returns for the fiscal year. Notable weak spots included biotech giants Genzyme and Amgen. The fund also sustained sizable losses in
Expense Ratios1 | | | |
Your fund compared with its peer group |
| | | Average |
| | | Health/ |
| Investor | Admiral | Biotechnology |
| Shares | Shares | Fund |
Health Care Fund | 0.25% | 0.17% | 1.79% |
| | | | | | |
1 Fund expense ratio reflects the 12 months ended January 31, 2007. Peer-group expense ratio is derived from data provided by Lipper Inc. and captures information through year-end 2006.
4
top-ten holdings Sanofi-Aventis and Eli Lilly as the pharmaceuticals big hitters have wrestled with regulatory challenges.
As you know, Vanguard Health Care Fund was closed to new investors on March 23, 2005, after experiencing significant growth in assets. The fund remains closed to new investors, although existing shareholders may continue to invest in the fund.
For the long term, the fund’s performance has been strong
We have long counseled that long-term performance, not a single year’s result, is the best gauge of how well a fund meets its mandate. Over the past ten years, Vanguard Health Care Fund has produced an average annual return of 16.2%, considerably ahead of its comparative benchmarks and well ahead of the broad stock market.
The table below shows the fund’s average annual return for the ten years ended January 31, 2007, along with the returns of its comparative measures. The table shows what would have happened to a hypothetical $25,000 investment made in each at the start of the decade. In your fund, the investment would have grown to $112,616, more than four times the original sum. That’s more than double the value of the same stake invested in the broad stock market, and over $48,000 more than the result for the average health/biotechnology fund.
Total Returns | | |
Ten Years Ended January 31, 2007 | | |
| Average | Final Value of a $25,000 |
| Annual Return | Initial Investment |
Health Care Fund Investor Shares | 16.2% | $112,616 |
S&P Health Sector Index | 8.9 | 58,429 |
Average Health/Biotechnology Fund1 | 9.9 | 64,373 |
Dow Jones Wilshire 5000 Index | 8.3 | 55,587 |
The figures shown represent past performance, which is not a guarantee of future results. (Current performance may be lower or higher than the performance data cited. For performance data current to the most recent month-end, visit our website at www.vanguard.com.) Note, too, that both investment returns and principal value can fluctuate widely, so an investor’s shares, when sold, could be worth more or less than their original cost.
1 Derived from data provided by Lipper Inc.
5
Wellington Management Company, LLP, your fund’s advisor, has guided the fund’s performance over the years through its stock-picking talents. In addition, Vanguard’s low costs allow more of the fund’s gains to stay in shareholders’ pockets. For a comparison of your fund’s cost with the average cost of its competitors, see the table on page 4.
Diversification is key to success in investing
In these missives, we routinely stress to investors that neither under- nor outperformance in the short term is all that meaningful. On the contrary, we always encourage our shareholders to evaluate their investments from a longer-term perspective. Through the years, we have steadfastly counseled investors to stick with a carefully considered, balanced portfolio of stock, bond, and money market mutual funds suited to their unique circumstances.
As an investor, you can emulate some of the strategies that have worked well for the Health Care Fund in the past. Just as the fund is diversified within its sector, you can make sure that your own portfolio is diversified both across and within the major asset classes.
As part of such a balanced portfolio, Vanguard Health Care Fund can play an important role in helping you to move toward your financial goals.
Thank you for investing with Vanguard.
Sincerely,

John J. Brennan
Chairman and Chief Executive Officer
February 12, 2007
6
Advisor’s Report
Vanguard Health Care Fund advanced 10.8% during the fiscal year ended January 31, 2007. This compared with the 14.5% return of the Standard & Poor’s 500 Index, the 11.4% result of the S&P Health Sector Index, and the 4.3% return of the average health/biotechnology fund.
The investment environment
Health care stocks lagged the overall stock market during the period, even though absolute performance was strong. Within the portfolio, international pharmaceutical and international biotech stocks were quite strong, faring much better than their domestic counterparts; medical products stocks especially outperformed. The Health Care Fund outpaced its competitive fund group by having greater exposure to these better-performing categories.
Our successes
Our international holdings AstraZeneca, Roche Holdings, Bayer AG, Daiichi Sankyo, and Takeda Pharmaceutical were particularly robust during the period, driven by vigorous earnings growth, improved fundamentals, and solid sales growth. Our health services and medical products holdings, including drug retailer CVS and diversified pharmaceuticals company Abbott Laboratories, also contributed to the positive overall results.
Portfolio Changes | |
Year Ended January 31, 2007 | |
| |
Additions | Comments |
St. Jude Medical | Market-share gainer. |
Merck | Good new product flow. |
Health Management Associates | Added based on weakness. |
| |
| |
Reductions | Comments |
Pfizer | Weakening fundamentals. |
Gilead Sciences | Reduced, as stock reached an attractive price. |
| |
| |
Eliminations | Comments |
Serono | Acquired by Merck KGaA. |
7
Our shortfalls
U.S. biotech companies Amgen and Genzyme were weak during the period. Biotech stocks are driven by drug development. Insurance reimbursement issues and challenges to drug pipelines were reflected in the stocks’ lackluster performance. Health care service providers Coventry Health Care and Cardinal Health also struggled during the 12 months.
The fund’s positioning
The broad market’s solid performance during the fiscal year created a high hurdle for continued gains in 2007. We expect an overall difficult environment for stocks; however, we believe the health care sector can potentially benefit from being a defensive sector. In other words, we will continue to invest the Health Care Fund with a long-term focus, while maintaining appropriate diversification and attention to valuations.
Edward P. Owens,
Senior Vice President and
Portfolio Manager
Wellington Management Company, LLP
February 12, 2007
8
Fund Profile
As of January 31, 2007
Portfolio Characteristics | | |
| | Comparative | Broad |
| Fund | Index1 | Index2 |
Number of Stocks | 82 | 55 | 4,939 |
Median Market Cap | $35.2B | $61.5B | $30.8B |
Price/Earnings Ratio | 22.6x | 21.1x | 17.9x |
Price/Book Ratio | 3.7x | 3.7x | 2.8x |
Yield | | 1.5% | 1.7% |
Investor Shares | 1.1% | | |
Admiral Shares | 1.2% | | |
Return on Equity | 17.9% | 21.4% | 17.8% |
Earnings Growth Rate | 12.7% | 12.7% | 18.5% |
Foreign Holdings | 27.7% | 0.0% | 1.1% |
Turnover Rate | 8% | — | — |
Expense Ratio | | — | — |
Investor Shares | 0.25% | | |
Admiral Shares | 0.17% | | |
Short-Term Reserves | 8% | — | — |
Volatility Measures3 | |
| Fund Versus | Fund Versus |
| Comparative Index1 | Broad Index2 |
R-Squared | 0.82 | 0.27 |
Beta | 0.71 | 0.48 |
Sector Diversification4 (% of portfolio) | |
| |
Biotechnology | 10% |
Consumer Staples | 4 |
Health Care Distributors | 6 |
Health Care Equipment | 8 |
Health Care Facilities | 1 |
Health Care Services | 2 |
Health Care Technology | 2 |
Managed Health Care | 6 |
Materials | 3 |
Pharmaceuticals | 50 |
Short-Term Reserves | 8% |
Ten Largest Holdings5 (% of total net assets) |
| |
Schering-Plough Corp. | 5.2% |
Eli Lilly & Co. | 4.6 |
Roche Holdings AG | 4.2 |
Forest Laboratories, Inc. | 4.1 |
Sanofi-Aventis | 3.9 |
AstraZeneca Group PLC | 3.7 |
McKesson Corp. | 3.0 |
Cardinal Health, Inc. | 2.9 |
Novartis AG (Registered) | 2.8 |
Abbott Laboratories | 2.7 |
Top Ten | 37.1% |
Market Diversification (% of portfolio) | |
| |
United States | 65% |
Japan | 10 |
Switzerland | 7 |
France | 4 |
United Kingdom | 4 |
Germany | 1 |
Others | 1 |
Short-Term Reserves | 8% |
Investment Focus
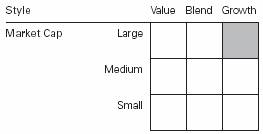
1 S&P Health Sector Index.
2 Dow Jones Wilshire 5000 Index.
3 For an explanation of R-squared, beta, and other terms used here, see the Glossary on page 29.
4 Sector percentages combine U.S. and international holdings.
5 “Ten Largest Holdings” excludes any temporary cash investments and equity index
9
Performance Summary
All of the returns in this report represent past performance, which is not a guarantee of future results that may be achieved by the fund. (Current performance may be lower or higher than the performance data cited. For performance data current to the most recent month-end, visit our website at www.vanguard.com.) Note, too, that both investment returns and principal value can fluctuate widely, so an investor’s shares, when sold, could be worth more or less than their original cost. The returns shown do not reflect taxes that a shareholder would pay on fund distributions or on the sale of fund shares.
Cumulative Performance: January 31, 1997–January 31, 2007
Initial Investment of $25,000
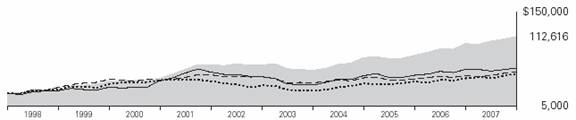
| Average Annual Total Returns | Final Value |
| Periods Ended January 31, 2007 | of a $25,000 |
| One Year | Five Years | Ten Years | Investment |
Health Care Fund Investor Shares1 | 10.85% | 10.42% | 16.24% | $112,616 |
Dow Jones Wilshire 5000 Index | 14.14 | 8.35 | 8.32 | 55,587 |
S&P Health Sector Index | 11.36 | 2.89 | 8.86 | 58,429 |
Average Health/ Biotechnology Fund2 | 4.28 | 4.80 | 9.92 | 64,373 |
| | | | Final Value |
| | | Since | of a $100,000 |
| One Year | Five Years | Inception3 | Investment |
Health Care Fund Admiral Shares1 | 10.96% | 10.52% | 10.32% | $166,957 |
Dow Jones Wilshire 5000 Index | 14.14 | 8.35 | 8.60 | 153,780 |
S&P Health Sector Index | 11.36 | 2.89 | 2.60 | 114,334 |
1 Total return figures do not reflect the 1% fee assessed on redemptions of shares held less than one year.
2 Derived from data provided by Lipper Inc.
3 November 12, 2001.
10
Fiscal-Year Total Returns (%): January 31, 1997–January 31, 2007
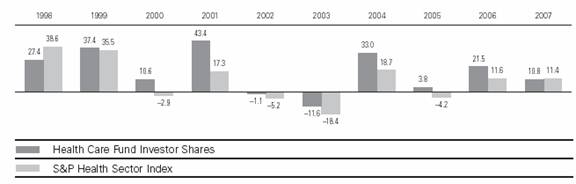
Average Annual Total Returns: Periods Ended December 31, 2006
This table presents average annual total returns through the latest calendar quarter—rather than through the end of the fiscal period. Securities and Exchange Commission rules require that we provide this information.
| Inception Date | One Year | Five Years | Ten Years |
Investor Shares1 | 5/23/1984 | 10.87% | 9.47% | 16.37% |
Admiral Shares1 | 11/12/2001 | 10.96 | 9.57 | 9.902 |
1 Total return figures do not reflect the 1% fee assessed on redemptions of shares held less than one year.
2 Return since inception.
Note: See Financial Highlights tables on pages 17 and 18 for dividend and capital gains information.
11
Financial Statements
Statement of Net Assets
As of January 31, 2007
The fund provides a complete list of its holdings four times in each fiscal year, at the quarter-ends. For the second and fourth fiscal quarters, the lists appear in the fund’s semiannual and annual reports to shareholders. For the first and third fiscal quarters, the fund files the lists with the Securities and Exchange Commission on Form N-Q. Shareholders can look up the fund’s Forms N-Q on the SEC’s website at www.sec.gov. Forms N-Q may also be reviewed and copied at the SEC’s Public Reference Room (see the back cover of this report for further information).
| | | Market |
| | | Value• |
| | Shares | ($000) |
Common Stocks (92.6%) | | |
United States (64.9%) | | |
Biotechnology (10.2%) | | |
* | Amgen, Inc. | 9,989,355 | 702,951 |
* | Genentech, Inc. | 5,250,000 | 458,692 |
* | Genzyme Corp. | 6,919,340 | 454,808 |
* | Gilead Sciences, Inc. | 6,249,848 | 401,990 |
* | MedImmune Inc. | 8,550,000 | 296,343 |
* | Vertex | | |
| Pharmaceuticals, Inc. | 4,009,400 | 141,732 |
* | Cephalon, Inc. | 1,902,000 | 137,724 |
* | Biogen Idec Inc. | 2,000,000 | 96,680 |
* | Millennium | | |
| Pharmaceuticals, Inc. | 7,641,300 | 84,818 |
* | Human Genome | | |
| Sciences, Inc. | 1,738,500 | 20,480 |
* | Amylin | | |
| Pharmaceuticals, Inc. | 300,000 | 11,634 |
| | | 2,807,852 |
Chemicals (0.7%) | | |
| Sigma-Aldrich Corp. | 4,800,000 | 182,160 |
| | | |
Food & Staples Retailing (2.8%) | | |
| CVS Corp. | 20,600,000 | 693,190 |
| Walgreen Co. | 1,500,000 | 67,950 |
| | | 761,140 |
Health Care Equipment & Supplies (8.2%) | |
| Medtronic, Inc. | 11,414,900 | 610,126 |
| Becton, Dickinson & Co. | 7,300,000 | 561,662 |
* | St. Jude Medical, Inc. | 9,300,900 | 397,706 |
| Baxter International, Inc. | 5,300,000 | 263,198 |
| Beckman Coulter, Inc. | 2,776,600 | 179,146 |
| DENTSPLY | | |
| International Inc. | 2,885,400 | 88,986 |
* | Hospira, Inc. | 2,045,070 | 75,218 |
| Biomet, Inc. | 900,000 | 38,124 |
| STERIS Corp. | 850,000 | 21,964 |
| Bausch & Lomb, Inc. | 200,000 | 11,136 |
| | | 2,247,266 |
Health Care Providers & Services (15.5%) | | |
1 | McKesson Corp. | 14,800,000 | 825,100 |
| Cardinal Health, Inc. | 11,036,708 | 788,242 |
* 1 | Human a Inc. | 8,433,000 | 468,032 |
| Quest Diagnostics, Inc. | 5,135,400 | 269,506 |
* | WellPoint Inc. | 3,402,400 | 266,680 |
| CIGNA Corp. | 1,900,000 | 251,560 |
| UnitedHealth Group Inc. | 4,800,000 | 250,848 |
* | Coventry Health Care Inc. | 4,750,000 | 244,862 |
1 | Health Management | | |
| Associates Class A | 12,386,900 | 240,925 |
* | Laboratory Corp. of | | |
| America Holdings | 2,767,360 | 203,235 |
* | Health Net Inc. | 3,000,000 | 146,130 |
| Universal Health Services | | |
| Class B | 2,460,400 | 142,531 |
1 | Owens & Minor, Inc. | | |
| Holding Co. | 2,200,000 | 73,590 |
* | Medco Health | | |
| Solutions, Inc. | 1,000,000 | 59,210 |
| Aetna Inc. | 600,000 | 25,296 |
| | | 4,255,747 |
Heath Care Technology (1.6%) | | |
| IMS Health, Inc. | 8,347,400 | 240,906 |
* 1 | Cerner Corp. | 4,200,000 | 188,706 |
| | | 429,612 |
Household Products (0.5%) | | |
| Colgate-Palmolive Co. | 1,500,000 | 102,450 |
| Kimberly-Clark Corp. | 676,300 | 46,935 |
| | | 149,385 |
Insurance (0.1%) | | |
| UnumProvident Corp. | 1,252,500 | 27,555 |
| | | |
Life Science Tools & Services (0.3%) | | |
* 1 | PAREXEL International Corp. | 1,570,200 | 51,424 |
* | Ventana Medical Systems, Inc. | 950,000 | 39,995 |
| | | 91,419 |
12
| | Market |
| | Value• |
| Shares | ($000) |
Machinery (0.3%) | | |
Pall Corp. | 2,404,600 | 83,584 |
| | |
Pharmaceuticals (24.7%) | | |
Schering-Plough Corp. | 57,170,000 | 1,429,250 |
Eli Lilly & Co. | 23,329,900 | 1,262,614 |
* 1 Forest Laboratories, Inc. | 20,001,500 | 1,122,284 |
Abbott Laboratories | 14,000,000 | 742,000 |
Pfizer Inc. | 17,411,570 | 456,880 |
Bristol-Myers Squibb Co. | 15,100,000 | 434,729 |
Wyeth | 8,250,000 | 407,633 |
Merck & Co., Inc. | 6,000,000 | 268,500 |
Allergan, Inc. | 2,100,000 | 245,091 |
Johnson & Johnson | 3,300,000 | 220,440 |
1 Perrigo Co. | 5,322,320 | 91,970 |
* Watson | | |
Pharmaceuticals, Inc. | 2,200,000 | 59,884 |
* Barr Pharmaceuticals Inc. | 900,000 | 48,168 |
| | 6,789,443 |
Total United States | | 17,825,163 |
International (27.7%) | | |
Belgium (0.5%) | | |
^UCB SA | 1,933,593 | 127,895 |
| | |
Canada (0.1%) | | |
* Axcan Pharma Inc. | 1,356,900 | 20,565 |
| | |
Denmark (0.3%) | | |
Novo Nordisk A/S B Shares | 700,000 | 60,222 |
| | |
France (4.1%) | | |
^Sanofi-Aventis | 12,189,415 | 1,070,958 |
^Ipsen Promesses | 1,400,000 | 63,558 |
| | 1,134,516 |
Germany (1.4%) | | |
^Bayer AG | 6,044,656 | 357,922 |
Fresenius Medical Care AG | 220,650 | 29,480 |
| | 387,402 |
Japan (9.9%) | | |
Takeda | | |
Pharmaceutical Co. Ltd. | 10,400,000 | 678,755 |
Astellas Pharma Inc. | 14,565,700 | 620,119 |
Eisai Co., Ltd. | 9,453,700 | 484,870 |
Daiichi Sankyo Co., Ltd. | 13,538,300 | 376,885 |
Chugai | | |
Pharmaceutical Co., Ltd. | 8,834,500 | 198,505 |
Shionogi & Co., Ltd. | 9,876,000 | 175,289 |
Tanabe Seiyaku Co., Ltd. | 6,850,000 | 92,532 |
Ono | | |
Pharmaceutical Co., Ltd. | 1,113,000 | 54,460 |
Olympus Corp. | 1,000,000 | 31,951 |
| | 2,713,366 |
Netherlands (0.5%) | | |
| Akzo Nobel NV | 2,400,000 | 150,761 |
| | | |
Switzerland (6.9%) | | |
| Roche Holdings AG | 6,123,977 | 1,149,609 |
| Novartis AG (Registered) | 13,219,880 | 759,687 |
| | | 1,909,296 |
United Kingdom (4.0%) | | |
| AstraZeneca Group PLC | 14,781,500 | 824,476 |
| AstraZeneca Group PLC | | |
| ADR | 3,496,672 | 195,639 |
| GlaxoSmithKline PLC ADR | 1,642,381 | 88,902 |
| | | 1,109,017 |
Total International | | 7,613,040 |
Total Common Stocks | | |
(Cost $14,693,741) | | 25,438,203 |
Temporary Cash Investments (8.3%) | |
Money Market Fund (0.7%) | | |
2 | Vanguard Market | | |
| Liquidity Fund, | | |
| 5.272%–Note G | 201,747,881 | 201,748 |
| | | |
| | | |
| | Face | |
| | Amount | |
| | ($000) | |
Commercial Paper (1.5%) | | |
| General Electric | | |
| Capital Services | | |
| 5.287%, 2/26/07 | 210,000 | 209,236 |
| General Electric | | |
| Capital Services | | |
| 5.277%, 2/27/07 | 210,000 | 209,205 |
| | | 418,441 |
Repurchase Agreements (6.1%) | |
| Banc of America | | |
| 5.270%, 2/1/07 (Dated | | |
| 1/31/07, Repurchase Value | |
| $274,140,000 collateralized | |
| by Federal National | | |
| Mortgage Assn., | | |
| 5.000%, 10/1/35) | 274,100 | 274,100 |
| Credit Suisse First Boston LLC | |
| 5.270%, 2/1/07 (Dated | | |
| 1/31/07, Repurchase Value | |
| $425,161,000 collateralized | |
| by Federal National | | |
| Mortgage Assn., | | |
| 4.500%–6.500%, | | |
| 5/1/08–2/1/37) | 425,100 | 425,100 |
13
| Face | Market |
| Amount | Value• |
| ($000) | ($000) |
Deutsche Bank | | |
5.270%, 2/1/07 (Dated | | |
1/31/07, Repurchase Value | | |
$452,266,000 collateralized | | |
by Federal Home Loan | | |
Mortgage Corp., | | |
5.000%–7.000%, | | |
8/1/21–10/1/36 and | | |
Government National | | |
Mortgage Assn., | | |
6.000%–6.500%, | | |
7/15/17–11/15/36) | 452,200 | 452,200 |
SBC Warburg Dillon Read | | |
5.280%, 2/1/07 (Dated | | |
1/31/07, Repurchase Value | | |
$519,675,000 collateralized | | |
by Federal Home Loan | | |
Mortgage Corp., | | |
4.000%–10.500%, | | |
2/1/07–11/1/36 and | | |
Federal National | | |
Mortgage Assn., | | |
4.500%–8.000%, | | |
11/1/07–1/1/37) | 519,600 | 519,600 |
| | 1,671,000 |
Total Temporary Cash Investments | |
(Cost $2,291,191) | | 2,291,189 |
Total Investments (100.9%) | | |
(Cost $16,984,932) | | 27,729,392 |
Other Assets and Liabilities— | | |
Net (–0.9%) | | (248,532) |
Net Assets (100%) | | 27,480,860 |
| Market |
| Value* |
| ($000) |
Statement of Assets and Liabilities | |
Assets | |
Investments in Securities, at Value | 27,729,392 |
Other Assets—Note C | 44,207 |
Total Assets | 27,773,599 |
Liabilities | |
Security Lending Collateral | |
Payable to Brokers—Note G | 201,748 |
Payables for Capital Shares Redeemed | 15,717 |
Other Liabilities | 75,274 |
Total Liabilities | 292,739 |
Net Assets | 27,480,860 |
| |
| |
At January 31, 2007, net assets consisted of:3 |
| Amount |
| ($000) |
Paid-in Capital | 16,361,033 |
Overdistributed Net Investment Income | (12,818) |
Accumulated Net Realized Gains | 388,174 |
Unrealized Appreciation | |
Investment Securities | 10,744,460 |
Foreign Currencies | 11 |
Net Assets | 27,480,860 |
| |
Investor Shares—Net Assets | |
Applicable to 111,309,419 outstanding | |
$.001 par value shares of beneficial | |
interest (unlimited authorization) | 16,662,157 |
Net Asset Value Per Share— | |
Investor Shares | $149.69 |
| |
| |
Admiral Shares—Net Assets | |
Applicable to 171,220,996 outstanding | |
$.001 par value shares of beneficial | |
interest (unlimited authorization) | 10,818,703 |
Net Asset Value Per Share— | |
Admiral Shares | $63.19 |
• See Note A in Notes to Financial Statements.
* | Non-income-producing security. |
^ Part of security position is on loan to broker-dealers. See Note G in Notes to Financial Statements.
1 Considered an affiliated company of the fund as the fund owns more than 5% of the outstanding voting securities of such company. See Note I in Notes to Financial Statements.
2 Affiliated money market fund available only to Vanguard funds and certain trusts and accounts managed by Vanguard. Rate shown is the 7-day yield.
3 See Note E in Notes to Financial Statements for the tax-basis components of net assets. ADR—American Depositary Receipt.
14
Statement of Operations
| Year Ended |
| January 31, 2007 |
| ($000) |
Investment Income | |
Income | |
Dividends1,2 | 296,854 |
Interest | 115,978 |
Security Lending | 4,954 |
Total Income | 417,786 |
Expenses | |
Investment Advisory Fees—Note B | 17,069 |
The Vanguard Group—Note C | |
Management and Administrative | |
Investor Shares | 26,571 |
Admiral Shares | 8,532 |
Marketing and Distribution | |
Investor Shares | 2,507 |
Admiral Shares | 1,270 |
Custodian Fees | 1,904 |
Auditing Fees | 27 |
Shareholders’ Reports | |
Investor Shares | 266 |
Admiral Shares | 29 |
Trustees’ Fees and Expenses | 32 |
Total Expenses | 58,207 |
Expenses Paid Indirectly—Note D | (284) |
Net Expenses | 57,923 |
Net Investment Income | 359,863 |
Realized Net Gain (Loss) | |
Investment Securities Sold2 | 1,022,377 |
Foreign Currencies | 489 |
Realized Net Gain (Loss) | 1,022,866 |
Change in Unrealized Appreciation (Depreciation) | |
Investment Securities | 1,359,411 |
Foreign Currencies | 106 |
Change in Unrealized Appreciation (Depreciation) | 1,359,517 |
Net Increase (Decrease) in Net Assets Resulting from Operations | 2,742,246 |
1 Dividends are net of foreign withholding taxes of $12,914,000.
2 Dividend income and realized net gain (loss) from affiliated companies of the fund were $6,767,000 and $79,931,000, respectively.
15
Statement of Changes in Net Assets
| Year Ended January 31, |
| 2007 | 2006 |
| ($000) | ($000) |
Increase (Decrease) In Net Assets | | |
Operations | | |
Net Investment Income | 359,863 | 318,037 |
Realized Net Gain (Loss) | 1,022,866 | 1,288,545 |
Change in Unrealized Appreciation (Depreciation) | 1,359,517 | 3,083,665 |
Net Increase (Decrease) in Net Assets Resulting from Operations | 2,742,246 | 4,690,247 |
Distributions | | |
Net Investment Income | | |
Investor Shares | (231,097) | (184,582) |
Admiral Shares | (155,419) | (94,323) |
Realized Capital Gain1 | | |
Investor Shares | (747,621) | (644,500) |
Admiral Shares | (459,182) | (257,326) |
Total Distributions | (1,593,319) | (1,180,731) |
Capital Share Transactions—Note H | | |
Investor Shares | (1,240,502) | (4,688,888) |
Admiral Shares | 1,251,373 | 5,594,230 |
Net Increase (Decrease) from Capital Share Transactions | 10,871 | 905,342 |
Total Increase (Decrease) | 1,159,798 | 4,414,858 |
Net Assets | | |
Beginning of Period | 26,321,062 | 21,906,204 |
End of Period2 | 27,480,860 | 26,321,062 |
1 Includes fiscal 2007 and 2006 short-term gain distributions totaling $27,064,000 and $69,889,000, respectively. Short-term gain distributions are treated as ordinary income dividends for tax purposes.
2 Net Assets—End of Period includes undistributed (overdistributed) net investment income of ($12,818,000) and $26,914,000.
16
Financial Highlights
Health Care Fund Investor Shares | | | | | |
| | | | | |
| | | Year Ended January 31, |
For a Share Outstanding Throughout Each Period | 2007 | 2006 | 2005 | 2004 | 2003 |
Net Asset Value, Beginning of Period | $143.39 | $123.84 | $124.29 | $94.35 | $115.01 |
Investment Operations | | | | | |
Net Investment Income | 1.953 | 1.753 | 1.272 | .960 | .947 |
Net Realized and Unrealized Gain (Loss) on Investments | 13.107 | 24.424 | 3.385 | 30.078 | (14.124) |
Total from Investment Operations | 15.060 | 26.177 | 4.657 | 31.038 | (13.177) |
Distributions | | | | | |
Dividends from Net Investment Income | (2.100) | (1.542) | (1.112) | (.995) | (.955) |
Distributions from Realized Capital Gains | (6.660) | (5.085) | (3.995) | (.103) | (6.528) |
Total Distributions | (8.760) | (6.627) | (5.107) | (1.098) | (7.483) |
Net Asset Value, End of Period | $149.69 | $143.39 | $123.84 | $124.29 | $94.35 |
| | | | | |
Total Return1 | 10.85% | 21.49% | 3.76% | 32.99% | –11.65% |
| | | | | |
Ratios/Supplemental Data | | | | | |
Net Assets, End of Period (Millions) | $16,662 | $17,198 | $19,087 | $18,340 | $13,506 |
Ratio of Total Expenses to | | | | | |
Average Net Assets | 0.25% | 0.25% | 0.22% | 0.28% | 0.29% |
Ratio of Net Investment Income to | | | | | |
Average Net Assets | 1.33% | 1.29% | 1.02% | 0.91% | 0.86% |
Portfolio Turnover Rate | 8% | 14% | 13% | 13% | 25% |
1 Total returns do not reflect the 1% fee assessed on redemptions after March 23, 2005, of shares held for less than one year, or the 1% fee assessed until March 23, 2005, on shares purchased on or after April 19, 1999, and held for less than five years.
17
Health Care Fund Admiral Shares | | | | | |
| | | | | |
| | | Year Ended January 31, |
For a Share Outstanding Throughout Each Period | 2007 | 2006 | 2005 | 2004 | 2003 |
Net Asset Value, Beginning of Period | $60.52 | $52.25 | $52.44 | $39.80 | $48.52 |
Investment Operations | | | | | |
Net Investment Income | .877 | .779 | .576 | .447 | .436 |
Net Realized and Unrealized Gain (Loss) | | | | | |
on Investments | 5.542 | 10.328 | 1.431 | 12.696 | (5.963) |
Total from Investment Operations | 6.419 | 11.107 | 2.007 | 13.143 | (5.527) |
Distributions | | | | | |
Dividends from Net Investment Income | (.938) | (.690) | (.511) | (.460) | (.438) |
Distributions from Realized Capital Gains | (2.811) | (2.147) | (1.686) | (.043) | (2.755) |
Total Distributions | (3.749) | (2.837) | (2.197) | (.503) | (3.193) |
Net Asset Value, End of Period | $63.19 | $60.52 | $52.25 | $52.44 | $39.80 |
| | | | | |
Total Return1 | 10.96% | 21.62% | 3.84% | 33.12% | –11.58% |
| | | | | |
Ratios/Supplemental Data | | | | | |
Net Assets, End of Period (Millions) | $10,819 | $9,123 | $2,819 | $2,492 | $1,620 |
Ratio of Total Expenses to | | | | | |
Average Net Assets | 0.17% | 0.14% | 0.15% | 0.19% | 0.22% |
Ratio of Net Investment Income to | | | | | |
Average Net Assets | 1.41% | 1.40% | 1.10% | 0.98% | 0.93% |
Portfolio Turnover Rate | 8% | 14% | 13% | 13% | 25% |
1 Total returns do not reflect the 1% fee assessed on redemptions after March 23, 2005, of shares held for less than one year, or the 1% fee previously assessed on shares held for less than five years.
See accompanying Notes, which are an integral part of the Financial Statements.
18
Notes to Financial Statements
Vanguard Health Care Fund is registered under the Investment Company Act of 1940 as an open-end investment company, or mutual fund. The fund files reports with the SEC under the company name Vanguard Specialized Funds. The fund may invest in securities of foreign issuers, which may subject it to investment risks not normally associated with investing in securities of United States corporations. The fund offers two classes of shares, Investor Shares and Admiral Shares. Investor Shares are available to any investor who meets the fund’s minimum purchase requirements. Admiral Shares are designed for investors who meet certain administrative, service, tenure, and account-size criteria.
A. The following significant accounting policies conform to generally accepted accounting principles for U.S. mutual funds. The fund consistently follows such policies in preparing its financial statements.
1. Security Valuation: Securities are valued as of the close of trading on the New York Stock Exchange (generally 4:00 p.m. Eastern time) on the valuation date. Equity securities are valued at the latest quoted sales prices or official closing prices taken from the primary market in which each security trades; such securities not traded on the valuation date are valued at the mean of the latest quoted bid and asked prices. Securities for which market quotations are not readily available, or whose values have been affected by events occurring before the fund’s pricing time but after the close of the securities’ primary markets, are valued at their fair values calculated according to procedures adopted by the board of trustees. These procedures include obtaining quotations from an independent pricing service, monitoring news to identify significant market- or security-specific events, and evaluating changes in the values of foreign market proxies (for example, ADRs, futures contracts, or exchange-traded funds), between the time the foreign markets close and the fund’s pricing time. When fair-value pricing is employed, the prices of securities used by a fund to calculate its net asset value may differ from quoted or published prices for the same securities. Investments in Vanguard Market Liquidity Fund are valued at that fund’s net asset value. Temporary cash investments acquired over 60 days to maturity are valued using the latest bid prices or using valuations based on a matrix system (which considers such factors as security prices, yields, maturities, and ratings), both as furnished by independent pricing services. Other temporary cash investments are valued at amortized cost, which approximates market value.
2. Foreign Currency: Securities and other assets and liabilities denominated in foreign currencies are translated into U.S. dollars at the exchange rates on the valuation date as employed by Morgan Stanley Capital International (MSCI) in the calculation of its indexes. As part of the fund’s fair-value procedures, exchange rates may be adjusted if they change significantly before the fund’s pricing time but after the time at which the MSCI rates are determined (generally 11:00 a.m. Eastern time).
Realized gains (losses) and unrealized appreciation (depreciation) on investment securities include the effects of changes in exchange rates since the securities were purchased, combined with the effects of changes in security prices. Fluctuations in the value of other assets and liabilities resulting from changes in exchange rates are recorded as unrealized foreign currency gains (losses) until the asset or liability is settled in cash, when they are
recorded as realized foreign currency gains (losses).
3. Repurchase Agreements: The fund may invest in repurchase agreements. Securities pledged as collateral for repurchase agreements are held by a custodian bank until the agreements mature. Each agreement requires that the market value of the collateral be sufficient to cover payments of interest and principal; however, in the event of default or bankruptcy by the other party to the agreement, retention of the collateral may be subject to legal proceedings.
19
4. Federal Income Taxes: The fund intends to continue to qualify as a regulated investment company and distribute all of its taxable income. Accordingly, no provision for federal income taxes is required in the financial statements.
5. Distributions: Distributions to shareholders are recorded on the ex-dividend date.
6. Security Lending: The fund may lend its securities to qualified institutional borrowers to earn additional income. Security loans are required to be secured at all times by collateral at least equal to the market value of securities loaned. The fund invests cash collateral received in Vanguard Market Liquidity Fund, and records a liability for the return of the collateral, during the period the securities are on loan. Security lending income represents the income earned on investing cash collateral, less expenses associated with the loan.
7. Other: Dividend income is recorded on the ex-dividend date. Interest income is accrued daily. Premiums and discounts on debt securities purchased are amortized and accreted, respectively, to interest income over the lives of the respective securities. Security transactions are accounted for on the date securities are bought or sold. Costs used to determine realized gains (losses) on the sale of investment securities are those of the specific securities sold. Fees assessed on redemptions of capital shares are credited to paid-in capital.
Each class of shares has equal rights as to assets and earnings, except that each class separately bears certain class-specific expenses related to maintenance of shareholder accounts (included in Management and Administrative expenses) and shareholder reporting. Marketing and distribution expenses are allocated to each class of shares based on a method approved by the board of trustees. Income, other non-class-specific expenses, and gains and losses on investments are allocated to each class of shares based on its relative net assets.
B. Wellington Management Company, LLP, provides investment advisory services to the fund for a fee calculated at an annual percentage rate of average net assets. For the year ended January 31, 2007, the investment advisory fee represented an effective annual rate of 0.06% of the fund’s average net assets.
C. The Vanguard Group furnishes at cost corporate management, administrative, marketing, and distribution services. The costs of such services are allocated to the fund under methods approved by the board of trustees. The fund has committed to provide up to 0.40% of its net assets in capital contributions to Vanguard. At January 31, 2007, the fund had contributed capital of $2,606,000 to Vanguard (included in Other Assets), representing 0.01% of the fund’s net assets and 2.61% of Vanguard’s capitalization. The fund’s trustees and officers are also directors and officers of Vanguard.
D. The fund has asked its investment advisor to direct certain security trades, subject to obtaining the best price and execution, to brokers who have agreed to rebate to the fund part of the commissions generated. Such rebates are used solely to reduce the fund’s management and administrative expenses. The fund’s custodian bank has also agreed to reduce its fees when the fund maintains cash on deposit in the non-interest-bearing custody account. For the year ended January 31, 2007, these arrangements reduced the fund’s management and administrative expenses by $200,000 and custodian fees by $84,000.
20
E. Distributions are determined on a tax basis and may differ from net investment income and realized capital gains for financial reporting purposes. Differences may be permanent or temporary. Permanent differences are reclassified among capital accounts in the financial statements to reflect their tax character. Temporary differences arise when certain items of income, expense, gain, or loss are recognized in different periods for financial statement and tax purposes; these differences will reverse at some time in the future. Differences in classification may also result from the treatment of short-term gains as ordinary income for tax purposes.
During the year ended January 31, 2007, the fund realized net foreign currency gains of $489,000, which increased distributable net income for tax purposes; accordingly such gains have been reclassified from accumulated net realized gains to overdistributed net investment income. The fund used a tax accounting practice to treat a portion of the price of capital shares redeemed during the year as distributions from net investment income and realized capital gains. Accordingly, the fund has reclassified $13,568,000 from overdistributed net investment income, and $38,228,000 from accumulated net realized gains, to paid-in capital.
For tax purposes, at January 31, 2007, the fund had $47,134,000 of ordinary income and $367,247,000 of long-term capital gains available for distribution.
At January 31, 2007, the cost of investment securities for tax purposes was $16,984,932,000. Net unrealized appreciation of investment securities for tax purposes was $10,744,460,000, consisting of unrealized gains of $10,821,218,000 on securities that had risen in value since their purchase and $76,758,000 in unrealized losses on securities that had fallen in value since their purchase.
F. During the year ended January 31, 2007, the fund purchased $1,848,941,000 of investment securities and sold $2,537,646,000 of investment securities other than temporary cash investments.
G. The market value of securities on loan to broker-dealers at January 31, 2007, was $194,275,000, for which the fund received cash collateral of $201,748,000.
H. Capital share transactions for each class of shares were:
| | | | Year Ended January 31, |
| | 2007 | | | 2006 |
| Amount | Shares | | Amount | Shares |
| ($000) | (000) | | ($000) | (000) |
Investor Shares | | | | | |
Issued | 753,042 | 5,236 | | 1,232,491 | 9,231 |
Issued in Lieu of Cash Distributions | 937,568 | 6,521 | | 792,348 | 5,873 |
Redeemed1 | (2,931,112) | (20,390) | | (6,713,727) | (49,290) |
Net Increase (Decrease)—Investor Shares | (1,240,502) | (8,633) | | (4,688,888) | (34,186) |
Admiral Shares | | | | | |
Issued | 1,638,889 | 26,900 | | 5,619,324 | 97,256 |
Issued in Lieu of Cash Distributions | 560,409 | 9,227 | | 319,494 | 5,498 |
Redeemed1 | (947,925) | (15,636) | | (344,588) | (5,983) |
Net Increase (Decrease)—Admiral Shares | 1,251,373 | 20,491 | | 5,594,230 | 96,771 |
1 Net of redemption fees of $745,000 and $1,560,000 (fund totals).
21
I. Certain of the fund’s investments are in companies that are considered to be affiliated companies of the fund because the fund owns more than 5% of the outstanding voting securities of the company. Transactions during the period in these companies were as follows:
| | Current Period Transactions | |
| Jan. 31, 2006 | | Proceeds from | | Jan. 31, 2007 |
| Market | Purchases | Securities | Dividend | Market |
| Value | at Cost | Sold | Income | Value |
| ($000) | ($000) | ($000) | ($000) | ($000) |
Cephalon, Inc. | 238,843 | — | 88,942 | — | n/a1 |
Cerner Corp. | 207,000 | — | 18,929 | — | 188,706 |
Forest Laboratories, Inc. | 925,669 | 4,252 | 4,895 | — | 1,122,284 |
Health Management Associates | | | | | |
Class A | — | 250,381 | — | 941 | 240,925 |
Humana Inc. | 545,291 | — | 78,804 | — | 468,032 |
McKesson Corp. | 816,200 | — | 29,849 | 3,588 | 825,100 |
Owens & Minor, Inc. Holding Co. | 68,860 | — | — | 1,320 | 73,590 |
PAREXEL International Corp. | 38,281 | — | — | — | 51,424 |
Perrigo Co. | 83,081 | — | — | 918 | 91,970 |
| 2,923,225 | | | 6,767 | 3,062,031 |
J. In June 2006, the Financial Accounting Standards Board issued Interpretation No. 48 (“FIN 48”), “Accounting for Uncertainty in Income Taxes.” FIN 48 establishes the minimum threshold for recognizing, and a system for measuring, the benefits of tax-return positions in financial statements. FIN 48 will be effective for the fund’s fiscal year ending January 31, 2008. Management is in the process of analyzing the fund’s tax positions for purposes of implementing FIN 48; based on the analysis completed to date, management does not believe the adoption of FIN 48 will result in any material impact to the fund’s financial statements.
1 At January 31, 2007, the security was still held, but the issuer was no longer an affiliated company of the fund.
22
Report of Independent Registered
Public Accounting Firm
To the Trustees of Vanguard Specialized Funds and Shareholders of Vanguard Health Care Fund:
In our opinion, the accompanying statements of net assets and of assets and liabilities and the related statements of operations and of changes in net assets and the financial highlights present fairly, in all material respects, the financial position of Vanguard Health Care Fund (one of the funds constituting Vanguard Specialized Funds, hereafter referred to as the “Fund”) at January 31, 2007, the results of its operations for the year then ended, the changes in its net assets for each of the two years in the period then ended and the financial highlights for each of the five years in the period then ended, in conformity with accounting principles generally accepted in the United States of America. These financial statements and financial highlights (hereafter referred to as “financial statements”) are the responsibility of the Fund’s management; our responsibility is to express an opinion on these financial statements based on our audits. We conducted our audits of these financial statements in accordance with the standards of the Public Company Accounting Oversight Board (United States). Those standards require that we plan and perform the audit to obtain reasonable assurance about whether the financial statements are free of material misstatement. An audit includes examining, on a test basis, evidence supporting the amounts and disclosures in the financial statements, assessing the accounting principles used and significant estimates made by management, and evaluating the overall financial statement presentation. We believe that our audits, which included confirmation of securities at January 31, 2007 by correspondence with the custodians and brokers and by agreement to the underlying ownership records for Vanguard Market Liquidity Fund, provide a reasonable basis for our opinion.
PricewaterhouseCoopers LLP
Philadelphia, Pennsylvania
March 13, 2007
Special 2006 tax information (unaudited) for Vanguard Health Care Fund
This information for the fiscal year ended January 31, 2007, is included pursuant to provisions of the Internal Revenue Code.
The fund distributed $1,216,760,000 as capital gain dividends (from net long-term capital gains) to shareholders during the fiscal year.
The fund distributed $281,884,000 of qualified dividend income to shareholders during the fiscal year.
For corporate shareholders, 43.1% of investment income (dividend income plus short-term gains, if any) qualifies for the dividends-received deduction.
23
Your Fund’s After-Tax Returns
This table presents returns for your fund both before and after taxes. The after-tax returns are shown in two ways: (1) assuming that an investor owned the fund during the entire period and paid taxes on the fund’s distributions, and (2) assuming that an investor paid taxes on the fund’s distributions and sold all shares at the end of each period.
Calculations are based on the highest individual federal income tax and capital gains tax rates in effect at the times of the distributions and the hypothetical sales. State and local taxes were not considered. After-tax returns reflect any qualified dividend income, using actual prior-year figures and estimates for 2007. (In the example, returns after the sale of fund shares may be higher than those assuming no sale. This occurs when the sale would have produced a capital loss. The calculation assumes that the investor received a tax deduction for the loss.)
The table shows returns for Investor Shares only; returns for other share classes will differ. Please note that your actual after-tax returns will depend on your tax situation and may differ from those shown. Also note that if you own the fund in a tax-deferred account, such as an individual retirement account or a 401(k) plan, this information does not apply to you. Such accounts are not subject to current taxes.
Finally, keep in mind that a fund’s performance—whether before or after taxes—does not guarantee future results.
Average Annual Total Returns: Health Care Fund Investor Shares1 |
Periods Ended January 31, 2007 | | | |
| One | Five | Ten |
| Year | Years | Years |
Returns Before Taxes | 10.85% | 10.42% | 16.24% |
Returns After Taxes on Distributions | 9.76 | 9.54 | 14.75 |
Returns After Taxes on Distributions and Sale of Fund Shares | 8.15 | 8.80 | 13.92 |
1 Total return figures do not reflect the 1% fee assessed on redemptions of shares held less than one year.
24
About Your Fund’s Expenses
As a shareholder of the fund, you incur ongoing costs, which include costs for portfolio management, administrative services, and shareholder reports (like this one), among others. Operating expenses, which are deducted from a fund’s gross income, directly reduce the investment return of the fund.
A fund’s expenses are expressed as a percentage of its average net assets. This figure is known as the expense ratio. The following examples are intended to help you understand the ongoing costs (in dollars) of investing in your fund and to compare these costs with those of other mutual funds. The examples are based on an investment of $1,000 made at the beginning of the period shown and held for the entire period.
The table below illustrates your fund’s costs in two ways:
• Based on actual fund return. This section helps you to estimate the actual expenses that you paid over the period. The “Ending Account Value” shown is derived from the fund’s actual return, and the third column shows the dollar amount that would have been paid by an investor who started with $1,000 in the fund. You may use the information here, together with the amount you invested, to estimate the expenses that you paid over the period.
To do so, simply divide your account value by $1,000 (for example, an $8,600 account value divided by $1,000 = 8.6), then multiply the result by the number given for your fund under the heading “Expenses Paid During Period.”
• Based on hypothetical 5% yearly return. This section is intended to help you compare your fund’s costs with those of other mutual funds. It assumes that the fund had a yearly return of 5% before expenses, but that the expense ratio is unchanged. In this case—because the return used is not the fund’s actual return—the results do not apply to your investment. The example is useful in making comparisons because the Securities and Exchange Commission requires all mutual funds to calculate expenses based on a 5% return. You can assess your fund’s costs by comparing this hypothetical example with the hypothetical examples that appear in shareholder reports of other funds.
Six Months Ended January 31, 2007 | | | |
| Beginning | Ending | Expenses |
| Account Value | Account Value | Paid During |
Health Care Fund | 7/31/2006 | 1/31/2007 | Period1 |
Based on Actual Fund Return | | | |
Investor Shares | $1,000.00 | $1,066.29 | $1.30 |
Admiral Shares | 1,000.00 | 1,066.78 | 0.89 |
Based on Hypothetical 5% Yearly Return |
Investor Shares | $1,000.00 | $1,023.95 | $1.28 |
Admiral Shares | 1,000.00 | 1,024.35 | 0.87 |
1 These calculations are based on expenses incurred in the most recent six-month period. The fund’s annualized six-month expense ratios for that period are 0.25% for Investor Shares, and 0.17% for Admiral Shares. The dollar amounts shown as “Expenses Paid” are equal to the annualized expense ratio multiplied by the average account value over the period, multiplied by the number of days in the most recent six-month period, then divided by the number of days in the most recent 12-month period.
25
Note that the expenses shown in the table on page 25 are meant to highlight and help you compare ongoing costs only; they do not include your fund’s low-balance fee or the 1% redemption fee that applies to shares held for less than one year. These fees are fully described in the prospectus. If the fees were applied to your account, your costs would be higher. Your fund does not carry a “sales load.”
The calculations assume no shares were bought or sold during the period. Your actual costs may have been higher or lower, depending on the amount of your investment and the timing of any purchases or redemptions.
You can find more information about the fund’s expenses, including annual expense ratios, in the Financial Statements section of this report. For additional information on operating expenses and other shareholder costs, please refer to the appropriate fund prospectus.
26
Notice to Shareholders
The board of trustees of Vanguard Health Care Fund has adopted a new advisory fee schedule for the fund, effective May 1, 2007. The new advisory fee schedule is expected to raise the fund’s expense ratio to 0.28% from 0.25% for Investor Shares and to 0.20% from 0.17% for Admiral Shares. For shareholders, the increase represents an additional $3 in costs on a $10,000 investment. This change will not affect the fund’s investment objective, policies, or strategies. The fund’s trustees regularly evaluate its investment advisory arrangements, focusing on factors such as the advisor’s investment process, style consistency, and performance, as well as the composition and depth of the management and research teams. In deciding to adopt the new fee schedule, the trustees considered the fund’s performance together with a wide range of information relating to Wellington Management Company, LLP (Wellington Management), which has managed the fund since its inception in 1984.
The fund has entered into a new investment advisory agreement with Wellington Management to reflect the new fee schedule; however, other terms of the existing agreement have not changed. Under the terms of the agreement, the fund will pay Wellington Management a fee at the end of each fiscal quarter. The fee is calculated by applying an annual percentage rate to the fund’s average daily net assets for the quarter.
For the fiscal year ended January 31, 2007, the total advisory fees paid by Vanguard Health Care Fund were $17,069,000, or 0.06% of the fund’s average net assets. If the new fee schedule had been in place throughout the 2007 fiscal year, the advisory fees paid by the fund would have been $24,650,000, or 0.09% of the fund’s average net assets. The average advisory fee paid by funds in Vanguard Health Care Fund’s Lipper peer group was 0.78% of assets, as of December 31, 2006.
Board approval of the investment advisory agreement
Wellington Management is responsible for managing the investment and reinvestment of the fund’s assets and for continuously reviewing, supervising, and administering the fund’s investment program. The advisor discharges its responsibilities subject to the supervision and oversight of the officers and trustees of the fund.
The fund’s trustees retained Wellington Management under the terms of an investment advisory agreement. The board’s decision to revise the current advisory fee schedule was based upon its most recent evaluation of the advisor’s investment staff, portfolio management process, and performance results. In considering whether to approve the new agreement, the board engaged in arms-length discussions with Wellington Management and considered the following factors, among others:
The trustees considered the benefits to shareholders of continuing to retain Wellington Management as advisor to the fund, particularly in light of the nature, extent, and quality of services provided by Wellington Management. The board considered the quality of investment management to the fund over both the short and long term and the organizational depth and stability of the firm. Specifically, the board noted that the fund’s investment manager, Edward
P. Owens, has managed the fund since its inception. Further, the board noted that Wellington Management utilizes intensive fundamental analysis to identify companies with high-quality balance sheets, strong management, and the potential for new products that will lead to above-average growth in revenue and earnings. The board concluded that the existing advisory fee schedule should be adjusted to reflect the fair market value of Wellington Management’s services and the firm’s need to maintain an expanded portfolio management team to manage a large fund in this market segment. The new fee arrangement will enable Wellington Management to enhance the organizational depth and stability of the fund’s portfolio management team by retaining top investment talent and by hiring new investment professionals on an as-needed basis.
27
The trustees considered the fund’s investment performance compared with those of the fund’s peer group and a relevant benchmark. The board concluded that short- and long-term performance has been consistently competitive versus the fund’s benchmark, the S&P Health Sector Index. The board also concluded that short- and long-term performance has been above average versus that of the fund’s peer group (as defined by Lipper).
The trustees considered the cost of services to be provided, including consideration of competitive fee rates and the fact that, after the adjustment, the fund’s advisory fee will remain significantly below those of most of its peers.
The trustees considered the extent to which economies of scale would be realized as the fund grows, including a consideration of appropriate breakpoints in the fee schedule. By including asset-based breakpoints in the fee schedule, the trustees ensure that if the fund continues to grow, investors will benefit by realizing economies of scale in the form of a lower advisory fee ratio.
The trustees considered all of the circumstances and information provided by both Wellington Management and Vanguard regarding the performance of the fund and concluded that approval of the investment advisory agreement is in the best interest of the fund and its shareholders.
The advisory agreement will continue for a period of one year from its effective date and is renewable after that for successive one-year periods. The agreement will be reviewed annually by the fund’s trustees, a majority of whom are not “interested persons” of either the fund or Wellington Management as defined in federal securities laws.
Background information on Wellington Management
Wellington Management Company, LLP, a Massachusetts partnership with offices at 75 State Street, Boston, MA 02109, is an investment firm that was founded in 1928. As of December 31, 2006, the firm managed approximately $575.5 billion in assets for a variety of clients, including mutual funds, institutions, and separate accounts. The manager primarily responsible for overseeing the fund’s investments is Edward P. Owens, CFA, Senior Vice President, Partner, and Global Industry Analyst of Wellington Management. He has worked in investment management with Wellington Management since 1974 and has managed the fund since its inception in 1984. He holds a B.S. from the University of Virginia and an M.B.A. from Harvard Business School. Wellington Management is owned by its 99 active partners, all of whom are active members of the firm. The managing partners of the firm are Laurie A. Gabriel, Phillip H. Perelmuter, and Perry M. Traquina. Please note that the managing partners are not necessarily those with the largest economic interests in the firm.
28
Glossary
Beta. A measure of the magnitude of a fund’s past share-price fluctuations in relation to the ups and downs of a given market index. The index is assigned a beta of 1.00. Compared with a given index, a fund with a beta of 1.20 typically would have seen its share price rise or fall by 12% when the index rose or fell by 10%. A fund’s beta should be reviewed in conjunction with its R-squared (see definition below). The lower the R-squared, the less correlation there is between the fund and the index, and the less reliable beta is as an indicator of volatility.
Earnings Growth Rate. The average annual rate of growth in earnings over the past five years for the stocks now in a fund.
Expense Ratio. The percentage of a fund’s average net assets used to pay its annual administrative and advisory expenses. These expenses directly reduce returns to investors.
Foreign Holdings. The percentage of a fund represented by stocks or depositary receipts of companies based outside the United States.
Inception Date. The date on which the assets of a fund (or one of its share classes) are first invested in accordance with the fund’s investment objective. For funds with a subscription period, the inception date is the day after that period ends. Investment performance is measured from the inception date.
Median Market Cap. An indicator of the size of companies in which a fund invests; the midpoint of market capitalization (market price x shares outstanding) of a fund’s stocks, weighted by the proportion of the fund’s assets invested in each stock. Stocks representing half of the fund’s assets have market capitalizations above the median, and the rest are below it.
Price/Book Ratio. The share price of a stock divided by its net worth, or book value, per share. For a fund, the weighted average price/book ratio of the stocks it holds.
Price/Earnings Ratio. The ratio of a stock’s current price to its per-share earnings over the past year. For a fund, the weighted average P/E of the stocks it holds. P/E is an indicator of market expectations about corporate prospects; the higher the P/E, the greater the expectations for a company’s future growth.
R-Squared. A measure of how much of a fund’s past returns can be explained by the returns from the market in general, as measured by a given index. If a fund’s total returns were precisely synchronized with an index’s returns, its R-squared would be 1.00. If the fund’s returns bore no relationship to the index’s returns, its R-squared would be 0.
Return on Equity. The annual average rate of return generated by a company during the past five years for each dollar of shareholder’s equity (net income divided by shareholder’s equity). For a fund, the weighted average return on equity for the companies whose stocks it holds.
Short-Term Reserves. The percentage of a fund invested in highly liquid, short-term securities that can be readily converted to cash.
Turnover Rate. An indication of the fund’s trading activity. Funds with high turnover rates incur higher transaction costs and may be more likely to distribute capital gains (which may be taxable to investors). The turnover rate excludes in-kind transactions, which have minimal impact on costs.
Yield. A snapshot of a fund’s income from interest and dividends. The yield, expressed as a percentage of the fund’s net asset value, is based on income earned over the past 30 days and is annualized, or projected forward for the coming year. The index yield is based on the current annualized rate of income provided by securities in the index.
29
This page intentionally left blank.
This page intentionally left blank.
The People Who Govern Your Fund
The trustees of your mutual fund are there to see that the fund is operated and managed in your best interests since, as a shareholder, you are a part owner of the fund. Your fund’s trustees also serve on the board of directors of The Vanguard Group, Inc., which is owned by the Vanguard funds and provides services to them on an at-cost basis.
A majority of Vanguard’s board members are independent, meaning that they have no affiliation with Vanguard or the funds they oversee, apart from the sizable personal investments they have made as private individuals.
Our independent board members bring distinguished backgrounds in business, academia, and public service to their task of working with Vanguard officers to establish the policies and oversee the activities of the funds. Among board members’ responsibilities are selecting investment advisors for the funds; monitoring fund operations, performance, and costs; reviewing contracts; nominating and selecting new trustees/directors; and electing Vanguard officers.
Each trustee serves a fund until its termination; or until the trustee’s retirement, resignation, or death; or otherwise as specified in the fund’s organizational documents. Any trustee may be removed at a shareholders’ meeting by a vote representing two-thirds of the net asset value of all shares of the fund together with shares of other Vanguard funds organized within the same trust. The table on these two pages shows information for each trustee and executive officer of the fund. The mailing address of the trustees and officers is P.O. Box 876, Valley Forge, PA 19482.
Chairman of the Board, Chief Executive Officer, and Trustee |
| |
John J. Brennan1 | |
Born 1954 | Principal Occupation(s) During the Past Five Years: Chairman |
Trustee since May 1987; | of the Board, Chief Executive Officer, and Director/Trustee of |
Chairman of the Board and | The Vanguard Group, Inc., and of each of the investment |
Chief Executive Officer | companies served by The Vanguard Group. |
146 Vanguard Funds Overseen | |
| |
Independent Trustees | |
| |
Charles D. Ellis | |
Born 1937 | Principal Occupation(s) During the Past Five Years: Applecore |
Trustee since January 2001 | Partners (pro bono ventures in education); Senior Advisor to |
146 Vanguard Funds Overseen | Greenwich Associates (international business strategy |
| consulting); Successor Trustee of Yale University; Overseer of |
| the Stern School of Business at New York University; Trustee of the Whitehead Institute for Biomedical Research. |
| |
| |
Rajiv L. Gupta | |
Born 1945 | Principal Occupation(s) During the Past Five Years: Chairman |
Trustee since December 20012 | and Chief Executive Officer of Rohm and Haas Co. (chemicals); Board Member |
146 Vanguard Funds Overseen | of the American Chemistry Council;Director of Tyco |
| International, Ltd. (diversified manufacturing and services) |
| since 2005;Trustee of Drexel University and of the Chemical |
| Heritage Foundation. |
| |
Amy Gutmann | |
Born 1949 | Principal Occupation(s) During the Past Five Years: President |
Trustee since June 2006 | of the University of Pennsylvania since 2004; Professor in the |
146 Vanguard Funds Overseen | School of Arts and Sciences, Annenberg School for |
| Communication, and Graduate School of Education of the |
| University of Pennsylvania since 2004; Provost (2001–2004) |
| and Laurance S. Rockefeller Professor of Politics and the |
| University Center for Human Values (1990–2004), Princeton |
| University; Director of Carnegie Corporation of New York since |
| 2005 and of Schuylkill River Development Corporation and |
| Greater Philadelphia Chamber of Commerce since 2004. |
| |
JoAnn Heffernan Heisen | |
Born 1950 | Principal Occupation(s) During the Past Five Years: Corporate |
Trustee since July 1998 | Vice President and Chief Global Diversity Officer since 2006, |
146 Vanguard Funds Overseen | Vice President and Chief Information Officer (1997–2005), |
| and Member of the Executive Committee of Johnson & |
| Johnson (pharmaceuticals/consumer products); Director of the |
| University Medical Center at Princeton and Women’s Research and Education Institute. |
| |
| |
André F. Perold | |
Born 1952 | Principal Occupation(s) During the Past Five Years: George |
Trustee since December 2004 | Gund Professor of Finance and Banking, Harvard Business |
146 Vanguard Funds Overseen | School; Senior Associate Dean, Director of Faculty Recruiting, |
| and Chair of Finance Faculty, Harvard Business School; |
| Director and Chairman of UNX, Inc. (equities trading firm) |
| since 2003; Chair of the Investment Committee of HighVista |
| Strategies LLC (private investment firm) since 2005; Director of |
| registered investment companies advised by Merrill Lynch |
| Investment Managers and affiliates (1985–2004), Genbel |
| Securities Limited (South African financial services firm) (1999– |
| 2003), Gensec Bank (1999–2003), Sanlam, Ltd. (South African |
| insurance company) (2001–2003), and Stockback, Inc. (credit |
| card firm) (2000–2002). |
| |
Alfred M. Rankin, Jr. | |
Born 1941 | Principal Occupation(s) During the Past Five Years: Chairman, |
Trustee since January 1993 | President, Chief Executive Officer, and Director of NACCO |
146 Vanguard Funds Overseen | Industries, Inc. (forklift trucks/housewares/lignite); Director of |
| Goodrich Corporation (industrial products/aircraft systems |
| and services). |
| |
J. Lawrence Wilson | |
Born 1936 | Principal Occupation(s) During the Past Five Years: Retired |
Trustee since April 1985 | Chairman and Chief Executive Officer of Rohm and Haas Co. |
146 Vanguard Funds Overseen | (chemicals); Director of Cummins Inc. (diesel engines), |
| MeadWestvaco Corp. (packaging products), and |
| AmerisourceBergen Corp. (pharmaceutical distribution); |
| Trustee of Vanderbilt University and of Culver Educational Foundation. |
| |
Executive Officers1 | |
| |
Heidi Stam | |
Born 1956 | Principal Occupation(s) During the Past Five Years: Managing |
Secretary since July 2005 | Director of The Vanguard Group, Inc., since 2006; General |
146 Vanguard Funds Overseen | Counsel of The Vanguard Group since 2005; Secretary of The |
| Vanguard Group, and of each of the investment companies |
| served by The Vanguard Group, since 2005; Principal of The |
| Vanguard Group (1997–2006). |
| |
Thomas J. Higgins | |
Born 1957 | Principal Occupation(s) During the Past Five Years: Principal |
Treasurer since July 1998 | of The Vanguard Group, Inc.;Treasurer of each of the |
146 Vanguard Funds Overseen | investment companies served by The Vanguard Group. |
| |
Vanguard Senior Management Team | | |
| | |
R. Gregory Barton | Kathleen C. Gubanich | Michael S. Miller |
Mortimer J. Buckley | Paul A. Heller | Ralph K. Packard |
James H. Gately | F. William McNabb, III | George U. Sauter |
| | |
Founder | | |
| | |
John C. Bogle | | |
Chairman and Chief Executive Officer, 1974–1996 | |
1 Officers of the funds are “interested persons” as defined in the Investment Company Act of 1940.
2 December 2002 for Vanguard Equity Income Fund, Vanguard Growth Equity Fund, the Vanguard Municipal Bond Funds, and the Vanguard State Tax-Exempt Funds.
More information about the trustees is in the Statement of Additional Information, available from The Vanguard Group.
P.O. Box 2600
Valley Forge, PA 19482-2600
Connect with Vanguard® > www.vanguard.com
Fund Information > 800-662-7447 | Vanguard, Admiral, Connect with Vanguard, and |
| the ship logo are trademarks of The Vanguard |
Direct Investor Account Services > 800-662-2739 | Group, Inc. |
| |
Institutional Investor Services > 800-523-1036 | All other marks are the exclusive property of their |
| respective owners. |
Text Telephone for the | |
Hearing Impaired > 800-952-3335 | All comparative mutual fund data are from Lipper |
| Inc. or Morningstar, Inc., unless otherwise noted. |
| |
This material may be used in conjunction with | You can obtain a free copy of Vanguard’s proxy |
the offering of shares of any Vanguard fund | voting guidelines by visiting our website, |
only if preceded or accompanied by the | www.vanguard.com, and searching for “proxy |
fund’s current prospectus. | voting guidelines,” or by calling Vanguard at |
| 800-662-2739. They are also available from the |
| SEC’s website, www.sec.gov. In addition, you may |
| obtain a free report on how your fund voted the |
| proxies for securities it owned during the 12 |
| months ended June 30. To get the report, visit |
| either www.vanguard.com or www.sec.gov. |
| |
| You can review and copy information about your |
| fund at the SEC’s Public Reference Room in |
| Washington, D.C. To find out more about this |
| public service, call the SEC at 202-551-8090. |
| Information about your fund is also available on the |
| SEC’s website, and you can receive copies of |
| this information, for a fee, by sending a request in |
| either of two ways: via e-mail addressed to |
| publicinfo@sec.gov or via regular mail addressed |
| to the Public Reference Section, Securities and |
| Exchange Commission, Washington, |
| DC 20549-0102. |
| |
| |
| |
| |
| © 2007 The Vanguard Group, Inc. |
| All rights reserved. |
| Vanguard Marketing Corporation, Distributor. |
| |
| Q520 032007 |
|
|
Vanguard® REIT Index Fund |
|
|
> Annual Report |
|
|
|
|
|
January 31, 2007 |
|
|
> | For the fiscal year ended January 31, 2007, Vanguard REIT Index Fund |
| returned more than 36%, outpacing the broad U.S. stock market by a wide |
| margin. |
> | The fund’s result was in line with those of its target indexes, and |
| outperformed the return of the average real estate fund. |
> | During a strong year for commercial real estate, the fund benefited from |
| solid returns in every segment of the real estate market. |
Contents | |
| |
Your Fund’s Total Returns | 1 |
Chairman’s Letter | 2 |
Fund Profile | 7 |
Performance Summary | 8 |
Financial Statements | 11 |
Your Fund’s After-Tax Returns | 24 |
About Your Fund’s Expenses | 25 |
Glossary | 27 |

Please note: The opinions expressed in this report are just that—informed opinions. They should not be considered promises or advice. Also, please keep in mind that the information and opinions cover the period through the date on the cover of this report. Of course, the risks of investing in your fund are spelled out in the prospectus.
Your Fund’s Total Returns
Fiscal Year Ended January 31, 2007 | |
| Total |
| Returns |
Vanguard REIT Index Fund | |
Investor Shares | 36.3% |
Admiral™ Shares1 | 36.5 |
Institutional Shares2 | 36.5 |
ETF Shares3 | |
Market Price | 36.4 |
Net Asset Value | 36.5 |
Target REIT Composite4 | 36.5 |
MSCI® US REIT Index | 37.2 |
Average Real Estate Fund5 | 35.3 |
Dow Jones Wilshire 5000 Index | 14.1 |
Your Fund’s Performance at a Glance: | | | | | | |
January 31, 2006–January 31, 2007 | | | | | | |
| | | | Distributions Per Share | |
| Starting | Ending | | | |
| Share | | Share | Income | Capital | Return of |
| Price | | Price | Dividends | Gains | Capital |
Vanguard REIT Index Fund | | | | | | |
Investor Shares | $21.29 | $ | 27.76 | $0.534 | $0.413 | $0.113 |
Admiral Shares | 90.82 | | 118.46 | 2.341 | 1.761 | 0.489 |
Institutional Shares | 14.06 | | 18.33 | 0.368 | 0.273 | 0.076 |
ETF Shares | 64.07 | | 83.55 | 1.665 | 1.242 | 0.347 |
1 | A lower-cost class of shares available to many longtime shareholders and to those with significant investments in the fund. |
2 | This class of shares also carries low expenses and is available for a minimum investment of $5 million. |
3 | Vanguard ETF Shares are traded on the American Stock Exchange and are available only through brokers. The table shows the ETF returns based on both the AMEX market price and the net asset value for a share. U.S. Pat. No. 6,879,964 B2. |
4 | The Target REIT Composite consists of the MSCI US REIT Index adjusted to include a 2% cash position (Lipper Money Market Average). |
5 | Derived from data provided by Lipper Inc. |
1

Chairman’s Letter
Dear Shareholder,
Vanguard REIT Index Fund’s four share classes each returned more than 36% during the fiscal year ended January 31, outpacing by a wide margin the 14.1% return of the broad U.S. stock market. The fund’s performance was in line with the results of its target indexes and was slightly above the return of the average real estate fund.
Real estate investment trusts have been especially strong performers during the past five years, and Vanguard REIT Index Fund has outperformed the overall stock market by a wide margin. In the past 12 months, the fund benefited from strong returns in every sector of the commercial real estate industry.
The table on page 1 presents the total returns of the fund’s four share classes and its comparative standards. If you own the fund in a taxable account, you may wish to see page 24 for a report on the fund’s after-tax returns.
Domestic equity markets did well; markets abroad did even better
In the first half of the fiscal year, returns from large-capitalization stocks were virtually flat, while those of small-caps lost some ground. In the second six months, both large and small stocks rebounded, with small-caps faring slightly better. For the 12 months, the broad U.S. stock market gained 14.1%. Despite the weakness in the housing sector, the economy showed remarkable resilience, and corporate profits rose at a fast clip.
2
Across market capitalizations, value-oriented stocks outpaced their growth-oriented counterparts. International stocks continued to outperform U.S. stocks, as overseas markets—especially European and emerging markets—produced stellar returns. For U.S.-based investors, the dollar’s weakness further enhanced the results of international stocks.
Bond returns were modest as the Fed put rate hikes on hold
In the first six months of the fiscal year, the Federal Reserve Board continued its campaign to keep inflation in check, raising its target for the key federal funds rate by 0.25 percentage point on three occasions (in addition to a 0.25 percentage point increase the day before the fiscal year began). Then, at its August meeting, the
Fed left the target rate unchanged at 5.25%, where it remained through the end of the fiscal period, as inflation fears diminished.
Following the Fed’s pause, the prices of longer-maturity bonds rose faster than those of short-term bonds, reducing their yields more dramatically. Throughout the maturity spectrum, the “yield spread,” or the difference between yields of corporate securities and those of U.S. Treasury securities of comparable maturities, became even tighter. Bonds produced coupon-like returns for the period, with the broad taxable bond market returning 4.3%. Corporate bonds generally outperformed U.S. government issues. The Citigroup 3-Month Treasury Bill Index, a proxy for money market yields, returned 4.9%.
Market Barometer | | | |
| | Average Annual Total Returns |
| | Periods Ended January 31, 2007 |
| One Year | Three Years | Five Years |
Stocks | | | |
Russell 1000 Index (Large-caps) | 14.5% | 11.0% | 7.5% |
Russell 2000 Index (Small-caps) | 10.4 | 12.6 | 12.0 |
Dow Jones Wilshire 5000 Index (Entire market) | 14.1 | 11.5 | 8.4 |
MSCI All Country World Index ex USA (International) | 19.3 | 21.3 | 18.0 |
| | | |
| | | |
Bonds | | | |
Lehman Aggregate Bond Index (Broad taxable market) | 4.3% | 3.4% | 4.9% |
Lehman Municipal Bond Index | 4.3 | 4.0 | 5.1 |
Citigroup 3-Month Treasury Bill Index | 4.9 | 3.1 | 2.4 |
| | | |
| | | |
CPI | | | |
Consumer Price Index | 2.1% | 3.0% | 2.7% |
3
The commercial real estate market thrived across every segment
Unlike the housing sector, commercial real estate thrived throughout the year. Despite rising interest rates during the fiscal year’s first half, the long-running rally for REITs continued, contributing to Vanguard REIT Index Fund’s advance of more than 36% for the 12 months.
The fund’s Investor Shares finished just 0.2 percentage point behind the Target REIT Composite. The fund’s return was 0.9 percentage point below that of the MSCI US REIT Index, a margin consistent with the fund’s real-world operating costs and its modest weighting in cash.
Although the REIT Index Fund seeks to track a highly concentrated segment of the stock market, its strong 12-month return was broadly based across the office, retail, and residential segments of the real estate industry. Some of the fund’s largest holdings were also its best performers, including Vornado Realty Trust, a manager of retail and office properties; Simon Property Group, which develops and manages retail malls; and Boston Properties, an office-building developer and manager. Overall, only a handful of the fund’s 100-plus stock holdings had negative returns for the fiscal year.
The fund earned very strong returns from Equity Office Properties Trust (+81%), an office space manager and one of the fund’s top holdings. Through the later months of the fund’s fiscal year, Equity Office Properties was the target of a prolonged and often frenzied bidding
Total Returns | | |
Ten Years Ended January 31, 2007 | | |
| Average | Final Value of a $10,000 |
| Annual Return | Initial Investment |
REIT Index Fund Investor Shares | 15.1% | $40,801 |
Target REIT Composite | 15.0 | 40,629 |
MSCI US REIT Index | 15.3 | 41,500 |
Average Real Estate Fund1 | 15.1 | 40,841 |
Dow Jones Wilshire 5000 Composite Index | 8.3 | 22,235 |
The figures shown represent past performance, which is not a guarantee of future results. (Current performance may be lower or higher than the performance data cited. For performance data current to the most recent month-end, visit our website at www.vanguard.com.) Note, too, that both investment returns and principal value can fluctuate widely, so an investor’s shares, when sold, could be worth more or less than their original cost.
1 | Derived from data provided by Lipper Inc. |
4
battle, which drove up the price of the firm’s stock. A testament to the market’s large appetite for commercial real estate, the saga ended with Blackstone Group’s purchase of Equity Office Properties on February 7, 2007.
Real estate’s outperformance has helped the fund to prosper
Vanguard REIT Index Fund celebrated its tenth anniversary on May 13, 2006. As the table on page 4 shows, during the past decade the fund has closely tracked the results of its comparative standards, and its performance has been on a par with the average return of competing real estate funds.
The fund’s inception was, by coincidence, well timed. During the past ten years, exceptional returns for real estate have generated investment returns for REITs, overall, that are nearly twice those of the broad stock market. Vanguard REIT Index Fund has helped shareholders capture just about all of this outstanding return. Vanguard Quantitative Equity Group, the fund’s advisor, has developed and refined proprietary index tracking and trading methodologies that, along with the fund’s low costs, give the fund an edge over higher-cost competitors.
Although Vanguard REIT Index Fund’s ten-year performance has been gratifying, it’s important to recognize that there will inevitably be periods when the fund does not perform as well. Real estate’s outperformance can’t persist forever, and it would be entirely consistent with the performance characteristics of other segments of the stock market—that is
Expense Ratios1 | | | | | |
Your fund compared with its peer group | | | | |
| | | | | |
| Investor | Admiral | Institutional | ETF | Average Real |
| Shares | Shares | Shares | Shares | Estate Fund |
REIT Index Fund | 0.21% | 0.14% | 0.10% | 0.12% | 1.55% |
1 | Fund expense ratios reflect the 12 months ended January 31, 2007. Peer-group expense ratio is derived from data provided by Lipper Inc. and captures information through year-end 2006. |
5
to say, alternating patterns of strong and weak performance—if the real estate sector experienced a less sanguine stretch ahead.
REITs’ role in your portfolio
As the performance of REITs has surged, investor interest in them has swelled. Thus, a word of caution is in order: Chasing what’s hot today can prove to be a bitter disappointment in the future.
In these missives, we routinely stress to investors that neither under- nor outperformance in the short term is all that meaningful. On the contrary, we always encourage our shareholders to evaluate their investments from a longer-term perspective. Through the years, we have steadfastly counseled investors to stick with a carefully considered, balanced portfolio of stock, bond, and money market mutual funds suited to their unique circumstances.
An important strategy for weathering the market’s uncertainties over the long term is to maintain a diversified, well-planned investment strategy. Vanguard REIT Index Fund is a low-cost and efficient means of investing in real estate securities, and it can add significant diversification benefits to a portfolio of traditional stock and bond funds.
Thank you for investing with Vanguard.
Sincerely,

John J. Brennan
Chairman and Chief Executive Officer
February 12, 2007
Vanguard REIT Index Fund ETF Shares | | | | |
Premium/Discount: September 23, 20041–January 31, 2007 | | |
| | | | |
| Market Price Above or | Market Price Below |
| Equal to Net Asset Value | | Net Asset Value |
| Number | Percentage | Number | Percentage |
Basis Point Differential2 | of Days | of Total Days | of Days | of Total Days |
0–24.9 | 284 | 47.81% | 301 | 50.67% |
25–49.9 | 5 | 0.84 | 3 | 0.51 |
50–74.9 | 0 | 0.00 | 0 | 0.00 |
75–100.0 | 0 | 0.00 | 0 | 0.00 |
>100.0 | 1 | 0.17 | 0 | 0.00 |
Total | 290 | 48.82% | 304 | 51.18% |
2 | One basis point equals 1/100th of a percentage point. |
6
Fund Profile | | | |
As of January 31, 2007 | | | |
| | | |
Portfolio Characteristics | | |
| Comparative | Broad |
| Fund | Index1 | Index2 |
Number of Stocks | 103 | 101 | 4,939 |
Median Market Cap | $8.1B | $8.2B | $30.8B |
Price/Earnings Ratio | 50.4x | 50.9x | 17.9x |
Price/Book Ratio | 3.2x | 3.2x | 2.8x |
Yield | | 3.4% | 1.7% |
Investor Shares | 3.3%3 | | |
Admiral Shares | 3.3%3 | | |
Institutional Shares | 3.4%3 | | |
ETF Shares | 3.3%3 | | |
Return on Equity | 8.1% | 8.0% | 17.8% |
Earnings Growth Rate | –3.8% | –4.0% | 18.5% |
Foreign Holdings | 0.0% | 0.0% | 1.1% |
Turnover Rate | 11% | — | — |
Expense Ratio | | — | — |
Investor Shares | 0.21% | | |
Admiral Shares | 0.14% | | |
Institutional Shares | 0.10% | | |
ETF Shares | 0.12% | | |
Short-Term Reserves | 2% | — | — |
Fund Allocation by REIT Type (% of portfolio) |
| |
Retail | 26% |
Office | 20 |
Specialized | 19 |
Residential | 18 |
Diversified | 8 |
Industrial | 7 |
Short-Term Reserves | 2% |
Volatility Measures4 | |
| Fund Versus | Fund Versus |
| Target Index5 | Broad Index2 |
R-Squared | 1.00 | 0.31 |
Beta | 1.00 | 1.20 |
Ten Largest Holdings6 (% of total net assets) |
| |
Simon Property Group, Inc. REIT | 6.4% |
Equity Office Properties Trust REIT | 4.9 |
Vornado Realty Trust REIT | 4.2 |
Equity Residential REIT | 4.2 |
ProLogis REIT | 4.1 |
Public Storage, Inc. REIT | 3.5 |
Boston Properties, Inc. REIT | 3.5 |
Archstone-Smith Trust REIT | 3.4 |
General Growth Properties Inc. REIT | 3.4 |
Host Hotels & Resorts Inc. REIT | 3.3 |
Top Ten | 40.9% |
Investment Focus
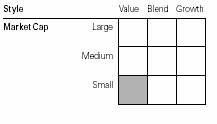
2 | Dow Jones Wilshire 5000 Index. |
3 | This yield may include some payments that represent a return of capital, capital gains distributions, or both by the underlying REITs. These amounts are determined by each REIT at the end of its fiscal year. |
4 | For an explanation of R-squared, beta, and other terms used here, see the Glossary on page 27. |
5 | The Target REIT Composite consists of the MSCI US REIT Index adjusted to include a 2% cash position (Lipper Money Market Average). |
6 | “Ten Largest Holdings” excludes any temporary cash investments and equity index products. |
7
Performance Summary
All of the returns in this report represent past performance, which is not a guarantee of future results that may be achieved by the fund. (Current performance may be lower or higher than the performance data cited. For performance data current to the most recent month-end, visit our website at www.vanguard.com.) Note, too, that both investment returns and principal value can fluctuate widely, so an investor’s shares, when sold, could be worth more or less than their original cost. The returns shown do not reflect taxes that a shareholder would pay on fund distributions or on the sale of fund shares.
Cumulative Performance: January 31, 1997–January 31, 2007
Initial Investment of $10,000
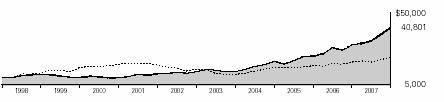
| | | |
| | | |
| Average Annual Total Returns | Final Value |
| Periods Ended January 31, 2007 | of a $10,000 |
| One Year | Five Years | Ten Years | Investment |
REIT Index Fund Investor Shares1 | 36.32% | 24.79% | 15.10% | $40,801 |
Dow Jones Wilshire 5000 Index | 14.14 | 8.35 | 8.32 | 22,235 |
Target REIT Composite2 | 36.50 | 24.86 | 15.05 | 40,629 |
MSCI US REIT Index | 37.23 | 25.35 | 15.29 | 41,500 |
Average Real Estate Fund3 | 35.28 | 24.82 | 15.11 | 40,841 |
| | | | Final Value |
| | | Since | of a $100,000 |
| One Year | Five Years | Inception4 | Investment |
REIT Index Fund Admiral Shares1 | 36.46% | 24.86% | 25.04% | $320,985 |
Dow Jones Wilshire 5000 Index | 14.14 | 8.35 | 8.60 | 153,780 |
Target REIT Composite | 36.50 | 24.86 | 25.05 | 321,198 |
1 | Total return figures do not reflect the 1% fee assessed on redemptions of shares held for less than one year. |
2 | The Target REIT Composite consists of the MSCI US REIT Index adjusted to include a 2% cash position (Lipper Money Market Average). |
3 | Derived from data provided by Lipper Inc. |
4 | Inception date November 12, 2001, for Admiral Shares. |
8
| | | Final Value of |
| | Since | a $5,000,000 |
| One Year | Inception1 | Investment |
REIT Index Fund Institutional Shares2 | 36.45% | 28.20% | $10,975,379 |
Dow Jones Wilshire 5000 Index | 14.14 | 12.86 | 7,331,778 |
Target REIT Composite | 36.50 | 28.17 | 10,967,291 |
| | | Final Value of |
| | Since | a $10,000 |
| One Year | Inception1 | Investment |
Vanguard REIT ETF Shares Net Asset Value | 36.48% | 32.00% | $19,232 |
Dow Jones Wilshire 5000 Index | 14.14 | 15.24 | 13,968 |
Target REIT Composite | 36.50 | 32.00 | 19,232 |
Cumulative Returns ETF Shares: September 23, 2004–January 31, 2007 | |
| | |
| | Cumulative |
| | Since |
| One Year | Inception |
Vanguard REIT ETF Shares Market Price | 36.44% | 92.33% |
Vanguard REIT ETF Shares Net Asset Value | 36.48 | 92.32 |
Target REIT Composite | 36.50 | 92.32 |
1 | Inception dates are December 2, 2003, for Institutional Shares and September 23, 2004, for ETF Shares. |
2 | Total return figures do not reflect the 1% fee assessed on redemptions of shares held for less than one year. |
9
Fiscal-Year Total Returns (%): January 31, 1997–January 31, 2007
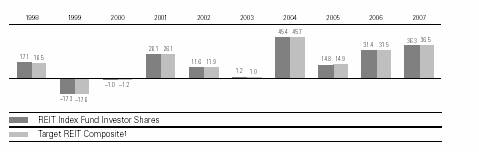
Average Annual Total Returns: Periods Ended December 31, 2006
This table presents average annual total returns through the latest calendar quarter—rather than through the end of the fiscal period. Securities and Exchange Commission rules require that we provide this information.
| Inception Date | One Year | Five Years | Ten Years |
Investor Shares2 | 5/13/1996 | 35.07% | 22.70% | 14.18% |
Admiral Shares2 | 11/12/2001 | 35.16 | 22.77 | 23.523 |
Institutional Shares2 | 12/2/2003 | 35.15 | 25.703 | — |
ETF Shares | 9/23/2004 | | | |
Market Price | | 35.13 | 28.593 | — |
Net Asset Value | | 35.20 | 28.663 | — |
1 | The Target REIT Composite consists of the MSCI US REIT Index adjusted to include a 2% cash position (Lipper Money Market Average). |
2 | Total return figures do not reflect the 1% fee assessed on redemptions of shares held for less than one year. |
Note: See Financial Highlights tables on pages 16–19 for dividend and capital gains information.
10
Financial Statements
Statement of Net Assets
As of January 31, 2007
The fund provides a complete list of its holdings four times in each fiscal year, at the quarter-ends. For the second and fourth fiscal quarters, the lists appear in the fund’s semiannual and annual reports to shareholders. For the first and third fiscal quarters, the fund files the lists with the Securities and Exchange Commission on Form N-Q. Shareholders can look up the fund’s Forms N-Q on the SEC’s website at www.sec.gov. Forms N-Q may also be reviewed and copied at the SEC’s Public Reference Room (see the back cover of this report for further information).
| | Market |
| | Value• |
| Shares | ($000) |
Real Estate Investment Trusts (97.9%) | |
Diversified REITs (7.8%) | | |
Vornado Realty Trust REIT | 4,470,987 | 547,025 |
Liberty Property Trust REIT | 2,950,462 | 152,657 |
Colonial Properties Trust REIT | 1,430,611 | 70,315 |
Crescent Real Estate, Inc. REIT | 3,194,165 | 64,075 |
Washington REIT | 1,474,854 | 63,050 |
Spirit Finance Corp. REIT | 3,523,042 | 44,109 |
PS Business Parks, Inc. REIT | 523,339 | 39,360 |
Investors Real Estate Trust REIT | 1,473,438 | 15,265 |
Capital Lease Funding, Inc. REIT | 1,111,703 | 12,462 |
| | 1,008,318 |
Industrial REITs (6.5%) | | |
ProLogis REIT | 8,033,570 | 522,182 |
AMB Property Corp. REIT | 2,896,807 | 176,271 |
First Industrial Realty Trust REIT | 1,468,489 | 69,401 |
EastGroup Properties, Inc. REIT | 769,159 | 42,104 |
First Potomac REIT | 786,253 | 23,611 |
| | 833,569 |
Office REITs (20.0%) | | |
Equity Office Properties Trust REIT | 11,475,309 | 637,453 |
Boston Properties, Inc.REIT | 3,558,842 | 448,734 |
SL Green Realty Corp. REIT | 1,915,342 | 280,751 |
Duke Realty Corp. REIT | 4,427,865 | 195,357 |
Mack-Cali Realty Corp. REIT | 2,045,068 | 113,788 |
Alexandria Real Estate Equities, Inc. REIT | 953,923 | 103,367 |
| | | |
| | Market |
| | Value• |
| Shares | ($000) |
Brandywine Realty Trust REIT | 2,950,605 | 102,858 |
Kilroy Realty Corp. REIT | 1,061,617 | 92,191 |
HRPT Properties Trust REIT | 6,882,320 | 89,608 |
Corporate Office Properties Trust, Inc. REIT | 1,320,209 | 70,341 |
Highwood Properties, Inc. REIT | 1,508,007 | 65,900 |
BioMed Realty Trust, Inc. REIT | 2,137,705 | 63,768 |
Digital Realty Trust, Inc. REIT | 1,599,110 | 57,472 |
Maguire Properties, Inc. REIT | 1,231,441 | 53,506 |
Cousins Properties, Inc. REIT | 1,251,453 | 48,982 |
American Financial Realty Trust REIT | 4,209,013 | 47,057 |
Lexington Realty Trust REIT | 2,140,682 | 45,554 |
^Franklin Street Properties Corp. REIT | 1,665,863 | 34,233 |
Parkway Properties Inc. REIT | 507,442 | 27,833 |
| | 2,578,753 |
Residential REITs (18.3%) | | |
Equity Residential REIT | 9,536,069 | 536,690 |
Archstone-Smith Trust REIT | 7,021,920 | 443,856 |
Avalonbay Communities, Inc. REIT | 2,576,229 | 382,209 |
Apartment Investment & Management Co.Class A REIT | 3,191,298 | 199,871 |
Camden Property Trust REIT | 1,848,091 | 144,890 |
United Dominion Realty Trust REIT | 4,412,175 | 144,675 |
11
| | Market |
| | Value• |
| Shares | ($000) |
BRE Properties Inc.Class A REIT | 1,690,216 | 117,318 |
Essex Property Trust, Inc. REIT | 720,554 | 104,005 |
Home Properties, Inc. REIT | 1,088,282 | 69,966 |
Post Properties, Inc. REIT | 1,416,637 | 68,707 |
Mid-America Apartment Communities, Inc. REIT | 748,722 | 45,013 |
Equity Lifestyle Properties, Inc. REIT | 735,014 | 40,595 |
American Campus Communities, Inc. REIT | 726,316 | 23,148 |
Sun Communities, Inc. REIT | 533,121 | 16,852 |
GMH Communities Trust REIT | 1,350,056 | 13,244 |
Education Realty Trust, Inc. REIT | 869,029 | 13,062 |
| | 2,364,101 |
Retail REITs (26.2%) | | |
Simon Property Group, Inc. REIT | 7,248,467 | 829,152 |
General Growth Properties Inc. REIT | 7,117,597 | 437,875 |
Kimco Realty Corp. REIT | 7,369,701 | 365,537 |
Developers Diversified Realty Corp. REIT | 3,596,484 | 241,396 |
The Macerich Co. REIT | 2,353,568 | 224,836 |
Regency Centers Corp.REIT | 2,253,201 | 196,254 |
Federal Realty Investment Trust REIT | 1,805,144 | 168,637 |
Weingarten Realty Investors REIT | 2,646,118 | 131,009 |
Taubman Co. REIT | 1,730,145 | 100,816 |
New Plan Excel Realty Trust REIT | 3,434,948 | 100,026 |
CBL & Associates Properties, Inc. REIT | 2,012,787 | 94,460 |
Realty Income Corp. REIT | 3,272,460 | 94,181 |
Pennsylvania REIT | 1,141,203 | 48,729 |
^National Retail Properties REIT | 1,810,028 | 42,988 |
Inland Real Estate Corp. REIT | 2,108,253 | 42,629 |
Tanger Factory Outlet Centers, Inc. REIT | 1,016,089 | 41,253 |
Equity One, Inc. REIT | 1,329,198 | 36,872 |
^Mills Corp. REIT | 1,669,710 | 36,149 |
Glimcher Realty Trust REIT | 1,204,984 | 34,053 |
Cedar Shopping Centers, Inc. REIT | 1,410,792 | 23,631 |
Acadia Realty Trust REIT | 833,085 | 21,402 |
Ramco-Gershenson Properties Trust REIT | 542,987 | 20,340 |
Saul Centers, Inc. REIT | 337,620 | 18,204 |
| | Market |
| | Value• |
| Shares | ($000) |
Getty Realty Holding Corp. REIT | 567,416 | 17,675 |
Urstadt Biddle Properties Class A REIT | 678,765 | 13,188 |
Urstadt Biddle Properties REIT | 18,944 | 341 |
| | 3,381,633 |
Specialized REITs (19.1%) | | |
Public Storage, Inc. REIT | 4,126,427 | 448,790 |
Host Hotels &Resorts Inc. REIT | 16,205,219 | 428,952 |
Health Care Properties Investors REIT | 6,578,838 | 271,377 |
Ventas, Inc. REIT | 3,068,215 | 141,905 |
Hospitality Properties Trust REIT | 2,828,029 | 138,008 |
^Health Care Inc. REIT | 2,364,901 | 110,701 |
Nationwide Health Properties, Inc. REIT | 2,624,707 | 87,455 |
Healthcare Realty Trust Inc. REIT | 1,567,037 | 66,411 |
Senior Housing Properties Trust REIT | 2,519,174 | 65,448 |
LaSalle Hotel Properties REIT | 1,310,130 | 62,375 |
Entertainment Properties Trust REIT | 867,317 | 56,254 |
DiamondRock Hospitality Co. REIT | 2,883,341 | 54,351 |
Sunstone Hotel Investors, Inc. REIT | 1,901,500 | 53,793 |
Strategic Hotels and Resorts, Inc. REIT | 2,467,433 | 53,099 |
FelCor Lodging Trust, Inc. REIT | 1,930,731 | 42,611 |
Sovran Self Storage, Inc. REIT | 659,812 | 39,589 |
Extra Space Storage Inc. REIT | 1,948,029 | 38,454 |
Trustreet Properties, Inc. REIT | 2,102,585 | 35,618 |
U-Store-It Trust REIT | 1,593,748 | 35,015 |
Omega Healthcare Investors, Inc. REIT | 1,929,394 | 34,980 |
Highland Hospitality Corp.REIT | 2,001,706 | 31,787 |
Equity Inns, Inc. REIT | 1,793,572 | 29,594 |
Ashford Hospitality Trust REIT | 2,133,411 | 26,262 |
National Health Investors REIT | 773,142 | 24,818 |
Innkeepers USA Trust REIT | 1,480,851 | 24,271 |
Medical Properties Trust Inc. REIT | 1,317,511 | 20,593 |
12
| | | Market |
| | | Value• |
| | Shares | ($000) |
| LTC Properties, Inc. REIT | 649,642 | 18,320 |
| Universal Health Realty | | |
| Income REIT | 367,037 | 14,843 |
| | | 2,455,674 |
Total Real Estate Investment Trusts | |
(Cost $7,550,541) | | 12,622,048 |
Temporary Cash Investments (2.1%) | |
1 | Vanguard Market Liquidity | | |
| Fund, 5.272% | 226,868,437 | 226,868 |
1 | Vanguard Market Liquidity | | |
| Fund, 5.272%—Note E | 47,691,600 | 47,692 |
Total Temporary Cash Investments | |
(Cost $274,560) | | 274,560 |
Total Investments (100.0%) | | |
(Cost $7,825,101) | | 12,896,608 |
Other Assets and Liabilities (0.0%) | |
Other Assets—Note B | | 167,511 |
Liabilities—Note E | | (172,227) |
| | | (4,716) |
Net Assets (100%) | | 12,891,892 |
At January 31, 2007, net assets consisted of:2 |
| Amount |
| ($000) |
Paid-in Capital | 7,833,384 |
Overdistributed Net Investment Income | (10,041) |
Overdistributed Net Realized Gains | (2,958) |
Unrealized Appreciation | 5,071,507 |
Net Assets | 12,891,892 |
| |
| |
Investor Shares—Net Assets | |
Applicable to 245,924,183 outstanding $.001 |
par value shares of beneficial interest | |
(unlimited authorization) | 6,827,356 |
Net Asset Value Per Share— | |
Investor Shares | $27.76 |
| |
| |
Admiral Shares—Net Assets | |
Applicable to 28,630,761 outstanding $.001 |
par value shares of beneficial interest | |
(unlimited authorization) | 3,391,674 |
Net Asset Value Per Share— | |
Admiral Shares | $118.46 |
| |
| |
Institutional Shares—Net Assets | |
Applicable to 52,367,284 outstanding $.001 |
par value shares of beneficial interest | |
(unlimited authorization) | 960,116 |
Net Asset Value Per Share— | |
Institutional Shares | $18.33 |
| |
| |
ETF Shares—Net Assets | |
Applicable to 20,500,050 outstanding $.001 |
par value shares of beneficial interest | |
(unlimited authorization) | 1,712,746 |
Net Asset Value Per Share— | |
ETF Shares | $83.55 |
• | See Note A in Notes to Financial Statements. |
^ | Part of security position is on loan to broker-dealers. See Note E in Notes to Financial Statements. |
1 | Affiliated money market fund available only to Vanguard funds and certain trusts and accounts managed by Vanguard. Rate shown is the 7-day yield. |
2 | See Note C in Notes to Financial Statements for the tax-basis components of net assets. |
13
Statement of Operations | |
| |
| Year Ended |
| January 31, 2007 |
| ($000) |
Investment Income | |
Income | |
Dividends | 232,616 |
Interest1 | 10,418 |
Security Lending | 199 |
Total Income | 243,233 |
Expenses | |
The Vanguard Group—Note B | |
Investment Advisory Services | 244 |
Management and Administrative | |
Investor Shares | 9,500 |
Admiral Shares | 2,881 |
Institutional Shares | 492 |
ETF Shares | 1,136 |
Marketing and Distribution | |
Investor Shares | 1,063 |
Admiral Shares | 400 |
Institutional Shares | 158 |
ETF Shares | 274 |
Custodian Fees | 161 |
Auditing Fees | 25 |
Shareholders’ Reports | |
Investor Shares | 187 |
Admiral Shares | 8 |
Institutional Shares | 3 |
ETF Shares | 12 |
Trustees’ Fees and Expenses | 12 |
Total Expenses | 16,556 |
Net Investment Income | 226,677 |
Realized Net Gain (Loss) | |
Investment Securities Sold | 499,772 |
Capital Gain Distributions Received | 117,789 |
Realized Net Gain (Loss) | 617,561 |
Change in Unrealized Appreciation (Depreciation) of Investment Securities | 2,406,468 |
Net Increase (Decrease) in Net Assets Resulting from Operations | 3,250,706 |
1 | Interest income from an affiliated company of the fund was $10,343,000. |
14
Statement of Changes in Net Assets | | |
| | |
| Year Ended January 31, |
| 2007 | 2006 |
| ($000) | ($000) |
Increase (Decrease) in Net Assets | | |
Operations | | |
Net Investment Income | 226,677 | 198,039 |
Realized Net Gain (Loss) | 617,561 | 180,856 |
Change in Unrealized Appreciation (Depreciation) | 2,406,468 | 1,448,924 |
Net Increase (Decrease) in Net Assets Resulting from Operations | 3,250,706 | 1,827,819 |
Distributions | | |
Net Investment Income | | |
Investor Shares | (121,669) | (130,616) |
Admiral Shares | (59,953) | (45,987) |
Institutional Shares | (17,265) | (13,886) |
ETF Shares | (30,789) | (10,432) |
Realized Capital Gain1 | | |
Investor Shares | (94,471) | (121,441) |
Admiral Shares | (46,021) | (42,265) |
Institutional Shares | (13,057) | (12,188) |
ETF Shares | (23,098) | (9,525) |
Return of Capital | | |
Investor Shares | (25,625) | (15,207) |
Admiral Shares | (12,511) | (5,302) |
Institutional Shares | (3,585) | (1,595) |
ETF Shares | (6,407) | (1,201) |
Total Distributions | (454,451) | (409,645) |
Capital Share Transactions—Note F | | |
Investor Shares | 596,373 | (571,751) |
Admiral Shares | 650,765 | 815,202 |
Institutional Shares | 182,463 | 184,704 |
ETF Shares | 471,824 | 602,492 |
Net Increase (Decrease) from Capital Share Transactions | 1,901,425 | 1,030,647 |
Total Increase (Decrease) | 4,697,680 | 2,448,821 |
Net Assets | | |
Beginning of Period | 8,194,212 | 5,745,391 |
End of Period2 | 12,891,892 | 8,194,212 |
1 | Includes fiscal 2007 and 2006 short-term gain distributions totaling $6,611,000 and $5,807,000, respectively. Short-term gain distributions are treated as ordinary income dividends for tax purposes. |
2 | Net Assets–End of Period includes undistributed (overdistributed) net investment income of ($10,041,000) and ($7,042,000). |
15
Financial Highlights
REIT Index Fund Investor Shares | | | | | |
| | | | | |
| | | | | |
| | | Year Ended January 31, |
For a Share Outstanding Throughout Each Period | 2007 | 2006 | 2005 | 2004 | 2003 |
Net Asset Value, Beginning of Period | $21.29 | $17.20 | $15.83 | $11.52 | $12.10 |
Investment Operations | | | | | |
Net Investment Income | .530 | .562 | .563 | .579 | .606 |
Net Realized and Unrealized Gain (Loss) on Investments1 | 7.000 | 4.692 | 1.759 | 4.511 | (.426) |
Total from Investment Operations | 7.530 | 5.254 | 2.322 | 5.090 | .180 |
Distributions | | | | | |
Dividends from Net Investment Income | (.534) | (.568) | (.565) | (.678) | (.667) |
Distributions from Realized Capital Gains | (.413) | (.530) | (.387) | — | — |
Return of Capital | (.113) | (.066) | — | (.102) | (.093) |
Total Distributions | (1.060) | (1.164) | (.952) | (.780) | (.760) |
Net Asset Value, End of Period | $27.76 | $21.29 | $17.20 | $15.83 | $11.52 |
| | | | | |
Total Return2 | 36.32% | 31.43% | 14.78% | 45.39% | 1.20% |
| | | | | |
Ratios/Supplemental Data | | | | | |
Net Assets, End of Period (Millions) | $6,827 | $4,727 | $4,311 | $3,383 | $1,734 |
Ratio of Total Expenses to Average Net Assets | 0.21% | 0.21% | 0.21% | 0.24% | 0.27% |
Ratio of Net Investment Income to Average Net Assets | 2.27% | 2.91% | 3.44% | 4.10% | 4.90% |
Portfolio Turnover Rate3 | 11% | 17% | 13% | 7% | 12% |
| | | | | | | |
1 | Includes increases from redemption fees of $0.00, $0.01, $0.01, $0.00, and $0.01. |
2 | Total returns do not reflect the 1% fee assessed on redemptions of shares held for less than one year. |
3 | Excludes the value of portfolio securities received or delivered as a result of in-kind purchases or redemptions of the fund’s capital shares, including ETF Creation Units. |
16
REIT Index Fund Admiral Shares | | | | | |
| | | | | |
| | | | | |
| | | Year Ended January 31, |
For a Share Outstanding Throughout Each Period | 2007 | 2006 | 2005 | 2004 | 2003 |
Net Asset Value, Beginning of Period | $90.82 | $73.40 | $67.56 | $49.14 | $51.65 |
Investment Operations | | | | | |
Net Investment Income | 2.328 | 2.460 | 2.437 | 2.508 | 2.619 |
Net Realized and Unrealized Gain (Loss) on Investments1 | 29.903 | 19.993 | 7.494 | 19.279 | (1.854) |
Total from Investment Operations | 32.231 | 22.453 | 9.931 | 21.787 | .765 |
Distributions | | | | | |
Dividends from Net Investment Income | (2.341) | (2.488) | (2.439) | (2.931) | (2.878) |
Distributions from Realized Capital Gains | (1.761) | (2.258) | (1.652) | — | — |
Return of Capital | (.489) | (.287) | — | (.436) | (.397) |
Total Distributions | (4.591) | (5.033) | (4.091) | (3.367) | (3.275) |
Net Asset Value, End of Period | $118.46 | $90.82 | $73.40 | $67.56 | $49.14 |
| | | | | |
Total Return2 | 36.46% | 31.49% | 14.82% | 45.57% | 1.19% |
| | | | | |
Ratios/Supplemental Data | | | | | |
Net Assets, End of Period (Millions) | $3,392 | $2,025 | $938 | $733 | $320 |
Ratio of Total Expenses to Average Net Assets | 0.14% | 0.14% | 0.16% | 0.18% | 0.21% |
Ratio of Net Investment Income to Average Net Assets | 2.34% | 2.98% | 3.49% | 4.16% | 4.99% |
Portfolio Turnover Rate3 | 11% | 17% | 13% | 7% | 12% |
| | | | | | | |
1 | Includes increases from redemption fees of $0.02, $0.02, $0.04, $0.01, and $0.03. |
2 | Total returns do not reflect the 1% fee assessed on redemptions of shares held for less than one year. |
3 | Excludes the value of portfolio securities received or delivered as a result of in-kind purchases or redemptions of the fund’s capital shares, including ETF Creation Units. |
17
REIT Index Fund Institutional Shares | | | | |
| | | | Dec. 2, |
| | | | 20031 to |
| Year Ended January 31, | Jan. 31, |
For a Share Outstanding Throughout Each Period | 2007 | 2006 | 2005 | 2004 |
Net Asset Value, Beginning of Period | $14.06 | $11.36 | $10.46 | $10.00 |
Investment Operations | | | | |
Net Investment Income | .366 | .385 | .381 | .065 |
Net Realized and Unrealized Gain (Loss) on Investments | 4.621 | 3.099 | 1.156 | .575 |
Total from Investment Operations | 4.987 | 3.484 | 1.537 | .640 |
Distributions | | | | |
Dividends from Net Investment Income | (.368) | (.389) | (.381) | (.157) |
Distributions from Realized Capital Gains | (.273) | (.350) | (.256) | — |
Return of Capital | (.076) | (.045) | — | (.023) |
Total Distributions | (.717) | (.784) | (.637) | (.180) |
Net Asset Value, End of Period | $18.33 | $14.06 | $11.36 | $10.46 |
| | | | |
Total Return2 | 36.45% | 31.58% | 14.81% | 6.49% |
| | | | |
Ratios/Supplemental Data | | | | |
Net Assets, End of Period (Millions) | $960 | $571 | $297 | $63 |
Ratio of Total Expenses to Average Net Assets | 0.10% | 0.10% | 0.13% | 0.15%* |
Ratio of Net Investment Income to Average Net Assets | 2.38% | 3.02% | 3.52% | 4.19%* |
Portfolio Turnover Rate3 | 11% | 17% | 13% | 7% |
2 | Total returns do not reflect the 1% fee assessed on redemptions of shares held for less than one year. |
3 | Excludes the value of portfolio securities received or delivered as a result of in-kind purchases or redemptions of the fund’s capital shares, including ETF Creation Units. |
18
REIT Index Fund ETF Shares | | | |
| | | |
| | | Sept. 23, |
| Year Ended | 20041 to |
| January 31, | Jan. 31, |
For a Share Outstanding Throughout Each Period | 2007 | 2006 | 2005 |
Net Asset Value, Beginning of Period | $64.07 | $51.77 | $49.41 |
Investment Operations | | | |
Net Investment Income | 1.654 | 1.745 | .665 |
Net Realized and Unrealized Gain (Loss) on Investments2 | 21.080 | 14.116 | 2.965 |
Total from Investment Operations | 22.734 | 15.861 | 3.630 |
Distributions | | | |
Dividends from Net Investment Income | (1.665) | (1.764) | (.682) |
Distributions from Realized Capital Gains | (1.242) | (1.594) | (.588) |
Return of Capital | (.347) | (.203) | — |
Total Distributions | (3.254) | (3.561) | (1.270) |
Net Asset Value, End of Period | $83.55 | $64.07 | $51.77 |
| | | |
Total Return | 36.48% | 31.54% | 7.13% |
| | | |
Ratios/Supplemental Data | | | |
Net Assets, End of Period (Millions) | $1,713 | $871 | $198 |
Ratio of Total Expenses to Average Net Assets | 0.12% | 0.12% | 0.18%* |
Ratio of Net Investment Income to Average Net Assets | 2.36% | 3.00% | 3.47%* |
Portfolio Turnover Rate3 | 11% | 17% | 13% |
2 | Includes increases from redemption fees of $0.01, $0.01, and $0.00. |
3 | Excludes the value of portfolio securities received or delivered as a result of in-kind purchases or redemptions of the fund’s capital shares, including ETF Creation Units. |
See accompanying Notes, which are an integral part of the Financial Statements.
19
Notes to Financial Statements
Vanguard REIT Index Fund is registered under the Investment Company Act of 1940 as an open-end investment company, or mutual fund. The fund files reports with the SEC under the company name Vanguard Specialized Funds. The fund offers four classes of shares: Investor Shares, Admiral Shares, Institutional Shares, and ETF Shares. Investor Shares are available to any investor who meets the fund’s minimum purchase requirements. Admiral Shares are designed for investors who meet certain administrative, service, tenure, and account-size criteria. Institutional Shares are designed for investors who meet certain administrative and service criteria and invest a minimum of $5 million. ETF Shares are listed for trading on the American Stock Exchange; they can be purchased and sold through a broker.
A. The following significant accounting policies conform to generally accepted accounting principles for U.S. mutual funds. The fund consistently follows such policies in preparing its financial statements.
1. Security Valuation: Securities are valued as of the close of trading on the New York Stock Exchange (generally 4:00 p.m. Eastern time) on the valuation date. Equity securities are valued at the latest quoted sales prices or official closing prices taken from the primary market in which each security trades; such securities not traded on the valuation date are valued at the mean of the latest quoted bid and asked prices. Securities for which market quotations are not readily available, or whose values have been materially affected by events occurring before the fund’s pricing time but after the close of the securities’ primary markets, are valued by methods deemed by the board of trustees to represent fair value. Investments in Vanguard Market Liquidity Fund are valued at that fund’s net asset value.
2. Federal Income Taxes: The fund intends to continue to qualify as a regulated investment company and distribute all of its taxable income. Accordingly, no provision for federal income taxes is required in the financial statements.
3. Distributions: Distributions to shareholders are recorded on the ex-dividend date. Quarterly income dividends declared by the fund are reallocated at fiscal year-end to ordinary income, capital gain, and return of capital to reflect their tax character.
4. Security Lending: The fund may lend its securities to qualified institutional borrowers to earn additional income. Security loans are required to be secured at all times by collateral at least equal to the market value of securities loaned. The fund invests cash collateral received in Vanguard Market Liquidity Fund, and records a liability for the return of the collateral, during the period the securities are on loan. Security lending income represents the income earned on investing cash collateral, less expenses associated with the loan.
5. Other: Distributions received from REITs are recorded on the ex-dividend date. Each REIT reports annually the tax character of its distributions. Dividend income, capital gain distributions received, and unrealized appreciation (depreciation) reflect the amounts of taxable income, capital gain, and return of capital reported by the REITs, and management’s estimates of such amounts for REIT distributions for which actual information has not been reported. Interest income includes income distributions received from Vanguard Market Liquidity Fund and is accrued daily. Security transactions are accounted for on the date securities are bought or sold. Costs used to determine realized gains (losses) on the sale of investment securities are those of the specific securities sold. Fees assessed on redemptions of capital shares are credited to paid-in capital.
20
Each class of shares has equal rights as to assets and earnings, except that each class separately bears certain class-specific expenses related to maintenance of shareholder accounts (included in Management and Administrative expenses) and shareholder reporting. Marketing and distribution expenses are allocated to each class of shares based on a method approved by the board of trustees. Income, other non-class-specific expenses, and gains and losses on investments are allocated to each class of shares based on its relative net assets.
B. The Vanguard Group furnishes at cost investment advisory, corporate management, administrative, marketing, and distribution services. The costs of such services are allocated to the fund under methods approved by the board of trustees. The fund has committed to provide up to 0.40% of its net assets in capital contributions to Vanguard. At January 31, 2007, the fund had contributed capital of $1,109,000 to Vanguard (included in Other Assets), representing 0.01% of the fund’s net assets and 1.11% of Vanguard’s capitalization. The fund’s trustees and officers are also directors and officers of Vanguard.
C. Distributions are determined on a tax basis and may differ from net investment income and realized capital gains for financial reporting purposes. Differences may be permanent or temporary. Permanent differences are reclassified among capital accounts in the financial statements to reflect their tax character. Temporary differences arise when certain items of income, expense, gain, or loss are recognized in different periods for financial statement and tax purposes; these differences will reverse at some time in the future. Differences in classification may also result from the treatment of short-term gains as ordinary income for tax purposes.
During the year ended January 31, 2007, the fund realized $443,872,000 of net capital gains resulting from in-kind redemptions—in which shareholders exchanged fund shares for securities held by the fund rather than for cash. Because such gains are not taxable to the fund, and are not distributed to shareholders, they have been reclassified from overdistributed net realized gains to paid-in capital.
For tax purposes, at January 31, 2007, the fund had no ordinary income and no long-term capital gains available for distribution.
At January 31, 2007, the cost of investment securities for tax purposes was $7,828,059,000. Net unrealized appreciation of investment securities for tax purposes was $5,068,549,000, consisting of unrealized gains of $5,112,690,000 on securities that had risen in value since their purchase and $44,141,000 in unrealized losses on securities that had fallen in value since their purchase.
D. During the year ended January 31, 2007, the fund purchased $3,753,651,000 of investment securities and sold $2,050,926,000 of investment securities other than temporary cash investments.
E. The market value of securities on loan to broker-dealers at January 31, 2007, was $46,175,000, for which the fund received cash collateral of $47,692,000.
21
F. Capital share transactions for each class of shares were:
| | | Year Ended January 31, |
| | 2007 | | 2006 |
| Amount | Shares | Amount | Shares |
| ($000) | (000) | ($000) | (000) |
Investor Shares | | | | |
Issued | 1,731,399 | 72,687 | 1,162,085 | 60,470 |
Issued in Lieu of Cash Distributions | 224,270 | 9,464 | 244,346 | 12,743 |
Redeemed1 | (1,359,296) | (58,310) | (1,978,182) | (101,814) |
Net Increase (Decrease)—Investor Shares | 596,373 | 23,841 | (571,751) | (28,601) |
Admiral Shares | | | | |
Issued | 1,081,669 | 10,634 | 1,295,720 | 15,370 |
Issued in Lieu of Cash Distributions | 99,808 | 984 | 77,443 | 933 |
Redeemed1 | (530,712) | (5,288) | (557,961) | (6,787) |
Net Increase (Decrease)—Admiral Shares | 650,765 | 6,330 | 815,202 | 9,516 |
Institutional Shares | | | | |
Issued | 286,029 | 18,678 | 283,189 | 21,978 |
Issued in Lieu of Cash Distributions | 29,962 | 1,909 | 24,652 | 1,932 |
Redeemed1 | (133,528) | (8,807) | (123,137) | (9,506) |
Net Increase (Decrease)—Institutional Shares | 182,463 | 11,780 | 184,704 | 14,404 |
ETF Shares | | | | |
Issued | 1,432,154 | 20,104 | 657,191 | 10,668 |
Issued in Lieu of Cash Distributions | — | — | — | — |
Redeemed1 | (960,330) | (13,200) | (54,699) | (900) |
Net Increase (Decrease)—ETF Shares | 471,824 | 6,904 | 602,492 | 9,768 |
G. In June 2006, the Financial Accounting Standards Board issued Interpretation No. 48 (“FIN 48”),”Accounting for Uncertainty in Income Taxes.” FIN 48 establishes the minimum threshold for recognizing, and a system for measuring, the benefits of tax-return positions in financial statements. FIN 48 will be effective for the fund’s fiscal year ending January 31, 2008. Management is in the process of analyzing the fund’s tax positions for purposes of implementing FIN 48; based on the analysis completed to date, management does not believe the adoption of FIN 48 will result in any material impact to the fund’s financial statements.
1 | Net of redemption fees of $1,769,000 and $2,336,000 (fund totals). |
22
Report of Independent Registered Public Accounting Firm
To the Trustees of Vanguard Specialized Funds and Shareholders of Vanguard REIT Index Fund:
In our opinion, the accompanying statement of net assets and the related statements of operations and of changes in net assets and the financial highlights present fairly, in all material respects, the financial position of Vanguard REIT Index Fund (one of the funds constituting Vanguard Specialized Funds, hereafter referred to as the “Fund”) at January 31, 2007, the results of its operations for the year then ended, the changes in its net assets for each of the two years in the period then ended and the financial highlights for each of the periods indicated, in conformity with accounting principles generally accepted in the United States of America. These financial statements and financial highlights (hereafter referred to as “financial statements”) are the responsibility of the Fund’s management; our responsibility is to express an opinion on these financial statements based on our audits. We conducted our audits of these financial statements in accordance with the standards of the Public Company Accounting Oversight Board (United States). Those standards require that we plan and perform the audit to obtain reasonable assurance about whether the financial statements are free of material misstatement. An audit includes examining, on a test basis, evidence supporting the amounts and disclosures in the financial statements, assessing the accounting principles used and significant estimates made by management, and evaluating the overall financial statement presentation. We believe that our audits, which included confirmation of securities at January 31, 2007 by correspondence with the custodian and by agreement to the underlying ownership records for Vanguard Market Liquidity Fund, provide a reasonable basis for our opinion.
PricewaterhouseCoopers LLP
Philadelphia, Pennsylvania
March 9, 2007
Special 2006 tax information (unaudited) for Vanguard REIT Index Fund
This information for the fiscal year ended January 31, 2007, is included pursuant to provisions of the Internal Revenue Code.
The fund distributed $170,036,000 as capital gain dividends (from net long-term capital gains) to shareholders during the fiscal year. Of the $170,036,000 capital gain dividends, the fund designates $136,870,000 as a 15% rate gain distribution and $33,166,000 as a 25% rate gain distribution.
The fund distributed $8,407,000 of qualified dividend income to shareholders during the fiscal year.
23
Your Fund’s After-Tax Returns
This table presents returns for your fund both before and after taxes. The after-tax returns are shown in two ways: (1) assuming that an investor owned the fund during the entire period and paid taxes on the fund’s distributions, and (2) assuming that an investor paid taxes on the fund’s distributions and sold all shares at the end of each period.
Calculations are based on the highest individual federal income tax and capital gains tax rates in effect at the times of the distributions and the hypothetical sales. State and local taxes were not considered. After-tax returns reflect any qualified dividend income, using actual prior-year figures and estimates for 2007. (In the example, returns after the sale of fund shares may be higher than those assuming no sale. This occurs when the sale would have produced a capital loss. The calculation assumes that the investor received a tax deduction for the loss.)
The table shows returns for Investor Shares only; returns for other share classes will differ. Please note that your actual after-tax returns will depend on your tax situation and may differ from those shown. Also note that if you own the fund in a tax-deferred account, such as an individual retirement account or a 401(k) plan, this information does not apply to you. Such accounts are not subject to current taxes.
Finally, keep in mind that a fund’s performance—whether before or after taxes—does not guarantee future results.
Average Annual Total Returns: REIT Index Fund Investor Shares1 | | | |
Periods Ended January 31, 2007 | | | |
| One | Five | Ten |
| Year | Years | Years |
Returns Before Taxes | 36.32% | 24.79% | 15.10% |
Returns After Taxes on Distributions | 34.87 | 22.78 | 12.92 |
Returns After Taxes on Distributions and Sale of Fund Shares | 23.81 | 20.68 | 11.93 |
1 | Total return figures do not reflect the 1% fee assessed on redemptions of shares held for less than one year. |
24
About Your Fund’s Expenses
As a shareholder of the fund, you incur ongoing costs, which include costs for portfolio management, administrative services, and shareholder reports (like this one), among others. Operating expenses, which are deducted from a fund’s gross income, directly reduce the investment return of the fund.
A fund’s expenses are expressed as a percentage of its average net assets. This figure is known as the expense ratio. The following examples are intended to help you understand the ongoing costs (in dollars) of investing in your fund and to compare these costs with those of other mutual funds. The examples are based on an investment of $1,000 made at the beginning of the period shown and held for the entire period.
The table below illustrates your fund’s costs in two ways:
• Based on actual fund return. This section helps you to estimate the actual expenses that you paid over the period. The “Ending Account Value” shown is derived from the fund’s actual return, and the third column shows the dollar amount that would have been paid by an investor who started with $1,000 in the fund. You may use the information here, together with the amount you invested, to estimate the expenses that you paid over the period.
To do so, simply divide your account value by $1,000 (for example, an $8,600 account value divided by $1,000 = 8.6), then multiply the result by the number given for your fund under the heading “Expenses Paid During Period.”
• Based on hypothetical 5% yearly return. This section is intended to help you compare your fund’s costs with those of other mutual funds. It assumes that the fund had a yearly return of 5% before expenses, but that the expense ratio is unchanged. In this case—because the return used is not the fund’s actual return—the results do not apply to your investment. The example is useful in making comparisons because the Securities and Exchange Commission requires all mutual funds to calculate expenses based on a 5% return. You can assess your fund’s costs by comparing this hypothetical example with the hypothetical examples that appear in shareholder reports of other funds.
Six Months Ended January 31, 2007 | | | |
| Beginning | Ending | Expenses |
| Account Value | Account Value | Paid During |
REIT Index Fund | 7/31/2006 | 1/31/2007 | Period1 |
Based on Actual Fund Return | | | |
Investor Shares | $1,000.00 | $1,251.08 | $1.13 |
Admiral Shares | 1,000.00 | 1,251.46 | 0.74 |
Institutional Shares | 1,000.00 | 1,251.35 | 0.51 |
ETF Shares | 1,000.00 | 1,251.54 | 0.62 |
Based on Hypothetical 5% Yearly Return | | | |
Investor Shares | $1,000.00 | $1,024.20 | $1.02 |
Admiral Shares | 1,000.00 | 1,024.55 | 0.66 |
Institutional Shares | 1,000.00 | 1,024.75 | 0.46 |
ETF Shares | 1,000.00 | 1,024.65 | 0.56 |
1 | These calculations are based on expenses incurred in the most recent six-month period. The fund’s annualized six-month expense ratios for that period are 0.20% for Investor Shares, 0.13% for Admiral Shares, 0.09% for Institutional Shares, and 0.11% for ETF Shares. The dollar amounts shown as “Expenses Paid” are equal to the annualized expense ratio multiplied by the average account value over the period, multiplied by the number of days in the most recent six-month period, then divided by the number of days in the most recent 12-month period. |
25
Note that the expenses shown in the table on page 25 are meant to highlight and help you compare ongoing costs only; they do not include your fund’s low-balance fee or the 1% redemption fee that applies to shares held for less than one year. These fees are fully described in the prospectus. If these fees were applied to your account, your costs would be higher. Your fund does not carry a “sales load.”
The calculations assume no shares were bought or sold during the period. Your actual costs may have been higher or lower, depending on the amount of your investment and the timing of any purchases or redemptions.
You can find more information about the fund’s expenses, including annual expense ratios, in the Financial Statements section of this report. For additional information on operating expenses and other shareholder costs, please refer to the appropriate fund prospectus.
26
Glossary
Beta. A measure of the magnitude of a fund’s past share-price fluctuations in relation to the ups and downs of a given market index. The index is assigned a beta of 1.00. Compared with a given index, a fund with a beta of 1.20 typically would have seen its share price rise or fall by 12% when the index rose or fell by 10%. A fund’s beta should be reviewed in conjunction with its R-squared (see definition below). The lower the R-squared, the less correlation there is between the fund and the index, and the less reliable beta is as an indicator of volatility.
Earnings Growth Rate. The average annual rate of growth in earnings over the past five years for the stocks now in a fund.
Expense Ratio. The percentage of a fund’s average net assets used to pay its annual administrative and advisory expenses. These expenses directly reduce returns to investors.
Foreign Holdings. The percentage of a fund represented by stocks or depositary receipts of companies based outside the United States.
Median Market Cap. An indicator of the size of companies in which a fund invests; the midpoint of market capitalization (market price x shares outstanding) of a fund’s stocks, weighted by the proportion of the fund’s assets invested in each stock. Stocks representing half of the fund’s assets have market capitalizations above the median, and the rest are below it.
Price/Book Ratio. The share price of a stock divided by its net worth, or book value, per share. For a fund, the weighted average price/book ratio of the stocks it holds.
Price/Earnings Ratio. The ratio of a stock’s current price to its per-share earnings over the past year. For a fund, the weighted average P/E of the stocks it holds. P/E is an indicator of market expectations about corporate prospects; the higher the P/E, the greater the expectations for a company’s future growth.
R-Squared. A measure of how much of a fund’s past returns can be explained by the returns from the market in general, as measured by a given index. If a fund’s total returns were precisely synchronized with an index’s returns, its R-squared would be 1.00. If the fund’s returns bore no relationship to the index’s returns, its R-squared would be 0.
Return on Equity. The annual average rate of return generated by a company during the past five years for each dollar of shareholder’s equity (net income divided by shareholder’s equity). For a fund, the weighted average return on equity for the companies whose stocks it holds.
Short-Term Reserves. The percentage of a fund invested in highly liquid, short-term securities that can be readily converted to cash.
Turnover Rate. An indication of the fund’s trading activity. Funds with high turnover rates incur higher transaction costs and may be more likely to distribute capital gains (which may be taxable to investors). The turnover rate excludes in-kind transactions, which have minimal impact on costs.
Yield. A snapshot of the level of dividends, interest, capital gains distributions, and return-of-capital distributions received by the fund. The index yield is based on the current annualized rate of dividends and other distributions provided by securities in the index.
27
The People Who Govern Your Fund
The trustees of your mutual fund are there to see that the fund is operated and managed in your best interests since, as a shareholder, you are a part owner of the fund. Your fund’s trustees also serve on the board of directors of The Vanguard Group, Inc., which is owned by the Vanguard funds and provides services to them on an at-cost basis.
A majority of Vanguard’s board members are independent, meaning that they have no affiliation with Vanguard or the funds they oversee, apart from the sizable personal investments they have made as private individuals.
Our independent board members bring distinguished backgrounds in business, academia, and public service to their task of working with Vanguard officers to establish the policies and oversee the activities of the funds. Among board members’ responsibilities are selecting investment advisors for the funds; monitoring fund operations, performance, and costs; reviewing contracts; nominating and selecting new trustees/directors; and electing Vanguard officers.
Each trustee serves a fund until its termination; or until the trustee’s retirement, resignation, or death; or otherwise as specified in the fund’s organizational documents. Any trustee may be removed at a shareholders’ meeting by a vote representing two-thirds of the net asset value of all shares of the fund together with shares of other Vanguard funds organized within the same trust. The table on these two pages shows information for each trustee and executive officer of the fund. The mailing address of the trustees and officers is P.O. Box 876, Valley Forge, PA 19482.
Chairman of the Board, Chief Executive Officer, and Trustee |
| |
John J. Brennan1 | |
Born 1954 | Principal Occupation(s) During the Past Five Years: Chairman of the Board, Chief |
Trustee since May 1987; | Executive Officer, and Director/Trustee of The Vanguard Group, Inc., and of each |
Chairman of the Board and | of the investment companies served by The Vanguard Group. |
Chief Executive Officer | |
146 Vanguard Funds Overseen |
| |
Independent Trustees | |
| |
Charles D. Ellis | |
Born 1937 | Principal Occupation(s) During the Past Five Years: Applecore Partners (pro bono ventures |
Trustee since January 2001 | in education); Senior Advisor to Greenwich Associates (international business strategy |
146 Vanguard Funds Overseen | consulting); Successor Trustee of Yale University; Overseer of the Stern School of Business |
| at New York University; Trustee of the Whitehead Institute for Biomedical Research. |
| |
Rajiv L. Gupta | |
Born 1945 | Principal Occupation(s) During the Past Five Years: Chairman and Chief Executive Officer |
Trustee since December 20012 | of Rohm and Haas Co. (chemicals); Board Member of the American Chemistry Council; |
146 Vanguard Funds Overseen | Director of Tyco International, Ltd. (diversified manufacturing and services) (since 2005); |
| Trustee of Drexel University and of the Chemical Heritage Foundation. |
| |
Amy Gutmann | |
Born 1949 | Principal Occupation(s) During the Past Five Years: President of the University of |
Trustee since June 2006 | Pennsylvania since 2004; Professor in the School of Arts and Sciences, Annenberg School |
146 Vanguard Funds Overseen | for Communication, and Graduate School of Education of the University of Pennsylvania |
| since 2004; Provost (2001–2004) and Laurance S. Rockefeller Professor of Politics and the |
| University Center for Human Values (1990–2004), Princeton University; Director of Carnegie |
| Corporation of New York and of Philadelphia 2016 (since 2005) and of Schuylkill River |
| Development Corporation and Greater Philadelphia Chamber of Commerce (since 2004). |
JoAnn Heffernan Heisen | |
Born 1950 | Principal Occupation(s) During the Past Five Years: Corporate Vice President and Chief |
Trustee since July 1998 | Global Diversity Officer (since January 2006), Vice President and Chief Information |
146 Vanguard Funds Overseen | Officer (1997–2005), and Member of the Executive Committee of Johnson & Johnson |
| (pharmaceuticals/consumer products); Director of the University Medical Center at |
| Princeton and Women’s Research and Education Institute. |
| |
André F. Perold | |
Born 1952 | Principal Occupation(s) During the Past Five Years: George Gund Professor of Finance and |
Trustee since December 2004 | Banking, Harvard Business School (since 2000); Senior Associate Dean, Director of Faculty |
146 Vanguard Funds Overseen | Recruiting, and Chair of Finance Faculty, Harvard Business School; Director and Chairman |
| of UNX, Inc. (equities trading firm) (since 2003); Director of registered investment |
| companies advised by Merrill Lynch Investment Managers and affiliates (1985–2004), |
| Genbel Securities Limited (South African financial services firm) (1999–2003), Gensec |
| Bank (1999–2003), Sanlam, Ltd. (South African insurance company) (2001–2003), and |
| Stockback, Inc. (credit card firm) (2000–2002). |
| |
Alfred M. Rankin, Jr. | |
Born 1941 | Principal Occupation(s) During the Past Five Years: Chairman, President, Chief Executive |
Trustee since January 1993 | Officer, and Director of NACCO Industries, Inc. (forklift trucks/housewares/ lignite); |
146 Vanguard Funds Overseen | Director of Goodrich Corporation (industrial products/aircraft systems and services). |
| |
J. Lawrence Wilson | |
Born 1936 | Principal Occupation(s) During the Past Five Years: Retired Chairman and Chief Executive |
Trustee since April 1985 | Officer of Rohm and Haas Co. (chemicals); Director of Cummins Inc. (diesel engines), |
146 Vanguard Funds Overseen | MeadWestvaco Corp. (packaging products), and AmerisourceBergen Corp. (pharmaceutical |
| distribution); Trustee of Vanderbilt University and of Culver Educational Foundation. |
| |
Executive Officers1 | |
| |
Heidi Stam | |
Born 1956 | Principal Occupation(s) During the Past Five Years: Managing Director of The Vanguard |
Secretary since July 2005 | Group, Inc., since 2006; General Counsel of The Vanguard Group since 2005; Secretary |
146 Vanguard Funds Overseen | of The Vanguard Group, and each of the investment companies served by The Vanguard |
| Group, since 2005; Principal of The Vanguard Group (1997-2006). |
| |
Thomas J. Higgins | |
Born 1957 | Principal Occupation(s) During the Past Five Years: Principal of The Vanguard Group, Inc.; |
Treasurer since July 1998 | Treasurer of each of the investment companies served by The Vanguard Group. |
146 Vanguard Funds Overseen | |
| |
Vanguard Senior Management Team |
| |
R. Gregory Barton | Kathleen C. Gubanich | Michael S. Miller |
Mortimer J. Buckley | Paul A. Heller | Ralph K. Packard |
James H. Gately | F. William McNabb, III | George U. Sauter |
| |
Founder | |
| |
John C. Bogle | |
Chairman and Chief Executive Officer, 1974–1996 |
1 Officers of the funds are “interested persons” as defined in the Investment Company Act of 1940.
2 December 2002 for Vanguard Equity Income Fund, Vanguard Growth Equity Fund, the Vanguard Municipal Bond Funds, and the Vanguard State Tax-Exempt Funds.
More information about the trustees is in the Statement of Additional Information, available from The Vanguard Group.
| 
|
| P.O. Box 2600 |
| Valley Forge, PA 19482-2600 |
Connect with Vanguard™ > www.vanguard.com
Fund Information > 800-662-7447 | Vanguard, Admiral, Connect with Vanguard, Vanguard ETF |
| and the ship logo are trademarks of The Vanguard Group, |
Direct Investor Account Services > 800-662-2739 | Inc. |
| |
Institutional Investor Services > 800-523-1036 | All other marks are the exclusive property of their |
| respective owners. |
Text Telephone for the | |
Hearing Impaired > 800-952-3335 | All comparative mutual fund data are from Lipper Inc. |
| or Morningstar, Inc., unless otherwise noted. |
| |
| |
| |
This material may be used in conjunction | You can obtain a free copy of Vanguard’s proxy voting |
with the offering of shares of any Vanguard | guidelines by visiting our website, www.vanguard.com, |
fund only if preceded or accompanied by | and searching for “proxy voting guidelines,” or by calling |
the fund’s current prospectus. | Vanguard at 800-662-2739. They are also available from |
| the SEC’s website, www.sec.gov. In addition, you may |
| obtain a free report on how your fund voted the proxies for |
| securities it owned during the 12 months ended June 30. |
| To get the report, visit either www.vanguard.com |
| or www.sec.gov. |
| |
| You can review and copy information about your fund |
| at the SEC’s Public Reference Room in Washington, D.C. |
| To find out more about this public service, call the SEC |
| at 202-551-8090. Information about your fund is also |
| available on the SEC’s website, and you can receive |
| copies of this information, for a fee, by sending a |
| request in either of two ways: via e-mail addressed to |
| publicinfo@sec.gov or via regular mail addressed to the |
| Public Reference Section, Securities and Exchange |
| Commission, Washington, DC 20549-0102. |
| |
| |
| |
| |
| © 2007 The Vanguard Group, Inc. |
| All rights reserved. |
| Vanguard Marketing Corporation, Distributor. |
| |
| Q1230 032007 |
| |
Vanguard® Dividend Growth Fund |
| |
| |
> Annual Report | |
| |
| |
January 31, 2007 | |
| |
| |
| |
| 
|
| |
| |
| |
| |
| |
| |
| |
| |
> Vanguard Dividend Growth Fund returned 17.8% during the 12 months ended January 31, 2007.
> The fund outpaced both its primary benchmark index and the average return of its peer group, benefiting from the strong performance of its holdings in several sectors, particularly industrials and consumer-oriented stocks.
> The U.S. stock market produced healthy gains, shrugging off fears of inflation and concern over the housing industry.
Contents | |
| |
Your Fund’s Total Returns | 1 |
Chairman’s Letter | 2 |
Advisor’s Report | 7 |
Fund Profile | 9 |
Performance Summary | 10 |
Financial Statements | 12 |
Your Fund’s After-Tax Returns | 21 |
About Your Fund’s Expenses | 22 |
Glossary | 24 |
Please note: The opinions expressed in this report are just that—informed opinions. They should not be considered promises or advice. Also, please keep in mind that the information and opinions cover the period through the date on the cover of this report. Of course, the risks of investing in your fund are spelled out in the prospectus.
Your Fund’s Total Returns
Fiscal Year Ended January 31, 2007 | |
| Total |
| Returns |
Vanguard Dividend Growth Fund | 17.8% |
Russell 1000 Index | 14.5 |
Average Large-Cap Core Fund1 | 12.3 |
Dow Jones Wilshire 5000 Index | 14.1 |
Your Fund’s Performance at a Glance |
January 31, 2006–January 31, 2007 |
| | | Distributions Per Share |
| Starting | Ending | Income | Capital |
| Share Price | Share Price | Dividends | Gains |
Vanguard Dividend Growth Fund | $12.75 | $14.74 | $0.26 | $0.00 |
1 Derived from data provided by Lipper Inc.
1

Chairman’s Letter
Dear Shareholder,
Vanguard Dividend Growth Fund returned 17.8% for the fiscal year ended January 31, 2007. The fund made the most of a strong market for dividend-paying stocks, with especially strong selections among industrial and consumer-oriented companies. The fund’s performance outpaced the 12.3% return of the average large-cap core mutual fund and the 14.5% return of the Russell 1000 Index, the fund’s primary unmanaged benchmark.
If you own your fund in a taxable account, you may wish to see page 21 for a report on the fund’s after-tax returns.
Domestic equity markets did well; markets abroad did even better
In the first half of the fiscal year, returns from large-capitalization stocks were virtually flat, while those of small-caps lost some ground. In the second six months, both large and small stocks rebounded, with small-caps faring slightly better. For the 12 months, the broad U.S. stock market gained 14.1%. Despite the weakness in the housing sector, the economy showed remarkable resilience, and corporate profits rose at a fast clip.
Across market capitalizations, value-oriented stocks outpaced their growth-oriented counterparts. International stocks continued to outperform U.S. stocks, as overseas markets—especially European and emerging markets—produced stellar
2
returns. For U.S.-based investors, the dollar’s weakness further enhanced the results of international stocks.
Bond returns were modest as the Fed put rate hikes on hold
In the first six months of the fiscal year, the Federal Reserve Board continued its campaign to keep inflation in check, raising its target for the key federal funds rate by 0.25 percentage point on three occasions (in addition to a 0.25-percentage-point increase the day before the fiscal year began). Then, at its August meeting, the Fed left the target rate unchanged at 5.25%, where it remained through the end of the fiscal period, as inflation fears diminished.
Following the Fed’s pause, the prices of longer-maturity bonds rose faster than those of short-term bonds, reducing their yields more dramatically. Throughout the maturity spectrum, the “yield spread,” or the difference between yields of corporate securities and those of U.S. Treasury securities of comparable maturities, became even tighter. Bonds produced coupon-like returns for the period, with the broad taxable bond market returning 4.3%. Corporate bonds generally outperformed U.S. government issues. The Citigroup 3-Month Treasury Bill Index, a proxy for money market yields, returned 4.9%.
Market Barometer | | | |
| Average Annual Total Returns |
| Periods Ended January 31, 2007 |
| One Year | Three Years | Five Years |
Stocks | | | |
Russell 1000 Index (Large-caps) | 14.5% | 11.0% | 7.5% |
Russell 2000 Index (Small-caps) | 10.4 | 12.6 | 12.0 |
Dow Jones Wilshire 5000 Index (Entire market) | 14.1 | 11.5 | 8.4 |
MSCI All Country World Index ex USA (International) | 19.3 | 21.3 | 18.0 |
| | | |
Bonds | | | |
Lehman Aggregate Bond Index (Broad taxable market) | 4.3% | 3.4% | 4.9% |
Lehman Municipal Bond Index | 4.3 | 4.0 | 5.1 |
Citigroup 3-Month Treasury Bill Index | 4.9 | 3.1 | 2.4 |
| | | |
CPI | | | |
Consumer Price Index | 2.1% | 3.0% | 2.7% |
3
Fund performance was bolstered by stock-picking in several sectors
The Dividend Growth Fund focuses primarily on the stocks of larger, high-quality, dividend-paying companies, but it takes a different approach from that of many income-oriented portfolios. Wellington Management Company, your fund’s advisor, is less concerned with what a company’s dividend is now than with what it is likely to be down the road.
Wellington seeks to identify companies that will increase their earnings over time and that have made a commitment to use some of the cash they generate to raise their dividend payouts. The strategy was particularly successful during the past 12 months: All but two of the companies in the portfolio at the fiscal year-end had raised their dividends. Notable examples included McDonald’s, which announced that it would raise its annual dividend by 49%, and Prudential, which said it would raise its annual dividend by 22%.
The Dividend Growth Fund’s strong performance over the 12 months was broadly based across sectors, led in particular by its industrials and consumer-oriented holdings. Aerospace contractors Lockheed Martin and General Dynamics, benefiting from higher government spending, were at the forefront of the industrials group, which made the largest contribution to the fund’s total return.
The resilience of the U.S. consumer was evident in the returns provided by companies like CBS, Walt Disney, and
Total Returns | | |
Ten Years Ended January 31, 2007 | | |
| Average | Final Value of a $10,000 |
| Annual Return | Initial Investment |
Dividend Growth Fund | 6.8% | $19,375 |
Dividend Growth Spliced Index | 6.4 | 18,582 |
Dividend Growth Spliced Average1 | 5.2 | 16,612 |
Dow Jones Wilshire 5000 Index | 8.3 | 22,235 |
The figures shown represent past performance, which is not a guarantee of future results. (Current performance may be lower or higher than the performance data cited. For performance data current to the most recent month-end, visit our website at www.vanguard.com.) Note, too, that both investment returns and principal value can fluctuate widely, so an investor’s shares, when sold, could be worth more or less than their original cost.
1 Derived from data provided by Lipper Inc.
Note: The footnotes on page 10 describe the composition of the spliced index and peer-group average.
4
Nike. Their gains helped to offset the drag from Carnival, the world’s largest cruise operator and the largest individual detractor from the fund’s return.
Supermarket giant Safeway, which advanced on the strength of upgrades to existing stores and the opening of new ones, was another strong performer.
Other bright spots included a handful of strongly performing pharmaceuticals firms; AT&T, which rallied on news of its agreement to merge with BellSouth; and ExxonMobil, the fund’s largest holding on average over the period. At the end of the calendar year, the energy giant again set a record for the largest annual profit by a U.S. company; it had done the same thing in 2005.
Shortfalls were conspicuous by their absence. The fund earned double-digit returns in every sector. In comparison with the benchmark index, the fund’s weak spots were mostly errors of omission. Financial stocks, for example, represent a much smaller portion of the fund than the index, and as a group they made a proportionately smaller contribution to the fund’s overall return. Bank of America and Citigroup provided strong returns for the fund, but in general, financial companies, particularly the high-flying capital markets firms, did not present the potential for dividend growth and the attractive valuations that the fund seeks.
For more details about the fund’s positioning and performance during the fiscal year, see the Advisor’s Report on page 7.
Expense Ratios1 | | |
Your fund compared with its peer group | | |
| | Average |
| | Large-Cap |
| Fund | Core Fund |
Dividend Growth Fund | 0.38% | 1.35% |
1 Fund expense ratio reflects the 12 months ended January 31, 2007. Peer-group expense ratio is derived from data provided by Lipper Inc. and captures information through year-end 2006.
5
The fund has chalked up a respectable long-term record
It has been a little over four years now since your fund adopted its dividend-growth strategy, after spending its earlier years as a utility fund. During this time, the fund has benefited significantly from the guidance of its advisor, Wellington Management Company. The Dividend Growth Fund is concentrated in a relatively small number of holdings—at the end of the fiscal year, it contained 60 stocks—magnifying the impact of Wellington’s talent and expertise in selecting securities and positioning the portfolio. Since the end of 2002, the Dividend Growth Fund has produced an annualized return of 15.6%, in line with the return of its benchmark and superior to the 12.9% average return of its peer group.
The long-term performance table on page 4 compares the fund’s ten-year results with those of spliced measures of its former and present benchmarks and peer averages, and shows what would have happened to a hypothetical $10,000 investment made at the start of the period. Because of the fund’s December 2002 change in strategy, however, the information is not especially meaningful.
One thing that has remained constant over the ten years is the significant cost advantage your fund enjoys over its rivals, which helps to keep more of its return in your pocket. During the fiscal year, the fund’s expense ratio was nearly a percentage point less than the average for its peers.
Diversification and balance are key to a patient approach
As the new calendar year begins, there is much talk about what to expect from the economy and the financial markets in 2007. For the individual investor, following along as the pundits discuss inflation, the housing industry, or, say, the dollar’s decline (or rise) can be entertaining, but not particularly rewarding.
Our counsel, as always, is to tune out the noise so that you can stay focused on a carefully considered, long-range investment plan, one that is built on a balanced foundation of mutual funds that provide broad exposure to stocks, bonds, and short-term investments. We believe that the Dividend Growth Fund, with its low-cost advantage and its focus on finding companies that are likely to increase their earnings and dividends in the years ahead, can be a valuable part of a diversified long-term portfolio that will help you reach your financial goals.
Thank you for entrusting your assets to Vanguard.
Sincerely,

John J. Brennan
Chairman and Chief Executive Officer
February 16, 2007
6
Advisor’s Report
Vanguard Dividend Growth Fund advanced 17.8% for the 12-month period ended January 31, 2007. This performance compared favorably to the 14.5% return achieved by the Russell 1000 Index and the 12.3% gain of the average large-cap core fund.
The investment environment
The last 12 months have been quite eventful for equity markets. Questions about the health of the global economy and the Middle East turmoil abound. The emergence of the large private equity fund and its growing influence are particularly noteworthy. Continuing growth in private equity capital has spawned a furious takeover environment.
This trend toward privatization has been made possible, in some part, by the low interest rates and tight credit spreads that have defined the global financial landscape. Both the cost of money and the implied cost of risk remain low by historical standards. Even though these dynamics have resulted in some distortions in the market, we remain dedicated to our approach of focusing on companies we think are best positioned to generate long-term dividend growth.
The fund’s successes
The Dividend Growth Fund’s holdings in industrials, health care, and energy stocks boosted performance during the period.
Among the portfolio’s top contributors were Lockheed Martin, Schering-Plough, Nokia, Safeway, Chevron, and CBS.
Only two companies held in the portfolio at the end of the fiscal year failed to increase their dividends during the period. Several holdings raised dividends by more than 30%, including Cardinal Health, CBS, and Linear Technology. Over the period, the average dividend increase in the fund exceeded 15%.
The fund’s shortfalls
Among those individual holdings that detracted from the fund’s performance during the 12 months, one of the most noteworthy was UPS. The company’s stock underperformed in large part because of investors’ concern about the economic environment and how this uncertainty might affect the company’s revenue, especially in the domestic package business. We remain highly confident in UPS’s long-term prospects for solid dividend growth and strong share-price appreciation. UPS raised its dividend payment by more than 15% during our fiscal year.
The fund’s positioning and strategy
Our primary aim is to identify companies that we believe will steadily and reliably increase their dividend payments. We carefully build the portfolio one stock at a time, giving central consideration to
7
each company’s dividend growth prospects. Our industry weightings are a consequence of this process. The fund currently has significant positions in health care, industrials, and both consumer sectors while having less exposure to the utilities, telecommunication services, and materials sectors.
Donald J. Kilbride
Vice President and Portfolio Manager
Wellington Management Company, LLP
February 12, 2007
8
Fund Profile
As of January 31, 2007
Portfolio Characteristics | | |
| | Comparative | Broad |
| Fund | Index1 | Index2 |
Number of Stocks | 60 | 983 | 4,939 |
Median Market Cap | $64.5B | $42.8B | $30.8B |
Price/Earnings Ratio | 15.9x | 17.4x | 17.9x |
Price/Book Ratio | 3.2x | 2.9x | 2.8x |
Yield | 1.7% | 1.8% | 1.7% |
Return on Equity | 21.8% | 18.8% | 17.8% |
Earnings Growth Rate | 17.0% | 18.6% | 18.5% |
Foreign Holdings | 5.0% | 0.0% | 1.1% |
Turnover Rate | 41% | — | — |
Expense Ratio | 0.38% | — | — |
Short-Term Reserves | 2% | — | — |
Sector Diversification (% of portfolio) | |
| | Comparative | Broad |
| Fund | Index1 | Index2 |
Consumer Discretionary | 14% | 11% | 13% |
Consumer Staples | 13 | 9 | 8 |
Energy | 11 | 9 | 9 |
Financials | 13 | 22 | 23 |
Health Care | 16 | 12 | 12 |
Industrials | 15 | 11 | 11 |
Information Technology | 12 | 15 | 15 |
Materials | 1 | 3 | 3 |
Telecommunication | | | |
Services | 2 | 4 | 3 |
Utilities | 1 | 4 | 3 |
Short-Term Reserves | 2% | — | — |
Volatility Measures3 | |
| Fund Versus | Fund Versus |
| Comparative Index1 | Broad Index2 |
R-Squared | 0.85 | 0.81 |
Beta | 0.79 | 0.71 |
Ten Largest Holdings4 (% of total net assets) |
| | |
ExxonMobil Corp. | integrated | |
| oil and gas | 3.3% |
Total SA ADR | integrated | |
| oil and gas | 2.8 |
Chevron Corp. | integrated | |
| oil and gas | 2.8 |
Cardinal Health, Inc. | health care | |
| distributors | 2.6 |
Medtronic, Inc. | health care | |
| equipment | 2.6 |
Microsoft Corp. | systems software | 2.5 |
Citigroup, Inc. | diversified | |
| financial services | 2.5 |
Eli Lilly & Co. | pharmaceuticals | 2.5 |
General Electric Co. | industrial | |
| conglomerates | 2.4 |
Schering-Plough Corp. | pharmaceuticals | 2.3 |
Top Ten | | 26.3% |
Investment Focus
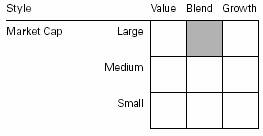
1 Russell 1000 Index.
2 Dow Jones Wilshire 5000 Index.
3 For an explanation of R-squared, beta, and other terms used here, see the Glossary on page 24.
4 “Ten Largest Holdings” excludes any temporary cash investments and equity index products.
9
Performance Summary
All of the returns in this report represent past performance, which is not a guarantee of future results that may be achieved by the fund. (Current performance may be lower or higher than the performance data cited. For performance data current to the most recent month-end, visit our website at www.vanguard.com.) Note, too, that both investment returns and principal value can fluctuate widely, so an investor’s shares, when sold, could be worth more or less than their original cost. The returns shown do not reflect taxes that a shareholder would pay on fund distributions or on the sale of fund shares.
Cumulative Performance: January 31, 1997–January 31, 2007
Initial Investment of $10,000
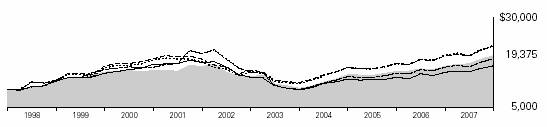
| Average Annual Total Returns | Final Value |
| Periods Ended January 31, 2007 | of a $10,000 |
| One Year | Five Years | Ten Years | Investment |
Dividend Growth Fund1 | 17.84% | 7.56% | 6.84% | $19,375 |
Dow Jones Wilshire 5000 Index | 14.14 | 8.35 | 8.32 | 22,235 |
Russell 1000 Index | 14.48 | 7.51 | 8.23 | 22,047 |
Dividend Growth Spliced Index2 | 14.48 | 4.72 | 6.39 | 18,582 |
Dividend Growth Spliced Average3 | 12.34 | 4.37 | 5.21 | 16,612 |
1 Prior to December 6, 2002, the fund was known as Utilities Income Fund.
2 Prior to December 6, 2002, the comparative benchmark was known as the Utilities Composite Index. The index weightings have been: 40% S&P Utilities Index, 40% S&P Telephone Index, and 20% Lehman Utility Bond Index through April 30, 1999; 63.75% S&P Utilities Index, 21.25% S&P Telephone Index, and 15% Lehman Utility Bond Index through March 31, 2000; 75% S&P Utilities Index, 25% S&P Telephone Index through December 31, 2001; 75% S&P Utilities Index, 25% S&P Integrated Telecommunication Services Index through December 6, 2002; and Russell 1000 Index thereafter.
3 Based on the average utility fund through December 6, 2002, and the average large-cap core fund thereafter. Derived from data provided by Lipper Inc.
10
Fiscal-Year Total Returns (%): January 31, 1997–January 31, 2007
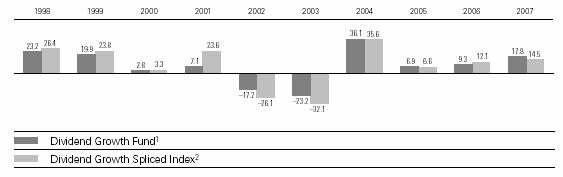
Average Annual Total Returns: Periods Ended December 31, 2006
This table presents average annual total returns through the latest calendar quarter—rather than through the end of the fiscal period. Securities and Exchange Commission rules require that we provide this information.
| Inception Date | One Year | Five Years | Ten Years |
Dividend Growth Fund | 5/15/1992 | 19.58% | 6.56% | 6.87% |
1 Prior to December 6, 2002, the fund was known as Utilities Income Fund.
2 Prior to December 6, 2002, the comparative benchmark was known as the Utilities Composite Index. The index weightings have been: 40% S&P Utilities Index, 40% S&P Telephone Index, and 20% Lehman Utility Bond Index through April 30, 1999; 63.75% S&P Utilities Index, 21.25% S&P Telephone Index, and 15% Lehman Utility Bond Index through March 31, 2000; 75% S&P Utilities Index, 25% S&P Telephone Index through December 31, 2001; 75% S&P Utilities Index, 25% S&P Integrated Telecommunication Services Index through December 6, 2002; and Russell 1000 Index thereafter.
Note: See Financial Highlights table on page 16 for dividend and capital gains information.
11
Financial Statements
Statement of Net Assets
As of January 31, 2007
The fund provides a complete list of its holdings four times in each fiscal year, at the quarter-ends. For the second and fourth fiscal quarters, the lists appear in the fund’s semiannual and annual reports to shareholders. For the first and third fiscal quarters, the fund files the lists with the Securities and Exchange Commission on Form N-Q. Shareholders can look up the fund’s Forms N-Q on the SEC’s website at www.sec.gov. Forms N-Q may also be reviewed and copied at the SEC’s Public Reference Room (see the back cover of this report for further information).
| | Market |
| | Value• |
| Shares | ($000) |
Common Stocks (98.3%) | | |
Consumer Discretionary (14.0%) | |
NIKE, Inc. Class B | 280,900 | 27,756 |
CBS Corp. | 807,600 | 25,173 |
Home Depot, Inc. | 528,600 | 21,535 |
TJX Cos., Inc. | 721,600 | 21,338 |
McDonald’s Corp. | 438,000 | 19,425 |
The Walt Disney Co. | 460,800 | 16,206 |
The Gap, Inc. | 624,100 | 11,964 |
Staples, Inc. | 463,600 | 11,924 |
The McGraw-Hill Cos., Inc. | 175,300 | 11,759 |
Carnival Corp. | 137,000 | 7,064 |
| | 174,144 |
Consumer Staples (13.4%) | | |
Wal-Mart Stores, Inc. | 534,700 | 25,500 |
PepsiCo, Inc. | 338,800 | 22,103 |
Safeway, Inc. | 535,300 | 19,287 |
Kimberly-Clark Corp. | 269,000 | 18,668 |
The Procter & Gamble Co. | 285,400 | 18,514 |
The Coca-Cola Co. | 368,000 | 17,620 |
Altria Group, Inc. | 197,200 | 17,233 |
General Mills, Inc. | 251,000 | 14,367 |
Anheuser-Busch Cos., Inc. | 251,200 | 12,804 |
| | 166,096 |
Energy (11.1%) | | |
ExxonMobil Corp. | 557,100 | 41,281 |
Total SA ADR | 515,400 | 35,073 |
Chevron Corp. | 471,900 | 34,392 |
ConocoPhillips Co. | 417,600 | 27,733 |
| | 138,479 |
Financials (12.7%) | | |
Citigroup, Inc. | 572,100 | 31,540 |
Prudential Financial, Inc. | 314,200 | 28,005 |
Bank of America Corp. | 520,900 | 27,389 |
American International | | |
Group, Inc. | 334,400 | 22,890 |
State Street Corp. | 267,600 | 19,013 |
ACE Ltd. | 321,700 | 18,588 |
Merrill Lynch & Co., Inc. | 104,500 | 9,777 |
| | 157,202 |
Health Care (16.0%) | | |
Cardinal Health, Inc. | 451,400 | 32,239 |
Medtronic, Inc. | 598,300 | 31,979 |
Eli Lilly & Co. | 581,700 | 31,482 |
Schering-Plough Corp. | 1,163,900 | 29,097 |
Johnson & Johnson | 309,300 | 20,661 |
Abbott Laboratories | 357,300 | 18,937 |
Wyeth | 371,500 | 18,356 |
AstraZeneca Group PLC ADR | 283,400 | 15,856 |
| | 198,607 |
Industrials (15.2%) | | |
General Electric Co. | 819,500 | 29,543 |
United Parcel Service, Inc. | 318,800 | 23,043 |
Avery Dennison Corp. | 304,800 | 20,836 |
Lockheed Martin Corp. | 201,700 | 19,603 |
General Dynamics Corp. | 240,600 | 18,803 |
Emerson Electric Co. | 418,000 | 18,797 |
Honeywell International Inc. | 283,400 | 12,948 |
The Boeing Co. | 132,300 | 11,849 |
Pitney Bowes, Inc. | 236,000 | 11,297 |
Illinois Tool Works, Inc. | 218,900 | 11,162 |
United Technologies Corp. | 161,200 | 10,965 |
| | 188,846 |
Information Technology (11.8%) | |
Microsoft Corp. | 1,022,800 | 31,563 |
Automatic Data | | |
Processing, Inc. | 578,700 | 27,616 |
Linear Technology Corp. | 735,900 | 22,776 |
International Business | | |
Machines Corp. | 212,800 | 21,099 |
Paychex, Inc. | 467,600 | 18,709 |
Motorola, Inc. | 681,700 | 13,532 |
Nokia Corp. ADR | 531,800 | 11,753 |
| | 147,048 |
Materials (1.6%) | | |
Weyerhaeuser Co. | 165,200 | 12,390 |
Alcoa Inc. | 222,900 | 7,200 |
| | 19,590 |
12
| | Market |
| | Value• |
| Shares | ($000) |
Telecommunication Services (1.8%) | |
AT&T Inc. | 601,100 | 22,619 |
| | |
Utilities (0.7%) | | |
Exelon Corp. | 146,800 | 8,807 |
Total Common Stocks | | |
(Cost $945,679) | | 1,221,438 |
| Face | |
| Amount | |
| ($000) | |
Temporary Cash Investments (1.7%) | |
Repurchase Agreement | | |
Credit Suisse First | | |
Boston LLC 5.270%, | | |
2/1/07 (Dated 1/31/07, | | |
Repurchase Value | | |
$21,503,000, collateralized | | |
by Federal National | | |
Mortgage Assn., | | |
5.500%–6.500%, | | |
6/1/08–2/1/37) | | |
(Cost $21,500) | 21,500 | 21,500 |
Total Investments (100.0%) | | |
(Cost $967,179) | | 1,242,938 |
Other Assets and Liabilities (0.0%) | |
Other Assets—Note C | | 8,130 |
Liabilities | | (8,352) |
| | (222) |
Net Assets (100%) | | |
Applicable to 84,324,320 outstanding | |
$.001 par value shares of beneficial | |
interest (unlimited authorization) | 1,242,716 |
Net Asset Value Per Share | | $14.74 |
At January 31, 2007, net assets consisted of:1 |
| Amount | Per |
| ($000) | Share |
Paid-in Capital | 1,024,564 | $12.16 |
Overdistributed Net | | |
Investment Income | (560) | (.01) |
Accumulated Net | | |
Realized Losses | (57,047) | (.68) |
Unrealized Appreciation | 275,759 | 3.27 |
Net Assets | 1,242,716 | $14.74 |
• See Note A in Notes to Financial Statements.
1 See Note E in Notes to Financial Statements for the tax-basis components of net assets.
ADR—American Depositary Receipt.
13
Statement of Operations
| Year Ended |
| January 31, 2007 |
| ($000) |
Investment Income | |
Income | |
Dividends | 23,609 |
Interest | 866 |
Security Lending | 154 |
Total Income | 24,629 |
Expenses | |
Investment Advisory Fees—Note B | |
Basic Fee | 1,319 |
Performance Adjustment | 146 |
The Vanguard Group—Note C | |
Management and Administrative | 2,341 |
Marketing and Distribution | 181 |
Custodian Fees | 10 |
Auditing Fees | 19 |
Shareholders’ Reports | 35 |
Trustees’ Fees and Expenses | 2 |
Total Expenses | 4,053 |
Expenses Paid Indirectly—Note D | (81) |
Net Expenses | 3,972 |
Net Investment Income | 20,657 |
Realized Net Gain (Loss) on Investment Securities Sold | 81,236 |
Change in Unrealized Appreciation (Depreciation) of Investment Securities | 78,627 |
Net Increase (Decrease) in Net Assets Resulting from Operations | 180,520 |
14
Statement of Changes in Net Assets
| Year Ended January 31, |
| 2007 | 2006 |
| ($000) | ($000) |
Increase (Decrease) in Net Assets | | |
Operations | | |
Net Investment Income | 20,657 | 18,128 |
Realized Net Gain (Loss) | 81,236 | 28,292 |
Change in Unrealized Appreciation (Depreciation) | 78,627 | 41,590 |
Net Increase (Decrease) in Net Assets Resulting from Operations | 180,520 | 88,010 |
Distributions | | |
Net Investment Income | (20,673) | (19,180) |
Realized Capital Gain | — | — |
Total Distributions | (20,673) | (19,180) |
Capital Share Transactions—Note G | | |
Issued | 221,674 | 144,674 |
Issued in Lieu of Cash Distributions | 17,716 | 16,255 |
Redeemed | (151,063) | (200,711) |
Net Increase (Decrease) from Capital Share Transactions | 88,327 | (39,782) |
Total Increase (Decrease) | 248,174 | 29,048 |
Net Assets | | |
Beginning of Period | 994,542 | 965,494 |
End of Period1 | 1,242,716 | 994,542 |
1 Net Assets—End of Period includes undistributed (overdistributed) net investment income of ($560,000) and ($544,000).
15
Financial Highlights
| Year Ended January31, |
For a Share Outstanding Throughout Each Period | 2007 | 2006 | 2005 | 2004 | 2003 |
Net Asset Value, Beginning of Period | $12.75 | $11.89 | $11.33 | $8.48 | $11.47 |
Investment Operations | | | | | |
Net Investment Income | .26 | .22 | .231 | .18 | .37 |
Net Realized and Unrealized Gain | | | | | |
(Loss) on Investments | 1.99 | .88 | .55 | 2.86 | (2.98) |
Total from Investment Operations | 2.25 | 1.10 | .78 | 3.04 | (2.61) |
Distributions | | | | | |
Dividends from Net Investment Income | (.26) | (.24) | (.22) | (.19) | (.38) |
Distributions from Realized Capital Gains | — | — | — | — | — |
Total Distributions | (.26) | (.24) | (.22) | (.19) | (.38) |
Net Asset Value, End of Period | $14.74 | $12.75 | $11.89 | $11.33 | $8.48 |
| | | | | |
Total Return | 17.84% | 9.34% | 6.92% | 36.08% | –23.22% |
| | | | | |
Ratios/Supplemental Data | | | | | |
Net Assets, End of Period (Millions) | $1,243 | $995 | $965 | $818 | $550 |
Ratio of Total Expenses to | | | | | |
Average Net Assets | 0.38%2 | 0.37%2 | 0.37%2 | 0.40% | 0.34% |
Ratio of Net Investment Income to | | | | | |
Average Net Assets | 1.93% | 1.85% | 2.04%1 | 1.84% | 3.57% |
Portfolio Turnover Rate | 41% | 16% | 20% | 23% | 104%3 |
1 Net investment income per share and the ratio of net investment income to average net assets include $.03 and 0.28%, respectively, resulting from a special dividend from Microsoft Corp. in November 2004.
2 Includes performance-based investment advisory fee increases (decreases) of 0.01%, 0.01%, and 0.01%.
3 Includes activity related to a change in the fund’s investment objective.
See accompanying Notes, which are an integral part of the Financial Statements.
16
Notes to Financial Statements
Vanguard Dividend Growth Fund is registered under the Investment Company Act of 1940 as an open-end investment company, or mutual fund. The fund files reports with the SEC under the company name Vanguard Specialized Funds.
A. The following significant accounting policies conform to generally accepted accounting principles for U.S. mutual funds. The fund consistently follows such policies in preparing its financial statements.
1. Security Valuation: Securities are valued as of the close of trading on the New York Stock Exchange (generally 4:00 p.m. Eastern time) on the valuation date. Equity securities are valued at the latest quoted sales prices or official closing prices taken from the primary market in which each security trades; such securities not traded on the valuation date are valued at the mean of the latest quoted bid and asked prices. Securities for which market quotations are not readily available, or whose values have been materially affected by events occurring before the fund’s pricing time but after the close of the securities’ primary markets, are valued by methods deemed by the board of trustees to represent fair value. Temporary cash investments acquired over 60 days to maturity are valued using the latest bid prices or using valuations based on a matrix system (which considers such factors as security prices, yields, maturities, and ratings), both as furnished by independent pricing services. Other temporary cash investments are valued at amortized cost, which approximates market value.
2. Repurchase Agreements: The fund may invest in repurchase agreements. Securities pledged as collateral for repurchase agreements are held by a custodian bank until the agreements mature. Each agreement requires that the market value of the collateral be sufficient to cover payments of interest and principal; however, in the event of default or bankruptcy by the other party to the agreement, retention of the collateral may be subject to legal proceedings.
3. Federal Income Taxes: The fund intends to continue to qualify as a regulated investment company and distribute all of its taxable income. Accordingly, no provision for federal income taxes is required in the financial statements.
4. Distributions: Distributions to shareholders are recorded on the ex-dividend date.
5. Security Lending: The fund may lend its securities to qualified institutional borrowers to earn additional income. Security loans are required to be secured at all times by collateral at least equal to the market value of securities loaned. The fund invests cash collateral received in Vanguard Market Liquidity Fund, and records a liability for the return of the collateral, during the period the securities are on loan. Security lending income represents the income earned on investing cash collateral, less expenses associated with the loan.
6. Other: Dividend income is recorded on the ex-dividend date. Interest income is accrued daily. Security transactions are accounted for on the date securities are bought or sold. Costs used to determine realized gains (losses) on the sale of investment securities are those of the specific securities sold.
B. Wellington Management Company, LLP, provides investment advisory services to the fund for a fee calculated at an annual percentage rate of average net assets. The basic fee is subject to quarterly adjustments based on the fund’s performance for the preceding three years relative to the Russell 1000 Index. For the year ended January 31, 2007, the investment advisory fee represented an effective annual basic rate of 0.12% of the fund’s average net assets before an increase of $146,000 (0.01%) based on performance.
17
C. The Vanguard Group furnishes at cost corporate management, administrative, marketing, and distribution services. The costs of such services are allocated to the fund under methods approved by the board of trustees. The fund has committed to provide up to 0.40% of its net assets in capital contributions to Vanguard. At January 31, 2007, the fund had contributed capital of $118,000 to Vanguard (included in Other Assets), representing 0.01% of the fund’s net assets and 0.12% of Vanguard’s capitalization. The fund’s trustees and officers are also directors and officers of Vanguard.
D. The fund has asked its investment advisor to direct certain security trades, subject to obtaining the best price and execution, to brokers who have agreed to rebate to the fund part of the commissions generated. Such rebates are used solely to reduce the fund’s management and administrative expenses. The fund’s custodian bank has also agreed to reduce its fees when the fund maintains cash on deposit in the non-interest-bearing custody account. For the year ended January 31, 2007, these arrangements reduced the fund’s management and administrative expenses by $74,000 and custodian fees by $7,000. The total expense reduction represented an effective annual rate of 0.01% of the fund’s average net assets.
E. Distributions are determined on a tax basis and may differ from net investment income and realized capital gains for financial reporting purposes. Differences may be permanent or temporary. Permanent differences are reclassified among capital accounts in the financial statements to reflect their tax character. Temporary differences arise when certain items of income, expense, gain, or loss are recognized in different periods for financial statement and tax purposes; these differences will reverse at some time in the future. Differences in classification may also result from the treatment of short-term gains as ordinary income for tax purposes.
For tax purposes, at January 31, 2007, the fund had $1,100,000 of ordinary income available for distributions. The fund had available realized losses of $56,731,000 to offset future net capital gains of $56,731,000 through January 31, 2012.
At January 31, 2007, the cost of investment securities for tax purposes was $967,179,000. Net unrealized appreciation of investment securities for tax purposes was $275,759,000 consisting of unrealized gains of $279,239,000 on securities that had risen in value since their purchase and $3,480,000 in unrealized losses on securities that had fallen in value since their purchase.
F. During the year ended January 31, 2007, the fund purchased $507,295,000 of investment securities and sold $436,126,000 of investment securities other than temporary cash investments.
18
G. Capital shares issued and redeemed were:
| Year Ended January 31, |
| 2007 | 2006 |
| Shares | Shares |
| (000) | (000) |
Issued | 16,265 | 11,818 |
Issued in Lieu of Cash Distributions | 1,305 | 1,327 |
Redeemed | (11,242) | (16,377) |
Net Increase (Decrease) in Shares Outstanding | 6,328 | (3,232) |
H. In June 2006, the Financial Accounting Standards Board issued Interpretation No. 48 (“FIN 48”), “Accounting for Uncertainty in Income Taxes.” FIN 48 establishes the minimum threshold for recognizing, and a system for measuring, the benefits of tax-return positions in financial statements. FIN 48 will be effective for the fund’s fiscal year ending January 31, 2008. Management is in the process of analyzing the fund’s tax positions for purposes of implementing FIN 48; based on the analysis completed to date, management does not believe the adoption of FIN 48 will result in any material impact to the fund’s financial statements.
19
Report of Independent Registered
Public Accounting Firm
To the Trustees of Vanguard Specialized Funds and Shareholders of Vanguard Dividend Growth Fund:
In our opinion, the accompanying statement of net assets and the related statements of operations and of changes in net assets and the financial highlights present fairly, in all material respects, the financial position of Vanguard Dividend Growth Fund (one of the funds constituting Vanguard Specialized Funds, hereafter referred to as the “Fund”) at January 31, 2007, the results of its operations for the year then ended, the changes in its net assets for each of the two years in the period then ended and the financial highlights for each of the five years in the period then ended, in conformity with accounting principles generally accepted in the United States of America. These financial statements and financial highlights (hereafter referred to as “financial statements”) are the responsibility of the Fund’s management; our responsibility is to express an opinion on these financial statements based on our audits. We conducted our audits of these financial statements in accordance with the standards of the Public Company Accounting Oversight Board (United States). Those standards require that we plan and perform the audit to obtain reasonable assurance about whether the financial statements are free of material misstatement. An audit includes examining, on a test basis, evidence supporting the amounts and disclosures in the financial statements, assessing the accounting principles used and significant estimates made by management, and evaluating the overall financial statement presentation. We believe that our audits, which included confirmation of securities at January 31, 2007 by correspondence with the custodians and broker, provide a reasonable basis for our opinion.
PricewaterhouseCoopers LLP
Philadelphia, Pennsylvania
March 13, 2007
Special 2007 tax information (unaudited) for Vanguard Dividend Growth Fund
This information for the fiscal year ended January 31, 2007, is included pursuant to provisions of the Internal Revenue Code.
The fund distributed $20,673,000 of qualified dividend income to shareholders during the fiscal year.
For corporate shareholders, 100.0% of investment income (dividend income plus short-term gains, if any) qualifies for the dividends-received deduction.
20
Your Fund’s After-Tax Returns
This table presents returns for your fund both before and after taxes. The after-tax returns are shown in two ways: (1) assuming that an investor owned the fund during the entire period and paid taxes on the fund’s distributions, and (2) assuming that an investor paid taxes on the fund’s distributions and sold all shares at the end of each period.
Calculations are based on the highest individual federal income tax and capital gains tax rates in effect at the times of the distributions and the hypothetical sales. State and local taxes were not considered. After-tax returns reflect any qualified dividend income, using actual prior-year figures and estimates for 2007. (In the example, returns after the sale of fund shares may be higher than those assuming no sale. This occurs when the sale would have produced a capital loss. The calculation assumes that the investor received a tax deduction for the loss.)
Please note that your actual after-tax returns will depend on your tax situation and may differ from those shown. Also note that if you own the fund in a tax-deferred account, such as an individual retirement account or a 401(k) plan, this information does not apply to you. Such accounts are not subject to current taxes.
Finally, keep in mind that a fund’s performance—whether before or after taxes—does not guarantee future results.
Average Annual Total Returns: Dividend Growth Fund |
Periods Ended January 31, 2007 | | | |
| One | Five | Ten |
| Year | Years | Years |
Returns Before Taxes | 17.84% | 7.56% | 6.84% |
Returns After Taxes on Distributions | 17.50 | 7.00 | 5.27 |
Returns After Taxes on Distributions and Sale of Fund Shares | 11.99 | 6.27 | 5.10 |
21
About Your Fund’s Expenses
As a shareholder of the fund, you incur ongoing costs, which include costs for portfolio management, administrative services, and shareholder reports (like this one), among others. Operating expenses, which are deducted from a fund’s gross income, directly reduce the investment return of the fund.
A fund’s expenses are expressed as a percentage of its average net assets. This figure is known as the expense ratio. The following examples are intended to help you understand the ongoing costs (in dollars) of investing in your fund and to compare these costs with those of other mutual funds. The examples are based on an investment of $1,000 made at the beginning of the period shown and held for the entire period.
The table below illustrates your fund’s costs in two ways:
• Based on actual fund return. This section helps you to estimate the actual expenses that you paid over the period. The “Ending Account Value” shown is derived from the fund’s actual return, and the third column shows the dollar amount that would have been paid by an investor who started with $1,000 in the fund. You may use the information here, together with the amount you invested, to estimate the expenses that you paid over the period.
To do so, simply divide your account value by $1,000 (for example, an $8,600 account value divided by $1,000 = 8.6), then multiply the result by the number given for your fund under the heading “Expenses Paid During Period.”
• Based on hypothetical 5% yearly return. This section is intended to help you compare your fund’s costs with those of other mutual funds. It assumes that the fund had a yearly return of 5% before expenses, but that the expense ratio is unchanged. In this case—because the return used is not the fund’s actual return—the results do not apply to your investment. The example is useful in making comparisons because the Securities and Exchange Commission requires all mutual funds to calculate expenses based on a 5% return. You can assess your fund’s costs by comparing this hypothetical example with the hypothetical examples that appear in shareholder reports of other funds.
Six Months Ended January 31, 2007 |
| Beginning | Ending | Expenses |
| Account Value | Account Value | Paid During |
Dividend Growth Fund | 7/31/2006 | 1/31/2007 | Period1 |
Based on Actual Fund Return | $1,000.00 | $1,131.75 | $1.99 |
Based on Hypothetical 5% Yearly Return | 1,000.00 | 1,023.34 | 1.89 |
Note that the expenses shown in the table are meant to highlight and help you compare ongoing costs only and do not reflect any transactional costs or account maintenance fees. They do not include your fund’s low-balance fee, which is described in the prospectus. If this fee were applied to your account, your costs would be higher. Your fund does not charge transaction fees, such as purchase or redemption fees, nor does it carry a “sales load.”
1 These calculations are based on expenses incurred in the most recent six-month period. The fund’s annualized six-month expense ratio for that period is 0.37%. The dollar amounts shown as “Expenses Paid” are equal to the annualized expense ratio multiplied by the average account value over the period, multiplied by the number of days in the most recent six-month period, then divided by the number of days in the most recent 12-month period.
22
The calculations assume no shares were bought or sold during the period. Your actual costs may have been higher or lower, depending on the amount of your investment and the timing of any purchases or redemptions.
You can find more information about the fund’s expenses, including annual expense ratios, in the Financial Statements section of this report. For additional information on operating expenses and other shareholder costs, please refer to the appropriate fund prospectus.
23
Glossary
Beta. A measure of the magnitude of a fund’s past share-price fluctuations in relation to the ups and downs of a given market index. The index is assigned a beta of 1.00. Compared with a given index, a fund with a beta of 1.20 typically would have seen its share price rise or fall by 12% when the index rose or fell by 10%. A fund’s beta should be reviewed in conjunction with its R-squared (see definition below). The lower the R-squared, the less correlation there is between the fund and the index, and the less reliable beta is as an indicator of volatility.
Earnings Growth Rate. The average annual rate of growth in earnings over the past five years for the stocks now in a fund.
Expense Ratio. The percentage of a fund’s average net assets used to pay its annual administrative and advisory expenses. These expenses directly reduce returns to investors.
Foreign Holdings. The percentage of a fund represented by stocks or depositary receipts of companies based outside the United States.
Inception Date. The date on which the assets of a fund (or one of its share classes) are first invested in accordance with the fund’s investment objective. For funds with a subscription period, the inception date is the day after that period ends. Investment performance is measured from the inception date.
Median Market Cap. An indicator of the size of companies in which a fund invests; the midpoint of market capitalization (market price x shares outstanding) of a fund’s stocks, weighted by the proportion of the fund’s assets invested in each stock. Stocks representing half of the fund’s assets have market capitalizations above the median, and the rest are below it.
Price/Book Ratio. The share price of a stock divided by its net worth, or book value, per share. For a fund, the weighted average price/book ratio of the stocks it holds.
Price/Earnings Ratio. The ratio of a stock’s current price to its per-share earnings over the past year. For a fund, the weighted average P/E of the stocks it holds. P/E is an indicator of market expectations about corporate prospects; the higher the P/E, the greater the expectations for a company’s future growth.
R-Squared. A measure of how much of a fund’s past returns can be explained by the returns from the market in general, as measured by a given index. If a fund’s total returns were precisely synchronized with an index’s returns, its R-squared would be 1.00. If the fund’s returns bore no relationship to the index’s returns, its R-squared would be 0.
Return on Equity. The annual average rate of return generated by a company during the past five years for each dollar of shareholder’s equity (net income divided by shareholder’s equity). For a fund, the weighted average return on equity for the companies whose stocks it holds.
Short-Term Reserves. The percentage of a fund invested in highly liquid, short-term securities that can be readily converted to cash.
Turnover Rate. An indication of the fund’s trading activity. Funds with high turnover rates incur higher transaction costs and may be more likely to distribute capital gains (which may be taxable to investors). The turnover rate excludes in-kind transactions, which have minimal impact on costs.
Yield. A snapshot of a fund’s income from interest and dividends. The yield, expressed as a percentage of the fund’s net asset value, is based on income earned over the past 30 days and is annualized, or projected forward for the coming year. The index yield is based on the current annualized rate of income provided by securities in the index.
24
This page intentionally left blank.
This page intentionally left blank.
This page intentionally left blank.
The People Who Govern Your Fund
The trustees of your mutual fund are there to see that the fund is operated and managed in your best interests since, as a shareholder, you are a part owner of the fund. Your fund’s trustees also serve on the board of directors of The Vanguard Group, Inc., which is owned by the Vanguard funds and provides services to them on an at-cost basis.
A majority of Vanguard’s board members are independent, meaning that they have no affiliation with Vanguard or the funds they oversee, apart from the sizable personal investments they have made as private individuals.
Our independent board members bring distinguished backgrounds in business, academia, and public service to their task of working with Vanguard officers to establish the policies and oversee the activities of the funds. Among board members’ responsibilities are selecting investment advisors for the funds; monitoring fund operations, performance, and costs; reviewing contracts; nominating and selecting new trustees/directors; and electing Vanguard officers.
Each trustee serves a fund until its termination; or until the trustee’s retirement, resignation, or death; or otherwise as specified in the fund’s organizational documents. Any trustee may be removed at a shareholders’ meeting by a vote representing two-thirds of the net asset value of all shares of the fund together with shares of other Vanguard funds organized within the same trust. The table on these two pages shows information for each trustee and executive officer of the fund. The mailing address of the trustees and officers is P.O. Box 876, Valley Forge, PA 19482.
Chairman of the Board, Chief Executive Officer, and Trustee |
| |
John J. Brennan1 | |
Born 1954 | Principal Occupation(s) During the Past Five Years: Chairman of the Board, Chief Executive |
Trustee since May 1987; | Officer, and Director/Trustee of The Vanguard Group, Inc., and of each of the investment |
Chairman of the Board and | companies served by The Vanguard Group. |
Chief Executive Officer | |
146 Vanguard Funds Overseen | |
| |
Independent Trustees | |
| |
Charles D. Ellis | |
Born 1937 | Principal Occupation(s) During the Past Five Years: Applecore Partners (pro bono ventures |
Trustee since January 2001 | in education); Senior Advisor to Greenwich Associates (international business strategy |
146 Vanguard Funds Overseen | consulting); Successor Trustee of Yale University; Overseer of the Stern School of Business |
| at New York University; Trustee of the Whitehead Institute for Biomedical Research. |
| |
Rajiv L. Gupta | |
Born 1945 | Principal Occupation(s) During the Past Five Years: Chairman and Chief Executive Officer |
Trustee since December 20012 | of Rohm and Haas Co. (chemicals); Board Member of the American Chemistry Council; |
146 Vanguard Funds Overseen | Director of Tyco International, Ltd. (diversified manufacturing and services) since 2005; |
| Trustee of Drexel University and of the Chemical Heritage Foundation. |
| |
Amy Gutmann | |
Born 1949 | Principal Occupation(s) During the Past Five Years: President of the University of |
Trustee since June 2006 | Pennsylvania since 2004; Professor in the School of Arts and Sciences, Annenberg School |
146 Vanguard Funds Overseen | for Communication, and Graduate School of Education of the University of Pennsylvania |
| since 2004; Provost (2001–2004) and Laurance S. Rockefeller Professor of Politics and the |
| University Center for Human Values (1990–2004), Princeton University; Director of Carnegie |
| Corporation of New York since 2005 and of Schuylkill River Development Corporation and |
| Greater Philadelphia Chamber of Commerce since 2004. |
JoAnn Heffernan Heisen | |
Born 1950 | Principal Occupation(s) During the Past Five Years: Corporate Vice President and Chief |
Trustee since July 1998 | Global Diversity Officer since 2006, Vice President and Chief Information Officer |
146 Vanguard Funds Overseen | (1997–2005), and Member of the Executive Committee of Johnson & Johnson |
| (pharmaceuticals/consumer products); Director of the University Medical Center |
| at Princeton and Women’s Research and Education Institute. |
| |
André F. Perold | |
Born 1952 | Principal Occupation(s) During the Past Five Years: George Gund Professor of Finance |
Trustee since December 2004 | and Banking, Harvard Business School; Senior Associate Dean, Director of Faculty |
146 Vanguard Funds Overseen | Recruiting, and Chair of Finance Faculty, Harvard Business School; Director and Chairman |
| of UNX, Inc. (equities trading firm) since 2003; Chair of the Investment Committee of |
| HighVista Strategies LLC (private investment firm) since 2005; Director of registered |
| investment companies advised by Merrill Lynch Investment Managers and affiliates |
| (1985–2004), Genbel Securities Limited (South African financial services firm) |
| (1999–2003), Gensec Bank (1999–2003), Sanlam, Ltd. (South African insurance |
| company) (2001–2003), and Stockback, Inc. (credit card firm) (2000–2002). |
| |
Alfred M. Rankin, Jr. | |
Born 1941 | Principal Occupation(s) During the Past Five Years: Chairman, President, Chief Executive |
Trustee since January 1993 | Officer, and Director of NACCO Industries, Inc. (forklift trucks/housewares/lignite); Director |
146 Vanguard Funds Overseen | of Goodrich Corporation (industrial products/aircraft systems and services). |
| |
J. Lawrence Wilson | |
Born 1936 | Principal Occupation(s) During the Past Five Years: Retired Chairman and Chief Executive |
Trustee since April 1985 | Officer of Rohm and Haas Co. (chemicals); Director of Cummins Inc. (diesel engines), |
146 Vanguard Funds Overseen | MeadWestvaco Corp. (packaging products), and AmerisourceBergen Corp. (pharmaceutical |
| distribution); Trustee of Vanderbilt University and of Culver Educational Foundation. |
| |
Executive Officers1 | |
| |
Heidi Stam | |
Born 1956 | Principal Occupation(s) During the Past Five Years: Managing Director of The Vanguard |
Secretary since July 2005 | Group, Inc., since 2006; General Counsel of The Vanguard Group since 2005; Secretary of |
146 Vanguard Funds Overseen | The Vanguard Group, and of each of the investment companies served by The Vanguard |
| Group, since 2005; Principal of The Vanguard Group (1997–2006). |
| |
Thomas J. Higgins | |
Born 1957 | Principal Occupation(s) During the Past Five Years: Principal of The Vanguard Group, Inc.; |
Treasurer since July 1998 | Treasurer of each of the investment companies served by The Vanguard Group. |
146 Vanguard Funds Overseen | |
| |
Vanguard Senior Management Team |
| |
R. Gregory Barton | Kathleen C. Gubanich | Michael S. Miller |
Mortimer J. Buckley | Paul A. Heller | Ralph K. Packard |
James H. Gately | F. William McNabb, III | George U. Sauter |
| |
Founder | |
| |
John C. Bogle | |
Chairman and Chief Executive Officer, 1974–1996 |
1 Officers of the funds are “interested persons” as defined in the Investment Company Act of 1940.
2 December 2002 for Vanguard Equity Income Fund, Vanguard Growth Equity Fund, the Vanguard Municipal Bond Funds, and the Vanguard State Tax-Exempt Funds.
More information about the trustees is in the Statement of Additional Information, available from The Vanguard Group.
P.O. Box 2600
Valley Forge, PA 19482-2600
Connect with Vanguard® > www.vanguard.com
Fund Information > 800-662-7447 | Vanguard, Connect with Vanguard, and the ship logo are |
| trademarks of The Vanguard Group, Inc. |
Direct Investor Account Services > 800-662-2739 | |
| All other marks are the exclusive property of their |
Institutional Investor Services > 800-523-1036 | respective owners. |
| |
Text Telephone for the | |
Hearing-Impaired > 800-952-3335 | All comparative mutual fund data are from Lipper Inc. |
| or Morningstar, Inc., unless otherwise noted. |
| |
| You can obtain a free copy of Vanguard’s proxy voting |
| guidelines by visiting our website, www.vanguard.com, |
This material may be used in conjunction | and searching for “proxy voting guidelines,” or by calling |
with the offering of shares of any Vanguard | Vanguard at 800-662-2739. They are also available from |
fund only if preceded or accompanied by | the SEC’s website, www.sec.gov. In addition, you may |
the fund’s current prospectus. | obtain a free report on how your fund voted the proxies for |
| securities it owned during the 12 months ended June 30. |
| To get the report, visit either www.vanguard.com |
| or www.sec.gov. |
| |
| You can review and copy information about your fund |
| at the SEC’s Public Reference Room in Washington, D.C. |
| To find out more about this public service, call the SEC |
| at 202-551-8090. Information about your fund is also |
| available on the SEC’s website, and you can receive |
| copies of this information, for a fee, by sending a |
| request in either of two ways: via e-mail addressed to |
| publicinfo@sec.gov or via regular mail addressed to the |
| Public Reference Section, Securities and Exchange |
| Commission, Washington, DC 20549-0102. |
| |
| |
| |
| |
| © 2007 The Vanguard Group, Inc. |
| All rights reserved. |
| Vanguard Marketing Corporation, Distributor. |
| |
| Q570 032007 |
|
|
Vanguard® Dividend Appreciation |
Index Fund |
|
> Annual Report |
|
|
|
|
|
January 31, 2007 |
|
|
> | The Investor Shares of Vanguard Dividend Appreciation Index Fund posted a |
| return of 10.0% from their April 27, 2006, inception through January 31, 2007. |
> | Holdings in the fund’s three largest sectors—consumer staples, industrials, |
| and financials—contributed slightly more than half of the fund’s return. |
> | For the 12 months that ended January 31, the broad U.S. stock market gained 14.1%. |
|
|
Contents | |
| |
Your Fund’s Total Returns | 1 |
Chairman’s Letter | 2 |
Fund Profile | 6 |
Performance Summary | 7 |
Financial Statements | 9 |
About Your Fund’s Expenses | 21 |
Glossary | 23 |
Please note: The opinions expressed in this report are just that—informed opinions. They should not be considered promises or advice. Also, please keep in mind that the information and opinions cover the period through the date on the cover of this report. Of course, the risks of investing in your fund are spelled out in the prospectus.
Your Fund’s Total Returns
Period Ended January 31, 2007 | |
| Returns Since |
| Inception1 |
Vanguard Dividend Appreciation Index Fund Investor Shares | 10.0% |
Dividend Achievers Select Index | 10.3 |
Average Large-Cap Core Fund2 | 9.6 |
Dow Jones Wilshire 5000 Index | 10.9 |
| |
| |
Vanguard Dividend Appreciation Index Fund ETF Shares3 | |
Market Price | 10.6% |
Net Asset Value | 10.4 |
Dividend Achievers Select Index | 10.6 |
Average Large-Cap Core Fund | 9.8 |
Dow Jones Wilshire 5000 Index | 10.6 |
Your Fund’s Performance at a Glance | | | | |
| | | Distributions Per Share |
| Starting | Ending | Income | Capital |
| Share Price | Share Price | Dividends | Gains |
Vanguard Dividend Appreciation Index Fund | | | | |
Investor Shares | $20.054 | $21.84 | $0.206 | $0.000 |
ETF Shares | 49.945 | 54.60 | 0.526 | 0.000 |
1 | Inception was April 27, 2006, for Investor Shares and April 21, 2006, for ETF Shares. |
2 | Derived from data provided by Lipper Inc. |
3 | Vanguard ETF™ Shares are traded on the American Stock Exchange and are available only through brokers. The table shows ETF returns based on both the AMEX market price and the net asset value for a share. U.S. Pat. No. 6,879,964 B2 |
4 | At inception, April 27, 2006. |
5 | At inception, April 21, 2006. |
1

Chairman’s Letter
Dear Shareholder,
I am pleased to present the first annual report on Vanguard Dividend Appreciation Index Fund, covering the fund’s first nine months of operations.
Strong corporate earnings, low inflation, and a healthy export market were some of the underpinnings of the fund’s initial success. Since their April 27, 2006, inception, the fund’s Investor Shares returned 10.0%. This was in line with the return of the Dividend Achievers Select Index, a specially constructed index developed by Mergent, Inc., and ahead of the average return for large-capitalization core funds.
Domestic equity markets did well; markets abroad did even better
In the first half of the past year, returns from large-cap stocks were virtually flat, while those of small-caps lost some ground. In the second six months, both large and small stocks rebounded, with small-caps faring slightly better. For the 12 months, the broad U.S. stock market gained 14.1%. Despite the weakness in the housing sector, the economy showed remarkable resilience, and corporate profits rose at a fast clip.
Across market capitalizations, value-oriented stocks outpaced their growth-oriented counterparts. International stocks continued to outperform U.S. stocks, as overseas markets—especially European and emerging markets—produced stellar
2
returns. For U.S.-based investors, the dollar’s weakness further enhanced the results of international stocks.
Bond returns were modest as the Fed put rate hikes on hold
In the first six months of the past year, the Federal Reserve Board continued its campaign to keep inflation in check, raising its target for the key federal funds rate by 0.25 percentage point on three occasions (in addition to a 0.25 percentage point increase the day before the fiscal year began). Then, at its August meeting, the Fed left the target rate unchanged at 5.25%, where it remained through the end of the fiscal period, as inflation fears diminished.
Following the Fed’s pause, the prices of longer-maturity bonds rose faster than those of short-term bonds, reducing their yields more dramatically. Throughout the maturity spectrum, the “yield spread,” or the difference between yields of corporate securities and those of U.S. Treasury securities of comparable maturities, became even tighter. Bonds produced coupon-like returns for the period, with the broad taxable bond market returning 4.3%. Corporate bonds generally outperformed U.S. government issues. The Citigroup 3-Month Treasury Bill Index, a proxy for money market yields, returned 4.9%.
Market Barometer | | | |
| | Average Annual Total Returns |
| | Periods Ended January 31, 2007 |
| One Year | Three Years | Five Years |
Stocks | | | |
Russell 1000 Index (Large-caps) | 14.5% | 11.0% | 7.5% |
Russell 2000 Index (Small-caps) | 10.4 | 12.6 | 12.0 |
Dow Jones Wilshire 5000 Index (Entire market) | 14.1 | 11.5 | 8.4 |
MSCI All Country World Index ex USA (International) | 19.3 | 21.3 | 18.0 |
| | | |
| | | |
Bonds | | | |
Lehman Aggregate Bond Index (Broad taxable market) | 4.3% | 3.4% | 4.9% |
Lehman Municipal Bond Index | 4.3 | 4.0 | 5.1 |
Citigroup 3-Month Treasury Bill Index | 4.9 | 3.1 | 2.4 |
| | | |
| | | |
CPI | | | |
Consumer Price Index | 2.1% | 3.0% | 2.7% |
3
Consumer staples led performance in fund’s first nine months
The fund seeks to track the Dividend Achievers Select Index, which is constructed of mature, blue chip companies that have met the index’s mandate for providing a history of relatively superior growth of dividends. The consumer staples sector, which makes up just over 22% of the fund’s index, on average, is the largest sector weighting for both the fund and the index. Companies in the sector include Anheuser-Busch and Colgate Palmolive; both were strong performers during the fund’s first nine months.
The fund also benefited from its heavy exposure to industrial companies, particularly defense contractors United Technologies and General Dynamics. Industrial conglomerate General Electric was also among the fund’s top performers.
All industry sectors produced positive returns, most in double digits. The fund’s second-largest sector, financials, lagged somewhat, with a gain of 8.5% as a group. Former highflier Legg Mason fell –18.5%, and consumer finance firm SLM Corp. and insurer Progressive Corp. also posted disappointing results for the period.
Materials, telecommunication services, and energy stocks produced the highest gains for the period; however, they make up only a small portion of fund assets.
Market cycles have smiled on dividend-paying stocks
When “New Economy” mania ruled in the late 1990s, dividend-paying stocks were considered a quaint throwback to a sleepier time. Then the market peaked early in 2000, and those new economy stocks took a drubbing. Investors found renewed appreciation for stocks that generate income through good times and bad.
For a stock to be included in the Dividend Achievers Select Index (which Mergent administers exclusively for Vanguard), the company must have a history of raising annual regular dividends for ten or more consecutive years. This produces a portfolio of large-cap, well-established companies that have been able to generate excess cash flow and use it to increase their dividends over time.
4
With its low-cost, indexed approach to investing in income-oriented stocks, the Dividend Appreciation Index Fund can be a very useful complement to a broad portfolio diversified to take advantage of other stock and bond market segments.
Thank you for entrusting your assets to Vanguard.
Sincerely,

John J. Brennan
Chairman and Chief Executive Officer
February 14, 2007
Vanguard Dividend Appreciation ETF | | | | |
Premium/Discount: April 21, 20061–January 31, 2007 | | |
| | | | |
| Market Price Above or | Market Price Below |
| Equal to Net Asset Value | | Net Asset Value |
| Number | Percentage | Number | Percentage |
Basis Point Differential2 | of Days | of Total Days | of Days | of Total Days |
0–24.9 | 90 | 45.69% | 107 | 54.31% |
25–49.9 | 0 | 0.00 | 0 | 0.00 |
50–74.9 | 0 | 0.00 | 0 | 0.00 |
75–100.0 | 0 | 0.00 | 0 | 0.00 |
>100.0 | 0 | 0.00 | 0 | 0.00 |
Total | 90 | 45.69% | 107 | 54.31% |
| | | | | | | |
2 | One basis point equals 1/100 of a percentage point. |
5
Fund Profile
As of January 31, 2007
Portfolio Characteristics | | |
| | Target | Broad |
| Fund | Index1 | Index2 |
Number of Stocks | 225 | 225 | 4,939 |
Median Market Cap | $54.4B | $54.6B | $30.8B |
Price/Earnings Ratio | 16.9x | 16.9x | 17.9x |
Price/Book Ratio | 3.3x | 3.3x | 2.8x |
Yield | | 1.8% | 1.7% |
Investor Shares | 1.4% | | |
ETF Shares | 1.5% | | |
Return on Equity | 25.1% | 25.1% | 17.8% |
Earnings Growth Rate | 15.4% | 15.5% | 18.5% |
Foreign Holdings | 0.0% | 0.0% | 1.1% |
Turnover Rate | 21% | — | — |
Expense Ratio | | — | — |
Investor Shares | 0.40%3 | | |
ETF Shares | 0.28%3 | | |
Short-Term Reserves | 0% | — | — |
Sector Diversification (% of portfolio) | |
| | Target | Broad |
| Fund | Index1 | Index2 |
Consumer Discretionary | 12% | 12% | 12% |
Consumer Staples | 22 | 22 | 8 |
Energy | 8 | 8 | 9 |
Financials | 21 | 21 | 23 |
Health Care | 11 | 11 | 12 |
Industrials | 15 | 15 | 11 |
Information Technology | 6 | 6 | 15 |
Materials | 4 | 4 | 4 |
Telecommunication Services | 0 | 0 | 3 |
Utilities | 1 | 1 | 3 |
Short-Term Reserves | 0% | — | — |
Ten Largest Holdings4 (% of total net assets) |
| | |
Chevron Corp. | integrated oil and gas | 4.0% |
ExxonMobil Corp. | integrated oil and gas | 4.0 |
Johnson & Johnson | pharmaceuticals | 4.0 |
International Business Machines Corp. | computer hardware | 4.0 |
American International Group, Inc. | multiline insurance | 4.0 |
Wal-Mart Stores, Inc. | hypermarkets and super centers | 4.0 |
The Procter & Gamble Co. | household products | 4.0 |
General Electric Co. | industriaconglomerate | 3.9 |
The Coca-Cola Co. | soft drinks | 3.5 |
PepsiCo, Inc. | soft drinks | 3.2 |
Top Ten | | 38.6% |
Investment Focus
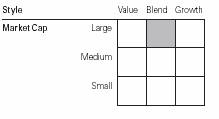
1 | Dividend Achievers Select Index. |
2 | Dow Jones Wilshire 5000 Index. |
4 | “Ten Largest Holdings” excludes any temporary cash investments and equity index products. See page 23 for a glossary of investment terms. |
6
Performance Summary
All of the returns in this report represent past performance, which is not a guarantee of future results that may be achieved by the fund. (Current performance may be lower or higher than the performance data cited. For performance data current to the most recent month-end, visit our website at www.vanguard.com.) Note, too, that both investment returns and principal value can fluctuate widely, so an investor’s shares, when sold, could be worth more or less than their original cost. The returns shown do not reflect taxes that a shareholder would pay on fund distributions or on the sale of fund shares.
Cumulative Performance: April 27, 2006–January 31, 2007
Initial Investment of $10,000
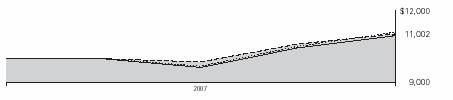
| | Final Value |
| Since | of a $10,000 |
| Inception1 | Investment |
Dividend Appreciation Index Fund Investor Shares2 | 10.02% | $11,002 |
Dow Jones Wilshire 5000 Index | 10.95 | 11,095 |
Dividend Achievers Select Index | 10.31 | 11,031 |
Average Large-Cap Core Fund3 | 9.57 | 10,957 |
| | Final Value |
| Since | of a $10,000 |
| Inception1 | Investment |
Dividend Appreciation Index Fund ETF Shares Net Asset Value | 10.45% | $11,045 |
Dow Jones Wilshire 5000 Index | 10.64 | 11,064 |
Dividend Achievers Select Index | 10.62 | 11,062 |
Cumulative Returns of ETF Shares: April 21, 2006–January 31, 2007 | |
| Cumulative |
| Since Inception |
Dividend Appreciation Index Fund ETF Shares Market Price | 10.63% |
Dividend Appreciation Index Fund ETF Shares Net Asset Value | 10.45 |
Dividend Achievers Select Index | 10.62 |
1 | Inception dates are: for Investor Shares, April 27, 2006; for ETF Shares, April 21, 2006. |
2 | Total return figure does not reflect the $10 annual account maintenance fee applied on balances under $10,000. |
3 | Derived from data provided by Lipper Inc. |
7
Fiscal Period Total Returns (%): April 27, 2006–January 31, 2007
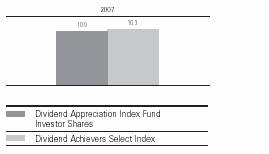
Average Annual Total Returns: Periods Ended December 31, 2006
This table presents average annual total returns through the latest calendar quarter—rather than through the end of the fiscal period. Securities and Exchange Commission rules require that we provide this information.
| Inception Date | Since Inception |
Investor Shares1 | 4/27/2006 | 8.36% |
ETF Shares | 4/21/2006 | |
Market Price | | 8.86 |
Net Asset Value | | 8.77 |
1 | Total return figure does not reflect the $10 annual account maintenance fee applied on balances under $10,000. |
| Note: See Financial Highlights tables on pages 15 and 16 for dividend and capital gains information. |
8
Financial Statements
Statement of Net Assets
As of January 31, 2007
The fund provides a complete list of its holdings four times in each fiscal year, at the quarter-ends. For the second and fourth fiscal quarters, the lists appear in the fund’s semiannual and annual reports to shareholders. For the first and third fiscal quarters, the fund files the lists with the Securities and Exchange Commission on Form N-Q. Shareholders can look up the fund’s Forms N-Q on the SEC’s website at www.sec.gov. Forms N-Q may also be reviewed and copied at the SEC’s Public Reference Room (see the back cover of this report for further information).
| | Market |
| | Value• |
| Shares | ($000) |
Common Stocks (99.9%) | | |
Consumer Discretionary (12.2%) | | |
Home Depot, Inc. | 172,285 | 7,019 |
McDonald’s Corp. | 106,339 | 4,716 |
Target Corp. | 68,420 | 4,198 |
Lowe’s Cos., Inc. | 121,781 | 4,105 |
The McGraw-Hill Cos., Inc. | 30,260 | 2,030 |
Harley-Davidson, Inc. | 21,863 | 1,493 |
Johnson Controls, Inc. | 15,362 | 1,420 |
Gannett Co., Inc. | 20,553 | 1,195 |
TJX Cos., Inc. | 37,059 | 1,096 |
Nordstrom, Inc. | 19,549 | 1,089 |
VF Corp. | 10,473 | 795 |
Sherwin-Williams Co. | 10,668 | 737 |
Genuine Parts Co. | 14,538 | 691 |
Family Dollar Stores, Inc. | 11,608 | 376 |
Leggett & Platt, Inc. | 15,208 | 369 |
The Stanley Works | 6,111 | 350 |
Ross Stores, Inc. | 10,730 | 348 |
Meredith Corp. | 3,079 | 182 |
Harte-Hanks, Inc. | 6,265 | 170 |
Applebee’s International, Inc. | 6,661 | 168 |
John Wiley & Sons Class A | 4,152 | 154 |
^Polaris Industries, Inc. | 3,252 | 152 |
Wolverine World Wide, Inc. | 4,879 | 150 |
Talbots Inc. | 4,555 | 107 |
Matthews International Corp. | 2,510 | 102 |
Media General, Inc. Class A | 2,020 | 81 |
Courier Corp. | 1,131 | 45 |
Bandag, Inc. | 757 | 39 |
Haverty Furniture Cos., Inc. | 1,432 | 22 |
| | 33,399 |
Consumer Staples (21.8%) | | |
Beverages (8.0%) | | |
The Coca-Cola Co. | 198,862 | 9,522 |
PepsiCo, Inc. | 133,355 | 8,700 |
Anheuser-Busch Cos., Inc. | 62,443 | 3,183 |
Brown-Forman Corp. Class B | 5,681 | 373 |
| | Market |
| | Value• |
| Shares | ($000) |
Food & Staples Retailing (6.3%) | | |
Wal-Mart Stores, Inc. | 227,363 | 10,843 |
Walgreen Co. | 85,056 | 3,853 |
Sysco Corp. | 56,106 | 1,938 |
SuperValu Inc. | 16,648 | 632 |
| | |
Food Products (1.6%) | | |
Archer-Daniels-Midland Co. | 56,349 | 1,803 |
Wm. Wrigley Jr. Co. | 18,619 | 959 |
The Hershey Co. | 13,897 | 709 |
Hormel Foods Corp. | 11,503 | 436 |
McCormick & Co., Inc. | 9,816 | 383 |
Lancaster Colony Corp. | 2,583 | 113 |
Tootsie Roll Industries, Inc. | 3,170 | 101 |
| | |
Household Products (5.4%) | | |
The Procter & Gamble Co. | 166,816 | 10,821 |
Colgate-Palmolive Co. | 42,144 | 2,879 |
The Clorox Co. | 12,548 | 821 |
Church & Dwight, Inc. | 5,186 | 235 |
| | |
Personal Products (0.5%) | | |
Avon Products, Inc. | 36,061 | 1,240 |
| | 59,544 |
Energy (8.2%) | | |
Chevron Corp. | 151,368 | 11,032 |
ExxonMobil Corp. | 147,864 | 10,957 |
Holly Corp. | 4,465 | 235 |
Helmerich & Payne, Inc. | 8,131 | 218 |
| | 22,442 |
Financials (20.6%) | | |
Capital Markets (4.6%) | | |
Lehman Brothers Holdings, Inc. | 43,069 | 3,542 |
Franklin Resources Corp. | 19,993 | 2,381 |
State Street Corp. | 26,921 | 1,913 |
Northern Trust Corp. | 18,397 | 1,118 |
Legg Mason Inc. | 10,071 | 1,056 |
T. Rowe Price Group Inc. | 20,369 | 978 |
SEI Investments Co. | 8,053 | 502 |
Eaton Vance Corp. | 10,203 | 350 |
9
| | Market |
| | Value• |
| Shares | ($000) |
Nuveen Investments, Inc.Class A | 6,889 | 341 |
Investors Financial Services Corp. | 5,223 | 244 |
| | |
Commercial Banks (3.2%) | | |
M & T Bank Corp. | 9,411 | 1,142 |
Marshall & Ilsley Corp. | 22,699 | 1,068 |
Synovus Financial Corp. | 26,598 | 849 |
Compass Bancshares Inc. | 10,936 | 666 |
Commerce Bancorp, Inc. | 16,852 | 569 |
Mercantile Bankshares Corp. | 10,796 | 509 |
Colonial BancGroup, Inc. | 13,570 | 333 |
City National Corp. | 4,012 | 289 |
Commerce Bancshares, Inc. | 5,812 | 285 |
Cullen/Frost Bankers, Inc. | 5,137 | 275 |
Bank of Hawaii Corp. | 4,482 | 235 |
The South Financial Group, Inc. | 6,502 | 168 |
Trustmark Corp. | 5,541 | 163 |
Westamerica Bancorporation | 2,812 | 140 |
United Bankshares, Inc. | 3,771 | 138 |
Pacific Capital Bancorp | 4,121 | 132 |
UMB Financial Corp. | 3,579 | 131 |
Chittenden Corp. | 4,032 | 123 |
Greater Bay Bancorp | 4,353 | 122 |
Alabama National BanCorporation | 1,701 | 120 |
Glacier Bancorp, Inc. | 4,091 | 96 |
CVB Financial Corp. | 7,357 | 92 |
First Financial Bankshares, Inc. | 1,777 | 73 |
Sterling Bancshares, Inc. | 5,912 | 71 |
BancFirst Corp. | 1,440 | 70 |
Sterling Financial Corp. (PA) | 2,509 | 57 |
Capital City Bank Group, Inc. | 1,652 | 57 |
First Source Corp. | 1,948 | 56 |
Community Banks, Inc. | 2,140 | 54 |
Irwin Financial Corp. | 2,490 | 54 |
Community Trust Bancorp Inc. | 1,337 | 52 |
IBERIABANK Corp. | 832 | 48 |
Sandy Spring Bancorp, Inc. | 1,320 | 48 |
Banner Corp. | 1,082 | 46 |
West Coast Bancorp | 1,374 | 46 |
Heartland Financial USA, Inc. | 1,426 | 41 |
Renasant Corp. | 1,426 | 40 |
First Financial Corp. (IN) | 1,221 | 40 |
Seacoast Banking Corp. of Florida | 1,679 | 39 |
Simmons First National Corp. | 1,252 | 38 |
First Community Bancshares, Inc. | 918 | 37 |
S.Y. Bancorp, Inc. | 1,260 | 35 |
First State Bancorporation | 1,440 | 33 |
Washington Trust Bancorp, Inc. | 1,151 | 32 |
Old Second Bancorp, Inc. | 1,072 | 31 |
Southwest Bancorp, Inc. | 1,091 | 29 |
Peoples Bancorp, Inc. | 933 | 27 |
Horizon Financial Corp. | 1,034 | 26 |
| | Market |
| | Value• |
| Shares | ($000) |
Consumer Finance (0.6%) | | |
SLM Corp. | 36,629 | 1,683 |
| | |
Insurance (10.2%) | | |
American International Group, Inc. | 158,451 | 10,846 |
The Allstate Corp. | 53,699 | 3,231 |
The Hartford Financial Services Group Inc. | 26,526 | 2,518 |
AFLAC Inc. | 40,534 | 1,930 |
The Chubb Corp. | 35,125 | 1,828 |
Lincoln National Corp. | 23,536 | 1,580 |
Progressive Corp. of Ohio | 65,008 | 1,508 |
MBIA, Inc. | 11,466 | 824 |
Ambac Financial Group, Inc. | 9,077 | 800 |
Old Republic International Corp. | 20,193 | 450 |
Brown & Brown, Inc. | 12,243 | 347 |
Transatlantic Holdings, Inc. | 5,395 | 339 |
HCC Insurance Holdings, Inc. | 9,837 | 307 |
Protective Life Corp. | 5,725 | 280 |
Erie Indemnity Co. Class A | 5,059 | 280 |
Wesco Financial Corp. | 563 | 272 |
Alfa Corp. | 6,885 | 130 |
Hilb, Rogal and Hamilton Co. | 3,052 | 129 |
R.L.I. Corp. | 2,192 | 121 |
State Auto Financial Corp. | 3,512 | 113 |
Harleysville Group, Inc. | 2,567 | 87 |
Midland Co. | 1,660 | 76 |
| | |
Real Estate Management & Development (0.1%) |
Forest City Enterprise Class A | 6,102 | 369 |
| | |
Thrifts & Mortgage Finance (1.9%) | |
Freddie Mac | 61,704 | 4,007 |
People’s Bank | 11,697 | 526 |
Webster Financial Corp. | 4,545 | 226 |
MAF Bancorp, Inc. | 2,810 | 126 |
BankAtlantic Bancorp, Inc.Class A | 4,944 | 66 |
Anchor Bancorp Wisconsin Inc. | 1,863 | 56 |
First Busey Corp. | 1,952 | 46 |
First Financial Holdings, Inc. | 1,136 | 40 |
Flushing Financial Corp. | 1,729 | 30 |
| | 56,421 |
Health Care (11.0%) | | |
Johnson & Johnson | 163,579 | 10,927 |
Abbott Laboratories | 119,128 | 6,314 |
Medtronic, Inc. | 98,134 | 5,245 |
Cardinal Health, Inc. | 30,904 | 2,207 |
Stryker Corp. | 30,411 | 1,884 |
Becton, Dickinson & Co. | 19,245 | 1,481 |
C.R. Bard, Inc. | 8,851 | 730 |
DENTSPLY International Inc. | 12,386 | 382 |
Beckman Coulter, Inc. | 4,862 | 314 |
Hillenbrand Industries, Inc. | 5,339 | 304 |
10
| | Market |
| | Value• |
| Shares | ($000) |
West Pharmaceutical Services, Inc. | 2,803 | 136 |
Arrow International, Inc. | 3,953 | 133 |
Meridian Bioscience Inc. | 1,812 | 54 |
| | 30,111 |
Industrials (15.4%) | | |
General Electric Co. | 299,121 | 10,783 |
United Technologies Corp. | 80,076 | 5,447 |
3M Co. | 60,977 | 4,531 |
Caterpillar, Inc. | 54,188 | 3,472 |
Emerson Electric Co. | 67,148 | 3,020 |
General Dynamics Corp. | 32,645 | 2,551 |
Illinois Tool Works, Inc. | 46,834 | 2,388 |
Danaher Corp. | 25,941 | 1,921 |
Dover Corp. | 17,762 | 881 |
Pitney Bowes, Inc. | 18,047 | 864 |
Parker Hannifin Corp. | 9,376 | 776 |
Expeditors International of Washington, Inc. | 17,427 | 744 |
Avery Dennison Corp. | 9,271 | 634 |
Cintas Corp. | 12,848 | 529 |
W.W. Grainger, Inc. | 6,525 | 507 |
Roper Industries Inc. | 7,089 | 368 |
Harsco Corp. | 3,252 | 279 |
Pentair, Inc. | 8,829 | 275 |
Donaldson Co., Inc. | 7,165 | 252 |
Carlisle Co., Inc. | 2,671 | 218 |
Teleflex Inc. | 3,212 | 214 |
HNI Corp. | 3,812 | 185 |
CLARCOR Inc. | 4,512 | 156 |
Brady Corp. Class A | 3,992 | 150 |
Nordson Corp. | 2,853 | 148 |
Mine Safety Appliances Co. | 3,170 | 122 |
Franklin Electric, Inc. | 1,980 | 100 |
ABM Industries Inc. | 3,612 | 93 |
NACCO Industries, Inc. Class A | 632 | 91 |
Universal Forest Products, Inc. | 1,640 | 80 |
A.O. Smith Corp. | 1,852 | 71 |
McGrath RentCorp | 2,163 | 66 |
Tennant Co. | 1,633 | 50 |
Raven Industries, Inc. | 1,632 | 46 |
Gorman-Rupp Co. | 1,047 | 42 |
Badger Meter, Inc. | 1,080 | 31 |
LSI Industries Inc. | 1,600 | 31 |
| | 42,116 |
Information Technology (5.7%) | | |
International Business | | |
Machines Corp. | 109,856 | 10,892 |
Automatic Data Processing, Inc. | 48,081 | 2,294 |
Paychex, Inc. | 31,516 | 1,261 |
Linear Technology Corp. | 24,816 | 768 |
Diebold, Inc. | 5,999 | 278 |
Jack Henry & Associates Inc. | 7,873 | 168 |
| | 15,661 |
| | | Market |
| | | Value• |
| | Shares | ($000) |
Materials (3.4%) | | |
| Praxair, Inc. | 25,824 | 1,628 | |
| Nucor Corp. | 22,345 | 1,442 | |
| Air Products & Chemicals, Inc. | 17,247 | 1,288 | |
| Rohm & Haas Co. | 18,417 | 959 | |
| Ecolab, Inc. | 21,819 | 958 | |
| Vulcan Materials Co. | 7,045 | 717 | |
| Sigma-Aldrich Corp. | 11,282 | 428 | |
| Martin Marietta Materials, Inc. | 3,415 | 394 | |
| Sonoco Products Co. | 8,331 | 321 | |
| Bemis Co., Inc. | 9,171 | 311 | |
| Albemarle Corp. | 3,621 | 282 | |
| Valspar Corp. | 8,213 | 231 | |
| AptarGroup Inc. | 2,710 | 165 | |
| H.B. Fuller Co. | 5,122 | 133 | |
| Myers Industries, Inc. | 3,012 | 52 | |
| | | 9,309 | |
Telecommunication Services (0.2%) | | | |
| CenturyTel, Inc. | 9,463 | 424 | |
| | | | |
Utilities (1.4%) | | | |
| FPL Group, Inc. | 32,931 | 1,866 | |
| Questar Corp. | 7,465 | 606 | |
| MDU Resources Group, Inc. | 15,863 | 410 | |
| Energen Corp. | 6,449 | 298 | |
| ^Aqua America, Inc. | 11,183 | 248 | |
| UGI Corp. Holding Co. | 8,791 | 241 | |
| SJW Corp. | 1,526 | 61 | |
| American States Water Co. | 1,483 | 58 | |
| Southwest Water Co. | 1,652 | 22 | |
| | | 3,810 | |
Total Common Stocks | | | |
(Cost $261,665) | | 273,237 | |
Temporary Cash Investments (0.3%) | | | |
1 | Vanguard Market Liquidity | | | |
| Fund, 5.272% | 434,311 | 434 | |
1 | Vanguard Market Liquidity | | | |
| Fund, 5.272%—Note F | 400,300 | 400 | |
Total Temporary Cash Investments | | |
(Cost $834) | | 834 | |
Total Investments (100.2%) | | | |
(Cost $262,499) | | 274,071 | |
Other Assets and Liabilities—Net (–0.2%) | (452) | |
Net Assets (100%) | | 273,619 | |
| | | | | | |
11
| Market |
| Value• |
| ($000) |
Statement of Assets and Liabilities | |
Assets | |
Investments in Securities, at Value | 274,071 |
Receivables for Investment | |
Securities Sold | 28,046 |
Other Assets—Note B | 484 |
Total Assets | 302,601 |
Liabilities | |
Payables for Investment | |
Securities Purchased | 28,378 |
Other Liabilities—Note F | 604 |
Total Liabilities | 28,982 |
Net Assets | 273,619 |
At January 31, 2007, net assets consisted of:2 |
| Amount |
| ($000) |
Paid-in Capital | 262,002 |
Undistributed Net Investment Income | 126 |
Accumulated Net Realized Losses | (81) |
Unrealized Appreciation | 11,572 |
Net Assets | 273,619 |
| |
| |
Investor Shares—Net Assets | |
Applicable to 7,456,264 outstanding $.001 | |
par value shares of beneficial interest | |
(unlimited authorization) | 162,881 |
Net Asset Value Per Share— | |
Investor Shares | $21.84 |
| |
| |
ETF Shares—Net Assets | |
Applicable to 2,028,323 outstanding $.001 | |
par value shares of beneficial interest | |
(unlimited authorization) | 110,738 |
Net Asset Value Per Share— | |
ETF Shares | $54.60 |
• | See Note A in Notes to Financial Statements. |
^ | Part of security position is on loan to broker-dealers. See Note F in Notes to Financial Statements. |
1 | Affiliated money market fund available only to Vanguard funds and certain trusts and accounts managed by Vanguard. Rate shown is the 7-day yield. |
2 | See Note D in Notes to Financial Statements for the tax-basis components of net assets. |
12
Statement of Operations
| April 21, 20061 to |
| January 31, 2007 |
| ($000) |
Investment Income | |
Income | |
Dividends | 1,988 |
Interest2 | 60 |
Security Lending | — |
Total Income | 2,048 |
Expenses | |
The Vanguard Group—Note B | |
Investment Advisory Services | 28 |
Management and Administrative | |
Investor Shares | 176 |
ETF Shares | 83 |
Marketing and Distribution | |
Investor Shares | 9 |
ETF Shares | 6 |
Custodian Fees | 33 |
Auditing Fees | 23 |
Shareholders’ Reports | |
Investor Shares | 8 |
ETF Shares | 1 |
Total Expenses | 367 |
Expenses Paid Indirectly—Note C | (3) |
Net Expenses | 364 |
Net Investment Income | 1,684 |
Realized Net Gain (Loss) on Investment Securities Sold | 3,114 |
Change in Unrealized Appreciation (Depreciation) of Investment Securities | 11,572 |
Net Increase (Decrease) in Net Assets Resulting from Operations | 16,370 |
2 | Interest income from an affiliated company of the fund was $60,000. |
13
Statement of Changes in Net Assets
| April 21, 20061 to |
| January 31, 2007 |
| ($000) |
Increase (Decrease) in Net Assets | |
Operations | |
Net Investment Income | 1,684 |
Realized Net Gain (Loss) | 3,114 |
Change in Unrealized Appreciation (Depreciation) | 11,572 |
Net Increase (Decrease) in Net Assets Resulting from Operations | 16,370 |
Distributions | |
Net Investment Income | |
Investor Shares | (959) |
ETF Shares | (599) |
Realized Capital Gain | |
Investor Shares | — |
ETF Shares | — |
Total Distributions | (1,558) |
Capital Share Transactions—Note G | |
Investor Shares | 153,498 |
ETF Shares | 105,309 |
Net Increase (Decrease) from Capital Share Transactions | 258,807 |
Total Increase (Decrease) | 273,619 |
Net Assets | |
Beginning of Period | — |
End of Period2 | 273,619 |
2 | Net Assets—End of Period includes undistributed net investment income of $126,000. |
14
Financial Highlights
Dividend Appreciation Index Fund Investor Shares | |
| April 27, 20061 to |
For a Share Outstanding Throughout the Period | January 31, 2007 |
Net Asset Value, Beginning of Period | $20.05 |
Investment Operations | |
Net Investment Income | .214 |
Net Realized and Unrealized Gain (Loss) on Investments | 1.782 |
Total from Investment Operations | 1.996 |
Distributions | |
Dividends from Net Investment Income | (.206) |
Distributions from Realized Capital Gains | — |
Total Distributions | (.206) |
Net Asset Value, End of Period | $21.84 |
| |
Total Return2 | 10.02% |
| |
Ratios/Supplemental Data | |
Net Assets, End of Period (Millions) | $163 |
Ratio of Total Expenses to Average Net Assets | 0.40%* |
Ratio of Net Investment Income to Average Net Assets | 1.53%* |
Portfolio Turnover Rate3 | 21% |
2 | Total returns do not reflect the $10 annual account maintenance fee applied on balances under $10,000. |
3 | Excludes the value of portfolio securities received or delivered as a result of in-kind purchases or redemptions of the fund’s capital shares, including ETF creation units. |
15
Dividend Appreciation Index Fund ETF Shares | |
| April 21, 20061 to |
For a Share Outstanding Throughout the Period | January 31, 2007 |
Net Asset Value, Beginning of Period | $49.94 |
Investment Operations | |
Net Investment Income | .555 |
Net Realized and Unrealized Gain (Loss) on Investments | 4.631 |
Total from Investment Operations | 5.186 |
Distributions | |
Dividends from Net Investment Income | (.526) |
Distributions from Realized Capital Gains | — |
Total Distributions | (.526) |
Net Asset Value, End of Period | $54.60 |
| |
Total Return | 10.45% |
| |
Ratios/Supplemental Data | |
Net Assets, End of Period (Millions) | $111 |
Ratio of Total Expenses to Average Net Assets | 0.28%* |
Ratio of Net Investment Income to Average Net Assets | 1.65%* |
Portfolio Turnover Rate2 | 21% |
2 | Excludes the value of portfolio securities received or delivered as a result of in-kind purchases or redemptions of the fund’s capital shares, including ETF creation units. |
See accompanying Notes, which are an integral part of the Financial Statements.
16
Notes to Financial Statements
Vanguard Dividend Appreciation Index Fund is registered under the Investment Company Act of 1940 as an open-end investment company, or mutual fund. The fund files reports with the SEC under the company name Vanguard Specialized Funds. The fund offers two classes of shares: Investor Shares and ETF Shares. Investor Shares were first issued on April 27, 2006, and are available to any investor who meets the fund’s minimum purchase requirements. ETF Shares were first issued on April 21, 2006, and first offered to the public on April 27, 2006. ETF Shares are listed for trading on the American Stock Exchange; they can be purchased and sold through a broker.
A. The following significant accounting policies conform to generally accepted accounting principles for U.S. mutual funds. The fund consistently follows such policies in preparing its financial statements.
1. Security Valuation: Securities are valued as of the close of trading on the New York Stock Exchange (generally 4:00 p.m. Eastern time) on the valuation date. Equity securities are valued at the latest quoted sales prices or official closing prices taken from the primary market in which each security trades; such securities not traded on the valuation date are valued at the mean of the latest quoted bid and asked prices. Securities for which market quotations are not readily available, or whose values have been materially affected by events occurring before the fund’s pricing time but after the close of the securities’ primary markets, are valued by methods deemed by the board of trustees to represent fair value. Investments in Vanguard Market Liquidity Fund are valued at that fund’s net asset value.
2. Federal Income Taxes: The fund intends to qualify as a regulated investment company and distribute all of its taxable income. Accordingly, no provision for federal income taxes is required in the financial statements.
3. Distributions: Distributions to shareholders are recorded on the ex-dividend date.
4. Security Lending: The fund may lend its securities to qualified institutional borrowers to earn additional income. Security loans are required to be secured at all times by collateral at least equal to the market value of securities loaned. The fund invests cash collateral received in Vanguard Market Liquidity Fund and records a liability for the return of the collateral, during the period the securities are on loan. Security lending income represents the income earned on investing cash collateral, less expenses associated with the loan.
5. Other: Dividend income is recorded on the ex-dividend date. Interest income includes income distributions received from Vanguard Market Liquidity Fund and is accrued daily. Security transactions are accounted for on the date securities are bought or sold. Costs used to determine realized gains (losses) on the sale of investment securities are those of the specific securities sold.
Each class of shares has equal rights as to assets and earnings, except that each class separately bears certain class-specific expenses related to maintenance of shareholder accounts (included in Management and Administrative expenses) and shareholder reporting. Marketing and distribution expenses are allocated to each class of shares based on a method approved by the board of trustees. Income, other non-class-specific expenses, and gains and losses on investments are allocated to each class of shares based on its relative net assets.
B. The Vanguard Group furnishes at cost investment advisory, corporate management, administrative, marketing, and distribution services. The costs of such services are allocated to the fund under methods approved by the board of trustees. The fund has committed to provide up to 0.40% of its net assets in capital contributions to Vanguard. At January 31, 2007, the fund had contributed capital
17
of $24,000 to Vanguard (included in Other Assets), representing 0.01% of the fund’s net assets and 0.02% of Vanguard’s capitalization. The fund’s trustees and officers are also directors and officers of Vanguard.
C. The fund’s custodian bank has agreed to reduce its fees when the fund maintains cash on deposit in the non-interest-bearing custody account. For the period ended January 31, 2007, custodian fee offset arrangements reduced the fund’s expenses by $3,000.
D. Distributions are determined on a tax basis and may differ from net investment income and realized capital gains for financial reporting purposes. Differences may be permanent or temporary. Permanent differences are reclassified among capital accounts in the financial statements to reflect their tax character. Temporary differences arise when certain items of income, expense, gain, or loss are recognized in different periods for financial statement and tax purposes; these differences will reverse at some time in the future. Differences in classification may also result from the treatment of short-term gains as ordinary income for tax purposes.
During the period ended January 31, 2007, the fund realized $3,195,000 of net capital gains resulting from in-kind redemptions—in which shareholders exchanged fund shares for securities held by the fund rather than for cash. Because such gains are not taxable to the fund, and are not distributed to shareholders, they have been reclassified from accumulated net realized losses to paid-in capital.
For tax purposes, at January 31, 2007, the fund had $428,000 of ordinary income and no long-term gains available for distribution.
At January 31, 2007, the cost of investment securities for tax purposes was $262,886,000. Net unrealized appreciation of investment securities for tax purposes was $11,185,000 consisting of unrealized gains of $12,891,000 on securities that had risen in value since their purchase and $1,706,000 in unrealized losses on securities that had fallen in value since their purchase.
E. During the period ended January 31, 2007, the fund purchased $321,989,000 of investment securities and sold $63,439,000 of investment securities other than temporary cash investments.
F. The market value of securities on loan to broker-dealers at January 31, 2007, was $388,000, for which the fund received cash collateral of $400,000.
16
G. Capital share transactions for each class of shares were:
| April 21, 20061 to January 31, 2007 |
| Amount | Shares |
| ($000) | (000) |
Investor Shares | | |
Issued | 164,261 | 7,978 |
Issued in Lieu of Cash Distributions | 586 | 28 |
Redeemed | (11,349) | (550) |
Net Increase (Decrease)—Investor Shares | 153,498 | 7,456 |
ETF Shares | | |
Issued | 136,841 | 2,628 |
Issued in Lieu of Cash Distributions | — | — |
Redeemed | (31,532) | (600) |
Net Increase (Decrease)—ETF Shares | 105,309 | 2,028 |
H. In June 2006, the Financial Accounting Standards Board issued Interpretation No. 48 (“FIN 48”), “Accounting for Uncertainty in Income Taxes.” FIN 48 establishes the minimum threshold for recognizing, and a system for measuring, the benefits of tax-return positions in financial statements. FIN 48 will be effective for the fund’s fiscal year ending January 31, 2008. Management is in the process of analyzing the fund’s tax positions for purposes of implementing FIN 48; based on the analysis completed to date, management does not believe the adoption of FIN 48 will result in any material impact to the fund’s financial statements.
19
Report of Independent Registered Public Accounting Firm
To the Trustees of Vanguard Specialized Funds and Shareholders of Vanguard Dividend Appreciation Index Fund:
In our opinion, the accompanying statements of net assets and of assets and liabilities and the related statements of operations and of changes in net assets and the financial highlights present fairly, in all material respects, the financial position of Vanguard Dividend Appreciation Index Fund (one of the funds constituting Vanguard Specialized Funds, hereafter referred to as the “Fund”) at January 31, 2007, the results of its operations and the changes in its net assets for the period from April 21, 2006 (commencement of operations) to January 31, 2007 and the financial highlights for the periods indicated, in conformity with accounting principles generally accepted in the United States of America. These financial statements and financial highlights (hereafter referred to as “financial statements”) are the responsibility of the Fund’s management; our responsibility is to express an opinion on these financial statements based on our audit. We conducted our audit of these financial statements in accordance with the standards of the Public Company Accounting Oversight Board (United States). Those standards require that we plan and perform the audit to obtain reasonable assurance about whether the financial statements are free of material misstatement. An audit includes examining, on a test basis, evidence supporting the amounts and disclosures in the financial statements, assessing the accounting principles used and significant estimates made by management, and evaluating the overall financial statement presentation. We believe that our audit, which included confirmation of securities at January 31, 2007 by correspondence with the custodian and by agreement to the underlying ownership records for Vanguard Market Liquidity Fund, provide a reasonable basis for our opinion.
PricewaterhouseCoopers LLP
Philadelphia, Pennsylvania
March 13, 2007
Special 2006 tax information (unaudited) for Vanguard Dividend Appreciation Index Fund
This information for the fiscal period ended January 31, 2007, is included pursuant to provisions of the Internal Revenue Code.
The fund distributed $1,558,000 of qualified dividend income to shareholders during the fiscal period.
For corporate shareholders, 98.2% of investment income (dividend income plus short-term gains, if any) qualifies for the dividends-received deduction.
20
About Your Fund’s Expenses
As a shareholder of the fund, you incur ongoing costs, which include costs for portfolio management, administrative services, and shareholder reports (like this one), among others. Operating expenses, which are deducted from a fund’s gross income, directly reduce the investment return of the fund.
A fund’s expenses are expressed as a percentage of its average net assets. This figure is known as the expense ratio. The following examples are intended to help you understand the ongoing costs (in dollars) of investing in your fund and to compare these costs with those of other mutual funds. The examples are based on an investment of $1,000 made at the beginning of the period shown and held for the entire period.
The table below illustrates your fund’s costs in two ways:
• Based on actual fund return. This section helps you to estimate the actual expenses that you paid over the period. The “Ending Account Value” shown is derived from the fund’s actual return, and the third column shows the dollar amount that would have been paid by an investor who started with $1,000 in the fund. You may use the information here, together with the amount you invested, to estimate the expenses that you paid over the period.
To do so, simply divide your account value by $1,000 (for example, an $8,600 account value divided by $1,000 = 8.6), then multiply the result by the number given for your fund under the heading “Expenses Paid During Period.”
• Based on hypothetical 5% yearly return. This section is intended to help you compare your fund’s costs with those of other mutual funds. It assumes that the fund had a yearly return of 5% before expenses, but that the expense ratio is unchanged. In this case—because the return used is not the fund’s actual return—the results do not apply to your investment. The example is useful in making comparisons because the Securities and Exchange Commission requires all mutual funds to calculate expenses based on a 5% return. You can assess your fund’s costs by comparing this hypothetical example with the hypothetical examples that appear in shareholder reports of other funds.
Six Months Ended January 31, 2007 | | | |
| Beginning | Ending | Expenses |
| Account Value | Account Value | Paid During |
Dividend Appreciation Index Fund | 7/31/2006 | 1/31/2007 | Period1 |
Based on Actual Fund Return | | | |
Investor Shares | $1,000.00 | $1,116.30 | $2.13 |
ETF Shares | 1,000.00 | 1,117.47 | 1.49 |
Based on Hypothetical 5% Return | | | |
Investor Shares | $1,000.00 | $1,023.19 | $2.04 |
ETF Shares | 1,000.00 | 1,023.79 | 1.43 |
1 | These calculations are based on expenses incurred in the most recent six-month period. The fund’s annualized six-month expense ratios for that period are 0.40% for Investor Shares, and 0.28% for ETF Shares. The dollar amounts shown as “Expenses Paid” are equal to the annualized expense ratio multiplied by the average account value over the period, multiplied by the number of days in the most recent six-month period, then divided by the number of days in the most recent 12-month period. |
21
Note that the expenses shown in the table on page 21 are meant to highlight and help you compare ongoing costs only and do not reflect any transactional costs or account maintenance fees. They do not include your fund’s low-balance fee, which is described in the prospectus. If this fee were applied to your account, your costs would be higher. Your fund does not charge transaction fees, such as purchase or redemption fees, nor does it carry a “sales load.”
The calculations assume no shares were bought or sold during the period. Your actual costs may have been higher or lower, depending on the amount of your investment and the timing of any purchases or redemptions.
You can find more information about the fund’s expenses, including annual expense ratios, in the Financial Statements section of this report. For additional information on operating expenses and other shareholder costs, please refer to the appropriate fund prospectus.
22
Glossary
Earnings Growth Rate. The average annual rate of growth in earnings over the past five years for the stocks now in a fund.
Expense Ratio. The percentage of a fund’s average net assets used to pay its annual administrative and advisory expenses. These expenses directly reduce returns to investors.
Foreign Holdings. The percentage of a fund represented by stocks or depositary receipts of companies based outside the United States.
Inception Date. The date on which the assets of a fund (or one of its share classes) are first invested in accordance with the fund’s investment objective. For funds with a subscription period, the inception date is the day after that period ends. Investment performance is measured from the inception date.
Median Market Cap. An indicator of the size of companies in which a fund invests; the midpoint of market capitalization (market price x shares outstanding) of a fund’s stocks, weighted by the proportion of the fund’s assets invested in each stock. Stocks representing half of the fund’s assets have market capitalizations above the median, and the rest are below it.
Price/Book Ratio. The share price of a stock divided by its net worth, or book value, per share. For a fund, the weighted average price/book ratio of the stocks it holds.
Price/Earnings Ratio. The ratio of a stock’s current price to its per-share earnings over the past year. For a fund, the weighted average P/E of the stocks it holds. P/E is an indicator of market expectations about corporate prospects; the higher the P/E, the greater the expectations for a company’s future growth.
Return on Equity. The annual average rate of return generated by a company during the past five years for each dollar of shareholder’s equity (net income divided by shareholder’s equity). For a fund, the weighted average return on equity for the companies whose stocks it holds.
Short-Term Reserves. The percentage of a fund invested in highly liquid, short-term securities that can be readily converted to cash.
Turnover Rate. An indication of the fund’s trading activity. Funds with high turnover rates incur higher transaction costs and may be more likely to distribute capital gains (which may be taxable to investors). The turnover rate excludes in-kind transactions, which have minimal impact on costs.
Yield. A snapshot of a fund’s income from interest and dividends. The yield, expressed as a percentage of the fund’s net asset value, is based on income earned over the past 30 days and is annualized, or projected forward for the coming year. The index yield is based on the current annualized rate of income provided by securities in the index.
23
The People Who Govern Your Fund
The trustees of your mutual fund are there to see that the fund is operated and managed in your best interests since, as a shareholder, you are a part owner of the fund. Your fund’s trustees also serve on the board of directors of The Vanguard Group, Inc., which is owned by the Vanguard funds and provides services to them on an at-cost basis.
A majority of Vanguard’s board members are independent, meaning that they have no affiliation with Vanguard or the funds they oversee, apart from the sizable personal investments they have made as private individuals.
Our independent board members bring distinguished backgrounds in business, academia, and public service to their task of working with Vanguard officers to establish the policies and oversee the activities of the funds. Among board members’ responsibilities are selecting investment advisors for the funds; monitoring fund operations, performance, and costs; reviewing contracts; nominating and selecting new trustees/directors; and electing Vanguard officers.
Each trustee serves a fund until its termination; or until the trustee’s retirement, resignation, or death; or otherwise as specified in the fund’s organizational documents. Any trustee may be removed at a shareholders’ meeting by a vote representing two-thirds of the net asset value of all shares of the fund together with shares of other Vanguard funds organized within the same trust. The table on these two pages shows information for each trustee and executive officer of the fund. The mailing address of the trustees and officers is P.O. Box 876, Valley Forge, PA 19482.
Chairman of the Board, Chief Executive Officer, and Trustee |
| |
John J. Brennan1 | |
Born 1954 | Principal Occupation(s) During the Past Five Years: Chairman of the Board, Chief |
Trustee since May 1987; | Executive Officer, and Director/Trustee of The Vanguard Group, Inc., and of each |
Chairman of the Board and | of the investment companies served by The Vanguard Group. |
Chief Executive Officer | |
146 Vanguard Funds Overseen |
| |
Independent Trustees | |
| |
Charles D. Ellis | |
Born 1937 | Principal Occupation(s) During the Past Five Years: Applecore Partners (pro bono ventures |
Trustee since January 2001 | in education); Senior Advisor to Greenwich Associates (international business strategy |
146 Vanguard Funds Overseen | consulting); Successor Trustee of Yale University; Overseer of the Stern School of Business |
| at New York University; Trustee of the Whitehead Institute for Biomedical Research. |
| |
Rajiv L. Gupta | |
Born 1945 | Principal Occupation(s) During the Past Five Years: Chairman and Chief Executive Officer |
Trustee since December 20012 | of Rohm and Haas Co. (chemicals); Board Member of the American Chemistry Council; |
146 Vanguard Funds Overseen | Director of Tyco International, Ltd. (diversified manufacturing and services) (since 2005); |
| Trustee of Drexel University and of the Chemical Heritage Foundation. |
| |
Amy Gutmann | |
Born 1949 | Principal Occupation(s) During the Past Five Years: President of the University of |
Trustee since June 2006 | Pennsylvania since 2004; Professor in the School of Arts and Sciences, Annenberg School |
146 Vanguard Funds Overseen | for Communication, and Graduate School of Education of the University of Pennsylvania |
| since 2004; Provost (2001–2004) and Laurance S. Rockefeller Professor of Politics and the |
| University Center for Human Values (1990–2004), Princeton University; Director of Carnegie |
| Corporation of New York and of Philadelphia 2016 (since 2005) and of Schuylkill River |
| Development Corporation and Greater Philadelphia Chamber of Commerce (since 2004). |
JoAnn Heffernan Heisen | |
Born 1950 | Principal Occupation(s) During the Past Five Years: Corporate Vice President and Chief |
Trustee since July 1998 | Global Diversity Officer (since January 2006), Vice President and Chief Information |
146 Vanguard Funds Overseen | Officer (1997–2005), and Member of the Executive Committee of Johnson & Johnson |
| (pharmaceuticals/consumer products); Director of the University Medical Center at |
| Princeton and Women’s Research and Education Institute. |
| |
André F. Perold | |
Born 1952 | Principal Occupation(s) During the Past Five Years: George Gund Professor of Finance and |
Trustee since December 2004 | Banking, Harvard Business School (since 2000); Senior Associate Dean, Director of Faculty |
146 Vanguard Funds Overseen | Recruiting, and Chair of Finance Faculty, Harvard Business School; Director and Chairman |
| of UNX, Inc. (equities trading firm) (since 2003); Director of registered investment |
| companies advised by Merrill Lynch Investment Managers and affiliates (1985–2004), |
| Genbel Securities Limited (South African financial services firm) (1999–2003), Gensec |
| Bank (1999–2003), Sanlam, Ltd. (South African insurance company) (2001–2003), and |
| Stockback, Inc. (credit card firm) (2000–2002). |
| |
Alfred M. Rankin, Jr. | |
Born 1941 | Principal Occupation(s) During the Past Five Years: Chairman, President, Chief Executive |
Trustee since January 1993 | Officer, and Director of NACCO Industries, Inc. (forklift trucks/housewares/ lignite); |
146 Vanguard Funds Overseen | Director of Goodrich Corporation (industrial products/aircraft systems and services). |
| |
J. Lawrence Wilson | |
Born 1936 | Principal Occupation(s) During the Past Five Years: Retired Chairman and Chief Executive |
Trustee since April 1985 | Officer of Rohm and Haas Co. (chemicals); Director of Cummins Inc. (diesel engines), |
146 Vanguard Funds Overseen | MeadWestvaco Corp. (packaging products), and AmerisourceBergen Corp. (pharmaceutical |
| distribution); Trustee of Vanderbilt University and of Culver Educational Foundation. |
| |
Executive Officers1 | |
| |
Heidi Stam | |
Born 1956 | Principal Occupation(s) During the Past Five Years: Managing Director of The Vanguard |
Secretary since July 2005 | Group, Inc., since 2006; General Counsel of The Vanguard Group since 2005; Secretary |
146 Vanguard Funds Overseen | of The Vanguard Group, and each of the investment companies served by The Vanguard |
| Group, since 2005; Principal of The Vanguard Group (1997-2006). |
| |
Thomas J. Higgins | |
Born 1957 | Principal Occupation(s) During the Past Five Years: Principal of The Vanguard Group, Inc.; |
Treasurer since July 1998 | Treasurer of each of the investment companies served by The Vanguard Group. |
146 Vanguard Funds Overseen | |
| |
Vanguard Senior Management Team |
| |
R. Gregory Barton | Kathleen C. Gubanich | Michael S. Miller |
Mortimer J. Buckley | Paul A. Heller | Ralph K. Packard |
James H. Gately | F. William McNabb, III | George U. Sauter |
| |
Founder | |
| |
John C. Bogle | |
Chairman and Chief Executive Officer, 1974–1996 |
1 Officers of the funds are “interested persons” as defined in the Investment Company Act of 1940.
2 December 2002 for Vanguard Equity Income Fund, Vanguard Growth Equity Fund, the Vanguard Municipal Bond Funds, and the Vanguard State Tax-Exempt Funds.
More information about the trustees is in the Statement of Additional Information, available from The Vanguard Group.
| 
|
| P.O. Box 2600 |
| Valley Forge, PA 19482-2600 |
Connect with Vanguard™ > www.vanguard.com
Fund Information > 800-662-7447 | All comparative mutual fund data are from Lipper Inc. |
| or Morningstar, Inc., unless otherwise noted. |
Direct Investor Account Services > 800-662-2739 | |
| You can obtain a free copy of Vanguard’s proxy voting |
Institutional Investor Services > 800-523-1036 | guidelines by visiting our website, www.vanguard.com, |
| and searching for “proxy voting guidelines,” or by calling |
Text Telephone for the | Vanguard at 800-662-2739. They are also available from |
Hearing Impaired > 800-952-3335 | the SEC’s website, www.sec.gov. In addition, you may |
| obtain a free report on how your fund voted the proxies for |
| securities it owned during the 12 months ended June 30. |
| To get the report, visit either www.vanguard.com |
| or www.sec.gov. |
This material may be used in conjunction | |
with the offering of shares of any Vanguard | You can review and copy information about your fund |
fund only if preceded or accompanied by | at the SEC’s Public Reference Room in Washington, D.C. |
the fund’s current prospectus. | To find out more about this public service, call the SEC |
| at 202-551-8090. Information about your fund is also |
Vanguard, Vanguard ETF, Connect with Vanguard, and the | available on the SEC’s website, and you can receive |
ship logo are trademarks of The Vanguard Group, Inc. | copies of this information, for a fee, by sending a |
| request in either of two ways: via e-mail addressed to |
“Dividend Achievers” is a trademark of Mergent, Inc., and | publicinfo@sec.gov or via regular mail addressed to the |
has been licensed for use by The Vanguard Group, Inc. | Public Reference Section, Securities and Exchange |
Vanguard mutual funds are not sponsored, endorsed, sold, | Commission, Washington, DC 20549-0102. |
or promoted by Mergent, and Mergent makes no | |
representation regarding the advisability of investing in | |
the funds. | |
| |
All other marks are the exclusive property of their | |
respective owners. | |
| |
| |
| |
| |
| |
| |
| |
| © 2007 The Vanguard Group, Inc. |
| All rights reserved. |
| Vanguard Marketing Corporation, Distributor. |
| |
| Q6020 032007 |
Item 2: Code of Ethics. The Registrant has adopted a code of ethics that applies to the Registrant’s principal executive officer, principal financial officer, principal accounting officer or controller or persons performing similar functions. The Code of Ethics was amended during the reporting period covered by this report to make certain technical, non-material changes.
Item 3: Audit Committee Financial Expert. The following members of the Audit Committee have been determined by the Registrant’s Board of Trustees to be Audit Committee Financial Experts serving on its Audit Committee, and to be independent: Charles D. Ellis, Rajiv L. Gupta, JoAnn Heffernan Heisen, André F. Perold, Alfred M. Rankin, Jr., and J. Lawrence Wilson.
Item 4: Principal Accountant Fees and Services.
(a) Audit Fees.
Audit Fees of the Registrant | |
Fiscal Year Ended January 31, 2007: | $142,000 |
Fiscal Year Ended January 31, 2006: | $90,000 |
Aggregate Audit Fees of Registered Investment Companies in the Vanguard Group.
Fiscal Year Ended January 31, 2007: | $2,347,620 |
Fiscal Year Ended January 31, 2006: | $2,152,740 |
(b) Audit-Related Fees.
Fiscal Year Ended January 31, 2007: | $530,000 |
Fiscal Year Ended January 31, 2006: | $382,200 |
Includes fees billed in connection with assurance and related services provided to the Registrant, The Vanguard Group, Inc., Vanguard Marketing Corporation, and other registered investment companies in the Vanguard Group.
(c) Tax Fees.
Fiscal Year Ended January 31, 2007: | $101,300 |
Fiscal Year Ended January 31, 2006: | $98,400 |
Includes fees billed in connection with tax compliance, planning and advice services provided to the Registrant, The Vanguard Group, Inc., Vanguard Marketing Corporation, and other registered investment companies in the Vanguard Group and related to income and excise taxes.
(d) All Other Fees.
Fiscal Year Ended January 31, 2007: | $0 |
Fiscal Year Ended January 31, 2006: | $0 |
Includes fees billed for services related to risk management and privacy matters. Services were provided to the Registrant, The Vanguard Group, Inc., Vanguard Marketing Corporation, and other registered investment companies in the Vanguard Group.
(e) (1) Pre-Approval Policies. The policy of the Registrant’s Audit Committee is to consider and, if appropriate, approve before the principal accountant is engaged for such services, all specific audit and non-audit services provided to: (1) the Registrant; (2) The Vanguard Group, Inc.; (3) other entities controlled by The Vanguard Group, Inc. that provide ongoing services to the Registrant; and (4) other registered investment companies in the Vanguard Group. In making a determination, the Audit Committee considers whether the services are consistent with maintaining the principal accountant’s independence.
In the event of a contingency situation in which the principal accountant is needed to provide services in between scheduled Audit Committee meetings, the Chairman of the Audit Committee would be called on to consider and, if appropriate, pre-approve audit or permitted non-audit services in an amount sufficient to complete services through the next Audit Committee meeting, and to determine if such services would be consistent with maintaining the accountant’s independence. At the next scheduled Audit Committee meeting, services and fees would be presented to the Audit Committee for formal consideration, and, if appropriate, approval by the entire Audit Committee. The Audit Committee would again consider whether such services and fees are consistent with maintaining the principal accountant’s independence.
The Registrant’s Audit Committee is informed at least annually of all audit and non-audit services provided by the principal accountant to the Vanguard complex, whether such services are provided to: (1) the Registrant; (2) The Vanguard Group, Inc.; (3) other entities controlled by The Vanguard Group, Inc. that provide ongoing services to the Registrant; or (4) other registered investment companies in the Vanguard Group.
(2) No percentage of the principal accountant’s fees or services were approved pursuant to the waiver provision of paragraph (c)(7)(i)(C) of Rule 2-01 of Regulation S-X.
(f) For the most recent fiscal year, over 50% of the hours worked under the principal accountant’s engagement were not performed by persons other than full-time, permanent employees of the principal accountant.
(g) Aggregate Non-Audit Fees.
Fiscal Year Ended January 31, 2007: | $101,300 |
Fiscal Year Ended January 31, 2006: | $98,400 |
Includes fees billed for non-audit services provided to the Registrant, The Vanguard Group, Inc., Vanguard Marketing Corporation, and other registered investment companies in the Vanguard Group.
(h) For the most recent fiscal year, the Audit Committee has determined that the provision of all non-audit services was consistent with maintaining the principal accountant’s independence.
Item 5: The Registrant is a listed issuer as defined in Rule 10A-3 under the Securities Exchange Act of 1934 (“Exchange Act”). The Registrant has a separately-designated standing audit committee established in accordance with Section 3(a)(58)(A) of the Exchange Act. The Registrant’s audit committee members are: Charles D. Ellis, Rajiv L. Gupta, Amy Gutmann, JoAnn Heffernan Heisen, André F. Perold, Alfred M. Rankin, Jr., and J. Lawrence Wilson.
Item 6: Not Applicable.
Item 7: Not Applicable.
Item 8: Not Applicable.
Item 9: Not Applicable.
Item 10: Not Applicable.
Item 11: Controls and Procedures.
(a) Disclosure Controls and Procedures. The Principal Executive and Financial Officers concluded that the Registrant's Disclosure Controls and Procedures are effective based on their evaluation of the Disclosure Controls and Procedures as of a date within 90 days of the filing date of this report.
(b) Internal Control Over Financial Reporting. There were no significant changes in Registrant’s Internal Control Over Financial Reporting or in other factors that could significantly affect this control subsequent to the date of the evaluation, including any corrective actions with regard to significant deficiencies and material weaknesses.
Item 12: Exhibits.
(a) Code of Ethics.
(b) Certifications.
Pursuant to the requirements of the Securities Exchange Act of 1934 and the Investment Company Act of 1940, the registrant has duly caused this report to be signed on its behalf by the undersigned, thereunto duly authorized.
VANGUARD SPECIALIZED FUNDS
BY: | (signature) |
| (HEIDI STAM) |
| JOHN J. BRENNAN* |
| CHIEF EXECUTIVE OFFICER |
Date: March 16, 2007
Pursuant to the requirements of the Securities Exchange Act of 1934 and the Investment Company Act of 1940, this report has been signed below by the following persons on behalf of the registrant and in the capacities and on the dates indicated.
VANGUARD SPECIALIZED FUNDS
BY: | (signature) |
| (HEIDI STAM) |
| JOHN J. BRENNAN* |
| CHIEF EXECUTIVE OFFICER |
Date: March 16, 2007
VANGUARD SPECIALIZED FUNDS
BY: | (signature) |
| (HEIDI STAM) |
| THOMAS J. HIGGINS* |
| TREASURER |
Date: March 16, 2007
*By Power of Attorney. See File Number 002-65955-99, filed on July 27, 2006. Incorporated by Reference.