UNITED STATES
SECURITIES AND EXCHANGE COMMISSION
Washington, D.C. 20549
FORM N-CSR
CERTIFIED SHAREHOLDER REPORT
OF
REGISTERED MANAGEMENT INVESTMENT COMPANIES
Investment Company Act file number: 811-3916
Name of Registrant: Vanguard Specialized Funds
Address of Registrant: | P.O. Box 2600 |
| Valley Forge, PA 19482 |
| |
Name and address of agent for service: | Heidi Stam, Esquire |
| P.O. Box 876 |
| Valley Forge, PA 19482 |
| |
Registrant’s telephone number, including area code: (610) 669-1000
Date of fiscal year end: January 31
Date of reporting period: February 1, 2007–January 31, 2008
Item 1: Reports to Shareholders |
> | As oil prices soared to record levels, Vanguard Energy Fund Investor Shares returned 25.0% for the fiscal year ended January 31, 2008. |
> | With strong performance across its diversified portfolio, the fund outperformed its energy sector benchmark by 3 percentage points, but fell slightly short of the average gain of peer funds. |
> | For the decade ended January 31, the Energy Fund Investor Shares’ average annual return of 18.1% bested the average annual return of peer funds as well as the returns of the benchmark and the broad U.S. stock market. |
Contents | |
| |
Your Fund’s Total Returns | 1 |
Chairman’s Letter | 2 |
Advisors’ Report | 7 |
Fund Profile | 9 |
Performance Summary | 12 |
Financial Statements | 14 |
Your Fund’s After-Tax Returns | 29 |
About Your Fund’s Expenses | 30 |
Glossary | 32 |
Past performace is not a guarantee of future results. (Current performance may be lower or higher than the performance data cited. For performance data current to the most recent month-end, visit our website at www.vanguard.com/performance.) Note, too, that both investment returns and principal value can fluctuate widely, so an investor’s shares, when sold, could be worth more or less than their original cost.
Please note: The opinions expressed in this report are just that—informed opinions. They should not be considered promises or advice. Also, please keep in mind that the information and opinions cover the period through the date on the cover of this report. Of course, the risks of investing in your fund are spelled out in the prospectus.
Your Fund’s Total Returns
Fiscal Year Ended January 31, 2008 | | |
| Ticker | Total |
| Symbol | Returns |
Vanguard Energy Fund | | |
Investor Shares | VGENX | 25.0% |
Admiral™ Shares1 | VGELX | 25.1 |
S&P Energy Sector Index | | 22.0 |
Average Natural Resources Fund2 | | 25.7 |
Your Fund’s Performance at a Glance | | | | |
January 31, 2007–January 31, 2008 | | | | |
| | | Distributions Per Share |
| Starting | Ending | Income | Capital |
| Share Price | Share Price | Dividends | Gains |
Vanguard Energy Fund | | | | |
Investor Shares | $63.55 | $73.93 | $1.177 | $4.308 |
Admiral Shares | 119.35 | 138.86 | 2.322 | 8.091 |
1 A lower-cost class of shares available to many longtime shareholders and to those with significant investments in the fund.
2 Derived from data provided by Lipper Inc.
1

Chairman’s Letter
Dear Shareholder,
Propelled by soaring oil prices, Vanguard Energy Fund Investor Shares returned 25.0% in fiscal year 2008. The lower-cost Admiral Shares returned 25.1%. The fund’s return slightly lagged the average return of peer funds, but surpassed the benchmark Standard & Poor’s Energy Sector Index return by 3 percentage points. (Although this index is a fair gauge of energy stock performance, it’s important to note that it includes only United States-based companies and is far less diversified than your fund and the energy industry in general.)
During the past year, supply-and-demand dynamics drove oil prices ever higher, to a record of $100 per barrel in January. The seemingly insatiable appetite for energy—especially in rapidly developing economies such as China, India, and even oil exporters such as Saudi Arabia—was a major factor. Supply-side drivers included political instability and greater solidarity among producing nations, limited new discoveries, and concern about future resources. Your fund benefited from the energy sector’s position as the market’s best performer over the 12 months and from excellent stock selection by the fund’s advisors, Wellington Management Company and Vanguard Quantitative Equity Group.
If you invest in the Energy Fund through a taxable account, you may wish to review the fund’s after-tax performance on page 25.
2
Stocks gained in the first half but faltered in the second
The broad U.S. stock market returned –2.7% for the 12 months ended January 31, reflecting a volatile year punctuated by sharp declines for equities. Gains in the first half of the fiscal period were largely relinquished in midsummer and fall as repercussions from the subprime mortgage debacle began to be felt in the broader U.S. economy. The stock market’s retreat accelerated in January amid tightening global credit markets, a weakening U.S. dollar, and widening fears of a U.S. recession.
Large-capitalization stocks fared best in these unsettled conditions, outperforming small-caps for the year; meanwhile, growth stocks outpaced their value-oriented counterparts.
International stocks outperformed U.S. stocks for the sixth straight year, largely owing to exchange-rate gains produced by the weak U.S. dollar. Emerging markets and developed economies in Europe and Asia posted strong performances earlier in the fiscal year, but slumped after November as a result of increased concern about a U.S.-led downturn.
Market Barometer | |
| Average Annual Total Returns |
| Periods Ended January 31, 2008 |
| One Year | Three Years | Five Years |
Stocks | | | |
Russell 1000 Index (Large-caps) | –2.4% | 7.8% | 12.6% |
Russell 2000 Index (Small-caps) | –9.8 | 5.8 | 15.3 |
Dow Jones Wilshire 5000 Index (Entire market) | –2.7 | 7.9 | 13.2 |
MSCI All Country World Index ex USA (International) | 5.4 | 17.0 | 22.9 |
| | | |
Bonds | | | |
Lehman U.S. Aggregate Bond Index (Broad taxable market) | 8.8% | 4.9% | 4.8% |
Lehman Municipal Bond Index | 4.9 | 4.0 | 4.6 |
Citigroup 3-Month Treasury Bill Index | 4.6 | 4.2 | 3.0 |
| | | |
CPI | | | |
Consumer Price Index | 4.3% | 3.4% | 3.0% |
3
Bond returns grew stronger as Fed lowered rates
During the first half of the fiscal year, a stronger U.S. economy made investors more willing to take on risk to earn higher yields; spreads thus narrowed between the yields of U.S. Treasury securities and those of lower-quality issues. But as the subprime lending problems unraveled further in summer, investors flocked to higher-quality government and corporate bonds. This drove Treasury prices higher and yields lower, widening the spread between Treasury yields and those of riskier bonds.
The Federal Reserve Board responded to the credit market turmoil and deteriorating economic outlook with aggressive reductions in its target for the federal funds rate. The Fed cut the rate five times during the fiscal year (twice in January), ending the period at 3.0%, the lowest rate since May 2005.
Lower interest rates depressed bond yields, but pushed prices higher. The broad taxable bond market returned 8.8% for the fiscal year. Tax-exempt municipal bonds returned 4.9%.
Robust returns across the oil patch
Soaring oil prices were a dominant theme in economies, stock markets, and households around the globe during the year. West Texas Intermediate crude oil—an industry benchmark—skyrocketed from about $58 per barrel to a record $100 in early January 2008, then retreated
Expense Ratios1 | | | |
Your fund compared with its peer group | | | |
| | | Average |
| | | Natural |
| Investor | Admiral | Resources |
| Shares | Shares | Fund |
Energy Fund | 0.25% | 0.17% | 1.43% |
Total Returns | |
Ten Years Ended January 31, 2008 | |
| Average |
| Annual Return |
Energy Fund Investor Shares | 18.1% |
S&P Energy Sector Index | 14.5 |
Average Natural Resources Fund2 | 14.8 |
The figures shown represent past performance, which is not a guarantee of future results. (Current performance may be lower or higher than the performance data cited. For performance data current to the most recent month-end, visit our website at www.vanguard.com/performance.) Note, too, that both investment returns and principal value can fluctuate widely, so an investor’s shares, when sold, could be worth more or less than their original cost.
1 Fund expense ratios reflect the 12 months ended January 31, 2008. Peer-group expense ratio is derived from data provided by Lipper Inc. and captures information through year-end 2007.
2 Derived from data provided by Lipper Inc.
4
modestly. Natural gas prices also rose, but far less dramatically. Despite dismal performance in January, energy stocks delivered robust returns for the fiscal year.
Like most segments of the portfolio, integrated oil and gas producers—which participate globally in the entire supply chain from high-risk exploration through refining and marketing—were major beneficiaries of rising prices. The stocks of these companies accounted for about half of the fund’s total return, commensurate with their 53% average weighting in the portfolio. Leading contributors included three top-ten holdings: ExxonMobil, Chevron, and ConocoPhillips. In addition to these U.S.-based giants, the fund held some excellent performers in international markets. (Like the energy industry itself, your fund is globally diversified.) Petroleo Brasileiro (or Petrobras), which returned more than 131%, and BG Group (British Gas), which returned nearly 69%, contributed significantly: They jointly discovered an ultra-deep-water oil field off the Brazilian coast, potentially one of the world’s largest finds in recent years.
Higher prices spurred exploration activity, enhancing earnings of oil-field equipment and service providers, which generated almost 5 percentage points of return for the fund. Top-ten holdings Schlumberger and Weatherford International were notable contributors, as were Halliburton and Fugro (a Netherlands-based geoscience company). Transocean and Global Santa Fe, drilling contractors and merger partners, added 1.5 percentage points to total return. The global resource quest also helped exploration and production companies to contribute 4 percentage points to total return, led by Canadian Natural Resources, EnCana, EOG Resources, and Noble Energy.
At the other end of the pipeline, refiners and marketers—a small slice of the fund and its benchmark—had a mixed year. Although consumers felt the pinch of higher retail prices, profit margins were squeezed by rising costs for raw materials.
Beyond the oil patch, the fund’s above-benchmark weighting in coal producers and its inclusion of BHP Billiton—a diversified metals and mining company that benefited from booming global demand for commodities and base metals—boosted returns and contributed notably to outperforming the index.
Fund’s long-term record reveals deep strengths
After a modest showing a year ago, the Energy Fund resumed its long-term path of impressive returns and significant outperformance. For the decade ended January 31, 2008, the average annual return of 18.1% for the fund’s Investor Shares bested both the peer average and the sector index return by more than 3 percentage points, as shown in the table on page 4.
This superior performance is a tribute to the fund’s investment advisors. In seeking to identify companies with the potential for significant capital appreciation, Wellington Management Company focuses on the bottom-up selection of stocks it considers undervalued, while Vanguard Quantitative Equity Group uses a risk-controlled, computer-based approach to evaluate
5
and rank stocks. Within the confines of a single sector fund, these distinct yet complementary approaches can help to provide the benefit of diversification. For more about the advisors’ strategies and the fund’s positioning during the year, see the Advisors’ Report, which begins on page 7.
In addition, your fund’s low expenses help investors keep more of the fund’s return, an advantage that compounds over time.
Stay diversified even when energy is hot
It can be tempting to chase the stocks or industries that are leading the market at the moment. All too often, however, this approach leads investors to disappointment. Rather than chase performance, Vanguard encourages shareholders to invest with a long-term view, to diversify within and across asset classes, and to pay attention to costs.
Just as oil and gas exploration companies encounter dry holes, the Energy Fund is likely to experience occasional years of underperformance. The fund’s focus on a single market segment, combined with the energy industry’s ever-changing economic and geopolitical dynamics, can lead to heightened volatility in the short term. That’s why we encourage investors to consider the fund not on a stand-alone basis but as part of a balanced, diversified portfolio consistent with their comfort level and long-term goals. The Energy Fund can provide low-cost exposure to a meaningful market sector and can help you achieve your personal investment objectives.
As I close this report to you, it’s my pleasure to introduce the fund’s new president, F. William McNabb III. Bill is a man of great character and integrity who is intimately familiar with all aspects of Vanguard—from how we serve our clients to how we invest for our clients.
Bill and I have worked together very closely for more than two decades. I’m thrilled that the fund’s board elected him president, effective March 1, and designated him as my successor as chief executive officer, a role he will assume within a year, after an orderly transition. Bill and the rest of our team will serve you and our other clients extremely well in the years ahead.
Thank you for entrusting your assets to Vanguard.
Sincerely,

John J. Brennan
Chairman and Chief Executive Officer
February 22, 2008
6
Advisors’ Report
For the fiscal year ended January 31, 2008, the Investor Shares of Vanguard Energy Fund returned 25.0%, and the Admiral Shares returned 25.1%. This impressive performance reflected the combined efforts of your fund’s two advisors. The use of multiple advisors enhances the fund’s diversification by providing exposure to distinct, yet complementary, investment approaches.
The advisors, the percentage of fund assets each manages, and brief descriptions of their investment strategies are presented in the table below. The advisors have also prepared a discussion of the investment environment that existed during the fiscal year and of how their portfolio positioning reflects this assessment. These reports were prepared on February 13, 2008.
Wellington Management Company, LLP
Portfolio Managers:
Karl E. Bandtel, Senior Vice President
James A. Bevilacqua, Senior Vice President
The environment for energy investing has remained positive over the last 12 months. The price of oil continued to set record highs as it rose throughout the period. Prices were supported by low spare capacity, supply disappointments outside the Organization of Petroleum Exporting Countries (OPEC), and persistently strong demand. Natural gas prices fluctuated throughout the fiscal year before finishing the period somewhat higher than they had been at the start.
Vanguard Energy Fund Investment Advisors | |
| | | |
| Fund Assets Managed | |
Investment Advisor | % | $ Million | Investment Strategy |
Wellington Management | 92 | 11,986 | Emphasizes long-term total-return opportunities from |
Company, LLP | | | the various energy subsectors: international oils, foreign |
| | | integrated oils and foreign producers, North American |
| | | producers, oil services and equipment, transportation |
| | | and distribution, and refining and marketing. |
Vanguard Quantitative Equity Group | 7 | 969 | Conducts quantitative portfolio management using |
| | | models that assess valuation, marketplace sentiment, |
| | | and balance-sheet characteristics of companies |
| | | compared with their peers. |
Cash Investments1 | 1 | 178 | |
1 These short-term reserves are invested by Vanguard in equity index products to stimulate investments in stocks. Each advisor may also maintain a modest cash position.
7
Despite high prices and solid demand globally, Saudi Arabia and other OPEC members have been holding oil off the market voluntarily. North American natural gas markets do not have a producer organization to manage supplies. However, as imports of liquefied natural gas grow in importance, that may change. We continue to believe supply expansions are likely to become more challenging going forward.
Top absolute contributors to performance for our portion of the fund included BHP Billiton, Petroleo Brasileiro (Petrobras), and CONSOL Energy. Detractors for the period included Hyundai Heavy Industries and Lukoil. We created new positions in OMV, Repsol, and Seadrill, and added to our existing position in Gazprom. We trimmed holdings in ENI and Norsk Hydro. We also reduced our position in Valero Energy because of concerns about refining margins.
Vanguard Quantitative Equity Group
Portfolio Manager:
James D. Troyer, CFA, Principal
Our quantitative investment process evaluates a security’s attractiveness on three dimensions: valuation, sentiment, and balance-sheet prospects. We believe that having multiple indicators in our model creates a better overall evaluation process than relying on each signal alone.
A key characteristic of our strategy is that we do not maintain a “view” on the overall market for energy shares. This is reflected in our portfolio, where we are always fully invested. We apply a stringent risk-control process to neutralize our exposure to market-capitalization, volatility, and industry risks relative to our energy benchmark. The resulting portfolio takes many small positions in individual stocks in an attempt to capture the market’s tendency to overreact or underreact to new information.
During the last 12 months, overseas energy stocks performed particularly well. Our positions in the Australian company Santos and the Brazilian firm Petrobras were particularly successful. In the United States, Hess and Massey Energy were good performers. Detracting from our performance were our holdings of Cameco and Rowan Companies.
Focusing on the performance of individual firms, however, can distract us from the objective of a quantitative model, which is to make many small, systematic bets, rigorously tested and applied, in order to catch relatively small mispricings across large numbers of stocks. The success or failure of a few holdings is not as important as the average return we earn over our entire portfolio.
8
Fund Profile
As of January 31, 2008
Portfolio Characteristics | | |
| | Comparative | Broad |
| Fund | Index1 | Index2 |
Number of Stocks | 101 | 36 | 4,830 |
Median Market Cap | $56.0B | $131.3B | $33.7B |
Price/Earnings Ratio | 11.1x | 11.8x | 17.0x |
Price/Book Ratio | 3.1x | 2.8x | 2.5x |
Yield | | 1.4% | 1.9% |
Investor Shares | 1.6% | | |
Admiral Shares | 1.7% | | |
Return on Equity | 26.6% | 26.3% | 19.2% |
Earnings Growth Rate | 44.6% | 52.9% | 20.1% |
Foreign Holdings | 45.3% | 0.0% | 0.0% |
Turnover Rate | 21.7% | — | — |
Expense Ratio | | — | — |
Investor Shares | 0.25% | | |
Admiral Shares | 0.17% | | |
Short-Term Reserves3 | 3.8% | — | — |
Sector Diversification4 (% of equity exposure) |
| |
Coal & Consumable Fuels | 3.8% |
Industrials | 0.9 |
Integrated Oil & Gas | 54.6 |
Materials | 3.2 |
Oil & Gas Drilling | 4.2 |
Oil & Gas Equipment & Services | 11.0 |
Oil & Gas Exploration & Production | 16.7 |
Oil & Gas Refining & Marketing | 2.0 |
Oil & Gas Storage & Transportation | 0.5 |
Utilities | 2.1 |
Other | 1.0 |
Volatility Measures5 | |
| Fund Versus | Fund Versus |
| Comparative Index1 | Broad Index2 |
R-Squared | 0.92 | 0.35 |
Beta | 0.93 | 1.36 |
9
Ten Largest Holdings6 (% of total net assets) | |
| |
ExxonMobil Corp. | 6.2% |
ConocoPhillips Co. | 4.0 |
Petroleo Brasileiro SA | 4.0 |
Chevron Corp. | 3.9 |
Royal Dutch Shell PLC | 3.9 |
Total SA | 3.6 |
Weatherford International Ltd. | 3.3 |
BG Group PLC | 3.2 |
BHP Billiton Ltd. ADR | 3.0 |
Schlumberger Ltd. | 3.0 |
Top Ten | 38.1% |
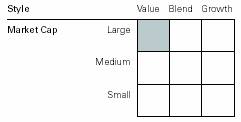
Investment Focus
1 S&P Energy Sector Index.
2 Dow Jones Wilshire 5000 Index.
3 Short-term reserves exclude futures and currency contracts held by the fund.
4 Sector percentages combine U.S. and international holdings.
5 For an explanation of R-squared, beta, and other terms used here, see the Glossary on page 28.
6 “Ten Largest Holdings” excludes any temporary cash investments and equity index products.
10
Portfolio Characteristics | | |
| | Comparative | Broad |
| Fund | Index1 | Index2 |
Number of Stocks | 101 | 36 | 4,830 |
Median Market Cap | $56.0B | $131.3B | $33.7B |
Price/Earnings Ratio | 11.1x | 11.8x | 17.0x |
Price/Book Ratio | 3.1x | 2.8x | 2.5x |
Yield | | 1.4% | 1.9% |
Investor Shares | 1.6% | | |
Admiral Shares | 1.7% | | |
Return on Equity | 26.6% | 26.3% | 19.2% |
Earnings Growth Rate | 44.6% | 52.9% | 20.1% |
Foreign Holdings | 45.3% | 0.0% | 0.0% |
Turnover Rate | 21.7% | — | — |
Expense Ratio | | — | — |
Investor Shares | 0.25% | | |
Admiral Shares | 0.17% | | |
Short-Term Reserves3 | 3.8% | — | — |
Sector Diversification4 (% of equity exposure) |
| |
Coal & Consumable Fuels | 3.8% |
Industrials | 0.9 |
Integrated Oil & Gas | 54.6 |
Materials | 3.2 |
Oil & Gas Drilling | 4.2 |
Oil & Gas Equipment & Services | 11.0 |
Oil & Gas Exploration & Production | 16.7 |
Oil & Gas Refining & Marketing | 2.0 |
Oil & Gas Storage & Transportation | 0.5 |
Utilities | 2.1 |
Other | 1.0 |
Volatility Measures5 | |
| Fund Versus | Fund Versus |
| Comparative Index1 | Broad Index2 |
R-Squared | 0.92 | 0.35 |
Beta | 0.93 | 1.36 |
Ten Largest Holdings6 (% of total net assets) |
| |
ExxonMobil Corp. | 6.2% |
ConocoPhillips Co. | 4.0 |
Petroleo Brasileiro SA | 4.0 |
Chevron Corp. | 3.9 |
Royal Dutch Shell PLC | 3.9 |
Total SA ADR | 3.6 |
Weatherford International Ltd. | 3.3 |
BG Group PLC | 3.2 |
BHP Billiton Ltd. ADR | 3.0 |
Schlumberger Ltd. | 3.0 |
Top Ten | 38.1% |
11
Performance Summary
All of the returns in this report represent past performance, which is not a guarantee of future results that may be achieved by the fund. (Current performance may be lower or higher than the performance data cited. For performance data current to the most recent month-end, visit our website at www.vanguard.com/performance.) Note, too, that both investment returns and principal value can fluctuate widely, so an investor’s shares, when sold, could be worth more or less than their original cost. The returns shown do not reflect taxes that a shareholder would pay on fund distributions or on the sale of fund shares.
Cumulative Performance: January 31, 1998–January 31, 2008
Initial Investment of $25,000
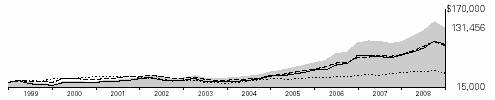
| Average Annual Total Returns | Final Value |
| Periods Ended January 31, 2008 | of a $25,000 |
| One Year | Five Years | Ten Years | Investment |
Energy Fund Investor Shares1 | 25.02% | 31.61% | 18.05% | $131,456 |
Dow Jones Wilshire 5000 Index | –2.70 | 13.21 | 5.61 | 43,166 |
S&P Energy Sector Index | 21.97 | 27.08 | 14.54 | 97,156 |
Average Natural Resources Fund2 | 25.67 | 29.35 | 14.80 | 99,434 |
| | | | Final Value |
| | | Since | of a $100,000 |
| One Year | Five Years | Inception3 | Investment |
Energy Fund Admiral Shares1 | 25.13% | 31.70% | 24.90% | $398,544 |
Dow Jones Wilshire 5000 Index | –2.70 | 13.21 | 6.69 | 149,626 |
S&P Energy Sector Index | 21.97 | 27.08 | 18.60 | 288,941 |
1 Total returns do not reflect the 1% fee assessed on redemptions of shares held less than one year, nor do they include the account service fee that may be applicable to certain accounts with balances below $10,000.
2 Derived from data provided by Lipper Inc.
3 Performance for the fund’s Admiral Shares and comparative standards is calculated since the Admiral Shares’ inception: November 12, 2001.
12
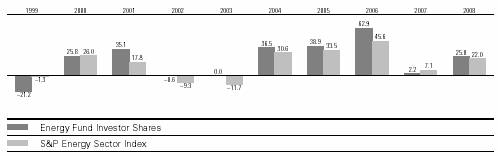
Fiscal-Year Total Returns (%): January 31, 1998—January 31, 2008
Average Annual Total Returns: Periods Ended December 31, 2007
This table presents average annual total returns through the latest calendar quarter—rather than through the end of the fiscal period. Securities and Exchange Commission rules require that we provide this information.
| Inception Date | One Year | Five Years | Ten Years |
Investor Shares1 | 5/23/1984 | 37.00% | 34.08% | 18.60% |
Admiral Shares1 | 11/12/2001 | 37.11 | 34.17 | 27.512 |
1 Total returns do not reflect the 1% fee assessed on redemptions of shares held less than one year, nor do they include the account service fee that may be applicable to certain accounts with balances below $10,000.
2 Return since inception.
Note: See Financial Highlights tables on pages 18 and 19 for dividend and capital gains information.
13
Financial Statements
Statement of Net Assets
As of January 31, 2008
The fund provides a complete list of its holdings four times in each fiscal year, at the quarter-ends. For the second and fourth fiscal quarters, the lists appear in the fund’s semiannual and annual reports to shareholders. For the first and third fiscal quarters, the fund files the lists with the Securities and Exchange Commission on Form N-Q. Shareholders can look up the fund’s Forms N-Q on the SEC’s website at www.sec.gov. Forms N-Q may also be reviewed and copied at the SEC’s Public Reference Room (see the back cover of this report for further information).
| | | Market |
| | | Value• |
| | Shares | ($000) |
Common Stocks (94.8%)1 | | |
United States (49.5%) | | |
Energy Equipment & Services (12.3%) | | |
| Oil & Gas Drilling (2.7%) | | |
* | Transocean, Inc. | 2,083,964 | 255,494 |
* | Nabors Industries, Inc. | 1,997,600 | 54,375 |
| Noble Corp. | 285,672 | 12,504 |
| ENSCO International, Inc. | 223,614 | 11,431 |
| Rowan Cos., Inc. | 313,600 | 10,675 |
| Patterson-UTI Energy, Inc. | 278,348 | 5,450 |
* | Pride International, Inc. | 163,500 | 5,185 |
| | | |
| Oil & Gas Equipment & Services (9.6%) | | |
* | Weatherford | | |
| International Ltd. | 7,084,812 | 437,912 |
| Schlumberger Ltd. | 5,145,964 | 388,314 |
| Baker Hughes, Inc. | 3,447,611 | 223,853 |
| Halliburton Co. | 5,570,732 | 184,781 |
* | Cameron | | |
| International Corp. | 285,508 | 11,495 |
* | National Oilwell Varco Inc. | 155,856 | 9,387 |
* | FMC Technologies Inc. | 151,000 | 7,272 |
* | Grant Prideco, Inc. | 58,500 | 2,912 |
* | Exterran Holdings, Inc. | 800 | 52 |
| | | 1,621,092 |
Gas Utilities (2.0%) | | |
| Equitable Resources, Inc. | 2,851,800 | 158,988 |
| Questar Corp. | 2,002,500 | 101,947 |
| | | 260,935 |
Oil, Gas & Consumable Fuels (35.2%) | | |
| Coal & Consumable Fuels (3.6%) | | |
| CONSOL Energy, Inc. | 4,367,800 | 318,849 |
| Peabody Energy Corp. | 2,639,000 | 142,559 |
* | Patriot Coal Corp. | 150,935 | 6,000 |
| Arch Coal, Inc. | 31,000 | 1,364 |
| Massey Energy Co. | 29,000 | 1,078 |
14
| | | Market |
| | | Value• |
| | Shares | ($000) |
| Integrated Oil & Gas (20.8%) | | |
| ExxonMobil Corp. | 9,490,031 | 819,939 |
| ConocoPhillips Co. | 6,614,209 | 531,253 |
| Chevron Corp. | 6,127,035 | 517,734 |
| Occidental Petroleum Corp. | 4,952,801 | 336,147 |
| Marathon Oil Corp. | 6,925,891 | 324,478 |
| Hess Corp. | 2,160,489 | 196,237 |
| Murphy Oil Corp. | 191,100 | 14,054 |
| | | |
| Oil & Gas Exploration & Production (8.4%) | |
| EOG Resources, Inc. | 3,483,936 | 304,844 |
| Noble Energy, Inc. | 2,960,300 | 214,859 |
| Devon Energy Corp. | 1,871,376 | 159,030 |
| XTO Energy, Inc. | 2,412,077 | 125,283 |
* | Newfield Exploration Co. | 2,384,700 | 118,949 |
| Cabot Oil & Gas Corp. | 3,037,000 | 117,502 |
| Apache Corp. | 164,770 | 15,726 |
| Chesapeake Energy Corp. | 412,818 | 15,369 |
| Anadarko Petroleum Corp. | 231,660 | 13,573 |
| Cimarex Energy Co. | 192,400 | 7,852 |
* | Denbury Resources, Inc. | 171,000 | 4,326 |
| Range Resources Corp. | 25,500 | 1,332 |
| | | |
| Oil & Gas Refining & Marketing (2.0%) | | |
| Valero Energy Corp. | 3,879,451 | 229,625 |
| Sunoco, Inc. | 304,359 | 18,931 |
| Tesoro Corp. | 247,552 | 9,667 |
| | | |
| Oil & Gas Storage & Transportation (0.4%) | |
| Williams Cos., Inc. | 1,430,982 | 45,748 |
| El Paso Corp. | 654,100 | 10,780 |
| Spectra Energy Corp. | 106,968 | 2,443 |
| | | 4,625,531 |
Total United States | | 6,507,558 |
International (45.3%) | | |
Argentina (0.0%) | | |
| Tenaris SA ADR | 72,900 | 2,915 |
15
| | | Market |
| | | Value• |
| | Shares | ($000) |
Australia (4.1%) | | |
^ | BHP Billiton Ltd. ADR | 5,800,000 | 391,906 |
| Woodside | | |
| Petroleum Ltd. ADR | 3,331,600 | 139,677 |
| Santos Ltd. | 381,100 | 4,180 |
| | | 535,763 |
Austria (1.0%) | | |
| OMV AG | 1,766,996 | 127,453 |
| | | |
Brazil (4.0%) | | |
| Petroleo Brasileiro SA ADR | 4,281,700 | 475,868 |
| Petroleo Brasileiro SA Pfd. | 637,360 | 29,132 |
| Petroleo Brasileiro SA | 423,621 | 23,216 |
| | | 528,216 |
Canada (10.7%) | | |
| Canadian Natural | | |
| Resources Ltd. | 4,656,200 | 296,647 |
| Suncor Energy, Inc. | 2,723,700 | 255,973 |
| EnCana Corp. | 3,240,700 | 214,567 |
| Canadian Oil Sands Trust | 4,221,175 | 159,758 |
| Petro-Canada | 3,337,000 | 152,167 |
| Husky Energy Inc. | 2,755,400 | 114,135 |
| Talisman Energy, Inc. | 6,872,731 | 108,562 |
| EnCana Corp. | 333,939 | 22,014 |
| Petro-Canada | 365,750 | 16,622 |
| Canadian Natural | | |
| Resources Ltd. | 253,139 | 16,188 |
| Nexen Inc. | 492,600 | 14,100 |
| Suncor Energy, Inc. | 149,776 | 14,082 |
| Canadian Oil Sands Trust | 251,200 | 9,507 |
| Imperial Oil Ltd. | 111,417 | 5,477 |
| TransCanada Corp. | 60,296 | 2,376 |
| Cameco Corp. | 63,810 | 2,161 |
| | | 1,404,336 |
China (0.2%) | | |
| China Petroleum & | | |
| Chemical Corp. | 12,366,000 | 12,979 |
| PetroChina Co. Ltd. | 8,978,000 | 12,403 |
| Yanzhou Coal Mining Co. | | |
| Ltd. H Shares | 3,549,800 | 5,989 |
| | | 31,371 |
Denmark (0.0%) | | |
| Dampskibsselskabet | | |
| Torm A/S | 133,950 | 4,313 |
| | | |
France (3.7%) | | |
| Total SA ADR | 6,098,100 | 443,820 |
| Total SA | 483,316 | 35,175 |
| Technip SA | 133,906 | 8,649 |
| | | 487,644 |
Hong Kong (0.1%) | | |
| CNOOC Ltd. | 6,042,717 | 8,541 |
16
| | | Market |
| | | Value• |
| | Shares | ($000) |
India (0.1%) | | |
2 | Oil & Natural Gas Corp., Ltd. | | |
| Warrants Exp. 7/14/08 | 351,450 | 8,834 |
| | | |
Italy (2.0%) | | |
| Eni SpA ADR | 3,551,850 | 229,201 |
| Eni SpA | 877,181 | 28,362 |
| | | 257,563 |
Netherlands (0.8%) | | |
| Fugro NV | 1,505,610 | 103,197 |
| | | |
Norway (2.7%) | | |
* | Seadrill Ltd. | 8,449,600 | 177,034 |
| Statoil ASA ADR | 6,577,900 | 172,802 |
| Statoil ASA | 433,060 | 11,403 |
| | | 361,239 |
Russia (4.1%) | | |
| OAO Gazprom- | | |
| Sponsored ADR | 7,002,622 | 341,010 |
| LUKOIL ADR | 2,836,000 | 197,653 |
| | | 538,663 |
South Africa (0.1%) | | |
| Sasol Ltd. | 278,874 | 13,406 |
| | | |
South Korea (0.7%) | | |
| Hyundai Heavy | | |
| Industries Co., Inc. | 268,654 | 90,387 |
| | | |
Spain (1.5%) | | |
| Repsol YPF, SA ADR | 5,599,500 | 178,512 |
| Repsol YPF SA | 402,047 | 12,858 |
| | | 191,370 |
United Kingdom (9.5%) | | |
| BG Group PLC | 19,159,622 | 422,703 |
| BP PLC ADR | 4,455,800 | 284,057 |
| Royal Dutch Shell PLC | | |
| ADR Class B | 3,920,726 | 271,118 |
| Royal Dutch Shell PLC | | |
| ADR Class A | 2,768,500 | 197,699 |
| BP PLC | 3,268,745 | 34,838 |
| Royal Dutch Shell | | |
| PLC Class A | 527,721 | 18,920 |
| Royal Dutch Shell | | |
| PLC Class B | 452,717 | 15,732 |
| Royal Dutch Shell | | |
| PLC Class A | | |
| (Amsterdam Shares) | 117,600 | 4,206 |
| | | 1,249,273 |
Total International | | 5,944,484 |
Total Common Stocks | | |
(Cost $6,428,217) | | 12,452,042 |
17
| | | Market |
| | | Value• |
| | Shares | ($000) |
Temporary Cash Investments (5.4%)1 | | |
Money Market Fund (1.3%) | | |
3 | Vanguard Market Liquidity | | |
| Fund, 4.060% 147,445,209 | | 147,445 |
3 | Vanguard Market Liquidity | | |
| Fund, 4.060%—Note F | 24,722,700 | 24,723 |
| | | 172,168 |
| | | |
| | Face | |
| | Amount | |
| | ($000) | |
Repurchase Agreement (3.9%) | | |
| Deutsche Bank 3.000%, | | |
| 2/1/08 (Dated 1/31/08, | | |
| Repurchase Value $505,742,000 | | |
| collateralized by Federal Home | | |
| Loan Mortgage Corp., | | |
| 5.000%–7.500%, | | |
| 1/1/23–1/1/38 and | | |
| Government National | | |
| Mortgage Assn., | | |
| 6.000%–7.000%, | | |
| 12/20/25–10/15/37) | 505,700 | 505,700 |
U.S. Agency Obligations (0.2%) | | |
4 | Federal Home Loan Bank | | |
5 | 4.548%, 2/1/08 | 9,500 | 9,499 |
5 | 4.736%, 2/22/08 | 5,000 | 4,992 |
4 | Federal National Mortgage Assn. | | |
5 | 4.068%–4.194%, 4/2/08 | 11,000 | 10,952 |
| 2.701%, 4/21/08 | 500 | 497 |
| | | 25,940 |
Total Temporary Cash Investments | | |
(Cost $703,775) | | 703,808 |
Total Investments (100.2%) | | |
(Cost $7,131,992) | | 13,155,850 |
18
| Market |
| Value• |
| ($000) |
Other Assets and Liabilities (–0.2%) | |
Other Assets—Note C | 45,531 |
Liabilities—Note F | (68,846) |
| (23,315) |
Net Assets (100%) | 13,132,535 |
| |
| |
| |
At January 31, 2008, net assets consisted of:6 | |
| Amount |
| ($000) |
Paid in Capital | 6,792,778 |
Overdistributed Net Investment Income | (7,458) |
Accumulated Net Realized Gains | 333,106 |
Unrealized Appreciation (Depreciation) | |
Investment Securities | 6,023,858 |
Futures Contracts | (9,947) |
Foreign Currencies | 198 |
Net Assets | 13,132,535 |
| |
Investor Shares—Net Assets | |
Applicable to 107,108,685 outstanding | |
$.001 par value shares of beneficial | |
interest (unlimited authorization) | 7,918,658 |
Net Asset Value Per Share— | |
Investor Shares | $73.93 |
| |
Admiral Shares—Net Assets | |
Applicable to 37,548,347 outstanding | |
$.001 par value shares of beneficial | |
interest (unlimited authorization) | 5,213,877 |
Net Asset Value Per Share— | |
Admiral Shares | $138.86 |
• | See Note A in Notes to Financial Statements. |
* | Non-income-producing security. |
^ Part of security position is on loan to broker-dealers. See Note F in Notes to Financial Statements.
1 The fund invests a portion of its cash reserves in equity markets through the use of index futures contracts. After giving effect to futures investments, the fund’s effective common stock and temporary cash investment positions represent 96.2% and 4.0%, respectively, of net assets. See Note D in Notes to Financial Statements.
2 Security exempt from registration under Rule 144A of the Securities Act of 1933. Such securities may be sold in transactions exempt from registration, normally to qualified institutional buyers. At January 31, 2008, the value of this security represented 0.07% of net assets.
3 Affiliated money market fund available only to Vanguard funds and certain trusts and accounts managed by Vanguard. Rate shown is the 7-day yield.
4 The issuer operates under a congressional charter; its securities are neither issued nor guaranteed by the U.S. government. If needed, access to additional funding from the U.S. Treasury (beyond the issuer’s line of credit) would require congressional action.
5 Securities with a value of $25,443,000 have been segregated as initial margin for open futures contracts.
6 See Note D in Notes to Financial Statements for the tax-basis components of net assets.
ADR—American Depositary Receipt.
19
Statement of Operations
| Year Ended |
| January 31, 2008 |
| ($000) |
Investment Income | |
Income | |
Dividends1 | 196,924 |
Interest2 | 37,710 |
Security Lending | 3,156 |
Total Income | 237,790 |
Expenses | |
Investment Advisory Fees—Note B | 9,151 |
The Vanguard Group—Note C | |
Management and Administrative | |
Investor Shares | 11,748 |
Admiral Shares | 3,609 |
Marketing and Distribution | |
Investor Shares | 1,563 |
Admiral Shares | 739 |
Custodian Fees | 121 |
Auditing Fees | 23 |
Shareholders’ Reports | |
Investor Shares | 146 |
Admiral Shares | 16 |
Trustees’ Fees and Expenses | 13 |
Total Expenses | 27,129 |
Net Investment Income | 210,661 |
Realized Net Gain (Loss) | |
Investment Securities Sold | 944,727 |
Futures Contracts | (30,693) |
Foreign Currencies | 1,415 |
Realized Net Gain (Loss) | 915,449 |
Change in Unrealized Appreciation (Depreciation) | |
Investment Securities | 1,374,420 |
Futures Contracts | (11,020) |
Foreign Currencies | 142 |
Change in Unrealized Appreciation (Depreciation) | 1,363,542 |
Net Increase (Decrease) in Net Assets Resulting from Operations | 2,489,652 |
1 Dividends are net of foreign withholding taxes of $13,645,000.
2 Interest income from an affiliated company of the fund was $13,886,000.
20
Statement of Changes in Net Assets
| Year Ended January 31, |
| 2008 | 2007 |
| ($000) | ($000) |
Increase (Decrease) in Net Assets | | |
Operations | | |
Net Investment Income | 210,661 | 173,983 |
Realized Net Gain (Loss) | 915,449 | 433,315 |
Change in Unrealized Appreciation (Depreciation) | 1,363,542 | (450,957) |
Net Increase (Decrease) in Net Assets Resulting from Operations | 2,489,652 | 156,341 |
Distributions | | |
Net Investment Income | | |
Investor Shares | (119,127) | (101,187) |
Admiral Shares | (83,384) | (58,057) |
Realized Capital Gain1 | | |
Investor Shares | (435,495) | (143,716) |
Admiral Shares | (280,073) | (78,820) |
Total Distributions | (918,079) | (381,780) |
Capital Share Transactions—Note G | | |
Investor Shares | 422,009 | (88,347) |
Admiral Shares | 1,048,332 | 582,810 |
Net Increase (Decrease) from Capital Share Transactions | 1,470,341 | 494,463 |
Total Increase (Decrease) | 3,041,914 | 269,024 |
Net Assets | | |
Beginning of Period | 10,090,621 | 9,821,597 |
End of Period2 | 13,132,535 | 10,090,621 |
1 Includes fiscal 2008 and 2007 short-term gain distributions totaling $64,462,000 and $6,548,000, respectively. Short-term gain distributions are treated as ordinary income dividends for tax purposes.
2 Net Assets—End of Period includes undistributed (overdistributed) net investment income of ($7,458,000) and ($6,604,000).
21
Financial Highlights
Investor Shares | | | | | |
| | | | | |
For a Share Outstanding | Year Ended January 31, |
Throughout Each Period | 2008 | 2007 | 2006 | 2005 | 2004 |
Net Asset Value, Beginning of Period | $63.55 | $64.50 | $40.85 | $29.99 | $22.85 |
Investment Operations | | | | | |
Net Investment Income | 1.226 | 1.112 | .813 | .529 | .435 |
Net Realized and Unrealized Gain (Loss) | | | | | |
on Investments1 | 14.639 | .405 | 24.606 | 11.052 | 7.839 |
Total from Investment Operations | 15.865 | 1.517 | 25.419 | 11.581 | 8.274 |
Distributions | | | | | |
Dividends from Net Investment Income | (1.177) | (1.020) | (.740) | (.524) | (.390) |
Distributions from Realized Capital Gains | (4.308) | (1.447) | (1.029) | (.197) | (.744) |
Total Distributions | (5.485) | (2.467) | (1.769) | (.721) | (1.134) |
Net Asset Value, End of Period | $73.93 | $63.55 | $64.50 | $40.85 | $29.99 |
| | | | | |
Total Return2 | 25.02% | 2.24% | 62.93% | 38.90% | 36.49% |
| | | | | |
Ratios/Supplemental Data | | | | | |
Net Assets, End of Period (Millions) | $7,919 | $6,479 | $6,733 | $4,822 | $2,434 |
Ratio of Total Expenses to Average Net Assets | 0.25% | 0.25% | 0.28% | 0.32% | 0.38% |
Ratio of Net Investment Income to | | | | | |
Average Net Assets | 1.67% | 1.71% | 1.57% | 1.67% | 1.79% |
Portfolio Turnover Rate3 | 22% | 22% | 10% | 1% | 26% |
1 Includes increases from redemption fees of $.02, $.03, $.03, $.02, and $.00.
2 Total returns do not reflect the 1% fee assessed on redemptions of shares held for less than one year, or the account service fee that may be applicable to certain accounts with balances below $10,000.
3 Excludes the value of portfolio securities received or delivered as a result of in-kind purchases or redemptions of the fund’s capital shares.
22
Admiral Shares | | | | | |
| | | |
For a Share Outstanding | Year Ended January 31, |
Throughout Each Period | 2008 | 2007 | 2006 | 2005 | 2004 |
Net Asset Value, Beginning of Period | $119.35 | $121.13 | $76.71 | $56.30 | $42.89 |
Investment Operations | | | | | |
Net Investment Income | 2.418 | 2.180 | 1.561 | 1.034 | .847 |
Net Realized and Unrealized Gain (Loss) | | | | | |
on Investments1 | 27.505 | .757 | 46.217 | 20.770 | 14.721 |
Total from Investment Operations | 29.923 | 2.937 | 47.778 | 21.804 | 15.568 |
Distributions | | | | | |
Dividends from Net Investment Income | (2.322) | (2.000) | (1.425) | (1.024) | (.760) |
Distributions from Realized Capital Gains | (8.091) | (2.717) | (1.933) | (.370) | (1.398) |
Total Distributions | (10.413) | (4.717) | (3.358) | (1.394) | (2.158) |
Net Asset Value, End of Period | $138.86 | $119.35 | $121.13 | $76.71 | $56.30 |
| | | | | |
Total Return2 | 25.13% | 2.32% | 63.00% | 39.02% | 36.58% |
| | | | | |
Ratios/Supplemental Data | | | | | |
Net Assets, End of Period (Millions) | $5,214 | $3,612 | $3,088 | $549 | $208 |
Ratio of Total Expenses to Average Net Assets | 0.17% | 0.18% | 0.22% | 0.26% | 0.32% |
Ratio of Net Investment Income to | | | | | |
Average Net Assets | 1.75% | 1.78% | 1.63% | 1.70% | 1.85% |
Portfolio Turnover Rate3 | 22% | 22% | 10% | 1% | 26% |
1 Includes increases from redemption fees of $.03, $.05, $.03, $.03, and $.01.
2 Total returns do not reflect the 1% fee assessed on redemptions of shares held for less than one year.
3 Excludes the value of portfolio securities received or delivered as a result of in-kind purchases or redemptions of the fund’s capital shares.
See accompanying Notes, which are an integral part of the Financial Statements.
23
Notes to Financial Statements
Vanguard Energy Fund is registered under the Investment Company Act of 1940 as an open-end investment company, or mutual fund. The fund files reports with the SEC under the company name Vanguard Specialized Funds. The fund may invest in securities of foreign issuers, which may subject it to investment risks not normally associated with investing in securities of United States corporations. The fund offers two classes of shares, Investor Shares and Admiral Shares. Investor Shares are available to any investor who meets the fund’s minimum purchase requirements. Admiral Shares are designed for investors who meet certain administrative, service, tenure, and account-size criteria.
A. The following significant accounting policies conform to generally accepted accounting principles for U.S. mutual funds. The fund consistently follows such policies in preparing its financial statements.
1. Security Valuation: Securities are valued as of the close of trading on the New York Stock Exchange (generally 4 p.m., Eastern time) on the valuation date. Equity securities are valued at the latest quoted sales prices or official closing prices taken from the primary market in which each security trades; such securities not traded on the valuation date are valued at the mean of the latest quoted bid and asked prices. Securities for which market quotations are not readily available, or whose values have been affected by events occurring before the fund’s pricing time but after the close of the securities’ primary markets, are valued at their fair values calculated according to procedures adopted by the board of trustees. These procedures include obtaining quotations from an independent pricing service, monitoring news to identify significant market- or security-specific events, and evaluating changes in the values of foreign market proxies (for example, ADRs, futures contracts, or exchange-traded funds), between the time the foreign markets close and the fund’s pricing time. When fair-value pricing is employed, the prices of securities used by a fund to calculate its net asset value may differ from quoted or published prices for the same securities. Investments in Vanguard Market Liquidity Fund are valued at that fund’s net asset value. Temporary cash investments acquired over 60 days to maturity are valued using the latest bid prices or using valuations based on a matrix system (which considers such factors as security prices, yields, maturities, and ratings), both as furnished by independent pricing services. Other temporary cash investments are valued at amortized cost, which approximates market value.
2. Foreign Currency: Securities and other assets and liabilities denominated in foreign currencies are translated into U.S. dollars using exchange rates obtained from an independent third party as of the fund’s pricing time on the valuation date. Realized gains (losses) and unrealized appreciation (depreciation) on investment securities include the effects of changes in exchange rates since the securities were purchased, combined with the effects of changes in security prices. Fluctuations in the value of other assets and liabilities resulting from changes in exchange rates are recorded as unrealized foreign currency gains (losses) until the assets or liabilities are settled in cash, at which time they are recorded as realized foreign currency gains (losses).
3. Futures Contracts: The fund uses index futures contracts to a limited extent, with the objective of maintaining full exposure to the stock market while maintaining liquidity. The fund may purchase or sell futures contracts to achieve a desired level of investment, whether to accommodate portfolio turnover or cash flows from capital share transactions. The primary risks associated with the use of futures contracts are imperfect correlation between changes in market values of stocks held by the fund and the prices of futures contracts, and the possibility of an illiquid market.
Futures contracts are valued based upon their quoted daily settlement prices. The aggregate principal amounts of the contracts are not recorded in the Statement of Net Assets. Fluctuations in the value of the contracts are recorded in the Statement of Net Assets as an asset (liability) and in the Statement of Operations as unrealized appreciation (depreciation) until the contracts are closed, when they are recorded as realized futures gains (losses).
24
4. Repurchase Agreements: The fund may invest in repurchase agreements. Securities pledged as collateral for repurchase agreements are held by a custodian bank until the agreements mature. Each agreement requires that the market value of the collateral be sufficient to cover payments of interest and principal; however, in the event of default or bankruptcy by the other party to the agreement, retention of the collateral may be subject to legal proceedings.
5. Federal Income Taxes: The fund intends to continue to qualify as a regulated investment company and distribute all of its taxable income. Accordingly, no provision for federal income taxes is required in the financial statements.
6. Distributions: Distributions to shareholders are recorded on the ex-dividend date.
7. Security Lending: The fund may lend its securities to qualified institutional borrowers to earn additional income. Security loans are required to be secured at all times by collateral at least equal to the market value of securities loaned. The fund invests cash collateral received in Vanguard Market Liquidity Fund, and records a liability for the return of the collateral, during the period the securities are on loan. Security lending income represents the income earned on investing cash collateral, less expenses associated with the loan.
8. Other: Dividend income is recorded on the ex-dividend date. Interest income includes income distributions received from Vanguard Market Liquidity Fund and is accrued daily. Security transactions are accounted for on the date securities are bought or sold. Costs used to determine realized gains (losses) on the sale of investment securities are those of the specific securities sold. Fees assessed on redemptions of capital shares are credited to paid-in capital.
Each class of shares has equal rights as to assets and earnings, except that each class separately bears certain class-specific expenses related to maintenance of shareholder accounts (included in Management and Administrative expenses) and shareholder reporting. Marketing and distribution expenses are allocated to each class of shares based on a method approved by the board of trustees. Income, other non-class-specific expenses, and gains and losses on investments are allocated to each class of shares based on its relative net assets.
B. Wellington Management Company, LLP, provides investment advisory services to a portion of the fund for a fee calculated at an annual percentage rate of average net assets managed by the advisor. Beginning in February 2008, the investment advisory fee will be subject to quarterly adjustments based on performance since May 1, 2007, relative to a combined index composed of the S&P Citigroup BMI World Energy Index and the S&P 500 Energy Equal Weight Index.
The Vanguard Group provides investment advisory services to a portion of the fund on an at-cost basis; the fund paid Vanguard advisory fees of $292,000 for the year ended January 31, 2008.
For the year ended January 31, 2008, the aggregate investment advisory fee represented an effective annual rate of 0.07% of the fund’s average net assets.
C. The Vanguard Group furnishes at cost corporate management, administrative, marketing, and distribution services. The costs of such services are allocated to the fund under methods approved by the board of trustees. The fund has committed to provide up to 0.40% of its net assets in capital contributions to Vanguard. At January 31, 2008, the fund had contributed capital of $1,230,000, to Vanguard (included in Other Assets), representing 0.01% of the fund’s net assets and 1.23% of Vanguard’s capitalization. The fund’s trustees and officers are also directors and officers of Vanguard.
25
D. Distributions are determined on a tax basis and may differ from net investment income and realized capital gains for financial reporting purposes. Differences may be permanent or temporary. Permanent differences are reclassified among capital accounts in the financial statements to reflect their tax character. Temporary differences arise when certain items of income, expense, gain, or loss are recognized in different periods for financial statement and tax purposes; these differences will reverse at some time in the future. Differences in classification may also result from the treatment of short-term gains as ordinary income for tax purposes.
The fund used a tax accounting practice to treat a portion of the price of capital shares redeemed during the year as distributions from net investment income and realized capital gains. Accordingly, the fund has reclassified $10,419,000 from undistributed net investment income, and $43,759,000 from accumulated net realized gains, to paid-in capital.
During the year ended January 31, 2008, the fund realized net foreign currency gains of $1,415,000, which increased distributable net income for tax purposes; accordingly, such gains have been reclassified from undistributed net investment income to accumulated net realized gains.
For tax purposes, at January 31, 2008, the fund had $4,375,000 of ordinary income and $323,379,000 of long-term capital gains available for distribution.
At January 31, 2008, the cost of investment securities for tax purposes was $7,131,992,000. Net unrealized appreciation of investment securities for tax purposes was $6,023,858,000, consisting of unrealized gains of $6,121,863,000 on securities that had risen in value since their purchase and $98,005,000 in unrealized losses on securities that had fallen in value since their purchase.
At January 31, 2008, the aggregate settlement value of open futures contracts expiring in March 2008 and the related unrealized appreciation (depreciation) were:
| | | ($000) |
| | Aggregate | Unrealized |
| Number of | Settlement | Appreciation |
Futures Contracts | Long Contracts | Value | (Depreciation) |
S&P 500 Index | 460 | 158,654 | (10,011) |
E-mini S&P 500 Index | 301 | 20,763 | 64 |
Unrealized appreciation (depreciation) on open futures contracts is required to be treated as realized gain (loss) for tax purposes.
E. During the year ended January 31, 2008, the fund purchased $3,203,618,000 of investment securities and sold $2,511,828,000 of investment securities other than temporary cash investments.
F. The market value of securities on loan to broker-dealers at January 31, 2008, was $24,210,000, for which the fund received cash collateral of $24,723,000.
26
G. Capital share transactions for each class of shares were:
| | | Year Ended January 31, |
| | 2008 | | 2007 |
| Amount | Shares | Amount | Shares |
| ($000) | (000) | ($000) | (000) |
Investor Shares | | | | |
Issued | 1,916,427 | 25,320 | 1,793,137 | 28,223 |
Issued in Lieu of Cash Distributions | 534,104 | 7,173 | 235,334 | 3,595 |
Redeemed1 | (2,028,522) | (27,338) | (2,116,818) | (34,259) |
Net Increase (Decrease)—Investor Shares | 422,009 | 5,155 | (88,347) | (2,441) |
Admiral Shares | | | | |
Issued | 1,557,799 | 10,982 | 1,261,595 | 10,675 |
Issued in Lieu of Cash Distributions | 334,798 | 2,381 | 124,702 | 1,014 |
Redeemed1 | (844,265) | (6,076) | (803,487) | (6,921) |
Net Increase (Decrease)—Admiral Shares | 1,048,332 | 7,287 | 582,810 | 4,768 |
H. In June 2006, the Financial Accounting Standards Board issued Interpretation No. 48 (“FIN 48”), “Accounting for Uncertainty in Income Taxes.” FIN 48 establishes the minimum threshold for recognizing, and a system for measuring, the benefits of tax-return positions in financial statements, effective for the fund’s current fiscal year. Management has analyzed the fund’s tax positions taken on federal income tax returns for all open tax years (tax years ended January 31, 2005–2008) for purposes of implementing FIN 48, and has concluded that no provision for income tax is required in the fund’s financial statements.
1 Net of redemption fees of $3,474,000 and $3,975,000 (fund totals).
27
Report of Independent Registered Public Accounting Firm
To the Trustees of Vanguard Specialized Funds and the Shareholders of Vanguard Energy Fund:
In our opinion, the accompanying statement of net assets and the related statements of operations and of changes in net assets and the financial highlights present fairly, in all material respects, the financial position of Vanguard Energy Fund (constituting a separate portfolio of Vanguard Specialized Funds, hereafter referred to as the “Fund”) at January 31, 2008, the results of its operations for the year then ended, the changes in its net assets for each of the two years in the period then ended and the financial highlights for each of the five years in the period then ended, in conformity with accounting principles generally accepted in the United States of America. These financial statements and financial highlights (hereafter referred to as “financial statements”) are the responsibility of the Fund’s management; our responsibility is to express an opinion on these financial statements based on our audits. We conducted our audits of these financial statements in accordance with the standards of the Public Company Accounting Oversight Board (United States). Those standards require that we plan and perform the audit to obtain reasonable assurance about whether the financial statements are free of material misstatement. An audit includes examining, on a test basis, evidence supporting the amounts and disclosures in the financial statements, assessing the accounting principles used and significant estimates made by management, and evaluating the overall financial statement presentation. We believe that our audits, which included confirmation of securities at January 31, 2008 by correspondence with the custodians and brokers and by agreement to the underlying ownership records for Vanguard Market Liquidity Fund, provide a reasonable basis for our opinion.
PricewaterhouseCoopers LLP
Philadelphia, Pennsylvania
March 12, 2008
Special 2007 tax information (unaudited) for Vanguard Energy Fund
This information for the fiscal year ended January 31, 2008, is included pursuant to provisions of the Internal Revenue Code.
The fund distributed $692,666,000 as capital gain dividends (from net long-term capital gains) to shareholders during the fiscal year.
The fund distributed $159,284,000 of qualified dividend income to shareholders during the fiscal year.
For corporate shareholders, 27.5% of investment income (dividend income plus short-term gains, if any) qualifies for the dividends-received deduction.
28
Your Fund’s After-Tax Returns
This table presents returns for your fund both before and after taxes. The after-tax returns are shown in two ways: (1) assuming that an investor owned the fund during the entire period and paid taxes on the fund’s distributions, and (2) assuming that an investor paid taxes on the fund’s distributions and sold all shares at the end of each period.
Calculations are based on the highest individual federal income tax and capital gains tax rates in effect at the times of the distributions and the hypothetical sales. State and local taxes were not considered. After-tax returns reflect any qualified dividend income, using actual prior-year figures and estimates for 2008. (In the example, returns after the sale of fund shares may be higher than those assuming no sale. This occurs when the sale would have produced a capital loss. The calculation assumes that the investor received a tax deduction for the loss.)
The table shows returns for Investor Shares only; returns for other share classes will differ. Please note that your actual after-tax returns will depend on your tax situation and may differ from those shown. Also note that if you own the fund in a tax-deferred account, such as an individual retirement account or a 401(k) plan, this information does not apply to you. Such accounts are not subject to current taxes.
Finally, keep in mind that a fund’s performance—whether before or after taxes—does not guarantee future results.
Average Annual Total Returns: Energy Fund Investor Shares1 |
Periods Ended January 31, 2008 | | | |
| One | Five | Ten |
| Year | Years | Years |
Returns Before Taxes | 25.02% | 31.61% | 18.05% |
Returns After Taxes on Distributions | 23.50 | 30.71 | 16.90 |
Returns After Taxes on Distributions and Sale of Fund Shares | 17.80 | 28.19 | 15.77 |
1 Total returns do not reflect the 1% fee assessed on redemptions of shares held less than one year, nor do they include the account service fee that may be applicable to certain accounts with balances below $10,000.
29
About Your Fund’s Expenses
As a shareholder of the fund, you incur ongoing costs, which include costs for portfolio management, administrative services, and shareholder reports (like this one), among others. Operating expenses, which are deducted from a fund’s gross income, directly reduce the investment return of the fund.
A fund’s expenses are expressed as a percentage of its average net assets. This figure is known as the expense ratio. The following examples are intended to help you understand the ongoing costs (in dollars) of investing in your fund and to compare these costs with those of other mutual funds. The examples are based on an investment of $1,000 made at the beginning of the period shown and held for the entire period.
The table below illustrates your fund’s costs in two ways:
• Based on actual fund return. This section helps you to estimate the actual expenses that you paid over the period. The “Ending Account Value” shown is derived from the fund’s actual return, and the third column shows the dollar amount that would have been paid by an investor who started with $1,000 in the fund. You may use the information here, together with the amount you invested, to estimate the expenses that you paid over the period.
To do so, simply divide your account value by $1,000 (for example, an $8,600 account value divided by $1,000 = 8.6), then multiply the result by the number given for your fund under the heading “Expenses Paid During Period.”
• Based on hypothetical 5% yearly return. This section is intended to help you compare your fund’s costs with those of other mutual funds. It assumes that the fund had a yearly return of 5% before expenses, but that the expense ratio is unchanged. In this case—because the return used is not the fund’s actual return—the results do not apply to your investment. The example is useful in making comparisons because the Securities and Exchange Commission requires all mutual funds to calculate expenses based on a 5% return. You can assess your fund’s costs by comparing this hypothetical example with the hypothetical examples that appear in shareholder reports of other funds.
Six Months Ended January 31, 2008 | | | |
| Beginning | Ending | Expenses |
| Account Value | Account Value | Paid During |
Energy Fund | 7/31/2007 | 1/31/2008 | Period1 |
Based on Actual Fund Return | | | |
Investor Shares | $1,000.00 | $1,039.19 | $1.28 |
Admiral Shares | 1,000.00 | 1,039.73 | 0.82 |
Based on Hypothetical 5% Return | | | |
Investor Shares | $1,000.00 | $1,023.95 | $1.28 |
Admiral Shares | 1,000.00 | 1,024.40 | 0.82 |
1 These calculations are based on expenses incurred in the most recent six-month period. The fund’s annualized six-month expense ratios for that period are 0.25% for Investor Shares and 0.16% for Admiral Shares. The dollar amounts shown as “Expenses Paid” are equal to the annualized expense ratio multiplied by the average account value over the period, multiplied by the number of days in the most recent six-month period, then divided by the number of days in the most recent 12-month period.
30
Note that the expenses shown in the table on page 26 are meant to highlight and help you compare ongoing costs only and do not reflect transaction costs incurred by the fund for buying and selling securities. Further, the expenses do not include the 1% fee on redemptions of shares held for less than one year, nor do they include the account service fee described in the prospectus. If such fees were applied to your account, your costs would be higher. Your fund does not carry a “sales load.”
The calculations assume no shares were bought or sold during the period. Your actual costs may have been higher or lower, depending on the amount of your investment and the timing of any purchases or redemptions.
You can find more information about the fund’s expenses, including annual expense ratios, in the Financial Statements section of this report. For additional information on operating expenses and other shareholder costs, please refer to your fund’s current prospectus.
31
Glossary
Beta. A measure of the magnitude of a fund’s past share-price fluctuations in relation to the ups and downs of a given market index. The index is assigned a beta of 1.00. Compared with a given index, a fund with a beta of 1.20 typically would have seen its share price rise or fall by 12% when the index rose or fell by 10%. For this report, beta is based on returns over the past 36 months for both the fund and the index. Note that a fund’s beta should be reviewed in conjunction with its R-squared (see definition below). The lower the R-squared, the less correlation there is between the fund and the index, and the less reliable beta is as an indicator of volatility.
Earnings Growth Rate. The average annual rate of growth in earnings over the past five years for the stocks now in a fund.
Equity Exposure. A measure that reflects a fund’s investments in stocks and stock futures. Any holdings in short-term reserves are excluded.
Expense Ratio. The percentage of a fund’s average net assets used to pay its annual administrative and advisory expenses. These expenses directly reduce returns to investors.
Foreign Holdings. The percentage of a fund represented by stocks or depositary receipts of companies based outside the United States.
Inception Date. The date on which the assets of a fund (or one of its share classes) are first invested in accordance with the fund’s investment objective. For funds with a subscription period, the inception date is the day after that period ends. Investment performance is measured from the inception date.
Median Market Cap. An indicator of the size of companies in which a fund invests; the midpoint of market capitalization (market price x shares outstanding) of a fund’s stocks, weighted by the proportion of the fund’s assets invested in each stock. Stocks representing half of the fund’s assets have market capitalizations above the median, and the rest are below it.
Price/Book Ratio. The share price of a stock divided by its net worth, or book value, per share. For a fund, the weighted average price/book ratio of the stocks it holds.
Price/Earnings Ratio. The ratio of a stock’s current price to its per-share earnings over the past year. For a fund, the weighted average P/E of the stocks it holds. P/E is an indicator of market expectations about corporate prospects; the higher the P/E, the greater the expectations for a company’s future growth.
R-Squared. A measure of how much of a fund’s past returns can be explained by the returns from the market in general, as measured by a given index. If a fund’s total returns were precisely synchronized with an index’s returns, its R-squared would be 1.00. If the fund’s returns bore no relationship to the index’s returns, its R-squared would be 0. For this report, R-squared is based on returns over the past 36 months for both the fund and the index.
Return on Equity. The annual average rate of return generated by a company during the past five years for each dollar of shareholder’s equity (net income divided by shareholder’s equity). For a fund, the weighted average return on equity for the companies whose stocks it holds.
Short-Term Reserves. The percentage of a fund invested in highly liquid, short-term securities that can be readily converted to cash.
Turnover Rate. An indication of the fund’s trading activity. Funds with high turnover rates incur higher transaction costs and may be more likely to distribute capital gains (which may be taxable to investors). The turnover rate excludes in-kind transactions, which have minimal impact on costs.
Yield. A snapshot of a fund’s income from interest and dividends. The yield, expressed as a percentage of the fund’s net asset value, is based on income earned over the past 30 days and is annualized, or projected forward for the coming year. The index yield is based on the current annualized rate of income provided by securities in the index.
32
This page intentionally left blank.
This page intentionally left blank.
This page intentionally left blank.
The People Who Govern Your Fund
The trustees of your mutual fund are there to see that the fund is operated and managed in your best interests since, as a shareholder, you are a part owner of the fund. Your fund’s trustees also serve on the board of directors of The Vanguard Group, Inc., which is owned by the Vanguard funds and provides services to them on an at-cost basis.
A majority of Vanguard’s board members are independent, meaning that they have no affiliation with Vanguard or the funds they oversee, apart from the sizable personal investments they have made as private individuals.
Our independent board members bring distinguished backgrounds in business, academia, and public service to their task of working with Vanguard officers to establish the policies and oversee the activities of the funds. Among board members’ responsibilities are selecting investment advisors for the funds; monitoring fund operations, performance, and costs; reviewing contracts; nominating and selecting new trustees/directors; and electing Vanguard officers.
Each trustee serves a fund until its termination; or until the trustee’s retirement, resignation, or death; or otherwise as specified in the fund’s organizational documents. Any trustee may be removed at a shareholders’ meeting by a vote representing two-thirds of the net asset value of all shares of the fund together with shares of other Vanguard funds organized within the same trust. The table on these two pages shows information for each trustee and executive officer of the fund. The mailing address of the trustees and officers is P.O. Box 876, Valley Forge, PA 19482.
Chairman of the Board, Chief Executive Officer, and Trustee |
| |
John J. Brennan1 | |
Born 1954 | Principal Occupation(s) During the Past Five Years: Chairman of the Board, Chief Executive |
Trustee since May 1987; | Officer, and Director/Trustee of The Vanguard Group, Inc., and of each of the investment |
Chairman of the Board and | companies served by The Vanguard Group. |
Chief Executive Officer | |
152 Vanguard Funds Overseen | |
| |
Independent Trustees | |
| |
Charles D. Ellis | |
Born 1937 | Principal Occupation(s) During the Past Five Years: Applecore Partners (pro bono ventures |
Trustee since January 2001 | in education); Senior Advisor to Greenwich Associates (international business strategy |
152 Vanguard Funds Overseen | consulting); Successor Trustee of Yale University; Overseer of the Stern School of Business |
| at New York University; Trustee of the Whitehead Institute for Biomedical Research. |
| |
Emerson U. Fullwood | |
Born 1948 | Principal Occupation(s) During the Past Five Years: Executive Chief Staff and Marketing |
Trustee since January 2008 | Officer for North America since 2004 and Corporate Vice President of Xerox Corporation |
152 Vanguard Funds Overseen | (photocopiers and printers); Director of SPX Corporation (multi-industry manufacturing), |
| of the United Way of Rochester, and of the Boy Scouts of America. |
| |
Rajiv L. Gupta | |
Born 1945 | Principal Occupation(s) During the Past Five Years: Chairman, President, and |
Trustee since December 20012 | Chief Executive Officer of Rohm and Haas Co. (chemicals); Board Member of |
152 Vanguard Funds Overseen | the American Chemistry Council; Director of Tyco International, Ltd. (diversified |
| manufacturing and services) since 2005. |
Amy Gutmann | |
Born 1949 | Principal Occupation(s) During the Past Five Years: President of the University of |
Trustee since June 2006 | Pennsylvania since 2004; Professor in the School of Arts and Sciences, Annenberg School |
152 Vanguard Funds Overseen | for Communication, and Graduate School of Education of the University of Pennsylvania |
| since 2004; Provost (2001–2004) and Laurance S. Rockefeller Professor of Politics and |
| the University Center for Human Values (1990–2004), Princeton University; Director of |
| Carnegie Corporation of New York since 2005 and of Schuylkill River Development |
| Corporation and Greater Philadelphia Chamber of Commerce since 2004. |
| |
JoAnn Heffernan Heisen | |
Born 1950 | Principal Occupation(s) During the Past Five Years: Corporate Vice President and |
Trustee since July 1998 | Chief Global Diversity Officer since 2006, Vice President and Chief Information |
152 Vanguard Funds Overseen | Officer (1997–2005), and Member of the Executive Committee of Johnson & |
| Johnson (pharmaceuticals/consumer products); Director of the University Medical |
| Center at Princeton and Women’s Research and Education Institute. |
| |
André F. Perold | |
Born 1952 | Principal Occupation(s) During the Past Five Years: George Gund Professor of Finance |
Trustee since December 2004 | and Banking, Harvard Business School; Senior Associate Dean, Director of Faculty |
152 Vanguard Funds Overseen | Recruiting, and Chair of Finance Faculty, Harvard Business School; Director and Chairman |
| of UNX, Inc. (equities trading firm) since 2003; Chair of the Investment Committee of |
| HighVista Strategies LLC (private investment firm) since 2005. |
| |
Alfred M. Rankin, Jr. | |
Born 1941 | Principal Occupation(s) During the Past Five Years: Chairman, President, Chief Executive |
Trustee since January 1993 | Officer, and Director of NACCO Industries, Inc. (forklift trucks/housewares/lignite); Director |
152 Vanguard Funds Overseen | of Goodrich Corporation (industrial products/aircraft systems and services). |
| |
| |
J. Lawrence Wilson | |
Born 1936 | Principal Occupation(s) During the Past Five Years: Retired Chairman and Chief Executive |
Trustee since April 1985 | Officer of Rohm and Haas Co. (chemicals); Director of Cummins Inc. (diesel engines) and |
152 Vanguard Funds Overseen | AmerisourceBergen Corp. (pharmaceutical distribution); Trustee of Vanderbilt University |
| and of Culver Educational Foundation. |
| |
Executive Officers1 | |
| |
Thomas J. Higgins | |
Born 1957 | Principal Occupation(s) During the Past Five Years: Principal of The Vanguard Group, Inc.; |
Treasurer since July 1998 | Treasurer of each of the investment companies served by The Vanguard Group. |
152 Vanguard Funds Overseen | |
| |
| |
Heidi Stam | |
Born 1956 | Principal Occupation(s) During the Past Five Years: Managing Director of The Vanguard |
Secretary since July 2005 | Group, Inc., since 2006; General Counsel of The Vanguard Group since 2005; Secretary of |
152 Vanguard Funds Overseen | The Vanguard Group, and of each of the investment companies served by The Vanguard |
| Group, since 2005; Principal of The Vanguard Group (1997–2006). |
Vanguard Senior Management Team | | |
| | | |
R. Gregory Barton | Kathleen C. Gubanich | F. William McNabb III | Ralph K. Packard |
Mortimer J. Buckley | Paul A. Heller | Michael S. Miller | George U. Sauter |
Founder |
|
John C. Bogle |
Chairman and Chief Executive Officer, 1974–1996 |
1 Officers of the funds are “interested persons” as defined in the Investment Company Act of 1940.
2 December 2002 for Vanguard Equity Income Fund, Vanguard Growth Equity Fund, the Vanguard Municipal Bond Funds, and the Vanguard State Tax-Exempt Funds.
More information about the trustees is in the Statement of Additional Information, available from The Vanguard Group.
| 
|
| P.O. Box 2600 |
| Valley Forge, PA 19482-2600 |
Connect with Vanguard® > www.vanguard.com
Fund Information > 800-662-7447 | Vanguard, Admiral, Connect with Vanguard, and the |
| ship logo are trademarks of The Vanguard Group, Inc. |
Direct Investor Account Services > 800-662-2739 | |
| |
Institutional Investor Services > 800-523-1036 | All other marks are the exclusive property of their |
| respective owners. |
Text Telephone for People | |
With Hearing Impairment > 800-952-3335 | |
| All comparative mutual fund data are from Lipper Inc. |
| or Morningstar, Inc., unless otherwise noted. |
| |
| |
| You can obtain a free copy of Vanguard’s proxy voting |
This material may be used in conjunction | guidelines by visiting our website, www.vanguard.com, |
with the offering of shares of any Vanguard | and searching for “proxy voting guidelines,” or by |
fund only if preceded or accompanied by | calling Vanguard at 800-662-2739. The guidelines are |
the fund’s current prospectus. | also available from the SEC’s website, www.sec.gov. |
| In addition, you may obtain a free report on how your |
| fund voted the proxies for securities it owned during |
| the 12 months ended June 30. To get the report, visit |
| either www.vanguard.com or www.sec.gov. |
| |
| |
| You can review and copy information about your fund |
| at the SEC’s Public Reference Room in Washington, D.C. |
| To find out more about this public service, call the SEC |
| at 202-551-8090. Information about your fund is also |
| available on the SEC’s website, and you can receive |
| copies of this information, for a fee, by sending a |
| request in either of two ways: via e-mail addressed to |
| publicinfo@sec.gov or via regular mail addressed to the |
| Public Reference Section, Securities and Exchange |
| Commission, Washington, DC 20549-0102. |
| |
| |
| |
| |
| |
| © 2008 The Vanguard Group, Inc. |
| All rights reserved. |
| Vanguard Marketing Corporation, Distributor. |
| |
| Q510 032008 |
> | For the fiscal year ended January 31, 2008, Vanguard Precious Metals and Mining Fund returned 34.0%, outperforming the average return of its peer funds but lagging its custom benchmark. |
> | As robust global demand lifted commodity prices and worrisome economic news led investors to seek shelter in gold assets, the fund’s exceptional return far surpassed the –2.7% result of the broad U.S. stock market and the 5.4% return of international stock markets. |
> | For the decade ended January 31, despite significant interim volatility, the Precious Metals and Mining Fund’s average annual return was 22.5%—besting the performance of its benchmark, the average return of its peer funds, and world stock markets. |
Contents | |
| |
Your Fund’s Total Returns | 1 |
Chairman’s Letter | 2 |
Advisor’s Report | 8 |
Fund Profile | 10 |
Performance Summary | 11 |
Financial Statements | 13 |
Your Fund’s After-Tax Returns | 24 |
About Your Fund’s Expenses | 25 |
Glossary | 27 |
Past performance is not a guarantee of future results. (Current performance may be lower or higher than the performance data cited. For performance data current to the most recent month-end, visit our website at www.vanguard.com/performance.) Note, too, that both investment returns and principal value can fluctuate widely, so an investor’s shares, when sold, could be worth more or less than their original cost.
Please note: The opinions expressed in this report are just that—informed opinions. They should not be considered promises or advice. Also, please keep in mind that the information and opinions cover the period through the date on the cover of this report. Of course, the risks of investing in your fund are spelled out in the prospectus.
Your Fund’s Total Returns
Fiscal Year Ended January 31, 2008 | | |
| Ticker | Total |
| Symbol | Returns |
Vanguard Precious Metals and Mining Fund | VGPMX | 34.0% |
S&P/Citigroup Custom Precious Metals and Mining Index | | 40.2 |
Average Gold-Oriented Fund1 | | 33.6 |
Your Fund’s Performance at a Glance | | | | |
January 31, 2007–January 31, 2008 | | | | |
| | | Distributions Per Share |
| Starting | Ending | Income | Capital |
| Share Price | Share Price | Dividends | Gains |
Vanguard Precious Metals and Mining Fund | $28.64 | $33.45 | $0.670 | $3.782 |
1 Derived from data provided by Lipper Inc.
1

Chairman’s Letter
Dear Shareholder,
For the fiscal year ended January 31, 2008, Vanguard Precious Metals and Mining Fund returned 34.0%, outperforming both the average return of peer funds and world stock markets. Compared with its gold-oriented benchmark, the fund’s emphasis on the broader mining industry—including an underperforming platinum producer—held its returns in check. In the long run, however, the fund’s diversified approach moderates some of the high volatility often experienced in precious metals stocks.
Gold and platinum prices were driven higher by a mix of investor, consumer, and commercial demand from developed and fast-growing emerging-market nations. Rapid industrialization in the developing world also boosted basic commodity prices. Vanguard Precious Metals and Mining Fund was well-positioned to benefit from this broad-based rally and from the advisor’s focus on large, asset-rich companies with a favorable supply/demand balance, strong cash flows, and capable management.
Please note that the fund remained closed to most new investors. (The fund closure does not apply to Flagship members.) Existing account holders may purchase additional shares. If you hold the fund in a taxable account, you may wish to refer to our report on after-tax performance on page 23.
2
Stocks gained in the first half but faltered in the second
The broad U.S. stock market returned –2.7% for the 12 months ended January 31, reflecting a volatile year punctuated by sharp declines for equities. Gains in the first half of the fiscal period were largely relinquished in midsummer and fall as repercussions from the subprime mortgage debacle began to be felt in the broader U.S. economy. The stock market’s retreat accelerated in January amid tightening global credit markets, a weakening U.S. dollar, and widening fears of a U.S. recession.
Large-capitalization stocks fared best in these unsettled conditions, outperforming small-caps for the year; meanwhile, growth stocks bested their value-oriented counterparts.
International stocks outperformed U.S. stocks for the sixth straight year, largely owing to exchange-rate gains produced by the weak U.S. dollar. Emerging markets and developed economies in Europe and Asia posted strong performances earlier in the fiscal year, but slumped after November as a result of increased concern about a U.S.-led downturn.
Market Barometer | |
| Average Annual Total Returns |
| Periods Ended January 31, 2008 |
| One Year | Three Years | Five Years |
Stocks | | | |
Russell 1000 Index (Large-caps) | –2.4% | 7.8% | 12.6% |
Russell 2000 Index (Small-caps) | –9.8 | 5.8 | 15.3 |
Dow Jones Wilshire 5000 Index (Entire market) | –2.7 | 7.9 | 13.2 |
MSCI All Country World Index ex USA (International) | 5.4 | 17.0 | 22.9 |
| | | |
Bonds | | | |
Lehman U.S. Aggregate Bond Index (Broad taxable market) | 8.8% | 4.9% | 4.8% |
Lehman Municipal Bond Index | 4.9 | 4.0 | 4.6 |
Citigroup 3-Month Treasury Bill Index | 4.6 | 4.2 | 3.0 |
| | | |
CPI | | | |
Consumer Price Index | 4.3% | 3.4% | 3.0% |
3
Bond returns grew stronger as Fed lowered rates
During the first half of the fiscal year, a stronger U.S. economy made investors more willing to take on risk to earn higher yields; spreads thus narrowed between the yields of U.S. Treasury securities and those of lower-quality issues. But as the subprime lending problems unraveled further in the summer, investors flocked to higher-quality government and corporate bonds. This drove Treasury prices higher and yields lower, widening the spread between Treasury yields and those of riskier bonds.
The Federal Reserve Board responded to the credit market turmoil and deteriorating economic outlook with aggressive reductions in its target for the federal funds rate. The Fed cut the rate five times during the fiscal year (twice in January), ending the period at 3.0%, the lowest rate since May 2005.
Lower interest rates depressed bond yields, but pushed prices higher. The broad taxable bond market returned 8.8% for the fiscal year. Tax-exempt municipal bonds returned 4.9%.
Total Returns | |
Ten Years Ended January 31, 2008 | |
| Average |
| Annual Return |
Precious Metals and Mining Fund | 22.5% |
Spliced Precious Metals and Mining Index1 | 18.1 |
Average Gold-Oriented Fund2 | 16.7 |
The figures shown represent past performance, which is not a guarantee of future results. (Current performance may be lower or higher than the performance data cited. For performance data current to the most recent month-end, visit our website at www.vanguard.com/performance.) Note, too, that both investment returns and principal value can fluctuate widely, so an investor’s shares, when sold, could be worth more or less than their original cost.
1 | S&P/Citigroup World Equity Gold Index through June 30, 2005; S&P/Citigroup Custom Precious Metals and Mining Index thereafter. |
2 | Derived from data provided by Lipper Inc. |
4
Fund capitalized on broad-based rally in metals and commodities
Since ancient times, gold has been considered a store of value. This was evident over the past year, as investors flocked to gold assets and U.S. Treasury bonds in the wake of the subprime mortgage crisis and liquidity crunch. Gold surged to a record price—more than $920 per ounce—in January 2008, on mounting concerns about inflation, a possible U.S. recession that could put the brakes on global economic growth, and geopolitical tensions. Output at some of the world’s largest gold and platinum mines in South Africa, recently disrupted by other issues, was curtailed by January power blackouts that stoked the precious metals’ upward price spiral. Continuing a multiyear trend, robust demand for base metals and industrial commodities—especially to support Asian infrastructure expansion—drove raw materials prices higher. The stock prices of major producers followed suit.
Within the confines of a concentrated sector portfolio of 40 to 45 stocks—with the combined top-ten holdings averaging 57% of the portfolio—the fund earned its returns from several corners of its investable universe. Gold shares contributed more than 5 percentage points to total return, led by top-ten holding Barrick Gold of Canada. Other precious metals stocks contributed another 5 percentage points to return, with standout performance from two top-ten South African producers, Impala Platinum Holdings and Anglo Platinum.
Expense Ratios1 | | |
Your fund compared with its peer group | | |
| | Average |
| | Gold-Oriented |
| Fund | Fund |
Precious Metals and Mining Fund | 0.28% | 1.52% |
1 Fund expense ratio reflects the 12 months ended January 31, 2008. Peer-group expense ratio is derived from data provided by Lipper Inc. and captures information through year-end 2007.
5
Platinum prices benefited from the metal’s industrial use in catalytic converters to reduce toxic emissions, as well as its use in jewelry.
Diversified metals and mining enterprises also delivered lustrous results and contributed 10 percentage points to total return. Leaders were top-ten holding Eramet—up almost 220% for the year—a French producer of nickel and other nonferrous metals, and Rio Tinto, an Australian mining conglomerate and takeover candidate.
The fund’s holdings in selected chemicals and coal producers enhanced both absolute and relative returns. K+S and Agrium—two chemicals companies that extract and produce ingredients for fertilizer, which is in high demand to improve crop yields—were strong contributors. Coal producers averaged 9% of the portfolio and added almost 7 percentage points of total return. Previously a major coal exporter, China became a net importer, which boosted coal prices and producers’ share prices. CONSOL Energy, a U.S. producer and top-ten holding, signed new contracts to deliver coal to Europe, where economics favor coal-fired electrical power generation over oil.
A notable detractor was Harry Winston Diamond, a top-ten holding during the year. Lackluster performance by platinum producer Lonmin—the largest position in the fund on average—and limited exposure to certain diversified metals and mining companies that profited from industry consolidation, represented missed opportunities.
Diversification has been rewarding over the long term
The fund’s long-term track record remains outstanding, despite the sector’s occasionally dramatic ups and downs. For the decade ended January 31, 2008, the 22.5% average annual return of the Precious Metals and Mining Fund bested the average return of gold-oriented funds, as well as the returns of the benchmark index, by a wide margin. A hypothetical initial investment of $10,000 made in the fund ten years ago would have grown to $76,276 as of January 31, significantly exceeding the comparable ending balance of $46,749 for the average peer fund.
This exceptional long-term performance is a tribute to London-based M&G Investment Management, the fund’s advisor since its inception, which uses a bottom-up stock selection process focused on quality. The fund’s investment mandate, which allows the Precious Metals and Mining Fund to be more diversified than most of its peer funds, helps to temper some of the volatility characteristic of precious metals stocks.
6
And Vanguard’s low expenses help investors keep more of the fund’s return, an advantage that can compound over time.
Maintain long-term focus on core beliefs
The Precious Metals and Mining Fund notched its seventh consecutive year of double-digit returns in fiscal 2008. While we are pleased with its outstanding track record of both absolute and relative performance, we remind investors that this is a concentrated fund with a relatively small number of holdings in a volatile sector of the market. We can’t predict whether or when the road may turn bumpy again, but chances are that it will.
No matter how tempting it may be to pursue stocks or market segments that are leading the market at the moment, Vanguard’s core beliefs are constant: Shareholders should invest with a long-term view, diversify within and across asset classes, and pay attention to costs. That’s why we encourage you to consider this fund not on a stand-alone basis but within a balanced, diversified portfolio consistent with your comfort level and long-term goals. The Precious Metals and Mining Fund can provide low-cost exposure to a sector of the market that offers unique portfolio diversification opportunities.
As I close this report to you, it’s my pleasure to introduce the fund’s new president, F. William McNabb III. Bill is a man of great character and integrity who is intimately familiar with all aspects of Vanguard—from how we serve our clients to how we invest for our clients.
Bill and I have worked together very closely for more than two decades. I’m thrilled that the fund’s board elected him president, effective March 1, and designated him as my successor as chief executive officer, a role he will assume within a year, after an orderly transition. Bill and the rest of our team will serve you and our other clients extremely well in the years ahead.
Thank you for entrusting your assets to Vanguard.
Sincerely,

John J. Brennan
Chairman and Chief Executive Officer
February 22, 2008
7
Advisor’s Report
Vanguard Precious Metals and Mining Fund returned 34.0% for the fiscal year ended January 31, 2008. The fund outperformed the 33.6% average return of gold-oriented funds, but trailed the 40.2% return of its custom benchmark index.
The investment environment
The price of gold bullion hit a record high of more than $920 per ounce during the fiscal year. Gold’s position as a traditional store of value led investors to seek safety in the metal as inflation worries mounted and financial markets faltered worldwide. Many other metals and minerals also rose to record levels during the year, supported by supply-side constraints and fast-growing global demand. The slowing U.S. economy did not dampen the appetite of industrializing nations such as China and India for raw materials to fuel growth. Against this backdrop, firms that mine a broad array of metals and minerals delivered exceptional returns. Gold-oriented stocks, however, generally underperformed many of their broader counterparts, as some companies struggled to overcome rising costs and remained focused on growth rather than profitability.
The portfolio’s performance
French nickel group Eramet, one of the few remaining independent producers in this highly consolidated industry, made an extremely strong contribution as investors focused on the long-term value of the company’s nickel and manganese assets amid rising international demand for steel. Platinum prices followed gold prices to record highs, rewarding the fund’s platinum exposure. South African producers Anglo Platinum and Impala Platinum Holdings were notable performers, despite rising costs and some production-related problems. Holdings in coal producers CONSOL Energy (U.S.) and Centennial Coal (Australia) had a positive impact on the fund’s return as coal prices rose sharply. With China recently banning coal exports to help meet domestic demand and with energy shortages causing power blackouts in many countries, coal is gaining favor as a highly valuable and economic source of lower-cost power generation; furthermore, we are encouraged to see that many coal producers are moving toward cleaner-coal technology. Our positions in German potash miner K+S and Canadian fertilizer producer Agrium added significant value, benefiting from intensifying demand for fertilizers to improve land yields. Among our gold holdings, a strong contribution came from Canadian miner Barrick Gold, the world’s largest producer and one of the few capitalizing on high gold prices by actively improving its returns.
On the negative side, Canadian diamond producer Harry Winston Diamond (previously Aber Diamond) suffered from rising input costs in its mining business and from the perception that its diamond retailing business would be a casualty of the U.S. consumer slowdown. However, the company is achieving record production levels, and fundamentals for the diamond industry remain extremely compelling. Elsewhere, despite its consistently strong business and decent earnings, shares in French kaolin producer
8
Imerys were depressed by rising energy costs and concerns over the company’s exposure to the weakening construction industry. AMCOL International, a U.S. producer of highly absorbent bentonite clays used in many industrial applications, including auto manufacturing, also declined because of the company’s perceived sensitivity to economic slowdown in the United States.
The fund’s positioning
We made a significant addition to our position in Barrick Gold, which is attractively positioned and benefiting from cost-reducing synergies following its recent acquisition of Placer Dome. We also increased our positions in United Kingdom-based companies Peter Hambro Mining (which produces gold in Russia) and Johnson Matthey. We expect Peter Hambro Mining’s focus on increasing production and efficiency to generate higher returns than those found in most of the gold industry. Johnson Matthey, which processes platinum for use in automotive catalytic converters, has benefited from rising global demand, fueled by stricter regulation of exhaust emissions. Finally, we established a new position in Aur Resources, a well-managed copper miner with assets in Chile and Canada; the company was subsequently acquired by Teck Cominco at a significant premium.
Our largest sale was Australian diversified mining company Rio Tinto, a long-held position that delivered many years of very strong performance for the portfolio. Our growing concerns over its management strategy led us to opt for better long-term valuation opportunities elsewhere. We also exited our positions in Canadian-listed copper and gold miner First Quantum Minerals, as well as K+S and Agrium, following robust long-term returns from all three holdings.
Looking forward, we are encouraged by the attractive supply/demand balance for raw materials. Strong demand from both emerging and developed nations is being driven primarily by China’s extraordinary industrial expansion. Supply remains tight because of ongoing consolidation in the mining industry and years of underinvestment in new projects. We remain confident that the long-term outlook for commodities provides a favorable environment for the mining companies in our portfolio. Following significant share price appreciation, we are mindful of valuations. We will continue to employ an extremely rigorous stock-selection approach focused on higher-returning companies that are creating long-term value for shareholders.
Graham E. French, Portfolio Manager
M&G Investment Management Ltd.
February 19, 2008
9
Fund Profile
As of January 31, 2008
Portfolio Characteristics | | |
| | Comparative | Broad |
| Fund | Index1 | Index2 |
Number of Stocks | 40 | 312 | 4,830 |
Median Market Cap | $8.2B | $23.4B | $33.7B |
Price/Earnings Ratio | 21.2x | 20.1x | 17.0x |
Price/Book Ratio | 3.6x | 3.5x | 2.5x |
Return on Equity | 17.4% | 19.5% | 19.2% |
Earnings Growth Rate | 22.9% | 32.1% | 20.1% |
Foreign Holdings | 81.3% | 0.0% | 0.0% |
Turnover Rate | 29.3% | — | — |
Expense Ratio | 0.28% | — | — |
Short-Term Reserves | 2.1% | — | — |
Market Diversification (% of equity exposure) |
| |
Canada | 19.8% |
United Kingdom | 19.7 |
United States | 17.3 |
South Africa | 14.5 |
France | 13.3 |
Australia | 10.7 |
Peru | 2.5 |
Norway | 1.8 |
Indonesia | 0.4 |
Volatility Measures3 | |
| Fund Versus | Fund Versus |
| Comparative Index1 | Broad Index2 |
R-Squared | 0.88 | 0.39 |
Beta | 0.82 | 1.52 |
Ten Largest Holdings4 (% of total net assets) |
| |
Eramet SLN | 8.7% |
Lonmin PLC | 8.6 |
Impala Platinum Holdings Ltd. ADR | 7.7 |
Barrick Gold Corp. | 7.0 |
Johnson Matthey PLC | 6.9 |
CONSOL Energy, Inc. | 5.1 |
Anglo Platinum Ltd. ADR | 4.9 |
Centerra Gold Inc. | 4.6 |
Imerys SA | 4.3 |
Sims Group Ltd. | 3.9 |
Top Ten | 61.7% |
1 S&P/Citigroup Custom Precious Metals and Mining Index.
2 Dow Jones Wilshire 5000 Index.
3 For an explanation of R-squared, beta, and other terms used here, see the Glossary on page 26.
4 “Ten Largest Holdings” excludes any temporary cash investments and equity index products.
10
Performance Summary
All of the returns in this report represent past performance, which is not a guarantee of future results that may be achieved by the fund. (Current performance may be lower or higher than the performance data cited. For performance data current to the most recent month-end, visit our website at www.vanguard.com/performance.) Note, too, that both investment returns and principal value can fluctuate widely, so an investor’s shares, when sold, could be worth more or less than their original cost. The returns shown do not reflect taxes that a shareholder would pay on fund distributions or on the sale of fund shares.
Cumulative Performance: January 31, 1998–January 31, 2008
Initial Investment of $10,000
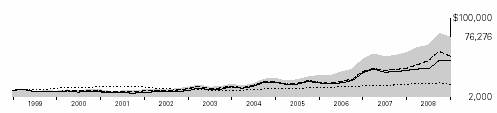
| | Average Annual Total Returns | Final Value |
| | Periods Ended January 31, 2008 | of a $10,000 |
| One Year | Five Years | Ten Years | Investment |
Precious Metals and Mining Fund1 | 33.97% | 34.53% | 22.53% | $76,276 |
Dow Jones Wilshire 5000 Index | –2.70 | 13.21 | 5.61 | 17,266 |
Spliced Precious Metals and Mining Index2 | 40.24 | 28.06 | 18.11 | 52,835 |
Average Gold-Oriented Fund3 | 33.62 | 26.67 | 16.67 | 46,749 |
1 Total return figures do not reflect the 1% fee assessed on redemptions of shares held less than one year, nor do they include the account service fee that may be applicable to certain accounts with balances below $10,000.
2 S&P/Citigroup World Equity Gold Index through June 30, 2005; S&P/Citigroup Custom Precious Metals and Mining Index thereafter.
3 Derived from data provided by Lipper Inc.
11
Fiscal Year Total Returns (%) January 31, 1998–January 31, 2008
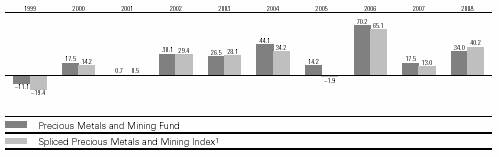
Average Annual Total Returns: Periods Ended December 31, 2007
This table presents average annual total returns through the latest calendar quarter—rather than through the end of the fiscal period. Securities and Exchange Commission rules require that we provide this information.
| Inception Date | One Year | Five Years | Ten Years |
Precious Metals and Mining Fund2 | 5/23/1984 | 36.13% | 35.28% | 23.42% |
1 S&P/Citigroup World Equity Gold Index through June 30, 2005; S&P/Citigroup Custom Precious Metals and Mining Index thereafter.
2 Total return figures do not reflect the 1% fee assessed on redemptions of shares held less than one year, nor do they include the account service fee that may be applicable to certain accounts with balances below $10,000.
Note: See Financial Highlights table on page 17 for dividend and capital gains information.
12
Financial Statements
Statement of Net Assets
As of January 31, 2008
The fund provides a complete list of its holdings four times in each fiscal year, at the quarter-ends. For the second and fourth fiscal quarters, the lists appear in the fund’s semiannual and annual reports to shareholders. For the first and third fiscal quarters, the fund files the lists with the Securities and Exchange Commission on Form N-Q. Shareholders can look up the fund’s Forms N-Q on the SEC’s website at www.sec.gov. Forms N-Q may also be reviewed and copied at the SEC’s Public Reference Room (see the back cover of this report for further information).
| | | Market |
| | | Value• |
| | Shares | ($000) |
Common Stocks (98.2%) | | |
Australia (10.5%) | | |
1 ^ | Sims Group Ltd. | 7,100,000 | 182,990 |
| BlueScope Steel Ltd. | 14,050,000 | 130,230 |
1 ^ | Iluka Resources Ltd. | 17,150,000 | 70,228 |
*1^ | St. Barbara Ltd. | 72,000,000 | 53,465 |
1 ^ | Centennial Coal Co., Ltd. | 15,775,000 | 49,955 |
* | Tanami Gold NL | 18,170,000 | 1,988 |
* | MIL Resources, Ltd. | 1,678,671 | 71 |
| | | 488,927 |
Canada (19.4%) | | |
| Barrick Gold Corp. | 6,300,000 | 325,086 |
*1 | Centerra Gold Inc. | 14,165,000 | 214,439 |
1 | Harry Winston | | |
| Diamond Corp. | 7,250,000 | 178,714 |
| Sherritt International Corp. | 8,725,000 | 116,270 |
* | Franco-Nevada Corp. | 2,550,000 | 48,255 |
| Yamana Gold, Inc. | 622,500 | 10,259 |
*1 | Claude Resources, Inc. | 5,150,000 | 6,746 |
| | | 899,769 |
France (13.0%) | | |
| Eramet SLN | 776,773 | 403,842 |
| Imerys SA | 2,585,000 | 200,579 |
| | | 604,421 |
Indonesia (0.4%) | | |
| PT International Nickel | | |
| Indonesia Tbk | 22,500,000 | 19,802 |
| | | |
Norway (1.8%) | | |
| Norsk Hydro ASA | 6,850,000 | 82,077 |
| | | |
Papua New Guinea (0.0%) | | |
* | Bougainville Copper Ltd. | 2,000,000 | 1,524 |
| | | |
Peru (2.5%) | | |
| Compania de Minas | | |
| Buenaventura S.A.A. ADR | 1,700,000 | 113,900 |
13
| | | Market |
| | | Value• |
| | Shares | ($000) |
South Africa (14.3%) | | |
| Impala Platinum Holdings | | |
| Ltd. ADR | 9,400,000 | 357,188 |
| Anglo Platinum Ltd. ADR | 1,550,000 | 224,908 |
| Northam Platinum Ltd. | 9,600,000 | 57,209 |
| Gold Fields Ltd. ADR | 1,500,000 | 22,545 |
| | | 661,850 |
United Kingdom (19.3%) | | |
| Lonmin PLC | 6,869,413 | 399,867 |
| Johnson Matthey PLC | 8,650,000 | 322,013 |
*1^ | Peter Hambro Mining PLC | 4,717,368 | 123,928 |
* | Gem Diamond Ltd. | 1,471,428 | 24,518 |
| Hochschild Mining PLC | 2,550,000 | 18,777 |
* | Kenmare Resources PLC | 4,550,000 | 3,792 |
* | Mwana Africa PLC | 3,180,219 | 2,315 |
* | Zambezi Resources Ltd. | 4,895,833 | 1,278 |
| | | 896,488 |
United States (17.0%) | | |
| CONSOL Energy, Inc. | 3,230,000 | 235,790 |
| Peabody Energy Corp. | 3,300,000 | 178,266 |
| FMC Corp. | 2,350,000 | 124,926 |
| Schnitzer Steel Industries, | | |
| Inc. Class A | 1,500,000 | 84,990 |
1 | Minerals Technologies, Inc. | 1,336,514 | 72,706 |
1 | AMCOL International Corp. | 2,600,000 | 63,752 |
| Arch Coal, Inc. | 300,000 | 13,200 |
* | Patriot Coal Corp. | 320,000 | 12,720 |
| | | 786,350 |
Total Common Stocks | | |
(Cost $2,799,967) | | 4,555,108 |
14
| | Market |
| | Value• |
| Shares | ($000) |
Precious Metals (0.1%) | | |
* Platinum Bullion (In Ounces) | 2,009 | 3,492 |
Total Precious Metals | | |
(Cost $1,213) | | 3,492 |
Temporary Cash Investments (3.7%) | | |
2 Vanguard Market Liquidity Fund, 4.060% | 66,604,761 | 66,605 |
2 Vanguard Market Liquidity Fund, 4.060%—Note F | 104,506,137 | 104,506 |
Total Temporary Cash Investments | | |
(Cost $171,111) | | 171,111 |
Total Investments (102.0%) | | |
(Cost $2,972,291) | | 4,729,711 |
Other Assets and Liabilities—Net (–2.0%) | | (94,783) |
Net Assets (100%) | | |
Applicable to 138,558,700 outstanding | | |
$.001 par value shares of beneficial | | |
interest (unlimited authorization) | | 4,634,928 |
Net Asset Value Per Share | | $33.45 |
| | |
Statement of Assets and Liabilities | | |
Assets | | |
Investments in Securities, at Value | | 4,729,711 |
Income Receivable | | 25,111 |
Receivables for Capital Shares Issued | | 11,516 |
Other Assets—Note C | | 6,340 |
Total Assets | | 4,772,678 |
Liabilities | | |
Security Lending Collateral | | |
Payable to Brokers—Note F | | 104,506 |
Payables for Capital Shares Redeemed | | 3,354 |
Other Liabilities | | 29,890 |
Total Liabilities | | 137,750 |
Net Assets | | $4,634,928 |
At January 31, 2008, net assets consisted of:3 |
| Amount | Per |
| ($000) | Share |
Paid-in Capital | 2,767,961 | $19.98 |
Overdistributed Net | | |
Investment Income | (7,025) | (.05) |
Accumulated Net | | |
Realized Gains | 116,492 | .84 |
Unrealized Appreciation | | |
Investment Securities | 1,757,420 | 12.68 |
Foreign Currencies | 80 | — |
Net Assets | 4,634,928 | $33.45 |
• | See Note A in Notes to Financial Statements. |
* | Non-income-producing security. |
^ | Part of security position is on loan to broker-dealers. See Note F in Notes to Financial Statements. |
1 Considered an affiliated company of the fund as the fund owns more than 5% of the outstanding voting securities of such company. See Note H in Notes to Financial Statements.
2 Affiliated money market fund available only to Vanguard funds and certain trusts and accounts managed by Vanguard. Rate shown is the 7-day yield.
3 See Note D in Notes to Financial Statements for the tax-basis components of net assets.
ADR—American Depositary Receipt.
15
Statement of Operations
| Year Ended |
| January 31, 2008 |
| ($000) |
Investment Income | |
Income | |
Dividends1,2 | 113,811 |
Interest2 | 6,054 |
Security Lending | 1,915 |
Total Income | 121,780 |
Expenses | |
Investment Advisory Fees—Note B | |
Basic Fee | 5,039 |
Performance Adjustment | (497) |
The Vanguard Group—Note C | |
Management and Administrative | 5,535 |
Marketing and Distribution | 783 |
Custodian Fees | 459 |
Auditing Fees | 19 |
Shareholders’ Reports | 47 |
Trustees’ Fees and Expenses | 4 |
Total Expenses | 11,389 |
Net Investment Income | 110,391 |
Realized Net Gain (Loss) | |
Investment Securities Sold2 | 574,292 |
Foreign Currencies | (901) |
Realized Net Gain (Loss) | 573,391 |
Change in Unrealized Appreciation (Depreciation) | |
Investment Securities | 449,388 |
Foreign Currencies | 22 |
Change in Unrealized Appreciation (Depreciation) | 449,410 |
Net Increase (Decrease) in Net Assets Resulting from Operations | 1,133,192 |
1 Dividends are net of foreign withholding taxes of $2,481,000.
2 Dividend income, interest income and realized net gain (loss) from affiliated companies of the fund were $42,315,000, $6,054,000, and $0, respectively.
16
Statement of Changes in Net Assets
| Year Ended January 31, |
| 2008 | 2007 |
| ($000) | ($000) |
Increase (Decrease) in Net Assets | | |
Operations | | |
Net Investment Income | 110,391 | 63,302 |
Realized Net Gain (Loss) | 573,391 | 373,021 |
Change in Unrealized Appreciation (Depreciation) | 449,410 | 81,090 |
Net Increase (Decrease) in Net Assets Resulting from Operations | 1,133,192 | 517,413 |
Distributions | | |
Net Investment Income | (83,075) | (54,699) |
Realized Capital Gain1 | (466,982) | (284,886) |
Total Distributions | (550,057) | (339,585) |
Capital Share Transactions—Note G | | |
Issued | 783,925 | 585,297 |
Issued in Lieu of Cash Distributions | 507,139 | 314,309 |
Redeemed2 | (682,805) | (930,593) |
Net Increase (Decrease) from Capital Share Transactions | 608,259 | (30,987) |
Total Increase (Decrease) | 1,191,394 | 146,841 |
Net Assets | | |
Beginning of Period | 3,443,534 | 3,296,693 |
End of Period3 | 4,634,928 | 3,443,534 |
1 Includes fiscal 2008 and 2007 short-term gain distributions totaling $41,392,000 and $127,033,000, respectively. Short-term gain distributions are treated as ordinary income dividends for tax purposes.
2 Net of redemption fees of $739,000 and $3,932,000.
3 Net Assets—End of Period includes overdistributed net investment income of ($7,025,000) and ($27,542,000).
17
Financial Highlights
For a Share Outstanding | Year Ended January 31, |
Throughout Each Period | 2008 | 2007 | 2006 | 2005 | 2004 |
Net Asset Value, Beginning of Period | $28.64 | $27.08 | $16.46 | $15.29 | $11.25 |
Investment Operations | | | | | |
Net Investment Income | .9001 | .560 | .3372 | .1852 | .194 |
Net Realized and Unrealized Gain (Loss) | | | | | |
on Investments3 | 8.362 | 4.027 | 11.080 | 1.988 | 4.780 |
Total from Investment Operations | 9.262 | 4.587 | 11.417 | 2.173 | 4.974 |
Distributions | | | | | |
Dividends from Net Investment Income | (.670) | (.490) | (.240) | (.144) | (.934) |
Distributions from Realized Capital Gains | (3.782) | (2.537) | (.557) | (.859) | — |
Total Distributions | (4.452) | (3.027) | (.797) | (1.003) | (.934) |
Net Asset Value, End of Period | $33.45 | $28.64 | $27.08 | $16.46 | $15.29 |
| | | | | |
Total Return4 | 33.97% | 17.48% | 70.19% | 14.20% | 44.07% |
| | | | | |
Ratios/Supplemental Data | | | | | |
Net Assets, End of Period (Millions) | $4,635 | $3,444 | $3,297 | $921 | $608 |
Ratio of Total Expenses to | | | | | |
Average Net Assets | 0.28%5 | 0.35%5 | 0.40% | 0.48% | 0.55% |
Ratio of Net Investment Income to | | | | | |
Average Net Assets | 2.70%1 | 1.88% | 1.68% | 1.32% | 1.61% |
Portfolio Turnover Rate | 29% | 24% | 20% | 36% | 15% |
1 Net investment income per share and the ratio of net investment income to average net assets include $0.190 and 0.65% respectively, resulting from a special dividend from Centennial Coal Co., Ltd. in January 2008.
2 Calculated based on average shares outstanding.
3 Includes increases from redemption fees of $.00, $.03, $.01, $.01, and $.00.
4 Total returns do not reflect the 1% fee assessed on redemptions of shares held for less than one year, or the account service fee that may be applicable to certain accounts with balances below $10,000.
5 Includes performance-based investment advisory fee increases (decreases) of (0.01%), and 0.01%.
See accompanying Notes, which are an integral part of the Financial Statements.
18
Notes to Financial Statements
Vanguard Precious Metals and Mining Fund is registered under the Investment Company Act of 1940 as an open-end investment company, or mutual fund. The fund files reports with the SEC under the company name Vanguard Specialized Funds. The fund invests in securities of foreign issuers, which may subject it to investment risks not normally associated with investing in securities of United States corporations.
A. The following significant accounting policies conform to generally accepted accounting principles for U.S. mutual funds. The fund consistently follows such policies in preparing its financial statements.
1. Security Valuation: Securities are valued as of the close of trading on the New York Stock Exchange (generally 4 p.m., Eastern time) on the valuation date. Equity securities are valued at the latest quoted sales prices or official closing prices taken from the primary market in which each security trades; such securities not traded on the valuation date are valued at the mean of the latest quoted bid and asked prices. Securities for which market quotations are not readily available, or whose values have been affected by events occurring before the fund’s pricing time but after the close of the securities’ primary markets, are valued at their fair values calculated according to procedures adopted by the board of trustees. These procedures include obtaining quotations from an independent pricing service, monitoring news to identify significant market- or security-specific events, and evaluating changes in the values of foreign market proxies (for example, ADRs, futures contracts, or exchange-traded funds), between the time the foreign markets close and the fund’s pricing time. When fair-value pricing is employed, the prices of securities used by a fund to calculate its net asset value may differ from quoted or published prices for the same securities. Precious metals are valued at the mean of the latest quoted bid and asked prices. Investments in Vanguard Market Liquidity Fund are valued at that fund’s net asset value.
2. Foreign Currency: Securities and other assets and liabilities denominated in foreign currencies are translated into U.S. dollars using exchange rates obtained from an independent third party as of the fund’s pricing time on the valuation date. Realized gains (losses) and unrealized appreciation (depreciation) on investment securities include the effects of changes in exchange rates since the securities were purchased, combined with the effects of changes in security prices. Fluctuations in the value of other assets and liabilities resulting from changes in exchange rates are recorded as unrealized foreign currency gains (losses) until the assets or liabilities are settled in cash, at which time they are recorded as realized foreign currency gains (losses).
3. Federal Income Taxes: The fund intends to continue to qualify as a regulated investment company and distribute all of its taxable income. Accordingly, no provision for federal income taxes is required in the financial statements.
4. Distributions: Distributions to shareholders are recorded on the ex-dividend date.
5. Security Lending: The fund may lend its securities to qualified institutional borrowers to earn additional income. Security loans are required to be secured at all times by collateral at least equal to the market value of securities loaned. The fund invests cash collateral received in Vanguard Market Liquidity Fund, and records a liability for the return of the collateral, during the period the securities are on loan. Security lending income represents the income earned on investing cash collateral, less expenses associated with the loan.
19
6. Other: Dividend income is recorded on the ex-dividend date. Interest income includes income distributions received from Vanguard Market Liquidity Fund and is accrued daily. Security transactions are accounted for on the date securities are bought or sold. Costs used to determine realized gains (losses) on the sale of investment securities are those of the specific securities sold. Fees assessed on redemptions of capital shares are credited to paid-in capital.
B. M&G Investment Management Ltd. provides investment advisory services to the fund for a fee calculated at an annual percentage rate of average net assets. The basic fee is subject to quarterly adjustments based on the fund’s performance since January 31, 2006, relative to the S&P/Citigroup Custom Precious Metals and Mining Index. For the year ended January 31, 2008, the investment advisory fee represented an effective annual basic rate of 0.12% of the fund’s average net assets before a decrease of $497,000 (0.01%) based on performance.
C. The Vanguard Group furnishes at cost corporate management, administrative, marketing, and distribution services. The costs of such services are allocated to the fund under methods approved by the board of trustees. The fund has committed to provide up to 0.40% of its net assets in capital contributions to Vanguard. At January 31, 2008, the fund had contributed capital of $387,000 to Vanguard (included in Other Assets), representing 0.01% of the fund’s net assets and 0.39% of Vanguard’s capitalization. The fund’s trustees and officers are also directors and officers of Vanguard.
D. Distributions are determined on a tax basis and may differ from net investment income and realized capital gains for financial reporting purposes. Differences may be permanent or temporary. Permanent differences are reclassified among capital accounts in the financial statements to reflect their tax character. Temporary differences arise when certain items of income, expense, gain, or loss are recognized in different periods for financial statement and tax purposes; these differences will reverse at some time in the future. Differences in classification may also result from the treatment of short-term gains as ordinary income for tax purposes.
During the year ended January 31, 2008, the fund realized net foreign currency losses of $901,000, which permanently decreased distributable net income for tax purposes; accordingly, such losses have been reclassified from accumulated net realized gains to overdistributed net investment income.
Certain of the fund’s investments are in securities considered to be “passive foreign investment companies,” for which any unrealized appreciation and/or realized gains are required to be included in distributable net income for tax purposes. During the year ended January 31, 2008, the fund did not realize any gains on the sale of passive foreign investment companies. Unrealized appreciation of $32,859,000 on the fund’s passive foreign investment company holdings through October 31, 2007, (the most recent previous mark-to-market date for tax purposes), has been distributed and is reflected in the balance of overdistributed net investment income. Since October 31, 2007, the fund’s passive foreign investment company holdings have depreciated in value by $2,985,000, reducing the amount of taxable income available for distribution as of January 31, 2008. Unrealized appreciation on the fund’s passive foreign investment company holdings at January 31, 2008, was $29,874,000.
The fund used a tax accounting practice to treat a portion of the price of capital shares redeemed during the year as distributions from net investment income and realized capital gains. Accordingly, the fund has reclassified $5,898,000 from overdistributed net investment income, and $29,319,000 from accumulated net realized gains, to paid-in capital.
20
During 2001, the fund elected to use a provision of the Taxpayer Relief Act of 1997 to mark to market certain appreciated securities held on January 1, 2001; such securities were treated as sold and repurchased, with unrealized gains of $46,006,000 becoming realized, for tax purposes. The mark-to-market created a difference between the cost of investments for financial statement and tax purposes, which will reverse when the securities are sold. Through January 31, 2008, the fund realized gains on the sale of these securities of $18,280,000 for financial statement purposes, which were included in prior year mark-to-market gains for tax purposes. The remaining difference of $27,726,000 is reflected in the balance of accumulated net realized gains; the corresponding difference between the securities’ cost for financial statement and tax purposes is reflected in unrealized appreciation.
For tax purposes, at January 31, 2008, the fund had $32,438,000 of ordinary income and $141,705,000 of long-term capital gains available for distribution.
At January 31, 2008, the cost of investment securities for tax purposes was $3,029,891,000. Net unrealized appreciation of investment securities for tax purposes was $1,699,820,000, consisting of unrealized gains of $1,861,848,000 on securities that had risen in value since their purchase and $162,028,000 in unrealized losses on securities that had fallen in value since their purchase or since being marked to market for tax purposes.
E. During the year ended January 31, 2008, the fund purchased $1,314,399,000 of investment securities and sold $1,163,934,000 of investment securities other than temporary cash investments.
F. The market value of securities on loan to broker-dealers at January 31, 2008, was $98,397,000, for which the fund received cash collateral of $104,506,000.
G. Capital shares issued and redeemed were:
| Year Ended January 31, |
| 2008 | 2007 |
| Shares | Shares |
| (000) | (000) |
Issued | 22,924 | 20,497 |
Issued in Lieu of Cash Distributions | 16,414 | 11,406 |
Redeemed | (21,016) | (33,402) |
Net Increase (Decrease) in Shares Outstanding | 18,322 | (1,499) |
21
H. Certain of the fund’s investments are in companies that are considered to be affiliated companies of the fund because the fund owns more than 5% of the outstanding voting securities of the company. Transactions during the period in securities of these companies were as follows:
| | Current Period Transactions | |
| Jan. 31, 2007 | | Proceeds from | | Jan. 31, 2008 |
| Market | Purchases | Securities | Dividend | Market |
| Value | at Cost | Sold | Income | Value |
| ($000) | ($000) | ($000) | ($000) | ($000) |
AMCOL International Corp. | n/a1 | 62,753 | — | 958 | 63,752 |
Centennial Coal Co., Ltd. | 34,777 | — | — | 27,555 | 49,955 |
Centerra Gold Inc. | 143,974 | 14,591 | — | — | 214,439 |
Claude Resources, Inc. | n/a1 | 3,404 | — | — | 6,746 |
Harry Winston Diamond Corp.2 | 217,068 | 60,360 | 6 | 4,198 | 178,714 |
Iluka Resources Ltd. | 83,373 | — | — | 3,193 | 70,228 |
Minerals Technologies, Inc. | 69,142 | 11,689 | 2,690 | 258 | 72,706 |
Peter Hambro Mining PLC | n/a1 | 65,381 | — | — | 123,928 |
Sims Group Ltd. | n/a1 | 29,320 | — | 6,153 | 182,990 |
St. Barbara Ltd. | n/a1 | 30,605 | — | — | 53,465 |
| 548,334 | | | 42,315 | 1,016,923 |
I. In June 2006, the Financial Accounting Standards Board issued Interpretation No. 48 (“FIN 48”), “Accounting for Uncertainty in Income Taxes.” FIN 48 establishes the minimum threshold for recognizing, and a system for measuring, the benefits of tax-return positions in financial statements, effective for the fund’s current fiscal year. Management has analyzed the fund’s tax positions taken on federal income tax returns for all open tax years (tax years ended January 31, 2005–2008) for purposes of implementing FIN 48, and has concluded that no provision for income tax is required in the fund’s financial statements.
1 At January 31, 2007, the issuer was not an affiliated company of the fund.
2 Aber Diamond Corp. underwent a name change to Harry Winston Diamond Corp. in November 2007.
22
Report of Independent Registered Public Accounting Firm
To the Trustees of Vanguard Specialized Funds and the Shareholders of Vanguard Precious Metals and Mining Fund:
In our opinion, the accompanying statements of net assets and of assets and liabilities and the related statements of operations and of changes in net assets and the financial highlights present fairly, in all material respects, the financial position of Vanguard Precious Metals and Mining Fund (constituting a separate portfolio of Vanguard Specialized Funds, hereafter referred to as the “Fund”) at January 31, 2008, the results of its operations for the year then ended, the changes in its net assets for each of the two years in the period then ended and the financial highlights for each of the five years in the period then ended, in conformity with accounting principles generally accepted in the United States of America. These financial statements and financial highlights (hereafter referred to as “financial statements”) are the responsibility of the Fund’s management; our responsibility is to express an opinion on these financial statements based on our audits. We conducted our audits of these financial statements in accordance with the standards of the Public Company Accounting Oversight Board (United States). Those standards require that we plan and perform the audit to obtain reasonable assurance about whether the financial statements are free of material misstatement. An audit includes examining, on a test basis, evidence supporting the amounts and disclosures in the financial statements, assessing the accounting principles used and significant estimates made by management, and evaluating the overall financial statement presentation. We believe that our audits, which included confirmation of securities at January 31, 2008 by correspondence with the custodian and by agreement to the underlying ownership records for Vanguard Market Liquidity Fund, provide a reasonable basis for our opinion.
PricewaterhouseCoopers LLP
Philadelphia, Pennsylvania
Special 2007 tax information (unaudited) for Vanguard Precious Metals and Mining Fund
This information for the fiscal year ended January 31, 2008, is included pursuant to provisions of the Internal Revenue Code.
The fund distributed $452,399,000 as capital gain dividends (from net long-term capital gains) to shareholders during the fiscal year.
The fund distributed $77,609,000 of qualified dividend income to shareholders during the fiscal year.
For corporate shareholders, 2.5% of investment income (dividend income plus short-term gains, if any) qualifies for the dividends-received deduction.
The Precious Metals and Mining Fund passed through to shareholders foreign source income of $109,723,000 and foreign taxes of $2,481,000. The pass-through of foreign taxes paid will affect only shareholders on the dividend record date in December 2006. Shareholders received more detailed information along with their Form 1099-DIV in January 2008.
23
Your Fund’s After-Tax Returns
This table presents returns for your fund both before and after taxes. The after-tax returns are shown in two ways: (1) assuming that an investor owned the fund during the entire period and paid taxes on the fund’s distributions, and (2) assuming that an investor paid taxes on the fund’s distributions and sold all shares at the end of each period.
Calculations are based on the highest individual federal income tax and capital gains tax rates in effect at the times of the distributions and the hypothetical sales. State and local taxes were not considered. After-tax returns reflect any qualified dividend income, using actual prior-year figures and estimates for 2008. (In the example, returns after the sale of fund shares may be higher than those assuming no sale. This occurs when the sale would have produced a capital loss. The calculation assumes that the investor received a tax deduction for the loss.)
Please note that your actual after-tax returns will depend on your tax situation and may differ from those shown. Also note that if you own the fund in a tax-deferred account, such as an individual retirement account or a 401(k) plan, this information does not apply to you. Such accounts are not subject to current taxes.
Finally, keep in mind that a fund’s performance—whether before or after taxes—does not guarantee future results.
Average Annual Total Returns: Precious Metals and Mining Fund1 |
Periods Ended January 31, 2008 | | | |
| One | Five | Ten |
| Year | Years | Years |
Returns Before Taxes | 33.97% | 34.53% | 22.53% |
Returns After Taxes on Distributions | 31.11 | 32.50 | 20.92 |
Returns After Taxes on Distributions and Sale of Fund Shares | 24.85 | 30.20 | 19.71 |
1 Total return figures do not reflect the 1% fee assessed on redemptions of shares held less than one year, nor do they include the account service fee that may be applicable to certain accounts with balances below $10,000.
24
About Your Fund’s Expenses
As a shareholder of the fund, you incur ongoing costs, which include costs for portfolio management, administrative services, and shareholder reports (like this one), among others. Operating expenses, which are deducted from a fund’s gross income, directly reduce the investment return of the fund.
A fund’s expenses are expressed as a percentage of its average net assets. This figure is known as the expense ratio. The following examples are intended to help you understand the ongoing costs (in dollars) of investing in your fund and to compare these costs with those of other mutual funds. The examples are based on an investment of $1,000 made at the beginning of the period shown and held for the entire period.
The table below illustrates your fund’s costs in two ways:
• Based on actual fund return. This section helps you to estimate the actual expenses that you paid over the period. The “Ending Account Value” shown is derived from the fund’s actual return, and the third column shows the dollar amount that would have been paid by an investor who started with $1,000 in the fund. You may use the information here, together with the amount you invested, to estimate the expenses that you paid over the period.
To do so, simply divide your account value by $1,000 (for example, an $8,600 account value divided by $1,000 = 8.6), then multiply the result by the number given for your fund under the heading “Expenses Paid During Period.”
• Based on hypothetical 5% yearly return. This section is intended to help you compare your fund’s costs with those of other mutual funds. It assumes that the fund had a yearly return of 5% before expenses, but that the expense ratio is unchanged. In this case—because the return used is not the fund’s actual return—the results do not apply to your investment. The example is useful in making comparisons because the Securities and Exchange Commission requires all mutual funds to calculate expenses based on a 5% return. You can assess your fund’s costs by comparing this hypothetical example with the hypothetical examples that appear in shareholder reports of other funds.
Six Months Ended January 31, 2008 | | | |
| Beginning | Ending | Expenses |
| Account Value | Account Value | Paid During |
Precious Metals and Mining Fund | 7/31/2007 | 1/31/2008 | Period1 |
Based on Actual Fund Return | $1,000.00 | $1,155.09 | $1.30 |
Based on Hypothetical 5% Return | 1,000.00 | 1,024.00 | 1.22 |
1 These calculations are based on expenses incurred in the most recent six-month period. The fund’s annualized six-month expense ratio for that period is 0.24%. The dollar amounts shown as “Expenses Paid” are equal to the annualized expense ratio multiplied by the average account value over the period, multiplied by the number of days in the most recent six-month period, then divided by the number of days in the most recent 12-month period.
25
Note that the expenses shown in the table are meant to highlight and help you compare ongoing costs only and do not reflect transaction costs incurred by the fund for buying and selling securities. Further, the expenses do not include the 1% fee on redemptions of shares held for less than one year, nor do they include the account service fee described in the prospectus. If such fees were applied to your account, your costs would be higher. Your fund does not carry a “sales load.”
The calculations assume no shares were bought or sold during the period. Your actual costs may have been higher or lower, depending on the amount of your investment and the timing of any purchases or redemptions.
You can find more information about the fund’s expenses, including annual expense ratios, in the Financial Statements section of this report. For additional information on operating expenses and other shareholder costs, please refer to your fund’s current prospectus.
26
Glossary
Beta. A measure of the magnitude of a fund’s past share-price fluctuations in relation to the ups and downs of a given market index. The index is assigned a beta of 1.00. Compared with a given index, a fund with a beta of 1.20 typically would have seen its share price rise or fall by 12% when the index rose or fell by 10%. For this report, beta is based on returns over the past 36 months for both the fund and the index. Note that a fund’s beta should be reviewed in conjunction with its R-squared (see definition below). The lower the R-squared, the less correlation there is between the fund and the index, and the less reliable beta is as an indicator of volatility.
Earnings Growth Rate. The average annual rate of growth in earnings over the past five years for the stocks now in a fund.
Equity Exposure. A measure that reflects a fund’s investments in stocks and stock futures. Any holdings in short-term reserves are excluded.
Expense Ratio. The percentage of a fund’s average net assets used to pay its annual administrative and advisory expenses. These expenses directly reduce returns to investors.
Foreign Holdings. The percentage of a fund represented by stocks or depositary receipts of companies based outside the United States.
Inception Date. The date on which the assets of a fund (or one of its share classes) are first invested in accordance with the fund’s investment objective. For funds with a subscription period, the inception date is the day after that period ends. Investment performance is measured from the inception date.
Median Market Cap. An indicator of the size of companies in which a fund invests; the midpoint of market capitalization (market price x shares outstanding) of a fund’s stocks, weighted by the proportion of the fund’s assets invested in each stock. Stocks representing half of the fund’s assets have market capitalizations above the median, and the rest are below it.
Price/Book Ratio. The share price of a stock divided by its net worth, or book value, per share. For a fund, the weighted average price/book ratio of the stocks it holds.
Price/Earnings Ratio. The ratio of a stock’s current price to its per-share earnings over the past year. For a fund, the weighted average P/E of the stocks it holds. P/E is an indicator of market expectations about corporate prospects; the higher the P/E, the greater the expectations for a company’s future growth.
R-Squared. A measure of how much of a fund’s past returns can be explained by the returns from the market in general, as measured by a given index. If a fund’s total returns were precisely synchronized with an index’s returns, its R-squared would be 1.00. If the fund’s returns bore no relationship to the index’s returns, its R-squared would be 0. For this report, R-squared is based on returns over the past 36 months for both the fund and the index.
Return on Equity. The annual average rate of return generated by a company during the past five years for each dollar of shareholder’s equity (net income divided by shareholder’s equity). For a fund, the weighted average return on equity for the companies whose stocks it holds.
Short-Term Reserves. The percentage of a fund invested in highly liquid, short-term securities that can be readily converted to cash.
Turnover Rate. An indication of the fund’s trading activity. Funds with high turnover rates incur higher transaction costs and may be more likely to distribute capital gains (which may be taxable to investors). The turnover rate excludes in-kind transactions, which have minimal impact on costs.
27
This page intentionally left blank.
The People Who Govern Your Fund
The trustees of your mutual fund are there to see that the fund is operated and managed in your best interests since, as a shareholder, you are a part owner of the fund. Your fund’s trustees also serve on the board of directors of The Vanguard Group, Inc., which is owned by the Vanguard funds and provides services to them on an at-cost basis.
A majority of Vanguard’s board members are independent, meaning that they have no affiliation with Vanguard or the funds they oversee, apart from the sizable personal investments they have made as private individuals.
Our independent board members bring distinguished backgrounds in business, academia, and public service to their task of working with Vanguard officers to establish the policies and oversee the activities of the funds. Among board members’ responsibilities are selecting investment advisors for the funds; monitoring fund operations, performance, and costs; reviewing contracts; nominating and selecting new trustees/directors; and electing Vanguard officers.
Each trustee serves a fund until its termination; or until the trustee’s retirement, resignation, or death; or otherwise as specified in the fund’s organizational documents. Any trustee may be removed at a shareholders’ meeting by a vote representing two-thirds of the net asset value of all shares of the fund together with shares of other Vanguard funds organized within the same trust. The table on these two pages shows information for each trustee and executive officer of the fund. The mailing address of the trustees and officers is P.O. Box 876, Valley Forge, PA 19482.
Chairman of the Board, Chief Executive Officer, and Trustee |
| |
John J. Brennan1 | |
Born 1954 | Principal Occupation(s) During the Past Five Years: Chairman of the Board, Chief Executive |
Trustee since May 1987; | Officer, and Director/Trustee of The Vanguard Group, Inc., and of each of the investment |
Chairman of the Board and | companies served by The Vanguard Group. |
Chief Executive Officer | |
152 Vanguard Funds Overseen | |
| |
Independent Trustees | |
| |
Charles D. Ellis | |
Born 1937 | Principal Occupation(s) During the Past Five Years: Applecore Partners (pro bono ventures |
Trustee since January 2001 | in education); Senior Advisor to Greenwich Associates (international business strategy |
152 Vanguard Funds Overseen | consulting); Successor Trustee of Yale University; Overseer of the Stern School of Business |
| at New York University; Trustee of the Whitehead Institute for Biomedical Research. |
| |
Emerson U. Fullwood | |
Born 1948 | Principal Occupation(s) During the Past Five Years: Executive Chief Staff and Marketing |
Trustee since January 2008 | Officer for North America since 2004 and Corporate Vice President of Xerox Corporation |
152 Vanguard Funds Overseen | (photocopiers and printers); Director of SPX Corporation (multi-industry manufacturing), |
| of the United Way of Rochester, and of the Boy Scouts of America. |
| |
Rajiv L. Gupta | |
Born 1945 | Principal Occupation(s) During the Past Five Years: Chairman, President, and |
Trustee since December 20012 | Chief Executive Officer of Rohm and Haas Co. (chemicals); Board Member of |
152 Vanguard Funds Overseen | the American Chemistry Council; Director of Tyco International, Ltd. (diversified |
| manufacturing and services) since 2005. |
Amy Gutmann | |
Born 1949 | Principal Occupation(s) During the Past Five Years: President of the University of |
Trustee since June 2006 | Pennsylvania since 2004; Professor in the School of Arts and Sciences, Annenberg School |
152 Vanguard Funds Overseen | for Communication, and Graduate School of Education of the University of Pennsylvania |
| since 2004; Provost (2001–2004) and Laurance S. Rockefeller Professor of Politics and |
| the University Center for Human Values (1990–2004), Princeton University; Director of |
| Carnegie Corporation of New York since 2005 and of Schuylkill River Development |
| Corporation and Greater Philadelphia Chamber of Commerce since 2004. |
| |
JoAnn Heffernan Heisen | |
Born 1950 | Principal Occupation(s) During the Past Five Years: Corporate Vice President and |
Trustee since July 1998 | Chief Global Diversity Officer since 2006, Vice President and Chief Information |
152 Vanguard Funds Overseen | Officer (1997–2005), and Member of the Executive Committee of Johnson & |
| Johnson (pharmaceuticals/consumer products); Director of the University Medical |
| Center at Princeton and Women’s Research and Education Institute. |
| |
André F. Perold | |
Born 1952 | Principal Occupation(s) During the Past Five Years: George Gund Professor of Finance |
Trustee since December 2004 | and Banking, Harvard Business School; Senior Associate Dean, Director of Faculty |
152 Vanguard Funds Overseen | Recruiting, and Chair of Finance Faculty, Harvard Business School; Director and Chairman |
| of UNX, Inc. (equities trading firm) since 2003; Chair of the Investment Committee of |
| HighVista Strategies LLC (private investment firm) since 2005. |
| |
Alfred M. Rankin, Jr. | |
Born 1941 | Principal Occupation(s) During the Past Five Years: Chairman, President, Chief Executive |
Trustee since January 1993 | Officer, and Director of NACCO Industries, Inc. (forklift trucks/housewares/lignite); Director |
152 Vanguard Funds Overseen | of Goodrich Corporation (industrial products/aircraft systems and services). |
| |
| |
J. Lawrence Wilson | |
Born 1936 | Principal Occupation(s) During the Past Five Years: Retired Chairman and Chief Executive |
Trustee since April 1985 | Officer of Rohm and Haas Co. (chemicals); Director of Cummins Inc. (diesel engines) and |
152 Vanguard Funds Overseen | AmerisourceBergen Corp. (pharmaceutical distribution); Trustee of Vanderbilt University |
| and of Culver Educational Foundation. |
| |
Executive Officers1 | |
| |
Thomas J. Higgins | |
Born 1957 | Principal Occupation(s) During the Past Five Years: Principal of The Vanguard Group, Inc.; |
Treasurer since July 1998 | Treasurer of each of the investment companies served by The Vanguard Group. |
152 Vanguard Funds Overseen | |
| |
| |
Heidi Stam | |
Born 1956 | Principal Occupation(s) During the Past Five Years: Managing Director of The Vanguard |
Secretary since July 2005 | Group, Inc., since 2006; General Counsel of The Vanguard Group since 2005; Secretary of |
152 Vanguard Funds Overseen | The Vanguard Group, and of each of the investment companies served by The Vanguard |
| Group, since 2005; Principal of The Vanguard Group (1997–2006). |
Vanguard Senior Management Team | | |
| | | |
R. Gregory Barton | Kathleen C. Gubanich | F. William McNabb III | Ralph K. Packard |
Mortimer J. Buckley | Paul A. Heller | Michael S. Miller | George U. Sauter |
Founder |
|
John C. Bogle |
Chairman and Chief Executive Officer, 1974–1996 |
1 Officers of the funds are “interested persons” as defined in the Investment Company Act of 1940.
2 December 2002 for Vanguard Equity Income Fund, Vanguard Growth Equity Fund, the Vanguard Municipal Bond Funds, and the Vanguard State Tax-Exempt Funds.
More information about the trustees is in the Statement of Additional Information, available from The Vanguard Group.
| 
|
| P.O. Box 2600 |
| Valley Forge, PA 19482-2600 |
Connect with Vanguard® > www.vanguard.com
Fund Information > 800-662-7447 | Vanguard, Connect with Vanguard, and the ship logo are |
| trademarks of The Vanguard Group, Inc. |
Direct Investor Account Services > 800-662-2739 | |
| |
Institutional Investor Services > 800-523-1036 | All other marks are the exclusive property of their |
| respective owners. |
Text Telephone for People | |
With Hearing Impairment > 800-952-3335 | |
| All comparative mutual fund data are from Lipper Inc. |
| or Morningstar, Inc., unless otherwise noted. |
| |
| |
| You can obtain a free copy of Vanguard’s proxy voting |
This material may be used in conjunction | guidelines by visiting our website, www.vanguard.com, |
with the offering of shares of any Vanguard | and searching for “proxy voting guidelines,” or by |
fund only if preceded or accompanied by | calling Vanguard at 800-662-2739. The guidelines are |
the fund’s current prospectus. | also available from the SEC’s website, www.sec.gov. |
| In addition, you may obtain a free report on how your |
| fund voted the proxies for securities it owned during |
| the 12 months ended June 30. To get the report, visit |
| either www.vanguard.com or www.sec.gov. |
| |
| |
| You can review and copy information about your fund |
| at the SEC’s Public Reference Room in Washington, D.C. |
| To find out more about this public service, call the SEC |
| at 202-551-8090. Information about your fund is also |
| available on the SEC’s website, and you can receive |
| copies of this information, for a fee, by sending a |
| request in either of two ways: via e-mail addressed to |
| publicinfo@sec.gov or via regular mail addressed to the |
| Public Reference Section, Securities and Exchange |
| Commission, Washington, DC 20549-0102. |
| |
| |
| |
| |
| |
| © 2008 The Vanguard Group, Inc. |
| All rights reserved. |
| Vanguard Marketing Corporation, Distributor. |
| |
| Q530 032008 |

> | For the fiscal year ended January 31, 2008, Investor Shares of Vanguard Health Care Fund returned –2.0%. |
> | The fund’s performance was slightly below the results of its benchmark and the average health/biotechnology fund. |
> | Domestic and international large-capitalization pharmaceutical companies were a significant drag on the fund’s performance over the past 12 months. |
Contents | |
| |
Your Fund’s Total Returns | 1 |
Chairman’s Letter | 2 |
Advisor’s Report | 7 |
Fund Profile | 9 |
Performance Summary | 12 |
Financial Statements | 14 |
Your Fund’s After-Tax Returns | 28 |
About Your Fund’s Expenses | 29 |
Glossary | 31 |
Please note: The opinions expressed in this report are just that—informed opinions. They should not be considered promises or advice. Also, please keep in mind that the information and opinions cover the period through the date on the cover of this report. Of course, the risks of investing in your fund are spelled out in the prospectus.
Your Fund’s Total Returns
Fiscal Year Ended January 31, 2008 | | |
| Ticker | Total |
| Symbol | Returns |
Vanguard Health Care Fund | | |
Investor Shares | VGHCX | –2.0% |
Admiral™ Shares1 | VGHAX | –1.9 |
S&P Health Sector Index | | –1.1 |
Average Health/Biotechnology Fund2 | | 0.1 |
Your Fund’s Performance at a Glance | | | | |
January 31, 2007–January 31, 2008 | | | | |
| | | Distributions Per Share |
| Starting | Ending | Income | Capital |
| Share Price | Share Price | Dividends | Gains |
Vanguard Health Care Fund | | | | |
Investor Shares | $149.69 | $133.80 | $2.747 | $10.592 |
Admiral Shares | 63.19 | 56.47 | 1.212 | 4.471 |
1 A lower-cost class of shares available to many longtime shareholders and to those with significant investments in the fund.
2 Derived from data provided by Lipper Inc.
1

Chairman’s Letter
Dear Shareholder,
For the fiscal year ended January 31, 2008, the Investor Shares of Vanguard Health Care Fund returned –2.0% as health care stocks retreated. (The lower-cost Admiral Shares returned –1.9%.) The fund’s large stake in pharmaceutical companies faced an especially tough time. Bright spots included the fund’s smaller positions in managed health care companies and some medical equipment providers. The fund’s performance slightly lagged that of the less diversified S&P Health Sector Index, which returned –1.1% for the year, as well as the average health/biotechnology fund, which returned 0.1%.
Please note that Vanguard Health Care Fund remains closed to most new investors. Existing clients can continue to invest in the fund, which is also open to new accounts by Flagship members.
Stocks gained in the first half but faltered in the second
The broad U.S. stock market returned –2.7% for the 12 months ended January 31, reflecting a volatile year punctuated by sharp declines for equities. Gains in the first half of the fiscal period were largely relinquished in midsummer and fall as repercussions from the subprime mortgage debacle began to be felt in the broader U.S. economy. The stock market’s retreat accelerated in January amid tightening global credit markets, a weakening U.S. dollar, and widening fears of a U.S. recession.
2
Large-capitalization stocks fared best in these unsettled conditions, outperforming small-caps for the year; meanwhile, growth stocks outpaced their value-oriented counterparts.
International stocks outperformed U.S. stocks for the sixth straight year, largely owing to exchange-rate gains produced by the weak U.S. dollar. Emerging markets and developed economies in Europe and Asia posted strong performances earlier in the fiscal year, but slumped after November as a result of increased concern about a U.S.-led downturn.
Bond returns grew stronger as Fed lowered rates
During the first half of the fiscal year, a stronger U.S. economy made investors more willing to take on risk to earn higher yields; spreads thus narrowed between the yields of U.S. Treasury securities and those of lower-quality issues. But as the subprime lending problems unraveled further in summer, investors flocked to higher-quality government and corporate bonds. This drove Treasury prices higher and yields lower, widening the spread between Treasury yields and those of riskier bonds.
The Federal Reserve Board responded to the credit market turmoil and deteriorating economic outlook with aggressive reductions in its target for the federal funds rate. The Fed cut the rate five times during the fiscal year (twice in January), ending the period at 3.0%, the lowest rate since May 2005.
Market Barometer | | | |
| | | Total Returns |
| Periods Ended January 31, 2008 |
| One Year | Three Years | Five Years |
Stocks | | | |
Russell 1000 Index (Large-caps) | –2.4% | 7.8% | 12.6% |
Russell 2000 Index (Small-caps) | –9.8 | 5.8 | 15.3 |
Dow Jones Wilshire 5000 Index (Entire market) | –2.7 | 7.9 | 13.2 |
MSCI All Country World Index ex USA (International) | 5.4 | 17.0 | 22.9 |
| | | |
Bonds | | | |
Lehman U.S. Aggregate Bond Index (Broad taxable market) | 8.8% | 4.9% | 4.8% |
Lehman Municipal Bond Index | 4.9 | 4.0 | 4.6 |
Citigroup 3-Month Treasury Bill Index | 4.6 | 4.2 | 3.0 |
| | | |
CPI | | | |
Consumer Price Index | 4.3% | 3.4% | 3.0% |
3
Lower interest rates depressed bond yields, but pushed prices higher. The broad taxable bond market returned 8.8% for the fiscal year. Tax-exempt municipal bonds returned 4.9%.
In a difficult year, pharmaceutical companies felt the pain
For fiscal-year 2008, Vanguard Health Care Fund’s modestly negative return was a bit ahead of the broad stock market, but was a disappointing outcome compared with the fund’s strong showing over the previous fiscal year. The fund’s listless performance for the 12 months ended January 31, 2008, reflected, in part, its sizable weighting in both domestic and foreign large-cap pharmaceutical stocks.
Pharmaceutical companies suffered when the U.S. Food and Drug Administration and international regulators imposed stricter guidelines for approving drugs. International pharmaceutical companies, such as Novartis, Eisai, and AstraZeneca, endured an exceptionally rough year, weathering delays on patent approvals and competition from generic drugmakers. Investors seemingly demonstrated increased wariness about pharmaceutical companies’ ability to confront what could be an even more challenging regulatory environment going forward.
Vanguard Health Care Fund is broadly diversified among subsectors of the health care industry, which alleviated some of this fiscal year’s weakness in
Expense Ratios1 | | | |
Your fund compared with its peer group | | | |
| | | Average |
| | | Health/ |
| Investor | Admiral | Biotechnology |
| Shares | Shares | Fund1 |
Health Care Fund | 0.26% | 0.18% | 1.54% |
1 Fund expense ratios reflect the 12 months ended January 31, 2008. Peer-group expense ratio is derived from data provided by Lipper Inc. and captures information through year-end 2007.
4
pharmaceuticals. Selective holdings in health care equipment companies, biotechnology companies, and managed care helped to offset the fund’s negative returns. In the health care equipment industry, for example, Becton, Dickinson generated a double-digit return, even as the fund’s subsector declined in value.
The fund’s long-term performance continues to impress
Over the past ten years, Vanguard Health Care Fund has returned an average of 13.2% annually, significantly outperforming its benchmark and peer group, whose returns have averaged 5.1% and 8.2%, respectively. Although the past fiscal year proved lackluster for the fund, this short-term performance has not dimmed the fund’s impressive long-term record. At the same time, the one-year results provide a perfect example of why Vanguard urges investors to focus on the long term rather than the short term.
The fund’s marked success over the past decade is a tribute to the stock-selection and portfolio management talents of the fund’s longtime advisor, Wellington Management Company, LLP. The combination of Wellington’s investment expertise and Vanguard’s low costs has produced excellent returns for long-term shareholders. For a comparison of your fund’s cost with the average cost of its competitors, see the table on page 4.
Total Returns | |
Ten Years Ended January 31, 2008 | |
| Average |
| Annual Return |
Health Care Fund Investor Shares | 13.2% |
S&P Health Sector Index | 5.1 |
Average Health/Biotechnology Fund1 | 8.2 |
The figures shown represent past performance, which is not a guarantee of future results. (Current performance may be lower or higher than the performance data cited. For performance data current to the most recent month-end, visit our website at www.vanguard.com/performance.) Note, too, that both investment returns and principal value can fluctuate widely, so an investor’s shares, when sold, could be worth more or less than their original cost.
1 Derived from data provided by Lipper Inc.
5
Diversification and long-term investing can reward shareholders
By investing for the long term and staying diversified within the health care industry, Vanguard Health Care Fund sets a good example for shareholders. We recommend that you follow suit, remaining focused on your long-term goals and ensuring that your portfolio is balanced among the primary asset classes. Shareholders should resist the urge to react to the market’s short-term ups and downs; rather, Vanguard recommends that a much more effective strategy can be to maintain a portfolio over the long haul that is balanced in line with your objectives, investing time horizon, and tolerance for risk.
A diversified portfolio that includes stocks, bonds, and short-term reserves can provide some protection against the market’s inevitable downturns through the fixed income allocation, while allowing you to participate in the stock market’s long-term potential for growth. As part of a well-balanced portfolio, Vanguard Health Care Fund can help shareholders meet their financial goals.
As I close this report to you, it’s my pleasure to introduce the fund’s new president, F. William McNabb III. Bill is a man of great character and integrity who is intimately familiar with all aspects of Vanguard—from how we serve our clients to how we invest for our clients.
Bill and I have worked together very closely for more than two decades. I’m thrilled that the fund’s board elected him president, effective March 1, and designated him as my successor as chief executive officer, a role he will assume within a year, after an orderly transition. Bill and the rest of our team will serve you and our other clients extremely well in the years ahead.
Thank you for investing with Vanguard.
Sincerely,

John J. Brennan
Chairman and Chief Executive Officer
February 22, 2008
6
Advisor’s Report
The Investor Shares of Vanguard Health Care Fund declined –2.0% for the 12 months ended January 31, 2008. (The Admiral Shares returned –1.9%.) This result compared with the Standard & Poor’s 500 Index’s result of –2.3%, the S&P 500 Health Care Index’s decrease of –1.1%, and the average health/biotechnology fund’s return of 0.1%.
The investment environment
Health care stocks as measured by the S&P 500 Health Care Index outperformed the overall U.S. stock market during the period. Within the Health Care Fund, medical products equities were strong, helping to buoy performance for the period. Pharmaceutical companies continued to have mixed-to-negative results, while many biotechnology names fared well. International holdings hindered the fund’s outcome; specifically, many Japanese pharmaceutical companies underperformed for the 12 months, following strong showings in 2006. Health services stocks also struggled during the period.
Our successes
Biotechnology holdings MedImmune, Gilead Sciences, and Genzyme boosted returns during the fiscal year. MedImmune was acquired by AstraZeneca during the period; Gilead benefited from the release of strong phase-III data for a few late-stage pipeline drugs; and Genzyme shares
Portfolio Changes | |
Year Ended January 31, 2008 | |
| |
Additions | Comments |
Walgreen | Replaced CVS. |
Forest Laboratories | Added on weakness and strong outlook. |
Merck & Co. | Added on weakness and strong outlook. |
| |
Deletions | Comments |
CVS Caremark | Eliminated after strong run. |
Gilead Sciences | Reduced into strength. |
MedImmune | Acquired by AstraZeneca. |
7
rose amid speculation that the company could be a takeover target after one of its competitors, Biogen Idec (another of the fund’s holdings), put itself up for sale. Our health services holdings in Humana also contributed positively to overall results.
Our shortfalls
Amgen and Schering-Plough shares were down during the period. Amgen shares declined due to the regulatory cloud surrounding use of erythropoietin, marketed by the company in the treatment of cancer-related anemia. Shares of Schering-Plough fell following news that a congressional committee would investigate the marketing of the firm’s cholesterol drug Vytorin.
The fund’s positioning
Health care stocks outperformed the broad U.S. stock market in 2007, and given continuing concerns about credit and the economy, we expect these defensive stocks will perform well in 2008. We remain cautious, because we believe that the conservative U.S. Food and Drug Administration will continue to limit drug approvals. However, we emphasize pharmaceutical companies whose products have durable patents and valuable late-stage development assets. We will continue to invest the Health Care Fund with a long-term focus, maintaining appropriate diversification and attention to valuation.
Edward P. Owens
Senior Vice President and Portfolio Manager
Wellington Management Company, LLP
February 12, 2008
8
Fund Profile
As of January 31, 2008
Portfolio Characteristics | | |
| | Comparative | Broad |
| Fund | Index1 | Index2 |
Number of Stocks | 79 | 51 | 4,830 |
Median Market Cap | $31.7B | $53.5B | $33.7B |
Price/Earnings Ratio | 25.5x | 19.2x | 17.0x |
Price/Book Ratio | 3.9x | 3.5x | 2.5x |
Yield | | 1.9% | 1.9% |
Investor Shares | 1.1% | | |
Admiral Shares | 1.2% | | |
Return on Equity | 17.9% | 22.0% | 19.2% |
Earnings Growth Rate | 10.5% | 11.9% | 20.1% |
Foreign Holdings | 26.6% | 0.0% | 0.0% |
Turnover Rate | 8.7% | — | — |
Expense Ratio | | — | — |
Investor Shares | 0.26% | | |
Admiral Shares | 0.18% | | |
Short-Term Reserves | 7.3% | — | — |
Volatility Measures3 | |
| Fund Versus | Fund Versus |
| Comparative Index1 | Broad Index2 |
R-Squared | 0.83 | 0.31 |
Beta | 0.77 | 0.48 |
Sector Diversification4 (% of equity exposure) | |
| |
Biotechnology | 9.5% |
Diversified Chemical | 1.2 |
Drug Retail | 1.7 |
Health Care Distributors | 6.7 |
Health Care Equipment | 9.2 |
Health Care Facilities | 0.9 |
Health Care Services | 2.2 |
Health Care Supplies | 0.5 |
Health Care Technology | 1.8 |
Household Products | 0.6 |
Industrial Machinery | 0.4 |
Life & Health Insurance | 0.1 |
Life Sciences Tools | 0.3 |
Managed Health Care | 8.2 |
Pharmaceuticals | 55.7 |
Specialty Chemicals | 1.0 |
9
Investment Focus
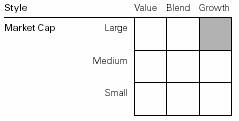
1 S&P Health Sector Index.
2 Dow Jones Wilshire 5000 Index.
3 For an explanation of R-squared, beta, and other terms used here, see the Glossary on page 28.
4 Sector percentages combine U.S. and international holdings.
10
Ten Largest Holdings1 (% of total net assets) |
| |
Eli Lilly & Co. | 4.9% |
Forest Laboratories, Inc. | 4.7 |
Roche Holdings AG | 4.3 |
Schering-Plough Corp. | 4.2 |
McKesson Corp. | 3.6 |
Sanofi-Aventis | 3.4 |
AstraZeneca Group PLC | 3.1 |
Abbott Laboratories | 3.0 |
Takeda Pharmaceutical Co. Ltd. | 2.6 |
Astellas Pharma Inc. | 2.5 |
Top Ten | 36.3% |
Market Diversification (% of equity exposure) |
| |
United States | 71.2% |
Japan | 11.1 |
Switzerland | 7.2 |
France | 4.0 |
United Kingdom | 3.7 |
Germany | 1.4 |
Belgium | 0.7 |
Denmark | 0.4 |
Ireland | 0.2 |
Canada | 0.1 |
1 “Ten Largest Holdings” excludes any temporary cash investments and equity index products.
11
Performance Summary
All of the returns in this report represent past performance, which is not a guarantee of future results that may be achieved by the fund. (Current performance may be lower or higher than the performance data cited. For performance data current to the most recent month-end, visit our website at www.vanguard.com/performance.) Note, too, that both investment returns and principal value can fluctuate widely, so an investor’s shares, when sold, could be worth more or less than their original cost. The returns shown do not reflect taxes that a shareholder would pay on fund distributions or on the sale of fund shares.
Cumulative Performance: January 31, 1998–January 31, 2008
Initial Investment of $25,000
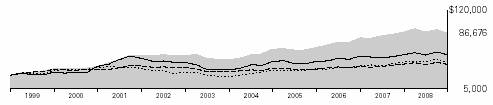
| | Average Annual Total Returns | Final Value |
| Periods Ended January 31, 2008 | of a $25,000 |
| One Year | Five Years | Ten Years | Investment |
Health Care Fund Investor Shares1 | –1.97% | 12.75% | 13.24% | $86,676 |
Dow Jones Wilshire 5000 Index | –2.70 | 13.21 | 5.61 | 43,166 |
S&P Health Sector Index | –1.07 | 6.52 | 5.05 | 40,923 |
Average Health/Biotechnology Fund2 | 0.10 | 11.03 | 8.24 | 55,174 |
| | | | Final Value |
| | | Since | of a $100,000 |
| One Year | Five Years | Inception3 | Investment |
Health Care Fund Admiral Shares1 | –1.90% | 12.85% | 8.26% | $163,778 |
Dow Jones Wilshire 5000 Index | –2.70 | 13.21 | 6.69 | 149,626 |
S&P Health Sector Index | –1.07 | 6.52 | 1.69 | 110,962 |
1 Total return figures do not reflect the 1% fee assessed on redemptions of shares held for less than one year, nor for the Investor Shares do they include the account service fee that may be applicable to certain accounts with balances below $10,000.
2 Derived from data provided by Lipper Inc.
3 Performance for the fund’s Admiral Shares and comparative standards is calculated since the Admiral Shares’ inception on November 12, 2001.
12
Fiscal Year Total Returns (%): January 31, 1998–January 31, 2008
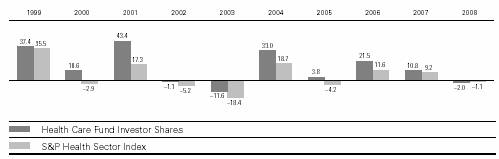
Average Annual Total Returns: Periods Ended December 31, 2007
This table presents average annual total returns through the latest calendar quarter—rather than through the end of the fiscal period. Securities and Exchange Commission rules require that we provide this information.
| Inception Date | One Year | Five Years | Ten Years |
Investor Shares1 | 5/23/1984 | 4.42% | 13.12% | 13.98% |
Admiral Shares1 | 11/12/2001 | 4.50 | 13.21 | 9.002 |
1 Total return figures do not reflect the 1% fee assessed on redemptions of shares held for less than one year, nor for the Investor Shares do they include the account service fee that may be applicable to certain accounts with balances below $10,000.
2 Return since inception.
Note: See Financial Highlights tables on pages 18 and 19 for dividend and capital gains information.
13
Financial Statements
Statement of Net Assets
As of January 31, 2008
The fund provides a complete list of its holdings four times in each fiscal year, at the quarter-ends. For the second and fourth fiscal quarters, the lists appear in the fund’s semiannual and annual reports to shareholders. For the first and third fiscal quarters, the fund files the lists with the Securities and Exchange Commission on Form N-Q. Shareholders can look up the fund’s Forms N-Q on the SEC’s website at www.sec.gov. Forms N-Q may also be reviewed and copied at the SEC’s Public Reference Room (see the back cover of this report for further information).
| | | Market |
| | | Value• |
| | Shares | ($000) |
Common Stocks (92.8%) | | |
United States (66.2%) | | |
Biotechnology (8.8%) | | |
* | Genzyme Corp. | 6,419,340 | 501,543 |
* | Amgen, Inc. | 9,589,355 | 446,768 |
* | Genentech, Inc. | 5,450,000 | 382,535 |
* | Gilead Sciences, Inc. | 4,799,696 | 219,298 |
* | Millennium | | |
| Pharmaceuticals, Inc. | 10,941,300 | 165,980 |
*1 | OSI Pharmaceuticals, Inc. | 3,480,000 | 138,782 |
* | Cephalon, Inc. | 1,602,000 | 105,139 |
* | Biogen Idec Inc. | 1,407,300 | 85,775 |
*^ | Amylin | | |
| Pharmaceuticals, Inc. | 2,057,200 | 60,996 |
* | Vertex | | |
| Pharmaceuticals, Inc. | 2,909,400 | 59,235 |
* | PDL BioPharma Inc. | 830,500 | 12,399 |
* | Human | | |
| Genome Sciences, Inc. | 938,500 | 5,237 |
| | | 2,183,687 |
Chemicals (0.9%) | | |
| Sigma-Aldrich Corp. | 4,600,000 | 228,436 |
| | | |
Food & Staples Retailing (1.6%) | | |
| Walgreen Co. | 11,450,000 | 402,010 |
| | | |
Health Care Equipment & Supplies (8.8%) | | |
| Medtronic, Inc. | 12,814,900 | 596,790 |
| Becton, Dickinson & Co. | 6,000,000 | 519,180 |
* | St. Jude Medical, Inc. | 9,250,900 | 374,754 |
| Baxter International, Inc. | 5,100,000 | 309,774 |
| Beckman Coulter, Inc. | 2,776,600 | 184,644 |
| DENTSPLY | | |
| International Inc. | 2,585,400 | 106,803 |
* | Hospira, Inc. | 1,895,070 | 77,906 |
| STERIS Corp. | 850,000 | 21,063 |
| | | 2,190,914 |
Health Care Providers & Services (16.5%) | | |
| McKesson Corp. | 14,100,000 | 885,339 |
* | Humana Inc. | 7,033,000 | 564,750 |
14
| | | Market |
| | | Value• |
| | Shares | ($000) |
| Cardinal Health, Inc. | 9,736,708 | 564,437 |
* | WellPoint Inc. | 4,402,400 | 344,268 |
| UnitedHealth Group Inc. | 6,400,000 | 325,376 |
| CIGNA Corp. | 5,500,000 | 270,380 |
| Quest Diagnostics, Inc. | 5,335,400 | 263,142 |
* | Coventry Health Care Inc. | 4,050,000 | 229,149 |
* | Laboratory Corp. of | | |
| America Holdings | 2,767,360 | 204,452 |
* | Health Net Inc. | 3,200,000 | 148,768 |
| Universal Health | | |
| Services Class B | 2,460,400 | 115,959 |
1 | Owens & Minor, Inc. | | |
| Holding Co. | 2,100,000 | 86,772 |
1 | Health Management | | |
| Associates Class A | 15,756,900 | 84,930 |
| | | 4,087,722 |
Heath Care Technology (1.7%) | | |
*1 | Cerner Corp. | 4,000,000 | 209,600 |
| IMS Health, Inc. | 8,547,400 | 204,197 |
| | | 413,797 |
Household Products (0.6%) | | |
| Colgate-Palmolive Co. | 1,400,000 | 107,800 |
| Kimberly-Clark Corp. | 576,300 | 37,834 |
| | | 145,634 |
Insurance (0.1%) | | |
| Unum Group | 1,056,300 | 23,894 |
| | | |
Life Science Tools & Services (0.3%) | | |
* | PAREXEL | | |
| International Corp. | 1,370,200 | 74,552 |
| | | |
Machinery (0.4%) | | |
| Pall Corp. | 2,404,600 | 88,706 |
| | | |
Pharmaceuticals (26.5%) | | |
| Eli Lilly & Co. | 23,629,900 | 1,217,412 |
*1 | Forest Laboratories, Inc. | 29,266,300 | 1,163,921 |
| Schering-Plough Corp. | 53,508,700 | 1,047,165 |
| Abbott Laboratories | 13,449,100 | 757,184 |
| Merck & Co., Inc. | 11,391,200 | 527,185 |
| Wyeth | 9,629,800 | 383,266 |
15
| | | Market |
| | | Value• |
| | Shares | ($000) |
| Bristol-Myers Squibb Co. | 15,100,000 | 350,169 |
| Pfizer Inc. | 13,911,570 | 325,392 |
| Allergan, Inc. | 4,100,000 | 275,479 |
| Johnson & Johnson | 2,500,000 | 158,150 |
1 | Perrigo Co. | 4,900,000 | 151,116 |
* | Sepracor Inc. | 4,175,400 | 117,913 |
* | Watson | | |
| Pharmaceuticals, Inc. | 2,200,000 | 57,442 |
* | Barr Pharmaceuticals Inc. | 900,000 | 46,971 |
| | | 6,578,765 |
Total United States | | 16,418,117 |
International (26.6%) | | |
Belgium (0.6%) | | |
| UCB SA | 3,123,593 | 151,970 |
| | | |
Canada (0.1%) | | |
* | Axcan Pharma Inc. | 704,900 | 16,007 |
| | | |
Denmark (0.3%) | | |
| Novo Nordisk A/S B Shares | 1,400,000 | 88,327 |
| | | |
France (3.7%) | | |
| Sanofi-Aventis | 10,407,991 | 848,752 |
| Ipsen Promesses | 1,300,000 | 72,448 |
| | | 921,200 |
Germany (1.3%) | | |
| Bayer AG | 3,494,656 | 286,734 |
| Fresenius Medical Care AG | 661,950 | 34,057 |
| | | 320,791 |
Ireland (0.2%) | | |
* | Elan Corp. PLC ADR | 1,820,000 | 46,246 |
| | | |
Japan (10.3%) | | |
| Takeda | | |
| Pharmaceutical Co. Ltd. | 10,500,000 | 641,168 |
| Astellas Pharma Inc. | 14,565,700 | 631,818 |
| Eisai Co., Ltd. | 9,853,700 | 407,822 |
| Daiichi Sankyo Co., Ltd. | 13,504,300 | 405,317 |
| Shionogi & Co., Ltd. | 9,876,000 | 185,491 |
| Chugai | | |
| Pharmaceutical Co., Ltd. | 8,834,500 | 117,003 |
| Tanabe Seiyaku Co., Ltd. | 6,850,000 | 83,163 |
| Ono | | |
| Pharmaceutical Co., Ltd. | 1,113,000 | 54,901 |
| Olympus Corp. | 500,000 | 16,866 |
| Terumo Corp. | 300,000 | 16,402 |
| | | 2,559,951 |
Switzerland (6.7%) | | |
| Roche Holdings AG | 5,823,977 | 1,057,467 |
| Novartis AG (Registered) | 12,019,880 | 608,967 |
| | | 1,666,434 |
United Kingdom (3.4%) | | |
| AstraZeneca Group PLC | 14,781,500 | 620,775 |
16
| | Market |
| | Value• |
| Shares | ($000) |
AstraZeneca Group | | |
PLC ADR | 3,496,672 | 146,336 |
GlaxoSmithKline PLC ADR | 1,642,381 | 77,816 |
| | 844,927 |
Total International | | 6,615,853 |
Total Common Stocks | | |
(Cost $15,045,731) | | 23,033,970 |
Temporary Cash Investments (7.3%) | | |
Money Market Fund (0.0%) | | |
2 Vanguard Market | | |
Liquidity Fund, | | |
4.060%—Note F | 8,604,000 | 8,604 |
| | |
| | |
| Face | |
| Amount | |
| ($000) | |
Commercial Paper (1.6%) | | |
General Electric Capital Corp. | | |
4.464%, 2/20/08 | 200,000 | 199,659 |
General Electric Capital Corp. | | |
3.022%, 4/24/08 | 200,000 | 198,577 |
| | 398,236 |
Repurchase Agreements (5.7%) | | |
Banc of America | | |
3.000%, 2/1/08 (Dated | | |
1/31/08, Repurchase Value | | |
$630,853,000 collateralized | | |
by Federal Home Loan | | |
Mortgage Corp. | | |
5.500%, 2/1/38 and Federal | | |
National Mortgage Assn. | | |
5.000%, 6/1/35) | 630,800 | 630,800 |
Deutsche Bank | | |
3.000%, 2/1/08 (Dated | | |
1/31/08, Repurchase Value | | |
$788,566,000 collateralized | | |
by Federal Home Loan | | |
Mortgage Corp. 5.000%– | | |
7.000%, 11/1/27–2/1/38 | | |
and Government National | | |
Mortgage Assn. | | |
7.000%,12/15/37) | 788,500 | 788,500 |
| | 1,419,300 |
Total Temporary Cash Investments | | |
(Cost $1,826,053) | | 1,826,140 |
Total Investments (100.1%) | | |
(Cost $16,871,784) | | 24,860,110 |
Other Assets and Liabilities—Net (–0.1%) | | (33,057) |
Net Assets (100%) | | 24,827,053 |
17
| Market |
| Value• |
| ($000) |
Statement of Assets and Liabilities | |
Assets | |
Investments in Securites, at Value | 24,860,110 |
Accrued Income Receivable | 38,073 |
Receivables for Investment | |
Securities Sold | 28,704 |
Other Assets—Note C | 21,974 |
Total Assets | 24,948,861 |
Liabilities | |
Security Lending Collateral | |
Payable to Brokers—Note F | 8,604 |
Payables for Investment | |
Securities Purchased | 16,769 |
Payables for Capital Shares Redeemed | 15,116 |
Other Liabilites | 81,319 |
Total Liabilties | 121,808 |
Net Assets | 24,827,053 |
At January 31, 2008, net assets consisted of:3 |
| Amount |
| ($000) |
Paid-in Capital | 16,626,598 |
Overdistributed Net Investment Income | (35,789) |
Accumulated Net Realized Gains | 246,948 |
Unrealized Appreciation | |
Investment Securities | 7,988,326 |
Foreign Currencies | 970 |
Net Assets | 24,827,053 |
| |
Investor Shares—Net Assets | |
Applicable to 106,979,100 outstanding | |
$.001 par value shares of beneficial | |
interest (unlimited authorization) | 14,313,951 |
Net Asset Value Per Share— | |
Investor Shares | $133.80 |
| |
Admiral Shares—Net Assets | |
Applicable to 186,155,043 outstanding | |
$.001 par value shares of beneficial | |
interest (unlimited authorization) | 10,513,102 |
Net Asset Value Per Share— | |
Admiral Shares | $56.47 |
• | See Note A in Notes to Financial Statements. |
* | Non-income-producing security. |
^ | Part of security position is on loan to broker-dealers. See Note F in Notes to Financial Statements. |
1 Considered an affiliated company of the fund as the fund owns more than 5% of the outstanding voting securities of such company. See Note H in Notes to Financial Statements.
2 Affiliated money market fund available only to Vanguard funds and certain trusts and accounts managed by Vanguard. Rate shown is the 7-day yield.
3 See Note D in Notes to Financial Statements for the tax-basis components of net assets.
ADR—American Depositary Receipt.
18
Statement of Operations
| Year Ended |
| January 31, 2008 |
| ($000) |
Investment Income | |
Income | |
Dividends1,2 | 434,823 |
Interest | 117,461 |
Security Lending | 4,408 |
Total Income | 556,692 |
Expenses | |
Investment Advisory Fees—Note B | 23,264 |
The Vanguard Group—Note C | |
Management and Administrative | |
Investor Shares | 24,640 |
Admiral Shares | 8,886 |
Marketing and Distribution | |
Investor Shares | 2,378 |
Admiral Shares | 1,535 |
Custodian Fees | 1,640 |
Auditing Fees | 25 |
Shareholders’ Reports | |
Investor Shares | 274 |
Admiral Shares | 35 |
Trustees’ Fees and Expenses | 31 |
Total Expenses | 62,708 |
Net Investment Income | 493,984 |
Realized Net Gain (Loss) | |
Investment Securities Sold2 | 1,822,549 |
Foreign Currencies | (274) |
Realized Net Gain (Loss) | 1,822,275 |
Change in Unrealized Appreciation (Depreciation) | |
Investment Securities | (2,756,134) |
Foreign Currencies | 959 |
Change in Unrealized Appreciation (Depreciation) | (2,755,175) |
Net Increase (Decrease) in Net Assets Resulting from Operations | (438,916) |
1 Dividends are net of foreign withholding taxes of $14,134,000.
2 Dividend income and realized net gain (loss) from affiliated companies of the fund were $114,531,000 and $121,740,000, respectively.
19
Statement of Changes in Net Assets
| Year Ended January 31, |
| 2008 | 2007 |
| ($000) | ($000) |
Increase (Decrease) in Net Assets | | |
Operations | | |
Net Investment Income | 493,984 | 359,863 |
Realized Net Gain (Loss) | 1,822,275 | 1,022,866 |
Change in Unrealized Appreciation (Depreciation) | (2,755,175) | 1,359,517 |
Net Increase (Decrease) in Net Assets Resulting from Operations | (438,916) | 2,742,246 |
Distributions | | |
Net Investment Income | | |
Investor Shares | (277,864) | (231,097) |
Admiral Shares | (212,406) | (155,419) |
Realized Capital Gain1 | | |
Investor Shares | (1,084,200) | (747,621) |
Admiral Shares | (782,841) | (459,182) |
Total Distributions | (2,357,311) | (1,593,319) |
Capital Share Transactions—Note G | | |
Investor Shares | (757,827) | (1,240,502) |
Admiral Shares | 900,247 | 1,251,373 |
Net Increase (Decrease) from Capital Share Transactions | 142,420 | 10,871 |
Total Increase (Decrease) | (2,653,807) | 1,159,798 |
Net Assets | | |
Beginning of Period | 27,480,860 | 26,321,062 |
End of Period2 | 24,827,053 | 27,480,860 |
1 Includes fiscal 2008 and 2007 short-term gain distributions totaling $40,898,000 and $27,064,000, respectively. Short-term gain distributions are treated as ordinary income dividends for tax purposes.
2 Net Assets—End of Period includes undistributed (overdistributed) net investment income of ($35,789,000) and ($12,818,000).
20
Financial Highlights
Investor Shares | | | | | |
| | | | | |
For a Share Outstanding | Year Ended January 31, |
Throughout Each Period | 2008 | 2007 | 2006 | 2005 | 2004 |
Net Asset Value, Beginning of Period | $149.69 | $143.39 | $123.84 | $124.29 | $94.35 |
Investment Operations | | | | | |
Net Investment Income | 2.7661 | 1.953 | 1.753 | 1.272 | .960 |
Net Realized and Unrealized Gain (Loss) | | | | | |
on Investments | (5.317) | 13.107 | 24.424 | 3.385 | 30.078 |
Total from Investment Operations | (2.551) | 15.060 | 26.177 | 4.657 | 31.038 |
Distributions | | | | | |
Dividends from Net Investment Income | (2.747) | (2.100) | (1.542) | (1.112) | (.995) |
Distributions from Realized Capital Gains | (10.592) | (6.660) | (5.085) | (3.995) | (.103) |
Total Distributions | (13.339) | (8.760) | (6.627) | (5.107) | (1.098) |
Net Asset Value, End of Period | $133.80 | $149.69 | $143.39 | $123.84 | $124.29 |
| | | | | |
Total Return2 | –1.97% | 10.85% | 21.49% | 3.76% | 32.99% |
| | | | | |
Ratios/Supplemental Data | | | | | |
Net Assets, End of Period (Millions) | $14,314 | $16,662 | $17,198 | $19,087 | $18,340 |
Ratio of Total Expenses to | | | | | |
Average Net Assets | 0.26% | 0.25% | 0.25% | 0.22% | 0.28% |
Ratio of Net Investment Income to | | | | | |
Average Net Assets | 1.78%1 | 1.33% | 1.29% | 1.02% | 0.91% |
Portfolio Turnover Rate | 9% | 8% | 14% | 13% | 13% |
1 Net investment income per share and the ratio of net investment income to average net assets include $0.585 and 0.40%, respectively, resulting from a special dividend from Health Management Associates Class A in March 2007.
2 Total returns do not reflect the 1% fee assessed on redemptions after March 23, 2005, of shares held for less than one year, or the 1% fee assessed until March 23, 2005, on shares purchased on or after April 19, 1999, and held for less than five years. Total returns do not include the account service fee that may be applicable to certain accounts with balances below $10,000.
21
Admiral Shares | | | | | |
| | | | | |
For a Share Outstanding | Year Ended January 31, |
Throughout Each Period | 2008 | 2007 | 2006 | 2005 | 2004 |
Net Asset Value, Beginning of Period | $63.19 | $60.52 | $52.25 | $52.44 | $39.80 |
Investment Operations | | | | | |
Net Investment Income | 1.2201 | .877 | .779 | .576 | .447 |
Net Realized and Unrealized Gain (Loss) | | | | | |
on Investments | (2.257) | 5.542 | 10.328 | 1.431 | 12.696 |
Total from Investment Operations | (1.037) | 6.419 | 11.107 | 2.007 | 13.143 |
Distributions | | | | | |
Dividends from Net Investment Income | (1.212) | (.938) | (.690) | (.511) | (.460) |
Distributions from Realized Capital Gains | (4.471) | (2.811) | (2.147) | (1.686) | (.043) |
Total Distributions | (5.683) | (3.749) | (2.837) | (2.197) | (.503) |
Net Asset Value, End of Period | $56.47 | $63.19 | $60.52 | $52.25 | $52.44 |
| | | | | |
Total Return2 | –1.90% | 10.96% | 21.62% | 3.84% | 33.12% |
| | | | | |
Ratios/Supplemental Data | | | | | |
Net Assets, End of Period (Millions) | $10,513 | $10,819 | $9,123 | $2,819 | $2,492 |
Ratio of Total Expenses to | | | | | |
Average Net Assets | 0.18% | 0.17% | 0.14% | 0.15% | 0.19% |
Ratio of Net Investment Income to | | | | | |
Average Net Assets | 1.86%1 | 1.41% | 1.40% | 1.10% | 0.98% |
Portfolio Turnover Rate | 9% | 8% | 14% | 13% | 13% |
1 Net investment income per share and the ratio of net investment income to average net assets include $0.247 and 0.40%, respectively, resulting from a special dividend from Health Management Associates Class A in March 2007.
2 Total returns do not reflect the 1% fee assessed on redemptions after March 23, 2005, of shares held for less than one year, or the 1% fee previously assessed on shares held for less than five years.
See accompanying Notes, which are an integral part of the Financial Statements.
22
Notes to Financial Statements
Vanguard Health Care Fund is registered under the Investment Company Act of 1940 as an open-end investment company, or mutual fund. The fund files reports with the SEC under the company name Vanguard Specialized Funds. The fund may invest in securities of foreign issuers, which may subject it to investment risks not normally associated with investing in securities of United States corporations. The fund offers two classes of shares, Investor Shares and Admiral Shares. Investor Shares are available to any investor who meets the fund’s minimum purchase requirements. Admiral Shares are designed for investors who meet certain administrative, service, tenure, and account-size criteria.
A. The following significant accounting policies conform to generally accepted accounting principles for U.S. mutual funds. The fund consistently follows such policies in preparing its financial statements.
1. Security Valuation: Securities are valued as of the close of trading on the New York Stock Exchange (generally 4 p.m., Eastern time) on the valuation date. Equity securities are valued at the latest quoted sales prices or official closing prices taken from the primary market in which each security trades; such securities not traded on the valuation date are valued at the mean of the latest quoted bid and asked prices. Securities for which market quotations are not readily available, or whose values have been affected by events occurring before the fund’s pricing time but after the close of the securities’ primary markets, are valued at their fair values calculated according to procedures adopted by the board of trustees. These procedures include obtaining quotations from an independent pricing service, monitoring news to identify significant market- or security-specific events, and evaluating changes in the values of foreign market proxies (for example, ADRs, futures contracts, or exchange-traded funds), between the time the foreign markets close and the fund’s pricing time. When fair-value pricing is employed, the prices of securities used by a fund to calculate its net asset value may differ from quoted or published prices for the same securities. Investments in Vanguard Market Liquidity Fund are valued at that fund’s net asset value. Temporary cash investments acquired over 60 days to maturity are valued using the latest bid prices or using valuations based on a matrix system (which considers such factors as security prices, yields, maturities, and ratings), both as furnished by independent pricing services. Other temporary cash investments are valued at amortized cost, which approximates market value.
2. Foreign Currency: Securities and other assets and liabilities denominated in foreign currencies are translated into U.S. dollars using exchange rates obtained from an independent third party as of the fund’s pricing time on the valuation date. Realized gains (losses) and unrealized appreciation (depreciation) on investment securities include the effects of changes in exchange rates since the securities were purchased, combined with the effects of changes in security prices. Fluctuations in the value of other assets and liabilities resulting from changes in exchange rates are recorded as unrealized foreign currency gains (losses) until the assets or liabilities are settled in cash, at which time they are recorded as realized foreign currency gains (losses).
3. Repurchase Agreements: The fund may invest in repurchase agreements. Securities pledged as collateral for repurchase agreements are held by a custodian bank until the agreements mature. Each agreement requires that the market value of the collateral be sufficient to cover payments of interest and principal; however, in the event of default or bankruptcy by the other party to the agreement, retention of the collateral may be subject to legal proceedings.
4. Federal Income Taxes: The fund intends to continue to qualify as a regulated investment company and distribute all of its taxable income. Accordingly, no provision for federal income taxes is required in the financial statements.
23
5. Distributions: Distributions to shareholders are recorded on the ex-dividend date.
6. Security Lending: The fund may lend its securities to qualified institutional borrowers to earn additional income. Security loans are required to be secured at all times by collateral at least equal to the market value of securities loaned. The fund invests cash collateral received in Vanguard Market Liquidity Fund, and records a liability for the return of the collateral, during the period the securities are on loan. Security lending income represents the income earned on investing cash collateral, less expenses associated with the loan.
7. Other: Dividend income is recorded on the ex-dividend date. Interest income is accrued daily. Premiums and discounts on debt securities purchased are amortized and accreted, respectively, to interest income over the lives of the respective securities. Security transactions are accounted for on the date securities are bought or sold. Costs used to determine realized gains (losses) on the sale of investment securities are those of the specific securities sold. Fees assessed on redemptions of capital shares are credited to paid-in capital.
Each class of shares has equal rights as to assets and earnings, except that each class separately bears certain class-specific expenses related to maintenance of shareholder accounts (included in Management and Administrative expenses) and shareholder reporting. Marketing and distribution expenses are allocated to each class of shares based on a method approved by the board of trustees. Income, other non-class-specific expenses, and gains and losses on investments are allocated to each class of shares based on its relative net assets.
B. Wellington Management Company, LLP, provides investment advisory services to the fund for a fee calculated at an annual percentage rate of average net assets. For the year ended January 31, 2008, the investment advisory fee represented an effective annual rate of 0.09% of the fund’s average net assets.
C. The Vanguard Group furnishes at cost corporate management, administrative, marketing, and distribution services. The costs of such services are allocated to the fund under methods approved by the board of trustees. The fund has committed to provide up to 0.40% of its net assets in capital contributions to Vanguard. At January 31, 2008, the fund had contributed capital of $2,175,000 to Vanguard (included in Other Assets), representing 0.01% of the fund’s net assets and 2.17% of Vanguard’s capitalization. The fund’s trustees and officers are also directors and officers of Vanguard.
D. Distributions are determined on a tax basis and may differ from net investment income and realized capital gains for financial reporting purposes. Differences may be permanent or temporary. Permanent differences are reclassified among capital accounts in the financial statements to reflect their tax character. Temporary differences arise when certain items of income, expense, gain, or loss are recognized in different periods for financial statement and tax purposes; these differences will reverse at some time in the future. Differences in classification may also result from the treatment of short-term gains as ordinary income for tax purposes.
The fund used a tax accounting practice to treat a portion of the price of capital shares redeemed during the year as distributions from net investment income and realized capital gains. Accordingly, the fund has reclassified $26,411,000 from undistributed net investment income, and $96,734,000 from accumulated net realized gains, to paid-in capital.
During the year ended January 31, 2008, the fund realized net foreign currency losses of $274,000, which decreased distributable net income for tax purposes; accordingly such losses have been reclassified from accumulated net realized gains to undistributed net investment income.
24
For tax purposes, at January 31, 2008, the fund had $11,689,000 of ordinary income and $242,398,000 of long-term capital gains available for distribution.
At January 31, 2008, the cost of investment securities for tax purposes was $16,871,784,000. Net unrealized appreciation of investment securities for tax purposes was $7,988,326,000, consisting of unrealized gains of $8,493,236,000 on securities that had risen in value since their purchase and $504,910,000 in unrealized losses on securities that had fallen in value since their purchase.
E. During the year ended January 31, 2008, the fund purchased $2,156,609,000 of investment securities and sold $3,611,463,000 of investment securities other than temporary cash investments.
F. The market value of securities on loan to broker-dealers at January 31, 2008, was $8,504,000, for which the fund received cash collateral of $8,604,000.
G. Capital share transactions for each class of shares were:
| | | Year Ended January 31, |
| | 2008 | | 2007 |
| Amount | Shares | Amount | Shares |
| ($000) | (000) | ($000) | (000) |
Investor Shares | | | | |
Issued | 677,166 | 4,534 | 753,042 | 5,236 |
Issued in Lieu of Cash Distributions | 1,302,730 | 9,323 | 937,568 | 6,521 |
Redeemed1 | (2,737,723) | (18,187) | (2,931,112) | (20,390) |
Net Increase (Decrease)—Investor Shares | (757,827) | (4,330) | (1,240,502) | (8,633) |
Admiral Shares | | | | |
Issued | 1,267,202 | 19,746 | 1,638,889 | 26,900 |
Issued in Lieu of Cash Distributions | 895,071 | 15,187 | 560,409 | 9,227 |
Redeemed1 | (1,262,026) | (19,999) | (947,925) | (15,636) |
Net Increase (Decrease)—Admiral Shares | 900,247 | 14,934 | 1,251,373 | 20,491 |
1 Net of redemption fees of $607,000 and $745,000 (fund totals).
25
H. Certain of the fund’s investments are in companies that are considered to be affiliated companies of the fund because the fund owns more than 5% of the outstanding voting securities of the company. Transactions during the period in securities of these companies were as follows:
| | Current Period Transactions | |
| Jan. 31, 2007 | | Proceeds from | | Jan. 31, 2008 |
| Market | Purchases | Securities | Dividend | Market |
| Value | at Cost | Sold | Income | Value |
| ($000) | ($000) | ($000) | ($000) | ($000) |
Cerner Corp. | 188,706 | — | 11,825 | — | 209,600 |
Forest Laboratories, Inc. | 1,122,284 | 405,191 | 16,365 | — | 1,163,921 |
Health Management | | | | | |
Associates Class A | 240,925 | 25,860 | — | 108,633 | 84,930 |
Humana Inc. | 468,032 | — | 102,138 | — | NA1 |
McKesson Corp. | 825,100 | — | 40,890 | 3,444 | NA1 |
OSI Pharmaceuticals, Inc. | NA2 | 127,228 | 8,688 | — | 138,782 |
Owens & Minor, Inc. Holding Co. | 73,590 | — | 3,791 | 1,479 | 86,772 |
PAREXEL International Corp. | 51,424 | — | 10,146 | — | NA1 |
Perrigo Co. | 91,970 | — | 12,790 | 975 | 151,116 |
| 3,062,031 | | | 114,531 | 1,835,121 |
I. In June 2006, the Financial Accounting Standards Board issued Interpretation No. 48 (“FIN 48”), “Accounting for Uncertainty in Income Taxes.” FIN 48 establishes the minimum threshold for recognizing, and a system for measuring, the benefits of tax-return positions in financial statements, effective for the fund’s current fiscal year. Management has analyzed the fund’s tax positions taken on federal income tax returns for all open tax years (tax years ended January 31, 2005–2008) for purposes of implementing FIN 48, and has concluded that no provision for income tax is required in the fund’s financial statements.
1 At January 31, 2008, the security was still held, but the issuer is no longer an affiliated company of the fund.
2 At January 31, 2007, the issuer was not an affiliated company of the fund.
26
Report of Independent Registered Public Accounting Firm
To the Trustees of Vanguard Specialized Funds and the Shareholders of Vanguard Health Care Fund:
In our opinion, the accompanying statements of net assets and of assets and liabilities and the related statements of operations and of changes in net assets and the financial highlights present fairly, in all material respects, the financial position of Vanguard Health Care Fund (constituting a separate portfolio of Vanguard Specialized Funds, hereafter referred to as the “Fund”) at January 31, 2008, the results of its operations for the year then ended, the changes in its net assets for each of the two years in the period then ended and the financial highlights for each of the five years in the period then ended, in conformity with accounting principles generally accepted in the United States of America. These financial statements and financial highlights (hereafter referred to as “financial statements”) are the responsibility of the Fund’s management; our responsibility is to express an opinion on these financial statements based on our audits. We conducted our audits of these financial statements in accordance with the standards of the Public Company Accounting Oversight Board (United States). Those standards require that we plan and perform the audit to obtain reasonable assurance about whether the financial statements are free of material misstatement. An audit includes examining, on a test basis, evidence supporting the amounts and disclosures in the financial statements, assessing the accounting principles used and significant estimates made by management, and evaluating the overall financial statement presentation. We believe that our audits, which included confirmation of securities at January 31, 2008 by correspondence with the custodians and brokers and by agreement to the underlying ownership records for Vanguard Market Liquidity Fund, provide a reasonable basis for our opinion.
PricewaterhouseCoopers LLP
Philadelphia, Pennsylvania
March 12, 2008
Special 2007 tax information (unaudited) for Vanguard Health Care Fund
This information for the fiscal year ended January 31, 2008, is included pursuant to provisions of the Internal Revenue Code.
The fund distributed $1,921,503,000 as capital gain dividends (from net long-term capital gains) to shareholders during the fiscal year.
The fund distributed $404,564,000 of qualified dividend income to shareholders during the fiscal year.
For corporate shareholders, 54.9% of investment income (dividend income plus short-term gains, if any) qualifies for the dividends-received deduction.
27
Your Fund’s After-Tax Returns
This table presents returns for your fund both before and after taxes. The after-tax returns are shown in two ways: (1) assuming that an investor owned the fund during the entire period and paid taxes on the fund’s distributions, and (2) assuming that an investor paid taxes on the fund’s distributions and sold all shares at the end of each period.
Calculations are based on the highest individual federal income tax and capital gains tax rates in effect at the times of the distributions and the hypothetical sales. State and local taxes were not considered. After-tax returns reflect any qualified dividend income, using actual prior-year figures and estimates for 2008. (In the example, returns after the sale of fund shares may be higher than those assuming no sale. This occurs when the sale would have produced a capital loss. The calculation assumes that the investor received a tax deduction for the loss.)
The table shows returns for Investor Shares only; returns for other share classes will differ. Please note that your actual after-tax returns will depend on your tax situation and may differ from those shown. Also note that if you own the fund in a tax-deferred account, such as an individual retirement account or a 401(k) plan, this information does not apply to you. Such accounts are not subject to current taxes.
Finally, keep in mind that a fund’s performance—whether before or after taxes—does not guarantee future results.
Average Annual Total Returns: Health Care Fund Investor Shares1 |
Periods Ended January 31, 2008 | | | |
| One | Five | Ten |
| Year | Years | Years |
Returns Before Taxes | –1.97% | 12.75% | 13.24% |
Returns After Taxes on Distributions | –3.37 | 11.84 | 11.75 |
Returns After Taxes on Distributions and Sale of Fund Shares | 0.46 | 11.04 | 11.22 |
1 Total return figures do not reflect the 1% fee assessed on redemptions of shares held less than one year, nor do they include the account service fee that may be applicable to certain accounts with balances below $10,000.
28
About Your Fund’s Expenses
As a shareholder of the fund, you incur ongoing costs, which include costs for portfolio management, administrative services, and shareholder reports (like this one), among others. Operating expenses, which are deducted from a fund’s gross income, directly reduce the investment return of the fund.
A fund’s expenses are expressed as a percentage of its average net assets. This figure is known as the expense ratio. The following examples are intended to help you understand the ongoing costs (in dollars) of investing in your fund and to compare these costs with those of other mutual funds. The examples are based on an investment of $1,000 made at the beginning of the period shown and held for the entire period.
The table below illustrates your fund’s costs in two ways:
• Based on actual fund return. This section helps you to estimate the actual expenses that you paid over the period. The “Ending Account Value” shown is derived from the fund’s actual return, and the third column shows the dollar amount that would have been paid by an investor who started with $1,000 in the fund. You may use the information here, together with the amount you invested, to estimate the expenses that you paid over the period.
To do so, simply divide your account value by $1,000 (for example, an $8,600 account value divided by $1,000 = 8.6), then multiply the result by the number given for your fund under the heading “Expenses Paid During Period.”
• Based on hypothetical 5% yearly return. This section is intended to help you compare your fund’s costs with those of other mutual funds. It assumes that the fund had a yearly return of 5% before expenses, but that the expense ratio is unchanged. In this case—because the return used is not the fund’s actual return—the results do not apply to your investment. The example is useful in making comparisons because the Securities and Exchange Commission requires all mutual funds to calculate expenses based on a 5% return. You can assess your fund’s costs by comparing this hypothetical example with the hypothetical examples that appear in shareholder reports of other funds.
Six Months Ended January 31, 2008 | | | |
| Beginning | Ending | Expenses |
| Account Value | Account Value | Paid During |
Health Care Fund | 7/31/2007 | 1/31/2008 | Period1 |
Based on Actual Fund Return | | | |
Investor Shares | $1,000.00 | $983.26 | $1.30 |
Admiral Shares | 1,000.00 | 983.60 | 0.90 |
Based on Hypothetical 5% Yearly Return | | | |
Investor Shares | $1,000.00 | $1,023.89 | $1.33 |
Admiral Shares | 1,000.00 | 1,024.30 | 0.92 |
1 These calculations are based on expenses incurred in the most recent six-month period. The fund’s annualized six-month expense ratios for that period are 0.26% for Investor Shares and 0.18% for Admiral Shares. The dollar amounts shown as “Expenses Paid” are equal to the annualized expense ratio multiplied by the average account value over the period, multiplied by the number of days in the most recent six-month period, then divided by the number of days in the most recent 12-month period.
29
Note that the expenses shown in the table on page 26 are meant to highlight and help you compare ongoing costs only and do not reflect transaction costs incurred by the fund for buying and selling securities. Further, the expenses do not include the 1% fee on redemptions of shares held for less than one year, nor do they include the account service fee described in the prospectus. If such fees were applied to your account, your costs would be higher. Your fund does not carry a “sales load.”
The calculations assume no shares were bought or sold during the period. Your actual costs may have been higher or lower, depending on the amount of your investment and the timing of any purchases or redemptions.
You can find more information about the fund’s expenses, including annual expense ratios, in the Financial Statements section of this report. For additional information on operating expenses and other shareholder costs, please refer to your fund’s current prospectus.
30
Glossary
Beta. A measure of the magnitude of a fund’s past share-price fluctuations in relation to the ups and downs of a given market index. The index is assigned a beta of 1.00. Compared with a given index, a fund with a beta of 1.20 typically would have seen its share price rise or fall by 12% when the index rose or fell by 10%. For this report, beta is based on returns over the past 36 months for both the fund and the index. Note that a fund’s beta should be reviewed in conjunction with its R-squared (see definition below). The lower the R-squared, the less correlation there is between the fund and the index, and the less reliable beta is as an indicator of volatility.
Earnings Growth Rate. The average annual rate of growth in earnings over the past five years for the stocks now in a fund.
Equity Exposure. A measure that reflects a fund’s investments in stocks and stock futures. Any holdings in short-term reserves are excluded.
Expense Ratio. The percentage of a fund’s average net assets used to pay its annual administrative and advisory expenses. These expenses directly reduce returns to investors.
Foreign Holdings. The percentage of a fund represented by stocks or depositary receipts of companies based outside the United States.
Inception Date. The date on which the assets of a fund (or one of its share classes) are first invested in accordance with the fund’s investment objective. For funds with a subscription period, the inception date is the day after that period ends. Investment performance is measured from the inception date.
Median Market Cap. An indicator of the size of companies in which a fund invests; the midpoint of market capitalization (market price x shares outstanding) of a fund’s stocks, weighted by the proportion of the fund’s assets invested in each stock. Stocks representing half of the fund’s assets have market capitalizations above the median, and the rest are below it.
Price/Book Ratio. The share price of a stock divided by its net worth, or book value, per share. For a fund, the weighted average price/book ratio of the stocks it holds.
Price/Earnings Ratio. The ratio of a stock’s current price to its per-share earnings over the past year. For a fund, the weighted average P/E of the stocks it holds. P/E is an indicator of market expectations about corporate prospects; the higher the P/E, the greater the expectations for a company’s future growth.
R-Squared. A measure of how much of a fund’s past returns can be explained by the returns from the market in general, as measured by a given index. If a fund’s total returns were precisely synchronized with an index’s returns, its R-squared would be 1.00. If the fund’s returns bore no relationship to the index’s returns, its R-squared would be 0. For this report, R-squared is based on returns over the past 36 months for both the fund and the index.
Return on Equity. The annual average rate of return generated by a company during the past five years for each dollar of shareholder’s equity (net income divided by shareholder’s equity). For a fund, the weighted average return on equity for the companies whose stocks it holds.
Short-Term Reserves. The percentage of a fund invested in highly liquid, short-term securities that can be readily converted to cash.
31
Turnover Rate. An indication of the fund’s trading activity. Funds with high turnover rates incur higher transaction costs and may be more likely to distribute capital gains (which may be taxable to investors). The turnover rate excludes in-kind transactions, which have minimal impact on costs.
Yield. A snapshot of a fund’s income from interest and dividends. The yield, expressed as a percentage of the fund’s net asset value, is based on income earned over the past 30 days and is annualized, or projected forward for the coming year. The index yield is based on the current annualized rate of income provided by securities in the index.
32
This page intentionally left blank.
This page intentionally left blank.
The People Who Govern Your Fund
The trustees of your mutual fund are there to see that the fund is operated and managed in your best interests since, as a shareholder, you are a part owner of the fund. Your fund’s trustees also serve on the board of directors of The Vanguard Group, Inc., which is owned by the Vanguard funds and provides services to them on an at-cost basis.
A majority of Vanguard’s board members are independent, meaning that they have no affiliation with Vanguard or the funds they oversee, apart from the sizable personal investments they have made as private individuals.
Our independent board members bring distinguished backgrounds in business, academia, and public service to their task of working with Vanguard officers to establish the policies and oversee the activities of the funds. Among board members’ responsibilities are selecting investment advisors for the funds; monitoring fund operations, performance, and costs; reviewing contracts; nominating and selecting new trustees/directors; and electing Vanguard officers.
Each trustee serves a fund until its termination; or until the trustee’s retirement, resignation, or death; or otherwise as specified in the fund’s organizational documents. Any trustee may be removed at a shareholders’ meeting by a vote representing two-thirds of the net asset value of all shares of the fund together with shares of other Vanguard funds organized within the same trust. The table on these two pages shows information for each trustee and executive officer of the fund. The mailing address of the trustees and officers is P.O. Box 876, Valley Forge, PA 19482.
Chairman of the Board, Chief Executive Officer, and Trustee |
| |
John J. Brennan1 | |
Born 1954 | Principal Occupation(s) During the Past Five Years: Chairman of the Board, Chief Executive |
Trustee since May 1987; | Officer, and Director/Trustee of The Vanguard Group, Inc., and of each of the investment |
Chairman of the Board and | companies served by The Vanguard Group. |
Chief Executive Officer | |
152 Vanguard Funds Overseen | |
| |
Independent Trustees | |
| |
Charles D. Ellis | |
Born 1937 | Principal Occupation(s) During the Past Five Years: Applecore Partners (pro bono ventures |
Trustee since January 2001 | in education); Senior Advisor to Greenwich Associates (international business strategy |
152 Vanguard Funds Overseen | consulting); Successor Trustee of Yale University; Overseer of the Stern School of Business |
| at New York University; Trustee of the Whitehead Institute for Biomedical Research. |
| |
Emerson U. Fullwood | |
Born 1948 | Principal Occupation(s) During the Past Five Years: Executive Chief Staff and Marketing |
Trustee since January 2008 | Officer for North America since 2004 and Corporate Vice President of Xerox Corporation |
152 Vanguard Funds Overseen | (photocopiers and printers); Director of SPX Corporation (multi-industry manufacturing), |
| of the United Way of Rochester, and of the Boy Scouts of America. |
| |
Rajiv L. Gupta | |
Born 1945 | Principal Occupation(s) During the Past Five Years: Chairman, President, and |
Trustee since December 20012 | Chief Executive Officer of Rohm and Haas Co. (chemicals); Board Member of |
152 Vanguard Funds Overseen | the American Chemistry Council; Director of Tyco International, Ltd. (diversified |
| manufacturing and services) since 2005. |
Amy Gutmann | |
Born 1949 | Principal Occupation(s) During the Past Five Years: President of the University of |
Trustee since June 2006 | Pennsylvania since 2004; Professor in the School of Arts and Sciences, Annenberg School |
152 Vanguard Funds Overseen | for Communication, and Graduate School of Education of the University of Pennsylvania |
| since 2004; Provost (2001–2004) and Laurance S. Rockefeller Professor of Politics and |
| the University Center for Human Values (1990–2004), Princeton University; Director of |
| Carnegie Corporation of New York since 2005 and of Schuylkill River Development |
| Corporation and Greater Philadelphia Chamber of Commerce since 2004. |
| |
JoAnn Heffernan Heisen | |
Born 1950 | Principal Occupation(s) During the Past Five Years: Corporate Vice President and |
Trustee since July 1998 | Chief Global Diversity Officer since 2006, Vice President and Chief Information |
152 Vanguard Funds Overseen | Officer (1997–2005), and Member of the Executive Committee of Johnson & |
| Johnson (pharmaceuticals/consumer products); Director of the University Medical |
| Center at Princeton and Women’s Research and Education Institute. |
| |
André F. Perold | |
Born 1952 | Principal Occupation(s) During the Past Five Years: George Gund Professor of Finance |
Trustee since December 2004 | and Banking, Harvard Business School; Senior Associate Dean, Director of Faculty |
152 Vanguard Funds Overseen | Recruiting, and Chair of Finance Faculty, Harvard Business School; Director and Chairman |
| of UNX, Inc. (equities trading firm) since 2003; Chair of the Investment Committee of |
| HighVista Strategies LLC (private investment firm) since 2005. |
| |
Alfred M. Rankin, Jr. | |
Born 1941 | Principal Occupation(s) During the Past Five Years: Chairman, President, Chief Executive |
Trustee since January 1993 | Officer, and Director of NACCO Industries, Inc. (forklift trucks/housewares/lignite); Director |
152 Vanguard Funds Overseen | of Goodrich Corporation (industrial products/aircraft systems and services). |
| |
| |
J. Lawrence Wilson | |
Born 1936 | Principal Occupation(s) During the Past Five Years: Retired Chairman and Chief Executive |
Trustee since April 1985 | Officer of Rohm and Haas Co. (chemicals); Director of Cummins Inc. (diesel engines) and |
152 Vanguard Funds Overseen | AmerisourceBergen Corp. (pharmaceutical distribution); Trustee of Vanderbilt University |
| and of Culver Educational Foundation. |
| |
Executive Officers1 | |
| |
Thomas J. Higgins | |
Born 1957 | Principal Occupation(s) During the Past Five Years: Principal of The Vanguard Group, Inc.; |
Treasurer since July 1998 | Treasurer of each of the investment companies served by The Vanguard Group. |
152 Vanguard Funds Overseen | |
| |
| |
Heidi Stam | |
Born 1956 | Principal Occupation(s) During the Past Five Years: Managing Director of The Vanguard |
Secretary since July 2005 | Group, Inc., since 2006; General Counsel of The Vanguard Group since 2005; Secretary of |
152 Vanguard Funds Overseen | The Vanguard Group, and of each of the investment companies served by The Vanguard |
| Group, since 2005; Principal of The Vanguard Group (1997–2006). |
Vanguard Senior Management Team | | |
| | | |
R. Gregory Barton | Kathleen C. Gubanich | F. William McNabb III | Ralph K. Packard |
Mortimer J. Buckley | Paul A. Heller | Michael S. Miller | George U. Sauter |
Founder |
|
John C. Bogle |
Chairman and Chief Executive Officer, 1974–1996 |
1 Officers of the funds are “interested persons” as defined in the Investment Company Act of 1940.
2 December 2002 for Vanguard Equity Income Fund, Vanguard Growth Equity Fund, the Vanguard Municipal Bond Funds, and the Vanguard State Tax-Exempt Funds.
More information about the trustees is in the Statement of Additional Information, available from The Vanguard Group.
| 
|
| P.O. Box 2600 |
| Valley Forge, PA 19482-2600 |
Connect with Vanguard® > www.vanguard.com
Fund Information > 800-662-7447 | Vanguard, Admiral, Connect with Vanguard, and the |
| ship logo are trademarks of The Vanguard Group, Inc. |
Direct Investor Account Services > 800-662-2739 | |
| |
Institutional Investor Services > 800-523-1036 | All other marks are the exclusive property of their |
| respective owners. |
Text Telephone for People | |
With Hearing Impairment > 800-952-3335 | |
| All comparative mutual fund data are from Lipper Inc. |
| or Morningstar, Inc., unless otherwise noted. |
| |
| |
| You can obtain a free copy of Vanguard’s proxy voting |
This material may be used in conjunction | guidelines by visiting our website, www.vanguard.com, |
with the offering of shares of any Vanguard | and searching for “proxy voting guidelines,” or by |
fund only if preceded or accompanied by | calling Vanguard at 800-662-2739. The guidelines are |
the fund’s current prospectus. | also available from the SEC’s website, www.sec.gov. |
| In addition, you may obtain a free report on how your |
| fund voted the proxies for securities it owned during |
| the 12 months ended June 30. To get the report, visit |
| either www.vanguard.com or www.sec.gov. |
| |
| |
| You can review and copy information about your fund |
| at the SEC’s Public Reference Room in Washington, D.C. |
| To find out more about this public service, call the SEC |
| at 202-551-8090. Information about your fund is also |
| available on the SEC’s website, and you can receive |
| copies of this information, for a fee, by sending a |
| request in either of two ways: via e-mail addressed to |
| publicinfo@sec.gov or via regular mail addressed to the |
| Public Reference Section, Securities and Exchange |
| Commission, Washington, DC 20549-0102. |
| |
| |
| |
| |
| |
| © 2008 The Vanguard Group, Inc. |
| All rights reserved. |
| Vanguard Marketing Corporation, Distributor. |
| |
| Q520 032008 |
> | Vanguard REIT Index Fund’s Investor Shares returned –23.3% during the fiscal year ended January 31, 2008. |
> | It was an up-and-down year in the broad stock market (which returned –2.7%), and a particularly challenging period for real estate and housing-related issues. |
> | Despite its poor results, the fund met its primary objective of closely tracking its target composite index. |
Contents | |
| |
Your Fund’s Total Returns | 1 |
Chairman’s Letter | 2 |
Fund Profile | 8 |
Performance Summary | 10 |
Financial Statements | 13 |
Your Fund’s After-Tax Returns | 29 |
About Your Fund’s Expenses | 30 |
Glossary | 32 |
Please note: The opinions expressed in this report are just that—informed opinions. They should not be considered promises or advice. Also, please keep in mind that the information and opinions cover the period through the date on the cover of this report. Of course, the risks of investing in your fund are spelled out in the prospectus.
Your Fund’s Total Returns
Fiscal Year Ended January 31, 2008 | | |
| Ticker | Total |
| Symbol | Returns |
Vanguard REIT Index Fund | | |
Investor Shares | VGSIX | –23.3% |
Admiral™ Shares1 | VGSLX | –23.2 |
Signal™ Shares2 | VGRSX | –19.73 |
Institutional Shares4 | VGSNX | –23.2 |
ETF Shares5 | VNQ | |
Market Price | | –23.4 |
Net Asset Value | | –23.2 |
Target REIT Composite6 | | –23.3 |
MSCI® US REIT Index | | –23.8 |
Average Real Estate Fund7 | | –21.3 |
Your Fund’s Performance at a Glance | | | |
January 31, 2007–January 31, 2008 | | | |
| Starting | Ending | Distributions Per Share | |
| Share | Share | Income | Capital | Return of |
| Price | Price | Dividends | Gains | Capital |
Vanguard REIT Index Fund | | | | | |
Investor Shares | $27.76 | $20.38 | $0.622 | $0.199 | $0.189 |
Admiral Shares | 118.46 | 86.94 | 2.735 | 0.849 | 0.826 |
Signal Shares | 30.058 | 23.21 | 0.620 | 0.192 | 0.187 |
Institutional Shares | 18.33 | 13.46 | 0.426 | 0.131 | 0.128 |
ETF Shares | 83.55 | 61.31 | 1.931 | 0.598 | 0.582 |
1 A lower-cost class of shares available to many longtime shareholders and to those with significant investments in the fund.
2 Signal Shares also carry lower costs and are available to institutional shareholders who meet certain administrative, service, and account-size criteria.
3 Return since the share-class inception on June 4, 2007.
4 Available for a minimum investment of $5 million, this class of shares also carries low expenses.s
5 These Vanguard ETF™ Shares are traded on the American Stock Exchange and are available only through brokers. The table shows the ETF returns based on both the AMEX market price and the net asset value for a share. U.S. Pat. No. 6,879,964 B2.
6 The Target REIT Composite consists of the MSCI US REIT Index adjusted to include a 2% cash position (Lipper Money Market Average).
7 Derived from data provided by Lipper Inc.
8 Price at the share-class inception on June 4, 2007.
1

Chairman’s Letter
Dear Shareholder,
The financial markets experienced an uptick in volatility during your fund’s fiscal year. Much of the turbulence stemmed from weakness in the real estate market, the crisis in the residential subprime-mortgage market, and growing fears of an economic slowdown.
Most real estate investment trusts struggled in this challenging environment. Vanguard REIT Index Fund returned slightly less than –23% for most of its share classes for fiscal year ended January 31, 2008. The fund’s Signal Shares, which launched in June 2007, returned –19.7% for the partial year. The fund’s 12-month result, although quite disappointing, was in line with the return of its benchmark. The fund’s return also trailed the average return of competing real estate funds.
As of January 31, the fund’s Investor Shares yielded 5.0%, and the Admiral, Signal, Institutional, and ETF Shares yielded 5.1%. Please note that these yield figures are not comparable to dividends paid by other stock funds, because REITs must distribute at least 90% of their taxable income, minus expenses, to shareholders. The figures also include some payments that represent capital gains and returns of capital by the underlying REITs; each REIT determines these amounts at the end of its fiscal year.
2
If you own the fund in a taxable account, you may wish to see page 26 for a report on the fund’s after-tax returns.
Stocks gained in the first half but faltered in the second
The broad U.S. stock market returned –2.7% for the 12 months ended January 31, reflecting a volatile year punctuated by sharp declines for equities. Gains in the first half of the fiscal period were largely relinquished in midsummer and fall as repercussions from the subprime-mortgage debacle began to be felt in the broader U.S. economy. The stock market’s retreat accelerated in January amid tightening global credit markets, a weakening U.S. dollar, and widening fears of a U.S. recession.
Large-capitalization stocks fared best in these unsettled conditions, outperforming small-caps for the year; meanwhile, growth stocks outpaced their value-oriented counterparts.
International stocks outperformed U.S. stocks for the sixth straight year, largely owing to exchange-rate gains produced by the weak U.S. dollar. Emerging markets and developed economies in Europe and Asia posted strong performances earlier in the fiscal year, but slumped after November as a result of increased concern about a U.S.-led downturn.
Market Barometer | | | |
| Average Annual Total Returns |
| Periods Ended January 31, 2008 |
| One Year | Three Years | Five Years |
Stocks | | | |
Russell 1000 Index (Large-caps) | –2.4% | 7.8% | 12.6% |
Russell 2000 Index (Small-caps) | –9.8 | 5.8 | 15.3 |
Dow Jones Wilshire 5000 Index (Entire market) | –2.7 | 7.9 | 13.2 |
MSCI All Country World Index ex USA (International) | 5.4 | 17.0 | 22.9 |
| | | |
Bonds | | | |
Lehman U.S. Aggregate Bond Index (Broad taxable market) | 8.8% | 4.9% | 4.8% |
Lehman Municipal Bond Index | 4.9 | 4.0 | 4.6 |
Citigroup 3-Month Treasury Bill Index | 4.6 | 4.2 | 3.0 |
| | | |
CPI | | | |
Consumer Price Index | 4.3% | 3.4% | 3.0% |
3
Bond returns grew stronger as Fed lowered rates
During the first half of the fiscal year, a stronger U.S. economy made investors more willing to take on risk to earn higher yields; spreads thus narrowed between the yields of U.S. Treasury securities and those of lower-quality issues. But as the subprime lending problems unraveled further in summer, investors flocked to higher-quality government and corporate bonds. This drove Treasury prices higher and yields lower, widening the spread between Treasury yields and those of riskier bonds.
The Federal Reserve Board responded to the credit-market turmoil and deteriorating economic outlook with aggressive reductions in its target for the federal funds rate. The Fed cut the rate five times during the fiscal year (twice in January). The target rate ended the period at 3.0%, its lowest level since May 2005.
Lower interest rates depressed bond yields, but pushed prices higher. The broad taxable bond market returned 8.8% for the fiscal year. Tax-exempt municipal bonds returned 4.9%.
Weakness in REITs was deep and widespread
The REIT Index Fund outperformed the broad stock market for seven consecutive fiscal years from 2000 through 2006. The fund did particularly well in 2005 and 2006, even as the residential housing market began to experience a sharp downturn. But in 2007, as weakness in the housing
Total Returns | |
Ten Years Ended January 31, 2008 | |
| Average |
| Annual Return |
REIT Index Fund Investor Shares | 10.3% |
Target REIT Composite | 10.3 |
MSCI US REIT Index | 10.5 |
Average Real Estate Fund1 | 10.5 |
The figures shown represent past performance, which is not a guarantee of future results. (Current performance may be lower or higher than the performance data cited. For performance data current to the most recent month-end, visit our website at www.vanguard.com.) Note, too, that both investment returns and principal value can fluctuate widely, so an investor’s shares, when sold, could be worth more or less than their original cost.
1 Derived from data provided by Lipper Inc.
4
market and the ensuing subprime-mortgage crisis threatened the health of the overall economy, the commercial real estate market felt the effects.
The REIT Index Fund’s –23.3% result reflected weakness across all segments of the real estate market, triggered by a combination of declining property values, tougher credit standards, and a diminished appetite for business spending. The fund held about 100 stocks during the period, and all but a handful posted negative returns.
Among the index’s investment categories, office and residential REITs were the worst performers. Office REITs declined –28% as business demand for square footage softened amid a weaker economic outlook. Residential REITs—firms that own and manage apartment complexes—also fell –28%. Retail REITs decreased –25% during the year as investors in that sector grew concerned that a drop in consumer spending could negatively affect lease renewals in shopping centers and malls.
Industrial REITs returned –11%, the strongest relative performance in the index. Firms in this category provide warehouse and storage space for large manufacturing and shipping firms. These stocks are often considered less volatile than other types of REITs, and can more closely reflect activity in the manufacturing sector than in the real estate sector.
Expense Ratios1 | | | | |
Your fund compared with its peer group | | | | |
| | | | | | Average |
| Investor | Admiral | Signal | Institutional | ETF | Real Estate |
| Shares | Shares | Shares | Shares | Shares | Fund |
REIT Index Fund | 0.20% | 0.10% | 0.10%2 | 0.09% | 0.10% | 1.46% |
1 Fund expense ratios reflect the 12 months ended January 31, 2008. Peer-group expense ratio is derived from data provided by Lipper Inc. and captures information through year-end 2007.
2 Annualized since the share-class inception on June 4, 2007.
5
The fund’s long-term record remains strong
The REIT Index Fund’s negative double-digit return during the fiscal year was certainly unpleasant. But a look at the long-term results for the fund reveals a different story. For the ten years ended January 31, the fund’s Investor Shares posted an average annual return of 10.3%, closely tracking the target composite index. The fund handily outpaced the 5.6% average annual return of the broad stock market during that time span (as measured by the Dow Jones Wilshire 5000 Composite Index).
The fund’s performance is a tribute to the tight index-tracking capabilities of the advisor, Vanguard Quantitative Equity Group. The advisor’s job is aided by the fund’s low costs, which have helped it to capture most of the index’s return over the long term.
The fund is best used in a supporting role
We often counsel investors not to place too much emphasis on a single year’s return. But paging back through past years’ REIT Index Fund annual reports can provide some valuable perspective. For example, last year at this time we reported that your fund returned more than 36% for its 2006 fiscal year. This year, the fund reversed course, with a –23% result. These returns are notable both for their magnitude and their starkly opposite values. The lesson here: Small segments of the market can experience big volatility.
The REIT Index Fund is about 111/2 years old. In that brief history, we’ve seen that when the fund has performed strongly, it’s often performed very strongly; but when REITs have been out of favor, it’s been painful. Real estate investment trusts are a small but important part of the broad stock market—just as real estate is an important part of the overall economy. The REIT Index Fund is a low-cost, efficient way to gain exposure to this unique market segment. But the potential for volatility reminds us that the fund is best used as a supporting player in a balanced and diversified investment strategy.
As I close this report to you, it’s my pleasure to introduce the fund’s new president, F. William McNabb III. Bill is a man of great character and integrity who is intimately familiar with all aspects of Vanguard—from how we serve our clients to how we invest for our clients.
6
Bill and I have worked together very closely for more than two decades. I’m thrilled that the fund’s board elected him president, effective March 1, and designated him as my successor as chief executive officer, a role he will assume within a year, after an orderly transition. Bill and the rest of our team will serve you and our other clients extremely well in the years ahead.
Thank you for investing with Vanguard.
Sincerely,

John J. Brennan
Chairman and Chief Executive Officer
February 22, 2008
Vanguard REIT ETF | | | |
Premium/Discount: September 23, 20041–January 31, 2008 | | |
| | | | |
| Market Price Above or | Market Price Below |
| Equal to Net Asset Value | | Net Asset Value |
| Number | Percentage | Number | Percentage |
Basis Point Differential2 | of Days | of Total Days | of Days | of Total Days |
0–24.9 | 393 | 46.45% | 433 | 51.18% |
25–49.9 | 8 | 0.95 | 10 | 1.18 |
50–74.9 | 0 | 0.00 | 0 | 0.00 |
75–100.0 | 0 | 0.00 | 1 | 0.12 |
>100.0 | 1 | 0.12 | 0 | 0.00 |
Total | 402 | 47.52% | 444 | 52.48% |
1 Inception.
2 One basis point equals 1/100 of a percentage point.
7
Fund Profile
As of January 31, 2008
Portfolio Characteristics | | |
| | Comparative | Broad |
| Fund | Index1 | Index2 |
Number of Stocks | 97 | 96 | 4,830 |
Median Market Cap | $5.1B | $5.1B | $33.7B |
Price/Earnings Ratio | 29.1x | 29.1x | 17.0x |
Price/Book Ratio | 2.2x | 2.2x | 2.5x |
Yield | — | 5.0% | 1.9% |
Investor Shares | 5.0%3 | | |
Admiral Shares | 5.1%3 | | |
Signal Shares | 5.1%3 | | |
Institutional Shares | 5.1%3 | | |
ETF Shares | 5.1%3 | | |
Return on Equity | 9.0% | 9.0% | 19.2% |
Earnings Growth Rate | 4.3% | 4.3% | 20.1% |
Foreign Holdings | 0.0% | 0.0% | 0.0% |
Turnover Rate | 12.9% | — | — |
Expense Ratio | | — | — |
Investor Shares | 0.20% | | |
Admiral Shares | 0.10% | | |
Signal Shares | 0.10%4 | | |
Institutional Shares | 0.09% | | |
ETF Shares | 0.10% | | |
Short-Term Reserves | 1.9% | — | — |
Fund Allocation by REIT Type (% of portfolio) |
| |
Retail | 28.5% |
Specialized | 21.8 |
Office | 16.8 |
Residential | 15.3 |
Industrial | 9.6 |
Diversified | 8.0 |
Volatility Measures5 | |
| Fund Versus | Fund Versus |
| Target Index6 | Broad Index2 |
R-Squared | 1.00 | 0.38 |
Beta | 1.00 | 1.10 |
8
Ten Largest Holdings7 (% of total net assets) |
| |
Simon Property Group, Inc. REIT | 7.5% |
ProLogis REIT | 5.8 |
Vornado Realty Trust REIT | 4.7 |
Boston Properties, Inc. REIT | 4.1 |
Equity Residential REIT | 3.9 |
Public Storage, Inc. REIT | 3.8 |
Host Hotels & Resorts Inc. REIT | 3.3 |
Kimco Realty Corp. REIT | 3.1 |
General Growth Properties Inc. REIT | 3.1 |
Avalonbay Communities, Inc. REIT | 2.8 |
Top Ten | 42.1 |
Investment Focus
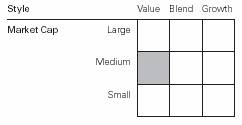
1 MSCI US REIT Index.
2 Dow Jones Wilshire 5000 Index.
3 This yield may include some payments that represent a return of capital, capital gains distributions, or both by the underlying REITs. These amounts are determined by each REIT at the end of its fiscal year.
4 Annualized since the share-class inception on June 4, 2007.
5 For an explanation of R-squared, beta, and other terms used here, see the Glossary on page 29.
6 The Target REIT Composite consists of the MSCI US REIT Index adjusted to include a 2% cash position (Lipper Money Market Average).
7 “Ten Largest Holdings” excludes any temporary cash investments and equity index products.
9
Performance Summary
All of the returns in this report represent past performance, which is not a guarantee of future results that may be achieved by the fund. (Current performance may be lower or higher than the performance data cited. For performance data current to the most recent month-end, visit our website at www.vanguard.com/performance.) Note, too, that both investment returns and principal value can fluctuate widely, so an investor’s shares, when sold, could be worth more or less than their original cost. The returns shown do not reflect taxes that a shareholder would pay on fund distributions or on the sale of fund shares.
Cumulative Performance: January 31, 1998–January 31, 2008
Initial Investment of $10,000
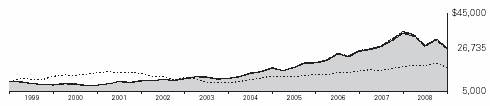
| | Average Annual Total Returns | Final Value |
| Periods Ended January 31, 2008 | of a $10,000 |
| One Year | Five Years | Ten Years | Investment |
REIT Index Fund Investor Shares1 | –23.28% | 18.06% | 10.33% | $26,735 |
Dow Jones Wilshire 5000 Index | –2.70 | 13.21 | 5.61 | 17,266 |
Target REIT Composite2 | –23.27 | 18.17 | 10.35 | 26,768 |
MSCI US REIT Index | –23.78 | 18.48 | 10.48 | 27,095 |
Average Real Estate Fund3 | –21.29 | 18.65 | 10.47 | 27,075 |
| | | | Final Value |
| | | Since | of a $100,000 |
| One Year | Five Years | Inception4 | Investment |
REIT Index Fund Admiral Shares1 | –23.23% | 18.15% | 15.61% | $246,416 |
Dow Jones Wilshire 5000 Index | –2.70 | 13.21 | 6.69 | 149,626 |
Target REIT Composite | –23.27 | 18.17 | 15.61 | 246,456 |
1 Total returns do not reflect the 1% fee assessed on redemptions of shares held for less than one year, nor for the Investor Shares do they include the account service fee that may apply to certain accounts with balances below $10,000.
2 The Target REIT Composite consists of the MSCI US REIT Index adjusted to include a 2% cash position (Lipper Money Market Average).
3 Derived from data provided by Lipper Inc.
4 Performance for the fund’s Admiral Shares and comparative standards is calculated since the Admiral Shares’ inception: November 12, 2001.
10
| | Final Value of |
| Since | a $1,000,000 |
| Inception1 | Investment |
REIT Index Fund Signal Shares2 | –19.68% | $803,220 |
Dow Jones Wilshire 5000 Index | –9.74 | 902,640 |
Target REIT Composite3 | –19.70 | 802,964 |
| | | Final Value of |
| | Since | a $5,000,000 |
| One Year | Inception1 | Investment |
REIT Index Fund Institutional Shares2 | –23.18% | 13.37% | $8,431,550 |
Dow Jones Wilshire 5000 Index | –2.70 | 8.91 | 7,133,735 |
Target REIT Composite3 | –23.27 | 13.32 | 8,415,243 |
| | | Final Value |
| | Since | of a $10,000 |
| One Year | Inception1 | Investment |
REIT ETF Shares Net Asset Value | –23.23% | 12.31% | $14,764 |
Dow Jones Wilshire 5000 Index | –2.70 | 9.57 | 13,591 |
Target REIT Composite3 | –23.27 | 12.30 | 14,757 |
Cumulative Returns ETF Shares: September 23, 2004–January 31, 2008 |
| | |
| | Cumulative |
| | Since |
| One Year | Inception |
REIT ETF Shares Market Price | –23.38% | 47.35% |
REIT ETF Shares Net Asset Value | –23.23 | 47.64 |
Target REIT Composite3 | –23.27 | 47.57 |
1 Performance for the fund and its comparative standards is calculated since the following inception dates: June 4, 2007, for Signal Shares; December 2, 2003, for Institutional Shares; September 23, 2004, for ETF Shares.
2 Total returns do not reflect the 1% fee assessed on redemptions of shares held for less than one year, nor for the Investor Shares do they include the account service fee that may apply to certain accounts with balances below $10,000.
3 The Target REIT Composite consists of the Morgan Stanley REIT Index adjusted to include a 2% cash position (Lipper Money Market Average).
11
Fiscal-Year Total Returns (%): January 31, 1998–January 31, 2008
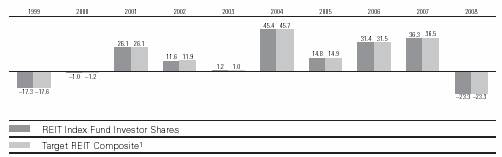
Average Annual Total Returns: Periods Ended December 31, 2007
This table presents average annual total returns through the latest calendar quarter—rather than through the end of the fiscal period. Securities and Exchange Commission rules require that we provide this information.
| Inception Date | One Year | Five Years | Ten Years |
Investor Shares2 | 5/13/1996 | –16.46% | 17.50% | 10.23% |
Admiral Shares2 | 11/12/2001 | –16.39 | 17.59 | 15.903 |
Signal Shares2 | 6/4/2007 | –20.183 | — | — |
Institutional Shares2 | 12/2/2003 | –16.38 | 13.753 | — |
ETF Shares | 9/23/2004 | | | |
Market Price | | –16.37 | 12.743 | — |
Net Asset Value | | –16.38 | 12.773 | — |
1 The Target REIT Composite consists of the MSCI US REIT Index adjusted to include a 2% cash position (Lipper Money Market Average).
2 Total returns do not reflect the 1% fee assessed on redemptions of shares held for less than one year, nor do they include the account service fee that may apply to certain accounts with balances below $10,000.
3 Return since inception.
Note: See Financial Highlights tables on pages 17–21 for dividend and capital gains information.
12
Financial Statements
Statement of Net Assets
As of January 31, 2008
The fund provides a complete list of its holdings four times in each fiscal year, at the quarter-ends. For the second and fourth fiscal quarters, the lists appear in the fund’s semiannual and annual reports to shareholders. For the first and third fiscal quarters, the fund files the lists with the Securities and Exchange Commission on Form N-Q. Shareholders can look up the fund’s Forms N-Q on the SEC’s website at www.sec.gov. Forms N-Q may also be reviewed and copied at the SEC’s Public Reference Room (see the back cover of this report for further information).
| | Market |
| | Value• |
| Shares | ($000) |
Real Estate Investment Trusts (98.0%) | | |
Diversified REITs (7.8%) | | |
Vornado Realty Trust REIT | 4,701,075 | 424,977 |
Liberty Property Trust REIT | 3,135,927 | 100,695 |
Washington REIT | 1,603,532 | 50,447 |
Colonial Properties Trust | | |
REIT | 1,532,758 | 37,767 |
^Cousins Properties, Inc. | | |
REIT | 1,336,366 | 35,547 |
PS Business Parks, Inc. | | |
REIT | 550,166 | 27,646 |
Investors Real Estate Trust | | |
REIT | 1,906,476 | 18,683 |
CapLease, Inc. REIT | 1,568,644 | 12,722 |
| | 708,484 |
Industrial REITs (9.4%) | | |
ProLogis REIT | 8,830,137 | 524,069 |
AMB Property Corp. REIT | 3,433,232 | 173,721 |
DCT Industrial Trust Inc. | | |
REIT | 5,785,108 | 54,785 |
First Industrial Realty Trust | | |
REIT | 1,560,974 | 54,369 |
EastGroup Properties, Inc. | | |
REIT | 816,810 | 33,808 |
First Potomac REIT | 833,428 | 14,493 |
| | 855,245 |
Office REITs (16.4%) | | |
^Boston Properties, Inc. | | |
REIT | 4,090,379 | 375,988 |
SL Green Realty Corp. REIT | 2,045,003 | 189,797 |
Duke Realty Corp. REIT | 4,946,383 | 116,932 |
Alexandria Real Estate | | |
Equities, Inc. REIT | 1,085,037 | 106,583 |
Mack-Cali Realty Corp. | | |
REIT | 2,334,189 | 82,910 |
Digital Realty Trust, Inc. | | |
REIT | 2,096,256 | 74,899 |
Douglas Emmett, Inc. REIT | 3,019,359 | 68,992 |
HRPT Properties Trust REIT | 7,695,433 | 61,179 |
13
| | Market |
| | Value• |
| Shares | ($000) |
Highwood Properties, Inc. | | |
REIT | 1,865,016 | 55,820 |
Kilroy Realty Corp. REIT | 1,123,922 | 55,106 |
Brandywine Realty Trust | | |
REIT | 2,834,948 | 53,439 |
BioMed Realty Trust, Inc. | | |
REIT | 2,249,524 | 51,919 |
Corporate Office Properties | | |
Trust, Inc. REIT | 1,539,724 | 49,317 |
American Financial Realty | | |
Trust REIT | 4,459,451 | 36,701 |
^Maguire Properties, Inc. | | |
REIT | 1,297,884 | 35,796 |
^Lexington Realty Trust REIT | 2,090,343 | 31,251 |
^Franklin Street | | |
Properties Corp. REIT | 2,066,965 | 29,661 |
Parkway Properties Inc. | | |
REIT | 546,283 | 19,622 |
| | 1,495,912 |
Residential REITs (15.0%) | | |
Equity Residential REIT | 9,523,128 | 356,260 |
Avalonbay | | |
Communities, Inc. REIT | 2,739,978 | 257,421 |
Apartment Investment & | | |
Management Co. | | |
Class A REIT | 3,324,235 | 131,773 |
UDR, Inc. REIT | 4,630,114 | 105,706 |
Camden Property Trust | | |
REIT | 1,928,716 | 95,182 |
Essex Property Trust, Inc. | | |
REIT | 864,693 | 89,591 |
BRE Properties Inc. | | |
Class A REIT | 1,743,215 | 75,987 |
Post Properties, Inc. REIT | 1,501,009 | 63,448 |
Home Properties, Inc. REIT | 1,153,472 | 55,355 |
Mid-America Apartment | | |
Communities, Inc. REIT | 832,856 | 38,153 |
Equity Lifestyle | | |
Properties, Inc. REIT | 794,794 | 34,709 |
14
| | | Market |
| | | Value• |
| | Shares | ($000) |
| American Campus | | |
| Communities, Inc. REIT | 930,277 | 26,838 |
| Education Realty Trust, Inc. | | |
| REIT | 978,905 | 11,531 |
| Sun Communities, Inc. REIT | 594,771 | 11,497 |
| GMH Communities Trust | | |
| REIT | 1,359,927 | 7,180 |
| | | 1,360,631 |
Retail REITs (28.0%) | | |
| Simon Property Group, Inc. | | |
| REIT | 7,676,166 | 686,096 |
| Kimco Realty Corp. REIT | 7,800,439 | 279,334 |
| General Growth | | |
| Properties Inc. REIT | 7,595,079 | 277,372 |
| Developers Diversified | | |
| Realty Corp. REIT | 4,267,804 | 175,620 |
| The Macerich Co. REIT | 2,469,724 | 168,855 |
| Regency Centers Corp. | | |
| REIT | 2,388,484 | 146,725 |
| Federal Realty Investment | | |
| Trust REIT | 1,937,852 | 143,013 |
| Taubman Co. REIT | 1,818,119 | 91,179 |
| Weingarten Realty | | |
| Investors REIT | 2,673,646 | 89,888 |
^ | Realty Income Corp. REIT | 3,473,142 | 84,675 |
| CBL & Associates | | |
| Properties, Inc. REIT | 2,143,410 | 56,972 |
^ | National Retail Properties | | |
| REIT | 2,442,886 | 55,502 |
^ | Tanger Factory Outlet | | |
| Centers, Inc. REIT | 1,075,770 | 40,417 |
| Pennsylvania REIT | 1,331,003 | 35,471 |
| Equity One, Inc. REIT | 1,268,387 | 29,947 |
| Inland Real Estate Corp. | | |
| REIT | 2,132,378 | 28,531 |
| Acadia Realty Trust REIT | 1,049,526 | 26,291 |
* | Alexander’s, Inc. REIT | 69,312 | 24,266 |
| Saul Centers, Inc. REIT | 365,175 | 18,708 |
^ | Glimcher Realty Trust REIT | 1,294,107 | 17,160 |
| Cedar Shopping | | |
| Centers, Inc. REIT | 1,518,934 | 16,906 |
| Getty Realty Holding Corp. | | |
| REIT | 595,269 | 15,656 |
| Ramco-Gershenson | | |
| Properties Trust REIT | 634,689 | 14,154 |
| Kite Realty Group Trust | | |
| REIT | 993,555 | 13,075 |
| Urstadt Biddle Properties | | |
| Class A REIT | 620,598 | 9,582 |
| Urstadt Biddle Properties | | |
| REIT | 26,988 | 417 |
| | | 2,545,812 |
15
| | Market |
| | Value• |
| Shares | ($000) |
Specialized REITs (21.4%) | | |
Public Storage, Inc. REIT | 4,394,551 | 343,874 |
Host Hotels & Resorts Inc. | | |
REIT | 17,946,481 | 300,424 |
HCP, Inc. REIT | 7,091,763 | 215,661 |
Ventas, Inc. REIT | 4,583,730 | 202,601 |
^Health Care Inc. REIT | 2,783,327 | 119,377 |
Hospitality Properties Trust | | |
REIT | 3,225,633 | 109,510 |
Nationwide Health | | |
Properties, Inc. REIT | 3,125,676 | 98,646 |
Senior Housing Properties | | |
Trust REIT | 3,047,593 | 68,236 |
Entertainment Properties | | |
Trust REIT | 965,100 | 47,772 |
Healthcare Realty Trust Inc. | | |
REIT | 1,646,541 | 42,530 |
DiamondRock | | |
Hospitality Co. REIT | 3,090,886 | 40,645 |
Omega Healthcare | | |
Investors, Inc. REIT | 2,336,480 | 38,552 |
LaSalle Hotel Properties | | |
REIT | 1,377,766 | 37,765 |
Strategic Hotels and | | |
Resorts, Inc. REIT | 2,555,008 | 36,664 |
Sunstone Hotel | | |
Investors, Inc. REIT | 2,055,654 | 34,206 |
Extra Space Storage Inc. | | |
REIT | 2,116,652 | 32,046 |
Sovran Self Storage, Inc. | | |
REIT | 741,551 | 29,380 |
FelCor Lodging Trust, Inc. | | |
REIT | 2,037,047 | 27,520 |
Ashford Hospitality Trust | | |
REIT | 4,000,150 | 25,001 |
National Health Investors | | |
REIT | 810,652 | 23,963 |
Medical Properties | | |
Trust Inc. REIT | 1,703,640 | 21,534 |
LTC Properties, Inc. REIT | 642,485 | 16,737 |
U-Store-It Trust REIT | 1,684,986 | 16,041 |
Universal Health Realty | | |
Income REIT | 386,356 | 13,928 |
| | 1,942,613 |
Total Real Estate Investment Trusts | | |
(Cost $7,793,490) | | 8,908,697 |
16
| | Market |
| | Value• |
| | ($000) |
Temporary Cash Investments (3.4%) | | |
1 Vanguard Market Liquidity Fund, 4.060% | 174,924,186 | 174,924 |
1 Vanguard Market Liquidity Fund, 4.060%—Note E | 135,619,700 | 135,620 |
Total Temporary Cash Investments | | |
(Cost $310,544) | | 310,544 |
Total Investments (101.4%) | | |
(Cost $8,104,034) | | 9,219,241 |
Other Assets and Liabilities (–1.4%) | | |
Other Assets—Note B | | 71,872 |
Liabilities—Note E | | (197,639) |
| | (125,767) |
Net Assets (100%) | | 9,093,474 |
At January 31, 2008, net assets consisted of:2 |
| Amount |
| ($000) |
Paid-in Capital | 7,991,406 |
Overdistributed Net Investment Income | (12,932) |
Overdistributed Net Realized Gains | (207) |
Unrealized Appreciation | 1,115,207 |
Net Assets | 9,093,474 |
| |
Investor Shares—Net Assets | |
Applicable to 198,590,757 outstanding $.001 par value shares of beneficial | |
interest (unlimited authorization) | 4,046,414 |
Net Asset Value Per Share—Investor Shares | $20.38 |
| |
Admiral Shares—Net Assets | |
Applicable to 19,621,455 outstanding $.001 par value shares of beneficial | |
interest (unlimited authorization) | 1,705,979 |
Net Asset Value Per Share—Admiral Shares | $86.94 |
| |
Signal Shares—Net Assets | |
Applicable to 23,176,229 outstanding $.001 par value shares of beneficial | |
interest (unlimited authorization) | 537,887 |
Net Asset Value Per Share—Signal Shares | $23.21 |
| |
Institutional Shares—Net Assets | |
Applicable to 53,629,043 outstanding $.001 par value shares of beneficial | |
interest (unlimited authorization) | 721,600 |
Net Asset Value Per Share—Institutional Shares | $13.46 |
| |
ETF Shares—Net Assets | |
Applicable to 33,951,724 outstanding $.001 par value shares of beneficial | |
interest (unlimited authorization) | 2,081,594 |
Net Asset Value Per Share—ETF Shares | $61.31 |
• | See Note A in Notes to Financial Statements. |
* | Non-income-producing security. |
^ | Part of security position is on loan to broker-dealers. See Note E in Notes to Financial Statements. |
1 Affiliated money market fund available only to Vanguard funds and certain trusts and accounts managed by Vanguard. Rate shown is the 7-day yield.
2 See Note C in Notes to Financial Statements for the tax-basis components of net assets.
17
Statement of Operations
| Year Ended |
| January 31, 2008 |
| ($000) |
Investment Income | |
Income | |
Dividends | 282,676 |
Interest1 | 10,436 |
Security Lending | 323 |
Total Income | 293,435 |
Expenses | |
The Vanguard Group—Note B | |
Investment Advisory Services | 280 |
Management and Administrative | |
Investor Shares | 8,887 |
Admiral Shares | 1,976 |
Signal Shares | 175 |
Institutional Shares | 451 |
ETF Shares | 1,162 |
Marketing and Distribution | |
Investor Shares | 1,400 |
Admiral Shares | 569 |
Signal Shares | 10 |
Institutional Shares | 225 |
ETF Shares | 438 |
Custodian Fees | 93 |
Auditing Fees | 27 |
Shareholders’ Reports | |
Investor Shares | 173 |
Admiral Shares | 12 |
Signal Shares | — |
Institutional Shares | 19 |
ETF Shares | 55 |
Trustees’ Fees and Expenses | 14 |
Total Expenses | 15,966 |
Net Investment Income | 277,469 |
Realized Net Gain (Loss) | |
Investment Securities Sold | 599,358 |
Capital Gain Distributions Received | 165,027 |
Realized Net Gain (Loss) | 764,385 |
Change in Unrealized Appreciation (Depreciation) of Investment Securities | (3,956,300) |
Net Increase (Decrease) in Net Assets Resulting from Operations | (2,914,446) |
1 Interest income from an affiliated company of the fund was $10,427,000.
18
Statement of Changes in Net Assets
| Year Ended January 31, |
| 2008 | 2007 |
| ($000) | ($000) |
Increase (Decrease) In Net Assets | | |
Operations | | |
Net Investment Income | 277,469 | 226,677 |
Realized Net Gain (Loss) | 764,385 | 617,561 |
Change in Unrealized Appreciation (Depreciation) | (3,956,300) | 2,406,468 |
Net Increase (Decrease) in Net Assets Resulting from Operations | (2,914,446) | 3,250,706 |
Distributions | | |
Net Investment Income | | |
Investor Shares | (135,972) | (121,669) |
Admiral Shares | (69,231) | (59,953) |
Signal Shares | (5,931) | — |
Institutional Shares | (22,421) | (17,265) |
ETF Shares | (46,805) | (30,789) |
Realized Capital Gain1 | | |
Investor Shares | (43,507) | (94,471) |
Admiral Shares | (21,491) | (46,021) |
Signal Shares | (1,833) | — |
Institutional Shares | (6,913) | (13,057) |
ETF Shares | (14,497) | (23,098) |
Return of Capital | | |
Investor Shares | (41,347) | (25,625) |
Admiral Shares | (20,900) | (12,511) |
Signal Shares | (1,789) | — |
Institutional Shares | (6,758) | (3,585) |
ETF Shares | (14,122) | (6,407) |
Total Distributions | (453,517) | (454,451) |
Capital Share Transactions—Note F | | |
Investor Shares | (1,091,585) | 596,373 |
Admiral Shares | (903,826) | 650,765 |
Signal Shares | 657,624 | — |
Institutional Shares | 18,915 | 182,463 |
ETF Shares | 888,417 | 471,824 |
Net Increase (Decrease) from Capital Share Transactions | (430,455) | 1,901,425 |
Total Increase (Decrease) | (3,798,418) | 4,697,680 |
Net Assets | | |
Beginning of Period | 12,891,892 | 8,194,212 |
End of Period2 | 9,093,474 | 12,891,892 |
1 Includes fiscal 2008 and 2007 short-term gain distributions totaling $0 and $6,611,000, respectively. Short-term gain distributions are treated as ordinary income dividends for tax purposes.
2 Net Assets—End of Period includes undistributed (overdistributed) net investment income of ($12,932,000) and ($10,041,000).
19
Financial Highlights
Investor Shares | | | | | |
| | | | | |
For a Share Outstanding | Year Ended January 31, |
Throughout Each Period | 2008 | 2007 | 2006 | 2005 | 2004 |
Net Asset Value, Beginning of Period | $27.76 | $21.29 | $17.20 | $15.83 | $11.52 |
Investment Operations | | | | | |
Net Investment Income | .615 | .530 | .562 | .563 | .579 |
Net Realized and Unrealized Gain (Loss) | | | | | |
on Investments1 | (6.985) | 7.000 | 4.692 | 1.759 | 4.511 |
Total from Investment Operations | (6.370) | 7.530 | 5.254 | 2.322 | 5.090 |
Distributions | | | | | |
Dividends from Net Investment Income | (.622) | (.534) | (.568) | (.565) | (.678) |
Distributions from Realized Capital Gains | (.199) | (.413) | (.530) | (.387) | — |
Return of Capital | (.189) | (.113) | (.066) | — | (.102) |
Total Distributions | (1.010) | (1.060) | (1.164) | (.952) | (.780) |
Net Asset Value, End of Period | $20.38 | $27.76 | $21.29 | $17.20 | $15.83 |
| | | | | |
Total Return2 | –23.28% | 36.32% | 31.43% | 14.78% | 45.39% |
| | | | | |
Ratios/Supplemental Data | | | | | |
Net Assets, End of Period (Millions) | $4,046 | $6,827 | $4,727 | $4,311 | $3,383 |
Ratio of Total Expenses to | | | | | |
Average Net Assets | 0.20% | 0.21% | 0.21% | 0.21% | 0.24% |
Ratio of Net Investment Income to | | | | | |
Average Net Assets | 2.52% | 2.27% | 2.91% | 3.44% | 4.10% |
Portfolio Turnover Rate3 | 13% | 11% | 17% | 13% | 7% |
1 Includes increases from redemption fees of $0.02, $0.00, $0.01, $0.01, and $0.00.
2 Total returns do not reflect the 1% fee assessed on redemptions of shares held for less than one year; nor do they include the account service fee that may be applicable to certain accounts with balances below $10,000.
3 Excludes the value of portfolio securities received or delivered as a result of in-kind purchases or redemptions of the fund’s capital shares, including ETF Creation Units.
20
Admiral Shares | | | | | |
| | | | | |
For a Share Outstanding | Year Ended January 31, |
Throughout Each Period | 2008 | 2007 | 2006 | 2005 | 2004 |
Net Asset Value, Beginning of Period | $118.46 | $90.82 | $73.40 | $67.56 | $49.14 |
Investment Operations | | | | | |
Net Investment Income | 2.707 | 2.328 | 2.460 | 2.437 | 2.508 |
Net Realized and Unrealized Gain (Loss) | | | | | |
on Investments1 | (29.817) | 29.903 | 19.993 | 7.494 | 19.279 |
Total from Investment Operations | (27.110) | 32.231 | 22.453 | 9.931 | 21.787 |
Distributions | | | | | |
Dividends from Net Investment Income | (2.735) | (2.341) | (2.488) | (2.439) | (2.931) |
Distributions from Realized Capital Gains | (.849) | (1.761) | (2.258) | (1.652) | — |
Return of Capital | (.826) | (.489) | (.287) | — | (.436) |
Total Distributions | (4.410) | (4.591) | (5.033) | (4.091) | (3.367) |
Net Asset Value, End of Period | $86.94 | $118.46 | $90.82 | $73.40 | $67.56 |
| | | | | |
Total Return2 | –23.23% | 36.46% | 31.49% | 14.82% | 45.57% |
| | | | | |
Ratios/Supplemental Data | | | | | |
Net Assets, End of Period (Millions) | $1,706 | $3,392 | $2,025 | $938 | $733 |
Ratio of Total Expenses to | | | | | |
Average Net Assets | 0.10% | 0.14% | 0.14% | 0.16% | 0.18% |
Ratio of Net Investment Income to | | | | | |
Average Net Assets | 2.62% | 2.34% | 2.98% | 3.49% | 4.16% |
Portfolio Turnover Rate3 | 13% | 11% | 17% | 13% | 7% |
1 Includes increases from redemption fees of $0.10, $0.02, $0.02, $0.04, and $0.01.
2 Total returns do not reflect the 1% fee assessed on redemptions of shares held for less than one year.
3 Excludes the value of portfolio securities received or delivered as a result of in-kind purchases or redemptions of the fund’s capital shares, including ETF Creation Units.
21
Signal Shares | |
| |
| June 4, 20071 to |
For a Share Outstanding Throughout the Period | January 31, 2008 |
Net Asset Value, Beginning of Period | $30.05 |
Investment Operations | |
Net Investment Income | .470 |
Net Realized and Unrealized Gain (Loss) on Investments2 | (6.311) |
Total from Investment Operations | (5.841) |
Distributions | |
Dividends from Net Investment Income | (.620) |
Distributions from Realized Capital Gains | (.192) |
Return of Capital | (.187) |
Total Distributions | (.999) |
Net Asset Value, End of Period | $23.21 |
| |
Total Return3 | –19.68% |
| |
Ratios/Supplemental Data | |
Net Assets, End of Period (Millions) | $538 |
Ratio of Total Expenses to Average Net Assets | 0.10%* |
Ratio of Net Investment Income to Average Net Assets | 2.62%* |
Portfolio Turnover Rate4 | 13% |
1 Inception.
2 Includes increase from redemption fees of $0.01.
3 Total returns do not reflect the 1% fee assessed on redemptions of shares held for less than one year.
4 Excludes the value of portfolio securities received or delivered as a result of in-kind purchases or redemptions of the fund’s capital shares, including ETF Creation Units.
22
Institutional Shares | | | | | |
| | | | | Dec. 2, |
| | | 20031 to |
For a Share Outstanding | Year Ended January 31, | Jan. 31, |
Throughout Each Period | 2008 | 2007 | 2006 | 2005 | 2004 |
Net Asset Value, Beginning of Period | $18.33 | $14.06 | $11.36 | $10.46 | $10.00 |
Investment Operations | | | | | |
Net Investment Income | .420 | .366 | .385 | .381 | .065 |
Net Realized and Unrealized Gain (Loss) | | | | | |
on Investments2 | (4.605) | 4.621 | 3.099 | 1.156 | .575 |
Total from Investment Operations | (4.185) | 4.987 | 3.484 | 1.537 | .640 |
Distributions | | | | | |
Dividends from Net Investment Income | (.426) | (.368) | (.389) | (.381) | (.157) |
Distributions from Realized Capital Gains | (.131) | (.273) | (.350) | (.256) | — |
Return of Capital | (.128) | (.076) | (.045) | — | (.023) |
Total Distributions | (.685) | (.717) | (.784) | (.637) | (.180) |
Net Asset Value, End of Period | $13.46 | $18.33 | $14.06 | $11.36 | $10.46 |
| | | | | |
Total Return3 | –23.18% | 36.45% | 31.58% | 14.81% | 6.49% |
| | | | | |
Ratios/Supplemental Data | | | | | |
Net Assets, End of Period (Millions) | $722 | $960 | $571 | $297 | $63 |
Ratio of Total Expenses to | | | | | |
Average Net Assets | 0.09% | 0.10% | 0.10% | 0.13% | 0.15%* |
Ratio of Net Investment Income | | | | | |
to Average Net Assets | 2.63% | 2.38% | 3.02% | 3.52% | 4.19%* |
Portfolio Turnover Rate4 | 13% | 11% | 17% | 13% | 7% |
1 Inception.
2 Includes increases from redemption fees of $0.01, $0.00, $0.00, $0.00, and $0.00.
3 Total returns do not reflect the 1% fee assessed on redemptions of shares held for less than one year.
4 Excludes the value of portfolio securities received or delivered as a result of in-kind purchases or redemptions of the fund’s capital shares, including ETF Creation Units.
23
ETF Shares | | | | |
| | | | Sept. 23, |
| | | | 20041 to |
| Year Ended January 31, | Jan. 31, |
For a Share Outstanding Throughout Each Period | 2008 | 2007 | 2006 | 2005 |
Net Asset Value, Beginning of Period | $83.55 | $64.07 | $51.77 | $49.41 |
Investment Operations | | | | |
Net Investment Income | 1.908 | 1.654 | 1.745 | .665 |
Net Realized and Unrealized Gain (Loss) on Investments2 | (21.037) | 21.080 | 14.116 | 2.965 |
Total from Investment Operations | (19.129) | 22.734 | 15.861 | 3.630 |
Distributions | | | | |
Dividends from Net Investment Income | (1.931) | (1.665) | (1.764) | (.682) |
Distributions from Realized Capital Gains | (.598) | (1.242) | (1.594) | (.588) |
Return of Capital | (.582) | (.347) | (.203) | — |
Total Distributions | (3.111) | (3.254) | (3.561) | (1.270) |
Net Asset Value, End of Period | $61.31 | $83.55 | $64.07 | $51.77 |
| | | | |
Total Return | –23.23% | 36.48% | 31.54% | 7.13% |
| | | | |
Ratios/Supplemental Data | | | | |
Net Assets, End of Period (Millions) | $2,082 | $1,713 | $871 | $198 |
Ratio of Total Expenses to Average Net Assets | 0.10% | 0.12% | 0.12% | 0.18%* |
Ratio of Net Investment Income to Average Net Assets | 2.62% | 2.36% | 3.00% | 3.47%* |
Portfolio Turnover Rate3 | 13% | 11% | 17% | 13% |
1 Inception.
2 Includes increases from redemption fees of $0.04, $0.01, $0.01, and $0.00.
3 Excludes the value of portfolio securities received or delivered as a result of in-kind purchases or redemptions of the fund’s capital shares, including ETF Creation Units.
See accompanying Notes, which are an integral part of the Financial Statements.
24
Notes to Financial Statements
Vanguard REIT Index Fund is registered under the Investment Company Act of 1940 as an open-end investment company, or mutual fund. The fund files reports with the SEC under the company name Vanguard Specialized Funds. The fund offers five classes of shares: Investor Shares, Admiral Shares, Signal Shares, Institutional Shares, and ETF Shares. Investor Shares are available to any investor who meets the fund’s minimum purchase requirements. Admiral Shares are designed for investors who meet certain administrative, service, tenure, and account-size criteria. Signal Shares are designed for institutional investors who meet certain administrative, service, and account-size criteria. Signal Shares were first issued on June 4, 2007. Institutional Shares are designed for investors who meet certain administrative and service criteria and invest a minimum of $5 million. ETF Shares are listed for trading on the American Stock Exchange; they can be purchased and sold through a broker.
A. The following significant accounting policies conform to generally accepted accounting principles for U.S. mutual funds. The fund consistently follows such policies in preparing its financial statements.
1. Security Valuation: Securities are valued as of the close of trading on the New York Stock Exchange (generally 4 p.m., Eastern time) on the valuation date. Equity securities are valued at the latest quoted sales prices or official closing prices taken from the primary market in which each security trades; such securities not traded on the valuation date are valued at the mean of the latest quoted bid and asked prices. Securities for which market quotations are not readily available, or whose values have been materially affected by events occurring before the fund’s pricing time but after the close of the securities’ primary markets, are valued by methods deemed by the board of trustees to represent fair value. Investments in Vanguard Market Liquidity Fund are valued at that fund’s net asset value.
2. Federal Income Taxes: The fund intends to continue to qualify as a regulated investment company and distribute all of its taxable income. Accordingly, no provision for federal income taxes is required in the financial statements.
3. Distributions: Distributions to shareholders are recorded on the ex-dividend date. Quarterly income dividends declared by the fund are reallocated at fiscal year-end to ordinary income, capital gain, and return of capital to reflect their tax character.
4. Security Lending: The fund may lend its securities to qualified institutional borrowers to earn additional income. Security loans are required to be secured at all times by collateral at least equal to the market value of securities loaned. The fund invests cash collateral received in Vanguard Market Liquidity Fund, and records a liability for the return of the collateral, during the period the securities are on loan. Security lending income represents the income earned on investing cash collateral, less expenses associated with the loan.
5. Other: Distributions received from REITs are recorded on the ex-dividend date. Each REIT reports annually the tax character of its distributions. Dividend income, capital gain distributions received and unrealized appreciation (depreciation) reflect the amounts of taxable income, capital gain, and return of capital reported by the REITs, and management’s estimates of such amounts for REIT distributions for which actual information has not been reported. Interest income includes income distributions received from Vanguard Market Liquidity Fund and is accrued daily. Security transactions are accounted for on the date securities are bought or sold. Costs used to determine realized gains (losses) on the sale of investment securities are those of the specific securities sold. Fees assessed on redemptions of capital shares are credited to paid-in capital.
25
Each class of shares has equal rights as to assets and earnings, except that each class separately bears certain class-specific expenses related to maintenance of shareholder accounts (included in Management and Administrative expenses) and shareholder reporting. Marketing and distribution expenses are allocated to each class of shares based on a method approved by the board of trustees. Income, other non-class-specific expenses, and gains and losses on investments are allocated to each class of shares based on its relative net assets.
B. The Vanguard Group furnishes at cost investment advisory, corporate management, administrative, marketing, and distribution services. The costs of such services are allocated to the fund under methods approved by the board of trustees. The fund has committed to provide up to 0.40% of its net assets in capital contributions to Vanguard. At January 31, 2008, the fund had contributed capital of $741,000 to Vanguard (included in Other Assets), representing 0.01% of the fund’s net assets and 0.74% of Vanguard’s capitalization. The fund’s trustees and officers are also directors and officers of Vanguard.
C. Distributions are determined on a tax basis and may differ from net investment income and realized capital gains for financial reporting purposes. Differences may be permanent or temporary. Permanent differences are reclassified among capital accounts in the financial statements to reflect their tax character. Temporary differences arise when certain items of income, expense, gain, or loss are recognized in different periods for financial statement and tax purposes; these differences will reverse at some time in the future. Differences in classification may also result from the treatment of short-term gains as ordinary income for tax purposes.
During the year ended January 31, 2008, the fund realized $673,393,000 of net capital gains resulting from in-kind redemptions—in which shareholders exchanged fund shares for securities held by the fund rather than for cash. Because such gains are not taxable to the fund, and are not distributed to shareholders, they have been reclassified from accumulated net realized gains to paid-in capital.
For tax purposes, at January 31, 2008, the fund had no ordinary income and no long-term capital gains available for distribution.
At January 31, 2008, the cost of investment securities for tax purposes was $8,104,241,000. Net unrealized appreciation of investment securities for tax purposes was $1,115,000,000, consisting of unrealized gains of $1,513,826,000 on securities that had risen in value since their purchase and $398,826,000 in unrealized losses on securities that had fallen in value since their purchase.
D. During the year ended January 31, 2008, the fund purchased $3,788,012,000 of investment securities and sold $4,148,427,000 of investment securities other than temporary cash investments.
E. The market value of securities on loan to broker-dealers at January 31, 2008, was $133,796,000, for which the fund received cash collateral of $135,620,000.
26
F. Capital share transactions for each class of shares were:
| | | Year Ended January 31, |
| | 2008 | | 2007 |
| Amount | Shares | Amount | Shares |
| ($000) | (000) | ($000) | (000) |
Investor Shares | | | | |
Issued | 1,399,642 | 56,790 | 1,731,399 | 72,687 |
Issued in Lieu of Cash Distributions | 206,766 | 8,999 | 224,270 | 9,464 |
Redeemed1 | (2,697,993) | (113,122) | (1,359,296) | (58,310) |
Net Increase (Decrease)—Investor Shares | (1,091,585) | (47,333) | 596,373 | 23,841 |
Admiral Shares | | | | |
Issued | 767,550 | 7,020 | 1,081,669 | 10,634 |
Issued in Lieu of Cash Distributions | 93,775 | 948 | 99,808 | 984 |
Redeemed1 | (1,765,151) | (16,977) | (530,712) | (5,288) |
Net Increase (Decrease)—Admiral Shares | (903,826) | (9,009) | 650,765 | 6,330 |
Signal Shares | | | | |
Issued | 744,428 | 26,756 | — | — |
Issued in Lieu of Cash Distributions | 8,094 | 346 | — | — |
Redeemed1 | (94,898) | (3,926) | — | — |
Net Increase (Decrease)—Signal Shares | 657,624 | 23,176 | — | — |
Institutional Shares | | | | |
Issued | 353,251 | 22,005 | 286,029 | 18,678 |
Issued in Lieu of Cash Distributions | 33,538 | 2,226 | 29,962 | 1,909 |
Redeemed1 | (367,874) | (22,969) | (133,528) | (8,807) |
Net Increase (Decrease)—Institutional Shares | 18,915 | 1,262 | 182,463 | 11,780 |
ETF Shares | | | | |
Issued | 2,480,141 | 33,552 | 1,432,154 | 20,104 |
Issued in Lieu of Cash Distributions | — | — | — | — |
Redeemed1 | (1,591,724) | (20,100) | (960,330) | (13,200) |
Net Increase (Decrease)—ETF Shares | 888,417 | 13,452 | 471,824 | 6,904 |
G. In June 2006, the Financial Accounting Standards Board issued Interpretation No. 48 (“FIN 48”), “Accounting for Uncertainty in Income Taxes.” FIN 48 establishes the minimum threshold for recognizing, and a system for measuring, the benefits of tax-return positions in financial statements, effective for the fund’s current fiscal year. Management has analyzed the fund’s tax positions taken on federal income tax returns for all open tax years (tax years ended January 31, 2005–2008) for purposes of implementing FIN 48, and has concluded that no provision for income tax is required in the fund��s financial statements.
1 Net of redemption fees of $7,614,000 and $1,769,000 (fund totals).
27
Report of Independent Registered Public Accounting Firm
To the Trustees of Vanguard Specialized Funds and the Shareholders of Vanguard REIT Index Fund:
In our opinion, the accompanying statement of net assets and the related statements of operations and of changes in net assets and the financial highlights present fairly, in all material respects, the financial position of Vanguard REIT Index Fund (constituting a separate portfolio of Vanguard Specialized Funds, hereafter referred to as the “Fund”) at January 31, 2008, the results of its operations for the year then ended, the changes in its net assets for each of the two years in the period then ended and the financial highlights for each of the periods indicated, in conformity with accounting principles generally accepted in the United States of America. These financial statements and financial highlights (hereafter referred to as “financial statements”) are the responsibility of the Fund’s management; our responsibility is to express an opinion on these financial statements based on our audits. We conducted our audits of these financial statements in accordance with the standards of the Public Company Accounting Oversight Board (United States). Those standards require that we plan and perform the audit to obtain reasonable assurance about whether the financial statements are free of material misstatement. An audit includes examining, on a test basis, evidence supporting the amounts and disclosures in the financial statements, assessing the accounting principles used and significant estimates made by management, and evaluating the overall financial statement presentation. We believe that our audits, which included confirmation of securities at January 31, 2008 by correspondence with the custodian and by agreement to the underlying ownership records for Vanguard Market Liquidity Fund, provide a reasonable basis for our opinion.
PricewaterhouseCoopers LLP
Philadelphia, Pennsylvania
March 12, 2008
Special 2007 tax information (unaudited) for Vanguard REIT Index Fund
This information for the fiscal year ended January 31, 2008, is included pursuant to provisions of the Internal Revenue Code.
The fund distributed $88,240,000 as capital gain dividends (from net long-term capital gains) to shareholders during the fiscal year. The fund designates $80,530,000 of its capital gain dividends as a 15% rate gain distribution and $7,710,000 as a 25% rate gain distribution.
The fund distributed $5,214,000 of qualified dividend income to shareholders during the fiscal year.
28
Your Fund’s After-Tax Returns
This table presents returns for your fund both before and after taxes. The after-tax returns are shown in two ways: (1) assuming that an investor owned the fund during the entire period and paid taxes on the fund’s distributions, and (2) assuming that an investor paid taxes on the fund’s distributions and sold all shares at the end of each period.
Calculations are based on the highest individual federal income tax and capital gains tax rates in effect at the times of the distributions and the hypothetical sales. State and local taxes were not considered. After-tax returns reflect any qualified dividend income, using actual prior-year figures and estimates for 2008. (In the example, returns after the sale of fund shares may be higher than those assuming no sale. This occurs when the sale would have produced a capital loss. The calculation assumes that the investor received a tax deduction for the loss.)
The table shows returns for Investor Shares only; returns for other share classes will differ. Please note that your actual after-tax returns will depend on your tax situation and may differ from those shown. Also note that if you own the fund in a tax-deferred account, such as an individual retirement account or a 401(k) plan, this information does not apply to you. Such accounts are not subject to current taxes.
Finally, keep in mind that a fund’s performance—whether before or after taxes—does not guarantee future results.
Average Annual Total Returns: REIT Index Fund Investor Shares1 |
Periods Ended January 31, 2008 | | | |
| One | Five | Ten |
| Year | Years | Years |
Returns Before Taxes | –23.28% | 18.06% | 10.33% |
Returns After Taxes on Distributions | –24.10 | 16.39 | 8.33 |
Returns After Taxes on Distributions and Sale of Fund Shares | –14.93 | 14.99 | 7.77 |
1 Total returns do not reflect the 1% fee assessed on redemptions of shares held for less than one year, nor do they include the account service fee that may apply to certain accounts with balances below $10,000.
29
About Your Fund’s Expenses
As a shareholder of the fund, you incur ongoing costs, which include costs for portfolio management, administrative services, and shareholder reports (like this one), among others. Operating expenses, which are deducted from a fund’s gross income, directly reduce the investment return of the fund.
A fund’s expenses are expressed as a percentage of its average net assets. This figure is known as the expense ratio. The following examples are intended to help you understand the ongoing costs (in dollars) of investing in your fund and to compare these costs with those of other mutual funds. The examples are based on an investment of $1,000 made at the beginning of the period shown and held for the entire period.
The table on page 28 illustrates your fund’s costs in two ways:
• Based on actual fund return. This section helps you to estimate the actual expenses that you paid over the period. The “Ending Account Value” shown is derived from the fund’s actual return, and the third column shows the dollar amount that would have been paid by an investor who started with $1,000 in the fund. You may use the information here, together with the amount you invested, to estimate the expenses that you paid over the period.
To do so, simply divide your account value by $1,000 (for example, an $8,600 account value divided by $1,000 = 8.6), then multiply the result by the number given for your fund under the heading “Expenses Paid During Period.”
• Based on hypothetical 5% yearly return. This section is intended to help you compare your fund’s costs with those of other mutual funds. It assumes that the fund had a yearly return of 5% before expenses, but that the expense ratio is unchanged. In this case—because the return used is not the fund’s actual return—the results do not apply to your investment. The example is useful in making comparisons because the Securities and Exchange Commission requires all mutual funds to calculate expenses based on a 5% return. You can assess your fund’s costs by comparing this hypothetical example with the hypothetical examples that appear in shareholder reports of other funds.
Note that the expenses shown in the table are meant to highlight and help you compare ongoing costs only and do not reflect transaction costs incurred by the fund for buying and selling securities. Further, the expenses do not include the 1% fee on redemptions of shares held for less than one year, nor do they include the account service fee described in the prospectus. If such fees were applied to your account, your costs would be higher. Your fund does not carry a “sales load.”
The calculations assume no shares were bought or sold during the period. Your actual costs may have been higher or lower, depending on the amount of your investment and the timing of any purchases or redemptions.
You can find more information about the fund’s expenses, including annual expense ratios, in the Financial Statements section of this report. For additional information on operating expenses and other shareholder costs, please refer to your fund’s current prospectus.
30
Six Months Ended January 31, 2008 | | | |
| Beginning | Ending | Expenses |
| Account Value | Account Value | Paid During |
REIT Index Fund | 7/31/2007 | 1/31/2008 | Period1 |
Based on Actual Fund Return | | | |
Investor Shares | $1,000.00 | $963.66 | $0.99 |
Admiral Shares | 1,000.00 | 963.76 | 0.49 |
Signal Shares | 1,000.00 | 963.99 | 0.50 |
Institutional Shares | 1,000.00 | 964.20 | 0.45 |
ETF Shares | 1,000.00 | 963.76 | 0.45 |
Based on Hypothetical 5% Yearly Return | | | |
Investor Shares | $1,000.00 | $1,024.20 | $1.02 |
Admiral Shares | 1,000.00 | 1,024.70 | 0.51 |
Signal Shares | 1,000.00 | 1,024.70 | 0.51 |
Institutional Shares | 1,000.00 | 1,024.75 | 0.46 |
ETF Shares | 1,000.00 | 1,024.75 | 0.46 |
1 These calculations are based on expenses incurred in the most recent six-month period. The fund’s annualized six-month expense ratios for that period are 0.20% for Investor Shares, 0.10% for Admiral Shares, 0.10% for Signal Shares, 0.09% for Institutional Shares, and 0.09% for ETF Shares. The dollar amounts shown as “Expenses Paid” are equal to the annualized expense ratio multiplied by the average account value over the period, multiplied by the number of days in the most recent six-month period, then divided by the number of days in the most recent 12-month period.
31
Glossary
Beta. A measure of the magnitude of a fund’s past share-price fluctuations in relation to the ups and downs of a given market index. The index is assigned a beta of 1.00. Compared with a given index, a fund with a beta of 1.20 typically would have seen its share price rise or fall by 12% when the index rose or fell by 10%. For this report, beta is based on returns over the past 36 months for both the fund and the index. Note that a fund’s beta should be reviewed in conjunction with its R-squared (see definition below). The lower the R-squared, the less correlation there is between the fund and the index, and the less reliable beta is as an indicator of volatility.
Earnings Growth Rate. The average annual rate of growth in earnings over the past five years for the stocks now in a fund.
Expense Ratio. The percentage of a fund’s average net assets used to pay its annual administrative and advisory expenses. These expenses directly reduce returns to investors.
Foreign Holdings. The percentage of a fund represented by stocks or depositary receipts of companies based outside the United States.
Inception Date. The date on which the assets of a fund (or one of its share classes) are first invested in accordance with the fund’s investment objective. For funds with a subscription period, the inception date is the day after that period ends. Investment performance is measured from the inception date.
Median Market Cap. An indicator of the size of companies in which a fund invests; the midpoint of market capitalization (market price x shares outstanding) of a fund’s stocks, weighted by the proportion of the fund’s assets invested in each stock. Stocks representing half of the fund’s assets have market capitalizations above the median, and the rest are below it.
Price/Book Ratio. The share price of a stock divided by its net worth, or book value, per share. For a fund, the weighted average price/book ratio of the stocks it holds.
Price/Earnings Ratio. The ratio of a stock’s current price to its per-share earnings over the past year. For a fund, the weighted average P/E of the stocks it holds. P/E is an indicator of market expectations about corporate prospects; the higher the P/E, the greater the expectations for a company’s future growth.
R-Squared. A measure of how much of a fund’s past returns can be explained by the returns from the market in general, as measured by a given index. If a fund’s total returns were precisely synchronized with an index’s returns, its R-squared would be 1.00. If the fund’s returns bore no relationship to the index’s returns, its R-squared would be 0. For this report, R-squared is based on returns over the past 36 months for both the fund and the index.
Return on Equity. The annual average rate of return generated by a company during the past five years for each dollar of shareholder’s equity (net income divided by shareholder’s equity). For a fund, the weighted average return on equity for the companies whose stocks it holds.
Short-Term Reserves. The percentage of a fund invested in highly liquid, short-term securities that can be readily converted to cash.
Turnover Rate. An indication of the fund’s trading activity. Funds with high turnover rates incur higher transaction costs and may be more likely to distribute capital gains (which may be taxable to investors). The turnover rate excludes in-kind transactions, which have minimal impact on costs.
Yield. A snapshot of the level of dividends, interest, capital gains distributions, and return-of-capital distributions received by the fund. The index yield is based on the current annualized rate of dividends and other distributions provided by securities in the index.
32
This page intentionally left blank.
This page intentionally left blank.
The People Who Govern Your Fund
The trustees of your mutual fund are there to see that the fund is operated and managed in your best interests since, as a shareholder, you are a part owner of the fund. Your fund’s trustees also serve on the board of directors of The Vanguard Group, Inc., which is owned by the Vanguard funds and provides services to them on an at-cost basis.
A majority of Vanguard’s board members are independent, meaning that they have no affiliation with Vanguard or the funds they oversee, apart from the sizable personal investments they have made as private individuals.
Our independent board members bring distinguished backgrounds in business, academia, and public service to their task of working with Vanguard officers to establish the policies and oversee the activities of the funds. Among board members’ responsibilities are selecting investment advisors for the funds; monitoring fund operations, performance, and costs; reviewing contracts; nominating and selecting new trustees/directors; and electing Vanguard officers.
Each trustee serves a fund until its termination; or until the trustee’s retirement, resignation, or death; or otherwise as specified in the fund’s organizational documents. Any trustee may be removed at a shareholders’ meeting by a vote representing two-thirds of the net asset value of all shares of the fund together with shares of other Vanguard funds organized within the same trust. The table on these two pages shows information for each trustee and executive officer of the fund. The mailing address of the trustees and officers is P.O. Box 876, Valley Forge, PA 19482.
Chairman of the Board, Chief Executive Officer, and Trustee |
| |
John J. Brennan1 | |
Born 1954 | Principal Occupation(s) During the Past Five Years: Chairman of the Board, Chief Executive |
Trustee since May 1987; | Officer, and Director/Trustee of The Vanguard Group, Inc., and of each of the investment |
Chairman of the Board and | companies served by The Vanguard Group. |
Chief Executive Officer | |
152 Vanguard Funds Overseen | |
| |
Independent Trustees | |
| |
Charles D. Ellis | |
Born 1937 | Principal Occupation(s) During the Past Five Years: Applecore Partners (pro bono ventures |
Trustee since January 2001 | in education); Senior Advisor to Greenwich Associates (international business strategy |
152 Vanguard Funds Overseen | consulting); Successor Trustee of Yale University; Overseer of the Stern School of Business |
| at New York University; Trustee of the Whitehead Institute for Biomedical Research. |
| |
Emerson U. Fullwood | |
Born 1948 | Principal Occupation(s) During the Past Five Years: Executive Chief Staff and Marketing |
Trustee since January 2008 | Officer for North America since 2004 and Corporate Vice President of Xerox Corporation |
152 Vanguard Funds Overseen | (photocopiers and printers); Director of SPX Corporation (multi-industry manufacturing), |
| of the United Way of Rochester, and of the Boy Scouts of America. |
| |
Rajiv L. Gupta | |
Born 1945 | Principal Occupation(s) During the Past Five Years: Chairman, President, and |
Trustee since December 20012 | Chief Executive Officer of Rohm and Haas Co. (chemicals); Board Member of |
152 Vanguard Funds Overseen | the American Chemistry Council; Director of Tyco International, Ltd. (diversified |
| manufacturing and services) since 2005. |
Amy Gutmann | |
Born 1949 | Principal Occupation(s) During the Past Five Years: President of the University of |
Trustee since June 2006 | Pennsylvania since 2004; Professor in the School of Arts and Sciences, Annenberg School |
152 Vanguard Funds Overseen | for Communication, and Graduate School of Education of the University of Pennsylvania |
| since 2004; Provost (2001–2004) and Laurance S. Rockefeller Professor of Politics and |
| the University Center for Human Values (1990–2004), Princeton University; Director of |
| Carnegie Corporation of New York since 2005 and of Schuylkill River Development |
| Corporation and Greater Philadelphia Chamber of Commerce since 2004. |
| |
JoAnn Heffernan Heisen | |
Born 1950 | Principal Occupation(s) During the Past Five Years: Corporate Vice President and |
Trustee since July 1998 | Chief Global Diversity Officer since 2006, Vice President and Chief Information |
152 Vanguard Funds Overseen | Officer (1997–2005), and Member of the Executive Committee of Johnson & |
| Johnson (pharmaceuticals/consumer products); Director of the University Medical |
| Center at Princeton and Women’s Research and Education Institute. |
| |
André F. Perold | |
Born 1952 | Principal Occupation(s) During the Past Five Years: George Gund Professor of Finance |
Trustee since December 2004 | and Banking, Harvard Business School; Senior Associate Dean, Director of Faculty |
152 Vanguard Funds Overseen | Recruiting, and Chair of Finance Faculty, Harvard Business School; Director and Chairman |
| of UNX, Inc. (equities trading firm) since 2003; Chair of the Investment Committee of |
| HighVista Strategies LLC (private investment firm) since 2005. |
| |
Alfred M. Rankin, Jr. | |
Born 1941 | Principal Occupation(s) During the Past Five Years: Chairman, President, Chief Executive |
Trustee since January 1993 | Officer, and Director of NACCO Industries, Inc. (forklift trucks/housewares/lignite); Director |
152 Vanguard Funds Overseen | of Goodrich Corporation (industrial products/aircraft systems and services). |
| |
| |
J. Lawrence Wilson | |
Born 1936 | Principal Occupation(s) During the Past Five Years: Retired Chairman and Chief Executive |
Trustee since April 1985 | Officer of Rohm and Haas Co. (chemicals); Director of Cummins Inc. (diesel engines) and |
152 Vanguard Funds Overseen | AmerisourceBergen Corp. (pharmaceutical distribution); Trustee of Vanderbilt University |
| and of Culver Educational Foundation. |
| |
Executive Officers1 | |
| |
Thomas J. Higgins | |
Born 1957 | Principal Occupation(s) During the Past Five Years: Principal of The Vanguard Group, Inc.; |
Treasurer since July 1998 | Treasurer of each of the investment companies served by The Vanguard Group. |
152 Vanguard Funds Overseen | |
| |
| |
Heidi Stam | |
Born 1956 | Principal Occupation(s) During the Past Five Years: Managing Director of The Vanguard |
Secretary since July 2005 | Group, Inc., since 2006; General Counsel of The Vanguard Group since 2005; Secretary of |
152 Vanguard Funds Overseen | The Vanguard Group, and of each of the investment companies served by The Vanguard |
| Group, since 2005; Principal of The Vanguard Group (1997–2006). |
Vanguard Senior Management Team | | |
| | | |
R. Gregory Barton | Kathleen C. Gubanich | F. William McNabb III | Ralph K. Packard |
Mortimer J. Buckley | Paul A. Heller | Michael S. Miller | George U. Sauter |
Founder |
|
John C. Bogle |
Chairman and Chief Executive Officer, 1974–1996 |
1 Officers of the funds are “interested persons” as defined in the Investment Company Act of 1940.
2 December 2002 for Vanguard Equity Income Fund, Vanguard Growth Equity Fund, the Vanguard Municipal Bond Funds, and the Vanguard State Tax-Exempt Funds.
More information about the trustees is in the Statement of Additional Information, available from The Vanguard Group.
| 
|
| P.O. Box 2600 |
| Valley Forge, PA 19482-2600 |
Connect with Vanguard® > www.vanguard.com
Fund Information > 800-662-7447 | Vanguard, Admiral, Signal, Connect with Vanguard, and |
| the ship logo are trademarks of The Vanguard Group, Inc. |
Direct Investor Account Services > 800-662-2739 | |
| |
Institutional Investor Services > 800-523-1036 | All other marks are the exclusive property of their |
| respective owners. |
Text Telephone for People | |
With Hearing Impairment > 800-952-3335 | |
| All comparative mutual fund data are from Lipper Inc. |
| or Morningstar, Inc., unless otherwise noted. |
| |
| |
| You can obtain a free copy of Vanguard’s proxy voting |
This material may be used in conjunction | guidelines by visiting our website, www.vanguard.com, |
with the offering of shares of any Vanguard | and searching for “proxy voting guidelines,” or by |
fund only if preceded or accompanied by | calling Vanguard at 800-662-2739. The guidelines are |
the fund’s current prospectus. | also available from the SEC’s website, www.sec.gov. |
| In addition, you may obtain a free report on how your |
| fund voted the proxies for securities it owned during |
The funds or securities referred to herein are not | the 12 months ended June 30. To get the report, visit |
sponsored, endorsed, or promoted by MSCI, and | either www.vanguard.com or www.sec.gov. |
MSCI bears no liability with respect to any such funds | |
or securities. For any such funds or securities, the | |
prospectus or the Statement of Additional Information | You can review and copy information about your fund |
contains a more detailed description of the limited | at the SEC’s Public Reference Room in Washington, D.C. |
relationship MSCI has with The Vanguard Group and | To find out more about this public service, call the SEC |
any related funds. | at 202-551-8090. Information about your fund is also |
| available on the SEC’s website, and you can receive |
| copies of this information, for a fee, by sending a |
| request in either of two ways: via e-mail addressed to |
| publicinfo@sec.gov or via regular mail addressed to the |
| Public Reference Section, Securities and Exchange |
| Commission, Washington, DC 20549-0102. |
| |
| |
| |
| |
| |
| © 2008 The Vanguard Group, Inc. |
| All rights reserved. |
| Vanguard Marketing Corporation, Distributor. |
| |
| Q1230 032008 |
> | For the fiscal year ended January 31, 2008, Vanguard Dividend Growth Fund’s dividend income offset share price declines, producing a 12-month return of 0.0%. |
> | This unusual result was lackluster on an absolute basis, but a strong performance relative to that of the fund’s benchmark index and the average return of its peer group. |
> | The fund’s bright spots included its energy and industrials holdings, as well as its decision to limit exposure to financial stocks. The health care sector was a notable weak spot. |
Contents | |
| |
Your Fund’s Total Returns | 1 |
Chairman’s Letter | 2 |
Advisor’s Report | 7 |
Fund Profile | 8 |
Performance Summary | 9 |
Financial Statements | 11 |
Your Fund’s After-Tax Returns | 20 |
About Your Fund’s Expenses | 21 |
Glossary | 23 |
Please note: The opinions expressed in this report are just that—informed opinions. They should not be considered promises or advice. Also, please keep in mind that the information and opinions cover the period through the date on the cover of this report. Of course, the risks of investing in your fund are spelled out in the prospectus.
Your Fund’s Total Returns
Fiscal Year Ended January 31, 2008 | | |
| Ticker | Total |
| Symbol | Returns |
Vanguard Dividend Growth Fund | VDIGX | 0.0% |
Russell 1000 Index | | –2.4 |
Average Large-Cap Core Fund1 | | –2.7 |
Your Fund’s Performance at a Glance | | | | |
January 31, 2007–January 31, 2008 | | | | |
| | | Distributions Per Share |
| Starting | Ending | Income | Capital |
| Share Price | Share Price | Dividends | Gains |
Vanguard Dividend Growth Fund | $14.74 | $14.38 | $0.280 | $0.100 |
1 Derived from data provided by Lipper Inc.
1

Chairman’s Letter
Dear Shareholder,
Vanguard Dividend Growth Fund finished the fiscal year ended January 31, 2008, with a return of 0.0%, as a modest decline in the fund’s share price was offset by dividend income returns. Over the full 12 months, the fund’s dividend distributions increased by 7.7% from a year earlier.
The fund’s unusual result was weak on an absolute basis, but a strong performance relative to that of its benchmark index and the average return of its peer group. The fund outpaced the –2.7% average return of large-cap core funds and the –2.4% return of the Russell 1000 Index, the fund’s primary unmanaged benchmark.
The fund held its own in a challenging market, with strong stock selections in the energy and industrials sectors.
If you own your fund in a taxable account, you may wish to see page 20 for a report on the fund’s after-tax returns.
Stocks gained in the first half but faltered in the second
The broad U.S. stock market returned –2.7% for the 12 months ended January 31, reflecting a volatile year punctuated by sharp declines for equities. Gains in the first half of the fiscal period were largely relinquished in midsummer and fall as repercussions from the subprime mortgage debacle began to be felt in the broader
2
U.S. economy. The stock market’s retreat accelerated in January amid tightening global credit markets, a weakening U.S. dollar, and widening fears of a U.S. recession.
Large-capitalization stocks fared best in these unsettled conditions, outperforming small-caps for the year; meanwhile, growth stocks outpaced their value-oriented counterparts.
International stocks outperformed U.S. stocks for the sixth straight year, largely owing to exchange-rate gains produced by the weak U.S. dollar. Emerging markets and developed economies in Europe and Asia posted strong performances earlier in the fiscal year, but slumped after November as a result of increased concern about a U.S.-led downturn.
Bond returns grew stronger as Fed lowered rates
During the first half of the fiscal year, a stronger U.S. economy made investors more willing to take on risk to earn higher yields; spreads thus narrowed between the yields of U.S. Treasury securities and those of lower-quality issues. But as the subprime lending problems unraveled further in summer, investors flocked to higher-quality government and corporate bonds. This drove Treasury prices higher and yields lower, widening the spread between Treasury yields and those of riskier bonds.
The Federal Reserve Board responded to the credit market turmoil and deteriorating economic outlook with aggressive reductions in its target for the federal funds rate. The Fed cut the rate
Market Barometer | |
| Average Annual Total Returns |
| Periods Ended January 31, 2008 |
| One Year | Three Years | Five Years |
Stocks | | | |
Russell 1000 Index (Large-caps) | –2.4% | 7.8% | 12.6% |
Russell 2000 Index (Small-caps) | –9.8 | 5.8 | 15.3 |
Dow Jones Wilshire 5000 Index (Entire market) | –2.7 | 7.9 | 13.2 |
MSCI All Country World Index ex USA (International) | 5.4 | 17.0 | 22.9 |
| | | |
Bonds | | | |
Lehman U.S. Aggregate Bond Index (Broad taxable market) | 8.8% | 4.9% | 4.8% |
Lehman Municipal Bond Index | 4.9 | 4.0 | 4.6 |
Citigroup 3-Month Treasury Bill Index | 4.6 | 4.2 | 3.0 |
| | | |
CPI | | | |
Consumer Price Index | 4.3% | 3.4% | 3.0% |
3
five times during the fiscal year (twice in January), ending the period at 3.0%, the lowest rate since May 2005.
Lower interest rates depressed bond yields, but pushed prices higher. The broad taxable bond market returned 8.8% for the fiscal year. Tax-exempt municipal bonds returned 4.9%.
The fund limited its exposure to the market’s weakest performers
The Dividend Growth Fund seeks to invest in large, high-quality companies that, in the judgment of fund manager Wellington Management Company, boast the cash flow and earnings prospects to pay out—and ultimately increase—dividends to shareholders. This strategy proved successful over the fiscal year. Each of the companies represented in the fund declared a dividend, and about 80% of the firms boosted dividends by 10% or more.
McDonald’s increased its dividend by 50%, the highest rate of any company in the fund. The fast food giant benefited from a new corporate strategy focused on investing in existing stores, improving menus, and slowing the growth of new stores. Overall, the Dividend Growth Fund’s dividends increased to $0.28 per share, up from $0.26 per share in the previous fiscal year.
The fund experienced gains in seven of the market’s ten sectors. Energy led the way as ExxonMobil and Chevron—
Expense Ratios1 | | |
Your fund compared with its peer group | | |
| | Average |
| | Large-Cap |
| Fund | Core Fund |
Dividend Growth Fund | 0.32% | 1.29% |
Total Returns | |
Ten Years Ended January 31, 2008 | |
| Average |
| Annual Return |
Dividend Growth Fund | 4.6% |
Dividend Growth Spliced Index | 3.7 |
Dividend Growth Spliced Average2 | 2.8 |
The figures shown represent past performance, which is not a guarantee of future results. (Current performance may be lower or higher than the performance data cited. For performance data current to the most recent month-end, visit our website at www.vanguard.com/performance.) Note, too, that both investment returns and principal value can fluctuate widely, so an investor’s shares, when sold, could be worth more or less than their original cost.
1 Fund expense ratio reflects the 12 months ended January 31, 2008. Peer-group expense ratio is derived from data provided by Lipper Inc. and captures information through year-end 2007.
2 Derived from data provided by Lipper Inc.
Note: The footnotes on page 9 describe the composition of the spliced index and peer-group average.
4
which are among the fund’s top ten holdings—profited from soaring oil prices during the fiscal year. Firms in the industrials sector, such as Honeywell International, a diversified technology and manufacturing company, were the second-highest contributors to the fund’s gains, followed by companies selling consumer staples, such as Wal-Mart Stores and Coca-Cola.
As was the case in the stock market in general, financials, health care, and consumer discretionary stocks were among the fund’s weaker performers. The fund moderated its exposure to financials by selling or reducing its stakes in companies such as Countrywide Financial and Citigroup.
In health care, by contrast, the Dividend Growth Fund held relatively large positions in some of the sector’s weaker performers, notably large multinational pharmaceutical companies. All of the health care holdings in the fund declined during the fiscal year, with the exception of Abbot Laboratories. AstraZeneca and Schering-Plough had the steepest declines, with returns of –22% and –21%, respectively. The sector was hammered by a combination of patent delays, a tough regulatory environment, and competition from generic drugmakers.
For more details about the fund’s positioning and performance during the fiscal year, see the Advisor’s Report on page 7.
Long-term performance reflects a change in strategy
The Dividend Growth Fund has transformed its mandate and strategy over the past ten years. Launched in 1992 as Vanguard Utilities Income Fund, the fund changed its name in 2002 to reflect a new investment objective.
Since then, the fund’s strategy has been to select a relatively small, diversified pool of stocks—there were 52 stocks in the portfolio at the end of fiscal year 2008—that have the potential to increase their dividends over time. In the best circumstances, the strategy can help investors secure a growing stream of income, even as the portfolio’s selection of high-quality companies appreciates in value.
The skillful portfolio management of Wellington Management Company has helped the fund meet its objective. Since December 2002, the Dividend Growth Fund has produced an annualized return of 12.4%, slightly more than its benchmark’s 11.8% return, and well ahead of the 9.6% average return of its peer group. One component of this strong performance has been steadily rising dividend distributions during that period.
The long-term performance table on page 4 compares the fund’s ten-year results with those of spliced measures of its former and present benchmarks and peer averages. The fund’s change in strategy in 2002, however, makes the information less meaningful than it is for other funds.
5
Still, what has not changed over the ten years has been the fund’s commitment to keep expenses low, providing you with significant cost savings.
It’s important to stay calm in volatile markets
The new year began on an anxious note. Recent volatility in the stock market, the shakeup in large financial institutions, and pundits’ chatter about the probability of a U.S. recession can create a potentially counterproductive sense of urgency among investors.
At Vanguard, our advice always is to avoid rash investment decisions based on current events. Much of what seems critically important in the moment ultimately amounts to little more than noise. That’s why we counsel investors to instead focus on long-term goals, by carefully developing an investment plan based on a diversified portfolio made up of a broad selection of stocks, bonds, and short-term investments.
We believe that the Dividend Growth Fund, with its low-cost advantage and its focus on established companies with the potential to increase dividends, can be a valuable part of a diversified portfolio designed to help you reach your financial goals.
As I close this report to you, it’s my pleasure to introduce the fund’s new president, F. William McNabb III. Bill’s a man of great character and integrity who is intimately familiar with all aspects of Vanguard—from how we serve our clients to how we invest for our clients.
Bill and I have worked together very closely for more than two decades. I’m thrilled that the fund’s board elected him president, effective March 1, and designated him as my successor as chief executive officer, a role he’ll assume within a year, after an orderly transition. Bill and the rest of our team will serve you and our other clients extremely well in the years ahead.
Thank you for investing your assets at Vanguard.
Sincerely,

John J. Brennan
Chairman and Chief Executive Officer
February 22, 2008
6
Advisor’s Report
Vanguard Dividend Growth Fund returned 0.0% for the 12-month period ended January 31, 2008. This performance compared favorably with the –2.4% decline of the Russell 1000 Index and the –2.7% average return among large-cap core funds.
The investment environment
Nothing has had a greater impact on the global equity markets over the last 12 months than the continued volatility in the financials sector. The problems associated with soft lending standards and lax attitudes toward risk have been exacerbated by aggressive financial engineering. The result has been an unprecedented revaluing of investment portfolios. Amid this volatility, we have remained steadfast in our investment approach by staying focused on companies we think are best positioned to generate long-term dividend growth.
The fund’s successes
The fund’s holdings in industrials, consumer staples, and energy boosted performance during the period. Among the portfolio’s top absolute contributors were ExxonMobil, ConocoPhillips, Nike, McDonald’s, Honeywell, and Emerson Electric.
All the companies held in the portfolio at the close of the fiscal year increased their dividends in 2007. Several holdings increased their dividends more than 30%, including McDonald’s, Staples, Illinois Tool Works, and Paychex. The average dividend increase among the fund’s holdings during 2007 was 18%.
The fund’s shortfalls
A number of stocks detracted from the fund’s performance during the past 12 months; one of the most noteworthy was Automatic Data Processing (ADP). We believe ADP is one of those rare companies that have a deep competitive moat, a network that is difficult to replicate, and expanding global opportunities. However, a combination of softer economic trends and lower interest rates has lowered expectations for the company’s near-term prospects. We remain highly confident in ADP’s long-term prospects for solid dividend growth and strong share price appreciation. It’s worth noting that despite its weak performance during the fund’s fiscal year, ADP still raised its dividend payment by 25%.
The fund’s positioning and investment strategy
Our primary objective is to identify companies that we believe will steadily and reliably increase their dividend payments. We seek to fulfill this objective by carefully building the portfolio one stock at a time, giving central consideration to each company’s dividend growth prospects. Our industry weightings follow from this process: The fund has significant positions in health care, industrials, and both consumer sectors, and less exposure to the utilities, telecommunication services, and materials sectors.
Donald J. Kilbride
Senior Vice President and Portfolio Manager
Wellington Management Company, LLP
February 12, 2008
7
Fund Profile
As of January 31, 2008
Portfolio Characteristics | | |
| | Comparative | Broad |
| Fund | Index1 | Index2 |
Number of Stocks | 52 | 999 | 4,830 |
Median Market Cap | $63.9B | $40.4B | $33.7B |
Price/Earnings Ratio | 14.7x | 16.4x | 17.0x |
Price/Book Ratio | 3.4x | 2.6x | 2.5x |
Yield | 2.0% | 2.0% | 1.9% |
Return on Equity | 23.7% | 19.9% | 19.2% |
Earnings Growth Rate | 19.1% | 20.5% | 20.1% |
Foreign Holdings | 8.1% | 0.0% | 0.0% |
Turnover Rate | 35.8% | — | — |
Expense Ratio | 0.32% | — | — |
Short-Term Reserves | 2.4% | — | — |
Sector Diversification (% of equity exposure) |
| | Comparative | Broad |
| Fund | Index1 | Index2 |
Consumer Discretionary | 10.9% | 9.6% | 9.7% |
Consumer Staples | 17.4 | 9.7 | 9.0 |
Energy | 12.6 | 11.9 | 11.7 |
Financials | 9.2 | 18.4 | 19.3 |
Health Care | 15.6 | 12.0 | 12.1 |
Industrials | 16.8 | 12.0 | 11.8 |
Information Technology | 13.2 | 15.4 | 15.5 |
Materials | 1.7 | 3.8 | 3.9 |
Telecommunication Services | 2.6 | 3.3 | 3.2 |
Utilities | 0.0 | 3.9 | 3.8 |
Volatility Measures3 | |
| Fund Versus | Fund Versus |
| Comparative Index1 | Broad Index2 |
R-Squared | 0.89 | 0.84 |
Beta | 0.81 | 0.75 |
8
Ten Largest Holdings4 (% of total net assets) |
| | |
ExxonMobil Corp. | integrated oil and gas | 3.5% |
Automatic Data Processing, Inc. | data processing and outsourced services | 3.1 |
Total SA ADR | integrated oil and gas | 2.9 |
Staples, Inc. | specialty stores | 2.8 |
Wal-Mart Stores, Inc. | hypermarkets and super centers | 2.7 |
PepsiCo, Inc. | soft drinks | 2.6 |
Chevron Corp. | integrated oil and gas | 2.6 |
Medtronic, Inc. | health care equipment | 2.5 |
AT&T Inc. | integrated telecommunication services | 2.5 |
The Procter &Gamble Co. | household products | 2.5 |
Top Ten | | 27.7% |
Investment Focus
1 Russell 1000 Index.
2 Dow Jones Wilshire 5000 Index.
3 For an explanation of R-squared, beta, and other terms used here, see the Glossary on pages 23–24.
4 “Ten Largest Holdings” excludes any temporary cash investments and equity index products.
9
Performance Summary
All of the returns in this report represent past performance, which is not a guarantee of future results that may be achieved by the fund. (Current performance may be lower or higher than the performance data cited. For performance data current to the most recent month-end, visit our website at www.vanguard.com/performance.) Note, too, that both investment returns and principal value can fluctuate widely, so an investor’s shares, when sold, could be worth more or less than their original cost. The returns shown do not reflect taxes that a shareholder would pay on fund distributions or on the sale of fund shares.
Cumulative Performance: January 31, 1998–January 31, 2008
Initial Investment of $10,000
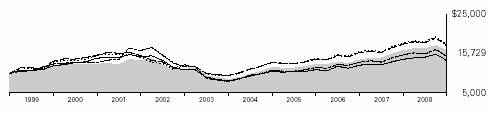
| Average Annual Total Returns | Final Value |
| Periods Ended January 31, 2008 | of a $10,000 |
| One Year | Five Years | Ten Years | Investment |
Dividend Growth Fund1 | –0.01% | 13.39% | 4.63% | $15,729 |
Dow Jones Wilshire 5000 Index | –2.70 | 13.21 | 5.61 | 17,266 |
Russell 1000 Index | –2.45 | 12.59 | 5.46 | 17,023 |
Dividend Growth Spliced Index2 | –2.45 | 12.59 | 3.67 | 14,346 |
Dividend Growth Spliced Average3 | –2.65 | 10.39 | 2.81 | 13,199 |
1 Prior to December 6, 2002, the fund was known as the Utilities Income Fund. Total returns do not include the account service fee that may be applicable to certain accounts with balances below $10,000.
2 Prior to December 6, 2002, the comparative benchmark was known as the Utilities Composite Index. The index weightings have been: 40% S&P Utilities Index, 40% S&P Telephone Index, and 20% Lehman Utility Bond Index through April 30, 1999; 63.75% S&P Utilities Index, 21.25% S&P Telephone Index, and 15% Lehman Utility Bond Index through March 31, 2000; 75% S&P Utilities Index, 25% S&P Telephone Index through December 31, 2001; 75% S&P Utilities Index, 25% S&P Integrated Telecommunication Services Index through December 6, 2002; and Russell 1000 Index thereafter.
3 Based on the average utility fund through December 6, 2002, and the average large-cap core fund thereafter. Derived from data provided by Lipper Inc.
10
Fiscal-Year Total Returns (%): January 31, 1998–January 31, 2008
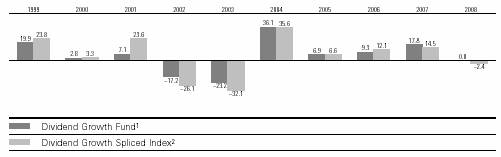
Average Annual Total Returns: Periods Ended December 31, 2007
This table presents average annual total returns through the latest calendar quarter—rather than through the end of the fiscal period. Securities and Exchange Commission rules require that we provide this information.
| Inception Date | One Year | Five Years | Ten Years |
Dividend Growth Fund3 | 5/15/1992 | 7.00% | 13.85% | 5.22% |
1 Prior to December 6, 2002, the fund was known as the Utilities Income Fund.
2 Prior to December 6, 2002, the comparative benchmark was known as the Utilities Composite Index. The index weightings have been: 40% S&P Utilities Index, 40% S&P Telephone Index, and 20% Lehman Utility Bond Index through April 30, 1999; 63.75% S&P Utilities Index, 21.25% S&P Telephone Index, and 15% Lehman Utility Bond Index through March 31, 2000; 75% S&P Utilities Index, 25% S&P Telephone Index through December 31, 2001; 75% S&P Utilities Index, 25% S&P Integrated Telecommunication Services Index through December 6, 2002; and Russell 1000 Index thereafter.
3 Total returns do not include the account service fee that may be applicable to certain accounts with balances below $10,000. Note: See Financial Highlights table on page 15 for dividend and capital gains information.
11
Financial Statements
Statement of Net Assets
As of January 31, 2008
The fund provides a complete list of its holdings four times in each fiscal year, at the quarter-ends. For the second and fourth fiscal quarters, the lists appear in the fund’s semiannual and annual reports to shareholders. For the first and third fiscal quarters, the fund files the lists with the Securities and Exchange Commission on Form N-Q. Shareholders can look up the fund’s Forms N-Q on the SEC’s website at www.sec.gov. Forms N-Q may also be reviewed and copied at the SEC’s Public Reference Room (see the back cover of this report for further information).
| | Market |
| | Value• |
| Shares | ($000) |
Common Stocks (97.6%) | | |
Consumer Discretionary (10.7%) | | |
Staples, Inc. | 1,539,900 | 36,865 |
NIKE, Inc. Class B | 469,400 | 28,990 |
McDonald’s Corp. | 440,100 | 23,567 |
Toyota Motor Corp. ADR | 187,800 | 20,386 |
The Walt Disney Co. | 611,700 | 18,308 |
Carnival Corp. | 301,300 | 13,405 |
| | 141,521 |
Consumer Staples (17.0%) | | |
Wal-Mart Stores, Inc. | 702,900 | 35,763 |
PepsiCo, Inc. | 513,900 | 35,043 |
The Procter & Gamble Co. | 500,000 | 32,975 |
Sysco Corp. | 791,100 | 22,981 |
The Coca-Cola Co. | 373,000 | 22,070 |
Kimberly-Clark Corp. | 320,300 | 21,028 |
Altria Group, Inc. | 270,900 | 20,540 |
Anheuser-Busch Cos., Inc. | 387,000 | 18,003 |
General Mills, Inc. | 304,800 | 16,645 |
| | 225,048 |
Energy (12.3%) | | |
ExxonMobil Corp. | 535,400 | 46,259 |
Total SA ADR | 522,300 | 38,013 |
Chevron Corp. | 401,200 | 33,901 |
ConocoPhillips Co. | 393,800 | 31,630 |
Schlumberger Ltd. | 169,900 | 12,821 |
| | 162,624 |
Financials (9.0%) | | |
American International | | |
Group, Inc. | 509,200 | 28,087 |
State Street Corp. | 303,800 | 24,948 |
ACE Ltd. | 412,100 | 24,042 |
Bank of America Corp. | 487,100 | 21,603 |
Prudential Financial, Inc. | 248,000 | 20,924 |
| | 119,604 |
Health Care (15.2%) | | |
Medtronic, Inc. | 723,700 | 33,703 |
Eli Lilly & Co. | 570,100 | 29,372 |
12
| | Market |
| | Value• |
| Shares | ($000) |
Abbott Laboratories | 479,300 | 26,985 |
Cardinal Health, Inc. | 456,500 | 26,463 |
Johnson & Johnson | 404,300 | 25,576 |
Schering-Plough Corp. | 1,126,300 | 22,042 |
AstraZeneca Group | | |
PLC ADR | 449,100 | 18,795 |
Wyeth | 463,300 | 18,439 |
| | 201,375 |
Industrials (16.4%) | | |
The Boeing Co. | 362,800 | 30,178 |
United Parcel Service, Inc. | 406,500 | 29,739 |
General Electric Co. | 764,000 | 27,053 |
Honeywell International Inc. | 398,700 | 23,551 |
General Dynamics Corp. | 234,500 | 19,806 |
Emerson Electric Co. | 374,500 | 19,040 |
United Technologies Corp. | 257,600 | 18,910 |
Lockheed Martin Corp. | 167,600 | 18,087 |
Caterpillar, Inc. | 248,900 | 17,707 |
Illinois Tool Works, Inc. | 278,400 | 14,031 |
| | 218,102 |
Information Technology (12.9%) | | |
Automatic Data | | |
Processing, Inc. | 1,028,600 | 41,730 |
Microsoft Corp. | 970,700 | 31,645 |
International Business | | |
Machines Corp. | 273,100 | 29,315 |
Paychex, Inc. | 780,600 | 25,541 |
Accenture Ltd. | 586,300 | 20,298 |
Linear Technology Corp. | 442,600 | 12,247 |
Nokia Corp. ADR | 267,600 | 9,888 |
| | 170,664 |
Materials (1.6%) | | |
Praxair, Inc. | 272,500 | 22,048 |
| | |
Telecommunication Services (2.5%) | | |
AT&T Inc. | 870,400 | 33,502 |
Total Common Stocks | | |
(Cost $1,110,795) | | 1,294,488 |
13
| Face | Market |
| Amount | Value• |
| ($000) | ($000) |
Temporary Cash Investment (2.4%) | | |
Repurchase Agreement | | |
UBS Securities LLC 2.950%, | | |
2/1/08 (Dated 1/31/08, | | |
Repurchase Value | | |
$31,503,000, collateralized | | |
by Federal National Mortgage | | |
Assn. 5.500%–6.000%, | | |
5/1/35–12/1/37) | | |
(Cost $31,500) | 31,500 | 31,500 |
Total Investments (100.0%) | | |
(Cost $1,142,295) | | 1,325,988 |
Other Assets and Liabilities (0.0%) | | |
Other Assets—Note C | | 2,954 |
Liabilities | | (3,213) |
| | (259) |
Net Assets (100%) | | |
Applicable to 92,191,612 outstanding | | |
$.001 par value shares of beneficial | | |
interest (unlimited authorization) | | 1,325,729 |
Net Asset Value Per Share | | $14.38 |
At January 31, 2008, net assets consisted of:1 |
| Amount | Per |
| ($000) | Share |
Paid-in Capital | 1,145,502 | $12.43 |
Overdistributed Net | | |
Investment Income | (160) | — |
Accumulated Net | | |
Realized Losses | (3,306) | (.04) |
Unrealized Appreciation | 183,693 | 1.99 |
Net Assets | 1,325,729 | $14.38 |
• | See Note A in Notes to Financial Statements. |
1 See Note E in Notes to Financial Statements for the tax-basis components of net assets.
ADR—American Depositary Receipt.
14
Statement of Operations
| Year Ended |
| January 31, 2008 |
| ($000) |
Investment Income | |
Income | |
Dividends | 26,989 |
Interest | 1,050 |
Security Lending | 193 |
Total Income | 28,232 |
Expenses | |
Investment Advisory Fees—Note B | |
Basic Fee | 1,516 |
Performance Adjustment | 42 |
The Vanguard Group—Note C | |
Management and Administrative | 2,234 |
Marketing and Distribution | 216 |
Custodian Fees | 7 |
Auditing Fees | 20 |
Shareholders’ Reports | 25 |
Trustees’ Fees and Expenses | 2 |
Total Expenses | 4,062 |
Expenses Paid Indirectly—Note D | (20) |
Net Expenses | 4,042 |
Net Investment Income | 24,190 |
Realized Net Gain (Loss) on Investment Securities Sold | 63,097 |
Change in Unrealized Appreciation (Depreciation) of Investment Securities | (92,066) |
Net Increase (Decrease) in Net Assets Resulting from Operations | (4,779) |
15
Statement of Changes in Net Assets
| Year Ended January 31, |
| 2008 | 2007 |
| ($000) | ($000) |
Increase (Decrease) in Net Assets | | |
Operations | | |
Net Investment Income | 24,190 | 20,657 |
Realized Net Gain (Loss) | 63,097 | 81,236 |
Change in Unrealized Appreciation (Depreciation) | (92,066) | 78,627 |
Net Increase (Decrease) in Net Assets Resulting from Operations | (4,779) | 180,520 |
Distributions | | |
Net Investment Income | (23,790) | (20,673) |
Realized Capital Gain | (8,839) | — |
Total Distributions | (32,629) | (20,673) |
Capital Share Transactions—Note G | | |
Issued | 350,693 | 221,674 |
Issued in Lieu of Cash Distributions | 28,508 | 17,716 |
Redeemed | (258,780) | (151,063) |
Net Increase (Decrease) from Capital Share Transactions | 120,421 | 88,327 |
Total Increase (Decrease) | 83,013 | 248,174 |
Net Assets | | |
Beginning of Period | 1,242,716 | 994,542 |
End of Period1 | 1,325,729 | 1,242,716 |
1 Net Assets—End of Period includes undistributed (overdistributed) net investment income of ($160,000) and ($560,000).
16
Financial Highlights
For a Share Outstanding | Year Ended January 31, |
Throughout Each Period | 2008 | 2007 | 2006 | 2005 | 2004 |
Net Asset Value, Beginning of Period | $14.74 | $12.75 | $11.89 | $11.33 | $ 8.48 |
Investment Operations | | | | | |
Net Investment Income | .29 | .26 | .22 | .231 | .18 |
Net Realized and Unrealized Gain | | | | | |
(Loss) on Investments | (.27) | 1.99 | .88 | .55 | 2.86 |
Total from Investment Operations | .02 | 2.25 | 1.10 | .78 | 3.04 |
Distributions | | | | | |
Dividends from Net Investment Income | (.28) | (.26) | (.24) | (.22) | (.19) |
Distributions from Realized Capital Gains | (.10) | — | — | — | — |
Total Distributions | (.38) | (.26) | (.24) | (.22) | (.19) |
Net Asset Value, End of Period | $14.38 | $14.74 | $12.75 | $11.89 | $11.33 |
| | | | | |
Total Return2 | –0.01% | 17.84% | 9.34% | 6.92% | 36.08% |
| | | | | |
Ratios/Supplemental Data | | | | | |
Net Assets, End of Period (Millions) | $1,326 | $1,243 | $995 | $965 | $818 |
Ratio of Total Expenses to | | | | | |
Average Net Assets | 0.32%3 | 0.38%3 | 0.37%3 | 0.37%3 | 0.40% |
Ratio of Net Investment Income to | | | | | |
Average Net Assets | 1.91% | 1.93% | 1.85% | 2.04%1 | 1.84% |
Portfolio Turnover Rate | 36% | 41% | 16% | 20% | 23% |
1 Net investment income per share and the ratio of net investment income to average net assets include $.03 and 0.28%, respectively, resulting from a special dividend from Microsoft Corp. in November 2004.
2 Total returns do not include the account service fee that may be applicable to certain accounts with balances below $10,000.
3 Includes performance-based investment advisory fee increases (decreases) of 0.00%, 0.01%, 0.01%, and 0.01%.
See accompanying Notes, which are an integral part of the Financial Statements.
17
Notes to Financial Statements
Vanguard Dividend Growth Fund is registered under the Investment Company Act of 1940 as an open-end investment company, or mutual fund. The fund files reports with the SEC under the company name Vanguard Specialized Funds.
A. The following significant accounting policies conform to generally accepted accounting principles for U.S. mutual funds. The fund consistently follows such policies in preparing its financial statements.
1. Security Valuation: Securities are valued as of the close of trading on the New York Stock Exchange (generally 4 p.m., Eastern time) on the valuation date. Equity securities are valued at the latest quoted sales prices or official closing prices taken from the primary market in which each security trades; such securities not traded on the valuation date are valued at the mean of the latest quoted bid and asked prices. Securities for which market quotations are not readily available, or whose values have been materially affected by events occurring before the fund’s pricing time but after the close of the securities’ primary markets, are valued by methods deemed by the board of trustees to represent fair value. Temporary cash investments acquired over 60 days to maturity are valued using the latest bid prices or using valuations based on a matrix system (which considers such factors as security prices, yields, maturities, and ratings), both as furnished by independent pricing services. Other temporary cash investments are valued at amortized cost, which approximates market value.
2. Repurchase Agreements: The fund may invest in repurchase agreements. Securities pledged as collateral for repurchase agreements are held by a custodian bank until the agreements mature. Each agreement requires that the market value of the collateral be sufficient to cover payments of interest and principal; however, in the event of default or bankruptcy by the other party to the agreement, retention of the collateral may be subject to legal proceedings.
3. Federal Income Taxes: The fund intends to continue to qualify as a regulated investment company and distribute all of its taxable income. Accordingly, no provision for federal income taxes is required in the financial statements.
4. Distributions: Distributions to shareholders are recorded on the ex-dividend date.
5. Security Lending: The fund may lend its securities to qualified institutional borrowers to earn additional income. Security loans are required to be secured at all times by collateral at least equal to the market value of securities loaned. The fund invests cash collateral received in Vanguard Market Liquidity Fund, and records a liability for the return of the collateral, during the period the securities are on loan. Security lending income represents the income earned on investing cash collateral, less expenses associated with the loan.
6. Other: Dividend income is recorded on the ex-dividend date. Interest income is accrued daily. Security transactions are accounted for on the date securities are bought or sold. Costs used to determine realized gains (losses) on the sale of investment securities are those of the specific securities sold.
18
B. Wellington Management Company, LLP, provides investment advisory services to the fund for a fee calculated at an annual percentage rate of average net assets. The basic fee is subject to quarterly adjustments based on the fund’s performance for the preceding three years relative to the Russell 1000 Index. For the year ended January 31, 2008, the investment advisory fee represented an effective annual basic rate of 0.12% of the fund’s average net assets before an increase of $42,000 based on performance.
C. The Vanguard Group furnishes at cost corporate management, administrative, marketing, and distribution services. The costs of such services are allocated to the fund under methods approved by the board of trustees. The fund has committed to provide up to 0.40% of its net assets in capital contributions to Vanguard. At January 31, 2008, the fund had contributed capital of $115,000 to Vanguard (included in Other Assets), representing 0.01% of the fund’s net assets and 0.11% of Vanguard’s capitalization. The fund’s trustees and officers are also directors and officers of Vanguard.
D. The fund has asked its investment advisor to direct certain security trades, subject to obtaining the best price and execution, to brokers who have agreed to rebate to the fund part of the commissions generated. Such rebates are used solely to reduce the fund’s management and administrative expenses. The fund’s custodian bank has also agreed to reduce its fees when the fund maintains cash on deposit in the non-interest-bearing custody account. For the year ended January 31, 2008, these arrangements reduced the fund’s management and administrative expenses by $19,000 and custodian fees by $1,000.
E. Distributions are determined on a tax basis and may differ from net investment income and realized capital gains for financial reporting purposes. Differences may be permanent or temporary. Permanent differences are reclassified among capital accounts in the financial statements to reflect their tax character. Temporary differences arise when certain items of income, expense, gain, or loss are recognized in different periods for financial statement and tax purposes; these differences will reverse at some time in the future. Differences in classification may also result from the treatment of short-term gains as ordinary income for tax purposes.
The fund used a tax accounting practice to treat a portion of the price of capital shares redeemed during the year as distributions from realized capital gains. Accordingly, the fund has reclassified $517,000 from accumulated net realized losses to paid-in capital.
For tax purposes, at January 31, 2008, the fund had $1,644,000 of ordinary income available for distribution. The fund used a capital loss carryforward of $56,731,000 to offset taxable capital gains realized during the year ended January 31, 2008, reducing the amount of capital gains that would otherwise be available to distribute to shareholders. For federal tax purposes, capital gains required to be distributed in December 2007 included net gains realized through October 31, 2007. Subsequently, the fund realized capital losses of $2,890,000, which are available to offset future net capital gains.
19
At January 31, 2008, the cost of investment securities for tax purposes was $1,142,295,000. Net unrealized appreciation of investment securities for tax purposes was $183,693,000, consisting of unrealized gains of $218,816,000 on securities that had risen in value since their purchase and $35,123,000 in unrealized losses on securities that had fallen in value since their purchase.
F. During the year ended January 31, 2008, the fund purchased $549,855,000 of investment securities and sold $446,875,000 of investment securities other than temporary cash investments.
G. Capital shares issued and redeemed were:
| Year Ended January 31, |
| 2008 | 2007 |
| Shares | Shares |
| (000) | (000) |
Issued | 23,079 | 16,265 |
Issued in Lieu of Cash Distributions | 1,863 | 1,305 |
Redeemed | (17,075) | (11,242) |
Net Increase (Decrease) in Shares Outstanding | 7,867 | 6,328 |
H. In June 2006, the Financial Accounting Standards Board issued Interpretation No. 48 (“FIN 48”), “Accounting for Uncertainty in Income Taxes.” FIN 48 establishes the minimum threshold for recognizing, and a system for measuring, the benefits of tax-return positions in financial statements, effective for the fund’s current fiscal year. Management has analyzed the fund’s tax positions taken on federal income tax returns for all open tax years (tax years ended January 31, 2005–2008) for purposes of implementing FIN 48, and has concluded that no provision for income tax is required in the fund’s financial statements.
20
Report of Independent Registered Public Accounting Firm
To the Trustees of Vanguard Specialized Funds and the Shareholders of Vanguard Dividend Growth Fund:
In our opinion, the accompanying statement of net assets and the related statements of operations and of changes in net assets and the financial highlights present fairly, in all material respects, the financial position of Vanguard Dividend Growth Fund (constituting a separate portfolio of Vanguard Specialized Funds, hereafter referred to as the “Fund”) at January 31, 2008, the results of its operations for the year then ended, the changes in its net assets for each of the two years in the period then ended and the financial highlights for each of the five years in the period then ended, in conformity with accounting principles generally accepted in the United States of America. These financial statements and financial highlights (hereafter referred to as “financial statements”) are the responsibility of the Fund’s management; our responsibility is to express an opinion on these financial statements based on our audits. We conducted our audits of these financial statements in accordance with the standards of the Public Company Accounting Oversight Board (United States). Those standards require that we plan and perform the audit to obtain reasonable assurance about whether the financial statements are free of material misstatement. An audit includes examining, on a test basis, evidence supporting the amounts and disclosures in the financial statements, assessing the accounting principles used and significant estimates made by management, and evaluating the overall financial statement presentation. We believe that our audits, which included confirmation of securities at January 31, 2008 by correspondence with the custodians and broker, provide a reasonable basis for our opinion.
PricewaterhouseCoopers LLP
Philadelphia, Pennsylvania
March 12, 2008
Special 2008 tax information (unaudited) for Vanguard Dividend Growth Fund
This information for the fiscal year ended January 31, 2008, is included pursuant to provisions of the Internal Revenue Code.
The fund distributed $9,256,000 as capital gain dividends (from net long-term capital gains) to shareholders during the fiscal year.
The fund distributed $23,787,000 of qualified dividend income to shareholders during the fiscal year.
For corporate shareholders, 99.1% of investment income (dividend income plus short-term gains, if any) qualifies for the dividends-received deduction.
21
Your Fund’s After-Tax Returns
This table presents returns for your fund both before and after taxes. The after-tax returns are shown in two ways: (1) assuming that an investor owned the fund during the entire period and paid taxes on the fund’s distributions, and (2) assuming that an investor paid taxes on the fund’s distributions and sold all shares at the end of each period.
Calculations are based on the highest individual federal income tax and capital gains tax rates in effect at the times of the distributions and the hypothetical sales. State and local taxes were not considered. After-tax returns reflect any qualified dividend income, using actual prior-year figures and estimates for 2008. (In the example, returns after the sale of fund shares may be higher than those assuming no sale. This occurs when the sale would have produced a capital loss. The calculation assumes that the investor received a tax deduction for the loss.)
Please note that your actual after-tax returns will depend on your tax situation and may differ from those shown. Also note that if you own the fund in a tax-deferred account, such as an individual retirement account or a 401(k) plan, this information does not apply to you. Such accounts are not subject to current taxes.
Finally, keep in mind that a fund’s performance—whether before or after taxes—does not guarantee future results.
Average Annual Total Returns: Dividend Growth Fund1 | | | |
Periods Ended January 31, 2008 | | | |
| One | Five | Ten |
| Year | Years | Years |
Returns Before Taxes | –0.01% | 13.39% | 4.63% |
Returns After Taxes on Distributions | –0.37 | 13.05 | 3.28 |
Returns After Taxes on Distributions and Sale of Fund Shares | 0.53 | 11.71 | 3.31 |
1 Total returns do not include the account service fee that may be applicable to certain accounts with balances below $10,000.
22
About Your Fund’s Expenses
As a shareholder of the fund, you incur ongoing costs, which include costs for portfolio management, administrative services, and shareholder reports (like this one), among others. Operating expenses, which are deducted from a fund’s gross income, directly reduce the investment return of the fund.
A fund’s expenses are expressed as a percentage of its average net assets. This figure is known as the expense ratio. The following examples are intended to help you understand the ongoing costs (in dollars) of investing in your fund and to compare these costs with those of other mutual funds. The examples are based on an investment of $1,000 made at the beginning of the period shown and held for the entire period.
The table below illustrates your fund’s costs in two ways:
• Based on actual fund return. This section helps you to estimate the actual expenses that you paid over the period. The “Ending Account Value” shown is derived from the fund’s actual return, and the third column shows the dollar amount that would have been paid by an investor who started with $1,000 in the fund. You may use the information here, together with the amount you invested, to estimate the expenses that you paid over the period.
To do so, simply divide your account value by $1,000 (for example, an $8,600 account value divided by $1,000 = 8.6), then multiply the result by the number given for your fund under the heading “Expenses Paid During Period.”
• Based on hypothetical 5% yearly return. This section is intended to help you compare your fund’s costs with those of other mutual funds. It assumes that the fund had a yearly return of 5% before expenses, but that the expense ratio is unchanged. In this case—because the return used is not the fund’s actual return—the results do not apply to your investment. The example is useful in making comparisons because the Securities and Exchange Commission requires all mutual funds to calculate expenses based on a 5% return. You can assess your fund’s costs by comparing this hypothetical example with the hypothetical examples that appear in shareholder reports of other funds.
Six Months Ended January 31, 2008 | | | |
| Beginning | Ending | Expenses |
| Account Value | Account Value | Paid During |
Dividend Growth Fund | 7/31/2007 | 1/31/2008 | Period1 |
Based on Actual Fund Return | $1,000.00 | $969.84 | $1.54 |
Based on Hypothetical 5% Yearly Return | 1,000.00 | 1,023.64 | 1.58 |
Note that the expenses shown in the table are meant to highlight and help you compare ongoing costs only and do not reflect transaction costs incurred by the fund for buying and selling securities. Further, the expenses do not include the account service fee described in the prospectus. If such a fee were applied to your account, your costs would be higher. Your fund does not charge transaction fees, such as purchase or redemption fees, nor does it carry a “sales load.”
1 These calculations are based on expenses incurred in the most recent six-month period. The fund’s annualized six-month expense ratio for that period is 0.31%. The dollar amounts shown as “Expenses Paid” are equal to the annualized expense ratio multiplied by the average account value over the period, multiplied by the number of days in the most recent six-month peiod, then divided by the number of days in the most recent 12-month period.
23
The calculations assume no shares were bought or sold during the period. Your actual costs may have been higher or lower, depending on the amount of your investment and the timing of any purchases or redemptions.
You can find more information about the fund’s expenses, including annual expense ratios, in the Financial Statements section of this report. For additional information on operating expenses and other shareholder costs, please refer to your fund’s current prospectus.
24
Glossary
Beta. A measure of the magnitude of a fund’s past share-price fluctuations in relation to the ups and downs of a given market index. The index is assigned a beta of 1.00. Compared with a given index, a fund with a beta of 1.20 typically would have seen its share price rise or fall by 12% when the index rose or fell by 10%. For this report, beta is based on returns over the past 36 months for both the fund and the index. Note that a fund’s beta should be reviewed in conjunction with its R-squared (see definition below). The lower the R-squared, the less correlation there is between the fund and the index, and the less reliable beta is as an indicator of volatility.
Earnings Growth Rate. The average annual rate of growth in earnings over the past five years for the stocks now in a fund.
Equity Exposure. A measure that reflects a fund’s investments in stocks and stock futures. Any holdings in short-term reserves are excluded.
Expense Ratio. The percentage of a fund’s average net assets used to pay its annual administrative and advisory expenses. These expenses directly reduce returns to investors.
Foreign Holdings. The percentage of a fund represented by stocks or depositary receipts of companies based outside the United States.
Inception Date. The date on which the assets of a fund (or one of its share classes) are first invested in accordance with the fund’s investment objective. For funds with a subscription period, the inception date is the day after that period ends. Investment performance is measured from the inception date.
Median Market Cap. An indicator of the size of companies in which a fund invests; the midpoint of market capitalization (market price x shares outstanding) of a fund’s stocks, weighted by the proportion of the fund’s assets invested in each stock. Stocks representing half of the fund’s assets have market capitalizations above the median, and the rest are below it.
Price/Book Ratio. The share price of a stock divided by its net worth, or book value, per share. For a fund, the weighted average price/book ratio of the stocks it holds.
Price/Earnings Ratio. The ratio of a stock’s current price to its per-share earnings over the past year. For a fund, the weighted average P/E of the stocks it holds. P/E is an indicator of market expectations about corporate prospects; the higher the P/E, the greater the expectations for a company’s future growth.
R-Squared. A measure of how much of a fund’s past returns can be explained by the returns from the market in general, as measured by a given index. If a fund’s total returns were precisely synchronized with an index’s returns, its R-squared would be 1.00. If the fund’s returns bore no relationship to the index’s returns, its R-squared would be 0. For this report, R-squared is based on returns over the past 36 months for both the fund and the index.
Return on Equity. The annual average rate of return generated by a company during the past five years for each dollar of shareholder’s equity (net income divided by shareholder’s equity). For a fund, the weighted average return on equity for the companies whose stocks it holds.
Short-Term Reserves. The percentage of a fund invested in highly liquid, short-term securities that can be readily converted to cash.
25
Turnover Rate. An indication of the fund’s trading activity. Funds with high turnover rates incur higher transaction costs and may be more likely to distribute capital gains (which may be taxable to investors). The turnover rate excludes in-kind transactions, which have minimal impact on costs.
Yield. A snapshot of a fund’s income from interest and dividends. The yield, expressed as a percentage of the fund’s net asset value, is based on income earned over the past 30 days and is annualized, or projected forward for the coming year. The index yield is based on the current annualized rate of income provided by securities in the index.
26
This page intentionally left blank.
This page intentionally left blank.
This page intentionally left blank.
The People Who Govern Your Fund
The trustees of your mutual fund are there to see that the fund is operated and managed in your best interests since, as a shareholder, you are a part owner of the fund. Your fund’s trustees also serve on the board of directors of The Vanguard Group, Inc., which is owned by the Vanguard funds and provides services to them on an at-cost basis.
A majority of Vanguard’s board members are independent, meaning that they have no affiliation with Vanguard or the funds they oversee, apart from the sizable personal investments they have made as private individuals.
Our independent board members bring distinguished backgrounds in business, academia, and public service to their task of working with Vanguard officers to establish the policies and oversee the activities of the funds. Among board members’ responsibilities are selecting investment advisors for the funds; monitoring fund operations, performance, and costs; reviewing contracts; nominating and selecting new trustees/directors; and electing Vanguard officers.
Each trustee serves a fund until its termination; or until the trustee’s retirement, resignation, or death; or otherwise as specified in the fund’s organizational documents. Any trustee may be removed at a shareholders’ meeting by a vote representing two-thirds of the net asset value of all shares of the fund together with shares of other Vanguard funds organized within the same trust. The table on these two pages shows information for each trustee and executive officer of the fund. The mailing address of the trustees and officers is P.O. Box 876, Valley Forge, PA 19482.
Chairman of the Board, Chief Executive Officer, and Trustee |
| |
John J. Brennan1 | |
Born 1954 | Principal Occupation(s) During the Past Five Years: Chairman of the Board, Chief Executive |
Trustee since May 1987; | Officer, and Director/Trustee of The Vanguard Group, Inc., and of each of the investment |
Chairman of the Board and | companies served by The Vanguard Group. |
Chief Executive Officer | |
152 Vanguard Funds Overseen | |
| |
Independent Trustees | |
| |
Charles D. Ellis | |
Born 1937 | Principal Occupation(s) During the Past Five Years: Applecore Partners (pro bono ventures |
Trustee since January 2001 | in education); Senior Advisor to Greenwich Associates (international business strategy |
152 Vanguard Funds Overseen | consulting); Successor Trustee of Yale University; Overseer of the Stern School of Business |
| at New York University; Trustee of the Whitehead Institute for Biomedical Research. |
| |
Emerson U. Fullwood | |
Born 1948 | Principal Occupation(s) During the Past Five Years: Executive Chief Staff and Marketing |
Trustee since January 2008 | Officer for North America since 2004 and Corporate Vice President of Xerox Corporation |
152 Vanguard Funds Overseen | (photocopiers and printers); Director of SPX Corporation (multi-industry manufacturing), |
| of the United Way of Rochester, and of the Boy Scouts of America. |
| |
Rajiv L. Gupta | |
Born 1945 | Principal Occupation(s) During the Past Five Years: Chairman, President, and |
Trustee since December 20012 | Chief Executive Officer of Rohm and Haas Co. (chemicals); Board Member of |
152 Vanguard Funds Overseen | the American Chemistry Council; Director of Tyco International, Ltd. (diversified |
| manufacturing and services) since 2005. |
Amy Gutmann | |
Born 1949 | Principal Occupation(s) During the Past Five Years: President of the University of |
Trustee since June 2006 | Pennsylvania since 2004; Professor in the School of Arts and Sciences, Annenberg School |
152 Vanguard Funds Overseen | for Communication, and Graduate School of Education of the University of Pennsylvania |
| since 2004; Provost (2001–2004) and Laurance S. Rockefeller Professor of Politics and |
| the University Center for Human Values (1990–2004), Princeton University; Director of |
| Carnegie Corporation of New York since 2005 and of Schuylkill River Development |
| Corporation and Greater Philadelphia Chamber of Commerce since 2004. |
| |
JoAnn Heffernan Heisen | |
Born 1950 | Principal Occupation(s) During the Past Five Years: Corporate Vice President and |
Trustee since July 1998 | Chief Global Diversity Officer since 2006, Vice President and Chief Information |
152 Vanguard Funds Overseen | Officer (1997–2005), and Member of the Executive Committee of Johnson & |
| Johnson (pharmaceuticals/consumer products); Director of the University Medical |
| Center at Princeton and Women’s Research and Education Institute. |
| |
André F. Perold | |
Born 1952 | Principal Occupation(s) During the Past Five Years: George Gund Professor of Finance |
Trustee since December 2004 | and Banking, Harvard Business School; Senior Associate Dean, Director of Faculty |
152 Vanguard Funds Overseen | Recruiting, and Chair of Finance Faculty, Harvard Business School; Director and Chairman |
| of UNX, Inc. (equities trading firm) since 2003; Chair of the Investment Committee of |
| HighVista Strategies LLC (private investment firm) since 2005. |
| |
Alfred M. Rankin, Jr. | |
Born 1941 | Principal Occupation(s) During the Past Five Years: Chairman, President, Chief Executive |
Trustee since January 1993 | Officer, and Director of NACCO Industries, Inc. (forklift trucks/housewares/lignite); Director |
152 Vanguard Funds Overseen | of Goodrich Corporation (industrial products/aircraft systems and services). |
| |
| |
J. Lawrence Wilson | |
Born 1936 | Principal Occupation(s) During the Past Five Years: Retired Chairman and Chief Executive |
Trustee since April 1985 | Officer of Rohm and Haas Co. (chemicals); Director of Cummins Inc. (diesel engines) and |
152 Vanguard Funds Overseen | AmerisourceBergen Corp. (pharmaceutical distribution); Trustee of Vanderbilt University |
| and of Culver Educational Foundation. |
| |
Executive Officers1 | |
| |
Thomas J. Higgins | |
Born 1957 | Principal Occupation(s) During the Past Five Years: Principal of The Vanguard Group, Inc.; |
Treasurer since July 1998 | Treasurer of each of the investment companies served by The Vanguard Group. |
152 Vanguard Funds Overseen | |
| |
| |
Heidi Stam | |
Born 1956 | Principal Occupation(s) During the Past Five Years: Managing Director of The Vanguard |
Secretary since July 2005 | Group, Inc., since 2006; General Counsel of The Vanguard Group since 2005; Secretary of |
152 Vanguard Funds Overseen | The Vanguard Group, and of each of the investment companies served by The Vanguard |
| Group, since 2005; Principal of The Vanguard Group (1997–2006). |
Vanguard Senior Management Team | | |
| | | |
R. Gregory Barton | Kathleen C. Gubanich | F. William McNabb III | Ralph K. Packard |
Mortimer J. Buckley | Paul A. Heller | Michael S. Miller | George U. Sauter |
Founder |
|
John C. Bogle |
Chairman and Chief Executive Officer, 1974–1996 |
1 Officers of the funds are “interested persons” as defined in the Investment Company Act of 1940.
2 December 2002 for Vanguard Equity Income Fund, Vanguard Growth Equity Fund, the Vanguard Municipal Bond Funds, and the Vanguard State Tax-Exempt Funds.
More information about the trustees is in the Statement of Additional Information, available from The Vanguard Group.
| 
|
| P.O. Box 2600 |
| Valley Forge, PA 19482-2600 |
Connect with Vanguard® > www.vanguard.com
Fund Information > 800-662-7447 | Vanguard, Connect with Vanguard, and the ship logo are |
| trademarks of The Vanguard Group, Inc. |
Direct Investor Account Services > 800-662-2739 | |
| |
Institutional Investor Services > 800-523-1036 | All other marks are the exclusive property of their |
| respective owners. |
Text Telephone for People | |
With Hearing Impairment > 800-952-3335 | |
| All comparative mutual fund data are from Lipper Inc. |
| or Morningstar, Inc., unless otherwise noted. |
| You can obtain a free copy of Vanguard’s proxy voting |
This material may be used in conjunction | guidelines by visiting our website, www.vanguard.com, |
with the offering of shares of any Vanguard | and searching for “proxy voting guidelines,” or by |
fund only if preceded or accompanied by | calling Vanguard at 800-662-2739. The guidelines are |
the fund’s current prospectus. | also available from the SEC’s website, www.sec.gov. |
| In addition, you may obtain a free report on how your |
| fund voted the proxies for securities it owned during |
| the 12 months ended June 30. To get the report, visit |
| either www.vanguard.com or www.sec.gov. |
| |
| |
| You can review and copy information about your fund |
| at the SEC’s Public Reference Room in Washington, D.C. |
| To find out more about this public service, call the SEC |
| at 202-551-8090. Information about your fund is also |
| available on the SEC’s website, and you can receive |
| copies of this information, for a fee, by sending a |
| request in either of two ways: via e-mail addressed to |
| publicinfo@sec.gov or via regular mail addressed to the |
| Public Reference Section, Securities and Exchange |
| Commission, Washington, DC 20549-0102. |
| |
| |
| |
| |
| |
| © 2008 The Vanguard Group, Inc. |
| All rights reserved. |
| Vanguard Marketing Corporation, Distributor. |
| |
| Q570 032008 |

> | The Investor Shares of Vanguard Dividend Appreciation Index Fund returned –0.6% for the fiscal year ended January 31, 2008, closely matching the return of the fund’s benchmark. |
> | Dividend income partially offset declines in the fund’s share prices. The fund’s total return ended the fiscal year a few steps ahead of the result for the broad stock market and the peer-group average. |
Contents | |
| |
Your Fund’s Total Returns | 1 |
Chairman’s Letter | 2 |
Fund Profile | 7 |
Performance Summary | 9 |
Financial Statements | 11 |
Your Fund’s After-Tax Returns | 26 |
About Your Fund’s Expenses | 27 |
Glossary | 29 |
Please note: The opinions expressed in this report are just that—informed opinions. They should not be considered promises or advice. Also, please keep in mind that the information and opinions cover the period through the date on the cover of this report. Of course, the risks of investing in your fund are spelled out in the prospectus.
Your Fund’s Total Returns
Fiscal Year Ended January 31, 2008 | | |
| Ticker | Total |
| Symbol | Returns |
Vanguard Dividend Appreciation Index Fund | | |
Investor Shares | VDAIX | –0.6% |
ETF Shares1 | VIG | |
Market Price | | –1.2 |
Net Asset Value | | –0.5 |
Dividend Achievers Select Index | | –0.4 |
Average Large-Cap Core Fund2 | | –2.7 |
Your Fund’s Performance at a Glance | | | | |
January 31, 2007–January 31, 2008 | | | | |
| | | Distributions Per Share |
| Starting | Ending | Income | Capital |
| Share Price | Share Price | Dividends | Gains |
Vanguard Dividend Appreciation Index Fund | | | | |
Investor Shares | $21.84 | $21.40 | $0.327 | $0.000 |
ETF Shares | 54.60 | 53.48 | 0.873 | 0.000 |
1 Vanguard ETF™ Shares are traded on the American Stock Exchange and are available only through brokers. The table shows the ETF returns based on both the AMEX market price and the net asset value for a share. U.S. Pat. No. 6,879,964 B2.
2 Derived from data provided by Lipper Inc.
1

Chairman’s Letter
Dear Shareholder,
I am pleased to present this report on Vanguard Dividend Appreciation Index Fund, covering the fund’s first full fiscal year of operations.
The final months of fiscal 2008 were marked by a general decline in stock prices as investors worried about the broader implications of the subprime mortgage market crises and a possible recession. Despite a market decline of –10.9% as measured by the Dow Jones Wilshire 5000 Index, the fund’s Investor Shares reported a total return of –0.6%. By comparison, the average return of peer-group funds was –2.7%.
Strong income returns—a result of Dividend Appreciation Index Fund’s focus on companies with histories of consistently increasing dividends—helped cushion the impact of sliding stock prices. (If changes in stock price were its only source of return, the fund would have posted a –2.0% result for the year.)
2
Stocks gained in the first half but faltered in the second
The broad U.S. stock market returned –2.7% for the 12 months ended January 31, reflecting a volatile year punctuated by sharp declines for equities. Gains in the first half of the fiscal period were largely relinquished in midsummer and fall as repercussions from the subprime mortgage debacle began to be felt in the broader U.S. economy. The stock market’s retreat accelerated in January amid tightening global credit markets, a weakening U.S. dollar, and widening fears of a U.S. recession.
Large-capitalization stocks fared best in these unsettled conditions, outperforming small-caps for the year; meanwhile, growth stocks outpaced their value-oriented counterparts.
International stocks outperformed U.S. stocks for the sixth straight year, largely owing to exchange-rate gains produced by the weak U.S. dollar. Emerging markets and developed economies in Europe and Asia posted strong performances earlier in the fiscal year, but slumped after November as a result of increased concern about a U.S.-led downturn.
Bond returns grew stronger as Fed lowered rates
During the first half of the fiscal year, a stronger U.S. economy made investors more willing to take on risk to earn higher yields; spreads thus narrowed between the yields of U.S. Treasury securities and those of lower-quality issues. But as the subprime lending problems unraveled further in summer, investors flocked to higher-quality government and corporate
Market Barometer | | | |
| Average Annual Total Returns |
| Periods Ended January 31, 2008 |
| One Year | Three Years | Five Years |
Stocks | | | |
Russell 1000 Index (Large-caps) | –2.4% | 7.8% | 12.6% |
Russell 2000 Index (Small-caps) | –9.8 | 5.8 | 15.3 |
Dow Jones Wilshire 5000 Index (Entire market) | –2.7 | 7.9 | 13.2 |
MSCI All Country World Index ex USA (International) | 5.4 | 17.0 | 22.9 |
| | | |
Bonds | | | |
Lehman U.S. Aggregate Bond Index (Broad taxable market) | 8.8% | 4.9% | 4.8% |
Lehman Municipal Bond Index | 4.9 | 4.0 | 4.6 |
Citigroup 3-Month Treasury Bill Index | 4.6 | 4.2 | 3.0 |
| | | |
CPI | | | |
Consumer Price Index | 4.3% | 3.4% | 3.0% |
3
bonds. This drove Treasury prices higher and yields lower, widening the spread between Treasury yields and those of riskier bonds.
The Federal Reserve Board responded to the credit market turmoil and deteriorating economic outlook with aggressive reductions in its target for the federal funds rate. The Fed cut the rate five times during the fiscal year (twice in January), ending the period at 3.0%, the lowest rate since May 2005.
Lower interest rates depressed bond yields, but pushed prices higher. The broad taxable bond market returned 8.8% for the fiscal year. Tax-exempt municipal bonds returned 4.9%.
Consumer staples, energy stocks supported the fund’s return
After an upbeat start for the fiscal year, the fund’s performance was dampened by investor concerns about the impact of the subprime mortgage market crises and a slowing economy.
Stocks of financials companies, the fund’s third-largest sector weighting, bore the brunt of the subprime-related fears, falling by –17%. The largest declines came from Freddie Mac, the government-sponsored, stockholder-owned corporation that seeks to provide liquidity to the mortgage market, and American International Group, a huge global insurer that maintains large holdings of mortgage-related investments.
Expense Ratios1 | | | |
Your fund compared with its peer group | | | |
| | | Average |
| Investor | ETF | Large-Cap |
| Shares | Shares | Core Fund |
Dividend Appreciation Index Fund | 0.40% | 0.28% | 1.29% |
1 Fund expense ratios reflect the 12 months ended January 31, 2008. Peer-group expense ratio is derived from data provided by Lipper Inc. and captures information through year-end 2007.
4
The fund’s consumer discretionary stocks, which are particularly sensitive to economic slowdowns, fell almost –12%. Stocks of Home Depot, Lowe’s, and McGraw-Hill led the sector’s decline (although McDonald’s ran counter to this trend by returning almost 24%).
Positive returns from consumer staples stocks, the fund’s largest sector weighting, boosted performance. As the sector name implies, consumer staples companies provide basic products, such as food, that are relatively immune to the economic cycle’s highs and lows. Within this sector, Coca-Cola and Wal-Mart Stores were major contributors to performance.
The energy sector, one of the fund’s smaller weightings, made the largest contribution to the fund’s return. Returns from this sector were pumped up by integrated oil giants ExxonMobil and Chevron, two of the fund’s largest holdings, whose profits were boosted by the rising price of oil.
Don’t let unpredictable markets throw your plan off course
The events of the past fiscal year highlight an enduring certainty about the market: its short-term inscrutability. The year began on a bullish note—strong stock market, reasonably positive economic outlook. Less than 12 months later, stock prices were in retreat, and pessimism prevailed.
Total Returns | |
April 27, 2006,1 Through January 31, 2008 | |
| Average |
| Annual Return |
Dividend Appreciation Index Fund Investor Shares | 5.2% |
Dividend Achievers Select Index | 5.5 |
Average Large-Cap Core Fund2 | 3.7 |
The figures shown represent past performance, which is not a guarantee of future results. (Current performance may be lower or higher than the performance data cited. For performance data current to the most recent month-end, visit our website at www.vanguard.com/performance.) Note, too, that both investment returns and principal value can fluctuate widely, so an investor’s shares, when sold, could be worth more or less than their original cost.
1 Inception date.
2 Derived from data provided by Lipper Inc.
5
To weather the market’s uncertainties, we counsel investors to stick with a carefully considered, balanced portfolio of stock, bond, and money market mutual funds suited to their unique circumstances. After selecting such a portfolio, steadfastly resist the urge to make changes in the face of short-term volatility, regardless of market conditions. (The exception is a periodic rebalancing to ensure that the portfolio’s asset mix hasn’t drifted away from your target mix because of those market conditions.)
Vanguard Dividend Appreciation Index Fund, with its focus on companies that have established track records of increasing their dividend payouts, can play a valuable role in such a well-rounded portfolio.
As I close this report to you, it’s my pleasure to introduce the fund’s new president, F. William McNabb III. Bill is a man of great character and integrity who is intimately familiar with all aspects of Vanguard—from how we serve our clients to how we invest for our clients.
Bill and I have worked together very closely for more than two decades. I’m thrilled that the fund’s board elected him president, effective March 1, and designated him as my successor as chief executive officer, a role he will assume within a year, after an orderly transition. Bill and the rest of our team will serve you and our other clients extremely well in the years ahead.
Thank you for entrusting your assets to Vanguard.
Sincerely,

John J. Brennan
Chairman and Chief Executive Officer
February 22, 2008
Vanguard Dividend Appreciation ETF |
Premium/Discount: April 21, 20061–January 31, 2008 |
| | | | |
| Market Price Above or | | Market Price Below |
| Equal to Net Asset Value | | Net Asset Value |
| Number | Percentage | Number | Percentage |
Basis Point Differential2 | of Days | of Total Days | of Days | of Total Days |
0–24.9 | 208 | 46.33% | 230 | 51.22% |
25–49.9 | 4 | 0.89 | 2 | 0.45 |
50–74.9 | 4 | 0.89 | 0 | 0.00 |
75–100.0 | 0 | 0.00 | 0 | 0.00 |
>100.0 | 1 | 0.22 | 0 | 0.00 |
Total | 217 | 48.33% | 232 | 51.67% |
1 Inception.
2 One basis point equals 1/100 of a percentage point.
6
Fund Profile
As of January 31, 2008
Portfolio Characteristics | | |
| | Target | Broad |
| Fund | Index1 | Index2 |
Number of Stocks | 219 | 215 | 4,830 |
Median Market Cap | $63.9B | $57.4B | $33.7B |
Price/Earnings Ratio | 15.3x | 15.2x | 17.0x |
Price/Book Ratio | 3.1x | 3.0x | 2.5x |
Yield | | 2.1% | 1.9% |
Investor Shares | 1.7% | | |
ETF Shares | 1.8% | | |
Return on Equity | 24.0% | 24.5% | 19.2% |
Earnings Growth Rate | 18.1% | 19.4% | 20.1% |
Foreign Holdings | 0.0% | 0.0% | 0.0% |
Turnover Rate | 16.7% | — | — |
Expense Ratio | | — | — |
Investor Shares | 0.40% | | |
ETF Shares | 0.28% | | |
Short-Term Reserves | 0.3% | — | — |
Sector Diversification (% of equity exposure) |
| | Target | Broad |
| Fund | Index1 | Index2 |
Consumer Discretionary | 9.3% | 10.6% | 9.7% |
Consumer Staples | 23.2 | 23.7 | 9.0 |
Energy | 8.3 | 9.9 | 11.7 |
Financials | 14.6 | 16.8 | 19.3 |
Health Care | 12.6 | 11.1 | 12.1 |
Industrials | 16.3 | 16.4 | 11.8 |
Information Technology | 5.5 | 6.0 | 15.5 |
Materials | 4.1 | 3.8 | 3.9 |
Telecommunication Services | 4.2 | 0.1 | 3.2 |
Utilities | 1.9 | 1.6 | 3.8 |
7
Ten Largest Holdings3 (% of total net assets) |
| | |
Wal-Mart Stores, Inc. | hypermarkets and supercenters | 4.1% |
Chevron Corp. | integrated oil and gas | 4.0 |
The Procter & Gamble Co. | household products | 4.0 |
General Electric Co. | industrial conglomerates | 4.0 |
AT&T Inc. | integrated telecommunication services | 4.0 |
ExxonMobil Corp. | integrated oil and gas | 4.0 |
International Business Machines Corp. | computer hardware | 4.0 |
The Coca-Cola Co. | soft drinks | 4.0 |
Johnson & Johnson | pharmaceuticals | 4.0 |
American International Group, Inc. | multi-line insurance | 3.8 |
Top Ten | | 39.9% |
Investment Focus
��
1 Dividend Achievers Select Index.
2 Dow Jones Wilshire 5000 Index.
3 “Ten Largest Holdings” excludes any temporary cash investments and equity index products.
See page 25 for a Glossary of investment terms.
8
Performance Summary
All of the returns in this report represent past performance, which is not a guarantee of future results that may be achieved by the fund. (Current performance may be lower or higher than the performance data cited. For performance data current to the most recent month-end, visit our website at www.vanguard.com/performance.) Note, too, that both investment returns and principal value can fluctuate widely, so an investor’s shares, when sold, could be worth more or less than their original cost. The returns shown do not reflect taxes that a shareholder would pay on fund distributions or on the sale of fund shares.
Cumulative Performance: April 27, 2006–January 31, 2008
Initial Investment of $10,000
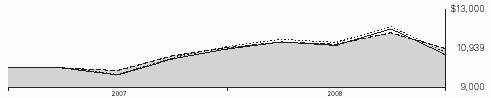
| Average Annual Total Returns | |
| Periods Ended January 31, 2008 | Final Value |
| | Since | of a $10,000 |
| One Year | Inception1 | Investment |
Dividend Appreciation Index Fund Investor Shares2 | –0.58% | 5.22% | $10,939 |
Dow Jones Wilshire 5000 Index | –2.70 | 4.43 | 10,795 |
Dividend Achievers Select Index | –0.40 | 5.48 | 10,987 |
Average Large-Cap Core Fund3 | –2.65 | 3.72 | 10,666 |
| | | Final Value |
| | Since | of a $10,000 |
| One Year | Inception1 | Investment |
Dividend Appreciation Index Fund ETF Shares Net Asset Value | –0.51% | 5.43% | $10,988 |
Dow Jones Wilshire 5000 Index | –2.70 | 4.23 | 10,765 |
Dividend Achievers Select Index | –0.40 | 5.60 | 11,018 |
Cumulative Returns of ETF Shares: April 21, 2006–January 31, 2008 | |
| | Cumulative |
| One Year | Since Inception |
Dividend Appreciation Index Fund ETF Shares Market Price | –1.16% | 9.34% |
Dividend Appreciation Index Fund ETF Shares Net Asset Value | –0.51 | 9.88 |
Dividend Achievers Select Index | –0.40 | 10.18 |
1 Performance for the fund and its comparative standards is calculated since the following inception dates: April 27, 2006, for the Investor Shares and April 21, 2006, for the ETF Shares.
2 Total returns do not include the account service fee that may be applicable to certain accounts with balances below $10,000.
3 Derived from data provided by Lipper Inc.
9
Fiscal-Year Total Returns (%): April 27, 2006–January 31, 2008
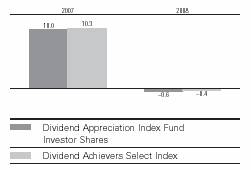
Average Annual Total Returns: Periods Ended December 31, 2007
This table presents average annual total returns through the latest calendar quarter—rather than through the end of the fiscal period. Securities and Exchange Commission rules require that we provide this information.
| | | Since |
| Inception Date | One Year | Inception |
Investor Shares1 | 4/27/2006 | 5.53% | 8.31% |
ETF Shares | 4/21/2006 | | |
Market Price | | 5.43 | 8.46 |
Net Asset Value | | 5.63 | 8.53 |
1 Total returns do not include the account service fee that may be applicable to certain accounts with balances below $10,000. Note: See Financial Highlights tables on pages 16 and 17 for dividend and capital gains information.
10
Financial Statements
Statement of Net Assets
As of January 31, 2008
The fund provides a complete list of its holdings four times in each fiscal year, at the quarter-ends. For the second and fourth fiscal quarters, the lists appear in the fund’s semiannual and annual reports to shareholders. For the first and third fiscal quarters, the fund files the lists with the Securities and Exchange Commission on Form N-Q. Shareholders can look up the fund’s Forms N-Q on the SEC’s website at www.sec.gov. Forms N-Q may also be reviewed and copied at the SEC’s Public Reference Room (see the back cover of this report for further information).
| | Market |
| | Value• |
| Shares | ($000) |
Common Stocks (99.7%) | | |
Consumer Discretionary (9.3%) | | |
McDonald’s Corp. | 256,373 | 13,729 |
Home Depot, Inc. | 285,784 | 8,765 |
Target Corp. | 146,897 | 8,165 |
Lowe’s Cos., Inc. | 239,536 | 6,333 |
Johnson Controls, Inc. | 116,799 | 4,131 |
The McGraw-Hill Cos., Inc. | 64,592 | 2,762 |
TJX Cos., Inc. | 73,690 | 2,326 |
Harley-Davidson, Inc. | 52,999 | 2,151 |
Gannett Co., Inc. | 45,229 | 1,673 |
Nordstrom, Inc. | 41,664 | 1,621 |
Genuine Parts Co. | 34,246 | 1,504 |
VF Corp. | 18,496 | 1,431 |
Sherwin-Williams Co. | 24,470 | 1,400 |
H & R Block, Inc. | 59,030 | 1,138 |
The Stanley Works | 14,827 | 762 |
Ross Stores, Inc. | 22,438 | 654 |
Family Dollar Stores, Inc. | 25,928 | 545 |
Meredith Corp. | 8,453 | 397 |
John Wiley & Sons Class A | 9,887 | 390 |
Polaris Industries, Inc. | 7,190 | 312 |
Wolverine World Wide, Inc. | 10,884 | 275 |
Matthews International Corp. | 5,433 | 266 |
Harte-Hanks, Inc. | 14,986 | 240 |
| | 60,970 |
Consumer Staples (23.2%) | | |
Beverages (8.6%) | | |
The Coca-Cola Co. | 443,047 | 26,215 |
PepsiCo, Inc. | 332,523 | 22,675 |
Anheuser-Busch Cos., Inc. | 151,705 | 7,057 |
Brown-Forman Corp. Class B | 14,085 | 887 |
| | |
Food & Staples Retailing (6.0%) | | |
Wal-Mart Stores, Inc. | 529,311 | 26,931 |
Walgreen Co. | 203,077 | 7,130 |
Sysco Corp. | 125,796 | 3,654 |
SuperValu Inc. | 49,546 | 1,489 |
11
| | Market |
| | Value• |
| Shares | ($000) |
Food Products (1.7%) | | |
Archer-Daniels-Midland Co. | 129,823 | 5,719 |
Wm. Wrigley Jr. Co. | 40,462 | 2,324 |
The Hershey Co. | 33,259 | 1,204 |
Hormel Foods Corp. | 26,561 | 1,029 |
McCormick & Co., Inc. | 23,431 | 790 |
Lancaster Colony Corp. | 6,347 | 221 |
Tootsie Roll Industries, Inc. | 7,179 | 179 |
| | |
Household Products (6.4%) | | |
The Procter & Gamble Co. | 401,032 | 26,448 |
Colgate-Palmolive Co. | 100,192 | 7,715 |
Kimberly-Clark Corp. | 83,747 | 5,498 |
The Clorox Co. | 27,803 | 1,705 |
Church & Dwight, Inc. | 12,683 | 675 |
| | |
Personal Products (0.5%) | | |
Avon Products, Inc. | 91,610 | 3,208 |
| | |
Tobacco (0.0%) | | |
Universal Corp. (VA) | 5,255 | 262 |
| | 153,015 |
Energy (8.2%) | | |
Chevron Corp. | 314,015 | 26,534 |
ExxonMobil Corp. | 304,851 | 26,339 |
Helmerich & Payne, Inc. | 20,448 | 802 |
Holly Corp. | 10,480 | 507 |
| | 54,182 |
Financials (14.6%) | | |
Capital Markets (4.3%) | | |
Lehman Brothers | | |
Holdings, Inc. | 103,882 | 6,666 |
State Street Corp. | 73,210 | 6,012 |
Franklin Resources Corp. | 50,827 | 5,298 |
Northern Trust Corp. | 43,822 | 3,215 |
T. Rowe Price Group Inc. | 56,858 | 2,876 |
Legg Mason Inc. | 25,342 | 1,825 |
SEI Investments Co. | 40,738 | 1,128 |
Eaton Vance Corp. | 27,537 | 1,026 |
12
| | Market |
| | Value• |
| Shares | ($000) |
Commercial Banks (1.6%) | | |
M & T Bank Corp. | 18,499 | 1,698 |
Synovus Financial Corp. | 119,265 | 1,575 |
Commerce Bancorp, Inc. | 36,294 | 1,383 |
Commerce Bancshares, Inc. | 13,731 | 610 |
Cullen/Frost Bankers, Inc. | 10,213 | 556 |
City National Corp. | 9,557 | 544 |
Bank of Hawaii Corp. | 9,577 | 482 |
BancorpSouth, Inc. | 14,829 | 364 |
UMB Financial Corp. | 7,154 | 301 |
Alabama National | | |
BanCorporation | 3,717 | 291 |
Trustmark Corp. | 12,405 | 285 |
^Westamerica Bancorporation | 5,008 | 248 |
First Charter Corp. | 7,105 | 195 |
Glacier Bancorp, Inc. | 10,355 | 193 |
CVB Financial Corp. | 14,744 | 164 |
Sterling Bancshares, Inc. | 15,142 | 152 |
First Financial Bankshares, Inc. | 3,752 | 140 |
BancFirst Corp. | 2,730 | 123 |
IBERIABANK Corp. | 2,212 | 114 |
Banner Corp. | 3,684 | 95 |
^Capital City Bank Group, Inc. | 3,164 | 92 |
Sandy Spring Bancorp, Inc. | 2,918 | 87 |
Bank of the Ozarks, Inc. | 3,574 | 87 |
S.Y. Bancorp, Inc. | 3,212 | 83 |
First Source Corp. | 4,202 | 82 |
Renasant Corp. | 3,714 | 78 |
Tompkins Trustco, Inc. | 1,709 | 72 |
Simmons First National Corp. | 2,477 | 70 |
First Financial Corp. (IN) | 2,339 | 70 |
First Community | | |
Bancshares, Inc. | 1,888 | 65 |
Washington Trust | | |
Bancorp, Inc. | 2,494 | 62 |
Old Second Bancorp, Inc. | 2,206 | 62 |
First State Bancorporation | 4,780 | 60 |
Heartland Financial USA, Inc. | 3,014 | 58 |
Mainsource Financial | | |
Group, Inc. | 3,716 | 58 |
Peoples Bancorp, Inc. | 2,412 | 57 |
Southwest Bancorp, Inc. | 3,216 | 57 |
Suffolk Bancorp | 1,801 | 55 |
West Coast Bancorp | 3,520 | 54 |
Horizon Financial Corp. | 2,695 | 42 |
| | |
Insurance (8.5%) | | |
American International | | |
Group, Inc. | 457,343 | 25,227 |
AFLAC Inc. | 91,690 | 5,623 |
The Allstate Corp. | 106,474 | 5,246 |
The Hartford Financial | | |
Services Group Inc. | 64,320 | 5,195 |
The Chubb Corp. | 76,845 | 3,980 |
Lincoln National Corp. | 53,492 | 2,908 |
13
| | Market |
| | Value• |
| Shares | ($000) |
Cincinnati Financial Corp. | 31,871 | 1,228 |
Transatlantic Holdings, Inc. | 13,232 | 902 |
HCC Insurance Holdings, Inc. | 22,401 | 624 |
Brown & Brown, Inc. | 27,451 | 618 |
Wesco Financial Corp. | 1,426 | 565 |
Protective Life Corp. | 13,697 | 544 |
Erie Indemnity Co. Class A | 10,304 | 522 |
^Ambac Financial Group, Inc. | 37,856 | 444 |
Nationwide Financial | | |
Services, Inc. | 9,264 | 409 |
Commerce Group, Inc. | 11,168 | 404 |
Alfa Corp. | 14,962 | 328 |
Hilb, Rogal and Hamilton Co. | 7,985 | 289 |
R.L.I. Corp. | 4,514 | 255 |
Midland Co. | 3,590 | 230 |
State Auto Financial Corp. | 7,478 | 209 |
Harleysville Group, Inc. | 5,582 | 199 |
| | |
Real Estate Management & Development (0.1%) | |
Forest City Enterprise Class A | 16,700 | 666 |
| | |
Thrifts & Mortgage Finance (0.1%) | | |
^First Busey Corp. | 7,019 | 152 |
Anchor Bancorp | | |
Wisconsin Inc. | 3,861 | 97 |
Flushing Financial Corp. | 4,464 | 71 |
| | 95,845 |
Health Care (12.6%) | | |
Johnson & Johnson | 411,940 | 26,059 |
Abbott Laboratories | 288,050 | 16,217 |
Eli Lilly & Co. | 216,265 | 11,142 |
Medtronic, Inc. | 227,268 | 10,584 |
Stryker Corp. | 84,994 | 5,692 |
Becton, Dickinson & Co. | 44,445 | 3,846 |
Cardinal Health, Inc. | 66,328 | 3,845 |
C.R. Bard, Inc. | 19,398 | 1,873 |
DENTSPLY International Inc. | 29,923 | 1,236 |
Beckman Coulter, Inc. | 12,752 | 848 |
Hillenbrand Industries, Inc. | 12,559 | 650 |
Owens & | | |
Minor, Inc. Holding Co. | 7,969 | 329 |
West Pharmaceutical | | |
Services, Inc. | 6,355 | 249 |
Meridian Bioscience Inc. | 7,207 | 226 |
| | 82,796 |
Industrials (16.2%) | | |
General Electric Co. | 746,269 | 26,425 |
United Technologies Corp. | 193,055 | 14,172 |
3M Co. | 143,958 | 11,466 |
Caterpillar, Inc. | 124,903 | 8,886 |
Emerson Electric Co. | 161,281 | 8,200 |
General Dynamics Corp. | 80,179 | 6,772 |
Illinois Tool Works, Inc. | 107,387 | 5,412 |
Danaher Corp. | 69,680 | 5,188 |
14
| | Market |
| | Value• |
| Shares | ($000) |
Parker Hannifin Corp. | 36,389 | 2,460 |
C.H. Robinson Worldwide Inc. | 33,764 | 1,875 |
Expeditors International of | | |
Washington, Inc. | 38,824 | 1,836 |
Dover Corp. | 44,480 | 1,795 |
Pitney Bowes, Inc. | 42,134 | 1,546 |
W.W. Grainger, Inc. | 16,697 | 1,329 |
Avery Dennison Corp. | 20,593 | 1,067 |
Roper Industries Inc. | 18,969 | 1,061 |
Harsco Corp. | 18,385 | 1,047 |
Cintas Corp. | 30,216 | 992 |
Donaldson Co., Inc. | 16,700 | 700 |
Pentair, Inc. | 20,712 | 658 |
Teleflex Inc. | 7,949 | 470 |
Carlisle Co., Inc. | 13,416 | 447 |
Nordson Corp. | 7,643 | 381 |
CLARCOR Inc. | 9,329 | 350 |
Mine Safety Appliances Co. | 7,684 | 343 |
Brady Corp. Class A | 10,970 | 333 |
^HNI Corp. | 9,163 | 308 |
ABM Industries Inc. | 9,337 | 193 |
Franklin Electric, Inc. | 4,420 | 166 |
Tennant Co. | 4,795 | 158 |
A.O. Smith Corp. | 4,270 | 149 |
Raven Industries, Inc. | 4,421 | 133 |
McGrath RentCorp | 5,417 | 126 |
NACCO Industries, Inc. | | |
Class A | 1,183 | 118 |
Badger Meter, Inc. | 2,923 | 111 |
Universal Forest Products, Inc. | 3,043 | 110 |
Gorman-Rupp Co. | 3,402 | 93 |
LSI Industries Inc. | 5,949 | 73 |
Courier Corp. | 2,692 | 71 |
| | 107,020 |
Information Technology (5.5%) | | |
International Business | | |
Machines Corp. | 244,496 | 26,244 |
Automatic Data | | |
Processing, Inc. | 110,693 | 4,491 |
Paychex, Inc. | 71,637 | 2,344 |
Linear Technology Corp. | 48,512 | 1,342 |
Total System Services, Inc. | 45,442 | 1,050 |
Jack Henry & Associates Inc. | 16,513 | 406 |
Diebold, Inc. | 13,647 | 353 |
| | 36,230 |
Materials (4.0%) | | |
Praxair, Inc. | 64,738 | 5,238 |
Air Products & | | |
Chemicals, Inc. | 43,227 | 3,891 |
Nucor Corp. | 56,831 | 3,285 |
Ecolab, Inc. | 49,096 | 2,369 |
PPG Industries, Inc. | 33,285 | 2,200 |
Rohm & Haas Co. | 37,047 | 1,976 |
Vulcan Materials Co. | 18,706 | 1,468 |
15
| | | Market |
| | | Value• |
| | Shares | ($000) |
| Sigma-Aldrich Corp. | 26,982 | 1,340 |
| Martin Marietta Materials, Inc. | 9,085 | 1,115 |
| Albemarle Corp. | 20,922 | 759 |
| Sonoco Products Co. | 20,135 | 621 |
| AptarGroup Inc. | 13,935 | 526 |
| Bemis Co., Inc. | 19,207 | 522 |
| RPM International, Inc. | 21,323 | 461 |
| Valspar Corp. | 21,509 | 431 |
| H.B. Fuller Co. | 12,558 | 261 |
| Myers Industries, Inc. | 8,548 | 100 |
| Stepan Co. | 1,921 | 57 |
| | | 26,620 |
Telecommunication Services (4.2%) | | |
| AT&T Inc. | 684,657 | 26,352 |
| CenturyTel, Inc. | 24,239 | 895 |
| Shenandoah | | |
| Telecommunications Co. | 5,804 | 106 |
| | | 27,353 |
Utilities (1.9%) | | |
| FPL Group, Inc. | 82,253 | 5,304 |
| Questar Corp. | 35,154 | 1,790 |
| MDU Resources Group, Inc. | 36,402 | 944 |
| Energen Corp. | 13,746 | 865 |
| National Fuel Gas Co. | 17,249 | 744 |
| UGI Corp. Holding Co. | 20,974 | 558 |
| Aqua America, Inc. | 26,637 | 531 |
| Black Hills Corp. | 8,105 | 314 |
| New Jersey Resources Corp. | 5,587 | 262 |
| Northwest Natural Gas Co. | 5,086 | 241 |
| Otter Tail Corp. | 5,979 | 195 |
| California Water Service Group | 4,086 | 142 |
| American States Water Co. | 3,672 | 127 |
| SJW Corp. | 3,896 | 118 |
| Southwest Water Co. | 5,401 | 62 |
| | | 12,197 |
Total Common Stocks | | |
(Cost $654,230) | | 656,228 |
Temporary Cash Investments (0.1%) | | |
1 | Vanguard Market Liquidity | | |
| Fund, 4.060% | 95,456 | 95 |
1 | Vanguard Market Liquidity | | |
| Fund, 4.060%—Note E | 635,100 | 635 |
Total Temporary Cash Investments | | |
(Cost $730) | | 730 |
Total Investments (99.8%) | | |
(Cost $654,960) | | 656,958 |
Other Assets and Liabilities—Net (0.2%) | | 1,527 |
Net Assets (100%) | | 658,485 |
16
| Market |
| Value• |
| ($000) |
Statement of Assets and Liabilities | |
Assets | |
Investments in Securities, at Value | 656,958 |
Receivables for Investment Securities Sold | 61,600 |
Other Assets—Note B | 765 |
Total Assets | 719,323 |
Liabilities | |
Payables for Investment | |
Securities Purchased | 59,832 |
Other Liabilities—Note E | 1,006 |
Total Liabilities | 60,838 |
Net Assets | 658,485 |
At January 31, 2008, net assets consisted of:2 |
| Amount |
| ($000) |
Paid-in Capital | 673,065 |
Undistributed Net Investment Income | 557 |
Accumulated Net Realized Losses | (17,135) |
Unrealized Appreciation | 1,998 |
Net Assets | 658,485 |
| |
Investor Shares—Net Assets | |
Applicable to 16,672,716 outstanding | |
$.001 par value shares of beneficial | |
interest (unlimited authorization) | 356,719 |
Net Asset Value Per Share— | |
Investor Shares | $21.40 |
| |
ETF Shares—Net Assets | |
Applicable to 5,642,279 outstanding | |
$.001 par value shares of beneficial | |
interest (unlimited authorization) | 301,766 |
Net Asset Value Per Share— | |
ETF Shares | $53.48 |
• | See Note A in Notes to Financial Statements. |
^ | Part of security position is on loan to broker-dealers. See Note E in Notes to Financial Statements. |
1 Affiliated money market fund available only to Vanguard funds and certain trusts and accounts managed by Vanguard. Rate shown is the 7-day yield.
2 See Note C in Notes to Financial Statements for the tax-basis components of net assets.
17
Statement of Operations
| Year Ended |
| January 31, 2008 |
| ($000) |
Investment Income | |
Income | |
Dividends | 8,571 |
Interest1 | 83 |
Security Lending | 13 |
Total Income | 8,667 |
Expenses | |
The Vanguard Group—Note B | |
Investment Advisory Services | 50 |
Management and Administrative | |
Investor Shares | 921 |
ETF Shares | 374 |
Marketing and Distribution | |
Investor Shares | 65 |
ETF Shares | 41 |
Custodian Fees | 75 |
Auditing Fees | 19 |
Shareholders’ Reports | |
Investor Shares | 6 |
ETF Shares | 3 |
Total Expenses | 1,554 |
Net Investment Income | 7,113 |
Realized Net Gain (Loss) on Investment Securities Sold | (8,098) |
Change in Unrealized Appreciation (Depreciation) of Investment Securities | (9,574) |
Net Increase (Decrease) in Net Assets Resulting from Operations | (10,559) |
1 Interest income from an affiliated company of the fund was $83,000.
18
Statement of Changes in Net Assets
| Year Ended | April 21, 20061 |
| January 31, | to January 31, |
| 2008 | 2007 |
| ($000) | ($000) |
Increase (Decrease) in Net Assets | | |
Operations | | |
Net Investment Income | 7,113 | 1,684 |
Realized Net Gain (Loss) | (8,098) | 3,114 |
Change in Unrealized Appreciation (Depreciation) | (9,574) | 11,572 |
Net Increase (Decrease) in Net Assets Resulting from Operations | (10,559) | 16,370 |
Distributions | | |
Net Investment Income | | |
Investor Shares | (4,174) | (959) |
ETF Shares | (2,783) | (599) |
Realized Capital Gain | | |
Investor Shares | — | — |
ETF Shares | — | — |
Total Distributions | (6,957) | (1,558) |
Capital Share Transactions—Note F | | |
Investor Shares | 204,617 | 153,498 |
ETF Shares | 197,765 | 105,309 |
Net Increase (Decrease) from Capital Share Transactions | 402,382 | 258,807 |
Total Increase (Decrease) | 384,866 | 273,619 |
Net Assets | | |
Beginning of Period | 273,619 | — |
End of Period2 | 658,485 | 273,619 |
1 Inception.
2 Net Assets—End of Period includes undistributed net investment income of $557,000 and $126,000.
19
Financial Highlights
Investor Shares | | |
| Year | April 27, |
| Ended | 20061 to |
| Jan. 31, | Jan. 31, |
For a Share Outstanding Throughout Each Period | 2008 | 2007 |
Net Asset Value, Beginning of Period | $21.84 | $20.05 |
Investment Operations | | |
Net Investment Income | .325 | .214 |
Net Realized and Unrealized Gain (Loss) on Investments | (.438) | 1.782 |
Total from Investment Operations | (.113) | 1.996 |
Distributions | | |
Dividends from Net Investment Income | (.327) | (.206) |
Distributions from Realized Capital Gains | — | — |
Total Distributions | (.327) | (.206) |
Net Asset Value, End of Period | $21.40 | $21.84 |
| | |
Total Return2 | –0.58% | 10.02% |
| | |
Ratios/Supplemental Data | | |
Net Assets, End of Period (Millions) | $357 | $163 |
Ratio of Total Expenses to Average Net Assets | 0.40% | 0.40%* |
Ratio of Net Investment Income to Average Net Assets | 1.56% | 1.53%* |
Portfolio Turnover Rate3 | 17% | 21% |
1 Inception.
2 Total returns do not include the account service fee that may be applicable to certain accounts with balances below $10,000.
3 Excludes the value of portfolio securities received or delivered as a result of in-kind purchases or redemptions of the fund’s capital shares, including ETF creation units.
20
ETF Shares | | |
| Year | April 21, |
| Ended | 20061 to |
| Jan. 31, | Jan. 31, |
For a Share Outstanding Throughout Each Period | 2008 | 2007 |
Net Asset Value, Beginning of Period | $54.60 | $49.94 |
Investment Operations | | |
Net Investment Income | .873 | .555 |
Net Realized and Unrealized Gain (Loss) on Investments | (1.120) | 4.631 |
Total from Investment Operations | (.247) | 5.186 |
Distributions | | |
Dividends from Net Investment Income | (.873) | (.526) |
Distributions from Realized Capital Gains | — | — |
Total Distributions | (.873) | (.526) |
Net Asset Value, End of Period | $53.48 | $54.60 |
| | |
Total Return | –0.51% | 10.45% |
| | |
Ratios/Supplemental Data | | |
Net Assets, End of Period (Millions) | $302 | $111 |
Ratio of Total Expenses to Average Net Assets | 0.28% | 0.28%* |
Ratio of Net Investment Income to Average Net Assets | 1.68% | 1.65%* |
Portfolio Turnover Rate2 | 17% | 21% |
1 Inception.
2 Excludes the value of portfolio securities received or delivered as a result of in-kind purchases or redemptions of the fund’s capital shares, including ETF creation units.
See accompanying Notes, which are an integral part of the Financial Statements.
21
Notes to Financial Statements
Vanguard Dividend Appreciation Index Fund is registered under the Investment Company Act of 1940 as an open-end investment company, or mutual fund. The fund files reports with the SEC under the company name Vanguard Specialized Funds. The fund offers two classes of shares: Investor Shares and ETF Shares. Investor Shares are available to any investor who meets the fund’s minimum purchase requirements. ETF Shares are listed for trading on the American Stock Exchange; they can be purchased and sold through a broker.
A. The following significant accounting policies conform to generally accepted accounting principles for U.S. mutual funds. The fund consistently follows such policies in preparing its financial statements.
1. Security Valuation: Securities are valued as of the close of trading on the New York Stock Exchange (generally 4 p.m., Eastern time) on the valuation date. Equity securities are valued at the latest quoted sales prices or official closing prices taken from the primary market in which each security trades; such securities not traded on the valuation date are valued at the mean of the latest quoted bid and asked prices. Securities for which market quotations are not readily available, or whose values have been materially affected by events occurring before the fund’s pricing time but after the close of the securities’ primary markets, are valued by methods deemed by the board of trustees to represent fair value. Investments in Vanguard Market Liquidity Fund are valued at that fund’s net asset value.
2. Federal Income Taxes: The fund intends to continue to qualify as a regulated investment company and distribute all of its taxable income. Accordingly, no provision for federal income taxes is required in the financial statements.
3. Distributions: Distributions to shareholders are recorded on the ex-dividend date.
4. Security Lending: The fund may lend its securities to qualified institutional borrowers to earn additional income. Security loans are required to be secured at all times by collateral at least equal to the market value of securities loaned. The fund invests cash collateral received in Vanguard Market Liquidity Fund and records a liability for the return of the collateral, during the period the securities are on loan. Security lending income represents the income earned on investing cash collateral, less expenses associated with the loan.
5. Other: Dividend income is recorded on the ex-dividend date. Interest income includes income distributions received from Vanguard Market Liquidity Fund and is accrued daily. Security transactions are accounted for on the date securities are bought or sold. Costs used to determine realized gains (losses) on the sale of investment securities are those of the specific securities sold.
Each class of shares has equal rights as to assets and earnings, except that each class separately bears certain class-specific expenses related to maintenance of shareholder accounts (included in Management and Administrative expenses) and shareholder reporting. Marketing and distribution expenses are allocated to each class of shares based on a method approved by the board of trustees. Income, other non-class-specific expenses, and gains and losses on investments are allocated to each class of shares based on its relative net assets.
B. The Vanguard Group furnishes at cost investment advisory, corporate management, administrative, marketing, and distribution services. The costs of such services are allocated to the fund under methods approved by the board of trustees. The fund has committed to provide up to 0.40% of its net assets in capital contributions to Vanguard. At January 31, 2008, the fund had contributed capital of $49,000 to Vanguard (included in Other Assets), representing 0.01% of the fund’s net assets and 0.05% of Vanguard’s capitalization. The fund’s trustees and officers are also directors and officers of Vanguard.
22
C. Distributions are determined on a tax basis and may differ from net investment income and realized capital gains for financial reporting purposes. Differences may be permanent or temporary. Permanent differences are reclassified among capital accounts in the financial statements to reflect their tax character. Temporary differences arise when certain items of income, expense, gain, or loss are recognized in different periods for financial statement and tax purposes; these differences will reverse at some time in the future. Differences in classification may also result from the treatment of short-term gains as ordinary income for tax purposes.
During the year ended January 31, 2008, the fund realized $8,651,000 of net capital gains resulting from in-kind redemptions—in which shareholders exchanged fund shares for securities held by the fund rather than for cash. Because such gains are not taxable to the fund, and are not distributed to shareholders, they have been reclassified from accumulated net realized gains to paid-in capital.
For tax purposes, at January 31, 2008, the fund had $705,000 of ordinary income available for distribution. The fund had available realized losses of $14,431,000 to offset future net capital gains of $608,000 through January 31, 2016, and $13,823,000 through January 31, 2017.
At January 31, 2008, the cost of investment securities for tax purposes was $657,664,000. Net unrealized depreciation of investment securities for tax purposes was $706,000, consisting of unrealized gains of $24,083,000 on securities that had risen in value since their purchase and $24,789,000 in unrealized losses on securities that had fallen in value since their purchase.
D. During the year ended January 31, 2008, the fund purchased $519,153,000 of investment securities and sold $118,490,000 of investment securities other than temporary cash investments.
E. The market value of securities on loan to broker-dealers at January 31, 2008, was $617,000, for which the fund received cash collateral of $635,000.
F. Capital share transactions for each class of shares were:
| | Year Ended | April 21, 20061 to |
| January 31, 2008 | January 31, 2007 |
| Amount | Shares | Amount | Shares |
| ($000) | (000) | ($000) | (000) |
Investor Shares | | | | |
Issued | 233,275 | 10,505 | 164,261 | 7,978 |
Issued in Lieu of Cash Distributions | 3,696 | 165 | 586 | 28 |
Redeemed | (32,354) | (1,454) | (11,349) | (550) |
Net Increase (Decrease)—Investor Shares | 204,617 | 9,216 | 153,498 | 7,456 |
ETF Shares | | | | |
Issued | 241,521 | 4,414 | 136,841 | 2,628 |
Issued in Lieu of Cash Distributions | — | — | — | — |
Redeemed | (43,756) | (800) | (31,532) | (600) |
Net Increase (Decrease)—ETF Shares | 197,765 | 3,614 | 105,309 | 2,028 |
1 Inception date for the fund and the ETF Shares. Inception date for the Investor Shares was April 27, 2006.
23
G. In June 2006, the Financial Accounting Standards Board issued Interpretation No. 48 (“FIN 48”), “Accounting for Uncertainty in Income Taxes.” FIN 48 establishes the minimum threshold for recognizing, and a system for measuring, the benefits of tax-return positions in financial statements, effective for the fund’s current fiscal year. Management has analyzed the fund’s tax positions taken on federal income tax returns for all open tax years (tax years ended January 31, 2007–2008) for purposes of implementing FIN 48, and has concluded that no provision for income tax is required in the fund’s financial statements.
24
Report of Independent Registered Public Accounting Firm
To the Trustees of Vanguard Specialized Funds and the Shareholders of Vanguard Dividend Appreciation Index Fund:
In our opinion, the accompanying statements of net assets and of assets and liabilities and the related statements of operations and of changes in net assets and the financial highlights present fairly, in all material respects, the financial position of Vanguard Dividend Appreciation Index Fund (constituting a separate portfolio of Vanguard Specialized Funds, hereafter referred to as the “Fund”) at January 31, 2008, the results of its operations for the year then ended, and the changes in its net assets and the financial highlights for each of the periods indicated, in conformity with accounting principles generally accepted in the United States of America. These financial statements and financial highlights (hereafter referred to as “financial statements”) are the responsibility of the Fund’s management; our responsibility is to express an opinion on these financial statements based on our audits. We conducted our audits of these financial statements in accordance with the standards of the Public Company Accounting Oversight Board (United States). Those standards require that we plan and perform the audit to obtain reasonable assurance about whether the financial statements are free of material misstatement. An audit includes examining, on a test basis, evidence supporting the amounts and disclosures in the financial statements, assessing the accounting principles used and significant estimates made by management, and evaluating the overall financial statement presentation. We believe that our audits, which included confirmation of securities at January 31, 2008 by correspondence with the custodian and by agreement to the underlying ownership records for Vanguard Market Liquidity Fund, provide a reasonable basis for our opinion.
PricewaterhouseCoopers LLP
Philadelphia, Pennsylvania
March 12, 2008
Special 2007 tax information (unaudited) for Vanguard Dividend Appreciation Index Fund
This information for the fiscal year ended January 31, 2008, is included pursuant to provisions of the Internal Revenue Code.
The fund distributed $6,957,000 of qualified dividend income to shareholders during the fiscal year.
For corporate shareholders, 100.0% of investment income (dividend income plus short-term gains, if any) qualifies for the dividends-received deduction.
25
Your Fund’s After-Tax Returns
This table presents returns for your fund both before and after taxes. The after-tax returns are shown in two ways: (1) assuming that an investor owned the fund during the entire period and paid taxes on the fund’s distributions, and (2) assuming that an investor paid taxes on the fund’s distributions and sold all shares at the end of each period.
Calculations are based on the highest individual federal income tax and capital gains tax rates in effect at the times of the distributions and the hypothetical sales. State and local taxes were not considered. After-tax returns reflect any qualified dividend income, using actual prior-year figures and estimates for 2008. (In the example, returns after the sale of fund shares may be higher than those assuming no sale. This occurs when the sale would have produced a capital loss. The calculation assumes that the investor received a tax deduction for the loss.)
The table shows returns for Investor Shares only; returns for other share classes will differ. Please note that your actual after-tax returns will depend on your tax situation and may differ from those shown. Also note that if you own the fund in a tax-deferred account, such as an individual retirement account or a 401(k) plan, this information does not apply to you. Such accounts are not subject to current taxes.
Finally, keep in mind that a fund’s performance—whether before or after taxes—does not guarantee future results.
Average Annual Total Returns: Dividend Appreciation Index Fund Investor Shares1 |
Periods Ended January 31, 2008 | | |
| One | Since |
| Year | Inception2 |
Returns Before Taxes | –0.58% | 5.22% |
Returns After Taxes on Distributions | –0.79 | 5.00 |
Returns After Taxes on Distributions and Sale of Fund Shares | –0.07 | 4.45 |
1 Total returns do not include the account service fee that may be applicable to certain accounts with balances below $10,000.
2 April 27, 2006.
26
About Your Fund’s Expenses
As a shareholder of the fund, you incur ongoing costs, which include costs for portfolio management, administrative services, and shareholder reports (like this one), among others. Operating expenses, which are deducted from a fund’s gross income, directly reduce the investment return of the fund.
A fund’s expenses are expressed as a percentage of its average net assets. This figure is known as the expense ratio. The following examples are intended to help you understand the ongoing costs (in dollars) of investing in your fund and to compare these costs with those of other mutual funds. The examples are based on an investment of $1,000 made at the beginning of the period shown and held for the entire period.
The table below illustrates your fund’s costs in two ways:
• Based on actual fund return. This section helps you to estimate the actual expenses that you paid over the period. The “Ending Account Value” shown is derived from the fund’s actual return, and the third column shows the dollar amount that would have been paid by an investor who started with $1,000 in the fund. You may use the information here, together with the amount you invested, to estimate the expenses that you paid over the period.
To do so, simply divide your account value by $1,000 (for example, an $8,600 account value divided by $1,000 = 8.6), then multiply the result by the number given for your fund under the heading “Expenses Paid During Period.”
• Based on hypothetical 5% yearly return. This section is intended to help you compare your fund’s costs with those of other mutual funds. It assumes that the fund had a yearly return of 5% before expenses, but that the expense ratio is unchanged. In this case—because the return used is not the fund’s actual return—the results do not apply to your investment. The example is useful in making comparisons because the Securities and Exchange Commission requires all mutual funds to calculate expenses based on a 5% return. You can assess your fund’s costs by comparing this hypothetical example with the hypothetical examples that appear in shareholder reports of other funds.
Six Months Ended January 31, 2008 | | | |
| Beginning | Ending | Expenses |
| Account Value | Account Value | Paid During |
Dividend Appreciation Index Fund | 7/31/2007 | 1/31/2008 | Period1 |
Based on Actual Fund Return | | | |
Investor Shares | $1,000.00 | $980.35 | $2.00 |
ETF Shares | 1,000.00 | 980.61 | 1.40 |
Based on Hypothetical 5% Return | | | |
Investor Shares | $1,000.00 | $1,023.19 | $2.04 |
ETF Shares | 1,000.00 | 1,023.79 | 1.43 |
1 These calculations are based on expenses incurred in the most recent six-month period. The fund’s annualized six-month expense ratios for that period are 0.40% for Investor Shares and 0.28% for ETF Shares. The dollar amounts shown as “Expenses Paid” are equal to the annualized expense ratio multiplied by the average account value over the period, multiplied by the number of days in the most recent six-month period, then divided by the number of days in the most recent 12-month period.
27
Note that the expenses shown on page 23 are meant to highlight and help you compare ongoing costs only and do not reflect transaction costs incurred by the fund for buying and selling securities. Further, the expenses do not include the account service fee described in the prospectus. If such a fee were applied to your account, your costs would be higher. Your fund does not charge transaction fees, such as purchase or redemption fees, nor does it carry a “sales load.”
The calculations assume no shares were bought or sold during the period. Your actual costs may have been higher or lower, depending on the amount of your investment and the timing of any purchases or redemptions.
You can find more information about the fund’s expenses, including annual expense ratios, in the Financial Statements section of this report. For additional information on operating expenses and other shareholder costs, please refer to the appropriate fund prospectus.
28
Glossary
Earnings Growth Rate. The average annual rate of growth in earnings over the past five years for the stocks now in a fund.
Equity Exposure. A measure that reflects a fund’s investments in stocks and stock futures. Any holdings in short-term reserves are excluded.
Expense Ratio. The percentage of a fund’s average net assets used to pay its annual administrative and advisory expenses. These expenses directly reduce returns to investors.
Foreign Holdings. The percentage of a fund represented by stocks or depositary receipts of companies based outside the United States.
Inception Date. The date on which the assets of a fund (or one of its share classes) are first invested in accordance with the fund’s investment objective. For funds with a subscription period, the inception date is the day after that period ends. Investment performance is measured from the inception date.
Median Market Cap. An indicator of the size of companies in which a fund invests; the midpoint of market capitalization (market price x shares outstanding) of a fund’s stocks, weighted by the proportion of the fund’s assets invested in each stock. Stocks representing half of the fund’s assets have market capitalizations above the median, and the rest are below it.
Price/Book Ratio. The share price of a stock divided by its net worth, or book value, per share. For a fund, the weighted average price/book ratio of the stocks it holds.
Price/Earnings Ratio. The ratio of a stock’s current price to its per-share earnings over the past year. For a fund, the weighted average P/E of the stocks it holds. P/E is an indicator of market expectations about corporate prospects; the higher the P/E, the greater the expectations for a company’s future growth.
Return on Equity. The annual average rate of return generated by a company during the past five years for each dollar of shareholder’s equity (net income divided by shareholder’s equity). For a fund, the weighted average return on equity for the companies whose stocks it holds.
Short-Term Reserves. The percentage of a fund invested in highly liquid, short-term securities that can be readily converted to cash.
Turnover Rate. An indication of the fund’s trading activity. Funds with high turnover rates incur higher transaction costs and may be more likely to distribute capital gains (which may be taxable to investors). The turnover rate excludes in-kind transactions, which have minimal impact on costs.
Yield. A snapshot of a fund’s income from interest and dividends. The yield, expressed as a percentage of the fund’s net asset value, is based on income earned over the past 30 days and is annualized, or projected forward for the coming year. The index yield is based on the current annualized rate of income provided by securities in the index.
29
This page intentionally left blank.
This page intentionally left blank.
This page intentionally left blank.
The People Who Govern Your Fund
The trustees of your mutual fund are there to see that the fund is operated and managed in your best interests since, as a shareholder, you are a part owner of the fund. Your fund’s trustees also serve on the board of directors of The Vanguard Group, Inc., which is owned by the Vanguard funds and provides services to them on an at-cost basis.
A majority of Vanguard’s board members are independent, meaning that they have no affiliation with Vanguard or the funds they oversee, apart from the sizable personal investments they have made as private individuals.
Our independent board members bring distinguished backgrounds in business, academia, and public service to their task of working with Vanguard officers to establish the policies and oversee the activities of the funds. Among board members’ responsibilities are selecting investment advisors for the funds; monitoring fund operations, performance, and costs; reviewing contracts; nominating and selecting new trustees/directors; and electing Vanguard officers.
Each trustee serves a fund until its termination; or until the trustee’s retirement, resignation, or death; or otherwise as specified in the fund’s organizational documents. Any trustee may be removed at a shareholders’ meeting by a vote representing two-thirds of the net asset value of all shares of the fund together with shares of other Vanguard funds organized within the same trust. The table on these two pages shows information for each trustee and executive officer of the fund. The mailing address of the trustees and officers is P.O. Box 876, Valley Forge, PA 19482.
Chairman of the Board, Chief Executive Officer, and Trustee |
| |
John J. Brennan1 | |
Born 1954 | Principal Occupation(s) During the Past Five Years: Chairman of the Board, Chief Executive |
Trustee since May 1987; | Officer, and Director/Trustee of The Vanguard Group, Inc., and of each of the investment |
Chairman of the Board and | companies served by The Vanguard Group. |
Chief Executive Officer | |
152 Vanguard Funds Overseen | |
| |
Independent Trustees | |
| |
Charles D. Ellis | |
Born 1937 | Principal Occupation(s) During the Past Five Years: Applecore Partners (pro bono ventures |
Trustee since January 2001 | in education); Senior Advisor to Greenwich Associates (international business strategy |
152 Vanguard Funds Overseen | consulting); Successor Trustee of Yale University; Overseer of the Stern School of Business |
| at New York University; Trustee of the Whitehead Institute for Biomedical Research. |
| |
Emerson U. Fullwood | |
Born 1948 | Principal Occupation(s) During the Past Five Years: Executive Chief Staff and Marketing |
Trustee since January 2008 | Officer for North America since 2004 and Corporate Vice President of Xerox Corporation |
152 Vanguard Funds Overseen | (photocopiers and printers); Director of SPX Corporation (multi-industry manufacturing), |
| of the United Way of Rochester, and of the Boy Scouts of America. |
| |
Rajiv L. Gupta | |
Born 1945 | Principal Occupation(s) During the Past Five Years: Chairman, President, and |
Trustee since December 20012 | Chief Executive Officer of Rohm and Haas Co. (chemicals); Board Member of |
152 Vanguard Funds Overseen | the American Chemistry Council; Director of Tyco International, Ltd. (diversified |
| manufacturing and services) since 2005. |
Amy Gutmann | |
Born 1949 | Principal Occupation(s) During the Past Five Years: President of the University of |
Trustee since June 2006 | Pennsylvania since 2004; Professor in the School of Arts and Sciences, Annenberg School |
152 Vanguard Funds Overseen | for Communication, and Graduate School of Education of the University of Pennsylvania |
| since 2004; Provost (2001–2004) and Laurance S. Rockefeller Professor of Politics and |
| the University Center for Human Values (1990–2004), Princeton University; Director of |
| Carnegie Corporation of New York since 2005 and of Schuylkill River Development |
| Corporation and Greater Philadelphia Chamber of Commerce since 2004. |
| |
JoAnn Heffernan Heisen | |
Born 1950 | Principal Occupation(s) During the Past Five Years: Corporate Vice President and |
Trustee since July 1998 | Chief Global Diversity Officer since 2006, Vice President and Chief Information |
152 Vanguard Funds Overseen | Officer (1997–2005), and Member of the Executive Committee of Johnson & |
| Johnson (pharmaceuticals/consumer products); Director of the University Medical |
| Center at Princeton and Women’s Research and Education Institute. |
| |
André F. Perold | |
Born 1952 | Principal Occupation(s) During the Past Five Years: George Gund Professor of Finance |
Trustee since December 2004 | and Banking, Harvard Business School; Senior Associate Dean, Director of Faculty |
152 Vanguard Funds Overseen | Recruiting, and Chair of Finance Faculty, Harvard Business School; Director and Chairman |
| of UNX, Inc. (equities trading firm) since 2003; Chair of the Investment Committee of |
| HighVista Strategies LLC (private investment firm) since 2005. |
| |
Alfred M. Rankin, Jr. | |
Born 1941 | Principal Occupation(s) During the Past Five Years: Chairman, President, Chief Executive |
Trustee since January 1993 | Officer, and Director of NACCO Industries, Inc. (forklift trucks/housewares/lignite); Director |
152 Vanguard Funds Overseen | of Goodrich Corporation (industrial products/aircraft systems and services). |
| |
| |
J. Lawrence Wilson | |
Born 1936 | Principal Occupation(s) During the Past Five Years: Retired Chairman and Chief Executive |
Trustee since April 1985 | Officer of Rohm and Haas Co. (chemicals); Director of Cummins Inc. (diesel engines) and |
152 Vanguard Funds Overseen | AmerisourceBergen Corp. (pharmaceutical distribution); Trustee of Vanderbilt University |
| and of Culver Educational Foundation. |
| |
Executive Officers1 | |
| |
Thomas J. Higgins | |
Born 1957 | Principal Occupation(s) During the Past Five Years: Principal of The Vanguard Group, Inc.; |
Treasurer since July 1998 | Treasurer of each of the investment companies served by The Vanguard Group. |
152 Vanguard Funds Overseen | |
| |
| |
Heidi Stam | |
Born 1956 | Principal Occupation(s) During the Past Five Years: Managing Director of The Vanguard |
Secretary since July 2005 | Group, Inc., since 2006; General Counsel of The Vanguard Group since 2005; Secretary of |
152 Vanguard Funds Overseen | The Vanguard Group, and of each of the investment companies served by The Vanguard |
| Group, since 2005; Principal of The Vanguard Group (1997–2006). |
Vanguard Senior Management Team | | |
| | | |
R. Gregory Barton | Kathleen C. Gubanich | F. William McNabb III | Ralph K. Packard |
Mortimer J. Buckley | Paul A. Heller | Michael S. Miller | George U. Sauter |
Founder |
|
John C. Bogle |
Chairman and Chief Executive Officer, 1974–1996 |
1 Officers of the funds are “interested persons” as defined in the Investment Company Act of 1940.
2 December 2002 for Vanguard Equity Income Fund, Vanguard Growth Equity Fund, the Vanguard Municipal Bond Funds, and the Vanguard State Tax-Exempt Funds.
More information about the trustees is in the Statement of Additional Information, available from The Vanguard Group.
| 
|
| P.O. Box 2600 |
| Valley Forge, PA 19482-2600 |
Connect with Vanguard® > www.vanguard.com
Fund Information > 800-662-7447 | All comparative mutual fund data are from Lipper Inc. |
| or Morningstar, Inc., unless otherwise noted. |
Direct Investor Account Services > 800-662-2739 | |
| |
Institutional Investor Services > 800-523-1036 | You can obtain a free copy of Vanguard’s proxy voting |
| guidelines by visiting our website, www.vanguard.com, |
Text Telephone for People | and searching for “proxy voting guidelines,” or by |
With Hearing Impairment > 800-952-3335 | calling Vanguard at 800-662-2739. The guidelines are |
| also available from the SEC’s website, www.sec.gov. |
| In addition, you may obtain a free report on how your |
| fund voted the proxies for securities it owned during |
This material may be used in conjunction | the 12 months ended June 30. To get the report, visit |
with the offering of shares of any Vanguard | either www.vanguard.com or www.sec.gov. |
fund only if preceded or accompanied by | |
the fund’s current prospectus. | |
| You can review and copy information about your fund |
| at the SEC’s Public Reference Room in Washington, D.C. |
Vanguard, Vanguard ETF, Connect with Vanguard, and the | To find out more about this public service, call the SEC |
ship logo are trademarks of The Vanguard Group, Inc. | at 202-551-8090. Information about your fund is also |
| available on the SEC’s website, and you can receive |
| copies of this information, for a fee, by sending a |
“Dividend Achievers” is a trademark of Mergent, Inc., | request in either of two ways: via e-mail addressed to |
and has been licensed for use by The Vanguard Group, | publicinfo@sec.gov or via regular mail addressed to the |
Inc. Vanguard mutual funds are not sponsored, endorsed, | Public Reference Section, Securities and Exchange |
sold, or promoted by Mergent, and Mergent makes no | Commission, Washington, DC 20549-0102. |
representation regarding the advisability of investing in | |
the funds. | |
| |
| |
All other marks are the exclusive property of their | |
respective owners. | |
| |
| |
| |
| |
| |
| |
| |
| |
| © 2008 The Vanguard Group, Inc. |
| All rights reserved. |
| Vanguard Marketing Corporation, Distributor. |
| |
| Q6020 032008 |
Item 2: Code of Ethics. The Registrant has adopted a code of ethics that applies to the Registrant’s principal executive officer, principal financial officer, principal accounting officer or controller or persons performing similar functions. The Code of Ethics was amended during the reporting period covered by this report to make certain technical, non-material changes.
Item 3: Audit Committee Financial Expert. The following members of the Audit Committee have been determined by the Registrant’s Board of Trustees to be Audit Committee Financial Experts serving on its Audit Committee, and to be independent: Charles D. Ellis, Rajiv L. Gupta, JoAnn Heffernan Heisen, André F. Perold, Alfred M. Rankin, Jr., and J. Lawrence Wilson.
Item 4: Principal Accountant Fees and Services.
(a) Audit Fees.
Audit Fees of the Registrant
Fiscal Year Ended January 31, 2008: $133,000
Fiscal Year Ended January 31, 2007: $142,000
Aggregate Audit Fees of Registered Investment Companies in the Vanguard Group.
Fiscal Year Ended January 31, 2008: $2,835,320
Fiscal Year Ended January 31, 2007: $2,347,620
(b) Audit-Related Fees.
Fiscal Year Ended January 31, 2008: $630,400
Fiscal Year Ended January 31, 2007: $530,000
Includes fees billed in connection with assurance and related services provided to the Registrant, The Vanguard Group, Inc., Vanguard Marketing Corporation, and other registered investment companies in the Vanguard Group.
(c) Tax Fees.
Fiscal Year Ended January 31, 2008: $215,900
Fiscal Year Ended January 31, 2007: $101,300
Includes fees billed in connection with tax compliance, planning and advice services provided to the Registrant, The Vanguard Group, Inc., Vanguard Marketing Corporation, and other registered investment companies in the Vanguard Group and related to income and excise taxes.
(d) All Other Fees.
Fiscal Year Ended January 31, 2008: $0
Fiscal Year Ended January 31, 2007: $0
Includes fees billed for services related to risk management and privacy matters. Services were provided to the Registrant, The Vanguard Group, Inc., Vanguard Marketing Corporation, and other registered investment companies in the Vanguard Group.
(e) (1) Pre-Approval Policies. The policy of the Registrant’s Audit Committee is to consider and, if appropriate, approve before the principal accountant is engaged for such services, all specific audit and non-audit services provided to: (1) the Registrant; (2) The Vanguard Group, Inc.; (3) other entities controlled by The Vanguard Group, Inc. that provide ongoing services to the Registrant; and (4) other registered investment companies in the Vanguard Group. In making a determination, the Audit Committee considers whether the services are consistent with maintaining the principal accountant’s independence.
In the event of a contingency situation in which the principal accountant is needed to provide services in between scheduled Audit Committee meetings, the Chairman of the Audit Committee would be called on to consider and, if appropriate, pre-approve audit or permitted non-audit services in an amount sufficient to complete services through the next Audit Committee meeting, and to determine if such services would be consistent with maintaining the accountant’s independence. At the next scheduled Audit Committee meeting, services and fees would be presented to the Audit Committee for formal consideration, and, if appropriate, approval by the entire Audit Committee. The Audit Committee would again consider whether such services and fees are consistent with maintaining the principal accountant’s independence.
The Registrant’s Audit Committee is informed at least annually of all audit and non-audit services provided by the principal accountant to the Vanguard complex, whether such services are provided to: (1) the Registrant; (2) The Vanguard Group, Inc.; (3) other entities controlled by The Vanguard Group, Inc. that provide ongoing services to the Registrant; or (4) other registered investment companies in the Vanguard Group.
(2) No percentage of the principal accountant’s fees or services were approved pursuant to the waiver provision of paragraph (c)(7)(i)(C) of Rule 2-01 of Regulation S-X.
(f) For the most recent fiscal year, over 50% of the hours worked under the principal accountant’s engagement were not performed by persons other than full-time, permanent employees of the principal accountant.
(g) Aggregate Non-Audit Fees.
Fiscal Year Ended January 31, 2008: $215,900
Fiscal Year Ended January 31, 2007: $101,300
Includes fees billed for non-audit services provided to the Registrant, The Vanguard Group, Inc., Vanguard Marketing Corporation, and other registered investment companies in the Vanguard Group.
(h) For the most recent fiscal year, the Audit Committee has determined that the provision of all non-audit services was consistent with maintaining the principal accountant’s independence.
Item 5: Not Applicable.
Item 6: Not Applicable.
Item 7: Not Applicable.
Item 8: Not Applicable.
Item 9: Not Applicable.
Item 10: Not Applicable.
Item 11: Controls and Procedures.
(a) Disclosure Controls and Procedures. The Principal Executive and Financial Officers concluded that the Registrant's Disclosure Controls and Procedures are effective based on their evaluation of the Disclosure Controls and Procedures as of a date within 90 days of the filing date of this report.
(b) Internal Control Over Financial Reporting. There were no significant changes in Registrant’s Internal Control Over Financial Reporting or in other factors that could significantly affect this control subsequent to the date of the evaluation, including any corrective actions with regard to significant deficiencies and material weaknesses.
Item 12: Exhibits.
Pursuant to the requirements of the Securities Exchange Act of 1934 and the Investment Company Act of 1940, the registrant has duly caused this report to be signed on its behalf by the undersigned, thereunto duly authorized.
| VANGUARD SPECIALIZED FUNDS |
| |
By: | (signature) |
| (HEIDI STAM) |
| JOHN J. BRENNAN* |
| CHIEF EXECUTIVE OFFICER |
| |
Date: March 17, 2008 |
Pursuant to the requirements of the Securities Exchange Act of 1934 and the Investment Company Act of 1940, this report has been signed below by the following persons on behalf of the registrant and in the capacities and on the dates indicated.
| VANGUARD SPECIALIZED FUNDS |
| |
By: | (signature) |
| (HEIDI STAM) |
| JOHN J. BRENNAN* |
| CHIEF EXECUTIVE OFFICER |
| |
Date: March 17, 2008 |
| VANGUARD SPECIALIZED FUNDS |
| |
By: | (signature) |
| (HEIDI STAM) |
| THOMAS J. HIGGINS* |
| TREASURER |
| |
Date: March 17, 2008 |
*By Power of Attorney. Filed on January 18, 2008, see File Number 2-29601. Incorporated by Reference.