UNITED STATES
SECURITIES AND EXCHANGE COMMISSION
Washington, D.C. 20549
FORM N-CSR
CERTIFIED SHAREHOLDER REPORT
OF
REGISTERED MANAGEMENT INVESTMENT COMPANIES
Investment Company Act file number: 811-3916
Name of Registrant: Vanguard Specialized Funds
Address of Registrant:
P.O. Box 2600
Valley Forge, PA 19482
Name and address of agent for service:
Heidi Stam, Esquire
P.O. Box 876
Valley Forge, PA 19482
Registrant’s telephone number, including area code: (610) 669-1000
Date of fiscal year end: January 31
Date of reporting period: February 1, 2009 – January 31, 2010
Item 1: Reports to Shareholders
 |
| Vanguard Energy Fund |
| Annual Report |
|
|
| January 31, 2010 |
|
 |
|
|
> As crude oil prices rose from their February lows, Vanguard Energy Fund returned about 36% for the fiscal year ended January 31, 2010.
> The fund’s return lagged the average return of its global natural resources peers, but was far ahead of the result of its highly concentrated all-U.S. benchmark index.
> The Energy Fund maintained its long-term performance edge over its comparative standards and the broad U.S. stock market for the decade ended January 31, with an average annual return of about 16%.
| |
| Contents | |
| Your Fund’s Total Returns. | 1 |
| Chairman’s Letter. | 2 |
| Advisors’ Report. | 9 |
| Fund Profile. | 12 |
| Performance Summary. | 14 |
| Financial Statements. | 16 |
| Your Fund’s After-Tax Returns. | 30 |
| About Your Fund’s Expenses. | 31 |
| Glossary. | 33 |
Past performance is not a guarantee of future results. (Current performance may be lower or higher than the performance data cited. For performance data current to the most recent month-end, visit our website at www.vanguard.com/performance.) Note, too, that both investment returns and principal value can fluctuate widely, so an investor’s shares, when sold, could be worth more or less than their original cost.
Please note: The opinions expressed in this report are just that—informed opinions. They should not be considered promises or advice. Also, please keep in mind that the information and opinions cover the period through the date on the front of this report. Of course, the risks of investing in your fund are spelled out in the prospectus.
See the Glossary for definitions of investment terms used in this report.
Cover photograph: Veronica Coia.
Your Fund’s Total Returns
| |
| Fiscal Year Ended January 31, 2010 | |
| | Total |
| | Returns |
| Vanguard Energy Fund | |
| Investor Shares | 36.28% |
| Admiral™ Shares | 36.37 |
| S&P Energy Sector Index | 12.24 |
| Global Natural Resources Funds Average | 42.50 |
| Global Natural Resources Funds Average: Derived from data provided by Lipper Inc. | |
Admiral Shares are a lower-cost class of shares available to many longtime shareholders and to those with significant investments in the fund.
| | | | |
| Your Fund’s Performance at a Glance | | | | |
| January 31, 2009 , Through January 31, 2010 | | | | |
| | | | Distributions Per Share |
| | Starting | Ending | Income | Capital |
| | Share Price | Share Price | Dividends | Gains |
| Vanguard Energy Fund | | | | |
| Investor Shares | $42.62 | $57.17 | $0.951 | $0.000 |
| Admiral Shares | 80.02 | 107.34 | 1.855 | 0.000 |
1

Chairman’s Letter
Dear Shareholder,
Amid the U.S. stock market’s robust rebound, the energy sector was one of the laggards: The Standard & Poor’s Energy Sector Index returned “only” about 12% for the fiscal year ended January 31, 2010. But this didn’t hold back Vanguard Energy Fund, which returned about 36%, an exceptional performance that nevertheless fell a bit short of the peer group’s average return.
The fund’s success is a tribute to the disciplined, value-conscious investment strategy of its advisors, Wellington Management Company, LLP (which manages most of the fund’s assets) and Vanguard Quantitative Equity Group. In a year in which the rising tide did not lift all boats, the advisors’ ability to identify companies with superior management teams or assets, or both, played a key role in the fund’s success. So, too, did holding a globally diversified portfolio. The fund’s all-U.S. benchmark, which provides a useful guidepost for evaluation, is concentrated in some supersized holdings that can heavily influence its returns.
If you invest in the Energy Fund through a taxable account, you may wish to review information about the fund’s after-tax performance provided later in this report.
2
Remarkable rally loses steam at year-end
The broad U.S. stock market returned about 36% for the 12 months through January 31. Stocks began the period under severe pressure from the global financial crisis and a stalled U.S. economy. After a dismal showing in February 2009, however, U.S. equities turned the corner in early March and kept surging until the fiscal year’s final weeks, when the major market indexes pulled back a bit. During the rally, the federal government’s stimulus plan took hold, companies began to repair their balance sheets, and investors increased their appetite for risk—the riskier the better, it seemed.
The stock market’s exuberance overshot the pace of economic recovery, which slowly improved as the year progressed. It wasn’t until the third calendar quarter that the recession appeared to be ending, and double-digit unemployment still weighed on the economy.
International markets traced an even steeper line upward than their U.S. counterpart for most of the fiscal year. They recovered strongly through 2009 and into 2010, before dropping in the latter half of January amid concerns about the strength of the global recovery. The most impressive international returns came from emerging markets, with especially strong results from Brazil and China.
| | | |
| Market Barometer | | | |
| |
| | | Average Annual Total Returns |
| | | Periods Ended January 31, 2010 |
| | One | Three | Five |
| | Year | Years | Years |
| Stocks | | | |
| Russell 1000 Index (Large-caps) | 34.81% | -7.10% | 0.57% |
| Russell 2000 Index (Small-caps) | 37.82 | -7.74 | 0.61 |
| Dow Jones U.S. Total Stock Market Index | 36.06 | -6.72 | 0.94 |
| MSCI All Country World Index ex USA (International) | 48.28 | -4.76 | 5.61 |
| |
| Bonds | | | |
| Barclays Capital U.S. Aggregate Bond Index (Broad | | | |
| taxable market) | 8.51% | 6.60% | 5.16% |
| Barclays Capital Municipal Bond Index | 9.49 | 4.68 | 4.23 |
| Citigroup Three-Month U.S. Treasury Bill Index | 0.15 | 2.07 | 2.84 |
| |
| CPI | | | |
| Consumer Price Index | .63% | 2.30% | 2.59% |
3
Although the fiscal year’s returns were a welcome relief for stock investors worldwide, the severity of the financial crisis continues to depress the longer-term record, especially for U.S. stocks.
Bond returns traced very different courses
The U.S. government’s programs also soothed parts of the bond market as the fiscal year progressed. At the start of the period, the difference between the yields of corporate bonds and those of U.S. Treasuries had widened almost to levels last seen in the 1930s, an indication of just how unwilling investors were to take on risk. As the threat of a depression receded, however, confidence returned and investors flocked to the lowest-quality, highest-yielding bonds, passing over conservative Treasuries, the previous year’s favorite.
For the 12 months ended January 31, the broad taxable bond market returned 8.51%, municipal bonds returned about 9%, and high-yield corporate bonds delivered a stunning 51%. Meanwhile, Treasury returns were negative to lack-luster, depending on their maturity.
While the Federal Reserve’s monetary policies seemed to help the stock market and most areas of the bond market, the policies exacted a heavy price from money market investors. The Fed kept the federal funds rate––the interest rate that banks charge one another for overnight lending,
| | | |
| Expense Ratios | | | |
| Your Fund Compared With Its Peer Group | | | |
| | Investor | Admiral | Peer Group |
| | Shares | Shares | Average |
| Energy Fund | 0.32% | 0.24% | 1.52% |
The fund expense ratios shown are from the prospectus dated May 29, 2009, and represent estimated costs for the current fiscal year based on the fund’s net assets as of the prospectus date. For the fiscal year ended January 31, 2010, the expense ratios were 0.38% for Investor Shares and 0.31% for Admiral Shares. The peer-group expense ratio is derived from data provided by Lipper Inc. and captures information through year-end 2009.
Peer group: Global Natural Resources Funds.
4
a benchmark for the market’s short-term rates––between 0% and 0.25% during the entire fiscal year.
Although the Fed said it planned to maintain that stance for an “extended period,” it recently indicated that it was ready to wind down emergency measures and would halt its purchase of agency mortgage-backed securities and debt in the coming months.
Fund returns were lifted by foreign and exploration companies
In many ways, fiscal year 2010 was a mirror image of last year. Several energy companies enjoyed a tailwind from rising crude oil prices: After slipping into the mid-$30s in February, the price of a barrel of West Texas Intermediate crude rose to
finish the fiscal year in the low $70s. Even with reports of falling global energy demand and concerns about the sustainability of the nascent economic recovery, investors found attractive opportunities in a sector that had been battered during the bear market.
Major integrated oil and gas companies accounted for about half of the market value of fund assets during the year, but contributed less than one-third of the fund’s return. In the sluggish economy, weak demand for gasoline and diesel fuel led to losses in their refining operations, weighing on corporate-wide earnings and stock prices. ExxonMobil’s double-digit decline, and tepid gains by both Chevron (which announced plans to restructure its struggling refining operations) and
| |
| Total Returns | |
| Ten Years Ended January 31, 2010 | |
| | Average |
| | Annual Return |
| Energy Fund Investor Shares | 16.08% |
| S&P Energy Sector Index | 9.52 |
| Global Natural Resources Funds Average | 13.32 |
| Global Natural Resources Funds Average: Derived from data provided by Lipper Inc. | |
The figures shown represent past performance, which is not a guarantee of future results. (Current performance may be lower or higher than the performance data cited. For performance data current to the most recent month-end, visit our website at www.vanguard.com/performance.) Note, too, that both investment returns and principal value can fluctuate widely, so an investor’s shares, when sold, could be worth more or less than their original cost.
5
ConocoPhillips, pulled down the group’s absolute return. However, when compared with the benchmark—in which these three U.S.-based integrated giants accounted for more than one-half of the index’s value, on average (and ExxonMobil alone represented one-third)—the advisors’ more-diversified approach was very rewarding.
In stark contrast to last year, the fund’s foreign-based integrated oil and gas holdings delivered a powerful boost to returns. Some examples: Petróleo Brasileiro (which returned +59%) is positioning Brazil to become Latin America’s largest oil producer; Suncor Energy (+66%) merged with Petro-Canada to become Canada’s largest energy company; and Russia’s Gazprom (+85%) benefited from improving demand for natural gas in Europe.
Among the nonintegrated companies, which focus on either exploration and production or refining and marketing, results diverged. Natural gas prices were soft, but rising oil prices helped the producers, which represented about one-fifth of fund assets and added more than 10 percentage points to the fund’s return. Notable contributors included top-ten holding EOG Resources (+34%), Canadian Natural Resources (+81%), Newfield Exploration (+155%), and Noble Energy (+53%). At the same time, higher prices meant higher feedstock costs and lower profit margins that, along with soft demand, squeezed independent refiners such as Valero Energy (–21%)—but this group represented only a small slice of the portfolio.
Many drillers and equipment and services providers benefited from the pickup in drilling activity—especially for natural gas—and enjoyed robust returns. This group advanced more than 50%, led by Halliburton, Weatherford International, Baker Hughes, and Schlumberger. And top-ten holding BHP Billiton (+91%), an Australian-based diversified mining and metals company, also deserves honorable mention.
With crude oil prices grabbing much of the attention over the past two years, it’s easy to lose sight of natural gas. However, in recent months, natural gas has moved center stage. In addition to being favored by many as a “clean” energy source that is abundant in the United States, natural gas was catapulted into the headlines by ExxonMobil’s plans to acquire XTO Energy (which represented a $41 billion transaction when it was announced in December). XTO, a small holding in the Energy Fund, is a pioneer in a drilling technique that helps produce natural gas from unconventional sources such as shale rock formations.
6
Long-term results shine, smoothing year-to-year volatility
Despite the dramatic turnaround in U.S. equities, the broad U.S. stock market fell below breakeven for the decade ended January 31: The Dow Jones U.S. Total Stock Market Index had an average annual return of –0.09%. In contrast, the Energy Fund had an average annual return of about 16% (see table on page 5), well ahead of the performance of its comparative standards—a tribute to the discipline and risk controls of its advisors. And your fund’s low costs provide an advantage that compounds over time.
Although the fund’s cost advantage over its peer group remains substantial (see the comparison on page 4), the fund’s expense ratio has risen over the past fiscal year.
As the average value of fund assets declined over the past 12 months, the fund’s fixed expenses accounted for a modestly higher percentage of fund assets. In addition, the Vanguard funds' contracts with external advisors typically include breakpoint pricing. As assets rise above a breakpoint threshold, advisory fees are paid at a lower rate. When a fund’s average assets decline, a smaller portion of assets is subject to the lower rate, causing the overall rate to increase. Such was the case during the past fiscal year.
Vanguard’s contracts with external advisors also generally include incentive-fee provisions and penalties that are contingent on the advisors’ performance relative to their benchmarks. This fee structure helps to ensure that the interests of the fund shareholders and advisors remain aligned. Over the past year, the advisory fee increased as the fund’s relative performance improved. The fund’s financial statements include more information about Vanguard Energy Fund’s incentive fee.
And, finally, as noted in the previous semiannual report, the fund’s trustees approved an increase in the advisor’s base fee rate. Altogether, these developments raised the expense ratio by 10 basis points (0.10 percentage point).
Old-fashioned principles apply in the new decade
As we pointed out in last year’s annual report to you, the first decade of the new century coincided with a spectacular boom in energy and other commodity prices that proved, at least temporarily, to be unsustainable. The roller-coaster ride in energy stocks and in the broad market over the past two years reminded us that boom-and-bust cycles in commodities—and in the stock market—are not uncommon.
7
Of course, no one can predict with certainty what comes next. However, we do know that the old-fashioned principles of diversification, discipline, and patience are the hallmarks of a successful investing strategy for the long term. Within a balanced portfolio that is consistent with your investment objectives, risk tolerance, and time horizon, the Energy Fund can provide you with low-cost exposure to an important segment of the global economy.
On another matter, I would like to inform you that on January 1, 2010, we completed a leadership transition that began in March 2008. I succeeded Jack Brennan as chairman of Vanguard and each of the funds. Jack has agreed to serve as chairman emeritus and senior advisor. Under Jack’s leadership, Vanguard has grown to become a preeminent firm in the mutual fund industry. Jack’s energy, his relentless pursuit of perfection, and his unwavering focus on always doing the right thing for our clients are evident in every facet of Vanguard policy today.
Thank you for entrusting your assets to Vanguard.
Sincerely,

F. William McNabb III
Chairman and Chief Executive Officer
February 10, 2010
8
Advisors’ Report
The Investor Shares of Vanguard Energy Fund returned 36.28% (Admiral Shares, 36.37%) for the fiscal year ended January 31, 2010. Your fund is managed by two advisors, a strategy that enhances the fund’s diversification by providing exposure to distinct, yet complementary, investment approaches. It’s not uncommon for different advisors to have different views about individual securities or the broader investment environment.
The advisors, the amount and percentage of fund assets each manages, and brief descriptions of their investment strategies are presented in the table below. The advisors have also provided a discussion of the investment environment that existed during the year and of how their portfolio positioning reflects this assessment. These reports were prepared on February 17, 2010.
Wellington Management Company, LLP
Portfolio Manager: Karl E. Bandtel, Senior Vice President
Volatility in the global oil markets continued through the fiscal year. After starting 2008 at around $100 per barrel, oil prices plummeted in early 2009 as the bull market in commodities collided with a global economic recession. Prices rebounded into the $70–$80 per-barrel range toward the end of the period, led by OPEC supply discipline and by demand from emerging markets, most notably China. For oil, the current $70–$80 price range is a level that is fueling modest demand growth, led by developing countries, and at the same time supporting investment in new production.
| | | |
| Vanguard Energy Fund Investment Advisors | |
| |
| | Fund Assets Managed | |
| Investment Advisor | % | $ Million | Investment Strategy |
| Wellington Management | 94 | 10,362 | Emphasizes long-term total-return opportunities from |
| Company, LLP | | | the various energy subsectors: international oils, |
| | | | foreign integrated oils and foreign producers, North |
| | | | American producers, oil services and equipment, |
| | | | transportation and distribution, and refining and |
| | | | marketing. |
| Vanguard Quantitative Equity | 3 | 293 | Employs a quantitative fundamental management |
| Group | | | approach, using models that assess valuation, market |
| | | | sentiment, earnings quality and growth, and |
| | | | management decisions of companies relative to their |
| | | | peers. |
| Cash Investments | 3 | 320 | These short-term reserves are invested by Vanguard in |
| | | | equity index products to simulate investments in stock. |
| | | | Each advisor may also maintain a modest cash |
| | | | position. |
9
North American natural gas prices were also volatile, slipping to a low of near $2.90 per million BTUs in early September on concerns about new supply successes and high storage levels. Prices moved higher, to a range of $5.30 to $5.40 per million BTUs at the end of the fiscal year. While price levels are still moderate, the rebound is contributing to a resumption in drilling activity, primarily directed at unconventional shale projects.
Top absolute contributors to the performance of our portion of the Energy Fund included BHP Billiton, Canadian Natural Resources, and Suncor Energy. Detractors for the period included ExxonMobil, Valero Energy, and ConocoPhillips. We purchased new names, including PetroChina and Anadarko Petroleum, and added to our existing positions in ExxonMobil and Baker Hughes. We eliminated holdings in Transocean and Woodside Petroleum from our portion of the portfolio and reduced our position in Suncor Energy, as we found other opportunities in which to invest after these companies performed very well.
We continue to believe that the direction of oil and natural gas prices will be driven largely by inherent underlying supply challenges, including geologic and political issues. We expect continued high volatility and uncertainty. Our investment process remains steady, with an emphasis on high-quality management and long-lived resources at reasonable valuations.
Vanguard Quantitative Equity Group
Portfolio Manager: James D. Troyer, CFA, Principal
Energy stocks climbed back from their lows earlier in the year, along with the broad market and oil prices. U.S. firms were the laggards in the energy sector, returning about 12%, as reflected by the fund’s benchmark return, while emerging market energy firms produced higher returns.
A key characteristic of our investment strategy is that we do not maintain an opinion on the overall market for energy shares. Neither do we attempt to make calls on relative country performance. These characteristics are reflected in our portfolio, which is always fully invested. We apply a rigorous risk-control process to neutralize our exposure to market-capitalization, volatility, and industry risks relative to our energy benchmark. In our view, such risk exposures are not justified by the rewards available.
In addition, we attempt to reduce risk relative to the benchmark by diversifying our model to include multiple signals. Valuation measures the price we will pay for a stock’s earnings or cash flow. By itself, valuation can be a powerful investment tool, but our research leads us to conclude that other models help improve a valuation signal.
10
Our sentiment score measures the market’s overall evaluation of the company’s value, following the logic that a stock’s performance reflects the news around that stock, which helps to verify the results of our other scores. Other measures separate cheap stocks that deserve their low valuation because of poor margins or growth prospects from their more attractive peers.
We combine these components into an overall score, with each indicator serving as a verification of the others. Our research tells us that these attributes—low price/ earnings (P/E) or low price/cash-flow ratio, higher return on equity—are successful in the long term, but may not work in some periods. The resulting portfolio takes many small positions on individual stocks in an attempt to capture our model’s stock selection.
In spite of the turmoil early in the period, our model held up well in the fiscal year. Firms outside the United States delivered some of our best returns for the year: Tupras-Turkiye Petrol Rafinerileri (Turkey), Banpu (Thailand), and SK Energy (South Korea). Two U.S.-based holdings—Devon Energy and Chesapeake Energy—were among our detractors.
We believe that holding a portfolio of stocks with below-market P/E (or price/cash flow) ratios and expected earnings growth similar to that of the market is an attractive strategy that can be rewarding in the long term. We thank you for your investment and we look forward to the upcoming year.
11
Energy Fund
Fund Profile
As of January 31, 2010
| | |
| Share-Class Characteristics | |
| | Investor | Admiral |
| | Shares | Shares |
| Ticker Symbol | VGENX | VGELX |
| Expense Ratio1 | 0.32% | 0.24% |
| 30-Day SEC Yield | 1.98% | 2.05% |
| | | |
| Portfolio Characteristics | | |
| | | | DJ |
| | | | U.S. Total |
| | | S&P Energy | Market |
| | Fund | Sector Index | Index |
| Number of Stocks | 121 | 39 | 4,185 |
| Median Market Cap | $37.2B | $71.1B | $29.6B |
| Price/Earnings Ratio | 20.2x | 32.9x | 26.4x |
| Price/Book Ratio | 1.8x | 2.0x | 2.1x |
| Return on Equity | 27.8% | 27.0% | 19.2% |
| Earnings Growth Rate | 13.7% | 10.3% | 7.7% |
| Dividend Yield | 2.1% | 2.1% | 1.9% |
| Foreign Holdings | 34.1% | 0.0% | 0.0% |
| Turnover Rate | 27% | — | — |
| Short-Term Reserves | 3.5% | — | — |
| | |
| Volatility Measures | | |
| | | DJ |
| | | U.S. Total |
| | S&P Energy | Market |
| | Sector Index | Index |
| R-Squared | 0.90 | 0.58 |
| Beta | 1.15 | 1.06 |
These measures show the degree and timing of the fund’s fluctuations compared with the indexes over 36 months.
| | |
| Ten Largest Holdings (% of total net assets) |
| Exxon Mobil Corp. | Integrated Oil & | |
| | Gas | 7.4% |
| Occidental Petroleum | Integrated Oil & | |
| Corp. | Gas | 4.5 |
| BP PLC | Integrated Oil & | |
| | Gas | 4.2 |
| Chevron Corp. | Integrated Oil & | |
| | Gas | 4.1 |
| EOG Resources Inc. | Oil & Gas | |
| | Exploration & | |
| | Production | 3.9 |
| Baker Hughes Inc. | Oil & Gas | |
| | Equipment & | |
| | Services | 3.5 |
| Halliburton Co. | Oil & Gas | |
| | Equipment & | |
| | Services | 3.3 |
| BHP Billiton Ltd. ADR | Diversified Metals | |
| | & Mining | 3.2 |
| ConocoPhillips | Integrated Oil & | |
| | Gas | 3.2 |
| BG Group PLC | Integrated Oil & | |
| | Gas | 3.1 |
| Top Ten | | 40.4% |
The holdings listed exclude any temporary cash investments and equity index products.
1 The expense ratios shown are from the prospectus dated May 29, 2009, and represent estimated costs for the current fiscal year based on the fund’s net assets as of the prospectus date. For the fiscal year ended January 31, 2010, the expense ratios were 0.38% for Investor Shares and 0.31% for Admiral Shares.
12
Energy Fund
| |
| Market Diversification (% of equity exposure) |
| Europe | |
| United Kingdom | 8.2% |
| France | 2.6 |
| Italy | 1.9 |
| Netherlands | 1.8 |
| Other | 1.1 |
| Subtotal | 15.6 |
| Pacific | |
| Australia | 3.3% |
| Subtotal | 3.3 |
| Emerging Markets | |
| Russia | 2.3% |
| Brazil | 2.0 |
| China | 1.6 |
| India | 1.4 |
| Other | 0.1 |
| Subtotal | 7.4 |
| North America | |
| United States | 64.7% |
| Canada | 9.0 |
| Subtotal | 73.7 |
| Subindustry Diversification (% of equity exposure) | | |
| | | S&P Energy |
| | Fund | Sector Index |
| Coal & Consumable Fuels | 3.5% | 2.1% |
| Diversified Metals and | | |
| Mining | 3.3 | 0.0 |
| Industrials | 0.3 | 0.0 |
| Integrated Oil & Gas | 49.2 | 58.2 |
| Materials | 0.1 | 0.0 |
| Oil & Gas Drilling | 0.3 | 1.4 |
| Oil & Gas Equipment & | | |
| Services | 13.6 | 15.0 |
| Oil & Gas Exploration & | | |
| Production | 21.3 | 18.9 |
| Oil & Gas Refining & | | |
| Marketing | 2.5 | 1.4 |
| Oil & Gas Storage & | | |
| Transportation | 0.3 | 3.0 |
| Utilities | 3.3 | 0.0 |
| Other Energy | 2.3 | 0.0 |
13
Energy Fund
Performance Summary
All of the returns in this report represent past performance, which is not a guarantee of future results that may be achieved by the fund. (Current performance may be lower or higher than the performance data cited. For performance data current to the most recent month-end, visit our website at www.vanguard.com/performance.) Note, too, that both investment returns and principal value can fluctuate widely, so an investor’s shares, when sold, could be worth more or less than their original cost. The returns shown do not reflect taxes that a shareholder would pay on fund distributions or on the sale of fund shares.
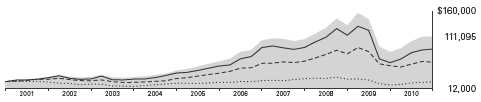
Cumulative Performance: January 31, 2000, Through January 31, 2010
Initial Investment of $25,000
| | | | |
| | Average Annual Total Returns | |
| | Periods Ended January 31, 2010 | |
| | | | | Final Value |
| | One | Five | Ten | of a $25,000 |
| | Year | Years | Years | Investment |
| Energy Fund Investor Shares | 36.28% | 11.78% | 16.08% | $111,095 |
| Dow Jones U.S. Total Stock Market | | | | |
| Index | 36.06 | 0.94 | -0.09 | 24,768 |
| S&P Energy Sector Index | 12.24 | 8.61 | 9.52 | 62,091 |
| Global Natural Resources Funds | | | | |
| Average | 42.50 | 9.75 | 13.32 | 87,260 |
Global Natural Resources Funds Average: Derived from data provided by Lipper Inc.
| | | | |
| | | | Since | Final Value |
| | One | Five | Inception | of a $100,000 |
| | Year | Years | (11/12/2001) | Investment |
| Energy Fund Admiral Shares | 36.37% | 11.86% | 15.82% | $334,437 |
| Dow Jones U.S. Total Stock Market | | | | |
| Index | 36.06 | 0.94 | 2.73 | 124,821 |
| S&P Energy Sector Index | 12.24 | 8.61 | 10.64 | 229,623 |
| Performance for the fund’s Admiral Shares and comparative standards is calculated since the Admiral Shares’ inception. | |
Vanguard fund total returns do not include any transaction or account fees that applied in the periods shown. Fund prospectuses provide information about current fees.
See Financial Highlights for dividend and capital gains information.
14
Energy Fund
Fiscal-Year Total Returns (%): January 31, 2000, Through January 31, 2010
Average Annual Total Returns: Periods Ended December 31, 2009
This table presents average annual total returns through the latest calendar quarter—rather than through the end of
the fiscal period. Securities and Exchange Commission rules require that we provide this information.
| | | | |
| | Inception | One | Five | Ten |
| | Date | Year | Years | Years |
| Investor Shares | 5/23/1984 | 38.36% | 13.38% | 16.30% |
| Admiral Shares | 11/12/2001 | 38.48 | 13.46 | 16.711 |
| 1 Return since inception. | | | | |
Vanguard fund total returns do not include any transaction or account fees that applied in the periods shown. Fund prospectuses provide information about current fees.
15
Energy Fund
Financial Statements
Statement of Net Assets
As of January 31, 2010
The fund reports a complete list of its holdings in regulatory filings four times in each fiscal year, at the quarter-ends. For the second and fourth fiscal quarters, the lists appear in the fund’s semiannual and annual reports to shareholders. For the first and third fiscal quarters, the fund files the lists with the Securities and Exchange Commission on Form N-Q. Shareholders can look up the fund’s Forms N-Q on the SEC’s website at www.sec.gov. Forms N-Q may also be reviewed and copied at the SEC’s Public Reference Room (see the back cover of this report for further information).
| | | |
| | | | Market |
| | | | Value• |
| | | Shares | ($000) |
| Common Stocks (94.4%)1 | | |
| United States (60.3%) | | |
| Electric Utilities (0.4%) | | |
| | Exelon Corp. | 1,072,700 | 48,937 |
| |
| Energy Equipment & Services (13.0%) | |
| | Baker Hughes Inc. | 8,437,200 | 382,036 |
| | Halliburton Co. | 12,274,732 | 358,545 |
| | Schlumberger Ltd. | 5,232,664 | 332,065 |
| * | Weatherford | | |
| | International Ltd. | 14,943,500 | 234,314 |
| * | SEACOR Holdings Inc. | 775,800 | 54,500 |
| | National Oilwell Varco Inc. | 926,476 | 37,893 |
| | Ensco International | | |
| | PLC ADR | 443,300 | 17,302 |
| * | Transocean Ltd. | 53,706 | 4,551 |
| | Noble Corp. | 67,872 | 2,737 |
| | Diamond Offshore Drilling Inc. 24,500 | 2,242 |
| * | Rowan Cos. Inc. | 79,600 | 1,710 |
| | | | 1,427,895 |
| Exchange-Traded Fund (0.5%) | |
| ^,2 | Vanguard Energy ETF | 663,000 | 52,887 |
| |
| Gas Utilities (2.7%) | | |
| | Questar Corp. | 3,589,918 | 148,910 |
| | EQT Corp. | 3,224,400 | 141,938 |
| | | | 290,848 |
| Oil, Gas & Consumable Fuels (43.7%) | |
| | Coal & Consumable Fuels (3.3%) | |
| | Consol Energy Inc. | 4,616,600 | 215,180 |
| | Peabody Energy Corp. | 3,570,300 | 150,381 |
| |
| | Integrated Oil & Gas (23.4%) | |
| | Exxon Mobil Corp. | 12,560,198 | 809,253 |
| | Occidental Petroleum Corp. | 6,253,801 | 489,923 |
| | Chevron Corp. | 6,257,435 | 451,286 |
| | ConocoPhillips | 7,213,209 | 346,234 |
| | Marathon Oil Corp. | 8,283,991 | 246,946 |
| | Hess Corp. | 3,839,289 | 221,872 |
| | Murphy Oil Corp. | 45,100 | 2,304 |
| | | |
| | | | Market |
| | | | Value• |
| | | Shares | ($000) |
| | Oil & Gas Exploration & Production (15.7%) |
| | EOG Resources Inc. | 4,720,236 | 426,804 |
| | Noble Energy Inc. | 3,114,600 | 230,293 |
| | Cabot Oil & Gas Corp. | 4,881,100 | 186,800 |
| | Devon Energy Corp. | 2,384,507 | 159,547 |
| | Anadarko Petroleum Corp. | 2,157,560 | 137,609 |
| | Chesapeake Energy Corp. | 4,159,637 | 103,076 |
| * | Ultra Petroleum Corp. | 1,706,136 | 78,380 |
| * | Newfield Exploration Co. | 1,349,603 | 66,049 |
| | XTO Energy Inc. | 1,407,045 | 62,712 |
| * | Plains Exploration & | | |
| | Production Co. | 1,829,601 | 61,017 |
| * | Denbury Resources Inc. | 3,320,214 | 44,989 |
| * | Encore Acquisition Co. | 900,907 | 42,901 |
| | Range Resources Corp. | 649,302 | 29,868 |
| * | Quicksilver Resources Inc. | 2,144,073 | 28,495 |
| * | SandRidge Energy Inc. | 2,983,600 | 25,241 |
| * | Forest Oil Corp. | 709,045 | 17,102 |
| * | Petrohawk Energy Corp. | 592,200 | 13,224 |
| | Apache Corp. | 53,070 | 5,242 |
| | Cimarex Energy Co. | 41,000 | 2,018 |
| * | Southwestern Energy Co. | 3,500 | 150 |
| |
| | Oil & Gas Refining & Marketing (1.0%) |
| | Valero Energy Corp. | 5,922,042 | 109,084 |
| |
| | Oil & Gas Storage & Transportation (0.3%) |
| | Williams Cos. Inc. | 1,466,500 | 30,562 |
| | | | 4,794,542 |
| Total United States | | 6,615,109 |
| International (34.1%) | | |
| Australia (3.3%) | | |
| | BHP Billiton Ltd. ADR | 5,115,000 | 354,828 |
| | Woodside Petroleum Ltd. | 19,402 | 723 |
| | | | 355,551 |
| Austria (0.9%) | | |
| | OMV AG | 2,455,167 | 96,700 |
16
| | | |
| Energy Fund | | |
| |
| |
| |
| | | | Market |
| | | | Value• |
| | | Shares | ($000) |
| Belgium (0.1%) | | |
| * | Hansen Transmissions | 6,573,611 | 9,326 |
| |
| Brazil (1.9%) | | |
| | Petroleo Brasileiro | | |
| | SA ADR | 4,843,000 | 196,480 |
| | Petroleo Brasileiro | | |
| | SA Prior Pfd. | 384,220 | 6,965 |
| | Petroleo Brasileiro SA | 261,842 | 5,309 |
| | | | 208,754 |
| Canada (8.7%) | | |
| | Canadian Natural | | |
| | Resources Ltd. | | |
| | (New York Shares) | 3,689,459 | 235,425 |
| | Suncor Energy Inc. | | |
| | (New York Shares) | 6,119,412 | 193,680 |
| | EnCana Corp. | | |
| | (New York Shares) | 4,874,800 | 149,120 |
| | Cenovus Energy Inc. | | |
| | (New York Shares) | 4,874,800 | 112,852 |
| | Husky Energy Inc. | 4,154,900 | 103,363 |
| | Canadian Oil Sands Trust | 3,009,175 | 78,068 |
| * | Imperial Oil Ltd. | 842,800 | 30,425 |
| ^ | Penn West Energy Trust | 1,302,637 | 21,402 |
| 3 | Crescent Point | | |
| | Energy Corp. | 217,700 | 7,706 |
| ^ | Crescent Point | | |
| | Energy Corp. | 203,200 | 7,193 |
| | Canadian Natural | | |
| | Resources Ltd. | 83,539 | 5,332 |
| | Suncor Energy Inc. | 125,584 | 3,965 |
| | EnCana Corp. | 129,139 | 3,949 |
| | Talisman Energy Inc. | 202,673 | 3,353 |
| | TransCanada Corp. | 25,696 | 821 |
| | Cenovus Energy Inc. | 33,239 | 768 |
| | Enbridge Inc. | 2,400 | 104 |
| | | | 957,526 |
| China (1.5%) | | |
| | PetroChina Co. Ltd. ADR | 1,377,700 | 153,600 |
| | CNOOC Ltd. | 3,019,717 | 4,234 |
| | PetroChina Co. Ltd. | 3,676,000 | 4,105 |
| | China Petroleum & | | |
| | Chemical Corp. | 3,594,000 | 2,796 |
| | Yanzhou Coal | | |
| | Mining Co. Ltd. | 994,000 | 1,941 |
| | China Oilfield Services Ltd. | 708,000 | 837 |
| | China Shenhua | | |
| | Energy Co. Ltd. | 39,500 | 168 |
| | | | 167,681 |
| France (2.5%) | | |
| | Total SA ADR | 4,581,900 | 263,871 |
| | Total SA | 208,911 | 12,074 |
| | Technip SA | 34,188 | 2,337 |
| | | | 278,282 |
| | | |
| | | | Market |
| | | | Value• |
| | | Shares | ($000) |
| Greece (0.0%) | | |
| | Hellenic Petroleum SA | 17,061 | 211 |
| |
| Hungary (0.0%) | | |
| * | MOL Hungarian Oil | | |
| | and Gas NyRt | 23,066 | 2,132 |
| |
| India (1.4%) | | |
| | Reliance Industries Ltd. | 6,564,540 | 147,633 |
| | Oil & Natural | | |
| | Gas Corp. Ltd. | 92,781 | 2,196 |
| | Bharat Petroleum | | |
| | Corp. Ltd. | 137,226 | 1,609 |
| | | | 151,438 |
| Italy (1.9%) | | |
| | ENI SPA ADR | 4,317,550 | 200,852 |
| | ENI SPA | 225,757 | 5,247 |
| | | | 206,099 |
| Malaysia (0.0%) | | |
| | Petronas Dagangan Bhd. | 632,900 | 1,613 |
| |
| Netherlands (1.8%) | | |
| | Royal Dutch Shell | | |
| | PLC ADR | 3,364,800 | 186,376 |
| | Royal Dutch Shell | | |
| | PLC Class A | 94,464 | 2,623 |
| | Fugro NV | 32,417 | 1,923 |
| | | | 190,922 |
| Norway (0.1%) | | |
| | Statoil ASA | 191,560 | 4,299 |
| | Seadrill Ltd. | 98,350 | 2,232 |
| | | | 6,531 |
| Poland (0.0%) | | |
| * | Grupa Lotos SA | 97,133 | 920 |
| * | Polski Koncern | | |
| | Naftowy Orlen | 2,222 | 26 |
| | | | 946 |
| Russia (2.2%) | | |
| | Gazprom OAO ADR | | |
| | (U.S. Shares) | 9,203,433 | 223,167 |
| | Gazprom OAO ADR | | |
| | (London Shares) | 262,243 | 6,359 |
| | Lukoil OAO ADR | 79,913 | 4,370 |
| | Rosneft Oil Co. GDR | 333,492 | 2,565 |
| | Tatneft ADR | 83,123 | 2,558 |
| | Surgutneftegaz ADR | 166,360 | 1,398 |
| | Surgutneftegaz | | |
| | Prior Pfd. | 2,362,900 | 1,089 |
| | Gazprom Neft JSC | 182,858 | 921 |
| | Gazprom OAO | 124,674 | 747 |
| | | | 243,174 |
| South Africa (0.0%) | | |
| | Sasol Ltd. | 23,121 | 857 |
17
Energy Fund
| | |
| | | Market |
| | | Value• |
| | Shares | ($000) |
| South Korea (0.0%) | | |
| SK Energy Co. Ltd. | 21,209 | 1,925 |
| GS Holdings | 3,530 | 105 |
| | | 2,030 |
| Spain (0.0%) | | |
| Repsol YPF SA | 140,162 | 3,311 |
| |
| Thailand (0.1%) | | |
| PTT PCL (Foreign) | 291,000 | 1,942 |
| Banpu PCL | 112,800 | 1,803 |
| PTT Aromatics & | | |
| Refining PCL (Foreign) | 2,361,000 | 1,735 |
| Thai Oil PCL (Foreign) | 1,249,000 | 1,522 |
| IRPC PCL (Foreign) | 5,109,300 | 666 |
| | | 7,668 |
| Turkey (0.0%) | | |
| Tupras Turkiye | | |
| Petrol Rafine | 94,880 | 1,953 |
| |
| United Kingdom (7.7%) | | |
| BP PLC ADR | 7,867,800 | 441,541 |
| BG Group PLC | 18,587,345 | 341,705 |
| Wellstream | | |
| Holdings PLC | 3,059,864 | 24,210 |
| BP PLC | 2,235,564 | 20,858 |
| Royal Dutch Shell | | |
| PLC Class A | 322,732 | 8,920 |
| Royal Dutch Shell | | |
| PLC Class B | 324,950 | 8,644 |
| Petrofac Ltd. | 97,308 | 1,491 |
| Tullow Oil PLC | 8,303 | 152 |
| | | 847,521 |
| Total International | | 3,740,226 |
| Total Common Stocks | | |
| (Cost $7,062,428) | | 10,355,335 |
| Temporary Cash Investments (6.2%)1 | |
| Money Market Fund (2.4%) | | |
| 4,5 Vanguard Market | | |
| Liquidity Fund, 0.175% | 269,735,737 | 269,736 |
| | | |
| | | Face | Market |
| | | Amount | Value• |
| | | ($000) | ($000) |
| Repurchase Agreement (3.6%) | | |
| | Deutsche Bank | | |
| | Securities, Inc. | | |
| | 0.120%, 2/1/10 | | |
| | (Dated 1/29/10, | | |
| | Repurchase Value | | |
| | $391,704,000, | | |
| | collateralized by Federal | | |
| | National Mortgage Assn. | | |
| | 7.000%, 4/1/37–10/1/38) | 391,700 | 391,700 |
| |
| U.S. Government and Agency Obligations (0.2%) |
| 6,7 | Fannie Mae Discount | | |
| | Notes, 0.220%, 7/21/10 | 2,000 | 1,998 |
| 6,7 | Federal Home Loan Bank | | |
| | Discount Notes, | | |
| | 0.275%, 2/19/10 | 500 | 500 |
| 6,7 | Federal Home Loan Bank | | |
| | Discount Notes, | | |
| | 0.220%, 3/26/10 | 17,000 | 16,998 |
| 6,7 | Federal Home Loan | | |
| | Bank Discount Notes, | | |
| | 0.195%, 7/14/10 | 1,000 | 999 |
| 6,7 | Freddie Mac Discount | | |
| | Notes, 0.180%, 3/16/10 | 3,000 | 3,000 |
| | | | 23,495 |
| Total Temporary Cash Investments | |
| (Cost $684,927) | | 684,931 |
| Total Investments (100.6%) | | |
| (Cost $7,747,355) | | 11,040,266 |
| Other Assets and Liabilities (-0.6%) | |
| Other Assets | | 178,712 |
| Liabilities5 | | (244,313) |
| | | | (65,601) |
| Net Assets (100%) | | 10,974,665 |
18
Energy Fund
| |
| At January 31, 2010, net assets consisted of: |
| | Amount |
| | ($000) |
| Paid-in Capital | 7,645,752 |
| Overdistributed Net Investment Income | (18,896) |
| Accumulated Net Realized Gains | 66,032 |
| Unrealized Appreciation (Depreciation) | |
| Investment Securities | 3,292,911 |
| Futures Contracts | (11,152) |
| Foreign Currencies | 18 |
| Net Assets | 10,974,665 |
| |
| Investor Shares—Net Assets | |
| Applicable to 114,324,450 outstanding | |
| $.001 par value shares of beneficial | |
| interest (unlimited authorization) | 6,536,091 |
| Net Asset Value Per Share— | |
| Investor Shares | $57.17 |
| |
| Admiral Shares—Net Assets | |
| Applicable to 41,349,670 outstanding | |
| $.001 par value shares of beneficial | |
| interest (unlimited authorization) | 4,438,574 |
| Net Asset Value Per Share— | |
| Admiral Shares | $107.34 |
• See Note A in Notes to Financial Statements.
* Non-income-producing security.
^ Part of security position is on loan to broker-dealers. The total value of securities on loan is $33,732,000.
1 The fund invests a portion of its cash reserves in equity markets through the use of index futures contracts. After giving effect to futures investments, the fund’s effective common stock and temporary cash investment positions represent 96.7% and 3.9%, respectively, of net assets.
2 Considered an affiliated company of the fund as the issuer is another member of The Vanguard Group.
3 Security exempt from registration under Rule 144A of the Securities Act of 1933. Such securities may be sold in transactions exempt from registration, normally to qualified institutional buyers. At January 31, 2010, the value of this security represented 0.1% of net assets.
4 Affiliated money market fund available only to Vanguard funds and certain trusts and accounts managed by Vanguard. Rate shown is the 7-day yield.
5 Includes $35,328,000 of collateral received for securities on loan.
6 The issuer operates under a congressional charter; its securities are not backed by the full faith and credit of the U.S. government.
7 Securities with a value of $23,495,000 have been segregated as initial margin for open futures contracts.
ADR—American Depositary Receipt.
GDR—Global Depositary Receipt.
See accompanying Notes, which are an integral part of the Financial Statements.
19
| |
| Energy Fund | |
| |
| |
| Statement of Operations | |
| |
| | Year Ended |
| | January 31, 2010 |
| | ($000) |
| Investment Income | |
| Income | |
| Dividends1,2 | 200,174 |
| Interest2 | 1,146 |
| Security Lending | 4,284 |
| Total Income | 205,604 |
| Expenses | |
| Investment Advisory Fees—Note B | |
| Basic Fee | 13,257 |
| Performance Adjustment | 2,834 |
| The Vanguard Group—Note C | |
| Management and Administrative—Investor Shares | 10,552 |
| Management and Administrative—Admiral Shares | 4,655 |
| Marketing and Distribution—Investor Shares | 1,229 |
| Marketing and Distribution—Admiral Shares | 762 |
| Custodian Fees | 189 |
| Auditing Fees | 26 |
| Shareholders’ Reports and Proxies—Investor Shares | 363 |
| Shareholders’ Reports and Proxies—Admiral Shares | 54 |
| Trustees’ Fees and Expenses | 20 |
| Total Expenses | 33,941 |
| Net Investment Income | 171,663 |
| Realized Net Gain (Loss) | |
| Investment Securities Sold2 | 197,027 |
| Futures Contracts | 25,326 |
| Foreign Currencies | 343 |
| Realized Net Gain (Loss) | 222,696 |
| Change in Unrealized Appreciation (Depreciation) | |
| Investment Securities | 2,363,123 |
| Futures Contracts | 1,460 |
| Foreign Currencies | 36 |
| Change in Unrealized Appreciation (Depreciation) | 2,364,619 |
| Net Increase (Decrease) in Net Assets Resulting from Operations | 2,758,978 |
1 Dividends are net of foreign withholding taxes of $12,848,000.
2 Dividend income, interest income, and realized net gain (loss) from affiliated companies of the fund were $791,000, $500,000, and $0, respectively.
See accompanying Notes, which are an integral part of the Financial Statements.
20
| | |
| Energy Fund | | |
| |
| |
| Statement of Changes in Net Assets | | |
| |
| | Year Ended January 31, |
| | 2010 | 2009 |
| | ($000) | ($000) |
| Increase (Decrease) in Net Assets | | |
| Operations | | |
| Net Investment Income | 171,663 | 228,649 |
| Realized Net Gain (Loss) | 222,696 | (5,246) |
| Change in Unrealized Appreciation (Depreciation) | 2,364,619 | (5,096,951) |
| Net Increase (Decrease) in Net Assets Resulting from Operations | 2,758,978 | (4,873,548) |
| Distributions | | |
| Net Investment Income | | |
| Investor Shares | (105,714) | (125,121) |
| Admiral Shares | (74,777) | (86,895) |
| Realized Capital Gain | | |
| Investor Shares | — | (259,700) |
| Admiral Shares | — | (171,115) |
| Total Distributions | (180,491) | (642,831) |
| Capital Share Transactions | | |
| Investor Shares | 565,224 | (236,479) |
| Admiral Shares | 508,755 | (57,478) |
| Net Increase (Decrease) from Capital Share Transactions | 1,073,979 | (293,957) |
| Total Increase (Decrease) | 3,652,466 | (5,810,336) |
| Net Assets | | |
| Beginning of Period | 7,322,199 | 13,132,535 |
| End of Period1 | 10,974,665 | 7,322,199 |
1 Net Assets—End of Period includes undistributed (overdistributed) net investment income of ($18,896,000) and ($9,611,000).
See accompanying Notes, which are an integral part of the Financial Statements.
21
| | | | | |
| Energy Fund | | | | | |
| |
| |
| Financial Highlights | | | | | |
| |
| |
| Investor Shares | | | | | |
| |
| For a Share Outstanding | | | Year Ended January 31, |
| Throughout Each Period | 2010 | 2009 | 2008 | 2007 | 2006 |
| Net Asset Value, Beginning of Period | $42.62 | $73.93 | $63.55 | $64.50 | $40.85 |
| Investment Operations | | | | | |
| Net Investment Income | .910 | 1.2761 | 1.226 | 1.112 | .813 |
| Net Realized and Unrealized Gain (Loss) | | | | | |
| on Investments | 14.591 | (28.853) | 14.639 | .405 | 24.606 |
| Total from Investment Operations | 15.501 | (27.577) | 15.865 | 1.517 | 25.419 |
| Distributions | | | | | |
| Dividends from Net Investment Income | (.951) | (1.264) | (1.177) | (1.020) | (.740) |
| Distributions from Realized Capital Gains | — | (2.469) | (4.308) | (1.447) | (1.029) |
| Total Distributions | (.951) | (3.733) | (5.485) | (2.467) | (1.769) |
| Net Asset Value, End of Period | $57.17 | $42.62 | $73.93 | $63.55 | $64.50 |
| |
| Total Return2 | 36.28% | -38.51% | 25.02% | 2.24% | 62.93% |
| |
| Ratios/Supplemental Data | | | | | |
| Net Assets, End of Period (Millions) | $6,536 | $4,434 | $7,919 | $6,479 | $6,733 |
| Ratio of Total Expenses to | | | | | |
| Average Net Assets | 0.38%3 | 0.28%3 | 0.25% | 0.25% | 0.28% |
| Ratio of Net Investment Income to | | | | | |
| Average Net Assets | 1.73% | 1.84% | 1.67% | 1.71% | 1.57% |
| Portfolio Turnover Rate4 | 27% | 21% | 22% | 22% | 10% |
1 Calculated based on average shares outstanding.
2 Total returns do not reflect the 1% fee assessed on redemptions of shares held less than one year, nor do they include the account service fee that may be applicable to certain accounts with balances below $10,000.
3 Includes performance-based investment advisory fee increases (decreases) of 0.03% for fiscal 2010 and 0.01% for fiscal 2009.
4 Excludes the value of portfolio securities received or delivered as a result of in-kind purchases or redemptions of the fund’s capital shares.
See accompanying Notes, which are an integral part of the Financial Statements.
22
| | | | | |
| Energy Fund | | | | | |
| |
| |
| Financial Highlights | | | | | |
| |
| |
| Admiral Shares | | | | | |
| |
| For a Share Outstanding | | | Year Ended January 31, |
| Throughout Each Period | 2010 | 2009 | 2008 | 2007 | 2006 |
| Net Asset Value, Beginning of Period | $80.02 | $138.86 | $119.35 | $121.13 | $76.71 |
| Investment Operations | | | | | |
| Net Investment Income | 1.780 | 2.4801 | 2.418 | 2.180 | 1.561 |
| Net Realized and Unrealized Gain (Loss) | | | | | |
| on Investments | 27.395 | (54.203) | 27.505 | .757 | 46.217 |
| Total from Investment Operations | 29.175 | (51.723) | 29.923 | 2.937 | 47.778 |
| Distributions | | | | | |
| Dividends from Net Investment Income | (1.855) | (2.480) | (2.322) | (2.000) | (1.425) |
| Distributions from Realized Capital Gains | — | (4.637) | (8.091) | (2.717) | (1.933) |
| Total Distributions | (1.855) | (7.117) | (10.413) | (4.717) | (3.358) |
| Net Asset Value, End of Period | $107.34 | $80.02 | $138.86 | $119.35 | $121.13 |
| |
| Total Return2 | 36.37% | -38.46% | 25.13% | 2.32% | 63.00% |
| |
| Ratios/Supplemental Data | | | | | |
| Net Assets, End of Period (Millions) | $4,439 | $2,889 | $5,214 | $3,612 | $3,088 |
| Ratio of Total Expenses to | | | | | |
| Average Net Assets | 0.31%3 | 0.21%3 | 0.17% | 0.18% | 0.22% |
| Ratio of Net Investment Income to | | | | | |
| Average Net Assets | 1.80% | 1.91% | 1.75% | 1.78% | 1.63% |
| Portfolio Turnover Rate4 | 27% | 21% | 22% | 22% | 10% |
1 Calculated based on average shares outstanding.
2 Total returns do not reflect the 1% fee assessed on redemptions of shares held for less than one year.
3 Includes performance-based investment advisory fee increases (decreases) of 0.03% for fiscal 2010 and 0.01% for fiscal 2009.
4 Excludes the value of portfolio securities received or delivered as a result of in-kind purchases or redemptions of the fund’s capital shares.
See accompanying Notes, which are an integral part of the Financial Statements.
23
Energy Fund
Notes to Financial Statements
Vanguard Energy Fund is registered under the Investment Company Act of 1940 as an open-end investment company, or mutual fund. The fund invests in securities of foreign issuers, which may subject it to investment risks not normally associated with investing in securities of U.S. corporations. The fund offers two classes of shares: Investor Shares and Admiral Shares. Investor Shares are available to any investor who meets the fund’s minimum purchase requirements. Admiral Shares are designed for investors who meet certain administrative, service, tenure, and account-size criteria.
A. The following significant accounting policies conform to generally accepted accounting principles for U.S. mutual funds. The fund consistently follows such policies in preparing its financial statements.
1. Security Valuation: Securities are valued as of the close of trading on the New York Stock Exchange (generally 4 p.m., Eastern time) on the valuation date. Equity securities are valued at the latest quoted sales prices or official closing prices taken from the primary market in which each security trades; such securities not traded on the valuation date are valued at the mean of the latest quoted bid and asked prices. Securities for which market quotations are not readily available, or whose values have been affected by events occurring before the fund’s pricing time but after the close of the securities’ primary markets, are valued at their fair values calculated according to procedures adopted by the board of trus tees. These procedures include obtaining quotations from an independent pricing service, monitoring news to identify significant market- or security-specific events, and evaluating changes in the values of foreign market proxies (for example, ADRs, futures contracts, or exchange-traded funds), between the time the foreign markets close and the fund’s pricing time. When fair-value pricing is employed, the prices of securities used by a fund to calculate its net asset value may differ from quoted or published prices for the same securities. Investments in Vanguard Market Liquidity Fund are valued at that fund’s net asset value. Temporary cash investments acquired over 60 days to maturity are valued using the latest bid prices or using valuations based on a matrix system (which considers such factors as security prices, yields, maturities, and ratings), both as furnished by independent pricing services. Other temporary cash investments are valued at amortized cost, which approximates market value.
2. Foreign Currency: Securities and other assets and liabilities denominated in foreign currencies are translated into U.S. dollars using exchange rates obtained from an independent third party as of the fund’s pricing time on the valuation date. Realized gains (losses) and unrealized appreciation (depreciation) on investment securities include the effects of changes in exchange rates since the securities were purchased, combined with the effects of changes in security prices. Fluctuations in the value of other assets and liabilities resulting from changes in exchange rates are recorded as unrealized foreign currency gains (losses) until the assets or liabilities are settled in cash, at which time they are recorded as realized foreign currency gains (losses).
3. Futures Contracts: The fund uses index futures contracts to a limited extent, with the objective of maintaining full exposure to the stock market while maintaining liquidity. The fund may purchase or sell futures contracts to achieve a desired level of investment, whether to accommodate portfolio turnover or cash flows from capital share transactions. The primary risks associated with the use of futures contracts are imperfect correlation between changes in market values of stocks held by the fund and the prices of futures contracts, and the possibility of an illiquid market.
24
Energy Fund
Futures contracts are valued at their quoted daily settlement prices. The aggregate principal amounts of the contracts are not recorded in the Statement of Net Assets. Fluctuations in the value of the contracts are recorded in the Statement of Net Assets as an asset (liability) and in the Statement of Operations as unrealized appreciation (depreciation) until the contracts are closed, when they are recorded as realized futures gains (losses).
4. Repurchase Agreements: The fund may invest in repurchase agreements. Securities pledged as collateral for repurchase agreements are held by a custodian bank until the agreements mature. Each agreement requires that the market value of the collateral be sufficient to cover payments of interest and principal; however, in the event of default or bankruptcy by the other party to the agreement, retention of the collateral may be subject to legal proceedings.
5. Federal Income Taxes: The fund intends to continue to qualify as a regulated investment company and distribute all of its taxable income. Management has analyzed the fund’s tax positions taken for all open federal income tax years (January 31, 2007–2010), and has concluded that no provision for federal income tax is required in the fund’s financial statements.
6. Distributions: Distributions to shareholders are recorded on the ex-dividend date.
7. Security Lending: The fund may lend its securities to qualified institutional borrowers to earn additional income. Security loans are required to be secured at all times by collateral at least equal to the market value of securities loaned. The fund invests cash collateral received in Vanguard Market Liquidity Fund, and records a liability for the return of the collateral, during the period the securities are on loan. Security lending income represents the income earned on investing cash collateral, less expenses associated with the loan.
8. Other: Dividend income is recorded on the ex-dividend date. Interest income includes income distributions received from Vanguard Market Liquidity Fund and is accrued daily. Security transactions are accounted for on the date securities are bought or sold. Costs used to determine realized gains (losses) on the sale of investment securities are those of the specific securities sold. Fees assessed on redemptions of capital shares are credited to paid-in capital.
Each class of shares has equal rights as to assets and earnings, except that each class separately bears certain class-specific expenses related to maintenance of shareholder accounts (included in Management and Administrative expenses), shareholder reporting, and proxies. Marketing and distribution expenses are allocated to each class of shares based on a method approved by the board of trustees. Income, other non-class-specific expenses, and gains and losses on investments are allocated to each class of shares based on its relative net assets.
B. Wellington Management Company, LLP, provides investment advisory services to a portion of the fund for a fee calculated at an annual percentage rate of average net assets managed by the advisor. The basic fee is subject to quarterly adjustments based on performance since May 1, 2007, relative to a combined index composed of the S&P Citigroup BMI World Energy Index and the S&P 500 Energy Equal Weighted Blend Index.
25
Energy Fund
The Vanguard Group provides investment advisory services to a portion of the fund on an at-cost basis; the fund paid Vanguard advisory fees of $303,000 for the year ended January 31, 2010.
For the year ended January 31, 2010, the aggregate investment advisory fee represented an effective annual basic rate of 0.14% of the fund’s average net assets, before an increase of $2,834,000 (0.03%) based on performance.
C. The Vanguard Group furnishes at cost corporate management, administrative, marketing, and distribution services. The costs of such services are allocated to the fund under methods approved by the board of trustees. The fund has committed to provide up to 0.40% of its net assets in capital contributions to Vanguard. At January 31, 2010, the fund had contributed capital of $2,263,000 to Vanguard (included in Other Assets), representing 0.02% of the fund’s net assets and 0.91% of Vanguard’s capitalization. The fund’s trustees and officers are also directors and officers of Vanguard.
D. Various inputs may be used to determine the value of the fund’s investments. These inputs are summarized in three broad levels for financial statement purposes. The inputs or methodologies used to value securities are not necessarily an indication of the risk associated with investing in those securities.
Level 1 — Quoted prices in active markets for identical securities.
Level 2 — Other significant observable inputs (including quoted prices for similar securities, interest rates, prepayment speeds, credit risk, etc.).
Level 3 — Significant unobservable inputs (including the fund’s own assumptions used to determine the fair value of investments).
The following table summarizes the fund’s investments as of January 31, 2010, based on the inputs used to value them:
| | | |
| | Level 1 | Level 2 | Level 3 |
| Investments | ($000) | ($000) | ($000) |
| Common Stocks—United States | 6,615,109 | — | — |
| Common Stocks—International | 2,681,574 | 1,058,652 | — |
| Temporary Cash Investments | 269,736 | 415,195 | — |
| Futures Contracts—Assets1 | 4 | — | — |
| Futures Contracts—Liabilities1 | (2,041) | — | — |
| Total | 9,564,382 | 1,473,847 | — |
| 1 Represents variation margin on the last day of the reporting period. | | | |
26
Energy Fund
E. At January 31, 2010, the aggregate settlement value of open futures contracts and the related unrealized appreciation (depreciation) were:
| | | | |
| | | | | ($000) |
| | | Number of | Aggregate | Unrealized |
| | | Long (Short) | Settlement Value | Appreciation |
| Futures Contracts | Expiration | Contracts | Long (Short) | (Depreciation) |
| S&P 500 Index | March 2010 | 506 | 135,406 | (4,840) |
| E-mini S&P 500 Index | March 2010 | 2,308 | 123,524 | (6,312) |
Unrealized appreciation (depreciation) on open futures contracts is required to be treated as realized gain (loss) for tax purposes.
F. Distributions are determined on a tax basis and may differ from net investment income and realized capital gains for financial reporting purposes. Differences may be permanent or temporary. Permanent differences are reclassified among capital accounts in the financial statements to reflect their tax character. Temporary differences arise when certain items of income, expense, gain, or loss are recognized in different periods for financial statement and tax purposes; these differences will reverse at some time in the future. Differences in classification may also result from the treatment of short-term gains as ordinary income for tax purposes.
During the year ended January 31, 2010, the fund realized net foreign currency gains of $343,000, which increased distributable net income for tax purposes; accordingly, such gains have been reclassified from accumulated net realized gains to overdistributed net investment income. Certain of the fund’s investments are in securities considered to be “passive foreign investment companies,” for which any unrealized appreciation and/or realized gains are required to be included in distributable net income for tax purposes. During the year ended January 31, 2010, the fund realized gains on the sale of passive foreign investment companies of $1,324,000, which have been included in the current period’s taxable income; accordingly, such gains have been reclassified from accumulated net realized gains to overdistributed net investment income.
The fund’s realized gains for the year ended January 31, 2010, include $78,000 of capital gain tax paid on sales of Indian securities; this tax is treated as a decrease to taxable income; accordingly, this amount has been reclassified from accumulated net realized gains to overdistributed net investment income.
The fund used a tax accounting practice to treat a portion of the price of capital shares redeemed during the year as distributions from net investment income and realized capital gains. Accordingly, the fund has reclassified $2,046,000 from overdistributed net investment income, and $1,025,000 from accumulated net realized gains, to paid-in capital.
For tax purposes, at January 31, 2010, the fund had $14,973,000 of ordinary income and $62,384,000 of long-term capital gains available for distribution.
27
Energy Fund
At January 31, 2010, the cost of investment securities for tax purposes was $7,769,832,000. Net unrealized appreciation of investment securities for tax purposes was $3,270,434,000, consisting of unrealized gains of $3,614,402,000 on securities that had risen in value since their purchase and $343,968 ,000 in unrealized losses on securities that had fallen in value since their purchase.
G. During the year ended January 31, 2010, the fund purchased $3,194,502,000 of investment securities and sold $2,399,255,000 of investment securities, other than temporary cash investments.
H. Capital share transactions for each class of shares were:
| | | | |
| | | | Year Ended January 31, |
| | | 2010 | | 2009 |
| | Amount | Shares | Amount | Shares |
| | ($000) | (000) | ($000) | (000) |
| Investor Shares | | | | |
| Issued | 1,489,177 | 28,171 | 1,651,475 | 23,673 |
| Issued in Lieu of Cash Distributions | 101,349 | 1,698 | 370,438 | 6,442 |
| Redeemed1 | (1,025,302) | (19,560) | (2,258,392) | (33,208) |
| Net Increase (Decrease)—Investor Shares | 565,224 | 10,309 | (236,479) | (3,093) |
| Admiral Shares | | | | |
| Issued | 1,126,454 | 11,663 | 1,123,526 | 7,996 |
| Issued in Lieu of Cash Distributions | 65,102 | 582 | 235,956 | 2,191 |
| Redeemed1 | (682,801) | (6,994) | (1,416,960) | (11,637) |
| Net Increase (Decrease)—Admiral Shares | 508,755 | 5,251 | (57,478) | (1,450) |
| 1 Net of redemption fees for fiscal 2010 and 2009 of $3,460,000 and $5,850,000, respectively (fund totals). | | |
I. In preparing the financial statements as of January 31, 2010, management considered the impact of subsequent events for potential recognition or disclosure in these financial statements.
28
Report of Independent Registered Public Accounting Firm
To the Trustees of Vanguard Specialized Funds and the Shareholders of Vanguard Energy Fund:
In our opinion, the accompanying statement of net assets and the related statements of operations and of changes in net assets and the financial highlights present fairly, in all material respects, the financial position of Vanguard Energy Fund (constituting a separate portfolio of Vanguard Specialized Funds, hereafter referred to as the “Fund”) at January 31, 2010, the results of its operations for the year then ended, the changes in its net assets for each of the two years in the period then ended and the financial highlights for each of the five years in the period then ended, in conformity with accounting principles generally accepted in the United S tates of America. These financial statements and financial highlights (hereafter referred to as “financial statements”) are the responsibility of the Fund’s management; our responsibility is to express an opinion on these financial statements based on our audits. We conducted our audits of these financial statements in accordance with the standards of the Public Company Accounting Oversight Board (United States). Those standards require that we plan and perform the audit to obtain reasonable assurance about whether the financial statements are free of material misstatement. An audit includes examining, on a test basis, evidence supporting the amounts and disclosures in the financial statements, assessing the accounting principles used and significant estimates made by management, and evaluating the overall financial statement presentation. We believe that our audits, which included confirmation of securities at January 31 , 2010 by correspondence with the custodians and brokers and by agreement to the underlying ownership records of Vanguard Market Liquidity Fund, provide a reasonable basis for our opinion.
PricewaterhouseCoopers LLP
Philadelphia, Pennsylvania
March 16, 2010
| Special 2009 tax information (unaudited) for Vanguard Energy Fund |
This information for the fiscal year ended January 31, 2010, is included pursuant to provisions of the Internal Revenue Code.
The fund distributed $164,536,000 of qualified dividend income to shareholders during the fiscal year.
For corporate shareholders, 44.9% of investment income (dividend income plus short-term gains, if any) qualifies for the dividends-received deduction.
29
Your Fund’s After-Tax Returns
This table presents returns for your fund both before and after taxes. The after-tax returns are shown in two ways: (1) assuming that an investor owned the fund during the entire period and paid taxes on the fund’s distributions, and (2) assuming that an investor paid taxes on the fund’s distributions and sold all shares at the end of each period.
Calculations are based on the highest individual federal income tax and capital gains tax rates in effect at the times of the distributions and the hypothetical sales. State and local taxes were not considered. After-tax returns reflect any qualified dividend income , using actual prior-year figures and estimates for 2010. (In the example, returns after the sale of fund shares may be higher than those assuming no sale. This occurs when the sale would have produced a capital loss. The calculation assumes that the investor received a tax deduction for the loss.) The table shows returns for Investor Shares only; returns for other share classes will differ. Please note that your actual after-tax returns will depend on your tax situation and may differ from those shown. Also note that if you own the fund in a tax-deferred account, such as an individual retirement account or a 401(k) plan, this information does not apply to you. Such accounts are not subject to current taxes.
Finally, keep in mind that a fund’s performance—whether before or after taxes—does not guarantee future results.
| | | |
| Average Annual Total Returns: Energy Fund Investor Shares | | | |
| Periods Ended January 31, 2010 | | | |
| | One | Five | Ten |
| | Year | Years | Years |
| Returns Before Taxes | 36.28% | 11.78% | 16.08% |
| Returns After Taxes on Distributions | 35.92 | 10.95 | 15.01 |
| Returns After Taxes on Distributions and Sale of Fund Shares | 24.00 | 10.22 | 14.13 |
Total returns do not include any transaction or account fees that applied in the periods shown. Fund prospectuses provide information about current fees.
30
About Your Fund’s Expenses
As a shareholder of the fund, you incur ongoing costs, which include costs for portfolio management, administrative services, and shareholder reports (like this one), among others. Operating expenses, which are deducted from a fund’s gross income, directly reduce the investment return of the fund.
A fund’s expenses are expressed as a percentage of its average net assets. This figure is known as the expense ratio. The following examples are intended to help you understand the ongoing costs (in dollars) of investing in your fund and to compare these costs with those of other mutual funds. The examples are based on an investment of $1,000 made at the beginning of the period shown and held for the entire period.
The accompanying table illustrates your fund’s costs in two ways:
• Based on actual fund return. This section helps you to estimate the actual expenses that you paid over the period. The ”Ending Account Value“ shown is derived from the fund‘s actual return, and the third column shows the dollar amount that would have been paid by an investor who started with $1,000 in the fund. You may use the information here, together with the amount you invested, to estimate the expenses that you paid over the period.
To do so, simply divide your account value by $1,000 (for example, an $8,600 account value divided by $1,000 = 8.6), then multiply the result by the number given for your fund under the heading ”Expenses Paid During Period.“
• Based on hypothetical 5% yearly return. This section is intended to help you compare your fund‘s costs with those of other mutual funds. It assumes that the fund had a yearly return of 5% before expenses, but that the expense ratio is unchanged. In this case—because the return used is not the fund’s actual return—the results do not apply to your investment. The example is useful in making comparisons because the Securities and Exchange Commission requires all mutual funds to calculate expenses based on a 5% return. You can assess your fund’s costs by comparing this hypothetical example with the hypothetical examples that appear in shareholder reports of other funds.
Note that the expenses shown in the table are meant to highlight and help you compare ongoing costs only and do not reflect transaction costs incurred by the fund for buying and selling securities. Further, the expenses do not include the 1% fee on redemptions of shares held for less than one year, nor do they include the account service fee described in the prospectus. If such fees were applied to your account, your costs would be higher. Your fund does not carry a “sales load.” The calculations assume no shares were bought or sold during the period. Your actual costs may have been higher or lower, depending on the amount of your investment and the timing of any purchases or redemptions.
You can find more information about the fund’s expenses, including annual expense ratios, in the Financial Statements section of this report. For additional information on operating expenses and other shareholder costs, please refer to your fund’s current prospectus.
31
| | | |
| Six Months Ended January 31, 2010 | | | |
| | Beginning | Ending | Expenses |
| | Account Value | Account Value | Paid During |
| Energy Fund | 7/31/2009 | 1/31/2010 | Period |
| Based on Actual Fund Return | | | |
| Investor Shares | $1,000.00 | $1,088.70 | $1.90 |
| Admiral Shares | 1,000.00 | 1,089.09 | 1.53 |
| Based on Hypothetical 5% Yearly Return | | | |
| Investor Shares | $1,000.00 | $1,023.39 | $1.84 |
| Admiral Shares | 1,000.00 | 1,023.74 | 1.48 |
These calculations are based on expenses incurred in the most recent six-month period. The fund’s annualized six-month expense ratios for that period are 0.36% for Investor Shares and 0.29% for Admiral Shares. The dollar amounts shown as “Expenses Paid” are equal to the annualized expense ratio multiplied by the average account value over the period, multiplied by the number of days in the most recent six-month period, then divided by the number of days in the most recent 12-month period.
32
Glossary
30-Day SEC Yield. A fund’s 30-day SEC yield is derived using a formula specified by the U.S. Securities and Exchange Commission. Under the formula, data related to the fund’s security holdings in the previous 30 days are used to calculate the fund’s hypothetical net income for that period, which is then annualized and divided by the fund’s estimated average net assets over the calculation period. For the purposes of this calculation, a security’s income is based on its current market yield to maturity (in the case of bonds) or its projected dividend yield (for stocks). Because the SEC yield represents hypothetical annualized income, it will differ—at times significantly—from the fund’s actual experience. As a result, the fund’s income distributions may be higher or lower than implied by the SEC yield.
Beta. A measure of the magnitude of a fund’s past share-price fluctuations in relation to the ups and downs of a given market index. The index is assigned a beta of 1.00. Compared with a given index, a fund with a beta of 1.20 typically would have seen its share price rise or fall by 12% when the index rose or fell by 10%. For this report, beta is based on returns over the past 36 months for both the fund and the index. Note that a fund’s beta should be reviewed in conjunction with its R-squared (see definition). The lower the R-squared, the less correlation there is between the fund and the index, and the less reliable beta is as an indicator of volatility.
Dividend Yield. Dividend income earned by stocks, expressed as a percentage of the aggregate market value (or of net asset value, for a fund). The yield is determined by dividing the amount of the annual dividends by the aggregate value (or net asset value) at the end of the period. For a fund, the dividend yield is based solely on stock holdings and does not include any income produced by other investments.
Earnings Growth Rate. The average annual rate of growth in earnings over the past five years for the stocks now in a fund.
Equity Exposure. A measure that reflects a fund’s investments in stocks and stock futures. Any holdings in short-term reserves are excluded.
Expense Ratio. The percentage of a fund’s average net assets used to pay its annual administrative and advisory expenses. These expenses directly reduce returns to investors.
Foreign Holdings. The percentage of a fund represented by stocks or depositary receipts of companies based outside the United States.
Inception Date. The date on which the assets of a fund (or one of its share classes) are first invested in accordance with the fund’s investment objective. For funds with a subscription period, the inception date is the day after that period ends. Investment performance is measured from the inception date.
Median Market Cap. An indicator of the size of companies in which a fund invests; the midpoint of market capitalization (market price x shares outstanding) of a fund’s stocks, weighted by the proportion of the fund’s assets invested in each stock. Stocks representing half of the fund’s assets have market capitalizations above the median, and the rest are below it.
Price/Book Ratio. The share price of a stock divided by its net worth, or book value, per share. For a fund, the weighted average price/book ratio of the stocks it holds.
33
Price/Earnings Ratio. The ratio of a stock’s current price to its per-share earnings over the past year. For a fund, the weighted average P/E of the stocks it holds. P/E is an indicator of market expectations about corporate prospects; the higher the P/E, the greater the expectations for a company’s future growth.
R-Squared. A measure of how much of a fund’s past returns can be explained by the returns from the market in general, as measured by a given index. If a fund’s total returns were precisely synchronized with an index’s returns, its R-squared would be 1.00. If the fund’s returns bore no relationship to the index’s returns, its R-squared would be 0. For this report, R-squared is based on returns over the past 36 months for both the fund and the index.
Return on Equity. The annual average rate of return generated by a company during the past five years for each dollar of shareholder’s equity (net income divided by shareholder’s equity). For a fund, the weighted average return on equity for the companies whose stocks it holds.
Short-Term Reserves. The percentage of a fund invested in highly liquid, short-term securities that can be readily converted to cash.
Turnover Rate. An indication of the fund’s trading activity. Funds with high turnover rates incur higher transaction costs and may be more likely to distribute capital gains (which may be taxable to investors). The turnover rate excludes in-kind transactions, which have minimal impact on costs.
34
This page intentionally left blank.
The People Who Govern Your Fund
The trustees of your mutual fund are there to see that the fund is operated and managed in your best interests since, as a shareholder, you are a part owner of the fund. Your fund’s trustees also serve on the board of directors of The Vanguard Group, Inc., which is owned by the Vanguard funds and provides services to them on an at-cost basis.
A majority of Vanguard’s board members are independent, meaning that they have no affiliation with Vanguard or the funds they oversee, apart from the sizable personal investments they have made as private individuals. The independent board members have distinguished backgrounds in business, academia, and public service. Each of the trustees and executive officers oversees 162 Vanguard funds.
The following table provides information for each trustee and executive officer of the fund. More information about the trustees is in the Statement of Additional Information, which can be obtained, without charge, by contacting Vanguard at 800-662-7447, or online at www.vanguard.com.
| |
| Interested Trustee1 | Rajiv L. Gupta |
| | Born 1945. Trustee Since December 2001.2 Principal |
| F. William McNabb III | Occupation(s) During the Past Five Years: Chairman |
| Born 1957. Trustee Since July 2009. Chairman of the | and Chief Executive Officer (retired 2009) and |
| Board. Principal Occupation(s) During the Past Five | President (2006–2008) of Rohm and Haas Co. |
| Years: Chairman of the Board of The Vanguard Group, | (chemicals); Board Member of American Chemistry |
| Inc., and of each of the investment companies served | Council; Director of Tyco International, Ltd. (diversified |
| by The Vanguard Group, since January 2010; Director | manufacturing and services) and Hewlett-Packard Co. |
| of The Vanguard Group since 2008; Chief Executive | (electronic computer manufacturing); Trustee of The |
| Officer and President of The Vanguard Group and of | Conference Board. |
| each of the investment companies served by The | |
| Vanguard Group since 2008; Director of Vanguard | Amy Gutmann |
| Marketing Corporation; Managing Director of The | Born 1949. Trustee Since June 2006. Principal |
| Vanguard Group (1995–2008). | Occupation(s) During the Past Five Years: President |
| | of the University of Pennsylvania; Christopher H. |
| | Browne Distinguished Professor of Political Science |
| Independent Trustees | in the School of Arts and Sciences with secondary |
| | appointments at the Annenberg School for Commu- |
| Emerson U. Fullwood | nication and the Graduate School of Education of |
| Born 1948. Trustee Since January 2008. Principal | the University of Pennsylvania; Director of Carnegie |
| Occupation(s) During the Past Five Years: Executive | Corporation of New York, Schuylkill River Development |
| Chief Staff and Marketing Officer for North America | Corporation, and Greater Philadelphia Chamber of |
| and Corporate Vice President (retired 2008) of Xerox | Commerce; Trustee of the National Constitution Center. |
| Corporation (photocopiers and printers); Director of | |
| SPX Corporation (multi-industry manufacturing), the | |
| United Way of Rochester, the Boy Scouts of America, | |
| Amerigroup Corporation (direct health and medical | |
| insurance carriers), and Monroe Community College | |
| Foundation. | |
| | |
| JoAnn Heffernan Heisen | Executive Officers | |
| Born 1950. Trustee Since July 1998. Principal | | |
| Occupation(s) During the Past Five Years: Corporate | Thomas J. Higgins | |
| Vice President and Chief Global Diversity Officer since | Born 1957. Chief Financial Officer Since September |
| 2006 (retired 2008) and Member of the Executive | 2008. Principal Occupation(s) During the Past Five |
| Committee (retired 2008) of Johnson & Johnson | Years: Principal of The Vanguard Group, Inc.; Chief |
| (pharmaceuticals/consumer products); Vice President | Financial Officer of each of the investment companies |
| and Chief Information Officer of Johnson & Johnson | served by The Vanguard Group since 2008; Treasurer |
| (1997–2005); Director of the University Medical Center | of each of the investment companies served by The |
| at Princeton and Women’s Research and Education | Vanguard Group (1998–2008). |
| Institute; Member of the Advisory Board of the | | |
| Maxwell School of Citizenship and Public Affairs | Kathryn J. Hyatt | |
| at Syracuse University. | Born 1955. Treasurer Since November 2008. Principal |
| | Occupation(s) During the Past Five Years: Principal |
| F. Joseph Loughrey | of The Vanguard Group, Inc.; Treasurer of each of |
| Born 1949. Trustee Since October 2009. Principal | the investment companies served by The Vanguard |
| Occupation(s) During the Past Five Years: President | Group since 2008; Assistant Treasurer of each of the |
| and Chief Operating Officer since 2005 (retired 2009) | investment companies served by The Vanguard Group |
| and Vice Chairman of the Board (2008–2009) of | (1988–2008). | |
| Cummins Inc. (industrial machinery); Director of | | |
| SKF AB (industrial machinery), Hillenbrand, Inc. | Heidi Stam | |
| (specialized consumer services), Sauer-Danfoss Inc. | Born 1956. Secretary Since July 2005. Principal |
| (machinery), the Lumina Foundation for Education, | Occupation(s) During the Past Five Years: Managing |
| and the Columbus Community Education Coalition; | Director of The Vanguard Group, Inc., since 2006; |
| Chairman of the Advisory Council for the College of | General Counsel of The Vanguard Group since 2005; |
| Arts and Letters at the University of Notre Dame. | Secretary of The Vanguard Group and of each of the |
| | investment companies served by The Vanguard Group |
| André F. Perold | since 2005; Director and Senior Vice President of |
| Born 1952. Trustee Since December 2004. Principal | Vanguard Marketing Corporation since 2005; |
| Occupation(s) During the Past Five Years: George | Principal of The Vanguard Group (1997–2006). |
| Gund Professor of Finance and Banking, Harvard | | |
| Business School; Chair of the Investment Committee | | |
| of HighVista Strategies LLC (private investment firm). | Vanguard Senior Management Team |
| |
| Alfred M. Rankin, Jr. | R. Gregory Barton | Michael S. Miller |
| Born 1941. Trustee Since January 1993. Principal | Mortimer J. Buckley | James M. Norris |
| Occupation(s) During the Past Five Years: Chairman, | Kathleen C. Gubanich | Glenn W. Reed |
| President, and Chief Executive Officer of NACCO | Paul A. Heller | George U. Sauter |
| Industries, Inc. (forklift trucks/housewares/lignite); | | |
| Director of Goodrich Corporation (industrial products/ | | |
| aircraft systems and services); Deputy Chairman | Chairman Emeritus and Senior Advisor |
| of the Federal Reserve Bank of Cleveland; Trustee | | |
| of University Hospitals of Cleveland, The Cleveland | John J. Brennan | |
| Museum of Art, and Case Western Reserve University. | Chairman, 1996–2009 | |
| | Chief Executive Officer and President, 1996–2008 |
| Peter F. Volanakis | | |
| Born 1955. Trustee Since July 2009. Principal | | |
| Occupation(s) During the Past Five Years: President | Founder | |
| since 2007 and Chief Operating Officer since 2005 | | |
| of Corning Incorporated (communications equipment); | John C. Bogle | |
| President of Corning Technologies (2001–2005); | Chairman and Chief Executive Officer, 1974–1996 |
| Director of Corning Incorporated and Dow Corning; | | |
| Trustee of the Corning Incorporated Foundation and | | |
| the Corning Museum of Glass; Overseer of the | | |
| Amos Tuck School of Business Administration at | | |
| Dartmouth College. | | |
1 Mr. McNabb is considered an “interested person,” as defined in the Investment Company Act of 1940, because he is an officer of the Vanguard funds.
2 December 2002 for Vanguard Equity Income Fund, Vanguard Growth Equity Fund, the Vanguard Municipal Bond Funds, and the Vanguard State Tax-Exempt Funds.
| 
|
| P.O. Box 2600 |
| Valley Forge, PA 19482-2600 |
Connect with Vanguard® > www.vanguard.com
| Fund Information > 800-662-7447 | CFA® is a trademark owned by CFA Institute. |
| |
| Direct Investor Account Services > 800-662-2739 | |
| |
| Institutional Investor Services > 800-523-1036 | |
| |
| Text Telephone for People | |
| With Hearing Impairment > 800-749-7273 | |
| |
| This material may be used in conjunction | |
| with the offering of shares of any Vanguard | |
| fund only if preceded or accompanied by | |
| the fund’s current prospectus. | |
| |
| All comparative mutual fund data are from Lipper Inc. or | |
| Morningstar, Inc., unless otherwise noted. | |
| |
| You can obtain a free copy of Vanguard’s proxy voting | |
| guidelines by visiting our website, www.vanguard.com, | |
| and searching for “proxy voting guidelines,” or by calling | |
| Vanguard at 800-662-2739. The guidelines are also | |
| available from the SEC’s website, www.sec.gov. In | |
| addition, you may obtain a free report on how your fund | |
| voted the proxies for securities it owned during the 12 | |
| months ended June 30. To get the report, visit either | |
| www.vanguard.com or www.sec.gov. | |
| |
| You can review and copy information about your fund at | |
| the SEC’s Public Reference Room in Washington, D.C. To | |
| find out more about this public service, call the SEC at | |
| 202-551-8090. Information about your fund is also | |
| available on the SEC’s website, and you can receive | |
| copies of this information, for a fee, by sending a | |
| request in either of two ways: via e-mail addressed to | |
| publicinfo@sec.gov or via regular mail addressed to the | |
| Public Reference Section, Securities and Exchange | |
| Commission, Washington, DC 20549-1520. | |
| |
| © 2010 The Vanguard Group, Inc. |
| All rights reserved. |
| Vanguard Marketing Corporation, Distributor. |
 | |
| Q510 032010 |
 |
| Vanguard Precious Metals |
| and Mining Fund Annual Report |
|
|
|
| January 31, 2010 |
|
|
 |
|
|
> For the fiscal year ended January 31, 2010, Vanguard Precious Metals and Mining Fund returned about 78%.
> The fund’s return surpassed that of its benchmark and was more than double the average return of gold-oriented funds.
> Stocks of platinum-mining companies were substantial contributors to the fund’s return.
| |
| Contents | |
| Your Fund’s Total Returns. | 1 |
| Chairman’s Letter. | 2 |
| Advisor’s Report. | 8 |
| Fund Profile. | 11 |
| Performance Summary. | 12 |
| Financial Statements. | 14 |
| Your Fund’s After-Tax Returns. | 25 |
| About Your Fund’s Expenses. | 26 |
| Glossary. | 28 |
Please note: The opinions expressed in this report are just that—informed opinions. They should not be considered promises or advice. Also, please keep in mind that the information and opinions cover the period through the date on the front of this report. Of course, the risks of investing in your fund are spelled out in the prospectus.
See the Glossary for definitions of investment terms used in this report.
Cover photograph: Veronica Coia.
| | | | |
| Your Fund’s Total Returns | | | | |
| |
| |
| |
| |
| Fiscal Year Ended January 31, 2010 | | | | |
| | | | | Total |
| | | | | Returns |
| Vanguard Precious Metals and Mining Fund | | | | 77.75% |
| S&P Custom Precious Metals and Mining Index | | | | 72.15 |
| Gold-Oriented Funds Average | | | | 35.25 |
| Gold-Oriented Funds Average: Derived from data provided by Lipper Inc. | | | |
| |
| Your Fund’s Performance at a Glance | | | | |
| January 31, 2009 , Through January 31, 2010 | | | | |
| | | | Distributions Per Share |
| | Starting | Ending | Income | Capital |
| | Share Price | Share Price | Dividends | Gains |
| Vanguard Precious Metals and Mining Fund | $10.74 | $18.74 | $0.300 | $0.000 |
1

Chairman’s Letter
Dear Shareholder,
The fiscal year ended January 31, 2010, contrasted sharply with fiscal 2009. A slump in the economy, stocks, and metal prices gave way to the beginnings of an economic upturn (though job growth is disappointingly slow), a strong stock market rally, and a surge in the prices of base and precious metals.
This confluence of events helped Vanguard Precious Metals and Mining Fund return about 78%, a reversal of the prior year’s unprecedented decline. Most of the portfolio’s widely diversified investments contributed to its return, although the largest boost came from the stocks of platinum-mining companies.
Note: If you hold the fund in a taxable account, you may wish to refer to our report on after-tax performance later in this report.
Remarkable rally loses steam at year-end
The broad U.S. stock market returned about 36% for the 12 months through January 31. Stocks began the period under severe pressure from the global financial crisis and a stalled U.S. economy. After a dismal showing in February 2009, however, U.S. equities turned the corner in early March and kept surging until the fiscal year’s final weeks, when the major market indexes pulled back a bit. During the nine months, the federal government’s stimulus plan took hold, companies began to repair
2
their balance sheets, and investors increased their appetite for risk—the riskier the better, it seemed.
The stock market’s exuberance overshot the pace of economic recovery, which slowly improved as the year progressed. It wasn’t until the third calendar quarter that the recession appeared to be ending; however, double-digit unemployment still weighed on the economy.
International markets traced an even steeper line upward than their U.S. counterpart for most of the fiscal year. They recovered strongly through 2009 and into 2010, before dropping in the latter half of January amid concerns about the strength of the global recovery. The most impressive international returns came from emerging markets, with especially strong results from Brazil and China.
Although the fiscal year’s returns were a welcome relief for stock investors worldwide, the severity of the financial crisis continues to depress the longer-term record, especially for U.S. stocks.
Bond returns traced very different courses
The U.S. government’s programs also soothed parts of the bond market as the fiscal year progressed. At the start of the period, the difference between the yields of corporate bonds and those of U.S. Treasuries had widened almost to levels last seen in the 1930s, an indication of
| | | |
| Market Barometer | | | |
| |
| | | Average Annual Total Returns |
| | | Periods Ended January 31, 2010 |
| | One | Three | Five |
| | Year | Years | Years |
| Stocks | | | |
| Russell 1000 Index (Large-caps) | 34.81% | -7.10% | 0.57% |
| Russell 2000 Index (Small-caps) | 37.82 | -7.74 | 0.61 |
| Dow Jones U.S. Total Stock Market Index | 36.06 | -6.72 | 0.94 |
| MSCI All Country World Index ex USA (International) | 48.28 | -4.76 | 5.61 |
| |
| Bonds | | | |
| Barclays Capital U.S. Aggregate Bond Index (Broad | | | |
| taxable market) | 8.51% | 6.60% | 5.16% |
| Barclays Capital Municipal Bond Index | 9.49 | 4.68 | 4.23 |
| Citigroup Three-Month U.S. Treasury Bill Index | 0.15 | 2.07 | 2.84 |
| |
| CPI | | | |
| Consumer Price Index | 2.63% | 2.30% | 2.59% |
3
just how unwilling investors were to take on risk. As the threat of a depression receded, however, confidence returned and investors flocked to the lowest-quality, highest-yielding bonds, passing over conservative Treasuries, the previous year’s favorite.
For the 12 months ended January 31, 2010, the broad taxable bond market returned about 8.51%, municipal bonds returned about 9%, and high-yield corporate bonds delivered a stunning 51%. Meanwhile, Treasury returns were negative to lackluster, depending on their maturity.
While the Federal Reserve’s monetary policies seemed to help the stock market and most areas of the bond market, the policies exacted a heavy price from money market investors. The Fed kept the federal funds rate––the interest rate that banks charge one another for overnight lending, a benchmark for the market’s short-term rates––between 0% and 0.25% during the entire fiscal year.
Although the Fed said it planned to maintain those rates for an “extended period,” it recently indicated that it was ready to wind down emergency measures and would halt its purchase of agency mortgage-backed securities and debt in the coming months.
| | |
| Expense Ratios | | |
| Your Fund Compared With Its Peer Group | | |
| | | Peer Group |
| | Fund | Average |
| Precious Metals and Mining Fund | 0.39% | 1.43% |
The fund expense ratio shown is from the prospectus dated May 29, 2009, and represents estimated costs for the current fiscal year based on the fund’s net assets as of the prospectus date. For the fiscal year ended January 31, 2010, the fund’s expense ratio was 0.27%. The peer-group expense ratio is derived from data provided by Lipper Inc. and captures information through year-end 2009.
Peer group: Gold-Oriented Funds.
4
Metal prices rise on expectations of growth and growth-fed inflation
Developed markets around the world regained economic steam at different rates during 2009, while many developing countries, especially China, continued their steady growth. The resulting demand, and expectations of demand, from industry has sharply boosted the prices of base metals such as copper (+116%), zinc (+95%), and nickel (+65%). On the strength of expected car sales, prices for platinum and palladium—precious metals that are key components of automobile catalytic converters, their primary market—climbed 52% and 116%, respectively.
Expectations of growth also fueled the run-up in the price of gold (+17%)—although gold’s price lagged that of other metals. Gold is the traditional haven for investors who fear that governments’ easy-money policies will produce severe inflation and depreciating currencies. Governments, of course, have been combating the financial crisis and steep economic slump by flooding the financial markets with liquidity.
All these trends affected the Precious Metals and Mining Fund’s portfolio of 40 or so stocks. Although the fund’s holdings are concentrated, they are also diversified among the subsectors of the broad metals and mining industry. This diversification
| |
| Total Returns | |
| Ten Years Ended January 31, 2010 | |
| | Average |
| | Annual Return |
| Precious Metals and Mining Fund | 17.85% |
| Spliced Precious Metals and Mining Index | 17.16 |
| Gold-Oriented Funds Average | 17.95 |
Spliced Precious Metals and Mining Index: MSCI Gold Mines Index through December 31, 1994; S&P/Citigroup World Equity Gold Index through June 30, 2005; S&P Custom Precious Metals and Mining Index thereafter.
Gold-Oriented Funds Average: Derived from data provided by Lipper Inc.
The figures shown represent past performance, which is not a guarantee of future results. (Current performance may be lower or higher than the performance data cited. For performance data current to the most recent month-end, visit our website at www.vanguard.com/performance.) Note, too, that both investment returns and principal value can fluctuate widely, so an investor’s shares, when sold, could be worth more or less than their original cost.
5
helps to temper some of the volatility that is characteristic of precious metal stocks (and makes the fund quite different from gold-oriented funds). Relative to the broad market, of course, the fund can be expected to deliver exceptionally volatile performance.
A half-dozen platinum-mining stocks were the driving force behind the fund’s 78% return, contributing about 33 percentage points. These included shares of Anglo Platinum, Impala Platinum Holdings, and Lonmin—the world’s three largest platinum producers.
Consistent with the more modest run-up in gold prices, the ten or so gold-mining stocks in the portfolio together contributed only about 8 percentage points to return. The primary contributors among this group were Toronto’s Centerra Gold, which mines gold in Kyrgyzstan and Mongolia, and London-based Petropavlovsk (formerly, Peter Hambro Mining), which operates in eastern Russia. M&G Investment Management Ltd., the fund’s advisor, takes a very disciplined approach to selecting gold-mining companies for the portfolio, owing to M&G’s belief that many of these companies are run inefficiently.
Other major contributors illustrate the fund’s diversity. These included, for example, the French firms Eramet, a miner of nickel and manganese, and Imerys, which processes rare industrial minerals; Sims Metal Management, the Australian metals recycling firm; and First Quantum Minerals, a Canadian firm that mines copper in Africa. Together, they accounted for about 19 percentage points of return.
A research-heavy approach has paid off over time
Stock returns rise and fall in the normal course of events, although their movements over the past two years have been more extreme. A fund like the Precious Metals and Mining Fund has additional layers of volatility built in. These stem from the nature of the industries in which the fund invests as well as from the concentrated nature of its stockholdings. These factors have produced wide swings in returns, from 34% for fiscal 2008 to –60% for 2009, and to 78% for 2010.
To put such year-to-year volatility into perspective, it’s important to take a long-term view, which accounts for good markets and bad markets and those in between. The fund’s average annual return of about 18% for the decade ended January 31, 2010, outpaced that of its benchmark index and virtually matched the average return of gold-oriented funds (see the table on page 5).
The ten-year results are extraordinary and are a tribute to M&G’s skills. Underlying the results is the consistent application of the advisor’s approach: to understand a company in detail through a research-intensive “bottom-up” approach that emphasizes factors such as whether a company is operating cost-effectively; and to diversify the fund’s holdings as sensibly as possible.
6
A word of caution is nevertheless in order: While our confidence in the fund’s advisor remains high, it would be unrealistic to use the past decade’s average annual gain of 18% as a basis for future expectations. Metals prices and mining stocks are notoriously volatile. This segment of the stock market—and this fund—have also experienced long stretches of weak performance.
Balance and diversification: A time-tested approach
Most stock investors were undoubtedly discouraged at the market’s steep descent in 2008 and early 2009. The strong recovery that followed underscored the benefit of patience and persistence. However, living through the market’s ups and downs is often easier said than done.
That’s why, no matter what the stock market does in the coming year, we believe it is crucial to maintain a portfolio that’s diversified both among and within different asset classes and tailored to each investor’s time horizon and risk tolerance. This time-tested approach can shield your investments from the worst of the market’s gyrations. Vanguard Precious Metals and Mining Fund can play a useful role as one element of such a diversified portfolio.
On another matter, I would like to inform you that as of January 1, 2010, we completed a leadership transition that began in March 2008. I succeeded Jack Brennan as chairman of Vanguard and each of its funds. Jack has agreed to serve as chairman emeritus and senior advisor.
Under Jack’s leadership, Vanguard has grown to become a preeminent firm in the mutual fund industry. Jack’s energy, his relentless pursuit of perfection, and his unwavering focus on always doing the right thing for our clients are evident in every facet of Vanguard policy today.
As always, thank you for entrusting your assets to Vanguard.
Sincerely,

F. William McNabb III
Chairman and Chief Executive Officer
February 19, 2010
Advisor’s Report
Vanguard Precious Metals and Mining Fund produced a strong absolute return of 77.75% for the 12 months ended January 31, 2010. This was several percentage points ahead of the fund’s customized benchmark index, which gained 72.15%, and significantly ahead of the 35.25% average return of gold-oriented funds.
Having proved its worth as a store of value during the worst of the 2008–2009 financial crisis, gold continued its price rise during much of the most recent fiscal period, reaching record highs in excess of $1,200 per ounce in December 2009, before finishing the period nearer to $1,100. The main supports to the gold price continued to be investment-related, with investors remaining concerned about the prospect of higher inflation and a weaker U.S. dollar, in spite of relatively weak jewelry demand and less than compelling supply-side fundamentals.
Outside of gold, most of the more industrially sensitive metals and minerals—which had suffered dramatic declines in the second half of 2008—rebounded sharply during the 12 months owing to improvements in the economic outlook, the greater exposure of these commodities to robust demand in China, and investors’ heightened appetite for risk. Against this backdrop, mining groups that produce industrial metals and minerals enjoyed steep share price appreciation and generally outperformed the pure gold producers, with the latter group lagging the strength in gold’s price.
The central factor in the fund’s strong performance, therefore, was its significant exposure to the producers of more industrially sensitive metals (such as platinum) at the expense of gold. This reversed the negative impact of our stance during last year’s downturn, when the fund’s lack of exposure to relatively resilient gold producers hurt performance. Our view throughout both periods has been that, for long-term, fundamentally driven firms such as ourselves, the broader mining industry contains many more attractively valued, asset-rich companies focused on generating returns for shareholders. By contrast, in spite of gold’s perceived safe haven, gold producers in general continue to struggle to manage rising costs and generate tangible returns for investors.
As such, the fund’s substantial holdings in U.K.-listed platinum-producer Lonmin and South African producers Impala Platinum and Anglo Platinum made positive contributions to performance, vindicating our conviction in the long-term value of these companies’ assets. Autocatalyst-related demand for platinum, which is used to reduce harmful emissions from vehicle exhausts, is expected to rise strongly in the coming years as a result of soaring automotive growth in developing countries and intensifying emissions legislation around the world. Supply-side issues are equally supportive of platinum prices, with the cost and difficulty of extracting the metal from the ground further constraining the production of what is already a very scarce natural resource.
8
Elsewhere, a number of broader mining-related companies made very healthy contributions to the fund’s performance. Hong Kong-based commodities trading firm Noble Group performed impressively as global materials demand picked up and a Chinese sovereign wealth fund offered long-term financial support to the business. Canadian-listed copper producer First Quantum Minerals, French nickel producer Eramet, and Canadian nickel and coal producer Sherritt International all had strong results as resurgent demand for industrial metals and minerals boosted prices for their products.
On the negative side, Australian mineral sands producer Iluka Resources struggled to offset the earnings-eroding impact of the strong Australian dollar, in spite of rapidly growing Chinese demand for its products (in the manufacture of ceramics and paint, for example). Following a strong performance last year, Canadian gold royalty company Franco-Nevada lagged in the face of cool investor reaction to the company’s bid for a rival mineral royalty company. Elsewhere, weak performances came from scrap-metal recycler Schnitzer Steel Industries and specialty minerals company Minerals Technologies—both U.S.-based—and from French kaolin producer Imerys. These companies were affected, respectively, by their greater exposure to the weak industrial recovery in the United States and Western Europe.
During the fund’s fiscal year, we continued to increase our holdings in metals and minerals producers that have returns-focused management and exposure to strategically important materials. Among these, we built up a large position in diversified mining giant BHP Billiton, whose financial strength and broad range of world-class mining assets set it ahead of most of its competition. We also established a new holding in Hochschild Mining, a well-managed gold and silver producer in Latin America, and we added to our position in Noble Group, which is well-placed to fill the gap as some banks have reduced or ceased their commodities trading operations.
In terms of sales from the portfolio, our two most significant actions were to reduce our substantial holding in Franco-Nevada and to eliminate our position in Australian steel producer BlueScope Steel. We decreased the Franco-Nevada holding following a strong run in its shares and the company’s ill-advised (in our view) bid for one of its competitors. We sold out of Bluescope Steel after not participating in a heavily discounted rights issue. We also reduced positions in Barrick Gold, the world’s largest gold producer; Minerals Technologies, a specialty minerals producer; and Peabody Energy, the world’s largest coal miner.
The strong performance of the broader mining sector during the fiscal year ended January 31, 2010, vindicates our decision to look beyond the short-term panic of a year ago. However, following such a powerful rally, valuations across the mining spectrum appear more stretched, so we believe greater caution is required; as such, we have been building up the portfolio’s cash position.
9
Nevertheless, we continue to believe that appetite for commodities will be supported over the long-term by infrastructure expenditure worldwide and rising urbanization in developing economies.
We remain convinced of the importance of sticking to long-term investment principles and focusing on industry and company fundamentals. We shall continue to invest in well-capitalized, trustworthy companies, with strategically important assets whose value is not properly appreciated by investors. It follows that we are avoiding those companies that are operating in disadvantaged industries, have unsound balance sheets, and are run by managers who do not have the interests of long-term shareholders in mind.
Portfolio Managers: Graham E. French, Matthew Vaight, UKSIP
M&G Investment Management Ltd.
February 26, 2010
10
Precious Metals and Mining Fund
Fund Profile
As of January 31, 2010
| | | |
| Portfolio Characteristics | | |
| | | S&P | |
| | | Precious | DJ |
| | | Metals and | U.S. Total |
| | | Mining | Market |
| | Fund | Index | Index |
| Number of Stocks | 44 | 281 | 4,185 |
| Median Market Cap | $4.2B | $21.0B | $29.6B |
| Price/Book Ratio | 2.1x | 2.3x | 2.1x |
| Return on Equity | 17.5% | 19.9% | 19.2% |
| Earnings Growth Rate 12.6% | | 20.5% | 7.7% |
| Dividend Yield | 1.4% | 1.3% | 1.9% |
| Foreign Holdings | 86.7% | 0.0% | 0.0% |
| Turnover Rate | 17% | — | — |
| Ticker Symbol | VGPMX | — | — |
| Expense Ratio1 | 0.39% | — | — |
| Short-Term Reserves | 3.4% | — | — |
| |
| Market Diversification (% of equity exposure) |
| Europe | |
| United Kingdom | 25.4% |
| France | 12.6 |
| Germany | 3.0 |
| Other | 0.1 |
| Subtotal | 41.1 |
| Pacific | |
| Australia | 17.4% |
| Singapore | 3.9 |
| Subtotal | 21.3 |
| Emerging Markets | |
| South Africa | 12.5% |
| Other | 0.7 |
| Subtotal | 13.2 |
| North America | |
| Canada | 15.6% |
| United States | 8.8 |
| Subtotal | 24.4 |
| | |
| Volatility Measures | | |
| | S&P | |
| | Precious | DJ |
| | Metals and | U.S. Total |
| | Mining | Market |
| | Index | Index |
| R-Squared | 0.89 | 0.61 |
| Beta | 0.99 | 1.59 |
These measures show the degree and timing of the fund’s fluctuations compared with the indexes over 36 months.
| | |
| Ten Largest Holdings (% of total net assets) |
| Lonmin PLC | Precious Metals & | |
| | Minerals | 8.1% |
| Johnson Matthey PLC | Specialty Chemicals | 7.1 |
| Impala Platinum Holdings | Precious Metals & | |
| Ltd. ADR | Minerals | 6.5 |
| Imerys SA | Construction | |
| | Materials | 6.1 |
| Eramet | Diversified Metals | |
| | & Mining | 5.9 |
| Sims Metal Management | Steel | |
| Ltd. | | 4.7 |
| Centerra Gold Inc. | Gold | 4.4 |
| BHP Billiton Ltd. | Diversified Metals | |
| | & Mining | 4.0 |
| Noble Group Ltd. | Trading Companies | |
| | & Distributors | 3.7 |
| Hochschild Mining PLC | Precious Metals & | |
| | Minerals | 3.7 |
| Top Ten | | 54.2% |
The holdings listed exclude any temporary cash investments and equity index products.
Allocation by Region (% of equity exposure)

1 The expense ratio shown is from the prospectus dated May 29, 2009, and represents estimated costs for the current fiscal year based on the fund’s net assets as of the prospectus date. For the fiscal year ended January 31, 2010, the fund’s expense ratio was 0.27%.
11
Precious Metals and Mining Fund
Performance Summary
All of the returns in this report represent past performance, which is not a guarantee of future results that may be achieved by the fund. (Current performance may be lower or higher than the performance data cited. For performance data current to the most recent month-end, visit our website at www.vanguard.com/performance.) Note, too, that both investment returns and principal value can fluctuate widely, so an investor’s shares, when sold, could be worth more or less than their original cost. The returns shown do not reflect taxes that a shareholder would pay on fund distributions or on the sale of fund shares.
Cumulative Performance: January 31, 2000, Through January 31, 2010
Initial Investment of $10,000

| | | | |
| | Average Annual Total Returns | |
| | Periods Ended January 31, 2010 | |
| | | | | Final Value |
| | One | Five | Ten | of a $10,000 |
| | Year | Years | Years | Investment |
| Precious Metals and Mining Fund | 77.75% | 13.66% | 17.85% | $51,693 |
| Dow Jones U.S. Total Stock Market | | | | |
| Index | 36.06 | 0.94 | -0.09 | 9,907 |
| Spliced Precious Metals and Mining | | | | |
| Index | 72.15 | 17.31 | 17.16 | 48,750 |
| Gold-Oriented Funds Average | 35.25 | 16.81 | 17.95 | 52,114 |
Spliced Precious Metals and Mining Index: MSCI Gold Mines Index through December 31, 1994; S&P/Citigroup World Equity Gold Index through June 30, 2005; S&P Custom Precious Metals and Mining Index thereafter.
Gold-Oriented Funds Average: Derived from data provided by Lipper Inc.
Vanguard fund total returns do not include any transaction or account fees that applied in the periods shown. Fund prospectuses provide information about current fees.
See Financial Highlights for dividend and capital gains information.
12
Precious Metals and Mining Fund
Fiscal-Year Total Returns (%): January 31, 2000, Through January 31, 2010
Average Annual Total Returns: Periods Ended December 31, 2009
This table presents average annual total returns through the latest calendar quarter—rather than through the end of
the fiscal period. Securities and Exchange Commission rules require that we provide this information.
| | | | |
| | Inception | One | Five | Ten |
| | Date | Year | Years | Years |
| Precious Metals and Mining Fund | 5/23/1984 | 76.46% | 15.33% | 17.79% |
Vanguard fund total returns do not include any transaction or account fees that applied in the periods shown. Fund prospectuses provide information about current fees.
13
Precious Metals and Mining Fund
Financial Statements
Statement of Net Assets
As of January 31, 2010
The fund reports a complete list of its holdings in regulatory filings four times in each fiscal year, at the quarter-ends. For the second and fourth fiscal quarters, the lists appear in the fund’s semiannual and annual reports to shareholders. For the first and third fiscal quarters, the fund files the lists with the Securities and Exchange Commission on Form N-Q. Shareholders can look up the fund’s Forms N-Q on the SEC’s website at www.sec.gov. Forms N-Q may also be reviewed and copied at the SEC’s Public Reference Room (see the back cover of this report for further information).
| | | |
| | | | Market |
| | | | Value• |
| | | Shares | ($000) |
| Common Stocks (95.0%) | | |
| Australia (16.6%) | | |
| | Sims Metal | | |
| | Management Ltd. | 9,220,000 | 173,146 |
| | BHP Billiton Ltd. | 4,200,000 | 146,011 |
| *,1 | Iluka Resources Ltd. | 41,783,827 | 121,198 |
| * | Aquila Resources Ltd. | 7,892,500 | 59,041 |
| *,1 | St. Barbara Ltd. | 180,024,246 | 39,500 |
| *,1 | Resolute Mining Ltd. | 37,000,000 | 32,015 |
| 1 | Panoramic | | |
| | Resources Ltd. | 19,700,000 | 31,730 |
| *,1 | Apex Minerals NL | 260,000,000 | 7,085 |
| * | MIL Resources Ltd. | 1,678,671 | 53 |
| | | | 609,779 |
| Canada (14.8%) | | |
| *,1 | Centerra Gold Inc. | 16,000,000 | 162,058 |
| 1 | Sherritt | | |
| | International Corp. | 17,175,000 | 98,625 |
| *,1 | Harry Winston | | |
| | Diamond Corp. | 9,050,000 | 83,200 |
| | First Quantum | | |
| | Minerals Ltd. | 950,000 | 68,901 |
| | Franco-Nevada Corp. | 1,850,000 | 46,784 |
| * | Eldorado Gold Corp. | 3,900,000 | 46,322 |
| *,1 | Nevsun Resources Ltd. | 13,000,000 | 24,924 |
| * | Minefinders Corp. | | |
| | (New York Shares) | 1,299,900 | 11,907 |
| *,^ | Claude Resources Inc. | 2,650,000 | 2,544 |
| * | Minefinders Corp. | 100,100 | 919 |
| | | | 546,184 |
| France (11.9%) | | |
| 1 | Imerys SA | 4,056,000 | 224,312 |
| | Eramet | 716,626 | 215,747 |
| | | | 440,059 |
| Germany (2.8%) | | |
| | K&S AG | 1,840,000 | 103,432 |
| |
| Indonesia (0.2%) | | |
| | International Nickel | | |
| | Indonesia Tbk PT | 17,500,000 | 6,621 |
| | | |
| | | | Market |
| | | | Value• |
| | | Shares | ($000) |
| Ireland (0.1%) | | |
| * | Kenmare Resources PLC | 5,138,062 | 2,003 |
| |
| Papua New Guinea (0.0%) | | |
| * | Bougainville Copper Ltd. | 2,000,000 | 1,020 |
| |
| Peru (0.5%) | | |
| | Cia de Minas Buenaventura | |
| | SA ADR | 600,000 | 18,888 |
| |
| Singapore (3.7%) | | |
| | Noble Group Ltd. | 67,337,052 | 136,827 |
| |
| South Africa (11.9%) | | |
| | Impala Platinum | | |
| | Holdings Ltd. ADR | 9,350,000 | 238,518 |
| * | Anglo Platinum Ltd. ADR | 1,350,000 | 126,225 |
| | Northam Platinum Ltd. | 11,200,000 | 72,288 |
| | | | 437,031 |
| United Kingdom (24.2%) | | |
| *,1 | Lonmin PLC | 10,391,666 | 297,263 |
| 1 | Johnson Matthey PLC | 11,311,294 | 262,966 |
| 1 | Hochschild Mining PLC | 31,500,000 | 135,378 |
| *,1 | Petropavlovsk PLC | 9,332,359 | 131,813 |
| | Vedanta Resources PLC | 1,500,000 | 57,535 |
| * | Gem Diamonds Ltd. | 1,800,000 | 6,710 |
| * | Mwana Africa PLC | 3,180,219 | 686 |
| * | Gemfields PLC | 3,333,333 | 287 |
| * | Zambezi Resources Ltd. | 4,895,833 | 98 |
| | | | 892,736 |
| United States (8.3%) | | |
| | Newmont Mining Corp. | 2,200,000 | 94,292 |
| 1 | AMCOL | | |
| | International Corp. | 3,030,000 | 76,144 |
| | Schnitzer Steel | | |
| | Industries Inc. | 1,750,000 | 70,875 |
| | Minerals Technologies Inc. | 842,778 | 40,285 |
| | Peabody Energy Corp. | 600,000 | 25,272 |
| | | | 306,868 |
| Total Common Stocks (Cost $3,378,279) | 3,501,448 |
14
| | |
| Precious Metals and Mining Fund | |
| |
| |
| |
| | | Market |
| | | Value• |
| | Shares | ($000) |
| Precious Metals (0.1%) | | |
| * Platinum Bullion | | |
| (In Troy Ounces) | 2,009 | 3,022 |
| Total Precious Metals (Cost $1,213) | 3,022 |
| Temporary Cash Investment (3.4%) | |
| Money Market Fund (3.4%) | |
| 2,3 Vanguard Market | | |
| Liquidity Fund, 0.175% | | |
| (Cost $124,064) | 124,064,379 | 124,064 |
| Total Investments (98.5%) | |
| (Cost $3,503,556) | | 3,628,534 |
| Other Assets and Liabilities (1.5%) | |
| Other Assets | | 96,869 |
| Liabilities3 | | (41,288) |
| | | 55,581 |
| Net Assets (100%) | | |
| Applicable to 196,614,624 outstanding | |
| $.001 par value shares of beneficial | |
| interest (unlimited authorization) | 3,684,115 |
| Net Asset Value Per Share | $18.74 |
| |
| |
| Statement of Assets and Liabilities | |
| Assets | | |
| Investments in Securities, at Value | 3,628,534 |
| Receivables for Investment | |
| Securities Sold | | 65,002 |
| Receivables for Capital Shares Issued | 4,335 |
| Other Assets | | 27,532 |
| Total Assets | | 3,725,403 |
| Liabilities | | |
| Payables for Capital Shares Redeemed | 8,512 |
| Security Lending Collateral | |
| Payable to Brokers | | 551 |
| Other Liabilities | | 32,225 |
| Total Liabilities | | 41,288 |
| Net Assets | | 3,684,115 |
| |
| At January 31, 2010, net assets consisted of: |
| | Amount |
| | ($000) |
| Paid-in Capital | 3,719,111 |
| Overdistributed Net Investment Income | (53,960) |
| Accumulated Net Realized Losses | (105,479) |
| Unrealized Appreciation (Depreciation) | |
| Investment Securities | 124,978 |
| Foreign Currencies | (535) |
| Net Assets | 3,684,115 |
• See Note A in Notes to Financial Statements.
* Non-income-producing security.
^ Part of security position is on loan to broker-dealers. The total value of securities on loan is $265,000.
1 Considered an affiliated company of the fund as the fund owns more than 5% of the outstanding voting securities of such company.
2 Affiliated money market fund available only to Vanguard funds and certain trusts and accounts managed by Vanguard. Rate shown is the 7-day yield.
3 Includes $551,000 of collateral received for securities on loan.
ADR—American Depositary Receipt.
See accompanying Notes, which are an integral part of the Financial Statements.
15
| |
| Precious Metals and Mining Fund | |
| |
| |
| Statement of Operations | |
| |
| | Year Ended |
| | January 31, 2010 |
| | ($000) |
| Investment Income | |
| Income | |
| Dividends1,2 | 24,425 |
| Interest2 | 125 |
| Security Lending | 665 |
| Total Income | 25,215 |
| Expenses | |
| Investment Advisory Fees—Note B | |
| Basic Fee | 3,890 |
| Performance Adjustment | (2,282) |
| The Vanguard Group—Note C | |
| Management and Administrative | 5,383 |
| Marketing and Distribution | 510 |
| Custodian Fees | 161 |
| Auditing Fees | 36 |
| Shareholders’ Reports and Proxies | 162 |
| Trustees’ Fees and Expenses | 6 |
| Total Expenses | 7,866 |
| Net Investment Income | 17,349 |
| Realized Net Gain (Loss) | |
| Investment Securities Sold2 | (58,835) |
| Foreign Currencies | (3,023) |
| Realized Net Gain (Loss) | (61,858) |
| Change in Unrealized Appreciation (Depreciation) | |
| Investment Securities | 1,391,759 |
| Foreign Currencies | (540) |
| Change in Unrealized Appreciation (Depreciation) | 1,391,219 |
| Net Increase (Decrease) in Net Assets Resulting from Operations | 1,346,710 |
| 1 | Dividends are net of foreign withholding taxes of $1,660,000. |
| 2 | Dividend income, interest income, and realized net gain (loss) from affiliated companies of the fund were $17,028,000, $125,000, and ($27,776,000), respectively. |
See accompanying Notes, which are an integral part of the Financial Statements.
16
| | |
| Precious Metals and Mining Fund | | |
| |
| |
| Statement of Changes in Net Assets | | |
| |
| | Year Ended January 31, |
| | 2010 | 2009 |
| | ($000) | ($000) |
| Increase (Decrease) in Net Assets | | |
| Operations | | |
| Net Investment Income | 17,349 | 82,443 |
| Realized Net Gain (Loss) | (61,858) | 284,265 |
| Change in Unrealized Appreciation (Depreciation) | 1,391,219 | (3,024,276) |
| Net Increase (Decrease) in Net Assets Resulting from Operations | 1,346,710 | (2,657,568) |
| Distributions | | |
| Net Investment Income | (53,316) | (99,293) |
| Realized Capital Gain1 | — | (361,426) |
| Total Distributions | (53,316) | (460,719) |
| Capital Share Transactions | | |
| Issued | 1,369,003 | 841,029 |
| Issued in Lieu of Cash Distributions | 48,944 | 423,318 |
| Redeemed2 | (671,175) | (1,137,039) |
| Net Increase (Decrease) from Capital Share Transactions | 746,772 | 127,308 |
| Total Increase (Decrease) | 2,040,166 | (2,990,979) |
| Net Assets | | |
| Beginning of Period | 1,643,949 | 4,634,928 |
| End of Period3 | 3,684,115 | 1,643,949 |
| 1 | Includes fiscal 2009 short-term gain distributions totaling $2,529,000. Short-term gain distributions are treated as ordinary income dividends for tax purposes. |
| 2 | Net of redemption fees for fiscal 2010 and 2009 of $2,627,000 and $2,019,000, respectively. |
| 3 | Net Assets—End of Period includes undistributed (overdistributed) net investment income of ($53,960,000) and ($36,107,000). |
See accompanying Notes, which are an integral part of the Financial Statements.
17
| | | | | |
| Precious Metals and Mining Fund | | | | | |
| |
| |
| Financial Highlights | | | | | |
| |
| |
| For a Share Outstanding | | | Year Ended January 31, |
| Throughout Each Period | 2010 | 2009 | 2008 | 2007 | 2006 |
| Net Asset Value, Beginning of Period | $10.74 | $33.45 | $28.64 | $27.08 | $16.46 |
| Investment Operations | | | | | |
| Net Investment Income | .0931 | .653 | .9001 | .560 | .3372 |
| Net Realized and Unrealized Gain (Loss) | | | | | |
| on Investments3 | 8.207 | (19.849) | 8.362 | 4.027 | 11.080 |
| Total from Investment Operations | 8.300 | (19.196) | 9.262 | 4.587 | 11.417 |
| Distributions | | | | | |
| Dividends from Net Investment Income | (.300) | (.763) | (.670) | (.490) | (.240) |
| Distributions from Realized Capital Gains | — | (2.751) | (3.782) | (2.537) | (.557) |
| Total Distributions | (.300) | (3.514) | (4.452) | (3.027) | (.797) |
| Net Asset Value, End of Period | $18.74 | $10.74 | $33.45 | $28.64 | $27.08 |
| |
| Total Return4 | 77.75% | -60.16% | 33.97% | 17.48% | 70.19% |
| |
| Ratios/Supplemental Data | | | | | |
| Net Assets, End of Period (Millions) | $3,684 | $1,644 | $4,635 | $3,444 | $3,297 |
| Ratio of Total Expenses to | | | | | |
| Average Net Assets | 0.27%5 | 0.30%5 | 0.28%5 | 0.35%5 | 0.40% |
| Ratio of Net Investment Income to | | | | | |
| Average Net Assets | 0.59%1 | 2.17% | 2.70%1 | 1.88% | 1.68% |
| Portfolio Turnover Rate | 17% | 22% | 29% | 24% | 20% |
| 1 | Net investment income per share and the ratio of net investment income to average net assets for the year ended January 31, 2008, include $0.190 and 0.65%, respectively, resulting from a special dividend from Centennial Coal Co. Ltd. in January 2008. Based on additional information reported by the company in 2009, a portion of the special dividend was reallocated to return of capital. The reallocation reduced net investment income per share and the ratio of net investment income to average net assets for the year ended January 31, 2010, by $0.134 and 0.90%, respectively. The reallocation has no impact on net assets, net asset values per share, or total returns. |
| 2 | Calculated based on average shares outstanding. |
| 3 | Includes increases from redemption fees of $.01, $.01, $.00, $.03, and $.01. |
| 4 | Total returns do not reflect the 1% fee assesed on redemptions of shares held for less than one year, nor do they include the account service fee that may be applicable to certain accounts with balances below $10,000. |
| 5 | Includes performance-based investment advisory fee increases (decreases) of (0.08%) for fiscal 2010, 0.00% for fiscal 2009, (0.01%) for fiscal 2008, and, 0.01% for fiscal 2007. |
See accompanying Notes, which are an integral part of the Financial Statements.
18
Precious Metals and Mining Fund
Notes to Financial Statements
Vanguard Precious Metals and Mining Fund is registered under the Investment Company Act of 1940 as an open-end investment company, or mutual fund. The fund invests in securities of foreign issuers, which may subject it to investment risks not normally associated with investing in securities of United States corporations.
A. The following significant accounting policies conform to generally accepted accounting principles for U.S. mutual funds. The fund consistently follows such policies in preparing its financial statements.
1. Security Valuation: Securities are valued as of the close of trading on the New York Stock Exchange (generally 4 p.m., Eastern time) on the valuation date. Equity securities are valued at the latest quoted sales prices or official closing prices taken from the primary market in which each security trades; such securities not traded on the valuation date are valued at the mean of the latest quoted bid and asked prices. Securities for which market quotations are not readily available, or whose values have been affected by events occurring before the fund’s pricing time but after the close of the securities’ primary markets, are valued at their fair values calculated according to procedures adopted by the board of trus tees. These procedures include obtaining quotations from an independent pricing service, monitoring news to identify significant market- or security-specific events, and evaluating changes in the values of foreign market proxies (for example, ADRs, futures contracts, or exchange-traded funds), between the time the foreign markets close and the fund’s pricing time. When fair-value pricing is employed, the prices of securities used by a fund to calculate its net asset value may differ from quoted or published prices for the same securities. Precious metals are valued at the mean of the latest quoted bid and asked prices. Investments in Vanguard Market Liquidity Fund are valued at that fund’s net asset value.
2. Foreign Currency: Securities and other assets and liabilities denominated in foreign currencies are translated into U.S. dollars using exchange rates obtained from an independent third party as of the fund’s pricing time on the valuation date. Realized gains (losses) and unrealized appreciation (depreciation) on investment securities include the effects of changes in exchange rates since the securities were purchased, combined with the effects of changes in security prices. Fluctuations in the value of other assets and liabilities resulting from changes in exchange rates are recorded as unrealized foreign currency gains (losses) until the assets or liabilities are settled in cash, at which time they are recorded as realized foreign currency gains (losses).
3. Federal Income Taxes: The fund intends to continue to qualify as a regulated investment company and distribute all of its taxable income. Management has analyzed the fund’s tax positions taken for all open federal income tax years (January 31, 2007–2010), and has concluded that no provision for federal income tax is required in the fund’s financial statements.
4. Distributions: Distributions to shareholders are recorded on the ex-dividend date.
5. Security Lending: The fund may lend its securities to qualified institutional borrowers to earn additional income. Security loans are required to be secured at all times by collateral at least equal to the market value of securities loaned. The fund invests cash collateral received in Vanguard Market Liquidity Fund, and records a liability for the return of the collateral, during the period the securities are on loan. Security lending income represents the income earned on investing cash collateral, less expenses associated with the loan.
19
Precious Metals and Mining Fund
6. Other: Dividend income is recorded on the ex-dividend date. Interest income includes income distributions received from Vanguard Market Liquidity Fund and is accrued daily. Security transactions are accounted for on the date securities are bought or sold. Costs used to determine realized gains (losses) on the sale of investment securities are those of the specific securities sold. Fees assessed on redemptions of capital shares are credited to paid-in capital.
B. M&G Investment Management Ltd. provides investment advisory services to the fund for a fee calculated at an annual percentage rate of average net assets. The basic fee is subject to quarterly adjustments based on the fund’s performance for the preceding three years relative to the S&P Custom Precious Metals and Mining Index (formerly known as the S&P/Citigroup Custom Precious Metals and Mining Index). For the year ended January 31, 2010, the investment advisory fee represented an effective annual basic rate of 0.1 3% of the fund’s average net assets before a decrease of $2,282,000 (–0.08%) based on performance.
C. The Vanguard Group furnishes at cost corporate management, administrative, marketing, and distribution services. The costs of such services are allocated to the fund under methods approved by the board of trustees. The fund has committed to provide up to 0.40% of its net assets in capital contributions to Vanguard. At January 31, 2010, the fund had contributed capital of $782,000 to Vanguard (included in Other Assets), representing 0.02% of the fund’s net assets and 0.31% of Vanguard’s capitalization. The fund’s trustees and officers are also directors and officers of Vanguard.
D. Various inputs may be used to determine the value of the fund’s investments. These inputs are summarized in three broad levels for financial statement purposes. The inputs or methodologies used to value securities are not necessarily an indication of the risk associated with investing in those securities.
Level 1 — Quoted prices in active markets for identical securities.
Level 2 — Other significant observable inputs (including quoted prices for similar securities, interest rates, prepayment speeds, credit risk, etc.).
Level 3 — Significant unobservable inputs (including the fund’s own assumptions used to determine the fair value of investments).
The following table summarizes the fund’s investments as of January 31, 2010, based on the inputs used to value them:
| | | |
| | Level 1 | Level 2 | Level 3 |
| Investments | ($000) | ($000) | ($000) |
| Common Stocks—North America | 853,052 | — | — |
| Common Stocks—Other | 383,631 | 2,264,667 | 98 |
| Precious Metals | 3,022 | — | — |
| Temporary Cash Investments | 124,064 | — | — |
| Total | 1,363,769 | 2,264,667 | 98 |
20
Precious Metals and Mining Fund
The following table summarizes changes in investments valued based on Level 3 inputs during the year ended January 31, 2010:
| |
| | Investments in |
| | Common Stocks |
| Amount Valued Based on Level 3 Inputs | ($000) |
| Balance as of January 31, 2009 | 2,646 |
| Transfers in and/or out of Level 3 | (3,627) |
| Change in Unrealized Appreciation (Depreciation) | 1,079 |
| Balance as of January 31, 2010 | 98 |
E. Distributions are determined on a tax basis and may differ from net investment income and realized capital gains for financial reporting purposes. Differences may be permanent or temporary. Permanent differences are reclassified among capital accounts in the financial statements to reflect their tax character. Temporary differences arise when certain items of income, expense, gain, or loss are recognized in different periods for financial statement and tax purposes; these differences will reverse at some time in the future. Differences in classification may also result from the treatment of short-term gains as ordinary income for tax purposes.
During the year ended January 31, 2010, the fund realized net foreign currency losses of $3,023,000, which decreased distributable net income for tax purposes; accordingly, such losses have been reclassified from accumulated net realized losses to overdistributed net investment income.
Certain of the fund’s investments are in securities considered to be “passive foreign investment companies,” for which any unrealized appreciation and/or realized gains are required to be included in distributable net income for tax purposes. During the year ended January 31, 2010, the fund realized gains on the sale of passive foreign investment companies of $21,137,000, which have been in cluded in current and prior periods’ taxable income; accordingly, such gains have been reclassified from accumulated net realized losses to overdistributed net investment income. Unrealized appreciation of $60,006,000 on the fund’s passive foreign investment company holdings through October 31, 2009, (the most recent previous mark-to-market date for tax purposes), has been distributed and is reflected in the balance of overdistributed net investment income. Since October 31, 2009, the fund’s passive foreign investment company holdings have depreciated in value by $1,551,000, decreasing the amount of taxable income available for distribution as of January 31, 2010. Unrealized appreciation on the fund’s passive foreign investment company holdings at January 31, 2010, was $47,889,000.
During 2001, the fund elected to use a provision of the Taxpayer Relief Act of 1997 to mark to market certain appreciated securities held on January 1, 2001; such securities were treated as sold and repurchased, with unrealized gains of $46,006,000 becoming realized, for tax purposes. The mark-to-market created a difference between the cost of investments for financial statement and tax purposes, which will reverse when the securities are sold. Through January 31, 2010, the fund realized gains on the sale of these securities of $20,516,000 for financial statement purposes, which were included in prior year mark-to-market gains for tax purposes. The remaining difference of $25,490,000 is reflected in the balance of accumulated net realized losses; the corresponding difference between the securities’ cost for financial statement and tax purposes in reflected in unrealized appreciation.
21
Precious Metals and Mining Fund
For tax purposes, at January 31, 2010, the fund had $1,927,000 of ordinary income available for distribution. The fund had available capital loss carryforwards totaling $52,818,000 to offset future net capital gains through January 31, 2018. In addition, the fund realized losses of $27,156,000 during the period from November 1, 2009, through January 31, 2010, which are def erred and will be treated as realized for tax purposes in fiscal 2011.
At January 31, 2010, the cost of investment securities for tax purposes was $3,576,935,000. Net unrealized appreciation of investment securities for tax purposes was $51,599,000, consisting of unrealized gains of $664,826,000 on securities that had risen in value since their purchase and $613,227,000 in unrealized losses on securities that had fallen in value since their purchase or since being marked to market for tax purposes.
F. During the year ended January 31, 2010, the fund purchased $1,030,493,000 of investment securities and sold $476,273,000 of investment securities, other than temporary cash investments.
G. Capital shares issued and redeemed were:
| | |
| | Year Ended January 31, |
| | 2010 | 2009 |
| | Shares | Shares |
| | (000) | (000) |
| Issued | 81,521 | 37,881 |
| Issued in Lieu of Cash Distributions | 2,952 | 27,485 |
| Redeemed | (40,946) | (50,837) |
| Net Increase (Decrease) in Shares Outstanding | 43,527 | 14,529 |
22
Precious Metals and Mining Fund
H. Certain of the fund’s investments are in companies that are considered to be affiliated companies of the fund because the fund owns more than 5% of the outstanding voting securities of the company. Transactions during the period in securities of these companies were as follows:
| | | | | |
| | | | Current Period Transactions | |
| | Jan. 31, 2009 | | Proceeds from | | Jan. 31, 2010 |
| | Market | Purchases | Securities | Dividend | Market |
| | Value | at Cost | Sold | Income | Value |
| | ($000) | ($000) | ($000) | ($000) | ($000) |
| AMCOL International Corp. | 44,919 | — | 847 | 2,183 | 76,144 |
| Apex Minerals NL | — | 9,544 | — | — | 7,085 |
| Centerra Gold Inc. | 61,150 | 10,146 | — | — | 162,058 |
| Claude Resources, Inc. | 2,524 | — | 1,379 | — | NA1 |
| Franco-Nevada Corp. | 171,223 | — | 145,140 | 830 | NA1 |
| Harry Winston Diamond Corp. | 33,2892 | 6,218 | — | — | 83,200 |
| Hochschild Mining PLC | NA3 | 103,438 | — | 833 | 135,378 |
| Iluka Resources Ltd. | 98,933 | 9,993 | — | — | 121,198 |
| Imerys SA | 134,204 | — | — | 3,997 | 224,312 |
| Johnson Matthey PLC | 160,598 | — | 3,346 | 7,070 | 262,966 |
| Lonmin PLC | 101,515 | 33,530 | — | — | 297,263 |
| Minerals Technologies, Inc. | 50,534 | 4,662 | 32,456 | 278 | NA1 |
| Nevsun Resources Ltd. | — | 34,329 | — | — | 24,924 |
| Panoramic Resources, Ltd. | — | 22,120 | — | 341 | 31,730 |
| Petropavlovsk PLC4 | 55,203 | 48,814 | 37,113 | — | 131,813 |
| Resolute Mining Ltd. | — | 24,737 | — | — | 32,015 |
| Sherritt International Corp. | NA3 | 33,463 | — | 1,496 | 98,625 |
| St. Barbara Ltd. | 23,056 | 15,664 | — | — | 39,500 |
| | 937,148 | | | 17,028 | 1,728,211 |
| 1 | Not applicable—at January 31, 2010, the security was still held, but the issuer was no longer an affiliated company of the fund. |
| 2 | Includes Harry Winston Diamond Corp. Private Placement shares that were converted to common shares during the period. |
| 3 | Not applicable—at January 31, 2009, the issuer was not an affiliated company of the fund. |
| 4 | Effective September 2009, Petropavlovsk PLC changed its name from Peter Hambro Mining PLC. |
I. In preparing the financial statements as of January 31, 2010, management considered the impact of subsequent events for potential recognition or disclosure in these financial statements.
23
Report of Independent Registered Public Accounting Firm
To the Trustees of Vanguard Specialized Funds and the Shareholders of Vanguard Precious Metals and Mining Fund:
In our opinion, the accompanying statements of net assets and of assets and liabilities and the related statements of operations and of changes in net assets and the financial highlights present fairly, in all material respects, the financial position of Vanguard Precious Metals and Mining Fund (constituting a separate portfolio of Vanguard Specialized Funds, hereafter referred to as the “Fund”) at January 31, 2010, the results of its operations for the year then ended, the changes in its net assets for each of the two years in the period then ended and the financial highlights for each of five years in the period then ended, in conformity with accountin g principles generally accepted in the United States of America. These financial statements and financial highlights (hereafter referred to as “financial statements”) are the responsibility of the Fund’s management; our responsibility is to express an opinion on these financial statements based on our audits. We conducted our audits of these financial statements in accordance with the standards of the Public Company Accounting Oversight Board (United States). Those standards require that we plan and perform the audit to obtain reasonable assurance about whether the financial statements are free of material misstatement. An audit includes examining, on a test basis, evidence supporting the amounts and disclosures in the financial statements, assessing the accounting principles used and significant estimates made by management, and evaluating the overall financial statement presentation. We believe that our audits, which included confirmation of securities at January 31, 2010 by correspondence with the custodian, and by agreement to the underlying ownership records of Vanguard Market Liquidity Fund, provide a reasonable basis for our opinion.
PricewaterhouseCoopers LLP
Philadelphia, Pennsylvania
March 16, 2010
| Special 2009 tax information (unaudited) for Vanguard Precious Metals and Mining Fund |
This information for the fiscal year ended January 31, 2010, is included pursuant to provisions of the Internal Revenue Code.
The fund distributed $19,493,000 of qualified dividend income to shareholders during the fiscal year.
For corporate shareholders, 8.9% of investment income (dividend income plus short-term gains, if any) qualifies for the dividends-received deduction.
The fund passed through foreign source income of $22,566,000 and foreign taxes paid of $1,666,000 to shareholders. The pass-through of foreign taxes paid will affect only shareholders on the fund’s dividend record date in December 2009. Shareholders received more detailed information along with their Form 1099-DIV in January 2010.
24
Your Fund’s After-Tax Returns
This table presents returns for your fund both before and after taxes. The after-tax returns are shown in two ways: (1) assuming that an investor owned the fund during the entire period and paid taxes on the fund’s distributions, and (2) assuming that an investor paid taxes on the fund’s distributions and sold all shares at the end of each period.
Calculations are based on the highest individual federal income tax and capital gains tax rates in effect at the times of the distributions and the hypothetical sales. State and local taxes were not considered. After-tax returns reflect any qualified dividend income , using actual prior-year figures and estimates for 2010. (In the example, returns after the sale of fund shares may be higher than those assuming no sale. This occurs when the sale would have produced a capital loss. The calculation assumes that the investor received a tax deduction for the loss.) Please note that your actual after-tax returns will depend on your tax situation and may differ from those shown. Also note that if you own the fund in a tax-deferred account, such as an individual retirement account or a 401(k) plan, this information does not apply to you. Such accounts are not subject to current taxes.
Finally, keep in mind that a fund’s performance—whether before or after taxes—does not guarantee future results.
| | | |
| Average Annual Total Returns: Precious Metals and Mining Fund | | |
| Periods Ended January 31, 2010 | | | |
| | One | Five | Ten |
| | Year | Years | Years |
| Returns Before Taxes | 77.75% | 13.66% | 17.85% |
| Returns After Taxes on Distributions | 76.91 | 11.75 | 16.02 |
| Returns After Taxes on Distributions and Sale of Fund Shares | 50.72 | 11.66 | 15.47 |
Total returns do not include any transaction or account fees that applied in the periods shown. Fund prospectuses provide information about current fees.
25
About Your Fund’s Expenses
As a shareholder of the fund, you incur ongoing costs, which include costs for portfolio management, administrative services, and shareholder reports (like this one), among others. Operating expenses, which are deducted from a fund’s gross income, directly reduce the investment return of the fund.
A fund’s expenses are expressed as a percentage of its average net assets. This figure is known as the expense ratio. The following examples are intended to help you understand the ongoing costs (in dollars) of investing in your fund and to compare these costs with those of other mutual funds. The examples are based on an investment of $1,000 made at the beginning of the period shown and held for the entire period.
The accompanying table illustrates your fund’s costs in two ways:
• Based on actual fund return. This section helps you to estimate the actual expenses that you paid over the period. The ”Ending Account Value“ shown is derived from the fund‘s actual return, and the third column shows the dollar amount that would have been paid by an investor who started with $1,000 in the fund. You may use the information here, together with the amount you invested, to estimate the expenses that you paid over the period.
To do so, simply divide your account value by $1,000 (for example, an $8,600 account value divided by $1,000 = 8.6), then multiply the result by the number given for your fund under the heading ”Expenses Paid During Period.“
• Based on hypothetical 5% yearly return. This section is intended to help you compare your fund‘s costs with those of other mutual funds. It assumes that the fund had a yearly return of 5% before expenses, but that the expense ratio is unchanged. In this case—because the return used is not the fund’s actual return—the results do not apply to your investment. The example is useful in making comparisons because the Securities and Exchange Commission requires all mutual funds to calculate expenses based on a 5% return. You can assess your fund’s costs by comparing this hypothetical example with the hypothetical examples that appear in shareholder reports of other funds.
Note that the expenses shown in the table are meant to highlight and help you compare ongoing costs only and do not reflect transaction costs incurred by the fund for buying and selling securities. Further, the expenses do not include the 1% fee on redemptions of shares held for less than one year, nor do they include the account service fee described in the prospectus. If such fees were applied to your account, your costs would be higher. Your fund does not carry a “sales load.” The calculations assume no shares were bought or sold during the period. Your actual costs may have been higher or lower, depending on the amount of your investment and the timing of any purchases or redemptions.
You can find more information about the fund’s expenses, including annual expense ratios, in the Financial Statements section of this report. For additional information on operating expenses and other shareholder costs, please refer to your fund’s current prospectus.
26
| | | |
| Six Months Ended January 31, 2010 | | | |
| | Beginning | Ending | Expenses |
| | Account Value | Account Value | Paid During |
| Precious Metals and Mining Fund | 7/31/2009 | 1/31/2010 | Period |
| Based on Actual Fund Return | $1,000.00 | $1,114.07 | $1.39 |
| Based on Hypothetical 5% Yearly Return | 1,000.00 | 1,023.89 | 1.33 |
The calculations are based on expenses incurred in the most recent six-month period. The fund’s annualized six-month expense ratio for that period is 0.26%. The dollar amounts shown as “Expenses Paid” are equal to the annualized expense ratio multiplied by the average account value over the period, multiplied by the number of days in the most recent six-month period, then divided by the number of days in the most recent 12-month period.
27
Glossary
Beta. A measure of the magnitude of a fund’s past share-price fluctuations in relation to the ups and downs of a given market index. The index is assigned a beta of 1.00. Compared with a given index, a fund with a beta of 1.20 typically would have seen its share price rise or fall by 12% when the index rose or fell by 10%. For this report, beta is based on returns over the past 36 months for both the fund and the index. Note that a fund’s beta should be reviewed in conjunction with its R-squared (see definition). The lower the R-squared, the less correlation there is between the fund and the index, and the less reliable beta is as an indicator of volatility.
Dividend Yield. Dividend income earned by stocks, expressed as a percentage of the aggregate market value (or of net asset value, for a fund). The yield is determined by dividing the amount of the annual dividends by the aggregate value (or net asset value) at the end of the period. For a fund, the dividend yield is based solely on stock holdings and does not include any income produced by other investments.
Earnings Growth Rate. The average annual rate of growth in earnings over the past five years for the stocks now in a fund.
Equity Exposure. A measure that reflects a fund’s investments in stocks and stock futures. Any holdings in short-term reserves are excluded.
Expense Ratio. The percentage of a fund’s average net assets used to pay its annual administrative and advisory expenses. These expenses directly reduce returns to investors.
Foreign Holdings. The percentage of a fund represented by stocks or depositary receipts of companies based outside the United States.
Inception Date. The date on which the assets of a fund (or one of its share classes) are first invested in accordance with the fund’s investment objective. For funds with a subscription period, the inception date is the day after that period ends. Investment performance is measured from the inception date.
Median Market Cap. An indicator of the size of companies in which a fund invests; the midpoint of market capitalization (market price x shares outstanding) of a fund’s stocks, weighted by the proportion of the fund’s assets invested in each stock. Stocks representing half of the fund’s assets have market capitalizations above the median, and the rest are below it.
Price/Book Ratio. The share price of a stock divided by its net worth, or book value, per share. For a fund, the weighted average price/book ratio of the stocks it holds.
R-Squared. A measure of how much of a fund’s past returns can be explained by the returns from the market in general, as measured by a given index. If a fund’s total returns were precisely synchronized with an index’s returns, its R-squared would be 1.00. If the fund’s returns bore no relationship to the index’s returns, its R-squared would be 0. For this report, R-squared is based on returns over the past 36 months for both the fund and the index.
Return on Equity. The annual average rate of return generated by a company during the past five years for each dollar of shareholder’s equity (net income divided by shareholder’s equity). For a fund, the weighted average return on equity for the companies whose stocks it holds.
28
Short-Term Reserves. The percentage of a fund invested in highly liquid, short-term securities that can be readily converted to cash.
Turnover Rate. An indication of the fund’s trading activity. Funds with high turnover rates incur higher transaction costs and may be more likely to distribute capital gains (which may be taxable to investors). The turnover rate excludes in-kind transactions, which have minimal impact on costs.
29
This page intentionally left blank.
This page intentionally left blank.
The People Who Govern Your Fund
The trustees of your mutual fund are there to see that the fund is operated and managed in your best interests since, as a shareholder, you are a part owner of the fund. Your fund’s trustees also serve on the board of directors of The Vanguard Group, Inc., which is owned by the Vanguard funds and provides services to them on an at-cost basis.
A majority of Vanguard’s board members are independent, meaning that they have no affiliation with Vanguard or the funds they oversee, apart from the sizable personal investments they have made as private individuals. The independent board members have distinguished backgrounds in business, academia, and public service. Each of the trustees and executive officers oversees 162 Vanguard funds.
The following table provides information for each trustee and executive officer of the fund. More information about the trustees is in the Statement of Additional Information, which can be obtained, without charge, by contacting Vanguard at 800-662-7447, or online at www.vanguard.com.
| |
| Interested Trustee1 | Rajiv L. Gupta |
| | Born 1945. Trustee Since December 2001.2 Principal |
| F. William McNabb III | Occupation(s) During the Past Five Years: Chairman |
| Born 1957. Trustee Since July 2009. Chairman of the | and Chief Executive Officer (retired 2009) and |
| Board. Principal Occupation(s) During the Past Five | President (2006–2008) of Rohm and Haas Co. |
| Years: Chairman of the Board of The Vanguard Group, | (chemicals); Board Member of American Chemistry |
| Inc., and of each of the investment companies served | Council; Director of Tyco International, Ltd. (diversified |
| by The Vanguard Group, since January 2010; Director | manufacturing and services) and Hewlett-Packard Co. |
| of The Vanguard Group since 2008; Chief Executive | (electronic computer manufacturing); Trustee of The |
| Officer and President of The Vanguard Group and of | Conference Board. |
| each of the investment companies served by The | |
| Vanguard Group since 2008; Director of Vanguard | Amy Gutmann |
| Marketing Corporation; Managing Director of The | Born 1949. Trustee Since June 2006. Principal |
| Vanguard Group (1995–2008). | Occupation(s) During the Past Five Years: President |
| | of the University of Pennsylvania; Christopher H. |
| | Browne Distinguished Professor of Political Science |
| Independent Trustees | in the School of Arts and Sciences with secondary |
| | appointments at the Annenberg School for Commu- |
| Emerson U. Fullwood | nication and the Graduate School of Education of |
| Born 1948. Trustee Since January 2008. Principal | the University of Pennsylvania; Director of Carnegie |
| Occupation(s) During the Past Five Years: Executive | Corporation of New York, Schuylkill River Development |
| Chief Staff and Marketing Officer for North America | Corporation, and Greater Philadelphia Chamber of |
| and Corporate Vice President (retired 2008) of Xerox | Commerce; Trustee of the National Constitution Center. |
| Corporation (photocopiers and printers); Director of | |
| SPX Corporation (multi-industry manufacturing), the | |
| United Way of Rochester, the Boy Scouts of America, | |
| Amerigroup Corporation (direct health and medical | |
| insurance carriers), and Monroe Community College | |
| Foundation. | |
| | |
| JoAnn Heffernan Heisen | Executive Officers | |
| Born 1950. Trustee Since July 1998. Principal | | |
| Occupation(s) During the Past Five Years: Corporate | Thomas J. Higgins | |
| Vice President and Chief Global Diversity Officer since | Born 1957. Chief Financial Officer Since September |
| 2006 (retired 2008) and Member of the Executive | 2008. Principal Occupation(s) During the Past Five |
| Committee (retired 2008) of Johnson & Johnson | Years: Principal of The Vanguard Group, Inc.; Chief |
| (pharmaceuticals/consumer products); Vice President | Financial Officer of each of the investment companies |
| and Chief Information Officer of Johnson & Johnson | served by The Vanguard Group since 2008; Treasurer |
| (1997–2005); Director of the University Medical Center | of each of the investment companies served by The |
| at Princeton and Women’s Research and Education | Vanguard Group (1998–2008). |
| Institute; Member of the Advisory Board of the | | |
| Maxwell School of Citizenship and Public Affairs | Kathryn J. Hyatt | |
| at Syracuse University. | Born 1955. Treasurer Since November 2008. Principal |
| | Occupation(s) During the Past Five Years: Principal |
| F. Joseph Loughrey | of The Vanguard Group, Inc.; Treasurer of each of |
| Born 1949. Trustee Since October 2009. Principal | the investment companies served by The Vanguard |
| Occupation(s) During the Past Five Years: President | Group since 2008; Assistant Treasurer of each of the |
| and Chief Operating Officer since 2005 (retired 2009) | investment companies served by The Vanguard Group |
| and Vice Chairman of the Board (2008–2009) of | (1988–2008). | |
| Cummins Inc. (industrial machinery); Director of | | |
| SKF AB (industrial machinery), Hillenbrand, Inc. | Heidi Stam | |
| (specialized consumer services), Sauer-Danfoss Inc. | Born 1956. Secretary Since July 2005. Principal |
| (machinery), the Lumina Foundation for Education, | Occupation(s) During the Past Five Years: Managing |
| and the Columbus Community Education Coalition; | Director of The Vanguard Group, Inc., since 2006; |
| Chairman of the Advisory Council for the College of | General Counsel of The Vanguard Group since 2005; |
| Arts and Letters at the University of Notre Dame. | Secretary of The Vanguard Group and of each of the |
| | investment companies served by The Vanguard Group |
| André F. Perold | since 2005; Director and Senior Vice President of |
| Born 1952. Trustee Since December 2004. Principal | Vanguard Marketing Corporation since 2005; |
| Occupation(s) During the Past Five Years: George | Principal of The Vanguard Group (1997–2006). |
| Gund Professor of Finance and Banking, Harvard | | |
| Business School; Chair of the Investment Committee | | |
| of HighVista Strategies LLC (private investment firm). | Vanguard Senior Management Team |
| |
| Alfred M. Rankin, Jr. | R. Gregory Barton | Michael S. Miller |
| Born 1941. Trustee Since January 1993. Principal | Mortimer J. Buckley | James M. Norris |
| Occupation(s) During the Past Five Years: Chairman, | Kathleen C. Gubanich | Glenn W. Reed |
| President, and Chief Executive Officer of NACCO | Paul A. Heller | George U. Sauter |
| Industries, Inc. (forklift trucks/housewares/lignite); | | |
| Director of Goodrich Corporation (industrial products/ | | |
| aircraft systems and services); Deputy Chairman | Chairman Emeritus and Senior Advisor |
| of the Federal Reserve Bank of Cleveland; Trustee | | |
| of University Hospitals of Cleveland, The Cleveland | John J. Brennan | |
| Museum of Art, and Case Western Reserve University. | Chairman, 1996–2009 | |
| | Chief Executive Officer and President, 1996–2008 |
| Peter F. Volanakis | | |
| Born 1955. Trustee Since July 2009. Principal | | |
| Occupation(s) During the Past Five Years: President | Founder | |
| since 2007 and Chief Operating Officer since 2005 | | |
| of Corning Incorporated (communications equipment); | John C. Bogle | |
| President of Corning Technologies (2001–2005); | Chairman and Chief Executive Officer, 1974–1996 |
| Director of Corning Incorporated and Dow Corning; | | |
| Trustee of the Corning Incorporated Foundation and | | |
| the Corning Museum of Glass; Overseer of the | | |
| Amos Tuck School of Business Administration at | | |
| Dartmouth College. | | |
1 Mr. McNabb is considered an “interested person,” as defined in the Investment Company Act of 1940, because he is an officer of the Vanguard funds.
2 December 2002 for Vanguard Equity Income Fund, Vanguard Growth Equity Fund, the Vanguard Municipal Bond Funds, and the Vanguard
State Tax-Exempt Funds.
|  |
| P.O. Box 2600 |
| Valley Forge, PA 19482-2600 |
Connect with Vanguard® > www.vanguard.com
Fund Information > 800-662-7447Direct Investor Account Services > 800-662-2739Institutional Investor Services > 800-523-1036Text Telephone for PeopleWith Hearing Impairment > 800-749-7273This material may be used in conjunctionwith the offering of shares of any Vanguardfund only if preceded or accompanied bythe fund’s current prospectus.All comparative mutual fund data are from Lipper Inc. orMorningstar, Inc., unless otherwise noted.You can obtain a free copy of Vanguard’s proxy votingguidelines by visiting our website, www.vanguard.com,and searching for “proxy voting guidelines,” or by callingVanguard at 800-662-2739. The guidelines are alsoavailable from the SEC’s website, www.sec.gov. Inaddition, you may obtain a free report on how your fundvoted the proxies for securities it owned during the 12months ended June 30. To get the report, visit eitherwww.vanguard.com or www.sec.gov.You can review and copy information about your fund atthe SEC’s Public Reference Room in Washington, D.C. Tofind out more about this public service, call the SEC at202-551-8090. Information about your fund is alsoavailable on the SEC’s website, and you can receivecopies of this information, for a fee, by sending arequest in either of two ways: via e-mail addressed topublicinfo@sec.gov or via regular mail addressed to thePublic Reference Section, Securities and ExchangeCommission, Washington, DC 20549-1520. | |
|
| © 2010 The Vanguard Group, Inc. |
| All rights reserved. |
| Vanguard Marketing Corporation, Distributor. |
 | |
| Q530 032010 |
 |
| Vanguard Health Care Fund |
| Annual Report |
|
|
| January 31, 2010 |
|
|
 |
|
|
> For the fiscal year ended January 31, 2010, Vanguard Health Care Fund returned nearly 24%.
> The fund’s results were better than that of its market benchmark, the S&P Health Care Index, which returned about 22% for the period, and in line with the average return of peer funds.
> Pharmaceutical companies, which accounted for almost 60% of the fund’s holdings on average, generated strong returns.
| |
| Contents | |
| Your Fund’s Total Returns. | 1 |
| Chairman’s Letter. | 2 |
| Advisor’s Report. | 8 |
| Fund Profile. | 10 |
| Performance Summary. | 11 |
| Financial Statements. | 13 |
| Your Fund’s After-Tax Returns. | 25 |
| About Your Fund’s Expenses. | 26 |
| Glossary. | 28 |
Please note: The opinions expressed in this report are just that—informed opinions. They should not be considered promises or advice. Also, please keep in mind that the information and opinions cover the period through the date on the front of this report. Of course, the risks of investing in your fund are spelled out in the prospectus.
See the Glossary for definitions of investment terms used in this report.
Cover photograph: Veronica Coia.
| |
| Your Fund’s Total Returns | |
| |
| |
| |
| |
| Fiscal Year Ended January 31, 2010 | |
| | Total |
| | Returns |
| Vanguard Health Care Fund | |
| Investor Shares | 23.63% |
| Admiral™ Shares | 23.72 |
| S&P Health Care Index | 21.80 |
| Global Health/Biotechnology Funds Average | 23.65 |
| Global Health/Biotechnology Funds Average: Derived from data provided by Lipper Inc. | |
Admiral Shares are a lower-cost class of shares available to many longtime shareholders and to those with significant investments in the fund.
| | | | |
| Your Fund’s Performance at a Glance | | | | |
| January 31, 2009 , Through January 31, 2010 | | | | |
| | | | Distributions Per Share |
| | Starting | Ending | Income | Capital |
| | Share Price | Share Price | Dividends | Gains |
| Vanguard Health Care Fund | | | | |
| Investor Shares | $99.12 | $120.06 | $1.761 | $0.731 |
| Admiral Shares | 41.83 | 50.67 | 0.777 | 0.309 |
1

Chairman’s Letter
Dear Shareholder,
Twelve months ago, the United States was in the midst of the biggest economic crisis in decades and stock prices had fallen to historic lows. In mid-March, however, the market staged an impressive rally and stock prices began to soar. By January 31, 2010, the broad U.S. market had rebounded dramatically. Health care stocks participated in the rally, though the sector’s gains were more subdued.
For the fiscal year ended January 31, Vanguard Health Care Fund returned nearly 24%, posting gains in all subsectors except for biotechnology. The fund outperformed the Standard & Poor’s Health Care Index, which returned about 22%, and was in line with the average return for the fund’s global health/biotechnology peer group.
If you own shares of the fund in a taxable account, you may wish to review the fund’s after-tax returns later in this report.
Remarkable rally loses steam at year-end
The broad U.S. stock market returned about 36% for the 12 months through January 31. Stocks began the period under severe pressure from the global financial crisis and a stalled U.S. economy. After a dismal showing in February 2009, however, U.S. equities turned the corner and kept surging until the fiscal year’s final weeks, when the major market indexes pulled back a bit. During the nine months, the federal
2
government’s stimulus plan took hold, companies began to repair their balance sheets, and investors increased their appetite for risk—the riskier the better, it seemed.
The stock market’s exuberance overshot the pace of economic recovery, which slowly improved as the year progressed. It wasn’t until the third calendar quarter that the recession appeared to be ending, yet double-digit unemployment still weighed on the economy.
International markets traced an even steeper line upward than their U.S. counterpart for most of the fiscal year. They recovered strongly through 2009 and into 2010, before dropping in the latter half of January amid concerns about the strength of the global recovery. The most impressive international returns came from emerging markets, with especially strong results from Brazil and China.
Although the fiscal year’s returns were a welcome relief for stock investors worldwide, the severity of the financial crisis continues to depress the longer-term record, especially for U.S. stocks.
Bond returns traced very different courses
The U.S. government’s monetary policies also soothed parts of the bond market as the fiscal year progressed. At the start of the period, the difference between the yields of corporate bonds and those of
| | | |
| Market Barometer | | | |
| |
| | | Average Annual Total Returns |
| | | Periods Ended January 31, 2010 |
| | One | Three | Five |
| | Year | Years | Years |
| Stocks | | | |
| Russell 1000 Index (Large-caps) | 34.81% | -7.10% | 0.57% |
| Russell 2000 Index (Small-caps) | 37.82 | -7.74 | 0.61 |
| Dow Jones U.S. Total Stock Market Index | 36.06 | -6.72 | 0.94 |
| MSCI All Country World Index ex USA (International) | 48.28 | -4.76 | 5.61 |
| |
| Bonds | | | |
| Barclays Capital U.S. Aggregate Bond Index (Broad | | | |
| taxable market) | 8.51% | 6.60% | 5.16% |
| Barclays Capital Municipal Bond Index | 9.49 | 4.68 | 4.23 |
| Citigroup Three-Month U.S. Treasury Bill Index | 0.15 | 2.07 | 2.84 |
| |
| CPI | | | |
| Consumer Price Index | 2.63% | 2.30% | 2.59% |
3
U.S. Treasuries widened almost to levels last seen in the 1930s, an indication of just how unwilling investors were to take on risk. As the threat of a depression receded, however, confidence returned and investors flocked to the lowest-quality, highest-yielding bonds, passing over conservative Treasuries, the previous year’s favorite.
For the 12 months ended January 31, 2010, the broad taxable bond market returned 8.51%, municipal bonds returned about 9%, and high-yield corporate bonds delivered a stunning 51%. Meanwhile, Treasury returns were negative to lackluster, depending on their maturity.
While the Federal Reserve’s monetary policies seemed to help the stock market and most areas of the bond market, the policies exacted a heavy price from money market investors. The Fed kept the federal funds rate––the interest rate that banks charge one another for overnight lending, a benchmark for the market’s short-term rates––between 0% and 0.25% during the entire fiscal year.
Although the Fed said it planned to maintain those rates for an “extended period,” it recently indicated that it was ready to wind down emergency measures and would halt its purchase of agency mortgage-backed securities and debt in the coming months.
| | | |
| Expense Ratios | | | |
| Your Fund Compared With Its Peer Group | | | |
| | Investor | Admiral | Peer Group |
| | Shares | Shares | Average |
| Health Care Fund | 0.33% | 0.25% | 1.61% |
The fund expense ratios shown are from the prospectus dated May 29, 2009, and represent estimated costs for the current fiscal year based on the fund’s net assets as of the prospectus date. For the fiscal year ended January 31, 2010, the Health Care Fund’s expense ratios were 0.36% for Investor Shares and 0.29% for Admiral Shares. The peer-group expense ratio is derived from data provided by Lipper Inc. and captures information through year-end 2009.
Peer group: Global Health/Biotechnology Funds.
4
In the health care sector, U.S. pharmaceuticals led
Vanguard Health Care Fund, like the rest of the broad U.S. stock market, bounced back significantly during the past 12 months. However, the health care sector was notably weaker than the market as a whole. This lag in investor enthusiasm was due mainly to operating issues that have dogged the industry for several years, including dwindling product pipelines and expiring patents on blockbuster drugs, as well as to heightened uncertainty raised by the debate about national health care reform.
As noted above, the Health Care Fund built its return of nearly 24% on gains in all industry subsectors except for biotech-nology. The fund’s strongest results came from pharmaceutical stocks, which accounted for almost 60% of the portfolio, on average, throughout the period. Large-cap U.S. pharmaceutical companies performed generally well and were among the fund’s main contributors. Schering-Plough, whose stock spiked when it announced plans to merge with Merck, provided a large boost to returns.
Overseas pharmaceutical companies didn’t fare as well. Fund returns were hurt by holdings in several Japanese drug makers, including Takeda Pharmaceutical, Astellas Pharma, and Daiichi Sankyo. These companies suffered owing partly to stiff competition from generic drug producers and difficulties in obtaining regulatory approval of products.
| |
| Total Returns | |
| Ten Years Ended January 31, 2010 | |
| | Average |
| | Annual Return |
| Health Care Fund Investor Shares | 8.82% |
| S&P Health Care Index | 1.95 |
| Global Health/Biotechnology Funds Average | 4.61 |
| Global Health/Biotechnology Funds Average: Derived from data provided by Lipper Inc. | |
The figures shown represent past performance, which is not a guarantee of future results. (Current performance may be lower or higher than the performance data cited. For performance data current to the most recent month-end, visit our website at www.vanguard.com/performance.) Note, too, that both investment returns and principal value can fluctuate widely, so an investor’s shares, when sold, could be worth more or less than their original cost.
5
Managed health care companies also posted substantial gains for the period, and the fund benefited from its large positions in CIGNA and Coventry Health Care. Among health care technology firms, Cerner and IMS Health both performed exceptionally well, as investors anticipated that the federal economic stimulus package would help boost the industry’s usage of information technology.
Biotechnology stocks—which have struggled in recent months because of regulatory, manufacturing, and political issues—were the only part of the broad health care industry to post losses for the fiscal year, and the fund’s holdings in this group were no exception. Fortunately, the group made up only about 8% of the portfolio on average.
The fund’s long-term results have remained impressive
Despite some extremely volatile times in global stock markets during the past several years, the Health Care Fund’s long-term record remains strong. For the past ten years, the fund’s Investor Shares have returned an average of 8.82% annually. This is considerably better than the annual averages for both the benchmark index and the peer group: 1.95% and 4.61%, respectively, over the decade.
Given the rocky market environment of recent years, the fund’s solid ten-year performance has been no easy achievement. It is a credit to the portfolio management and stock-picking skills of your fund’s experienced advisor, Wellington Management Company, LLP. Wellington’s investment expertise, supported by the fund’s exceptionally low costs, has produced exceptional results for long-term shareholders. Although the fund’s cost advantage over its peer group remains substantial (see the comparison on page 4), the fund’s expense ratio has risen over the past fiscal year.
As the average value of fund assets declined over the past 12 months, the fund’s fixed expenses accounted for a modestly higher percentage of fund assets. In addition, the Vanguard funds’ contracts with external advisors typically include breakpoint pricing. As assets rise above a breakpoint threshold, advisory fees are paid at a lower rate. When a fund’s average assets decline, a smaller portion of assets is subject to the lower rate, causing the overall rate to increase. Such was the case during the past fiscal year.
And as noted in the semiannual report, the fund’s trustees approved an increase in the advisor’s base fee rate. Altogether, these developments raised the expense ratio by 7 basis points (0.07 percentage point).
6
The fund can help diversify a well-balanced portfolio
Although the stock market rallied strongly throughout most of the period covered in this report, volatility returned in the final weeks. In the short term, it’s uncertain whether the market will resume its healthy recovery or more drama will ensue.
Although we can’t control what happens in the financial markets or the economy, we can control how we react to the inevitable volatility and incessant “noise” that accompany investing. That’s why Vanguard encourages investors to create a plan that includes a mix of stocks, bonds, and short-term reserves. By investing across different asset classes, you can reduce the impact of volatility in any one of them, and that can help you to weather short-term market swings.
Diversification can help within an asset class as well. Vanguard Health Care Fund offers broad exposure to the overall health care industry together with the expertise of a premier portfolio management team at exceptionally low cost. As one component of stock holdings within a balanced portfolio, the Health Care Fund can provide an opportunity to participate in the long-term growth—and challenges—of one of the global economy’s most innovative segments.
On another matter, I would like to inform you that as of January 1, 2010, we completed a leadership transition that began in March 2008. I succeeded Jack Brennan as chairman of Vanguard and each of its funds. Jack has agreed to serve as chairman emeritus and senior advisor.
Under Jack’s leadership, Vanguard has grown to become a preeminent firm in the mutual fund industry. Jack’s energy, his relentless pursuit of perfection, and his unwavering focus on always doing the right thing for our clients are evident in every facet of Vanguard policy today.
As always, thank you for entrusting your assets to Vanguard.
Sincerely,

F. William McNabb III
Chairman and Chief Executive Officer
February 10, 2010
Advisor’s Report
Vanguard Health Care Fund’s Investor Shares gained 23.63% for the 12 months ended January 31, 2010. This compares with returns of 33.14% for the S&P 500 Index, 21.80% for the S&P Health Care Index, and 23.65%, on average, for global health/biotechnology funds.
The investment environment
As the broad U.S. stock market recovered from its low mark in March 2009, health care stocks lagged the overall gain. This is not unexpected in the context of a market rebound driven by a return to risk-seeking among investors.
Our successes
Schering-Plough’s stock price jumped significantly following news that it would merge with Merck. Merck’s outlook improved with the deal, and the combined company is now our largest holding. Pfizer shares benefited from the company’s acquisition of Wyeth. Forest Laboratories rebounded strongly on investors’ improved perception of its drug pipeline.
Our shortfalls
Genzyme shares fell sharply in March 2009 and continued to struggle throughout the year after the company reported problems with its production systems. We are hopeful Genzyme will recover this year without losing too much long-term value. Our Japanese pharmaceuticals holdings, including Astellas Pharma, Daiichi Sankyo, and Takeda Pharmaceutical, performed poorly during the period. We believe that much of this resulted from a high valuation
| |
| Portfolio Changes | |
| Year Ended January 31, 2010 | |
| |
| Additions | Comments |
| Cephalon | Augmented on weakness. |
| Johnson & Johnson | Patent expirations that caused concern are mostly over with. |
| Boston Scientific | Acquired in belief that the worst is over for the company. |
| |
| Reductions | Comments |
| Merck | Reduced after Schering-Plough merger made it our largest position. |
| Schering-Plough | Eliminated through merger with Merck. |
| Wyeth | Eliminated through merger with Pfizer. |
8
base after outperformance in 2008 and from overall weakness in the Japanese equity market.
The fund’s positioning
With the U.S. stock market having recovered significantly from the lows of a year ago, we believe 2010 is likely to be a better year for the relative performance of health care. The uncertainty about prospective changes in the U.S. health care system remains a concern, but valuations are very reasonable. We will continue to be diversified, focused on the long term, and positioned in the most attractive health care stocks.
Edward P. Owens, CFA Senior Vice President and Partner
Jean M. Hynes, CFA Senior Vice President and Global Industry Analyst
Wellington Management Company, LLP
February 11, 2010
9
Health Care Fund
Fund Profile
As of January 31, 2010
| | |
| Share-Class Characteristics | |
| | Investor | Admiral |
| | Shares | Shares |
| Ticker Symbol | VGHCX | VGHAX |
| Expense Ratio1 | 0.33% | 0.25% |
| 30-Day SEC Yield | 0.73% | 0.79% |
| | | |
| Portfolio Characteristics | | |
| | | | DJ |
| | | | U.S. Total |
| | | S&P Health | Market |
| | Fund | Care Index | Index |
| Number of Stocks | 78 | 52 | 4,185 |
| Median Market Cap | $29.2B | $43.8B | $29.6B |
| Price/Earnings Ratio | 14.2x | 14.9x | 26.4x |
| Price/Book Ratio | 2.3x | 2.8x | 2.1x |
| Return on Equity | 18.6% | 20.3% | 19.2% |
| Earnings Growth Rate | 9.1% | 11.9% | 7.7% |
| Dividend Yield | 2.1% | 2.0% | 1.9% |
| Foreign Holdings | 23.4% | 0.0% | 0.0% |
| Turnover Rate | 6% | — | — |
| Short-Term Reserves | 10.8% | — | — |
| | |
| Subindustry Diversification (% of equity exposure) |
| | | S&P Health |
| | Fund | Care Index |
| Biotechnology | 8.8% | 13.0% |
| Consumer Staples | 3.0 | 0.0 |
| Health Care Distributors | 5.3 | 3.0 |
| Health Care Equipment | 8.7 | 15.2 |
| Health Care Facilities | 1.3 | 0.2 |
| Health Care Services | 3.1 | 5.9 |
| Health Care Supplies | 0.5 | 0.4 |
| Health Care Technology | 2.3 | 0.3 |
| Industrials | 0.4 | 0.0 |
| Life Sciences Tools & | | |
| Services | 0.3 | 3.1 |
| Managed Health Care | 11.5 | 8.1 |
| Materials | 0.9 | 0.0 |
| Pharmaceuticals | 53.9 | 50.8 |
| | |
| Volatility Measures | | |
| | | DJ |
| | | U.S. Total |
| | S&P Health | Market |
| | Care Index | Index |
| R-Squared | 0.95 | 0.66 |
| Beta | 0.96 | 0.68 |
These measures show the degree and timing of the fund’s fluctuations compared with the indexes over 36 months.
| | |
| Ten Largest Holdings (% of total net assets) |
| Merck & Co. Inc. | Pharmaceuticals | 6.3% |
| Forest Laboratories Inc. | Pharmaceuticals | 4.4 |
| Pfizer Inc. | Pharmaceuticals | 4.0 |
| Roche Holding AG | Pharmaceuticals | 3.8 |
| Abbott Laboratories | Pharmaceuticals | 3.5 |
| Eli Lilly & Co. | Pharmaceuticals | 3.4 |
| AstraZeneca PLC | Pharmaceuticals | 3.4 |
| McKesson Corp. | Health Care | |
| | Distributors | 3.2 |
| UnitedHealth Group Inc. | Managed Health | |
| | Care | 3.1 |
| Astellas Pharma Inc. | Pharmaceuticals | 2.6 |
| Top Ten | | 37.7% |
The holdings listed exclude any temporary cash investments and equity index products.
| |
| Market Diversification (% of equity exposure) |
| Europe | |
| Switzerland | 6.1% |
| United Kingdom | 4.2 |
| France | 3.2 |
| Other Europe | 1.7 |
| Subtotal | 15.2 |
| Pacific | |
| Japan | 10.9% |
| North America | |
| United States | 73.9% |
1 The expense ratios shown are from the prospectus dated May 29, 2009, and represent estimated costs for the current fiscal year based on the fund’s net assets as of the prospectus date. For the fiscal year ended January 31, 2010, the Health Care Fund’s expense ratios were 0.36% for Investor Shares and 0.29% for Admiral Shares.
10
Health Care Fund
Performance Summary
All of the returns in this report represent past performance, which is not a guarantee of future results that may be achieved by the fund. (Current performance may be lower or higher than the performance data cited. For performance data current to the most recent month-end, visit our website at www.vanguard.com/performance.) Note, too, that both investment returns and principal value can fluctuate widely, so an investor’s shares, when sold, could be worth more or less than their original cost. The returns shown do not reflect taxes that a shareholder would pay on fund distributions or on the sale of fund shares.
Cumulative Performance: January 31, 2000, Through January 31, 2010
Initial Investment of $25,000
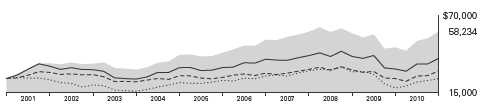
| | | | |
| | Average Annual Total Returns | |
| | Periods Ended January 31, 2010 | |
| | | | | Final Value |
| | One | Five | Ten | of a $25,000 |
| | Year | Years | Years | Investment |
| Health Care Fund Investor Shares | 23.63% | 6.15% | 8.82% | $58,234 |
| Dow Jones U.S. Total Stock Market | | | | |
| Index | 36.06 | 0.94 | -0.09 | 24,768 |
| S&P Health Care Index | 21.80 | 3.30 | 1.95 | 30,333 |
| Global Health/Biotechnology Funds | | | | |
| Average | 23.65 | 3.67 | 4.61 | 39,239 |
Global Health/Biotechnology Funds Average: Derived from data provided by Lipper Inc.
| | | | |
| | | | Since | Final Value |
| | One | Five | Inception | of a $100,000 |
| | Year | Years | (11/12/2001) | Investment |
| Health Care Fund Admiral Shares | 23.72% | 6.23% | 6.47% | $167,415 |
| Dow Jones U.S. Total Stock Market | | | | |
| Index | 36.06 | 0.94 | 2.73 | 124,821 |
| S&P Health Care Index | 21.80 | 3.30 | 0.97 | 108,243 |
| Performance for the fund’s Admiral Shares and comparative standards is calculated since the Admiral Shares’ inception. | |
Vanguard fund total returns do not include any transaction or account fees that applied in the periods shown. Fund prospectuses provide information about current fees.
See Financial Highlights for dividend and capital gains information.
11
Health Care Fund
Fiscal-Year Total Returns (%): January 31, 2000, Through January 31, 2010
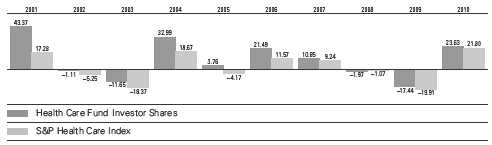
Average Annual Total Returns: Periods Ended December 31, 2009
This table presents average annual total returns through the latest calendar quarter—rather than through the end of the fiscal period. Securities and Exchange Commission rules require that we provide this information.
| | | | |
| | Inception | One | Five | Ten |
| | Date | Year | Years | Years |
| Investor Shares | 5/23/1984 | 20.96% | 5.68% | 9.24% |
| Admiral Shares | 11/12/2001 | 21.03 | 5.76 | 6.561 |
| 1 Return since inception. | | | | |
Vanguard fund total returns do not include any transaction or account fees that applied in the periods shown. Fund prospectuses provide information about current fees.
12
Health Care Fund
Financial Statements
Statement of Net Assets
As of January 31, 2010
The fund reports a complete list of its holdings in regulatory filings four times in each fiscal year, at the quarter-ends. For the second and fourth fiscal quarters, the lists appear in the fund’s semiannual and annual reports to shareholders. For the first and third fiscal quarters, the fund files the lists with the Securities and Exchange Commission on Form N-Q. Shareholders can look up the fund’s Forms N-Q on the SEC’s website at www.sec.gov. Forms N-Q may also be reviewed and copied at the SEC’s Public Reference Room (see the back cover of this report for further information).
| | | |
| | | | Market |
| | | | Value• |
| | | Shares | ($000) |
| Common Stocks (89.3%) | | |
| United States (65.9%) | | |
| Biotechnology (7.8%) | | |
| * | Amgen Inc. | 8,838,455 | 516,873 |
| *,1 | Cephalon Inc. | 5,464,502 | 348,854 |
| * | Genzyme Corp. | 5,369,340 | 291,340 |
| *,1 | OSI Pharmaceuticals Inc. | 3,840,873 | 131,435 |
| * | Biogen Idec Inc. | 2,370,000 | 127,364 |
| * | Vertex | | |
| | Pharmaceuticals Inc. | 1,593,800 | 61,202 |
| * | Gilead Sciences Inc. | 700,000 | 33,789 |
| * | Amylin | | |
| | Pharmaceuticals Inc. | 1,657,200 | 29,796 |
| * | Onyx Pharmaceuticals Inc. | 807,200 | 23,215 |
| * | United Therapeutics Corp. | 222,000 | 13,225 |
| * | Cubist Pharmaceuticals Inc. | 586,542 | 12,018 |
| | | | 1,589,111 |
| Chemicals (0.8%) | | |
| | Sigma-Aldrich Corp. | 3,480,000 | 166,518 |
| |
| Food & Staples Retailing (2.0%) | |
| | Walgreen Co. | 11,300,000 | 407,365 |
| |
| Health Care Equipment & Supplies (8.1%) | |
| * | St. Jude Medical Inc. | 8,910,900 | 336,208 |
| | Medtronic Inc. | 6,814,900 | 292,291 |
| | Becton Dickinson and Co. | 3,402,500 | 256,447 |
| | Beckman Coulter Inc. | 2,511,784 | 164,195 |
| | Baxter International Inc. | 2,700,000 | 155,493 |
| * | Boston Scientific Corp. | 11,200,000 | 96,656 |
| * | CareFusion Corp. | 3,268,354 | 84,160 |
| | DENTSPLY | | |
| | International Inc. | 2,485,400 | 83,336 |
| * | Hospira Inc. | 1,395,070 | 70,646 |
| | Covidien PLC | 1,150,000 | 58,144 |
| | | |
| | | | Market |
| | | | Value• |
| | | Shares | ($000) |
| * | Zimmer Holdings Inc. | 500,000 | 28,160 |
| | STERIS Corp. | 803,083 | 20,944 |
| | | | 1,646,680 |
| Health Care Providers & Services (18.8%) | |
| | McKesson Corp. | 11,189,900 | 658,190 |
| | UnitedHealth Group Inc. | 19,085,100 | 629,808 |
| * | WellPoint Inc. | 6,602,400 | 420,705 |
| * | Humana Inc. | 7,894,800 | 383,845 |
| | Quest Diagnostics Inc. | 5,785,400 | 322,073 |
| | CIGNA Corp. | 7,810,600 | 263,764 |
| | Cardinal Health Inc. | 6,536,708 | 216,169 |
| *,1 | Coventry Health Care Inc. | 8,957,500 | 204,948 |
| * | Laboratory Corp. of | | |
| | America Holdings | 2,731,360 | 194,200 |
| | Universal Health | | |
| | Services Inc. Class B | 4,320,800 | 125,995 |
| * | Health Net Inc. | 4,663,458 | 113,135 |
| *,1 | Health Management | | |
| | Associates Inc. Class A | 15,756,900 | 104,626 |
| | Owens & Minor Inc. | 2,000,000 | 80,180 |
| | Aetna Inc. | 2,050,000 | 61,438 |
| * | DaVita Inc. | 304,600 | 18,203 |
| * | WellCare Health Plans Inc. | 449,000 | 14,000 |
| | | | 3,811,279 |
| Health Care Technology (2.1%) | |
| * | Cerner Corp. | 3,150,000 | 238,297 |
| | IMS Health Inc. | 8,547,400 | 184,966 |
| | | | 423,263 |
| Household Products (0.1%) | | |
| * | Energizer Holdings Inc. | 337,300 | 18,720 |
| |
| Life Sciences Tools & Services (0.3%) | |
| *,1 | PAREXEL | | |
| | International Corp. | 3,140,400 | 60,735 |
| |
| Machinery (0.3%) | | |
| | Pall Corp. | 2,104,600 | 72,546 |
13
| | | |
| Health Care Fund | | |
| |
| |
| |
| | | | Market |
| | | | Value• |
| | | Shares | ($000) |
| Personal Products (0.6%) | | |
| | Mead Johnson | | |
| | Nutrition Co. | 2,621,937 | 118,590 |
| |
| Pharmaceuticals (25.0%) | | |
| | Merck & Co. Inc. | 33,630,248 | 1,284,003 |
| *,1 | Forest Laboratories Inc. | 30,133,000 | 893,142 |
| | Pfizer Inc. | 43,259,788 | 807,228 |
| | Abbott Laboratories | 13,300,000 | 704,102 |
| | Eli Lilly & Co. | 19,879,900 | 699,772 |
| | Bristol-Myers Squibb Co. | 9,078,361 | 221,149 |
| | Johnson & Johnson | 3,400,000 | 213,724 |
| | Perrigo Co. | 3,975,000 | 176,013 |
| * | Watson | | |
| | Pharmaceuticals Inc. | 1,900,000 | 72,903 |
| * | Warner Chilcott PLC | | |
| | Class A | 232,200 | 6,346 |
| | | | 5,078,382 |
| Total United States | | 13,393,189 |
| International (23.4%) | | |
| Belgium (0.4%) | | |
| | UCB SA | 1,644,146 | 73,502 |
| |
| Denmark (0.2%) | | |
| | Novo Nordisk A/S Class B | 700,000 | 47,362 |
| |
| France (2.9%) | | |
| | Sanofi-Aventis SA | 6,926,233 | 512,157 |
| | Ipsen SA | 1,400,000 | 75,278 |
| | | | 587,435 |
| Germany (0.6%) | | |
| | Bayer AG | 1,394,656 | 95,325 |
| | Fresenius Medical Care | | |
| | AG & Co. KGaA | 611,950 | 31,018 |
| | | | 126,343 |
| Ireland (0.3%) | | |
| * | Elan Corp. PLC ADR | 8,262,700 | 61,557 |
| |
| Japan (9.7%) | | |
| | Astellas Pharma Inc. | 14,265,700 | 526,144 |
| | Takeda | | |
| | Pharmaceutical Co. Ltd. | 9,649,900 | 423,301 |
| | Eisai Co. Ltd. | 8,993,700 | 334,384 |
| | Daiichi Sankyo Co. Ltd. | 12,251,500 | 254,612 |
| | Shionogi & Co. Ltd. | 10,126,000 | 208,681 |
| | Mitsubishi Tanabe | | |
| | Pharma Corp. | 6,850,000 | 97,039 |
| | Chugai | | |
| | Pharmaceutical Co. Ltd. | 4,101,800 | 73,239 |
| | Ono | | |
| | Pharmaceutical Co. Ltd. | 960,000 | 42,718 |
| | Terumo Corp. | 200,000 | 11,212 |
| | | | 1,971,330 |
| | | |
| | | | Market |
| | | | Value• |
| | | Shares | ($000) |
| Switzerland (5.5%) | | | |
| Roche Holding AG | | 4,113,977 | 690,206 |
| Novartis AG | | 6,369,880 | 340,883 |
| Roche Holding AG (Bearer) | 464,320 | 80,537 |
| | | | 1,111,626 |
| United Kingdom (3.8%) | | | |
| AstraZeneca PLC | 14,881,500 | 690,743 |
| GlaxoSmithKline | | | |
| PLC ADR | | 1,942,381 | 75,772 |
| | | | 766,515 |
| Total International | | | 4,745,670 |
| Total Common Stocks | | | |
| (Cost $12,870,186) | | | 18,138,859 |
| Temporary Cash Investments (10.8%) | |
| |
| |
| | | Face | |
| | | Amount | |
| | | ($000) | |
| Repurchase Agreements (7.6%) | | | |
| Banc of America | | | |
| Securities, LLC 0.120%, | | |
| 2/1/10 (Dated 1/29/09, | | |
| Repurchase Value | | | |
| $498,705,000, collateralized | |
| by Federal National | | | |
| Mortgage Assn. | | | |
| 4.000%–6.000%, | | | |
| 6/1/24–12/1/48 and | | | |
| Federal Home Loan | | | |
| Mortgage Corp. | | | |
| 5.000%, 8/1/24) | | 498,700 | 498,700 |
| Barclays Capital Inc. 0.110%, | | | |
| 2/1/10 (Dated 1/29/09, | | |
| Repurchase Value | | | |
| $935,509,000, collateralized | |
| by Federal Home Loan | | |
| Mortgage Corp. | | | |
| 4.500%–6.500%, | | | |
| 4/1/18–6/1/39 and Federal | |
| National Mortgage Assn. | | |
| 4.047%–6.500%, | | | |
| 10/1/18–2/1/48) | | 935,500 | 935,500 |
| Credit Suisse Securities | | |
| (USA) LLC 0.120%, 2/1/10 | | |
| (Dated 1/29/09, Repurchase | |
| Value $102,001,000, | | | |
| collateralized by Federal | | |
| National Mortgage Assn. | | |
| 4.500%–7.000%, | | | |
| 12/1/23–1/1/40) | | 102,000 | 102,000 |
| | | | 1,536,200 |
14
| | |
| Health Care Fund | | |
| |
| |
| |
| | Face | Market |
| | Amount | Value• |
| | ($000) | ($000) |
| U.S. Government and Agency Obligations (1.2%) |
| 2 Fannie Mae Discount | | |
| Notes, 0.180%, 5/25/10 | 250,000 | 249,903 |
| |
| Commercial Paper (2.0%) | | |
| General Electric | | |
| Capital Services Inc., | | |
| 0.180%, 4/20/10 | 200,000 | 199,888 |
| General Electric Co., | | |
| 0.150%, 2/16/10 | 200,000 | 199,987 |
| | | 399,875 |
| Total Temporary Cash Investments | |
| (Cost $2,185,968) | | 2,185,978 |
| Total Investments (100.1%) | | |
| (Cost $15,056,154) | | 20,324,837 |
| Other Assets and Liabilities (-0.1%) | |
| Other Assets | | 51,104 |
| Liabilities | | (64,262) |
| | | (13,158) |
| Net Assets (100%) | | 20,311,679 |
| |
| |
| Statement of Assets and Liabilities | |
| Assets | | |
| Investments in Securities, at Value | 20,324,837 |
| Receivables for Investment | | |
| Securities Sold | | 15,462 |
| Receivables for Capital Shares Issued | 13,836 |
| Income Receivable | | 8,527 |
| Other Assets | | 13,279 |
| Total Assets | | 20,375,941 |
| Liabilities | | |
| Payables for Capital Shares Redeemed | 11,548 |
| Other Liabilities | | 52,714 |
| Total Liabilities | | 64,262 |
| Net Assets | | 20,311,679 |
| |
| At January 31, 2010, net assets consisted of: |
| | Amount |
| | ($000) |
| Paid-in Capital | 14,886,379 |
| Overdistributed Net Investment Income | (25,007) |
| Accumulated Net Realized Gains | 180,855 |
| Unrealized Appreciation (Depreciation) | |
| Investment Securities | 5,268,683 |
| Foreign Currencies | 769 |
| Net Assets | 20,311,679 |
| |
| Investor Shares—Net Assets | |
| Applicable to 97,387,116 outstanding | |
| $.001 par value shares of beneficial | |
| interest (unlimited authorization) | 11,692,236 |
| Net Asset Value Per Share— | |
| Investor Shares | $120.06 |
| |
| Admiral Shares—Net Assets | |
| Applicable to 170,117,109 outstanding | |
| $.001 par value shares of beneficial | |
| interest (unlimited authorization) | 8,619,443 |
| Net Asset Value Per Share— | |
| Admiral Shares | $50.67 |
• See Note A in Notes to Financial Statements.
* Non-income-producing security.
1 Considered an affiliated company of the fund as the fund owns more than 5% of the outstanding voting securities of such company.
2 The issuer operates under a congressional charter; its securities are not backed by the full faith and credit of the U.S. government.
ADR—American Depositary Receipt.
See accompanying Notes, which are an integral part of the Financial Statements.
15
| |
| Health Care Fund | |
| |
| |
| Statement of Operations | |
| |
| | Year Ended |
| | January 31, 2010 |
| | ($000) |
| Investment Income | |
| Income | |
| Dividends1,2 | 379,756 |
| Interest | 2,119 |
| Security Lending | 4,236 |
| Total Income | 386,111 |
| Expenses | |
| Investment Advisory Fees—Note B | 26,298 |
| The Vanguard Group—Note C | |
| Management and Administrative—Investor Shares | 19,778 |
| Management and Administrative—Admiral Shares | 9,530 |
| Marketing and Distribution—Investor Shares | 2,057 |
| Marketing and Distribution—Admiral Shares | 1,446 |
| Custodian Fees | 296 |
| Auditing Fees | 25 |
| Shareholders’ Reports and Proxies—Investor Shares | 798 |
| Shareholders’ Reports and Proxies—Admiral Shares | 115 |
| Trustees’ Fees and Expenses | 40 |
| Total Expenses | 60,383 |
| Net Investment Income | 325,728 |
| Realized Net Gain (Loss) | |
| Investment Securities Sold2 | 346,859 |
| Foreign Currencies | 18 |
| Realized Net Gain (Loss) | 346,877 |
| Change in Unrealized Appreciation (Depreciation) | |
| Investment Securities | 3,255,078 |
| Foreign Currencies | 831 |
| Change in Unrealized Appreciation (Depreciation) | 3,255,909 |
| Net Increase (Decrease) in Net Assets Resulting from Operations | 3,928,514 |
| 1 | Dividends are net of foreign withholding taxes of $16,822,000. |
| 2 | Dividend income and realized net gain (loss) from affiliated companies of the fund were $0 and ($7,720,000), respectively. |
See accompanying Notes, which are an integral part of the Financial Statements.
16
| | |
| Health Care Fund | | |
| |
| |
| Statement of Changes in Net Assets | | |
| |
| | Year Ended January 31, |
| | 2010 | 2009 |
| | ($000) | ($000) |
| Increase (Decrease) in Net Assets | | |
| Operations | | |
| Net Investment Income | 325,728 | 358,569 |
| Realized Net Gain (Loss) | 346,877 | 1,460,834 |
| Change in Unrealized Appreciation (Depreciation) | 3,255,909 | (5,975,753) |
| Net Increase (Decrease) in Net Assets Resulting from Operations | 3,928,514 | (4,156,350) |
| Distributions | | |
| Net Investment Income | | |
| Investor Shares | (169,451) | (187,362) |
| Admiral Shares | (130,015) | (143,549) |
| Realized Capital Gain1 | | |
| Investor Shares | (70,199) | (936,594) |
| Admiral Shares | (51,618) | (684,776) |
| Total Distributions | (421,283) | (1,952,281) |
| Capital Share Transactions | | |
| Investor Shares | (827,665) | (324,652) |
| Admiral Shares | (422,405) | (339,252) |
| Net Increase (Decrease) from Capital Share Transactions | (1,250,070) | (663,904) |
| Total Increase (Decrease) | 2,257,161 | (6,772,535) |
| Net Assets | | |
| Beginning of Period | 18,054,518 | 24,827,053 |
| End of Period2 | 20,311,679 | 18,054,518 |
| 1 | Includes fiscal 2010 and 2009 short-term gain distributions totaling $32,329,000 and $47,615,000, respectively. Short-term gain distributions are treated as ordinary income dividends for tax purposes. |
| 2 | Net Assets—End of Period includes undistributed (overdistributed) net investment income of ($25,007,000) and ($36,939,000). |
See accompanying Notes, which are an integral part of the Financial Statements.
17
| | | | | |
| Health Care Fund | | | | | |
| |
| |
| Financial Highlights | | | | | |
| |
| |
| Investor Shares | | | | | |
| |
| For a Share Outstanding | | | Year Ended January 31, |
| Throughout Each Period | 2010 | 2009 | 2008 | 2007 | 2006 |
| Net Asset Value, Beginning of Period | $99.12 | $133.80 | $149.69 | $143.39 | $123.84 |
| Investment Operations | | | | | |
| Net Investment Income | 1.902 | 1.998 | 2.7661 | 1.953 | 1.753 |
| Net Realized and Unrealized Gain (Loss) | | | | | |
| on Investments | 21.530 | (25.229) | (5.317) | 13.107 | 24.424 |
| Total from Investment Operations | 23.432 | (23.231) | (2.551) | 15.060 | 26.177 |
| Distributions | | | | | |
| Dividends from Net Investment Income | (1.761) | (1.925) | (2.747) | (2.100) | (1.542) |
| Distributions from Realized Capital Gains | (.731) | (9.524) | (10.592) | (6.660) | (5.085) |
| Total Distributions | (2.492) | (11.449) | (13.339) | (8.760) | (6.627) |
| Net Asset Value, End of Period | $120.06 | $99.12 | $133.80 | $149.69 | $143.39 |
| |
| Total Return2 | 23.63% | -17.44% | -1.97% | 10.85% | 21.49% |
| |
| Ratios/Supplemental Data | | | | | |
| Net Assets, End of Period (Millions) | $11,692 | $10,478 | $14,314 | $16,662 | $17,198 |
| Ratio of Total Expenses to | | | | | |
| Average Net Assets | 0.36% | 0.29% | 0.26% | 0.25% | 0.25% |
| Ratio of Net Investment Income to | | | | | |
| Average Net Assets | 1.73% | 1.64% | 1.78%1 | 1.33% | 1.29% |
| Portfolio Turnover Rate | 6% | 12% | 9% | 8% | 14% |
| 1 | Net investment income per share and the ratio of net investment income to average net assets include $0.585 and 0.40%, respectively, resulting from a special dividend from Health Management Associates Class A in March 2007. |
| 2 | Total returns do not reflect the 1% fee assessed on redemptions after March 23, 2005, of shares held for less than one year, nor do they include the account service fee that may be applicable to certain accounts with balances below $10,000. |
See accompanying Notes, which are an integral part of the Financial Statements.
18
| | | | | |
| Health Care Fund | | | | | |
| |
| |
| Financial Highlights | | | | | |
| |
| |
| Admiral Shares | | | | | |
| |
| For a Share Outstanding | | | Year Ended January 31, |
| Throughout Each Period | 2010 | 2009 | 2008 | 2007 | 2006 |
| Net Asset Value, Beginning of Period | $41.83 | $56.47 | $63.19 | $60.52 | $52.25 |
| Investment Operations | | | | | |
| Net Investment Income | .835 | .879 | 1.2201 | .877 | .779 |
| Net Realized and Unrealized Gain | | | | | |
| (Loss) on Investments | 9.091 | (10.648) | (2.257) | 5.542 | 10.328 |
| Total from Investment Operations | 9.926 | (9.769) | (1.037) | 6.419 | 11.107 |
| Distributions | | | | | |
| Dividends from Net Investment Income | (.777) | (.852) | (1.212) | (.938) | (.690) |
| Distributions from Realized Capital Gains | (.309) | (4.019) | (4.471) | (2.811) | (2.147) |
| Total Distributions | (1.086) | (4.871) | (5.683) | (3.749) | (2.837) |
| Net Asset Value, End of Period | $50.67 | $41.83 | $56.47 | $63.19 | $60.52 |
| |
| Total Return2 | 23.72% | -17.38% | -1.90% | 10.96% | 21.62% |
| |
| Ratios/Supplemental Data | | | | | |
| Net Assets, End of Period (Millions) | $8,619 | $7,576 | $10,513 | $10,819 | $9,123 |
| Ratio of Total Expenses to | | | | | |
| Average Net Assets | 0.29% | 0.22% | 0.18% | 0.17% | 0.14% |
| Ratio of Net Investment Income to | | | | | |
| Average Net Assets | 1.80% | 1.71% | 1.86%1 | 1.41% | 1.40% |
| Portfolio Turnover Rate | 6% | 12% | 9% | 8% | 14% |
| 1 | Net investment income per share and the ratio of net investment income to average net assets include $0.247 and 0.40%, respectively, resulting from a special dividend from Health Management Associates Class A in March 2007. |
| 2 | Total returns do not reflect the 1% fee assessed on redemptions after March 23, 2005, of shares held for less than one year. |
See accompanying Notes, which are an integral part of the Financial Statements.
19
Health Care Fund
Notes to Financial Statements
Vanguard Health Care Fund is registered under the Investment Company Act of 1940 as an open-end investment company, or mutual fund. The fund invests in securities of foreign issuers, which may subject it to investment risks not normally associated with investing in securities of U.S. corporations. The fund offers two classes of shares: Investor Shares and Admiral Shares. Investor Shares are available to any investor who meets the fund’s minimum purchase requirements. Admiral Shares are designed for investors who meet certain administrative, service, tenure, and account-size criteria.
A. The following significant accounting policies conform to generally accepted accounting principles for U.S. mutual funds. The fund consistently follows such policies in preparing its financial statements.
1. Security Valuation: Securities are valued as of the close of trading on the New York Stock Exchange (generally 4 p.m., Eastern time) on the valuation date. Equity securities are valued at the latest quoted sales prices or official closing prices taken from the primary market in which each security trades; such securities not traded on the valuation date are valued at the mean of the latest quoted bid and asked prices. Securities for which market quotations are not readily available, or whose values have been affected by events occurring before the fund’s pricing time but after the close of the securities’ primary markets, are valued at their fair values calculated according to procedures adopted by the board of trus tees. These procedures include obtaining quotations from an independent pricing service, monitoring news to identify significant market- or security-specific events, and evaluating changes in the values of foreign market proxies (for example, ADRs, futures contracts, or exchange-traded funds), between the time the foreign markets close and the fund’s pricing time. When fair-value pricing is employed, the prices of securities used by a fund to calculate its net asset value may differ from quoted or published prices for the same securities. Investments in Vanguard Market Liquidity Fund are valued at that fund’s net asset value. Temporary cash investments acquired over 60 days to maturity are valued using the latest bid prices or using valuations based on a matrix system (which considers such factors as security prices, yields, maturities, and ratings), both as furnished by independent pricing services. Other temporary cash investments are valued at amortized cost, which approximates market value.
2. Foreign Currency: Securities and other assets and liabilities denominated in foreign currencies are translated into U.S. dollars using exchange rates obtained from an independent third party as of the fund’s pricing time on the valuation date. Realized gains (losses) and unrealized appreciation (depreciation) on investment securities include the effects of changes in exchange rates since the securities were purchased, combined with the effects of changes in security prices. Fluctuations in the value of other assets and liabilities resulting from changes in exchange rates are recorded as unrealized foreign currency gains (losses) until the assets or liabilities are settled in cash, at which time they are recorded as realized foreign currency gains (losses).
3. Repurchase Agreements: The fund may invest in repurchase agreements. Securities pledged as collateral for repurchase agreements are held by a custodian bank until the agreements mature. Each agreement requires that the market value of the collateral be sufficient to cover payments of interest and principal; however, in the event of default or bankruptcy by the other party to the agreement, retention of the collateral may be subject to legal proceedings.
4. Federal Income Taxes: The fund intends to continue to qualify as a regulated investment company and distribute all of its taxable income. Management has analyzed the fund’s tax positions taken for all open federal income tax years (January 31, 2007–2010), and has concluded that no provision for federal income tax is required in the fund’s financial statements.
20
Health Care Fund
5. Distributions: Distributions to shareholders are recorded on the ex-dividend date.
6. Security Lending: The fund may lend its securities to qualified institutional borrowers to earn additional income. Security loans are required to be secured at all times by collateral at least equal to the market value of securities loaned. The fund invests cash collateral received in Vanguard Market Liquidity Fund, and records a liability for the return of the collateral, during the period the securities are on loan. Security lending income represents the income earned on investing cash collateral, less expenses associated with the loan.
7. Other: Dividend income is recorded on the ex-dividend date. Interest income is accrued daily. Premiums and discounts on debt securities purchased are amortized and accreted, respectively, to interest income over the lives of the respective securities. Security transactions are accounted for on the date securities are bought or sold. Costs used to determine realized gains (losses) on the sale of investment securities are those of the specific securities sold. Fees assessed on redemptions of capital shares are credited to paid-in capital.
Each class of shares has equal rights as to assets and earnings, except that each class separately bears certain class-specific expenses related to maintenance of shareholder accounts (included in Management and Administrative expenses), shareholder reporting, and proxies. Marketing and distribution expenses are allocated to each class of shares based on a method approved by the board of trustees. Income, other non-class-specific expenses, and gains and losses on investments are allocated to each class of shares based on its relative net assets.
B. Wellington Management Company, LLP, provides investment advisory services to the fund for a fee calculated at an annual percentage rate of average net assets. For the year ended January 31, 2010, the investment advisory fee represented an effective annual rate of 0.14% of the fund’s average net assets.
C. The Vanguard Group furnishes at cost corporate management, administrative, marketing, and distribution services. The costs of such services are allocated to the fund under methods approved by the board of trustees. The fund has committed to provide up to 0.40% of its net assets in capital contributions to Vanguard. At January 31, 2010, the fund had contributed capital of $4,034,000 to Vanguard (included in Other Assets), representing 0.02% of the fund’s net assets and 1.61% of Vanguard’s capitalization. The fund’s trustees and officers are also directors and officers of Vanguard.
D. Various inputs may be used to determine the value of the fund’s investments. These inputs are summarized in three broad levels for financial statement purposes. The inputs or methodologies used to value securities are not necessarily an indication of the risk associated with investing in those securities.
Level 1 — Quoted prices in active markets for identical securities.
Level 2 — Other significant observable inputs (including quoted prices for similar securities, interest rates, prepayment speeds, credit risk, etc.).
Level 3 — Significant unobservable inputs (including the fund’s own assumptions used to determine the fair value of investments).
21
Health Care Fund
The following table summarizes the fund’s investments as of January 31, 2010, based on the inputs used to value them:
| | | |
| | Level 1 | Level 2 | Level 3 |
| Investments | ($000) | ($000) | ($000) |
| Common Stocks—U.S. | 13,393,189 | — | — |
| Common Stocks—International | 137,330 | 4,608,340 | — |
| Temporary Cash Investments | — | 2,185,978 | — |
| Total | 13,530,519 | 6,794,318 | — |
E. Distributions are determined on a tax basis and may differ from net investment income and realized capital gains for financial reporting purposes. Differences may be permanent or temporary. Permanent differences are reclassified among capital accounts in the financial statements to reflect their tax character. Temporary differences arise when certain items of income, expense, gain, or loss are recognized in different periods for financial statement and tax purposes; these differences will reverse at some time in the future. Differences in classification may also result from the treatment of short-term gains as ordinary income for tax purposes.
During the year ended January 31, 2010, the fund realized net foreign currency gains of $18,000, which increased distributable net income for tax purposes; accordingly, such gains have been reclassified from accumulated net realized gains to overdistributed net investment income.
The fund used a tax accounting practice to treat a portion of the price of capital shares redeemed during the year as distributions from net investment income and realized capital gains. Accordingly, the fund has reclassified $14,348,000 from overdistributed net investment income, and $15,147,000 from accumulated net realized gains, to paid-in capital.
For tax purposes, at January 31, 2010, the fund had $15,276,000 of ordinary income and $199,210,000 of long-term capital gains available for dis tribution.
At January 31, 2010, the cost of investment securities for tax purposes was $15,075,333,000. Net unrealized appreciation of investment securities for tax purposes was $5,249,504,000, consisting of unrealized gains of $6,220,010,000 on securities that had risen in value since their purchase and $970,506,000 in unrealized losses on securities that had fallen in value since their purchase.
F. During the year ended January 31, 2010, the fund purchased $975,414,000 of investment securities and sold $3,532,098,000 of investment securities, other than temporary cash investments.
22
Health Care Fund
G. Capital share transactions for each class of shares were:
| | | | |
| | | | Year Ended January 31, |
| | | 2010 | | 2009 |
| | Amount | Shares | Amount | Shares |
| | ($000) | (000) | ($000) | (000) |
| Investor Shares | | | | |
| Issued | 682,184 | 6,337 | 683,036 | 5,807 |
| Issued in Lieu of Cash Distributions | 228,626 | 1,898 | 1,073,783 | 10,605 |
| Redeemed1 | (1,738,475) | (16,563) | (2,081,471) | (17,676) |
| Net Increase (Decrease)—Investor Shares | (827,665) | (8,328) | (324,652) | (1,264) |
| Admiral Shares | | | | |
| Issued | 545,366 | 11,748 | 478,417 | 9,423 |
| Issued in Lieu of Cash Distributions | 162,555 | 3,200 | 738,966 | 17,282 |
| Redeemed1 | (1,130,326) | (25,942) | (1,556,635) | (31,749) |
| Net Increase (Decrease)—Admiral Shares | (422,405) | (10,994) | (339,252) | (5,044) |
| 1 Net of redemption fees for fiscal 2010 and 2009 of $790,000 and $1,038,000, respectively (fund tot als). | | |
H. Certain of the fund’s investments are in companies that are considered to be affiliated companies of the fund because the fund owns more than 5% of the outstanding voting securities of the company. Transactions during the period in securities of these companies were as follows:
| | | | | |
| | | | Current Period Transactions | |
| | Jan. 31, 2009 | | Proceeds from | | Jan. 31, 2010 |
| | Market | Purchases | Securities | Dividend | Market |
| | Value | at Cost | Sold | Income | Value |
| | ($000) | ($000) | ($000) | ($000) | ($000) |
| Cephalon Inc. | NA1 | 222,237 | 12,859 | — | 348,854 |
| Coventry Health Care Inc. | 142,015 | — | 8,055 | — | 204,948 |
| Forest Laboratories Inc. | 754,530 | — | — | — | 893,142 |
| Health Management | | | | | |
| Associates Inc. Class A | 25,053 | — | — | — | 104,626 |
| OSI Pharmaceuticals Inc. | 123,888 | 12,200 | 1,752 | — | 131,435 |
| PAREXEL International Corp. | 31,059 | — | — | — | 60,735 |
| | 1,076,545 | | | | 1,743,740 |
| 1 Not applicable—At January 31, 2009, the issuer was not an affiliated company of the fund. | | |
I. In preparing the financial statements as of January 31, 2010, management considered the impact of subsequent events for potential recognition or disclosure in these financial statements.
23
Report of Independent Registered Public Accounting Firm
To the Trustees of Vanguard Specialized Funds and the Shareholders of Vanguard Health Care Fund:
In our opinion, the accompanying statements of net assets and of assets and liabilities and the related statements of operations and of changes in net assets and the financial highlights present fairly, in all material respects, the financial position of Vanguard Health Care Fund (constituting a separate portfolio of Vanguard Specialized Funds, hereafter referred to as the “Fund”) at January 31, 2010, the results of its operations for the year then ended, the changes in its net assets for each of the two years in the period then ended and the financial highlights for each of the five years in the period then ended, in conformity with accounting principle s generally accepted in the United States of America. These financial statements and financial highlights (hereafter referred to as “financial statements”) are the responsibility of the Fund’s management; our responsibility is to express an opinion on these financial statements based on our audits. We conducted our audits of these financial statements in accordance with the standards of the Public Company Accounting Oversight Board (United States). Those standards require that we plan and perform the audit to obtain reasonable assurance about whether the financial statements are free of material misstatement. An audit includes examining, on a test basis, evidence supporting the amounts and disclosures in the financial statements, assessing the accounting principles used and significant estimates made by management, and evaluating the overall financial statement presentation. We believe that our audits, which included confirmation of securities at January 31, 2010 by correspondence with the custodians and brokers, provide a reasonable basis for our opinion.
PricewaterhouseCoopers LLP
Philadelphia, Pennsylvania
March 16, 2010
| Special 2009 tax information (unaudited) for Vanguard Health Care Fund |
This information for the fiscal year ended January 31, 2010, is included pursuant to provisions of the Internal Revenue Code.
The fund distributed $103,075,000 as capital gain dividends (from net long-term capital gains) to shareholders during the fiscal year.
The fund distributed $331,802,000 of qualified dividend income to shareholders during the fiscal year.
For corporate shareholders, 60.5% of investment income (dividend income plus short-term gains, if any) qualifies for the dividends-received deduction.
24
Your Fund’s After-Tax Returns
This table presents returns for your fund both before and after taxes. The after-tax returns are shown in two ways: (1) assuming that an investor owned the fund during the entire period and paid taxes on the fund’s distributions, and (2) assuming that an investor paid taxes on the fund’s distributions and sold all shares at the end of each period.
Calculations are based on the highest individual federal income tax and capital gains tax rates in effect at the times of the distributions and the hypothetical sales. State and local taxes were not considered. After-tax returns reflect any qualified dividend income , using actual prior-year figures and estimates for 2010. (In the example, returns after the sale of fund shares may be higher than those assuming no sale. This occurs when the sale would have produced a capital loss. The calculation assumes that the investor received a tax deduction for the loss.) The table shows returns for Investor Shares only; returns for other share classes will differ. Please note that your actual after-tax returns will depend on your tax situation and may differ from those shown. Also note that if you own the fund in a tax-deferred account, such as an individual retirement account or a 401(k) plan, this information does not apply to you. Such accounts are not subject to current taxes.
Finally, keep in mind that a fund’s performance—whether before or after taxes—does not guarantee future results.
| | | |
| Average Annual Total Returns: Health Care Fund Investor Shares | | |
| Periods Ended January 31, 2010 | | | |
| | One | Five | Ten |
| | Year | Years | Years |
| Returns Before Taxes | 23.63% | 6.15% | 8.82% |
| Returns After Taxes on Distributions | 23.26 | 5.06 | 7.54 |
| Returns After Taxes on Distributions and Sale of Fund Shares | 15.86 | 5.16 | 7.37 |
Total returns do not include any transaction or account fees that applied in the periods shown. Fund prospectuses provide information about current fees.
25
About Your Fund’s Expenses
As a shareholder of the fund, you incur ongoing costs, which include costs for portfolio management, administrative services, and shareholder reports (like this one), among others. Operating expenses, which are deducted from a fund’s gross income, directly reduce the investment return of the fund.
A fund’s expenses are expressed as a percentage of its average net assets. This figure is known as the expense ratio. The following examples are intended to help you understand the ongoing costs (in dollars) of investing in your fund and to compare these costs with those of other mutual funds. The examples are based on an investment of $1,000 made at the beginning of the period shown and held for the entire period.
The accompanying table illustrates your fund’s costs in two ways:
• Based on actual fund return. This section helps you to estimate the actual expenses that you paid over the period. The ”Ending Account Value“ shown is derived from the fund‘s actual return, and the third column shows the dollar amount that would have been paid by an investor who started with $1,000 in the fund. You may use the information here, together with the amount you invested, to estimate the expenses that you paid over the period.
To do so, simply divide your account value by $1,000 (for example, an $8,600 account value divided by $1,000 = 8.6), then multiply the result by the number given for your fund under the heading ”Expenses Paid During Period.“
• Based on hypothetical 5% yearly return. This section is intended to help you compare your fund‘s costs with those of other mutual funds. It assumes that the fund had a yearly return of 5% before expenses, but that the expense ratio is unchanged. In this case—because the return used is not the fund’s actual return—the results do not apply to your investment. The example is useful in making comparisons because the Securities and Exchange Commission requires all mutual funds to calculate expenses based on a 5% return. You can assess your fund’s costs by comparing this hypothetical example with the hypothetical examples that appear in shareholder reports of other funds.
Note that the expenses shown in the table are meant to highlight and help you compare ongoing costs only and do not reflect transaction costs incurred by the fund for buying and selling securities. Further, the expenses do not include the 1% fee on redemptions of shares held for less than one year, nor do they include the account service fee described in the prospectus. If such fees were applied to your account, your costs would be higher. Your fund does not carry a “sales load.” The calculations assume no shares were bought or sold during the period. Your actual costs may have been higher or lower, depending on the amount of your investment and the timing of any purchases or redemptions.
You can find more information about the fund’s expenses, including annual expense ratios, in the Financial Statements section of this report. For additional information on operating expenses and other shareholder costs, please refer to your fund’s current prospectus.
26
| | | |
| Six Months Ended January 31, 2010 | | | |
| | Beginning | Ending | Expenses |
| | Account Value | Account Value | Paid During |
| Health Care Fund | 7/31/2009 | 1/31/2010 | Period |
| Based on Actual Fund Return | | | |
| Investor Shares | $1,000.00 | $1,127.68 | $1.82 |
| Admiral Shares | 1,000.00 | 1,128.02 | 1.50 |
| Based on Hypothetical 5% Yearly Return | | | |
| Investor Shares | $1,000.00 | $1,023.49 | $1.73 |
| Admiral Shares | 1,000.00 | 1,023.79 | 1.43 |
These calculations are based on expenses incurred in the most recent six-month period. The fund’s annualized six-month expense ratios for that period are 0.34% for Investor Shares and 0.28% for Admiral Shares. The dollar amounts shown as “Expenses Paid” are equal to the annualized expense ratio multiplied by the average account value over the period, multiplied by the number of days in the most recent six-month period, then divided by the number of days in the most recent 12-month period.
27
Glossary
30-Day SEC Yield. A fund’s 30-day SEC yield is derived using a formula specified by the U.S. Securities and Exchange Commission. Under the formula, data related to the fund’s security holdings in the previous 30 days are used to calculate the fund’s hypothetical net income for that period, which is then annualized and divided by the fund’s estimated average net assets over the calculation period. For the purposes of this calculation, a security’s income is based on its current market yield to maturity (in the case of bonds) or its projected dividend yield (for stocks). Because the SEC yield represents hypothetical annualized income, it will differ—at times significantly—from the fund’s actual experience. As a result, the fund’s income distributions may be higher or lower than implied by the SEC yield.
Beta. A measure of the magnitude of a fund’s past share-price fluctuations in relation to the ups and downs of a given market index. The index is assigned a beta of 1.00. Compared with a given index, a fund with a beta of 1.20 typically would have seen its share price rise or fall by 12% when the index rose or fell by 10%. For this report, beta is based on returns over the past 36 months for both the fund and the index. Note that a fund’s beta should be reviewed in conjunction with its R-squared (see definition). The lower the R-squared, the less correlation there is between the fund and the index, and the less reliable beta is as an indicator of volatility.
Dividend Yield. Dividend income earned by stocks, expressed as a percentage of the aggregate market value (or of net asset value, for a fund). The yield is determined by dividing the amount of the annual dividends by the aggregate value (or net asset value) at the end of the period. For a fund, the dividend yield is based solely on stock holdings and does not include any income produced by other investments.
Earnings Growth Rate. The average annual rate of growth in earnings over the past five years for the stocks now in a fund.
Equity Exposure. A measure that reflects a fund’s investments in stocks and stock futures. Any holdings in short-term reserves are excluded.
Expense Ratio. The percentage of a fund’s average net assets used to pay its annual administrative and advisory expenses. These expenses directly reduce returns to investors.
Foreign Holdings. The percentage of a fund represented by stocks or depositary receipts of companies based outside the United States.
Inception Date. The date on which the assets of a fund (or one of its share classes) are first invested in accordance with the fund’s investment objective. For funds with a subscription period, the inception date is the day after that period ends. Investment performance is measured from the inception date.
Median Market Cap. An indicator of the size of companies in which a fund invests; the midpoint of market capitalization (market price x shares outstanding) of a fund’s stocks, weighted by the proportion of the fund’s assets invested in each stock. Stocks representing half of the fund’s assets have market capitalizations above the median, and the rest are below it.
Price/Book Ratio. The share price of a stock divided by its net worth, or book value, per share. For a fund, the weighted average price/book ratio of the stocks it holds.
28
Price/Earnings Ratio. The ratio of a stock’s current price to its per-share earnings over the past year. For a fund, the weighted average P/E of the stocks it holds. P/E is an indicator of market expectations about corporate prospects; the higher the P/E, the greater the expectations for a company’s future growth.
R-Squared. A measure of how much of a fund’s past returns can be explained by the returns from the market in general, as measured by a given index. If a fund’s total returns were precisely synchronized with an index’s returns, its R-squared would be 1.00. If the fund’s returns bore no relationship to the index’s returns, its R-squared would be 0. For this report, R-squared is based on returns over the past 36 months for both the fund and the index.
Return on Equity. The annual average rate of return generated by a company during the past five years for each dollar of shareholder’s equity (net income divided by shareholder’s equity). For a fund, the weighted average return on equity for the companies whose stocks it holds.
Short-Term Reserves. The percentage of a fund invested in highly liquid, short-term securities that can be readily converted to cash.
Turnover Rate. An indication of the fund’s trading activity. Funds with high turnover rates incur higher transaction costs and may be more likely to distribute capital gains (which may be taxable to investors). The turnover rate excludes in-kind transactions, which have minimal impact on costs.
29
This page intentionally left blank.
This page intentionally left blank.
The People Who Govern Your Fund
The trustees of your mutual fund are there to see that the fund is operated and managed in your best interests since, as a shareholder, you are a part owner of the fund. Your fund’s trustees also serve on the board of directors of The Vanguard Group, Inc., which is owned by the Vanguard funds and provides services to them on an at-cost basis.
A majority of Vanguard’s board members are independent, meaning that they have no affiliation with Vanguard or the funds they oversee, apart from the sizable personal investments they have made as private individuals. The independent board members have distinguished backgrounds in business, academia, and public service. Each of the trustees and executive officers oversees 162 Vanguard funds.
The following table provides information for each trustee and executive officer of the fund. More information about the trustees is in the Statement of Additional Information, which can be obtained, without charge, by contacting Vanguard at 800-662-7447, or online at www.vanguard.com.
| |
| Interested Trustee1 | Rajiv L. Gupta |
| | Born 1945. Trustee Since December 2001.2 Principal |
| F. William McNabb III | Occupation(s) During the Past Five Years: Chairman |
| Born 1957. Trustee Since July 2009. Chairman of the | and Chief Executive Officer (retired 2009) and |
| Board. Principal Occupation(s) During the Past Five | President (2006–2008) of Rohm and Haas Co. |
| Years: Chairman of the Board of The Vanguard Group, | (chemicals); Board Member of American Chemistry |
| Inc., and of each of the investment companies served | Council; Director of Tyco International, Ltd. (diversified |
| by The Vanguard Group, since January 2010; Director | manufacturing and services) and Hewlett-Packard Co. |
| of The Vanguard Group since 2008; Chief Executive | (electronic computer manufacturing); Trustee of The |
| Officer and President of The Vanguard Group and of | Conference Board. |
| each of the investment companies served by The | |
| Vanguard Group since 2008; Director of Vanguard | Amy Gutmann |
| Marketing Corporation; Managing Director of The | Born 1949. Trustee Since June 2006. Principal |
| Vanguard Group (1995–2008). | Occupation(s) During the Past Five Years: President |
| | of the University of Pennsylvania; Christopher H. |
| | Browne Distinguished Professor of Political Science |
| Independent Trustees | in the School of Arts and Sciences with secondary |
| | appointments at the Annenberg School for Commu- |
| Emerson U. Fullwood | nication and the Graduate School of Education of |
| Born 1948. Trustee Since January 2008. Principal | the University of Pennsylvania; Director of Carnegie |
| Occupation(s) During the Past Five Years: Executive | Corporation of New York, Schuylkill River Development |
| Chief Staff and Marketing Officer for North America | Corporation, and Greater Philadelphia Chamber of |
| and Corporate Vice President (retired 2008) of Xerox | Commerce; Trustee of the National Constitution Center. |
| Corporation (photocopiers and printers); Director of | |
| SPX Corporation (multi-industry manufacturing), the | |
| United Way of Rochester, the Boy Scouts of America, | |
| Amerigroup Corporation (direct health and medical | |
| insurance carriers), and Monroe Community College | |
| Foundation. | |
| | |
| JoAnn Heffernan Heisen | Executive Officers | |
| Born 1950. Trustee Since July 1998. Principal | | |
| Occupation(s) During the Past Five Years: Corporate | Thomas J. Higgins | |
| Vice President and Chief Global Diversity Officer since | Born 1957. Chief Financial Officer Since September |
| 2006 (retired 2008) and Member of the Executive | 2008. Principal Occupation(s) During the Past Five |
| Committee (retired 2008) of Johnson & Johnson | Years: Principal of The Vanguard Group, Inc.; Chief |
| (pharmaceuticals/consumer products); Vice President | Financial Officer of each of the investment companies |
| and Chief Information Officer of Johnson & Johnson | served by The Vanguard Group since 2008; Treasurer |
| (1997–2005); Director of the University Medical Center | of each of the investment companies served by The |
| at Princeton and Women’s Research and Education | Vanguard Group (1998–2008). |
| Institute; Member of the Advisory Board of the | | |
| Maxwell School of Citizenship and Public Affairs | Kathryn J. Hyatt | |
| at Syracuse University. | Born 1955. Treasurer Since November 2008. Principal |
| | Occupation(s) During the Past Five Years: Principal |
| F. Joseph Loughrey | of The Vanguard Group, Inc.; Treasurer of each of |
| Born 1949. Trustee Since October 2009. Principal | the investment companies served by The Vanguard |
| Occupation(s) During the Past Five Years: President | Group since 2008; Assistant Treasurer of each of the |
| and Chief Operating Officer since 2005 (retired 2009) | investment companies served by The Vanguard Group |
| and Vice Chairman of the Board (2008–2009) of | (1988–2008). | |
| Cummins Inc. (industrial machinery); Director of | | |
| SKF AB (industrial machinery), Hillenbrand, Inc. | Heidi Stam | |
| (specialized consumer services), Sauer-Danfoss Inc. | Born 1956. Secretary Since July 2005. Principal |
| (machinery), the Lumina Foundation for Education, | Occupation(s) During the Past Five Years: Managing |
| and the Columbus Community Education Coalition; | Director of The Vanguard Group, Inc., since 2006; |
| Chairman of the Advisory Council for the College of | General Counsel of The Vanguard Group since 2005; |
| Arts and Letters at the University of Notre Dame. | Secretary of The Vanguard Group and of each of the |
| | investment companies served by The Vanguard Group |
| André F. Perold | since 2005; Director and Senior Vice President of |
| Born 1952. Trustee Since December 2004. Principal | Vanguard Marketing Corporation since 2005; |
| Occupation(s) During the Past Five Years: George | Principal of The Vanguard Group (1997–2006). |
| Gund Professor of Finance and Banking, Harvard | | |
| Business School; Chair of the Investment Committee | | |
| of HighVista Strategies LLC (private investment firm). | Vanguard Senior Management Team |
| |
| Alfred M. Rankin, Jr. | R. Gregory Barton | Michael S. Miller |
| Born 1941. Trustee Since January 1993. Principal | Mortimer J. Buckley | James M. Norris |
| Occupation(s) During the Past Five Years: Chairman, | Kathleen C. Gubanich | Glenn W. Reed |
| President, and Chief Executive Officer of NACCO | Paul A. Heller | George U. Sauter |
| Industries, Inc. (forklift trucks/housewares/lignite); | | |
| Director of Goodrich Corporation (industrial products/ | | |
| aircraft systems and services); Deputy Chairman | Chairman Emeritus and Senior Advisor |
| of the Federal Reserve Bank of Cleveland; Trustee | | |
| of University Hospitals of Cleveland, The Cleveland | John J. Brennan | |
| Museum of Art, and Case Western Reserve University. | Chairman, 1996–2009 | |
| | Chief Executive Officer and President, 1996–2008 |
| Peter F. Volanakis | | |
| Born 1955. Trustee Since July 2009. Principal | | |
| Occupation(s) During the Past Five Years: President | Founder | |
| since 2007 and Chief Operating Officer since 2005 | | |
| of Corning Incorporated (communications equipment); | John C. Bogle | |
| President of Corning Technologies (2001–2005); | Chairman and Chief Executive Officer, 1974–1996 |
| Director of Corning Incorporated and Dow Corning; | | |
| Trustee of the Corning Incorporated Foundation and | | |
| the Corning Museum of Glass; Overseer of the | | |
| Amos Tuck School of Business Administration at | | |
| Dartmouth College. | | |
1 Mr. McNabb is considered an “interested person,” as defined in the Investment Company Act of 1940, because he is an officer of the Vanguard funds.
2 December 2002 for Vanguard Equity Income Fund, Vanguard Growth Equity Fund, the Vanguard Municipal Bond Funds, and the Vanguard State Tax-Exempt Funds.
| |
|  |
| P.O. Box 2600 |
| Valley Forge, PA 19482-2600 |
Connect with Vanguard® > www.vanguard.com
| Fund Information > 800-662-7447 | CFA® is a trademark owned by CFA Institute. |
| |
| Direct Investor Account Services > 800-662-2739 | |
| |
| Institutional Investor Services > 800-523-1036 | |
| |
| Text Telephone for People | |
| With Hearing Impairment > 800-749-7273 | |
| |
| This material may be used in conjunction | |
| with the offering of shares of any Vanguard | |
| fund only if preceded or accompanied by | |
| the fund’s current prospectus. | |
| |
| All comparative mutual fund data are from Lipper Inc. or | |
| Morningstar, Inc., unless otherwise noted. | |
| |
| You can obtain a free copy of Vanguard’s proxy voting | |
| guidelines by visiting our website, www.vanguard.com, | |
| and searching for “proxy voting guidelines,” or by calling | |
| Vanguard at 800-662-2739. The guidelines are also | |
| available from the SEC’s website, www.sec.gov. In | |
| addition, you may obtain a free report on how your fund | |
| voted the proxies for securities it owned during the 12 | |
| months ended June 30. To get the report, visit either | |
| www.vanguard.com or www.sec.gov. | |
| |
| You can review and copy information about your fund at | |
| the SEC’s Public Reference Room in Washington, D.C. To | |
| find out more about this public service, call the SEC at | |
| 202-551-8090. Information about your fund is also | |
| available on the SEC’s website, and you can receive | |
| copies of this information, for a fee, by sending a | |
| request in either of two ways: via e-mail addressed to | |
| publicinfo@sec.gov or via regular mail addressed to the | |
| Public Reference Section, Securities and Exchange | |
| Commission, Washington, DC 20549-1520. | |
| © 2010 The Vanguard Group, Inc. |
| All rights reserved. |
| Vanguard Marketing Corporation, Distributor. |
 |
| Q520 032010 |
 |
| Vanguard REIT Index Fund |
| Annual Report |
|
|
| January 31, 2010 |
|
|
 |
|
|
> Vanguard REIT Index Fund returned about 49% for the fiscal year ended January 31, 2010.
> The fund’s return was in line with that of its target index and slightly better than the average return of its peer group.
> REITs made an impressive comeback in recent months, significantly outperforming the broad stock market for the 12-month period.
| |
| Contents | |
| Your Fund’s Total Returns. | 1 |
| Chairman’s Letter. | 2 |
| Fund Profile. | 7 |
| Performance Summary. | 8 |
| Financial Statements. | 11 |
| Your Fund’s After-Tax Returns. | 28 |
| About Your Fund’s Expenses. | 29 |
| Glossary. | 31 |

REIT Index Fund
Please note: The opinions expressed in this report are just that—informed opinions. They should not be considered promises or advice. Also, please keep in mind that the information and opinions cover the period through the date on the front of this report. Of course, the risks of investing in your fund are spelled out in the prospectus.
See the Glossary for definitions of investment terms used in this report.
Cover photograph: Veronica Coia.
| |
| Your Fund’s Total Returns | |
| |
| |
| |
| |
| Fiscal Year Ended January 31, 2010 | |
| | Total |
| | Returns |
| Vanguard REIT Index Fund | |
| Investor Shares | 48.51% |
| Admiral™ Shares | 48.73 |
| Signal® Shares | 48.68 |
| Institutional Shares | 48.90 |
| ETF Shares | |
| Market Price | 47.83 |
| Net Asset Value | 48.74 |
| U.S. REIT Spliced Index | 48.06 |
| Real Estate Funds Average | 47.69 |
U.S. REIT Spliced Index: MSCI US REIT Index adjusted to include a 2% cash position (Lipper Money Market Average) through April 30, 2009; MSCI US REIT Index thereafter.
Real Estate Funds Average: Derived from data provided by Lipper Inc.
Admiral Shares are a lower-cost class of shares available to many longtime shareholders and to those with significant investments in the fund. Signal Shares also carry lower costs and are available to certain institutional shareholders who meet specific administrative, service, and account-size criteria. Institutional Shares also carry lower costs and are available for a minimum investment of $5 million. These Vanguard ETF® Shares are traded on the NYSE Arca exchange and are available only through brokers. The table shows ETF returns based on both the NYSE Arca market price and the net asset value for a share. U.S. Pat. No. 6,879,964 B2; 7,337,138.
| | | | | |
| Your Fund’s Performance at a Glance | | | | | |
| January 31, 2009 , Through January 31, 2010 | | | | |
| | | | Distributions Per Share | |
| | Starting | Ending | Income | Capital | Return of |
| | Share Price | Share Price | Dividends | Gains | Capital |
| Vanguard REIT Index Fund | | | | | |
| Investor Shares | $10.02 | $14.05 | $0.481 | $0.000 | $0.158 |
| Admiral Shares | 42.74 | 59.95 | 2.094 | 0.000 | 0.688 |
| Signal Shares | 11.41 | 16.00 | 0.559 | 0.000 | 0.183 |
| Institutional Shares | 6.61 | 9.28 | 0.326 | 0.000 | 0.107 |
| ETF Shares | 30.14 | 42.30 | 1.478 | 0.000 | 0.486 |
1

Chairman’s Letter
Dear Shareholder,
At the start of the fiscal year, the United States was in the midst of the biggest economic crisis in decades and stock prices had fallen to historic lows. In mid-March, however, the market staged an impressive rally and stock prices began to soar. By January 31, the broad U.S. stock market had rebounded dramatically, returning about 36%.
REITs performed even better than the broad market for the 12-month period, and Vanguard REIT Index Fund posted a total return of about 49%. The fund’s returns were in line with those of its target index.
If you own the fund in a taxable account, you may wish to review information about its after-tax returns provided later in this report.
Remarkable rally loses steam at year-end
The stock market began the fiscal year under severe pressure from the global financial crisis and a stalled U.S. economy. After a dismal showing in February 2009, however, U.S. equities turned the corner in early March and kept surging until the fiscal year’s final weeks, when the major market indexes pulled back a bit. During the nine months, the federal government’s stimulus plan took hold, companies began to repair their balance sheets, and investors increased their appetite for risk—the riskier the better, it seemed.
2
The stock market’s exuberance overshot the pace of economic recovery, which slowly improved as the year progressed. It wasn’t until the third calendar quarter that the recession appeared to be ending, yet double-digit unemployment still weighed on the economy.
International markets traced an even steeper line upward than their U.S. counterpart for most of the fiscal year. They recovered strongly through 2009 and into 2010, before dropping in the latter half of January amid concerns about the strength of the global recovery. The most impressive international returns came from emerging markets, with especially strong results from Brazil and China.
Although the fiscal year’s returns were a welcome relief for stock investors worldwide, the severity of the financial crisis continues to depress the longer-term record, especially for U.S. stocks.
Bond returns traced very different courses
The U.S. government’s programs also soothed parts of the bond market as the fiscal year progressed. At the start of the period, the difference between the yields of corporate bonds and those of U.S. Treasuries had widened almost to levels last seen in the 1930s, an indication of just how unwilling investors were to take on risk. As the threat of a depression receded, however, confidence returned
| | | |
| Market Barometer | | | |
| |
| | | Average Annual Total Returns |
| | | Periods Ended January 31, 2010 |
| | One | Three | Five |
| | Year | Years | Years |
| Stocks | | | |
| Russell 1000 Index (Large-caps) | 34.81% | -7.10% | 0.57% |
| Russell 2000 Index (Small-caps) | 37.82 | -7.74 | 0.61 |
| Dow Jones U.S. Total Stock Market Index | 36.06 | -6.72 | 0.94 |
| MSCI All Country World Index ex USA (International) | 48.28 | -4.76 | 5.61 |
| |
| Bonds | | | |
| Barclays Capital U.S. Aggregate Bond Index (Broad | | | |
| taxable market) | 8.51% | 6.60% | 5.16% |
| Barclays Capital Municipal Bond Index | 9.49 | 4.68 | 4.23 |
| Citigroup Three-Month U.S. Treasury Bill Index | 0.15 | 2.07 | 2.84 |
| |
| CPI | | | |
| Consumer Price Index | 2.63% | 2.30% | 2.59% |
3
and investors flocked to the lowest-quality, highest-yielding bonds, passing over conservative Treasuries, the previous year’s favorite.
For the 12 months ended January 31, the broad taxable bond market returned 8.51%, municipal bonds returned about 9%, and high-yield corporate bonds delivered a stunning 51%. Meanwhile, Treasury returns were negative to lackluster, depending on their maturity.
While the Federal Reserve’s monetary policies seemed to help the stock market and most areas of the bond market, the policies exacted a heavy price from money market investors. The Fed kept the federal funds rate––the interest rate that banks charge one another for overnight lending, a benchmark for the market’s short-term rates––between 0% and 0.25% during the entire fiscal year.
Although the Fed said it planned to maintain those rates for an “extended period,” it recently indicated that it was ready to wind down emergency measures and would halt its purchase of agency mortgage-backed securities and debt in the coming months.
Beaten down since 2007, REIT stocks rebounded sharply
When the subprime mortgage crisis started unfolding in the latter half of 2007, REITs were among the hardest-hit stocks. This trend continued in 2008, when real
| | | | | | |
| Expense Ratios | | | | | | |
| Your Fund Compared With Its Peer Group | | | | | | |
| | | | | | | Peer |
| | Investor | Admiral | Signal | Institutional | ETF | Group |
| | Shares | Shares | Shares | Shares | Shares | Average |
| REIT Index Fund | 0.26% | 0.15% | 0.15% | 0.10% | 0.15% | 1.43% |
The fund expense ratios shown are from the prospectuses dated May 29, 2009, and represent estimated costs for the current fiscal year based on the fund’s net assets as of the prospectus date. For the fiscal year ended January 31, 2010, the fund’s expense ratios were 0.26% for Investor Shares, 0.13% for Admiral Shares, 0.14% for Signal Shares, 0.09% for Institutional Shares, and 0.13% for ETF Shares. The peer-group expense ratio is derived from data provided by Lipper Inc. and captures information through year-end 2009.
Peer group: Real Estate Funds.
4
estate investment trusts experienced one of their worst years on record. However, when the stock market began to soar last March, REIT stocks rose right along with it. By the end of the fiscal year, REITs had staged a significant comeback.
All areas of the REIT market turned in positive results for the fiscal year, a stark contrast to the fiscal year ended January 2009, when almost all REITs posted declines. The biggest contributors to performance included specialized REITs and retail REITs, which together accounted for more than 50% of the fund’s holdings, on average, during the period.
Specialized REITs, which include hotels and hospitality properties, benefited as consumers began traveling again. On the same note, retail REITs—among the worst sufferers during the financial crisis—received a boost as consumer spending slowly resumed.
Solid long-term results despite the recent volatility
Over the past decade, the REIT Index Fund’s Investor Shares have returned an impressive 9.74% per year, although the path to that result has hardly been smooth, punctuated by unnerving declines and outsized gains. The fund has captured
| |
| Total Returns | |
| Ten Years Ended January 31, 2010 | |
| | Average |
| | Annual Return |
| REIT Index Fund Investor Shares | 9.74% |
| U.S. REIT Spliced Index | 9.75 |
| Real Estate Funds Average | 9.05 |
U.S. REIT Spliced Index: MSCI US REIT Index adjusted to include a 2% cash position (Lipper Money Market Average) through April 30, 2009; MSCI US REIT Index thereafter.
Real Estate Funds Average: Derived from data provided by Lipper Inc.
The figures shown represent past performance, which is not a guarantee of future results. (Current performance may be lower or higher than the performance data cited. For performance data current to the most recent month-end, visit our website at www.vanguard.com/performance.) Note, too, that both investment returns and principal value can fluctuate widely, so an investor’s shares, when sold, could be worth more or less than their original cost.
5
the ups, downs, and ultimately strong long-term returns of the REIT market by closely tracking its benchmark index through real estate booms and busts.
That close tracking is a credit to the portfolio’s advisor, Vanguard Quantitative Equity Group, which has more than 25 years of indexing experience. These long-tenured professionals have developed sophisticated portfolio construction and trading methodologies to help Vanguard deliver excellent index fund management in a variety of marketplaces and market environments. The group’s efforts are made easier by the fund’s low operating expenses.
REITs can help diversify a well-balanced portfolio
Although the stock market rallied strongly throughout most of the period covered in this report, volatility returned in the fiscal year’s final weeks. In the short term, it’s uncertain whether the market will resume its healthy recovery or more drama will ensue.
While we can’t control the markets or the economy, we can control how we react to the inevitable volatility and incessant “noise” that accompany investing. At Vanguard, we advocate a balanced approach that includes holding stock, bond, and money market funds in proportions adapted to your goals and unique financial circumstances.
The REIT Index Fund boasts extremely low costs and invests in a broad range of REITs. For these reasons, we believe that a modest allocation to the portfolio can provide diversification to a well-balanced investment program, as long as investors understand the sharp ups and downs that may come with investing in a particular market sector.
On another matter, I would like to inform you that as of January 1, 2010, we completed a leadership transition that began in March 2008. I succeeded Jack Brennan as chairman of Vanguard and each of its funds. Jack has agreed to serve as chairman emeritus and senior advisor.
Under Jack’s leadership, Vanguard has grown to become a preeminent firm in the mutual fund industry. Jack’s energy, his relentless pursuit of perfection, and his unwavering focus on always doing the right thing for our clients are evident in every facet of Vanguard policy today.
As always, thank you for entrusting your assets to Vanguard.
Sincerely,

F. William McNabb III
Chairman and Chief Executive Officer
February 12, 2010
6
REIT Index Fund
Fund Profile
As of January 31, 2010
| | | | | |
| Share-Class Characteristics | | | | | |
| | Investor | Admiral | Signal | Institutional | ETF |
| | Shares | Shares | Shares | Shares | Shares |
| Ticker Symbol | VGSIX | VGSLX | VGRSX | VGSNX | VNQ |
| Expense Ratio1 | 0.26% | 0.15% | 0.15% | 0.10% | 0.15% |
| | | |
| Portfolio Characteristics | | |
| | | | DJ |
| | | | U.S. Total |
| | | MSCI US | Market |
| | Fund | REIT Index | Index |
| Number of Stocks | 98 | 97 | 4,185 |
| Median Market Cap | $3.8B | $3.8B | $29.6B |
| Price/Earnings Ratio | 339.1x | 343.6x | 26.4x |
| Price/Book Ratio | 1.6x | 1.6x | 2.1x |
| Return on Equity | 8.0% | 8.0% | 19.2% |
| Earnings Growth Rate | -6.5% | -6.5% | 7.7% |
| Dividend Yield | 4.5% | 4.5% | 1.9% |
| Turnover Rate | 16% | — | — |
| Short-Term Reserves | 0.5% | — | — |
| | |
| Subindustry Diversification (% of equity exposure) |
| | | MSCI US |
| | Fund | REIT Index |
| Diversified REITs | 8.8% | 8.9% |
| Industrial REITs | 5.9 | 5.9 |
| Office REITs | 17.5 | 17.5 |
| Residential REITs | 15.3 | 15.3 |
| Retail REITs | 24.9 | 24.9 |
| Specialized REITs | 27.6 | 27.5 |
| | |
| Volatility Measures | | |
| | U.S. | DJ |
| | REIT | U.S. Total |
| | Spliced | Market |
| | Index | Index |
| R-Squared | 1.00 | 0.69 |
| Beta | 1.00 | 1.61 |
These measures show the degree and timing of the fund’s fluctuations compared with the indexes over 36 months.
U.S. REIT Spliced Index: MSCI US REIT Index adjusted to include a 2% cash position (Lipper Money Market Average) through April 30, 2009; MSCI US REIT Index thereafter.
| | |
| Ten Largest Holdings (% of total net assets) |
| Simon Property Group | Retail REITs | |
| Inc. | | 9.6% |
| Vornado Realty Trust | Diversified REITs | 4.9 |
| Public Storage | Specialized REITs | 4.7 |
| Boston Properties Inc. | Office REITs | 4.2 |
| Equity Residential | Residential REITs | 4.1 |
| HCP Inc. | Specialized REITs | 3.9 |
| Ventas Inc. | Specialized REITs | 3.1 |
| Host Hotels & Resorts | Specialized REITs | |
| Inc. | | 3.1 |
| AvalonBay Communities | Residential REITs | |
| Inc. | | 2.9 |
| ProLogis | Industrial REITs | 2.6 |
| Top Ten | | 43.1% |
| The holdings listed exclude any temporary cash investments and |
| equity index products. | | |
1 The expense ratios shown are from the prospectuses dated May 29, 2009, and represent estimated costs for the current fiscal year based on the fund’s net assets as of the prospectus date. For the fiscal year ended January 31, 2010, the fund’s expense ratios were 0.26% for Investor Shares, 0.13% for Admiral Shares, 0.14% for Signal Shares, 0.09% for Institutional Shares, and 0.13% for ETF Shares.
7
Performance Summary
All of the returns in this report represent past performance, which is not a guarantee of future results that may be achieved by the fund. (Current performance may be lower or higher than the performance data cited. For performance data current to the most recent month-end, visit our website at www.vanguard.com/performance.) Note, too, that both investment returns and principal value can fluctuate widely, so an investor’s shares, when sold, could be worth more or less than their original cost. The returns shown do not reflect taxes that a shareholder would pay on fund distributions or on the sale of fund shares.
Cumulative Performance: January 31, 2000, Through January 31, 2010
Initial Investment of $10,000
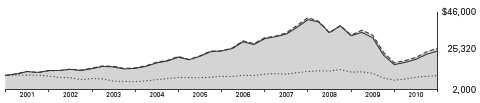
| | | | |
| | Average Annual Total Returns | |
| | Periods Ended January 31, 2010 | |
| | | | | Final Value |
| | One | Five | Ten | of a $10,000 |
| | Year | Years | Years | Investment |
| REIT Index Fund Investor Shares | 48.51% | 1.27% | 9.74% | $25,320 |
| Dow Jones U.S. Total Stock Market | | | | |
| Index | 36.06 | 0.94 | -0.09 | 9,907 |
| U.S. REIT Spliced Index | 48.06 | 1.21 | 9.75 | 25,348 |
| Real Estate Funds Average | 47.69 | -0.12 | 9.05 | 23,786 |
U.S. REIT Spliced Index: MSCI US REIT Index adjusted to include a 2% cash position (Lipper Money Market Average) through April 30, 2009; MSCI US REIT Index thereafter.
Real Estate Funds Average: Derived from data provided by Lipper Inc.
| | | | |
| | | | Since | Final Value |
| | One | Five | Inception | of a $100,000 |
| | Year | Years | (11/12/2001) | Investment |
| REIT Index Fund Admiral Shares | 48.73% | 1.36% | 8.22% | $191,416 |
| Dow Jones U.S. Total Stock Market | | | | |
| Index | 36.06 | 0.94 | 2.73 | 124,821 |
| U.S. REIT Spliced Index | 48.06 | 1.21 | 8.12 | 190,032 |
| Performance for the fund’s Admiral Shares and comparative standards is calculated since the Admiral Shares’ inception. | |
Vanguard fund total returns do not include any transaction or account fees that applied in the periods shown. Fund prospectuses provide information about current fees.
See Financial Highlights for dividend and capital gains information.
8
REIT Index Fund
| | | | |
| | | | Since | Final Value |
| | One | | Inception | of a $1,000,000 |
| | Year | | (6/4/2007) | Investment |
| REIT Index Fund Signal Shares | 48.68% | | -16.26% | $623,705 |
| Dow Jones U.S. Total Stock Market | | | | |
| Index | 36.06 | | -10.12 | 752,999 |
| U.S. REIT Spliced Index | 48.06 | | -16.49 | 619,131 |
| Performance for the fund’s Signal Shares and comparative standards is calculated since the Signal Shares’ inception. | |
| |
| | | | Since | Final Value |
| | One | Five | Inception | of a $5,000,000 |
| | Year | Years | (12/2/2003) | Investment |
| REIT Index Fund Institutional | | | | |
| Shares | 48.90% | 1.39% | 4.48% | $6,551,375 |
| Dow Jones U.S. Total Stock Market | | | | |
| Index | 36.06 | 0.94 | 2.87 | 5,951,090 |
| U.S. REIT Spliced Index | 48.06 | 1.21 | 4.32 | 6,488,636 |
| Performance for the fund’s Institutional Shares and comparative standards is calculated since the Institutional Shares’ inception. |
| |
| | | | Since | Final Value |
| | One | Five | Inception | of a $10,000 |
| | Year | Years | (9/23/2004) | Investment |
| REIT Index Fund | | | | |
| ETF Shares Net Asset Value | 48.74% | 1.37% | 2.59% | $11,469 |
| Dow Jones U.S. Total Stock Market Index | 36.06 | 0.94 | 2.37 | 11,338 |
| U.S. REIT Spliced Index | 48.06 | 1.21 | 2.44 | 11,378 |
| Performance for the fund’s ETF Shares and comparative standards is calculated since the ETF Shares’ inception. | |
For more information about how the ETF Shares' market prices have compared with their net asset value, visit www.vanguard.com, select your ETF, and then select the Performance tab. The Premium/Discount table there shows the percentages of days on which the ETF Shares' market price was above or below the NAV.
| | | |
| Cumulative Returns of ETF Shares: September 23, 2004, Through January 31, 2010 | |
| | | | Since |
| | One | Five | Inception |
| | Year | Years | (9/23/2004) |
| REIT Index Fund | | | |
| ETF Shares Market Price | 47.83% | 6.96% | 14.60% |
| REIT Index Fund | | | |
| ETF Shares Net Asset Value | 48.74 | 7.06 | 14.69 |
| U.S. REIT Spliced Index | 48.06 | 6.18 | 13.78 |
| Performance for the fund’s ETF Shares and comparative standards is calculated since the ETF Shares’ inception. | |
Vanguard fund total returns do not include any transaction or account fees that applied in the periods shown. Fund prospectuses provide information about current fees.
9
REIT Index Fund
Fiscal-Year Total Returns (%): January 31, 2000, Through January 31, 2010
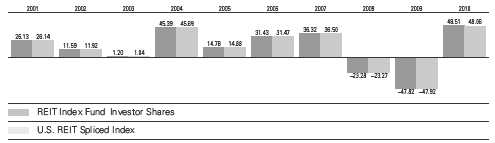
Average Annual Total Returns: Periods Ended December 31, 2009
This table presents average annual total returns through the latest calendar quarter—rather than through the end of the fiscal period. Securities and Exchange Commission rules require that we provide this information.
| | | | |
| | Inception | One | Five | Ten |
| | Date | Year | Years | Years |
| Investor Shares | 5/13/1996 | 29.58% | 0.59% | 10.40% |
| Admiral Shares | 11/12/2001 | 29.76 | 0.69 | 9.041 |
| Signal Shares | 6/4/2007 | 29.82 | — | -14.941 |
| Institutional Shares | 12/2/2003 | 29.76 | 0.71 | 5.491 |
| ETF Shares | 9/23/2004 | | | |
| Market Price | | 30.17 | 0.72 | 3.731 |
| Net Asset Value | | 29.74 | 0.69 | 3.711 |
| 1 Return since inception. | | | | |
Vanguard fund total returns do not include any transaction or account fees that applied in the periods shown. Fund prospectuses provide information about current fees.
10
REIT Index Fund
Financial Statements
Statement of Net Assets
As of January 31, 2010
The fund reports a complete list of its holdings in regulatory filings four times in each fiscal year, at the quarter-ends. For the second and fourth fiscal quarters, the lists appear in the fund’s semiannual and annual reports to shareholders. For the first and third fiscal quarters, the fund files the lists with the Securities and Exchange Commission on Form N-Q. Shareholders can look up the fund’s Forms N-Q on the SEC’s website at www.sec.gov. Forms N-Q may also be reviewed and copied at the SEC’s Public Reference Room (see the back cover of this report for further information).
| | | |
| | | | Market |
| | | | Value• |
| | | Shares | ($000) |
| Real Estate Investment Trusts (99.3%)1 | |
| Diversified REITs (8.8%) | | |
| | Vornado Realty Trust | 8,293,335 | 536,413 |
| 2 | Liberty Property Trust | 5,710,927 | 173,612 |
| | Washington Real Estate | | |
| | Investment Trust | 2,979,487 | 78,033 |
| | PS Business Parks Inc. | 977,266 | 46,791 |
| | Colonial Properties Trust | 3,144,666 | 34,623 |
| | Cousins Properties Inc. | 4,317,527 | 33,072 |
| | Investors Real Estate Trust | 3,672,008 | 32,057 |
| | CapLease Inc. | 2,525,377 | 11,591 |
| | Winthrop Realty Trust | 688,347 | 8,570 |
| * | Gramercy Capital Corp. | 2,162,777 | 7,051 |
| | | | 961,813 |
| Industrial REITs (5.8%) | | |
| | ProLogis | 22,648,695 | 285,374 |
| 2 | AMB Property Corp. | 7,480,521 | 179,533 |
| 2 | DCT Industrial Trust Inc. | 10,451,501 | 51,735 |
| 2 | EastGroup Properties Inc. | 1,327,942 | 50,807 |
| 2 | DuPont Fabros | | |
| | Technology Inc. | 2,134,470 | 35,475 |
| | First Potomac Realty Trust | 1,463,835 | 19,908 |
| * | First Industrial | | |
| | Realty Trust Inc. | 2,842,481 | 14,553 |
| | | | 637,385 |
| Office REITs (17.4%) | | |
| 2 | Boston Properties Inc. | 7,088,440 | 459,827 |
| 2 | SL Green Realty Corp. | 3,930,039 | 178,778 |
| | Digital Realty Trust Inc. | 3,699,999 | 177,600 |
| 2 | Alexandria Real Estate | | |
| | Equities Inc. | 2,221,500 | 132,690 |
| 2 | Mack-Cali Realty Corp. | 4,006,916 | 130,706 |
| 2 | Duke Realty Corp. | 11,455,859 | 129,680 |
| 2 | Highwoods Properties Inc. | 3,624,533 | 109,497 |
| 2 | Corporate Office | | |
| | Properties Trust SBI | 2,967,533 | 105,911 |
| 2 | HRPT Properties Trust | 11,442,633 | 76,322 |
| 2 | Brandywine Realty Trust | 6,576,917 | 73,859 |
| 2 | BioMed Realty Trust Inc. | 5,018,662 | 73,122 |
| | | |
| | | | Market |
| | | | Value• |
| | | Shares | ($000) |
| | Douglas Emmett Inc. | 4,971,136 | 68,751 |
| 2 | Kilroy Realty Corp. | 2,207,138 | 63,764 |
| | Franklin Street | | |
| | Properties Corp. | 3,612,920 | 45,378 |
| | Lexington Realty Trust | 4,797,667 | 28,546 |
| | Government Properties | | |
| | Income Trust | 1,109,324 | 25,747 |
| 2 | Parkway Properties Inc. | 1,105,497 | 23,028 |
| | | | 1,903,206 |
| Residential REITs (15.1%) | | |
| 2 | Equity Residential | 14,013,673 | 449,138 |
| 2 | AvalonBay | | |
| | Communities Inc. | 4,088,662 | 313,232 |
| 2 | Camden Property Trust | 3,279,851 | 127,160 |
| 2 | UDR Inc. | 7,700,898 | 119,826 |
| | Essex Property Trust Inc. | 1,442,190 | 114,928 |
| 2 | Apartment Investment & | | |
| | Management Co. | 5,986,768 | 91,957 |
| | BRE Properties Inc. | 2,701,838 | 86,648 |
| 2 | Home Properties Inc. | 1,690,210 | 74,927 |
| | Equity Lifestyle | | |
| | Properties Inc. | 1,473,115 | 71,181 |
| 2 | American Campus | | |
| | Communities Inc. | 2,669,553 | 68,501 |
| 2 | Mid-America Apartment | | |
| | Communities Inc. | 1,443,718 | 67,739 |
| 2 | Post Properties Inc. | 2,449,220 | 43,719 |
| | Sun Communities Inc. | 904,308 | 16,377 |
| | Education Realty Trust Inc. | 2,712,278 | 14,321 |
| | | | 1,659,654 |
| Retail REITs (24.7%) | | |
| 2 | Simon Property | | |
| | Group Inc. | 14,575,632 | 1,049,446 |
| 2 | Kimco Realty Corp. | 20,549,175 | 259,331 |
| 2 | Federal Realty | | |
| | Investment Trust | 3,115,784 | 200,594 |
| 2 | Regency Centers Corp. | 4,517,371 | 151,287 |
| 2 | Macerich Co. | 4,835,097 | 149,163 |
| ^,2 | Realty Income Corp. | 5,333,970 | 148,978 |
11
| | | |
| REIT Index Fund | | |
| |
| |
| |
| | | | Market |
| | | | Value• |
| | | Shares | ($000) |
| | Weingarten | | |
| | Realty Investors | 5,820,823 | 108,675 |
| 2 | Taubman Centers Inc. | 2,717,202 | 86,027 |
| 2 | National Retail | | |
| | Properties Inc. | 4,128,622 | 83,398 |
| 2 | Tanger Factory | | |
| | Outlet Centers | 2,036,510 | 77,998 |
| | CBL & Associates | | |
| | Properties Inc. | 6,699,006 | 66,990 |
| | Developers Diversified | | |
| | Realty Corp. | 7,015,089 | 57,874 |
| ^ | Equity One Inc. | 2,207,872 | 36,982 |
| | Inland Real Estate Corp. | 3,880,591 | 32,752 |
| | Acadia Realty Trust | 1,928,163 | 30,716 |
| * | Alexander’s Inc. | 104,454 | 30,531 |
| | Saul Centers Inc. | 686,606 | 24,471 |
| | Getty Realty Corp. | 949,180 | 20,474 |
| ^ | Pennsylvania Real Estate | | |
| | Investment Trust | 2,102,935 | 18,842 |
| | Cedar Shopping | | |
| | Centers Inc. | 2,302,978 | 16,075 |
| | Ramco-Gershenson | | |
| | Properties Trust | 1,492,479 | 14,208 |
| | Urstadt Biddle | | |
| | Properties Inc. Class A | 816,103 | 12,233 |
| 2 | Kite Realty Group Trust | 3,220,974 | 12,207 |
| | Glimcher Realty Trust | 3,307,235 | 10,649 |
| | Urstadt Biddle | | |
| | Properties Inc. | 69,255 | 973 |
| | | | 2,700,874 |
| Specialized REITs (27.5%) | | |
| | Public Storage | 6,502,900 | 514,900 |
| 2 | HCP Inc. | 14,872,812 | 421,644 |
| 2 | Ventas Inc. | 8,006,814 | 337,888 |
| 2 | Host Hotels & | | |
| | Resorts Inc. | 31,771,770 | 336,781 |
| | Health Care REIT Inc. | 6,126,593 | 263,443 |
| | Nationwide Health | | |
| | Properties Inc. | 5,489,324 | 180,928 |
| 2 | Hospitality | | |
| | Properties Trust | 6,246,769 | 138,178 |
| 2 | Senior Housing | | |
| | Properties Trust | 6,494,186 | 135,404 |
| 2 | Omega Healthcare | | |
| | Investors Inc. | 4,259,002 | 79,686 |
| 2 | Entertainment | | |
| | Properties Trust | 2,149,145 | 75,027 |
| 2 | LaSalle Hotel Properties | 3,250,852 | 65,505 |
| 2 | Healthcare Realty | | |
| | Trust Inc. | 3,036,121 | 63,667 |
| | Extra Space Storage Inc. | 4,200,328 | 47,674 |
| 2 | Sovran Self Storage Inc. | 1,379,390 | 46,761 |
| | DiamondRock | | |
| | Hospitality Co. | 5,681,987 | 46,251 |
| | | |
| | | | Market |
| | | | Value• |
| | | Shares | ($000) |
| * | Sunstone Hotel | | |
| | Investors Inc. | 4,867,576 | 41,812 |
| 2 | Medical Properties | | |
| | Trust Inc. | 4,100,520 | 41,046 |
| | National Health | | |
| | Investors Inc. | 1,199,582 | 40,810 |
| | U-Store-It Trust | 4,081,363 | 28,243 |
| | LTC Properties Inc. | 1,066,967 | 27,080 |
| | Universal Health | | |
| | Realty Income Trust | 577,570 | 19,175 |
| | Hersha Hospitality Trust | 4,628,584 | 16,848 |
| * | Ashford Hospitality | | |
| | Trust Inc. | 2,948,791 | 15,540 |
| *,2 | FelCor Lodging Trust Inc. | 3,305,252 | 12,494 |
| *,2 | Strategic Hotels & | | |
| | Resorts Inc. | 3,836,001 | 8,823 |
| | | | 3,005,608 |
| Total Real Estate Investment Trusts | |
| (Cost $12,713,528) | | 10,868,540 |
| Temporary Cash Investment (1.0%)1 | |
| Money Market Fund (1.0%) | | |
| 3,4 | Vanguard Market | | |
| | Liquidity Fund, 0.175% | | |
| | (Cost $104,584) | 104,584,404 | 104,584 |
| Total Investments (100.3%) | | |
| (Cost $12,818,112) | | 10,973,124 |
| Other Assets and Liabilities (-0.3%) | |
| Other Assets | | 59,345 |
| Liabilities4 | | (90,686) |
| | | | (31,341) |
| Net Assets (100%) | | 10,941,783 |
| |
| |
| Statement of Assets and Liabilities | |
| Assets | | |
| Investments in Securities, at Value | 10,973,124 |
| Receivables for Capital Shares Issued | 19,675 |
| Other Assets | | 39,670 |
| Total Assets | | 11,032,469 |
| Liabilities | | |
| Security Lending Collateral | | |
| Payable to Brokers | | 36,668 |
| Payables for Investment | | |
| Securities Purchased | | 31,809 |
| Other Liabilities | | 22,209 |
| Total Liabilities | | 90,686 |
| Net Assets | | 10,941,783 |
12
REIT Index Fund
| |
| At January 31, 2010, net assets consisted of: |
| | Amount |
| | ($000) |
| Paid-in Capital | 13,173,136 |
| Overdistributed Net Investment Income | (7,474) |
| Accumulated Net Realized Losses | (396,594) |
| Unrealized Appreciation (Depreciation) | |
| Investment Securities | (1,844,988) |
| Swap Contracts | 17,703 |
| Net Assets | 10,941,783 |
| |
| Investor Shares—Net Assets | |
| Applicable to 254,256,984 outstanding | |
| $.001 par value shares of beneficial | |
| interest (unlimited authorization) | 3,571,947 |
| Net Asset Value Per Share— | |
| Investor Shares | $14.05 |
| |
| Admiral Shares—Net Assets | |
| Applicable to 21,624,343 outstanding | |
| $.001 par value shares of beneficial | |
| interest (unlimited authorization) | 1,296,421 |
| Net Asset Value Per Share— | |
| Admiral Shares | $59.95 |
| |
| | Amount |
| | ($000) |
| Signal Shares—Net Assets | |
| Applicable to 30,536,551 outstanding | |
| $.001 par value shares of beneficial | |
| interest (unlimited authorization) | 488,726 |
| Net Asset Value Per Share— | |
| Signal Shares | $16.00 |
| |
| Institutional Shares—Net Assets | |
| Applicable to 97,682,368 outstanding | |
| $.001 par value shares of beneficial | |
| interest (unlimited authorization) | 906,507 |
| Net Asset Value Per Share— | |
| Institutional Shares | $9.28 |
| |
| ETF Shares—Net Assets | |
| Applicable to 110,599,728 outstanding | |
| $.001 par value shares of beneficial | |
| interest (unlimited authorization) | 4,678,182 |
| Net Asset Value Per Share— | |
| ETF Shares | $42.30 |
• See Note A in Notes to Financial Statements.
* Non-income-producing security.
^ Part of security position is on loan to broker-dealers. The total value of securities on loan is $35,053,000.
1 The fund invests a portion of its assets in Real Estate Investment Trusts through the use of swap contracts. After giving effect to swap investments, the fund’s effective Real Estate Investment Trust and temporary cash investment positions represent 99.8% and 0.5%, respect ively, of net assets.
2 Considered an affiliated company of the fund as the fund owns more than 5% of the outstanding voting securities of such company.
3 Affiliated money market fund available only to Vanguard funds and certain trusts and accounts managed by Vanguard. Rate shown is the 7-day yield.
4 Includes $36,668,000 of collateral received for securities on loan.
REIT—Real Estate Investment Trust.
See accompanying Notes, which are an integral part of the Financial Statements.
13
| |
| REIT Index Fund | |
| |
| |
| Statement of Operations | |
| |
| |
| | Year Ended |
| | January 31, 2010 |
| | ($000) |
| Investment Income | |
| Income | |
| Dividends1 | 329,674 |
| Interest1 | 251 |
| Security Lending | 2,676 |
| Total Income | 332,601 |
| Expenses | |
| The Vanguard Group—Note B | |
| Investment Advisory Services | 337 |
| Management and Administrative—Investor Shares | 6,163 |
| Management and Administrative—Admiral Shares | 1,130 |
| Management and Administrative—Signal Shares | 405 |
| Management and Administrative—Institutional Shares | 337 |
| Management and Administrative—ETF Shares | 2,602 |
| Marketing and Distribution—Investor Shares | 685 |
| Marketing and Distribution—Admiral Shares | 203 |
| Marketing and Distribution—Signal Shares | 127 |
| Marketing and Distribution—Institutional Shares | 201 |
| Marketing and Distribution—ETF Shares | 737 |
| Custodian Fees | 101 |
| Auditing Fees | 28 |
| Shareholders’ Reports and Proxies—Investor Shares | 462 |
| Shareholders’ Reports and Proxies—Admiral Shares | 18 |
| Shareholders’ Reports and Proxies—Signal Shares | 9 |
| Shareholders’ Reports and Proxies—Institutional Shares | 24 |
| Shareholders’ Reports and Proxies—ETF Shares | 300 |
| Trustees’ Fees and Expenses | 18 |
| Total Expenses | 13,887 |
| Net Investment Income | 318,714 |
| Realized Net Gain (Loss) | |
| Capital Gain Distributions Received | 54,496 |
| Investment Securities Sold | (333,839) |
| Realized Net Gain (Loss)1 | (279,343) |
| Change in Unrealized Appreciation (Depreciation) | |
| Investment Securities | 3,064,695 |
| Swap Contracts | 17,703 |
| Change in Unrealized Appreciation (Depreciation) | 3,082,398 |
| Net Increase (Decrease) in Net Assets Resulting from Operations | 3,121,769 |
1 Dividend income, interest income, and realized net gain (loss) from affiliated companies of the fund were $220,468,000, $245,000, and ($36,486,000), respectively.
See accompanying Notes, which are an integral part of the Financial Statements.
14
| | |
| REIT Index Fund | | |
| |
| |
| Statement of Changes in Net Assets | | |
| |
| | Year Ended January 31, |
| | 2010 | 2009 |
| | ($000) | ($000) |
| Increase (Decrease) in Net Assets | | |
| Operations | | |
| Net Investment Income | 318,714 | 299,591 |
| Realized Net Gain (Loss) | (279,343) | 844,806 |
| Change in Unrealized Appreciation (Depreciation) | 3,082,398 | (6,024,890) |
| Net Increase (Decrease) in Net Assets Resulting from Operations | 3,121,769 | (4,880,493) |
| Distributions | | |
| Net Investment Income | | |
| Investor Shares | (116,521) | (122,164) |
| Admiral Shares | (43,685) | (50,605) |
| Signal Shares | (17,371) | (18,431) |
| Institutional Shares | (28,920) | (25,391) |
| ETF Shares | (115,870) | (73,889) |
| Realized Capital Gain | | |
| Investor Shares | — | (26,879) |
| Admiral Shares | — | (10,877) |
| Signal Shares | — | (3,962) |
| Institutional Shares | — | (5,438) |
| ETF Shares | — | (15,867) |
| Return of Capital | | |
| Investor Shares | (38,280) | (60,479) |
| Admiral Shares | (14,352) | (24,948) |
| Signal Shares | (5,707) | (9,087) |
| Institutional Shares | (9,501) | (12,510) |
| ETF Shares | (38,066) | (36,421) |
| Total Distributions | (428,273) | (496,948) |
| Capital Share Transactions | | |
| Investor Shares | 297,943 | 525,377 |
| Admiral Shares | 64,315 | 96,330 |
| Signal Shares | (9,662) | 160,016 |
| Institutional Shares | 151,229 | 258,367 |
| ETF Shares | 2,329,044 | 659,295 |
| Net Increase (Decrease) from Capital Share Transactions | 2,832,869 | 1,699,385 |
| Total Increase (Decrease) | 5,526,365 | (3,678,056) |
| Net Assets | | |
| Beginning of Period | 5,415,418 | 9,093,474 |
| End of Period1 | 10,941,783 | 5,415,418 |
1 Net Assets—End of Period includes undistributed (overdistributed) net investment income of ($7,474,000) and ($3,821,000).
See accompanying Notes, which are an integral part of the Financial Statements.
15
| | | | | |
| REIT Index Fund | | | | | |
| |
| |
| Financial Highlights | | | | | |
| |
| |
| Investor Shares | | | | | |
| |
| For a Share Outstanding | | | Year Ended January 31, |
| Throughout Each Period | 2010 | 2009 | 2008 | 2007 | 2006 |
| Net Asset Value, Beginning of Period | $10.02 | $20.38 | $27.76 | $21.29 | $17.20 |
| Investment Operations | | | | | |
| Net Investment Income | .477 | .593 | .615 | .530 | .562 |
| Net Realized and Unrealized Gain (Loss) | | | | | |
| on Investments1 | 4.192 | (9.975) | (6.985) | 7.000 | 4.692 |
| Total from Investment Operations | 4.669 | (9.382) | (6.370) | 7.530 | 5.254 |
| Distributions | | | | | |
| Dividends from Net Investment Income | (.481) | (.571) | (.622) | (.534) | (.568) |
| Distributions from Realized Capital Gains | — | (.125) | (.199) | (.413) | (.530) |
| Return of Capital | (.158) | (.282) | (.189) | (.113) | (.066) |
| Total Distributions | (.639) | (.978) | (1.010) | (1.060) | (1.164) |
| Net Asset Value, End of Period | $14.05 | $10.02 | $20.38 | $27.76 | $21.29 |
| |
| Total Return2 | 48.51% | -47.82% | -23.28% | 36.32% | 31.43% |
| |
| Ratios/Supplemental Data | | | | | |
| Net Assets, End of Period (Millions) | $3,572 | $2,274 | $4,046 | $6,827 | $4,727 |
| Ratio of Total Expenses to | | | | | |
| Average Net Assets | 0.26% | 0.21% | 0.20% | 0.21% | 0.21% |
| Ratio of Net Investment Income to | | | | | |
| Average Net Assets | 3.94% | 3.36% | 2.52% | 2.27% | 2.91% |
| Portfolio Turnover Rate3 | 16% | 10% | 13% | 11% | 17% |
| 1 | Includes increases from redemption fees of $0.00, $0.00, $0.02, $0.00, and $0.01. |
| 2 | Total returns do not reflect the 1% fee assessed on redemptions of shares held for less than one year, nor do they include the account service fee that may be applicable to certain accounts with balances below $10,000. |
| 3 | Excludes the value of portfolio securities received or delivered as a result of in-kind purchases or redemptions of the fund’s capital shares, including ETF Creation Units. |
See accompanying Notes, which are an integral part of the Financial Statements.
16
| | | | | |
| REIT Index Fund | | | | | |
| |
| |
| Financial Highlights | | | | | |
| |
| |
| Admiral Shares | | | | | |
| |
| For a Share Outstanding | | | Year Ended January 31, |
| Throughout Each Period | 2010 | 2009 | 2008 | 2007 | 2006 |
| Net Asset Value, Beginning of Period | $42.74 | $86.94 | $118.46 | $90.82 | $73.40 |
| Investment Operations | | | | | |
| Net Investment Income | 2.083 | 2.581 | 2.707 | 2.328 | 2.460 |
| Net Realized and Unrealized Gain (Loss) | | | | | |
| on Investments1 | 17.909 | (42.527) | (29.817) | 29.903 | 19.993 |
| Total from Investment Operations | 19.992 | (39.946) | (27.110) | 32.231 | 22.453 |
| Distributions | | | | | |
| Dividends from Net Investment Income | (2.094) | (2.491) | (2.735) | (2.341) | (2.488) |
| Distributions from Realized Capital Gains | — | (.535) | (.849) | (1.761) | (2.258) |
| Return of Capital | (.688) | (1.228) | (.826) | (.489) | (.287) |
| Total Distributions | (2.782) | (4.254) | (4.410) | (4.591) | (5.033) |
| Net Asset Value, End of Period | $59.95 | $42.74 | $86.94 | $118.46 | $90.82 |
| |
| Total Return2 | 48.73% | -47.77% | -23.23% | 36.46% | 31.49% |
| |
| Ratios/Supplemental Data | | | | | |
| Net Assets, End of Period (Millions) | $1,296 | $873 | $1,706 | $3,392 | $2,025 |
| Ratio of Total Expenses to | | | | | |
| Average Net Assets | 0.13% | 0.11% | 0.10% | 0.14% | 0.14% |
| Ratio of Net Investment Income to | | | | | |
| Average Net Assets | 4.07% | 3.46% | 2.62% | 2.34% | 2.98% |
| Portfolio Turnover Rate3 | 16% | 10% | 13% | 11% | 17% |
| 1 | Includes increases from redemption fees of $0.01, $0.02, $0.10, $0.02, and $0.02. |
| 2 | Total returns do not reflect the 1% fee assessed on redemptions of shares held for less than one year. |
| 3 | Excludes the value of portfolio securities received or delivered as a result of in-kind purchases or redemptions of the fund’s capital shares, including ETF Creation Units. |
See accompanying Notes, which are an integral part of the Financial Statements.
17
| | | |
| REIT Index Fund | | | |
| |
| |
| Financial Highlights | | | |
| |
| |
| Signal Shares | | | |
| | | | June 4, |
| | Year Ended | 20071 to |
| | January 31, | Jan. 31, |
| For a Share Outstanding Throughout Each Period | 2010 | 2009 | 2008 |
| Net Asset Value, Beginning of Period | $11.41 | $23.21 | $30.05 |
| Investment Operations | | | |
| Net Investment Income | .557 | .688 | .470 |
| Net Realized and Unrealized Gain (Loss) on Investments2 | 4.775 | (11.353) | (6.311) |
| Total from Investment Operations | 5.332 | (10.665) | (5.841) |
| Distributions | | | |
| Dividends from Net Investment Income | (.559) | (.664) | (.620) |
| Distributions from Realized Capital Gains | — | (.143) | (.192) |
| Return of Capital | (.183) | (.328) | (.187) |
| Total Distributions | (.742) | (1.135) | (.999) |
| Net Asset Value, End of Period | $16.00 | $11.41 | $23.21 |
| |
| Total Return3 | 48.68% | -47.77% | -19.68% |
| |
| Ratios/Supplemental Data | | | |
| Net Assets, End of Period (Millions) | $489 | $350 | $538 |
| Ratio of Total Expenses to Average Net Assets | 0.14% | 0.11% | 0.10%4 |
| Ratio of Net Investment Income to Average Net Assets | 4.06% | 3.46% | 2.62%4 |
| Portfolio Turnover Rate5 | 16% | 10% | 13% |
| 1 | Inception. |
| 2 | Includes increases from redemption fees of $0.00, $0.00, and $0.01. |
| 3 | Total returns do not reflect the 1% fee assessed on redemptions of shares held for less than one year. |
| 4 | Annualized. |
| 5 | Excludes the value of portfolio securities received or delivered as a result of in-kind purchases or redemptions of the fund’s capital shares, including ETF Creation Units. |
See accompanying Notes, which are an integral part of the Financial Statements.
18
| | | | | |
| REIT Index Fund | | | | | |
| |
| |
| Financial Highlights | | | | | |
| |
| |
| Institutional Shares | | | | | |
| |
| For a Share Outstanding | | | Year Ended January 31, |
| Throughout Each Period | 2010 | 2009 | 2008 | 2007 | 2006 |
| Net Asset Value, Beginning of Period | $6.61 | $13.46 | $18.33 | $14.06 | $11.36 |
| Investment Operations | | | | | |
| Net Investment Income | .326 | .401 | .420 | .366 | .385 |
| Net Realized and Unrealized Gain (Loss) | | | | | |
| on Investments1 | 2.777 | (6.591) | (4.605) | 4.621 | 3.099 |
| Total from Investment Operations | 3.103 | (6.190) | (4.185) | 4.987 | 3.484 |
| Distributions | | | | | |
| Dividends from Net Investment Income | (.326) | (.386) | (.426) | (.368) | (.389) |
| Distributions from Realized Capital Gains | — | (.083) | (.131) | (.273) | (.350) |
| Return of Capital | (.107) | (.191) | (.128) | (.076) | (.045) |
| Total Distributions | (.433) | (.660) | (.685) | (.717) | (.784) |
| Net Asset Value, End of Period | $9.28 | $6.61 | $13.46 | $18.33 | $14.06 |
| |
| Total Return2 | 48.90% | -47.82% | -23.18% | 36.45% | 31.58% |
| |
| Ratios/Supplemental Data | | | | | |
| Net Assets, End of Period (Millions) | $907 | $504 | $722 | $960 | $571 |
| Ratio of Total Expenses to | | | | | |
| Average Net Assets | 0.09% | 0.09% | 0.09% | 0.10% | 0.10% |
| Ratio of Net Investment Income to | | | | | |
| Average Net Assets | 4.11% | 3.48% | 2.63% | 2.38% | 3.02% |
| Portfolio Turnover Rate3 | 16% | 10% | 13% | 11% | 17% |
| 1 | Includes increases from redemption fees of $0.00, $0.00, $0.01, $0.00, and $0.00. |
| 2 | Total returns do not reflect the 1% fee assessed on redemptions of shares held for less than one year. |
| 3 | Excludes the value of portfolio securities received or delivered as a result of in-kind purchases or redemptions of the fund’s capital shares, including ETF Creation Units. |
See accompanying Notes, which are an integral part of the Financial Statements.
19
| | | | | |
| REIT Index Fund | | | | | |
| |
| |
| Financial Highlights | | | | | |
| |
| |
| ETF Shares | | | | | |
| |
| For a Share Outstanding | | | Year Ended January 31, |
| Throughout Each Period | 2010 | 2009 | 2008 | 2007 | 2006 |
| Net Asset Value, Beginning of Period | $30.14 | $61.31 | $83.55 | $64.07 | $51.77 |
| Investment Operations | | | | | |
| Net Investment Income | 1.473 | 1.820 | 1.908 | 1.654 | 1.745 |
| Net Realized and Unrealized Gain (Loss) | | | | | |
| on Investments1 | 12.651 | (29.990) | (21.037) | 21.080 | 14.116 |
| Total from Investment Operations | 14.124 | (28.170) | (19.129) | 22.734 | 15.861 |
| Distributions | | | | | |
| Dividends from Net Investment Income | (1.478) | (1.757) | (1.931) | (1.665) | (1.764) |
| Distributions from Realized Capital Gains | — | (.377) | (.598) | (1.242) | (1.594) |
| Return of Capital | (.486) | (.866) | (.582) | (.347) | (.203) |
| Total Distributions | (1.964) | (3.000) | (3.111) | (3.254) | (3.561) |
| Net Asset Value, End of Period | $42.30 | $30.14 | $61.31 | $83.55 | $64.07 |
| |
| Total Return | 48.74% | -47.77% | -23.23% | 36.48% | 31.54% |
| |
| Ratios/Supplemental Data | | | | | |
| Net Assets, End of Period (Millions) | $4,678 | $1,414 | $2,082 | $1,713 | $871 |
| Ratio of Total Expenses to | | | | | |
| Average Net Assets | 0.13% | 0.11% | 0.10% | 0.12% | 0.12% |
| Ratio of Net Investment Income to | | | | | |
| Average Net Assets | 4.07% | 3.46% | 2.62% | 2.36% | 3.00% |
| Portfolio Turnover Rate2 | 16% | 10% | 13% | 11% | 17% |
1 Includes increases from redemption fees of $0.01, $0.01, $0.04, $0.01, and $0.01.
2 Excludes the value of portfolio securities received or delivered as a result of in-kind purchases or redemptions of the fund’s capital shares, including ETF Creation Units.
See accompanying Notes, which are an integral part of the Financial Statements.
20
REIT Index Fund
Notes to Financial Statements
Vanguard REIT Index Fund is registered under the Investment Company Act of 1940 as an open-end investment company, or mutual fund. The fund offers five classes of shares: Investor Shares, Admiral Shares, Signal Shares, Institutional Shares, and ETF Shares. Investor Shares are available to any investor who meets the fund’s minimum purchase requirements. Admiral Shares are designed for investors who meet certain administrative, service, tenure, and account-size criteria. Signal Shares are designed for institutional investors who meet certain administrative, service, and account-size criteria. Institutional Shares are designed for investors who meet certain admi nistrative and service criteria and invest a minimum amount of $5 million. ETF Shares are listed for trading on the NYSE Arca, Inc.; they can be purchased and sold through a broker.
A. The following significant accounting policies conform to generally accepted accounting principles for U.S. mutual funds. The fund consistently follows such policies in preparing its financial statements.
1. Security Valuation: Securities are valued as of the close of trading on the New York Stock Exchange (generally 4 p.m., Eastern time) on the valuation date. Equity securities are valued at the latest quoted sales prices or official closing prices taken from the primary market in which each security trades; such securities not traded on the valuation date are valued at the mean of the latest quoted bid and asked prices. Securities for which market quotations are not readily available, or whose values have been materially affected by events occurring before the fund’s pricing time but after the close of the securities’ primary markets, are valued by methods deemed by the board of trustees to represent fair value. Inves tments in Vanguard Market Liquidity Fund are valued at that fund’s net asset value. Temporary cash investments acquired over 60 days to maturity are valued using the latest bid prices or using valuations based on a matrix system (which considers such factors as security prices, yields, maturities, and ratings), both as furnished by independent pricing services. Other temporary cash investments are valued at amortized cost, which approximates market value.
2. Swap Contracts: The fund has entered into swap transactions to earn the total return on a specified REIT index. Under the terms of the swaps, the fund receives the total return (either receiving the increase or paying the decrease) on a reference index, applied to a notional principal amount. In return, the fund agrees to pay the counterparty a floating rate, which is reset periodically based on short-term interest rates, applied to the same notional amount. At the same time, the fund invests an amount equal to the notional amount of the swap in high-quality temporary cash investments.
The notional amounts of swap contracts are not recorded in the Statement of Net Assets. Swaps are valued daily and the change in value is recorded as unrealized appreciation (depreciation) until periodic payments are made, or the swap terminates, at which time realized gain (loss) is recorded. The primary risk associated with the swaps is that a counterparty will default on its obligation to pay net amounts due to the fund. The fund’s maximum risk of loss from counterparty credit risk is the amount of unrealized appreciation on the swap contract. This risk is mitigated by entering into swaps only with highly rated counterparties, by a master netting arrangement between the fund and the counterparty, and by the posting of collateral by the counterparty. The swap contracts contain provisions whereby a counterparty may terminate open contracts if the fund’s net assets decline below a certain level, triggering a paym ent by the fund if the fund is in a net liability position at the time of the termination. The payment amount would be reduced by any collateral the fund has posted. Any securities posted as collateral for open contracts are noted in the Statement of Net Assets.
21
REIT Index Fund
3. Federal Income Taxes: The fund intends to continue to qualify as a regulated investment company and distribute all of its taxable income. Management has analyzed the fund’s tax positions taken for all open federal income tax years (January 31, 2007–2010), and has concluded that no provision for federal income tax is required in the fund’s financial statements.
4. Distributions: Distributions to shareholders are recorded on the ex-dividend date.
5. Security Lending: The fund may lend its securities to qualified institutional borrowers to earn additional income. Security loans are required to be secured at all times by collateral at least equal to the market value of securities loaned. The fund invests cash collateral received in Vanguard Market Liquidity Fund, and records a liability for the return of the collateral, during the period the securities are on loan. Security lending income represents the income earned on investing cash collateral, less expenses associated with the loan.
6. Other: Distributions received from REITs are recorded on the ex-dividend date. Each REIT reports annually the tax character of its distributions. Dividend income, capital gain distributions received and unrealized appreciation (depreciation) reflect the amounts of taxable income, capital gain, and return of capital reported by the REITs, and management’s estimates of such amounts for REIT distributions for which actual information has not been reported. Interest income includes income distributions received from Vanguard Market Liquidity Fund and is accrued daily. Security transactions are accounted for on the date securities are bought or sold. Costs used to determine realized gains (losses) on the sale of investment securities are those of the specific securities sold. Fees assessed on redemptions of capital shares are credited to paid-in capital.
Each class of shares has equal rights as to assets and earnings, except that each class separately bears certain class-specific expenses related to maintenance of shareholder accounts (included in Management and Administrative expenses), shareholder reporting, and proxies. Marketing and distribution expenses are allocated to each class of shares based on a method approved by the board of trustees. Income, other non-class-specific expenses, and gains and losses on investments are allocated to each class of shares based on its relative net assets.
B. The Vanguard Group furnishes at cost investment advisory, corporate management, administrative, marketing, and distribution services. The costs of such services are allocated to the fund under methods approved by the board of trustees. The fund has committed to provide up to 0.40% of its net assets in capital contributions to Vanguard. At January 31, 2010, the fund had contributed capital of $2,235,000 to Vanguard (included in Other Assets), representing 0.02% of the fund’s net assets and 0.89% of Vanguard’s capitalization. The fund’s trustees and officers are also directors and officers of Vanguard.
C. Various inputs may be used to determine the value of the fund’s investments. These inputs are summarized in three broad levels for financial statement purposes. The inputs or methodologies used to value securities are not necessarily an indication of the risk associated with investing in those securities.
22
REIT Index Fund
Level 1 — Quoted prices in active markets for identical securities.
Level 2 — Other significant observable inputs (including quoted prices for similar securities, interest rates, prepayment speeds, credit risk, etc.).
Level 3 — Significant unobservable inputs (including the fund’s own assumptions used to determine the fair value of investments).
The following table summarizes the fund’s investments as of January 31, 2010, based on the inputs used to value them:
| | | |
| | Level 1 | Level 2 | Level 3 |
| Investments | ($000) | ($000) | ($000) |
| Real Estate Investment Trusts | 10,868,540 | — | — |
| Temporary Cash Investments | 104,584 | — | — |
| Swap Contracts—Assets | — | 17,703 | — |
| Total | 10,973,124 | 17,703 | — |
D. At January 31, 2010, the fund had the following open total return swap contract:
| | | | | |
| | | | | Floating | Unrealized |
| | | | Notional | Interest Rate | Appreciation |
| | Termination | | Amount | Received | (Depreciation) |
| Reference Entity | Date | Counterparty | ($000) | (Paid)1 | ($000) |
| MSCI US REIT Total Return | | | | | |
| Swap Gross Index | 6/29/10 | GSI | 51,326 | 0.019% | 17,703 |
| GSI—Goldman Sachs International. | | | | | |
1 Based on one-month London Interbank Offered Rate (LIBOR) as of the most recent payment date. The contract provides for the payment of interest based on LIBOR less a fixed interest rate spread. If the spread is greater than LIBOR, the result is net interest received by the fund.
At January 31, 2010, the counterparty had deposited in a segregated account securities with a value sufficient to cover substantially all amounts due to the fund in connection with open swap contracts.
E. Distributions are determined on a tax basis and may differ from net investment income and realized capital gains for financial reporting purposes. Differences may be permanent or temporary. Permanent differences are reclassified among capital accounts in the financial statements to reflect their tax character. Temporary differences arise when certain items of income, expense, gain, or loss are recognized in different periods for financial statement and tax purposes; these differences will reverse at some time in the future. Differences in classification may also result from the treatment of short-term gains as ordinary income for tax purposes.
During the year ended January 31, 2010, the fund realized $76,332,000 of net capital gains resulting from in-kind redemptions—in which shareholders exchanged fund shares for securities held by the fund rather than for cash. Because such gains are not taxable to the fund, and are not distributed to shareholders, they have been reclassified from accumulated net realized losses to paid-in capital.
23
REIT Index Fund
For tax purposes, at January 31, 2010, the fund had no ordinary income available for distribution. The fund had available capital loss carryforwards totaling $396,594,000 to offset future net capital gains through January 31, 2018.
At January 31, 2010, the cost of investment securities for tax purposes was $12,818,112,000. Net unrealized depreciation of investment securities for tax purposes was $1,844,988,000, consisting of unrealized gains of $378,486,000 on securities that had risen in value since their purchase and $2,223,474,000 in unrealized losses on securities that had fallen in value since t heir purchase.
F. During the year ended January 31, 2010, the fund purchased $4,277,271,000 of investment securities and sold $1,409,195,000 of investment securities, other than temporary cash investments.
G. Capital share transactions for each class of shares were:
| | | | |
| | | | Year Ended January 31, |
| | | 2010 | | 2009 |
| | Amount | Shares | Amount | Shares |
| | ($000) | (000) | ($000) | (000) |
| Investor Shares | | | | |
| Issued | 805,386 | 70,148 | 1,134,996 | 65,608 |
| Issued in Lieu of Cash Distributions | 144,818 | 12,990 | 196,216 | 12,122 |
| Redeemed1 | (652,261) | (55,891) | (805,835) | (49,310) |
| Net Increase (Decrease)—Investor Shares | 297,943 | 27,247 | 525,377 | 28,420 |
| Admiral Shares | | | | |
| Issued | 227,091 | 4,473 | 316,602 | 4,056 |
| Issued in Lieu of Cash Distributions | 47,522 | 1,002 | 71,754 | 1,029 |
| Redeemed1 | (210,298) | (4,289) | (292,026) | (4,268) |
| Net Increase (Decrease)—Admiral Shares | 64,315 | 1,186 | 96,330 | 817 |
| Signal Shares | | | | |
| Issued | 148,001 | 11,605 | 292,068 | 14,603 |
| Issued in Lieu of Cash Distributions | 20,008 | 1,595 | 27,716 | 1,507 |
| Redeemed1 | (177,671) | (13,365) | (159,768) | (8,585) |
| Net Increase (Decrease)—Signal Shares | (9,662) | (165) | 160,016 | 7,525 |
| Institutional Shares | | | | |
| Issued | 272,886 | 36,428 | 378,908 | 33,267 |
| Issued in Lieu of Cash Distributions | 34,721 | 4,703 | 40,717 | 3,869 |
| Redeemed1 | (156,378) | (19,585) | (161,258) | (14,629) |
| Net Increase (Decrease)—Institutional Shares | 151,229 | 21,546 | 258,367 | 22,507 |
| ETF Shares | | | | |
| Issued | 2,512,381 | 68,773 | 2,522,879 | 48,375 |
| Issued in Lieu of Cash Distributions | — | — | — | — |
| Redeemed1 | (183,337) | (5,100) | (1,863,584) | (35,400) |
| Net Increase (Decrease)—ETF Shares | 2,329,044 | 63,673 | 659,295 | 12,975 |
| 1 | Net of redemption fees of $1,733,000 and $1,996,000 (fund totals). |
24
REIT Index Fund
H. Certain of the fund’s investments are in companies that are considered to be affiliated companies of the fund because the fund owns more than 5% of the outstanding voting securities of the company. Transactions during the period in securities of these companies were as follows:
| | | | | |
| | | | Current Period Transactions | |
| Jan. 31, 2009 | | Proceeds from | | Jan. 31, 2010 |
| | Market | Purchases | Securities | Dividend | Market |
| | Value | at Cost | Sold | Income | Value |
| | ($000) | ($000) | ($000) | ($000) | ($000) |
| Alexandria Real Estate Equities Inc. | NA1 | 59,402 | 16,435 | 3,395 | 132,690 |
| AMB Property Corp. | NA1 | 83,567 | 23,626 | 4,715 | 179,533 |
| American Campus Communities Inc. | NA1 | 31,768 | 9,655 | 635 | 68,501 |
| Apartment Investment & | | | | | |
| Management Co. | NA1 | 29,771 | 10,056 | 297 | 91,957 |
| Ashford Hospitality Trust Inc. | 6,633 | 5,265 | 10,469 | — | NA2 |
| AvalonBay Communities Inc. | NA1 | 98,536 | 45,357 | 9,009 | 313,232 |
| BioMed Realty Trust Inc. | NA1 | 29,383 | 8,707 | 1,212 | 73,122 |
| Boston Properties Inc. | NA1 | 174,652 | 55,803 | 11,949 | 459,827 |
| Brandywine Realty Trust | NA1 | 30,925 | 7,086 | 2,476 | 73,859 |
| Camden Property Trust | NA1 | 54,200 | 19,875 | 4,838 | 127,160 |
| Corporate Office Properties Trust SBI | NA1 | 42,410 | 13,804 | 3,407 | 105,911 |
| DCT Industrial Trust Inc. | NA1 | 21,689 | 6,633 | 1,872 | 51,735 |
| Duke Realty Corp. | NA1 | 67,799 | 16,483 | 4,570 | 129,680 |
| DuPont Fabros Technology Inc. | NA1 | 11,290 | 2,678 | 164 | 35,475 |
| EastGroup Properties Inc. | NA1 | 17,398 | 6,767 | 2,030 | 50,807 |
| Entertainment Properties Trust | NA1 | 31,137 | 7,695 | 4,222 | 75,027 |
| Equity Residential | NA1 | 140,033 | 61,674 | 9,943 | 449,138 |
| Federal Realty Investment Trust | NA1 | 70,117 | 29,307 | 6,608 | 200,594 |
| FelCor Lodging Trust Inc. | NA1 | 3,208 | 998 | — | 12,494 |
| HCP Inc. | NA1 | 177,877 | 60,160 | 19,472 | 421,644 |
| Healthcare Realty Trust Inc. | NA1 | 22,186 | 9,446 | 2,400 | 63,667 |
| Highwoods Properties Inc. | NA1 | 41,346 | 14,897 | 3,291 | 109,497 |
| Home Properties Inc. | NA1 | 24,379 | 10,079 | 1,541 | 74,927 |
| Hospitality Properties Trust | NA1 | 53,339 | 15,374 | 2,789 | 138,178 |
| Host Hotels & Resorts Inc. | NA1 | 141,722 | 40,065 | 7,219 | 336,781 |
| HRPT Properties Trust | NA1 | 23,078 | 11,660 | 4,807 | 76,322 |
| Kilroy Realty Corp. | NA1 | 27,652 | 7,279 | 624 | 63,764 |
| Kimco Realty Corp. | NA1 | 150,216 | 31,544 | 6,672 | 259,331 |
| Kite Realty Group Trust | NA1 | 7,283 | 907 | — | 12,207 |
| LaSalle Hotel Properties | NA1 | 28,246 | 5,603 | 106 | 65,505 |
| Liberty Property Trust | NA1 | 70,369 | 21,596 | 8,015 | 173,612 |
25
REIT Index Fund
| | | | | |
| | | | Current Period Transactions | |
| | Jan. 31, 2009 | | Proceeds from | | Jan. 31, 2010 |
| | Market | Purchases | Securities | Dividend | Market |
| | Value | at Cost | Sold | Income | Value |
| | ($000) | ($000) | ($000) | ($000) | ($000) |
| Macerich Co. | NA1 | 62,312 | 15,315 | 1,820 | 149,163 |
| Mack-Cali Realty Corp. | NA1 | 52,905 | 17,000 | 5,760 | 130,706 |
| Medical Properties Trust Inc. | NA1 | 10,465 | 3,831 | 1,802 | 41,046 |
| Mid-America Apartment | | | | | |
| Communities Inc. | NA1 | 21,923 | 9,796 | 2,173 | 67,739 |
| National Retail Properties Inc. | NA1 | 31,511 | 11,564 | 5,554 | 83,398 |
| Omega Healthcare Investors Inc. | NA1 | 26,602 | 11,494 | 3,567 | 79,686 |
| Parkway Properties Inc. | NA1 | 9,537 | 2,265 | 651 | 23,028 |
| Post Properties Inc. | NA1 | 15,843 | 5,398 | 107 | 43,719 |
| Realty Income Corp. | NA1 | 48,365 | 21,585 | 6,638 | 148,978 |
| Regency Centers Corp. | NA1 | 78,187 | 22,822 | 3,891 | 151,287 |
| Senior Housing Properties Trust | NA1 | 52,301 | 18,788 | 6,361 | 135,404 |
| Simon Property Group Inc. | NA1 | 408,445 | 122,225 | 31,244 | 1,049,446 |
| SL Green Realty Corp. | NA1 | 61,926 | 16,712 | 1,981 | 178,778 |
| Sovran Self Storage Inc. | NA1 | 19,062 | 4,901 | 1,026 | 46,761 |
| Strategic Hotels & Resorts Inc. | NA1 | 1,775 | 545 | — | 8,823 |
| Tanger Factory Outlet Centers | NA1 | 37,364 | 11,233 | 2,427 | 77,998 |
| Taubman Centers Inc. | NA1 | 28,372 | 12,725 | 2,450 | 86,027 |
| UDR Inc. | NA1 | 36,171 | 9,375 | 1,917 | 119,826 |
| Ventas Inc. | NA1 | 116,335 | 46,127 | 12,821 | 337,888 |
| | 6,633 | | | 220,468 | 7,385,878 |
1 Not applicable—At January 31, 2009, the issuer was not an affiliated company of the fund.
2 Not applicable—At January 31, 2010, the security was still held but the issuer was no longer an affiliated company of the fund.
I. In preparing the financial statements as of January 31, 2010, management considered the impact of subsequent events for potential recognition or disclosure in these financial statements.
26
Report of Independent Registered Public Accounting Firm
To the Trustees of Vanguard Specialized Funds and the Shareholders of Vanguard REIT Index Fund:
In our opinion, the accompanying statements of net assets and of assets and liabilities and the related statements of operations and of changes in net assets and the financial highlights present fairly, in all material respects, the financial position of Vanguard REIT Index Fund (constituting a separate portfolio of Vanguard Specialized Funds, hereafter referred to as the “Fund”) at January 31, 2010, the results of its operations for the year then ended, the changes in its net assets for each of the two years in the period then ended and the financial highlights for each of the periods indicated, in conformity with accounting principles generally accepte d in the United States of America. These financial statements and financial highlights (hereafter referred to as “financial statements”) are the responsibility of the Fund’s management; our responsibility is to express an opinion on these financial statements based on our audits. We conducted our audits of these financial statements in accordance with the standards of the Public Company Accounting Oversight Board (United States). Those standards require that we plan and perform the audit to obtain reasonable assurance about whether the financial statements are free of material misstatement. An audit includes examining, on a test basis, evidence supporting the amounts and disclosures in the financial statements, assessing the accounting principles used and significant estimates made by management, and evaluating the overall financial statement presentation. We believe that our audits, which included confirmation of securities at January 31, 2010 by correspondence with the custodian and broker and by agreement to the underlying ownership records of Vanguard Market Liquidity Fund, provide a reasonable basis for our opinion.
PricewaterhouseCoopers LLP
Philadelphia, Pennsylvania
March 16, 2010
| Special 2009 tax information (unaudited) for Vanguard REIT Index Fund |
This information for the fiscal year ended January 31, 2010, is included pursuant to provisions of the Internal Revenue Code.
The fund distributed $2,291,000 of qualified dividend income to shareholders during the fiscal year.
27
Your Fund’s After-Tax Returns
This table presents returns for your fund both before and after taxes. The after-tax returns are shown in two ways: (1) assuming that an investor owned the fund during the entire period and paid taxes on the fund’s distributions, and (2) assuming that an investor paid taxes on the fund’s distributions and sold all shares at the end of each period.
Calculations are based on the highest individual federal income tax and capital gains tax rates in effect at the times of the distributions and the hypothetical sales. State and local taxes were not considered. After-tax returns reflect any qualified dividend income , using actual prior-year figures and estimates for 2010. (In the example, returns after the sale of fund shares may be higher than those assuming no sale. This occurs when the sale would have produced a capital loss. The calculation assumes that the investor received a tax deduction for the loss.) The table shows returns for Investor Shares only; returns for other share classes will differ. Please note that your actual after-tax returns will depend on your tax situation and may differ from those shown. Also note that if you own the fund in a tax-deferred account, such as an individual retirement account or a 401(k) plan, this information does not apply to you. Such accounts are not subject to current taxes.
Finally, keep in mind that a fund’s performance—whether before or after taxes—does not guarantee future results.
| | | |
| Average Annual Total Returns: REIT Index Fund Investor Shares | | |
| Periods Ended January 31, 2010 | | | |
| | One | Five | Ten |
| | Year | Years | Years |
| Returns Before Taxes | 48.51% | 1.27% | 9.74% |
| Returns After Taxes on Distributions | 46.30 | -0.03 | 7.95 |
| Returns After Taxes on Distributions and Sale of Fund Shares | 31.21 | 0.51 | 7.55 |
Total returns do not include any transaction or account fees that applied in the periods shown. Fund prospectuses provide information about current fees.
28
About Your Fund’s Expenses
As a shareholder of the fund, you incur ongoing costs, which include costs for portfolio management, administrative services, and shareholder reports (like this one), among others. Operating expenses, which are deducted from a fund’s gross income, directly reduce the investment return of the fund.
A fund’s expenses are expressed as a percentage of its average net assets. This figure is known as the expense ratio. The following examples are intended to help you understand the ongoing costs (in dollars) of investing in your fund and to compare these costs with those of other mutual funds. The examples are based on an investment of $1,000 made at the beginning of the period shown and held for the entire period.
The accompanying table illustrates your fund’s costs in two ways:
• Based on actual fund return. This section helps you to estimate the actual expenses that you paid over the period. The ”Ending Account Value“ shown is derived from the fund‘s actual return, and the third column shows the dollar amount that would have been paid by an investor who started with $1,000 in the fund. You may use the information here, together with the amount you invested, to estimate the expenses that you paid over the period.
To do so, simply divide your account value by $1,000 (for example, an $8,600 account value divided by $1,000 = 8.6), then multiply the result by the number given for your fund under the heading ”Expenses Paid During Period.“
• Based on hypothetical 5% yearly return. This section is intended to help you compare your fund‘s costs with those of other mutual funds. It assumes that the fund had a yearly return of 5% before expenses, but that the expense ratio is unchanged. In this case—because the return used is not the fund’s actual return—the results do not apply to your investment. The example is useful in making comparisons because the Securities and Exchange Commission requires all mutual funds to calculate expenses based on a 5% return. You can assess your fund’s costs by comparing this hypothetical example with the hypothetical examples that appear in shareholder reports of other funds.
Note that the expenses shown in the table are meant to highlight and help you compare ongoing costs only and do not reflect transaction costs incurred by the fund for buying and selling securities. Further, the expenses do not include the 1% fee on redemptions of shares held for less than one year, nor do they include the account service fee described in the prospectus. If such fees were applied to your account, your costs would be higher. Your fund does not carry a “sales load.” The calculations assume no shares were bought or sold during the period. Your actual costs may have been higher or lower, depending on the amount of your investment and the timing of any purchases or redemptions.
You can find more information about the fund’s expenses, including annual expense ratios, in the Financial Statements section of this report. For additional information on operating expenses and other shareholder costs, please refer to your fund’s current prospectus.
29
| | | |
| Six Months Ended January 31, 2010 | | | |
| | Beginning | Ending | Expenses |
| | Account Value | Account Value | Paid During |
| REIT Index Fund | 7/31/2009 | 1/31/2010 | Period |
| Based on Actual Fund Return | | | |
| Investor Shares | $1,000.00 | $1,255.56 | $1.48 |
| Admiral Shares | 1,000.00 | 1,256.57 | 0.74 |
| Signal Shares | 1,000.00 | 1,256.00 | 0.74 |
| Institutional Shares | 1,000.00 | 1,257.47 | 0.46 |
| ETF Shares | 1,000.00 | 1,256.59 | 0.74 |
| Based on Hypothetical 5% Yearly Return | | | |
| Investor Shares | $1,000.00 | $1,023.89 | $1.33 |
| Admiral Shares | 1,000.00 | 1,024.55 | 0.66 |
| Signal Shares | 1,000.00 | 1,024.55 | 0.66 |
| Institutional Shares | 1,000.00 | 1,024.80 | 0.41 |
| ETF Shares | 1,000.00 | 1,024.55 | 0.66 |
The calculations are based on expenses incurred in the most recent six-month period. The fund’s annualized six-month expense ratios for that period are 0.26% for Investor Shares, 0.13% for Admiral Shares, 0.13% for Signal Shares, 0.08% for Institutional Shares, and 0.13% for ETF Shares. The dollar amounts shown as “Expenses Paid” are equal to the annualized expense ratio multiplied by the average account value over the period, multiplied by the number of days in the most recent six-month period, then divided by the number of days in the most recent 12-month period.
30
Glossary
Beta. A measure of the magnitude of a fund’s past share-price fluctuations in relation to the ups and downs of a given market index. The index is assigned a beta of 1.00. Compared with a given index, a fund with a beta of 1.20 typically would have seen its share price rise or fall by 12% when the index rose or fell by 10%. For this report, beta is based on returns over the past 36 months for both the fund and the index. Note that a fund’s beta should be reviewed in conjunction with its R-squared (see definition). The lower the R-squared, the less correlation there is between the fund and the index, and the less reliable beta is as an indicator of volatility.
Dividend Yield. Dividend income earned by stocks, expressed as a percentage of the aggregate market value (or of net asset value, for a fund). The yield is determined by dividing the amount of the annual dividends by the aggregate value (or net asset value) at the end of the period. For a fund, the dividend yield is based solely on stock holdings and does not include any income produced by other investments.
Earnings Growth Rate. The average annual rate of growth in earnings over the past five years for the stocks now in a fund.
Expense Ratio. The percentage of a fund’s average net assets used to pay its annual administrative and advisory expenses. These expenses directly reduce returns to investors.
Foreign Holdings. The percentage of a fund represented by stocks or depositary receipts of companies based outside the United States.
Inception Date. The date on which the assets of a fund (or one of its share classes) are first invested in accordance with the fund’s investment objective. For funds with a subscription period, the inception date is the day after that period ends. Investment performance is measured from the inception date.
Median Market Cap. An indicator of the size of companies in which a fund invests; the midpoint of market capitalization (market price x shares outstanding) of a fund’s stocks, weighted by the proportion of the fund’s assets invested in each stock. Stocks representing half of the fund’s assets have market capitalizations above the median, and the rest are below it.
Price/Book Ratio. The share price of a stock divided by its net worth, or book value, per share. For a fund, the weighted average price/book ratio of the stocks it holds.
Price/Earnings Ratio. The ratio of a stock’s current price to its per-share earnings over the past year. For a fund, the weighted average P/E of the stocks it holds. P/E is an indicator of market expectations about corporate prospects; the higher the P/E, the greater the expectations for a company’s future growth.
R-Squared. A measure of how much of a fund’s past returns can be explained by the returns from the market in general, as measured by a given index. If a fund’s total returns were precisely synchronized with an index’s returns, its R-squared would be 1.00. If the fund’s returns bore no relationship to the index’s returns, its R-squared would be 0. For this report, R-squared is based on returns over the past 36 months for both the fund and the index.
Return on Equity. The annual average rate of return generated by a company during the past five years for each dollar of shareholder’s equity (net income divided by shareholder’s equity). For a fund, the weighted average return on equity for the companies whose stocks it holds.
31
Short-Term Reserves. The percentage of a fund invested in highly liquid, short-term securities that can be readily converted to cash.
Turnover Rate. An indication of the fund’s trading activity. Funds with high turnover rates incur higher transaction costs and may be more likely to distribute capital gains (which may be taxable to investors). The turnover rate excludes in-kind transactions, which have minimal impact on costs.
32
This page intentionally left blank.
This page intentionally left blank.
This page intentionally left blank.
The People Who Govern Your Fund
The trustees of your mutual fund are there to see that the fund is operated and managed in your best interests since, as a shareholder, you are a part owner of the fund. Your fund’s trustees also serve on the board of directors of The Vanguard Group, Inc., which is owned by the Vanguard funds and provides services to them on an at-cost basis.
A majority of Vanguard’s board members are independent, meaning that they have no affiliation with Vanguard or the funds they oversee, apart from the sizable personal investments they have made as private individuals. The independent board members have distinguished backgrounds in business, academia, and public service. Each of the trustees and executive officers oversees 162 Vanguard funds.
The following table provides information for each trustee and executive officer of the fund. More information about the trustees is in the Statement of Additional Information, which can be obtained, without charge, by contacting Vanguard at 800-662-7447, or online at www.vanguard.com.
| |
| Interested Trustee1 | Rajiv L. Gupta |
| | Born 1945. Trustee Since December 2001.2 Principal |
| F. William McNabb III | Occupation(s) During the Past Five Years: Chairman |
| Born 1957. Trustee Since July 2009. Chairman of the | and Chief Executive Officer (retired 2009) and |
| Board. Principal Occupation(s) During the Past Five | President (2006–2008) of Rohm and Haas Co. |
| Years: Chairman of the Board of The Vanguard Group, | (chemicals); Board Member of American Chemistry |
| Inc., and of each of the investment companies served | Council; Director of Tyco International, Ltd. (diversified |
| by The Vanguard Group, since January 2010; Director | manufacturing and services) and Hewlett-Packard Co. |
| of The Vanguard Group since 2008; Chief Executive | (electronic computer manufacturing); Trustee of The |
| Officer and President of The Vanguard Group and of | Conference Board. |
| each of the investment companies served by The | |
| Vanguard Group since 2008; Director of Vanguard | Amy Gutmann |
| Marketing Corporation; Managing Director of The | Born 1949. Trustee Since June 2006. Principal |
| Vanguard Group (1995–2008). | Occupation(s) During the Past Five Years: President |
| | of the University of Pennsylvania; Christopher H. |
| | Browne Distinguished Professor of Political Science |
| Independent Trustees | in the School of Arts and Sciences with secondary |
| | appointments at the Annenberg School for Commu- |
| Emerson U. Fullwood | nication and the Graduate School of Education of |
| Born 1948. Trustee Since January 2008. Principal | the University of Pennsylvania; Director of Carnegie |
| Occupation(s) During the Past Five Years: Executive | Corporation of New York, Schuylkill River Development |
| Chief Staff and Marketing Officer for North America | Corporation, and Greater Philadelphia Chamber of |
| and Corporate Vice President (retired 2008) of Xerox | Commerce; Trustee of the National Constitution Center. |
| Corporation (photocopiers and printers); Director of | |
| SPX Corporation (multi-industry manufacturing), the | |
| United Way of Rochester, the Boy Scouts of America, | |
| Amerigroup Corporation (direct health and medical | |
| insurance carriers), and Monroe Community College | |
| Foundation. | |
| | |
| JoAnn Heffernan Heisen | Executive Officers | |
| Born 1950. Trustee Since July 1998. Principal | | |
| Occupation(s) During the Past Five Years: Corporate | Thomas J. Higgins | |
| Vice President and Chief Global Diversity Officer since | Born 1957. Chief Financial Officer Since September |
| 2006 (retired 2008) and Member of the Executive | 2008. Principal Occupation(s) During the Past Five |
| Committee (retired 2008) of Johnson & Johnson | Years: Principal of The Vanguard Group, Inc.; Chief |
| (pharmaceuticals/consumer products); Vice President | Financial Officer of each of the investment companies |
| and Chief Information Officer of Johnson & Johnson | served by The Vanguard Group since 2008; Treasurer |
| (1997–2005); Director of the University Medical Center | of each of the investment companies served by The |
| at Princeton and Women’s Research and Education | Vanguard Group (1998–2008). |
| Institute; Member of the Advisory Board of the | | |
| Maxwell School of Citizenship and Public Affairs | Kathryn J. Hyatt | |
| at Syracuse University. | Born 1955. Treasurer Since November 2008. Principal |
| | Occupation(s) During the Past Five Years: Principal |
| F. Joseph Loughrey | of The Vanguard Group, Inc.; Treasurer of each of |
| Born 1949. Trustee Since October 2009. Principal | the investment companies served by The Vanguard |
| Occupation(s) During the Past Five Years: President | Group since 2008; Assistant Treasurer of each of the |
| and Chief Operating Officer since 2005 (retired 2009) | investment companies served by The Vanguard Group |
| and Vice Chairman of the Board (2008–2009) of | (1988–2008). | |
| Cummins Inc. (industrial machinery); Director of | | |
| SKF AB (industrial machinery), Hillenbrand, Inc. | Heidi Stam | |
| (specialized consumer services), Sauer-Danfoss Inc. | Born 1956. Secretary Since July 2005. Principal |
| (machinery), the Lumina Foundation for Education, | Occupation(s) During the Past Five Years: Managing |
| and the Columbus Community Education Coalition; | Director of The Vanguard Group, Inc., since 2006; |
| Chairman of the Advisory Council for the College of | General Counsel of The Vanguard Group since 2005; |
| Arts and Letters at the University of Notre Dame. | Secretary of The Vanguard Group and of each of the |
| | investment companies served by The Vanguard Group |
| André F. Perold | since 2005; Director and Senior Vice President of |
| Born 1952. Trustee Since December 2004. Principal | Vanguard Marketing Corporation since 2005; |
| Occupation(s) During the Past Five Years: George | Principal of The Vanguard Group (1997–2006). |
| Gund Professor of Finance and Banking, Harvard | | |
| Business School; Chair of the Investment Committee | | |
| of HighVista Strategies LLC (private investment firm). | Vanguard Senior Management Team |
| |
| Alfred M. Rankin, Jr. | R. Gregory Barton | Michael S. Miller |
| Born 1941. Trustee Since January 1993. Principal | Mortimer J. Buckley | James M. Norris |
| Occupation(s) During the Past Five Years: Chairman, | Kathleen C. Gubanich | Glenn W. Reed |
| President, and Chief Executive Officer of NACCO | Paul A. Heller | George U. Sauter |
| Industries, Inc. (forklift trucks/housewares/lignite); | | |
| Director of Goodrich Corporation (industrial products/ | | |
| aircraft systems and services); Deputy Chairman | Chairman Emeritus and Senior Advisor |
| of the Federal Reserve Bank of Cleveland; Trustee | | |
| of University Hospitals of Cleveland, The Cleveland | John J. Brennan | |
| Museum of Art, and Case Western Reserve University. | Chairman, 1996–2009 | |
| | Chief Executive Officer and President, 1996–2008 |
| Peter F. Volanakis | | |
| Born 1955. Trustee Since July 2009. Principal | | |
| Occupation(s) During the Past Five Years: President | Founder | |
| since 2007 and Chief Operating Officer since 2005 | | |
| of Corning Incorporated (communications equipment); | John C. Bogle | |
| President of Corning Technologies (2001–2005); | Chairman and Chief Executive Officer, 1974–1996 |
| Director of Corning Incorporated and Dow Corning; | | |
| Trustee of the Corning Incorporated Foundation and | | |
| the Corning Museum of Glass; Overseer of the | | |
| Amos Tuck School of Business Administration at | | |
| Dartmouth College. | | |
1 Mr. McNabb is considered an “interested person,” as defined in the Investment Company Act of 1940, because he is an officer of the Vanguard funds.
2 December 2002 for Vanguard Equity Income Fund, Vanguard Growth Equity Fund, the Vanguard Municipal Bond Funds, and the Vanguard State Tax-Exempt Funds.
|  |
| P.O. Box 2600 |
| Valley Forge, PA 19482-2600 |
| |
| Connect with Vanguard® > www.vanguard.com |
| |
| |
| |
| Direct Investor Account Services > 800-662-2739 | The funds or securities referred to herein are not |
| sponsored, endorsed, or promoted by MSCI, and MSCI |
| Institutional Investor Services > 800-523-1036 | bears no liability with respect to any such funds or |
| securities. For any such funds or securities, the |
| Text Telephone for People | prospectus or the Statement of Additional Information |
| With Hearing Impairment > 800-749-7273 | contains a more detailed description of the limited |
| | relationship MSCI has with The Vanguard Group and |
| This material may be used in conjunction | any related funds. |
| with the offering of shares of any Vanguard | |
| fund only if preceded or accompanied by | |
| the fund’s current prospectus. | |
| |
| All comparative mutual fund data are from Lipper Inc. or | |
| Morningstar, Inc., unless otherwise noted. | |
| |
| You can obtain a free copy of Vanguard’s proxy voting | |
| guidelines by visiting our website, www.vanguard.com, | |
| and searching for “proxy voting guidelines,” or by calling | |
| Vanguard at 800-662-2739. The guidelines are also | |
| available from the SEC’s website, www.sec.gov. In | |
| addition, you may obtain a free report on how your fund | |
| voted the proxies for securities it owned during the 12 | |
| months ended June 30. To get the report, visit either | |
| www.vanguard.com or www.sec.gov. | |
| |
| You can review and copy information about your fund at | |
| the SEC’s Public Reference Room in Washington, D.C. To | |
| find out more about this public service, call the SEC at | |
| 202-551-8090. Information about your fund is also | |
| available on the SEC’s website, and you can receive | |
| copies of this information, for a fee, by sending a | |
| request in either of two ways: via e-mail addressed to | |
| publicinfo@sec.gov or via regular mail addressed to the | |
| Public Reference Section, Securities and Exchange | |
| Commission, Washington, DC 20549-1520. | |
| |
| © 2010 The Vanguard Group, Inc. |
| All rights reserved. |
| Vanguard Marketing Corporation, Distributor. |
| |
| Q1230 032010 |
 |
| Vanguard Dividend Growth Fund |
| Annual Report |
|
|
| January 31, 2010 |
|
|
 |
|
|
> Vanguard Dividend Growth Fund posted a gain of about 26% for the fiscal year ended January 31, 2010, lagging the returns of its comparative standards.
> Despite a poor start and sluggish finish for the period, the broad U.S. stock market performed strongly.
> After the close of the period, the fund adopted a benchmark more consistent with its focus on dividend growth.
| |
| Contents | |
| Your Fund’s Total Returns. | 1 |
| Chairman’s Letter. | 2 |
| Advisor’s Report. | 8 |
| Fund Profile. | 10 |
| Performance Summary. | 11 |
| Financial Statements. | 13 |
| Your Fund’s After-Tax Returns. | 23 |
| About Your Fund’s Expenses. | 24 |
| Notice to Shareholders. | 26 |
| Glossary. | 28 |
Please note: The opinions expressed in this report are just that—informed opinions. They should not be considered promises or advice. Also, please keep in mind that the information and opinions cover the period through the date on the front of this report. Of course, the risks of investing in your fund are spelled out in the prospectus.
See the Glossary for definitions of investment terms used in this report.
Cover photograph: Veronica Coia.
| | | | |
| Your Fund’s Total Returns | | | | |
| |
| |
| |
| |
| Fiscal Year Ended January 31, 2010 | | | | |
| | | | | Total |
| | | | | Returns |
| Vanguard Dividend Growth Fund | | | | 26.01% |
| Russell 1000 Index | | | | 34.81 |
| Large-Cap Core Funds Average | | | | 33.23 |
| Large-Cap Core Funds Average: Derived from data provided by Lipper Inc. | | | |
| |
| Your Fund’s Performance at a Glance | | | | |
| January 31, 2009 , Through January 31, 2010 | | | | |
| | | | Distributions Per Share |
| | Starting | Ending | Income | Capital |
| | Share Price | Share Price | Dividends | Gains |
| Vanguard Dividend Growth Fund | $10.42 | $12.82 | $0.292 | $0.000 |
1

Chairman’s Letter
Dear Shareholder,
Vanguard Dividend Growth Fund returned about 26% for the fiscal year ended January 31, 2010, helped by gains in all ten industry sectors. The fund’s return trailed that of the Russell 1000 Index, a measure of large- and mid-capitalization stocks, as well as the average return of large-cap core funds.
As the credit markets thawed last year, investors regained their thirst for the riskier stocks and bonds that had struggled the most during the bear market. This environment wasn’t ideal for the sort of investment strategy employed by the fund’s advisor, Wellington Management Company, LLP. Wellington aims to invest in high-quality companies with visible profits and viable prospects, companies that are likely to raise their dividends in the future. The fund paid total dividends of 29.2 cents per share during the fiscal year, compared with 26.4 cents the year before.
Please note that, effective February 1, the Dividend Growth Fund’s primary benchmark was changed to the Dividend Achievers Select Index, a standard that is more consistent with the fund’s mandate.
If you own the Dividend Growth Fund in a taxable account, you may wish to review the information about its after-tax returns later in this report.
2
Remarkable rally loses steam at year-end
The broad U.S. stock market returned about 36% for the 12 months through January 31. Stocks began the period under severe pressure from the global financial crisis and a stalled U.S. economy. After a dismal showing in February 2009, however, U.S. equities turned the corner in early March and kept surging until the fiscal year’s final weeks, when the major market indexes pulled back a bit. During the rally, the federal government’s stimulus plan took hold, companies began to repair their balance sheets, and investors increased their appetite for risk—the riskier the better, it seemed.
The stock market’s exuberance overshot the pace of economic recovery, which slowly improved as the year progressed. It wasn’t until the third calendar quarter that the recession appeared to be ending, and double-digit unemployment still weighed on the economy.
International markets traced an even steeper line upward than their U.S. counterpart for most of the fiscal year. They recovered strongly through 2009 and into 2010, before dropping in the latter half of January amid concerns about the strength of the global recovery. The most impressive international returns came from emerging markets, with especially strong results from Brazil and China.
| | | |
| Market Barometer | | | |
| |
| | | Average Annual Total Returns |
| | | Periods Ended January 31, 2010 |
| | One | Three | Five |
| | Year | Years | Years |
| Stocks | | | |
| Russell 1000 Index (Large-caps) | 34.81% | -7.10% | 0.57% |
| Russell 2000 Index (Small-caps) | 37.82 | -7.74 | 0.61 |
| Dow Jones U.S. Total Stock Market Index | 36.06 | -6.72 | 0.94 |
| MSCI All Country World Index ex USA (International) | 48.28 | -4.76 | 5.61 |
| |
| Bonds | | | |
| Barclays Capital U.S. Aggregate Bond Index (Broad | | | |
| taxable market) | 8.51% | 6.60% | 5.16% |
| Barclays Capital Municipal Bond Index | 9.49 | 4.68 | 4.23 |
| Citigroup Three-Month U.S. Treasury Bill Index | 0.15 | 2.07 | 2.84 |
| |
| CPI | | | |
| Consumer Price Index | 2.63% | 2.30% | 2.59% |
3
Although the fiscal year’s returns were a welcome relief for stock investors worldwide, the severity of the financial crisis continues to depress the longer-term record, especially for U.S. stocks.
Bond returns traced very different courses
The U.S. government’s programs also soothed parts of the bond market as the fiscal year progressed. At the start of the period, the difference between the yields of corporate bonds and those of U.S. Treasuries had widened almost to levels last seen in the 1930s, an indication of just how unwilling investors were to take on risk. As the threat of a depression receded, however, confidence returned and investors flocked to the lowest-quality, highest-yielding bonds, passing over conservative Treasuries, the previous year’s favorite.
For the 12 months ended January 31, the broad taxable bond market returned 8.51%, municipal bonds returned about 9%, and high-yield corporate bonds delivered a stunning 51%. Meanwhile, Treasury returns were negative to lackluster, depending on their maturity.
While the Federal Reserve’s monetary policies seemed to help the stock market and most areas of the bond market, the policies exacted a heavy price from money market investors. The Fed kept the federal funds rate––the interest rate that banks charge one another for overnight lending,
| | |
| Expense Ratios | | |
| Your Fund Compared With Its Peer Group | | |
| | | Peer Group |
| | Fund | Average |
| Dividend Growth Fund | 0.38% | 1.27% |
The fund expense ratio shown is from the prospectus dated October 2, 2009, and represents estimated costs for the current fiscal year based on the fund’s net assets as of the prospectus date. For the fiscal year ended January 31, 2010, the fund’s expense ratio was 0.38%. The peer-group expense ratio is derived from data provided by Lipper Inc. and captures information through year-end 2009.
Peer group: Large-Cap Core Funds.
4
a benchmark for the market’s short-term rates––between 0% and 0.25% during the entire fiscal year.
Although the Fed said it planned to maintain that stance for an “extended period,” it recently indicated that it was ready to wind down emergency measures and would halt its purchase of agency mortgage-backed securities and debt in the coming months.
The fund’s holdings posted mixed results
The Dividend Growth Fund takes a different approach than that of many other dividend-focused funds. Rather than concentrate on stocks with particularly high current dividends, the fund’s advisor maintains a longer and broader view.
Wellington Management searches for companies that can increase their dividends over time with cash generated by strong business operations.
Compared with other dividend-focused funds, the result can be a portfolio with a lower current 30-day SEC yield. An equity-income fund, for example, might have a high current yield and heavy weightings in traditionally slower-growing, higher-yielding sectors such as utilities. Vanguard Dividend Growth Fund, by contrast, tends to seek companies that can boost payouts over time, even if current yields are unexceptional.
Some of the fund’s best returns came from the health care sector. The fund benefited from owning both Schering-
| |
| Total Returns | |
| Ten Years Ended January 31, 2010 | |
| | Average |
| | Annual Return |
| Dividend Growth Fund | 1.76% |
| Dividend Growth Spliced Index | -0.80 |
| Dividend Growth Spliced Average | -2.62 |
Dividend Growth Spliced Index: Prior to December 6, 2002, the comparative benchmark was known as the Utilities Composite Index. The index weightings were: 40% S&P Utilities Index, 40% S&P Telephone Index, and 20% Lehman Utility Bond Index through April 30, 1999; 63.75% S&P Utilities Index, 21.25% S&P Telephone Index, and 15% Lehman Utility Bond Index through March 31, 2000; 75% S&P Utilities Index and 25% S&P Telephone Index through December 31, 2001; and 75% S&P Utilities Index and 25% S&P Integrated Telecommunication Services Index through December 6, 2002. The fund’s benchmark was the Russell 1000 Index through January 31, 2010, after which it was changed to the Dividend Achievers Select Index. The Dividend Achievers Select Index is administered exclusively for Vanguard by Mergent, Inc.
Dividend Growth Spliced Average: Based on the Utility Funds Average through December 6, 2002, and the Large-Cap Core Funds Average thereafter. Derived from data provided by Lipper Inc.
The figures shown represent past performance, which is not a guarantee of future results. (Current performance may be lower or higher than the performance data cited. For performance data current to the most recent month-end, visit our website at www.vanguard.com/performance.) Note, too, that both investment returns and principal value can fluctuate widely, so an investor’s shares, when sold, could be worth more or less than their original cost.
5
Plough, which rose after receiving a premium buyout offer from Merck, and Pfizer, which advanced after acquiring Wyeth. With oil prices increasing during the period, the fund’s energy holdings rose on the strength of several oil and fuel companies as well as energy equipment stock Schlumberger. Strong stock selection also made a difference in the consumer staples category, particularly among food retailers and beverage and household products companies.
Although the fund’s holdings in the information technology, financial, industrial, and consumer discretionary sectors were among its best performers and made significant contributions to total return, they didn’t keep pace with their counterparts in the benchmark.
The fund did not hold two of the index’s strongest technology stocks, neither of which pays a dividend. Also, it did not own a major bank that advanced despite slashing its dividend, or several consumer discretionary stars from the automobile, Internet, and retailing industries. In the industrial sector, the fund’s aerospace and defense stocks weighed on performance.
Long-term record stands above benchmark
The Dividend Growth Fund changed its mandate and strategy over the decade ended January 31, 2010. Founded in 1992 as Vanguard Utilities Income Fund, the fund became the more broadly diversified Dividend Growth Fund in 2002. Since the transformation, the fund’s advisor has focused on a relatively small number of holdings––the fund contained 49 stocks
at the end of the fiscal year––selected for their potential to increase dividends over time.
The Dividend Growth Fund has recorded an annualized return of 1.76% over the past ten years. Although this return is disappointing, the fund did surpass the returns of its comparative standards, which incorporate the fund’s former and present mandates. Because of the fund’s 2002 change in strategy, this information is less meaningful than it is for other funds.
One thing that has remained constant is the fund’s commitment to keeping expenses low, which provides a significant cost advantage over rivals. Wellington Management is also dedicated to maintaining its approach of investing in companies that have the potential and willingness to raise their dividends.
Dividends can play role in a diversified portfolio
Although the stock market rallied strongly through most of the fiscal year, volatility returned in the final weeks. In the short term, it’s uncertain whether the market will resume its healthy recovery or succumb to more turmoil.
As frustrating as the stock market’s gyrations can be for investors, Vanguard believes that maintaining a well-balanced and diversified portfolio makes sense. That’s why we counsel investors to create an investment plan that includes an asset mix of stocks, bonds, and short-term investments appropriate for their long-term goals, financial objectives, and risk tolerance.
6
Vanguard Dividend Growth Fund can play an especially useful role in the portfolios of income-oriented investors. With its dual emphasis on current dividends and a company’s ability to increase its dividend over time, the fund aims to channel some of the stock market’s potential for growth into steadily rising income distributions. And with its low costs, the Dividend Growth Fund helps maximize your share of this strategy’s potential rewards.
On another matter, I would like to inform you that as of January 1, 2010, we completed a leadership transition that began in March 2008. I succeeded Jack Brennan as chairman of Vanguard and each of the funds. Jack has agreed to serve as chairman emeritus and senior advisor. Under Jack’s leadership, Vanguard has grown to become a preeminent firm in the mutual fund industry. Jack’s energy, his relentless pursuit of perfection, and his unwavering focus on always doing the right thing for our clients are evident in every facet of Vanguard policy today.
Thank you for investing with Vanguard.
Sincerely,

F. William McNabb III
Chairman and Chief Executive Officer
February 11, 2010
7
Advisor’s Report
Vanguard Dividend Growth Fund returned 26.01% for the 12 months ended January 31, 2010. Large- and mid-capitalization stocks, as measured by the Russell 1000 Index, returned 34.81% for the period, and the average return of large-cap core mutual funds was 33.23%.
The investment environment
The powerful rally in global equity markets in 2009 presented both a challenge and an opportunity. The “high beta” or “lower quality” nature of the rally largely excluded most of the fund’s holdings, but we were heartened for two reasons. First, the fund’s relative underperformance was what we might have predicted given the nature of the rally. It confirmed for us that the fund is very high quality in its character. Second, the sources of liquidity for the lower-quality rally were higher-quality, dividend-paying stocks. So while performance suffered as prices of these dividend-paying stocks weakened, we were able to increase our existing positions and add new ones at much lower prices, increasing the fund’s quality at lower cost.
The fund’s successes
On an absolute basis, all sectors contributed positive performance during the period. The fund’s holdings in the information technology, industrials, and consumer staples sectors contributed the most. Among the portfolio’s top absolute contributors were Staples, Schlumberger, United Parcel Service, and Microsoft.
All but five of the companies held in the fund last year boosted their annual payouts. At our last writing, in August, we estimated that the average dividend growth rate for the fund would be roughly 4%. Subsequently, several companies announced increases, thus boosting the final growth rate to 9.1%. The actual growth rate is also modestly understated because we purchased Pfizer and Wells Fargo after they announced dividend cuts.
The fund’s shortfalls
We had a number of individual stocks that detracted from the fund’s performance during the 12 months. Among the more noteworthy detractors were ExxonMobil, Abbott Laboratories, and Lockheed Martin. While we would prefer all the stocks in the fund to perform well at all times, it is inevitable that some holdings will detract from the fund’s performance over a given time period. We assess a stock’s contribution to the fund over a longer time frame and with an eye consistently focused on dividend action. In calendar-year 2009, these three companies raised their dividends by 7%, 11%, and 28%, respectively.
The fund’s positioning and strategy
Our primary objective is to identify companies that we believe will steadily and reliably increase their dividend payments. We seek to fulfill this objective by carefully building the portfolio one stock at a time, giving central consideration to each company’s dividend growth prospects.
Our industry weightings are a result of
8
this process. The fund continues to have significant positions in health care, industrials, energy, and consumer staples, while having less exposure to the utilities, technology, and financial sectors.
Calendar-year 2009 was an eventful period marked by one of the most powerful equity market recoveries in history. While we are pleased with the absolute gains made by the fund, we are mindful that the performance relative to the broader market was underwhelming. As always, we measure success, in large part, by looking at the dividend growth among our holdings. On this count, we view 2009 as successful. Over the long run, we believe a diligent application of our investment approach will lead to excellent absolute and relative performance. Nothing we experienced in the past year has altered this view.
Donald J. Kilbride
Senior Vice President and Equity Portfolio Manager
Wellington Management Company, LLP
February 8, 2010
9
Dividend Growth Fund
Fund Profile
As of January 31, 2010
| | | |
| Portfolio Characteristics | | |
| | | | DJ |
| | | Russell | U.S. Total |
| | | 1000 | Market |
| | Fund | Index | Index |
| Number of Stocks | 49 | 963 | 4,185 |
| Median Market Cap | $56.6B | $33.0B | $29.6B |
| Price/Earnings Ratio | 14.0x | 24.3x | 26.4x |
| Price/Book Ratio | 2.8x | 2.1x | 2.1x |
| Return on Equity | 24.8% | 20.1% | 19.2% |
| Earnings Growth Rate | 7.8% | 8.0% | 7.7% |
| Dividend Yield | 2.9% | 2.0% | 1.9% |
| Foreign Holdings | 7.6% | 0.0% | 0.0% |
| Turnover Rate | 24% | — | — |
| Ticker Symbol | VDIGX | — | — |
| Expense Ratio1 | 0.38% | — | — |
| 30-Day SEC Yield | 2.19% | — | — |
| Short-Term Reserves | 4.6% | — | — |
| | | |
| Sector Diversification (% of equity exposure) |
| | | | DJ |
| | | Russell | U.S. Total |
| | | 1000 | Market |
| | Fund | Index | Index |
| Consumer | | | |
| Discretionary | 9.5% | 10.3% | 10.4% |
| Consumer Staples | 16.5 | 11.0 | 10.1 |
| Energy | 13.3 | 11.2 | 10.5 |
| Financials | 8.6 | 14.7 | 16.6 |
| Health Care | 18.0 | 13.1 | 13.1 |
| Industrials | 16.0 | 10.7 | 10.8 |
| Information | | | |
| Technology | 13.1 | 18.3 | 18.1 |
| Materials | 1.5 | 3.8 | 3.8 |
| Telecommunication | | | |
| Services | 1.8 | 3.0 | 2.8 |
| Utilities | 1.7 | 3.9 | 3.8 |
| | |
| Volatility Measures | | |
| | | DJ |
| | | U.S. Total |
| | Russell 1000 | Market |
| | Index | Index |
| R-Squared | 0.95 | 0.94 |
| Beta | 0.77 | 0.76 |
These measures show the degree and timing of the fund’s fluctuations compared with the indexes over 36 months.
| | |
| Ten Largest Holdings (% of total net assets) |
| Automatic Data | Data Processing & | |
| Processing Inc. | Outsourced | |
| | Services | 3.4% |
| Johnson & Johnson | Pharmaceuticals | 3.2 |
| United Parcel Service Inc. | Air Freight & | |
| Class B | Logistics | 2.8 |
| Exxon Mobil Corp. | Integrated Oil & | |
| | Gas | 2.7 |
| Procter & Gamble Co. | Household | |
| | Products | 2.6 |
| Sysco Corp. | Food Distributors | 2.5 |
| Cardinal Health Inc. | Health Care | |
| | Distributors | 2.5 |
| PepsiCo Inc. | Soft Drinks | 2.5 |
| BG Group PLC | Integrated Oil & | |
| | Gas | 2.5 |
| Pfizer Inc. | Pharmaceuticals | 2.4 |
| Top Ten | | 27.1% |
The holdings listed exclude any temporary cash investments and equity index products.
Investment Focus
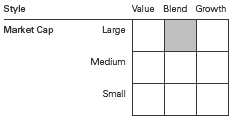
1 The expense ratio shown is from the prospectus dated October 2, 2009, and represents estimated costs for the current fiscal year based on the fund’s net assets as of the prospectus date. For the fiscal year ended January 31, 2010, the expense ratio was 0.38%.
10
Dividend Growth Fund
Performance Summary
All of the returns in this report represent past performance, which is not a guarantee of future results that may be achieved by the fund. (Current performance may be lower or higher than the performance data cited. For performance data current to the most recent month-end, visit our website at www.vanguard.com/performance.) Note, too, that both investment returns and principal value can fluctuate widely, so an investor’s shares, when sold, could be worth more or less than their original cost. The returns shown do not reflect taxes that a shareholder would pay on fund distributions or on the sale of fund shares.
Cumulative Performance: January 31, 2000, Through January 31, 2010
Initial Investment of $10,000
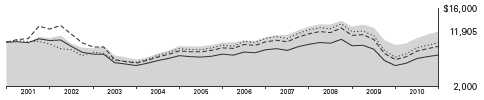
| | | | |
| | Average Annual Total Returns | |
| | Periods Ended January 31, 2010 | |
| | | | | Final Value |
| | One | Five | Ten | of a $10,000 |
| | Year | Years | Years | Investment |
| Dividend Growth Fund | 26.01% | 3.75% | 1.76% | $11,905 |
| Dow Jones U.S. Total Stock Market | | | | |
| Index | 36.06 | 0.94 | -0.09 | 9,907 |
| Dividend Growth Spliced Index | 34.81 | 0.57 | -0.80 | 9,224 |
| Dividend Growth Spliced Average | 33.23 | -0.40 | -2.62 | 7,665 |
Note: Prior to December 6, 2002, the fund was known as the Utilities Income Fund.
Dividend Growth Spliced Index: Prior to December 6, 2002, the comparative benchmark was known as the Utilities Composite Index. The index weightings were: 40% S&P Utilities Index, 40% S&P Telephone Index, and 20% Lehman Utility Bond Index through April 30, 1999; 63.75% S&P Utilities Index, 21.25% S&P Telephone Index, and 15% Lehman Utility Bond Index through March 31, 2000; 75% S&P Utilities Index and 25% S&P Telephone Index through December 31, 2001; and 75% S&P Utilities Index and 25% S&P Integrated Telecommunication Services Index through December 6, 2002. The fund’s benchmark was the Russell 1000 Index through January 31, 2010, after which it was changed to the Dividend Achievers Select Index. The Dividend Achievers Select Index is administered exclusively for Vanguard by Mergent, Inc.
Dividend Growth Spliced Average: Based on the Utility Funds Average through December 6, 2002, and the Large-Cap Core Funds Average thereafter. Derived from data provided by Lipper Inc.
Vanguard fund total returns do not include any transaction or account fees that applied in the periods shown. Fund prospectuses provide information about current fees.
See Financial Highlights for dividend and capital gains information.
11
Dividend Growth Fund
Fiscal-Year Total Returns (%): January 31, 2000, Through January 31, 2010
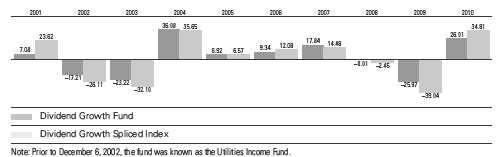
Average Annual Total Returns: Periods Ended December 31, 2009
This table presents average annual total returns through the latest calendar quarter—rather than through the end of
the fiscal period. Securities and Exchange Commission rules require that we provide this information.
| | | | |
| | Inception | One | Five | Ten |
| | Date | Year | Years | Years |
| Dividend Growth Fund | 5/15/1992 | 21.74% | 3.86% | 2.45% |
Vanguard fund total returns do not include any transaction or account fees that applied in the periods shown. Fund prospectuses provide information about current fees.
12
Dividend Growth Fund
Financial Statements
Statement of Net Assets
As of January 31, 2010
The fund reports a complete list of its holdings in regulatory filings four times in each fiscal year, at the quarter-ends. For the second and fourth fiscal quarters, the lists appear in the fund’s semiannual and annual reports to shareholders. For the first and third fiscal quarters, the fund files the lists with the Securities and Exchange Commission on Form N-Q. Shareholders can look up the fund’s Forms N-Q on the SEC’s website at www.sec.gov. Forms N-Q may also be reviewed and copied at the SEC’s Public Reference Room (see the back cover of this report for further information).
| | |
| | | Market |
| | | Value• |
| | Shares | ($000) |
| Common Stocks (95.6%) | | |
| Consumer Discretionary (9.1%) | |
| Staples Inc. | 2,435,600 | 57,139 |
| McDonald’s Corp. | 911,700 | 56,918 |
| Lowe’s Cos. Inc. | 2,439,100 | 52,807 |
| Walt Disney Co. | 1,530,300 | 45,220 |
| NIKE Inc. Class B | 700,900 | 44,682 |
| | | 256,766 |
| Consumer Staples (15.8%) | | |
| Procter & Gamble Co. | 1,185,100 | 72,943 |
| Sysco Corp. | 2,562,000 | 71,710 |
| PepsiCo Inc. | 1,172,100 | 69,881 |
| Wal-Mart Stores Inc. | 1,222,400 | 65,313 |
| Colgate-Palmolive Co. | 539,300 | 43,160 |
| Kimberly-Clark Corp. | 708,800 | 42,096 |
| Walgreen Co. | 1,165,200 | 42,005 |
| Coca-Cola Co. | 686,500 | 37,243 |
| | | 444,351 |
| Energy (12.8%) | | |
| Exxon Mobil Corp. | 1,173,900 | 75,634 |
| BG Group PLC | 3,758,702 | 69,099 |
| Chevron Corp. | 897,600 | 64,735 |
| Total SA ADR | 1,087,500 | 62,629 |
| Schlumberger Ltd. | 806,100 | 51,155 |
| BP PLC ADR | 628,300 | 35,260 |
| | | 358,512 |
| Financials (8.2%) | | |
| Wells Fargo & Co. | 2,086,300 | 59,314 |
| ACE Ltd. | 1,096,600 | 54,029 |
| Chubb Corp. | 1,035,400 | 51,770 |
| Marsh & | | |
| McLennan Cos. Inc. | 1,737,300 | 37,456 |
| JPMorgan Chase & Co. | 749,500 | 29,186 |
| | | 231,755 |
| Health Care (17.1%) | | |
| Johnson & Johnson | 1,436,700 | 90,311 |
| Cardinal Health Inc. | 2,150,400 | 71,114 |
| Pfizer Inc. | 3,594,000 | 67,064 |
| Medtronic Inc. | 1,524,000 | 65,364 |
| | |
| | | Market |
| | | Value• |
| | Shares | ($000) |
| Eli Lilly & Co. | 1,603,700 | 56,450 |
| Abbott Laboratories | 931,000 | 49,287 |
| AstraZeneca PLC ADR | 995,300 | 46,272 |
| Merck & Co. Inc. | 909,500 | 34,725 |
| | | 480,587 |
| Industrials (15.3%) | | |
| United Parcel Service Inc. | | |
| Class B | 1,376,900 | 79,544 |
| General Dynamics Corp. | 955,100 | 63,848 |
| Honeywell International Inc. | 1,645,500 | 63,582 |
| Lockheed Martin Corp. | 846,800 | 63,104 |
| United Technologies Corp. | 660,500 | 44,571 |
| Emerson Electric Co. | 1,043,800 | 43,359 |
| Waste Management Inc. | 1,225,600 | 39,280 |
| Illinois Tool Works Inc. | 774,100 | 33,743 |
| | | 431,031 |
| Information Technology (12.5%) | |
| Automatic Data | | |
| Processing Inc. | 2,364,300 | 96,440 |
| Accenture PLC Class A | 1,551,500 | 63,596 |
| Microsoft Corp. | 2,025,300 | 57,073 |
| International Business | | |
| Machines Corp. | 414,700 | 50,755 |
| Western Union Co. | 2,626,400 | 48,693 |
| Linear Technology Corp. | 1,381,100 | 36,047 |
| | | 352,604 |
| Materials (1.5%) | | |
| Praxair Inc. | 538,700 | 40,575 |
| |
| Telecommunication Services (1.7%) | |
| AT&T Inc. | 1,912,700 | 48,506 |
| |
| Utilities (1.6%) | | |
| Dominion Resources Inc. | 1,206,500 | 45,195 |
| Total Common Stocks | | |
| (Cost $2,483,038) | | 2,689,882 |
13
Dividend Growth Fund
| | |
| | Face | Market |
| | Amount | Value• |
| | ($000) | ($000) |
| Temporary Cash Investment (4.6%) | |
| Repurchase Agreement (4.6%) | |
| Credit Suisse Securities | | |
| (USA) LLC 0.120%, 2/1/10 | |
| (Dated 1/29/10, Repurchase | |
| Value $129,001,000, | | |
| collateralized by Federal | |
| Home Loan Mortgage Corp. | |
| 4.500%–6.500%, | | |
| 12/1/30–4/1/38) | | |
| (Cost $129,000) | 129,000 | 129,000 |
| Total Investments (100.2%) | | |
| (Cost $2,612,038) | | 2,818,882 |
| Other Assets and Liabilities (-0.2%) | |
| Other Assets | | 9,226 |
| Liabilities | | (13,782) |
| | | (4,556) |
| Net Assets (100%) | | |
| Applicable to 219,493,145 outstanding | |
| $.001 par value shares of beneficial | |
| interest (unlimited authorization) | 2,814,326 |
| Net Asset Value Per Share | | $12.82 |
| |
| At January 31, 2010, net assets consisted of: |
| | Amount |
| | ($000) |
| Paid-in Capital | 2,737,968 |
| Overdistributed Net Investment Income | (406) |
| Accumulated Net Realized Losses | (130,080) |
| Unrealized Appreciation (Depreciation) | 206,844 |
| Net Assets | 2,814,326 |
• see note a in notes to financial statements.
adr—american depositary receipt.
see accompanying notes, which are an integral part of the financial statements.
14
| |
| Dividend Growth Fund | |
| |
| |
| Statement of Operations | |
| |
| | Year Ended |
| | January 31, 2010 |
| | ($000) |
| Investment Income | |
| Income | |
| Dividends1 | 63,787 |
| Interest | 125 |
| Security Lending | 299 |
| Total Income | 64,211 |
| Expenses | |
| Investment Advisory Fees—Note B&n bsp; | |
| Basic Fee | 2,411 |
| Performance Adjustment | 755 |
| The Vanguard Group—Note C | |
| Management and Administrati ve | 4,347 |
| Marketing and Distribution | 483 |
| Custodian Fees | 33 |
| Auditing Fees | 23 |
| Shareholders’ Reports and Proxies | 166 |
| Trustees’ Fees and Expenses | 5 |
| Total Expenses | 8,223 |
| Expenses Paid Indirectly | (45) |
| Net Expenses | 8,178 |
| Net Investment Income | 56,033 |
| Realized Net Gain (Loss) | |
| Investment Securities Sold | (44,783) |
| Foreign Currencies | (104) |
| Covered Call Options Written | 1,879 |
| Realized Net Gain (Loss) | (43,008) |
| Change in Unrealized Appreciation (Depreciation) of Investment Securities | 461,001 |
| Net Increase (Decrease) in Net Assets Resulting from Operations | 474,026 |
| 1 Dividends are net of foreign withholding taxes of $536,000. | |
| |
| |
| |
| |
| See accompanying Notes, which are an integral part of the Financial Statements. | |
15
| | |
| Dividend Growth Fund | | |
| |
| |
| Statement of Changes in Net Assets | | |
| |
| | Year Ended January 31, |
| | 2010 | 2009 |
| | ($000) | ($000) |
| Increase (Decrease) in Net Assets | | |
| Operations | | |
| Net Investment Income | 56,033 | 34,785 |
| Realized Net Gain (Loss) | (43,008) | (83,870) |
| Change in Unrealized Appreciation (Depreciation) | 461,001 | (437,850) |
| Net Increase (Decrease) in Net Assets Resulting from Operations | 474,026 | (486,935) |
| Distributions | | |
| Net Investment Income | (56,342) | (34,618) |
| Realized Capital Gain | — | — |
| Total Distributions | (56,342) | (34,618) |
| Capital Share Transactions | | |
| Issued | 1,162,613 | 1,222,167 |
| Issued in Lieu of Cash Distributions | 47,849 | 29,865 |
| Redeemed | (558,468) | (311,560) |
| Net Increase (Decrease) from Capital Share Transactions | 651,994 | 940,472 |
| Total Increase (Decrease) | 1,069,678 | 418,919 |
| Net Assets | | |
| Beginning of Period | 1,744,648 | 1,325,729 |
| End of Period1 | 2,814,326 | 1,744,648 |
| 1 Net Assets—End of Period includes undistributed (overdistributed) net investment income of ($406,000) and $7,000. | |
See accompanying Notes, which are an integral part of the Financial Statements.
16
| | | | | |
| Dividend Growth Fund | | | | | |
| |
| |
| Financial Highlights | | | | | |
| |
| |
| For a Share Outstanding | | | Year Ended January 31, |
| Throughout Each Period | 2010 | 2009 | 2008 | 2007 | 2006 |
| Net Asset Value, Beginning of Period | $10.42 | $14.38 | $14.74 | $12.75 | $11.89 |
| Investment Operations | | | | | |
| Net Investment Income | .291 | .264 | .290 | .260 | .220 |
| Net Realized and Unrealized Gain (Loss) | | | | | |
| on Investments | 2.401 | (3.960) | (.270) | 1.990 | .880 |
| Total from Investment Operations | 2.692 | (3.696) | .020 | 2.250 | 1.100 |
| Distributions | | | | | |
| Dividends from Net Investment Income | (.292) | (.264) | (.280) | (.260) | (.240) |
| Distributions from Realized Capital Gains | — | — | (.100) | — | — |
| Total Distributions | (.292) | (.264) | (.380) | (.260) | (.240) |
| Net Asset Value, End of Period | $12.82 | $10.42 | $14.38 | $14.74 | $12.75 |
| |
| Total Return1 | 26.01% | -25.97% | -0.01% | 17.84% | 9.34% |
| |
| Ratios/Supplemental Data | | | | | |
| Net Assets, End of Period (Millions) | $2,814 | $1,745 | $1,326 | $1,243 | $995 |
| Ratio of Total Expenses to | | | | | |
| Average Net Assets2 | 0.38% | 0.36% | 0.32% | 0.38% | 0.37% |
| Ratio of Net Investment Income to | | | | | |
| Average Net Assets | 2.59% | 2.25% | 1.91% | 1.93% | 1.85% |
| Portfolio Turnover Rate | 24% | 28% | 36% | 41% | 16% |
1 Total returns do not include the account service fee that may be applicable to certain accounts with balances below $10,000.
2 Includes performance-based investment advisory fee increases (decreases) of 0.03%, 0.03%, 0.00%, 0.01%, and 0.01%.
See accompanying Notes, which are an integral part of the Financial Statements.
17
Dividend Growth Fund
Notes to Financial Statements
Vanguard Dividend Growth Fund is registered under the Investment Company Act of 1940 as an openend investment company, or mutual fund.
A. The following significant accounting policies conform to generally accepted accounting principles for
U.S. mutual funds. The fund consistently follows such policies in preparing its financial statements.
1. Security Valuation: Securities are valued as of the close of trading on the New York Stock Exchange (generally 4 p.m., Eastern time) on the valuation date. Equity securities are valued at the latest quoted sales prices or official closing prices taken from the primary market in which each security trades; such securities not traded on the valuation date are valued at the mean of the latest quoted bid and asked prices. Securities for w hich market quotations are not readily available, or whose values have been affected by events occurring before the fund’s pricing time but after the close of the securities’ primary markets, are valued at their fair values calculated according to procedures adopted by the board of trustees. These procedures include obtaining quotations from an independent pricing service, monitoring news to identify significant mar ket- or security-specific events, and evaluating changes in the values of foreign market proxies (for example, ADRs, futures contracts, or exchange-traded funds), between the time the foreign markets close and the fund’s pricing time. When fair-value pricing is employed, the prices of securities used by a fund to calculate its net asset value may di ffer from quoted or published prices for the same securities. Temporary cash investments acquired over 60 days to maturity are valued using the latest bid prices or using valuations based on a matrix system (which considers such factors as security prices, yields, maturities, and ratings), both as furnished by independent pricing services. Other temporary cash investments are valued at amortized cost, which approximates market value.
2. Foreign Currency: Securities and other assets and liabilities denominated in foreign currencies are translated into U.S. dollars using exchange rates obtained from an independent third party as of the fund’s pricing time on the valuation date. Realized gains (losses) and unrealized appreciatio n
(depreciation) on investment securities include the effects of changes in exchange rates since the securities were purchased, combined with the effects of changes in security prices. Fluctuations in the value of other assets and liabilities resulting from changes in exchange rates are recorded as unrealized foreign currency gains (losses) until the assets or liabilities are settled in cash, at which time they are recorded as realized foreign currency gains (losses).
3. Covered Call Options Written: The fund may write covered call options on security holdings that are considered to be attractive long-term investments but are believed to be overvalued in the short-term. When the fund writes options, the premium received by the fund is recorded as an asset with an equal liability that is marked-to-market to reflect the current market value of the options written.
Fluctuations in the value of the options are recorded as unrealized appreciation (depreciation) until expired, closed, or exercised, at which time realized gains (losses) are recognized. Options are valued at their latest quoted sales prices. Options not traded on the valuation date are valued at the latest quoted asked prices.
4. Repurchase Agreements: The fund may invest in repurchase agreements. Securities pledged as collateral for repurchase agreements are held by a custodian bank until the agreements mature. Each agreement requires that the market value of the collateral be sufficient to cover payments of interest and principal; however, in the event of default or bankruptcy by the other party to the agreement, retention of the collateral may be subject to legal proceedings.
18
Dividend Growth Fund
5. Federal Income Taxes: The fund intends to continue to qualify as a regulated investment company and distribute all of its taxable income. Management has analyzed the fund’s tax positions taken for all open federal income tax years (January 31, 2007–2010), and has concluded that no provision for federal income tax is required in the fund’s financial statements.
6. Distributions: Distributions to shareholders are recorded on the ex-dividend date.
7. Security Lending: The fund may lend its securities to qualified institutional borrowers to earn additional income. Security loans are required to be secured at all times by collateral at least equal to the market value of securities loaned. The fund invests cash collateral received in Vanguard Market Liquidity Fund, and records a liability for the return of the collateral, during the period the securities are on loan. Security lending income represents the income earned on investing cash collateral, less expenses associated with the loan.
8. Other: Dividend income is recorded on the ex-dividend date. Interest income is accrued daily. Security transactions are accounted for on the date securities are bought or sold. Costs used to determine realized gains (losses) on the sale of investment securities are those of the specific securities sold.
B. Wellington Management Company, LLP, provides investment advisory services to the fund for a fee calculated at an annual percentage rate of average net assets. The basic fee is subject to quarterly adjustments based on the fund’s performance for the preceding three years relative to the Russell 1000 Index. For the year ended January 31, 2010, the investment advisory fee represented an effective annual basic rate of 0.11% of the fund’s average net assets before an increase of $755,000 (0.03%) based on performance.
Effective February 1, 2010, the investment advisory fee will be subject to quarterly adjustments based on performance for the preceding three years relative to the Russell 1000 Index for periods prior to February 1, 2010, and the Dividend Achievers Select Index beginning February 1, 2010.
C. The Vanguard Group furnishes at cost corporate management, administrative, marketing, and distribution services. The costs of such services are allocated to the fund under methods approved by the board of trustees. The fund has committed to provide up to 0.40% of its net assets in capital contributions to Vanguard. At January 31, 2010, the fund had contributed capital of $547,000 to Vanguard (included in Other Assets), representing 0.02% of the fund’s net assets and 0.22% of
Vanguard’s capitalization. The fund’s trustees and officers are also directors and officers of Vanguard.
D. The fund has asked its investment advisor to direct certain security trades, subject to obtaining the best price and execution, to brokers who have agreed to rebate to the fund part of the commissions generated. Such rebates are used solely to reduce the fund’s management and administrative expenses. For the year ended January 31, 2010, these arrangements r educed the fund’s expenses by $45,000 (an annual rate of 0.00% of average net assets).
E. Various inputs may be used to determine the value of the fund’s investments. These inputs are summarized in three broad levels for financial statement purposes. The inputs or methodologies used to value securities are not necessarily an indication of the risk associated with investing in those securities.
19
Dividend Growth Fund
Level 1 — Quoted prices in active markets for identical securities.
Level 2 — Other significant observable inputs (including quoted prices for similar securities, interest rates, prepayment speeds, credit risk, etc.).
Level 3 — Significant unobservable inputs (including the fund’s own assumptions used to determine the fair value of investments).
The following table summarizes the fund’s investments as of January 31, 2010, based on the inputs used to value them:
| | | |
| | Level 1 | Level 2 | Level 3 |
| Investments | ($000) | ($000) | ($000) |
| Common Stocks | 2,620,783 | 69,099 | — |
| Temporary Cash Investments | ---- | 129,000 | — |
| Total | 2,620,783 | 198,099 | — |
F. The following table summarizes the fund’s covered call options written during the year ended January 31, 2010:
| | |
| | Number of | Premiums |
| | Contracts | Received |
| Covered Call Options | Written | ($000) |
| Balance at January 31, 2009 | — | — |
| Options Written | 11,913 | 1,879 |
| Options Expired | 11,913 | 1,879 |
| Options Closed | — | — |
| Options Exercised | — | — |
| Options Open at January 31, 2010 | ---- | ---- |
G. Distributions are determined on a tax basis and may differ from net investment income and realized capital gains for financial reporting purposes. Differences may be permanent or temporary. Permanent differences are reclassified among capital accounts in the financial statements to reflect their tax character. Temporary differences arise when certain items of income, expense, gain, or loss are recognized in different periods for financial statement and tax purposes; these differences will reverse at some time in the future. Differences in classification may also result from the treatment of shor t-term gains as ordinary income for tax purposes.
During the year ended January 31, 2010, the fund realized net foreign currency losses of $104,000, which decreased distributable net income for tax purposes; accordingly, such losses have been reclassified from accumulated net realized losses to overdistributed net investment income.
For tax purposes, at January 31, 2010, the fund had $2,811,000 of ordinary income available for distribution. The fund had available capital loss carryforwards totaling $129,664,000 to offset future net capital gains of $17,975,000 through January 31, 2017, and $111,689,000 through January 31, 2018.
20
Dividend Growth Fund
At January 31, 2010, the cost of investment securities for tax purposes was $2,612,038,000. Net unrealized appreciation of investment securities for tax purposes was $206,844,000, consisting of unrealized gains of $246,172,000 on securities that had risen in value since their purchase and $39,328,000 in unrealized losses on securities that had fallen in value since their purchase.
H. During the year ended January 31, 2010, the fund purchased $1,149,827,000 of investment securities and sold $493,217,000 of investment securities, other than temporary cash investments.
| | |
| I. Capital shares issued and redeemed were: | | |
| | Year Ended January 31, |
| | 2010 | 2009 |
| | Shares | Shares |
| | (000) | (000) |
| Issued | 97,395 | 97,909 |
| Issued in Lieu of Cash Distributions | 3,923 | 2,499 |
| Redeemed | (49,252) | (25,173) |
| Net Increase (Decrease) in Shares Outstanding | 52,066 | 75,235 |
J. In preparing the financial statements as of January 31, 2010, management considered the impact of subsequent events for potential recognition or disclosure in these financial statements.
21
Report of Independent Registered Public Accounting Firm
To the Trustees of Vanguard Specialized Funds and the Shareholders of Vanguard Dividend Growth Fund:
In our opinion, the accompanying statement of net assets and the related statements of operations and of changes in net assets and the financial highlights present fairly, in all material respects, the financial position of Vanguard Dividend Growth Fund (constituting a separate portfolio of Vanguard
Specialized Funds, hereafter referred to as the “Fund”) at January 31, 2010, the results of its operations for the year then ended, the changes in its net assets for each of the two years in the period then ended and the financial highlights for each of the five years in the period then ended, in conformity with accounting principles generally accepted in the United States of America. These financial statements and financial highlights (hereafter referred to as “financial statements”) are the responsibility of the Fund’s management; our responsibility is to express an opinion on these financial state ments based on our audits. We conducted our audits of these financial statements in accordance with the standards of the Public Company Accounting Oversight Board (United States). Those standards require that we plan and perform the audit to obtain reasonable assurance about whether the financial statements are free of material misstatement. An audit includes examining, on a test basis, evidence supporting the amounts and disclosures in the financial statements, assessing the accounting principles used and significant estimates made by management, and evaluating the overall financial statement presentation. We believe that our audits, which included confirmation of securities at January 31, 2010 by correspondence with the custodians and broker, provide a reasonable basis for our opinion.
PricewaterhouseCoopers LLP
Philadelphia, Pennsylvania
March 16, 2010
| Special 2009 tax information (unaudited) for Vanguard Dividend Growth Fund |
This information for the fiscal year ended January 31, 2010, is included pursuant to provisions of the Internal Revenue Code.
The fund distributed $56,342,000 of qualified dividend income to shareholders during the fiscal year.
For corporate shareholders, 92.3% of investment income (dividend income plus short-term gains, if any) qualifies for the dividends-received deduction.
22
Your Fund’s After-Tax Returns
This table presents returns for your fund both before and after taxes. The after-tax returns are shown in two ways: (1) assuming that an investor owned the fund during the entire period and paid taxes on the fund’s distributions, and (2) assuming that an investor paid taxes on the fund’s distributions and sold all shares at the end of each period.
Calculations are based on the highest individual federal income tax and capital gains tax rates in effect at the times of the distributions and the hypothetical sales. State and local taxes were not considered. After-tax returns reflect any qualified dividend income , using actual prior-year figures and estimates for 2010. (In the example, returns after the sale of fund shares may be higher than those assuming no sale. This occurs when the sale would have produced a capital loss. The calculation assumes that the investor received a tax deduction for the loss.) Please note that your actual after-tax returns will depend on your tax situation and may differ from those shown. Also note that if you own the fund in a tax-deferred account, such as an individual retirement account or a 401(k) plan, this information does not apply to you. Such accounts are not subject to current taxes.
Finally, keep in mind that a fund’s performance—whether before or after taxes—does not guarantee future results.
| | | |
| Average Annual Total Returns: Dividend Growth Fund | | | |
| Periods Ended January 31, 2010 | | | |
| | One | Five | Ten |
| | Year | Years | Years |
| Returns Before Taxes | 26.01% | 3.75% | 1.76% |
| Returns After Taxes on Distributions | 25.56 | 3.41 | 0.97 |
| Returns After Taxes on Distributions and Sale of Fund Shares | 17.45 | 3.21 | 1.16 |
Total returns do not include any transaction or account fees that applied in the periods shown. Fund prospectuses provide information about current fees.
23
About Your Fund’s Expenses
As a shareholder of the fund, you incur ongoing costs, which include costs for portfolio management, administrative services, and shareholder reports (like this one), among others. Operating expenses, which are deducted from a fund’s gross income, directly reduce the investment return of the fund.
A fund’s expenses are expressed as a percentage of its average net assets. This figure is known as the expense ratio. The following examples are intended to help you understand the ongoing costs (in dollars) of investing in your fund and to compare these costs with those of other mutual funds. The examples are based on an investment of $1,000 made at the beginning of the period shown and held for the entire period.
The accompanying table illustrates your fund’s costs in two ways:
• Based on actual fund return. This section helps you to estimate the actual expenses that you paid over the period. The ”Ending Account Value“ shown is derived from the fund‘s actual return, and the third column shows the dollar amount that would have been paid by an investor who started with $1,000 in the fund. You may use the information here, together with the amount you invested, to estimate the expenses that you paid over the period.
To do so, simply divide your account value by $1,000 (for example, an $8,600 account value divided by $1,000 = 8.6), then multiply the result by the number given for your fund under the heading ”Expenses Paid During Period.“
• Based on hypothetical 5% yearly return. This section is intended to help you compare your fund‘s costs with those of other mutual funds. It assumes that the fund had a yearly return of 5% before expenses, but that the expense ratio is unchanged. In this case—because the return used is not the fund’s actual return—the results do not apply to your investment. The example is useful in making comparisons because the Securities and Exchange Commission requires all mutual funds to calculate expenses based on a 5% return. You can assess your fund’s costs by comparing this hypothetical example with the hypothetical examples that appear in shareholder reports of other funds.
Note that the expenses shown in the table are meant to highlight and help you compare ongoing costs only and do not reflect transaction costs incurred by the fund for buying and selling securities. Further, the expenses do not include the account service fee described in the prospectus. If such a fee were applied to your account, your costs would be higher. Your fund does not charge transaction fees, such as purchase or redemption fees, nor does it carry a “sales load.” The calculations assume no shares were bought or sold during the period. Your actual costs may have been higher or lower, depending on the amount of your investment and the timing of any purchases or redemptions.
You can find more information about the fund’s expenses, including annual expense ratios, in the Financial Statements section of this report. For additional information on operating expenses and other shareholder costs, please refer to your fund’s current prospectus.
24
| | | |
| Six Months Ended January 31, 2010 | | | |
| | Beginning | Ending | Expenses |
| | Account Value | Account Value | Paid During |
| Dividend Growth Fund | 7/31/2009 | 1/31/2010 | Period |
| Based on Actual Fund Return | $1,000.00 | $1,112.85 | $1.92 |
| Based on Hypothetical 5% Yearly Return | 1,000.00 | 1,023.39 | 1.84 |
These calculations are based on expenses incurred in the most recent six-month period. The fund’s annualized six-month expense ratio for that period is 0.36%. The dollar amounts shown as “Expenses Paid” are equal to the annualized expense ratio multiplied by the average account value over the period, multiplied by the number of days in the most recent six-month period, then divided by the number of days in the most recent 12-month period.
25
Notice to Shareholders
The board of trustees of Vanguard Dividend Growth Fund has approved the replacement of the fund’s compensation benchmark, the Russell 1000 Index, with the Dividend Achievers Select Index, effective February 1, 2010. The board concluded that the new index is a more appropriate comparison index because it is more consistent with the fund’s objective. This change will not affect the fund’s investment objective, policies, strategies, or risks.
The fund’s trustees regularly evaluate its investment advisory arrangements, focusing on factors such as the advisor’s investment process, style consistency, and performance, as well as the composition and depth of the management and research teams. In deciding to replace the compensation benchmark, the trustees considered the fund’s performance together with a wide range of information relating to Wellington Management Company, LLP (Wellington Management).
The fund has entered into an amended investment advisory agreement with Wellington Management to reflect the change in the benchmark; however, other terms of the existing agreement have not changed. Under the terms of the agreement, the fund will pay Wellington Management a fee at the end of each fiscal quarter. The fee is calculated by applying an annual percentage rate to the average daily net assets of the fund during the quarter. The quarterly payments to Wellington Management may be increased or decreased by applying a performance adjustment schedule. The adjustment will be based on the fund’s cumulative total performance over a trailing 36-month period (subject to certain transition rules that will be in place until 36 months have elapsed from the date of the new agreement) as compared with that of the Dividend Achievers Select Index over the same period.
Board approval of the investment advisory agreement
Wellington Management is responsible for managing the investment and reinvestment of the fund’s assets and for continuously reviewing, supervising, and administering the fund’s investment program. The advisor discharges its responsibilities subject to the supervision and oversight of the officers and trustees of the fund.
The board’s decision to replace the compensation benchmark was based upon its most recent evaluation of the advisor’s investment staff, portfolio management process, and performance results. In considering whether to approve replacing the benchmark, the board engaged in arm’s-length discussions with Wellington Management and considered the following factors, among others:
•The trustees considered the benefits to shareholders of continuing to retain Wellington
Management as advisor to the fund, particularly in light of the nature, extent, and quality of services pr ovided by Wellington Management. The board considered the quality of investment management to the fund over both the short and long term and the organizational depth and stability of the firm.
The board noted that the fund’s investment manager has nearly two decades of investment experience. Further, the board noted that Wellington Management, founded in 1928 and advisor to the fund since its inception in 1992, is among the nation’s oldest and most respected institutional advisors. The board also noted that Wellington Management and the fund’s management team have depth and stability, with the manager backed by a well-tenured team of research analysts who conduct detailed fundamental analysis of their respective industries and companies. Wellington Management has seen a significant growth in assets in the past decade.
26
•The trustees considered the fund’s investment performance as compared with that of the fund’s peer group and its current and proposed benchmark indexes. The board concluded that short- and long-term performance has been competitive versus the fund’s benchmarks and peer group of large-cap core funds (as defined by Lipper Inc.).
•The trustees considered the cost of services to be provided, including competitive fee rates and the fact that, after changing the compensation benchmark, the fund’s advisory fee will remain significantly below the large-cap core funds average.
•The trustees considered the extent to which economies of scale would be realized as assets of the fund grow, in part through the use of appropriate breakpoints in the fee schedule. By including asset-based breakpoints in the fee schedule, the trustees ensure that if the fund continues to grow, investors will benefit by realizing economies of scale in the form of a lower advisory fee ratio.
•The trustees considered all of the circumstances and information provided by both Wellington Management and Vanguard regarding the performance of the fund and concluded that approval of the investment advisory agreement is in the best interest of the fund and its shareholders.
The advisory agreement will continue for a period of one year from its effective date and is renewable after that for successive one-year periods. The agreement will be reviewed annually by the fund’s trustees, a majority of whom are not “interested persons,” as defined in federal securities laws.
Background information on Wellington Management
Wellington Management Company, LLP, 75 State Street, Boston, MA 02109, is a Massachusetts limited liability partnership and an investment counseling firm that provides investment services to investment companies, employee benefit plans, endowments, foundations, and other institutions.
Wellington Management and its predecessor organizations have provided investment advisory services for over 70 years. As of October 31, 2009, Wellington Management had investment management authority with respect to approximately $507 billion in assets. The firm manages the fund subject to the supervision and oversight of the trustees and officers of the fund. The manager primarily responsible for overseeing the fund’s investments is:
Donald J. Kilbride, Senior Vice President and Equity Portfolio Manager of Wellington Management. He has worked in investment management since 1996; has managed investment portfolios since joining Wellington Management in 2002; and has managed the fund since 2006. Education: B.A., College of the Holy Cross; M.B.A., University of North Carolina, Kenan-Flagler Business School.
27
Glossary
30-Day SEC Yield. A fund’s 30-day SEC yield is derived using a formula specified by the U.S. Securities and Exchange Commission. Under the formula, data related to the fund’s security holdings in the previous 30 days are used to calculate the fund’s hypothetical net income for that period, which is then annualized and divided by the fund’s estimated average net assets over the calculation period. For the purposes of this calculation, a security’s income is based on its current market yield to maturity (in the case of bonds) or its projected dividend yield (for stocks). Because the SEC yield represents hypothetical annualized income, it will differ—at times significantly—from the fund’s actual experience. As a result, the fund’s income distributions may be higher or lower than implied by the SEC yield.
Beta. A measure of the magnitude of a fund’s past share-price fluctuations in relation to the ups and downs of a given market index. The index is assigned a beta of 1.00. Compared with a given index, a fund with a beta of 1.20 typically would have seen its share price rise or fall by 12% when the index rose or fell by 10%. For this report, beta is based on returns over the past 36 months for both the fund and the index. Note that a fund’s beta should be reviewed in conjunction with its R-squared (see definition). The lower the R-squared, the less correlation there is between the fund and the index, and the less reliable beta is as an indicator of volatility.
Dividend Yield. Dividend income earned by stocks, expressed as a percentage of the aggregate market value (or of net asset value, for a fund). The yield is determined by dividing the amount of the annual dividends by the aggregate value (or net asset value) at the end of the period. For a fund, the dividend yield is based solely on stock holdings and does not include any income produced by other investments.
Earnings Growth Rate. The average annual rate of growth in earnings over the past five years for the stocks now in a fund.
Equity Exposure. A measure that reflects a fund’s investments in stocks and stock futures. Any holdings in short-term reserves are excluded.
Expense Ratio. The percentage of a fund’s average net assets used to pay its annual administrative and advisory expenses. These expenses directly reduce returns to investors.
Foreign Holdings. The percentage of a fund represented by stocks or depositary receipts of companies based outside the United States.
Inception Date. The date on which the assets of a fund (or one of its share classes) are first invested in accordance with the fund’s investment objective. For funds with a subscription period, the inception date is the day after that period ends. Investment performance is measured from the inception date.
Median Market Cap. An indicator of the size of companies in which a fund invests; the midpoint of market capitalization (market price x shares outstanding) of a fund’s stocks, weighted by the proportion of the fund’s assets invested in each stock. Stocks representing half of the fund’s assets have market capitalizations above the median, and the rest are below it.
Price/Book Ratio. The share price of a stock divided by its net worth, or book value, per share. For a fund, the weighted average price/book ratio of the stocks it holds.
28
Price/Earnings Ratio. The ratio of a stock’s current price to its per-share earnings over the past year. For a fund, the weighted average P/E of the stocks it holds. P/E is an indicator of market expectations about corporate prospects; the higher the P/E, the greater the expectations for a company’s future growth.
R-Squared. A measure of how much of a fund’s past returns can be explained by the returns from the market in general, as measured by a given index. If a fund’s total returns were precisely synchronized with an index’s returns, its R-squared would be 1.00. If the fund’s returns bore no relationship to the index’s returns, its R-squared would be 0. For this report, R-squared is based on returns over the past 36 months for both the fund and the index.
Return on Equity. The annual average rate of return generated by a company during the past five years for each dollar of shareholder’s equity (net income divided by shareholder’s equity). For a fund, the weighted average return on equity for the companies whose stocks it holds.
Short-Term Reserves. The percentage of a fund invested in highly liquid, short-term securities that can be readily converted to cash.
Turnover Rate. An indication of the fund’s trading activity. Funds with high turnover rates incur higher transaction costs and may be more likely to distribute capital gains (which may be taxable to investors). The turnover rate excludes in-kind transactions, which have minimal impact on costs.
29
This page intentionally left blank.
This page intentionally left blank.
The People Who Govern Your Fund
The trustees of your mutual fund are there to see that the fund is operated and managed in your best interests since, as a shareholder, you are a part owner of the fund. Your fund’s trustees also serve on the board of directors of The Vanguard Group, Inc., which is owned by the Vanguard funds and provides services to them on an at-cost basis.
A majority of Vanguard’s board members are independent, meaning that they have no affiliation with Vanguard or the funds they oversee, apart from the sizable personal investments they have made as private individuals. The independent board members have distinguished backgrounds in business, academia, and public service. Each of the trustees and executive officers oversees 162 Vanguard funds.
The following table provides information for each trustee and executive officer of the fund. More information about the trustees is in the Statement of Additional Informatio n, which can be obtained, wit hout charge, by contacting Vanguard at 800-662-7447, or online at www.vanguard.com.
| |
| Interested Trustee1 | Rajiv L. Gupta |
| | Born 1945. Trustee Since December 2001.2 Principal |
| F. William McNabb III | Occupation(s) During the Past Five Years: Chairman |
| Born 1957. Trustee Since July 2009. Chairman of the | and Chief Executive Officer (retired 2009) and |
| Board. Principal Occupation(s) During the Past Five | President (2006–2008) of Rohm and Haas Co. |
| Years: Chairman of the Board of The Vanguard Group, | (chemicals); Board Member of American Chemistry |
| Inc., and of each of the investment companies served | Council; Director of Tyco International, Ltd. (diversified |
| by The Vanguard Group, since January 2010; Director | manufacturing and services) and Hewlett-Packard Co. |
| of The Vanguard Group since 2008; Chief Executive | (electronic computer manufacturing); Trustee of The |
| Officer and President of The Vanguard Group and of | Conference Board. |
| each of the investment companies served by The | |
| Vanguard Group since 2008; Director of Vanguard | Amy Gutmann |
| Marketing Corporation; Managing Director of The | Born 1949. Trustee Since June 2006. Principal |
| Vanguard Group (1995–2008). | Occupation(s) During the Past Five Years: President |
| | of the University of Pennsylvania; Christopher H. |
| | Browne Distinguished Professor of Political Science |
| Independent Trustees | in the School of Arts and Sciences with secondary |
| | appointments at the Annenberg School for Commu- |
| Emerson U. Fullwood | nication and the Graduate School of Education of |
| Born 1948. Trustee Since January 2008. Principal | the University of Pennsylvania; Director of Carnegie |
| Occupation(s) During the Past Five Years: Executive | Corporation of New York, Schuylkill River Development |
| Chief Staff and Marketing Officer for North America | Corporation, and Greater Philadelphia Chamber of |
| and Corporate Vice President (retired 2008) of Xerox | Commerce; Trustee of the National Constitution Center. |
| Corporation (photocopiers and printers); Director of | |
| SPX Corporation (multi-industry manufacturing), the | |
| United Way of Rochester, the Boy Scouts of America, | |
| Amerigroup Corporation (direct health and medical | |
| insurance carriers), and Monroe Community College | |
| Foundation. | |
| | |
| JoAnn Heffernan Heisen | Executive Officers | |
| Born 1950. Trustee Since July 1998. Principal | | |
| Occupation(s) During the Past Five Years: Corporate | Thomas J. Higgins | |
| Vice President and Chief Global Diversity Officer since | Born 1957. Chief Financial Officer Since September |
| 2006 (retired 2008) and Member of the Executive | 2008. Principal Occupation(s) During the Past Five |
| Committee (retired 2008) of Johnson & Johnson | Years: Principal of The Vanguard Group, Inc.; Chief |
| (pharmaceuticals/consumer products); Vice President | Financial Officer of each of the investment companies |
| and Chief Information Officer of Johnson & Johnson | served by The Vanguard Group since 2008; Treasurer |
| (1997–2005); Director of the University Medical Center | of each of the investment companies served by The |
| at Princeton and Women’s Research and Education | Vanguard Group (1998–2008). |
| Institute; Member of the Advisory Board of the | | |
| Maxwell School of Citizenship and Public Affairs | Kathryn J. Hyatt | |
| at Syracuse University. | Born 1955. Treasurer Since November 2008. Principal |
| | Occupation(s) During the Past Five Years: Principal |
| F. Joseph Loughrey | of The Vanguard Group, Inc.; Treasurer of each of |
| Born 1949. Trustee Since October 2009. Principal | the investment companies served by The Vanguard |
| Occupation(s) During the Past Five Years: President | Group since 2008; Assistant Treasurer of each of the |
| and Chief Operating Officer since 2005 (retired 2009) | investment companies served by The Vanguard Group |
| and Vice Chairman of the Board (2008–2009) of | (1988–2008). | |
| Cummins Inc. (industrial machinery); Director of | | |
| SKF AB (industrial machinery), Hillenbrand, Inc. | Heidi Stam | |
| (specialized consumer services), Sauer-Danfoss Inc. | Born 1956. Secretary Since July 2005. Principal |
| (machinery), the Lumina Foundation for Education, | Occupation(s) During the Past Five Years: Managing |
| and the Columbus Community Education Coalition; | Director of The Vanguard Group, Inc., since 2006; |
| Chairman of the Advisory Council for the College of | General Counsel of The Vanguard Group since 2005; |
| Arts and Letters at the University of Notre Dame. | Secretary of The Vanguard Group and of each of the |
| | investment companies served by The Vanguard Group |
| André F. Perold | since 2005; Director and Senior Vice President of |
| Born 1952. Trustee Since December 2004. Principal | Vanguard Marketing Corporation since 2005; |
| Occupation(s) During the Past Five Years: George | Principal of The Vanguard Group (1997–2006). |
| Gund Professor of Finance and Banking, Harvard | | |
| Business School; Chair of the Investment Committee | | |
| of HighVista Strategies LLC (private investment firm). | Vanguard Senior Management Team |
| |
| Alfred M. Rankin, Jr. | R. Gregory Barton | Michael S. Miller |
| Born 1941. Trustee Since January 1993. Principal | Mortimer J. Buckley | James M. Norris |
| Occupation(s) During the Past Five Years: Chairman, | Kathleen C. Gubanich | Glenn W. Reed |
| President, and Chief Executive Officer of NACCO | Paul A. Heller | George U. Sauter |
| Industries, Inc. (forklift trucks/housewares/lignite); | | |
| Director of Goodrich Corporation (industrial products/ | | |
| aircraft systems and services); Deputy Chairman | Chairman Emeritus and Senior Advisor |
| of the Federal Reserve Bank of Cleveland; Trustee | | |
| of University Hospitals of Cleveland, The Cleveland | John J. Brennan | |
| Museum of Art, and Case Western Reserve University. | Chairman, 1996–2009 | |
| | Chief Executive Officer and President, 1996–2008 |
| Peter F. Volanakis | | |
| Born 1955. Trustee Since July 2009. Principal | | |
| Occupation(s) During the Past Five Years: President | Founder | |
| since 2007 and Chief Operating Officer since 2005 | | |
| of Corning Incorporated (communications equipment); | John C. Bogle | |
| President of Corning Technologies (2001–2005); | Chairman and Chief Executive Officer, 1974–1996 |
| Director of Corning Incorporated and Dow Corning; | | |
| Trustee of the Corning Incorporated Foundation and | | |
| the Corning Museum of Glass; Overseer of the | | |
| Amos Tuck School of Business Administration at | | |
| Dartmouth College. | | |
1 Mr. McNabb is considered an “interested person,” as defined in the Investment Company Act of 1940, because he is an officer of the
Vanguard funds.
2 December 2002 for Vanguard Equity Income Fund, Vanguard Growth Equity Fund, the Vanguard Municipal Bond Funds, and the Vanguard
State Tax-Exempt Funds.

| |
| |
| P.O. Box 2600 |
| Valley Forge, PA 19482-2600 |
Connect with Vanguard® > www.vanguard.com
| Fund Information > 800-662-7447 |
|
| Direct Investor Account Services > 800-662-2739 |
|
| Institutional Investor Services > 800-523-1036 |
|
| Text Telephone for People |
| With Hearing Impairment > 800-749-7273 |
| |
| This material may be used in conjunction |
| with the offering of shares of any Vanguard |
| fund only if preceded or accompanied by |
| the fund’s current prospectus. |
| |
| All comparative mutual fund data are from Lipper Inc. or |
| Morningstar, Inc., unless otherwise noted. |
| |
| You can obtain a free copy of Vanguard’s proxy voting |
| guidelines by visiting our website, www.vanguard.com, |
| and searching for “proxy voting guidelines,” or by calling |
| Vanguard at 800-662-2739. The guidelines are also |
| available from the SEC’s website, www.sec.gov. In |
| addition, you may obtain a free report on how your fund |
| voted the proxies for securities it owned during the 12 |
| months ended June 30. To get the report, visit either |
| www.vanguard.com or www.sec.gov. |
| |
| You can review and copy information about your fund at |
| the SEC’s Public Reference Room in Washington, D.C. To |
| find out more about this public service, call the SEC at |
| 202-551-8090. Information about your fund is also |
| available on the SEC’s website, and you can receive |
| copies of this information, for a fee, by sending a |
| request in either of two ways: via e-mail addressed to |
| publicinfo@sec.gov or via regular mail addressed to the |
| Public Reference Section, Securities and Exchange |
| Commission, Washington, DC 20549-1520. |
| © 2010 The Vanguard Group, Inc. |
| All rights reserved. |
| Vanguard Marketing Corporation, Distributor. |
 | |
| Q570 032010 |
 |
| Vanguard Dividend Appreciation |
| Index Fund Annual Report |
|
|
| January 31, 2010 |
|
|
 |
|
|
> For the fiscal year ended January 31, 2010, Vanguard Dividend Appreciation Index Fund returned about 27%, closely tracking the return of its target index.
> The broad U.S. stock market advanced approximately 36% for the 12 months as the economy showed signs of recovering from a deep recession.
> Eight of the ten market sectors advanced, with rebounding financial stocks in the forefront.
| |
| Contents | |
| Your Fund’s Total Returns. | 1 |
| Chairman’s Letter. | 2 |
| Fund Profile. | 8 |
| Performance Summary. | 9 |
| Financial Statements. | 11 |
| Your Fund’s After-Tax Returns. | 22 |
| About Your Fund’s Expenses. | 23 |
| Glossary. | 25 |
Please note: The opinions expressed in this report are just that—informed opinions. They should not be considered promises or advice. Also, please keep in mind that the information and opinions cover the period through the date on the front of this report. Of course, the risks of investing in your fund are spelled out in the prospectus.
See the Glossary for definitions of investment terms used in this report.
Cover photograph: Veronica Coia.
| |
| Your Fund’s Total Returns | |
| |
| |
| |
| |
| Fiscal Year Ended January 31, 2010 | |
| | Total |
| | Returns |
| Vanguard Dividend Appreciation Index Fund | |
| Investor Shares | 26.80% |
| ETF Shares | |
| Market Price | 26.54 |
| Net Asset Value | 26.95 |
| Dividend Achievers Select Index | 26.99 |
| Large-Cap Core Funds Average | 33.23 |
| Large-Cap Core Funds Average: Derived from data provided by Lipper Inc. | |
These Vanguard ETF® Shares are traded on the NYSE Arca exchange and are available only through brokers. The table shows ETF returns based on both the NYSE Arca market price and the net asset value for a share. U.S. Pat. No. 6,879,964 B2; 7,337,138.
Your Fund’s Performance at a Glance
January 31, 2009 , Through January 31, 2010
| | | | |
| | | | Distributions Per Share |
| | Starting | Ending | Income | Capital |
| | Share Price | Share Price | Dividends | Gains |
| Vanguard Dividend Appreciation Index Fund | | | | |
| Investor Shares | $14.79 | $18.33 | $0.372 | $0.000 |
| ETF Shares | 36.96 | 45.81 | 0.979 | 0.000 |
1

Chairman’s Letter
Dear Shareholder,
Vanguard Dividend Appreciation Index Fund returned about 27% for the 12 months ended January 31, 2010, and closely tracked the performance of its target benchmark, the Dividend Achievers Select Index. The fund trailed the average return of about 33% posted by large-company stock funds and the roughly 36% gain of the broad U.S. stock market.
During a robust stock rally that took place through most of the 12 months, the leading gainers were companies and sectors that had suffered the steepest drops during the recent bear market. Companies that pay steady dividends, such as those in the Dividend Appreciation Index Fund, did not suffer as badly in the downturn and consequently did not rise as rapidly in the rebound.
The fund was also affected by the many dividend cuts announced across the market in the past year. More U.S. public companies decreased their dividends during calendar 2009 than at any other time since Standard & Poor’s began collecting such data in 1955, according to S&P. Even some companies in good financial shape reduced their dividends in an effort to conserve capital during the global financial crisis. For this reason and also because the fund’s share price rose, the fund’s SEC yield declined from 2.65% at the end of fiscal 2009 to 2.00% at the end of the most recent fiscal year. The per-share distributions for the fund’s
2
Investor Shares in fiscal 2010 declined slightly—by about one penny per share—compared with the previous fiscal year.
Remarkable rally loses steam at year-end
Stocks began the fiscal year under severe pressure from the global financial crisis and a stalled U.S. economy. After a dismal showing in February 2009, however, U.S. equities turned the corner in early March and kept surging until the fiscal year’s final weeks, when the major market indexes pulled back a bit. During the rally, the federal government’s stimulus plan took hold, companies began to repair their balance sheets, and investors increased their appetite for risk—the riskier the better, it seemed.
The stock market’s exuberance overshot the pace of economic recovery, which slowly improved as the year progressed. It wasn’t until the third calendar quarter that the recession appeared to be ending, and double-digit unemployment still weighed on the economy.
International markets traced an even steeper line upward than their U.S. counterpart for most of the fiscal year. They recovered strongly through 2009 and into 2010, before dropping in the latter half of January amid concerns about the strength of the global recovery. The most impressive international returns came from emerging markets, with especially strong results from Brazil and China.
| | | |
| Market Barometer | | | |
| |
| | | Average Annual Total Returns |
| | | Periods Ended January 31, 2010 |
| | One | Three | Five |
| | Year | Years | Years |
| Stocks | | | |
| Russell 1000 Index (Large-caps) | 34.81% | -7.10% | 0.57% |
| Russell 2000 Index (Small-caps) | 37.82 | -7.74 | 0.61 |
| Dow Jones U.S. Total Stock Market Index | 36.06 | -6.72 | 0.94 |
| MSCI All Country World Index ex USA (International) | 48.28 | -4.76 | 5.61 |
| |
| Bonds | | | |
| Barclays Capital U.S. Aggregate Bond Index (Broad | | | |
| taxable market) | 8.51% | 6.60% | 5.16% |
| Barclays Capital Municipal Bond Index | 9.49 | 4.68 | 4.23 |
| Citigroup Three-Month U.S. Treasury Bill Index | 0.15 | 2.07 | 2.84 |
| |
| CPI | | | |
| Consumer Price Index | 2.63% | 2.30% | 2.59% |
3
Although the fiscal year’s returns were a welcome relief for stock investors worldwide, the severity of the financial crisis continues to depress the longer-term record, especially for U.S. stocks.
Bond returns traced very different courses
The U.S. government’s programs also soothed parts of the bond market as the fiscal year progressed. At the start of the period, the difference between the yields of corporate bonds and those of U.S. Treasuries had widened almost to levels last seen in the 1930s, an indication of just how unwilling investors were to take on risk. As the threat of a depression receded, however, confidence returned and investors flocked to the lowest-quality, highest-yielding bonds, passing over conservative Treasuries, the previous year’s favorite.
For the 12 months ended January 31, the broad taxable bond market returned 8.51%, municipal bonds returned about 9%, and high-yield corporate bonds delivered a stunning 51%. Meanwhile, Treasury returns were negative to lack-luster, depending on their maturity.
While the Federal Reserve’s monetary policies seemed to help the stock market and most areas of the bond market, the policies exacted a heavy price from money market investors. The Fed kept the federal funds rate––the interest rate that banks charge one another for overnight lending,
| | | |
| Expense Ratios | | | |
| Your Fund Compared With Its Peer Group | | | |
| |
| | Investor | ETF | Peer Group |
| | Shares | Shares | Average |
| Dividend Appreciation Index Fund | 0.35% | 0.24% | 1.27% |
The fund expense ratios shown are from the prospectuses dated May 29, 2009, and represent estimated costs for the current fiscal year based on the fund’s net assets as of the prospectus date. For the fiscal year ended January 31, 2010, the fund’s expense ratios were 0.35% for Investor Shares and 0.23% for ETF Shares. The peer-group expense ratio is derived from data provided by Lipper Inc. and captures information through year-end 2009.
Peer group: Large-Cap Core Funds.
4
and a benchmark for the market’s short-term rates––between 0% and 0.25% during the entire fiscal year.
Although the Fed said it planned to maintain that stance for an “extended period,” it recently indicated that it was ready to wind down emergency measures and would halt its purchase of agency mortgage-backed securities and debt in the coming months.
Financial stocks led the way as sentiment shifted dramatically
The financial sector was the focus of investor angst in the previous fiscal year as some pillars of the industry either disappeared or were propped up by the government. The sector’s turnaround was dramatic in 2009. After plunging 67% during the fund’s previous fiscal year, financial companies in the fund climbed 50%, accounting for about one-fourth of the fund’s advance.
After banks proved to the federal government’s satisfaction that their capital reserves were adequate, their shares rose sharply. Insurance and financial firms benefited from rising equity values, restoring some cushion in their balance sheets. Commercial banks also reduced the risk levels of their loan portfolios and profited from low interest rates, which allowed them to lend at rates much higher than their borrowing costs.
The next most influential sector in the fund’s advance was industrials (+42%), as the market anticipated that an economic revival would lift profits for companies in
| |
| Total Returns | |
| Inception Through January 31, 2010 | |
| | Average |
| | Annual Return |
| Dividend Appreciation Index Fund Investor Shares (Returns since inception: 4/27/2006) | -0.59% |
| Dividend Achievers Select Index | -0.39 |
| Large-Cap Core Funds Average | -3.66 |
| Large-Cap Core Funds Average: Derived from data provided by Lipper Inc. | |
The figures shown represent past performance, which is not a guarantee of future results. (Current performance may be lower or higher than the performance data cited. For performance data current to the most recent month-end, visit our website at www.vanguard.com/performance.) Note, too, that both investment returns and principal value can fluctuate widely, so an investor’s shares, when sold, could be worth more or less than their original cost.
5
aerospace, defense, building products, engineering, and construction. The fund’s largest sector, consumer staples (+23%), and the other retail-oriented sector, consumer discretionary (+35%), were also significant contributors as investors were encouraged by a modest turnaround in consumer spending.
Gains were less robust in health care (+11%), in part because of concerns about potential changes to federal health insurance law, and in utilities (+6%), which tend to underperform during bull markets. Energy (–2%) and telecommunication services (–31%) were the only sectors that detracted from the fund’s result for the year.
The fund continues to build a successful tracking record
The slightly negative return for the fund’s Investor Shares since their inception in 2006 is a bit better than the average return
Updating an index’s composition
Index providers must review the securities listed in an index periodically to make sure they continue to adhere to the benchmark’s criteria. Mergent, Inc. updates its Dividend Achievers Select Index annually, and because of the unusual circumstances brought on by the economic crisis, the changes to the index were particularly noticeable this year.
One yardstick Mergent uses, for example, is that companies must have a track record of increasing their dividends annually for at least the past ten years. Because many financial firms reduced their dividend payouts in the past year to conserve capital and strengthen their balance sheets, some large financial institutions—including Wells Fargo, the index’s largest stock by market value as the fiscal year ended—were dropped from the index at the end of the period.
Vanguard Dividend Appreciation Index Fund seeks to track the Mergent index by holding all of the stocks listed in it, in the same proportions. When the index’s composition changes, the fund changes its portfolio accordingly. Here are the most notable changes:
| | |
| | Average weighting | |
| | January 31, 2009– | Weighting after |
| Sector | January 31, 2010 | composition change |
| Financials | 14% | 7% |
| Health Care | 12 | 15 |
| Energy | 7 | 10 |
6
for large-cap core funds overall for that period. This is not surprising, given that higher-dividend stocks often hold up better in market headwinds, which howled at gale force from fall 2007 until spring 2009. The fund met its objective of closely tracking its target index, including throughout the historic volatility of the past two years.
Whether the stock market rally continues or reverses in the coming year, we’re confident in the ability of Vanguard Quantitative Equity Group, the investment advisor, to continue to closely track the return of its target benchmark, providing you with convenient, low-cost exposure to a diversified portfolio of companies with a long-term record of regularly increasing their dividends.
The recent volatility offers an opportunity to reflect
The stock market’s extreme volatility during the past two years has provided a vivid lesson in the importance of maintaining a long-term perspective. Most stock investors were undoubtedly discouraged by the market’s steep descent, which bottomed in March 2009. The strong recovery that followed underscored the benefit of patience and persistence. However, living through the market’s ups and downs is often easier said than done.
That’s why, no matter what the stock market does in the coming year, we believe it is crucial to maintain a portfolio that’s diversified among and within different asset classes and tailored to each investor’s time
horizon and risk tolerance. This time-tested approach can shield your investments from the worst of the market’s gyrations. For dividend-oriented stock investors, Vanguard Dividend Appreciation Index Fund can play a useful role in providing diversified, low-cost exposure to companies that have a long-term track record of dividend growth.
On another matter, I would like to inform you that on January 1, 2010, we completed a leadership transition that began in March 2008. I succeeded Jack Brennan as chairman of Vanguard and each of the funds. Jack has agreed to serve as chairman emeritus and senior advisor. Under Jack’s leadership, Vanguard has grown to become a preeminent firm in the mutual fund industry. Jack’s energy, his relentless pursuit of perfection, and his unwavering focus on always doing the right thing for our clients are evident in every facet of Vanguard policy today.
As always, thank you for entrusting your assets to Vanguard.
Sincerely,

F. William McNabb III
Chairman and Chief Executive Officer
February 11, 2010
7
Dividend Appreciation Index Fund
Fund Profile
As of January 31, 2010
| | |
| Share-Class Characteristics | |
| |
| | Investor | ETF |
| | Shares | Shares |
| Ticker Symbol | VDAIX | VIG |
| Expense Ratio1 | 0.35% | 0.24% |
| 30-Day SEC Yield | 2.00% | 2.14% |
| | | |
| Portfolio Characteristics | | |
| | | | DJ |
| | | Dividend | U.S. Total |
| | | Achievers | Market |
| | Fund | Select Index | Index |
| Number of Stocks | 142 | 142 | 4,185 |
| Median Market Cap | $40.0B | $40.0B | $29.6B |
| Price/Earnings Ratio | 16.8x | 16.8x | 26.4x |
| Price/Book Ratio | 3.0x | 3.0x | 2.1x |
| Return on Equity | 24.9% | 24.9% | 19.2% |
| Earnings Growth Rate | 9.1% | 9.1% | 7.7% |
| Dividend Yield | 2.4% | 2.4% | 1.9% |
| Foreign Holdings | 0.0% | 0.0% | 0.0% |
| Turnover Rate | 20% | — | — |
| Short-Term Reserves | 0.0% | — | — |
| | | |
| Sector Diversification (% of equity exposure) |
| | | Dividend | DJ |
| | | Achievers | U.S. Total |
| | | Select | Market |
| | Fund | Index | Index |
| Consumer | | | |
| Discretionary | 11.6% | 11.6% | 10.4% |
| Consumer Staples | 25.6 | 25.6 | 10.1 |
| Energy | 10.2 | 10.2 | 10.5 |
| Financials | 6.6 | 6.6 | 16.6 |
| Health Care | 15.0 | 15.0 | 13.1 |
| Industrials | 18.3 | 18.3 | 10.8 |
| Information | | | |
| Technology | 5.9 | 5.9 | 18.1 |
| Materials | 5.0 | 5.0 | 3.8 |
| Telecommunication | | | |
| Services | 0.2 | 0.2 | 2.8 |
| Utilities | 1.6 | 1.6 | 3.8 |
| | |
| Volatility Measures | | |
| | | DJ |
| | Dividend | U.S. Total |
| | Achievers | Market |
| | Select Index | Index |
| R-Squared | 1.00 | 0.92 |
| Beta | 1.00 | 0.78 |
These measures show the degree and timing of the fund’s fluctuations compared with the indexes over 36 months.
| | |
| Ten Largest Holdings (% of total net assets) |
| Procter & Gamble Co. | Household | |
| | Products | 4.1% |
| Coca-Cola Co. | Soft Drinks | 4.1 |
| Johnson & Johnson | Pharmaceuticals | 4.1 |
| Wal-Mart Stores Inc. | Hypermarkets & | |
| | Super Centers | 4.1 |
| PepsiCo Inc. | Soft Drinks | 4.0 |
| Exxon Mobil Corp. | Integrated Oil & | |
| | Gas | 4.0 |
| International Business | Computer | |
| Machines Corp. | Hardware | 4.0 |
| Chevron Corp. | Integrated Oil & | |
| | Gas | 4.0 |
| Abbott Laboratories | Pharmaceuticals | 4.0 |
| McDonald's Corp. | Restaurants | 3.8 |
| Top Ten | | 40.2% |
The holdings listed exclude any temporary cash investments and equity index products.
Investment Focus
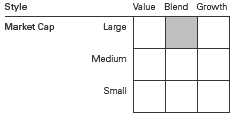
1 The expense ratios shown are from the prospectuses dated May 29, 2009, and represent estimated costs for the current fiscal year based on the fund’s net assets as of the prospectus date. For the fiscal year ended January 31, 2010, the fund’s expense ratios were 0.35% for Investor Shares and 0.23% for ETF Shares.
8
Dividend Appreciation Index Fund
Performance Summary
All of the returns in this report represent past performance, which is not a guarantee of future results that may be achieved by the fund. (Current performance may be lower or higher than the performance data cited. For performance data current to the most recent month-end, visit our website at www.vanguard.com/performance.) Note, too, that both investment returns and principal value can fluctuate widely, so an investor’s shares, when sold, could be worth more or less than their original cost. The returns shown do not reflect taxes that a shareholder would pay on fund distributions or on the sale of fund shares.
Cumulative Performance: April 27, 2006, Through January 31, 2010
Initial Investment of $10,000
| | | |
| | Average Annual Total Returns | |
| | Periods Ended January 31, 2010 | |
| | | | Final Value |
| | One | Since | of a $10,000 |
| | Year | Inception | Investment |
| Dividend Appreciation Index Fund | | | |
| Investor Shares | 26.80% | -0.59% | $9,781 |
| Dow Jones U.S. Total Stock Market | | | |
| Index | 36.06 | -2.74 | 9,005 |
| Dividend Achievers Select Index | 26.99 | -0.39 | 9,852 |
| Large-Cap Core Funds Average | 33.23 | -3.66 | 8,692 |
Large-Cap Core Funds Average: Derived from data provided by Lipper Inc.
Performance for the fund’s Investor Shares and comparative standards is calculated since the Investor Shares’ inception.
| | | |
| | | Since | Final Value |
| | One | Inception | of a $10,000 |
| | Year | (4/21/2006) | Investment |
| Dividend Appreciation Index Fund | | | |
| ETF Shares Net Asset Value | 26.95% | -0.39% | $9,852 |
| Dow Jones U.S. Total Stock Market Index | 36.06 | -2.80 | 8,980 |
| Dividend Achievers Select Index | 26.99 | -0.32 | 9,880 |
Performance for the fund’s ETF Shares and comparative standards is calculated since the ETF Shares’ inception.
For more information about how the ETF Shares' market prices have compared with their net asset value, visit www.vanguard.com, select your ETF, and then select the Performance tab. The Premium/Discount table there shows the percentages of days on which the ETF Shares' market price was above or below the NAV.
Vanguard fund total returns do not include any transaction or account fees that applied in the periods shown. Fund prospectuses provide information about current fees.
See Financial Highlights for dividend and capital gains information.
9
Dividend Appreciation Index Fund
| | |
| Cumulative Returns of ETF Shares: April 21, 2006, Through January 31, 2010 | |
| | | Since |
| | One | Inception |
| | Year | (4/21/2006) |
| Dividend Appreciation Index Fund | | |
| ETF Shares Market Price | 26.54% | -1.53% |
| Dividend Appreciation Index Fund | | |
| ETF Shares Net Asset Value | 26.95 | -1.48 |
| Dividend Achievers Select Index | 26.99 | -1.20 |
| Performance for the fund’s ETF Shares and comparative standards is calculated since the ETF Shares’ inception. | |
Fiscal-Year Total Returns (%): April 27, 2006, Through January 31, 2010
Average Annual Total Returns: Periods Ended December 31, 2009
This table presents average annual total returns through the latest calendar quarter—rather than through the end of
the fiscal period. Securities and Exchange Commission rules require that we provide this information.
| | | |
| | Inception | One | Since |
| | Date | Year | Inception |
| Investor Shares | 4/27/2006 | 19.15% | 0.01% |
| ETF Shares | 4/21/2006 | | |
| Market Price | | 19.29 | 0.21 |
| Net Asset Value | | 19.33 | 0.21 |
Vanguard fund total returns do not include any transaction or account fees that applied in the periods shown. Fund prospectuses provide information about current fees.
10
Dividend Appreciation Index Fund
Financial Statements
Statement of Net Assets
As of January 31, 2010
The fund reports a complete list of its holdings in regulatory filings four times in each fiscal year, at the quarter-ends. For the second and fourth fiscal quarters, the lists appear in the fund’s semiannual and annual reports to shareholders. For the first and third fiscal quarters, the fund files the lists with the Securities and Exchange Commission on Form N-Q. Shareholders can look up the fund’s Forms N-Q on the SEC’s website at www.sec.gov. Forms N-Q may also be reviewed and copied at the SEC’s Public Reference Room (see the back cover of this report for further information).
| | |
| | | Market |
| | | Value• |
| | Shares | ($000) |
| Common Stocks (100.1%) | | |
| Consumer Discretionary (11.6%) | |
| McDonald’s Corp. | 1,539,457 | 96,108 |
| Target Corp. | 1,019,788 | 52,284 |
| Lowe’s Cos. Inc. | 2,285,639 | 49,484 |
| TJX Cos. Inc. | 587,259 | 22,322 |
| McGraw-Hill Cos. Inc. | 449,444 | 15,933 |
| VF Corp. | 163,777 | 11,797 |
| H&R Block Inc. | 509,188 | 10,958 |
| Sherwin-Williams Co. | 162,125 | 10,271 |
| Ross Stores Inc. | 170,669 | 7,839 |
| Family Dollar Stores Inc. | 184,659 | 5,702 |
| John Wiley & Sons Inc. | | |
| Class A | 71,254 | 2,975 |
| Polaris Industries Inc. | 48,621 | 2,150 |
| Wolverine World Wide Inc. | 73,884 | 1,954 |
| Meredith Corp. | 51,824 | 1,605 |
| Matthews International | | |
| Corp. Class A | 45,649 | 1,545 |
| | | 292,927 |
| Consumer Staples (25.8%) | | |
| Procter & Gamble Co. | 1,696,158 | 104,399 |
| Coca-Cola Co. | 1,901,395 | 103,151 |
| Wal-Mart Stores Inc. | 1,920,217 | 102,597 |
| PepsiCo Inc. | 1,708,641 | 101,869 |
| Colgate-Palmolive Co. | 740,803 | 59,286 |
| Walgreen Co. | 1,461,892 | 52,701 |
| Archer-Daniels-Midland Co. | 989,540 | 29,656 |
| Sysco Corp. | 873,400 | 24,446 |
| Avon Products Inc. | 628,796 | 18,952 |
| Clorox Co. | 209,804 | 12,414 |
| JM Smucker Co. | 176,513 | 10,603 |
| Hormel Foods Corp. | 193,862 | 7,502 |
| Brown-Forman Corp. Class B | 139,138 | 7,141 |
| Church & Dwight Co. Inc. | 101,717 | 6,133 |
| McCormick & Co. Inc. | 168,314 | 6,110 |
| Casey’s General Stores Inc. | 76,912 | 2,360 |
| Lancaster Colony Corp. | 40,000 | 2,182 |
| Tootsie Roll Industries Inc. | 54,209 | 1,411 |
| | | 652,913 |
| | |
| | | Market |
| | | Value• |
| | Shares | ($000) |
| Energy (10.2%) | | |
| Exxon Mobil Corp. | 1,561,645 | 100,617 |
| Chevron Corp. | 1,388,300 | 100,124 |
| EOG Resources Inc. | 384,362 | 34,754 |
| Murphy Oil Corp. | 289,456 | 14,785 |
| Helmerich & Payne Inc. | 136,133 | 5,695 |
| Holly Corp. | 71,216 | 1,859 |
| | | 257,834 |
| Financials (6.6%) | | |
| Franklin Resources Inc. | 350,436 | 34,704 |
| Aflac Inc. | 634,497 | 30,729 |
| Chubb Corp. | 490,973 | 24,549 |
| T Rowe Price Group Inc. | 389,192 | 19,312 |
| Transatlantic Holdings Inc. | 101,158 | 5,026 |
| Eaton Vance Corp. | 170,192 | 4,903 |
| SEI Investments Co. | 261,266 | 4,627 |
| HCC Insurance | | |
| Holdings Inc. | 170,183 | 4,612 |
| Commerce | | |
| Bancshares Inc. | 116,437 | 4,609 |
| Cullen/Frost Bankers Inc. | 84,575 | 4,340 |
| Federated Investors Inc. | | |
| Class B | 160,535 | 4,074 |
| Brown & Brown Inc. | 208,308 | 3,666 |
| Wesco Financial Corp. | 10,158 | 3,586 |
| StanCorp Financial | | |
| Group Inc. | 69,068 | 2,968 |
| Prosperity Bancshares Inc. | 67,970 | 2,740 |
| Westamerica | | |
| Bancorporation | 41,536 | 2,308 |
| UMB Financial Corp. | 57,092 | 2,256 |
| First Financial | | |
| Bankshares Inc. | 31,409 | 1,666 |
| RLI Corp. | 32,253 | 1,660 |
| Bancfirst Corp. | 20,672 | 833 |
| Bank of the Ozarks Inc. | 24,610 | 729 |
| Tompkins Financial Corp. | 14,688 | 576 |
| First Financial Corp. | 20,643 | 570 |
| Republic Bancorp Inc. | | |
| Class A | 33,540 | 557 |
11
| | |
| Dividend Appreciation Index Fund | |
| |
| |
| |
| | | Market |
| | | Value• |
| | Shares | ($000) |
| Southside | | |
| Bancshares Inc. | 23,810 | 474 |
| SY Bancorp Inc. | 20,463 | 434 |
| WSFS Financial Corp. | 10,178 | 275 |
| | | 166,783 |
| Health Care (15.0%) | | |
| Johnson & Johnson | 1,639,508 | 103,060 |
| Abbott Laboratories | 1,889,546 | 100,033 |
| Medtronic Inc. | 1,618,428 | 69,414 |
| Stryker Corp. | 535,268 | 27,791 |
| Becton Dickinson | | |
| and Co. | 360,461 | 27,168 |
| Cardinal Health Inc. | 526,332 | 17,406 |
| CR Bard Inc. | 136,937 | 11,351 |
| DENTSPLY | | |
| International Inc. | 227,737 | 7,636 |
| Beckman Coulter Inc. | 99,088 | 6,477 |
| Teleflex Inc. | 53,159 | 3,039 |
| Owens & Minor Inc. | 64,116 | 2,570 |
| West Pharmaceutical | | |
| Services Inc. | 51,802 | 1,882 |
| Meridian Bioscience Inc. | 64,235 | 1,287 |
| | | 379,114 |
| Industrials (18.3%) | | |
| United Technologies | | |
| Corp. | 1,385,498 | 93,493 |
| 3M Co. | 1,045,215 | 84,129 |
| Caterpillar Inc. | 926,324 | 48,391 |
| Emerson Electric Co. | 1,107,828 | 46,019 |
| General Dynamics Corp. | 557,996 | 37,302 |
| Illinois Tool Works Inc. | 775,503 | 33,804 |
| CH Robinson | | |
| Worldwide Inc. | 251,536 | 14,244 |
| Parker Hannifin Corp. | 223,047 | 12,471 |
| Dover Corp. | 262,966 | 11,276 |
| Expeditors International | | |
| of Washington Inc. | 311,100 | 10,609 |
| WW Grainger Inc. | 105,593 | 10,483 |
| Fastenal Co. | 213,696 | 8,864 |
| Roper Industries Inc. | 140,111 | 7,017 |
| Cintas Corp. | 232,259 | 5,832 |
| Stanley Works | 113,321 | 5,808 |
| Donaldson Co. Inc. | 120,651 | 4,614 |
| Pentair Inc. | 148,091 | 4,523 |
| Harsco Corp. | 119,021 | 3,542 |
| Carlisle Cos. Inc. | 88,180 | 2,956 |
| Nordson Corp. | 51,765 | 2,927 |
| Graco Inc. | 87,402 | 2,333 |
| CLARCOR Inc. | 71,699 | 2,322 |
| Brady Corp. Class A | 73,813 | 2,086 |
| AO Smith Corp. | 37,412 | 1,593 |
| ABM Industries Inc. | 80,042 | 1,554 |
| Universal Forest | | |
| Products Inc. | 30,787 | 1,045 |
| Franklin Electric Co. Inc. | 36,505 | 950 |
| Badger Meter Inc. | 23,321 | 881 |
| | |
| | | Market |
| | | Value• |
| | Shares | ($000) |
| Raven Industries Inc. | 29,725 | 850 |
| Tennant Co. | 29,703 | 711 |
| Gorman-Rupp Co. | 25,932 | 628 |
| | | 463,257 |
| Information Technology (5.8%) | | |
| International Business | | |
| Machines Corp. | 818,637 | 100,193 |
| Automatic Data | | |
| Processing Inc. | 767,156 | 31,292 |
| Linear Technology Corp. | 364,092 | 9,503 |
| Factset Research | | |
| Systems Inc. | 71,036 | 4,475 |
| Jack Henry & | | |
| Associates Inc. | 128,558 | 2,823 |
| | | 148,286 |
| Materials (5.0%) | | |
| Praxair Inc. | 456,729 | 34,401 |
| Air Products & | | |
| Chemicals Inc. | 314,442 | 23,885 |
| Nucor Corp. | 491,526 | 20,054 |
| Ecolab Inc. | 346,892 | 15,229 |
| Sigma-Aldrich Corp. | 184,681 | 8,837 |
| Martin Marietta | | |
| Materials Inc. | 71,374 | 5,651 |
| Albemarle Corp. | 130,120 | 4,648 |
| Bemis Co. Inc. | 163,688 | 4,593 |
| Valspar Corp. | 142,153 | 3,764 |
| Aptargroup Inc. | 97,662 | 3,465 |
| HB Fuller Co. | 76,313 | 1,528 |
| Stepan Co. | 14,901 | 871 |
| | | 126,926 |
| Telecommunication Services (0.2%) | |
| Telephone & Data | | |
| Systems Inc. | 77,393 | 2,442 |
| Atlantic Tele-Network Inc. | 24,896 | 1,206 |
| Shenandoah | | |
| Telecommunications Co. | 41,060 | 706 |
| | | 4,354 |
| Utilities (1.6%) | | |
| Questar Corp. | 235,735 | 9,778 |
| MDU Resources | | |
| Group Inc. | 281,051 | 6,189 |
| National Fuel Gas Co. | 115,794 | 5,433 |
| Energen Corp. | 103,329 | 4,541 |
| UGI Corp. | 152,611 | 3,740 |
| Aqua America Inc. | 205,115 | 3,403 |
| New Jersey | | |
| Resources Corp. | 61,860 | 2,257 |
| Northwest Natural | | |
| Gas Co. | 39,608 | 1,718 |
| South Jersey | | |
| Industries Inc. | 42,891 | 1,644 |
| California Water | | |
| Service Group | 30,742 | 1,117 |
12
| | |
| Dividend Appreciation Index Fund | |
| |
| |
| |
| | | Market |
| | | Value • |
| | Shares | ($000) |
| American States | | |
| Water Co. | 28,704 | 954 |
| SJW Corp. | 27,735 | 608 |
| | | 41,382 |
| Total Common Stocks | | |
| (Cost $2,400,066) | | 2,533,776 |
| Temporary Cash Investment (0.0%) | |
| Money Market Fund (0.0%) | | |
| 1 Vanguard Market Liquidity | | |
| Fund, 0.175% | | |
| (Cost $82) | 81,742 | 82 |
| Total Investments (100.1%) | | |
| (Cost $2,400,148) | | 2,533,858 |
| Other Assets and Liabilities (-0.1%) | |
| Other Assets | | 266,059 |
| Liabilities | | (268,891) |
| | | (2,832) |
| Net Assets (100%) | | 2,531,026 |
| |
| |
| Statement of Assets and Liabilities | |
| Assets | | |
| Investments in Securities, at Value | 2,533,858 |
| Receivables for Investment | | |
| Securities Sold | | 257,373 |
| Receivables for Capital Shares Issued | 5,285 |
| Other Assets | | 3,401 |
| Total Assets | | 2,799,917 |
| Liabilities | | |
| Payables for Investment | | |
| Securities Purchased | | 266,608 |
| Other Liabilities | | 2,283 |
| Total Liabilities | | 268,891 |
| Net Assets | | 2,531,026 |
| |
| At January 31, 2010, net assets consisted of: |
| | Amount |
| | ($000) |
| Paid-in Capital | 2,591,567 |
| Undistributed Net Investment Income | 2,697 |
| Accumulated Net Realized Losses | (196,948) |
| Unrealized Appreciation (Depreciation) | 133,710 |
| Net Assets | 2,531,026 |
| |
| Investor Shares—Net Assets | |
| Applicable to 33,420,301 outstanding | |
| $.001 par value shares of beneficial | |
| interest (unlimited authorization) | 612,545 |
| Net Asset Value Per Share— | |
| Investor Shares | $18.33 |
| |
| ETF Shares—Net Assets | |
| Applicable to 41,883,009 outstanding | |
| $.001 par value shares of beneficial | |
| interest (unlimited authorization) | 1,918,481 |
| Net Asset Value Per Share— | |
| ETF Shares | $45.81 |
• See Note A in Notes to Financial Statements.
1 Affiliated money market fund available only to Vanguard funds and certain trusts and accounts managed by Vanguard. Rate shown is the 7-day yield.
See accompanying Notes, which are an integral part of the Financial Statements.
13
| |
| Dividend Appreciation Index Fund | |
| |
| |
| Statement of Operations | |
| |
| | Year Ended |
| | January 31, 2010 |
| | ($000) |
| Investment Income | |
| Income | |
| Dividends | 44,191 |
| Interest1 | 2 |
| Security Lending | 5 |
| Total Income | 44,198 |
| Expenses | |
| The Vanguard Group—Note B | |
| Investment Advisory Services | 132 |
| Management and Administrati ve—Investor Shares | 1,388 |
| Management and Administrati ve—ETF Shares | 2,216 |
| Marketing and Distribution& #151;Investor Shares | 127 |
| Marketing and Distribution& #151;ETF Shares | 324 |
| Custodian Fees | 150 |
| Auditing Fees | 23 |
| Shareholders’ Reports and Proxies—Investor Shares | 24 |
| Shareholders’ Reports and Proxies—ETF Shares | 82 |
| Trustees’ Fees and Expenses | 3 |
| Total Expenses | 4,469 |
| Net Investment Income | 39,729 |
| Realized Net Gain (Loss) on Investment Securities Sold | 31,626 |
| Change in Unrealized Appreciation (Depreciation) of Investment Securities | 294,047 |
| Net Increase (Decrease) in Net Assets Resulting from Operations | 365,402 |
| 1 Interest income from an affiliated company of the fund was $2,000. | |
See accompanying Notes, which are an integral part of the Financial Statements.
14
| | |
| Dividend Appreciation Index Fund | | |
| |
| |
| Statement of Changes in Net Assets | | |
| |
| | Year Ended January 31, |
| | 2010 | 2009 |
| | ($000) | ($000) |
| Increase (Decrease) in Net Assets | | |
| Operations | | |
| Net Investment Income | 39,729 | 19,295 |
| Realized Net Gain (Loss) | 31,626 | (150,714) |
| Change in Unrealized Appreciation (Depreciation) | 294,047 | (162,335) |
| Net Increase (Decrease) in Net Assets Resulting from Operations | 365,402 | (293,754) |
| Distributions | | |
| Net Investment Income | | |
| Investor Shares | (10,294) | (7,677) |
| ETF Shares | (28,500) | (10,413) |
| Realized Capital Gain | | |
| Investor Shares | — | — |
| ETF Shares | — | — |
| Total Distributions | (38,794) | (18,090) |
| Capital Share Transactions | | |
| Investor Shares | 133,342 | 164,638 |
| ETF Shares | 880,312 | 679,485 |
| Net Increase (Decrease) from Capital Share Transactions | 1,013,654 | 844,123 |
| Total Increase (Decrease) | 1,340,262 | 532,279 |
| Net Assets | | |
| Beginning of Period | 1,190,764 | 658,485 |
| End of Period1 | 2,531,026 | 1,190,764 |
| 1 Net Assets—End of Period includes undistributed net investment income of $2,697,000 and $1,762,000. | |
See accompanying Notes, which are an integral part of the Financial Statements.
15
| | | | |
| Dividend Appreciation Index Fund | | | | |
| |
| |
| Financial Highlights | | | | |
| |
| |
| Investor Shares | | | | |
| | | | | April 27, |
| | | | | 20061, to |
| | Year Ended January 31, | Jan. 31, |
| For a Share Outstanding Throughout Each Period | 2010 | 2009 | 2008 | 2007 |
| Net Asset Value, Beginning of Period | $14.79 | $21.40 | $21.84 | $20.05 |
| Investment Operations | | | | |
| Net Investment Income | .369 | .387 | .325 | .214 |
| Net Realized and Unrealized Gain (Loss) on Investments | 3.543 | (6.614) | (.438) | 1.782 |
| Total from Investment Operations | 3.912 | (6.227) | (.113) | 1.996 |
| Distributions | | | | |
| Dividends from Net Investment Income | (.372) | (.383) | (.327) | (.206) |
| Distributions from Realized Capital Gains | — | — | — | — |
| Total Distributions | (.372) | (.383) | (.327) | (.206) |
| Net Asset Value, End of Period | $18.33 | $14.79 | $21.40 | $21.84 |
| |
| Total Return2 | 26.80% | -29.48% | -0.58% | 10.02% |
| |
| Ratios/Supplemental Data | | | | |
| Net Assets, End of Period (Millions) | $613 | $386 | $357 | $163 |
| Ratio of Total Expenses to Average Net Assets | 0.35% | 0.36% | 0.40% | 0.40%3 |
| Ratio of Net Investment Income to Average Net Assets | 2.24% | 2.25% | 1.56% | 1.53%3 |
| Portfolio Turnover Rate4 | 20% | 34% | 17% | 21% |
1 Inception.
2 Total returns do not include the account service fee that may be applicable to certain accounts with balances below $10,000.
3 Annualized.
4 Excludes the value of portfolio securities received or delivered as a result of in-kind purchases or redemptions of the fund’s capital shares, including ETF Creation Units.
See accompanying Notes, which are an integral part of the Financial Statements.
16
| | | | |
| Dividend Appreciation Index Fund | | | | |
| |
| |
| Financial Highlights | | | | |
| |
| |
| ETF Shares | | | | |
| | | | | April 21, |
| | | | | 20061, to |
| | Year Ended January 31, | Jan. 31, |
| For a Share Outstanding Throughout Each Period | 2010 | 2009 | 2008 | 2007 |
| Net Asset Value, Beginning of Period | $36.96 | $53.48 | $54.60 | $49.94 |
| Investment Operations | | | | |
| Net Investment Income | .973 | 1.032 | .873 | .555 |
| Net Realized and Unrealized Gain (Loss) on Investments | 8.856 | (16.526) | (1.120) | 4.631 |
| Total from Investment Operations | 9.829 | (15.494) | (.247) | 5.186 |
| Distributions | | | | |
| Dividends from Net Investment Income | (.979) | (1.026) | (.873) | (.526) |
| Distributions from Realized Capital Gains | — | — | — | — |
| Total Distributions | (.979) | (1.026) | (.873) | (.526) |
| Net Asset Value, End of Period | $45.81 | $36.96 | $53.48 | $54.60 |
| |
| Total Return | 26.95% | -29.38% | -0.51% | 10.45% |
| |
| Ratios/Supplemental Data | | | | |
| Net Assets, End of Period (Millions) | $1,918 | $805 | $302 | $111 |
| Ratio of Total Expenses to Average Net Assets | 0.23% | 0.24% | 0.28% | 0.28%2 |
| Ratio of Net Investment Income to Average Net Assets | 2.36% | 2.37% | 1.68% | 1.65%2 |
| Portfolio Turnover Rate3 | 20% | 34% | 17% | 21% |
1 Inception.
2 Annualized.
3 Excludes the value of portfolio securities received or delivered as a result of in-kind purchases or redemptions of the fund’s capital shares, including ETF Creation Units.
See accompanying Notes, which are an integral part of the Financial Statements.
17
Dividend Appreciation Index Fund
Notes to Financial Statements
Vanguard Dividend Appreciation Index Fund is registered under the Investment Company Act of 1940 as an open-end investment company, or mutual fund. The fund offers two classes of shares: Investor Shares and ETF Shares. Investor Shares are available to any investor who meets the fund’s minimum purchase requirements. ETF Shares are liste d for trading on the NYSE Arca, I nc.; they can be purchased and sold through a broker.
A. The following significant accounting policies conform to generally accepted accounting principles for U.S. mutual funds. The fund consistently follows such policies in preparing its financial statements.
1. Security Valuation: Securities are valued as of the close of trading on the New York Stock Exchange (generally 4 p.m., Eastern time) on the valuation date. Equity securities are valued at the latest quoted sales prices or official closing prices taken from the primary market in which each security trades; such securities not trade d on the valuation date are valued at the mean of the latest quote d bid and asked prices. Securities for which market quotations are not re adily available, or whose values have been materially affected by events occurring before the fund’s pricing time but after the close of the securities’ primary markets, are valued by methods deemed by the board of trustees to represent fair value. Investments in Vanguard Market Liquidi ty Fund are valued at that fund’s net asset value.
2. Federal Income Taxes: The fund intends to continue to qualify as a regulated investment company and distribute all of its taxable income. Management has analyzed the fund’s tax positions taken for all open federal income tax years (January 31, 2007–2010), and has concluded that no provision for federal income tax is required in the fund’s financial statements.
3. Distributions: Distributions to shareholders are recorded on the ex-dividend date.
4. Security Lending: The fund may lend its securities to qualified institutional borrowers to earn additional income. Security loans are required to be secured at all times by collateral at least equal to the market value of securities loaned. The fund invests cash collateral received in Vanguard Market Liquidity Fund, and records a liability for the return of the collateral, during the period the securities are on loan. Security lending income represents the income earned on investing cash collateral, less expenses associated with the loan.
5. Other: Dividend income is recorded on the ex-dividend date. Interest income includes income distributions received from Vanguard Market Liquidity Fund and is accrued daily. Security transactions are accounted for on the date securities are bought or sold. Costs used to determine realized gains (losses) on the sale of investment securities are those of the specific securities sold.
Each class of shares has equal rights as to assets and earnings, except that each class separately bears certain class-specific expenses related to maintenance of shareholder accounts (included in Management and Administrative expenses), share holder reporting, and proxies. Marketing and distribution expenses are allocated to each class of s hares based on a method approved by the board of trustees. Income, other non-class-specific expenses, and gains and losses on investments are allocated to each class of shares based on its relative net assets.
B. The Vanguard Group furnishes at cost investment advisory, corporate management, administrative, marketing, and distribution services. The costs of such services are allocated to the fund under methods approved by the board of trustees. The fund has committed to provide up to 0.40% of its net assets in
18
Dividend Appreciation Index Fund
capital contributions to Vanguard. At January 31, 2010, the fund had contributed capital of $491,000 to Vanguard (included in Other Assets), representing 0.02% of the fund’s net assets and 0.20% of
Vanguard’s capitalization. The fund’s trustees and officers are also directors and officers of Vanguard.
C. Various inputs may be used to determine the value of the fund’s investments. These inputs are summarized in three broad levels for financial statement purposes. The inputs or methodologies used to value securities are not necessarily an indication of the risk associated with investing in those securities.
Level 1 — Quoted prices in active markets for identical securities.
Level 2 — Other significant observable inputs (including quoted prices for similar securities, interest rates, prepayment speeds, credit risk, etc.).
Level 3 — Significant unobservable inputs (including the fund’s own assumptions used to determine the fair value of investments).
At January 31, 2010, 100% of the fund’s investments were valued based on Level 1 inputs.
D. Distributions are determined on a tax basis and may differ from net investment income and realized capital gains for financial reporting purposes. Differences may be permanent or temporary. Permanent differences are reclassified among capital accounts in the financial statements to reflect their tax character. Temporary differences arise when certain items of income, expense, gain, or loss are recognized in different periods for financial statement and tax purposes; these differences will reverse at some time in the future. Differences in classification may also result from the treatment of shor t-term gains as ordinary income for tax purposes.
During the year ended January 31, 2010, the fund realized $58,337,000 of net capital gains resulting from in-kind redemptions—in which shareholders exchanged fund shares for securities held by the fund rather than for cash. Because such gains are not taxable to the fund, and are not distributed to shareholders, they have been reclassified from accumulated net realized losses to paid-in capital.
For tax purposes, at January 31, 2010, the fund had $4,571,000 of ordinary income available for distribution. The fund had available capital loss carryforwards totaling $169,000,000 to offset future net capital gains of $609,000 through January 31, 2016, $22,242,000 through January 31, 2017, and $146,149,000 through January 31, 2018. In addition, the fund realized losses of $25,865,000 during the period from November 1, 2009, through January 31, 2010, which are deferred and will be treated as realized for tax purposes in fiscal 2010.
At January 31, 2010, the cost of investment securities for tax purposes was $2,402,231,000. Net unrealized appreciation of investment securities for tax purposes was $131,627,000, consisting of unrealized gains of $154,791,000 on securities that had risen in value since their purchase and $23,164,000 in unrealized losses on securities that had fallen in value since their purchase.
E. During the year ended January 31, 2010, the fund purchased $1,664,367,000 of investment securities and sold $649,009,000 of investment securities, other than temporary cash investments.
19
Dividend Appreciation Index Fund
| | | | |
| F. Capital share transactions for each class of shares were: | | | |
| | | | Year Ended January 31, |
| | | 2010 | | 2009 |
| | Amount | Shares | Amount | Shares |
| | ($000) | (000) | ($000) | (000) |
| Investor Shares | | | | |
| Issued | 227,145 | 13,195 | 229,131 | 12,962 |
| Issued in Lieu of Cash Distributions | 9,119 | 557 | 6,983 | 372 |
| Redeemed | (102,922) | (6,443) | (71,476) | (3,895) |
| Net Increase (Decrease)—Investor Shares | 133,342 | 7,309 | 164,638 | 9,439 |
| ETF Shares | | | | |
| Issued | 1,178,556 | 26,816 | 692,968 | 16,425 |
| Issued in Lieu of Cash Distributions | — | — | — | — |
| Redeemed | (298,244) | (6,700) | (13,483) | (300) |
| Net Increase (Decrease)—ETF Shares | 880,312 | 20,116 | 679,485 | 16,125 |
G. In preparing the financial statements as of January 31, 2010, management considered the impact of subsequent events for potential recognition or disclosure in these financial statements.
20
Report of Independent Registered Public Accounting Firm
To the Trustees of Vanguard Specialized Funds and the Shareholders of Vanguard Dividend Appreciation Index Fund:
In our opinion, the accompanying statements of net assets and of assets and liabilities and the related statements of operations and of changes in net assets and the financial highlights present fairly, in all material respects, the financial position of Vanguard Divid end Appreciation Index Fund (constituting a separate portfolio of Vanguar d Specialized Funds, hereafter re ferred to as the “Fund”) at January 31, 2010, the results of its operations for the year then ended, the changes in its net assets for each of the two years in the period then ended and the financial highlights for each of the periods indicated, in conformity with accounting principles generally accepted in the United States of America. These financial statements and financial highlights (hereafter referred to as “financial statements”) are the responsibility of the Fund’s management; our responsibility is to express an opinion on these financial statements based on our audits. We conducted our audits of these financial statements in accordance with the standards of the Public Company Account ing Oversight Board (United State s). Those standards require that we plan and perform the audit to obtain reasonable assurance about whether the financial statements are free of material misstatement. An audit includes examining, on a test basis, evidence supporting the amounts and disclosures in the financial statements, assessing the accounting principles used and significant estimates made by management, and evaluating the overall financial statement presentation. We believe that our audits, which included confirmation of securities at January 31, 2010 by correspondence with the custodian and by agreement to the underlying ownership records of Vanguard Market Liquidity Fund, provide a reasonable basis for our opinion.
PricewaterhouseCoopers LLP
Philadelphia, Pennsylvania
March 16, 2010
| Special 2009 tax information (unaudited) for Vanguard Dividend Appreciation Index Fund |
This information for the fiscal year ended January 31, 2010, is included pursuant to provisions of the Internal Revenue Code.
The fund distributed $38,794,000 of qualified dividend income to shareholders during the fiscal year.
For corporate shareholders, 100.0% of investment income (dividend income plus short-term gains, if any) qualifies for the dividends-received deduction.
21
Your Fund’s After-Tax Returns
This table presents returns for your fund both before and after taxes. The after-tax returns are shown in two ways: (1) assuming that an investor owned the fund during the entire period and paid taxes on the fund’s distributions, and (2) assuming that an investor paid taxes on the fund’s distributions and sold all shares at the end of each period.
Calculations are based on the highest individual federal income tax and capital gains tax rates in effect at the times of the distributions and the hypothetical sales. State and local taxes were not considered. After-tax returns reflect any qualified dividend income , using actual prior-year figures and estimates for 2010. (In the example, returns after the sale of fund shares may be higher than those assuming no sale. This occurs when the sale would have produced a capital loss. The calculation assumes that the investor received a tax deduction for the loss.) The table shows returns for Investor Shares only; returns for other share classes will differ. Please note that your actual after-tax returns will depend on your tax situation and may differ from those shown. Also note that if you own the fund in a tax-deferred account, such as an individual retirement account or a 401(k) plan, this information does not apply to you. Such accounts are not subject to current taxes.
Finally, keep in mind that a fund’s performance—whether before or after taxes—does not guarantee future results.
| | |
| Average Annual Total Returns: Dividend Appreciation Index Fund Investor Shares | |
| Periods Ended January 31, 2010 | | |
| | | Since |
| | One | Inception |
| | Year | (4/27/2006) |
| Returns Before Taxes | 26.80% | -0.59% |
| Returns After Taxes on Distributions | 26.37 | -0.85 |
| Returns After Taxes on Distributions and Sale of Fund Shares | 17.89 | -0.50 |
Total returns do not include any transaction or account fees that applied in the periods shown. Fund prospectuses provide information about current fees.
22
About Your Fund’s Expenses
As a shareholder of the fund, you incur ongoing costs, which include costs for portfolio management, administrative services, and shareholder reports (like this one), among others. Operating expenses, which are deducted from a fund’s gross income, directly reduce the investment return of the fund.
A fund’s expenses are expressed as a percentage of its average net assets. This figure is known as the expense ratio. The following examples are intended to help you understand the ongoing costs (in dollars) of investing in your fund and to compare these costs with those of other mutual funds. The examples are based on an investment of $1,000 made at the beginning of the period shown and held for the entire period.
The accompanying table illustrates your fund’s costs in two ways:
• Based on actual fund return. This section helps you to estimate the actual expenses that you paid over the period. The ”Ending Account Value“ shown is derived from the fund‘s actual return, and the third column shows the dollar amount that would have been paid by an investor who started with $1,000 in the fund. You may use the information here, together with the amount you invested, to estimate the expenses that you paid over the period.
To do so, simply divide your account value by $1,000 (for example, an $8,600 account value divided by $1,000 = 8.6), then multiply the result by the number given for your fund under the heading ”Expenses Paid During Period.“
• Based on hypothetical 5% yearly return. This section is intended to help you compare your fund‘s costs with those of other mutual funds. It assumes that the fund had a yearly return of 5% before expenses, but that the expense ratio is unchanged. In this case—because the return used is not the fund’s actual return—the results do not apply to your investment. The example is useful in making comparisons because the Securities and Exchange Commission requires all mutual funds to calculate expenses based on a 5% return. You can assess your fund’s costs by comparing this hypothetical example with the hypothetical examples that appear in shareholder reports of other funds.
Note that the expenses shown in the table are meant to highlight and help you compare ongoing costs only and do not reflect transaction costs incurred by the fund for buying and selling securities. Further, the expenses do not include the account service fee described in the prospectus. If such a fee were applied to your account, your costs would be higher. Your fund does not charge transaction fees, such as purchase or redemption fees, nor does it carry a “sales load.” The calculations assume no shares were bought or sold during the period. Your actual costs may have been higher or lower, depending on the amount of your investment and the timing of any purchases or redemptions.
You can find more information about the fund’s expenses, including annual expense ratios, in the Financial Statements section of this report. For additional information on operating expenses and other shareholder costs, please refer to your fund’s current prospectus.
23
| | | |
| Six Months Ended January 31, 2010 | | | |
| | Beginning | Ending | Expenses |
| | Account Value | Account Value | Paid During |
| Dividend Appreciation Index Fund | 7/31/2009 | 1/31/2010 | Period |
| Based on Actual Fund Return | | | |
| Investor Shares | $1,000.00 | $1,094.63 | $1.85 |
| ETF Shares | 1,000.00 | 1,095.53 | 1.16 |
| Based on Hypothetical 5% Yearly Return | | | |
| Investor Shares | $1,000.00 | $1,023.44 | $1.79 |
| ETF Shares | 1,000.00 | 1,024.10 | 1.12 |
These calculations are based on expenses incurred in the most recent six-month period. The fund’s annualized six-month expense ratios for that period are 0.35% for Investor Shares and 0.22% for ETF Shares. The dollar amounts shown as “Expenses Paid” are equal to the annualized expense ratio multiplied by the average account value over the period, multiplied by the number of days in the most recent six-month period, then divided by the number of days in the most recent 12-month period.
24
Glossary
30-Day SEC Yield. A fund’s 30-day SEC yield is derived using a formula specified by the U.S. Securities and Exchange Commission. Under the formula, data related to the fund’s security holdings in the previous 30 days are used to calculate the fund’s hypothetical net income for that period, which is then annualized and divided by the fund’s estimated average net assets over the calculation period. For the purposes of this calculation, a security’s income is based on its current market yield to maturity (in the case of bonds) or its projected dividend yield (for stocks). Because the SEC yield represents hypothetical annualized income, it will differ—at times significantly—from the fund’s actual experience. As a result, the fund’s income distributions may be higher or lower than implied by the SEC yield.
Beta. A measure of the magnitude of a fund’s past share-price fluctuations in relation to the ups and downs of a given market index. The index is assigned a beta of 1.00. Compared with a given index, a fund with a beta of 1.20 typically would have seen its share price rise or fall by 12% when the index rose or fell by 10%. For this report, beta is based on returns over the past 36 months for both the fund and the index. Note that a fund’s beta should be reviewed in conjunction with its R-squared (see definition). The lower the R-squared, the less correlation there is between the fund and the index, and the less reliable beta is as an indicator of volatility.
Dividend Yield. Dividend income earned by stocks, expressed as a percentage of the aggregate market value (or of net asset value, for a fund). The yield is determined by dividing the amount of the annual dividends by the aggregate value (or net asset value) at the end of the period. For a fund, the dividend yield is based solely on stock holdings and does not include any income produced by other investments.
Earnings Growth Rate. The average annual rate of growth in earnings over the past five years for the stocks now in a fund.
Equity Exposure. A measure that reflects a fund’s investments in stocks and stock futures. Any holdings in short-term reserves are excluded.
Expense Ratio. The percentage of a fund’s average net assets used to pay its annual administrative and advisory expenses. These expenses directly reduce returns to investors.
Foreign Holdings. The percentage of a fund represented by stocks or depositary receipts of companies based outside the United States.
Inception Date. The date on which the assets of a fund (or one of its share classes) are first invested in accordance with the fund’s investment objective. For funds with a subscription period, the inception date is the day after that period ends. Investment performance is measured from the inception date.
Median Market Cap. An indicator of the size of companies in which a fund invests; the midpoint of market capitalization (market price x shares outstanding) of a fund’s stocks, weighted by the proportion of the fund’s assets invested in each stock. Stocks representing half of the fund’s assets have market capitalizations above the median, and the rest are below it.
Price/Book Ratio. The share price of a stock divided by its net worth, or book value, per share. For a fund, the weighted average price/book ratio of the stocks it holds.
25
Price/Earnings Ratio. The ratio of a stock’s current price to its per-share earnings over the past year. For a fund, the weighted average P/E of the stocks it holds. P/E is an indicator of market expectations about corporate prospects; the higher the P/E, the greater the expectations for a company’s future growth.
R-Squared. A measure of how much of a fund’s past returns can be explained by the returns from the market in general, as measured by a given index. If a fund’s total returns were precisely synchronized with an index’s returns, its R-squared would be 1.00. If the fund’s returns bore no relationship to the index’s returns, its R-squared would be 0. For this report, R-squared is based on returns over the past 36 months for both the fund and the index.
Return on Equity. The annual average rate of return generated by a company during the past five years for each dollar of shareholder’s equity (net income divided by shareholder’s equity). For a fund, the weighted average return on equity for the companies whose stocks it holds.
Short-Term Reserves. The percentage of a fund invested in highly liquid, short-term securities that can be readily converted to cash.
Turnover Rate. An indication of the fund’s trading activity. Funds with high turnover rates incur higher transaction costs and may be more likely to distribute capital gains (which may be taxable to investors). The turnover rate excludes in-kind transactions, which have minimal impact on costs.
26
This page intentionally left blank.
The People Who Govern Your Fund
The trustees of your mutual fund are there to see that the fund is operated and managed in your best interests since, as a shareholder, you are a part owner of the fund. Your fund’s trustees also serve on the board of directors of The Vanguard Group, Inc., which is owned by the Vanguard funds and provides services to them on an at-cost basis.
A majority of Vanguard’s board members are independent, meaning that they have no affiliation with Vanguard or the funds they oversee, apart from the sizable personal investments they have made as private individuals. The independent board members have distinguished backgrounds in business, academia, and public service. Each of the trustees and executive officers oversees 162 Vanguard funds.
The following table provides information for each trustee and executive officer of the fund. More information about the trustees is in the Statement of Additional Informatio n, which can be obtained, wit hout charge, by contacting Vanguard at 800-662-7447, or online at www.vanguard.com.
| |
| Interested Trustee1 | Rajiv L. Gupta |
| | Born 1945. Trustee Since December 2001.2 Principal |
| F. William McNabb III | Occupation(s) During the Past Five Years: Chairman |
| Born 1957. Trustee Since July 2009. Chairman of the | and Chief Executive Officer (retired 2009) and |
| Board. Principal Occupation(s) During the Past Five | President (2006–2008) of Rohm and Haas Co. |
| Years: Chairman of the Board of The Vanguard Group, | (chemicals); Board Member of American Chemistry |
| Inc., and of each of the investment companies served | Council; Director of Tyco International, Ltd. (diversified |
| by The Vanguard Group, since January 2010; Director | manufacturing and services) and Hewlett-Packard Co. |
| of The Vanguard Group since 2008; Chief Executive | (electronic computer manufacturing); Trustee of The |
| Officer and President of The Vanguard Group and of | Conference Board. |
| each of the investment companies served by The | |
| Vanguard Group since 2008; Director of Vanguard | Amy Gutmann |
| Marketing Corporation; Managing Director of The | Born 1949. Trustee Since June 2006. Principal |
| Vanguard Group (1995–2008). | Occupation(s) During the Past Five Years: President |
| | of the University of Pennsylvania; Christopher H. |
| | Browne Distinguished Professor of Political Science |
| Independent Trustees | in the School of Arts and Sciences with secondary |
| | appointments at the Annenberg School for Commu- |
| Emerson U. Fullwood | nication and the Graduate School of Education of |
| Born 1948. Trustee Since January 2008. Principal | the University of Pennsylvania; Director of Carnegie |
| Occupation(s) During the Past Five Years: Executive | Corporation of New York, Schuylkill River Development |
| Chief Staff and Marketing Officer for North America | Corporation, and Greater Philadelphia Chamber of |
| and Corporate Vice President (retired 2008) of Xerox | Commerce; Trustee of the National Constitution Center. |
| Corporation (photocopiers and printers); Director of | |
| SPX Corporation (multi-industry manufacturing), the | |
| United Way of Rochester, the Boy Scouts of America, | |
| Amerigroup Corporation (direct health and medical | |
| insurance carriers), and Monroe Community College | |
| Foundation. | |
| | |
| JoAnn Heffernan Heisen | Executive Officers | |
| Born 1950. Trustee Since July 1998. Principal | | |
| Occupation(s) During the Past Five Years: Corporate | Thomas J. Higgins | |
| Vice President and Chief Global Diversity Officer since | Born 1957. Chief Financial Officer Since September |
| 2006 (retired 2008) and Member of the Executive | 2008. Principal Occupation(s) During the Past Five |
| Committee (retired 2008) of Johnson & Johnson | Years: Principal of The Vanguard Group, Inc.; Chief |
| (pharmaceuticals/consumer products); Vice President | Financial Officer of each of the investment companies |
| and Chief Information Officer of Johnson & Johnson | served by The Vanguard Group since 2008; Treasurer |
| (1997–2005); Director of the University Medical Center | of each of the investment companies served by The |
| at Princeton and Women’s Research and Education | Vanguard Group (1998–2008). |
| Institute; Member of the Advisory Board of the | | |
| Maxwell School of Citizenship and Public Affairs | Kathryn J. Hyatt | |
| at Syracuse University. | Born 1955. Treasurer Since November 2008. Principal |
| | Occupation(s) During the Past Five Years: Principal |
| F. Joseph Loughrey | of The Vanguard Group, Inc.; Treasurer of each of |
| Born 1949. Trustee Since October 2009. Principal | the investment companies served by The Vanguard |
| Occupation(s) During the Past Five Years: President | Group since 2008; Assistant Treasurer of each of the |
| and Chief Operating Officer since 2005 (retired 2009) | investment companies served by The Vanguard Group |
| and Vice Chairman of the Board (2008–2009) of | (1988–2008). | |
| Cummins Inc. (industrial machinery); Director of | | |
| SKF AB (industrial machinery), Hillenbrand, Inc. | Heidi Stam | |
| (specialized consumer services), Sauer-Danfoss Inc. | Born 1956. Secretary Since July 2005. Principal |
| (machinery), the Lumina Foundation for Education, | Occupation(s) During the Past Five Years: Managing |
| and the Columbus Community Education Coalition; | Director of The Vanguard Group, Inc., since 2006; |
| Chairman of the Advisory Council for the College of | General Counsel of The Vanguard Group since 2005; |
| Arts and Letters at the University of Notre Dame. | Secretary of The Vanguard Group and of each of the |
| | investment companies served by The Vanguard Group |
| André F. Perold | since 2005; Director and Senior Vice President of |
| Born 1952. Trustee Since December 2004. Principal | Vanguard Marketing Corporation since 2005; |
| Occupation(s) During the Past Five Years: George | Principal of The Vanguard Group (1997–2006). |
| Gund Professor of Finance and Banking, Harvard | | |
| Business School; Chair of the Investment Committee | | |
| of HighVista Strategies LLC (private investment firm). | Vanguard Senior Management Team |
| |
| Alfred M. Rankin, Jr. | R. Gregory Barton | Michael S. Miller |
| Born 1941. Trustee Since January 1993. Principal | Mortimer J. Buckley | James M. Norris |
| Occupation(s) During the Past Five Years: Chairman, | Kathleen C. Gubanich | Glenn W. Reed |
| President, and Chief Executive Officer of NACCO | Paul A. Heller | George U. Sauter |
| Industries, Inc. (forklift trucks/housewares/lignite); | | |
| Director of Goodrich Corporation (industrial products/ | | |
| aircraft systems and services); Deputy Chairman | Chairman Emeritus and Senior Advisor |
| of the Federal Reserve Bank of Cleveland; Trustee | | |
| of University Hospitals of Cleveland, The Cleveland | John J. Brennan | |
| Museum of Art, and Case Western Reserve University. | Chairman, 1996–2009 | |
| | Chief Executive Officer and President, 1996–2008 |
| Peter F. Volanakis | | |
| Born 1955. Trustee Since July 2009. Principal | | |
| Occupation(s) During the Past Five Years: President | Founder | |
| since 2007 and Chief Operating Officer since 2005 | | |
| of Corning Incorporated (communications equipment); | John C. Bogle | |
| President of Corning Technologies (2001–2005); | Chairman and Chief Executive Officer, 1974–1996 |
| Director of Corning Incorporated and Dow Corning; | | |
| Trustee of the Corning Incorporated Foundation and | | |
| the Corning Museum of Glass; Overseer of the | | |
| Amos Tuck School of Business Administration at | | |
| Dartmouth College. | | |
1 Mr. McNabb is considered an “interested person,” as defined in the Investment Company Act of 1940, because he is an officer of the Vanguard funds.
2 December 2002 for Vanguard Equity Income Fund, Vanguard Growth Equity Fund, the Vanguard Municipal Bond Funds, and the Vanguard
State Tax-Exempt Funds.
| |
|
|  |
| P.O. Box 2600 |
| Valley Forge, PA 19482-2600 |
Connect with Vanguard® > www.vanguard.com
| Fund Information > 800-662-7447 | |
| “Dividend Achievers” is a trademark of Mergent, Inc., |
| Direct Investor Account Services > 800-662-2739 | and has been licensed for use by The Vanguard Group, |
| | Inc. Vanguard mutual funds are not sponsored, |
| Institutional Investor Services > 800-523-1036 | endorsed, sold, or promoted by Mergent, and Mergent |
| makes no representation regarding the advisability of |
| Text Telephone for People | investing in the funds. |
| With Hearing Impairment > 800-749-7273 | |
| |
| This material may be used in conjunction | |
| with the offering of shares of any Vanguard | |
| fund only if preceded or accompanied by | |
| the fund’s current prospectus. | |
| |
| All comparative mutual fund data are from Lipper Inc. or | |
| Morningstar, Inc., unless otherwise noted. | |
| |
| You can obtain a free copy of Vanguard’s proxy voting | |
| guidelines by visiting our website, www.vanguard.com, | |
| and searching for “proxy voting guidelines,” or by calling | |
| Vanguard at 800-662-2739. The guidelines are also | |
| available from the SEC’s website, www.sec.gov. In | |
| addition, you may obtain a free report on how your fund | |
| voted the proxies for securities it owned during the 12 | |
| months ended June 30. To get the report, visit either | |
| www.vanguard.com or www.sec.gov. | |
| |
| You can review and copy information about your fund at | |
| the SEC’s Public Reference Room in Washington, D.C. To | |
| find out more about this public service, call the SEC at | |
| 202-551-8090. Information about your fund is also | |
| available on the SEC’s website, and you can receive | |
| copies of this information, for a fee, by sending a | |
| request in either of two ways: via e-mail addressed to | |
| publicinfo@sec.gov or via regular mail addressed to the | |
| Public Reference Section, Securities and Exchange | |
| Commission, Washington, DC 20549-1520. | |
| |
| © 2010 The Vanguard Group, Inc. |
| All rights reserved. |
| Vanguard Marketing Corporation, Distributor. |
 |
| Q6020 032010 |
Item 2: Code of Ethics. The Registrant has adopted a code of ethics that applies to the Registrant’s principal executive officer, principal financial officer, principal accounting officer or controller or persons performing similar functions. The Code of Ethics was amended during the reporting period covered by this report to make certain technical, non-material changes.
Item 3: Audit Committee Financial Expert. The following members of the Audit Committee have been determined by the Registrant’s Board of Trustees to be Audit Committee Financial Experts serving on its Audit Committee, and to be independent: Rajiv L. Gupta, JoAnn Heffernan Heisen, André F. Perold, and Alfred M. Rankin, Jr.
Item 4: Principal Accountant Fees and Services.
(a) Audit Fees.
Audit Fees of the Registrant
Fiscal Year Ended January 31, 2010: $161,000
Fiscal Year Ended January 31, 2009: $141,000
Aggregate Audit Fees of Registered Investment Companies in the Vanguard Group.
Fiscal Year Ended January 31, 2010: $3,354,640
Fiscal Year Ended January 31, 2009: $3,055,590
(b) Audit-Related Fees.
Fiscal Year Ended January 31, 2010: $876,210
Fiscal Year Ended January 31, 2009: $626,240
Includes fees billed in connection with assurance and related services provided to the Registrant, The Vanguard Group, Inc., Vanguard Marketing Corporation, and other registered investment companies in the Vanguard Group.
(c) Tax Fees.
Fiscal Year Ended January 31, 2010: $423,070
Fiscal Year Ended January 31, 2009: $230,400
Includes fees billed in connection with tax compliance, planning and advice services provided to the Registrant, The Vanguard Group, Inc., Vanguard Marketing Corporation, and other registered investment companies in the Vanguard Group and related to income and excise taxes.
(d) All Other Fees.
Fiscal Year Ended January 31, 2010: $0
Fiscal Year Ended January 31, 2009: $0
Includes fees billed for services related to risk management and privacy matters. Services were provided to the Registrant, The Vanguard Group, Inc., Vanguard Marketing Corporation, and other registered investment companies in the Vanguard Group.
(e) (1) Pre-Approval Policies. The policy of the Registrant’s Audit Committee is to consider and, if appropriate, approve before the principal accountant is engaged for such services, all specific audit and non-audit services provided to: (1) the Registrant; (2) The Vanguard Group, Inc.; (3) other entities controlled by The Vanguard Group, Inc. that provide ongoing services to the Registrant; and (4) other registered investment companies in the Vanguard Group. In making a determination, the Audit Committee considers whether the services are consistent with maintaining the principal accountant’s independence.
In the event of a contingency situation in which the principal accountant is needed to provide services in between scheduled Audit Committee meetings, the Chairman of the Audit Committee would be called on to consider and, if appropriate, pre-approve audit or permitted non-audit services in an amount sufficient to complete services through the next Audit Committee meeting, and to determine if such services would be consistent with maintaining the accountant’s independence. At the next scheduled Audit Committee meeting, services and fees would be presented to the Audit Committee for formal consideration, and, if appropriate, approval by the entire Audit Committee. The Audit Committee would again consider whether such services and fees are consistent with maintaining the principal accountant’s independence.
The Registrant’s Audit Committee is informed at least annually of all audit and non-audit services provided by the principal accountant to the Vanguard complex, whether such services are provided to: (1) the Registrant; (2) The Vanguard Group, Inc.; (3) other entities controlled by The Vanguard Group, Inc. that provide ongoing services to the Registrant; or (4) other registered investment companies in the Vanguard Group.
(2) No percentage of the principal accountant’s fees or services were approved pursuant to the waiver provision of paragraph (c)(7)(i)(C) of Rule 2-01 of Regulation S-X.
(f) For the most recent fiscal year, over 50% of the hours worked under the principal accountant’s engagement were not performed by persons other than full-time, permanent employees of the principal accountant.
(g) Aggregate Non-Audit Fees.
Fiscal Year Ended January 31, 2010: $423,070
Fiscal Year Ended January 31, 2009: $230,400
Includes fees billed for non-audit services provided to the Registrant, The Vanguard Group, Inc., Vanguard Marketing Corporation, and other registered investment companies in the Vanguard Group.
(h) For the most recent fiscal year, the Audit Committee has determined that the provision of all non-audit services was consistent with maintaining the principal accountant’s independence.
Item 5: The Registrant is a listed issuer as defined in Rule 10A-3 under the Securities Exchange Act of 1934 (“Exchange Act”). The Registrant has a separately-designated standing audit committee established in accordance with Section 3(a)(58)(A) of the Exchange Act. The Registrant’s audit committee members are: Emerson U. Fullwood, Rajiv L. Gupta, Amy Gutmann, JoAnn Heffernan Heisen, F. Joseph Loughrey, André F. Perold, Alfred M. Rankin, Jr., and Peter F. Volanakis.
Item 6: Not Applicable.
Item 7: Not Applicable.
Item 8: Not Applicable.
Item 9: Not Applicable.
Item 10: Not Applicable.
Item 11: Controls and Procedures.
(a) Disclosure Controls and Procedures. The Principal Executive and Financial Officers concluded that the Registrant's Disclosure Controls and Procedures are effective based on their evaluation of the Disclosure Controls and Procedures as of a date within 90 days of the filing date of this report.
(b) Internal Control Over Financial Reporting. There were no significant changes in Registrant’s Internal Control Over Financial Reporting or in other factors that could significantly affect this control subsequent to the date of the evaluation, including any corrective actions with regard to significant deficiencies and material weaknesses.
Item 12: Exhibits.
(a) Code of Ethics.
(b) Certifications.
Pursuant to the requirements of the Securities Exchange Act of 1934 and the Investment Company Act of 1940, the registrant has duly caused this report to be signed on its behalf by the undersigned, thereunto duly authorized.
| |
| | VANGUARD SPECIALIZED FUNDS |
| |
| By: | /s/ F. WILLIAM MCNABB III* |
| | F. WILLIAM MCNABB III |
| | CHIEF EXECUTIVE OFFICER |
| |
| Date: March 26, 2010 |
Pursuant to the requirements of the Securities Exchange Act of 1934 and the Investment Company Act of 1940, this report has been signed below by the following persons on behalf of the registrant and in the capacities and on the dates indicated.
| |
| | VANGUARD SPECIALIZED FUNDS |
| |
| By: | /s/ F. WILLIAM MCNABB III* |
| | F. WILLIAM MCNABB III |
| | CHIEF EXECUTIVE OFFICER |
| |
| Date: March 26, 2010 |
| |
| | VANGUARD SPECIALIZED FUNDS |
| |
| By: | /s/ THOMAS J. HIGGINS* |
| | THOMAS J. HIGGINS |
| | CHIEF FINANCIAL OFFICER |
| |
| Date: March 26, 2010 |
*By: /s/ Heidi Stam
Heidi Stam, pursuant to a Power of Attorney filed on July 24, 2009, see File Number 2-88373,
and a Power of Attorney filed on October 16, 2009, see File Number 2-52698,
both Incorporated by Reference.